Showing preview only (1,223K chars total). Download the full file or copy to clipboard to get everything.
Repository: FighterLightning/ChartsUnderstandAndUsage
Branch: master
Commit: afb59a2d5937
Files: 221
Total size: 1.1 MB
Directory structure:
gitextract_fw1y0vwm/

├── ChartsUnderstandAndUsage/
│   ├── AppDelegate.swift
│   ├── Assets.xcassets/
│   │   ├── AppIcon.appiconset/
│   │   │   └── Contents.json
│   │   ├── Contents.json
│   │   ├── barChartImage.imageset/
│   │   │   └── Contents.json
│   │   ├── barChartWaveImage.imageset/
│   │   │   └── Contents.json
│   │   ├── bubbleChartImage.imageset/
│   │   │   └── Contents.json
│   │   ├── candleStickChartImage.imageset/
│   │   │   └── Contents.json
│   │   ├── combinedChartImage.imageset/
│   │   │   └── Contents.json
│   │   ├── lineChartImage.imageset/
│   │   │   └── Contents.json
│   │   ├── lineFilledChartImage.imageset/
│   │   │   └── Contents.json
│   │   ├── pieChartHalfImage.imageset/
│   │   │   └── Contents.json
│   │   ├── pieChartImage.imageset/
│   │   │   └── Contents.json
│   │   ├── pieChartPolylineImage.imageset/
│   │   │   └── Contents.json
│   │   ├── radarChartImage.imageset/
│   │   │   └── Contents.json
│   │   ├── scatterChartImage.imageset/
│   │   │   └── Contents.json
│   │   ├── smile.imageset/
│   │   │   └── Contents.json
│   │   └── waveformChartImage.imageset/
│   │       └── Contents.json
│   ├── BalloonMarker.swift
│   ├── BarChartVC.swift
│   ├── BarChartWaveVC.swift
│   ├── Base.lproj/
│   │   ├── LaunchScreen.storyboard
│   │   └── Main.storyboard
│   ├── BaseVC.swift
│   ├── BubbleChartVC.swift
│   ├── CandleStickChartVC.swift
│   ├── CombinedChartVC.swift
│   ├── Info.plist
│   ├── LineChartVC.swift
│   ├── LineFilledChartVC.swift
│   ├── PieChartHalfVC.swift
│   ├── PieChartPolylineVC.swift
│   ├── PieChartVC.swift
│   ├── RadarChartVC.swift
│   ├── ScatterChartVC.swift
│   ├── ViewController.swift
│   ├── WaveformChartVC.swift
│   └── ZHFColor.swift
├── ChartsUnderstandAndUsage.xcodeproj/
│   ├── project.pbxproj
│   ├── project.xcworkspace/
│   │   ├── contents.xcworkspacedata
│   │   ├── xcshareddata/
│   │   │   └── IDEWorkspaceChecks.plist
│   │   └── xcuserdata/
│   │       └── zhanghaifeng.xcuserdatad/
│   │           └── UserInterfaceState.xcuserstate
│   └── xcuserdata/
│       ├── macbook.xcuserdatad/
│       │   └── xcschemes/
│       │       └── xcschememanagement.plist
│       └── zhanghaifeng.xcuserdatad/
│           └── xcschemes/
│               └── xcschememanagement.plist
├── ChartsUnderstandAndUsage.xcworkspace/
│   ├── contents.xcworkspacedata
│   ├── xcshareddata/
│   │   └── IDEWorkspaceChecks.plist
│   └── xcuserdata/
│       ├── macbook.xcuserdatad/
│       │   └── UserInterfaceState.xcuserstate
│       └── zhanghaifeng.xcuserdatad/
│           ├── UserInterfaceState.xcuserstate
│           └── xcdebugger/
│               └── Breakpoints_v2.xcbkptlist
├── ChartsUnderstandAndUsageTests/
│   ├── ChartsUnderstandAndUsageTests.swift
│   └── Info.plist
├── ChartsUnderstandAndUsageUITests/
│   ├── ChartsUnderstandAndUsageUITests.swift
│   └── Info.plist
├── Podfile
├── Pods/
│   ├── Charts/
│   │   ├── LICENSE
│   │   ├── README.md
│   │   └── Source/
│   │       └── Charts/
│   │           ├── Animation/
│   │           │   ├── Animator.swift
│   │           │   └── ChartAnimationEasing.swift
│   │           ├── Charts/
│   │           │   ├── BarChartView.swift
│   │           │   ├── BarLineChartViewBase.swift
│   │           │   ├── BubbleChartView.swift
│   │           │   ├── CandleStickChartView.swift
│   │           │   ├── ChartViewBase.swift
│   │           │   ├── CombinedChartView.swift
│   │           │   ├── HorizontalBarChartView.swift
│   │           │   ├── LineChartView.swift
│   │           │   ├── PieChartView.swift
│   │           │   ├── PieRadarChartViewBase.swift
│   │           │   ├── RadarChartView.swift
│   │           │   └── ScatterChartView.swift
│   │           ├── Components/
│   │           │   ├── AxisBase.swift
│   │           │   ├── ChartLimitLine.swift
│   │           │   ├── ComponentBase.swift
│   │           │   ├── Description.swift
│   │           │   ├── IMarker.swift
│   │           │   ├── Legend.swift
│   │           │   ├── LegendEntry.swift
│   │           │   ├── MarkerImage.swift
│   │           │   ├── MarkerView.swift
│   │           │   ├── XAxis.swift
│   │           │   └── YAxis.swift
│   │           ├── Data/
│   │           │   ├── Implementations/
│   │           │   │   ├── ChartBaseDataSet.swift
│   │           │   │   └── Standard/
│   │           │   │       ├── BarChartData.swift
│   │           │   │       ├── BarChartDataEntry.swift
│   │           │   │       ├── BarChartDataSet.swift
│   │           │   │       ├── BarLineScatterCandleBubbleChartData.swift
│   │           │   │       ├── BarLineScatterCandleBubbleChartDataSet.swift
│   │           │   │       ├── BubbleChartData.swift
│   │           │   │       ├── BubbleChartDataEntry.swift
│   │           │   │       ├── BubbleChartDataSet.swift
│   │           │   │       ├── CandleChartData.swift
│   │           │   │       ├── CandleChartDataEntry.swift
│   │           │   │       ├── CandleChartDataSet.swift
│   │           │   │       ├── ChartData.swift
│   │           │   │       ├── ChartDataEntry.swift
│   │           │   │       ├── ChartDataEntryBase.swift
│   │           │   │       ├── ChartDataSet.swift
│   │           │   │       ├── CombinedChartData.swift
│   │           │   │       ├── LineChartData.swift
│   │           │   │       ├── LineChartDataSet.swift
│   │           │   │       ├── LineRadarChartDataSet.swift
│   │           │   │       ├── LineScatterCandleRadarChartDataSet.swift
│   │           │   │       ├── PieChartData.swift
│   │           │   │       ├── PieChartDataEntry.swift
│   │           │   │       ├── PieChartDataSet.swift
│   │           │   │       ├── RadarChartData.swift
│   │           │   │       ├── RadarChartDataEntry.swift
│   │           │   │       ├── RadarChartDataSet.swift
│   │           │   │       ├── ScatterChartData.swift
│   │           │   │       └── ScatterChartDataSet.swift
│   │           │   └── Interfaces/
│   │           │       ├── IBarChartDataSet.swift
│   │           │       ├── IBarLineScatterCandleBubbleChartDataSet.swift
│   │           │       ├── IBubbleChartDataSet.swift
│   │           │       ├── ICandleChartDataSet.swift
│   │           │       ├── IChartDataSet.swift
│   │           │       ├── ILineChartDataSet.swift
│   │           │       ├── ILineRadarChartDataSet.swift
│   │           │       ├── ILineScatterCandleRadarChartDataSet.swift
│   │           │       ├── IPieChartDataSet.swift
│   │           │       ├── IRadarChartDataSet.swift
│   │           │       └── IScatterChartDataSet.swift
│   │           ├── Filters/
│   │           │   ├── DataApproximator+N.swift
│   │           │   └── DataApproximator.swift
│   │           ├── Formatters/
│   │           │   ├── DefaultAxisValueFormatter.swift
│   │           │   ├── DefaultFillFormatter.swift
│   │           │   ├── DefaultValueFormatter.swift
│   │           │   ├── IAxisValueFormatter.swift
│   │           │   ├── IFillFormatter.swift
│   │           │   ├── IValueFormatter.swift
│   │           │   └── IndexAxisValueFormatter.swift
│   │           ├── Highlight/
│   │           │   ├── BarHighlighter.swift
│   │           │   ├── ChartHighlighter.swift
│   │           │   ├── CombinedHighlighter.swift
│   │           │   ├── Highlight.swift
│   │           │   ├── HorizontalBarHighlighter.swift
│   │           │   ├── IHighlighter.swift
│   │           │   ├── PieHighlighter.swift
│   │           │   ├── PieRadarHighlighter.swift
│   │           │   ├── RadarHighlighter.swift
│   │           │   └── Range.swift
│   │           ├── Interfaces/
│   │           │   ├── BarChartDataProvider.swift
│   │           │   ├── BarLineScatterCandleBubbleChartDataProvider.swift
│   │           │   ├── BubbleChartDataProvider.swift
│   │           │   ├── CandleChartDataProvider.swift
│   │           │   ├── ChartDataProvider.swift
│   │           │   ├── CombinedChartDataProvider.swift
│   │           │   ├── LineChartDataProvider.swift
│   │           │   └── ScatterChartDataProvider.swift
│   │           ├── Jobs/
│   │           │   ├── AnimatedMoveViewJob.swift
│   │           │   ├── AnimatedViewPortJob.swift
│   │           │   ├── AnimatedZoomViewJob.swift
│   │           │   ├── MoveViewJob.swift
│   │           │   ├── ViewPortJob.swift
│   │           │   └── ZoomViewJob.swift
│   │           ├── Renderers/
│   │           │   ├── AxisRendererBase.swift
│   │           │   ├── BarChartRenderer.swift
│   │           │   ├── BarLineScatterCandleBubbleRenderer.swift
│   │           │   ├── BubbleChartRenderer.swift
│   │           │   ├── CandleStickChartRenderer.swift
│   │           │   ├── ChartDataRendererBase.swift
│   │           │   ├── CombinedChartRenderer.swift
│   │           │   ├── HorizontalBarChartRenderer.swift
│   │           │   ├── LegendRenderer.swift
│   │           │   ├── LineChartRenderer.swift
│   │           │   ├── LineRadarRenderer.swift
│   │           │   ├── LineScatterCandleRadarRenderer.swift
│   │           │   ├── PieChartRenderer.swift
│   │           │   ├── RadarChartRenderer.swift
│   │           │   ├── Renderer.swift
│   │           │   ├── Scatter/
│   │           │   │   ├── ChevronDownShapeRenderer.swift
│   │           │   │   ├── ChevronUpShapeRenderer.swift
│   │           │   │   ├── CircleShapeRenderer.swift
│   │           │   │   ├── CrossShapeRenderer.swift
│   │           │   │   ├── IShapeRenderer.swift
│   │           │   │   ├── SquareShapeRenderer.swift
│   │           │   │   ├── TriangleShapeRenderer.swift
│   │           │   │   └── XShapeRenderer.swift
│   │           │   ├── ScatterChartRenderer.swift
│   │           │   ├── XAxisRenderer.swift
│   │           │   ├── XAxisRendererHorizontalBarChart.swift
│   │           │   ├── XAxisRendererRadarChart.swift
│   │           │   ├── YAxisRenderer.swift
│   │           │   ├── YAxisRendererHorizontalBarChart.swift
│   │           │   └── YAxisRendererRadarChart.swift
│   │           └── Utils/
│   │               ├── ChartColorTemplates.swift
│   │               ├── ChartUtils.swift
│   │               ├── Fill.swift
│   │               ├── Platform.swift
│   │               ├── Transformer.swift
│   │               ├── TransformerHorizontalBarChart.swift
│   │               └── ViewPortHandler.swift
│   ├── Pods.xcodeproj/
│   │   ├── project.pbxproj
│   │   └── xcuserdata/
│   │       ├── macbook.xcuserdatad/
│   │       │   └── xcschemes/
│   │       │       ├── Charts.xcscheme
│   │       │       ├── Pods-ChartsUnderstandAndUsage.xcscheme
│   │       │       └── xcschememanagement.plist
│   │       └── zhanghaifeng.xcuserdatad/
│   │           └── xcschemes/
│   │               ├── Charts.xcscheme
│   │               ├── Pods-ChartsUnderstandAndUsage.xcscheme
│   │               └── xcschememanagement.plist
│   └── Target Support Files/
│       ├── Charts/
│       │   ├── Charts-dummy.m
│       │   ├── Charts-prefix.pch
│       │   ├── Charts-umbrella.h
│       │   ├── Charts.debug.xcconfig
│       │   ├── Charts.modulemap
│       │   ├── Charts.release.xcconfig
│       │   ├── Charts.xcconfig
│       │   └── Info.plist
│       └── Pods-ChartsUnderstandAndUsage/
│           ├── Info.plist
│           ├── Pods-ChartsUnderstandAndUsage-Info.plist
│           ├── Pods-ChartsUnderstandAndUsage-acknowledgements.markdown
│           ├── Pods-ChartsUnderstandAndUsage-acknowledgements.plist
│           ├── Pods-ChartsUnderstandAndUsage-dummy.m
│           ├── Pods-ChartsUnderstandAndUsage-frameworks-Debug-input-files.xcfilelist
│           ├── Pods-ChartsUnderstandAndUsage-frameworks-Debug-output-files.xcfilelist
│           ├── Pods-ChartsUnderstandAndUsage-frameworks-Release-input-files.xcfilelist
│           ├── Pods-ChartsUnderstandAndUsage-frameworks-Release-output-files.xcfilelist
│           ├── Pods-ChartsUnderstandAndUsage-frameworks.sh
│           ├── Pods-ChartsUnderstandAndUsage-resources.sh
│           ├── Pods-ChartsUnderstandAndUsage-umbrella.h
│           ├── Pods-ChartsUnderstandAndUsage.debug.xcconfig
│           ├── Pods-ChartsUnderstandAndUsage.modulemap
│           └── Pods-ChartsUnderstandAndUsage.release.xcconfig
└── README.md
================================================
FILE CONTENTS
================================================
================================================
FILE: ChartsUnderstandAndUsage/AppDelegate.swift
================================================
// AppDelegate.swift
// ChartsUnderstandAndUsage
//
// Created by 张海峰 on 2018/9/12.
// Copyright © 2018年 张海峰. All rights reserved.
import UIKit
@UIApplicationMain
class AppDelegate: UIResponder, UIApplicationDelegate {
var window: UIWindow?
func application(_ application: UIApplication, didFinishLaunchingWithOptions launchOptions: [UIApplication.LaunchOptionsKey: Any]?) -> Bool {
// Override point for customization after application launch.
return true
}
}
//定义一个全局函数打印方法
//自定义标记 ->项目 ->buildSettings -> swift flag ->Debug -> -D DEBUG
func ZHFLog<T>(message : T, file : String = #file, line : Int = #line) {
//在DEBUG环境下打印,在RELEASE环境下不打印
#if DEBUG
let file1 = (file as NSString).lastPathComponent
let line1 = (line as Int)
print("\(file1):line\(line1)---\(message)")
#endif
}
================================================
FILE: ChartsUnderstandAndUsage/Assets.xcassets/AppIcon.appiconset/Contents.json
================================================
{
"images" : [
{
"idiom" : "iphone",
"size" : "20x20",
"scale" : "2x"
},
{
"idiom" : "iphone",
"size" : "20x20",
"scale" : "3x"
},
{
"idiom" : "iphone",
"size" : "29x29",
"scale" : "2x"
},
{
"idiom" : "iphone",
"size" : "29x29",
"scale" : "3x"
},
{
"idiom" : "iphone",
"size" : "40x40",
"scale" : "2x"
},
{
"idiom" : "iphone",
"size" : "40x40",
"scale" : "3x"
},
{
"idiom" : "iphone",
"size" : "60x60",
"scale" : "2x"
},
{
"idiom" : "iphone",
"size" : "60x60",
"scale" : "3x"
},
{
"idiom" : "ipad",
"size" : "20x20",
"scale" : "1x"
},
{
"idiom" : "ipad",
"size" : "20x20",
"scale" : "2x"
},
{
"idiom" : "ipad",
"size" : "29x29",
"scale" : "1x"
},
{
"idiom" : "ipad",
"size" : "29x29",
"scale" : "2x"
},
{
"idiom" : "ipad",
"size" : "40x40",
"scale" : "1x"
},
{
"idiom" : "ipad",
"size" : "40x40",
"scale" : "2x"
},
{
"idiom" : "ipad",
"size" : "76x76",
"scale" : "1x"
},
{
"idiom" : "ipad",
"size" : "76x76",
"scale" : "2x"
},
{
"idiom" : "ipad",
"size" : "83.5x83.5",
"scale" : "2x"
},
{
"idiom" : "ios-marketing",
"size" : "1024x1024",
"scale" : "1x"
}
],
"info" : {
"version" : 1,
"author" : "xcode"
}
}
================================================
FILE: ChartsUnderstandAndUsage/Assets.xcassets/Contents.json
================================================
{
"info" : {
"version" : 1,
"author" : "xcode"
}
}
================================================
FILE: ChartsUnderstandAndUsage/Assets.xcassets/barChartImage.imageset/Contents.json
================================================
{
"images" : [
{
"idiom" : "universal",
"scale" : "1x"
},
{
"idiom" : "universal",
"filename" : "barChartImage.png",
"scale" : "2x"
},
{
"idiom" : "universal",
"scale" : "3x"
}
],
"info" : {
"version" : 1,
"author" : "xcode"
}
}
================================================
FILE: ChartsUnderstandAndUsage/Assets.xcassets/barChartWaveImage.imageset/Contents.json
================================================
{
"images" : [
{
"idiom" : "universal",
"filename" : "barChartWaveImage.png",
"scale" : "1x"
},
{
"idiom" : "universal",
"scale" : "2x"
},
{
"idiom" : "universal",
"scale" : "3x"
}
],
"info" : {
"version" : 1,
"author" : "xcode"
}
}
================================================
FILE: ChartsUnderstandAndUsage/Assets.xcassets/bubbleChartImage.imageset/Contents.json
================================================
{
"images" : [
{
"idiom" : "universal",
"filename" : "bubbleChartImage.png",
"scale" : "1x"
},
{
"idiom" : "universal",
"scale" : "2x"
},
{
"idiom" : "universal",
"scale" : "3x"
}
],
"info" : {
"version" : 1,
"author" : "xcode"
}
}
================================================
FILE: ChartsUnderstandAndUsage/Assets.xcassets/candleStickChartImage.imageset/Contents.json
================================================
{
"images" : [
{
"idiom" : "universal",
"scale" : "1x"
},
{
"idiom" : "universal",
"filename" : "candleStickChartImage.png",
"scale" : "2x"
},
{
"idiom" : "universal",
"scale" : "3x"
}
],
"info" : {
"version" : 1,
"author" : "xcode"
}
}
================================================
FILE: ChartsUnderstandAndUsage/Assets.xcassets/combinedChartImage.imageset/Contents.json
================================================
{
"images" : [
{
"idiom" : "universal",
"scale" : "1x"
},
{
"idiom" : "universal",
"filename" : "combinedChartImage.png",
"scale" : "2x"
},
{
"idiom" : "universal",
"scale" : "3x"
}
],
"info" : {
"version" : 1,
"author" : "xcode"
}
}
================================================
FILE: ChartsUnderstandAndUsage/Assets.xcassets/lineChartImage.imageset/Contents.json
================================================
{
"images" : [
{
"idiom" : "universal",
"scale" : "1x"
},
{
"idiom" : "universal",
"filename" : "lineChartImage.png",
"scale" : "2x"
},
{
"idiom" : "universal",
"scale" : "3x"
}
],
"info" : {
"version" : 1,
"author" : "xcode"
}
}
================================================
FILE: ChartsUnderstandAndUsage/Assets.xcassets/lineFilledChartImage.imageset/Contents.json
================================================
{
"images" : [
{
"idiom" : "universal",
"scale" : "1x"
},
{
"idiom" : "universal",
"filename" : "LineFilledChartImage.png",
"scale" : "2x"
},
{
"idiom" : "universal",
"scale" : "3x"
}
],
"info" : {
"version" : 1,
"author" : "xcode"
}
}
================================================
FILE: ChartsUnderstandAndUsage/Assets.xcassets/pieChartHalfImage.imageset/Contents.json
================================================
{
"images" : [
{
"idiom" : "universal",
"filename" : "pieChartHalfImage.png",
"scale" : "1x"
},
{
"idiom" : "universal",
"scale" : "2x"
},
{
"idiom" : "universal",
"scale" : "3x"
}
],
"info" : {
"version" : 1,
"author" : "xcode"
}
}
================================================
FILE: ChartsUnderstandAndUsage/Assets.xcassets/pieChartImage.imageset/Contents.json
================================================
{
"images" : [
{
"idiom" : "universal",
"filename" : "pieChartImage.png",
"scale" : "1x"
},
{
"idiom" : "universal",
"scale" : "2x"
},
{
"idiom" : "universal",
"scale" : "3x"
}
],
"info" : {
"version" : 1,
"author" : "xcode"
}
}
================================================
FILE: ChartsUnderstandAndUsage/Assets.xcassets/pieChartPolylineImage.imageset/Contents.json
================================================
{
"images" : [
{
"idiom" : "universal",
"filename" : "pieChartPolylineImage.png",
"scale" : "1x"
},
{
"idiom" : "universal",
"scale" : "2x"
},
{
"idiom" : "universal",
"scale" : "3x"
}
],
"info" : {
"version" : 1,
"author" : "xcode"
}
}
================================================
FILE: ChartsUnderstandAndUsage/Assets.xcassets/radarChartImage.imageset/Contents.json
================================================
{
"images" : [
{
"idiom" : "universal",
"scale" : "1x"
},
{
"idiom" : "universal",
"filename" : "radarChartImage.png",
"scale" : "2x"
},
{
"idiom" : "universal",
"scale" : "3x"
}
],
"info" : {
"version" : 1,
"author" : "xcode"
}
}
================================================
FILE: ChartsUnderstandAndUsage/Assets.xcassets/scatterChartImage.imageset/Contents.json
================================================
{
"images" : [
{
"idiom" : "universal",
"filename" : "scatterChartImage.png",
"scale" : "1x"
},
{
"idiom" : "universal",
"scale" : "2x"
},
{
"idiom" : "universal",
"scale" : "3x"
}
],
"info" : {
"version" : 1,
"author" : "xcode"
}
}
================================================
FILE: ChartsUnderstandAndUsage/Assets.xcassets/smile.imageset/Contents.json
================================================
{
"images" : [
{
"idiom" : "universal",
"filename" : "smile.png",
"scale" : "1x"
},
{
"idiom" : "universal",
"scale" : "2x"
},
{
"idiom" : "universal",
"scale" : "3x"
}
],
"info" : {
"version" : 1,
"author" : "xcode"
}
}
================================================
FILE: ChartsUnderstandAndUsage/Assets.xcassets/waveformChartImage.imageset/Contents.json
================================================
{
"images" : [
{
"idiom" : "universal",
"scale" : "1x"
},
{
"idiom" : "universal",
"filename" : "waveformChartImage.png",
"scale" : "2x"
},
{
"idiom" : "universal",
"scale" : "3x"
}
],
"info" : {
"version" : 1,
"author" : "xcode"
}
}
================================================
FILE: ChartsUnderstandAndUsage/BalloonMarker.swift
================================================
//
// BalloonMarker.swift
// ChartsUnderstandAndUsage
//
// Created by 张海峰 on 2018/9/18.
// Copyright © 2018年 张海峰. All rights reserved.
//
import UIKit
import Charts
class BalloonMarker: MarkerImage {
open var color: UIColor
open var arrowSize = CGSize(width: 15, height: 11)
open var font: UIFont
open var textColor: UIColor
open var insets: UIEdgeInsets
open var minimumSize = CGSize()
fileprivate var label: String?
fileprivate var _labelSize: CGSize = CGSize()
fileprivate var _paragraphStyle: NSMutableParagraphStyle?
fileprivate var _drawAttributes = [NSAttributedString.Key : AnyObject]()
public init(color: UIColor, font: UIFont, textColor: UIColor, insets: UIEdgeInsets)
{
self.color = color
self.font = font
self.textColor = textColor
self.insets = insets
_paragraphStyle = NSParagraphStyle.default.mutableCopy()
as? NSMutableParagraphStyle
_paragraphStyle?.alignment = .center
super.init()
}
open override func offsetForDrawing(atPoint point: CGPoint) -> CGPoint
{
var offset = self.offset
var size = self.size
if size.width == 0.0 && image != nil
{
size.width = image!.size.width
}
if size.height == 0.0 && image != nil
{
size.height = image!.size.height
}
let width = size.width
let height = size.height
let padding: CGFloat = 8.0
var origin = point
origin.x -= width / 2
origin.y -= height
if origin.x + offset.x < 0.0
{
offset.x = -origin.x + padding
}
else if let chart = chartView,
origin.x + width + offset.x > chart.bounds.size.width
{
offset.x = chart.bounds.size.width - origin.x - width - padding
}
if origin.y + offset.y < 0
{
offset.y = height + padding;
}
else if let chart = chartView,
origin.y + height + offset.y > chart.bounds.size.height
{
offset.y = chart.bounds.size.height - origin.y - height - padding
}
return offset
}
open override func draw(context: CGContext, point: CGPoint)
{
guard let label = label else { return }
let offset = self.offsetForDrawing(atPoint: point)
let size = self.size
var rect = CGRect(
origin: CGPoint(
x: point.x + offset.x,
y: point.y + offset.y),
size: size)
rect.origin.x -= size.width / 2.0
rect.origin.y -= size.height
context.saveGState()
context.setFillColor(color.cgColor)
if offset.y > 0
{
context.beginPath()
context.move(to: CGPoint(
x: rect.origin.x,
y: rect.origin.y + arrowSize.height))
context.addLine(to: CGPoint(
x: rect.origin.x + (rect.size.width - arrowSize.width) / 2.0,
y: rect.origin.y + arrowSize.height))
//arrow vertex
context.addLine(to: CGPoint(
x: point.x,
y: point.y))
context.addLine(to: CGPoint(
x: rect.origin.x + (rect.size.width + arrowSize.width) / 2.0,
y: rect.origin.y + arrowSize.height))
context.addLine(to: CGPoint(
x: rect.origin.x + rect.size.width,
y: rect.origin.y + arrowSize.height))
context.addLine(to: CGPoint(
x: rect.origin.x + rect.size.width,
y: rect.origin.y + rect.size.height))
context.addLine(to: CGPoint(
x: rect.origin.x,
y: rect.origin.y + rect.size.height))
context.addLine(to: CGPoint(
x: rect.origin.x,
y: rect.origin.y + arrowSize.height))
context.fillPath()
}
else
{
context.beginPath()
context.move(to: CGPoint(
x: rect.origin.x,
y: rect.origin.y))
context.addLine(to: CGPoint(
x: rect.origin.x + rect.size.width,
y: rect.origin.y))
context.addLine(to: CGPoint(
x: rect.origin.x + rect.size.width,
y: rect.origin.y + rect.size.height - arrowSize.height))
context.addLine(to: CGPoint(
x: rect.origin.x + (rect.size.width + arrowSize.width) / 2.0,
y: rect.origin.y + rect.size.height - arrowSize.height))
//arrow vertex
context.addLine(to: CGPoint(
x: point.x,
y: point.y))
context.addLine(to: CGPoint(
x: rect.origin.x + (rect.size.width - arrowSize.width) / 2.0,
y: rect.origin.y + rect.size.height - arrowSize.height))
context.addLine(to: CGPoint(
x: rect.origin.x,
y: rect.origin.y + rect.size.height - arrowSize.height))
context.addLine(to: CGPoint(
x: rect.origin.x,
y: rect.origin.y))
context.fillPath()
}
if offset.y > 0 {
rect.origin.y += self.insets.top + arrowSize.height
} else {
rect.origin.y += self.insets.top
}
rect.size.height -= self.insets.top + self.insets.bottom
UIGraphicsPushContext(context)
label.draw(in: rect, withAttributes: _drawAttributes)
UIGraphicsPopContext()
context.restoreGState()
}
/**
open override func refreshContent(entry: ChartDataEntry, highlight: Highlight)
{
setLabel(String(entry.y))
}
**/
open func setLabel(_ newLabel: String)
{
label = newLabel
_drawAttributes.removeAll()
_drawAttributes[.font] = self.font
_drawAttributes[.paragraphStyle] = _paragraphStyle
_drawAttributes[.foregroundColor] = self.textColor
_labelSize = label?.size(withAttributes: _drawAttributes) ?? CGSize.zero
var size = CGSize()
size.width = _labelSize.width + self.insets.left + self.insets.right
size.height = _labelSize.height + self.insets.top + self.insets.bottom
size.width = max(minimumSize.width, size.width)
size.height = max(minimumSize.height, size.height)
self.size = size
}
}
================================================
FILE: ChartsUnderstandAndUsage/BarChartVC.swift
================================================
//
// BarChartVC.swift
// ChartsUnderstandAndUsage
//
// Created by 张海峰 on 2018/9/12.
// Copyright © 2018年 张海峰. All rights reserved.
//
//Charts框架地址
//https://github.com/danielgindi/Charts.git
//该demo地址
//https://github.com/FighterLightning/ChartsUnderstandAndUsage.git
/*柱状图*/
import UIKit
import Charts
class BarChartVC: BaseVC {
//默认是垂直方向 把下面这一行的 BarChartView 改为 HorizontalBarChartView 即为水平方向
var barChartView: BarChartView = BarChartView()
lazy var xVals: NSMutableArray = NSMutableArray.init()
var data: BarChartData = BarChartData()
let axisMaximum :Double = 100
override func viewDidLoad() {
super.viewDidLoad()
//添加柱状图
addBarChartView()
//设置基本样式
setBarChartViewBaseStyle()
//设置X轴,Y轴样式
setBarChartViewXY()
//添加(刷新数据)
updataData()
}
//添加柱状图
func addBarChartView(){
barChartView.backgroundColor = ZHFColor.white
barChartView.frame.size = CGSize.init(width: ScreenWidth - 20, height: 300)
barChartView.center = self.view.center
barChartView.delegate = self
self.view.addSubview(barChartView)
//刷新按钮响应
refreshrBtn.addTarget(self, action: #selector(updataData), for: .touchUpInside)
}
func setBarChartViewBaseStyle(){
//基本样式
barChartView.noDataText = "暂无数据"//没有数据时的显示
barChartView.drawValueAboveBarEnabled = true//数值显示是否在条柱上面
barChartView.drawBarShadowEnabled = false//是否绘制阴影背景
//交互设置 (把煮食逐个取消试试)
// barChartView.scaleXEnabled = false//取消X轴缩放
barChartView.scaleYEnabled = false//取消Y轴缩放
barChartView.doubleTapToZoomEnabled = false//取消双击是否缩放
// barChartView.pinchZoomEnabled = false//取消XY轴是否同时缩放
barChartView.dragEnabled = true //启用拖拽图表
barChartView.dragDecelerationEnabled = true //拖拽后是否有惯性效果
barChartView.dragDecelerationFrictionCoef = 0.9 //拖拽后惯性效果的摩擦系数(0~1),数值越小,惯性越不明显
}
func setBarChartViewXY(){
//1.X轴样式设置(对应界面显示的--->0月到7月)
let xAxis: XAxis = barChartView.xAxis
xAxis.valueFormatter = self //重写代理方法 设置x轴数据
xAxis.axisLineWidth = 1 //设置X轴线宽
xAxis.labelPosition = XAxis.LabelPosition.bottom //X轴(5种位置显示,根据需求进行设置)
xAxis.drawGridLinesEnabled = false//不绘制网格
xAxis.labelWidth = 4 //设置label间隔,若设置为1,则如果能全部显示,则每个柱形下面都会显示label
xAxis.labelFont = UIFont.systemFont(ofSize: 10)//x轴数值字体大小
xAxis.labelTextColor = ZHFColor.brown//数值字体颜色
//2.Y轴左样式设置(对应界面显示的--->0 到 100)
let leftAxisFormatter = NumberFormatter()
leftAxisFormatter.minimumFractionDigits = 0
leftAxisFormatter.maximumFractionDigits = 1
leftAxisFormatter.positiveSuffix = " $" //数字前缀positivePrefix、 后缀positiveSuffix
let leftAxis: YAxis = barChartView.leftAxis
leftAxis.valueFormatter = DefaultAxisValueFormatter.init(formatter: leftAxisFormatter)
leftAxis.axisMinimum = 0 //最小值
leftAxis.axisMaximum = axisMaximum //最大值
leftAxis.forceLabelsEnabled = true //不强制绘制制定数量的label
leftAxis.labelCount = 6 //Y轴label数量,数值不一定,如果forceLabelsEnabled等于true, 则强制绘制制定数量的label, 但是可能不平均
leftAxis.inverted = false //是否将Y轴进行上下翻转
leftAxis.axisLineWidth = 0.5 //Y轴线宽
leftAxis.axisLineColor = ZHFColor.black //Y轴颜色
leftAxis.labelPosition = YAxis.LabelPosition.outsideChart//坐标数值的位置
leftAxis.labelTextColor = ZHFColor.brown//坐标数值字体颜色
leftAxis.labelFont = UIFont.systemFont(ofSize: 10) //y轴字体大小
//设置虚线样式的网格线(对应的是每条横着的虚线[10.0, 3.0]对应实线和虚线的长度)
leftAxis.drawGridLinesEnabled = true //是否绘制网格线(默认为true)
leftAxis.gridLineDashLengths = [10.0, 3.0]
leftAxis.gridColor = ZHFColor.gray //网格线颜色
leftAxis.gridAntialiasEnabled = true//开启抗锯齿
leftAxis.spaceTop = 0.15//最大值到顶部的范围比
//设置限制线
let limitLine : ChartLimitLine = ChartLimitLine.init(limit: Double(axisMaximum * 0.85), label: "限制线")
limitLine.lineWidth = 2
limitLine.lineColor = ZHFColor.green
limitLine.lineDashLengths = [5.0, 2.0]
limitLine.labelPosition = ChartLimitLine.LabelPosition.rightTop//位置
limitLine.valueTextColor = ZHFColor.zhf66_contentTextColor
limitLine.valueFont = UIFont.systemFont(ofSize: 12)
leftAxis.addLimitLine(limitLine)
leftAxis.drawLimitLinesBehindDataEnabled = true //设置限制线在柱线图后面(默认在前)
//3.Y轴右样式设置(如若设置可参考左样式)
barChartView.rightAxis.enabled = false //不绘制右边轴线
//4.描述文字设置
barChartView.chartDescription?.text = "柱形图"//右下角的description文字样式 不设置的话会有默认数据
barChartView.chartDescription?.position = CGPoint.init(x: 80, y: 5)//位置(及在barChartView的中心点)
barChartView.chartDescription?.font = UIFont.systemFont(ofSize: 12)//大小
barChartView.chartDescription?.textColor = ZHFColor.orange
//5.设置类型试图的对齐方式,右上角 (默认左下角)
let legend = barChartView.legend
legend.enabled = true
legend.horizontalAlignment = .right
legend.verticalAlignment = .top
legend.orientation = .horizontal
legend.textColor = ZHFColor.orange
legend.font = UIFont.systemFont(ofSize: 11.0)
}
//设置数据
@objc func updataData(){
//对应x轴上面需要显示的数据
let count = 8
let x1Vals: NSMutableArray = NSMutableArray.init()
for i in 0 ..< count {
//x轴字体展示
x1Vals.add("\(i)月")
self.xVals = x1Vals
}
//对应Y轴上面需要显示的数据
let yVals: NSMutableArray = NSMutableArray.init()
for i in 0 ..< count {
let val: Double = Double(arc4random_uniform(UInt32(axisMaximum)))
let entry:BarChartDataEntry = BarChartDataEntry.init(x: Double(i), y: Double(val))
yVals.add(entry)
}
//创建BarChartDataSet对象,其中包含有Y轴数据信息,以及可以设置柱形样式
let set1: BarChartDataSet = BarChartDataSet.init(values: yVals as? [ChartDataEntry], label: "信息")
set1.barBorderWidth = 0.2 //边线宽
set1.drawValuesEnabled = true //是否在柱形图上面显示数值
set1.highlightEnabled = true //点击选中柱形图是否有高亮效果,(单击空白处取消选中)
set1.setColors(ZHFColor.gray,ZHFColor.green,ZHFColor.yellow,ZHFColor.zhf_randomColor(),ZHFColor.zhf_randomColor())//设置柱形图颜色(是一个循环,例如:你设置5个颜色,你设置8个柱形,后三个对应的颜色是该设置中的前三个,依次类推)
// set1.setColors(ChartColorTemplates.material(), alpha: 1)
// set1.setColor(ZHFColor.gray)//颜色一致
let dataSets: NSMutableArray = NSMutableArray.init()
dataSets.add(set1)
//创建BarChartData对象, 此对象就是barChartView需要最终数据对象
let data: BarChartData = BarChartData.init(dataSets: dataSets as? [IChartDataSet])
data.barWidth = 0.7 //默认是0.85 (介于0-1之间)
data.setValueFont(UIFont.systemFont(ofSize: 10))
data.setValueTextColor(ZHFColor.orange)
let formatter: NumberFormatter = NumberFormatter.init()
formatter.numberStyle = NumberFormatter.Style.currency//自定义数据显示格式 小数点形式(可以尝试不同看效果)
let forma :DefaultValueFormatter = DefaultValueFormatter.init(formatter: formatter)
data.setValueFormatter(forma)
barChartView.data = data
barChartView.animate(yAxisDuration: 1)//展示方式xAxisDuration 和 yAxisDuration两种
// barChartView.animate(xAxisDuration: 2, yAxisDuration: 2)//展示方式xAxisDuration 和 yAxisDuration两种
}
}
//MARK:- <ChartViewDelegate代理方法实现>
extension BarChartVC :ChartViewDelegate,IAxisValueFormatter {
func stringForValue(_ value: Double, axis: AxisBase?) -> String {
return self.xVals[Int(value)] as! String
}
//1.点击选中
func chartValueSelected(_ chartView: ChartViewBase, entry: ChartDataEntry, highlight: Highlight) {
ZHFLog(message: "点击选中")
}
//2.没有选中
func chartValueNothingSelected(_ chartView: ChartViewBase) {
ZHFLog(message: "没有选中")
}
//3.捏合放大或缩小
func chartScaled(_ chartView: ChartViewBase, scaleX: CGFloat, scaleY: CGFloat) {
ZHFLog(message: "捏合放大或缩小")
}
//4.拖拽图表
func chartTranslated(_ chartView: ChartViewBase, dX: CGFloat, dY: CGFloat) {
ZHFLog(message: "拖拽图表")
}
}
================================================
FILE: ChartsUnderstandAndUsage/BarChartWaveVC.swift
================================================
//
// BarChartHorizontalVC.swift
// ChartsUnderstandAndUsage
//
// Created by 张海峰 on 2018/10/18.
// Copyright © 2018年 张海峰. All rights reserved.
//
//Charts框架地址
//https://github.com/danielgindi/Charts.git
//该demo地址
//https://github.com/FighterLightning/ChartsUnderstandAndUsage.git
/*柱状图(波浪)*/
import UIKit
import Charts
class BarChartWaveVC: BaseVC {
var barChartView: BarChartView = BarChartView()
lazy var xVals: NSMutableArray = NSMutableArray.init()
var data: BarChartData = BarChartData()
let axisMaximum :Double = 100
override func viewDidLoad() {
super.viewDidLoad()
//添加柱状图
addBarChartView()
//设置基本样式
setBarChartViewBaseStyle()
//设置X轴,Y轴样式
setBarChartViewXY()
//添加(刷新数据)
updataData()
}
//添加柱状图
func addBarChartView(){
barChartView.backgroundColor = ZHFColor.white
barChartView.frame.size = CGSize.init(width: ScreenWidth - 20, height: 300)
barChartView.center = self.view.center
barChartView.delegate = self
self.view.addSubview(barChartView)
//刷新按钮响应
refreshrBtn.addTarget(self, action: #selector(updataData), for: .touchUpInside)
}
func setBarChartViewBaseStyle(){
//基本样式
barChartView.noDataText = "暂无数据"//没有数据时的显示
barChartView.drawValueAboveBarEnabled = true//数值显示是否在条柱上面
barChartView.drawBarShadowEnabled = false//是否绘制阴影背景
//交互设置 (把煮食逐个取消试试)
// barChartView.scaleXEnabled = false//取消X轴缩放
barChartView.scaleYEnabled = false//取消Y轴缩放
barChartView.doubleTapToZoomEnabled = false//取消双击是否缩放
// barChartView.pinchZoomEnabled = false//取消XY轴是否同时缩放
barChartView.dragEnabled = true //启用拖拽图表
barChartView.dragDecelerationEnabled = true //拖拽后是否有惯性效果
barChartView.dragDecelerationFrictionCoef = 0.9 //拖拽后惯性效果的摩擦系数(0~1),数值越小,惯性越不明显
}
func setBarChartViewXY(){
//1.X轴样式设置(对应界面显示的--->0月到7月)
let xAxis: XAxis = barChartView.xAxis
xAxis.axisLineWidth = 1 //设置X轴线宽
xAxis.labelPosition = XAxis.LabelPosition.bottom //X轴(5种位置显示,根据需求进行设置)
xAxis.drawGridLinesEnabled = false//不绘制网格
xAxis.labelWidth = 4 //设置label间隔,若设置为1,则如果能全部显示,则每个柱形下面都会显示label
xAxis.labelFont = UIFont.systemFont(ofSize: 10)//x轴数值字体大小
xAxis.labelTextColor = ZHFColor.brown//数值字体颜色
//2.Y轴左样式设置(对应界面显示的--->-2.5 到 2.5)
let leftAxis = barChartView.leftAxis
leftAxis.labelCount = 8
leftAxis.axisMinimum = -1.5
leftAxis.axisMaximum = 1.5
leftAxis.granularityEnabled = true
leftAxis.granularity = 0.2 //左Y 轴线间隙
//3.Y轴右样式设置(如若设置可参考左样式)
let rightAxis = barChartView.rightAxis
rightAxis.labelCount = 8
rightAxis.axisMinimum = -1.5
rightAxis.axisMaximum = 1.5
rightAxis.granularity = 0.2 //右Y 轴线间隙
//4.描述文字设置
barChartView.chartDescription?.text = "柱形图"//右下角的description文字样式 不设置的话会有默认数据
barChartView.chartDescription?.position = CGPoint.init(x: 80, y: 5)//位置(及在barChartView的中心点)
barChartView.chartDescription?.font = UIFont.systemFont(ofSize: 12)//大小
barChartView.chartDescription?.textColor = ZHFColor.orange
//5.设置类型试图的对齐方式,右上角 (默认左下角)
let legend = barChartView.legend
legend.enabled = true
legend.horizontalAlignment = .right
legend.verticalAlignment = .top
legend.orientation = .horizontal
legend.textColor = ZHFColor.orange
legend.font = UIFont.systemFont(ofSize: 11.0)
}
@objc func updataData(){
let count: NSInteger = NSInteger(arc4random_uniform(UInt32(150)) + 100)
let entries = (0 ..< count).map {
BarChartDataEntry(x: Double($0), y: sin(.pi * Double($0%128) / 64))
}
let set = BarChartDataSet(values: entries, label: "信息")
set.setColor(UIColor(red: 240/255, green: 120/255, blue: 123/255, alpha: 1))
let data = BarChartData(dataSet: set)
data.setValueFont(.systemFont(ofSize: 10, weight: .light))
data.setDrawValues(false)
data.barWidth = 0.8
barChartView.data = data
barChartView.animate(xAxisDuration: 2, yAxisDuration: 2)//展示方式xAxisDuration 和 yAxisDuration两种
}
}
//MARK:- <ChartViewDelegate代理方法实现>
extension BarChartWaveVC :ChartViewDelegate {
//1.点击选中
func chartValueSelected(_ chartView: ChartViewBase, entry: ChartDataEntry, highlight: Highlight) {
ZHFLog(message: "点击选中")
}
//2.没有选中
func chartValueNothingSelected(_ chartView: ChartViewBase) {
ZHFLog(message: "没有选中")
}
//3.捏合放大或缩小
func chartScaled(_ chartView: ChartViewBase, scaleX: CGFloat, scaleY: CGFloat) {
ZHFLog(message: "捏合放大或缩小")
}
//4.拖拽图表
func chartTranslated(_ chartView: ChartViewBase, dX: CGFloat, dY: CGFloat) {
ZHFLog(message: "拖拽图表")
}
}
================================================
FILE: ChartsUnderstandAndUsage/Base.lproj/LaunchScreen.storyboard
================================================
<?xml version="1.0" encoding="UTF-8" standalone="no"?>
<document type="com.apple.InterfaceBuilder3.CocoaTouch.Storyboard.XIB" version="3.0" toolsVersion="13122.16" systemVersion="17A277" targetRuntime="iOS.CocoaTouch" propertyAccessControl="none" useAutolayout="YES" launchScreen="YES" useTraitCollections="YES" useSafeAreas="YES" colorMatched="YES" initialViewController="01J-lp-oVM">
<dependencies>
<plugIn identifier="com.apple.InterfaceBuilder.IBCocoaTouchPlugin" version="13104.12"/>
<capability name="Safe area layout guides" minToolsVersion="9.0"/>
<capability name="documents saved in the Xcode 8 format" minToolsVersion="8.0"/>
</dependencies>
<scenes>
<!--View Controller-->
<scene sceneID="EHf-IW-A2E">
<objects>
<viewController id="01J-lp-oVM" sceneMemberID="viewController">
<view key="view" contentMode="scaleToFill" id="Ze5-6b-2t3">
<rect key="frame" x="0.0" y="0.0" width="375" height="667"/>
<autoresizingMask key="autoresizingMask" widthSizable="YES" heightSizable="YES"/>
<color key="backgroundColor" red="1" green="1" blue="1" alpha="1" colorSpace="custom" customColorSpace="sRGB"/>
<viewLayoutGuide key="safeArea" id="6Tk-OE-BBY"/>
</view>
</viewController>
<placeholder placeholderIdentifier="IBFirstResponder" id="iYj-Kq-Ea1" userLabel="First Responder" sceneMemberID="firstResponder"/>
</objects>
<point key="canvasLocation" x="53" y="375"/>
</scene>
</scenes>
</document>
================================================
FILE: ChartsUnderstandAndUsage/Base.lproj/Main.storyboard
================================================
<?xml version="1.0" encoding="UTF-8"?>
<document type="com.apple.InterfaceBuilder3.CocoaTouch.Storyboard.XIB" version="3.0" toolsVersion="14113" targetRuntime="iOS.CocoaTouch" propertyAccessControl="none" useAutolayout="YES" useTraitCollections="YES" useSafeAreas="YES" colorMatched="YES" initialViewController="xOe-gc-o2y">
<device id="retina4_7" orientation="portrait">
<adaptation id="fullscreen"/>
</device>
<dependencies>
<deployment identifier="iOS"/>
<plugIn identifier="com.apple.InterfaceBuilder.IBCocoaTouchPlugin" version="14088"/>
<capability name="documents saved in the Xcode 8 format" minToolsVersion="8.0"/>
</dependencies>
<scenes>
<!--View Controller-->
<scene sceneID="tne-QT-ifu">
<objects>
<placeholder placeholderIdentifier="IBFirstResponder" id="dkx-z0-nzr" sceneMemberID="firstResponder"/>
<viewController id="BYZ-38-t0r" customClass="ViewController" customModule="ChartsUnderstandAndUsage" customModuleProvider="target" sceneMemberID="viewController">
<navigationItem key="navigationItem" id="c0e-sz-hnU"/>
</viewController>
</objects>
<point key="canvasLocation" x="-1815" y="1979"/>
</scene>
<!--Navigation Controller-->
<scene sceneID="H6e-Hr-vst">
<objects>
<navigationController id="xOe-gc-o2y" sceneMemberID="viewController">
<navigationBar key="navigationBar" contentMode="scaleToFill" insetsLayoutMarginsFromSafeArea="NO" id="gdy-cN-cvV">
<rect key="frame" x="0.0" y="20" width="375" height="44"/>
<autoresizingMask key="autoresizingMask"/>
</navigationBar>
<connections>
<segue destination="BYZ-38-t0r" kind="relationship" relationship="rootViewController" id="fdb-gh-TwH"/>
</connections>
</navigationController>
<placeholder placeholderIdentifier="IBFirstResponder" id="ee7-gs-oVx" userLabel="First Responder" sceneMemberID="firstResponder"/>
</objects>
<point key="canvasLocation" x="-2820" y="1979"/>
</scene>
</scenes>
</document>
================================================
FILE: ChartsUnderstandAndUsage/BaseVC.swift
================================================
//
// BaseVC.swift
// ChartsUnderstandAndUsage
//
// Created by 张海峰 on 2018/10/18.
// Copyright © 2018年 张海峰. All rights reserved.
//
import UIKit
class BaseVC: UIViewController {
var refreshrBtn: UIButton = UIButton()
override func viewDidLoad() {
super.viewDidLoad()
self.view.backgroundColor = ZHFColor.white
//添加刷新按钮
refreshrBtn = UIButton.init(type: .custom)
refreshrBtn.frame = CGRect.init(x: 30, y: 84, width: 40, height: 25)
refreshrBtn.setTitle("刷新", for: .normal)
refreshrBtn.backgroundColor = ZHFColor.red
refreshrBtn.setTitleColor(ZHFColor.zhf33_titleTextColor, for: .normal)
refreshrBtn.layer.cornerRadius = 5
refreshrBtn.titleLabel?.font = UIFont.systemFont(ofSize: 13)
self.view.addSubview(refreshrBtn)
}
}
================================================
FILE: ChartsUnderstandAndUsage/BubbleChartVC.swift
================================================
//
// BubbleChartVC.swift
// ChartsUnderstandAndUsage
//
// Created by 张海峰 on 2018/9/17.
// Copyright © 2018年 张海峰. All rights reserved.
//
//Charts框架地址
//https://github.com/danielgindi/Charts.git
//该demo地址
//https://github.com/FighterLightning/ChartsUnderstandAndUsage.git
/*气泡图*/
import UIKit
import Charts
class BubbleChartVC: BaseVC {
var bubbleChartView: BubbleChartView = BubbleChartView()
override func viewDidLoad() {
super.viewDidLoad()
//1.添加气泡图
addBubbleChart()
//2. 基本样式
setBubbleChartViewBaseStyle()
//3.添加(刷新数据)
updataData()
}
}
extension BubbleChartVC{
//添加气泡图
func addBubbleChart(){
bubbleChartView.backgroundColor = ZHFColor.white
bubbleChartView.frame.size = CGSize.init(width: ScreenWidth - 20, height: 300)
bubbleChartView.center = self.view.center
bubbleChartView.delegate = self
self.view.addSubview(bubbleChartView)
//刷新按钮响应
refreshrBtn.addTarget(self, action: #selector(updataData), for: .touchUpInside)
}
func setBubbleChartViewBaseStyle(){
//气泡图描述
bubbleChartView.chartDescription?.text = "气泡图描述"
bubbleChartView.chartDescription?.position = CGPoint.init(x: bubbleChartView.frame.width - 30, y:bubbleChartView.frame.height - 20)//位置(及在bubbleChartView的中心点)
bubbleChartView.chartDescription?.font = UIFont.systemFont(ofSize: 12)//大小
bubbleChartView.chartDescription?.textColor = UIColor.red
//图例
let l = bubbleChartView.legend
l.wordWrapEnabled = false //显示图例
l.horizontalAlignment = .left //居左
l.verticalAlignment = .bottom //放在底部
l.orientation = .horizontal //水平排布
l.drawInside = false // 图例在外
l.formSize = 10 //(图例大小)默认是8
l.form = Legend.Form.circle//图例头部样式
//矩形:.square(默认值) 圆形:.circle 横线:.line 无:.none 空:.empty(与 .none 一样都不显示头部,但不同的是 empty 头部仍然会占一个位置)
//Y轴右侧线
let rightAxis = bubbleChartView.rightAxis
rightAxis.axisMinimum = 0
//Y轴左侧线
let leftAxis = bubbleChartView.leftAxis
leftAxis.axisMinimum = 0
//X轴
let xAxis = bubbleChartView.xAxis
xAxis.labelPosition = .bothSided //分布在两边外部
xAxis.axisMinimum = 0 //最小刻度值
xAxis.granularity = 1 //最小间隔
}
@objc func updataData(){
//第一组气泡图的10条随机数据
let dataEntries1 = (0..<10).map { (i) -> ChartDataEntry in
let val = Double(arc4random_uniform(50))
let size = CGFloat(arc4random_uniform(10))
//只要size超过6的气泡都会带有一个小图标
if size > 6 {
return BubbleChartDataEntry(x: Double(i), y: val, size: size,
icon: UIImage(named: "smile"))//这个图片可根据需求定
} else {
return BubbleChartDataEntry(x: Double(i), y: val, size: size)
}
}
let chartDataSet1 = BubbleChartDataSet(values: dataEntries1, label: "气泡1")
chartDataSet1.highlightCircleWidth = 6 //气泡选中时的边框宽
chartDataSet1.iconsOffset = CGPoint(x: 10, y: -10) //修改气泡上的图片位置(默认居中)
chartDataSet1.drawValuesEnabled = true
chartDataSet1.valueFont = UIFont.systemFont(ofSize: 7)
chartDataSet1.valueTextColor = ZHFColor.red
//第二组气泡图的10条随机数据
let dataEntries2 = (0..<10).map { (i) -> ChartDataEntry in
let val = Double(arc4random_uniform(50) + 50)
let size = CGFloat(arc4random_uniform(10))
//只要size超过6的气泡都会带有一个小图标
if size > 6 {
return BubbleChartDataEntry(x: Double(i), y: val, size: size,
icon: UIImage(named: "smile"))//这个图片可根据需求定
} else {
return BubbleChartDataEntry(x: Double(i), y: val, size: size)
}
}
let chartDataSet2 = BubbleChartDataSet(values: dataEntries2, label: "气泡2")
chartDataSet2.setColor(.orange) //第二组气泡使用橙色
//目前气泡图包括2组数据
let chartData = BubbleChartData(dataSets: [chartDataSet1, chartDataSet2])
//设置气泡图数据
bubbleChartView.data = chartData
}
}
extension BubbleChartVC: ChartViewDelegate{
//1.点击选中
func chartValueSelected(_ chartView: ChartViewBase, entry: ChartDataEntry, highlight: Highlight) {
ZHFLog(message: "点击选中")
}
//2.没有选中
func chartValueNothingSelected(_ chartView: ChartViewBase) {
ZHFLog(message: "没有选中")
}
//3.捏合放大或缩小
func chartScaled(_ chartView: ChartViewBase, scaleX: CGFloat, scaleY: CGFloat) {
ZHFLog(message: "捏合放大或缩小")
}
//4.拖拽图表
func chartTranslated(_ chartView: ChartViewBase, dX: CGFloat, dY: CGFloat) {
ZHFLog(message: "拖拽图表")
}
}
================================================
FILE: ChartsUnderstandAndUsage/CandleStickChartVC.swift
================================================
//
// CandleStickChartVC.swift
// ChartsUnderstandAndUsage
//
// Created by 张海峰 on 2018/9/17.
// Copyright © 2018年 张海峰. All rights reserved.
//
//Charts框架地址
//https://github.com/danielgindi/Charts.git
//该demo地址
//https://github.com/FighterLightning/ChartsUnderstandAndUsage.git
/*K 线图(烛形图)*/
import UIKit
import Charts
class CandleStickChartVC: BaseVC {
var candleStickChartView: CandleStickChartView = CandleStickChartView()
override func viewDidLoad() {
super.viewDidLoad()
//1.添加K 线图(烛形图)
addCandleStickChart()
//2. 基本样式
setCandleStickChartViewBaseStyle()
//3.添加(刷新数据)
updataData()
}
}
extension CandleStickChartVC{
//添加K 线图(烛形图)
func addCandleStickChart(){
candleStickChartView.backgroundColor = ZHFColor.white
candleStickChartView.frame.size = CGSize.init(width: ScreenWidth - 20, height: 300)
candleStickChartView.center = self.view.center
candleStickChartView.delegate = self
self.view.addSubview(candleStickChartView)
//刷新按钮响应
refreshrBtn.addTarget(self, action: #selector(updataData), for: .touchUpInside)
}
func setCandleStickChartViewBaseStyle(){
//K 线图(烛形图)描述
candleStickChartView.chartDescription?.text = "K 线图(烛形图)描述"
candleStickChartView.chartDescription?.position = CGPoint.init(x: candleStickChartView.frame.width - 30, y:candleStickChartView.frame.height - 20)//位置(及在bubbleChartView的中心点)
candleStickChartView.chartDescription?.font = UIFont.systemFont(ofSize: 12)//大小
candleStickChartView.chartDescription?.textColor = UIColor.red
//图例
let l = candleStickChartView.legend
l.wordWrapEnabled = false //显示图例
l.horizontalAlignment = .left //居左
l.verticalAlignment = .bottom //放在底部
l.orientation = .horizontal //水平排布
l.drawInside = false // 图例在外
l.formSize = 10 //(图例大小)默认是8
l.form = Legend.Form.circle//图例头部样式
//矩形:.square(默认值) 圆形:.circle 横线:.line 无:.none 空:.empty(与 .none 一样都不显示头部,但不同的是 empty 头部仍然会占一个位置)
//Y轴右侧线
let rightAxis = candleStickChartView.rightAxis
rightAxis.axisMinimum = 0
//Y轴左侧线
let leftAxis = candleStickChartView.leftAxis
leftAxis.axisMinimum = 0
//X轴
let xAxis = candleStickChartView.xAxis
xAxis.labelPosition = .bothSided //分布在两边外部
xAxis.axisMinimum = 0 //最小刻度值
xAxis.granularity = 1 //最小间隔
}
@objc func updataData(){
//第一组烛形图的10条随机数据
let dataEntries1 = (0..<10).map { (i) -> CandleChartDataEntry in
let val = Double(arc4random_uniform(40) + 10)
let high = Double(arc4random_uniform(9) + 8)
let low = Double(arc4random_uniform(9) + 8)
let open = Double(arc4random_uniform(6) + 1)
let close = Double(arc4random_uniform(6) + 1)
let even = arc4random_uniform(2) % 2 == 0 //true表示开盘价高于收盘价
//当天涨幅超过9的显示一个星星图标
if(!even && (open + close) > 9 ){
return CandleChartDataEntry(x: Double(i),
shadowH: val + high,
shadowL: val - low,
open: even ? val + open : val - open,
close: even ? val - close : val + close,
icon: UIImage(named: "smile")!)
}
else{
return CandleChartDataEntry(x: Double(i),
shadowH: val + high,
shadowL: val - low,
open: even ? val + open : val - open,
close: even ? val - close : val + close)
}
}
let chartDataSet1 = CandleChartDataSet(values: dataEntries1, label: "图例1")
chartDataSet1.shadowWidth = 2 //柱线(烛心线)颜色
chartDataSet1.decreasingFilled = false //开盘高于收盘则使用空心矩形
chartDataSet1.increasingFilled = true //开盘低于收盘则使用实心矩形
chartDataSet1.setColor(.orange) //整体设置颜色
// chartDataSet1.shadowColor = .darkGray //柱线(烛心线)颜色
// chartDataSet1.decreasingColor = ZHFColor.green //实心颜色
// chartDataSet1.increasingColor = ZHFColor.red //空心颜色
// chartDataSet1.shadowColorSameAsCandle = true//竖线的颜色与方框颜色一样
//chartDataSet1.showCandleBar = false //不显示方块
//目前烛形图包括1组数据
let chartData = CandleChartData(dataSets: [chartDataSet1])
//设置烛形图数据
candleStickChartView.data = chartData
}
}
extension CandleStickChartVC: ChartViewDelegate{
//1.点击选中
func chartValueSelected(_ chartView: ChartViewBase, entry: ChartDataEntry, highlight: Highlight) {
ZHFLog(message: "点击选中")
}
//2.没有选中
func chartValueNothingSelected(_ chartView: ChartViewBase) {
ZHFLog(message: "没有选中")
}
//3.捏合放大或缩小
func chartScaled(_ chartView: ChartViewBase, scaleX: CGFloat, scaleY: CGFloat) {
ZHFLog(message: "捏合放大或缩小")
}
//4.拖拽图表
func chartTranslated(_ chartView: ChartViewBase, dX: CGFloat, dY: CGFloat) {
ZHFLog(message: "拖拽图表")
}
}
================================================
FILE: ChartsUnderstandAndUsage/CombinedChartVC.swift
================================================
//
// CombinedChartVC.swift
// ChartsUnderstandAndUsage
//
// Created by 张海峰 on 2018/9/17.
// Copyright © 2018年 张海峰. All rights reserved.
//
//Charts框架地址
//https://github.com/danielgindi/Charts.git
//该demo地址
//https://github.com/FighterLightning/ChartsUnderstandAndUsage.git
/*组合图*/
import UIKit
import Charts
class CombinedChartVC: BaseVC {
let months = ["Jan", "Feb", "Mar",
"Apr", "May", "Jun",
"Jul", "Aug", "Sep",
"Oct", "Nov", "Dec"]
var combinedChartView: CombinedChartView = CombinedChartView()
override func viewDidLoad() {
super.viewDidLoad()
//1.添加混合图
addCombinedChart()
//2.基本样式
setCombinedChartViewBaseStyle()
//3.添加(刷新数据)
updataData()
}
}
//MARK:- UI和组合图基本样式
extension CombinedChartVC{
//添加组合线图
func addCombinedChart(){
combinedChartView.backgroundColor = ZHFColor.white
combinedChartView.frame.size = CGSize.init(width: ScreenWidth - 20, height: 300)
combinedChartView.center = self.view.center
combinedChartView.delegate = self
self.view.addSubview(combinedChartView)
//刷新按钮响应
refreshrBtn.addTarget(self, action: #selector(updataData), for: .touchUpInside)
}
func setCombinedChartViewBaseStyle(){
//混合图描述
combinedChartView.chartDescription?.text = "混合图描述"
combinedChartView.chartDescription?.position = CGPoint.init(x: combinedChartView.frame.width - 30, y:10)//位置(及在lineChartView的中心点)
combinedChartView.chartDescription?.font = UIFont.systemFont(ofSize: 12)//大小
combinedChartView.chartDescription?.textColor = UIColor.red
//图例
let l = combinedChartView.legend
l.wordWrapEnabled = false //显示图例
l.horizontalAlignment = .center //居中
l.verticalAlignment = .bottom //放在底部
l.orientation = .horizontal //水平排布
l.drawInside = false // 图例在外
l.formSize = 10 //(图例大小)默认是8
l.form = Legend.Form.circle//图例头部样式
//矩形:.square(默认值) 圆形:.circle 横线:.line 无:.none 空:.empty(与 .none 一样都不显示头部,但不同的是 empty 头部仍然会占一个位置)
//Y轴右侧线
let rightAxis = combinedChartView.rightAxis
rightAxis.axisMinimum = 0
//Y轴左侧线
let leftAxis = combinedChartView.leftAxis
leftAxis.axisMinimum = 0
//X轴
let xAxis = combinedChartView.xAxis
xAxis.labelPosition = .bothSided //分布在两边外部
xAxis.axisMinimum = 0 //最小刻度值
xAxis.granularity = 1 //最小间隔
xAxis.valueFormatter = self
}
}
//MARK:- 数据加载和刷新
extension CombinedChartVC{
@objc func updataData(){
//各类型图表的显示次序(后面的覆盖前面的)
combinedChartView.drawOrder = [DrawOrder.bar.rawValue,
DrawOrder.bubble.rawValue,
DrawOrder.line.rawValue,
DrawOrder.scatter.rawValue,
DrawOrder.candle.rawValue]
//组合图数据
let chartData = CombinedChartData()
chartData.barData = generateBarData() //柱形图数据
chartData.lineData = generateLineData() //线状图数据
chartData.scatterData = generateScatterData() //
chartData.bubbleData = generateBubbleData()
chartData.candleData = generateCandleData() //烛形图(股票线)
//设置组合图数据
combinedChartView.xAxis.axisMaximum = chartData.xMax + 0.25
combinedChartView.data = chartData
}
//柱状图数据
func generateBarData() -> BarChartData {
// 第一根柱
//10条随机数据
var dataEntries1 = [BarChartDataEntry]()
for i in 0..<10 {
let y = arc4random()%100 + 100
let entry = BarChartDataEntry(x: Double(i), y: Double(y))
dataEntries1.append(entry)
}
//这10条数据作为柱状图的所有数据
let chartDataSet1 = BarChartDataSet(values: dataEntries1, label: "柱状图1")
chartDataSet1.valueFont = UIFont.systemFont(ofSize: 10)
chartDataSet1.colors = [.orange] //使用橙色
chartDataSet1.axisDependency = .left //依赖左侧轴
chartDataSet1.drawValuesEnabled = false //不带文字
// 第二根柱
//生成10条随机数据
var dataEntries2 = [BarChartDataEntry]()
for i in 0..<10 {
let y = arc4random()%50 + 50
let y1 = arc4random()%50 + 50
let entry = BarChartDataEntry.init(x: Double(i), yValues: [Double(y),Double(y1)])
dataEntries2.append(entry)
}
//这10条数据作为柱状图的所有数据
let chartDataSet2 = BarChartDataSet(values: dataEntries2, label: "柱状图2")
chartDataSet2.stackLabels = ["Stack 1", "Stack 2"]
chartDataSet2.valueFont = UIFont.systemFont(ofSize: 10)
chartDataSet2.colors = [.red,.orange] //使用红色
chartDataSet2.axisDependency = .left //依赖左侧轴
chartDataSet2.drawValuesEnabled = false //不带文字
//目前柱状图只包括1组立柱
let chartData = BarChartData(dataSets: [chartDataSet1,chartDataSet2])
let groupSpace = 0.06 //组与组之间的空间比
let barSpace = 0.02 // 一组内两柱之间空间比
let barWidth = 0.45 // 一组内每个柱宽空间比
// (0.45 + 0.02) * 2 + 0.06 = 1.00 -> interval per "group"
chartData.barWidth = barWidth
// make this BarData object grouped
chartData.groupBars(fromX: 0, groupSpace: groupSpace, barSpace: barSpace)
return chartData
}
//折线图数据
func generateLineData() -> LineChartData {
//生成10条随机数据
var dataEntries = [ChartDataEntry]()
for i in 0..<10 {
let y = arc4random()%100
let entry = ChartDataEntry(x: Double(i), y: Double(y))
dataEntries.append(entry)
}
//这10条数据作为折线图的所有数据
let chartDataSet = LineChartDataSet(values: dataEntries, label: "折线图")
chartDataSet.setColor(ZHFColor.zhf_randomColor())//折线颜色
chartDataSet.lineWidth = 2.5
chartDataSet.setCircleColor(ZHFColor.red)
chartDataSet.circleRadius = 5 //外圆半径
chartDataSet.circleHoleColor = ZHFColor.yellow
chartDataSet.circleHoleRadius = 2.5 //内圆半径
// chartDataSet.drawFilledEnabled = true //开启填充色绘制
// chartDataSet.fillColor = ZHFColor.zhf_randomColor()
// chartDataSet.fillAlpha = 0.5 //设置填充色透明度
chartDataSet.mode = .cubicBezier //折线是bezier曲线
chartDataSet.drawValuesEnabled = true //带文字
chartDataSet.valueFont = .systemFont(ofSize: 10)
chartDataSet.valueTextColor = ZHFColor.zhf_randomColor()
chartDataSet.axisDependency = .left//依赖左侧轴
//目前柱状图只包括1组折线
let chartData = LineChartData(dataSets: [chartDataSet])
return chartData
}
//生成散点图数据
func generateScatterData() -> ScatterChartData {
//生成10条随机数据
let dataEntries = (0..<10).map { (i) -> ChartDataEntry in
let val = Double(arc4random_uniform(100) + 150)
return ChartDataEntry(x: Double(i), y: val)
}
let chartDataSet = ScatterChartDataSet(values: dataEntries, label: "散点图")
chartDataSet.colors = [ChartColorTemplates.material()[0]]
chartDataSet.scatterShapeSize = 8 //(默认是10)
chartDataSet.drawValuesEnabled = false
//目前散点图包括1组数据
let chartData = ScatterChartData(dataSets: [chartDataSet])
return chartData
}
//生成气泡图数据
func generateBubbleData() -> BubbleChartData {
//生成10条随机数据
let dataEntries = (0..<10).map { (i) -> BubbleChartDataEntry in
let val = Double(arc4random_uniform(100) + 300)
//气泡大小
let size = CGFloat(arc4random_uniform(10))
return BubbleChartDataEntry(x: Double(i), y: val, size: size)
}
let chartDataSet = BubbleChartDataSet(values: dataEntries, label: "气泡图")
chartDataSet.colors = [ChartColorTemplates.material()[1]]
chartDataSet.valueTextColor = .white
chartDataSet.valueFont = .systemFont(ofSize: 10)
chartDataSet.drawValuesEnabled = true //是否显示气泡上的数字
//目前气泡图包括1组数据
let chartData = BubbleChartData(dataSets: [chartDataSet])
return chartData
}
//生成烛形图数据
func generateCandleData() -> CandleChartData {
//生成10条随机数据
let dataEntries = (0..<10).map { (i) -> CandleChartDataEntry in
let val = Double(arc4random_uniform(100) + 10 + 400)
let high = Double(arc4random_uniform(20) + 8)
let low = Double(arc4random_uniform(20) + 8)
let open = Double(arc4random_uniform(20) + 1)
let close = Double(arc4random_uniform(20) + 1)
let even = arc4random_uniform(2) % 2 == 0 //true表示开盘价高于收盘价
return CandleChartDataEntry(x: Double(i),
shadowH: val + high,
shadowL: val - low,
open: even ? val + open : val - open,
close: even ? val - close : val + close)
}
let chartDataSet = CandleChartDataSet(values: dataEntries, label: "烛形图")
chartDataSet.setColor(ChartColorTemplates.material()[2])
chartDataSet.shadowColor = .darkGray //柱线(烛心线)颜色
chartDataSet.decreasingColor = ZHFColor.green //实心颜色
chartDataSet.increasingColor = ZHFColor.red //空心颜色
//目前烛形图包括1组数据
let chartData = CandleChartData(dataSets: [chartDataSet])
return chartData
}
}
//MARK:- ChartViewDelegate
extension CombinedChartVC: ChartViewDelegate,IAxisValueFormatter {
func stringForValue(_ value: Double, axis: AxisBase?) -> String {
return months[Int(value) % months.count]
}
//1.点击选中
func chartValueSelected(_ chartView: ChartViewBase, entry: ChartDataEntry, highlight: Highlight) {
ZHFLog(message: "点击选中")
}
//2.没有选中
func chartValueNothingSelected(_ chartView: ChartViewBase) {
ZHFLog(message: "没有选中")
}
//3.捏合放大或缩小
func chartScaled(_ chartView: ChartViewBase, scaleX: CGFloat, scaleY: CGFloat) {
ZHFLog(message: "捏合放大或缩小")
}
//4.拖拽图表
func chartTranslated(_ chartView: ChartViewBase, dX: CGFloat, dY: CGFloat) {
ZHFLog(message: "拖拽图表")
}
}
================================================
FILE: ChartsUnderstandAndUsage/Info.plist
================================================
<?xml version="1.0" encoding="UTF-8"?>
<!DOCTYPE plist PUBLIC "-//Apple//DTD PLIST 1.0//EN" "http://www.apple.com/DTDs/PropertyList-1.0.dtd">
<plist version="1.0">
<dict>
<key>CFBundleDevelopmentRegion</key>
<string>$(DEVELOPMENT_LANGUAGE)</string>
<key>CFBundleExecutable</key>
<string>$(EXECUTABLE_NAME)</string>
<key>CFBundleIdentifier</key>
<string>$(PRODUCT_BUNDLE_IDENTIFIER)</string>
<key>CFBundleInfoDictionaryVersion</key>
<string>6.0</string>
<key>CFBundleName</key>
<string>$(PRODUCT_NAME)</string>
<key>CFBundlePackageType</key>
<string>APPL</string>
<key>CFBundleShortVersionString</key>
<string>1.0</string>
<key>CFBundleVersion</key>
<string>1</string>
<key>LSRequiresIPhoneOS</key>
<true/>
<key>UILaunchStoryboardName</key>
<string>LaunchScreen</string>
<key>UIMainStoryboardFile</key>
<string>Main</string>
<key>UIRequiredDeviceCapabilities</key>
<array>
<string>armv7</string>
</array>
<key>UISupportedInterfaceOrientations</key>
<array>
<string>UIInterfaceOrientationPortrait</string>
<string>UIInterfaceOrientationLandscapeLeft</string>
<string>UIInterfaceOrientationLandscapeRight</string>
</array>
<key>UISupportedInterfaceOrientations~ipad</key>
<array>
<string>UIInterfaceOrientationPortrait</string>
<string>UIInterfaceOrientationPortraitUpsideDown</string>
<string>UIInterfaceOrientationLandscapeLeft</string>
<string>UIInterfaceOrientationLandscapeRight</string>
</array>
</dict>
</plist>
================================================
FILE: ChartsUnderstandAndUsage/LineChartVC.swift
================================================
//
// LineChartVC.swift
// ChartsUnderstandAndUsage
//
// Created by 张海峰 on 2018/9/17.
// Copyright © 2018年 张海峰. All rights reserved.
//
//Charts框架地址
//https://github.com/danielgindi/Charts.git
//该demo地址
//https://github.com/FighterLightning/ChartsUnderstandAndUsage.git
/*折线图*/
import UIKit
import Charts
class LineChartVC: BaseVC {
var circleColors :[UIColor] = [UIColor]()
var lineChartView: LineChartView = LineChartView()
override func viewDidLoad() {
super.viewDidLoad()
//添加折线
addLineChart()
//折线图描述文字和样式
chartDescription()
//设置交互样式
interactionStyle()
//修改背景色和边框样式
setBackgroundBorder()
//设置x轴的样式属性
setXAxisStyle()
//设置y轴的样式属性
setYAxisStyle()
//设置限制线(可设置多根)
setlimitLine()
//添加(刷新数据)
updataData()
}
}
//MARK:- UI和折线图基本样式
extension LineChartVC{
//添加折线
func addLineChart(){
lineChartView.backgroundColor = ZHFColor.white
lineChartView.frame.size = CGSize.init(width: ScreenWidth - 20, height: 300)
lineChartView.center = self.view.center
lineChartView.delegate = self
self.view.addSubview(lineChartView)
//刷新按钮响应
refreshrBtn.addTarget(self, action: #selector(updataData), for: .touchUpInside)
}
//设置交互样式
func interactionStyle(){
lineChartView.scaleYEnabled = false //取消Y轴缩放
lineChartView.doubleTapToZoomEnabled = true //双击缩放
lineChartView.dragEnabled = true //启用拖动手势
lineChartView.dragDecelerationEnabled = true //拖拽后是否有惯性效果
lineChartView.dragDecelerationFrictionCoef = 0.9 //拖拽后惯性效果摩擦系数(0~1)越小惯性越不明显
}
//描述文字
func chartDescription(){
lineChartView.noDataText = "暂无数据" //如果没有数据会显示这个
lineChartView.chartDescription?.text = "折线图描述"
lineChartView.chartDescription?.position = CGPoint.init(x: lineChartView.frame.width - 30, y:lineChartView.frame.height - 20)//位置(及在lineChartView的中心点)
lineChartView.chartDescription?.font = UIFont.systemFont(ofSize: 12)//大小
lineChartView.chartDescription?.textColor = UIColor.red
lineChartView.legend.textColor = ZHFColor.purple //描述文字颜色
lineChartView.legend.formSize = 10 //(图例大小)默认是8
lineChartView.legend.form = Legend.Form.circle//图例头部样式
//矩形:.square(默认值) 圆形:.circle 横线:.line 无:.none 空:.empty(与 .none 一样都不显示头部,但不同的是 empty 头部仍然会占一个位置)
}
//修改背景色和边框样式
func setBackgroundBorder(){
// lineChartView.drawGridBackgroundEnabled = true //绘制图形区域背景
// lineChartView.gridBackgroundColor = ZHFColor.yellow //背景改成黄色(默认为浅灰色)
lineChartView.drawBordersEnabled = true //绘制图形区域边框
lineChartView.borderColor = ZHFColor.red //边框为红色
lineChartView.borderLineWidth = 2 //边框线条大小为2
}
//设置x轴的样式属性
func setXAxisStyle(){
//轴线宽、颜色、刻度、间隔
lineChartView.xAxis.axisLineWidth = 2 //x轴宽度
lineChartView.xAxis.axisLineColor = .black //x轴颜色
lineChartView.xAxis.axisMinimum = 0 //最小刻度值
lineChartView.xAxis.axisMaximum = 10 //最大刻度值
lineChartView.xAxis.granularity = 1 //最小间隔
//文字属性
lineChartView.xAxis.labelPosition = .bottom //x轴上的数字显示在下方(默认显示在上方 .top .bottom .bothSided .topInside .bottomInside)
lineChartView.xAxis.labelTextColor = .red //刻度文字颜色
lineChartView.xAxis.labelFont = .systemFont(ofSize: 13) //刻度文字大小
lineChartView.xAxis.labelRotationAngle = -20 //刻度文字倾斜角度
//文字格式
let formatter = NumberFormatter() //自定义格式
formatter.positivePrefix = "#" //数字前缀positivePrefix、 后缀positiveSuffix
lineChartView.xAxis.valueFormatter = DefaultAxisValueFormatter(formatter: formatter)
//自定义刻度标签文字
// let xValues = ["一月","二月","三月","四月","五月","六月","七月","八月","九月","十月"]
// lineChartView.xAxis.valueFormatter = IndexAxisValueFormatter(values: xValues)
//网格线
lineChartView.xAxis.drawGridLinesEnabled = true //制网格线
lineChartView.xAxis.gridColor = .orange //x轴对应网格线的颜色
lineChartView.xAxis.gridLineWidth = 2 //x轴对应网格线的大小
lineChartView.xAxis.gridLineDashLengths = [4,2] //虚线各段长度
}
//设置y轴的样式属性(分左、右侧)
func setYAxisStyle(){
//右侧(默认显示)
// lineChartView.rightAxis.drawLabelsEnabled = false //不绘制右侧Y轴文字
// lineChartView.rightAxis.drawAxisLineEnabled = false //不显示右侧Y轴
// lineChartView.rightAxis.enabled = false //禁用右侧的Y轴
//左侧
// lineChartView.leftAxis.inverted = true //刻度值反向排列(默认正向)
// lineChartView.leftAxis.labelPosition = .insideChart //文字显示在内侧
//0刻度线
lineChartView.leftAxis.drawZeroLineEnabled = true //绘制0刻度线
lineChartView.leftAxis.zeroLineColor = .red //0刻度线颜色
lineChartView.leftAxis.zeroLineWidth = 2 //0刻度线线宽
lineChartView.leftAxis.zeroLineDashLengths = [4, 2] //0刻度线使用虚线样式
//(1.轴线宽、颜色、刻度、间隔 2.文字属性 3.文字格式、4.网格线)和 func setXAxisStyle()方法一样
}
//设置限制线(可设置多根)
func setlimitLine(){
//界限1
let limitLine1 = ChartLimitLine(limit: 85, label: "优秀")
limitLine1.lineColor = ZHFColor.green
limitLine1.lineWidth = 2 //线宽
limitLine1.lineDashLengths = [4, 2] //虚线样式
//limitLine1.drawLabelEnabled = false //不绘制文字
limitLine1.valueTextColor = UIColor.blue //文字颜色
limitLine1.valueFont = UIFont.systemFont(ofSize: 13) //文字大小
limitLine1.labelPosition = .leftTop //文字位置
/*.leftTop:左上
.leftBottom:左下
.rightTop:右上(默认)
.rightBottom:右下
*/
lineChartView.leftAxis.addLimitLine(limitLine1)
//界限2
let limitLine2 = ChartLimitLine(limit: 60, label: "合格")
limitLine1.lineColor = ZHFColor.purple
lineChartView.leftAxis.addLimitLine(limitLine2)
lineChartView.leftAxis.drawLimitLinesBehindDataEnabled = true//将限制线绘制在折线后面
}
}
//MARK:- 数据加载和刷新
extension LineChartVC{
@objc func updataData(){
//1.第一条折线
//生成20条随机数据
var dataEntries1 = [ChartDataEntry]()
for i in 0..<20 {
let y = 50 - arc4random()%50
//或者 arc4random_uniform(UInt32(100))
let entry = ChartDataEntry.init(x: Double(i), y: Double(y))
dataEntries1.append(entry)
circleColors.append(ZHFColor.blue)
}
//设置折线
let chartDataSet1 = LineChartDataSet(values: dataEntries1, label: "张三")
chartDataSet1.setColors(ZHFColor.zhf_randomColor(),ZHFColor.zhf_randomColor())//设置折线颜色(是一个循环,例如:你设置5个颜色,你设置8条折线,后三个对应的颜色是该设置中的前三个,依次类推)
// chartDataSet1.setColors(ChartColorTemplates.material(), alpha: 1)
//chartDataSet1.setColor(ZHFColor.gray)//颜色一致
chartDataSet1.lineWidth = 3 //线条宽度
chartDataSet1.lineDashLengths = [4,2] //设置折线为虚线各段长度
chartDataSet1.mode = .horizontalBezier //贝塞尔曲线(默认是折线 .linear .stepped .cubicBezier .horizontalBezier)
//设置折点
// chartDataSet1.drawCirclesEnabled = false //不绘制转折点
// chartDataSet1.drawCircleHoleEnabled = false //不绘制转折点内圆
chartDataSet1.circleColors = circleColors //外圆颜色
chartDataSet1.circleHoleColor = ZHFColor.yellow //内圆颜色
chartDataSet1.circleRadius = 6 //外圆半径
chartDataSet1.circleHoleRadius = 4 //内圆半径
//设置折线上的文字
chartDataSet1.drawValuesEnabled = true //绘制拐点上的文字(默认绘制)
chartDataSet1.valueColors = [.blue] //拐点上的文字颜色
chartDataSet1.valueFont = .systemFont(ofSize: 9) //拐点上的文字大小
//文字格式
let formatter = NumberFormatter() //自定义格式
formatter.positiveSuffix = "%" //数字后缀单位
chartDataSet1.valueFormatter = DefaultValueFormatter(formatter: formatter)
//绘制填充色背景
//*半透明的填充色
chartDataSet1.drawFilledEnabled = true //开启填充色绘制
chartDataSet1.fillColor = .orange //设置填充色
chartDataSet1.fillAlpha = 0.5 //设置填充色透明度
//*渐变色填充
//开启填充色绘制
chartDataSet1.drawFilledEnabled = true
//渐变颜色数组
let gradientColors = [UIColor.orange.cgColor, UIColor.white.cgColor] as CFArray
//每组颜色所在位置(范围0~1)
let colorLocations:[CGFloat] = [1.0, 0.0]
//生成渐变色
let gradient = CGGradient.init(colorsSpace: CGColorSpaceCreateDeviceRGB(),
colors: gradientColors, locations: colorLocations)
//将渐变色作为填充对象s
chartDataSet1.fill = Fill.fillWithLinearGradient(gradient!, angle: 90.0)
//1.第二条折线
var dataEntries2 = [ChartDataEntry]()
for i in 0..<20 {
let y = 50 + arc4random()%50
//或者 arc4random_uniform(UInt32(100))
let entry = ChartDataEntry.init(x: Double(i), y: Double(y))
dataEntries2.append(entry)
}
let chartDataSet2 = LineChartDataSet(values: dataEntries2, label: "李四")
//chartDataSet2.setColors(ZHFColor.gray,ZHFColor.green,ZHFColor.yellow,ZHFColor.zhf_randomColor(),ZHFColor.zhf_randomColor())//设置折线颜色(是一个循环,例如:你设置5个颜色,你设置8条折线,后三个对应的颜色是该设置中的前三个,依次类推)
// chartDataSet2.setColors(ChartColorTemplates.material(), alpha: 1)
chartDataSet2.setColor(ZHFColor.gray)//颜色一致
chartDataSet2.lineWidth = 2
let chartData = LineChartData(dataSets: [chartDataSet1,chartDataSet2])
//设置折现图数据
lineChartView.data = chartData
lineChartView.animate(xAxisDuration: 2)//展示方式xAxisDuration 和 yAxisDuration两种
}
}
//MARK:- ChartViewDelegate
extension LineChartVC: ChartViewDelegate{
//1.点击选中
func chartValueSelected(_ chartView: ChartViewBase, entry: ChartDataEntry, highlight: Highlight) {
ZHFLog(message: "点击选中")
//将选中的数据点的颜色改成黄色
var chartDataSet = LineChartDataSet()
chartDataSet = (chartView.data?.dataSets[0] as? LineChartDataSet)!
let values = chartDataSet.values
let index = values.index(where: {$0.x == highlight.x}) //获取索引
chartDataSet.circleColors = circleColors //还原
chartDataSet.circleColors[index!] = .orange
//重新渲染表格
chartView.data?.notifyDataChanged()
chartView.notifyDataSetChanged()
// //显示该点的MarkerView标签(不同形式)
// self.showMarkerView(value: "\(entry.y)")
self.showBalloonMarkerView(value: "\(entry.y)")
}
//2.没有选中
func chartValueNothingSelected(_ chartView: ChartViewBase) {
ZHFLog(message: "取消选中")
//还原所有点的颜色
var chartDataSet = LineChartDataSet()
chartDataSet = (chartView.data?.dataSets[0] as? LineChartDataSet)!
chartDataSet.circleColors = circleColors
//重新渲染表格
chartView.data?.notifyDataChanged()
chartView.notifyDataSetChanged()
}
//3.捏合放大或缩小
func chartScaled(_ chartView: ChartViewBase, scaleX: CGFloat, scaleY: CGFloat) {
ZHFLog(message: "捏合放大或缩小")
}
//4.拖拽图表
func chartTranslated(_ chartView: ChartViewBase, dX: CGFloat, dY: CGFloat) {
ZHFLog(message: "拖拽图表")
}
}
//MARK:- MarkerView标签
extension LineChartVC{
//显示MarkerView标签
func showMarkerView(value:String){
let marker = MarkerView(frame: CGRect(x: 20, y: 20, width: 80, height: 20))
marker.chartView = self.lineChartView
let label = UILabel(frame: CGRect(x: 0, y: 0, width: 80, height: 20))
label.text = "数据:\(value)"
label.textColor = UIColor.white
label.font = UIFont.systemFont(ofSize: 12)
label.backgroundColor = UIColor.gray
label.textAlignment = .center
marker.addSubview(label)
self.lineChartView.marker = marker
}
//显示BalloonMarkerView标签
func showBalloonMarkerView(value:String){
let marker = BalloonMarker(color: UIColor(white: 180/255, alpha: 1),
font: .systemFont(ofSize: 12),
textColor: .white,
insets: UIEdgeInsets(top: 8, left: 8, bottom: 20, right: 8))
marker.chartView = self.lineChartView
marker.chartView = self.lineChartView
marker.minimumSize = CGSize(width: 80, height: 40)
marker.setLabel("数据:\(value)")
self.lineChartView.marker = marker
}
}
================================================
FILE: ChartsUnderstandAndUsage/LineFilledChartVC.swift
================================================
//
// LineFilledChartVC.swift
// ChartsUnderstandAndUsage
//
// Created by 张海峰 on 2018/9/18.
// Copyright © 2018年 张海峰. All rights reserved.
//
//Charts框架地址
//https://github.com/danielgindi/Charts.git
//该demo地址
//https://github.com/FighterLightning/ChartsUnderstandAndUsage.git
/*折线填充图*/
import UIKit
import Charts
class LineFilledChartVC: BaseVC {
var lineChartView: LineChartView = LineChartView()
override func viewDidLoad() {
super.viewDidLoad()
//添加折线
addLineChart()
//设置基本样式
setLineChartViewBaseStyle()
//添加(刷新数据)
updataData()
}
//添加折线
func addLineChart(){
lineChartView.backgroundColor = ZHFColor.white
lineChartView.frame.size = CGSize.init(width: ScreenWidth - 20, height: 300)
lineChartView.center = self.view.center
lineChartView.delegate = self
self.view.addSubview(lineChartView)
//刷新按钮响应
refreshrBtn.addTarget(self, action: #selector(updataData), for: .touchUpInside)
}
//基本样式
func setLineChartViewBaseStyle(){
lineChartView.noDataText = "暂无数据" //如果没有数据会显示这个
lineChartView.drawGridBackgroundEnabled = true //绘制图形区域背景
lineChartView.gridBackgroundColor = ZHFColor.blue //背景颜色
lineChartView.alpha = 0.5//背景透明度
//折线图描述文字和样式
lineChartView.chartDescription?.text = "折线图描述"
lineChartView.legend.textColor = ZHFColor.purple //描述文字颜色
lineChartView.legend.formSize = 10 //(图例大小)默认是8
lineChartView.legend.form = Legend.Form.circle//图例头部样式
//矩形:.square(默认值) 圆形:.circle 横线:.line 无:.none 空:.empty(与 .none 一样都不显示头部,但不同的是 empty 头部仍然会占一个位置)
lineChartView.chartDescription?.position = CGPoint.init(x: lineChartView.frame.width - 30, y:lineChartView.frame.height - 20)//位置(及在lineChartView的中心点)
lineChartView.chartDescription?.font = UIFont.systemFont(ofSize: 12)//大小
lineChartView.chartDescription?.textColor = UIColor.red
//设置交互样式
lineChartView.scaleYEnabled = false //取消Y轴缩放
lineChartView.doubleTapToZoomEnabled = true //双击缩放
lineChartView.dragEnabled = true //启用拖动手势
lineChartView.dragDecelerationEnabled = true //拖拽后是否有惯性效果
lineChartView.dragDecelerationFrictionCoef = 0.9 //拖拽后惯性效果摩擦系数(0~1)越小惯性越不明显
//修改背景色和边框样式
lineChartView.drawBordersEnabled = true //绘制图形区域边框
lineChartView.borderColor = ZHFColor.red //边框为红色
lineChartView.borderLineWidth = 2 //边框线条大小为2
}
@objc func updataData(){
//1.第一条折线
//生成30条随机数据
var dataEntries1 = [ChartDataEntry]()
for i in 0..<30 {
let y = arc4random()%10 + 20
//或者 arc4random_uniform(UInt32(100))
let entry = ChartDataEntry.init(x: Double(i), y: Double(y))
dataEntries1.append(entry)
}
let chartDataSet1 = LineChartDataSet(values: dataEntries1, label: "上折线")
//chartDataSet1.setColors(ZHFColor.gray,ZHFColor.green,ZHFColor.yellow,ZHFColor.zhf_randomColor(),ZHFColor.zhf_randomColor())//设置折线颜色(是一个循环,例如:你设置5个颜色,你设置8条折线,后三个对应的颜色是该设置中的前三个,依次类推)
// chartDataSet1.setColors(ChartColorTemplates.material(), alpha: 1)
chartDataSet1.setColor(ZHFColor.gray)//颜色一致
chartDataSet1.lineWidth = 2
chartDataSet1.drawCirclesEnabled = false //不绘制拐点
chartDataSet1.fillAlpha = 1
chartDataSet1.drawFilledEnabled = true //绘制上填充色
chartDataSet1.fillColor = .white
chartDataSet1.drawValuesEnabled = false //不绘制拐点上的文字
chartDataSet1.fillFormatter = DefaultFillFormatter { _,_ -> CGFloat in
return CGFloat(self.lineChartView.leftAxis.axisMaximum) //向上绘制填充区域
}
//修改点击时十字线的样式
chartDataSet1.highlightColor = .red //十字线颜色
chartDataSet1.highlightLineWidth = 2 //十字线线宽
chartDataSet1.highlightLineDashLengths = [4, 2] //使用虚线样式的十字线
// chartDataSet1.highlightEnabled = false //不启用十字线
chartDataSet1.drawVerticalHighlightIndicatorEnabled = false //不显示纵向十字线
// chartDataSet1.drawHorizontalHighlightIndicatorEnabled = false //不显示横向十字线
//2.第二条折线
var dataEntries2 = [ChartDataEntry]()
for i in 0..<30 {
let y = arc4random()%10
//或者 arc4random_uniform(UInt32(100))
let entry = ChartDataEntry.init(x: Double(i), y: Double(y))
dataEntries2.append(entry)
}
let chartDataSet2 = LineChartDataSet(values: dataEntries2, label: "下折线")
//chartDataSet2.setColors(ZHFColor.gray,ZHFColor.green,ZHFColor.yellow,ZHFColor.zhf_randomColor(),ZHFColor.zhf_randomColor())//设置折线颜色(是一个循环,例如:你设置5个颜色,你设置8条折线,后三个对应的颜色是该设置中的前三个,依次类推)
// chartDataSet2.setColors(ChartColorTemplates.material(), alpha: 1)
chartDataSet2.setColor(ZHFColor.green)//颜色一致
chartDataSet2.lineWidth = 2
chartDataSet2.drawCirclesEnabled = false //不绘制拐点
chartDataSet2.fillAlpha = 1
chartDataSet2.drawFilledEnabled = true //绘制下填充色
chartDataSet2.fillColor = .white
chartDataSet2.drawValuesEnabled = false //不绘制拐点上的文字
chartDataSet2.fillFormatter = DefaultFillFormatter { _,_ -> CGFloat in
return CGFloat(self.lineChartView.leftAxis.axisMinimum) //向下绘制填充区域
}
//修改点击时十字线的样式
chartDataSet2.highlightColor = .red //十字线颜色
chartDataSet2.highlightLineWidth = 2 //十字线线宽
chartDataSet2.highlightLineDashLengths = [4, 2] //使用虚线样式的十字线
let chartData = LineChartData(dataSets: [chartDataSet1,chartDataSet2])
//设置折现图数据
lineChartView.data = chartData
}
}
extension LineFilledChartVC: ChartViewDelegate{
//1.点击选中
func chartValueSelected(_ chartView: ChartViewBase, entry: ChartDataEntry, highlight: Highlight) {
ZHFLog(message: "点击选中")
}
//2.没有选中
func chartValueNothingSelected(_ chartView: ChartViewBase) {
ZHFLog(message: "没有选中")
}
//3.捏合放大或缩小
func chartScaled(_ chartView: ChartViewBase, scaleX: CGFloat, scaleY: CGFloat) {
ZHFLog(message: "捏合放大或缩小")
}
//4.拖拽图表
func chartTranslated(_ chartView: ChartViewBase, dX: CGFloat, dY: CGFloat) {
ZHFLog(message: "拖拽图表")
}
}
================================================
FILE: ChartsUnderstandAndUsage/PieChartHalfVC.swift
================================================
//
// PieChartHalfVC.swift
// ChartsUnderstandAndUsage
//
// Created by 张海峰 on 2018/9/19.
// Copyright © 2018年 张海峰. All rights reserved.
//
//Charts框架地址
//https://github.com/danielgindi/Charts.git
//该demo地址
//https://github.com/FighterLightning/ChartsUnderstandAndUsage.git
/*半个饼状图*/
import UIKit
import Charts
class PieChartHalfVC: BaseVC {
var pieChartView: PieChartView = PieChartView()
var data: PieChartData = PieChartData()
override func viewDidLoad() {
super.viewDidLoad()
//1.添加饼状图
addPieChart()
//2.设置基本样式
setPieChartViewBaseStyle()
//3.添加(刷新数据)
updataData()
}
//添加饼状图
func addPieChart(){
pieChartView.backgroundColor = ZHFColor.white
pieChartView.frame.size = CGSize.init(width: ScreenWidth, height: 300)
pieChartView.center = self.view.center
pieChartView.delegate = self
self.view.addSubview(pieChartView)
//刷新按钮响应
refreshrBtn.addTarget(self, action: #selector(updataData), for: .touchUpInside)
}
func setPieChartViewBaseStyle(){
//基本样式
pieChartView.setExtraOffsets(left: 30, top: 30, right: 30, bottom: 0)//饼状图距离边缘的间隙
pieChartView.usePercentValuesEnabled = true//是否根据所提供的数据, 将显示数据转换为百分比格式
pieChartView.dragDecelerationEnabled = true//拖拽饼状图后是否有惯性效果
pieChartView.drawSlicesUnderHoleEnabled = true//是否显示区块文本
//空(实)心饼状图样式
pieChartView.drawHoleEnabled = true//饼状图是否是空心 true为空心 false为实心
pieChartView.holeRadiusPercent = 0.5//空心半径占比
pieChartView.holeColor = ZHFColor.white//空心颜色 这个不能设置成clear
pieChartView.transparentCircleRadiusPercent = 0.54//半透明空心半径占比
pieChartView.transparentCircleColor = ZHFColor.zhf_colorAlpha(withHex: 0xffffff, alpha: 0.4)//半透明空心的颜色
//设置成半圆
pieChartView.maxAngle = 180 // Half chart
pieChartView.rotationAngle = 180 // Rotate to make the half on the upper side
pieChartView.centerTextOffset = CGPoint(x: 0, y: -20)//上移20
//饼状图中间描述
if pieChartView.isDrawHoleEnabled == true {
pieChartView.drawCenterTextEnabled = true
//pieChartView.centerText = "饼状图"
//富文本
let centerText : NSMutableAttributedString = NSMutableAttributedString.init(string: "半圆饼状图")
centerText.setAttributes([NSAttributedString.Key.font : UIFont.boldSystemFont(ofSize: 15),NSAttributedString.Key.foregroundColor: ZHFColor.green], range: NSRange.init(location: 0, length: 2))
pieChartView.centerAttributedText = centerText
}
else{}
//饼状图描述
pieChartView.chartDescription?.text = "饼状图示例"
pieChartView.chartDescription?.font = UIFont.systemFont(ofSize: 10)
pieChartView.chartDescription?.textColor = ZHFColor.zhf33_titleTextColor
//饼状图图例
let l = pieChartView.legend
l.maxSizePercent = 1 //图例在饼状图中的大小占比, 这会影响图例的宽高
l.formToTextSpace = 5 //文本间隔
l.font = UIFont.systemFont(ofSize: 10)//字体大小
l.textColor = ZHFColor.gray//字体颜色
l.form = Legend.Form.circle//图示样式: 方形、线条、圆形
//图例在饼状图中的位置(右上角)
l.horizontalAlignment = Legend.HorizontalAlignment.right
l.verticalAlignment = Legend.VerticalAlignment.top
l.orientation = Legend.Orientation.vertical
l.formSize = 12;//图示大小
}
@objc func updataData(){
//对应x轴上面需要显示的数据
let count = 5
//对应Y轴上面需要显示的数据
let yVals: NSMutableArray = NSMutableArray.init()
for i in 0 ..< count {
let val: Double = Double(arc4random_uniform(UInt32(200)))
let entry:PieChartDataEntry = PieChartDataEntry.init(value: val, label: "paty\(i)")
// let entry:BarChartDataEntry = BarChartDataEntry.init(x: Double(i), y: Double(val))
yVals.add(entry)
}
//创建PieChartDataSet对象
let set1: PieChartDataSet = PieChartDataSet.init(values: yVals as? [ChartDataEntry], label: "饼状图")
set1.drawIconsEnabled = false //是否在饼状图上面显示图片
set1.sliceSpace = 2 //相邻区块之间的间距
set1.selectionShift = 8//选中区块时, 放大的半径
set1.drawValuesEnabled = true //是否在饼状图上面显示数值
set1.highlightEnabled = true //点击选饼状图是否有高亮效果,(单击空白处取消选中)
set1.setColors(ZHFColor.gray,ZHFColor.blue,ZHFColor.red,ZHFColor.zhf_randomColor(),ZHFColor.zhf_randomColor())//设置柱形图颜色(是一个循环,例如:你设置5个颜色,你设置8个柱形,后三个对应的颜色是该设置中的前三个,依次类推)
// set1.setColors(ChartColorTemplates.material(), alpha: 1)
// set1.setColor(ZHFColor.gray)//颜色一致
set1.xValuePosition = PieChartDataSet.ValuePosition.insideSlice//名称位置(名称显示在饼图内部)
//外部条件下有折线
set1.yValuePosition = PieChartDataSet.ValuePosition.insideSlice//数据位置
//数据与区块之间的用于指示的折线样式
set1.valueLinePart1OffsetPercentage = 0.85//折线中第一段起始位置相对于区块的偏移量, 数值越大, 折线距离区块越远
set1.valueLinePart1Length = 0.5//折线中第一段长度占比
set1.valueLinePart2Length = 0.4//折线中第二段长度最大占比
set1.valueLineWidth = 1//折线的粗细
set1.valueLineColor = ZHFColor.brown//折线颜色
let dataSets: NSMutableArray = NSMutableArray.init()
dataSets.add(set1)
//创建BarChartData对象, 此对象就是barChartView需要最终数据对象
let data: PieChartData = PieChartData.init(dataSets: dataSets as? [IChartDataSet])
let formatter: NumberFormatter = NumberFormatter.init()
formatter.numberStyle = NumberFormatter.Style.percent //自定义数据显示格式 小数点形式(可以尝试不同看效果)
formatter.maximumFractionDigits = 1
formatter.multiplier = 1
formatter.percentSymbol = " %"
let forma :DefaultValueFormatter = DefaultValueFormatter.init(formatter: formatter)
data.setValueFormatter(forma)
data.setValueFont(UIFont.systemFont(ofSize: 10))
data.setValueTextColor(ZHFColor.orange)
pieChartView.data = data
pieChartView.animate(xAxisDuration: 1, easingOption: ChartEasingOption.easeOutExpo)
}
}
//MARK:- <ChartViewDelegate代理方法实现>
extension PieChartHalfVC :ChartViewDelegate {
//1.点击选中
func chartValueSelected(_ chartView: ChartViewBase, entry: ChartDataEntry, highlight: Highlight) {
ZHFLog(message: "点击选中")
}
//2.没有选中
func chartValueNothingSelected(_ chartView: ChartViewBase) {
ZHFLog(message: "没有选中")
}
//3.捏合放大或缩小
func chartScaled(_ chartView: ChartViewBase, scaleX: CGFloat, scaleY: CGFloat) {
ZHFLog(message: "捏合放大或缩小")
}
//4.拖拽图表
func chartTranslated(_ chartView: ChartViewBase, dX: CGFloat, dY: CGFloat) {
ZHFLog(message: "拖拽图表")
}
}
================================================
FILE: ChartsUnderstandAndUsage/PieChartPolylineVC.swift
================================================
//
// PieChartPolylineVC.swift
// ChartsUnderstandAndUsage
//
// Created by 张海峰 on 2018/10/18.
// Copyright © 2018年 张海峰. All rights reserved.
//
//Charts框架地址
//https://github.com/danielgindi/Charts.git
//该demo地址
//https://github.com/FighterLightning/ChartsUnderstandAndUsage.git
/*饼状图(折线注释)*/
import UIKit
import Charts
class PieChartPolylineVC: BaseVC {
var pieChartView: PieChartView = PieChartView()
var data: PieChartData = PieChartData()
override func viewDidLoad() {
super.viewDidLoad()
//添加饼状图
addPieChart()
//设置基本样式
setPieChartViewBaseStyle()
//3.添加(刷新数据)
updataData()
}
//添加饼状图
func addPieChart(){
pieChartView.backgroundColor = ZHFColor.white
pieChartView.frame.size = CGSize.init(width: ScreenWidth - 20, height: 300)
pieChartView.center = self.view.center
pieChartView.delegate = self
self.view.addSubview(pieChartView)
//刷新按钮响应
refreshrBtn.addTarget(self, action: #selector(updataData), for: .touchUpInside)
}
func setPieChartViewBaseStyle(){
//基本样式
pieChartView.setExtraOffsets(left: 30, top: 30, right: 30, bottom: 0)//饼状图距离边缘的间隙
pieChartView.usePercentValuesEnabled = true//是否根据所提供的数据, 将显示数据转换为百分比格式
pieChartView.dragDecelerationEnabled = true//拖拽饼状图后是否有惯性效果
pieChartView.drawSlicesUnderHoleEnabled = true//是否显示区块文本
//空(实)心饼状图样式
pieChartView.drawHoleEnabled = true//饼状图是否是空心 true为空心 false为实心
pieChartView.holeRadiusPercent = 0.5//空心半径占比
pieChartView.holeColor = ZHFColor.white//空心颜色 这个不能设置成clear
pieChartView.transparentCircleRadiusPercent = 0.54//半透明空心半径占比
pieChartView.transparentCircleColor = ZHFColor.zhf_colorAlpha(withHex: 0xffffff, alpha: 0.4)//半透明空心的颜色
//饼状图中间描述
if pieChartView.isDrawHoleEnabled == true {
pieChartView.drawCenterTextEnabled = true
pieChartView.centerText = "饼状图"
//富文本
// let centerText : NSMutableAttributedString = NSMutableAttributedString.init(string: "饼状图")
// centerText.setAttributes([NSAttributedString.Key.font : UIFont.boldSystemFont(ofSize: 15),NSAttributedString.Key.foregroundColor: ZHFColor.green], range: NSRange.init(location: 0, length: centerText.length))
// pieChartView.centerAttributedText = centerText
}
else{}
//饼状图描述
pieChartView.chartDescription?.text = "饼状图示例"
pieChartView.chartDescription?.font = UIFont.systemFont(ofSize: 10)
pieChartView.chartDescription?.textColor = ZHFColor.zhf33_titleTextColor
//饼状图图例
let l = pieChartView.legend
l.maxSizePercent = 1 //图例在饼状图中的大小占比, 这会影响图例的宽高
l.formToTextSpace = 5 //文本间隔
l.font = UIFont.systemFont(ofSize: 10)//字体大小
l.textColor = ZHFColor.gray//字体颜色
l.form = Legend.Form.circle//图示样式: 方形、线条、圆形
//图例在饼状图中的位置(上局中、 水平布局)
l.horizontalAlignment = Legend.HorizontalAlignment.center
l.verticalAlignment = Legend.VerticalAlignment.top
l.orientation = Legend.Orientation.horizontal //水平布局
l.formSize = 12;//图示大小
}
@objc func updataData(){
//对应x轴上面需要显示的数据
let count = 5
//对应Y轴上面需要显示的数据
let yVals: NSMutableArray = NSMutableArray.init()
for i in 0 ..< count {
let val: Double = Double(arc4random_uniform(UInt32(200)))
let entry:PieChartDataEntry = PieChartDataEntry.init(value: val, label: "paty\(i)")
// let entry:BarChartDataEntry = BarChartDataEntry.init(x: Double(i), y: Double(val))
yVals.add(entry)
}
//创建PieChartDataSet对象
let set1: PieChartDataSet = PieChartDataSet.init(values: yVals as? [ChartDataEntry], label: "饼状图")
set1.drawIconsEnabled = false //是否在饼状图上面显示图片
set1.sliceSpace = 2 //相邻区块之间的间距
set1.selectionShift = 8//选中区块时, 放大的半径
set1.drawValuesEnabled = true //是否在饼状图上面显示数值
set1.highlightEnabled = true //点击选饼状图是否有高亮效果,(单击空白处取消选中)
set1.setColors(ZHFColor.gray,ZHFColor.blue,ZHFColor.red,ZHFColor.zhf_randomColor(),ZHFColor.zhf_randomColor())//设置柱形图颜色(是一个循环,例如:你设置5个颜色,你设置8个柱形,后三个对应的颜色是该设置中的前三个,依次类推)
// set1.setColors(ChartColorTemplates.material(), alpha: 1)
// set1.setColor(ZHFColor.gray)//颜色一致
set1.xValuePosition = PieChartDataSet.ValuePosition.insideSlice//名称位置
//PieChartDataSet.ValuePosition.insideSlice 数据显示在饼图内部 PieChartDataSet.ValuePosition.outsideSlice外部
//外部条件下有折线
set1.yValuePosition = PieChartDataSet.ValuePosition.insideSlice//数据位置
//数据与区块之间的用于指示的折线样式
set1.valueLinePart1OffsetPercentage = 0.85//折线中第一段起始位置相对于区块的偏移量, 数值越大, 折线距离区块越远
set1.valueLinePart1Length = 0.5//折线中第一段长度占比
set1.valueLinePart2Length = 0.4//折线中第二段长度最大占比
set1.valueLineWidth = 1//折线的粗细
set1.yValuePosition = .outsideSlice //这个折线外部展示
set1.valueLineColor = ZHFColor.red//折线颜色
let dataSets: NSMutableArray = NSMutableArray.init()
dataSets.add(set1)
//创建BarChartData对象, 此对象就是barChartView需要最终数据对象
let data: PieChartData = PieChartData.init(dataSets: dataSets as? [IChartDataSet])
let formatter: NumberFormatter = NumberFormatter.init()
//formatter.numberStyle = NumberFormatter.Style.currency//自定义数据显示格式 小数点形式(可以尝试不同看效果)
formatter.numberStyle = NumberFormatter.Style.percent //自定义数据显示格式 小数点形式(可以尝试不同看效果)
formatter.maximumFractionDigits = 0
formatter.multiplier = 1
let forma :DefaultValueFormatter = DefaultValueFormatter.init(formatter: formatter)
data.setValueFormatter(forma)
data.setValueFont(UIFont.systemFont(ofSize: 10))
data.setValueTextColor(ZHFColor.orange)
pieChartView.data = data
pieChartView.animate(xAxisDuration: 1, easingOption: ChartEasingOption.easeOutExpo)
}
}
//MARK:- <ChartViewDelegate代理方法实现>
extension PieChartPolylineVC :ChartViewDelegate {
//1.点击选中
func chartValueSelected(_ chartView: ChartViewBase, entry: ChartDataEntry, highlight: Highlight) {
ZHFLog(message: "点击选中")
}
//2.没有选中
func chartValueNothingSelected(_ chartView: ChartViewBase) {
ZHFLog(message: "没有选中")
}
//3.捏合放大或缩小
func chartScaled(_ chartView: ChartViewBase, scaleX: CGFloat, scaleY: CGFloat) {
ZHFLog(message: "捏合放大或缩小")
}
//4.拖拽图表
func chartTranslated(_ chartView: ChartViewBase, dX: CGFloat, dY: CGFloat) {
ZHFLog(message: "拖拽图表")
}
}
================================================
FILE: ChartsUnderstandAndUsage/PieChartVC.swift
================================================
//
// PieChartVC.swift
// ChartsUnderstandAndUsage
//
// Created by 张海峰 on 2018/9/13.
// Copyright © 2018年 张海峰. All rights reserved.
//
//Charts框架地址
//https://github.com/danielgindi/Charts.git
//该demo地址
//https://github.com/FighterLightning/ChartsUnderstandAndUsage.git
/*饼状图*/
import UIKit
import Charts
class PieChartVC: BaseVC {
var pieChartView: PieChartView = PieChartView()
var data: PieChartData = PieChartData()
override func viewDidLoad() {
super.viewDidLoad()
//添加饼状图
addPieChart()
//设置基本样式
setPieChartViewBaseStyle()
//3.添加(刷新数据)
updataData()
}
//添加饼状图
func addPieChart(){
pieChartView.backgroundColor = ZHFColor.white
pieChartView.frame.size = CGSize.init(width: ScreenWidth - 20, height: 300)
pieChartView.center = self.view.center
pieChartView.delegate = self
self.view.addSubview(pieChartView)
//刷新按钮响应
refreshrBtn.addTarget(self, action: #selector(updataData), for: .touchUpInside)
}
func setPieChartViewBaseStyle(){
//基本样式
pieChartView.setExtraOffsets(left: 30, top: 30, right: 30, bottom: 0)//饼状图距离边缘的间隙
pieChartView.usePercentValuesEnabled = true//是否根据所提供的数据, 将显示数据转换为百分比格式
pieChartView.dragDecelerationEnabled = true//拖拽饼状图后是否有惯性效果
pieChartView.drawSlicesUnderHoleEnabled = true//是否显示区块文本
//空(实)心饼状图样式
pieChartView.drawHoleEnabled = true//饼状图是否是空心 true为空心 false为实心
pieChartView.holeRadiusPercent = 0.5//空心半径占比
pieChartView.holeColor = ZHFColor.white//空心颜色 这个不能设置成clear
pieChartView.transparentCircleRadiusPercent = 0.54//半透明空心半径占比
pieChartView.transparentCircleColor = ZHFColor.zhf_colorAlpha(withHex: 0xffffff, alpha: 0.4)//半透明空心的颜色
//饼状图中间描述
if pieChartView.isDrawHoleEnabled == true {
pieChartView.drawCenterTextEnabled = true
pieChartView.centerText = "饼状图"
//富文本
// let centerText : NSMutableAttributedString = NSMutableAttributedString.init(string: "饼状图")
// centerText.setAttributes([NSAttributedString.Key.font : UIFont.boldSystemFont(ofSize: 15),NSAttributedString.Key.foregroundColor: ZHFColor.green], range: NSRange.init(location: 0, length: centerText.length))
// pieChartView.centerAttributedText = centerText
}
else{}
//饼状图描述
pieChartView.chartDescription?.text = "饼状图示例"
pieChartView.chartDescription?.font = UIFont.systemFont(ofSize: 10)
pieChartView.chartDescription?.textColor = ZHFColor.zhf33_titleTextColor
//饼状图图例
let l = pieChartView.legend
l.maxSizePercent = 1 //图例在饼状图中的大小占比, 这会影响图例的宽高
l.formToTextSpace = 5 //文本间隔
l.font = UIFont.systemFont(ofSize: 10)//字体大小
l.textColor = ZHFColor.gray//字体颜色
l.form = Legend.Form.circle//图示样式: 方形、线条、圆形
//图例在饼状图中的位置(上局中、 水平布局)
l.horizontalAlignment = Legend.HorizontalAlignment.center
l.verticalAlignment = Legend.VerticalAlignment.top
l.orientation = Legend.Orientation.horizontal //水平布局
l.formSize = 12;//图示大小
}
@objc func updataData(){
//对应x轴上面需要显示的数据
let count = 5
//对应Y轴上面需要显示的数据
let yVals: NSMutableArray = NSMutableArray.init()
for i in 0 ..< count {
let val: Double = Double(arc4random_uniform(UInt32(200)))
let entry:PieChartDataEntry = PieChartDataEntry.init(value: val, label: "paty\(i)")
// let entry:BarChartDataEntry = BarChartDataEntry.init(x: Double(i), y: Double(val))
yVals.add(entry)
}
//创建PieChartDataSet对象
let set1: PieChartDataSet = PieChartDataSet.init(values: yVals as? [ChartDataEntry], label: "饼状图")
set1.drawIconsEnabled = false //是否在饼状图上面显示图片
set1.sliceSpace = 2 //相邻区块之间的间距
set1.selectionShift = 8//选中区块时, 放大的半径
set1.drawValuesEnabled = true //是否在饼状图上面显示数值
set1.highlightEnabled = true //点击选饼状图是否有高亮效果,(单击空白处取消选中)
set1.setColors(ZHFColor.gray,ZHFColor.blue,ZHFColor.red,ZHFColor.zhf_randomColor(),ZHFColor.zhf_randomColor())//设置柱形图颜色(是一个循环,例如:你设置5个颜色,你设置8个柱形,后三个对应的颜色是该设置中的前三个,依次类推)
// set1.setColors(ChartColorTemplates.material(), alpha: 1)
// set1.setColor(ZHFColor.gray)//颜色一致
set1.xValuePosition = PieChartDataSet.ValuePosition.insideSlice//名称位置
//PieChartDataSet.ValuePosition.insideSlice 数据显示在饼图内部
let dataSets: NSMutableArray = NSMutableArray.init()
dataSets.add(set1)
//创建BarChartData对象, 此对象就是barChartView需要最终数据对象
let data: PieChartData = PieChartData.init(dataSets: dataSets as? [IChartDataSet])
let formatter: NumberFormatter = NumberFormatter.init()
//formatter.numberStyle = NumberFormatter.Style.currency//自定义数据显示格式 小数点形式(可以尝试不同看效果)
formatter.numberStyle = NumberFormatter.Style.percent //自定义数据显示格式 小数点形式(可以尝试不同看效果)
formatter.maximumFractionDigits = 0
formatter.multiplier = 1
let forma :DefaultValueFormatter = DefaultValueFormatter.init(formatter: formatter)
data.setValueFormatter(forma)
data.setValueFont(UIFont.systemFont(ofSize: 10))
data.setValueTextColor(ZHFColor.orange)
pieChartView.data = data
pieChartView.animate(xAxisDuration: 1, easingOption: ChartEasingOption.easeOutExpo)
}
}
//MARK:- <ChartViewDelegate代理方法实现>
extension PieChartVC :ChartViewDelegate {
//1.点击选中
func chartValueSelected(_ chartView: ChartViewBase, entry: ChartDataEntry, highlight: Highlight) {
ZHFLog(message: "点击选中")
}
//2.没有选中
func chartValueNothingSelected(_ chartView: ChartViewBase) {
ZHFLog(message: "没有选中")
}
//3.捏合放大或缩小
func chartScaled(_ chartView: ChartViewBase, scaleX: CGFloat, scaleY: CGFloat) {
ZHFLog(message: "捏合放大或缩小")
}
//4.拖拽图表
func chartTranslated(_ chartView: ChartViewBase, dX: CGFloat, dY: CGFloat) {
ZHFLog(message: "拖拽图表")
}
}
================================================
FILE: ChartsUnderstandAndUsage/RadarChartVC.swift
================================================
//
// RadarChartVC.swift
// ChartsUnderstandAndUsage
//
// Created by 张海峰 on 2018/9/13.
// Copyright © 2018年 张海峰. All rights reserved.
//Charts框架地址
//https://github.com/danielgindi/Charts.git
//该demo地址
//https://github.com/FighterLightning/ChartsUnderstandAndUsage.git
/*雷达图*/
import UIKit
import Charts
class RadarChartVC: BaseVC {
var radarChartView: RadarChartView = RadarChartView()
var data: RadarChartData = RadarChartData()
let axisMaximum :Double = 150
lazy var xVals: NSMutableArray = NSMutableArray.init()
override func viewDidLoad() {
super.viewDidLoad()
self.view.backgroundColor = ZHFColor.yellow
//添加雷达图
addRadarChart()
//设置基本样式
setRadarChartViewBaseStyle()
}
//添加雷达图
func addRadarChart(){
radarChartView.backgroundColor = ZHFColor.white
radarChartView.frame.size = CGSize.init(width: ScreenWidth - 20, height: 300)
radarChartView.center = self.view.center
radarChartView.delegate = self
self.view.addSubview(radarChartView)
//刷新按钮响应
refreshrBtn.addTarget(self, action: #selector(updataData), for: .touchUpInside)
}
func setRadarChartViewBaseStyle(){
//雷达图描述
radarChartView.rotationEnabled = true //是否允许转动
radarChartView.highlightPerTapEnabled = true //是否能被选中
//雷达图线条样式
radarChartView.webLineWidth = 0.5 //主干线线宽
radarChartView.webColor = ZHFColor.black
radarChartView.innerWebLineWidth = 0.375 //边线线宽
radarChartView.innerWebColor = ZHFColor.black
radarChartView.webAlpha = 1 //透明度
//设置 xAx
let xAxis: XAxis = radarChartView.xAxis
xAxis.valueFormatter = self //重写代理方法 设置y轴数据
xAxis.labelPosition = XAxis.LabelPosition.topInside //X轴(5种位置显示,根据需求进行设置)
xAxis.labelFont = UIFont.systemFont(ofSize: 10)//x轴数值字体大小
xAxis.labelTextColor = ZHFColor.brown//数值字体颜色
//设置 yAxis
let yAxis: YAxis = radarChartView.yAxis
yAxis.axisMinimum = 0
yAxis.axisMaximum = axisMaximum
yAxis.drawLabelsEnabled = false
yAxis.labelCount = 8
yAxis.labelFont = UIFont.systemFont(ofSize: 10)//x轴数值字体大小
xAxis.labelTextColor = ZHFColor.brown//数值字体颜色
//雷达图图例
radarChartView.chartDescription?.text = "雷达图示例"
radarChartView.chartDescription?.font = UIFont.systemFont(ofSize: 10)
radarChartView.chartDescription?.textColor = ZHFColor.zhf33_titleTextColor
radarChartView.chartDescription?.position = CGPoint.init(x: 80, y: 5)//位置(及在radarChartView的中心点)
//图例在雷达图中的位置(右上角)
radarChartView.legend.horizontalAlignment = Legend.HorizontalAlignment.right
radarChartView.legend.verticalAlignment = Legend.VerticalAlignment.top
radarChartView.legend.orientation = Legend.Orientation.horizontal
radarChartView.legend.formSize = 10;//图示大小
radarChartView.legend.maxSizePercent = 1 //图例在饼状图中的大小占比, 这会影响图例的宽高
radarChartView.legend.formToTextSpace = 5 //文本间隔
radarChartView.legend.font = UIFont.systemFont(ofSize: 10)//字体大小
radarChartView.legend.textColor = ZHFColor.gray//字体颜色
radarChartView.legend.form = Legend.Form.circle//图示样式: 方形、线条、圆形
//为雷达图提供数据
self.data = setData()
radarChartView.data = self.data;
//设置动画效果
radarChartView.animate(yAxisDuration: 1)//展示方式xAxisDuration 和 yAxisDuration两种
}
func setData() -> RadarChartData{
let count = 12
//对应x轴上面需要显示的数据
let x1Vals: NSMutableArray = NSMutableArray.init()
for i in 0 ..< count {
//x轴字体展示
x1Vals.add("\(i + 1)月")
self.xVals = x1Vals
}
//对应Y轴上面需要显示的数据
let yVals: NSMutableArray = NSMutableArray.init()
for _ in 0 ..< count {
let val: Double = Double(arc4random_uniform(UInt32(axisMaximum - 50)) + 50)
let entry:RadarChartDataEntry = RadarChartDataEntry.init(value: val)
yVals.add(entry)
}
//创建RadarChartDataSet对象,其中包含有Y轴数据信息
let set1: RadarChartDataSet = RadarChartDataSet.init(values: yVals as? [ChartDataEntry], label: "雷达星座运势图")
set1.lineWidth = 0.5 //数据折线线宽
set1.setColor(ZHFColor.gray)//颜色
set1.drawFilledEnabled = true ////是否填充颜色
set1.fillColor = ZHFColor.green
set1.fillAlpha = 0.3
set1.drawValuesEnabled = true //是否绘制显示数据
set1.highlightEnabled = true //点击选饼状图是否有高亮效果,(单击空白处取消选中)
set1.valueFont = UIFont.systemFont(ofSize: 10)
set1.valueTextColor = ZHFColor.gray
let dataSets: NSMutableArray = NSMutableArray.init()
dataSets.add(set1)
//创建RadarChartData对象, 此对象就是radarChartView需要最终数据对象
let data: RadarChartData = RadarChartData.init(dataSets: dataSets as? [IChartDataSet])
return data
}
@objc func updataData(){
//重新设置基本样式
setRadarChartViewBaseStyle()
}
}
//MARK:- <ChartViewDelegate代理方法实现>
extension RadarChartVC :ChartViewDelegate,IAxisValueFormatter {
func stringForValue(_ value: Double, axis: AxisBase?) -> String {
if Int(value) > self.xVals.count - 1 {
return self.xVals[Int(value - 1)] as! String
}
else{
return self.xVals[Int(value)] as! String
}
}
//1.点击选中
func chartValueSelected(_ chartView: ChartViewBase, entry: ChartDataEntry, highlight: Highlight) {
ZHFLog(message: "点击选中")
}
//2.没有选中
func chartValueNothingSelected(_ chartView: ChartViewBase) {
ZHFLog(message: "没有选中")
}
//3.捏合放大或缩小
func chartScaled(_ chartView: ChartViewBase, scaleX: CGFloat, scaleY: CGFloat) {
ZHFLog(message: "捏合放大或缩小")
}
//4.拖拽图表
func chartTranslated(_ chartView: ChartViewBase, dX: CGFloat, dY: CGFloat) {
ZHFLog(message: "拖拽图表")
}
}
================================================
FILE: ChartsUnderstandAndUsage/ScatterChartVC.swift
================================================
//
// ScatterChartVC.swift
// ChartsUnderstandAndUsage
//
// Created by 张海峰 on 2018/9/17.
// Copyright © 2018年 张海峰. All rights reserved.
//
//Charts框架地址
//https://github.com/danielgindi/Charts.git
//该demo地址
//https://github.com/FighterLightning/ChartsUnderstandAndUsage.git
/*散点图*/
import UIKit
import Charts
class ScatterChartVC: BaseVC {
var scatterChartView: ScatterChartView = ScatterChartView()
override func viewDidLoad() {
super.viewDidLoad()
//1.添加散点图
addScatterChart()
//2. 基本样式
setScatterChartViewBaseStyle()
//3.添加(刷新数据)
updataData()
}
}
extension ScatterChartVC{
//添加散点图
func addScatterChart(){
scatterChartView.backgroundColor = ZHFColor.white
scatterChartView.frame.size = CGSize.init(width: ScreenWidth - 20, height: 300)
scatterChartView.center = self.view.center
scatterChartView.delegate = self
self.view.addSubview(scatterChartView)
//刷新按钮响应
refreshrBtn.addTarget(self, action: #selector(updataData), for: .touchUpInside)
}
func setScatterChartViewBaseStyle(){
//散点图描述
scatterChartView.chartDescription?.text = "散点图描述"
scatterChartView.chartDescription?.position = CGPoint.init(x: scatterChartView.frame.width - 30, y:scatterChartView.frame.height - 20)//位置(及在scatterChartView的中心点)
scatterChartView.chartDescription?.font = UIFont.systemFont(ofSize: 12)//大小
scatterChartView.chartDescription?.textColor = UIColor.red
//图例
let l = scatterChartView.legend
l.wordWrapEnabled = false //显示图例
l.horizontalAlignment = .left //居左
l.verticalAlignment = .bottom //放在底部
l.orientation = .horizontal //水平排布
l.drawInside = false // 图例在外
l.formSize = 10 //(图例大小)默认是8
l.form = Legend.Form.circle//图例头部样式
//矩形:.square(默认值) 圆形:.circle 横线:.line 无:.none 空:.empty(与 .none 一样都不显示头部,但不同的是 empty 头部仍然会占一个位置)
//Y轴右侧线
let rightAxis = scatterChartView.rightAxis
rightAxis.axisMinimum = 0
//Y轴左侧线
let leftAxis = scatterChartView.leftAxis
leftAxis.axisMinimum = 0
//X轴
let xAxis = scatterChartView.xAxis
xAxis.labelPosition = .bothSided //分布在两边外部
xAxis.axisMinimum = 0 //最小刻度值
xAxis.granularity = 1 //最小间隔
}
@objc func updataData(){
//第一组散点图的10条随机数据
let dataEntries1 = (0..<10).map { (i) -> ChartDataEntry in
let val = Double(arc4random_uniform(20) )
return ChartDataEntry(x: Double(i), y: val)
}
let chartDataSet1 = ScatterChartDataSet(values: dataEntries1, label: "图例1")
chartDataSet1.setScatterShape(.circle) //使用圆形散点(三角形:.triangle 十字:.cross 叉:.x 上箭头:.chevronUp 下箭头:.chevronDown)
chartDataSet1.setColor(.yellow)
chartDataSet1.scatterShapeSize = 10 //散点大小
chartDataSet1.scatterShapeHoleRadius = 2.5 //内点大小
chartDataSet1.scatterShapeHoleColor = .red //内点颜色
//第二组散点图的10条随机数据
let dataEntries2 = (0..<10).map { (i) -> ChartDataEntry in
let val = Double(arc4random_uniform(20) + 20)
return ChartDataEntry(x: Double(i), y: val)
}
let chartDataSet2 = ScatterChartDataSet(values: dataEntries2, label: "图例2")
chartDataSet2.setColor(.red)
chartDataSet2.scatterShapeSize = 10 //散点大小
chartDataSet2.scatterShapeHoleRadius = 2.5 //内点大小
chartDataSet2.scatterShapeHoleColor = .yellow //内点颜色
//第三组散点图的10条随机数据
let dataEntries3 = (0..<10).map { (i) -> ChartDataEntry in
let val = Double(arc4random_uniform(20) + 40)
return ChartDataEntry(x: Double(i), y: val)
}
let chartDataSet3 = ScatterChartDataSet(values: dataEntries3, label: "图例3")
chartDataSet3.setScatterShape(.x)//使用圆形散点(三角形:.triangle 十字:.cross 叉:.x 上箭头:.chevronUp 下箭头:.chevronDown)
chartDataSet3.setColor(.green)
//目前散点图包括2组数据
let chartData = ScatterChartData(dataSets: [chartDataSet1, chartDataSet2,chartDataSet3])
//设置散点图数据
scatterChartView.data = chartData
}
}
extension ScatterChartVC: ChartViewDelegate{
//1.点击选中
func chartValueSelected(_ chartView: ChartViewBase, entry: ChartDataEntry, highlight: Highlight) {
ZHFLog(message: "点击选中")
}
//2.没有选中
func chartValueNothingSelected(_ chartView: ChartViewBase) {
ZHFLog(message: "没有选中")
}
//3.捏合放大或缩小
func chartScaled(_ chartView: ChartViewBase, scaleX: CGFloat, scaleY: CGFloat) {
ZHFLog(message: "捏合放大或缩小")
}
//4.拖拽图表
func chartTranslated(_ chartView: ChartViewBase, dX: CGFloat, dY: CGFloat) {
ZHFLog(message: "拖拽图表")
}
}
================================================
FILE: ChartsUnderstandAndUsage/ViewController.swift
================================================
//
// ViewController.swift
// ChartsUnderstandAndUsage
//
// Created by 张海峰 on 2018/9/12.
// Copyright © 2018年 张海峰. All rights reserved.
//
//Charts框架地址
//https://github.com/danielgindi/Charts.git
//该demo地址
//https://github.com/FighterLightning/ChartsUnderstandAndUsage.git
import UIKit
//设备物理尺寸
let ScreenHeight = UIScreen.main.bounds.size.height
let ScreenWidth = UIScreen.main.bounds.size.width
private struct ItemMessage{
let title: String
let subtitle: String
let imageName: String
let `class` : AnyClass
}
class ViewController: UIViewController {
var tableView:UITableView!
private var ItemMessages =
[ItemMessage.init(title: "柱状图", subtitle: "Bar Chart(A simple demonstration of the bar chart.)", imageName: "barChartImage", class: BarChartVC.self),
ItemMessage.init(title: "柱状图(波浪图)", subtitle: "Bar Chart Wave(A simple demonstration of the bar chart.)", imageName: "barChartWaveImage", class: BarChartWaveVC.self),
ItemMessage.init(title: "饼状图", subtitle: "Pie Chart(A simple demonstration of the pie chart.)", imageName: "pieChartImage", class: PieChartVC.self),
ItemMessage.init(title: "饼状图(半圆形)", subtitle: "Half Pie Chart (A simple demonstration of the pie chart.)", imageName: "pieChartHalfImage", class: PieChartHalfVC.self),
ItemMessage.init(title: "饼状图(折线注释)", subtitle: "Polyline Pie Chart(A simple demonstration of the pie chart with polyline notes.)", imageName: "pieChartPolylineImage", class: PieChartPolylineVC.self),
ItemMessage.init(title: "雷达图", subtitle: "Radar Chart(Demonstrates the use of a spider-web like (net) chart.)", imageName: "radarChartImage", class: RadarChartVC.self),
ItemMessage.init(title: "折线图", subtitle: "Line Chart(A simple demonstration of the linechart.)", imageName: "lineChartImage", class: LineChartVC.self),
ItemMessage.init(title: "折线填充图", subtitle: "Line Filled Chart(This demonstrates how to fill an area between two LineDataSets.)", imageName: "lineFilledChartImage", class: LineFilledChartVC.self),
ItemMessage.init(title: "散点图", subtitle: "Scatter Chart(A simple demonstration of the scatter chart.)", imageName: "scatterChartImage", class: ScatterChartVC.self),
ItemMessage.init(title: "K 线图(烛形图)", subtitle: "CandleStick Chart(Demonstrates usage of the CandleStickChart.)", imageName: "candleStickChartImage", class: CandleStickChartVC.self),
ItemMessage.init(title: "气泡图", subtitle: "Bubble Chart(A simple demonstration of the bubble chart.)", imageName: "bubbleChartImage", class: BubbleChartVC.self),
ItemMessage.init(title: "组合图(混合图)", subtitle: "Combined Chart(Demonstrates how to create a combined chart (bar and line in this case).", imageName: "combinedChartImage", class: CombinedChartVC.self),
ItemMessage.init(title: "波浪图", subtitle: "Waveform Chart(根据一组Hz数据,只给最高点画波浪)", imageName: "waveformChartImage", class: WaveformChartVC.self),]
lazy var dataMarr:NSMutableArray = NSMutableArray()
override func viewDidLoad() {
super.viewDidLoad()
self.title = "Charts框架理解与使用"
self.addTableView()
}
func addTableView(){
tableView = UITableView.init(frame: CGRect.init(x: 0, y: 44, width: ScreenWidth, height: ScreenHeight - 44), style: .plain)
self.view.addSubview(tableView)
tableView.backgroundColor = ZHFColor.zhff9_backGroundColor
tableView.separatorColor = ZHFColor.zhf_strColor(hex: "cccccc")
tableView.separatorInset = UIEdgeInsets.init(top: 0, left: 25, bottom: 0, right: 0)
tableView.delegate = self
tableView.dataSource = self
}
}
extension ViewController :UITableViewDataSource,UITableViewDelegate
{
func numberOfSections(in tableView: UITableView) -> Int {
return 1
}
func tableView(_ tableView: UITableView, numberOfRowsInSection section: Int) -> Int {
return self.ItemMessages.count
}
func tableView(_ tableView: UITableView, cellForRowAt indexPath: IndexPath) -> UITableViewCell {
let itemMessage = self.ItemMessages[indexPath.row]
var cell = tableView.dequeueReusableCell(withIdentifier: "Cell")
if cell == nil {
cell = UITableViewCell(style:.subtitle, reuseIdentifier: "Cell")
}
cell?.textLabel?.text = itemMessage.title
cell?.textLabel?.textColor = ZHFColor.red
cell?.detailTextLabel?.text = itemMessage.subtitle
cell?.detailTextLabel?.textColor = ZHFColor.zhf66_contentTextColor
cell?.detailTextLabel?.numberOfLines = 0
cell?.imageView?.image = UIImage.init(named: itemMessage.imageName)
cell?.selectionStyle = .none
return cell!
}
func tableView(_ tableView: UITableView, didSelectRowAt indexPath: IndexPath) {
let itemMessage = self.ItemMessages[indexPath.row]
let vcClass = itemMessage.class as! UIViewController.Type
let vc = vcClass.init()
self.navigationController?.pushViewController(vc, animated: true)
tableView.deselectRow(at: indexPath, animated: true)
}
func tableView(_ tableView: UITableView, heightForRowAt indexPath: IndexPath) -> CGFloat {
return 150
}
}
================================================
FILE: ChartsUnderstandAndUsage/WaveformChartVC.swift
================================================
//
// WaveformChartVC.swift
// ChartsUnderstandAndUsage
//
// Created by 张海峰 on 2018/11/15.
// Copyright © 2018年 张海峰. All rights reserved.
////Charts框架地址
//https://github.com/danielgindi/Charts.git
//该demo地址
//https://github.com/FighterLightning/ChartsUnderstandAndUsage.git
/*波浪图*/
import UIKit
import Charts
class WaveformChartVC: BaseVC {
var lineChartView: LineChartView = LineChartView()
override func viewDidLoad() {
super.viewDidLoad()
//添加折线
addLineChart()
//设置基本样式
setLineChartViewBaseStyle()
setXAxisStyle()
setYAxisStyle()
//添加(刷新数据)
updataData()
}
//添加折线
func addLineChart(){
lineChartView.backgroundColor = ZHFColor.white
lineChartView.frame.size = CGSize.init(width: ScreenWidth - 20, height: 150)
lineChartView.center = self.view.center
lineChartView.delegate = self
self.view.addSubview(lineChartView)
//刷新按钮响应
refreshrBtn.addTarget(self, action: #selector(updataData), for: .touchUpInside)
}
//基本样式
func setLineChartViewBaseStyle(){
lineChartView.noDataText = "暂无数据" //如果没有数据会显示这个
lineChartView.drawGridBackgroundEnabled = true //绘制图形区域背景
lineChartView.gridBackgroundColor = ZHFColor.white //背景颜色
lineChartView.alpha = 0.5//背景透明度
//折线图描述文字和样式
lineChartView.chartDescription?.text = "波浪图描述"
lineChartView.legend.textColor = ZHFColor.purple //描述文字颜色
lineChartView.legend.formSize = 10 //(图例大小)默认是8
lineChartView.legend.form = Legend.Form.circle//图例头部样式
//矩形:.square(默认值) 圆形:.circle 横线:.line 无:.none 空:.empty(与 .none 一样都不显示头部,但不同的是 empty 头部仍然会占一个位置)
lineChartView.chartDescription?.position = CGPoint.init(x: lineChartView.frame.width - 30, y:lineChartView.frame.height - 20)//位置(及在lineChartView的中心点)
lineChartView.chartDescription?.font = UIFont.systemFont(ofSize: 12)//大小
lineChartView.chartDescription?.textColor = UIColor.red
//设置交互样式
lineChartView.scaleYEnabled = false //取消Y轴缩放
lineChartView.doubleTapToZoomEnabled = true //双击缩放
lineChartView.dragEnabled = true //启用拖动手势
lineChartView.dragDecelerationEnabled = true //拖拽后是否有惯性效果
lineChartView.dragDecelerationFrictionCoef = 0.9 //拖拽后惯性效果摩擦系数(0~1)越小惯性越不明显
//修改背景色和边框样式
lineChartView.drawBordersEnabled = true //绘制图形区域边框
lineChartView.borderColor = ZHFColor.red //边框为红色
lineChartView.borderLineWidth = 2 //边框线条大小为2
}
//设置x轴的样式属性
func setXAxisStyle(){
//轴线宽、颜色、刻度、间隔
lineChartView.xAxis.axisLineWidth = 2 //x轴宽度
lineChartView.xAxis.axisLineColor = .black //x轴颜色
lineChartView.xAxis.axisMinimum = -3 //最小刻度值
lineChartView.xAxis.axisMaximum = 15 //最大刻度值
lineChartView.xAxis.labelCount = 18//显示个数
lineChartView.xAxis.spaceMin = 1 //最小间隔
//文字属性
lineChartView.xAxis.labelPosition = .bottom //x轴上的数字显示在下方(默认显示在上方 .top .bottom .bothSided .topInside .bottomInside)
lineChartView.xAxis.labelTextColor = .red //刻度文字颜色
lineChartView.xAxis.labelFont = .systemFont(ofSize: 13) //刻度文字大小
}
//设置y轴的样式属性(分左、右侧)
func setYAxisStyle(){
//右侧(默认显示)
// lineChartView.rightAxis.drawLabelsEnabled = false //不绘制右侧Y轴文字
lineChartView.rightAxis.drawAxisLineEnabled = false //不显示右侧Y轴
lineChartView.rightAxis.enabled = false //禁用右侧的Y轴
//左侧
// lineChartView.leftAxis.inverted = true //刻度值反向排列(默认正向)
// lineChartView.leftAxis.labelPosition = .insideChart //文字显示在内侧
//0刻度线
lineChartView.leftAxis.axisMinimum = 0
lineChartView.leftAxis.axisMaximum = 8
lineChartView.leftAxis.granularity = 1 //最小间隔
}
@objc func updataData(){
let dic: [String: Any] = [
"5g" : [
"forty" : ["number" : [0,0,0,0,0,0, 0,0, 0, 0, 0,0],
"channelsetting" : [38, 46, 54, 62, 102, 110, 118,126, 134,142,151,159]],
"eighty" : ["number" : [5,5,0,0,0,1],
"channelsetting" : [42,58,106,122,138,155]],
"twenty" : ["number" : [0,0,0,0,0,0,0,0,0,0,0,0,0,0,0,0,0,0,0,0,0,0,0,0,0],
"channelsetting" : [36,40,44,48,52,56,60,64,100,104,108,112,116,120,124,128,32,136,140,144,149,153,157,161,165]]
],
"2.4g" : [
"twenty" : ["number" : [5,0,0,0,0,4,0,0,0,0,2,0,0],
"channelsetting" : [1,2,3,4,5,6,7,8,9,10,11,12,13]],
"forty" : ["number" : [5,0,0,0,0,2,0,0,0,0,0,0],
"channelsetting" : [2,3,4,5,6,7,8,9,10,11,12,13]],
]
]
let dic24:[String:Any] = dic["2.4g"] as! [String : Any]
let dic2420:[String:Any] = dic24["twenty"] as! [String : Any]
let dic2420X:[NSInteger] = dic2420["channelsetting"] as! [NSInteger]
let dic2420Y:[NSInteger] = dic2420["number"] as! [NSInteger]
let dic2440:[String:Any] = dic24["forty"] as! [String : Any]
let dic2440X:[NSInteger] = dic2440["channelsetting"] as! [NSInteger]
let dic2440Y:[NSInteger] = dic2440["number"] as! [NSInteger]
let chartData = LineChartData.init()
//2.4g 20Hz 的图
if dic2420Y.count > 0 {
add(xArr: dic2420X, yArr: dic2420Y, HzNumber: 24/5,chartData:chartData,fillColor: ZHFColor.zhf_strColor(hex: "000000"))
}
//2.4g 40Hz 的图
if dic2440Y.count > 0 {
add(xArr: dic2440X, yArr: dic2440Y, HzNumber: 40/5,chartData:chartData,fillColor: ZHFColor.zhf_color(withHex: 0xff0000))
}
}
/*
xArr: x轴数组
yArr: y轴数组
HzNumber: Hz/间隔代表值
chartData: 初始化的 chartData
fillColor: 填充色
*/
func add(xArr:[NSInteger],yArr:[NSInteger],HzNumber:Double,chartData:LineChartData,fillColor:UIColor){
var labelStr1:String = ""
var labelColor1: UIColor = ZHFColor.orange
var isHaveLabel:Bool = true
for i in 0 ..< xArr.count {
let x = xArr[i]
let y = yArr[i]
if y != 0{
if isHaveLabel == true{
labelStr1 = "波浪线"
labelColor1 = ZHFColor.orange
}
else{
labelStr1 = ""
labelColor1 = ZHFColor.clear
}
var dataEntries1 = [ChartDataEntry]()
let entry1 = ChartDataEntry.init(x: Double(x) - HzNumber, y: -Double(y) - 1)
let entry2 = ChartDataEntry.init(x: Double(x), y: Double(y))
let entry3 = ChartDataEntry.init(x: Double(x) + HzNumber, y: -Double(y) - 1)
dataEntries1.append(entry1)
dataEntries1.append(entry2)
dataEntries1.append(entry3)
let chartDataSet1 = LineChartDataSet(values: dataEntries1, label: labelStr1)
chartDataSet1.mode = .horizontalBezier //(.line、.cubicBezier、.horizontalBezier、.stepped)
chartDataSet1.setColor(labelColor1)
chartDataSet1.lineWidth = 0
chartDataSet1.drawCirclesEnabled = false //不绘制拐点
chartDataSet1.fillAlpha = 0.3
chartDataSet1.fillColor = fillColor
chartDataSet1.drawFilledEnabled = true //绘制上填充色
chartDataSet1.fillFormatter = DefaultFillFormatter { _,_ -> CGFloat in
return CGFloat(self.lineChartView.leftAxis.axisMinimum) //向下绘制填充区域
}
chartData.addDataSet(chartDataSet1)
isHaveLabel = false
}
}
lineChartView.data = chartData
}
}
extension WaveformChartVC: ChartViewDelegate{
//1.点击选中
func chartValueSelected(_ chartView: ChartViewBase, entry: ChartDataEntry, highlight: Highlight) {
ZHFLog(message: "点击选中")
}
//2.没有选中
func chartValueNothingSelected(_ chartView: ChartViewBase) {
ZHFLog(message: "没有选中")
}
//3.捏合放大或缩小
func chartScaled(_ chartView: ChartViewBase, scaleX: CGFloat, scaleY: CGFloat) {
ZHFLog(message: "捏合放大或缩小")
}
//4.拖拽图表
func chartTranslated(_ chartView: ChartViewBase, dX: CGFloat, dY: CGFloat) {
ZHFLog(message: "拖拽图表")
}
}
================================================
FILE: ChartsUnderstandAndUsage/ZHFColor.swift
================================================
//
// ZHFColor.swift
// AmazedBox
//
// Created by lantian on 2018/5/9.
// Copyright © 2018年 张海峰. All rights reserved.
//
//Charts框架地址
//https://github.com/danielgindi/Charts.git
//该demo地址
//https://github.com/FighterLightning/ChartsUnderstandAndUsage.git
import UIKit
class ZHFColor: UIColor {
/// 主题色(及选中颜色)
open class var zhf_selectColor: UIColor {
//橙色
get {
return self.zhf_color(withHex: 0xF98507)
}
}
/// 标题字体颜色
open class var zhf33_titleTextColor: UIColor {
get {
return self.zhf_color(withHex: 0x333333)
}
}
/// 内容字体颜色1
open class var zhf88_contentTextColor: UIColor {
get {
return self.zhf_color(withHex: 0x888888)
}
}
/// 内容字体颜色2
open class var zhf66_contentTextColor: UIColor {
get {
return self.zhf_color(withHex: 0x666666)
}
}
/// 背景色1
open class var zhfe8_backGroundColor: UIColor {
get {
return self.zhf_color(withHex: 0xe8e8e8)
}
}
/// 背景色2
open class var zhff9_backGroundColor: UIColor {
get {
return self.zhf_color(withHex: 0xf9f9f9)
}
}
/// 分割线的颜色1
open class var zhfcc_lineColor: UIColor {
get {
return self.zhf_color(withHex: 0xcccccc)
}
}
/// 分割线的颜色2
open class var zhf_lineColor: UIColor {
get {
return self.zhf_color(withHex: 0xebf0f5)
}
}
/// 随机的颜色
class func zhf_randomColor() -> UIColor {
let r = CGFloat(arc4random() % 256) / 255.0
let g = CGFloat(arc4random() % 256) / 255.0
let b = CGFloat(arc4random() % 256) / 255.0
return UIColor(red: r, green: g, blue: b, alpha: 1.0)
}
/// 十六进制颜色 0xFFFFFF (0x六位颜色)
class func zhf_color(withHex: UInt32) -> UIColor {
let r = ((CGFloat)((withHex & 0xFF0000) >> 16)) / 255.0
let g = ((CGFloat)((withHex & 0xFF00) >> 8)) / 255.0
let b = ((CGFloat)(withHex & 0xFF)) / 255.0
return UIColor(red: r, green: g, blue: b, alpha: 1.0)
}
/// 十六进制颜色(带透明度) 0xFFFFFF (0x六位颜色)
class func zhf_colorAlpha(withHex: UInt32,alpha: CGFloat) -> UIColor {
let r = ((CGFloat)((withHex & 0xFF0000) >> 16)) / 255.0
let g = ((CGFloat)((withHex & 0xFF00) >> 8)) / 255.0
let b = ((CGFloat)(withHex & 0xFF)) / 255.0
return UIColor(red: r, green: g, blue: b, alpha: alpha)
}
/// 0~255 颜色
/// red(0~255)
/// green(0~255)
/// blue(0~255)
class func zhf_color(withRed: UInt8, green: UInt8, blue: UInt8) -> UIColor {
let r = CGFloat(withRed) / 255.0
let g = CGFloat(green) / 255.0
let b = CGFloat(blue) / 255.0
return UIColor(red: r, green: g, blue: b, alpha: 1.0)
}
/// 字符串颜色 "六位颜色"
class func zhf_strColor(hex: String) -> UIColor {
let scanner = Scanner(string: hex)
scanner.scanLocation = 0
var rgbValue: UInt64 = 0
scanner.scanHexInt64(&rgbValue)
let r = ((CGFloat)((rgbValue & 0xFF0000) >> 16)) / 255.0
let g = ((CGFloat)((rgbValue & 0xFF00) >> 8)) / 255.0
let b = ((CGFloat)(rgbValue & 0xFF)) / 255.0
return UIColor(red: r, green: g, blue: b, alpha: 1.0)
}
}
================================================
FILE: ChartsUnderstandAndUsage.xcodeproj/project.pbxproj
================================================
// !$*UTF8*$!
{
archiveVersion = 1;
classes = {
};
objectVersion = 50;
objects = {
/* Begin PBXBuildFile section */
094F73FE91B1045A7744156A /* Pods_ChartsUnderstandAndUsage.framework in Frameworks */ = {isa = PBXBuildFile; fileRef = 2986C8E69D024580F6229424 /* Pods_ChartsUnderstandAndUsage.framework */; };
E330184E2151FE3200151C8B /* PieChartHalfVC.swift in Sources */ = {isa = PBXBuildFile; fileRef = E330184D2151FE3200151C8B /* PieChartHalfVC.swift */; };
E346EC75219EC6A200861746 /* WaveformChartVC.swift in Sources */ = {isa = PBXBuildFile; fileRef = E346EC74219EC6A200861746 /* WaveformChartVC.swift */; };
E35A39B8214F668F002B545A /* LineChartVC.swift in Sources */ = {isa = PBXBuildFile; fileRef = E35A39B7214F668F002B545A /* LineChartVC.swift */; };
E35A39BA214F66E9002B545A /* CombinedChartVC.swift in Sources */ = {isa = PBXBuildFile; fileRef = E35A39B9214F66E9002B545A /* CombinedChartVC.swift */; };
E35A39BC214F6711002B545A /* ScatterChartVC.swift in Sources */ = {isa = PBXBuildFile; fileRef = E35A39BB214F6711002B545A /* ScatterChartVC.swift */; };
E35A39BE214F6748002B545A /* BubbleChartVC.swift in Sources */ = {isa = PBXBuildFile; fileRef = E35A39BD214F6748002B545A /* BubbleChartVC.swift */; };
E35A39C0214F676B002B545A /* CandleStickChartVC.swift in Sources */ = {isa = PBXBuildFile; fileRef = E35A39BF214F676B002B545A /* CandleStickChartVC.swift */; };
E35A39C62150BDE0002B545A /* LineFilledChartVC.swift in Sources */ = {isa = PBXBuildFile; fileRef = E35A39C52150BDE0002B545A /* LineFilledChartVC.swift */; };
E3800A812178579E007C9744 /* BaseVC.swift in Sources */ = {isa = PBXBuildFile; fileRef = E3800A802178579E007C9744 /* BaseVC.swift */; };
E3800A8621785EDC007C9744 /* PieChartPolylineVC.swift in Sources */ = {isa = PBXBuildFile; fileRef = E3800A8521785EDC007C9744 /* PieChartPolylineVC.swift */; };
E3800A8A217867C9007C9744 /* BarChartWaveVC.swift in Sources */ = {isa = PBXBuildFile; fileRef = E3800A89217867C9007C9744 /* BarChartWaveVC.swift */; };
E38958422149054700B960CD /* AppDelegate.swift in Sources */ = {isa = PBXBuildFile; fileRef = E38958412149054700B960CD /* AppDelegate.swift */; };
E38958442149054700B960CD /* ViewController.swift in Sources */ = {isa = PBXBuildFile; fileRef = E38958432149054700B960CD /* ViewController.swift */; };
E38958472149054700B960CD /* Main.storyboard in Resources */ = {isa = PBXBuildFile; fileRef = E38958452149054700B960CD /* Main.storyboard */; };
E38958492149054800B960CD /* Assets.xcassets in Resources */ = {isa = PBXBuildFile; fileRef = E38958482149054800B960CD /* Assets.xcassets */; };
E389584C2149054800B960CD /* LaunchScreen.storyboard in Resources */ = {isa = PBXBuildFile; fileRef = E389584A2149054800B960CD /* LaunchScreen.storyboard */; };
E38958572149054800B960CD /* ChartsUnderstandAndUsageTests.swift in Sources */ = {isa = PBXBuildFile; fileRef = E38958562149054800B960CD /* ChartsUnderstandAndUsageTests.swift */; };
E38958622149054800B960CD /* ChartsUnderstandAndUsageUITests.swift in Sources */ = {isa = PBXBuildFile; fileRef = E38958612149054800B960CD /* ChartsUnderstandAndUsageUITests.swift */; };
E3895870214909D300B960CD /* ZHFColor.swift in Sources */ = {isa = PBXBuildFile; fileRef = E389586F214909D300B960CD /* ZHFColor.swift */; };
E3895872214910AC00B960CD /* BarChartVC.swift in Sources */ = {isa = PBXBuildFile; fileRef = E3895871214910AC00B960CD /* BarChartVC.swift */; };
E3895878214A521B00B960CD /* PieChartVC.swift in Sources */ = {isa = PBXBuildFile; fileRef = E3895877214A521B00B960CD /* PieChartVC.swift */; };
E389587A214A650A00B960CD /* RadarChartVC.swift in Sources */ = {isa = PBXBuildFile; fileRef = E3895879214A650A00B960CD /* RadarChartVC.swift */; };
E3C36A5F2150FF1B00439354 /* BalloonMarker.swift in Sources */ = {isa = PBXBuildFile; fileRef = E3C36A5E2150FF1B00439354 /* BalloonMarker.swift */; };
FA3EAA12283639D600964992 /* Charts.framework in Frameworks */ = {isa = PBXBuildFile; fileRef = FA3EAA11283639D600964992 /* Charts.framework */; };
FA3EAA1528363E5E00964992 /* Pods_ChartsUnderstandAndUsage.framework in Embed Frameworks */ = {isa = PBXBuildFile; fileRef = 2986C8E69D024580F6229424 /* Pods_ChartsUnderstandAndUsage.framework */; settings = {ATTRIBUTES = (CodeSignOnCopy, RemoveHeadersOnCopy, ); }; };
/* End PBXBuildFile section */
/* Begin PBXContainerItemProxy section */
E38958532149054800B960CD /* PBXContainerItemProxy */ = {
isa = PBXContainerItemProxy;
containerPortal = E38958362149054700B960CD /* Project object */;
proxyType = 1;
remoteGlobalIDString = E389583D2149054700B960CD;
remoteInfo = ChartsUnderstandAndUsage;
};
E389585E2149054800B960CD /* PBXContainerItemProxy */ = {
isa = PBXContainerItemProxy;
containerPortal = E38958362149054700B960CD /* Project object */;
proxyType = 1;
remoteGlobalIDString = E389583D2149054700B960CD;
remoteInfo = ChartsUnderstandAndUsage;
};
/* End PBXContainerItemProxy section */
/* Begin PBXCopyFilesBuildPhase section */
FA3EAA14283639D600964992 /* Embed Frameworks */ = {
isa = PBXCopyFilesBuildPhase;
buildActionMask = 2147483647;
dstPath = "";
dstSubfolderSpec = 10;
files = (
FA3EAA1528363E5E00964992 /* Pods_ChartsUnderstandAndUsage.framework in Embed Frameworks */,
);
name = "Embed Frameworks";
runOnlyForDeploymentPostprocessing = 0;
};
/* End PBXCopyFilesBuildPhase section */
/* Begin PBXFileReference section */
2986C8E69D024580F6229424 /* Pods_ChartsUnderstandAndUsage.framework */ = {isa = PBXFileReference; explicitFileType = wrapper.framework; includeInIndex = 0; path = Pods_ChartsUnderstandAndUsage.framework; sourceTree = BUILT_PRODUCTS_DIR; };
80808BA9743F4CF4082C5819 /* Pods-ChartsUnderstandAndUsage.release.xcconfig */ = {isa = PBXFileReference; includeInIndex = 1; lastKnownFileType = text.xcconfig; name = "Pods-ChartsUnderstandAndUsage.release.xcconfig"; path = "Pods/Target Support Files/Pods-ChartsUnderstandAndUsage/Pods-ChartsUnderstandAndUsage.release.xcconfig"; sourceTree = "<group>"; };
8A8BDE7C0508A2EFCEA84120 /* Pods-ChartsUnderstandAndUsage.debug.xcconfig */ = {isa = PBXFileReference; includeInIndex = 1; lastKnownFileType = text.xcconfig; name = "Pods-ChartsUnderstandAndUsage.debug.xcconfig"; path = "Pods/Target Support Files/Pods-ChartsUnderstandAndUsage/Pods-ChartsUnderstandAndUsage.debug.xcconfig"; sourceTree = "<group>"; };
E330184D2151FE3200151C8B /* PieChartHalfVC.swift */ = {isa = PBXFileReference; lastKnownFileType = sourcecode.swift; path = PieChartHalfVC.swift; sourceTree = "<group>"; };
E346EC74219EC6A200861746 /* WaveformChartVC.swift */ = {isa = PBXFileReference; fileEncoding = 4; lastKnownFileType = sourcecode.swift; path = WaveformChartVC.swift; sourceTree = "<group>"; };
E35A39B7214F668F002B545A /* LineChartVC.swift */ = {isa = PBXFileReference; lastKnownFileType = sourcecode.swift; path = LineChartVC.swift; sourceTree = "<group>"; };
E35A39B9214F66E9002B545A /* CombinedChartVC.swift */ = {isa = PBXFileReference; lastKnownFileType = sourcecode.swift; path = CombinedChartVC.swift; sourceTree = "<group>"; };
E35A39BB214F6711002B545A /* ScatterChartVC.swift */ = {isa = PBXFileReference; lastKnownFileType = sourcecode.swift; path = ScatterChartVC.swift; sourceTree = "<group>"; };
E35A39BD214F6748002B545A /* BubbleChartVC.swift */ = {isa = PBXFileReference; lastKnownFileType = sourcecode.swift; path = BubbleChartVC.swift; sourceTree = "<group>"; };
E35A39BF214F676B002B545A /* CandleStickChartVC.swift */ = {isa = PBXFileReference; lastKnownFileType = sourcecode.swift; path = CandleStickChartVC.swift; sourceTree = "<group>"; };
E35A39C52150BDE0002B545A /* LineFilledChartVC.swift */ = {isa = PBXFileReference; lastKnownFileType = sourcecode.swift; path = LineFilledChartVC.swift; sourceTree = "<group>"; };
E3800A802178579E007C9744 /* BaseVC.swift */ = {isa = PBXFileReference; lastKnownFileType = sourcecode.swift; path = BaseVC.swift; sourceTree = "<group>"; };
E3800A8521785EDC007C9744 /* PieChartPolylineVC.swift */ = {isa = PBXFileReference; lastKnownFileType = sourcecode.swift; path = PieChartPolylineVC.swift; sourceTree = "<group>"; };
E3800A89217867C9007C9744 /* BarChartWaveVC.swift */ = {isa = PBXFileReference; fileEncoding = 4; lastKnownFileType = sourcecode.swift; path = BarChartWaveVC.swift; sourceTree = "<group>"; };
E389583E2149054700B960CD /* ChartsUnderstandAndUsage.app */ = {isa = PBXFileReference; explicitFileType = wrapper.application; includeInIndex = 0; path = ChartsUnderstandAndUsage.app; sourceTree = BUILT_PRODUCTS_DIR; };
E38958412149054700B960CD /* AppDelegate.swift */ = {isa = PBXFileReference; lastKnownFileType = sourcecode.swift; path = AppDelegate.swift; sourceTree = "<group>"; };
E38958432149054700B960CD /* ViewController.swift */ = {isa = PBXFileReference; lastKnownFileType = sourcecode.swift; path = ViewController.swift; sourceTree = "<group>"; };
E38958462149054700B960CD /* Base */ = {isa = PBXFileReference; lastKnownFileType = file.storyboard; name = Base; path = Base.lproj/Main.storyboard; sourceTree = "<group>"; };
E38958482149054800B960CD /* Assets.xcassets */ = {isa = PBXFileReference; lastKnownFileType = folder.assetcatalog; path = Assets.xcassets; sourceTree = "<group>"; };
E389584B2149054800B960CD /* Base */ = {isa = PBXFileReference; lastKnownFileType = file.storyboard; name = Base; path = Base.lproj/LaunchScreen.storyboard; sourceTree = "<group>"; };
E389584D2149054800B960CD /* Info.plist */ = {isa = PBXFileReference; lastKnownFileType = text.plist.xml; path = Info.plist; sourceTree = "<group>"; };
E38958522149054800B960CD /* ChartsUnderstandAndUsageTests.xctest */ = {isa = PBXFileReference; explicitFileType = wrapper.cfbundle; includeInIndex = 0; path = ChartsUnderstandAndUsageTests.xctest; sourceTree = BUILT_PRODUCTS_DIR; };
E38958562149054800B960CD /* ChartsUnderstandAndUsageTests.swift */ = {isa = PBXFileReference; lastKnownFileType = sourcecode.swift; path = ChartsUnderstandAndUsageTests.swift; sourceTree = "<group>"; };
E38958582149054800B960CD /* Info.plist */ = {isa = PBXFileReference; lastKnownFileType = text.plist.xml; path = Info.plist; sourceTree = "<group>"; };
E389585D2149054800B960CD /* ChartsUnderstandAndUsageUITests.xctest */ = {isa = PBXFileReference; explicitFileType = wrapper.cfbundle; includeInIndex = 0; path = ChartsUnderstandAndUsageUITests.xctest; sourceTree = BUILT_PRODUCTS_DIR; };
E38958612149054800B960CD /* ChartsUnderstandAndUsageUITests.swift */ = {isa = PBXFileReference; lastKnownFileType = sourcecode.swift; path = ChartsUnderstandAndUsageUITests.swift; sourceTree = "<group>"; };
E38958632149054800B960CD /* Info.plist */ = {isa = PBXFileReference; lastKnownFileType = text.plist.xml; path = Info.plist; sourceTree = "<group>"; };
E389586F214909D300B960CD /* ZHFColor.swift */ = {isa = PBXFileReference; fileEncoding = 4; lastKnownFileType = sourcecode.swift; path = ZHFColor.swift; sourceTree = "<group>"; };
E3895871214910AC00B960CD /* BarChartVC.swift */ = {isa = PBXFileReference; lastKnownFileType = sourcecode.swift; path = BarChartVC.swift; sourceTree = "<group>"; };
E389587321491CFF00B960CD /* Charts.framework */ = {isa = PBXFileReference; explicitFileType = wrapper.framework; path = Charts.framework; sourceTree = BUILT_PRODUCTS_DIR; };
E3895877214A521B00B960CD /* PieChartVC.swift */ = {isa = PBXFileReference; lastKnownFileType = sourcecode.swift; path = PieChartVC.swift; sourceTree = "<group>"; };
E3895879214A650A00B960CD /* RadarChartVC.swift */ = {isa = PBXFileReference; lastKnownFileType = sourcecode.swift; path = RadarChartVC.swift; sourceTree = "<group>"; };
E3C36A5E2150FF1B00439354 /* BalloonMarker.swift */ = {isa = PBXFileReference; lastKnownFileType = sourcecode.swift; path = BalloonMarker.swift; sourceTree = "<group>"; };
FA3EAA0D283639BE00964992 /* Charts.framework */ = {isa = PBXFileReference; explicitFileType = wrapper.framework; path = Charts.framework; sourceTree = BUILT_PRODUCTS_DIR; };
FA3EAA11283639D600964992 /* Charts.framework */ = {isa = PBXFileReference; explicitFileType = wrapper.framework; path = Charts.framework; sourceTree = BUILT_PRODUCTS_DIR; };
/* End PBXFileReference section */
/* Begin PBXFrameworksBuildPhase section */
E389583B2149054700B960CD /* Frameworks */ = {
isa = PBXFrameworksBuildPhase;
buildActionMask = 2147483647;
files = (
094F73FE91B1045A7744156A /* Pods_ChartsUnderstandAndUsage.framework in Frameworks */,
FA3EAA12283639D600964992 /* Charts.framework in Frameworks */,
);
runOnlyForDeploymentPostprocessing = 0;
};
E389584F2149054800B960CD /* Frameworks */ = {
isa = PBXFrameworksBuildPhase;
buildActionMask = 2147483647;
files = (
);
runOnlyForDeploymentPostprocessing = 0;
};
E389585A2149054800B960CD /* Frameworks */ = {
isa = PBXFrameworksBuildPhase;
buildActionMask = 2147483647;
files = (
);
runOnlyForDeploymentPostprocessing = 0;
};
/* End PBXFrameworksBuildPhase section */
/* Begin PBXGroup section */
C5ADDC9AD4F5D81F60A4FA36 /* Frameworks */ = {
isa = PBXGroup;
children = (
FA3EAA11283639D600964992 /* Charts.framework */,
FA3EAA0D283639BE00964992 /* Charts.framework */,
E389587321491CFF00B960CD /* Charts.framework */,
2986C8E69D024580F6229424 /* Pods_ChartsUnderstandAndUsage.framework */,
);
name = Frameworks;
sourceTree = "<group>";
};
E38958352149054700B960CD = {
isa = PBXGroup;
children = (
E38958402149054700B960CD /* ChartsUnderstandAndUsage */,
E38958552149054800B960CD /* ChartsUnderstandAndUsageTests */,
E38958602149054800B960CD /* ChartsUnderstandAndUsageUITests */,
E389583F2149054700B960CD /* Products */,
E87F0A782314E4C08224B6F5 /* Pods */,
C5ADDC9AD4F5D81F60A4FA36 /* Frameworks */,
);
sourceTree = "<group>";
};
E389583F2149054700B960CD /* Products */ = {
isa = PBXGroup;
children = (
E389583E2149054700B960CD /* ChartsUnderstandAndUsage.app */,
E38958522149054800B960CD /* ChartsUnderstandAndUsageTests.xctest */,
E389585D2149054800B960CD /* ChartsUnderstandAndUsageUITests.xctest */,
);
name = Products;
sourceTree = "<group>";
};
E38958402149054700B960CD /* ChartsUnderstandAndUsage */ = {
isa = PBXGroup;
children = (
E389586F214909D300B960CD /* ZHFColor.swift */,
E3C36A5E2150FF1B00439354 /* BalloonMarker.swift */,
E38958412149054700B960CD /* AppDelegate.swift */,
E38958432149054700B960CD /* ViewController.swift */,
E3800A802178579E007C9744 /* BaseVC.swift */,
E3895871214910AC00B960CD /* BarChartVC.swift */,
E3800A89217867C9007C9744 /* BarChartWaveVC.swift */,
E3895877214A521B00B960CD /* PieChartVC.swift */,
E330184D2151FE3200151C8B /* PieChartHalfVC.swift */,
E3800A8521785EDC007C9744 /* PieChartPolylineVC.swift */,
E3895879214A650A00B960CD /* RadarChartVC.swift */,
E35A39B7214F668F002B545A /* LineChartVC.swift */,
E35A39C52150BDE0002B545A /* LineFilledChartVC.swift */,
E35A39B9214F66E9002B545A /* CombinedChartVC.swift */,
E35A39BB214F6711002B545A /* ScatterChartVC.swift */,
E35A39BF214F676B002B545A /* CandleStickChartVC.swift */,
E35A39BD214F6748002B545A /* BubbleChartVC.swift */,
E346EC74219EC6A200861746 /* WaveformChartVC.swift */,
E38958452149054700B960CD /* Main.storyboard */,
E38958482149054800B960CD /* Assets.xcassets */,
E389584A2149054800B960CD /* LaunchScreen.storyboard */,
E389584D2149054800B960CD /* Info.plist */,
);
path = ChartsUnderstandAndUsage;
sourceTree = "<group>";
};
E38958552149054800B960CD /* ChartsUnderstandAndUsageTests */ = {
isa = PBXGroup;
children = (
E38958562149054800B960CD /* ChartsUnderstandAndUsageTests.swift */,
E38958582149054800B960CD /* Info.plist */,
);
path = ChartsUnderstandAndUsageTests;
sourceTree = "<group>";
};
E38958602149054800B960CD /* ChartsUnderstandAndUsageUITests */ = {
isa = PBXGroup;
children = (
E38958612149054800B960CD /* ChartsUnderstandAndUsageUITests.swift */,
E38958632149054800B960CD /* Info.plist */,
);
path = ChartsUnderstandAndUsageUITests;
sourceTree = "<group>";
};
E87F0A782314E4C08224B6F5 /* Pods */ = {
isa = PBXGroup;
children = (
8A8BDE7C0508A2EFCEA84120 /* Pods-ChartsUnderstandAndUsage.debug.xcconfig */,
80808BA9743F4CF4082C5819 /* Pods-ChartsUnderstandAndUsage.release.xcconfig */,
);
name = Pods;
sourceTree = "<group>";
};
/* End PBXGroup section */
/* Begin PBXNativeTarget section */
E389583D2149054700B960CD /* ChartsUnderstandAndUsage */ = {
isa = PBXNativeTarget;
buildConfigurationList = E38958662149054800B960CD /* Build configuration list for PBXNativeTarget "ChartsUnderstandAndUsage" */;
buildPhases = (
379ADA5B89F08EA9DC8140D4 /* [CP] Check Pods Manifest.lock */,
E389583A2149054700B960CD /* Sources */,
E389583B2149054700B960CD /* Frameworks */,
E389583C2149054700B960CD /* Resources */,
1310E3972A00FA57A6DA7B17 /* [CP] Embed Pods Frameworks */,
FA3EAA14283639D600964992 /* Embed Frameworks */,
);
buildRules = (
);
dependencies = (
);
name = ChartsUnderstandAndUsage;
productName = ChartsUnderstandAndUsage;
productReference = E389583E2149054700B960CD /* ChartsUnderstandAndUsage.app */;
productType = "com.apple.product-type.application";
};
E38958512149054800B960CD /* ChartsUnderstandAndUsageTests */ = {
isa = PBXNativeTarget;
buildConfigurationList = E38958692149054800B960CD /* Build configuration list for PBXNativeTarget "ChartsUnderstandAndUsageTests" */;
buildPhases = (
E389584E2149054800B960CD /* Sources */,
E389584F2149054800B960CD /* Frameworks */,
E38958502149054800B960CD /* Resources */,
);
buildRules = (
);
dependencies = (
E38958542149054800B960CD /* PBXTargetDependency */,
);
name = ChartsUnderstandAndUsageTests;
productName = ChartsUnderstandAndUsageTests;
productReference = E38958522149054800B960CD /* ChartsUnderstandAndUsageTests.xctest */;
productType = "com.apple.product-type.bundle.unit-test";
};
E389585C2149054800B960CD /* ChartsUnderstandAndUsageUITests */ = {
isa = PBXNativeTarget;
buildConfigurationList = E389586C2149054800B960CD /* Build configuration list for PBXNativeTarget "ChartsUnderstandAndUsageUITests" */;
buildPhases = (
E38958592149054800B960CD /* Sources */,
E389585A2149054800B960CD /* Frameworks */,
E389585B2149054800B960CD /* Resources */,
);
buildRules = (
);
dependencies = (
E389585F2149054800B960CD /* PBXTargetDependency */,
);
name = ChartsUnderstandAndUsageUITests;
productName = ChartsUnderstandAndUsageUITests;
productReference = E389585D2149054800B960CD /* ChartsUnderstandAndUsageUITests.xctest */;
productType = "com.apple.product-type.bundle.ui-testing";
};
/* End PBXNativeTarget section */
/* Begin PBXProject section */
E38958362149054700B960CD /* Project object */ = {
isa = PBXProject;
attributes = {
LastSwiftUpdateCheck = 0940;
LastUpgradeCheck = 1320;
ORGANIZATIONNAME = "张海峰";
TargetAttributes = {
E389583D2149054700B960CD = {
CreatedOnToolsVersion = 9.4.1;
};
E38958512149054800B960CD = {
CreatedOnToolsVersion = 9.4.1;
TestTargetID = E389583D2149054700B960CD;
};
E389585C2149054800B960CD = {
CreatedOnToolsVersion = 9.4.1;
TestTargetID = E389583D2149054700B960CD;
};
};
};
buildConfigurationList = E38958392149054700B960CD /* Build configuration list for PBXProject "ChartsUnderstandAndUsage" */;
compatibilityVersion = "Xcode 9.3";
developmentRegion = en;
hasScannedForEncodings = 0;
knownRegions = (
en,
Base,
);
mainGroup = E38958352149054700B960CD;
productRefGroup = E389583F2149054700B960CD /* Products */;
projectDirPath = "";
projectRoot = "";
targets = (
E389583D2149054700B960CD /* ChartsUnderstandAndUsage */,
E38958512149054800B960CD /* ChartsUnderstandAndUsageTests */,
E389585C2149054800B960CD /* ChartsUnderstandAndUsageUITests */,
);
};
/* End PBXProject section */
/* Begin PBXResourcesBuildPhase section */
E389583C2149054700B960CD /* Resources */ = {
isa = PBXResourcesBuildPhase;
buildActionMask = 2147483647;
files = (
E389584C2149054800B960CD /* LaunchScreen.storyboard in Resources */,
E38958492149054800B960CD /* Assets.xcassets in Resources */,
E38958472149054700B960CD /* Main.storyboard in Resources */,
);
runOnlyForDeploymentPostprocessing = 0;
};
E38958502149054800B960CD /* Resources */ = {
isa = PBXResourcesBuildPhase;
buildActionMask = 2147483647;
files = (
);
runOnlyForDeploymentPostprocessing = 0;
};
E389585B2149054800B960CD /* Resources */ = {
isa = PBXResourcesBuildPhase;
buildActionMask = 2147483647;
files = (
);
runOnlyForDeploymentPostprocessing = 0;
};
/* End PBXResourcesBuildPhase section */
/* Begin PBXShellScriptBuildPhase section */
1310E3972A00FA57A6DA7B17 /* [CP] Embed Pods Frameworks */ = {
isa = PBXShellScriptBuildPhase;
buildActionMask = 2147483647;
files = (
);
inputFileListPaths = (
);
name = "[CP] Embed Pods Frameworks";
outputFileListPaths = (
);
runOnlyForDeploymentPostprocessing = 0;
shellPath = /bin/sh;
shellScript = "\"${PODS_ROOT}/Target Support Files/Pods-ChartsUnderstandAndUsage/Pods-ChartsUnderstandAndUsage-frameworks.sh\"\n";
showEnvVarsInLog = 0;
};
379ADA5B89F08EA9DC8140D4 /* [CP] Check Pods Manifest.lock */ = {
isa = PBXShellScriptBuildPhase;
buildActionMask = 2147483647;
files = (
);
inputPaths = (
"${PODS_PODFILE_DIR_PATH}/Podfile.lock",
"${PODS_ROOT}/Manifest.lock",
);
name = "[CP] Check Pods Manifest.lock";
outputPaths = (
"$(DERIVED_FILE_DIR)/Pods-ChartsUnderstandAndUsage-checkManifestLockResult.txt",
);
runOnlyForDeploymentPostprocessing = 0;
shellPath = /bin/sh;
shellScript = "diff \"${PODS_PODFILE_DIR_PATH}/Podfile.lock\" \"${PODS_ROOT}/Manifest.lock\" > /dev/null\nif [ $? != 0 ] ; then\n # print error to STDERR\n echo \"error: The sandbox is not in sync with the Podfile.lock. Run 'pod install' or update your CocoaPods installation.\" >&2\n exit 1\nfi\n# This output is used by Xcode 'outputs' to avoid re-running this script phase.\necho \"SUCCESS\" > \"${SCRIPT_OUTPUT_FILE_0}\"\n";
showEnvVarsInLog = 0;
};
/* End PBXShellScriptBuildPhase section */
/* Begin PBXSourcesBuildPhase section */
E389583A2149054700B960CD /* Sources */ = {
isa = PBXSourcesBuildPhase;
buildActionMask = 2147483647;
files = (
E389587A214A650A00B960CD /* RadarChartVC.swift in Sources */,
E35A39C62150BDE0002B545A /* LineFilledChartVC.swift in Sources */,
E3800A8A217867C9007C9744 /* BarChartWaveVC.swift in Sources */,
E35A39BC214F6711002B545A /* ScatterChartVC.swift in Sources */,
E35A39C0214F676B002B545A /* CandleStickChartVC.swift in Sources */,
E3800A812178579E007C9744 /* BaseVC.swift in Sources */,
E3C36A5F2150FF1B00439354 /* BalloonMarker.swift in Sources */,
E330184E2151FE3200151C8B /* PieChartHalfVC.swift in Sources */,
E346EC75219EC6A200861746 /* WaveformChartVC.swift in Sources */,
E35A39B8214F668F002B545A /* LineChartVC.swift in Sources */,
E3800A8621785EDC007C9744 /* PieChartPolylineVC.swift in Sources */,
E3895870214909D300B960CD /* ZHFColor.swift in Sources */,
E38958442149054700B960CD /* ViewController.swift in Sources */,
E35A39BA214F66E9002B545A /* CombinedChartVC.swift in Sources */,
E38958422149054700B960CD /* AppDelegate.swift in Sources */,
E35A39BE214F6748002B545A /* BubbleChartVC.swift in Sources */,
E3895878214A521B00B960CD /* PieChartVC.swift in Sources */,
E3895872214910AC00B960CD /* BarChartVC.swift in Sources */,
);
runOnlyForDeploymentPostprocessing = 0;
};
E389584E2149054800B960CD /* Sources */ = {
isa = PBXSourcesBuildPhase;
buildActionMask = 2147483647;
files = (
E38958572149054800B960CD /* ChartsUnderstandAndUsageTests.swift in Sources */,
);
runOnlyForDeploymentPostprocessing = 0;
};
E38958592149054800B960CD /* Sources */ = {
isa = PBXSourcesBuildPhase;
buildActionMask = 2147483647;
files = (
E38958622149054800B960CD /* ChartsUnderstandAndUsageUITests.swift in Sources */,
);
runOnlyForDeploymentPostprocessing = 0;
};
/* End PBXSourcesBuildPhase section */
/* Begin PBXTargetDependency section */
E38958542149054800B960CD /* PBXTargetDependency */ = {
isa = PBXTargetDependency;
target = E389583D2149054700B960CD /* ChartsUnderstandAndUsage */;
targetProxy = E38958532149054800B960CD /* PBXContainerItemProxy */;
};
E389585F2149054800B960CD /* PBXTargetDependency */ = {
isa = PBXTargetDependency;
target = E389583D2149054700B960CD /* ChartsUnderstandAndUsage */;
targetProxy = E389585E2149054800B960CD /* PBXContainerItemProxy */;
};
/* End PBXTargetDependency section */
/* Begin PBXVariantGroup section */
E38958452149054700B960CD /* Main.storyboard */ = {
isa = PBXVariantGroup;
children = (
E38958462149054700B960CD /* Base */,
);
name = Main.storyboard;
sourceTree = "<group>";
};
E389584A2149054800B960CD /* LaunchScreen.storyboard */ = {
isa = PBXVariantGroup;
children = (
E389584B2149054800B960CD /* Base */,
);
name = LaunchScreen.storyboard;
sourceTree = "<group>";
};
/* End PBXVariantGroup section */
/* Begin XCBuildConfiguration section */
E38958642149054800B960CD /* Debug */ = {
isa = XCBuildConfiguration;
buildSettings = {
ALWAYS_SEARCH_USER_PATHS = NO;
CLANG_ANALYZER_NONNULL = YES;
CLANG_ANALYZER_NUMBER_OBJECT_CONVERSION = YES_AGGRESSIVE;
CLANG_CXX_LANGUAGE_STANDARD = "gnu++14";
CLANG_CXX_LIBRARY = "libc++";
CLANG_ENABLE_MODULES = YES;
CLANG_ENABLE_OBJC_ARC = YES;
CLANG_ENABLE_OBJC_WEAK = YES;
CLANG_WARN_BLOCK_CAPTURE_AUTORELEASING = YES;
CLANG_WARN_BOOL_CONVERSION = YES;
CLANG_WARN_COMMA = YES;
CLANG_WARN_CONSTANT_CONVERSION = YES;
CLANG_WARN_DEPRECATED_OBJC_IMPLEMENTATIONS = YES;
CLANG_WARN_DIRECT_OBJC_ISA_USAGE = YES_ERROR;
CLANG_WARN_DOCUMENTATION_COMMENTS = YES;
CLANG_WARN_EMPTY_BODY = YES;
CLANG_WARN_ENUM_CONVERSION = YES;
CLANG_WARN_INFINITE_RECURSION = YES;
CLANG_WARN_INT_CONVERSION = YES;
CLANG_WARN_NON_LITERAL_NULL_CONVERSION = YES;
CLANG_WARN_OBJC_IMPLICIT_RETAIN_SELF = YES;
CLANG_WARN_OBJC_LITERAL_CONVERSION = YES;
CLANG_WARN_OBJC_ROOT_CLASS = YES_ERROR;
CLANG_WARN_QUOTED_INCLUDE_IN_FRAMEWORK_HEADER = YES;
CLANG_WARN_RANGE_LOOP_ANALYSIS = YES;
CLANG_WARN_STRICT_PROTOTYPES = YES;
CLANG_WARN_SUSPICIOUS_MOVE = YES;
CLANG_WARN_UNGUARDED_AVAILABILITY = YES_AGGRESSIVE;
CLANG_WARN_UNREACHABLE_CODE = YES;
CLANG_WARN__DUPLICATE_METHOD_MATCH = YES;
CODE_SIGN_IDENTITY = "iPhone Developer";
COPY_PHASE_STRIP = NO;
DEBUG_INFORMATION_FORMAT = dwarf;
ENABLE_STRICT_OBJC_MSGSEND = YES;
ENABLE_TESTABILITY = YES;
GCC_C_LANGUAGE_STANDARD = gnu11;
GCC_DYNAMIC_NO_PIC = NO;
GCC_NO_COMMON_BLOCKS = YES;
GCC_OPTIMIZATION_LEVEL = 0;
GCC_PREPROCESSOR_DEFINITIONS = (
"DEBUG=1",
"$(inherited)",
);
GCC_WARN_64_TO_32_BIT_CONVERSION = YES;
GCC_WARN_ABOUT_RETURN_TYPE = YES_ERROR;
GCC_WARN_UNDECLARED_SELECTOR = YES;
GCC_WARN_UNINITIALIZED_AUTOS = YES_AGGRESSIVE;
GCC_WARN_UNUSED_FUNCTION = YES;
GCC_WARN_UNUSED_VARIABLE = YES;
IPHONEOS_DEPLOYMENT_TARGET = 10.0;
MTL_ENABLE_DEBUG_INFO = YES;
ONLY_ACTIVE_ARCH = YES;
SDKROOT = iphoneos;
SWIFT_ACTIVE_COMPILATION_CONDITIONS = DEBUG;
SWIFT_OPTIMIZATION_LEVEL = "-Onone";
};
name = Debug;
};
E38958652149054800B960CD /* Release */ = {
isa = XCBuildConfiguration;
buildSettings = {
ALWAYS_SEARCH_USER_PATHS = NO;
CLANG_ANALYZER_NONNULL = YES;
CLANG_ANALYZER_NUMBER_OBJECT_CONVERSION = YES_AGGRESSIVE;
CLANG_CXX_LANGUAGE_STANDARD = "gnu++14";
CLANG_CXX_LIBRARY = "libc++";
CLANG_ENABLE_MODULES = YES;
CLANG_ENABLE_OBJC_ARC = YES;
CLANG_ENABLE_OBJC_WEAK = YES;
CLANG_WARN_BLOCK_CAPTURE_AUTORELEASING = YES;
CLANG_WARN_BOOL_CONVERSION = YES;
CLANG_WARN_COMMA = YES;
CLANG_WARN_CONSTANT_CONVERSION = YES;
CLANG_WARN_DEPRECATED_OBJC_IMPLEMENTATIONS = YES;
CLANG_WARN_DIRECT_OBJC_ISA_USAGE = YES_ERROR;
CLANG_WARN_DOCUMENTATION_COMMENTS = YES;
CLANG_WARN_EMPTY_BODY = YES;
CLANG_WARN_ENUM_CONVERSION = YES;
CLANG_WARN_INFINITE_RECURSION = YES;
CLANG_WARN_INT_CONVERSION = YES;
CLANG_WARN_NON_LITERAL_NULL_CONVERSION = YES;
CLANG_WARN_OBJC_IMPLICIT_RETAIN_SELF = YES;
CLANG_WARN_OBJC_LITERAL_CONVERSION = YES;
CLANG_WARN_OBJC_ROOT_CLASS = YES_ERROR;
CLANG_WARN_QUOTED_INCLUDE_IN_FRAMEWORK_HEADER = YES;
CLANG_WARN_RANGE_LOOP_ANALYSIS = YES;
CLANG_WARN_STRICT_PROTOTYPES = YES;
CLANG_WARN_SUSPICIOUS_MOVE = YES;
CLANG_WARN_UNGUARDED_AVAILABILITY = YES_AGGRESSIVE;
CLANG_WARN_UNREACHABLE_CODE = YES;
CLANG_WARN__DUPLICATE_METHOD_MATCH = YES;
CODE_SIGN_IDENTITY = "iPhone Developer";
COPY_PHASE_STRIP = NO;
DEBUG_INFORMATION_FORMAT = "dwarf-with-dsym";
ENABLE_NS_ASSERTIONS = NO;
ENABLE_STRICT_OBJC_MSGSEND = YES;
GCC_C_LANGUAGE_STANDARD = gnu11;
GCC_NO_COMMON_BLOCKS = YES;
GCC_WARN_64_TO_32_BIT_CONVERSION = YES;
GCC_WARN_ABOUT_RETURN_TYPE = YES_ERROR;
GCC_WARN_UNDECLARED_SELECTOR = YES;
GCC_WARN_UNINITIALIZED_AUTOS = YES_AGGRESSIVE;
GCC_WARN_UNUSED_FUNCTION = YES;
GCC_WARN_UNUSED_VARIABLE = YES;
IPHONEOS_DEPLOYMENT_TARGET = 10.0;
MTL_ENABLE_DEBUG_INFO = NO;
SDKROOT = iphoneos;
SWIFT_COMPILATION_MODE = wholemodule;
SWIFT_OPTIMIZATION_LEVEL = "-O";
VALIDATE_PRODUCT = YES;
};
name = Release;
};
E38958672149054800B960CD /* Debug */ = {
isa = XCBuildConfiguration;
baseConfigurationReference = 8A8BDE7C0508A2EFCEA84120 /* Pods-ChartsUnderstandAndUsage.debug.xcconfig */;
buildSettings = {
ASSETCATALOG_COMPILER_APPICON_NAME = AppIcon;
CODE_SIGN_STYLE = Automatic;
DEVELOPMENT_TEAM = 8CB6874GM5;
INFOPLIST_FILE = ChartsUnderstandAndUsage/Info.plist;
IPHONEOS_DEPLOYMENT_TARGET = 10.0;
LD_RUNPATH_SEARCH_PATHS = (
"$(inherited)",
"@executable_path/Frameworks",
);
PRODUCT_BUNDLE_IDENTIFIER = ChartsUnderstandAndUsage.app;
PRODUCT_NAME = "$(TARGET_NAME)";
SWIFT_VERSION = 5.0;
TARGETED_DEVICE_FAMILY = "1,2";
};
name = Debug;
};
E38958682149054800B960CD /* Release */ = {
isa = XCBuildConfiguration;
baseConfigurationReference = 80808BA9743F4CF4082C5819 /* Pods-ChartsUnderstandAndUsage.release.xcconfig */;
buildSettings = {
ASSETCATALOG_COMPILER_APPICON_NAME = AppIcon;
CODE_SIGN_STYLE = Automatic;
DEVELOPMENT_TEAM = 8CB6874GM5;
INFOPLIST_FILE = ChartsUnderstandAndUsage/Info.plist;
IPHONEOS_DEPLOYMENT_TARGET = 10.0;
LD_RUNPATH_SEARCH_PATHS = (
"$(inherited)",
"@executable_path/Frameworks",
);
PRODUCT_BUNDLE_IDENTIFIER = ChartsUnderstandAndUsage.app;
PRODUCT_NAME = "$(TARGET_NAME)";
SWIFT_VERSION = 5.0;
TARGETED_DEVICE_FAMILY = "1,2";
};
name = Release;
};
E389586A2149054800B960CD /* Debug */ = {
isa = XCBuildConfiguration;
buildSettings = {
ALWAYS_EMBED_SWIFT_STANDARD_LIBRARIES = YES;
BUNDLE_LOADER = "$(TEST_HOST)";
CODE_SIGN_STYLE = Automatic;
DEVELOPMENT_TEAM = KF97C6R67W;
INFOPLIST_FILE = ChartsUnderstandAndUsageTests/Info.plist;
LD_RUNPATH_SEARCH_PATHS = (
"$(inherited)",
"@executable_path/Frameworks",
"@loader_path/Frameworks",
);
PRODUCT_BUNDLE_IDENTIFIER = ChartsUnderstandAndUsage.app;
PRODUCT_NAME = "$(TARGET_NAME)";
SWIFT_VERSION = 5.0;
TARGETED_DEVICE_FAMILY = "1,2";
TEST_HOST = "$(BUILT_PRODUCTS_DIR)/ChartsUnderstandAndUsage.app/ChartsUnderstandAndUsage";
};
name = Debug;
};
E389586B2149054800B960CD /* Release */ = {
isa = XCBuildConfiguration;
buildSettings = {
ALWAYS_EMBED_SWIFT_STANDARD_LIBRARIES = YES;
BUNDLE_LOADER = "$(TEST_HOST)";
CODE_SIGN_STYLE = Automatic;
DEVELOPMENT_TEAM = KF97C6R67W;
INFOPLIST_FILE = ChartsUnderstandAndUsageTests/Info.plist;
LD_RUNPATH_SEARCH_PATHS = (
"$(inherited)",
"@executable_path/Frameworks",
"@loader_path/Frameworks",
);
PRODUCT_BUNDLE_IDENTIFIER = ChartsUnderstandAndUsage.app;
PRODUCT_NAME = "$(TARGET_NAME)";
SWIFT_VERSION = 5.0;
TARGETED_DEVICE_FAMILY = "1,2";
TEST_HOST = "$(BUILT_PRODUCTS_DIR)/ChartsUnderstandAndUsage.app/ChartsUnderstandAndUsage";
};
name = Release;
};
E389586D2149054800B960CD /* Debug */ = {
isa = XCBuildConfiguration;
buildSettings = {
ALWAYS_EMBED_SWIFT_STANDARD_LIBRARIES = YES;
CODE_SIGN_STYLE = Automatic;
DEVELOPMENT_TEAM = KF97C6R67W;
INFOPLIST_FILE = ChartsUnderstandAndUsageUITests/Info.plist;
LD_RUNPATH_SEARCH_PATHS = (
"$(inherited)",
"@executable_path/Frameworks",
"@loader_path/Frameworks",
);
PRODUCT_BUNDLE_IDENTIFIER = ChartsUnderstandAndUsage.app;
PRODUCT_NAME = "$(TARGET_NAME)";
SWIFT_VERSION = 5.0;
TARGETED_DEVICE_FAMILY = "1,2";
TEST_TARGET_NAME = ChartsUnderstandAndUsage;
};
name = Debug;
};
E389586E2149054800B960CD /* Release */ = {
isa = XCBuildConfiguration;
buildSettings = {
ALWAYS_EMBED_SWIFT_STANDARD_LIBRARIES = YES;
CODE_SIGN_STYLE = Automatic;
DEVELOPMENT_TEAM = KF97C6R67W;
INFOPLIST_FILE = ChartsUnderstandAndUsageUITests/Info.plist;
LD_RUNPATH_SEARCH_PATHS = (
"$(inherited)",
"@executable_path/Frameworks",
"@loader_path/Frameworks",
);
PRODUCT_BUNDLE_IDENTIFIER = ChartsUnderstandAndUsage.app;
PRODUCT_NAME = "$(TARGET_NAME)";
SWIFT_VERSION = 5.0;
TARGETED_DEVICE_FAMILY = "1,2";
TEST_TARGET_NAME = ChartsUnderstandAndUsage;
};
name = Release;
};
/* End XCBuildConfiguration section */
/* Begin XCConfigurationList section */
E38958392149054700B960CD /* Build configuration list for PBXProject "ChartsUnderstandAndUsage" */ = {
isa = XCConfigurationList;
buildConfigurations = (
E38958642149054800B960CD /* Debug */,
E38958652149054800B960CD /* Release */,
);
defaultConfigurationIsVisible = 0;
defaultConfigurationName = Release;
};
E38958662149054800B960CD /* Build configuration list for PBXNativeTarget "ChartsUnderstandAndUsage" */ = {
isa = XCConfigurationList;
buildConfigurations = (
E38958672149054800B960CD /* Debug */,
E38958682149054800B960CD /* Release */,
);
defaultConfigurationIsVisible = 0;
defaultConfigurationName = Release;
};
E38958692149054800B960CD /* Build configuration list for PBXNativeTarget "ChartsUnderstandAndUsageTests" */ = {
isa = XCConfigurationList;
buildConfigurations = (
E389586A2149054800B960CD /* Debug */,
E389586B2149054800B960CD /* Release */,
);
defaultConfigurationIsVisible = 0;
defaultConfigurationName = Release;
};
E389586C2149054800B960CD /* Build configuration list for PBXNativeTarget "ChartsUnderstandAndUsageUITests" */ = {
isa = XCConfigurationList;
buildConfigurations = (
E389586D2149054800B960CD /* Debug */,
E389586E2149054800B960CD /* Release */,
);
defaultConfigurationIsVisible = 0;
defaultConfigurationName = Release;
};
/* End XCConfigurationList section */
};
rootObject = E38958362149054700B960CD /* Project object */;
}
================================================
FILE: ChartsUnderstandAndUsage.xcodeproj/project.xcworkspace/contents.xcworkspacedata
================================================
<?xml version="1.0" encoding="UTF-8"?>
<Workspace
version = "1.0">
<FileRef
location = "self:ChartsUnderstandAndUsage.xcodeproj">
</FileRef>
</Workspace>
================================================
FILE: ChartsUnderstandAndUsage.xcodeproj/project.xcworkspace/xcshareddata/IDEWorkspaceChecks.plist
================================================
<?xml version="1.0" encoding="UTF-8"?>
<!DOCTYPE plist PUBLIC "-//Apple//DTD PLIST 1.0//EN" "http://www.apple.com/DTDs/PropertyList-1.0.dtd">
<plist version="1.0">
<dict>
<key>IDEDidComputeMac32BitWarning</key>
<true/>
</dict>
</plist>
================================================
FILE: ChartsUnderstandAndUsage.xcodeproj/xcuserdata/macbook.xcuserdatad/xcschemes/xcschememanagement.plist
================================================
<?xml version="1.0" encoding="UTF-8"?>
<!DOCTYPE plist PUBLIC "-//Apple//DTD PLIST 1.0//EN" "http://www.apple.com/DTDs/PropertyList-1.0.dtd">
<plist version="1.0">
<dict>
<key>SchemeUserState</key>
<dict>
<key>ChartsUnderstandAndUsage.xcscheme_^#shared#^_</key>
<dict>
<key>orderHint</key>
<integer>2</integer>
</dict>
</dict>
</dict>
</plist>
================================================
FILE: ChartsUnderstandAndUsage.xcodeproj/xcuserdata/zhanghaifeng.xcuserdatad/xcschemes/xcschememanagement.plist
================================================
<?xml version="1.0" encoding="UTF-8"?>
<!DOCTYPE plist PUBLIC "-//Apple//DTD PLIST 1.0//EN" "http://www.apple.com/DTDs/PropertyList-1.0.dtd">
<plist version="1.0">
<dict>
<key>SchemeUserState</key>
<dict>
<key>ChartsUnderstandAndUsage.xcscheme</key>
<dict>
<key>orderHint</key>
<integer>2</integer>
</dict>
<key>ChartsUnderstandAndUsage.xcscheme_^#shared#^_</key>
<dict>
<key>orderHint</key>
<integer>2</integer>
</dict>
</dict>
</dict>
</plist>
================================================
FILE: ChartsUnderstandAndUsage.xcworkspace/contents.xcworkspacedata
================================================
<?xml version="1.0" encoding="UTF-8"?>
<Workspace
version = "1.0">
<FileRef
location = "group:ChartsUnderstandAndUsage.xcodeproj">
</FileRef>
<FileRef
location = "group:Pods/Pods.xcodeproj">
</FileRef>
</Workspace>
================================================
FILE: ChartsUnderstandAndUsage.xcworkspace/xcshareddata/IDEWorkspaceChecks.plist
================================================
<?xml version="1.0" encoding="UTF-8"?>
<!DOCTYPE plist PUBLIC "-//Apple//DTD PLIST 1.0//EN" "http://www.apple.com/DTDs/PropertyList-1.0.dtd">
<plist version="1.0">
<dict>
<key>IDEDidComputeMac32BitWarning</key>
<true/>
</dict>
</plist>
================================================
FILE: ChartsUnderstandAndUsage.xcworkspace/xcuserdata/zhanghaifeng.xcuserdatad/xcdebugger/Breakpoints_v2.xcbkptlist
================================================
<?xml version="1.0" encoding="UTF-8"?>
<Bucket
type = "0"
version = "2.0">
<Breakpoints>
<BreakpointProxy
BreakpointExtensionID = "Xcode.Breakpoint.ExceptionBreakpoint">
<BreakpointContent
shouldBeEnabled = "Yes"
ignoreCount = "0"
continueAfterRunningActions = "No"
scope = "0"
stopOnStyle = "0">
</BreakpointContent>
</BreakpointProxy>
</Breakpoints>
</Bucket>
================================================
FILE: ChartsUnderstandAndUsageTests/ChartsUnderstandAndUsageTests.swift
================================================
//
// ChartsUnderstandAndUsageTests.swift
// ChartsUnderstandAndUsageTests
//
// Created by 张海峰 on 2018/9/12.
// Copyright © 2018年 张海峰. All rights reserved.
//
import XCTest
@testable import ChartsUnderstandAndUsage
class ChartsUnderstandAndUsageTests: XCTestCase {
override func setUp() {
super.setUp()
// Put setup code here. This method is called before the invocation of each test method in the class.
}
override func tearDown() {
// Put teardown code here. This method is called after the invocation of each test method in the class.
super.tearDown()
}
func testExample() {
// This is an example of a functional test case.
// Use XCTAssert and related functions to verify your tests produce the correct results.
}
func testPerformanceExample() {
// This is an example of a performance test case.
self.measure {
// Put the code you want to measure the time of here.
}
}
}
================================================
FILE: ChartsUnderstandAndUsageTests/Info.plist
================================================
<?xml version="1.0" encoding="UTF-8"?>
<!DOCTYPE plist PUBLIC "-//Apple//DTD PLIST 1.0//EN" "http://www.apple.com/DTDs/PropertyList-1.0.dtd">
<plist version="1.0">
<dict>
<key>CFBundleDevelopmentRegion</key>
<string>$(DEVELOPMENT_LANGUAGE)</string>
<key>CFBundleExecutable</key>
<string>$(EXECUTABLE_NAME)</string>
<key>CFBundleIdentifier</key>
<string>$(PRODUCT_BUNDLE_IDENTIFIER)</string>
<key>CFBundleInfoDictionaryVersion</key>
<string>6.0</string>
<key>CFBundleName</key>
<string>$(PRODUCT_NAME)</string>
<key>CFBundlePackageType</key>
<string>BNDL</string>
<key>CFBundleShortVersionString</key>
<string>1.0</string>
<key>CFBundleVersion</key>
<string>1</string>
</dict>
</plist>
================================================
FILE: ChartsUnderstandAndUsageUITests/ChartsUnderstandAndUsageUITests.swift
================================================
//
// ChartsUnderstandAndUsageUITests.swift
// ChartsUnderstandAndUsageUITests
//
// Created by 张海峰 on 2018/9/12.
// Copyright © 2018年 张海峰. All rights reserved.
//
import XCTest
class ChartsUnderstandAndUsageUITests: XCTestCase {
override func setUp() {
super.setUp()
// Put setup code here. This method is called before the invocation of each test method in the class.
// In UI tests it is usually best to stop immediately when a failure occurs.
continueAfterFailure = false
// UI tests must launch the application that they test. Doing this in setup will make sure it happens for each test method.
XCUIApplication().launch()
// In UI tests it’s important to set the initial state - such as interface orientation - required for your tests before they run. The setUp method is a good place to do this.
}
override func tearDown() {
// Put teardown code here. This method is called after the invocation of each test method in the class.
super.tearDown()
}
func testExample() {
// Use recording to get started writing UI tests.
// Use XCTAssert and related functions to verify your tests produce the correct results.
}
}
================================================
FILE: ChartsUnderstandAndUsageUITests/Info.plist
================================================
<?xml version="1.0" encoding="UTF-8"?>
<!DOCTYPE plist PUBLIC "-//Apple//DTD PLIST 1.0//EN" "http://www.apple.com/DTDs/PropertyList-1.0.dtd">
<plist version="1.0">
<dict>
<key>CFBundleDevelopmentRegion</key>
<string>$(DEVELOPMENT_LANGUAGE)</string>
<key>CFBundleExecutable</key>
<string>$(EXECUTABLE_NAME)</string>
<key>CFBundleIdentifier</key>
<string>$(PRODUCT_BUNDLE_IDENTIFIER)</string>
<key>CFBundleInfoDictionaryVersion</key>
<string>6.0</string>
<key>CFBundleName</key>
<string>$(PRODUCT_NAME)</string>
<key>CFBundlePackageType</key>
<string>BNDL</string>
<key>CFBundleShortVersionString</key>
<string>1.0</string>
<key>CFBundleVersion</key>
<string>1</string>
</dict>
</plist>
================================================
FILE: Podfile
================================================
#Uncomment the to define a global platform for your project
platform :ios, '9.0'
target 'ChartsUnderstandAndUsage' do
# Comment the next line if you're not using Swift and don't want to use dynamic frameworks
use_frameworks!
pod 'Charts'
end
================================================
FILE: Pods/Charts/LICENSE
================================================
Apache License
Version 2.0, January 2004
http://www.apache.org/licenses/
TERMS AND CONDITIONS FOR USE, REPRODUCTION, AND DISTRIBUTION
1. Definitions.
"License" shall mean the terms and conditions for use, reproduction,
and distribution as defined by Sections 1 through 9 of this document.
"Licensor" shall mean the copyright owner or entity authorized by
the copyright owner that is granting the License.
"Legal Entity" shall mean the union of the acting entity and all
other entities that control, are controlled by, or are under common
control with that entity. For the purposes of this definition,
"control" means (i) the power, direct or indirect, to cause the
direction or management of such entity, whether by contract or
otherwise, or (ii) ownership of fifty percent (50%) or more of the
outstanding shares, or (iii) beneficial ownership of such entity.
"You" (or "Your") shall mean an individual or Legal Entity
exercising permissions granted by this License.
"Source" form shall mean the preferred form for making modifications,
including but not limited to software source code, documentation
source, and configuration files.
"Object" form shall mean any form resulting from mechanical
transformation or translation of a Source form, including but
not limited to compiled object code, generated documentation,
and conversions to other media types.
"Work" shall mean the work of authorship, whether in Source or
Object form, made available under the License, as indicated by a
copyright notice that is included in or attached to the work
(an example is provided in the Appendix below).
"Derivative Works" shall mean any work, whether in Source or Object
form, that is based on (or derived from) the Work and for which the
editorial revisions, annotations, elaborations, or other modifications
represent, as a whole, an original work of authorship. For the purposes
of this License, Derivative Works shall not include works that remain
separable from, or merely link (or bind by name) to the interfaces of,
the Work and Derivative Works thereof.
"Contribution" shall mean any work of authorship, including
the original version of the Work and any modifications or additions
to that Work or Derivative Works thereof, that is intentionally
submitted to Licensor for inclusion in the Work by the copyright owner
or by an individual or Legal Entity authorized to submit on behalf of
the copyright owner. For the purposes of this definition, "submitted"
means any form of electronic, verbal, or written communication sent
to the Licensor or its representatives, including but not limited to
communication on electronic mailing lists, source code control systems,
and issue tracking systems that are managed by, or on behalf of, the
Licensor for the purpose of discussing and improving the Work, but
excluding communication that is conspicuously marked or otherwise
designated in writing by the copyright owner as "Not a Contribution."
"Contributor" shall mean Licensor and any individual or Legal Entity
on behalf of whom a Contribution has been received by Licensor and
subsequently incorporated within the Work.
2. Grant of Copyright License. Subject to the terms and conditions of
this License, each Contributor hereby grants to You a perpetual,
worldwide, non-exclusive, no-charge, royalty-free, irrevocable
copyright license to reproduce, prepare Derivative Works of,
publicly display, publicly perform, sublicense, and distribute the
Work and such Derivative Works in Source or Object form.
3. Grant of Patent License. Subject to the terms and conditions of
this License, each Contributor hereby grants to You a perpetual,
worldwide, non-exclusive, no-charge, royalty-free, irrevocable
(except as stated in this section) patent license to make, have made,
use, offer to sell, sell, import, and otherwise transfer the Work,
where such license applies only to those patent claims licensable
by such Contributor that are necessarily infringed by their
Contribution(s) alone or by combination of their Contribution(s)
with the Work to which such Contribution(s) was submitted. If You
institute patent litigation against any entity (including a
cross-claim or counterclaim in a lawsuit) alleging that the Work
or a Contribution incorporated within the Work constitutes direct
or contributory patent infringement, then any patent licenses
granted to You under this License for that Work shall terminate
as of the date such litigation is filed.
4. Redistribution. You may reproduce and distribute copies of the
Work or Derivative Works thereof in any medium, with or without
modifications, and in Source or Object form, provided that You
meet the following conditions:
(a) You must give any other recipients of the Work or
Derivative Works a copy of this License; and
(b) You must cause any modified files to carry prominent notices
stating that You changed the files; and
(c) You must retain, in the Source form of any Derivative Works
that You distribute, all copyright, patent, trademark, and
attribution notices from the Source form of the Work,
excluding those notices that do not pertain to any part of
the Derivative Works; and
(d) If the Work includes a "NOTICE" text file as part of its
distribution, then any Derivative Works that You distribute must
include a readable copy of the attribution notices contained
within such NOTICE file, excluding those notices that do not
pertain to any part of the Derivative Works, in at least one
of the following places: within a NOTICE text file distributed
as part of the Derivative Works; within the Source form or
documentation, if provided along with the Derivative Works; or,
within a display generated by the Derivative Works, if and
wherever such third-party notices normally appear. The contents
of the NOTICE file are for informational purposes only and
do not modify the License. You may add Your own attribution
notices within Derivative Works that You distribute, alongside
or as an addendum to the NOTICE text from the Work, provided
that such additional attribution notices cannot be construed
as modifying the License.
You may add Your own copyright statement to Your modifications and
may provide additional or different license terms and conditions
for use, reproduction, or distribution of Your modifications, or
for any such Derivative Works as a whole, provided Your use,
reproduction, and distribution of the Work otherwise complies with
the conditions stated in this License.
5. Submission of Contributions. Unless You explicitly state otherwise,
any Contribution intentionally submitted for inclusion in the Work
by You to the Licensor shall be under the terms and conditions of
this License, without any additional terms or conditions.
Notwithstanding the above, nothing herein shall supersede or modify
the terms of any separate license agreement you may have executed
with Licensor regarding such Contributions.
6. Trademarks. This License does not grant permission to use the trade
names, trademarks, service marks, or product names of the Licensor,
except as required for reasonable and customary use in describing the
origin of the Work and reproducing the content of the NOTICE file.
7. Disclaimer of Warranty. Unless required by applicable law or
agreed to in writing, Licensor provides the Work (and each
Contributor provides its Contributions) on an "AS IS" BASIS,
WITHOUT WARRANTIES OR CONDITIONS OF ANY KIND, either express or
implied, including, without limitation, any warranties or conditions
of TITLE, NON-INFRINGEMENT, MERCHANTABILITY, or FITNESS FOR A
PARTICULAR PURPOSE. You are solely responsible for determining the
appropriateness of using or redistributing the Work and assume any
risks associated with Your exercise of permissions under this License.
8. Limitation of Liability. In no event and under no legal theory,
whether in tort (including negligence), contract, or otherwise,
unless required by applicable law (such as deliberate and grossly
negligent acts) or agreed to in writing, shall any Contributor be
liable to You for damages, including any direct, indirect, special,
incidental, or consequential damages of any character arising as a
result of this License or out of the use or inability to use the
Work (including but not limited to damages for loss of goodwill,
work stoppage, computer failure or malfunction, or any and all
other commercial damages or losses), even if such Contributor
has been advised of the possibility of such damages.
9. Accepting Warranty or Additional Liability. While redistributing
the Work or Derivative Works thereof, You may choose to offer,
and charge a fee for, acceptance of support, warranty, indemnity,
or other liability obligations and/or rights consistent with this
License. However, in accepting such obligations, You may act only
on Your own behalf and on Your sole responsibility, not on behalf
of any other Contributor, and only if You agree to indemnify,
defend, and hold each Contributor harmless for any liability
incurred by, or claims asserted against, such Contributor by reason
of your accepting any such warranty or additional liability.
END OF TERMS AND CONDITIONS
APPENDIX: How to apply the Apache License to your work.
To apply the Apache License to your work, attach the following
boilerplate notice, with the fields enclosed by brackets "{}"
replaced with your own identifying information. (Don't include
the brackets!) The text should be enclosed in the appropriate
comment syntax for the file format. We also recommend that a
file or class name and description of purpose be included on the
same "printed page" as the copyright notice for easier
identification within third-party archives.
Copyright 2016 Daniel Cohen Gindi & Philipp Jahoda
Licensed under the Apache License, Version 2.0 (the "License");
you may not use this file except in compliance with the License.
You may obtain a copy of the License at
http://www.apache.org/licenses/LICENSE-2.0
Unless required by applicable law or agreed to in writing, software
distributed under the License is distributed on an "AS IS" BASIS,
WITHOUT WARRANTIES OR CONDITIONS OF ANY KIND, either express or implied.
See the License for the specific language governing permissions and
limitations under the License.
================================================
FILE: Pods/Charts/README.md
================================================
**Version 3.1.1**, synced to [MPAndroidChart #f6a398b](https://github.com/PhilJay/MPAndroidChart/commit/f6a398b)

 [](https://github.com/danielgindi/Charts/releases) [](http://cocoapods.org/pods/charts) [](https://github.com/Carthage/Carthage) [](https://travis-ci.org/danielgindi/Charts) [](https://codecov.io/gh/danielgindi/Charts)
[](https://gitter.im/danielgindi/Charts?utm_source=badge&utm_medium=badge&utm_campaign=pr-badge&utm_content=badge)
### Just a heads up: Charts 3.0 has some breaking changes. Please read [the release/migration notes](https://github.com/danielgindi/Charts/releases/tag/v3.0.0).
### Another heads up: ChartsRealm is now in a [separate repo](https://github.com/danielgindi/ChartsRealm). Pods is also now `Charts` and `ChartsRealm`, instead of ~`Charts/Core`~ and ~`Charts/Realm`~
* Xcode 9.3 / Swift 4.1
* iOS >= 8.0 (Use as an **Embedded** Framework)
* tvOS >= 9.0
* macOS >= 10.11
Okay so there's this beautiful library called [MPAndroidChart](https://github.com/PhilJay/MPAndroidChart) by [Philipp Jahoda](https://www.linkedin.com/in/philippjahoda) which has become very popular amongst Android developers, and in the meanwhile there's no decent charting solution for iOS.
I've chosen to write it in `Swift` as it can be highly optimized by the compiler, and can be used in both `Swift` and `ObjC` project. The demo project is written in `ObjC` to demonstrate how it works.
**An amazing feature** of this library now, for Android, iOS, tvOS and macOS, is the time it saves you when developing for both platforms, as the learning curve is singleton- it happens only once, and the code stays very similar so developers don't have to go around and re-invent the app to produce the same output with a different library. (And that's not even considering the fact that there's not really another good choice out there currently...)
## Having trouble running the demo?
* `ChartsDemo/ChartsDemo.xcodeproj` is the demo project for iOS/tvOS
* `ChartsDemo-OSX/ChartsDemo-OSX.xcodeproj` is the demo project for macOS
* Make sure you are running a supported version of Xcode.
* Usually it is specified here a few lines above.
* In most cases it will be the latest Xcode version.
* Make sure that your project supports Swift 3.0
* Optional: Run `carthage checkout` in the project folder, to fetch dependencies (i.e testing dependencies).
* If you don't have Carthage - you can get it [here](https://github.com/Carthage/Carthage/releases).
## Usage
In order to correctly compile:
1. Drag the `Charts.xcodeproj` to your project
2. Go to your target's settings, hit the "+" under the "Embedded Binaries" section, and select the Charts.framework
3. `@import Charts`
4. When using Swift in an ObjC project:
- You need to import your Bridging Header. Usually it is "*YourProject-Swift.h*", so in ChartsDemo it's "*ChartsDemo-Swift.h*". Do not try to actually include "*ChartsDemo-Swift.h*" in your project :-)
- (Xcode 8.1 and earlier) Under "Build Options", mark "Embedded Content Contains Swift Code"
- (Xcode 8.2+) Under "Build Options", mark "Always Embed Swift Standard Libraries"
5. When using [Realm.io](https://realm.io/):
- Note that the Realm framework is not linked with Charts - it is only there for *optional* bindings. Which means that you need to have the framework in your project, and in a compatible version to whatever is compiled with Charts. We will do our best to always compile against the latest version.
- You'll need to add `ChartsRealm` as a dependency too.
## 3rd party tutorials
* [Using Realm and Charts with Swift 3 in iOS 10 (Sami Korpela)](https://medium.com/@skoli/using-realm-and-charts-with-swift-3-in-ios-10-40c42e3838c0#.2gyymwfh8)
* [Creating a Line Chart in Swift 3 and iOS 10 (Osian Smith)](https://medium.com/@OsianSmith/creating-a-line-chart-in-swift-3-and-ios-10-2f647c95392e)
* [Beginning Set-up and Example Using Charts with Swift 3](https://github.com/annalizhaz/ChartsForSwiftBasic)
* Want your tutorial to show here? Create a PR!
## Troubleshooting
#### Can't compile?
* Please note the difference between installing a compiled framework from CocoaPods or Carthage, and copying the source code.
* Please read the **Usage** section again.
* Search in the issues
* Try to politely ask in the issues section
#### Other problems / feature requests
* Search in the issues
* Try to politely ask in the issues section
## CocoaPods Install
Add `pod 'Charts'` to your Podfile. "Charts" is the name of the library.
For [Realm](https://realm.io/) support, please add `pod 'ChartsRealm'` too.
**Note:** ~~`pod 'ios-charts'`~~ is not the correct library, and refers to a different project by someone else.
## Carthage Install
Charts now include Carthage prebuilt binaries.
```carthage
github "danielgindi/Charts" == 3.1.1
github "danielgindi/Charts" ~> 3.1.1
```
In order to build the binaries for a new release, use `carthage build --no-skip-current && carthage archive Charts`.
## 3rd party bindings
Xamarin (by @Flash3001): *iOS* - [GitHub](https://github.com/Flash3001/iOSCharts.Xamarin)/[NuGet](https://www.nuget.org/packages/iOSCharts/). *Android* - [GitHub](https://github.com/Flash3001/MPAndroidChart.Xamarin)/[NuGet](https://www.nuget.org/packages/MPAndroidChart/).
## Help
If you like what you see here, and want to support the work being done in this repository, you could:
* Contribute code, issues and pull requests
* Let people know this library exists (:fire: spread the word :fire:)
* [](https://www.paypal.com/cgi-bin/webscr?cmd=_s-xclick&hosted_button_id=68UL6Y8KUPS96) (You can buy me a beer, or you can buy me dinner :-)
**Note:** The author of [MPAndroidChart](https://github.com/PhilJay/MPAndroidChart) is the reason that this library exists, and is accepting [donations](https://github.com/PhilJay/MPAndroidChart#donations) on his page. He deserves them!
Questions & Issues
-----
If you are having questions or problems, you should:
- Make sure you are using the latest version of the library. Check the [**release-section**](https://github.com/danielgindi/Charts/releases).
- Study the Android version's [**Documentation-Wiki**](https://github.com/PhilJay/MPAndroidChart/wiki)
- Study the (Still incomplete [](http://cocoadocs.org/docsets/Charts/)) [**Pod-Documentation**](http://cocoadocs.org/docsets/Charts/)
- Search or open questions on [**stackoverflow**](http://stackoverflow.com/questions/tagged/ios-charts) with the `ios-charts` tag
- Search [**known issues**](https://github.com/danielgindi/Charts/issues) for your problem (open and closed)
- Create new issues (please :fire: **search known issues before** :fire:, do not create duplicate issues)
Features
=======
**Core features:**
- 8 different chart types
- Scaling on both axes (with touch-gesture, axes separately or pinch-zoom)
- Dragging / Panning (with touch-gesture)
- Combined-Charts (line-, bar-, scatter-, candle-stick-, bubble-)
- Dual (separate) Axes
- Customizable Axes (both x- and y-axis)
- Highlighting values (with customizable popup-views)
- Save chart to camera-roll / export to PNG/JPEG
- Predefined color templates
- Legends (generated automatically, customizable)
- Animations (build up animations, on both x- and y-axis)
- Limit lines (providing additional information, maximums, ...)
- Fully customizable (paints, typefaces, legends, colors, background, gestures, dashed lines, ...)
- Plotting data directly from [**Realm.io**](https://realm.io) mobile database ([here](https://github.com/danielgindi/ChartsRealm))
**Chart types:**
*Screenshots are currently taken from the original repository, as they render exactly the same :-)*
- **LineChart (with legend, simple design)**

- **LineChart (with legend, simple design)**
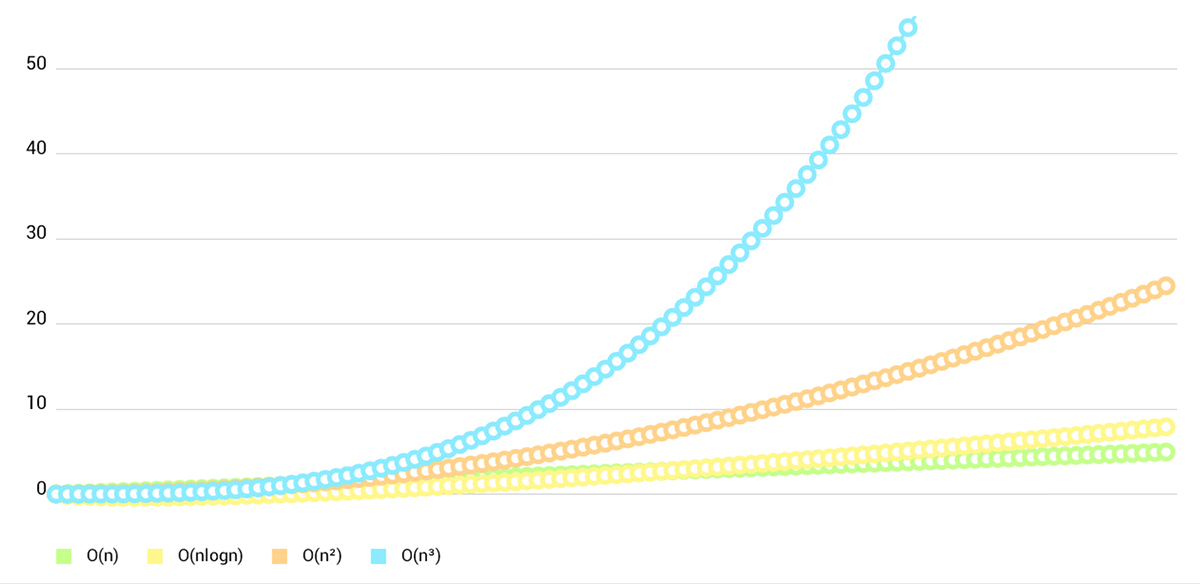
- **LineChart (cubic lines)**
- **LineChart (gradient fill)**
- **Combined-Chart (bar- and linechart in this case)**
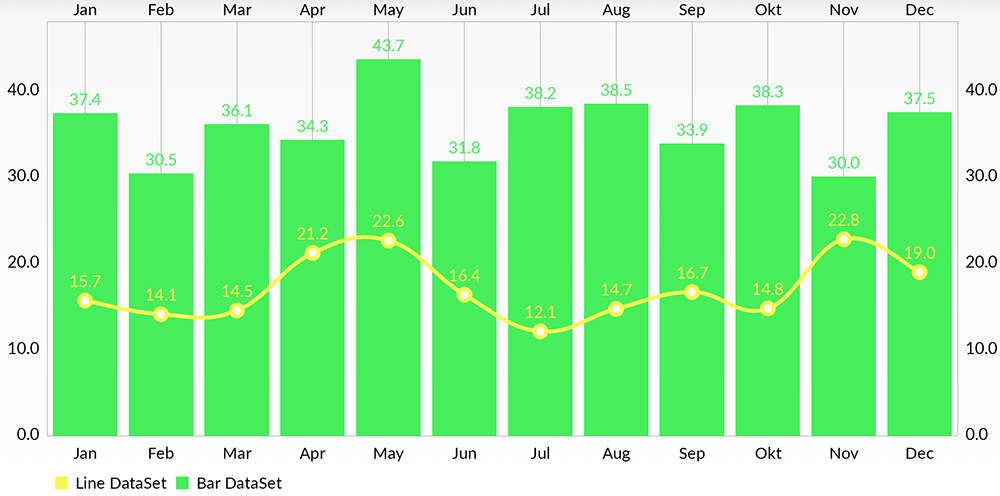
- **BarChart (with legend, simple design)**

- **BarChart (grouped DataSets)**

- **Horizontal-BarChart**
- **PieChart (with selection, ...)**

- **ScatterChart** (with squares, triangles, circles, ... and more)

- **CandleStickChart** (for financial data)

- **BubbleChart** (area covered by bubbles indicates the value)

- **RadarChart** (spider web chart)

Documentation
=======
Currently there's no need for documentation for the iOS/tvOS/macOS version, as the API is **95% the same** as on Android.
You can read the official [MPAndroidChart](https://github.com/PhilJay/MPAndroidChart) documentation here: [**Wiki**](https://github.com/PhilJay/MPAndroidChart/wiki)
Or you can see the [**ChartsDemo**](https://github.com/danielgindi/Charts/tree/master/ChartsDemo) project and learn the how-tos from it.
Special Thanks
=======
Goes to [@liuxuan30](https://github.com/liuxuan30), [@petester42](https://github.com/petester42) and [@AlBirdie](https://github.com/AlBirdie) for new features, bugfixes, and lots and lots of involvement in our open-sourced community! You guys are a huge help to all of those coming here with questions and issues, and I couldn't respond to all of those without you.
License
=======
Copyright 2016 Daniel Cohen Gindi & Philipp Jahoda
Licensed under the Apache License, Version 2.0 (the "License");
you may not use this file except in compliance with the License.
You may obtain a copy of the License at
http://www.apache.org/licenses/LICENSE-2.0
Unless required by applicable law or agreed to in writing, software
distributed under the License is distributed on an "AS IS" BASIS,
WITHOUT WARRANTIES OR CONDITIONS OF ANY KIND, either express or implied.
See the License for the specific language governing permissions and
limitations under the License.
================================================
FILE: Pods/Charts/Source/Charts/Animation/Animator.swift
================================================
//
// Animator.swift
// Charts
//
// Copyright 2015 Daniel Cohen Gindi & Philipp Jahoda
// A port of MPAndroidChart for iOS
// Licensed under Apache License 2.0
//
// https://github.com/danielgindi/Charts
//
import Foundation
import CoreGraphics
#if !os(OSX)
import UIKit
#endif
@objc(ChartAnimatorDelegate)
public protocol AnimatorDelegate
{
/// Called when the Animator has stepped.
func animatorUpdated(_ animator: Animator)
/// Called when the Animator has stopped.
func animatorStopped(_ animator: Animator)
}
@objc(ChartAnimator)
open class Animator: NSObject
{
@objc open weak var delegate: AnimatorDelegate?
@objc open var updateBlock: (() -> Void)?
@objc open var stopBlock: (() -> Void)?
/// the phase that is animated and influences the drawn values on the x-axis
@objc open var phaseX: Double = 1.0
/// the phase that is animated and influences the drawn values on the y-axis
@objc open var phaseY: Double = 1.0
private var _startTimeX: TimeInterval = 0.0
private var _startTimeY: TimeInterval = 0.0
private var _displayLink: NSUIDisplayLink?
private var _durationX: TimeInterval = 0.0
private var _durationY: TimeInterval = 0.0
private var _endTimeX: TimeInterval = 0.0
private var _endTimeY: TimeInterval = 0.0
private var _endTime: TimeInterval = 0.0
private var _enabledX: Bool = false
private var _enabledY: Bool = false
private var _easingX: ChartEasingFunctionBlock?
private var _easingY: ChartEasingFunctionBlock?
public override init()
{
super.init()
}
deinit
{
stop()
}
@objc open func stop()
{
guard _displayLink != nil else { return }
_displayLink?.remove(from: .main, forMode: .common)
_displayLink = nil
_enabledX = false
_enabledY = false
// If we stopped an animation in the middle, we do not want to leave it like this
if phaseX != 1.0 || phaseY != 1.0
{
phaseX = 1.0
phaseY = 1.0
delegate?.animatorUpdated(self)
updateBlock?()
}
delegate?.animatorStopped(self)
stopBlock?()
}
private func updateAnimationPhases(_ currentTime: TimeInterval)
{
if _enabledX
{
let elapsedTime: TimeInterval = currentTime - _startTimeX
let duration: TimeInterval = _durationX
var elapsed: TimeInterval = elapsedTime
if elapsed > duration
{
elapsed = duration
}
phaseX = _easingX?(elapsed, duration) ?? elapsed / duration
}
if _enabledY
{
let elapsedTime: TimeInterval = currentTime - _startTimeY
let duration: TimeInterval = _durationY
var elapsed: TimeInterval = elapsedTime
if elapsed > duration
{
elapsed = duration
}
phaseY = _easingY?(elapsed, duration) ?? elapsed / duration
}
}
@objc private func animationLoop()
{
let currentTime: TimeInterval = CACurrentMediaTime()
updateAnimationPhases(currentTime)
delegate?.animatorUpdated(self)
updateBlock?()
if currentTime >= _endTime
{
stop()
}
}
/// Animates the drawing / rendering of the chart on both x- and y-axis with the specified animation time.
/// If `animate(...)` is called, no further calling of `invalidate()` is necessary to refresh the chart.
/// - parameter xAxisDuration: duration for animating the x axis
/// - parameter yAxisDuration: duration for animating the y axis
/// - parameter easingX: an easing function for the animation on the x axis
/// - parameter easingY: an easing function for the animation on the y axis
@objc open func animate(xAxisDuration: TimeInterval, yAxisDuration: TimeInterval, easingX: ChartEasingFunctionBlock?, easingY: ChartEasingFunctionBlock?)
{
stop()
_startTimeX = CACurrentMediaTime()
_startTimeY = _startTimeX
_durationX = xAxisDuration
_durationY = yAxisDuration
_endTimeX = _startTimeX + xAxisDuration
_endTimeY = _startTimeY + yAxisDuration
_endTime = _endTimeX > _endTimeY ? _endTimeX : _endTimeY
_enabledX = xAxisDuration > 0.0
_enabledY = yAxisDuration > 0.0
_easingX = easingX
_easingY = easingY
// Take care of the first frame if rendering is already scheduled...
updateAnimationPhases(_startTimeX)
if _enabledX || _enabledY
{
_displayLink = NSUIDisplayLink(target: self, selector: #selector(animationLoop))
_displayLink?.add(to: RunLoop.main, forMode: .common)
}
}
/// Animates the drawing / rendering of the chart on both x- and y-axis with the specified animation time.
/// If `animate(...)` is called, no further calling of `invalidate()` is necessary to refresh the chart.
/// - parameter xAxisDuration: duration for animating the x axis
/// - parameter yAxisDuration: duration for animating the y axis
/// - parameter easingOptionX: the easing function for the animation on the x axis
/// - parameter easingOptionY: the easing function for the animation on the y axis
@objc open func animate(xAxisDuration: TimeInterval, yAxisDuration: TimeInterval, easingOptionX: ChartEasingOption, easingOptionY: ChartEasingOption)
{
animate(xAxisDuration: xAxisDuration, yAxisDuration: yAxisDuration, easingX: easingFunctionFromOption(easingOptionX), easingY: easingFunctionFromOption(easingOptionY))
}
/// Animates the drawing / rendering of the chart on both x- and y-axis with the specified animation time.
/// If `animate(...)` is called, no further calling of `invalidate()` is necessary to refresh the chart.
/// - parameter xAxisDuration: duration for animating the x axis
/// - parameter yAxisDuration: duration for animating the y axis
/// - parameter easing: an easing function for the animation
@objc open func animate(xAxisDuration: TimeInterval, yAxisDuration: TimeInterval, easing: ChartEasingFunctionBlock?)
{
animate(xAxisDuration: xAxisDuration, yAxisDuration: yAxisDuration, easingX: easing, easingY: easing)
}
/// Animates the drawing / rendering of the chart on both x- and y-axis with the specified animation time.
/// If `animate(...)` is called, no further calling of `invalidate()` is necessary to refresh the chart.
/// - parameter xAxisDuration: duration for animating the x axis
/// - parameter yAxisDuration: duration for animating the y axis
/// - parameter easingOption: the easing function for the animation
@objc open func animate(xAxisDuration: TimeInterval, yAxisDuration: TimeInterval, easingOption: ChartEasingOption = .easeInOutSine)
{
animate(xAxisDuration: xAxisDuration, yAxisDuration: yAxisDuration, easing: easingFunctionFromOption(easingOption))
}
/// Animates the drawing / rendering of the chart the x-axis with the specified animation time.
/// If `animate(...)` is called, no further calling of `invalidate()` is necessary to refresh the chart.
gitextract_fw1y0vwm/ ├── ChartsUnderstandAndUsage/ │ ├── AppDelegate.swift │ ├── Assets.xcassets/ │ │ ├── AppIcon.appiconset/ │ │ │ └── Contents.json │ │ ├── Contents.json │ │ ├── barChartImage.imageset/ │ │ │ └── Contents.json │ │ ├── barChartWaveImage.imageset/ │ │ │ └── Contents.json │ │ ├── bubbleChartImage.imageset/ │ │ │ └── Contents.json │ │ ├── candleStickChartImage.imageset/ │ │ │ └── Contents.json │ │ ├── combinedChartImage.imageset/ │ │ │ └── Contents.json │ │ ├── lineChartImage.imageset/ │ │ │ └── Contents.json │ │ ├── lineFilledChartImage.imageset/ │ │ │ └── Contents.json │ │ ├── pieChartHalfImage.imageset/ │ │ │ └── Contents.json │ │ ├── pieChartImage.imageset/ │ │ │ └── Contents.json │ │ ├── pieChartPolylineImage.imageset/ │ │ │ └── Contents.json │ │ ├── radarChartImage.imageset/ │ │ │ └── Contents.json │ │ ├── scatterChartImage.imageset/ │ │ │ └── Contents.json │ │ ├── smile.imageset/ │ │ │ └── Contents.json │ │ └── waveformChartImage.imageset/ │ │ └── Contents.json │ ├── BalloonMarker.swift │ ├── BarChartVC.swift │ ├── BarChartWaveVC.swift │ ├── Base.lproj/ │ │ ├── LaunchScreen.storyboard │ │ └── Main.storyboard │ ├── BaseVC.swift │ ├── BubbleChartVC.swift │ ├── CandleStickChartVC.swift │ ├── CombinedChartVC.swift │ ├── Info.plist │ ├── LineChartVC.swift │ ├── LineFilledChartVC.swift │ ├── PieChartHalfVC.swift │ ├── PieChartPolylineVC.swift │ ├── PieChartVC.swift │ ├── RadarChartVC.swift │ ├── ScatterChartVC.swift │ ├── ViewController.swift │ ├── WaveformChartVC.swift │ └── ZHFColor.swift ├── ChartsUnderstandAndUsage.xcodeproj/ │ ├── project.pbxproj │ ├── project.xcworkspace/ │ │ ├── contents.xcworkspacedata │ │ ├── xcshareddata/ │ │ │ └── IDEWorkspaceChecks.plist │ │ └── xcuserdata/ │ │ └── zhanghaifeng.xcuserdatad/ │ │ └── UserInterfaceState.xcuserstate │ └── xcuserdata/ │ ├── macbook.xcuserdatad/ │ │ └── xcschemes/ │ │ └── xcschememanagement.plist │ └── zhanghaifeng.xcuserdatad/ │ └── xcschemes/ │ └── xcschememanagement.plist ├── ChartsUnderstandAndUsage.xcworkspace/ │ ├── contents.xcworkspacedata │ ├── xcshareddata/ │ │ └── IDEWorkspaceChecks.plist │ └── xcuserdata/ │ ├── macbook.xcuserdatad/ │ │ └── UserInterfaceState.xcuserstate │ └── zhanghaifeng.xcuserdatad/ │ ├── UserInterfaceState.xcuserstate │ └── xcdebugger/ │ └── Breakpoints_v2.xcbkptlist ├── ChartsUnderstandAndUsageTests/ │ ├── ChartsUnderstandAndUsageTests.swift │ └── Info.plist ├── ChartsUnderstandAndUsageUITests/ │ ├── ChartsUnderstandAndUsageUITests.swift │ └── Info.plist ├── Podfile ├── Pods/ │ ├── Charts/ │ │ ├── LICENSE │ │ ├── README.md │ │ └── Source/ │ │ └── Charts/ │ │ ├── Animation/ │ │ │ ├── Animator.swift │ │ │ └── ChartAnimationEasing.swift │ │ ├── Charts/ │ │ │ ├── BarChartView.swift │ │ │ ├── BarLineChartViewBase.swift │ │ │ ├── BubbleChartView.swift │ │ │ ├── CandleStickChartView.swift │ │ │ ├── ChartViewBase.swift │ │ │ ├── CombinedChartView.swift │ │ │ ├── HorizontalBarChartView.swift │ │ │ ├── LineChartView.swift │ │ │ ├── PieChartView.swift │ │ │ ├── PieRadarChartViewBase.swift │ │ │ ├── RadarChartView.swift │ │ │ └── ScatterChartView.swift │ │ ├── Components/ │ │ │ ├── AxisBase.swift │ │ │ ├── ChartLimitLine.swift │ │ │ ├── ComponentBase.swift │ │ │ ├── Description.swift │ │ │ ├── IMarker.swift │ │ │ ├── Legend.swift │ │ │ ├── LegendEntry.swift │ │ │ ├── MarkerImage.swift │ │ │ ├── MarkerView.swift │ │ │ ├── XAxis.swift │ │ │ └── YAxis.swift │ │ ├── Data/ │ │ │ ├── Implementations/ │ │ │ │ ├── ChartBaseDataSet.swift │ │ │ │ └── Standard/ │ │ │ │ ├── BarChartData.swift │ │ │ │ ├── BarChartDataEntry.swift │ │ │ │ ├── BarChartDataSet.swift │ │ │ │ ├── BarLineScatterCandleBubbleChartData.swift │ │ │ │ ├── BarLineScatterCandleBubbleChartDataSet.swift │ │ │ │ ├── BubbleChartData.swift │ │ │ │ ├── BubbleChartDataEntry.swift │ │ │ │ ├── BubbleChartDataSet.swift │ │ │ │ ├── CandleChartData.swift │ │ │ │ ├── CandleChartDataEntry.swift │ │ │ │ ├── CandleChartDataSet.swift │ │ │ │ ├── ChartData.swift │ │ │ │ ├── ChartDataEntry.swift │ │ │ │ ├── ChartDataEntryBase.swift │ │ │ │ ├── ChartDataSet.swift │ │ │ │ ├── CombinedChartData.swift │ │ │ │ ├── LineChartData.swift │ │ │ │ ├── LineChartDataSet.swift │ │ │ │ ├── LineRadarChartDataSet.swift │ │ │ │ ├── LineScatterCandleRadarChartDataSet.swift │ │ │ │ ├── PieChartData.swift │ │ │ │ ├── PieChartDataEntry.swift │ │ │ │ ├── PieChartDataSet.swift │ │ │ │ ├── RadarChartData.swift │ │ │ │ ├── RadarChartDataEntry.swift │ │ │ │ ├── RadarChartDataSet.swift │ │ │ │ ├── ScatterChartData.swift │ │ │ │ └── ScatterChartDataSet.swift │ │ │ └── Interfaces/ │ │ │ ├── IBarChartDataSet.swift │ │ │ ├── IBarLineScatterCandleBubbleChartDataSet.swift │ │ │ ├── IBubbleChartDataSet.swift │ │ │ ├── ICandleChartDataSet.swift │ │ │ ├── IChartDataSet.swift │ │ │ ├── ILineChartDataSet.swift │ │ │ ├── ILineRadarChartDataSet.swift │ │ │ ├── ILineScatterCandleRadarChartDataSet.swift │ │ │ ├── IPieChartDataSet.swift │ │ │ ├── IRadarChartDataSet.swift │ │ │ └── IScatterChartDataSet.swift │ │ ├── Filters/ │ │ │ ├── DataApproximator+N.swift │ │ │ └── DataApproximator.swift │ │ ├── Formatters/ │ │ │ ├── DefaultAxisValueFormatter.swift │ │ │ ├── DefaultFillFormatter.swift │ │ │ ├── DefaultValueFormatter.swift │ │ │ ├── IAxisValueFormatter.swift │ │ │ ├── IFillFormatter.swift │ │ │ ├── IValueFormatter.swift │ │ │ └── IndexAxisValueFormatter.swift │ │ ├── Highlight/ │ │ │ ├── BarHighlighter.swift │ │ │ ├── ChartHighlighter.swift │ │ │ ├── CombinedHighlighter.swift │ │ │ ├── Highlight.swift │ │ │ ├── HorizontalBarHighlighter.swift │ │ │ ├── IHighlighter.swift │ │ │ ├── PieHighlighter.swift │ │ │ ├── PieRadarHighlighter.swift │ │ │ ├── RadarHighlighter.swift │ │ │ └── Range.swift │ │ ├── Interfaces/ │ │ │ ├── BarChartDataProvider.swift │ │ │ ├── BarLineScatterCandleBubbleChartDataProvider.swift │ │ │ ├── BubbleChartDataProvider.swift │ │ │ ├── CandleChartDataProvider.swift │ │ │ ├── ChartDataProvider.swift │ │ │ ├── CombinedChartDataProvider.swift │ │ │ ├── LineChartDataProvider.swift │ │ │ └── ScatterChartDataProvider.swift │ │ ├── Jobs/ │ │ │ ├── AnimatedMoveViewJob.swift │ │ │ ├── AnimatedViewPortJob.swift │ │ │ ├── AnimatedZoomViewJob.swift │ │ │ ├── MoveViewJob.swift │ │ │ ├── ViewPortJob.swift │ │ │ └── ZoomViewJob.swift │ │ ├── Renderers/ │ │ │ ├── AxisRendererBase.swift │ │ │ ├── BarChartRenderer.swift │ │ │ ├── BarLineScatterCandleBubbleRenderer.swift │ │ │ ├── BubbleChartRenderer.swift │ │ │ ├── CandleStickChartRenderer.swift │ │ │ ├── ChartDataRendererBase.swift │ │ │ ├── CombinedChartRenderer.swift │ │ │ ├── HorizontalBarChartRenderer.swift │ │ │ ├── LegendRenderer.swift │ │ │ ├── LineChartRenderer.swift │ │ │ ├── LineRadarRenderer.swift │ │ │ ├── LineScatterCandleRadarRenderer.swift │ │ │ ├── PieChartRenderer.swift │ │ │ ├── RadarChartRenderer.swift │ │ │ ├── Renderer.swift │ │ │ ├── Scatter/ │ │ │ │ ├── ChevronDownShapeRenderer.swift │ │ │ │ ├── ChevronUpShapeRenderer.swift │ │ │ │ ├── CircleShapeRenderer.swift │ │ │ │ ├── CrossShapeRenderer.swift │ │ │ │ ├── IShapeRenderer.swift │ │ │ │ ├── SquareShapeRenderer.swift │ │ │ │ ├── TriangleShapeRenderer.swift │ │ │ │ └── XShapeRenderer.swift │ │ │ ├── ScatterChartRenderer.swift │ │ │ ├── XAxisRenderer.swift │ │ │ ├── XAxisRendererHorizontalBarChart.swift │ │ │ ├── XAxisRendererRadarChart.swift │ │ │ ├── YAxisRenderer.swift │ │ │ ├── YAxisRendererHorizontalBarChart.swift │ │ │ └── YAxisRendererRadarChart.swift │ │ └── Utils/ │ │ ├── ChartColorTemplates.swift │ │ ├── ChartUtils.swift │ │ ├── Fill.swift │ │ ├── Platform.swift │ │ ├── Transformer.swift │ │ ├── TransformerHorizontalBarChart.swift │ │ └── ViewPortHandler.swift │ ├── Pods.xcodeproj/ │ │ ├── project.pbxproj │ │ └── xcuserdata/ │ │ ├── macbook.xcuserdatad/ │ │ │ └── xcschemes/ │ │ │ ├── Charts.xcscheme │ │ │ ├── Pods-ChartsUnderstandAndUsage.xcscheme │ │ │ └── xcschememanagement.plist │ │ └── zhanghaifeng.xcuserdatad/ │ │ └── xcschemes/ │ │ ├── Charts.xcscheme │ │ ├── Pods-ChartsUnderstandAndUsage.xcscheme │ │ └── xcschememanagement.plist │ └── Target Support Files/ │ ├── Charts/ │ │ ├── Charts-dummy.m │ │ ├── Charts-prefix.pch │ │ ├── Charts-umbrella.h │ │ ├── Charts.debug.xcconfig │ │ ├── Charts.modulemap │ │ ├── Charts.release.xcconfig │ │ ├── Charts.xcconfig │ │ └── Info.plist │ └── Pods-ChartsUnderstandAndUsage/ │ ├── Info.plist │ ├── Pods-ChartsUnderstandAndUsage-Info.plist │ ├── Pods-ChartsUnderstandAndUsage-acknowledgements.markdown │ ├── Pods-ChartsUnderstandAndUsage-acknowledgements.plist │ ├── Pods-ChartsUnderstandAndUsage-dummy.m │ ├── Pods-ChartsUnderstandAndUsage-frameworks-Debug-input-files.xcfilelist │ ├── Pods-ChartsUnderstandAndUsage-frameworks-Debug-output-files.xcfilelist │ ├── Pods-ChartsUnderstandAndUsage-frameworks-Release-input-files.xcfilelist │ ├── Pods-ChartsUnderstandAndUsage-frameworks-Release-output-files.xcfilelist │ ├── Pods-ChartsUnderstandAndUsage-frameworks.sh │ ├── Pods-ChartsUnderstandAndUsage-resources.sh │ ├── Pods-ChartsUnderstandAndUsage-umbrella.h │ ├── Pods-ChartsUnderstandAndUsage.debug.xcconfig │ ├── Pods-ChartsUnderstandAndUsage.modulemap │ └── Pods-ChartsUnderstandAndUsage.release.xcconfig └── README.md
Condensed preview — 221 files, each showing path, character count, and a content snippet. Download the .json file or copy for the full structured content (1,232K chars).
[
  {
    "path": "ChartsUnderstandAndUsage/AppDelegate.swift",
    "chars": 840,
    "preview": "\n\n//  AppDelegate.swift\n//  ChartsUnderstandAndUsage\n//\n//  Created by 张海峰 on 2018/9/12.\n//  Copyright © 2018年 张海峰. All "
  },
  {
    "path": "ChartsUnderstandAndUsage/Assets.xcassets/AppIcon.appiconset/Contents.json",
    "chars": 1590,
    "preview": "{\n  \"images\" : [\n    {\n      \"idiom\" : \"iphone\",\n      \"size\" : \"20x20\",\n      \"scale\" : \"2x\"\n    },\n    {\n      \"idiom\""
  },
  {
    "path": "ChartsUnderstandAndUsage/Assets.xcassets/Contents.json",
    "chars": 62,
    "preview": "{\n  \"info\" : {\n    \"version\" : 1,\n    \"author\" : \"xcode\"\n  }\n}"
  },
  {
    "path": "ChartsUnderstandAndUsage/Assets.xcassets/barChartImage.imageset/Contents.json",
    "chars": 310,
    "preview": "{\n  \"images\" : [\n    {\n      \"idiom\" : \"universal\",\n      \"scale\" : \"1x\"\n    },\n    {\n      \"idiom\" : \"universal\",\n     "
  },
  {
    "path": "ChartsUnderstandAndUsage/Assets.xcassets/barChartWaveImage.imageset/Contents.json",
    "chars": 314,
    "preview": "{\n  \"images\" : [\n    {\n      \"idiom\" : \"universal\",\n      \"filename\" : \"barChartWaveImage.png\",\n      \"scale\" : \"1x\"\n   "
  },
  {
    "path": "ChartsUnderstandAndUsage/Assets.xcassets/bubbleChartImage.imageset/Contents.json",
    "chars": 313,
    "preview": "{\n  \"images\" : [\n    {\n      \"idiom\" : \"universal\",\n      \"filename\" : \"bubbleChartImage.png\",\n      \"scale\" : \"1x\"\n    "
  },
  {
    "path": "ChartsUnderstandAndUsage/Assets.xcassets/candleStickChartImage.imageset/Contents.json",
    "chars": 318,
    "preview": "{\n  \"images\" : [\n    {\n      \"idiom\" : \"universal\",\n      \"scale\" : \"1x\"\n    },\n    {\n      \"idiom\" : \"universal\",\n     "
  },
  {
    "path": "ChartsUnderstandAndUsage/Assets.xcassets/combinedChartImage.imageset/Contents.json",
    "chars": 315,
    "preview": "{\n  \"images\" : [\n    {\n      \"idiom\" : \"universal\",\n      \"scale\" : \"1x\"\n    },\n    {\n      \"idiom\" : \"universal\",\n     "
  },
  {
    "path": "ChartsUnderstandAndUsage/Assets.xcassets/lineChartImage.imageset/Contents.json",
    "chars": 311,
    "preview": "{\n  \"images\" : [\n    {\n      \"idiom\" : \"universal\",\n      \"scale\" : \"1x\"\n    },\n    {\n      \"idiom\" : \"universal\",\n     "
  },
  {
    "path": "ChartsUnderstandAndUsage/Assets.xcassets/lineFilledChartImage.imageset/Contents.json",
    "chars": 317,
    "preview": "{\n  \"images\" : [\n    {\n      \"idiom\" : \"universal\",\n      \"scale\" : \"1x\"\n    },\n    {\n      \"idiom\" : \"universal\",\n     "
  },
  {
    "path": "ChartsUnderstandAndUsage/Assets.xcassets/pieChartHalfImage.imageset/Contents.json",
    "chars": 314,
    "preview": "{\n  \"images\" : [\n    {\n      \"idiom\" : \"universal\",\n      \"filename\" : \"pieChartHalfImage.png\",\n      \"scale\" : \"1x\"\n   "
  },
  {
    "path": "ChartsUnderstandAndUsage/Assets.xcassets/pieChartImage.imageset/Contents.json",
    "chars": 310,
    "preview": "{\n  \"images\" : [\n    {\n      \"idiom\" : \"universal\",\n      \"filename\" : \"pieChartImage.png\",\n      \"scale\" : \"1x\"\n    },\n"
  },
  {
    "path": "ChartsUnderstandAndUsage/Assets.xcassets/pieChartPolylineImage.imageset/Contents.json",
    "chars": 318,
    "preview": "{\n  \"images\" : [\n    {\n      \"idiom\" : \"universal\",\n      \"filename\" : \"pieChartPolylineImage.png\",\n      \"scale\" : \"1x\""
  },
  {
    "path": "ChartsUnderstandAndUsage/Assets.xcassets/radarChartImage.imageset/Contents.json",
    "chars": 312,
    "preview": "{\n  \"images\" : [\n    {\n      \"idiom\" : \"universal\",\n      \"scale\" : \"1x\"\n    },\n    {\n      \"idiom\" : \"universal\",\n     "
  },
  {
    "path": "ChartsUnderstandAndUsage/Assets.xcassets/scatterChartImage.imageset/Contents.json",
    "chars": 314,
    "preview": "{\n  \"images\" : [\n    {\n      \"idiom\" : \"universal\",\n      \"filename\" : \"scatterChartImage.png\",\n      \"scale\" : \"1x\"\n   "
  },
  {
    "path": "ChartsUnderstandAndUsage/Assets.xcassets/smile.imageset/Contents.json",
    "chars": 302,
    "preview": "{\n  \"images\" : [\n    {\n      \"idiom\" : \"universal\",\n      \"filename\" : \"smile.png\",\n      \"scale\" : \"1x\"\n    },\n    {\n  "
  },
  {
    "path": "ChartsUnderstandAndUsage/Assets.xcassets/waveformChartImage.imageset/Contents.json",
    "chars": 315,
    "preview": "{\n  \"images\" : [\n    {\n      \"idiom\" : \"universal\",\n      \"scale\" : \"1x\"\n    },\n    {\n      \"idiom\" : \"universal\",\n     "
  },
  {
    "path": "ChartsUnderstandAndUsage/BalloonMarker.swift",
    "chars": 6681,
    "preview": "//\n//  BalloonMarker.swift\n//  ChartsUnderstandAndUsage\n//\n//  Created by 张海峰 on 2018/9/18.\n//  Copyright © 2018年 张海峰. A"
  },
  {
    "path": "ChartsUnderstandAndUsage/BarChartVC.swift",
    "chars": 8120,
    "preview": "//\n//  BarChartVC.swift\n//  ChartsUnderstandAndUsage\n//\n//  Created by 张海峰 on 2018/9/12.\n//  Copyright © 2018年 张海峰. All "
  },
  {
    "path": "ChartsUnderstandAndUsage/BarChartWaveVC.swift",
    "chars": 4992,
    "preview": "//\n//  BarChartHorizontalVC.swift\n//  ChartsUnderstandAndUsage\n//\n//  Created by 张海峰 on 2018/10/18.\n//  Copyright © 2018"
  },
  {
    "path": "ChartsUnderstandAndUsage/Base.lproj/LaunchScreen.storyboard",
    "chars": 1681,
    "preview": "<?xml version=\"1.0\" encoding=\"UTF-8\" standalone=\"no\"?>\n<document type=\"com.apple.InterfaceBuilder3.CocoaTouch.Storyboard"
  },
  {
    "path": "ChartsUnderstandAndUsage/Base.lproj/Main.storyboard",
    "chars": 2314,
    "preview": "<?xml version=\"1.0\" encoding=\"UTF-8\"?>\n<document type=\"com.apple.InterfaceBuilder3.CocoaTouch.Storyboard.XIB\" version=\"3"
  },
  {
    "path": "ChartsUnderstandAndUsage/BaseVC.swift",
    "chars": 827,
    "preview": "//\n//  BaseVC.swift\n//  ChartsUnderstandAndUsage\n//\n//  Created by 张海峰 on 2018/10/18.\n//  Copyright © 2018年 张海峰. All rig"
  },
  {
    "path": "ChartsUnderstandAndUsage/BubbleChartVC.swift",
    "chars": 4771,
    "preview": "//\n//  BubbleChartVC.swift\n//  ChartsUnderstandAndUsage\n//\n//  Created by 张海峰 on 2018/9/17.\n//  Copyright © 2018年 张海峰. A"
  },
  {
    "path": "ChartsUnderstandAndUsage/CandleStickChartVC.swift",
    "chars": 5258,
    "preview": "//\n//  CandleStickChartVC.swift\n//  ChartsUnderstandAndUsage\n//\n//  Created by 张海峰 on 2018/9/17.\n//  Copyright © 2018年 张"
  },
  {
    "path": "ChartsUnderstandAndUsage/CombinedChartVC.swift",
    "chars": 10156,
    "preview": "//\n//  CombinedChartVC.swift\n//  ChartsUnderstandAndUsage\n//\n//  Created by 张海峰 on 2018/9/17.\n//  Copyright © 2018年 张海峰."
  },
  {
    "path": "ChartsUnderstandAndUsage/Info.plist",
    "chars": 1463,
    "preview": "<?xml version=\"1.0\" encoding=\"UTF-8\"?>\n<!DOCTYPE plist PUBLIC \"-//Apple//DTD PLIST 1.0//EN\" \"http://www.apple.com/DTDs/P"
  },
  {
    "path": "ChartsUnderstandAndUsage/LineChartVC.swift",
    "chars": 12215,
    "preview": "//\n//  LineChartVC.swift\n//  ChartsUnderstandAndUsage\n//\n//  Created by 张海峰 on 2018/9/17.\n//  Copyright © 2018年 张海峰. All"
  },
  {
    "path": "ChartsUnderstandAndUsage/LineFilledChartVC.swift",
    "chars": 6630,
    "preview": "//\n//  LineFilledChartVC.swift\n//  ChartsUnderstandAndUsage\n//\n//  Created by 张海峰 on 2018/9/18.\n//  Copyright © 2018年 张海"
  },
  {
    "path": "ChartsUnderstandAndUsage/PieChartHalfVC.swift",
    "chars": 6606,
    "preview": "//\n//  PieChartHalfVC.swift\n//  ChartsUnderstandAndUsage\n//\n//  Created by 张海峰 on 2018/9/19.\n//  Copyright © 2018年 张海峰. "
  },
  {
    "path": "ChartsUnderstandAndUsage/PieChartPolylineVC.swift",
    "chars": 6651,
    "preview": "//\n//  PieChartPolylineVC.swift\n//  ChartsUnderstandAndUsage\n//\n//  Created by 张海峰 on 2018/10/18.\n//  Copyright © 2018年 "
  },
  {
    "path": "ChartsUnderstandAndUsage/PieChartVC.swift",
    "chars": 6044,
    "preview": "//\n//  PieChartVC.swift\n//  ChartsUnderstandAndUsage\n//\n//  Created by 张海峰 on 2018/9/13.\n//  Copyright © 2018年 张海峰. All "
  },
  {
    "path": "ChartsUnderstandAndUsage/RadarChartVC.swift",
    "chars": 5919,
    "preview": "//\n//  RadarChartVC.swift\n//  ChartsUnderstandAndUsage\n//\n//  Created by 张海峰 on 2018/9/13.\n//  Copyright © 2018年 张海峰. Al"
  },
  {
    "path": "ChartsUnderstandAndUsage/ScatterChartVC.swift",
    "chars": 4772,
    "preview": "//\n//  ScatterChartVC.swift\n//  ChartsUnderstandAndUsage\n//\n//  Created by 张海峰 on 2018/9/17.\n//  Copyright © 2018年 张海峰. "
  },
  {
    "path": "ChartsUnderstandAndUsage/ViewController.swift",
    "chars": 5209,
    "preview": "//\n//  ViewController.swift\n//  ChartsUnderstandAndUsage\n//\n//  Created by 张海峰 on 2018/9/12.\n//  Copyright © 2018年 张海峰. "
  },
  {
    "path": "ChartsUnderstandAndUsage/WaveformChartVC.swift",
    "chars": 8372,
    "preview": "//\n//  WaveformChartVC.swift\n//  ChartsUnderstandAndUsage\n//\n//  Created by 张海峰 on 2018/11/15.\n//  Copyright © 2018年 张海峰"
  },
  {
    "path": "ChartsUnderstandAndUsage/ZHFColor.swift",
    "chars": 3299,
    "preview": "//\n//  ZHFColor.swift\n//  AmazedBox\n//\n//  Created by lantian on 2018/5/9.\n//  Copyright © 2018年 张海峰. All rights reserve"
  },
  {
    "path": "ChartsUnderstandAndUsage.xcodeproj/project.pbxproj",
    "chars": 35643,
    "preview": "// !$*UTF8*$!\n{\n\tarchiveVersion = 1;\n\tclasses = {\n\t};\n\tobjectVersion = 50;\n\tobjects = {\n\n/* Begin PBXBuildFile section *"
  },
  {
    "path": "ChartsUnderstandAndUsage.xcodeproj/project.xcworkspace/contents.xcworkspacedata",
    "chars": 169,
    "preview": "<?xml version=\"1.0\" encoding=\"UTF-8\"?>\n<Workspace\n   version = \"1.0\">\n   <FileRef\n      location = \"self:ChartsUnderstan"
  },
  {
    "path": "ChartsUnderstandAndUsage.xcodeproj/project.xcworkspace/xcshareddata/IDEWorkspaceChecks.plist",
    "chars": 238,
    "preview": "<?xml version=\"1.0\" encoding=\"UTF-8\"?>\n<!DOCTYPE plist PUBLIC \"-//Apple//DTD PLIST 1.0//EN\" \"http://www.apple.com/DTDs/P"
  },
  {
    "path": "ChartsUnderstandAndUsage.xcodeproj/xcuserdata/macbook.xcuserdatad/xcschemes/xcschememanagement.plist",
    "chars": 359,
    "preview": "<?xml version=\"1.0\" encoding=\"UTF-8\"?>\n<!DOCTYPE plist PUBLIC \"-//Apple//DTD PLIST 1.0//EN\" \"http://www.apple.com/DTDs/P"
  },
  {
    "path": "ChartsUnderstandAndUsage.xcodeproj/xcuserdata/zhanghaifeng.xcuserdatad/xcschemes/xcschememanagement.plist",
    "chars": 473,
    "preview": "<?xml version=\"1.0\" encoding=\"UTF-8\"?>\n<!DOCTYPE plist PUBLIC \"-//Apple//DTD PLIST 1.0//EN\" \"http://www.apple.com/DTDs/P"
  },
  {
    "path": "ChartsUnderstandAndUsage.xcworkspace/contents.xcworkspacedata",
    "chars": 242,
    "preview": "<?xml version=\"1.0\" encoding=\"UTF-8\"?>\n<Workspace\n   version = \"1.0\">\n   <FileRef\n      location = \"group:ChartsUndersta"
  },
  {
    "path": "ChartsUnderstandAndUsage.xcworkspace/xcshareddata/IDEWorkspaceChecks.plist",
    "chars": 238,
    "preview": "<?xml version=\"1.0\" encoding=\"UTF-8\"?>\n<!DOCTYPE plist PUBLIC \"-//Apple//DTD PLIST 1.0//EN\" \"http://www.apple.com/DTDs/P"
  },
  {
    "path": "ChartsUnderstandAndUsage.xcworkspace/xcuserdata/zhanghaifeng.xcuserdatad/xcdebugger/Breakpoints_v2.xcbkptlist",
    "chars": 473,
    "preview": "<?xml version=\"1.0\" encoding=\"UTF-8\"?>\n<Bucket\n   type = \"0\"\n   version = \"2.0\">\n   <Breakpoints>\n      <BreakpointProxy"
  },
  {
    "path": "ChartsUnderstandAndUsageTests/ChartsUnderstandAndUsageTests.swift",
    "chars": 1023,
    "preview": "//\n//  ChartsUnderstandAndUsageTests.swift\n//  ChartsUnderstandAndUsageTests\n//\n//  Created by 张海峰 on 2018/9/12.\n//  Cop"
  },
  {
    "path": "ChartsUnderstandAndUsageTests/Info.plist",
    "chars": 701,
    "preview": "<?xml version=\"1.0\" encoding=\"UTF-8\"?>\n<!DOCTYPE plist PUBLIC \"-//Apple//DTD PLIST 1.0//EN\" \"http://www.apple.com/DTDs/P"
  },
  {
    "path": "ChartsUnderstandAndUsageUITests/ChartsUnderstandAndUsageUITests.swift",
    "chars": 1279,
    "preview": "//\n//  ChartsUnderstandAndUsageUITests.swift\n//  ChartsUnderstandAndUsageUITests\n//\n//  Created by 张海峰 on 2018/9/12.\n// "
  },
  {
    "path": "ChartsUnderstandAndUsageUITests/Info.plist",
    "chars": 701,
    "preview": "<?xml version=\"1.0\" encoding=\"UTF-8\"?>\n<!DOCTYPE plist PUBLIC \"-//Apple//DTD PLIST 1.0//EN\" \"http://www.apple.com/DTDs/P"
  },
  {
    "path": "Podfile",
    "chars": 252,
    "preview": "#Uncomment the to define a global platform for your project\n   platform :ios, '9.0'\n   target 'ChartsUnderstandAndUsage'"
  },
  {
    "path": "Pods/Charts/LICENSE",
    "chars": 11333,
    "preview": "Apache License\n                           Version 2.0, January 2004\n                        http://www.apache.org/licens"
  },
  {
    "path": "Pods/Charts/README.md",
    "chars": 11753,
    "preview": "**Version 3.1.1**, synced to [MPAndroidChart #f6a398b](https://github.com/PhilJay/MPAndroidChart/commit/f6a398b)\n\n![alt "
  },
  {
    "path": "Pods/Charts/Source/Charts/Animation/Animator.swift",
    "chars": 10543,
    "preview": "//\n//  Animator.swift\n//  Charts\n//\n//  Copyright 2015 Daniel Cohen Gindi & Philipp Jahoda\n//  A port of MPAndroidChart "
  },
  {
    "path": "Pods/Charts/Source/Charts/Animation/ChartAnimationEasing.swift",
    "chars": 13524,
    "preview": "//\n//  ChartAnimationUtils.swift\n//  Charts\n//\n//  Copyright 2015 Daniel Cohen Gindi & Philipp Jahoda\n//  A port of MPAn"
  },
  {
    "path": "Pods/Charts/Source/Charts/Charts/BarChartView.swift",
    "chars": 6769,
    "preview": "//\n//  BarChartView.swift\n//  Charts\n//\n//  Copyright 2015 Daniel Cohen Gindi & Philipp Jahoda\n//  A port of MPAndroidCh"
  },
  {
    "path": "Pods/Charts/Source/Charts/Charts/BarLineChartViewBase.swift",
    "chars": 69419,
    "preview": "//\n//  BarLineChartViewBase.swift\n//  Charts\n//\n//  Copyright 2015 Daniel Cohen Gindi & Philipp Jahoda\n//  A port of MPA"
  },
  {
    "path": "Pods/Charts/Source/Charts/Charts/BubbleChartView.swift",
    "chars": 650,
    "preview": "//\n//  BubbleChartView.swift\n//  Charts\n//\n//  Bubble chart implementation:\n//    Copyright 2015 Pierre-Marc Airoldi\n// "
  },
  {
    "path": "Pods/Charts/Source/Charts/Charts/CandleStickChartView.swift",
    "chars": 829,
    "preview": "//\n//  CandleStickChartView.swift\n//  Charts\n//\n//  Copyright 2015 Daniel Cohen Gindi & Philipp Jahoda\n//  A port of MPA"
  },
  {
    "path": "Pods/Charts/Source/Charts/Charts/ChartViewBase.swift",
    "chars": 36806,
    "preview": "//\n//  ChartViewBase.swift\n//  Charts\n//\n//  Copyright 2015 Daniel Cohen Gindi & Philipp Jahoda\n//  A port of MPAndroidC"
  },
  {
    "path": "Pods/Charts/Source/Charts/Charts/CombinedChartView.swift",
    "chars": 7259,
    "preview": "//\n//  CombinedChartView.swift\n//  Charts\n//\n//  Copyright 2015 Daniel Cohen Gindi & Philipp Jahoda\n//  A port of MPAndr"
  },
  {
    "path": "Pods/Charts/Source/Charts/Charts/HorizontalBarChartView.swift",
    "chars": 9825,
    "preview": "//\n//  HorizontalBarChartView.swift\n//  Charts\n//\n//  Copyright 2015 Daniel Cohen Gindi & Philipp Jahoda\n//  A port of M"
  },
  {
    "path": "Pods/Charts/Source/Charts/Charts/LineChartView.swift",
    "chars": 705,
    "preview": "//\n//  LineChartView.swift\n//  Charts\n//\n//  Copyright 2015 Daniel Cohen Gindi & Philipp Jahoda\n//  A port of MPAndroidC"
  },
  {
    "path": "Pods/Charts/Source/Charts/Charts/PieChartView.swift",
    "chars": 17886,
    "preview": "//\n//  PieChartView.swift\n//  Charts\n//\n//  Copyright 2015 Daniel Cohen Gindi & Philipp Jahoda\n//  A port of MPAndroidCh"
  },
  {
    "path": "Pods/Charts/Source/Charts/Charts/PieRadarChartViewBase.swift",
    "chars": 27321,
    "preview": "//\n//  PieRadarChartViewBase.swift\n//  Charts\n//\n//  Copyright 2015 Daniel Cohen Gindi & Philipp Jahoda\n//  A port of MP"
  },
  {
    "path": "Pods/Charts/Source/Charts/Charts/RadarChartView.swift",
    "chars": 7181,
    "preview": "//\n//  RadarChartView.swift\n//  Charts\n//\n//  Copyright 2015 Daniel Cohen Gindi & Philipp Jahoda\n//  A port of MPAndroid"
  },
  {
    "path": "Pods/Charts/Source/Charts/Charts/ScatterChartView.swift",
    "chars": 824,
    "preview": "//\n//  ScatterChartView.swift\n//  Charts\n//\n//  Copyright 2015 Daniel Cohen Gindi & Philipp Jahoda\n//  A port of MPAndro"
  },
  {
    "path": "Pods/Charts/Source/Charts/Components/AxisBase.swift",
    "chars": 11947,
    "preview": "//\n//  AxisBase.swift\n//  Charts\n//\n//  Copyright 2015 Daniel Cohen Gindi & Philipp Jahoda\n//  A port of MPAndroidChart "
  },
  {
    "path": "Pods/Charts/Source/Charts/Components/ChartLimitLine.swift",
    "chars": 2105,
    "preview": "//\n//  ChartLimitLine.swift\n//  Charts\n//\n//  Copyright 2015 Daniel Cohen Gindi & Philipp Jahoda\n//  A port of MPAndroid"
  },
  {
    "path": "Pods/Charts/Source/Charts/Components/ComponentBase.swift",
    "chars": 901,
    "preview": "//\n//  ComponentBase.swift\n//  Charts\n//\n//  Copyright 2015 Daniel Cohen Gindi & Philipp Jahoda\n//  A port of MPAndroidC"
  },
  {
    "path": "Pods/Charts/Source/Charts/Components/Description.swift",
    "chars": 1320,
    "preview": "//\n//  Description.swift\n//  Charts\n//\n//  Copyright 2015 Daniel Cohen Gindi & Philipp Jahoda\n//  A port of MPAndroidCha"
  },
  {
    "path": "Pods/Charts/Source/Charts/Components/IMarker.swift",
    "chars": 1745,
    "preview": "//\n//  ChartMarker.swift\n//  Charts\n//\n//  Copyright 2015 Daniel Cohen Gindi & Philipp Jahoda\n//  A port of MPAndroidCha"
  },
  {
    "path": "Pods/Charts/Source/Charts/Components/Legend.swift",
    "chars": 14532,
    "preview": "//\n//  Legend.swift\n//  Charts\n//\n//  Copyright 2015 Daniel Cohen Gindi & Philipp Jahoda\n//  A port of MPAndroidChart fo"
  },
  {
    "path": "Pods/Charts/Source/Charts/Components/LegendEntry.swift",
    "chars": 3043,
    "preview": "//\n//  LegendEntry.swift\n//  Charts\n//\n//  Copyright 2015 Daniel Cohen Gindi & Philipp Jahoda\n//  A port of MPAndroidCha"
  },
  {
    "path": "Pods/Charts/Source/Charts/Components/MarkerImage.swift",
    "chars": 2623,
    "preview": "//\n//  ChartMarkerImage.swift\n//  Charts\n//\n//  Copyright 2015 Daniel Cohen Gindi & Philipp Jahoda\n//  A port of MPAndro"
  },
  {
    "path": "Pods/Charts/Source/Charts/Components/MarkerView.swift",
    "chars": 2602,
    "preview": "//\n//  ChartMarkerView.swift\n//  Charts\n//\n//  Copyright 2015 Daniel Cohen Gindi & Philipp Jahoda\n//  A port of MPAndroi"
  },
  {
    "path": "Pods/Charts/Source/Charts/Components/XAxis.swift",
    "chars": 2522,
    "preview": "//\n//  XAxis.swift\n//  Charts\n//\n//  Copyright 2015 Daniel Cohen Gindi & Philipp Jahoda\n//  A port of MPAndroidChart for"
  },
  {
    "path": "Pods/Charts/Source/Charts/Components/YAxis.swift",
    "chars": 5237,
    "preview": "//\n//  YAxis.swift\n//  Charts\n//\n//  Copyright 2015 Daniel Cohen Gindi & Philipp Jahoda\n//  A port of MPAndroidChart for"
  },
  {
    "path": "Pods/Charts/Source/Charts/Data/Implementations/ChartBaseDataSet.swift",
    "chars": 12625,
    "preview": "//\n//  BaseDataSet.swift\n//  Charts\n//\n//  Copyright 2015 Daniel Cohen Gindi & Philipp Jahoda\n//  A port of MPAndroidCha"
  },
  {
    "path": "Pods/Charts/Source/Charts/Data/Implementations/Standard/BarChartData.swift",
    "chars": 3348,
    "preview": "//\n//  BarChartData.swift\n//  Charts\n//\n//  Copyright 2015 Daniel Cohen Gindi & Philipp Jahoda\n//  A port of MPAndroidCh"
  },
  {
    "path": "Pods/Charts/Source/Charts/Data/Implementations/Standard/BarChartDataEntry.swift",
    "chars": 6408,
    "preview": "//\n//  BarChartDataEntry.swift\n//  Charts\n//\n//  Copyright 2015 Daniel Cohen Gindi & Philipp Jahoda\n//  A port of MPAndr"
  },
  {
    "path": "Pods/Charts/Source/Charts/Data/Implementations/Standard/BarChartDataSet.swift",
    "chars": 4809,
    "preview": "//\n//  BarChartDataSet.swift\n//  Charts\n//\n//  Copyright 2015 Daniel Cohen Gindi & Philipp Jahoda\n//  A port of MPAndroi"
  },
  {
    "path": "Pods/Charts/Source/Charts/Data/Implementations/Standard/BarLineScatterCandleBubbleChartData.swift",
    "chars": 492,
    "preview": "//\n//  BarLineScatterCandleBubbleChartData.swift\n//  Charts\n//\n//  Copyright 2015 Daniel Cohen Gindi & Philipp Jahoda\n//"
  },
  {
    "path": "Pods/Charts/Source/Charts/Data/Implementations/Standard/BarLineScatterCandleBubbleChartDataSet.swift",
    "chars": 1196,
    "preview": "//\n//  BarLineScatterCandleBubbleChartDataSet.swift\n//  Charts\n//\n//  Copyright 2015 Daniel Cohen Gindi & Philipp Jahoda"
  },
  {
    "path": "Pods/Charts/Source/Charts/Data/Implementations/Standard/BubbleChartData.swift",
    "chars": 782,
    "preview": "//\n//  BubbleChartData.swift\n//  Charts\n//\n//  Bubble chart implementation:\n//    Copyright 2015 Pierre-Marc Airoldi\n// "
  },
  {
    "path": "Pods/Charts/Source/Charts/Data/Implementations/Standard/BubbleChartDataEntry.swift",
    "chars": 2149,
    "preview": "//\n//  BubbleDataEntry.swift\n//  Charts\n//\n//  Bubble chart implementation: \n//    Copyright 2015 Pierre-Marc Airoldi\n//"
  },
  {
    "path": "Pods/Charts/Source/Charts/Data/Implementations/Standard/BubbleChartDataSet.swift",
    "chars": 1467,
    "preview": "//\n//  BubbleChartDataSet.swift\n//  Charts\n//\n//  Bubble chart implementation:\n//    Copyright 2015 Pierre-Marc Airoldi\n"
  },
  {
    "path": "Pods/Charts/Source/Charts/Data/Implementations/Standard/CandleChartData.swift",
    "chars": 478,
    "preview": "//\n//  CandleChartData.swift\n//  Charts\n//\n//  Copyright 2015 Daniel Cohen Gindi & Philipp Jahoda\n//  A port of MPAndroi"
  },
  {
    "path": "Pods/Charts/Source/Charts/Data/Implementations/Standard/CandleChartDataEntry.swift",
    "chars": 2763,
    "preview": "//\n//  CandleChartDataEntry.swift\n//  Charts\n//\n//  Copyright 2015 Daniel Cohen Gindi & Philipp Jahoda\n//  A port of MPA"
  },
  {
    "path": "Pods/Charts/Source/Charts/Data/Implementations/Standard/CandleChartDataSet.swift",
    "chars": 3497,
    "preview": "//\n//  CandleChartDataSet.swift\n//  Charts\n//\n//  Copyright 2015 Daniel Cohen Gindi & Philipp Jahoda\n//  A port of MPAnd"
  },
  {
    "path": "Pods/Charts/Source/Charts/Data/Implementations/Standard/ChartData.swift",
    "chars": 20049,
    "preview": "//\n//  ChartData.swift\n//  Charts\n//\n//  Copyright 2015 Daniel Cohen Gindi & Philipp Jahoda\n//  A port of MPAndroidChart"
  },
  {
    "path": "Pods/Charts/Source/Charts/Data/Implementations/Standard/ChartDataEntry.swift",
    "chars": 2707,
    "preview": "//\n//  ChartDataEntry.swift\n//  Charts\n//\n//  Copyright 2015 Daniel Cohen Gindi & Philipp Jahoda\n//  A port of MPAndroid"
  },
  {
    "path": "Pods/Charts/Source/Charts/Data/Implementations/Standard/ChartDataEntryBase.swift",
    "chars": 2257,
    "preview": "//\n//  ChartDataEntryBase.swift\n//  Charts\n//\n//  Copyright 2015 Daniel Cohen Gindi & Philipp Jahoda\n//  A port of MPAnd"
  },
  {
    "path": "Pods/Charts/Source/Charts/Data/Implementations/Standard/ChartDataSet.swift",
    "chars": 15409,
    "preview": "//\n//  ChartDataSet.swift\n//  Charts\n//\n//  Copyright 2015 Daniel Cohen Gindi & Philipp Jahoda\n//  A port of MPAndroidCh"
  },
  {
    "path": "Pods/Charts/Source/Charts/Data/Implementations/Standard/CombinedChartData.swift",
    "chars": 7721,
    "preview": "//\n//  CombinedChartData.swift\n//  Charts\n//\n//  Copyright 2015 Daniel Cohen Gindi & Philipp Jahoda\n//  A port of MPAndr"
  },
  {
    "path": "Pods/Charts/Source/Charts/Data/Implementations/Standard/LineChartData.swift",
    "chars": 520,
    "preview": "//\n//  LineChartData.swift\n//  Charts\n//\n//  Copyright 2015 Daniel Cohen Gindi & Philipp Jahoda\n//  A port of MPAndroidC"
  },
  {
    "path": "Pods/Charts/Source/Charts/Data/Implementations/Standard/LineChartDataSet.swift",
    "chars": 5153,
    "preview": "//\n//  LineChartDataSet.swift\n//  Charts\n//\n//  Copyright 2015 Daniel Cohen Gindi & Philipp Jahoda\n//  A port of MPAndro"
  },
  {
    "path": "Pods/Charts/Source/Charts/Data/Implementations/Standard/LineRadarChartDataSet.swift",
    "chars": 2498,
    "preview": "//\n//  LineRadarChartDataSet.swift\n//  Charts\n//\n//  Copyright 2015 Daniel Cohen Gindi & Philipp Jahoda\n//  A port of MP"
  },
  {
    "path": "Pods/Charts/Source/Charts/Data/Implementations/Standard/LineScatterCandleRadarChartDataSet.swift",
    "chars": 1906,
    "preview": "//\n//  LineScatterCandleRadarChartDataSet.swift\n//  Charts\n//\n//  Copyright 2015 Daniel Cohen Gindi & Philipp Jahoda\n// "
  },
  {
    "path": "Pods/Charts/Source/Charts/Data/Implementations/Standard/PieChartData.swift",
    "chars": 3106,
    "preview": "//\n//  PieData.swift\n//  Charts\n//\n//  Copyright 2015 Daniel Cohen Gindi & Philipp Jahoda\n//  A port of MPAndroidChart f"
  },
  {
    "path": "Pods/Charts/Source/Charts/Data/Implementations/Standard/PieChartDataEntry.swift",
    "chars": 3136,
    "preview": "//\n//  PieChartDataEntry.swift\n//  Charts\n//\n//  Copyright 2015 Daniel Cohen Gindi & Philipp Jahoda\n//  A port of MPAndr"
  },
  {
    "path": "Pods/Charts/Source/Charts/Data/Implementations/Standard/PieChartDataSet.swift",
    "chars": 3376,
    "preview": "//\n//  PieChartDataSet.swift\n//  Charts\n//\n//  Copyright 2015 Daniel Cohen Gindi & Philipp Jahoda\n//  A port of MPAndroi"
  },
  {
    "path": "Pods/Charts/Source/Charts/Data/Implementations/Standard/RadarChartData.swift",
    "chars": 1271,
    "preview": "//\n//  RadarChartData.swift\n//  Charts\n//\n//  Copyright 2015 Daniel Cohen Gindi & Philipp Jahoda\n//  A port of MPAndroid"
  },
  {
    "path": "Pods/Charts/Source/Charts/Data/Implementations/Standard/RadarChartDataEntry.swift",
    "chars": 1135,
    "preview": "//\n//  RadarChartDataEntry.swift\n//  Charts\n//\n//  Copyright 2015 Daniel Cohen Gindi & Philipp Jahoda\n//  A port of MPAn"
  },
  {
    "path": "Pods/Charts/Source/Charts/Data/Implementations/Standard/RadarChartDataSet.swift",
    "chars": 1588,
    "preview": "//\n//  RadarChartDataSet.swift\n//  Charts\n//\n//  Copyright 2015 Daniel Cohen Gindi & Philipp Jahoda\n//  A port of MPAndr"
  },
  {
    "path": "Pods/Charts/Source/Charts/Data/Implementations/Standard/ScatterChartData.swift",
    "chars": 1134,
    "preview": "//\n//  ScatterChartData.swift\n//  Charts\n//\n//  Copyright 2015 Daniel Cohen Gindi & Philipp Jahoda\n//  A port of MPAndro"
  },
  {
    "path": "Pods/Charts/Source/Charts/Data/Implementations/Standard/ScatterChartDataSet.swift",
    "chars": 2488,
    "preview": "//\n//  ScatterChartDataSet.swift\n//  Charts\n//\n//  Copyright 2015 Daniel Cohen Gindi & Philipp Jahoda\n//  A port of MPAn"
  },
  {
    "path": "Pods/Charts/Source/Charts/Data/Interfaces/IBarChartDataSet.swift",
    "chars": 1445,
    "preview": "//\n//  IBarChartDataSet.swift\n//  Charts\n//\n//  Copyright 2015 Daniel Cohen Gindi & Philipp Jahoda\n//  A port of MPAndro"
  },
  {
    "path": "Pods/Charts/Source/Charts/Data/Interfaces/IBarLineScatterCandleBubbleChartDataSet.swift",
    "chars": 670,
    "preview": "//\n//  IBarLineScatterCandleBubbleChartDataSet.swift\n//  Charts\n//\n//  Copyright 2015 Daniel Cohen Gindi & Philipp Jahod"
  },
  {
    "path": "Pods/Charts/Source/Charts/Data/Interfaces/IBubbleChartDataSet.swift",
    "chars": 671,
    "preview": "//\n//  IBubbleChartDataSet.swift\n//  Charts\n//\n//  Copyright 2015 Daniel Cohen Gindi & Philipp Jahoda\n//  A port of MPAn"
  },
  {
    "path": "Pods/Charts/Source/Charts/Data/Interfaces/ICandleChartDataSet.swift",
    "chars": 1822,
    "preview": "//\n//  ICandleChartDataSet.swift\n//  Charts\n//\n//  Copyright 2015 Daniel Cohen Gindi & Philipp Jahoda\n//  A port of MPAn"
  },
  {
    "path": "Pods/Charts/Source/Charts/Data/Interfaces/IChartDataSet.swift",
    "chars": 11282,
    "preview": "//\n//  IChartDataSet.swift\n//  Charts\n//\n//  Copyright 2015 Daniel Cohen Gindi & Philipp Jahoda\n//  A port of MPAndroidC"
  },
  {
    "path": "Pods/Charts/Source/Charts/Data/Interfaces/ILineChartDataSet.swift",
    "chars": 2675,
    "preview": "//\n//  ILineChartDataSet.swift\n//  Charts\n//\n//  Copyright 2015 Daniel Cohen Gindi & Philipp Jahoda\n//  A port of MPAndr"
  },
  {
    "path": "Pods/Charts/Source/Charts/Data/Interfaces/ILineRadarChartDataSet.swift",
    "chars": 1411,
    "preview": "//\n//  ILineRadarChartDataSet.swift\n//  Charts\n//\n//  Copyright 2015 Daniel Cohen Gindi & Philipp Jahoda\n//  A port of M"
  },
  {
    "path": "Pods/Charts/Source/Charts/Data/Interfaces/ILineScatterCandleRadarChartDataSet.swift",
    "chars": 1264,
    "preview": "//\n//  ILineScatterCandleRadarChartDataSet.swift\n//  Charts\n//\n//  Copyright 2015 Daniel Cohen Gindi & Philipp Jahoda\n//"
  },
  {
    "path": "Pods/Charts/Source/Charts/Data/Interfaces/IPieChartDataSet.swift",
    "chars": 2087,
    "preview": "//\n//  IPieChartDataSet.swift\n//  Charts\n//\n//  Copyright 2015 Daniel Cohen Gindi & Philipp Jahoda\n//  A port of MPAndro"
  },
  {
    "path": "Pods/Charts/Source/Charts/Data/Interfaces/IRadarChartDataSet.swift",
    "chars": 1085,
    "preview": "//\n//  IRadarChartDataSet.swift\n//  Charts\n//\n//  Copyright 2015 Daniel Cohen Gindi & Philipp Jahoda\n//  A port of MPAnd"
  },
  {
    "path": "Pods/Charts/Source/Charts/Data/Interfaces/IScatterChartDataSet.swift",
    "chars": 1072,
    "preview": "//\n//  IScatterChartDataSet.swift\n//  Charts\n//\n//  Copyright 2015 Daniel Cohen Gindi & Philipp Jahoda\n//  A port of MPA"
  },
  {
    "path": "Pods/Charts/Source/Charts/Filters/DataApproximator+N.swift",
    "chars": 4629,
    "preview": "//\n//  DataApproximator+N.swift\n//  Charts\n//\n//  Created by M Ivaniushchenko on 9/6/17.\n//  Licensed under Apache Licen"
  },
  {
    "path": "Pods/Charts/Source/Charts/Filters/DataApproximator.swift",
    "chars": 3473,
    "preview": "//\n//  DataApproximator.swift\n//  Charts\n//\n//  Copyright 2015 Daniel Cohen Gindi & Philipp Jahoda\n//  A port of MPAndro"
  },
  {
    "path": "Pods/Charts/Source/Charts/Formatters/DefaultAxisValueFormatter.swift",
    "chars": 2380,
    "preview": "//\n//  DefaultAxisValueFormatter.swift\n//  Charts\n//\n//  Copyright 2015 Daniel Cohen Gindi & Philipp Jahoda\n//  A port o"
  },
  {
    "path": "Pods/Charts/Source/Charts/Formatters/DefaultFillFormatter.swift",
    "chars": 1553,
    "preview": "//\n//  DefaultFillFormatter.swift\n//  Charts\n//\n//  Copyright 2015 Daniel Cohen Gindi & Philipp Jahoda\n//  A port of MPA"
  },
  {
    "path": "Pods/Charts/Source/Charts/Formatters/DefaultValueFormatter.swift",
    "chars": 2536,
    "preview": "//\n//  DefaultValueFormatter.swift\n//  Charts\n//\n//  Copyright 2015 Daniel Cohen Gindi & Philipp Jahoda\n//  A port of MP"
  },
  {
    "path": "Pods/Charts/Source/Charts/Formatters/IAxisValueFormatter.swift",
    "chars": 899,
    "preview": "//\n//  IAxisValueFormatter.swift\n//  Charts\n//\n//  Copyright 2015 Daniel Cohen Gindi & Philipp Jahoda\n//  A port of MPAn"
  },
  {
    "path": "Pods/Charts/Source/Charts/Formatters/IFillFormatter.swift",
    "chars": 692,
    "preview": "//\n//  IFillFormatter.swift\n//  Charts\n//\n//  Copyright 2015 Daniel Cohen Gindi & Philipp Jahoda\n//  A port of MPAndroid"
  },
  {
    "path": "Pods/Charts/Source/Charts/Formatters/IValueFormatter.swift",
    "chars": 1503,
    "preview": "//\n//  IValueFormatter.swift\n//  Charts\n//\n//  Copyright 2015 Daniel Cohen Gindi & Philipp Jahoda\n//  A port of MPAndroi"
  },
  {
    "path": "Pods/Charts/Source/Charts/Formatters/IndexAxisValueFormatter.swift",
    "chars": 1357,
    "preview": "//\n//  IndexAxisValueFormatter.swift\n//  Charts\n//\n//  Copyright 2015 Daniel Cohen Gindi & Philipp Jahoda\n//  A port of "
  },
  {
    "path": "Pods/Charts/Source/Charts/Highlight/BarHighlighter.swift",
    "chars": 3600,
    "preview": "//\n//  BarHighlighter.swift\n//  Charts\n//\n//  Copyright 2015 Daniel Cohen Gindi & Philipp Jahoda\n//  A port of MPAndroid"
  },
  {
    "path": "Pods/Charts/Source/Charts/Highlight/ChartHighlighter.swift",
    "chars": 6484,
    "preview": "//\n//  ChartHighlighter.swift\n//  Charts\n//\n//  Copyright 2015 Daniel Cohen Gindi & Philipp Jahoda\n//  A port of MPAndro"
  },
  {
    "path": "Pods/Charts/Source/Charts/Highlight/CombinedHighlighter.swift",
    "chars": 2187,
    "preview": "//\n//  CombinedHighlighter.swift\n//  Charts\n//\n//  Copyright 2015 Daniel Cohen Gindi & Philipp Jahoda\n//  A port of MPAn"
  },
  {
    "path": "Pods/Charts/Source/Charts/Highlight/Highlight.swift",
    "chars": 6807,
    "preview": "//\n//  Highlight.swift\n//  Charts\n//\n//  Copyright 2015 Daniel Cohen Gindi & Philipp Jahoda\n//  A port of MPAndroidChart"
  },
  {
    "path": "Pods/Charts/Source/Charts/Highlight/HorizontalBarHighlighter.swift",
    "chars": 2223,
    "preview": "//\n//  HorizontalBarHighlighter.swift\n//  Charts\n//\n//  Copyright 2015 Daniel Cohen Gindi & Philipp Jahoda\n//  A port of"
  },
  {
    "path": "Pods/Charts/Source/Charts/Highlight/IHighlighter.swift",
    "chars": 550,
    "preview": "//\n//  IHighlighter.swift\n//  Charts\n//\n//  Copyright 2015 Daniel Cohen Gindi & Philipp Jahoda\n//  A port of MPAndroidCh"
  },
  {
    "path": "Pods/Charts/Source/Charts/Highlight/PieHighlighter.swift",
    "chars": 714,
    "preview": "//\n//  PieHighlighter.swift\n//  Charts\n//\n//  Copyright 2015 Daniel Cohen Gindi & Philipp Jahoda\n//  A port of MPAndroid"
  },
  {
    "path": "Pods/Charts/Source/Charts/Highlight/PieRadarHighlighter.swift",
    "chars": 1675,
    "preview": "//\n//  PieRadarHighlighter.swift\n//  Charts\n//\n//  Copyright 2015 Daniel Cohen Gindi & Philipp Jahoda\n//  A port of MPAn"
  },
  {
    "path": "Pods/Charts/Source/Charts/Highlight/RadarHighlighter.swift",
    "chars": 2460,
    "preview": "//\n//  RadarHighlighter.swift\n//  Charts\n//\n//  Copyright 2015 Daniel Cohen Gindi & Philipp Jahoda\n//  A port of MPAndro"
  },
  {
    "path": "Pods/Charts/Source/Charts/Highlight/Range.swift",
    "chars": 1025,
    "preview": "//\n//  Range.swift\n//  Charts\n//\n//  Copyright 2015 Daniel Cohen Gindi & Philipp Jahoda\n//  A port of MPAndroidChart for"
  },
  {
    "path": "Pods/Charts/Source/Charts/Interfaces/BarChartDataProvider.swift",
    "chars": 543,
    "preview": "//\n//  BarChartDataProvider.swift\n//  Charts\n//\n//  Copyright 2015 Daniel Cohen Gindi & Philipp Jahoda\n//  A port of MPA"
  },
  {
    "path": "Pods/Charts/Source/Charts/Interfaces/BarLineScatterCandleBubbleChartDataProvider.swift",
    "chars": 588,
    "preview": "//\n//  BarLineScatterCandleBubbleChartDataProvider.swift\n//  Charts\n//\n//  Copyright 2015 Daniel Cohen Gindi & Philipp J"
  },
  {
    "path": "Pods/Charts/Source/Charts/Interfaces/BubbleChartDataProvider.swift",
    "chars": 408,
    "preview": "//\n//  BubbleChartDataProvider.swift\n//  Charts\n//\n//  Copyright 2015 Daniel Cohen Gindi & Philipp Jahoda\n//  A port of "
  },
  {
    "path": "Pods/Charts/Source/Charts/Interfaces/CandleChartDataProvider.swift",
    "chars": 408,
    "preview": "//\n//  CandleChartDataProvider.swift\n//  Charts\n//\n//  Copyright 2015 Daniel Cohen Gindi & Philipp Jahoda\n//  A port of "
  },
  {
    "path": "Pods/Charts/Source/Charts/Interfaces/ChartDataProvider.swift",
    "chars": 1020,
    "preview": "//\n//  ChartDataProvider.swift\n//  Charts\n//\n//  Copyright 2015 Daniel Cohen Gindi & Philipp Jahoda\n//  A port of MPAndr"
  },
  {
    "path": "Pods/Charts/Source/Charts/Interfaces/CombinedChartDataProvider.swift",
    "chars": 492,
    "preview": "//\n//  CombinedChartDataProvider.swoft\n//  Charts\n//\n//  Copyright 2015 Daniel Cohen Gindi & Philipp Jahoda\n//  A port o"
  },
  {
    "path": "Pods/Charts/Source/Charts/Interfaces/LineChartDataProvider.swift",
    "chars": 462,
    "preview": "//\n//  LineChartDataProvider.swift\n//  Charts\n//\n//  Copyright 2015 Daniel Cohen Gindi & Philipp Jahoda\n//  A port of MP"
  },
  {
    "path": "Pods/Charts/Source/Charts/Interfaces/ScatterChartDataProvider.swift",
    "chars": 412,
    "preview": "//\n//  ScatterChartDataProvider.swift\n//  Charts\n//\n//  Copyright 2015 Daniel Cohen Gindi & Philipp Jahoda\n//  A port of"
  },
  {
    "path": "Pods/Charts/Source/Charts/Jobs/AnimatedMoveViewJob.swift",
    "chars": 860,
    "preview": "//\n//  AnimatedMoveViewJob.swift\n//  Charts\n//\n//  Copyright 2015 Daniel Cohen Gindi & Philipp Jahoda\n//  A port of MPAn"
  },
  {
    "path": "Pods/Charts/Source/Charts/Jobs/AnimatedViewPortJob.swift",
    "chars": 3001,
    "preview": "//\n//  AnimatedViewPortJob.swift\n//  Charts\n//\n//  Copyright 2015 Daniel Cohen Gindi & Philipp Jahoda\n//  A port of MPAn"
  },
  {
    "path": "Pods/Charts/Source/Charts/Jobs/AnimatedZoomViewJob.swift",
    "chars": 2959,
    "preview": "//\n//  AnimatedZoomViewJob.swift\n//  Charts\n//\n//  Copyright 2015 Daniel Cohen Gindi & Philipp Jahoda\n//  A port of MPAn"
  },
  {
    "path": "Pods/Charts/Source/Charts/Jobs/MoveViewJob.swift",
    "chars": 772,
    "preview": "//\n//  MoveViewJob.swift\n//  Charts\n//\n//  Copyright 2015 Daniel Cohen Gindi & Philipp Jahoda\n//  A port of MPAndroidCha"
  },
  {
    "path": "Pods/Charts/Source/Charts/Jobs/ViewPortJob.swift",
    "chars": 1180,
    "preview": "//\n//  ViewPortJob.swift\n//  Charts\n//\n//  Copyright 2015 Daniel Cohen Gindi & Philipp Jahoda\n//  A port of MPAndroidCha"
  },
  {
    "path": "Pods/Charts/Source/Charts/Jobs/ZoomViewJob.swift",
    "chars": 2128,
    "preview": "//\n//  ZoomViewJob.swift\n//  Charts\n//\n//  Copyright 2015 Daniel Cohen Gindi & Philipp Jahoda\n//  A port of MPAndroidCha"
  },
  {
    "path": "Pods/Charts/Source/Charts/Renderers/AxisRendererBase.swift",
    "chars": 6925,
    "preview": "//\n//  AxisRendererBase.swift\n//  Charts\n//\n//  Copyright 2015 Daniel Cohen Gindi & Philipp Jahoda\n//  A port of MPAndro"
  },
  {
    "path": "Pods/Charts/Source/Charts/Renderers/BarChartRenderer.swift",
    "chars": 26059,
    "preview": "//\n//  BarChartRenderer.swift\n//  Charts\n//\n//  Copyright 2015 Daniel Cohen Gindi & Philipp Jahoda\n//  A port of MPAndro"
  },
  {
    "path": "Pods/Charts/Source/Charts/Renderers/BarLineScatterCandleBubbleRenderer.swift",
    "chars": 3418,
    "preview": "//\n//  BarLineScatterCandleBubbleRenderer.swift\n//  Charts\n//\n//  Copyright 2015 Daniel Cohen Gindi & Philipp Jahoda\n// "
  },
  {
    "path": "Pods/Charts/Source/Charts/Renderers/BubbleChartRenderer.swift",
    "chars": 10234,
    "preview": "//\n//  BubbleChartRenderer.swift\n//  Charts\n//\n//  Bubble chart implementation:\n//    Copyright 2015 Pierre-Marc Airoldi"
  },
  {
    "path": "Pods/Charts/Source/Charts/Renderers/CandleStickChartRenderer.swift",
    "chars": 13938,
    "preview": "//\n//  CandleStickChartRenderer.swift\n//  Charts\n//\n//  Copyright 2015 Daniel Cohen Gindi & Philipp Jahoda\n//  A port of"
  },
  {
    "path": "Pods/Charts/Source/Charts/Renderers/ChartDataRendererBase.swift",
    "chars": 1757,
    "preview": "//\n//  DataRenderer.swift\n//  Charts\n//\n//  Copyright 2015 Daniel Cohen Gindi & Philipp Jahoda\n//  A port of MPAndroidCh"
  },
  {
    "path": "Pods/Charts/Source/Charts/Renderers/CombinedChartRenderer.swift",
    "chars": 6239,
    "preview": "//\n//  CombinedChartRenderer.swift\n//  Charts\n//\n//  Copyright 2015 Daniel Cohen Gindi & Philipp Jahoda\n//  A port of MP"
  },
  {
    "path": "Pods/Charts/Source/Charts/Renderers/HorizontalBarChartRenderer.swift",
    "chars": 24712,
    "preview": "//\n//  HorizontalBarChartRenderer.swift\n//  Charts\n//\n//  Copyright 2015 Daniel Cohen Gindi & Philipp Jahoda\n//  A port "
  },
  {
    "path": "Pods/Charts/Source/Charts/Renderers/LegendRenderer.swift",
    "chars": 20318,
    "preview": "//\n//  LegendRenderer.swift\n//  Charts\n//\n//  Copyright 2015 Daniel Cohen Gindi & Philipp Jahoda\n//  A port of MPAndroid"
  },
  {
    "path": "Pods/Charts/Source/Charts/Renderers/LineChartRenderer.swift",
    "chars": 27101,
    "preview": "//\n//  LineChartRenderer.swift\n//  Charts\n//\n//  Copyright 2015 Daniel Cohen Gindi & Philipp Jahoda\n//  A port of MPAndr"
  },
  {
    "path": "Pods/Charts/Source/Charts/Renderers/LineRadarRenderer.swift",
    "chars": 1550,
    "preview": "//\n//  LineRadarRenderer.swift\n//  Charts\n//\n//  Copyright 2015 Daniel Cohen Gindi & Philipp Jahoda\n//  A port of MPAndr"
  },
  {
    "path": "Pods/Charts/Source/Charts/Renderers/LineScatterCandleRadarRenderer.swift",
    "chars": 1574,
    "preview": "//\n//  LineScatterCandleRadarRenderer.swift\n//  Charts\n//\n//  Copyright 2015 Daniel Cohen Gindi & Philipp Jahoda\n//  A p"
  },
  {
    "path": "Pods/Charts/Source/Charts/Renderers/PieChartRenderer.swift",
    "chars": 34575,
    "preview": "//\n//  PieChartRenderer.swift\n//  Charts\n//\n//  Copyright 2015 Daniel Cohen Gindi & Philipp Jahoda\n//  A port of MPAndro"
  },
  {
    "path": "Pods/Charts/Source/Charts/Renderers/RadarChartRenderer.swift",
    "chars": 13849,
    "preview": "//\n//  RadarChartRenderer.swift\n//  Charts\n//\n//  Copyright 2015 Daniel Cohen Gindi & Philipp Jahoda\n//  A port of MPAnd"
  },
  {
    "path": "Pods/Charts/Source/Charts/Renderers/Renderer.swift",
    "chars": 582,
    "preview": "//\n//  Renderer.swift\n//  Charts\n//\n//  Copyright 2015 Daniel Cohen Gindi & Philipp Jahoda\n//  A port of MPAndroidChart "
  },
  {
    "path": "Pods/Charts/Source/Charts/Renderers/Scatter/ChevronDownShapeRenderer.swift",
    "chars": 1112,
    "preview": "//\n//  ChevronDownShapeRenderer.swift\n//  Charts\n//\n//  Copyright 2015 Daniel Cohen Gindi & Philipp Jahoda\n//  A port of"
  },
  {
    "path": "Pods/Charts/Source/Charts/Renderers/Scatter/ChevronUpShapeRenderer.swift",
    "chars": 1108,
    "preview": "//\n//  ChevronUpShapeRenderer.swift\n//  Charts\n//\n//  Copyright 2015 Daniel Cohen Gindi & Philipp Jahoda\n//  A port of M"
  },
  {
    "path": "Pods/Charts/Source/Charts/Renderers/Scatter/CircleShapeRenderer.swift",
    "chars": 2172,
    "preview": "//\n//  CircleShapeRenderer.swift\n//  Charts\n//\n//  Copyright 2015 Daniel Cohen Gindi & Philipp Jahoda\n//  A port of MPAn"
  },
  {
    "path": "Pods/Charts/Source/Charts/Renderers/Scatter/CrossShapeRenderer.swift",
    "chars": 1052,
    "preview": "//\n//  CrossShapeRenderer.swift\n//  Charts\n//\n//  Copyright 2015 Daniel Cohen Gindi & Philipp Jahoda\n//  A port of MPAnd"
  },
  {
    "path": "Pods/Charts/Source/Charts/Renderers/Scatter/IShapeRenderer.swift",
    "chars": 900,
    "preview": "//\n//  IShapeRenderer.swift\n//  Charts\n//\n//  Copyright 2015 Daniel Cohen Gindi & Philipp Jahoda\n//  A port of MPAndroid"
  },
  {
    "path": "Pods/Charts/Source/Charts/Renderers/Scatter/SquareShapeRenderer.swift",
    "chars": 2139,
    "preview": "//\n//  SquareShapeRenderer.swift\n//  Charts\n//\n//  Copyright 2015 Daniel Cohen Gindi & Philipp Jahoda\n//  A port of MPAn"
  },
  {
    "path": "Pods/Charts/Source/Charts/Renderers/Scatter/TriangleShapeRenderer.swift",
    "chars": 2553,
    "preview": "//\n//  TriangleShapeRenderer.swift\n//  Charts\n//\n//  Copyright 2015 Daniel Cohen Gindi & Philipp Jahoda\n//  A port of MP"
  },
  {
    "path": "Pods/Charts/Source/Charts/Renderers/Scatter/XShapeRenderer.swift",
    "chars": 1092,
    "preview": "//\n//  XShapeRenderer.swift\n//  Charts\n//\n//  Copyright 2015 Daniel Cohen Gindi & Philipp Jahoda\n//  A port of MPAndroid"
  },
  {
    "path": "Pods/Charts/Source/Charts/Renderers/ScatterChartRenderer.swift",
    "chars": 8389,
    "preview": "//\n//  ScatterChartRenderer.swift\n//  Charts\n//\n//  Copyright 2015 Daniel Cohen Gindi & Philipp Jahoda\n//  A port of MPA"
  },
  {
    "path": "Pods/Charts/Source/Charts/Renderers/XAxisRenderer.swift",
    "chars": 16399,
    "preview": "//\n//  XAxisRenderer.swift\n//  Charts\n//\n//  Copyright 2015 Daniel Cohen Gindi & Philipp Jahoda\n//  A port of MPAndroidC"
  },
  {
    "path": "Pods/Charts/Source/Charts/Renderers/XAxisRendererHorizontalBarChart.swift",
    "chars": 12768,
    "preview": "//\n//  XAxisRendererHorizontalBarChart.swift\n//  Charts\n//\n//  Copyright 2015 Daniel Cohen Gindi & Philipp Jahoda\n//  A "
  },
  {
    "path": "Pods/Charts/Source/Charts/Renderers/XAxisRendererRadarChart.swift",
    "chars": 2940,
    "preview": "//\n//  XAxisRendererRadarChart.swift\n//  Charts\n//\n//  Copyright 2015 Daniel Cohen Gindi & Philipp Jahoda\n//  A port of "
  },
  {
    "path": "Pods/Charts/Source/Charts/Renderers/YAxisRenderer.swift",
    "chars": 12749,
    "preview": "//\n//  YAxisRenderer.swift\n//  Charts\n//\n//  Copyright 2015 Daniel Cohen Gindi & Philipp Jahoda\n//  A port of MPAndroidC"
  },
  {
    "path": "Pods/Charts/Source/Charts/Renderers/YAxisRendererHorizontalBarChart.swift",
    "chars": 12326,
    "preview": "//\n//  YAxisRendererHorizontalBarChart.swift\n//  Charts\n//\n//  Copyright 2015 Daniel Cohen Gindi & Philipp Jahoda\n//  A "
  },
  {
    "path": "Pods/Charts/Source/Charts/Renderers/YAxisRendererRadarChart.swift",
    "chars": 8080,
    "preview": "//\n//  YAxisRendererRadarChart.swift\n//  Charts\n//\n//  Copyright 2015 Daniel Cohen Gindi & Philipp Jahoda\n//  A port of "
  },
  {
    "path": "Pods/Charts/Source/Charts/Utils/ChartColorTemplates.swift",
    "chars": 7927,
    "preview": "//\n//  ChartColorTemplates.swift\n//  Charts\n//\n//  Copyright 2015 Daniel Cohen Gindi & Philipp Jahoda\n//  A port of MPAn"
  },
  {
    "path": "Pods/Charts/Source/Charts/Utils/ChartUtils.swift",
    "chars": 9282,
    "preview": "//\n//  Utils.swift\n//  Charts\n//\n//  Copyright 2015 Daniel Cohen Gindi & Philipp Jahoda\n//  A port of MPAndroidChart for"
  },
  {
    "path": "Pods/Charts/Source/Charts/Utils/Fill.swift",
    "chars": 8430,
    "preview": "//\n//  Fill.swift\n//  Charts\n//\n//  Copyright 2015 Daniel Cohen Gindi & Philipp Jahoda\n//  A port of MPAndroidChart for "
  },
  {
    "path": "Pods/Charts/Source/Charts/Utils/Platform.swift",
    "chars": 16267,
    "preview": "import Foundation\n\n/** This file provides a thin abstraction layer atop of UIKit (iOS, tvOS) and Cocoa (OS X). The two A"
  },
  {
    "path": "Pods/Charts/Source/Charts/Utils/Transformer.swift",
    "chars": 5872,
    "preview": "//\n//  Transformer.swift\n//  Charts\n//\n//  Copyright 2015 Daniel Cohen Gindi & Philipp Jahoda\n//  A port of MPAndroidCha"
  },
  {
    "path": "Pods/Charts/Source/Charts/Utils/TransformerHorizontalBarChart.swift",
    "chars": 999,
    "preview": "//\n//  TransformerHorizontalBarChart.swift\n//  Charts\n//\n//  Copyright 2015 Daniel Cohen Gindi & Philipp Jahoda\n//  A po"
  },
  {
    "path": "Pods/Charts/Source/Charts/Utils/ViewPortHandler.swift",
    "chars": 15832,
    "preview": "//\n//  ViewPortHandler.swift\n//  Charts\n//\n//  Copyright 2015 Daniel Cohen Gindi & Philipp Jahoda\n//  A port of MPAndroi"
  },
  {
    "path": "Pods/Pods.xcodeproj/project.pbxproj",
    "chars": 107057,
    "preview": "// !$*UTF8*$!\n{\n\tarchiveVersion = 1;\n\tclasses = {\n\t};\n\tobjectVersion = 51;\n\tobjects = {\n\n/* Begin PBXBuildFile section *"
  },
  {
    "path": "Pods/Pods.xcodeproj/xcuserdata/macbook.xcuserdatad/xcschemes/Charts.xcscheme",
    "chars": 2021,
    "preview": "<?xml version=\"1.0\" encoding=\"UTF-8\"?>\n<Scheme\n   LastUpgradeVersion = \"1240\"\n   version = \"1.3\">\n   <BuildAction\n      "
  },
  {
    "path": "Pods/Pods.xcodeproj/xcuserdata/macbook.xcuserdatad/xcschemes/Pods-ChartsUnderstandAndUsage.xcscheme",
    "chars": 2067,
    "preview": "<?xml version=\"1.0\" encoding=\"UTF-8\"?>\n<Scheme\n   LastUpgradeVersion = \"1240\"\n   version = \"1.3\">\n   <BuildAction\n      "
  },
  {
    "path": "Pods/Pods.xcodeproj/xcuserdata/macbook.xcuserdatad/xcschemes/xcschememanagement.plist",
    "chars": 567,
    "preview": "<?xml version=\"1.0\" encoding=\"UTF-8\"?>\n<!DOCTYPE plist PUBLIC \"-//Apple//DTD PLIST 1.0//EN\" \"http://www.apple.com/DTDs/P"
  },
  {
    "path": "Pods/Pods.xcodeproj/xcuserdata/zhanghaifeng.xcuserdatad/xcschemes/Charts.xcscheme",
    "chars": 2090,
    "preview": "<?xml version=\"1.0\" encoding=\"UTF-8\"?>\n<Scheme\n   LastUpgradeVersion = \"0930\"\n   version = \"1.3\">\n   <BuildAction\n      "
  },
  {
    "path": "Pods/Pods.xcodeproj/xcuserdata/zhanghaifeng.xcuserdatad/xcschemes/Pods-ChartsUnderstandAndUsage.xcscheme",
    "chars": 2585,
    "preview": "<?xml version=\"1.0\" encoding=\"UTF-8\"?>\n<Scheme\n   LastUpgradeVersion = \"0930\"\n   version = \"1.3\">\n   <BuildAction\n      "
  },
  {
    "path": "Pods/Pods.xcodeproj/xcuserdata/zhanghaifeng.xcuserdatad/xcschemes/xcschememanagement.plist",
    "chars": 567,
    "preview": "<?xml version=\"1.0\" encoding=\"UTF-8\"?>\n<!DOCTYPE plist PUBLIC \"-//Apple//DTD PLIST 1.0//EN\" \"http://www.apple.com/DTDs/P"
  },
  {
    "path": "Pods/Target Support Files/Charts/Charts-dummy.m",
    "chars": 116,
    "preview": "#import <Foundation/Foundation.h>\n@interface PodsDummy_Charts : NSObject\n@end\n@implementation PodsDummy_Charts\n@end\n"
  },
  {
    "path": "Pods/Target Support Files/Charts/Charts-prefix.pch",
    "chars": 195,
    "preview": "#ifdef __OBJC__\n#import <UIKit/UIKit.h>\n#else\n#ifndef FOUNDATION_EXPORT\n#if defined(__cplusplus)\n#define FOUNDATION_EXPO"
  },
  {
    "path": "Pods/Target Support Files/Charts/Charts-umbrella.h",
    "chars": 304,
    "preview": "#ifdef __OBJC__\n#import <UIKit/UIKit.h>\n#else\n#ifndef FOUNDATION_EXPORT\n#if defined(__cplusplus)\n#define FOUNDATION_EXPO"
  },
  {
    "path": "Pods/Target Support Files/Charts/Charts.debug.xcconfig",
    "chars": 638,
    "preview": "CLANG_WARN_QUOTED_INCLUDE_IN_FRAMEWORK_HEADER = NO\nCONFIGURATION_BUILD_DIR = ${PODS_CONFIGURATION_BUILD_DIR}/Charts\nGCC_"
  },
  {
    "path": "Pods/Target Support Files/Charts/Charts.modulemap",
    "chars": 102,
    "preview": "framework module Charts {\n  umbrella header \"Charts-umbrella.h\"\n\n  export *\n  module * { export * }\n}\n"
  },
  {
    "path": "Pods/Target Support Files/Charts/Charts.release.xcconfig",
    "chars": 638,
    "preview": "CLANG_WARN_QUOTED_INCLUDE_IN_FRAMEWORK_HEADER = NO\nCONFIGURATION_BUILD_DIR = ${PODS_CONFIGURATION_BUILD_DIR}/Charts\nGCC_"
  }
]

// ... and 21 more files (download for full content)
About this extraction
This page contains the full source code of the FighterLightning/ChartsUnderstandAndUsage GitHub repository, extracted and formatted as plain text for AI agents and large language models (LLMs). The extraction includes 221 files (1.1 MB), approximately 291.8k tokens. Use this with OpenClaw, Claude, ChatGPT, Cursor, Windsurf, or any other AI tool that accepts text input. You can copy the full output to your clipboard or download it as a .txt file.
Extracted by GitExtract — free GitHub repo to text converter for AI. Built by Nikandr Surkov.