[
{
"path": ".gitattributes",
"content": "*.css linguist-language=go\n*.less linguist-language=go\n*.js linguist-language=go\n*.tsx linguist-language=go\n*.html linguist-language=go\n"
},
{
"path": ".github/ISSUE_TEMPLATE/config.yml",
"content": "blank_issues_enabled: false\ncontact_links:\n - name: Nightingale docs\n url: https://n9e.github.io/\n about: You may want to read through the document before asking questions."
},
{
"path": ".github/ISSUE_TEMPLATE/enhancement.md",
"content": "---\nname: Enhancement Request\nabout: Suggest an enhancement to the nightingale project\nlabels: kind/feature\n\n---\n\n\n**What would you like to be added**:\n\n**Why is this needed**:"
},
{
"path": ".github/ISSUE_TEMPLATE/question.yml",
"content": "name: Bug Report & Usage Question\ndescription: Reporting a bug or asking a question about how to use Nightingale \nlabels: []\n\nbody:\n - type: markdown\n attributes:\n value: |\n The more detailed the form is filled in, the easier the problem will be solved.\n 提供的信息越详细,问题解决的可能性就越大。另外, 提问之前请先搜索历史 issue (包括 close 的), 以免重复提问。\n - type: textarea\n id: question\n attributes:\n label: Question and Steps to reproduce\n description: Describe your question and steps to reproduce the bug. 描述问题以及复现步骤\n validations:\n required: true\n - type: textarea\n id: logs\n attributes:\n label: Relevant logs and configurations\n description: Relevant logs and configurations. 报错日志([查看方法](https://flashcat.cloud/docs/content/flashcat-monitor/nightingale-v6/faq/how-to-check-logs/))以及各个相关组件的配置信息\n render: text\n validations:\n required: true\n - type: textarea\n id: system-info\n attributes:\n label: Version\n description: Include nightingale version, operating system, and other relevant details. 请告知夜莺的版本、操作系统的版本、CPU架构等信息\n validations:\n required: true\n \n"
},
{
"path": ".github/PULL_REQUEST_TEMPLATE.md",
"content": "**What type of PR is this?**\n\n**What this PR does / why we need it**:\n\n\n**Which issue(s) this PR fixes**:\n\nFixes #\n \n**Special notes for your reviewer**:"
},
{
"path": ".github/workflows/issue-translator.yml",
"content": "name: 'Issue Translator'\n\non:\n issues:\n types: [opened]\n\njobs:\n translate:\n runs-on: ubuntu-latest\n permissions:\n issues: write\n contents: read\n steps:\n - name: Translate Issues\n uses: usthe/issues-translate-action@v2.7\n with:\n # 是否翻译 issue 标题\n IS_MODIFY_TITLE: true\n # GitHub Token\n BOT_GITHUB_TOKEN: ${{ secrets.GITHUB_TOKEN }}\n # 自定义翻译标注(可选)\n # CUSTOM_BOT_NOTE: \"Translation by bot\"\n"
},
{
"path": ".github/workflows/n9e.yml",
"content": "name: Release\n\non:\n push:\n tags:\n - 'v*'\nenv:\n GO_VERSION: 1.23\n\njobs:\n goreleaser:\n runs-on: ubuntu-latest\n steps:\n - name: Checkout Source Code\n uses: actions/checkout@v3\n with:\n fetch-depth: 0\n - name: Setup Go Environment\n uses: actions/setup-go@v3\n with:\n go-version: ${{ env.GO_VERSION }}\n - uses: docker/login-action@v2\n with:\n username: ${{ secrets.DOCKERHUB_USERNAME }}\n password: ${{ secrets.DOCKERHUB_TOKEN }}\n - name: Run GoReleaser\n uses: goreleaser/goreleaser-action@v3\n with:\n distribution: goreleaser\n version: '~> v1'\n args: release --rm-dist\n env:\n GITHUB_TOKEN: ${{ secrets.GITHUB_TOKEN }}\n"
},
{
"path": ".gitignore",
"content": "*.exe\n*.exe~\n*.dll\n*.dylib\n*.test\n*.out\n*.prof\n*.log\n*.o\n*.a\n*.so\n*.db\n*.sw[po]\n*.tar.gz\n*.[568vq]\n[568vq].out\n\n*.cgo1.go\n*.cgo2.c\n_cgo_defun.c\n_cgo_gotypes.go\n_cgo_export.*\n_testmain.go\n_obj\n_test\n\n/log*\n/bin\n/out\n/build\n/dist\n/etc/*.local.yml\n/etc/*.local.conf\n/etc/rsa/*\n/etc/plugins/*.local.yml\n/etc/script/rules.yaml\n/etc/script/alert-rules.json\n/etc/script/record-rules.json\n/data*\n/tarball\n/run\n/vendor\n/tmp\n/pub\n/n9e\n/docker/pub\n/docker/n9e\n/docker/compose-bridge/mysqldata\n/docker/compose-host-network/mysqldata\n/docker/compose-host-network-metric-log/mysqldata\n/docker/compose-host-network-metric-log/n9e-logs\n/docker/compose-postgres/pgdata\n/etc.local*\n/front/statik/statik.go\n/docker/compose-bridge/etc-nightingale/rsa/\n\n.alerts\n.idea\n.index\n.vscode\n.issue\n.issue/*\n.cursor\n.claude\n.DS_Store\n.cache-loader\n.payload\nqueries.active\n\n/n9e-*\nn9e.sql\n\n!/datasource\n\n.env.json"
},
{
"path": ".goreleaser.yaml",
"content": "before:\n hooks:\n # You may remove this if you don't use go modules.\n - go mod tidy\n - go install github.com/rakyll/statik\n\nsnapshot:\n name_template: '{{ .Tag }}'\nchecksum:\n name_template: 'checksums.txt'\nchangelog:\n skip: true\n\nbuilds:\n - id: build\n hooks:\n pre:\n - cmd: sh -x ./fe.sh\n output: true\n main: ./cmd/center/\n binary: n9e\n env:\n - CGO_ENABLED=0\n goos:\n - linux\n goarch:\n - amd64\n - arm64\n ldflags:\n - -s -w\n - -X github.com/ccfos/nightingale/v6/pkg/version.Version={{ .Tag }}-{{.Commit}}\n - id: build-cli\n main: ./cmd/cli/\n binary: n9e-cli\n env:\n - CGO_ENABLED=0\n goos:\n - linux\n goarch:\n - amd64\n - arm64\n ldflags:\n - -s -w\n - -X github.com/ccfos/nightingale/v6/pkg/version.Version={{ .Tag }}-{{.Commit}}\n - id: build-edge\n main: ./cmd/edge/\n binary: n9e-edge\n env:\n - CGO_ENABLED=0\n goos:\n - linux\n goarch:\n - amd64\n - arm64\n ldflags:\n - -s -w\n - -X github.com/ccfos/nightingale/v6/pkg/version.Version={{ .Tag }}-{{.Commit}}\n\narchives:\n - id: n9e\n builds:\n - build\n - build-cli\n - build-edge\n format: tar.gz\n format_overrides:\n - goos: windows\n format: zip\n name_template: \"n9e-v{{ .Version }}-{{ .Os }}-{{ .Arch }}\"\n wrap_in_directory: false\n files:\n - docker/*\n - etc/*\n - integrations/*\n - cli/*\n - n9e.sql\n\nrelease:\n github:\n owner: ccfos\n name: nightingale\n name_template: \"v{{ .Version }}\"\n\ndockers:\n - image_templates:\n - flashcatcloud/nightingale:{{ .Version }}-amd64\n goos: linux\n goarch: amd64\n ids:\n - build\n dockerfile: docker/Dockerfile.goreleaser\n extra_files:\n - etc\n - integrations\n use: buildx\n build_flag_templates:\n - \"--platform=linux/amd64\"\n - image_templates:\n - flashcatcloud/nightingale:{{ .Version }}-arm64v8\n goos: linux\n goarch: arm64\n ids:\n - build\n dockerfile: docker/Dockerfile.goreleaser.arm64\n extra_files:\n - etc\n - integrations\n use: buildx\n build_flag_templates:\n - \"--platform=linux/arm64/v8\"\n\ndocker_manifests:\n\n - name_template: flashcatcloud/nightingale:{{ .Version }}\n image_templates:\n - flashcatcloud/nightingale:{{ .Version }}-amd64\n - flashcatcloud/nightingale:{{ .Version }}-arm64v8\n\n - name_template: flashcatcloud/nightingale:latest\n image_templates:\n - flashcatcloud/nightingale:{{ .Version }}-amd64\n - flashcatcloud/nightingale:{{ .Version }}-arm64v8\n"
},
{
"path": ".typos.toml",
"content": "# Configuration for typos tool\n[files]\nextend-exclude = [\n # Ignore auto-generated easyjson files\n \"*_easyjson.go\",\n # Ignore binary files\n \"*.gz\",\n \"*.tar\",\n \"n9e\",\n \"n9e-*\"\n]\n\n[default.extend-identifiers]\n# Didi is a company name (DiDi), not a typo\nDidi = \"Didi\"\n# datas is intentionally used as plural of data (slice variable)\ndatas = \"datas\"\n# pendings is intentionally used as plural\npendings = \"pendings\"\npendingsUseByRecover = \"pendingsUseByRecover\"\npendingsUseByRecoverMap = \"pendingsUseByRecoverMap\"\n# typs is intentionally used as shorthand for types (parameter name)\ntyps = \"typs\"\n\n[default.extend-words]\n# Some false positives\nba = \"ba\"\n# Specific corrections for ambiguous typos\ncontigious = \"contiguous\"\nonw = \"own\"\ncomponet = \"component\"\nPatten = \"Pattern\"\nRequets = \"Requests\"\nMis = \"Miss\"\nexporer = \"exporter\"\nsoruce = \"source\"\nverison = \"version\"\nConfigations = \"Configurations\"\nemmited = \"emitted\"\nUtlization = \"Utilization\"\nserie = \"series\"\n"
},
{
"path": "LICENSE",
"content": " Apache License\n Version 2.0, January 2004\n http://www.apache.org/licenses/\n\n TERMS AND CONDITIONS FOR USE, REPRODUCTION, AND DISTRIBUTION\n\n 1. Definitions.\n\n \"License\" shall mean the terms and conditions for use, reproduction,\n and distribution as defined by Sections 1 through 9 of this document.\n\n \"Licensor\" shall mean the copyright owner or entity authorized by\n the copyright owner that is granting the License.\n\n \"Legal Entity\" shall mean the union of the acting entity and all\n other entities that control, are controlled by, or are under common\n control with that entity. For the purposes of this definition,\n \"control\" means (i) the power, direct or indirect, to cause the\n direction or management of such entity, whether by contract or\n otherwise, or (ii) ownership of fifty percent (50%) or more of the\n outstanding shares, or (iii) beneficial ownership of such entity.\n\n \"You\" (or \"Your\") shall mean an individual or Legal Entity\n exercising permissions granted by this License.\n\n \"Source\" form shall mean the preferred form for making modifications,\n including but not limited to software source code, documentation\n source, and configuration files.\n\n \"Object\" form shall mean any form resulting from mechanical\n transformation or translation of a Source form, including but\n not limited to compiled object code, generated documentation,\n and conversions to other media types.\n\n \"Work\" shall mean the work of authorship, whether in Source or\n Object form, made available under the License, as indicated by a\n copyright notice that is included in or attached to the work\n (an example is provided in the Appendix below).\n\n \"Derivative Works\" shall mean any work, whether in Source or Object\n form, that is based on (or derived from) the Work and for which the\n editorial revisions, annotations, elaborations, or other modifications\n represent, as a whole, an original work of authorship. For the purposes\n of this License, Derivative Works shall not include works that remain\n separable from, or merely link (or bind by name) to the interfaces of,\n the Work and Derivative Works thereof.\n\n \"Contribution\" shall mean any work of authorship, including\n the original version of the Work and any modifications or additions\n to that Work or Derivative Works thereof, that is intentionally\n submitted to Licensor for inclusion in the Work by the copyright owner\n or by an individual or Legal Entity authorized to submit on behalf of\n the copyright owner. For the purposes of this definition, \"submitted\"\n means any form of electronic, verbal, or written communication sent\n to the Licensor or its representatives, including but not limited to\n communication on electronic mailing lists, source code control systems,\n and issue tracking systems that are managed by, or on behalf of, the\n Licensor for the purpose of discussing and improving the Work, but\n excluding communication that is conspicuously marked or otherwise\n designated in writing by the copyright owner as \"Not a Contribution.\"\n\n \"Contributor\" shall mean Licensor and any individual or Legal Entity\n on behalf of whom a Contribution has been received by Licensor and\n subsequently incorporated within the Work.\n\n 2. Grant of Copyright License. Subject to the terms and conditions of\n this License, each Contributor hereby grants to You a perpetual,\n worldwide, non-exclusive, no-charge, royalty-free, irrevocable\n copyright license to reproduce, prepare Derivative Works of,\n publicly display, publicly perform, sublicense, and distribute the\n Work and such Derivative Works in Source or Object form.\n\n 3. Grant of Patent License. Subject to the terms and conditions of\n this License, each Contributor hereby grants to You a perpetual,\n worldwide, non-exclusive, no-charge, royalty-free, irrevocable\n (except as stated in this section) patent license to make, have made,\n use, offer to sell, sell, import, and otherwise transfer the Work,\n where such license applies only to those patent claims licensable\n by such Contributor that are necessarily infringed by their\n Contribution(s) alone or by combination of their Contribution(s)\n with the Work to which such Contribution(s) was submitted. If You\n institute patent litigation against any entity (including a\n cross-claim or counterclaim in a lawsuit) alleging that the Work\n or a Contribution incorporated within the Work constitutes direct\n or contributory patent infringement, then any patent licenses\n granted to You under this License for that Work shall terminate\n as of the date such litigation is filed.\n\n 4. Redistribution. You may reproduce and distribute copies of the\n Work or Derivative Works thereof in any medium, with or without\n modifications, and in Source or Object form, provided that You\n meet the following conditions:\n\n (a) You must give any other recipients of the Work or\n Derivative Works a copy of this License; and\n\n (b) You must cause any modified files to carry prominent notices\n stating that You changed the files; and\n\n (c) You must retain, in the Source form of any Derivative Works\n that You distribute, all copyright, patent, trademark, and\n attribution notices from the Source form of the Work,\n excluding those notices that do not pertain to any part of\n the Derivative Works; and\n\n (d) If the Work includes a \"NOTICE\" text file as part of its\n distribution, then any Derivative Works that You distribute must\n include a readable copy of the attribution notices contained\n within such NOTICE file, excluding those notices that do not\n pertain to any part of the Derivative Works, in at least one\n of the following places: within a NOTICE text file distributed\n as part of the Derivative Works; within the Source form or\n documentation, if provided along with the Derivative Works; or,\n within a display generated by the Derivative Works, if and\n wherever such third-party notices normally appear. The contents\n of the NOTICE file are for informational purposes only and\n do not modify the License. You may add Your own attribution\n notices within Derivative Works that You distribute, alongside\n or as an addendum to the NOTICE text from the Work, provided\n that such additional attribution notices cannot be construed\n as modifying the License.\n\n You may add Your own copyright statement to Your modifications and\n may provide additional or different license terms and conditions\n for use, reproduction, or distribution of Your modifications, or\n for any such Derivative Works as a whole, provided Your use,\n reproduction, and distribution of the Work otherwise complies with\n the conditions stated in this License.\n\n 5. Submission of Contributions. Unless You explicitly state otherwise,\n any Contribution intentionally submitted for inclusion in the Work\n by You to the Licensor shall be under the terms and conditions of\n this License, without any additional terms or conditions.\n Notwithstanding the above, nothing herein shall supersede or modify\n the terms of any separate license agreement you may have executed\n with Licensor regarding such Contributions.\n\n 6. Trademarks. This License does not grant permission to use the trade\n names, trademarks, service marks, or product names of the Licensor,\n except as required for reasonable and customary use in describing the\n origin of the Work and reproducing the content of the NOTICE file.\n\n 7. Disclaimer of Warranty. Unless required by applicable law or\n agreed to in writing, Licensor provides the Work (and each\n Contributor provides its Contributions) on an \"AS IS\" BASIS,\n WITHOUT WARRANTIES OR CONDITIONS OF ANY KIND, either express or\n implied, including, without limitation, any warranties or conditions\n of TITLE, NON-INFRINGEMENT, MERCHANTABILITY, or FITNESS FOR A\n PARTICULAR PURPOSE. You are solely responsible for determining the\n appropriateness of using or redistributing the Work and assume any\n risks associated with Your exercise of permissions under this License.\n\n 8. Limitation of Liability. In no event and under no legal theory,\n whether in tort (including negligence), contract, or otherwise,\n unless required by applicable law (such as deliberate and grossly\n negligent acts) or agreed to in writing, shall any Contributor be\n liable to You for damages, including any direct, indirect, special,\n incidental, or consequential damages of any character arising as a\n result of this License or out of the use or inability to use the\n Work (including but not limited to damages for loss of goodwill,\n work stoppage, computer failure or malfunction, or any and all\n other commercial damages or losses), even if such Contributor\n has been advised of the possibility of such damages.\n\n 9. Accepting Warranty or Additional Liability. While redistributing\n the Work or Derivative Works thereof, You may choose to offer,\n and charge a fee for, acceptance of support, warranty, indemnity,\n or other liability obligations and/or rights consistent with this\n License. However, in accepting such obligations, You may act only\n on Your own behalf and on Your sole responsibility, not on behalf\n of any other Contributor, and only if You agree to indemnify,\n defend, and hold each Contributor harmless for any liability\n incurred by, or claims asserted against, such Contributor by reason\n of your accepting any such warranty or additional liability.\n\n END OF TERMS AND CONDITIONS\n\n APPENDIX: How to apply the Apache License to your work.\n\n To apply the Apache License to your work, attach the following\n boilerplate notice, with the fields enclosed by brackets \"[]\"\n replaced with your own identifying information. (Don't include\n the brackets!) The text should be enclosed in the appropriate\n comment syntax for the file format. We also recommend that a\n file or class name and description of purpose be included on the\n same \"printed page\" as the copyright notice for easier\n identification within third-party archives.\n\n Copyright CCF ODC.\n\n Licensed under the Apache License, Version 2.0 (the \"License\");\n you may not use this file except in compliance with the License.\n You may obtain a copy of the License at\n\n http://www.apache.org/licenses/LICENSE-2.0\n\n Unless required by applicable law or agreed to in writing, software\n distributed under the License is distributed on an \"AS IS\" BASIS,\n WITHOUT WARRANTIES OR CONDITIONS OF ANY KIND, either express or implied.\n See the License for the specific language governing permissions and\n limitations under the License.\n"
},
{
"path": "Makefile",
"content": ".PHONY: prebuild build\n\nROOT:=$(shell pwd -P)\nGIT_COMMIT:=$(shell git --work-tree ${ROOT} rev-parse 'HEAD^{commit}')\n_GIT_VERSION:=$(shell git --work-tree ${ROOT} describe --tags --abbrev=14 \"${GIT_COMMIT}^{commit}\" 2>/dev/null)\nTAG=$(shell echo \"${_GIT_VERSION}\" | awk -F\"-\" '{print $$1}')\nRELEASE_VERSION:=\"$(TAG)-$(GIT_COMMIT)\"\n\nall: prebuild build\n\nprebuild:\n\techo \"begin download and embed the front-end file...\"\n\tsh fe.sh\n\techo \"front-end file download and embedding completed.\"\n\nbuild:\n\tgo build -ldflags \"-w -s -X github.com/ccfos/nightingale/v6/pkg/version.Version=$(RELEASE_VERSION)\" -o n9e ./cmd/center/main.go\n\nbuild-edge:\n\tgo build -ldflags \"-w -s -X github.com/ccfos/nightingale/v6/pkg/version.Version=$(RELEASE_VERSION)\" -o n9e-edge ./cmd/edge/\n\nbuild-alert:\n\tgo build -ldflags \"-w -s -X github.com/ccfos/nightingale/v6/pkg/version.Version=$(RELEASE_VERSION)\" -o n9e-alert ./cmd/alert/main.go\n\nbuild-pushgw:\n\tgo build -ldflags \"-w -s -X github.com/ccfos/nightingale/v6/pkg/version.Version=$(RELEASE_VERSION)\" -o n9e-pushgw ./cmd/pushgw/main.go\n\nbuild-cli: \n\tgo build -ldflags \"-w -s -X github.com/ccfos/nightingale/v6/pkg/version.Version=$(RELEASE_VERSION)\" -o n9e-cli ./cmd/cli/main.go\n\nrun:\n\tnohup ./n9e > n9e.log 2>&1 &\n\nrun-alert:\n\tnohup ./n9e-alert > n9e-alert.log 2>&1 &\n\nrun-pushgw:\n\tnohup ./n9e-pushgw > n9e-pushgw.log 2>&1 &\n\nrelease:\n\tgoreleaser --skip-validate --skip-publish --snapshot"
},
{
"path": "README.md",
"content": "\n \n \n
\n\n Open-Source Alerting Expert \n
\n\n\n\n \n\n \n\n \n\n \n
\n\n\n\n[English](./README.md) | [中文](./README_zh.md)\n\n## 🎯 What is Nightingale\n\nNightingale is an open-source monitoring project that focuses on alerting. Similar to Grafana, Nightingale also connects with various existing data sources. However, while Grafana emphasizes visualization, Nightingale places greater emphasis on the alerting engine, as well as the processing and distribution of alarms.\n\n> 💡 Nightingale has now officially launched the [MCP-Server](https://github.com/n9e/n9e-mcp-server/). This MCP Server enables AI assistants to interact with the Nightingale API using natural language, facilitating alert management, monitoring, and observability tasks.\n> \n> The Nightingale project was initially developed and open-sourced by DiDi.inc. On May 11, 2022, it was donated to the Open Source Development Committee of the China Computer Federation (CCF ODTC).\n\n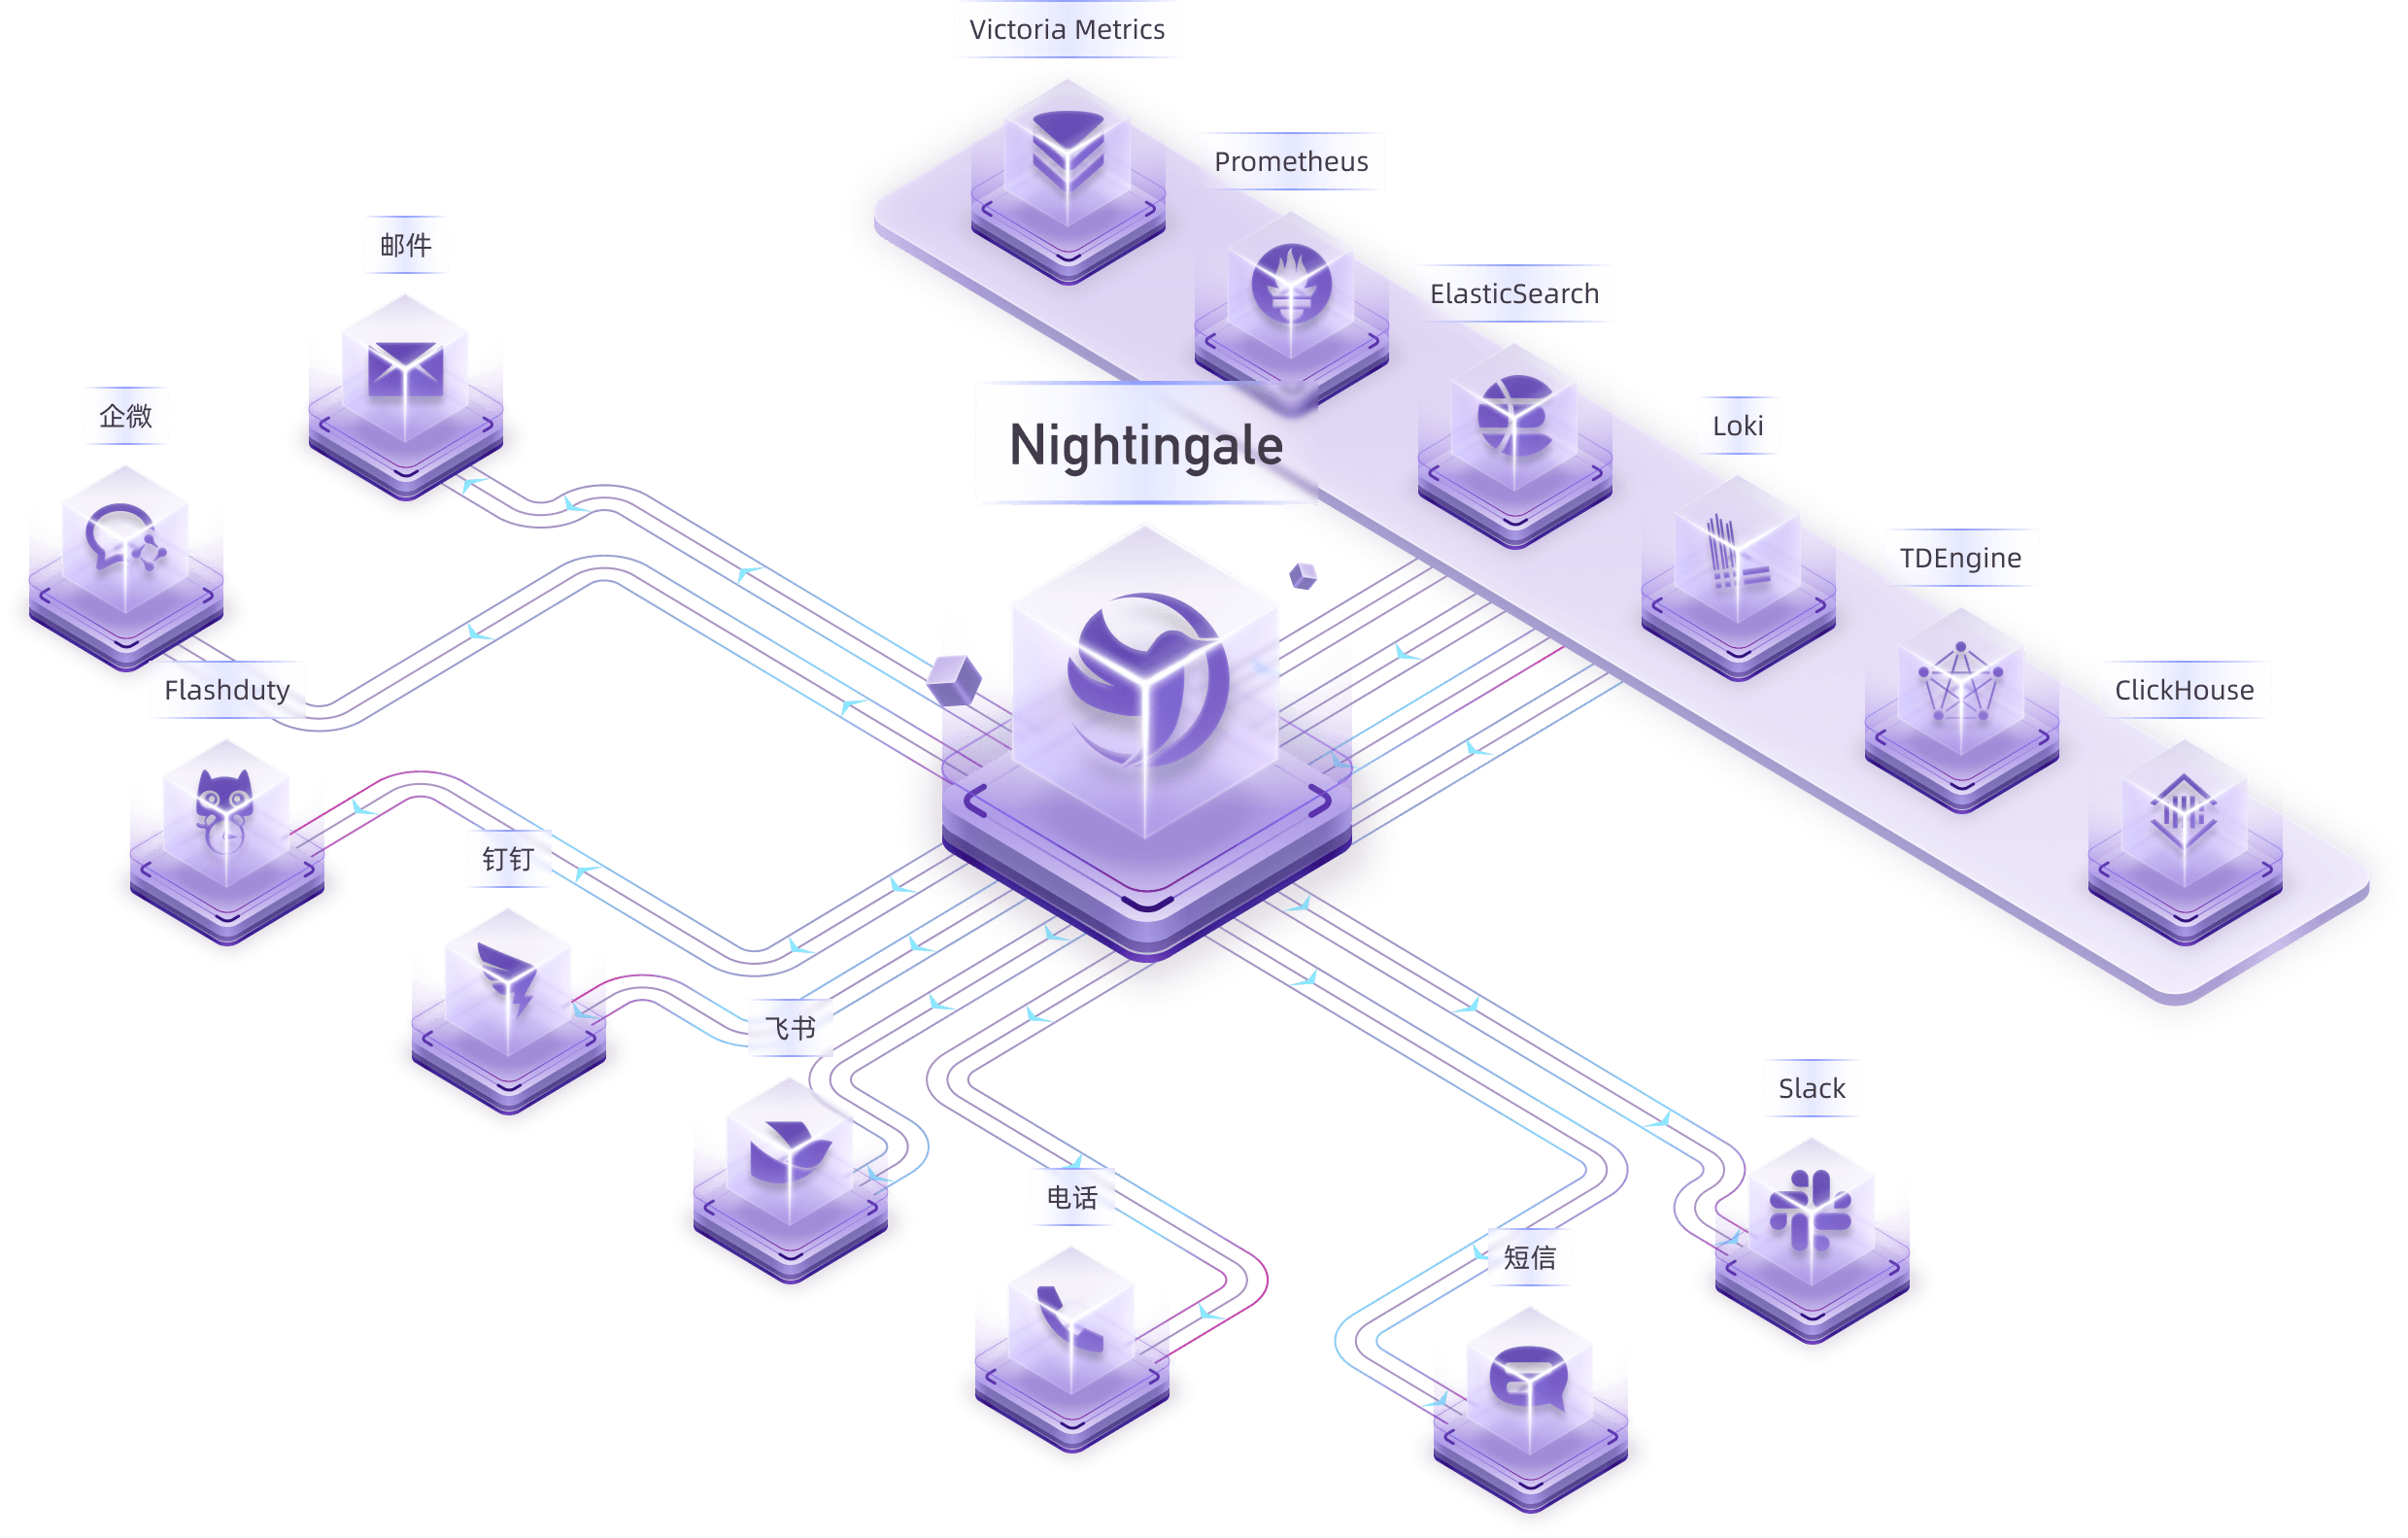\n\n## 💡 How Nightingale Works\n\nMany users have already collected metrics and log data. In this case, you can connect your storage repositories (such as VictoriaMetrics, ElasticSearch, etc.) as data sources in Nightingale. This allows you to configure alerting rules and notification rules within Nightingale, enabling the generation and distribution of alarms.\n\n\n\nNightingale itself does not provide monitoring data collection capabilities. We recommend using [Categraf](https://github.com/flashcatcloud/categraf) as the collector, which integrates seamlessly with Nightingale.\n\n[Categraf](https://github.com/flashcatcloud/categraf) can collect monitoring data from operating systems, network devices, various middleware, and databases. It pushes this data to Nightingale via the `Prometheus Remote Write` protocol. Nightingale then stores the monitoring data in a time-series database (such as Prometheus, VictoriaMetrics, etc.) and provides alerting and visualization capabilities.\n\nFor certain edge data centers with poor network connectivity to the central Nightingale server, we offer a distributed deployment mode for the alerting engine. In this mode, even if the network is disconnected, the alerting functionality remains unaffected.\n\n\n\n> In the above diagram, Data Center A has a good network with the central data center, so it uses the Nightingale process in the central data center as the alerting engine. Data Center B has a poor network with the central data center, so it deploys `n9e-edge` as the alerting engine to handle alerting for its own data sources.\n\n## 🔕 Alert Noise Reduction, Escalation, and Collaboration\n\nNightingale focuses on being an alerting engine, responsible for generating alarms and flexibly distributing them based on rules. It supports 20 built-in notification medias (such as phone calls, SMS, email, DingTalk, Slack, etc.).\n\nIf you have more advanced requirements, such as:\n- Want to consolidate events from multiple monitoring systems into one platform for unified noise reduction, response handling, and data analysis.\n- Want to support personnel scheduling, practice on-call culture, and support alert escalation (to avoid missing alerts) and collaborative handling.\n\nThen Nightingale is not suitable. It is recommended that you choose on-call products such as PagerDuty and FlashDuty. These products are simple and easy to use.\n\n## 🗨️ Communication Channels\n\n- **Report Bugs:** It is highly recommended to submit issues via the [Nightingale GitHub Issue tracker](https://github.com/ccfos/nightingale/issues/new?assignees=&labels=kind%2Fbug&projects=&template=bug_report.yml).\n- **Documentation:** For more information, we recommend thoroughly browsing the [Nightingale Documentation Site](https://n9e.github.io/).\n\n## 🔑 Key Features\n\n\n\n- Nightingale supports alerting rules, mute rules, subscription rules, and notification rules. It natively supports 20 types of notification media and allows customization of message templates. \n- It supports event pipelines for Pipeline processing of alarms, facilitating automated integration with in-house systems. For example, it can append metadata to alarms or perform relabeling on events. \n- It introduces the concept of business groups and a permission system to manage various rules in a categorized manner. \n- Many databases and middleware come with built-in alert rules that can be directly imported and used. It also supports direct import of Prometheus alerting rules. \n- It supports alerting self-healing, which automatically triggers a script to execute predefined logic after an alarm is generated—such as cleaning up disk space or capturing the current system state.\n\n\n\n- Nightingale archives historical alarms and supports multi-dimensional query and statistics. \n- It supports flexible aggregation grouping, allowing a clear view of the distribution of alarms across the company.\n\n\n\n- Nightingale has built-in metric descriptions, dashboards, and alerting rules for common operating systems, middleware, and databases, which are contributed by the community with varying quality. \n- It directly receives data via multiple protocols such as Remote Write, OpenTSDB, Datadog, and Falcon, integrates with various Agents. \n- It supports data sources like Prometheus, ElasticSearch, Loki, ClickHouse, MySQL, Postgres, allowing alerting based on data from these sources. \n- Nightingale can be easily embedded into internal enterprise systems (e.g. Grafana, CMDB), and even supports configuring menu visibility for these embedded systems.\n\n\n\n- Nightingale supports dashboard functionality, including common chart types, and comes with pre-built dashboards. The image above is a screenshot of one of these dashboards. \n- If you are already accustomed to Grafana, it is recommended to continue using Grafana for visualization, as Grafana has deeper expertise in this area. \n- For machine-related monitoring data collected by Categraf, it is advisable to use Nightingale's built-in dashboards for viewing. This is because Categraf's metric naming follows Telegraf's convention, which differs from that of Node Exporter. \n- Due to Nightingale's concept of business groups (where machines can belong to different groups), there may be scenarios where you only want to view machines within the current business group on the dashboard. Thus, Nightingale's dashboards can be linked with business groups for interactive filtering.\n\n## 🌟 Stargazers over time\n\n[](https://star-history.com/#ccfos/nightingale&Date)\n\n## 🔥 Users\n\n\n\n## 🤝 Community Co-Building\n\n- ❇️ Please read the [Nightingale Open Source Project and Community Governance Draft](./doc/community-governance.md). We sincerely welcome every user, developer, company, and organization to use Nightingale, actively report bugs, submit feature requests, share best practices, and help build a professional and active open-source community.\n- ❤️ Nightingale Contributors\n\n \n\n## 📜 License\n- [Apache License V2.0](https://github.com/ccfos/nightingale/blob/main/LICENSE)\n"
},
{
"path": "README_zh.md",
"content": "\n \n \n
\n\n 开源监控告警管理专家 \n
\n\n\n\n \n\n \n\n \n\n \n
\n\n\n\n[English](./README.md) | [中文](./README_zh.md)\n\n## 夜莺是什么\n\n夜莺 Nightingale 是一款开源云原生监控告警工具,是中国计算机学会接受捐赠并托管的第一个开源项目,在 GitHub 上有超过 12000 颗星,广受关注和使用。夜莺的统一告警引擎,可以对接 Prometheus、Elasticsearch、ClickHouse、Loki、MySQL 等多种数据源,提供全面的告警判定、丰富的事件处理和灵活的告警分发及通知能力。\n\n夜莺侧重于监控告警,类似于 Grafana 的数据源集成方式,夜莺也是对接多种既有的数据源,不过 Grafana 侧重于可视化,夜莺则是侧重于告警引擎、告警事件的处理和分发。\n\n> - 💡夜莺正式推出了 [MCP-Server](https://github.com/n9e/n9e-mcp-server/),此 MCP Server 允许 AI 助手通过自然语言与夜莺 API 交互,实现告警管理、监控和可观测性任务。\n> - 夜莺监控项目,最初由滴滴开发和开源,并于 2022 年 5 月 11 日,捐赠予中国计算机学会开源发展技术委员会(CCF ODTC),为 CCF ODTC 成立后接受捐赠的第一个开源项目。\n\n\n\n## 夜莺的工作逻辑\n\n很多用户已经自行采集了指标、日志数据,此时就把存储库(VictoriaMetrics、ElasticSearch等)作为数据源接入夜莺,即可在夜莺里配置告警规则、通知规则,完成告警事件的生成和派发。\n\n\n\n夜莺项目本身不提供监控数据采集能力。推荐您使用 [Categraf](https://github.com/flashcatcloud/categraf) 作为采集器,可以和夜莺丝滑对接。\n\n[Categraf](https://github.com/flashcatcloud/categraf) 可以采集操作系统、网络设备、各类中间件、数据库的监控数据,通过 Remote Write 协议推送给夜莺,夜莺把监控数据转存到时序库(如 Prometheus、VictoriaMetrics 等),并提供告警和可视化能力。\n\n对于个别边缘机房,如果和中心夜莺服务端网络链路不好,希望提升告警可用性,夜莺也提供边缘机房告警引擎下沉部署模式,这个模式下,即便边缘和中心端网络割裂,告警功能也不受影响。\n\n\n\n> 上图中,机房A和中心机房的网络链路很好,所以直接由中心端的夜莺进程做告警引擎,机房B和中心机房的网络链路不好,所以在机房B部署了 `n9e-edge` 做告警引擎,对机房B的数据源做告警判定。\n\n## 告警降噪、升级、协同\n\n夜莺的侧重点是做告警引擎,即负责产生告警事件,并根据规则做灵活派发,内置支持 20 种通知媒介(电话、短信、邮件、钉钉、飞书、企微、Slack 等)。\n\n如果您有更高级的需求,比如:\n\n- 想要把公司的多套监控系统产生的事件聚拢到一个平台,统一做收敛降噪、响应处理、数据分析\n- 想要支持人员的排班,践行 On-call 文化,想要支持告警认领、升级(避免遗漏)、协同处理\n\n那夜莺是不合适的,推荐您选用 [FlashDuty](https://flashcat.cloud/product/flashcat-duty/) 这样的 On-call 产品,产品简单易用,也有免费套餐。\n\n\n## 相关资料 & 交流渠道\n- 📚 [夜莺介绍PPT](https://mp.weixin.qq.com/s/Mkwx_46xrltSq8NLqAIYow) 对您了解夜莺各项关键特性会有帮助(PPT链接在文末)\n- 👉 [文档中心](https://flashcat.cloud/docs/) 为了更快的访问速度,站点托管在 [FlashcatCloud](https://flashcat.cloud)\n- ❤️ [报告 Bug](https://github.com/ccfos/nightingale/issues/new?assignees=&labels=&projects=&template=question.yml) 写清楚问题描述、复现步骤、截图等信息,更容易得到答案\n- 💡 前后端代码分离,前端代码仓库:[https://github.com/n9e/fe](https://github.com/n9e/fe)\n- 🎯 关注[这个公众号](https://gitlink.org.cn/UlricQin)了解更多夜莺动态和知识\n- 🌟 加我微信:`picobyte`(我已关闭好友验证)拉入微信群,备注:`夜莺互助群`,如果已经把夜莺上到生产环境,可联系我拉入资深监控用户群\n\n\n## 关键特性简介\n\n\n\n- 夜莺支持告警规则、屏蔽规则、订阅规则、通知规则,内置支持 20 种通知媒介,支持消息模板自定义\n- 支持事件管道,对告警事件做 Pipeline 处理,方便和自有系统做自动化整合,比如给告警事件附加一些元信息,对事件做 relabel\n- 支持业务组概念,引入权限体系,分门别类管理各类规则\n- 很多数据库、中间件内置了告警规则,可以直接导入使用,也可以直接导入 Prometheus 的告警规则\n- 支持告警自愈,即告警之后自动触发一个脚本执行一些预定义的逻辑,比如清理一下磁盘、抓一下现场等\n\n\n\n- 夜莺存档了历史告警事件,支持多维度的查询和统计\n- 支持灵活的聚合分组,一目了然看到公司的告警事件分布情况\n\n\n\n- 夜莺内置常用操作系统、中间件、数据库的的指标说明、仪表盘、告警规则,不过都是社区贡献的,整体也是参差不齐\n- 夜莺直接接收 Remote Write、OpenTSDB、Datadog、Falcon 等多种协议的数据,故而可以和各类 Agent 对接\n- 夜莺支持 Prometheus、ElasticSearch、Loki、TDEngine 等多种数据源,可以对其中的数据做告警\n- 夜莺可以很方便内嵌企业内部系统,比如 Grafana、CMDB 等,甚至可以配置这些内嵌系统的菜单可见性\n\n\n\n\n- 夜莺支持仪表盘功能,支持常见的图表类型,也内置了一些仪表盘,上图是其中一个仪表盘的截图。\n- 如果你已经习惯了 Grafana,建议仍然使用 Grafana 看图。Grafana 在看图方面道行更深。\n- 机器相关的监控数据,如果是 Categraf 采集的,建议使用夜莺自带的仪表盘查看,因为 Categraf 的指标命名 Follow 的是 Telegraf 的命名方式,和 Node Exporter 不同\n- 因为夜莺有个业务组的概念,机器可以归属不同的业务组,有时在仪表盘里只想查看当前所属业务组的机器,所以夜莺的仪表盘可以和业务组联动\n\n## 广受关注\n[](https://star-history.com/#ccfos/nightingale&Date)\n\n## 感谢众多企业的信赖\n\n\n\n## 社区共建\n- ❇️ 请阅读浏览[夜莺开源项目和社区治理架构草案](./doc/community-governance.md),真诚欢迎每一位用户、开发者、公司以及组织,使用夜莺监控、积极反馈 Bug、提交功能需求、分享最佳实践,共建专业、活跃的夜莺开源社区。\n- ❤️ 夜莺贡献者\n\n \n\n## License\n- [Apache License V2.0](https://github.com/ccfos/nightingale/blob/main/LICENSE)\n"
},
{
"path": "alert/aconf/conf.go",
"content": "package aconf\n\nimport (\n\t\"path\"\n)\n\ntype Alert struct {\n\tDisable bool\n\tEngineDelay int64\n\tHeartbeat HeartbeatConfig\n\tAlerting Alerting\n}\n\ntype SMTPConfig struct {\n\tHost string\n\tPort int\n\tUser string\n\tPass string\n\tFrom string\n\tInsecureSkipVerify bool\n\tBatch int\n}\n\ntype HeartbeatConfig struct {\n\tIP string\n\tInterval int64\n\tEndpoint string\n\tEngineName string\n}\n\ntype Alerting struct {\n\tTimeout int64\n\tTemplatesDir string\n\tNotifyConcurrency int\n\tWebhookBatchSend bool\n\tGlobalWebhook GlobalWebhook\n}\n\ntype GlobalWebhook struct {\n\tEnable bool\n\tUrl string\n\tBasicAuthUser string\n\tBasicAuthPass string\n\tTimeout int\n\tHeaders []string\n\tSkipVerify bool\n}\n\ntype CallPlugin struct {\n\tEnable bool\n\tPluginPath string\n\tCaller string\n}\n\ntype RedisPub struct {\n\tEnable bool\n\tChannelPrefix string\n\tChannelKey string\n}\n\nfunc (a *Alert) PreCheck(configDir string) {\n\tif a.Alerting.TemplatesDir == \"\" {\n\t\ta.Alerting.TemplatesDir = path.Join(configDir, \"template\")\n\t}\n\n\tif a.Alerting.NotifyConcurrency == 0 {\n\t\ta.Alerting.NotifyConcurrency = 10\n\t}\n\n\tif a.Heartbeat.Interval == 0 {\n\t\ta.Heartbeat.Interval = 1000\n\t}\n\n\tif a.EngineDelay == 0 {\n\t\ta.EngineDelay = 30\n\t}\n}\n"
},
{
"path": "alert/alert.go",
"content": "package alert\n\nimport (\n\t\"context\"\n\t\"fmt\"\n\n\t\"github.com/ccfos/nightingale/v6/dscache\"\n\n\t\"github.com/ccfos/nightingale/v6/alert/aconf\"\n\t\"github.com/ccfos/nightingale/v6/alert/astats\"\n\t\"github.com/ccfos/nightingale/v6/alert/dispatch\"\n\t\"github.com/ccfos/nightingale/v6/alert/eval\"\n\t\"github.com/ccfos/nightingale/v6/alert/naming\"\n\t\"github.com/ccfos/nightingale/v6/alert/process\"\n\t\"github.com/ccfos/nightingale/v6/alert/queue\"\n\t\"github.com/ccfos/nightingale/v6/alert/record\"\n\t\"github.com/ccfos/nightingale/v6/alert/router\"\n\t\"github.com/ccfos/nightingale/v6/alert/sender\"\n\t\"github.com/ccfos/nightingale/v6/conf\"\n\t\"github.com/ccfos/nightingale/v6/dumper\"\n\t\"github.com/ccfos/nightingale/v6/memsto\"\n\t\"github.com/ccfos/nightingale/v6/models\"\n\t\"github.com/ccfos/nightingale/v6/pkg/ctx\"\n\t\"github.com/ccfos/nightingale/v6/pkg/httpx\"\n\t\"github.com/ccfos/nightingale/v6/pkg/logx\"\n\t\"github.com/ccfos/nightingale/v6/pkg/macros\"\n\t\"github.com/ccfos/nightingale/v6/prom\"\n\t\"github.com/ccfos/nightingale/v6/pushgw/pconf\"\n\t\"github.com/ccfos/nightingale/v6/pushgw/writer\"\n\t\"github.com/ccfos/nightingale/v6/storage\"\n\t\"github.com/flashcatcloud/ibex/src/cmd/ibex\"\n)\n\nfunc Initialize(configDir string, cryptoKey string) (func(), error) {\n\tconfig, err := conf.InitConfig(configDir, cryptoKey)\n\tif err != nil {\n\t\treturn nil, fmt.Errorf(\"failed to init config: %v\", err)\n\t}\n\n\tlogxClean, err := logx.Init(config.Log)\n\tif err != nil {\n\t\treturn nil, err\n\t}\n\n\tctx := ctx.NewContext(context.Background(), nil, false, config.CenterApi)\n\n\tvar redis storage.Redis\n\tredis, err = storage.NewRedis(config.Redis)\n\tif err != nil {\n\t\treturn nil, err\n\t}\n\n\tsyncStats := memsto.NewSyncStats()\n\talertStats := astats.NewSyncStats()\n\n\tconfigCache := memsto.NewConfigCache(ctx, syncStats, nil, \"\")\n\ttargetCache := memsto.NewTargetCache(ctx, syncStats, redis)\n\tbusiGroupCache := memsto.NewBusiGroupCache(ctx, syncStats)\n\talertMuteCache := memsto.NewAlertMuteCache(ctx, syncStats)\n\talertRuleCache := memsto.NewAlertRuleCache(ctx, syncStats)\n\tnotifyConfigCache := memsto.NewNotifyConfigCache(ctx, configCache)\n\tdsCache := memsto.NewDatasourceCache(ctx, syncStats)\n\tuserCache := memsto.NewUserCache(ctx, syncStats)\n\tuserGroupCache := memsto.NewUserGroupCache(ctx, syncStats)\n\ttaskTplsCache := memsto.NewTaskTplCache(ctx)\n\tconfigCvalCache := memsto.NewCvalCache(ctx, syncStats)\n\tnotifyRuleCache := memsto.NewNotifyRuleCache(ctx, syncStats)\n\tnotifyChannelCache := memsto.NewNotifyChannelCache(ctx, syncStats)\n\tmessageTemplateCache := memsto.NewMessageTemplateCache(ctx, syncStats)\n\n\tpromClients := prom.NewPromClient(ctx)\n\tdispatch.InitRegisterQueryFunc(promClients)\n\n\texternalProcessors := process.NewExternalProcessors()\n\n\tmacros.RegisterMacro(macros.MacroInVain)\n\tdscache.Init(ctx, false)\n\tStart(config.Alert, config.Pushgw, syncStats, alertStats, externalProcessors, targetCache, busiGroupCache, alertMuteCache, alertRuleCache, notifyConfigCache, taskTplsCache, dsCache, ctx, promClients, userCache, userGroupCache, notifyRuleCache, notifyChannelCache, messageTemplateCache, configCvalCache)\n\n\tr := httpx.GinEngine(config.Global.RunMode, config.HTTP,\n\t\tconfigCvalCache.PrintBodyPaths, configCvalCache.PrintAccessLog)\n\trt := router.New(config.HTTP, config.Alert, alertMuteCache, targetCache, busiGroupCache, alertStats, ctx, externalProcessors, config.Log.Dir)\n\n\tif config.Ibex.Enable {\n\t\tibex.ServerStart(false, nil, redis, config.HTTP.APIForService.BasicAuth, config.Alert.Heartbeat, &config.CenterApi, r, nil, config.Ibex, config.HTTP.Port)\n\t}\n\n\trt.Config(r)\n\tdumper.ConfigRouter(r)\n\n\thttpClean := httpx.Init(config.HTTP, r)\n\n\treturn func() {\n\t\tlogxClean()\n\t\thttpClean()\n\t}, nil\n}\n\nfunc Start(alertc aconf.Alert, pushgwc pconf.Pushgw, syncStats *memsto.Stats, alertStats *astats.Stats, externalProcessors *process.ExternalProcessorsType, targetCache *memsto.TargetCacheType, busiGroupCache *memsto.BusiGroupCacheType,\n\talertMuteCache *memsto.AlertMuteCacheType, alertRuleCache *memsto.AlertRuleCacheType, notifyConfigCache *memsto.NotifyConfigCacheType, taskTplsCache *memsto.TaskTplCache, datasourceCache *memsto.DatasourceCacheType, ctx *ctx.Context,\n\tpromClients *prom.PromClientMap, userCache *memsto.UserCacheType, userGroupCache *memsto.UserGroupCacheType, notifyRuleCache *memsto.NotifyRuleCacheType, notifyChannelCache *memsto.NotifyChannelCacheType, messageTemplateCache *memsto.MessageTemplateCacheType, configCvalCache *memsto.CvalCache) {\n\talertSubscribeCache := memsto.NewAlertSubscribeCache(ctx, syncStats)\n\trecordingRuleCache := memsto.NewRecordingRuleCache(ctx, syncStats)\n\ttargetsOfAlertRulesCache := memsto.NewTargetOfAlertRuleCache(ctx, alertc.Heartbeat.EngineName, syncStats)\n\n\tgo models.InitNotifyConfig(ctx, alertc.Alerting.TemplatesDir)\n\tgo models.InitNotifyChannel(ctx)\n\tgo models.InitMessageTemplate(ctx)\n\n\tnaming := naming.NewNaming(ctx, alertc.Heartbeat, alertStats)\n\n\twriters := writer.NewWriters(pushgwc)\n\trecord.NewScheduler(alertc, recordingRuleCache, promClients, writers, alertStats, datasourceCache)\n\n\teval.NewScheduler(alertc, externalProcessors, alertRuleCache, targetCache, targetsOfAlertRulesCache,\n\t\tbusiGroupCache, alertMuteCache, datasourceCache, promClients, naming, ctx, alertStats)\n\n\teventProcessorCache := memsto.NewEventProcessorCache(ctx, syncStats)\n\n\tsender.InitStaticGlobalWebhook(alertc.Alerting.GlobalWebhook)\n\n\tdp := dispatch.NewDispatch(alertRuleCache, userCache, userGroupCache, alertSubscribeCache, targetCache, notifyConfigCache, taskTplsCache, notifyRuleCache, notifyChannelCache, messageTemplateCache, eventProcessorCache, configCvalCache, alertc.Alerting, ctx, alertStats)\n\tconsumer := dispatch.NewConsumer(alertc.Alerting, ctx, dp, promClients, alertMuteCache)\n\n\tnotifyRecordConsumer := sender.NewNotifyRecordConsumer(ctx)\n\n\tgo dp.ReloadTpls()\n\tgo consumer.LoopConsume()\n\tgo notifyRecordConsumer.LoopConsume()\n\n\tgo queue.ReportQueueSize(alertStats)\n\tgo sender.ReportNotifyRecordQueueSize(alertStats)\n\tgo sender.InitEmailSender(ctx, notifyConfigCache)\n}\n"
},
{
"path": "alert/astats/stats.go",
"content": "package astats\n\nimport (\n\t\"github.com/prometheus/client_golang/prometheus\"\n)\n\nconst (\n\tnamespace = \"n9e\"\n\tsubsystem = \"alert\"\n)\n\ntype Stats struct {\n\tAlertNotifyTotal *prometheus.CounterVec\n\tAlertNotifyErrorTotal *prometheus.CounterVec\n\tCounterAlertsTotal *prometheus.CounterVec\n\tGaugeAlertQueueSize prometheus.Gauge\n\tCounterRuleEval *prometheus.CounterVec\n\tCounterQueryDataErrorTotal *prometheus.CounterVec\n\tCounterQueryDataTotal *prometheus.CounterVec\n\tCounterVarFillingQuery *prometheus.CounterVec\n\tCounterRecordEval *prometheus.CounterVec\n\tCounterRecordEvalErrorTotal *prometheus.CounterVec\n\tCounterMuteTotal *prometheus.CounterVec\n\tCounterRuleEvalErrorTotal *prometheus.CounterVec\n\tCounterHeartbeatErrorTotal *prometheus.CounterVec\n\tCounterSubEventTotal *prometheus.CounterVec\n\tGaugeQuerySeriesCount *prometheus.GaugeVec\n\tGaugeRuleEvalDuration *prometheus.GaugeVec\n\tGaugeNotifyRecordQueueSize prometheus.Gauge\n}\n\nfunc NewSyncStats() *Stats {\n\tCounterRuleEval := prometheus.NewCounterVec(prometheus.CounterOpts{\n\t\tNamespace: namespace,\n\t\tSubsystem: subsystem,\n\t\tName: \"rule_eval_total\",\n\t\tHelp: \"Number of rule eval.\",\n\t}, []string{})\n\n\tCounterRuleEvalErrorTotal := prometheus.NewCounterVec(prometheus.CounterOpts{\n\t\tNamespace: namespace,\n\t\tSubsystem: subsystem,\n\t\tName: \"rule_eval_error_total\",\n\t\tHelp: \"Number of rule eval error.\",\n\t}, []string{\"datasource\", \"stage\", \"busi_group\", \"rule_id\"})\n\n\tCounterQueryDataErrorTotal := prometheus.NewCounterVec(prometheus.CounterOpts{\n\t\tNamespace: namespace,\n\t\tSubsystem: subsystem,\n\t\tName: \"query_data_error_total\",\n\t\tHelp: \"Number of rule eval query data error.\",\n\t}, []string{\"datasource\"})\n\n\tCounterQueryDataTotal := prometheus.NewCounterVec(prometheus.CounterOpts{\n\t\tNamespace: namespace,\n\t\tSubsystem: subsystem,\n\t\tName: \"query_data_total\",\n\t\tHelp: \"Number of rule eval query data.\",\n\t}, []string{\"datasource\", \"rule_id\"})\n\n\tCounterRecordEval := prometheus.NewCounterVec(prometheus.CounterOpts{\n\t\tNamespace: namespace,\n\t\tSubsystem: subsystem,\n\t\tName: \"record_eval_total\",\n\t\tHelp: \"Number of record eval.\",\n\t}, []string{\"datasource\"})\n\n\tCounterRecordEvalErrorTotal := prometheus.NewCounterVec(prometheus.CounterOpts{\n\t\tNamespace: namespace,\n\t\tSubsystem: subsystem,\n\t\tName: \"record_eval_error_total\",\n\t\tHelp: \"Number of record eval error.\",\n\t}, []string{\"datasource\"})\n\n\tAlertNotifyTotal := prometheus.NewCounterVec(prometheus.CounterOpts{\n\t\tNamespace: namespace,\n\t\tSubsystem: subsystem,\n\t\tName: \"alert_notify_total\",\n\t\tHelp: \"Number of send msg.\",\n\t}, []string{\"channel\"})\n\n\tAlertNotifyErrorTotal := prometheus.NewCounterVec(prometheus.CounterOpts{\n\t\tNamespace: namespace,\n\t\tSubsystem: subsystem,\n\t\tName: \"alert_notify_error_total\",\n\t\tHelp: \"Number of send msg.\",\n\t}, []string{\"channel\"})\n\n\t// 产生的告警总量\n\tCounterAlertsTotal := prometheus.NewCounterVec(prometheus.CounterOpts{\n\t\tNamespace: namespace,\n\t\tSubsystem: subsystem,\n\t\tName: \"alerts_total\",\n\t\tHelp: \"Total number alert events.\",\n\t}, []string{\"cluster\", \"type\", \"busi_group\"})\n\n\t// 内存中的告警事件队列的长度\n\tGaugeAlertQueueSize := prometheus.NewGauge(prometheus.GaugeOpts{\n\t\tNamespace: namespace,\n\t\tSubsystem: subsystem,\n\t\tName: \"alert_queue_size\",\n\t\tHelp: \"The size of alert queue.\",\n\t})\n\n\tCounterMuteTotal := prometheus.NewCounterVec(prometheus.CounterOpts{\n\t\tNamespace: namespace,\n\t\tSubsystem: subsystem,\n\t\tName: \"mute_total\",\n\t\tHelp: \"Number of mute.\",\n\t}, []string{\"group\", \"rule_id\", \"mute_rule_id\", \"datasource_id\"})\n\n\tCounterSubEventTotal := prometheus.NewCounterVec(prometheus.CounterOpts{\n\t\tNamespace: namespace,\n\t\tSubsystem: subsystem,\n\t\tName: \"sub_event_total\",\n\t\tHelp: \"Number of sub event.\",\n\t}, []string{\"group\"})\n\n\tCounterHeartbeatErrorTotal := prometheus.NewCounterVec(prometheus.CounterOpts{\n\t\tNamespace: namespace,\n\t\tSubsystem: subsystem,\n\t\tName: \"heartbeat_error_count\",\n\t\tHelp: \"Number of heartbeat error.\",\n\t}, []string{})\n\n\tGaugeQuerySeriesCount := prometheus.NewGaugeVec(prometheus.GaugeOpts{\n\t\tNamespace: namespace,\n\t\tSubsystem: subsystem,\n\t\tName: \"eval_query_series_count\",\n\t\tHelp: \"Number of series retrieved from data source after query.\",\n\t}, []string{\"rule_id\", \"datasource_id\", \"ref\"})\n\t// 通知记录队列的长度\n\tGaugeNotifyRecordQueueSize := prometheus.NewGauge(prometheus.GaugeOpts{\n\t\tNamespace: namespace,\n\t\tSubsystem: subsystem,\n\t\tName: \"notify_record_queue_size\",\n\t\tHelp: \"The size of notify record queue.\",\n\t})\n\n\tGaugeRuleEvalDuration := prometheus.NewGaugeVec(prometheus.GaugeOpts{\n\t\tNamespace: namespace,\n\t\tSubsystem: subsystem,\n\t\tName: \"rule_eval_duration_ms\",\n\t\tHelp: \"Duration of rule eval in milliseconds.\",\n\t}, []string{\"rule_id\", \"datasource_id\"})\n\n\tCounterVarFillingQuery := prometheus.NewCounterVec(prometheus.CounterOpts{\n\t\tNamespace: namespace,\n\t\tSubsystem: subsystem,\n\t\tName: \"var_filling_query_total\",\n\t\tHelp: \"Number of var filling query.\",\n\t}, []string{\"rule_id\", \"datasource_id\", \"ref\", \"typ\"})\n\n\tprometheus.MustRegister(\n\t\tCounterAlertsTotal,\n\t\tGaugeAlertQueueSize,\n\t\tAlertNotifyTotal,\n\t\tAlertNotifyErrorTotal,\n\t\tCounterRuleEval,\n\t\tCounterQueryDataTotal,\n\t\tCounterQueryDataErrorTotal,\n\t\tCounterRecordEval,\n\t\tCounterRecordEvalErrorTotal,\n\t\tCounterMuteTotal,\n\t\tCounterRuleEvalErrorTotal,\n\t\tCounterHeartbeatErrorTotal,\n\t\tCounterSubEventTotal,\n\t\tGaugeQuerySeriesCount,\n\t\tGaugeRuleEvalDuration,\n\t\tGaugeNotifyRecordQueueSize,\n\t\tCounterVarFillingQuery,\n\t)\n\n\treturn &Stats{\n\t\tCounterAlertsTotal: CounterAlertsTotal,\n\t\tGaugeAlertQueueSize: GaugeAlertQueueSize,\n\t\tAlertNotifyTotal: AlertNotifyTotal,\n\t\tAlertNotifyErrorTotal: AlertNotifyErrorTotal,\n\t\tCounterRuleEval: CounterRuleEval,\n\t\tCounterQueryDataTotal: CounterQueryDataTotal,\n\t\tCounterQueryDataErrorTotal: CounterQueryDataErrorTotal,\n\t\tCounterRecordEval: CounterRecordEval,\n\t\tCounterRecordEvalErrorTotal: CounterRecordEvalErrorTotal,\n\t\tCounterMuteTotal: CounterMuteTotal,\n\t\tCounterRuleEvalErrorTotal: CounterRuleEvalErrorTotal,\n\t\tCounterHeartbeatErrorTotal: CounterHeartbeatErrorTotal,\n\t\tCounterSubEventTotal: CounterSubEventTotal,\n\t\tGaugeQuerySeriesCount: GaugeQuerySeriesCount,\n\t\tGaugeRuleEvalDuration: GaugeRuleEvalDuration,\n\t\tGaugeNotifyRecordQueueSize: GaugeNotifyRecordQueueSize,\n\t\tCounterVarFillingQuery: CounterVarFillingQuery,\n\t}\n}\n"
},
{
"path": "alert/common/key.go",
"content": "package common\n\nimport (\n\t\"encoding/json\"\n\t\"fmt\"\n\t\"strings\"\n\n\t\"github.com/ccfos/nightingale/v6/models\"\n)\n\nfunc RuleKey(datasourceId, id int64) string {\n\treturn fmt.Sprintf(\"alert-%d-%d\", datasourceId, id)\n}\n\nfunc MatchTags(eventTagsMap map[string]string, itags []models.TagFilter) bool {\n\tfor _, filter := range itags {\n\t\t// target_group in和not in优先特殊处理:匹配通过则继续下一个 filter,匹配失败则整组不匹配\n\t\tif filter.Key == \"target_group\" {\n\t\t\t// target 字段从 event.JsonTagsAndValue() 中获取的\n\t\t\tv, ok := eventTagsMap[\"target\"]\n\t\t\tif !ok {\n\t\t\t\treturn false\n\t\t\t}\n\t\t\tif !targetGroupMatch(v, filter) {\n\t\t\t\treturn false\n\t\t\t}\n\t\t\tcontinue\n\t\t}\n\n\t\t// 普通标签按原逻辑处理\n\t\tvalue, has := eventTagsMap[filter.Key]\n\t\tif !has {\n\t\t\treturn false\n\t\t}\n\t\tif !matchTag(value, filter) {\n\t\t\treturn false\n\t\t}\n\t}\n\treturn true\n}\nfunc MatchGroupsName(groupName string, groupFilter []models.TagFilter) bool {\n\tfor _, filter := range groupFilter {\n\t\tif !matchTag(groupName, filter) {\n\t\t\treturn false\n\t\t}\n\t}\n\treturn true\n}\n\nfunc matchTag(value string, filter models.TagFilter) bool {\n\tswitch filter.Func {\n\tcase \"==\":\n\t\treturn strings.TrimSpace(fmt.Sprintf(\"%v\", filter.Value)) == strings.TrimSpace(value)\n\tcase \"!=\":\n\t\treturn strings.TrimSpace(fmt.Sprintf(\"%v\", filter.Value)) != strings.TrimSpace(value)\n\tcase \"in\":\n\t\t_, has := filter.Vset[value]\n\t\treturn has\n\tcase \"not in\":\n\t\t_, has := filter.Vset[value]\n\t\treturn !has\n\tcase \"=~\":\n\t\treturn filter.Regexp.MatchString(value)\n\tcase \"!~\":\n\t\treturn !filter.Regexp.MatchString(value)\n\t}\n\t// unexpected func\n\treturn false\n}\n\n// targetGroupMatch 处理 target_group 的特殊匹配逻辑\nfunc targetGroupMatch(value string, filter models.TagFilter) bool {\n\tvar valueMap map[string]interface{}\n\tif err := json.Unmarshal([]byte(value), &valueMap); err != nil {\n\t\treturn false\n\t}\n\tswitch filter.Func {\n\tcase \"in\", \"not in\":\n\t\t// float64 类型的 id 切片\n\t\tfilterValueIds, ok := filter.Value.([]interface{})\n\t\tif !ok {\n\t\t\treturn false\n\t\t}\n\t\tfilterValueIdsMap := make(map[float64]struct{})\n\t\tfor _, id := range filterValueIds {\n\t\t\tfilterValueIdsMap[id.(float64)] = struct{}{}\n\t\t}\n\t\t// float64 类型的 groupIds 切片\n\t\tgroupIds, ok := valueMap[\"group_ids\"].([]interface{})\n\t\tif !ok {\n\t\t\treturn false\n\t\t}\n\t\t// in 只要 groupIds 中有一个在 filterGroupIds 中出现,就返回 true\n\t\t// not in 则相反\n\t\tfound := false\n\t\tfor _, gid := range groupIds {\n\t\t\tif _, found = filterValueIdsMap[gid.(float64)]; found {\n\t\t\t\tbreak\n\t\t\t}\n\t\t}\n\t\tif filter.Func == \"in\" {\n\t\t\treturn found\n\t\t}\n\t\t// filter.Func == \"not in\"\n\t\treturn !found\n\n\tcase \"=~\", \"!~\":\n\t\t// 正则满足一个就认为 matched\n\t\tgroupNames, ok := valueMap[\"group_names\"].([]interface{})\n\t\tif !ok {\n\t\t\treturn false\n\t\t}\n\t\tmatched := false\n\t\tfor _, gname := range groupNames {\n\t\t\tif filter.Regexp.MatchString(fmt.Sprintf(\"%v\", gname)) {\n\t\t\t\tmatched = true\n\t\t\t\tbreak\n\t\t\t}\n\t\t}\n\t\tif filter.Func == \"=~\" {\n\t\t\treturn matched\n\t\t}\n\t\t// \"!~\": 只要有一个匹配就返回 false,否则返回 true\n\t\treturn !matched\n\tdefault:\n\t\treturn false\n\t}\n}\n"
},
{
"path": "alert/dispatch/consume.go",
"content": "package dispatch\n\nimport (\n\t\"context\"\n\t\"encoding/json\"\n\t\"fmt\"\n\t\"strings\"\n\t\"time\"\n\n\t\"github.com/ccfos/nightingale/v6/alert/aconf\"\n\t\"github.com/ccfos/nightingale/v6/alert/queue\"\n\t\"github.com/ccfos/nightingale/v6/memsto\"\n\t\"github.com/ccfos/nightingale/v6/models\"\n\t\"github.com/ccfos/nightingale/v6/pkg/ctx\"\n\t\"github.com/ccfos/nightingale/v6/pkg/poster\"\n\tpromsdk \"github.com/ccfos/nightingale/v6/pkg/prom\"\n\t\"github.com/ccfos/nightingale/v6/pkg/tplx\"\n\t\"github.com/ccfos/nightingale/v6/prom\"\n\n\t\"github.com/prometheus/common/model\"\n\t\"github.com/toolkits/pkg/concurrent/semaphore\"\n\t\"github.com/toolkits/pkg/logger\"\n)\n\ntype Consumer struct {\n\talerting aconf.Alerting\n\tctx *ctx.Context\n\n\tdispatch *Dispatch\n\tpromClients *prom.PromClientMap\n\talertMuteCache *memsto.AlertMuteCacheType\n}\n\ntype EventMuteHookFunc func(event *models.AlertCurEvent) bool\n\nvar EventMuteHook EventMuteHookFunc = func(event *models.AlertCurEvent) bool { return false }\n\nfunc InitRegisterQueryFunc(promClients *prom.PromClientMap) {\n\ttplx.RegisterQueryFunc(func(datasourceID int64, promql string) model.Value {\n\t\tif promClients.IsNil(datasourceID) {\n\t\t\treturn nil\n\t\t}\n\n\t\treaderClient := promClients.GetCli(datasourceID)\n\t\tvalue, _, _ := readerClient.Query(context.Background(), promql, time.Now())\n\t\treturn value\n\t})\n}\n\n// 创建一个 Consumer 实例\nfunc NewConsumer(alerting aconf.Alerting, ctx *ctx.Context, dispatch *Dispatch, promClients *prom.PromClientMap, alertMuteCache *memsto.AlertMuteCacheType) *Consumer {\n\treturn &Consumer{\n\t\talerting: alerting,\n\t\tctx: ctx,\n\t\tdispatch: dispatch,\n\t\tpromClients: promClients,\n\n\t\talertMuteCache: alertMuteCache,\n\t}\n}\n\nfunc (e *Consumer) LoopConsume() {\n\tsema := semaphore.NewSemaphore(e.alerting.NotifyConcurrency)\n\tduration := time.Duration(100) * time.Millisecond\n\tfor {\n\t\tevents := queue.EventQueue.PopBackBy(100)\n\t\tif len(events) == 0 {\n\t\t\ttime.Sleep(duration)\n\t\t\tcontinue\n\t\t}\n\t\te.consume(events, sema)\n\t}\n}\n\nfunc (e *Consumer) consume(events []interface{}, sema *semaphore.Semaphore) {\n\tfor i := range events {\n\t\tif events[i] == nil {\n\t\t\tcontinue\n\t\t}\n\n\t\tevent := events[i].(*models.AlertCurEvent)\n\t\tsema.Acquire()\n\t\tgo func(event *models.AlertCurEvent) {\n\t\t\tdefer sema.Release()\n\t\t\te.consumeOne(event)\n\t\t}(event)\n\t}\n}\n\nfunc (e *Consumer) consumeOne(event *models.AlertCurEvent) {\n\tLogEvent(event, \"consume\")\n\n\teventType := \"alert\"\n\tif event.IsRecovered {\n\t\teventType = \"recovery\"\n\t}\n\n\te.dispatch.Astats.CounterAlertsTotal.WithLabelValues(event.Cluster, eventType, event.GroupName).Inc()\n\n\tif err := event.ParseRule(\"rule_name\"); err != nil {\n\t\tlogger.Warningf(\"alert_eval_%d datasource_%d failed to parse rule name: %v\", event.RuleId, event.DatasourceId, err)\n\t\tevent.RuleName = fmt.Sprintf(\"failed to parse rule name: %v\", err)\n\t}\n\n\tif err := event.ParseRule(\"annotations\"); err != nil {\n\t\tlogger.Warningf(\"alert_eval_%d datasource_%d failed to parse annotations: %v\", event.RuleId, event.DatasourceId, err)\n\t\tevent.Annotations = fmt.Sprintf(\"failed to parse annotations: %v\", err)\n\t\tevent.AnnotationsJSON[\"error\"] = event.Annotations\n\t}\n\n\te.queryRecoveryVal(event)\n\n\tif err := event.ParseRule(\"rule_note\"); err != nil {\n\t\tlogger.Warningf(\"alert_eval_%d datasource_%d failed to parse rule note: %v\", event.RuleId, event.DatasourceId, err)\n\t\tevent.RuleNote = fmt.Sprintf(\"failed to parse rule note: %v\", err)\n\t}\n\n\te.persist(event)\n\n\te.dispatch.HandleEventNotify(event, false)\n}\n\nfunc (e *Consumer) persist(event *models.AlertCurEvent) {\n\tif event.Status != 0 {\n\t\treturn\n\t}\n\n\tif !e.ctx.IsCenter {\n\t\tevent.DB2FE()\n\t\tvar err error\n\t\tevent.Id, err = poster.PostByUrlsWithResp[int64](e.ctx, \"/v1/n9e/event-persist\", event)\n\t\tif err != nil {\n\t\t\tlogger.Errorf(\"event:%s persist err:%v\", event.Hash, err)\n\t\t\te.dispatch.Astats.CounterRuleEvalErrorTotal.WithLabelValues(fmt.Sprintf(\"%v\", event.DatasourceId), \"persist_event\", event.GroupName, fmt.Sprintf(\"%v\", event.RuleId)).Inc()\n\t\t}\n\t\treturn\n\t}\n\n\terr := models.EventPersist(e.ctx, event)\n\tif err != nil {\n\t\tlogger.Errorf(\"event:%s persist err:%v\", event.Hash, err)\n\t\te.dispatch.Astats.CounterRuleEvalErrorTotal.WithLabelValues(fmt.Sprintf(\"%v\", event.DatasourceId), \"persist_event\", event.GroupName, fmt.Sprintf(\"%v\", event.RuleId)).Inc()\n\t}\n}\n\nfunc (e *Consumer) queryRecoveryVal(event *models.AlertCurEvent) {\n\tif !event.IsRecovered {\n\t\treturn\n\t}\n\n\t// If the event is a recovery event, execute the recovery_promql query\n\tpromql, ok := event.AnnotationsJSON[\"recovery_promql\"]\n\tif !ok {\n\t\treturn\n\t}\n\n\tpromql = strings.TrimSpace(promql)\n\tif promql == \"\" {\n\t\tlogger.Warningf(\"alert_eval_%d datasource_%d promql is blank\", event.RuleId, event.DatasourceId)\n\t\treturn\n\t}\n\n\tif e.promClients.IsNil(event.DatasourceId) {\n\t\tlogger.Warningf(\"alert_eval_%d datasource_%d error reader client is nil\", event.RuleId, event.DatasourceId)\n\t\treturn\n\t}\n\n\treaderClient := e.promClients.GetCli(event.DatasourceId)\n\n\tvar warnings promsdk.Warnings\n\tvalue, warnings, err := readerClient.Query(e.ctx.Ctx, promql, time.Now())\n\tif err != nil {\n\t\tlogger.Errorf(\"alert_eval_%d datasource_%d promql:%s, error:%v\", event.RuleId, event.DatasourceId, promql, err)\n\t\tevent.AnnotationsJSON[\"recovery_promql_error\"] = fmt.Sprintf(\"promql:%s error:%v\", promql, err)\n\n\t\tb, err := json.Marshal(event.AnnotationsJSON)\n\t\tif err != nil {\n\t\t\tevent.AnnotationsJSON = make(map[string]string)\n\t\t\tevent.AnnotationsJSON[\"error\"] = fmt.Sprintf(\"failed to parse annotations: %v\", err)\n\t\t} else {\n\t\t\tevent.Annotations = string(b)\n\t\t}\n\t\treturn\n\t}\n\n\tif len(warnings) > 0 {\n\t\tlogger.Errorf(\"alert_eval_%d datasource_%d promql:%s, warnings:%v\", event.RuleId, event.DatasourceId, promql, warnings)\n\t}\n\n\tanomalyPoints := models.ConvertAnomalyPoints(value)\n\tif len(anomalyPoints) == 0 {\n\t\tlogger.Warningf(\"alert_eval_%d datasource_%d promql:%s, result is empty\", event.RuleId, event.DatasourceId, promql)\n\t\tevent.AnnotationsJSON[\"recovery_promql_error\"] = fmt.Sprintf(\"promql:%s error:%s\", promql, \"result is empty\")\n\t} else {\n\t\tevent.AnnotationsJSON[\"recovery_value\"] = fmt.Sprintf(\"%v\", anomalyPoints[0].Value)\n\t}\n\n\tb, err := json.Marshal(event.AnnotationsJSON)\n\tif err != nil {\n\t\tevent.AnnotationsJSON = make(map[string]string)\n\t\tevent.AnnotationsJSON[\"error\"] = fmt.Sprintf(\"failed to parse annotations: %v\", err)\n\t} else {\n\t\tevent.Annotations = string(b)\n\t}\n}\n\n"
},
{
"path": "alert/dispatch/dispatch.go",
"content": "package dispatch\n\nimport (\n\t\"bytes\"\n\t\"encoding/json\"\n\t\"errors\"\n\t\"fmt\"\n\t\"html/template\"\n\t\"net/url\"\n\t\"strconv\"\n\t\"strings\"\n\t\"sync\"\n\t\"time\"\n\n\t\"github.com/ccfos/nightingale/v6/alert/aconf\"\n\t\"github.com/ccfos/nightingale/v6/alert/astats\"\n\t\"github.com/ccfos/nightingale/v6/alert/common\"\n\t\"github.com/ccfos/nightingale/v6/alert/pipeline\"\n\t\"github.com/ccfos/nightingale/v6/alert/pipeline/engine\"\n\t\"github.com/ccfos/nightingale/v6/alert/sender\"\n\t\"github.com/ccfos/nightingale/v6/memsto\"\n\t\"github.com/ccfos/nightingale/v6/models\"\n\t\"github.com/ccfos/nightingale/v6/pkg/ctx\"\n\n\t\"github.com/toolkits/pkg/logger\"\n)\n\nvar ShouldSkipNotify func(*ctx.Context, *models.AlertCurEvent, int64) bool\nvar SendByNotifyRule func(*ctx.Context, *memsto.UserCacheType, *memsto.UserGroupCacheType, *memsto.NotifyChannelCacheType, *memsto.CvalCache,\n\t[]*models.AlertCurEvent, int64, *models.NotifyConfig, *models.NotifyChannelConfig, *models.MessageTemplate)\n\nvar EventProcessorCache *memsto.EventProcessorCacheType\n\nfunc init() {\n\tShouldSkipNotify = shouldSkipNotify\n\tSendByNotifyRule = SendNotifyRuleMessage\n}\n\ntype Dispatch struct {\n\talertRuleCache *memsto.AlertRuleCacheType\n\tuserCache *memsto.UserCacheType\n\tuserGroupCache *memsto.UserGroupCacheType\n\talertSubscribeCache *memsto.AlertSubscribeCacheType\n\ttargetCache *memsto.TargetCacheType\n\tnotifyConfigCache *memsto.NotifyConfigCacheType\n\ttaskTplsCache *memsto.TaskTplCache\n\tconfigCvalCache *memsto.CvalCache\n\n\tnotifyRuleCache *memsto.NotifyRuleCacheType\n\tnotifyChannelCache *memsto.NotifyChannelCacheType\n\tmessageTemplateCache *memsto.MessageTemplateCacheType\n\teventProcessorCache *memsto.EventProcessorCacheType\n\n\talerting aconf.Alerting\n\n\tSenders map[string]sender.Sender\n\tCallBacks map[string]sender.CallBacker\n\ttpls map[string]*template.Template\n\tExtraSenders map[string]sender.Sender\n\tBeforeSenderHook func(*models.AlertCurEvent) bool\n\tctx *ctx.Context\n\tAstats *astats.Stats\n\n\tRwLock sync.RWMutex\n}\n\n// 创建一个 Notify 实例\nfunc NewDispatch(alertRuleCache *memsto.AlertRuleCacheType, userCache *memsto.UserCacheType, userGroupCache *memsto.UserGroupCacheType,\n\talertSubscribeCache *memsto.AlertSubscribeCacheType, targetCache *memsto.TargetCacheType, notifyConfigCache *memsto.NotifyConfigCacheType,\n\ttaskTplsCache *memsto.TaskTplCache, notifyRuleCache *memsto.NotifyRuleCacheType, notifyChannelCache *memsto.NotifyChannelCacheType,\n\tmessageTemplateCache *memsto.MessageTemplateCacheType, eventProcessorCache *memsto.EventProcessorCacheType, configCvalCache *memsto.CvalCache, alerting aconf.Alerting, c *ctx.Context, astats *astats.Stats) *Dispatch {\n\tnotify := &Dispatch{\n\t\talertRuleCache: alertRuleCache,\n\t\tuserCache: userCache,\n\t\tuserGroupCache: userGroupCache,\n\t\talertSubscribeCache: alertSubscribeCache,\n\t\ttargetCache: targetCache,\n\t\tnotifyConfigCache: notifyConfigCache,\n\t\ttaskTplsCache: taskTplsCache,\n\t\tnotifyRuleCache: notifyRuleCache,\n\t\tnotifyChannelCache: notifyChannelCache,\n\t\tmessageTemplateCache: messageTemplateCache,\n\t\teventProcessorCache: eventProcessorCache,\n\t\tconfigCvalCache: configCvalCache,\n\n\t\talerting: alerting,\n\n\t\tSenders: make(map[string]sender.Sender),\n\t\ttpls: make(map[string]*template.Template),\n\t\tExtraSenders: make(map[string]sender.Sender),\n\t\tBeforeSenderHook: func(*models.AlertCurEvent) bool { return true },\n\n\t\tctx: c,\n\t\tAstats: astats,\n\t}\n\n\tpipeline.Init()\n\tEventProcessorCache = eventProcessorCache\n\n\t// 设置通知记录回调函数\n\tnotifyChannelCache.SetNotifyRecordFunc(sender.NotifyRecord)\n\n\treturn notify\n}\n\nfunc (e *Dispatch) ReloadTpls() error {\n\terr := e.reloadTpls()\n\tif err != nil {\n\t\tlogger.Errorf(\"failed to reload tpls: %v\", err)\n\t}\n\n\tduration := time.Duration(9000) * time.Millisecond\n\tfor {\n\t\ttime.Sleep(duration)\n\t\tif err := e.reloadTpls(); err != nil {\n\t\t\tlogger.Warning(\"failed to reload tpls:\", err)\n\t\t}\n\t}\n}\n\nfunc (e *Dispatch) reloadTpls() error {\n\ttmpTpls, err := models.ListTpls(e.ctx)\n\tif err != nil {\n\t\treturn err\n\t}\n\tsmtp := e.notifyConfigCache.GetSMTP()\n\n\tsenders := map[string]sender.Sender{\n\t\tmodels.Email: sender.NewSender(models.Email, tmpTpls, smtp),\n\t\tmodels.Dingtalk: sender.NewSender(models.Dingtalk, tmpTpls),\n\t\tmodels.Wecom: sender.NewSender(models.Wecom, tmpTpls),\n\t\tmodels.Feishu: sender.NewSender(models.Feishu, tmpTpls),\n\t\tmodels.Mm: sender.NewSender(models.Mm, tmpTpls),\n\t\tmodels.Telegram: sender.NewSender(models.Telegram, tmpTpls),\n\t\tmodels.FeishuCard: sender.NewSender(models.FeishuCard, tmpTpls),\n\t\tmodels.Lark: sender.NewSender(models.Lark, tmpTpls),\n\t\tmodels.LarkCard: sender.NewSender(models.LarkCard, tmpTpls),\n\t}\n\n\t// domain -> Callback()\n\tcallbacks := map[string]sender.CallBacker{\n\t\tmodels.DingtalkDomain: sender.NewCallBacker(models.DingtalkDomain, e.targetCache, e.userCache, e.taskTplsCache, tmpTpls),\n\t\tmodels.WecomDomain: sender.NewCallBacker(models.WecomDomain, e.targetCache, e.userCache, e.taskTplsCache, tmpTpls),\n\t\tmodels.FeishuDomain: sender.NewCallBacker(models.FeishuDomain, e.targetCache, e.userCache, e.taskTplsCache, tmpTpls),\n\t\tmodels.TelegramDomain: sender.NewCallBacker(models.TelegramDomain, e.targetCache, e.userCache, e.taskTplsCache, tmpTpls),\n\t\tmodels.FeishuCardDomain: sender.NewCallBacker(models.FeishuCardDomain, e.targetCache, e.userCache, e.taskTplsCache, tmpTpls),\n\t\tmodels.IbexDomain: sender.NewCallBacker(models.IbexDomain, e.targetCache, e.userCache, e.taskTplsCache, tmpTpls),\n\t\tmodels.LarkDomain: sender.NewCallBacker(models.LarkDomain, e.targetCache, e.userCache, e.taskTplsCache, tmpTpls),\n\t\tmodels.DefaultDomain: sender.NewCallBacker(models.DefaultDomain, e.targetCache, e.userCache, e.taskTplsCache, tmpTpls),\n\t\tmodels.LarkCardDomain: sender.NewCallBacker(models.LarkCardDomain, e.targetCache, e.userCache, e.taskTplsCache, tmpTpls),\n\t}\n\n\te.RwLock.RLock()\n\tfor channelName, extraSender := range e.ExtraSenders {\n\t\tsenders[channelName] = extraSender\n\t}\n\te.RwLock.RUnlock()\n\n\te.RwLock.Lock()\n\te.tpls = tmpTpls\n\te.Senders = senders\n\te.CallBacks = callbacks\n\te.RwLock.Unlock()\n\treturn nil\n}\n\nfunc (e *Dispatch) HandleEventWithNotifyRule(eventOrigin *models.AlertCurEvent) {\n\n\tif len(eventOrigin.NotifyRuleIds) > 0 {\n\t\tfor _, notifyRuleId := range eventOrigin.NotifyRuleIds {\n\t\t\t// 深拷贝新的 event,避免并发修改 event 冲突\n\t\t\teventCopy := eventOrigin.DeepCopy()\n\n\t\t\tlogger.Infof(\"notify rule ids: %v, event: %s\", notifyRuleId, eventCopy.Hash)\n\t\t\tnotifyRule := e.notifyRuleCache.Get(notifyRuleId)\n\t\t\tif notifyRule == nil {\n\t\t\t\tcontinue\n\t\t\t}\n\n\t\t\tif !notifyRule.Enable {\n\t\t\t\tcontinue\n\t\t\t}\n\t\t\teventCopy.NotifyRuleId = notifyRuleId\n\t\t\teventCopy.NotifyRuleName = notifyRule.Name\n\n\t\t\teventCopy = HandleEventPipeline(notifyRule.PipelineConfigs, eventOrigin, eventCopy, e.eventProcessorCache, e.ctx, notifyRuleId, \"notify_rule\")\n\t\t\tif eventCopy == nil {\n\t\t\t\tcontinue\n\t\t\t}\n\t\t\tif ShouldSkipNotify(e.ctx, eventCopy, notifyRuleId) {\n\t\t\t\tlogger.Infof(\"notify_id: %d, event:%s, should skip notify\", notifyRuleId, eventCopy.Hash)\n\t\t\t\tcontinue\n\t\t\t}\n\n\t\t\t// notify\n\t\t\tfor i := range notifyRule.NotifyConfigs {\n\t\t\t\terr := NotifyRuleMatchCheck(¬ifyRule.NotifyConfigs[i], eventCopy)\n\t\t\t\tif err != nil {\n\t\t\t\t\tlogger.Errorf(\"notify_id: %d, event:%s, channel_id:%d, template_id: %d, notify_config:%+v, err:%v\", notifyRuleId, eventCopy.Hash, notifyRule.NotifyConfigs[i].ChannelID, notifyRule.NotifyConfigs[i].TemplateID, notifyRule.NotifyConfigs[i], err)\n\t\t\t\t\tcontinue\n\t\t\t\t}\n\n\t\t\t\tnotifyChannel := e.notifyChannelCache.Get(notifyRule.NotifyConfigs[i].ChannelID)\n\t\t\t\tmessageTemplate := e.messageTemplateCache.Get(notifyRule.NotifyConfigs[i].TemplateID)\n\t\t\t\tif notifyChannel == nil {\n\t\t\t\t\tsender.NotifyRecord(e.ctx, []*models.AlertCurEvent{eventCopy}, notifyRuleId, fmt.Sprintf(\"notify_channel_id:%d\", notifyRule.NotifyConfigs[i].ChannelID), \"\", \"\", errors.New(\"notify_channel not found\"))\n\t\t\t\t\tlogger.Warningf(\"notify_id: %d, event:%s, channel_id:%d, template_id: %d, notify_channel not found\", notifyRuleId, eventCopy.Hash, notifyRule.NotifyConfigs[i].ChannelID, notifyRule.NotifyConfigs[i].TemplateID)\n\t\t\t\t\tcontinue\n\t\t\t\t}\n\n\t\t\t\tif notifyChannel.RequestType != \"flashduty\" && notifyChannel.RequestType != \"pagerduty\" && messageTemplate == nil {\n\t\t\t\t\tlogger.Warningf(\"notify_id: %d, channel_name: %v, event:%s, template_id: %d, message_template not found\", notifyRuleId, notifyChannel.Ident, eventCopy.Hash, notifyRule.NotifyConfigs[i].TemplateID)\n\t\t\t\t\tsender.NotifyRecord(e.ctx, []*models.AlertCurEvent{eventCopy}, notifyRuleId, notifyChannel.Name, \"\", \"\", errors.New(\"message_template not found\"))\n\n\t\t\t\t\tcontinue\n\t\t\t\t}\n\n\t\t\t\tgo SendByNotifyRule(e.ctx, e.userCache, e.userGroupCache, e.notifyChannelCache, e.configCvalCache, []*models.AlertCurEvent{eventCopy}, notifyRuleId, ¬ifyRule.NotifyConfigs[i], notifyChannel, messageTemplate)\n\t\t\t}\n\t\t}\n\t}\n}\n\nfunc shouldSkipNotify(ctx *ctx.Context, event *models.AlertCurEvent, notifyRuleId int64) bool {\n\tif event == nil {\n\t\t// 如果 eventCopy 为 nil,说明 eventCopy 被 processor drop 掉了, 不再发送通知\n\t\treturn true\n\t}\n\n\tif event.IsRecovered && event.NotifyRecovered == 0 {\n\t\t// 如果 eventCopy 是恢复事件,且 NotifyRecovered 为 0,则不发送通知\n\t\treturn true\n\t}\n\treturn false\n}\n\nfunc HandleEventPipeline(pipelineConfigs []models.PipelineConfig, eventOrigin, event *models.AlertCurEvent, eventProcessorCache *memsto.EventProcessorCacheType, ctx *ctx.Context, id int64, from string) *models.AlertCurEvent {\n\tworkflowEngine := engine.NewWorkflowEngine(ctx)\n\n\tfor _, pipelineConfig := range pipelineConfigs {\n\t\tif !pipelineConfig.Enable {\n\t\t\tcontinue\n\t\t}\n\n\t\teventPipeline := eventProcessorCache.Get(pipelineConfig.PipelineId)\n\t\tif eventPipeline == nil {\n\t\t\tlogger.Warningf(\"processor_by_%s_id:%d pipeline_id:%d, event pipeline not found, event: %s\", from, id, pipelineConfig.PipelineId, event.Hash)\n\t\t\tcontinue\n\t\t}\n\n\t\tif !PipelineApplicable(eventPipeline, event) {\n\t\t\tlogger.Debugf(\"processor_by_%s_id:%d pipeline_id:%d, event pipeline not applicable, event: %s\", from, id, pipelineConfig.PipelineId, event.Hash)\n\t\t\tcontinue\n\t\t}\n\n\t\t// 统一使用工作流引擎执行(兼容线性模式和工作流模式)\n\t\ttriggerCtx := &models.WorkflowTriggerContext{\n\t\t\tMode: models.TriggerModeEvent,\n\t\t\tTriggerBy: from + \"_\" + strconv.FormatInt(id, 10),\n\t\t}\n\n\t\tresultEvent, result, err := workflowEngine.Execute(eventPipeline, event, triggerCtx)\n\t\tif err != nil {\n\t\t\tlogger.Errorf(\"processor_by_%s_id:%d pipeline_id:%d, pipeline execute error: %v\", from, id, pipelineConfig.PipelineId, err)\n\t\t\tcontinue\n\t\t}\n\n\t\tif resultEvent == nil {\n\t\t\tlogger.Infof(\"processor_by_%s_id:%d pipeline_id:%d, event dropped, event: %s\", from, id, pipelineConfig.PipelineId, eventOrigin.Hash)\n\t\t\tif from == \"notify_rule\" {\n\t\t\t\tsender.NotifyRecord(ctx, []*models.AlertCurEvent{eventOrigin}, id, \"\", \"\", result.Message, fmt.Errorf(\"processor_by_%s_id:%d pipeline_id:%d, drop by pipeline\", from, id, pipelineConfig.PipelineId))\n\t\t\t}\n\t\t\treturn nil\n\t\t}\n\n\t\tevent = resultEvent\n\t\tlogger.Infof(\"processor_by_%s_id:%d pipeline_id:%d, pipeline executed, status:%s, message:%s\", from, id, pipelineConfig.PipelineId, result.Status, result.Message)\n\t}\n\n\tevent.FE2DB()\n\tevent.FillTagsMap()\n\treturn event\n}\n\nfunc PipelineApplicable(pipeline *models.EventPipeline, event *models.AlertCurEvent) bool {\n\tif pipeline == nil {\n\t\treturn true\n\t}\n\n\tif !pipeline.FilterEnable {\n\t\treturn true\n\t}\n\n\ttagMatch := true\n\tif len(pipeline.LabelFilters) > 0 {\n\t\t// Deep copy to avoid concurrent map writes on cached objects\n\t\tlabelFiltersCopy := make([]models.TagFilter, len(pipeline.LabelFilters))\n\t\tcopy(labelFiltersCopy, pipeline.LabelFilters)\n\t\tfor i := range labelFiltersCopy {\n\t\t\tif labelFiltersCopy[i].Func == \"\" {\n\t\t\t\tlabelFiltersCopy[i].Func = labelFiltersCopy[i].Op\n\t\t\t}\n\t\t}\n\n\t\ttagFilters, err := models.ParseTagFilter(labelFiltersCopy)\n\t\tif err != nil {\n\t\t\tlogger.Errorf(\"pipeline applicable failed to parse tag filter: %v event:%s pipeline:%+v\", err, event.Hash, pipeline)\n\t\t\treturn false\n\t\t}\n\t\ttagMatch = common.MatchTags(event.TagsMap, tagFilters)\n\t}\n\n\tattributesMatch := true\n\tif len(pipeline.AttrFilters) > 0 {\n\t\t// Deep copy to avoid concurrent map writes on cached objects\n\t\tattrFiltersCopy := make([]models.TagFilter, len(pipeline.AttrFilters))\n\t\tcopy(attrFiltersCopy, pipeline.AttrFilters)\n\n\t\ttagFilters, err := models.ParseTagFilter(attrFiltersCopy)\n\t\tif err != nil {\n\t\t\tlogger.Errorf(\"pipeline applicable failed to parse tag filter: %v event:%s pipeline:%+v err:%v\", tagFilters, event.Hash, pipeline, err)\n\t\t\treturn false\n\t\t}\n\n\t\tattributesMatch = common.MatchTags(event.JsonTagsAndValue(), tagFilters)\n\t}\n\n\treturn tagMatch && attributesMatch\n}\n\nfunc NotifyRuleMatchCheck(notifyConfig *models.NotifyConfig, event *models.AlertCurEvent) error {\n\ttm := time.Unix(event.TriggerTime, 0)\n\ttriggerTime := tm.Format(\"15:04\")\n\ttriggerWeek := int(tm.Weekday())\n\n\ttimeMatch := false\n\n\tif len(notifyConfig.TimeRanges) == 0 {\n\t\ttimeMatch = true\n\t}\n\tfor j := range notifyConfig.TimeRanges {\n\t\tif timeMatch {\n\t\t\tbreak\n\t\t}\n\t\tenableStime := notifyConfig.TimeRanges[j].Start\n\t\tenableEtime := notifyConfig.TimeRanges[j].End\n\t\tenableDaysOfWeek := notifyConfig.TimeRanges[j].Week\n\t\tlength := len(enableDaysOfWeek)\n\t\t// enableStime,enableEtime,enableDaysOfWeek三者长度肯定相同,这里循环一个即可\n\t\tfor i := 0; i < length; i++ {\n\t\t\tif enableDaysOfWeek[i] != triggerWeek {\n\t\t\t\tcontinue\n\t\t\t}\n\n\t\t\tif enableStime < enableEtime {\n\t\t\t\tif enableEtime == \"23:59\" {\n\t\t\t\t\t// 02:00-23:59,这种情况做个特殊处理,相当于左闭右闭区间了\n\t\t\t\t\tif triggerTime < enableStime {\n\t\t\t\t\t\t// mute, 即没生效\n\t\t\t\t\t\tcontinue\n\t\t\t\t\t}\n\t\t\t\t} else {\n\t\t\t\t\t// 02:00-04:00 或者 02:00-24:00\n\t\t\t\t\tif triggerTime < enableStime || triggerTime >= enableEtime {\n\t\t\t\t\t\t// mute, 即没生效\n\t\t\t\t\t\tcontinue\n\t\t\t\t\t}\n\t\t\t\t}\n\t\t\t} else if enableStime > enableEtime {\n\t\t\t\t// 21:00-09:00\n\t\t\t\tif triggerTime < enableStime && triggerTime >= enableEtime {\n\t\t\t\t\t// mute, 即没生效\n\t\t\t\t\tcontinue\n\t\t\t\t}\n\t\t\t}\n\n\t\t\t// 到这里说明当前时刻在告警规则的某组生效时间范围内,即没有 mute,直接返回 false\n\t\t\ttimeMatch = true\n\t\t\tbreak\n\t\t}\n\t}\n\n\tif !timeMatch {\n\t\treturn fmt.Errorf(\"event time not match time filter\")\n\t}\n\n\tseverityMatch := false\n\tfor i := range notifyConfig.Severities {\n\t\tif notifyConfig.Severities[i] == event.Severity {\n\t\t\tseverityMatch = true\n\t\t}\n\t}\n\n\tif !severityMatch {\n\t\treturn fmt.Errorf(\"event severity not match severity filter\")\n\t}\n\n\ttagMatch := true\n\tif len(notifyConfig.LabelKeys) > 0 {\n\t\t// Deep copy to avoid concurrent map writes on cached objects\n\t\tlabelKeysCopy := make([]models.TagFilter, len(notifyConfig.LabelKeys))\n\t\tcopy(labelKeysCopy, notifyConfig.LabelKeys)\n\t\tfor i := range labelKeysCopy {\n\t\t\tif labelKeysCopy[i].Func == \"\" {\n\t\t\t\tlabelKeysCopy[i].Func = labelKeysCopy[i].Op\n\t\t\t}\n\t\t}\n\n\t\ttagFilters, err := models.ParseTagFilter(labelKeysCopy)\n\t\tif err != nil {\n\t\t\tlogger.Errorf(\"notify send failed to parse tag filter: %v event:%s notify_config:%+v\", err, event.Hash, notifyConfig)\n\t\t\treturn fmt.Errorf(\"failed to parse tag filter: %v\", err)\n\t\t}\n\t\ttagMatch = common.MatchTags(event.TagsMap, tagFilters)\n\t}\n\n\tif !tagMatch {\n\t\treturn fmt.Errorf(\"event tag not match tag filter\")\n\t}\n\n\tattributesMatch := true\n\tif len(notifyConfig.Attributes) > 0 {\n\t\t// Deep copy to avoid concurrent map writes on cached objects\n\t\tattributesCopy := make([]models.TagFilter, len(notifyConfig.Attributes))\n\t\tcopy(attributesCopy, notifyConfig.Attributes)\n\n\t\ttagFilters, err := models.ParseTagFilter(attributesCopy)\n\t\tif err != nil {\n\t\t\tlogger.Errorf(\"notify send failed to parse tag filter: %v event:%s notify_config:%+v err:%v\", tagFilters, event.Hash, notifyConfig, err)\n\t\t\treturn fmt.Errorf(\"failed to parse tag filter: %v\", err)\n\t\t}\n\n\t\tattributesMatch = common.MatchTags(event.JsonTagsAndValue(), tagFilters)\n\t}\n\n\tif !attributesMatch {\n\t\treturn fmt.Errorf(\"event attributes not match attributes filter\")\n\t}\n\n\tlogger.Infof(\"notify send timeMatch:%v severityMatch:%v tagMatch:%v attributesMatch:%v event:%s notify_config:%+v\", timeMatch, severityMatch, tagMatch, attributesMatch, event.Hash, notifyConfig)\n\treturn nil\n}\n\nfunc GetNotifyConfigParams(notifyConfig *models.NotifyConfig, contactKey string, userCache *memsto.UserCacheType, userGroupCache *memsto.UserGroupCacheType) ([]string, []int64, []string, map[string]string) {\n\tcustomParams := make(map[string]string)\n\tvar flashDutyChannelIDs []int64\n\tvar pagerDutyRoutingKeys []string\n\tvar userInfoParams models.CustomParams\n\n\tfor key, value := range notifyConfig.Params {\n\t\tswitch key {\n\t\tcase \"user_ids\", \"user_group_ids\", \"ids\":\n\t\t\tif data, err := json.Marshal(value); err == nil {\n\t\t\t\tvar ids []int64\n\t\t\t\tif json.Unmarshal(data, &ids) == nil {\n\t\t\t\t\tif key == \"user_ids\" {\n\t\t\t\t\t\tuserInfoParams.UserIDs = ids\n\t\t\t\t\t} else if key == \"user_group_ids\" {\n\t\t\t\t\t\tuserInfoParams.UserGroupIDs = ids\n\t\t\t\t\t} else if key == \"ids\" {\n\t\t\t\t\t\tflashDutyChannelIDs = ids\n\t\t\t\t\t}\n\t\t\t\t}\n\t\t\t}\n\t\tcase \"pagerduty_integration_keys\", \"pagerduty_integration_ids\":\n\t\t\tif key == \"pagerduty_integration_ids\" {\n\t\t\t\t// 不处理ids,直接跳过,这个字段只给前端标记用\n\t\t\t\tcontinue\n\t\t\t}\n\t\t\tif data, err := json.Marshal(value); err == nil {\n\t\t\t\tvar keys []string\n\t\t\t\tif json.Unmarshal(data, &keys) == nil {\n\t\t\t\t\tpagerDutyRoutingKeys = keys\n\t\t\t\t\tbreak\n\t\t\t\t}\n\t\t\t}\n\t\tdefault:\n\t\t\t// 避免直接 value.(string) 导致 panic,支持多种类型并统一为字符串\n\t\t\tcustomParams[key] = value.(string)\n\t\t}\n\t}\n\n\tif len(userInfoParams.UserIDs) == 0 && len(userInfoParams.UserGroupIDs) == 0 {\n\t\treturn []string{}, flashDutyChannelIDs, pagerDutyRoutingKeys, customParams\n\t}\n\n\tuserIds := make([]int64, 0)\n\tuserIds = append(userIds, userInfoParams.UserIDs...)\n\n\tif len(userInfoParams.UserGroupIDs) > 0 {\n\t\tuserGroups := userGroupCache.GetByUserGroupIds(userInfoParams.UserGroupIDs)\n\t\tfor _, userGroup := range userGroups {\n\t\t\tuserIds = append(userIds, userGroup.UserIds...)\n\t\t}\n\t}\n\n\tusers := userCache.GetByUserIds(userIds)\n\tvisited := make(map[int64]bool)\n\tsendtos := make([]string, 0)\n\tfor _, user := range users {\n\t\tif visited[user.Id] {\n\t\t\tcontinue\n\t\t}\n\t\tvar sendto string\n\t\tif contactKey == \"phone\" {\n\t\t\tsendto = user.Phone\n\t\t} else if contactKey == \"email\" {\n\t\t\tsendto = user.Email\n\t\t} else {\n\t\t\tsendto, _ = user.ExtractToken(contactKey)\n\t\t}\n\n\t\tif sendto == \"\" {\n\t\t\tcontinue\n\t\t}\n\t\tsendtos = append(sendtos, sendto)\n\t\tvisited[user.Id] = true\n\t}\n\n\treturn sendtos, flashDutyChannelIDs, pagerDutyRoutingKeys, customParams\n}\n\nfunc SendNotifyRuleMessage(ctx *ctx.Context, userCache *memsto.UserCacheType, userGroupCache *memsto.UserGroupCacheType, notifyChannelCache *memsto.NotifyChannelCacheType, configCvalCache *memsto.CvalCache,\n\tevents []*models.AlertCurEvent, notifyRuleId int64, notifyConfig *models.NotifyConfig, notifyChannel *models.NotifyChannelConfig, messageTemplate *models.MessageTemplate) {\n\tif len(events) == 0 {\n\t\tlogger.Errorf(\"notify_id: %d events is empty\", notifyRuleId)\n\t\treturn\n\t}\n\n\tsiteInfo := configCvalCache.GetSiteInfo()\n\ttplContent := make(map[string]interface{})\n\tif notifyChannel.RequestType != \"flashduty\" {\n\t\ttplContent = messageTemplate.RenderEvent(events, siteInfo.SiteUrl)\n\t}\n\n\tvar contactKey string\n\tif notifyChannel.ParamConfig != nil && notifyChannel.ParamConfig.UserInfo != nil {\n\t\tcontactKey = notifyChannel.ParamConfig.UserInfo.ContactKey\n\t}\n\n\tsendtos, flashDutyChannelIDs, pagerdutyRoutingKeys, customParams := GetNotifyConfigParams(notifyConfig, contactKey, userCache, userGroupCache)\n\n\tswitch notifyChannel.RequestType {\n\tcase \"flashduty\":\n\t\tif len(flashDutyChannelIDs) == 0 {\n\t\t\tflashDutyChannelIDs = []int64{0} // 如果 flashduty 通道没有配置,则使用 0, 给 SendFlashDuty 判断使用, 不给 flashduty 传 channel_id 参数\n\t\t}\n\n\t\tfor i := range flashDutyChannelIDs {\n\t\t\tstart := time.Now()\n\t\t\trespBody, err := notifyChannel.SendFlashDuty(events, flashDutyChannelIDs[i], notifyChannelCache.GetHttpClient(notifyChannel.ID))\n\t\t\trespBody = fmt.Sprintf(\"send_time: %s duration: %d ms %s\", time.Now().Format(\"2006-01-02 15:04:05\"), time.Since(start).Milliseconds(), respBody)\n\t\t\tlogger.Infof(\"duty_sender notify_id: %d, channel_name: %v, event:%s, IntegrationUrl: %v dutychannel_id: %v, respBody: %v, err: %v\", notifyRuleId, notifyChannel.Name, events[0].Hash, notifyChannel.RequestConfig.FlashDutyRequestConfig.IntegrationUrl, flashDutyChannelIDs[i], respBody, err)\n\t\t\tsender.NotifyRecord(ctx, events, notifyRuleId, notifyChannel.Name, strconv.FormatInt(flashDutyChannelIDs[i], 10), respBody, err)\n\t\t}\n\n\tcase \"pagerduty\":\n\t\tfor _, routingKey := range pagerdutyRoutingKeys {\n\t\t\tstart := time.Now()\n\t\t\trespBody, err := notifyChannel.SendPagerDuty(events, routingKey, siteInfo.SiteUrl, notifyChannelCache.GetHttpClient(notifyChannel.ID))\n\t\t\trespBody = fmt.Sprintf(\"send_time: %s duration: %d ms %s\", time.Now().Format(\"2006-01-02 15:04:05\"), time.Since(start).Milliseconds(), respBody)\n\t\t\tlogger.Infof(\"pagerduty_sender notify_id: %d, channel_name: %v, event:%s, respBody: %v, err: %v\", notifyRuleId, notifyChannel.Name, events[0].Hash, respBody, err)\n\t\t\tsender.NotifyRecord(ctx, events, notifyRuleId, notifyChannel.Name, \"\", respBody, err)\n\t\t}\n\n\tcase \"http\":\n\t\t// 使用队列模式处理 http 通知\n\t\t// 创建通知任务\n\t\ttask := &memsto.NotifyTask{\n\t\t\tEvents: events,\n\t\t\tNotifyRuleId: notifyRuleId,\n\t\t\tNotifyChannel: notifyChannel,\n\t\t\tTplContent: tplContent,\n\t\t\tCustomParams: customParams,\n\t\t\tSendtos: sendtos,\n\t\t}\n\n\t\t// 将任务加入队列\n\t\tsuccess := notifyChannelCache.EnqueueNotifyTask(task)\n\t\tif !success {\n\t\t\tlogger.Errorf(\"failed to enqueue notify task for channel %d, notify_id: %d\", notifyChannel.ID, notifyRuleId)\n\t\t\t// 如果入队失败,记录错误通知\n\t\t\tsender.NotifyRecord(ctx, events, notifyRuleId, notifyChannel.Name, getSendTarget(customParams, sendtos), \"\", errors.New(\"failed to enqueue notify task, queue is full\"))\n\t\t}\n\n\tcase \"smtp\":\n\t\tnotifyChannel.SendEmail(notifyRuleId, events, tplContent, sendtos, notifyChannelCache.GetSmtpClient(notifyChannel.ID))\n\n\tcase \"script\":\n\t\tstart := time.Now()\n\t\ttarget, res, err := notifyChannel.SendScript(events, tplContent, customParams, sendtos)\n\t\tres = fmt.Sprintf(\"send_time: %s duration: %d ms %s\", time.Now().Format(\"2006-01-02 15:04:05\"), time.Since(start).Milliseconds(), res)\n\t\tlogger.Infof(\"script_sender notify_id: %d, channel_name: %v, event:%s, tplContent:%s, customParams:%v, target:%s, res:%s, err:%v\", notifyRuleId, notifyChannel.Name, events[0].Hash, tplContent, customParams, target, res, err)\n\t\tsender.NotifyRecord(ctx, events, notifyRuleId, notifyChannel.Name, target, res, err)\n\tdefault:\n\t\tlogger.Warningf(\"notify_id: %d, channel_name: %v, event:%s send type not found\", notifyRuleId, notifyChannel.Name, events[0].Hash)\n\t}\n}\n\nfunc NeedBatchContacts(requestConfig *models.HTTPRequestConfig) bool {\n\tb, _ := json.Marshal(requestConfig)\n\treturn strings.Contains(string(b), \"$sendtos\")\n}\n\n// HandleEventNotify 处理event事件的主逻辑\n// event: 告警/恢复事件\n// isSubscribe: 告警事件是否由subscribe的配置产生\nfunc (e *Dispatch) HandleEventNotify(event *models.AlertCurEvent, isSubscribe bool) {\n\tgo e.HandleEventWithNotifyRule(event)\n\tif event.IsRecovered && event.NotifyRecovered == 0 {\n\t\treturn\n\t}\n\n\tif !isSubscribe {\n\t\tgo sender.SendStaticGlobalWebhook(e.ctx, event.DeepCopy(), e.Astats)\n\t}\n\n\trule := e.alertRuleCache.Get(event.RuleId)\n\tif rule == nil {\n\t\treturn\n\t}\n\n\tfillUsers(event, e.userCache, e.userGroupCache)\n\n\tvar (\n\t\t// 处理事件到 notifyTarget 关系,处理的notifyTarget用OrMerge进行合并\n\t\thandlers []NotifyTargetDispatch\n\n\t\t// 额外去掉一些订阅,处理的notifyTarget用AndMerge进行合并, 如设置 channel=false,合并后不通过这个channel发送\n\t\t// 如果实现了相关 Dispatch,可以添加到interceptors中\n\t\tinterceptorHandlers []NotifyTargetDispatch\n\t)\n\tif isSubscribe {\n\t\thandlers = []NotifyTargetDispatch{NotifyGroupDispatch, EventCallbacksDispatch}\n\t} else {\n\t\thandlers = []NotifyTargetDispatch{NotifyGroupDispatch, GlobalWebhookDispatch, EventCallbacksDispatch}\n\t}\n\n\tnotifyTarget := NewNotifyTarget()\n\t// 处理订阅关系使用OrMerge\n\tfor _, handler := range handlers {\n\t\tnotifyTarget.OrMerge(handler(rule, event, notifyTarget, e))\n\t}\n\n\t// 处理移除订阅关系的逻辑,比如员工离职,临时静默某个通道的策略等\n\tfor _, handler := range interceptorHandlers {\n\t\tnotifyTarget.AndMerge(handler(rule, event, notifyTarget, e))\n\t}\n\n\tgo e.Send(rule, event, notifyTarget, isSubscribe)\n\n\t// 如果是不是订阅规则出现的event, 则需要处理订阅规则的event\n\tif !isSubscribe {\n\t\te.handleSubs(event)\n\t}\n}\n\nfunc (e *Dispatch) handleSubs(event *models.AlertCurEvent) {\n\t// handle alert subscribes\n\tsubscribes := make([]*models.AlertSubscribe, 0)\n\t// rule specific subscribes\n\tif subs, has := e.alertSubscribeCache.Get(event.RuleId); has {\n\t\tsubscribes = append(subscribes, subs...)\n\t}\n\t// global subscribes\n\tif subs, has := e.alertSubscribeCache.Get(0); has {\n\t\tsubscribes = append(subscribes, subs...)\n\t}\n\n\tfor _, sub := range subscribes {\n\t\te.handleSub(sub, *event)\n\t}\n}\n\n// handleSub 处理订阅规则的event,注意这里event要使用值传递,因为后面会修改event的状态\nfunc (e *Dispatch) handleSub(sub *models.AlertSubscribe, event models.AlertCurEvent) {\n\tif sub.IsDisabled() {\n\t\treturn\n\t}\n\n\tif !sub.MatchCluster(event.DatasourceId) {\n\t\treturn\n\t}\n\n\tif !sub.MatchProd(event.RuleProd) {\n\t\treturn\n\t}\n\n\tif !sub.MatchCate(event.Cate) {\n\t\treturn\n\t}\n\n\tif !common.MatchTags(event.TagsMap, sub.ITags) {\n\t\treturn\n\t}\n\t// event BusiGroups filter\n\tif !common.MatchGroupsName(event.GroupName, sub.IBusiGroups) {\n\t\treturn\n\t}\n\tif sub.ForDuration > (event.TriggerTime - event.FirstTriggerTime) {\n\t\treturn\n\t}\n\n\tif len(sub.SeveritiesJson) != 0 {\n\t\tmatch := false\n\t\tfor _, s := range sub.SeveritiesJson {\n\t\t\tif s == event.Severity || s == 0 {\n\t\t\t\tmatch = true\n\t\t\t\tbreak\n\t\t\t}\n\t\t}\n\t\tif !match {\n\t\t\treturn\n\t\t}\n\t}\n\n\te.Astats.CounterSubEventTotal.WithLabelValues(event.GroupName).Inc()\n\tsub.ModifyEvent(&event)\n\tevent.SubRuleId = sub.Id\n\n\tLogEvent(&event, \"subscribe\")\n\te.HandleEventNotify(&event, true)\n}\n\nfunc (e *Dispatch) Send(rule *models.AlertRule, event *models.AlertCurEvent, notifyTarget *NotifyTarget, isSubscribe bool) {\n\tneedSend := e.BeforeSenderHook(event)\n\tif needSend {\n\t\tfor channel, uids := range notifyTarget.ToChannelUserMap() {\n\t\t\tmsgCtx := sender.BuildMessageContext(e.ctx, rule, []*models.AlertCurEvent{event},\n\t\t\t\tuids, e.userCache, e.Astats)\n\t\t\te.RwLock.RLock()\n\t\t\ts := e.Senders[channel]\n\t\t\te.RwLock.RUnlock()\n\t\t\tif s == nil {\n\t\t\t\tlogger.Debugf(\"no sender for channel: %s\", channel)\n\t\t\t\tcontinue\n\t\t\t}\n\n\t\t\tvar event *models.AlertCurEvent\n\t\t\tif len(msgCtx.Events) > 0 {\n\t\t\t\tevent = msgCtx.Events[0]\n\t\t\t}\n\n\t\t\tlogger.Debugf(\"send to channel:%s event:%s users:%+v\", channel, event.Hash, msgCtx.Users)\n\t\t\ts.Send(msgCtx)\n\t\t}\n\t}\n\n\t// handle event callbacks\n\te.SendCallbacks(rule, notifyTarget, event)\n\n\t// handle global webhooks\n\tif !event.OverrideGlobalWebhook() {\n\t\tif e.alerting.WebhookBatchSend {\n\t\t\tsender.BatchSendWebhooks(e.ctx, notifyTarget.ToWebhookMap(), event, e.Astats)\n\t\t} else {\n\t\t\tsender.SingleSendWebhooks(e.ctx, notifyTarget.ToWebhookMap(), event, e.Astats)\n\t\t}\n\t}\n\n\t// handle plugin call\n\tgo sender.MayPluginNotify(e.ctx, e.genNoticeBytes(event), e.notifyConfigCache.\n\t\tGetNotifyScript(), e.Astats, event)\n\n\tif !isSubscribe {\n\t\t// handle ibex callbacks\n\t\te.HandleIbex(rule, event)\n\t}\n}\n\nfunc (e *Dispatch) SendCallbacks(rule *models.AlertRule, notifyTarget *NotifyTarget, event *models.AlertCurEvent) {\n\tuids := notifyTarget.ToUidList()\n\turls := notifyTarget.ToCallbackList()\n\twhMap := notifyTarget.ToWebhookMap()\n\togw := event.OverrideGlobalWebhook()\n\tfor _, urlStr := range urls {\n\t\tif len(urlStr) == 0 {\n\t\t\tcontinue\n\t\t}\n\n\t\tcbCtx := sender.BuildCallBackContext(e.ctx, urlStr, rule, []*models.AlertCurEvent{event}, uids, e.userCache, e.alerting.WebhookBatchSend, e.Astats)\n\n\t\tif wh, ok := whMap[cbCtx.CallBackURL]; !ogw && ok && wh.Enable {\n\t\t\tlogger.Debugf(\"SendCallbacks: webhook[%s] is in global conf.\", cbCtx.CallBackURL)\n\t\t\tcontinue\n\t\t}\n\n\t\tif strings.HasPrefix(urlStr, \"${ibex}\") {\n\t\t\te.CallBacks[models.IbexDomain].CallBack(cbCtx)\n\t\t\tcontinue\n\t\t}\n\n\t\tif !(strings.HasPrefix(urlStr, \"http://\") || strings.HasPrefix(urlStr, \"https://\")) {\n\t\t\tcbCtx.CallBackURL = \"http://\" + urlStr\n\t\t}\n\n\t\tparsedURL, err := url.Parse(urlStr)\n\t\tif err != nil {\n\t\t\tlogger.Errorf(\"SendCallbacks: failed to url.Parse(urlStr=%s): %v\", urlStr, err)\n\t\t\tcontinue\n\t\t}\n\n\t\t// process feishu card\n\t\tif parsedURL.Host == models.FeishuDomain && parsedURL.Query().Get(\"card\") == \"1\" {\n\t\t\te.CallBacks[models.FeishuCardDomain].CallBack(cbCtx)\n\t\t\tcontinue\n\t\t}\n\n\t\t// process lark card\n\t\tif parsedURL.Host == models.LarkDomain && parsedURL.Query().Get(\"card\") == \"1\" {\n\t\t\te.CallBacks[models.LarkCardDomain].CallBack(cbCtx)\n\t\t\tcontinue\n\t\t}\n\n\t\tcallBacker, ok := e.CallBacks[parsedURL.Host]\n\t\tif ok {\n\t\t\tcallBacker.CallBack(cbCtx)\n\t\t} else {\n\t\t\te.CallBacks[models.DefaultDomain].CallBack(cbCtx)\n\t\t}\n\t}\n}\n\nfunc (e *Dispatch) HandleIbex(rule *models.AlertRule, event *models.AlertCurEvent) {\n\t// 解析 RuleConfig 字段\n\tvar ruleConfig struct {\n\t\tTaskTpls []*models.Tpl `json:\"task_tpls\"`\n\t}\n\tjson.Unmarshal([]byte(rule.RuleConfig), &ruleConfig)\n\n\tif event.IsRecovered {\n\t\t// 恢复事件不需要走故障自愈的逻辑\n\t\treturn\n\t}\n\n\tfor _, t := range ruleConfig.TaskTpls {\n\t\tif t.TplId == 0 {\n\t\t\tcontinue\n\t\t}\n\n\t\tif len(t.Host) == 0 {\n\t\t\tsender.CallIbex(e.ctx, t.TplId, event.TargetIdent,\n\t\t\t\te.taskTplsCache, e.targetCache, e.userCache, event, \"\")\n\t\t\tcontinue\n\t\t}\n\t\tfor _, host := range t.Host {\n\t\t\tsender.CallIbex(e.ctx, t.TplId, host,\n\t\t\t\te.taskTplsCache, e.targetCache, e.userCache, event, \"\")\n\t\t}\n\t}\n}\n\ntype Notice struct {\n\tEvent *models.AlertCurEvent `json:\"event\"`\n\tTpls map[string]string `json:\"tpls\"`\n}\n\nfunc (e *Dispatch) genNoticeBytes(event *models.AlertCurEvent) []byte {\n\t// build notice body with templates\n\tntpls := make(map[string]string)\n\n\te.RwLock.RLock()\n\tdefer e.RwLock.RUnlock()\n\tfor filename, tpl := range e.tpls {\n\t\tvar body bytes.Buffer\n\t\tif err := tpl.Execute(&body, event); err != nil {\n\t\t\tntpls[filename] = err.Error()\n\t\t} else {\n\t\t\tntpls[filename] = body.String()\n\t\t}\n\t}\n\n\tnotice := Notice{Event: event, Tpls: ntpls}\n\tstdinBytes, err := json.Marshal(notice)\n\tif err != nil {\n\t\tlogger.Errorf(\"event_notify: failed to marshal notice: %v\", err)\n\t\treturn nil\n\t}\n\n\treturn stdinBytes\n}\n\n// for alerting\nfunc fillUsers(ce *models.AlertCurEvent, uc *memsto.UserCacheType, ugc *memsto.UserGroupCacheType) {\n\tgids := make([]int64, 0, len(ce.NotifyGroupsJSON))\n\tfor i := 0; i < len(ce.NotifyGroupsJSON); i++ {\n\t\tgid, err := strconv.ParseInt(ce.NotifyGroupsJSON[i], 10, 64)\n\t\tif err != nil {\n\t\t\tcontinue\n\t\t}\n\t\tgids = append(gids, gid)\n\t}\n\n\tce.NotifyGroupsObj = ugc.GetByUserGroupIds(gids)\n\n\tuids := make(map[int64]struct{})\n\tfor i := 0; i < len(ce.NotifyGroupsObj); i++ {\n\t\tug := ce.NotifyGroupsObj[i]\n\t\tfor j := 0; j < len(ug.UserIds); j++ {\n\t\t\tuids[ug.UserIds[j]] = struct{}{}\n\t\t}\n\t}\n\n\tce.NotifyUsersObj = uc.GetByUserIds(mapKeys(uids))\n}\n\nfunc mapKeys(m map[int64]struct{}) []int64 {\n\tlst := make([]int64, 0, len(m))\n\tfor k := range m {\n\t\tlst = append(lst, k)\n\t}\n\treturn lst\n}\n\nfunc getSendTarget(customParams map[string]string, sendtos []string) string {\n\tif len(customParams) == 0 {\n\t\treturn strings.Join(sendtos, \",\")\n\t}\n\n\tvalues := make([]string, 0)\n\tfor _, value := range customParams {\n\t\trunes := []rune(value)\n\t\tif len(runes) <= 4 {\n\t\t\tvalues = append(values, value)\n\t\t} else {\n\t\t\tmaskedValue := string(runes[:len(runes)-4]) + \"****\"\n\t\t\tvalues = append(values, maskedValue)\n\t\t}\n\t}\n\n\treturn strings.Join(values, \",\")\n}\n"
},
{
"path": "alert/dispatch/log.go",
"content": "package dispatch\n\nimport (\n\t\"github.com/ccfos/nightingale/v6/models\"\n\n\t\"github.com/toolkits/pkg/logger\"\n)\n\nfunc LogEvent(event *models.AlertCurEvent, location string, err ...error) {\n\tstatus := \"triggered\"\n\tif event.IsRecovered {\n\t\tstatus = \"recovered\"\n\t}\n\n\tmessage := \"\"\n\tif len(err) > 0 && err[0] != nil {\n\t\tmessage = \"error_message: \" + err[0].Error()\n\t}\n\n\tlogger.Infof(\n\t\t\"alert_eval_%d event(%s %s) %s: sub_id:%d notify_rule_ids:%v cluster:%s %v%s@%d last_eval_time:%d %s\",\n\t\tevent.RuleId,\n\t\tevent.Hash,\n\t\tstatus,\n\t\tlocation,\n\t\tevent.SubRuleId,\n\t\tevent.NotifyRuleIds,\n\t\tevent.Cluster,\n\t\tevent.TagsJSON,\n\t\tevent.TriggerValue,\n\t\tevent.TriggerTime,\n\t\tevent.LastEvalTime,\n\t\tmessage,\n\t)\n}\n"
},
{
"path": "alert/dispatch/notify_channel.go",
"content": "package dispatch\n\n// NotifyChannels channelKey -> bool\ntype NotifyChannels map[string]bool\n\nfunc NewNotifyChannels(channels []string) NotifyChannels {\n\tnc := make(NotifyChannels)\n\tfor _, ch := range channels {\n\t\tnc[ch] = true\n\t}\n\treturn nc\n}\n\nfunc (nc NotifyChannels) OrMerge(other NotifyChannels) {\n\tnc.merge(other, func(a, b bool) bool { return a || b })\n}\n\nfunc (nc NotifyChannels) AndMerge(other NotifyChannels) {\n\tnc.merge(other, func(a, b bool) bool { return a && b })\n}\n\nfunc (nc NotifyChannels) merge(other NotifyChannels, f func(bool, bool) bool) {\n\tif other == nil {\n\t\treturn\n\t}\n\tfor k, v := range other {\n\t\tif curV, has := nc[k]; has {\n\t\t\tnc[k] = f(curV, v)\n\t\t} else {\n\t\t\tnc[k] = v\n\t\t}\n\t}\n}\n"
},
{
"path": "alert/dispatch/notify_target.go",
"content": "package dispatch\n\nimport (\n\t\"strconv\"\n\n\t\"github.com/ccfos/nightingale/v6/models\"\n)\n\n// NotifyTarget 维护所有需要发送的目标 用户-通道/回调/钩子信息,用map维护的数据结构具有去重功能\ntype NotifyTarget struct {\n\tuserMap map[int64]NotifyChannels\n\twebhooks map[string]*models.Webhook\n\tcallbacks map[string]struct{}\n}\n\nfunc NewNotifyTarget() *NotifyTarget {\n\treturn &NotifyTarget{\n\t\tuserMap: make(map[int64]NotifyChannels),\n\t\twebhooks: make(map[string]*models.Webhook),\n\t\tcallbacks: make(map[string]struct{}),\n\t}\n}\n\n// OrMerge 将 channelMap 按照 or 的方式合并,方便实现多种组合的策略,比如根据某个 tag 进行路由等\nfunc (s *NotifyTarget) OrMerge(other *NotifyTarget) {\n\ts.merge(other, NotifyChannels.OrMerge)\n}\n\n// AndMerge 将 channelMap 中的 bool 值按照 and 的逻辑进行合并,可以单独将人/通道维度的通知移除\n// 常用的场景有:\n// 1. 人员离职了不需要发送告警了\n// 2. 某个告警通道进行维护,暂时不需要发送告警了\n// 3. 业务值班的重定向逻辑,将高等级的告警额外发送给应急人员等\n// 可以结合业务需求自己实现router\nfunc (s *NotifyTarget) AndMerge(other *NotifyTarget) {\n\ts.merge(other, NotifyChannels.AndMerge)\n}\n\nfunc (s *NotifyTarget) merge(other *NotifyTarget, f func(NotifyChannels, NotifyChannels)) {\n\tif other == nil {\n\t\treturn\n\t}\n\tfor k, v := range other.userMap {\n\t\tif curV, has := s.userMap[k]; has {\n\t\t\tf(curV, v)\n\t\t} else {\n\t\t\ts.userMap[k] = v\n\t\t}\n\t}\n\tfor k, v := range other.webhooks {\n\t\ts.webhooks[k] = v\n\t}\n\tfor k, v := range other.callbacks {\n\t\ts.callbacks[k] = v\n\t}\n}\n\n// ToChannelUserMap userMap(map[uid][channel]bool) 转换为 map[channel][]uid 的结构\nfunc (s *NotifyTarget) ToChannelUserMap() map[string][]int64 {\n\tm := make(map[string][]int64)\n\tfor uid, nc := range s.userMap {\n\t\tfor ch, send := range nc {\n\t\t\tif send {\n\t\t\t\tm[ch] = append(m[ch], uid)\n\t\t\t}\n\t\t}\n\t}\n\treturn m\n}\n\nfunc (s *NotifyTarget) ToCallbackList() []string {\n\tcallbacks := make([]string, 0, len(s.callbacks))\n\tfor cb := range s.callbacks {\n\t\tcallbacks = append(callbacks, cb)\n\t}\n\treturn callbacks\n}\n\nfunc (s *NotifyTarget) ToWebhookMap() map[string]*models.Webhook {\n\treturn s.webhooks\n}\n\nfunc (s *NotifyTarget) ToUidList() []int64 {\n\tuids := make([]int64, 0, len(s.userMap))\n\tfor uid, _ := range s.userMap {\n\t\tuids = append(uids, uid)\n\t}\n\treturn uids\n}\n\n// Dispatch 抽象由告警事件到信息接收者的路由策略\n// rule: 告警规则\n// event: 告警事件\n// prev: 前一次路由结果, Dispatch 的实现可以直接修改 prev, 也可以返回一个新的 NotifyTarget 用于 AndMerge/OrMerge\ntype NotifyTargetDispatch func(rule *models.AlertRule, event *models.AlertCurEvent, prev *NotifyTarget, dispatch *Dispatch) *NotifyTarget\n\n// GroupDispatch 处理告警规则的组订阅关系\nfunc NotifyGroupDispatch(rule *models.AlertRule, event *models.AlertCurEvent, prev *NotifyTarget, dispatch *Dispatch) *NotifyTarget {\n\tgroupIds := make([]int64, 0, len(event.NotifyGroupsJSON))\n\tfor _, groupId := range event.NotifyGroupsJSON {\n\t\tgid, err := strconv.ParseInt(groupId, 10, 64)\n\t\tif err != nil {\n\t\t\tcontinue\n\t\t}\n\t\tgroupIds = append(groupIds, gid)\n\t}\n\n\tgroups := dispatch.userGroupCache.GetByUserGroupIds(groupIds)\n\tNotifyTarget := NewNotifyTarget()\n\tfor _, group := range groups {\n\t\tfor _, userId := range group.UserIds {\n\t\t\tNotifyTarget.userMap[userId] = NewNotifyChannels(event.NotifyChannelsJSON)\n\t\t}\n\t}\n\treturn NotifyTarget\n}\n\nfunc GlobalWebhookDispatch(rule *models.AlertRule, event *models.AlertCurEvent, prev *NotifyTarget, dispatch *Dispatch) *NotifyTarget {\n\twebhooks := dispatch.notifyConfigCache.GetWebhooks()\n\tNotifyTarget := NewNotifyTarget()\n\tfor _, webhook := range webhooks {\n\t\tif !webhook.Enable {\n\t\t\tcontinue\n\t\t}\n\t\tNotifyTarget.webhooks[webhook.Url] = webhook\n\t}\n\treturn NotifyTarget\n}\n\nfunc EventCallbacksDispatch(rule *models.AlertRule, event *models.AlertCurEvent, prev *NotifyTarget, dispatch *Dispatch) *NotifyTarget {\n\tfor _, c := range event.CallbacksJSON {\n\t\tif c == \"\" {\n\t\t\tcontinue\n\t\t}\n\t\tprev.callbacks[c] = struct{}{}\n\t}\n\treturn nil\n}\n"
},
{
"path": "alert/eval/alert_rule.go",
"content": "package eval\n\nimport (\n\t\"context\"\n\t\"fmt\"\n\t\"strconv\"\n\t\"time\"\n\n\t\"github.com/ccfos/nightingale/v6/alert/aconf\"\n\t\"github.com/ccfos/nightingale/v6/alert/astats\"\n\t\"github.com/ccfos/nightingale/v6/alert/naming\"\n\t\"github.com/ccfos/nightingale/v6/alert/process\"\n\t\"github.com/ccfos/nightingale/v6/datasource/commons/eslike\"\n\t\"github.com/ccfos/nightingale/v6/memsto\"\n\t\"github.com/ccfos/nightingale/v6/pkg/ctx\"\n\t\"github.com/ccfos/nightingale/v6/prom\"\n\t\"github.com/toolkits/pkg/logger\"\n)\n\ntype Scheduler struct {\n\t// key: hash\n\talertRules map[string]*AlertRuleWorker\n\n\tExternalProcessors *process.ExternalProcessorsType\n\n\taconf aconf.Alert\n\n\talertRuleCache *memsto.AlertRuleCacheType\n\ttargetCache *memsto.TargetCacheType\n\ttargetsOfAlertRuleCache *memsto.TargetsOfAlertRuleCacheType\n\tbusiGroupCache *memsto.BusiGroupCacheType\n\talertMuteCache *memsto.AlertMuteCacheType\n\tdatasourceCache *memsto.DatasourceCacheType\n\n\tpromClients *prom.PromClientMap\n\n\tnaming *naming.Naming\n\n\tctx *ctx.Context\n\tstats *astats.Stats\n}\n\nfunc NewScheduler(aconf aconf.Alert, externalProcessors *process.ExternalProcessorsType, arc *memsto.AlertRuleCacheType,\n\ttargetCache *memsto.TargetCacheType, toarc *memsto.TargetsOfAlertRuleCacheType,\n\tbusiGroupCache *memsto.BusiGroupCacheType, alertMuteCache *memsto.AlertMuteCacheType, datasourceCache *memsto.DatasourceCacheType,\n\tpromClients *prom.PromClientMap, naming *naming.Naming, ctx *ctx.Context, stats *astats.Stats) *Scheduler {\n\tscheduler := &Scheduler{\n\t\taconf: aconf,\n\t\talertRules: make(map[string]*AlertRuleWorker),\n\n\t\tExternalProcessors: externalProcessors,\n\n\t\talertRuleCache: arc,\n\t\ttargetCache: targetCache,\n\t\ttargetsOfAlertRuleCache: toarc,\n\t\tbusiGroupCache: busiGroupCache,\n\t\talertMuteCache: alertMuteCache,\n\t\tdatasourceCache: datasourceCache,\n\n\t\tpromClients: promClients,\n\t\tnaming: naming,\n\n\t\tctx: ctx,\n\t\tstats: stats,\n\t}\n\teslike.SetEsIndexPatternCacheType(memsto.NewEsIndexPatternCacheType(ctx))\n\n\tgo scheduler.LoopSyncRules(context.Background())\n\treturn scheduler\n}\n\nfunc (s *Scheduler) LoopSyncRules(ctx context.Context) {\n\ttime.Sleep(time.Duration(s.aconf.EngineDelay) * time.Second)\n\tduration := 9000 * time.Millisecond\n\tfor {\n\t\tselect {\n\t\tcase <-ctx.Done():\n\t\t\treturn\n\t\tcase <-time.After(duration):\n\t\t\ts.syncAlertRules()\n\t\t}\n\t}\n}\n\nfunc (s *Scheduler) syncAlertRules() {\n\tids := s.alertRuleCache.GetRuleIds()\n\talertRuleWorkers := make(map[string]*AlertRuleWorker)\n\texternalRuleWorkers := make(map[string]*process.Processor)\n\tfor _, id := range ids {\n\t\trule := s.alertRuleCache.Get(id)\n\t\tif rule == nil {\n\t\t\tcontinue\n\t\t}\n\n\t\truleType := rule.GetRuleType()\n\t\tif rule.IsPrometheusRule() || rule.IsInnerRule() {\n\t\t\tdatasourceIds := s.datasourceCache.GetIDsByDsCateAndQueries(rule.Cate, rule.DatasourceQueries)\n\t\t\tfor _, dsId := range datasourceIds {\n\t\t\t\tif !naming.DatasourceHashRing.IsHit(strconv.FormatInt(dsId, 10), fmt.Sprintf(\"%d\", rule.Id), s.aconf.Heartbeat.Endpoint) {\n\t\t\t\t\tcontinue\n\t\t\t\t}\n\t\t\t\tds := s.datasourceCache.GetById(dsId)\n\t\t\t\tif ds == nil {\n\t\t\t\t\tlogger.Debugf(\"alert_eval_%d datasource %d not found\", rule.Id, dsId)\n\t\t\t\t\tcontinue\n\t\t\t\t}\n\n\t\t\t\tif ds.PluginType != ruleType {\n\t\t\t\t\tlogger.Debugf(\"alert_eval_%d datasource %d category is %s not %s\", rule.Id, dsId, ds.PluginType, ruleType)\n\t\t\t\t\tcontinue\n\t\t\t\t}\n\n\t\t\t\tif ds.Status != \"enabled\" {\n\t\t\t\t\tlogger.Debugf(\"alert_eval_%d datasource %d status is %s\", rule.Id, dsId, ds.Status)\n\t\t\t\t\tcontinue\n\t\t\t\t}\n\t\t\t\tprocessor := process.NewProcessor(s.aconf.Heartbeat.EngineName, rule, dsId, s.alertRuleCache, s.targetCache, s.targetsOfAlertRuleCache, s.busiGroupCache, s.alertMuteCache, s.datasourceCache, s.ctx, s.stats)\n\n\t\t\t\talertRule := NewAlertRuleWorker(rule, dsId, processor, s.promClients, s.ctx)\n\t\t\t\talertRuleWorkers[alertRule.Hash()] = alertRule\n\t\t\t}\n\t\t} else if rule.IsHostRule() {\n\t\t\t// all host rule will be processed by center instance\n\t\t\tif !naming.DatasourceHashRing.IsHit(s.aconf.Heartbeat.EngineName, strconv.FormatInt(rule.Id, 10), s.aconf.Heartbeat.Endpoint) {\n\t\t\t\tcontinue\n\t\t\t}\n\t\t\tprocessor := process.NewProcessor(s.aconf.Heartbeat.EngineName, rule, 0, s.alertRuleCache, s.targetCache, s.targetsOfAlertRuleCache, s.busiGroupCache, s.alertMuteCache, s.datasourceCache, s.ctx, s.stats)\n\t\t\talertRule := NewAlertRuleWorker(rule, 0, processor, s.promClients, s.ctx)\n\t\t\talertRuleWorkers[alertRule.Hash()] = alertRule\n\t\t} else {\n\t\t\t// 如果 rule 不是通过 prometheus engine 来告警的,则创建为 externalRule\n\t\t\t// if rule is not processed by prometheus engine, create it as externalRule\n\t\t\tdsIds := s.datasourceCache.GetIDsByDsCateAndQueries(rule.Cate, rule.DatasourceQueries)\n\t\t\tfor _, dsId := range dsIds {\n\t\t\t\tds := s.datasourceCache.GetById(dsId)\n\t\t\t\tif ds == nil {\n\t\t\t\t\tlogger.Debugf(\"alert_eval_%d datasource %d not found\", rule.Id, dsId)\n\t\t\t\t\tcontinue\n\t\t\t\t}\n\n\t\t\t\tif ds.Status != \"enabled\" {\n\t\t\t\t\tlogger.Debugf(\"alert_eval_%d datasource %d status is %s\", rule.Id, dsId, ds.Status)\n\t\t\t\t\tcontinue\n\t\t\t\t}\n\t\t\t\tprocessor := process.NewProcessor(s.aconf.Heartbeat.EngineName, rule, dsId, s.alertRuleCache, s.targetCache, s.targetsOfAlertRuleCache, s.busiGroupCache, s.alertMuteCache, s.datasourceCache, s.ctx, s.stats)\n\t\t\t\texternalRuleWorkers[processor.Key()] = processor\n\t\t\t}\n\t\t}\n\t}\n\n\tfor hash, rule := range alertRuleWorkers {\n\t\tif _, has := s.alertRules[hash]; !has {\n\t\t\trule.Prepare()\n\t\t\ttime.Sleep(time.Duration(20) * time.Millisecond)\n\t\t\trule.Start()\n\t\t\ts.alertRules[hash] = rule\n\t\t}\n\t}\n\n\tfor hash, rule := range s.alertRules {\n\t\tif _, has := alertRuleWorkers[hash]; !has {\n\t\t\trule.Stop()\n\t\t\tdelete(s.alertRules, hash)\n\t\t}\n\t}\n\n\ts.ExternalProcessors.ExternalLock.Lock()\n\tfor key, processor := range externalRuleWorkers {\n\t\tif curProcessor, has := s.ExternalProcessors.Processors[key]; has {\n\t\t\t// rule存在,且hash一致,认为没有变更,这里可以根据需求单独实现一个关联数据更多的hash函数\n\t\t\tif processor.Hash() == curProcessor.Hash() {\n\t\t\t\tcontinue\n\t\t\t}\n\t\t}\n\n\t\t// 现有规则中没有rule以及有rule但hash不一致的场景,需要触发rule的update\n\t\tprocessor.RecoverAlertCurEventFromDb()\n\t\ts.ExternalProcessors.Processors[key] = processor\n\t}\n\n\tfor key := range s.ExternalProcessors.Processors {\n\t\tif _, has := externalRuleWorkers[key]; !has {\n\t\t\tdelete(s.ExternalProcessors.Processors, key)\n\t\t}\n\t}\n\ts.ExternalProcessors.ExternalLock.Unlock()\n}\n"
},
{
"path": "alert/eval/eval.go",
"content": "package eval\n\nimport (\n\t\"context\"\n\t\"encoding/json\"\n\t\"errors\"\n\t\"fmt\"\n\t\"math\"\n\t\"reflect\"\n\t\"sort\"\n\t\"strconv\"\n\t\"strings\"\n\t\"sync\"\n\t\"text/template\"\n\t\"time\"\n\n\t\"github.com/ccfos/nightingale/v6/alert/astats\"\n\t\"github.com/ccfos/nightingale/v6/alert/common\"\n\t\"github.com/ccfos/nightingale/v6/alert/process\"\n\t\"github.com/ccfos/nightingale/v6/dscache\"\n\t\"github.com/ccfos/nightingale/v6/models\"\n\t\"github.com/ccfos/nightingale/v6/pkg/ctx\"\n\t\"github.com/ccfos/nightingale/v6/pkg/hash\"\n\t\"github.com/ccfos/nightingale/v6/pkg/parser\"\n\t\"github.com/ccfos/nightingale/v6/pkg/poster\"\n\tpromsdk \"github.com/ccfos/nightingale/v6/pkg/prom\"\n\tpromql2 \"github.com/ccfos/nightingale/v6/pkg/promql\"\n\t\"github.com/ccfos/nightingale/v6/pkg/tplx\"\n\t\"github.com/ccfos/nightingale/v6/pkg/unit\"\n\t\"github.com/ccfos/nightingale/v6/prom\"\n\t\"github.com/prometheus/common/model\"\n\n\t\"github.com/robfig/cron/v3\"\n\t\"github.com/toolkits/pkg/logger\"\n\t\"github.com/toolkits/pkg/str\"\n)\n\ntype AlertRuleWorker struct {\n\tDatasourceId int64\n\tQuit chan struct{}\n\tInhibit bool\n\n\tRule *models.AlertRule\n\n\tProcessor *process.Processor\n\n\tPromClients *prom.PromClientMap\n\tCtx *ctx.Context\n\n\tScheduler *cron.Cron\n\n\tHostAndDeviceIdentCache sync.Map\n\n\tLastSeriesStore map[uint64]models.DataResp\n\n\tDeviceIdentHook func(arw *AlertRuleWorker, paramQuery models.ParamQuery) ([]string, error)\n}\n\nconst (\n\tGET_RULE_CONFIG = \"get_rule_config\"\n\tGET_Processor = \"get_Processor\"\n\tCHECK_QUERY = \"check_query_config\"\n\tGET_CLIENT = \"get_client\"\n\tQUERY_DATA = \"query_data\"\n\tEXEC_TEMPLATE = \"exec_template\"\n)\n\nconst (\n\tJoinMark = \"@@\"\n)\n\ntype JoinType string\n\nconst (\n\tLeft JoinType = \"left\"\n\tRight JoinType = \"right\"\n\tInner JoinType = \"inner\"\n)\n\nfunc NewAlertRuleWorker(rule *models.AlertRule, datasourceId int64, Processor *process.Processor, promClients *prom.PromClientMap, ctx *ctx.Context) *AlertRuleWorker {\n\tarw := &AlertRuleWorker{\n\t\tDatasourceId: datasourceId,\n\t\tQuit: make(chan struct{}),\n\t\tRule: rule,\n\t\tProcessor: Processor,\n\n\t\tPromClients: promClients,\n\t\tCtx: ctx,\n\t\tHostAndDeviceIdentCache: sync.Map{},\n\t\tDeviceIdentHook: func(arw *AlertRuleWorker, paramQuery models.ParamQuery) ([]string, error) {\n\t\t\treturn nil, nil\n\t\t},\n\t\tLastSeriesStore: make(map[uint64]models.DataResp),\n\t}\n\n\tinterval := rule.PromEvalInterval\n\tif interval <= 0 {\n\t\tinterval = 10\n\t}\n\n\tif rule.CronPattern == \"\" {\n\t\trule.CronPattern = fmt.Sprintf(\"@every %ds\", interval)\n\t}\n\n\tarw.Scheduler = cron.New(cron.WithSeconds(), cron.WithChain(cron.SkipIfStillRunning(cron.DefaultLogger)))\n\n\tentryID, err := arw.Scheduler.AddFunc(rule.CronPattern, func() {\n\t\tarw.Eval()\n\t})\n\n\tif err != nil {\n\t\tlogger.Errorf(\"alert_eval_%d datasource_%d add cron pattern error: %v\", arw.Rule.Id, arw.DatasourceId, err)\n\t}\n\n\tProcessor.ScheduleEntry = arw.Scheduler.Entry(entryID)\n\n\tProcessor.PromEvalInterval = getPromEvalInterval(Processor.ScheduleEntry.Schedule)\n\treturn arw\n}\n\nfunc getPromEvalInterval(schedule cron.Schedule) int {\n\tnow := time.Now()\n\tnext1 := schedule.Next(now)\n\tnext2 := schedule.Next(next1)\n\treturn int(next2.Sub(next1).Seconds())\n}\n\nfunc (arw *AlertRuleWorker) Key() string {\n\treturn common.RuleKey(arw.DatasourceId, arw.Rule.Id)\n}\n\nfunc (arw *AlertRuleWorker) Hash() string {\n\treturn str.MD5(fmt.Sprintf(\"%d_%s_%s_%d\",\n\t\tarw.Rule.Id,\n\t\tarw.Rule.CronPattern,\n\t\tarw.Rule.RuleConfig,\n\t\tarw.DatasourceId,\n\t))\n}\n\nfunc (arw *AlertRuleWorker) Prepare() {\n\tarw.Processor.RecoverAlertCurEventFromDb()\n}\n\nfunc (arw *AlertRuleWorker) Start() {\n\tarw.Scheduler.Start()\n}\n\nfunc (arw *AlertRuleWorker) Eval() {\n\tbegin := time.Now()\n\tvar message string\n\n\tdefer func() {\n\t\tif len(message) == 0 {\n\t\t\tlogger.Infof(\"alert_eval_%d datasource_%d finished, duration:%v\", arw.Rule.Id, arw.DatasourceId, time.Since(begin))\n\t\t} else {\n\t\t\tlogger.Warningf(\"alert_eval_%d datasource_%d finished, duration:%v, message:%s\", arw.Rule.Id, arw.DatasourceId, time.Since(begin), message)\n\t\t}\n\t}()\n\n\tif arw.Processor.PromEvalInterval == 0 {\n\t\tarw.Processor.PromEvalInterval = getPromEvalInterval(arw.Processor.ScheduleEntry.Schedule)\n\t}\n\n\tcachedRule := arw.Rule\n\tif cachedRule == nil {\n\t\tmessage = \"rule not found\"\n\t\treturn\n\t}\n\tarw.Processor.Stats.CounterRuleEval.WithLabelValues().Inc()\n\tarw.HostAndDeviceIdentCache = sync.Map{}\n\n\ttyp := cachedRule.GetRuleType()\n\tvar (\n\t\tanomalyPoints []models.AnomalyPoint\n\t\trecoverPoints []models.AnomalyPoint\n\t\terr error\n\t)\n\n\tswitch typ {\n\tcase models.PROMETHEUS:\n\t\tanomalyPoints, err = arw.GetPromAnomalyPoint(cachedRule.RuleConfig)\n\tcase models.HOST:\n\t\tanomalyPoints, err = arw.GetHostAnomalyPoint(cachedRule.RuleConfig)\n\tcase models.LOKI:\n\t\tanomalyPoints, err = arw.GetPromAnomalyPoint(cachedRule.RuleConfig)\n\tdefault:\n\t\tanomalyPoints, recoverPoints, err = arw.GetAnomalyPoint(cachedRule, arw.Processor.DatasourceId())\n\t}\n\n\tif err != nil {\n\t\tmessage = fmt.Sprintf(\"failed to get anomaly points: %v\", err)\n\t\treturn\n\t}\n\n\tif arw.Processor == nil {\n\t\tmessage = \"processor is nil\"\n\t\treturn\n\t}\n\n\tif arw.Inhibit {\n\t\tpointsMap := make(map[string]models.AnomalyPoint)\n\t\tfor _, point := range recoverPoints {\n\t\t\t// 对于恢复的事件,合并处理\n\t\t\ttagHash := process.TagHash(point)\n\n\t\t\tp, exists := pointsMap[tagHash]\n\t\t\tif !exists {\n\t\t\t\tpointsMap[tagHash] = point\n\t\t\t\tcontinue\n\t\t\t}\n\n\t\t\tif p.Severity > point.Severity {\n\t\t\t\thash := process.Hash(cachedRule.Id, arw.Processor.DatasourceId(), p)\n\t\t\t\tarw.Processor.DeleteProcessEvent(hash)\n\t\t\t\tmodels.AlertCurEventDelByHash(arw.Ctx, hash)\n\n\t\t\t\tpointsMap[tagHash] = point\n\t\t\t}\n\t\t}\n\n\t\tnow := time.Now().Unix()\n\t\tfor _, point := range pointsMap {\n\t\t\tstr := fmt.Sprintf(\"%v\", point.Value)\n\t\t\tarw.Processor.RecoverSingle(true, process.Hash(cachedRule.Id, arw.Processor.DatasourceId(), point), now, &str)\n\t\t}\n\t} else {\n\t\tnow := time.Now().Unix()\n\t\tfor _, point := range recoverPoints {\n\t\t\tstr := fmt.Sprintf(\"%v\", point.Value)\n\t\t\tarw.Processor.RecoverSingle(true, process.Hash(cachedRule.Id, arw.Processor.DatasourceId(), point), now, &str)\n\t\t}\n\t}\n\n\tarw.Processor.Handle(anomalyPoints, \"inner\", arw.Inhibit)\n}\n\nfunc (arw *AlertRuleWorker) Stop() {\n\tlogger.Infof(\"alert_eval_%d datasource_%d stopped\", arw.Rule.Id, arw.DatasourceId)\n\tclose(arw.Quit)\n\tc := arw.Scheduler.Stop()\n\t<-c.Done()\n\n}\n\nfunc (arw *AlertRuleWorker) GetPromAnomalyPoint(ruleConfig string) ([]models.AnomalyPoint, error) {\n\tvar lst []models.AnomalyPoint\n\tstart := time.Now()\n\tdefer func() {\n\t\tarw.Processor.Stats.GaugeRuleEvalDuration.WithLabelValues(fmt.Sprintf(\"%v\", arw.Rule.Id), fmt.Sprintf(\"%v\", arw.Processor.DatasourceId())).Set(float64(time.Since(start).Milliseconds()))\n\t}()\n\n\tvar rule *models.PromRuleConfig\n\tif err := json.Unmarshal([]byte(ruleConfig), &rule); err != nil {\n\t\tlogger.Errorf(\"alert_eval_%d datasource_%d rule_config:%s, error:%v\", arw.Rule.Id, arw.DatasourceId, ruleConfig, err)\n\t\tarw.Processor.Stats.CounterRuleEvalErrorTotal.WithLabelValues(fmt.Sprintf(\"%v\", arw.Processor.DatasourceId()), GET_RULE_CONFIG, arw.Processor.BusiGroupCache.GetNameByBusiGroupId(arw.Rule.GroupId), fmt.Sprintf(\"%v\", arw.Rule.Id)).Inc()\n\t\tarw.Processor.Stats.GaugeQuerySeriesCount.WithLabelValues(\n\t\t\tfmt.Sprintf(\"%v\", arw.Rule.Id),\n\t\t\tfmt.Sprintf(\"%v\", arw.Processor.DatasourceId()),\n\t\t\t\"\",\n\t\t).Set(0)\n\t\treturn lst, err\n\t}\n\n\tif rule == nil {\n\t\tlogger.Errorf(\"alert_eval_%d datasource_%d rule_config:%s, error:rule is nil\", arw.Rule.Id, arw.DatasourceId, ruleConfig)\n\t\tarw.Processor.Stats.CounterRuleEvalErrorTotal.WithLabelValues(fmt.Sprintf(\"%v\", arw.Processor.DatasourceId()), GET_RULE_CONFIG, arw.Processor.BusiGroupCache.GetNameByBusiGroupId(arw.Rule.GroupId), fmt.Sprintf(\"%v\", arw.Rule.Id)).Inc()\n\t\tarw.Processor.Stats.GaugeQuerySeriesCount.WithLabelValues(\n\t\t\tfmt.Sprintf(\"%v\", arw.Rule.Id),\n\t\t\tfmt.Sprintf(\"%v\", arw.Processor.DatasourceId()),\n\t\t\t\"\",\n\t\t).Set(0)\n\t\treturn lst, errors.New(\"rule is nil\")\n\t}\n\n\tarw.Inhibit = rule.Inhibit\n\tfor i, query := range rule.Queries {\n\t\treaderClient := arw.PromClients.GetCli(arw.DatasourceId)\n\n\t\tif readerClient == nil {\n\t\t\tlogger.Warningf(\"alert_eval_%d datasource_%d error reader client is nil\", arw.Rule.Id, arw.DatasourceId)\n\t\t\tarw.Processor.Stats.CounterRuleEvalErrorTotal.WithLabelValues(fmt.Sprintf(\"%v\", arw.Processor.DatasourceId()), GET_CLIENT, arw.Processor.BusiGroupCache.GetNameByBusiGroupId(arw.Rule.GroupId), fmt.Sprintf(\"%v\", arw.Rule.Id)).Inc()\n\t\t\tarw.Processor.Stats.GaugeQuerySeriesCount.WithLabelValues(\n\t\t\t\tfmt.Sprintf(\"%v\", arw.Rule.Id),\n\t\t\t\tfmt.Sprintf(\"%v\", arw.Processor.DatasourceId()),\n\t\t\t\tfmt.Sprintf(\"%v\", i),\n\t\t\t).Set(-2)\n\t\t\tcontinue\n\t\t}\n\n\t\tif query.VarEnabled && strings.Contains(query.PromQl, \"$\") {\n\t\t\tvar anomalyPoints []models.AnomalyPoint\n\t\t\tif hasLabelLossAggregator(query) || notExactMatch(query) {\n\t\t\t\t// 若有聚合函数或非精确匹配则需要先填充变量然后查询,这个方式效率较低\n\t\t\t\tanomalyPoints = arw.VarFillingBeforeQuery(query, readerClient)\n\t\t\t\tarw.Processor.Stats.CounterVarFillingQuery.WithLabelValues(\n\t\t\t\t\tfmt.Sprintf(\"%v\", arw.Rule.Id),\n\t\t\t\t\tfmt.Sprintf(\"%v\", arw.Processor.DatasourceId()),\n\t\t\t\t\tfmt.Sprintf(\"%v\", i),\n\t\t\t\t\t\"BeforeQuery\",\n\t\t\t\t).Inc()\n\t\t\t} else {\n\t\t\t\t// 先查询再过滤变量,效率较高,但无法处理有聚合函数的情况\n\t\t\t\tanomalyPoints = arw.VarFillingAfterQuery(query, readerClient)\n\t\t\t\tarw.Processor.Stats.CounterVarFillingQuery.WithLabelValues(\n\t\t\t\t\tfmt.Sprintf(\"%v\", arw.Rule.Id),\n\t\t\t\t\tfmt.Sprintf(\"%v\", arw.Processor.DatasourceId()),\n\t\t\t\t\tfmt.Sprintf(\"%v\", i),\n\t\t\t\t\t\"AfterQuery\",\n\t\t\t\t).Inc()\n\t\t\t}\n\t\t\tlst = append(lst, anomalyPoints...)\n\t\t} else {\n\t\t\t// 无变量\n\t\t\tpromql := strings.TrimSpace(query.PromQl)\n\t\t\tif promql == \"\" {\n\t\t\t\tlogger.Warningf(\"alert_eval_%d datasource_%d promql is blank\", arw.Rule.Id, arw.DatasourceId)\n\t\t\t\tarw.Processor.Stats.CounterRuleEvalErrorTotal.WithLabelValues(fmt.Sprintf(\"%v\", arw.Processor.DatasourceId()), CHECK_QUERY, arw.Processor.BusiGroupCache.GetNameByBusiGroupId(arw.Rule.GroupId), fmt.Sprintf(\"%v\", arw.Rule.Id)).Inc()\n\t\t\t\tcontinue\n\t\t\t}\n\n\t\t\tif arw.PromClients.IsNil(arw.DatasourceId) {\n\t\t\t\tlogger.Warningf(\"alert_eval_%d datasource_%d error reader client is nil\", arw.Rule.Id, arw.DatasourceId)\n\t\t\t\tarw.Processor.Stats.CounterRuleEvalErrorTotal.WithLabelValues(fmt.Sprintf(\"%v\", arw.Processor.DatasourceId()), GET_CLIENT, arw.Processor.BusiGroupCache.GetNameByBusiGroupId(arw.Rule.GroupId), fmt.Sprintf(\"%v\", arw.Rule.Id)).Inc()\n\t\t\t\tcontinue\n\t\t\t}\n\n\t\t\tvar warnings promsdk.Warnings\n\t\t\tarw.Processor.Stats.CounterQueryDataTotal.WithLabelValues(fmt.Sprintf(\"%d\", arw.DatasourceId), fmt.Sprintf(\"%d\", arw.Rule.Id)).Inc()\n\t\t\tvalue, warnings, err := readerClient.Query(context.Background(), promql, time.Now())\n\t\t\tif err != nil {\n\t\t\t\tlogger.Errorf(\"alert_eval_%d datasource_%d promql:%s, error:%v\", arw.Rule.Id, arw.DatasourceId, promql, err)\n\t\t\t\tarw.Processor.Stats.CounterQueryDataErrorTotal.WithLabelValues(fmt.Sprintf(\"%d\", arw.DatasourceId)).Inc()\n\t\t\t\tarw.Processor.Stats.CounterRuleEvalErrorTotal.WithLabelValues(fmt.Sprintf(\"%v\", arw.Processor.DatasourceId()), QUERY_DATA, arw.Processor.BusiGroupCache.GetNameByBusiGroupId(arw.Rule.GroupId), fmt.Sprintf(\"%v\", arw.Rule.Id)).Inc()\n\t\t\t\tarw.Processor.Stats.GaugeQuerySeriesCount.WithLabelValues(\n\t\t\t\t\tfmt.Sprintf(\"%v\", arw.Rule.Id),\n\t\t\t\t\tfmt.Sprintf(\"%v\", arw.Processor.DatasourceId()),\n\t\t\t\t\tfmt.Sprintf(\"%v\", i),\n\t\t\t\t).Set(-1)\n\t\t\t\treturn lst, err\n\t\t\t}\n\n\t\t\tif len(warnings) > 0 {\n\t\t\t\tlogger.Errorf(\"alert_eval_%d datasource_%d promql:%s, warnings:%v\", arw.Rule.Id, arw.DatasourceId, promql, warnings)\n\t\t\t\tarw.Processor.Stats.CounterQueryDataErrorTotal.WithLabelValues(fmt.Sprintf(\"%d\", arw.DatasourceId)).Inc()\n\t\t\t\tarw.Processor.Stats.CounterRuleEvalErrorTotal.WithLabelValues(fmt.Sprintf(\"%v\", arw.Processor.DatasourceId()), QUERY_DATA, arw.Processor.BusiGroupCache.GetNameByBusiGroupId(arw.Rule.GroupId), fmt.Sprintf(\"%v\", arw.Rule.Id)).Inc()\n\t\t\t}\n\n\t\t\tlogger.Infof(\"alert_eval_%d datasource_%d query:%+v, value:%v\", arw.Rule.Id, arw.DatasourceId, query, value)\n\t\t\tpoints := models.ConvertAnomalyPoints(value)\n\t\t\tarw.Processor.Stats.GaugeQuerySeriesCount.WithLabelValues(\n\t\t\t\tfmt.Sprintf(\"%v\", arw.Rule.Id),\n\t\t\t\tfmt.Sprintf(\"%v\", arw.Processor.DatasourceId()),\n\t\t\t\tfmt.Sprintf(\"%v\", i),\n\t\t\t).Set(float64(len(points)))\n\n\t\t\tfor i := 0; i < len(points); i++ {\n\t\t\t\tpoints[i].Severity = query.Severity\n\t\t\t\tpoints[i].Query = promql\n\t\t\t\tpoints[i].ValuesUnit = map[string]unit.FormattedValue{\n\t\t\t\t\t\"v\": unit.ValueFormatter(query.Unit, 2, points[i].Value),\n\t\t\t\t}\n\t\t\t}\n\n\t\t\tlst = append(lst, points...)\n\t\t}\n\n\t\tarw.Processor.Stats.GaugeQuerySeriesCount.WithLabelValues(\n\t\t\tfmt.Sprintf(\"%v\", arw.Rule.Id),\n\t\t\tfmt.Sprintf(\"%v\", arw.Processor.DatasourceId()),\n\t\t\tfmt.Sprintf(\"%v\", i),\n\t\t).Set(float64(len(lst)))\n\t}\n\n\treturn lst, nil\n}\n\ntype sample struct {\n\tMetric model.Metric `json:\"metric\"`\n\tValue model.SampleValue `json:\"value\"`\n\tTimestamp model.Time\n}\n\n// VarFillingAfterQuery 填充变量,先查询再填充变量\n// 公式: mem_used_percent{host=\"$host\"} > $val 其中 $host 为参数变量,$val 为值变量\n// 实现步骤:\n// 依次遍历参数配置节点,保证同一参数变量的子筛选可以覆盖上一层筛选\n// 每个节点先查询无参数的 query, 即 mem_used_percent{} > curVal, 得到满足值变量的所有结果\n// 结果中有满足本节点参数变量的值,加入异常点列表\n// 参数变量的值不满足的组合,需要覆盖上层筛选中产生的异常点\nfunc (arw *AlertRuleWorker) VarFillingAfterQuery(query models.PromQuery, readerClient promsdk.API) []models.AnomalyPoint {\n\tvarToLabel := ExtractVarMapping(query.PromQl)\n\tfullQuery := removeVal(query.PromQl)\n\t// 存储所有的异常点,key 为参数变量的组合,可以实现子筛选对上一层筛选的覆盖\n\tanomalyPointsMap := make(map[string]models.AnomalyPoint)\n\t// 统一变量配置格式\n\tVarConfigForCalc := &models.ChildVarConfig{\n\t\tParamVal: make([]map[string]models.ParamQuery, 1),\n\t\tChildVarConfigs: query.VarConfig.ChildVarConfigs,\n\t}\n\tVarConfigForCalc.ParamVal[0] = make(map[string]models.ParamQuery)\n\tfor _, p := range query.VarConfig.ParamVal {\n\t\tVarConfigForCalc.ParamVal[0][p.Name] = models.ParamQuery{\n\t\t\tParamType: p.ParamType,\n\t\t\tQuery: p.Query,\n\t\t}\n\t}\n\t// 使用一个统一的参数变量顺序\n\tvar ParamKeys []string\n\tfor val, valQuery := range VarConfigForCalc.ParamVal[0] {\n\t\tif valQuery.ParamType == \"threshold\" {\n\t\t\tcontinue\n\t\t}\n\t\tParamKeys = append(ParamKeys, val)\n\t}\n\tsort.Slice(ParamKeys, func(i, j int) bool {\n\t\treturn ParamKeys[i] < ParamKeys[j]\n\t})\n\t// 遍历变量配置链表\n\tcurNode := VarConfigForCalc\n\tfor curNode != nil {\n\t\tfor _, param := range curNode.ParamVal {\n\t\t\t// curQuery 当前节点的无参数 query,用于时序库查询\n\t\t\tcurQuery := fullQuery\n\t\t\t// realQuery 当前节点产生异常点的 query,用于告警展示\n\t\t\trealQuery := query.PromQl\n\t\t\t// 取出阈值变量\n\t\t\tvalMap := make(map[string]string)\n\t\t\tfor val, valQuery := range param {\n\t\t\t\tif valQuery.ParamType == \"threshold\" {\n\t\t\t\t\tvalMap[val] = getString(valQuery.Query)\n\t\t\t\t}\n\t\t\t}\n\t\t\t// 替换值变量\n\t\t\tfor key, val := range valMap {\n\t\t\t\tcurQuery = strings.Replace(curQuery, fmt.Sprintf(\"$%s\", key), val, -1)\n\t\t\t\trealQuery = strings.Replace(realQuery, fmt.Sprintf(\"$%s\", key), val, -1)\n\t\t\t}\n\t\t\t// 得到满足值变量的所有结果\n\t\t\tarw.Processor.Stats.CounterQueryDataTotal.WithLabelValues(fmt.Sprintf(\"%d\", arw.DatasourceId), fmt.Sprintf(\"%d\", arw.Rule.Id)).Inc()\n\t\t\tvalue, _, err := readerClient.Query(context.Background(), curQuery, time.Now())\n\t\t\tif err != nil {\n\t\t\t\tlogger.Errorf(\"alert_eval_%d datasource_%d promql:%s, error:%v\", arw.Rule.Id, arw.DatasourceId, curQuery, err)\n\t\t\t\tcontinue\n\t\t\t}\n\t\t\tseqVals := getSamples(value)\n\t\t\t// 得到参数变量的所有组合\n\t\t\tparamPermutation, err := arw.getParamPermutation(param, ParamKeys, varToLabel, query.PromQl, readerClient)\n\t\t\tif err != nil {\n\t\t\t\tlogger.Errorf(\"alert_eval_%d datasource_%d paramPermutation error:%v\", arw.Rule.Id, arw.DatasourceId, err)\n\t\t\t\tcontinue\n\t\t\t}\n\t\t\t// 判断哪些参数值符合条件\n\t\t\tfor i := range seqVals {\n\t\t\t\tcurRealQuery := realQuery\n\t\t\t\tvar cur []string\n\t\t\t\tfor _, paramKey := range ParamKeys {\n\t\t\t\t\tval := string(seqVals[i].Metric[model.LabelName(varToLabel[paramKey])])\n\t\t\t\t\tcur = append(cur, val)\n\t\t\t\t\tcurRealQuery = fillVar(curRealQuery, paramKey, val)\n\t\t\t\t}\n\n\t\t\t\tif _, ok := paramPermutation[strings.Join(cur, JoinMark)]; ok {\n\t\t\t\t\tanomalyPointsMap[strings.Join(cur, JoinMark)] = models.AnomalyPoint{\n\t\t\t\t\t\tKey: seqVals[i].Metric.String(),\n\t\t\t\t\t\tTimestamp: seqVals[i].Timestamp.Unix(),\n\t\t\t\t\t\tValue: float64(seqVals[i].Value),\n\t\t\t\t\t\tLabels: seqVals[i].Metric,\n\t\t\t\t\t\tSeverity: query.Severity,\n\t\t\t\t\t\tQuery: curRealQuery,\n\t\t\t\t\t}\n\t\t\t\t\t// 生成异常点后,删除该参数组合\n\t\t\t\t\tdelete(paramPermutation, strings.Join(cur, JoinMark))\n\t\t\t\t}\n\t\t\t}\n\n\t\t\t// 剩余的参数组合为本层筛选不产生异常点的组合,需要覆盖上层筛选中产生的异常点\n\t\t\tfor k, _ := range paramPermutation {\n\t\t\t\tdelete(anomalyPointsMap, k)\n\t\t\t}\n\t\t}\n\t\tcurNode = curNode.ChildVarConfigs\n\t}\n\n\tanomalyPoints := make([]models.AnomalyPoint, 0)\n\tfor _, point := range anomalyPointsMap {\n\t\tanomalyPoints = append(anomalyPoints, point)\n\t}\n\treturn anomalyPoints\n}\n\n// getSamples 获取查询结果的所有样本,并转化为统一的格式\nfunc getSamples(value model.Value) []sample {\n\tvar seqVals []sample\n\tswitch value.Type() {\n\tcase model.ValVector:\n\t\titems, ok := value.(model.Vector)\n\t\tif !ok {\n\t\t\tbreak\n\t\t}\n\t\tfor i := range items {\n\t\t\tseqVals = append(seqVals, sample{\n\t\t\t\tMetric: items[i].Metric,\n\t\t\t\tValue: items[i].Value,\n\t\t\t\tTimestamp: items[i].Timestamp,\n\t\t\t})\n\t\t}\n\tcase model.ValMatrix:\n\t\titems, ok := value.(model.Matrix)\n\t\tif !ok {\n\t\t\tbreak\n\t\t}\n\t\tfor i := range items {\n\t\t\tlast := items[i].Values[len(items[i].Values)-1]\n\t\t\tseqVals = append(seqVals, sample{\n\t\t\t\tMetric: items[i].Metric,\n\t\t\t\tValue: last.Value,\n\t\t\t\tTimestamp: last.Timestamp,\n\t\t\t})\n\t\t}\n\tdefault:\n\t}\n\treturn seqVals\n}\n\n// removeVal 去除 promql 中的参数变量\n// mem{test1=\\\"$test1\\\",test2=\\\"test2\\\"} > $val1 and mem{test3=\\\"test3\\\",test4=\\\"$test4\\\"} > $val2\n// ==> mem{test2=\\\"test2\\\"} > $val1 and mem{test3=\\\"test3\\\"} > $val2\nfunc removeVal(promql string) string {\n\tsb := strings.Builder{}\n\tn := len(promql)\n\tstart := false\n\tlastIdx := 0\n\tcurIdx := 0\n\tisVar := false\n\tfor curIdx < n {\n\t\tif !start {\n\t\t\tif promql[curIdx] == '{' {\n\t\t\t\tstart = true\n\t\t\t\tlastIdx = curIdx\n\t\t\t}\n\t\t\tsb.WriteRune(rune(promql[curIdx]))\n\t\t} else {\n\t\t\tif promql[curIdx] == '$' {\n\t\t\t\tisVar = true\n\t\t\t}\n\t\t\tif promql[curIdx] == ',' || promql[curIdx] == '}' {\n\t\t\t\tif !isVar {\n\t\t\t\t\tif sb.String()[sb.Len()-1] == '{' {\n\t\t\t\t\t\tlastIdx++\n\t\t\t\t\t}\n\t\t\t\t\tsb.WriteString(promql[lastIdx:curIdx])\n\t\t\t\t}\n\t\t\t\tisVar = false\n\t\t\t\tif promql[curIdx] == '}' {\n\t\t\t\t\tstart = false\n\t\t\t\t\tsb.WriteRune(rune(promql[curIdx]))\n\t\t\t\t}\n\t\t\t\tlastIdx = curIdx\n\t\t\t}\n\t\t}\n\t\tcurIdx++\n\t}\n\n\treturn sb.String()\n}\n\n// 获取参数变量的所有组合\nfunc (arw *AlertRuleWorker) getParamPermutation(paramVal map[string]models.ParamQuery, paramKeys []string, varToLabel map[string]string, originPromql string, readerClient promsdk.API) (map[string]struct{}, error) {\n\n\t// 参数变量查询,得到参数变量值\n\tparamMap := make(map[string][]string)\n\tfor _, paramKey := range paramKeys {\n\t\tvar params []string\n\t\tparamQuery, ok := paramVal[paramKey]\n\t\tif !ok {\n\t\t\treturn nil, fmt.Errorf(\"param key not found: %s\", paramKey)\n\t\t}\n\t\tswitch paramQuery.ParamType {\n\t\tcase \"host\":\n\t\t\thostIdents, err := arw.getHostIdents(paramQuery)\n\t\t\tif err != nil {\n\t\t\t\tlogger.Errorf(\"alert_eval_%d datasource_%d fail to get host idents, error:%v\", arw.Rule.Id, arw.DatasourceId, err)\n\t\t\t\tbreak\n\t\t\t}\n\t\t\tparams = hostIdents\n\t\tcase \"device\":\n\t\t\tdeviceIdents, err := arw.getDeviceIdents(paramQuery)\n\t\t\tif err != nil {\n\t\t\t\tlogger.Errorf(\"alert_eval_%d datasource_%d fail to get device idents, error:%v\", arw.Rule.Id, arw.DatasourceId, err)\n\t\t\t\tbreak\n\t\t\t}\n\t\t\tparams = deviceIdents\n\t\tcase \"enum\":\n\t\t\tq, _ := json.Marshal(paramQuery.Query)\n\t\t\tvar query []string\n\t\t\terr := json.Unmarshal(q, &query)\n\t\t\tif err != nil {\n\t\t\t\tlogger.Errorf(\"alert_eval_%d datasource_%d query:%s fail to unmarshalling into string slice, error:%v\", arw.Rule.Id, arw.DatasourceId, paramQuery.Query, err)\n\t\t\t}\n\t\t\tif len(query) == 0 {\n\t\t\t\tparamsKeyAllLabel, err := getParamKeyAllLabel(varToLabel[paramKey], originPromql, readerClient, arw.DatasourceId, arw.Rule.Id, arw.Processor.Stats)\n\t\t\t\tif err != nil {\n\t\t\t\t\tlogger.Errorf(\"alert_eval_%d datasource_%d fail to getParamKeyAllLabel, error:%v query:%s\", arw.Rule.Id, arw.DatasourceId, err, paramQuery.Query)\n\t\t\t\t}\n\t\t\t\tparams = paramsKeyAllLabel\n\t\t\t} else {\n\t\t\t\tparams = query\n\t\t\t}\n\t\tdefault:\n\t\t\treturn nil, fmt.Errorf(\"unknown param type: %s\", paramQuery.ParamType)\n\t\t}\n\n\t\tif len(params) == 0 {\n\t\t\treturn nil, fmt.Errorf(\"param key: %s, params is empty\", paramKey)\n\t\t}\n\n\t\tlogger.Infof(\"alert_eval_%d datasource_%d paramKey: %s, params: %v\", arw.Rule.Id, arw.DatasourceId, paramKey, params)\n\t\tparamMap[paramKey] = params\n\t}\n\n\t// 得到以 paramKeys 为顺序的所有参数组合\n\tpermutation := mapPermutation(paramKeys, paramMap)\n\n\tres := make(map[string]struct{})\n\tfor i := range permutation {\n\t\tres[strings.Join(permutation[i], JoinMark)] = struct{}{}\n\t}\n\n\treturn res, nil\n}\n\nfunc getParamKeyAllLabel(paramKey string, promql string, client promsdk.API, dsId int64, rid int64, stats *astats.Stats) ([]string, error) {\n\tlabels, metricName, err := promql2.GetLabelsAndMetricNameWithReplace(promql, \"$\")\n\tif err != nil {\n\t\treturn nil, fmt.Errorf(\"promql:%s, get labels error:%v\", promql, err)\n\t}\n\tlabelstrs := make([]string, 0)\n\tfor _, label := range labels {\n\t\tif strings.HasPrefix(label.Value, \"$\") {\n\t\t\tcontinue\n\t\t}\n\t\tlabelstrs = append(labelstrs, label.Name+label.Op+label.Value)\n\t}\n\tpr := metricName + \"{\" + strings.Join(labelstrs, \",\") + \"}\"\n\n\tstats.CounterQueryDataTotal.WithLabelValues(fmt.Sprintf(\"%d\", dsId), fmt.Sprintf(\"%d\", rid)).Inc()\n\tvalue, _, err := client.Query(context.Background(), pr, time.Now())\n\tif err != nil {\n\t\treturn nil, fmt.Errorf(\"promql: %s query error: %v\", pr, err)\n\t}\n\tlabelValuesMap := make(map[string]struct{})\n\n\tswitch value.Type() {\n\tcase model.ValVector:\n\t\tvector := value.(model.Vector)\n\t\tfor _, sample := range vector {\n\t\t\tfor labelName, labelValue := range sample.Metric {\n\t\t\t\t// 只处理ParamKeys中指定的label\n\t\t\t\tif string(labelName) == paramKey {\n\t\t\t\t\tlabelValuesMap[string(labelValue)] = struct{}{}\n\t\t\t\t}\n\t\t\t}\n\t\t}\n\tcase model.ValMatrix:\n\t\tmatrix := value.(model.Matrix)\n\t\tfor _, series := range matrix {\n\t\t\tfor labelName, labelValue := range series.Metric {\n\t\t\t\t// 只处理ParamKeys中指定的label\n\t\t\t\tif string(labelName) == paramKey {\n\t\t\t\t\tlabelValuesMap[string(labelValue)] = struct{}{}\n\t\t\t\t}\n\t\t\t}\n\t\t}\n\t}\n\n\tresult := make([]string, 0)\n\tfor labelValue, _ := range labelValuesMap {\n\t\tresult = append(result, labelValue)\n\t}\n\n\treturn result, nil\n}\n\nfunc (arw *AlertRuleWorker) getHostIdents(paramQuery models.ParamQuery) ([]string, error) {\n\tvar params []string\n\tq, _ := json.Marshal(paramQuery.Query)\n\n\tcacheKey := \"Host_\" + string(q)\n\tvalue, hit := arw.HostAndDeviceIdentCache.Load(cacheKey)\n\tif idents, ok := value.([]string); hit && ok {\n\t\tparams = idents\n\t\treturn params, nil\n\t}\n\n\tvar queries []models.HostQuery\n\terr := json.Unmarshal(q, &queries)\n\tif err != nil {\n\t\treturn nil, err\n\t}\n\n\tif !arw.Ctx.IsCenter {\n\t\tlst, err := poster.PostByUrlsWithResp[[]*models.Target](arw.Ctx, \"/v1/n9e/targets-of-host-query\", queries)\n\t\tif err != nil {\n\t\t\treturn nil, err\n\t\t}\n\t\tfor i := range lst {\n\t\t\tparams = append(params, lst[i].Ident)\n\t\t}\n\t} else {\n\t\thostsQuery := models.GetHostsQuery(queries)\n\t\tsession := models.TargetFilterQueryBuild(arw.Ctx, hostsQuery, 0, 0)\n\t\tvar lst []*models.Target\n\t\terr = session.Find(&lst).Error\n\t\tif err != nil {\n\t\t\treturn nil, err\n\t\t}\n\t\tfor i := range lst {\n\t\t\tparams = append(params, lst[i].Ident)\n\t\t}\n\t}\n\n\tarw.HostAndDeviceIdentCache.Store(cacheKey, params)\n\treturn params, nil\n}\n\nfunc (arw *AlertRuleWorker) getDeviceIdents(paramQuery models.ParamQuery) ([]string, error) {\n\treturn arw.DeviceIdentHook(arw, paramQuery)\n}\n\n// 生成所有排列组合\nfunc mapPermutation(paramKeys []string, paraMap map[string][]string) [][]string {\n\tvar result [][]string\n\tcurrent := make([]string, len(paramKeys))\n\tcombine(paramKeys, paraMap, 0, current, &result)\n\treturn result\n}\n\n// 递归生成所有排列组合\nfunc combine(paramKeys []string, paraMap map[string][]string, index int, current []string, result *[][]string) {\n\t// 当到达最后一个 key 时,存储当前的组合\n\tif index == len(paramKeys) {\n\t\tcombination := make([]string, len(current))\n\t\tcopy(combination, current)\n\t\t*result = append(*result, combination)\n\t\treturn\n\t}\n\n\t// 获取当前 key 对应的 value 列表\n\tkey := paramKeys[index]\n\tvalueList := paraMap[key]\n\n\t// 遍历每个 value,并递归生成下一个 key 的组合\n\tfor _, value := range valueList {\n\t\tcurrent[index] = value\n\t\tcombine(paramKeys, paraMap, index+1, current, result)\n\t}\n}\n\nfunc (arw *AlertRuleWorker) GetHostAnomalyPoint(ruleConfig string) ([]models.AnomalyPoint, error) {\n\tvar lst []models.AnomalyPoint\n\tstart := time.Now()\n\tdefer func() {\n\t\tarw.Processor.Stats.GaugeRuleEvalDuration.WithLabelValues(fmt.Sprintf(\"%v\", arw.Rule.Id), fmt.Sprintf(\"%v\", arw.Processor.DatasourceId())).Set(float64(time.Since(start).Milliseconds()))\n\t}()\n\n\tvar rule *models.HostRuleConfig\n\tif err := json.Unmarshal([]byte(ruleConfig), &rule); err != nil {\n\t\tlogger.Errorf(\"alert_eval_%d datasource_%d rule_config:%s, error:%v\", arw.Rule.Id, arw.DatasourceId, ruleConfig, err)\n\t\tarw.Processor.Stats.CounterRuleEvalErrorTotal.WithLabelValues(fmt.Sprintf(\"%v\", arw.Processor.DatasourceId()), GET_RULE_CONFIG, arw.Processor.BusiGroupCache.GetNameByBusiGroupId(arw.Rule.GroupId), fmt.Sprintf(\"%v\", arw.Rule.Id)).Inc()\n\t\tarw.Processor.Stats.GaugeQuerySeriesCount.WithLabelValues(\n\t\t\tfmt.Sprintf(\"%v\", arw.Rule.Id),\n\t\t\tfmt.Sprintf(\"%v\", arw.Processor.DatasourceId()),\n\t\t\t\"\",\n\t\t).Set(0)\n\t\treturn lst, err\n\t}\n\n\tif rule == nil {\n\t\tlogger.Errorf(\"alert_eval_%d datasource_%d rule_config:%s, error:rule is nil\", arw.Rule.Id, arw.DatasourceId, ruleConfig)\n\t\tarw.Processor.Stats.CounterRuleEvalErrorTotal.WithLabelValues(fmt.Sprintf(\"%v\", arw.Processor.DatasourceId()), GET_RULE_CONFIG, arw.Processor.BusiGroupCache.GetNameByBusiGroupId(arw.Rule.GroupId), fmt.Sprintf(\"%v\", arw.Rule.Id)).Inc()\n\t\tarw.Processor.Stats.GaugeQuerySeriesCount.WithLabelValues(\n\t\t\tfmt.Sprintf(\"%v\", arw.Rule.Id),\n\t\t\tfmt.Sprintf(\"%v\", arw.Processor.DatasourceId()),\n\t\t\t\"\",\n\t\t).Set(0)\n\t\treturn lst, errors.New(\"rule is nil\")\n\t}\n\n\tarw.Inhibit = rule.Inhibit\n\tnow := time.Now().Unix()\n\tfor _, trigger := range rule.Triggers {\n\t\tswitch trigger.Type {\n\t\tcase \"target_miss\":\n\t\t\tt := now - int64(trigger.Duration)\n\n\t\t\tvar idents, engineIdents, missEngineIdents []string\n\t\t\tvar exists bool\n\t\t\tif arw.Ctx.IsCenter {\n\t\t\t\t// 如果是中心节点, 将不再上报数据的主机 engineName 为空的机器,也加入到 targets 中\n\t\t\t\tmissEngineIdents, exists = arw.Processor.TargetsOfAlertRuleCache.Get(\"\", arw.Rule.Id)\n\t\t\t\tif !exists {\n\t\t\t\t\tlogger.Debugf(\"alert_eval_%d datasource_%d targets not found engineName:%s\", arw.Rule.Id, arw.DatasourceId, arw.Processor.EngineName)\n\t\t\t\t\tarw.Processor.Stats.CounterRuleEvalErrorTotal.WithLabelValues(fmt.Sprintf(\"%v\", arw.Processor.DatasourceId()), QUERY_DATA, arw.Processor.BusiGroupCache.GetNameByBusiGroupId(arw.Rule.GroupId), fmt.Sprintf(\"%v\", arw.Rule.Id)).Inc()\n\t\t\t\t}\n\t\t\t}\n\t\t\tidents = append(idents, missEngineIdents...)\n\n\t\t\tengineIdents, exists = arw.Processor.TargetsOfAlertRuleCache.Get(arw.Processor.EngineName, arw.Rule.Id)\n\t\t\tif !exists {\n\t\t\t\tlogger.Warningf(\"alert_eval_%d datasource_%d targets not found engineName:%s\", arw.Rule.Id, arw.DatasourceId, arw.Processor.EngineName)\n\t\t\t\tarw.Processor.Stats.CounterRuleEvalErrorTotal.WithLabelValues(fmt.Sprintf(\"%v\", arw.Processor.DatasourceId()), QUERY_DATA, arw.Processor.BusiGroupCache.GetNameByBusiGroupId(arw.Rule.GroupId), fmt.Sprintf(\"%v\", arw.Rule.Id)).Inc()\n\t\t\t}\n\t\t\tidents = append(idents, engineIdents...)\n\n\t\t\tif len(idents) == 0 {\n\t\t\t\tarw.Processor.Stats.GaugeQuerySeriesCount.WithLabelValues(\n\t\t\t\t\tfmt.Sprintf(\"%v\", arw.Rule.Id),\n\t\t\t\t\tfmt.Sprintf(\"%v\", arw.Processor.DatasourceId()),\n\t\t\t\t\t\"\",\n\t\t\t\t).Set(0)\n\t\t\t\tcontinue\n\t\t\t}\n\n\t\t\tvar missTargets []string\n\t\t\ttargetUpdateTimeMap := arw.Processor.TargetCache.GetHostUpdateTime(idents)\n\t\t\tfor ident, updateTime := range targetUpdateTimeMap {\n\t\t\t\tif updateTime < t {\n\t\t\t\t\tmissTargets = append(missTargets, ident)\n\t\t\t\t}\n\t\t\t}\n\t\t\tarw.Processor.Stats.GaugeQuerySeriesCount.WithLabelValues(\n\t\t\t\tfmt.Sprintf(\"%v\", arw.Rule.Id),\n\t\t\t\tfmt.Sprintf(\"%v\", arw.Processor.DatasourceId()),\n\t\t\t\t\"\",\n\t\t\t).Set(float64(len(missTargets)))\n\n\t\t\tlogger.Debugf(\"alert_eval_%d datasource_%d missTargets:%v\", arw.Rule.Id, arw.DatasourceId, missTargets)\n\t\t\ttargets := arw.Processor.TargetCache.Gets(missTargets)\n\t\t\tfor _, target := range targets {\n\t\t\t\tm := make(map[string]string)\n\t\t\t\tfor k, v := range target.TagsMap {\n\t\t\t\t\tm[k] = v\n\t\t\t\t}\n\t\t\t\tm[\"ident\"] = target.Ident\n\n\t\t\t\tlst = append(lst, models.NewAnomalyPoint(trigger.Type, m, now, float64(now-target.BeatTime), trigger.Severity))\n\t\t\t}\n\t\tcase \"offset\":\n\t\t\tidents, exists := arw.Processor.TargetsOfAlertRuleCache.Get(arw.Processor.EngineName, arw.Rule.Id)\n\t\t\tif !exists {\n\t\t\t\tarw.Processor.Stats.GaugeQuerySeriesCount.WithLabelValues(\n\t\t\t\t\tfmt.Sprintf(\"%v\", arw.Rule.Id),\n\t\t\t\t\tfmt.Sprintf(\"%v\", arw.Processor.DatasourceId()),\n\t\t\t\t\t\"\",\n\t\t\t\t).Set(0)\n\t\t\t\tlogger.Warningf(\"alert_eval_%d datasource_%d targets not found\", arw.Rule.Id, arw.DatasourceId)\n\t\t\t\tarw.Processor.Stats.CounterRuleEvalErrorTotal.WithLabelValues(fmt.Sprintf(\"%v\", arw.Processor.DatasourceId()), QUERY_DATA, arw.Processor.BusiGroupCache.GetNameByBusiGroupId(arw.Rule.GroupId), fmt.Sprintf(\"%v\", arw.Rule.Id)).Inc()\n\t\t\t\tcontinue\n\t\t\t}\n\n\t\t\ttargets := arw.Processor.TargetCache.Gets(idents)\n\t\t\ttargetMap := make(map[string]*models.Target)\n\t\t\tfor _, target := range targets {\n\t\t\t\ttargetMap[target.Ident] = target\n\t\t\t}\n\n\t\t\toffsetIdents := make(map[string]int64)\n\t\t\ttargetsMeta := arw.Processor.TargetCache.GetHostMetas(targets)\n\t\t\tfor ident, meta := range targetsMeta {\n\t\t\t\tif meta.CpuNum <= 0 {\n\t\t\t\t\t// means this target is not collect by categraf, do not check offset\n\t\t\t\t\tcontinue\n\t\t\t\t}\n\t\t\t\tif target, exists := targetMap[ident]; exists {\n\t\t\t\t\tif now-target.BeatTime > 120 {\n\t\t\t\t\t\t// means this target is not a active host, do not check offset\n\t\t\t\t\t\tcontinue\n\t\t\t\t\t}\n\t\t\t\t}\n\n\t\t\t\toffset := meta.Offset\n\t\t\t\tif math.Abs(float64(offset)) > float64(trigger.Duration) {\n\t\t\t\t\toffsetIdents[ident] = offset\n\t\t\t\t}\n\t\t\t}\n\n\t\t\tlogger.Debugf(\"alert_eval_%d datasource_%d offsetIdents:%v\", arw.Rule.Id, arw.DatasourceId, offsetIdents)\n\t\t\tarw.Processor.Stats.GaugeQuerySeriesCount.WithLabelValues(\n\t\t\t\tfmt.Sprintf(\"%v\", arw.Rule.Id),\n\t\t\t\tfmt.Sprintf(\"%v\", arw.Processor.DatasourceId()),\n\t\t\t\t\"\",\n\t\t\t).Set(float64(len(offsetIdents)))\n\t\t\tfor host, offset := range offsetIdents {\n\t\t\t\tm := make(map[string]string)\n\t\t\t\ttarget, exists := arw.Processor.TargetCache.Get(host)\n\t\t\t\tif exists {\n\t\t\t\t\tfor k, v := range target.TagsMap {\n\t\t\t\t\t\tm[k] = v\n\t\t\t\t\t}\n\t\t\t\t}\n\t\t\t\tm[\"ident\"] = host\n\n\t\t\t\tlst = append(lst, models.NewAnomalyPoint(trigger.Type, m, now, float64(offset), trigger.Severity))\n\t\t\t}\n\t\tcase \"pct_target_miss\":\n\t\t\tt := now - int64(trigger.Duration)\n\t\t\tidents, exists := arw.Processor.TargetsOfAlertRuleCache.Get(arw.Processor.EngineName, arw.Rule.Id)\n\t\t\tif !exists {\n\t\t\t\tarw.Processor.Stats.GaugeQuerySeriesCount.WithLabelValues(\n\t\t\t\t\tfmt.Sprintf(\"%v\", arw.Rule.Id),\n\t\t\t\t\tfmt.Sprintf(\"%v\", arw.Processor.DatasourceId()),\n\t\t\t\t\t\"\",\n\t\t\t\t).Set(0)\n\t\t\t\tlogger.Warningf(\"alert_eval_%d datasource_%d targets not found\", arw.Rule.Id, arw.DatasourceId)\n\t\t\t\tarw.Processor.Stats.CounterRuleEvalErrorTotal.WithLabelValues(fmt.Sprintf(\"%v\", arw.Processor.DatasourceId()), QUERY_DATA, arw.Processor.BusiGroupCache.GetNameByBusiGroupId(arw.Rule.GroupId), fmt.Sprintf(\"%v\", arw.Rule.Id)).Inc()\n\t\t\t\tcontinue\n\t\t\t}\n\n\t\t\tvar missTargets []string\n\t\t\ttargetUpdateTimeMap := arw.Processor.TargetCache.GetHostUpdateTime(idents)\n\t\t\tfor ident, updateTime := range targetUpdateTimeMap {\n\t\t\t\tif updateTime < t {\n\t\t\t\t\tmissTargets = append(missTargets, ident)\n\t\t\t\t}\n\t\t\t}\n\t\t\tlogger.Debugf(\"alert_eval_%d datasource_%d missTargets:%v\", arw.Rule.Id, arw.DatasourceId, missTargets)\n\t\t\tarw.Processor.Stats.GaugeQuerySeriesCount.WithLabelValues(\n\t\t\t\tfmt.Sprintf(\"%v\", arw.Rule.Id),\n\t\t\t\tfmt.Sprintf(\"%v\", arw.Processor.DatasourceId()),\n\t\t\t\t\"\",\n\t\t\t).Set(float64(len(missTargets)))\n\t\t\tpct := float64(len(missTargets)) / float64(len(idents)) * 100\n\t\t\tif pct >= float64(trigger.Percent) {\n\t\t\t\tlst = append(lst, models.NewAnomalyPoint(trigger.Type, nil, now, pct, trigger.Severity))\n\t\t\t}\n\t\t}\n\t}\n\treturn lst, nil\n}\n\nfunc flatten(rehashed map[uint64][][]uint64) map[uint64][]uint64 {\n\tseriesTagIndex := make(map[uint64][]uint64)\n\tvar i uint64\n\tfor _, HashTagIndex := range rehashed {\n\t\tfor u := range HashTagIndex {\n\t\t\tseriesTagIndex[i] = HashTagIndex[u]\n\t\t\ti++\n\t\t}\n\t}\n\treturn seriesTagIndex\n}\n\n// onJoin 组合两个经过 rehash 之后的集合\n// 如查询 A,经过 on data_base rehash 分组后\n// [[A1{data_base=1, table=alert},A2{data_base=1, table=alert}],[A5{data_base=1, table=board}]]\n// [[A3{data_base=2, table=board}],[A4{data_base=2, table=alert}]]\n// 查询 B,经过 on data_base rehash 分组后\n// [[B1{data_base=1, table=alert}]]\n// [[B2{data_base=2, table=alert}]]\n// 内联得到\n// [[A1{data_base=1, table=alert},A2{data_base=1, table=alert},B1{data_base=1, table=alert}],[A5{data_base=1, table=board},[B1{data_base=1, table=alert}]]\n// [[A3{data_base=2, table=board},B2{data_base=2, table=alert}],[A4{data_base=2, table=alert},B2{data_base=2, table=alert}]]\nfunc onJoin(reHashTagIndex1 map[uint64][][]uint64, reHashTagIndex2 map[uint64][][]uint64, joinType JoinType) map[uint64][][]uint64 {\n\treHashTagIndex := make(map[uint64][][]uint64)\n\tfor rehash := range reHashTagIndex1 {\n\t\tif _, ok := reHashTagIndex2[rehash]; ok {\n\t\t\t// 若有 rehash 相同的记录,两两合并\n\t\t\tfor i1 := range reHashTagIndex1[rehash] {\n\t\t\t\tfor i2 := range reHashTagIndex2[rehash] {\n\t\t\t\t\treHashTagIndex[rehash] = append(reHashTagIndex[rehash], mergeNewArray(reHashTagIndex1[rehash][i1], reHashTagIndex2[rehash][i2]))\n\t\t\t\t}\n\t\t\t}\n\t\t} else {\n\t\t\t// 合并方式不为 inner 时,需要保留 reHashTagIndex1 中未匹配的记录\n\t\t\tif joinType != Inner {\n\t\t\t\treHashTagIndex[rehash] = reHashTagIndex1[rehash]\n\t\t\t}\n\t\t}\n\t}\n\treturn reHashTagIndex\n}\n\n// rehashSet 重新 hash 分组\n// 如当前查询 A 有五条记录\n// A1{data_base=1, table=alert}\n// A2{data_base=1, table=alert}\n// A3{data_base=2, table=board}\n// A4{data_base=2, table=alert}\n// A5{data_base=1, table=board}\n// 经过预处理(按曲线分组,此步已在进入 GetAnomalyPoint 函数前完成)后,分为 4 组,\n// [A1{data_base=1, table=alert},A2{data_base=1, table=alert}]\n// [A3{data_base=2, table=board}]\n// [A4{data_base=2, table=alert}]\n// [A5{data_base=1, table=board}]\n// 若 rehashSet 按 data_base 重新分组,此时会得到按 rehash 值分的二维数组,即不会将 rehash 值相同的记录完全合并\n// [[A1{data_base=1, table=alert},A2{data_base=1, table=alert}],[A5{data_base=1, table=board}]]\n// [[A3{data_base=2, table=board}],[A4{data_base=2, table=alert}]]\nfunc rehashSet(seriesTagIndex1 map[uint64][]uint64, seriesStore map[uint64]models.DataResp, on []string) map[uint64][][]uint64 {\n\treHashTagIndex := make(map[uint64][][]uint64)\n\tfor _, seriesHashes := range seriesTagIndex1 {\n\t\tif len(seriesHashes) == 0 {\n\t\t\tcontinue\n\t\t}\n\t\tseries, exists := seriesStore[seriesHashes[0]]\n\t\tif !exists {\n\t\t\tcontinue\n\t\t}\n\n\t\trehash := hash.GetTargetTagHash(series.Metric, on)\n\t\tif _, ok := reHashTagIndex[rehash]; !ok {\n\t\t\treHashTagIndex[rehash] = make([][]uint64, 0)\n\t\t}\n\t\treHashTagIndex[rehash] = append(reHashTagIndex[rehash], seriesHashes)\n\t}\n\treturn reHashTagIndex\n}\n\n// 笛卡尔积,查询的结果两两合并\nfunc cartesianJoin(seriesTagIndex1 map[uint64][]uint64, seriesTagIndex2 map[uint64][]uint64) map[uint64][]uint64 {\n\tvar index uint64\n\tseriesTagIndex := make(map[uint64][]uint64)\n\tfor _, seriesHashes1 := range seriesTagIndex1 {\n\t\tfor _, seriesHashes2 := range seriesTagIndex2 {\n\t\t\tseriesTagIndex[index] = mergeNewArray(seriesHashes1, seriesHashes2)\n\t\t\tindex++\n\t\t}\n\t}\n\treturn seriesTagIndex\n}\n\n// noneJoin 直接拼接\nfunc noneJoin(seriesTagIndex1 map[uint64][]uint64, seriesTagIndex2 map[uint64][]uint64) map[uint64][]uint64 {\n\tseriesTagIndex := make(map[uint64][]uint64)\n\tvar index uint64\n\tfor _, seriesHashes := range seriesTagIndex1 {\n\t\tseriesTagIndex[index] = seriesHashes\n\t\tindex++\n\t}\n\tfor _, seriesHashes := range seriesTagIndex2 {\n\t\tseriesTagIndex[index] = seriesHashes\n\t\tindex++\n\t}\n\treturn seriesTagIndex\n}\n\n// originalJoin 原始分组方案,key 相同,即标签全部相同分为一组\nfunc originalJoin(seriesTagIndex1 map[uint64][]uint64, seriesTagIndex2 map[uint64][]uint64) map[uint64][]uint64 {\n\tseriesTagIndex := make(map[uint64][]uint64)\n\tfor tagHash, seriesHashes := range seriesTagIndex1 {\n\t\tif _, ok := seriesTagIndex[tagHash]; !ok {\n\t\t\tseriesTagIndex[tagHash] = mergeNewArray(seriesHashes)\n\t\t} else {\n\t\t\tseriesTagIndex[tagHash] = append(seriesTagIndex[tagHash], seriesHashes...)\n\t\t}\n\t}\n\n\tfor tagHash, seriesHashes := range seriesTagIndex2 {\n\t\tif _, ok := seriesTagIndex[tagHash]; !ok {\n\t\t\tseriesTagIndex[tagHash] = mergeNewArray(seriesHashes)\n\t\t} else {\n\t\t\tseriesTagIndex[tagHash] = append(seriesTagIndex[tagHash], seriesHashes...)\n\t\t}\n\t}\n\n\treturn seriesTagIndex\n}\n\n// exclude 左斥,留下在 reHashTagIndex1 中,但不在 reHashTagIndex2 中的记录\nfunc exclude(reHashTagIndex1 map[uint64][][]uint64, reHashTagIndex2 map[uint64][][]uint64) map[uint64][][]uint64 {\n\treHashTagIndex := make(map[uint64][][]uint64)\n\tfor rehash, _ := range reHashTagIndex1 {\n\t\tif _, ok := reHashTagIndex2[rehash]; !ok {\n\t\t\treHashTagIndex[rehash] = reHashTagIndex1[rehash]\n\t\t}\n\t}\n\treturn reHashTagIndex\n}\n\nfunc MakeSeriesMap(series []models.DataResp, seriesTagIndex map[uint64][]uint64, seriesStore map[uint64]models.DataResp) {\n\tfor i := 0; i < len(series); i++ {\n\t\tseriesHash := hash.GetHash(series[i].Metric, series[i].Ref)\n\t\ttagHash := hash.GetTagHash(series[i].Metric)\n\t\tseriesStore[seriesHash] = series[i]\n\n\t\t// 将曲线按照相同的 tag 分组\n\t\tif _, exists := seriesTagIndex[tagHash]; !exists {\n\t\t\tseriesTagIndex[tagHash] = make([]uint64, 0)\n\t\t}\n\t\tseriesTagIndex[tagHash] = append(seriesTagIndex[tagHash], seriesHash)\n\t}\n}\n\nfunc mergeNewArray(arg ...[]uint64) []uint64 {\n\tres := make([]uint64, 0)\n\tfor _, a := range arg {\n\t\tres = append(res, a...)\n\t}\n\treturn res\n}\n\nfunc ProcessJoins(ruleId int64, trigger models.Trigger, seriesTagIndexes map[string]map[uint64][]uint64, seriesStore map[uint64]models.DataResp) map[uint64][]uint64 {\n\tlast := make(map[uint64][]uint64)\n\tif len(seriesTagIndexes) == 0 {\n\t\treturn last\n\t}\n\n\tif len(trigger.Joins) == 0 {\n\t\tidx := 0\n\t\tfor _, seriesTagIndex := range seriesTagIndexes {\n\t\t\tif idx == 0 {\n\t\t\t\tlast = seriesTagIndex\n\t\t\t} else {\n\t\t\t\tlast = originalJoin(last, seriesTagIndex)\n\t\t\t}\n\t\t\tidx++\n\t\t}\n\t\treturn last\n\t}\n\n\t// 有 join 条件,按条件依次合并\n\tif len(seriesTagIndexes) < len(trigger.Joins)+1 {\n\t\tlogger.Errorf(\"alert_eval_%d queries' count: %d not match join condition's count: %d\", ruleId, len(seriesTagIndexes), len(trigger.Joins))\n\t\treturn nil\n\t}\n\n\tlast = seriesTagIndexes[trigger.JoinRef]\n\tlastRehashed := rehashSet(last, seriesStore, trigger.Joins[0].On)\n\tfor i := range trigger.Joins {\n\t\tcur := seriesTagIndexes[trigger.Joins[i].Ref]\n\t\tswitch trigger.Joins[i].JoinType {\n\t\tcase \"original\":\n\t\t\tlast = originalJoin(last, cur)\n\t\tcase \"none\":\n\t\t\tlast = noneJoin(last, cur)\n\t\tcase \"cartesian\":\n\t\t\tlast = cartesianJoin(last, cur)\n\t\tcase \"inner_join\":\n\t\t\tcurRehashed := rehashSet(cur, seriesStore, trigger.Joins[i].On)\n\t\t\tlastRehashed = onJoin(lastRehashed, curRehashed, Inner)\n\t\t\tlast = flatten(lastRehashed)\n\t\tcase \"left_join\":\n\t\t\tcurRehashed := rehashSet(cur, seriesStore, trigger.Joins[i].On)\n\t\t\tlastRehashed = onJoin(lastRehashed, curRehashed, Left)\n\t\t\tlast = flatten(lastRehashed)\n\t\tcase \"right_join\":\n\t\t\tcurRehashed := rehashSet(cur, seriesStore, trigger.Joins[i].On)\n\t\t\tlastRehashed = onJoin(curRehashed, lastRehashed, Right)\n\t\t\tlast = flatten(lastRehashed)\n\t\tcase \"left_exclude\":\n\t\t\tcurRehashed := rehashSet(cur, seriesStore, trigger.Joins[i].On)\n\t\t\tlastRehashed = exclude(lastRehashed, curRehashed)\n\t\t\tlast = flatten(lastRehashed)\n\t\tcase \"right_exclude\":\n\t\t\tcurRehashed := rehashSet(cur, seriesStore, trigger.Joins[i].On)\n\t\t\tlastRehashed = exclude(curRehashed, lastRehashed)\n\t\t\tlast = flatten(lastRehashed)\n\t\tdefault:\n\t\t\tlogger.Warningf(\"alert_eval_%d join type:%s not support\", ruleId, trigger.Joins[i].JoinType)\n\t\t}\n\t}\n\treturn last\n}\n\nfunc GetQueryRef(query interface{}) (string, error) {\n\t// 首先检查是否为 map\n\tif m, ok := query.(map[string]interface{}); ok {\n\t\tif ref, exists := m[\"ref\"]; exists {\n\t\t\tif refStr, ok := ref.(string); ok {\n\t\t\t\treturn refStr, nil\n\t\t\t}\n\t\t\treturn \"\", fmt.Errorf(\"ref 字段不是字符串类型\")\n\t\t}\n\t\treturn \"\", fmt.Errorf(\"query 中没有找到 ref 字段\")\n\t}\n\n\t// 如果不是 map,则按原来的方式处理结构体\n\tv := reflect.ValueOf(query)\n\tif v.Kind() == reflect.Ptr {\n\t\tv = v.Elem()\n\t}\n\n\tif v.Kind() != reflect.Struct {\n\t\treturn \"\", fmt.Errorf(\"query not a struct or map\")\n\t}\n\n\trefField := v.FieldByName(\"Ref\")\n\tif !refField.IsValid() {\n\t\treturn \"\", fmt.Errorf(\"not find ref field\")\n\t}\n\n\tif refField.Kind() != reflect.String {\n\t\treturn \"\", fmt.Errorf(\"ref not a string\")\n\t}\n\n\treturn refField.String(), nil\n}\n\n// query 可能是 string 或是 int int64 float64 等数字,全部转为 string\nfunc getString(query interface{}) string {\n\tswitch query.(type) {\n\tcase string:\n\t\treturn query.(string)\n\tcase float64:\n\t\treturn strconv.FormatFloat(query.(float64), 'f', -1, 64)\n\tdefault:\n\t\treturn \"\"\n\t}\n}\n\nfunc GetQueryRefAndUnit(query interface{}) (string, string, error) {\n\ttype Query struct {\n\t\tRef string `json:\"ref\"`\n\t\tUnit string `json:\"unit\"`\n\t}\n\n\tqueryMap := Query{}\n\tqueryBytes, err := json.Marshal(query)\n\tif err != nil {\n\t\treturn \"\", \"\", err\n\t}\n\tjson.Unmarshal(queryBytes, &queryMap)\n\treturn queryMap.Ref, queryMap.Unit, nil\n}\n\n// VarFillingBeforeQuery 填充变量,先填充变量再查询,针对有聚合函数的情况\n// 公式: avg(mem_used_percent{host=\"$host\"}) > $val 其中 $host 为参数变量,$val 为值变量\n// 实现步骤:\n// 依次遍历参数配置节点,保证同一参数变量的子筛选可以覆盖上一层筛选\n// 每个节点先填充参数再进行查询, 即先得到完整的 promql avg(mem_used_percent{host=\"127.0.0.1\"}) > 5\n// 再查询得到满足值变量的所有结果加入异常点列表\n// 参数变量的值不满足的组合,需要覆盖上层筛选中产生的异常点\nfunc (arw *AlertRuleWorker) VarFillingBeforeQuery(query models.PromQuery, readerClient promsdk.API) []models.AnomalyPoint {\n\tvarToLabel := ExtractVarMapping(query.PromQl)\n\t// 存储异常点的 map,key 为参数变量的组合,可以实现子筛选对上一层筛选的覆盖\n\tanomalyPointsMap := sync.Map{}\n\t// 统一变量配置格式\n\tVarConfigForCalc := &models.ChildVarConfig{\n\t\tParamVal: make([]map[string]models.ParamQuery, 1),\n\t\tChildVarConfigs: query.VarConfig.ChildVarConfigs,\n\t}\n\tVarConfigForCalc.ParamVal[0] = make(map[string]models.ParamQuery)\n\tfor _, p := range query.VarConfig.ParamVal {\n\t\tVarConfigForCalc.ParamVal[0][p.Name] = models.ParamQuery{\n\t\t\tParamType: p.ParamType,\n\t\t\tQuery: p.Query,\n\t\t}\n\t}\n\t// 使用一个统一的参数变量顺序\n\tvar ParamKeys []string\n\tfor val, valQuery := range VarConfigForCalc.ParamVal[0] {\n\t\tif valQuery.ParamType == \"threshold\" {\n\t\t\tcontinue\n\t\t}\n\t\tParamKeys = append(ParamKeys, val)\n\t}\n\tsort.Slice(ParamKeys, func(i, j int) bool {\n\t\treturn ParamKeys[i] < ParamKeys[j]\n\t})\n\t// 遍历变量配置链表\n\tcurNode := VarConfigForCalc\n\tfor curNode != nil {\n\t\tfor _, param := range curNode.ParamVal {\n\t\t\tcurPromql := query.PromQl\n\t\t\t// 取出阈值变量\n\t\t\tvalMap := make(map[string]string)\n\t\t\tfor val, valQuery := range param {\n\t\t\t\tif valQuery.ParamType == \"threshold\" {\n\t\t\t\t\tvalMap[val] = getString(valQuery.Query)\n\t\t\t\t}\n\t\t\t}\n\t\t\t// 替换阈值变量\n\t\t\tfor key, val := range valMap {\n\t\t\t\tcurPromql = strings.Replace(curPromql, fmt.Sprintf(\"$%s\", key), val, -1)\n\t\t\t}\n\t\t\t// 得到参数变量的所有组合\n\t\t\tparamPermutation, err := arw.getParamPermutation(param, ParamKeys, varToLabel, query.PromQl, readerClient)\n\t\t\tif err != nil {\n\t\t\t\tlogger.Errorf(\"alert_eval_%d datasource_%d paramPermutation error:%v\", arw.Rule.Id, arw.DatasourceId, err)\n\t\t\t\tcontinue\n\t\t\t}\n\n\t\t\tkeyToPromql := make(map[string]string)\n\t\t\tfor paramPermutationKeys, _ := range paramPermutation {\n\t\t\t\trealPromql := curPromql\n\t\t\t\tsplit := strings.Split(paramPermutationKeys, JoinMark)\n\t\t\t\tfor j := range ParamKeys {\n\t\t\t\t\trealPromql = fillVar(realPromql, ParamKeys[j], split[j])\n\t\t\t\t}\n\t\t\t\tkeyToPromql[paramPermutationKeys] = realPromql\n\t\t\t}\n\n\t\t\t// 并发查询\n\t\t\twg := sync.WaitGroup{}\n\t\t\tsemaphore := make(chan struct{}, 200)\n\t\t\tfor key, promql := range keyToPromql {\n\t\t\t\twg.Add(1)\n\t\t\t\tsemaphore <- struct{}{}\n\t\t\t\tgo func(key, promql string) {\n\t\t\t\t\tdefer func() {\n\t\t\t\t\t\t<-semaphore\n\t\t\t\t\t\twg.Done()\n\t\t\t\t\t}()\n\t\t\t\t\tarw.Processor.Stats.CounterQueryDataTotal.WithLabelValues(fmt.Sprintf(\"%d\", arw.DatasourceId), fmt.Sprintf(\"%d\", arw.Rule.Id)).Inc()\n\t\t\t\t\tvalue, _, err := readerClient.Query(context.Background(), promql, time.Now())\n\t\t\t\t\tif err != nil {\n\t\t\t\t\t\tlogger.Errorf(\"alert_eval_%d datasource_%d promql:%s, error:%v\", arw.Rule.Id, arw.DatasourceId, promql, err)\n\t\t\t\t\t\treturn\n\t\t\t\t\t}\n\t\t\t\t\tlogger.Infof(\"alert_eval_%d datasource_%d promql:%s, value:%+v\", arw.Rule.Id, arw.DatasourceId, promql, value)\n\n\t\t\t\t\tpoints := models.ConvertAnomalyPoints(value)\n\t\t\t\t\tif len(points) == 0 {\n\t\t\t\t\t\tanomalyPointsMap.Delete(key)\n\t\t\t\t\t\treturn\n\t\t\t\t\t}\n\t\t\t\t\tfor i := 0; i < len(points); i++ {\n\t\t\t\t\t\tpoints[i].Severity = query.Severity\n\t\t\t\t\t\tpoints[i].Query = promql\n\t\t\t\t\t\tpoints[i].ValuesUnit = map[string]unit.FormattedValue{\n\t\t\t\t\t\t\t\"v\": unit.ValueFormatter(query.Unit, 2, points[i].Value),\n\t\t\t\t\t\t}\n\t\t\t\t\t\t// 每个异常点都需要生成 key,子筛选使用 key 覆盖上层筛选,解决 issue https://github.com/ccfos/nightingale/issues/2433 提的问题\n\t\t\t\t\t\tvar cur []string\n\t\t\t\t\t\tfor _, paramKey := range ParamKeys {\n\t\t\t\t\t\t\tval := string(points[i].Labels[model.LabelName(varToLabel[paramKey])])\n\t\t\t\t\t\t\tcur = append(cur, val)\n\t\t\t\t\t\t}\n\t\t\t\t\t\tanomalyPointsMap.Store(strings.Join(cur, JoinMark), points[i])\n\t\t\t\t\t}\n\t\t\t\t}(key, promql)\n\t\t\t}\n\t\t\twg.Wait()\n\t\t}\n\t\tcurNode = curNode.ChildVarConfigs\n\t}\n\tanomalyPoints := make([]models.AnomalyPoint, 0)\n\tanomalyPointsMap.Range(func(key, value any) bool {\n\t\tif point, ok := value.(models.AnomalyPoint); ok {\n\t\t\tanomalyPoints = append(anomalyPoints, point)\n\t\t}\n\t\treturn true\n\t})\n\treturn anomalyPoints\n}\n\n// 判断 query 中是否有会导致标签丢失的聚合函数\nfunc hasLabelLossAggregator(query models.PromQuery) bool {\n\tnoLabelAggregators := []string{\n\t\t\"sum\", \"min\", \"max\", \"avg\",\n\t\t\"stddev\", \"stdvar\",\n\t\t\"count\", \"quantile\",\n\t\t\"group\",\n\t}\n\tpromql := strings.ToLower(query.PromQl)\n\n\tfor _, fn := range noLabelAggregators {\n\t\t// 检查是否包含这些聚合函数,需要确保函数名后面跟着左括号\n\t\tif strings.Contains(promql, fn+\"(\") {\n\t\t\treturn true\n\t\t}\n\t}\n\n\treturn false\n}\n\n// 判断 query 中是否有 != =~ !~\nfunc notExactMatch(query models.PromQuery) bool {\n\tpromql := strings.ToLower(query.PromQl)\n\tif strings.Contains(promql, \"!=\") || strings.Contains(promql, \"=~\") || strings.Contains(promql, \"!~\") {\n\t\treturn true\n\t}\n\treturn false\n}\n\n// ExtractVarMapping 从 promql 中提取变量映射关系,为了在 query 之后可以将标签正确的放回 promql\n// 输入: sum(rate(mem_used_percent{host=\"$my_host\"})) by (instance) + avg(node_load1{region=\"$region\"}) > $val\n// 输出: map[string]string{\"my_host\":\"host\", \"region\":\"region\"}\nfunc ExtractVarMapping(promql string) map[string]string {\n\tvarMapping := make(map[string]string)\n\n\t// 遍历所有花括号对\n\tfor {\n\t\tstart := strings.Index(promql, \"{\")\n\t\tif start == -1 {\n\t\t\tbreak\n\t\t}\n\n\t\tend := strings.Index(promql, \"}\")\n\t\tif end == -1 {\n\t\t\tbreak\n\t\t}\n\n\t\t// 提取标签键值对\n\t\tlabels := promql[start+1 : end]\n\t\tpairs := strings.Split(labels, \",\")\n\n\t\tfor _, pair := range pairs {\n\t\t\t// 分割键值对\n\t\t\tvar kv []string\n\t\t\tif strings.Contains(pair, \"!=\") {\n\t\t\t\tkv = strings.Split(pair, \"!=\")\n\t\t\t} else if strings.Contains(pair, \"=~\") {\n\t\t\t\tkv = strings.Split(pair, \"=~\")\n\t\t\t} else if strings.Contains(pair, \"!~\") {\n\t\t\t\tkv = strings.Split(pair, \"!~\")\n\t\t\t} else {\n\t\t\t\tkv = strings.Split(pair, \"=\")\n\t\t\t}\n\t\t\tif len(kv) != 2 {\n\t\t\t\tcontinue\n\t\t\t}\n\n\t\t\tkey := strings.TrimSpace(kv[0])\n\t\t\tvalue := strings.Trim(strings.TrimSpace(kv[1]), \"\\\"\")\n\t\t\tvalue = strings.Trim(value, \"'\")\n\n\t\t\t// 检查值是否为变量(以$开头)\n\t\t\tif strings.HasPrefix(value, \"$\") {\n\t\t\t\tvarName := value[1:] // 去掉$前缀\n\t\t\t\tvarMapping[varName] = key\n\t\t\t}\n\t\t}\n\n\t\t// 继续处理剩余部分\n\t\tpromql = promql[end+1:]\n\t}\n\n\treturn varMapping\n}\n\nfunc fillVar(curRealQuery string, paramKey string, val string) string {\n\tcurRealQuery = strings.Replace(curRealQuery, fmt.Sprintf(\"'$%s'\", paramKey), fmt.Sprintf(\"'%s'\", val), -1)\n\tcurRealQuery = strings.Replace(curRealQuery, fmt.Sprintf(\"\\\"$%s\\\"\", paramKey), fmt.Sprintf(\"\\\"%s\\\"\", val), -1)\n\treturn curRealQuery\n}\n\nfunc (arw *AlertRuleWorker) GetAnomalyPoint(rule *models.AlertRule, dsId int64) ([]models.AnomalyPoint, []models.AnomalyPoint, error) {\n\t// 获取查询和规则判断条件\n\tstart := time.Now()\n\tdefer func() {\n\t\tarw.Processor.Stats.GaugeRuleEvalDuration.WithLabelValues(fmt.Sprintf(\"%v\", arw.Rule.Id), fmt.Sprintf(\"%v\", arw.Processor.DatasourceId())).Set(float64(time.Since(start).Milliseconds()))\n\t}()\n\n\tpoints := []models.AnomalyPoint{}\n\trecoverPoints := []models.AnomalyPoint{}\n\truleConfig := strings.TrimSpace(rule.RuleConfig)\n\tif ruleConfig == \"\" {\n\t\tlogger.Warningf(\"alert_eval_%d datasource_%d ruleConfig is blank\", rule.Id, dsId)\n\t\tarw.Processor.Stats.CounterRuleEvalErrorTotal.WithLabelValues(fmt.Sprintf(\"%v\", arw.Processor.DatasourceId()), GET_RULE_CONFIG, arw.Processor.BusiGroupCache.GetNameByBusiGroupId(arw.Rule.GroupId), fmt.Sprintf(\"%v\", arw.Rule.Id)).Inc()\n\t\tarw.Processor.Stats.GaugeQuerySeriesCount.WithLabelValues(\n\t\t\tfmt.Sprintf(\"%v\", arw.Rule.Id),\n\t\t\tfmt.Sprintf(\"%v\", arw.Processor.DatasourceId()),\n\t\t\t\"\",\n\t\t).Set(0)\n\n\t\treturn points, recoverPoints, fmt.Errorf(\"alert_eval_%d datasource_%d ruleConfig is blank\", rule.Id, dsId)\n\t}\n\n\tvar ruleQuery models.RuleQuery\n\terr := json.Unmarshal([]byte(ruleConfig), &ruleQuery)\n\tif err != nil {\n\t\tlogger.Warningf(\"alert_eval_%d datasource_%d promql parse error:%s\", rule.Id, dsId, err.Error())\n\t\tarw.Processor.Stats.CounterRuleEvalErrorTotal.WithLabelValues(fmt.Sprintf(\"%v\", arw.Processor.DatasourceId()), GET_RULE_CONFIG, arw.Processor.BusiGroupCache.GetNameByBusiGroupId(arw.Rule.GroupId), fmt.Sprintf(\"%v\", arw.Rule.Id)).Inc()\n\t\treturn points, recoverPoints, fmt.Errorf(\"alert_eval_%d datasource_%d promql parse error:%s\", rule.Id, dsId, err.Error())\n\t}\n\n\tarw.Inhibit = ruleQuery.Inhibit\n\tif len(ruleQuery.Queries) > 0 {\n\t\tseriesStore := make(map[uint64]models.DataResp)\n\t\tseriesTagIndexes := make(map[string]map[uint64][]uint64, 0)\n\t\tfor i, query := range ruleQuery.Queries {\n\t\t\tseriesTagIndex := make(map[uint64][]uint64)\n\n\t\t\tplug, exists := dscache.DsCache.Get(rule.Cate, dsId)\n\t\t\tif !exists {\n\t\t\t\tlogger.Warningf(\"alert_eval_%d datasource_%d not exists\", rule.Id, dsId)\n\t\t\t\tarw.Processor.Stats.CounterRuleEvalErrorTotal.WithLabelValues(fmt.Sprintf(\"%v\", arw.Processor.DatasourceId()), GET_CLIENT, arw.Processor.BusiGroupCache.GetNameByBusiGroupId(arw.Rule.GroupId), fmt.Sprintf(\"%v\", arw.Rule.Id)).Inc()\n\n\t\t\t\tarw.Processor.Stats.GaugeQuerySeriesCount.WithLabelValues(\n\t\t\t\t\tfmt.Sprintf(\"%v\", arw.Rule.Id),\n\t\t\t\t\tfmt.Sprintf(\"%v\", arw.Processor.DatasourceId()),\n\t\t\t\t\tfmt.Sprintf(\"%v\", i),\n\t\t\t\t).Set(-2)\n\n\t\t\t\treturn points, recoverPoints, fmt.Errorf(\"alert_eval_%d datasource_%d not exists\", rule.Id, dsId)\n\t\t\t}\n\n\t\t\tif err = ExecuteQueryTemplate(rule.Cate, query, nil); err != nil {\n\t\t\t\tlogger.Warningf(\"alert_eval_%d datasource_%d execute query template error: %v\", rule.Id, dsId, err)\n\t\t\t\tarw.Processor.Stats.CounterRuleEvalErrorTotal.WithLabelValues(fmt.Sprintf(\"%v\", arw.Processor.DatasourceId()), EXEC_TEMPLATE, arw.Processor.BusiGroupCache.GetNameByBusiGroupId(arw.Rule.GroupId), fmt.Sprintf(\"%v\", arw.Rule.Id)).Inc()\n\t\t\t\tarw.Processor.Stats.GaugeQuerySeriesCount.WithLabelValues(\n\t\t\t\t\tfmt.Sprintf(\"%v\", arw.Rule.Id),\n\t\t\t\t\tfmt.Sprintf(\"%v\", arw.Processor.DatasourceId()),\n\t\t\t\t\tfmt.Sprintf(\"%v\", i),\n\t\t\t\t).Set(-3)\n\t\t\t}\n\n\t\t\tctx := context.WithValue(context.Background(), \"delay\", int64(rule.Delay))\n\t\t\tseries, err := plug.QueryData(ctx, query)\n\t\t\tarw.Processor.Stats.CounterQueryDataTotal.WithLabelValues(fmt.Sprintf(\"%d\", arw.DatasourceId), fmt.Sprintf(\"%d\", rule.Id)).Inc()\n\t\t\tif err != nil {\n\t\t\t\tlogger.Warningf(\"alert_eval_%d datasource_%d query data error: %v\", rule.Id, dsId, err)\n\t\t\t\tarw.Processor.Stats.CounterRuleEvalErrorTotal.WithLabelValues(fmt.Sprintf(\"%v\", arw.Processor.DatasourceId()), GET_CLIENT, arw.Processor.BusiGroupCache.GetNameByBusiGroupId(arw.Rule.GroupId), fmt.Sprintf(\"%v\", arw.Rule.Id)).Inc()\n\t\t\t\tarw.Processor.Stats.GaugeQuerySeriesCount.WithLabelValues(\n\t\t\t\t\tfmt.Sprintf(\"%v\", arw.Rule.Id),\n\t\t\t\t\tfmt.Sprintf(\"%v\", arw.Processor.DatasourceId()),\n\t\t\t\t\tfmt.Sprintf(\"%v\", i),\n\t\t\t\t).Set(-1)\n\n\t\t\t\treturn points, recoverPoints, fmt.Errorf(\"alert_eval_%d datasource_%d query data error: %v\", rule.Id, dsId, err)\n\t\t\t}\n\n\t\t\tarw.Processor.Stats.GaugeQuerySeriesCount.WithLabelValues(\n\t\t\t\tfmt.Sprintf(\"%v\", arw.Rule.Id),\n\t\t\t\tfmt.Sprintf(\"%v\", arw.Processor.DatasourceId()),\n\t\t\t\tfmt.Sprintf(\"%v\", i),\n\t\t\t).Set(float64(len(series)))\n\n\t\t\t// 此条日志很重要,是告警判断的现场值\n\t\t\tlogger.Infof(\"alert_eval_%d datasource_%d req:%+v resp:%v\", rule.Id, dsId, query, series)\n\t\t\tfor i := 0; i < len(series); i++ {\n\t\t\t\tseriesHash := hash.GetHash(series[i].Metric, series[i].Ref)\n\t\t\t\ttagHash := hash.GetTagHash(series[i].Metric)\n\t\t\t\tseriesStore[seriesHash] = series[i]\n\n\t\t\t\t// 将曲线按照相同的 tag 分组\n\t\t\t\tif _, exists := seriesTagIndex[tagHash]; !exists {\n\t\t\t\t\tseriesTagIndex[tagHash] = make([]uint64, 0)\n\t\t\t\t}\n\t\t\t\tseriesTagIndex[tagHash] = append(seriesTagIndex[tagHash], seriesHash)\n\t\t\t}\n\t\t\tref, err := GetQueryRef(query)\n\t\t\tif err != nil {\n\t\t\t\tlogger.Warningf(\"alert_eval_%d datasource_%d query:%+v get ref error:%s\", rule.Id, dsId, query, err.Error())\n\t\t\t\tcontinue\n\t\t\t}\n\t\t\tseriesTagIndexes[ref] = seriesTagIndex\n\t\t}\n\n\t\tunitMap := make(map[string]string)\n\t\tfor _, query := range ruleQuery.Queries {\n\t\t\tref, unit, err := GetQueryRefAndUnit(query)\n\t\t\tif err != nil {\n\t\t\t\tlogger.Warningf(\"alert_eval_%d datasource_%d query:%+v get ref and unit error:%s\", rule.Id, dsId, query, err.Error())\n\t\t\t\tcontinue\n\t\t\t}\n\t\t\tunitMap[ref] = unit\n\t\t}\n\n\t\tif !ruleQuery.ExpTriggerDisable {\n\t\t\tfor _, trigger := range ruleQuery.Triggers {\n\t\t\t\tseriesTagIndex := ProcessJoins(rule.Id, trigger, seriesTagIndexes, seriesStore)\n\t\t\t\tfor _, seriesHash := range seriesTagIndex {\n\t\t\t\t\tvaluesUnitMap := make(map[string]unit.FormattedValue)\n\n\t\t\t\t\tsort.Slice(seriesHash, func(i, j int) bool {\n\t\t\t\t\t\treturn seriesHash[i] < seriesHash[j]\n\t\t\t\t\t})\n\n\t\t\t\t\tm := make(map[string]interface{})\n\t\t\t\t\tvar ts int64\n\t\t\t\t\tvar sample models.DataResp\n\t\t\t\t\tvar value float64\n\t\t\t\t\tfor _, seriesHash := range seriesHash {\n\t\t\t\t\t\tseries, exists := seriesStore[seriesHash]\n\t\t\t\t\t\tif !exists {\n\t\t\t\t\t\t\tlogger.Warningf(\"alert_eval_%d datasource_%d series:%+v not found\", rule.Id, dsId, series)\n\t\t\t\t\t\t\tcontinue\n\t\t\t\t\t\t}\n\t\t\t\t\t\tt, v, exists := series.Last()\n\t\t\t\t\t\tif !exists {\n\t\t\t\t\t\t\tlogger.Warningf(\"alert_eval_%d datasource_%d series:%+v value not found\", rule.Id, dsId, series)\n\t\t\t\t\t\t\tcontinue\n\t\t\t\t\t\t}\n\n\t\t\t\t\t\tif !strings.Contains(trigger.Exp, \"$\"+series.Ref) {\n\t\t\t\t\t\t\t// 表达式中不包含该变量\n\t\t\t\t\t\t\tcontinue\n\t\t\t\t\t\t}\n\n\t\t\t\t\t\tm[\"$\"+series.Ref] = v\n\t\t\t\t\t\tm[\"$\"+series.Ref+\".\"+series.MetricName()] = v\n\t\t\t\t\t\tfor k, v := range series.Metric {\n\t\t\t\t\t\t\tif k == \"__name__\" {\n\t\t\t\t\t\t\t\tcontinue\n\t\t\t\t\t\t\t}\n\n\t\t\t\t\t\t\tif !strings.Contains(trigger.Exp, \"$\"+series.Ref+\".\"+string(k)) {\n\t\t\t\t\t\t\t\t// 过滤掉表达式中不包含的标签\n\t\t\t\t\t\t\t\tcontinue\n\t\t\t\t\t\t\t}\n\n\t\t\t\t\t\t\tm[\"$\"+series.Ref+\".\"+string(k)] = string(v)\n\t\t\t\t\t\t}\n\n\t\t\t\t\t\tif u, exists := unitMap[series.Ref]; exists {\n\t\t\t\t\t\t\tvaluesUnitMap[\"$\"+series.Ref+\".\"+series.MetricName()] = unit.ValueFormatter(u, 2, v)\n\t\t\t\t\t\t}\n\n\t\t\t\t\t\tts = int64(t)\n\t\t\t\t\t\tsample = series\n\t\t\t\t\t\tvalue = v\n\t\t\t\t\t\tlogger.Infof(\"alert_eval_%d datasource_%d origin series labels:%+v\", rule.Id, dsId, series.Metric)\n\t\t\t\t\t}\n\n\t\t\t\t\tisTriggered := parser.CalcWithRid(trigger.Exp, m, rule.Id)\n\t\t\t\t\t// 此条日志很重要,是告警判断的现场值\n\t\t\t\t\tlogger.Infof(\"alert_eval_%d datasource_%d trigger:%+v exp:%s res:%v m:%v\", rule.Id, dsId, trigger, trigger.Exp, isTriggered, m)\n\n\t\t\t\t\tvar values string\n\t\t\t\t\tfor k, v := range m {\n\t\t\t\t\t\tif !strings.Contains(k, \".\") {\n\t\t\t\t\t\t\tcontinue\n\t\t\t\t\t\t}\n\n\t\t\t\t\t\tif u, exists := valuesUnitMap[k]; exists { // 配置了单位,优先用配置了单位的值\n\t\t\t\t\t\t\tvalues += fmt.Sprintf(\"%s:%s \", k, u.Text)\n\t\t\t\t\t\t} else {\n\t\t\t\t\t\t\tswitch v.(type) {\n\t\t\t\t\t\t\tcase float64:\n\t\t\t\t\t\t\t\tvalues += fmt.Sprintf(\"%s:%.3f \", k, v)\n\t\t\t\t\t\t\tcase string:\n\t\t\t\t\t\t\t\tvalues += fmt.Sprintf(\"%s:%s \", k, v)\n\t\t\t\t\t\t\t}\n\t\t\t\t\t\t}\n\t\t\t\t\t}\n\n\t\t\t\t\tqueries := ruleQuery.Queries\n\t\t\t\t\tif sample.Query != \"\" {\n\t\t\t\t\t\tqueries = []interface{}{sample.Query}\n\t\t\t\t\t}\n\n\t\t\t\t\tpoint := models.AnomalyPoint{\n\t\t\t\t\t\tKey: sample.MetricName(),\n\t\t\t\t\t\tLabels: sample.Metric,\n\t\t\t\t\t\tTimestamp: int64(ts),\n\t\t\t\t\t\tValue: value,\n\t\t\t\t\t\tValues: values,\n\t\t\t\t\t\tSeverity: trigger.Severity,\n\t\t\t\t\t\tTriggered: isTriggered,\n\t\t\t\t\t\tQuery: fmt.Sprintf(\"query:%+v trigger:%+v\", queries, trigger),\n\t\t\t\t\t\tRecoverConfig: trigger.RecoverConfig,\n\t\t\t\t\t\tValuesUnit: valuesUnitMap,\n\t\t\t\t\t}\n\n\t\t\t\t\tif isTriggered {\n\t\t\t\t\t\tpoints = append(points, point)\n\t\t\t\t\t} else {\n\t\t\t\t\t\tswitch trigger.RecoverConfig.JudgeType {\n\t\t\t\t\t\tcase models.Origin:\n\t\t\t\t\t\t\t// do nothing\n\t\t\t\t\t\tcase models.RecoverOnCondition:\n\t\t\t\t\t\t\tfulfill := parser.CalcWithRid(trigger.RecoverConfig.RecoverExp, m, rule.Id)\n\t\t\t\t\t\t\tif !fulfill {\n\t\t\t\t\t\t\t\tcontinue\n\t\t\t\t\t\t\t}\n\t\t\t\t\t\t}\n\t\t\t\t\t\trecoverPoints = append(recoverPoints, point)\n\t\t\t\t\t}\n\t\t\t\t}\n\t\t\t}\n\t\t}\n\n\t\tif ruleQuery.NodataTrigger.Enable {\n\n\t\t\tnow := time.Now().Unix()\n\n\t\t\t// 使用 arw.LastSeriesStore 检查上次查询结果\n\t\t\tif len(arw.LastSeriesStore) > 0 {\n\t\t\t\t// 遍历上次的曲线数据\n\t\t\t\tfor hash, lastSeries := range arw.LastSeriesStore {\n\n\t\t\t\t\tif ruleQuery.NodataTrigger.ResolveAfterEnable {\n\t\t\t\t\t\tlastTs, _, exists := lastSeries.Last()\n\t\t\t\t\t\tif !exists {\n\t\t\t\t\t\t\tcontinue\n\t\t\t\t\t\t}\n\n\t\t\t\t\t\t// 检查是否超过 resolve_after 时间\n\t\t\t\t\t\tif now-int64(lastTs) > int64(ruleQuery.NodataTrigger.ResolveAfter) {\n\t\t\t\t\t\t\tlogger.Infof(\"alert_eval_%d datasource_%d series:%+v resolve after %d seconds now:%d lastTs:%d\", rule.Id, dsId, lastSeries, ruleQuery.NodataTrigger.ResolveAfter, now, int64(lastTs))\n\t\t\t\t\t\t\tdelete(arw.LastSeriesStore, hash)\n\t\t\t\t\t\t\tcontinue\n\t\t\t\t\t\t}\n\t\t\t\t\t}\n\n\t\t\t\t\t// 检查是否在本次查询结果中存在\n\t\t\t\t\tif _, exists := seriesStore[hash]; !exists {\n\t\t\t\t\t\t// 生成无数据告警点\n\t\t\t\t\t\tpoint := models.AnomalyPoint{\n\t\t\t\t\t\t\tKey: lastSeries.MetricName(),\n\t\t\t\t\t\t\tLabels: lastSeries.Metric,\n\t\t\t\t\t\t\tTimestamp: now,\n\t\t\t\t\t\t\tValue: 0,\n\t\t\t\t\t\t\tValues: fmt.Sprintf(\"nodata since %v\", time.Unix(now, 0).Format(\"2006-01-02 15:04:05\")),\n\t\t\t\t\t\t\tSeverity: ruleQuery.NodataTrigger.Severity,\n\t\t\t\t\t\t\tTriggered: true,\n\t\t\t\t\t\t\tQuery: fmt.Sprintf(\"nodata check for %s\", lastSeries.LabelsString()),\n\t\t\t\t\t\t\tTriggerType: models.TriggerTypeNodata,\n\t\t\t\t\t\t}\n\t\t\t\t\t\tpoints = append(points, point)\n\t\t\t\t\t\tlogger.Infof(\"alert_eval_%d datasource_%d nodata point:%+v\", rule.Id, dsId, point)\n\t\t\t\t\t}\n\t\t\t\t}\n\n\t\t\t}\n\n\t\t\t// 更新 arw.LastSeriesStore\n\t\t\tfor hash, series := range seriesStore {\n\t\t\t\tarw.LastSeriesStore[hash] = series\n\t\t\t}\n\t\t}\n\t}\n\n\treturn points, recoverPoints, nil\n}\n\n// ExecuteQueryTemplate 根据数据源类型对 Query 进行模板渲染处理\n// cate: 数据源类别,如 \"mysql\", \"pgsql\" 等\n// query: 查询对象,如果是数据库类型的数据源,会处理其中的 sql 字段\n// data: 模板数据对象,如果为 nil 则使用空结构体(不支持变量渲染),如果不为 nil 则使用传入的数据(支持变量渲染)\nfunc ExecuteQueryTemplate(cate string, query interface{}, data interface{}) error {\n\t// 检查 query 是否是 map,且包含 sql 字段\n\tqueryMap, ok := query.(map[string]interface{})\n\tif !ok {\n\t\treturn nil\n\t}\n\n\tsqlVal, exists := queryMap[\"sql\"]\n\tif !exists {\n\t\treturn nil\n\t}\n\n\tsqlStr, ok := sqlVal.(string)\n\tif !ok {\n\t\treturn nil\n\t}\n\n\t// 调用 ExecuteSqlTemplate 处理 sql 字段\n\tprocessedSQL, err := ExecuteSqlTemplate(sqlStr, data)\n\tif err != nil {\n\t\treturn fmt.Errorf(\"execute sql template error: %w\", err)\n\t}\n\n\t// 更新 query 中的 sql 字段\n\tqueryMap[\"sql\"] = processedSQL\n\treturn nil\n}\n\n// ExecuteSqlTemplate 执行 query 中的 golang 模板语法函数\n// query: 要处理的 query 字符串\n// data: 模板数据对象,如果为 nil 则使用空结构体(不支持变量渲染),如果不为 nil 则使用传入的数据(支持变量渲染)\nfunc ExecuteSqlTemplate(query string, data interface{}) (string, error) {\n\tif !strings.Contains(query, \"{{\") || !strings.Contains(query, \"}}\") {\n\t\treturn query, nil\n\t}\n\n\ttmpl, err := template.New(\"query\").Funcs(tplx.TemplateFuncMap).Parse(query)\n\tif err != nil {\n\t\treturn \"\", fmt.Errorf(\"query tmpl parse error: %w\", err)\n\t}\n\n\tvar buf strings.Builder\n\ttemplateData := data\n\tif templateData == nil {\n\t\ttemplateData = struct{}{}\n\t}\n\n\tif err := tmpl.Execute(&buf, templateData); err != nil {\n\t\treturn \"\", fmt.Errorf(\"query tmpl execute error: %w\", err)\n\t}\n\n\treturn buf.String(), nil\n}\n"
},
{
"path": "alert/eval/eval_test.go",
"content": "package eval\n\nimport (\n\t\"reflect\"\n\t\"testing\"\n\n\t\"golang.org/x/exp/slices\"\n)\n\nvar (\n\treHashTagIndex1 = map[uint64][][]uint64{\n\t\t1: {\n\t\t\t{1, 2}, {3, 4},\n\t\t},\n\t\t2: {\n\t\t\t{5, 6}, {7, 8},\n\t\t},\n\t}\n\treHashTagIndex2 = map[uint64][][]uint64{\n\t\t1: {\n\t\t\t{9, 10}, {11, 12},\n\t\t},\n\t\t3: {\n\t\t\t{13, 14}, {15, 16},\n\t\t},\n\t}\n\tseriesTagIndex1 = map[uint64][]uint64{\n\t\t1: {1, 2, 3, 4},\n\t\t2: {5, 6, 7, 8},\n\t}\n\tseriesTagIndex2 = map[uint64][]uint64{\n\t\t1: {9, 10, 11, 12},\n\t\t3: {13, 14, 15, 16},\n\t}\n)\n\nfunc Test_originalJoin(t *testing.T) {\n\ttype args struct {\n\t\tseriesTagIndex1 map[uint64][]uint64\n\t\tseriesTagIndex2 map[uint64][]uint64\n\t}\n\ttests := []struct {\n\t\tname string\n\t\targs args\n\t\twant map[uint64][]uint64\n\t}{\n\t\t{\n\t\t\tname: \"original join\",\n\t\t\targs: args{\n\t\t\t\tseriesTagIndex1: map[uint64][]uint64{\n\t\t\t\t\t1: {1, 2, 3, 4},\n\t\t\t\t\t2: {5, 6, 7, 8},\n\t\t\t\t},\n\t\t\t\tseriesTagIndex2: map[uint64][]uint64{\n\t\t\t\t\t1: {9, 10, 11, 12},\n\t\t\t\t\t3: {13, 14, 15, 16},\n\t\t\t\t},\n\t\t\t},\n\t\t\twant: map[uint64][]uint64{\n\t\t\t\t1: {1, 2, 3, 4, 9, 10, 11, 12},\n\t\t\t\t2: {5, 6, 7, 8},\n\t\t\t\t3: {13, 14, 15, 16},\n\t\t\t},\n\t\t},\n\t}\n\tfor _, tt := range tests {\n\t\tt.Run(tt.name, func(t *testing.T) {\n\t\t\tif got := originalJoin(tt.args.seriesTagIndex1, tt.args.seriesTagIndex2); !reflect.DeepEqual(got, tt.want) {\n\t\t\t\tt.Errorf(\"originalJoin() = %v, want %v\", got, tt.want)\n\t\t\t}\n\t\t})\n\t}\n}\n\nfunc Test_exclude(t *testing.T) {\n\ttype args struct {\n\t\treHashTagIndex1 map[uint64][][]uint64\n\t\treHashTagIndex2 map[uint64][][]uint64\n\t}\n\ttests := []struct {\n\t\tname string\n\t\targs args\n\t\twant map[uint64][]uint64\n\t}{\n\t\t{\n\t\t\tname: \"left exclude\",\n\t\t\targs: args{\n\t\t\t\treHashTagIndex1: reHashTagIndex1,\n\t\t\t\treHashTagIndex2: reHashTagIndex2,\n\t\t\t},\n\t\t\twant: map[uint64][]uint64{\n\t\t\t\t0: {5, 6},\n\t\t\t\t1: {7, 8},\n\t\t\t},\n\t\t},\n\t\t{\n\t\t\tname: \"right exclude\",\n\t\t\targs: args{\n\t\t\t\treHashTagIndex1: reHashTagIndex2,\n\t\t\t\treHashTagIndex2: reHashTagIndex1,\n\t\t\t},\n\t\t\twant: map[uint64][]uint64{\n\t\t\t\t3: {13, 14},\n\t\t\t\t4: {15, 16},\n\t\t\t},\n\t\t},\n\t}\n\tfor _, tt := range tests {\n\t\tt.Run(tt.name, func(t *testing.T) {\n\t\t\tif got := exclude(tt.args.reHashTagIndex1, tt.args.reHashTagIndex2); !allValueDeepEqual(flatten(got), tt.want) {\n\t\t\t\tt.Errorf(\"exclude() = %v, want %v\", got, tt.want)\n\t\t\t}\n\t\t})\n\t}\n}\n\nfunc Test_noneJoin(t *testing.T) {\n\ttype args struct {\n\t\tseriesTagIndex1 map[uint64][]uint64\n\t\tseriesTagIndex2 map[uint64][]uint64\n\t}\n\ttests := []struct {\n\t\tname string\n\t\targs args\n\t\twant map[uint64][]uint64\n\t}{\n\t\t{\n\t\t\tname: \"none join, direct splicing\",\n\t\t\targs: args{\n\t\t\t\tseriesTagIndex1: seriesTagIndex1,\n\t\t\t\tseriesTagIndex2: seriesTagIndex2,\n\t\t\t},\n\t\t\twant: map[uint64][]uint64{\n\t\t\t\t0: {1, 2, 3, 4},\n\t\t\t\t1: {5, 6, 7, 8},\n\t\t\t\t2: {9, 10, 11, 12},\n\t\t\t\t3: {13, 14, 15, 16},\n\t\t\t},\n\t\t},\n\t}\n\tfor _, tt := range tests {\n\t\tt.Run(tt.name, func(t *testing.T) {\n\t\t\tif got := noneJoin(tt.args.seriesTagIndex1, tt.args.seriesTagIndex2); !allValueDeepEqual(got, tt.want) {\n\t\t\t\tt.Errorf(\"noneJoin() = %v, want %v\", got, tt.want)\n\t\t\t}\n\t\t})\n\t}\n}\n\nfunc Test_cartesianJoin(t *testing.T) {\n\ttype args struct {\n\t\tseriesTagIndex1 map[uint64][]uint64\n\t\tseriesTagIndex2 map[uint64][]uint64\n\t}\n\ttests := []struct {\n\t\tname string\n\t\targs args\n\t\twant map[uint64][]uint64\n\t}{\n\t\t{\n\t\t\tname: \"cartesian join\",\n\t\t\targs: args{\n\t\t\t\tseriesTagIndex1: seriesTagIndex1,\n\t\t\t\tseriesTagIndex2: seriesTagIndex2,\n\t\t\t},\n\t\t\twant: map[uint64][]uint64{\n\t\t\t\t0: {1, 2, 3, 4, 9, 10, 11, 12},\n\t\t\t\t1: {5, 6, 7, 8, 9, 10, 11, 12},\n\t\t\t\t2: {5, 6, 7, 8, 13, 14, 15, 16},\n\t\t\t\t3: {1, 2, 3, 4, 13, 14, 15, 16},\n\t\t\t},\n\t\t},\n\t}\n\tfor _, tt := range tests {\n\t\tt.Run(tt.name, func(t *testing.T) {\n\t\t\tif got := cartesianJoin(tt.args.seriesTagIndex1, tt.args.seriesTagIndex2); !allValueDeepEqual(got, tt.want) {\n\t\t\t\tt.Errorf(\"cartesianJoin() = %v, want %v\", got, tt.want)\n\t\t\t}\n\t\t})\n\t}\n}\n\nfunc Test_onJoin(t *testing.T) {\n\ttype args struct {\n\t\treHashTagIndex1 map[uint64][][]uint64\n\t\treHashTagIndex2 map[uint64][][]uint64\n\t\tjoinType JoinType\n\t}\n\ttests := []struct {\n\t\tname string\n\t\targs args\n\t\twant map[uint64][]uint64\n\t}{\n\t\t{\n\t\t\tname: \"left join\",\n\t\t\targs: args{\n\t\t\t\treHashTagIndex1: reHashTagIndex1,\n\t\t\t\treHashTagIndex2: reHashTagIndex2,\n\t\t\t\tjoinType: Left,\n\t\t\t},\n\t\t\twant: map[uint64][]uint64{\n\t\t\t\t1: {1, 2, 9, 10},\n\t\t\t\t2: {3, 4, 9, 10},\n\t\t\t\t3: {1, 2, 11, 12},\n\t\t\t\t4: {3, 4, 11, 12},\n\t\t\t\t5: {5, 6},\n\t\t\t\t6: {7, 8},\n\t\t\t},\n\t\t},\n\t\t{\n\t\t\tname: \"right join\",\n\t\t\targs: args{\n\t\t\t\treHashTagIndex1: reHashTagIndex2,\n\t\t\t\treHashTagIndex2: reHashTagIndex1,\n\t\t\t\tjoinType: Right,\n\t\t\t},\n\t\t\twant: map[uint64][]uint64{\n\t\t\t\t1: {1, 2, 9, 10},\n\t\t\t\t2: {3, 4, 9, 10},\n\t\t\t\t3: {1, 2, 11, 12},\n\t\t\t\t4: {3, 4, 11, 12},\n\t\t\t\t5: {13, 14},\n\t\t\t\t6: {15, 16},\n\t\t\t},\n\t\t},\n\n\t\t{\n\t\t\tname: \"inner join\",\n\t\t\targs: args{\n\t\t\t\treHashTagIndex1: reHashTagIndex1,\n\t\t\t\treHashTagIndex2: reHashTagIndex2,\n\t\t\t\tjoinType: Inner,\n\t\t\t},\n\t\t\twant: map[uint64][]uint64{\n\t\t\t\t1: {1, 2, 9, 10},\n\t\t\t\t2: {3, 4, 9, 10},\n\t\t\t\t3: {1, 2, 11, 12},\n\t\t\t\t4: {3, 4, 11, 12},\n\t\t\t},\n\t\t},\n\t}\n\tfor _, tt := range tests {\n\t\tt.Run(tt.name, func(t *testing.T) {\n\t\t\tif got := onJoin(tt.args.reHashTagIndex1, tt.args.reHashTagIndex2, tt.args.joinType); !allValueDeepEqual(flatten(got), tt.want) {\n\t\t\t\tt.Errorf(\"onJoin() = %v, want %v\", got, tt.want)\n\t\t\t}\n\t\t})\n\t}\n}\n\n// allValueDeepEqual 判断 map 的 value 是否相同,不考虑 key\nfunc allValueDeepEqual(got, want map[uint64][]uint64) bool {\n\tif len(got) != len(want) {\n\t\treturn false\n\t}\n\tfor _, v1 := range got {\n\t\tcurEqual := false\n\t\tslices.Sort(v1)\n\t\tfor _, v2 := range want {\n\t\t\tslices.Sort(v2)\n\t\t\tif reflect.DeepEqual(v1, v2) {\n\t\t\t\tcurEqual = true\n\t\t\t\tbreak\n\t\t\t}\n\t\t}\n\t\tif !curEqual {\n\t\t\treturn false\n\t\t}\n\t}\n\treturn true\n}\n\n// allValueDeepEqualOmitOrder 判断两个字符串切片是否相等,不考虑顺序\nfunc allValueDeepEqualOmitOrder(got, want []string) bool {\n\tif len(got) != len(want) {\n\t\treturn false\n\t}\n\tslices.Sort(got)\n\tslices.Sort(want)\n\tfor i := range got {\n\t\tif got[i] != want[i] {\n\t\t\treturn false\n\t\t}\n\t}\n\treturn true\n}\n\nfunc Test_removeVal(t *testing.T) {\n\ttype args struct {\n\t\tpromql string\n\t}\n\ttests := []struct {\n\t\tname string\n\t\targs args\n\t\twant string\n\t}{\n\t\t// TODO: Add test cases.\n\t\t{\n\t\t\tname: \"removeVal1\",\n\t\t\targs: args{\n\t\t\t\tpromql: \"mem{test1=\\\"$test1\\\",test2=\\\"$test2\\\",test3=\\\"$test3\\\"} > $val\",\n\t\t\t},\n\t\t\twant: \"mem{} > $val\",\n\t\t},\n\t\t{\n\t\t\tname: \"removeVal2\",\n\t\t\targs: args{\n\t\t\t\tpromql: \"mem{test1=\\\"test1\\\",test2=\\\"$test2\\\",test3=\\\"$test3\\\"} > $val\",\n\t\t\t},\n\t\t\twant: \"mem{test1=\\\"test1\\\"} > $val\",\n\t\t},\n\t\t{\n\t\t\tname: \"removeVal3\",\n\t\t\targs: args{\n\t\t\t\tpromql: \"mem{test1=\\\"$test1\\\",test2=\\\"test2\\\",test3=\\\"$test3\\\"} > $val\",\n\t\t\t},\n\t\t\twant: \"mem{test2=\\\"test2\\\"} > $val\",\n\t\t},\n\t\t{\n\t\t\tname: \"removeVal4\",\n\t\t\targs: args{\n\t\t\t\tpromql: \"mem{test1=\\\"$test1\\\",test2=\\\"$test2\\\",test3=\\\"test3\\\"} > $val\",\n\t\t\t},\n\t\t\twant: \"mem{test3=\\\"test3\\\"} > $val\",\n\t\t},\n\t\t{\n\t\t\tname: \"removeVal5\",\n\t\t\targs: args{\n\t\t\t\tpromql: \"mem{test1=\\\"$test1\\\",test2=\\\"test2\\\",test3=\\\"test3\\\"} > $val\",\n\t\t\t},\n\t\t\twant: \"mem{test2=\\\"test2\\\",test3=\\\"test3\\\"} > $val\",\n\t\t},\n\t\t{\n\t\t\tname: \"removeVal6\",\n\t\t\targs: args{\n\t\t\t\tpromql: \"mem{test1=\\\"test1\\\",test2=\\\"$test2\\\",test3=\\\"test3\\\"} > $val\",\n\t\t\t},\n\t\t\twant: \"mem{test1=\\\"test1\\\",test3=\\\"test3\\\"} > $val\",\n\t\t},\n\t\t{\n\t\t\tname: \"removeVal7\",\n\t\t\targs: args{\n\t\t\t\tpromql: \"mem{test1=\\\"test1\\\",test2=\\\"test2\\\",test3='$test3'} > $val\",\n\t\t\t},\n\t\t\twant: \"mem{test1=\\\"test1\\\",test2=\\\"test2\\\"} > $val\",\n\t\t},\n\t\t{\n\t\t\tname: \"removeVal8\",\n\t\t\targs: args{\n\t\t\t\tpromql: \"mem{test1=\\\"test1\\\",test2=\\\"test2\\\",test3=\\\"test3\\\"} > $val\",\n\t\t\t},\n\t\t\twant: \"mem{test1=\\\"test1\\\",test2=\\\"test2\\\",test3=\\\"test3\\\"} > $val\",\n\t\t},\n\t\t{\n\t\t\tname: \"removeVal9\",\n\t\t\targs: args{\n\t\t\t\tpromql: \"mem{test1=\\\"$test1\\\",test2=\\\"test2\\\"} > $val1 and mem{test3=\\\"test3\\\",test4=\\\"test4\\\"} > $val2\",\n\t\t\t},\n\t\t\twant: \"mem{test2=\\\"test2\\\"} > $val1 and mem{test3=\\\"test3\\\",test4=\\\"test4\\\"} > $val2\",\n\t\t},\n\t\t{\n\t\t\tname: \"removeVal10\",\n\t\t\targs: args{\n\t\t\t\tpromql: \"mem{test1=\\\"test1\\\",test2='$test2'} > $val1 and mem{test3=\\\"test3\\\",test4=\\\"test4\\\"} > $val2\",\n\t\t\t},\n\t\t\twant: \"mem{test1=\\\"test1\\\"} > $val1 and mem{test3=\\\"test3\\\",test4=\\\"test4\\\"} > $val2\",\n\t\t},\n\t\t{\n\t\t\tname: \"removeVal11\",\n\t\t\targs: args{\n\t\t\t\tpromql: \"mem{test1='test1',test2=\\\"test2\\\"} > $val1 and mem{test3=\\\"$test3\\\",test4=\\\"test4\\\"} > $val2\",\n\t\t\t},\n\t\t\twant: \"mem{test1='test1',test2=\\\"test2\\\"} > $val1 and mem{test4=\\\"test4\\\"} > $val2\",\n\t\t},\n\t\t{\n\t\t\tname: \"removeVal12\",\n\t\t\targs: args{\n\t\t\t\tpromql: \"mem{test1=\\\"test1\\\",test2=\\\"test2\\\"} > $val1 and mem{test3=\\\"test3\\\",test4=\\\"$test4\\\"} > $val2\",\n\t\t\t},\n\t\t\twant: \"mem{test1=\\\"test1\\\",test2=\\\"test2\\\"} > $val1 and mem{test3=\\\"test3\\\"} > $val2\",\n\t\t},\n\t}\n\tfor _, tt := range tests {\n\t\tt.Run(tt.name, func(t *testing.T) {\n\t\t\tif got := removeVal(tt.args.promql); got != tt.want {\n\t\t\t\tt.Errorf(\"removeVal() = %v, want %v\", got, tt.want)\n\t\t\t}\n\t\t})\n\t}\n}\n\nfunc TestExtractVarMapping(t *testing.T) {\n\ttests := []struct {\n\t\tname string\n\t\tpromql string\n\t\twant map[string]string\n\t}{\n\t\t{\n\t\t\tname: \"单个花括号单个变量\",\n\t\t\tpromql: `mem_used_percent{host=\"$my_host\"} > $val`,\n\t\t\twant: map[string]string{\"my_host\": \"host\"},\n\t\t},\n\t\t{\n\t\t\tname: \"单个花括号多个变量\",\n\t\t\tpromql: `mem_used_percent{host=\"$my_host\",region=\"$region\",env=\"prod\"} > $val`,\n\t\t\twant: map[string]string{\"my_host\": \"host\", \"region\": \"region\"},\n\t\t},\n\t\t{\n\t\t\tname: \"多个花括号多个变量\",\n\t\t\tpromql: `sum(rate(mem_used_percent{host=\"$my_host\"})) by (instance) + avg(node_load1{region=\"$region\"}) > $val`,\n\t\t\twant: map[string]string{\"my_host\": \"host\", \"region\": \"region\"},\n\t\t},\n\t\t{\n\t\t\tname: \"相同变量出现多次\",\n\t\t\tpromql: `sum(rate(mem_used_percent{host=\"$my_host\"})) + avg(node_load1{host=\"$my_host\"}) > $val`,\n\t\t\twant: map[string]string{\"my_host\": \"host\"},\n\t\t},\n\t\t{\n\t\t\tname: \"没有变量\",\n\t\t\tpromql: `mem_used_percent{host=\"localhost\",region=\"cn\"} > 80`,\n\t\t\twant: map[string]string{},\n\t\t},\n\t\t{\n\t\t\tname: \"没有花括号\",\n\t\t\tpromql: `80 > $val`,\n\t\t\twant: map[string]string{},\n\t\t},\n\t\t{\n\t\t\tname: \"格式不规范的标签\",\n\t\t\tpromql: `mem_used_percent{host=$my_host,region = $region} > $val`,\n\t\t\twant: map[string]string{\"my_host\": \"host\", \"region\": \"region\"},\n\t\t},\n\t\t{\n\t\t\tname: \"空花括号\",\n\t\t\tpromql: `mem_used_percent{} > $val`,\n\t\t\twant: map[string]string{},\n\t\t},\n\t\t{\n\t\t\tname: \"不完整的花括号\",\n\t\t\tpromql: `mem_used_percent{host=\"$my_host\"`,\n\t\t\twant: map[string]string{},\n\t\t},\n\t\t{\n\t\t\tname: \"复杂表达式\",\n\t\t\tpromql: `sum(rate(http_requests_total{handler=\"$handler\",code=\"$code\"}[5m])) by (handler) / sum(rate(http_requests_total{handler=\"$handler\"}[5m])) by (handler) * 100 > $threshold`,\n\t\t\twant: map[string]string{\"handler\": \"handler\", \"code\": \"code\"},\n\t\t},\n\t}\n\n\tfor _, tt := range tests {\n\t\tt.Run(tt.name, func(t *testing.T) {\n\t\t\tgot := ExtractVarMapping(tt.promql)\n\t\t\tif !reflect.DeepEqual(got, tt.want) {\n\t\t\t\tt.Errorf(\"ExtractVarMapping() = %v, want %v\", got, tt.want)\n\t\t\t}\n\t\t})\n\t}\n}\n"
},
{
"path": "alert/mute/mute.go",
"content": "package mute\n\nimport (\n\t\"slices\"\n\t\"strconv\"\n\t\"strings\"\n\t\"time\"\n\n\t\"github.com/ccfos/nightingale/v6/alert/common\"\n\t\"github.com/ccfos/nightingale/v6/memsto\"\n\t\"github.com/ccfos/nightingale/v6/models\"\n\n\t\"github.com/pkg/errors\"\n\t\"github.com/toolkits/pkg/logger\"\n)\n\nfunc IsMuted(rule *models.AlertRule, event *models.AlertCurEvent, targetCache *memsto.TargetCacheType, alertMuteCache *memsto.AlertMuteCacheType) (bool, string, int64) {\n\tif rule.Disabled == 1 {\n\t\treturn true, \"rule disabled\", 0\n\t}\n\n\tif TimeSpanMuteStrategy(rule, event) {\n\t\treturn true, \"rule is not effective for period of time\", 0\n\t}\n\n\tif IdentNotExistsMuteStrategy(rule, event, targetCache) {\n\t\treturn true, \"ident not exists mute\", 0\n\t}\n\n\tif BgNotMatchMuteStrategy(rule, event, targetCache) {\n\t\treturn true, \"bg not match mute\", 0\n\t}\n\n\thit, muteId := EventMuteStrategy(event, alertMuteCache)\n\tif hit {\n\t\treturn true, \"match mute rule\", muteId\n\t}\n\n\treturn false, \"\", 0\n}\n\n// TimeSpanMuteStrategy 根据规则配置的告警生效时间段过滤,如果产生的告警不在规则配置的告警生效时间段内,则不告警,即被mute\n// 时间范围,左闭右开,默认范围:00:00-24:00\n// 如果规则配置了时区,则在该时区下进行时间判断;如果时区为空,则使用系统时区\nfunc TimeSpanMuteStrategy(rule *models.AlertRule, event *models.AlertCurEvent) bool {\n\t// 确定使用的时区\n\tvar targetLoc *time.Location\n\tvar err error\n\n\ttimezone := rule.TimeZone\n\tif timezone == \"\" {\n\t\t// 如果时区为空,使用系统时区(保持原有逻辑)\n\t\ttargetLoc = time.Local\n\t} else {\n\t\t// 加载规则配置的时区\n\t\ttargetLoc, err = time.LoadLocation(timezone)\n\t\tif err != nil {\n\t\t\t// 如果时区加载失败,记录错误并使用系统时区\n\t\t\tlogger.Warningf(\"Failed to load timezone %s for rule %d, using system timezone: %v\", timezone, rule.Id, err)\n\t\t\ttargetLoc = time.Local\n\t\t}\n\t}\n\n\t// 将触发时间转换到目标时区\n\ttm := time.Unix(event.TriggerTime, 0).In(targetLoc)\n\ttriggerTime := tm.Format(\"15:04\")\n\ttriggerWeek := strconv.Itoa(int(tm.Weekday()))\n\n\tif rule.EnableDaysOfWeek == \"\" {\n\t\t// 如果规则没有配置生效时间,则默认全天生效\n\n\t\treturn false\n\t}\n\n\tenableStime := strings.Fields(rule.EnableStime)\n\tenableEtime := strings.Fields(rule.EnableEtime)\n\tenableDaysOfWeek := strings.Split(rule.EnableDaysOfWeek, \";\")\n\tlength := len(enableDaysOfWeek)\n\t// enableStime,enableEtime,enableDaysOfWeek三者长度肯定相同,这里循环一个即可\n\tfor i := 0; i < length; i++ {\n\t\tenableDaysOfWeek[i] = strings.Replace(enableDaysOfWeek[i], \"7\", \"0\", 1)\n\t\tif !strings.Contains(enableDaysOfWeek[i], triggerWeek) {\n\t\t\tcontinue\n\t\t}\n\n\t\tif enableStime[i] < enableEtime[i] {\n\t\t\tif enableEtime[i] == \"23:59\" {\n\t\t\t\t// 02:00-23:59,这种情况做个特殊处理,相当于左闭右闭区间了\n\t\t\t\tif triggerTime < enableStime[i] {\n\t\t\t\t\t// mute, 即没生效\n\t\t\t\t\tcontinue\n\t\t\t\t}\n\t\t\t} else {\n\t\t\t\t// 02:00-04:00 或者 02:00-24:00\n\t\t\t\tif triggerTime < enableStime[i] || triggerTime >= enableEtime[i] {\n\t\t\t\t\t// mute, 即没生效\n\t\t\t\t\tcontinue\n\t\t\t\t}\n\t\t\t}\n\t\t} else if enableStime[i] > enableEtime[i] {\n\t\t\t// 21:00-09:00\n\t\t\tif triggerTime < enableStime[i] && triggerTime >= enableEtime[i] {\n\t\t\t\t// mute, 即没生效\n\t\t\t\tcontinue\n\t\t\t}\n\t\t}\n\n\t\t// 到这里说明当前时刻在告警规则的某组生效时间范围内,即没有 mute,直接返回 false\n\t\treturn false\n\t}\n\n\treturn true\n}\n\n// IdentNotExistsMuteStrategy 根据ident是否存在过滤,如果ident不存在,则target_up的告警直接过滤掉\nfunc IdentNotExistsMuteStrategy(rule *models.AlertRule, event *models.AlertCurEvent, targetCache *memsto.TargetCacheType) bool {\n\tident, has := event.TagsMap[\"ident\"]\n\tif !has {\n\t\treturn false\n\t}\n\t_, exists := targetCache.Get(ident)\n\t// 如果是target_up的告警,且ident已经不存在了,直接过滤掉\n\t// 这里的判断有点太粗暴了,但是目前没有更好的办法\n\tif !exists && strings.Contains(rule.PromQl, \"target_up\") {\n\t\tlogger.Debugf(\"alert_eval_%d [IdentNotExistsMuteStrategy] mute: cluster:%s ident:%s\", rule.Id, event.Cluster, ident)\n\t\treturn true\n\t}\n\treturn false\n}\n\n// BgNotMatchMuteStrategy 当规则开启只在bg内部告警时,对于非bg内部的机器过滤\nfunc BgNotMatchMuteStrategy(rule *models.AlertRule, event *models.AlertCurEvent, targetCache *memsto.TargetCacheType) bool {\n\t// 没有开启BG内部告警,直接不过滤\n\tif rule.EnableInBG == 0 {\n\t\treturn false\n\t}\n\n\tident, has := event.TagsMap[\"ident\"]\n\tif !has {\n\t\treturn false\n\t}\n\n\ttarget, exists := targetCache.Get(ident)\n\t// 对于包含ident的告警事件,check一下ident所属bg和rule所属bg是否相同\n\t// 如果告警规则选择了只在本BG生效,那其他BG的机器就不能因此规则产生告警\n\tif exists && !target.MatchGroupId(rule.GroupId) {\n\t\tlogger.Debugf(\"alert_eval_%d [BgNotMatchMuteStrategy] mute: cluster:%s\", rule.Id, event.Cluster)\n\t\treturn true\n\t}\n\treturn false\n}\n\nfunc EventMuteStrategy(event *models.AlertCurEvent, alertMuteCache *memsto.AlertMuteCacheType) (bool, int64) {\n\tmutes, has := alertMuteCache.Gets(event.GroupId)\n\tif !has || len(mutes) == 0 {\n\t\treturn false, 0\n\t}\n\n\tfor i := 0; i < len(mutes); i++ {\n\t\tmatched, _ := MatchMute(event, mutes[i])\n\t\tif matched {\n\t\t\treturn true, mutes[i].Id\n\t\t}\n\t}\n\n\treturn false, 0\n}\n\n// MatchMute 如果传入了clock这个可选参数,就表示使用这个clock表示的时间,否则就从event的字段中取TriggerTime\nfunc MatchMute(event *models.AlertCurEvent, mute *models.AlertMute, clock ...int64) (bool, error) {\n\tif mute.Disabled == 1 {\n\t\treturn false, errors.New(\"mute is disabled\")\n\t}\n\n\t// 如果不是全局的,判断 匹配的 datasource id\n\tif len(mute.DatasourceIdsJson) != 0 && mute.DatasourceIdsJson[0] != 0 && event.DatasourceId != 0 {\n\t\tif !slices.Contains(mute.DatasourceIdsJson, event.DatasourceId) {\n\t\t\treturn false, errors.New(\"datasource id not match\")\n\t\t}\n\t}\n\n\tif mute.MuteTimeType == models.TimeRange {\n\t\tif !mute.IsWithinTimeRange(event.TriggerTime) {\n\t\t\treturn false, errors.New(\"event trigger time not within mute time range\")\n\t\t}\n\t} else if mute.MuteTimeType == models.Periodic {\n\t\tts := event.TriggerTime\n\t\tif len(clock) > 0 {\n\t\t\tts = clock[0]\n\t\t}\n\n\t\tif !mute.IsWithinPeriodicMute(ts) {\n\t\t\treturn false, errors.New(\"event trigger time not within periodic mute range\")\n\t\t}\n\t} else {\n\t\tlogger.Warningf(\"mute time type invalid, %d\", mute.MuteTimeType)\n\t\treturn false, errors.New(\"mute time type invalid\")\n\t}\n\n\tvar matchSeverity bool\n\tif len(mute.SeveritiesJson) > 0 {\n\t\tfor _, s := range mute.SeveritiesJson {\n\t\t\tif event.Severity == s || s == 0 {\n\t\t\t\tmatchSeverity = true\n\t\t\t\tbreak\n\t\t\t}\n\t\t}\n\t} else {\n\t\tmatchSeverity = true\n\t}\n\n\tif !matchSeverity {\n\t\treturn false, errors.New(\"event severity not match mute severity\")\n\t}\n\n\tif len(mute.ITags) == 0 {\n\t\treturn true, nil\n\t}\n\tif !common.MatchTags(event.TagsMap, mute.ITags) {\n\t\treturn false, errors.New(\"event tags not match mute tags\")\n\t}\n\treturn true, nil\n}\n"
},
{
"path": "alert/naming/hashring.go",
"content": "package naming\n\nimport (\n\t\"errors\"\n\t\"sync\"\n\n\t\"github.com/toolkits/pkg/consistent\"\n\t\"github.com/toolkits/pkg/logger\"\n)\n\nconst NodeReplicas = 500\n\ntype DatasourceHashRingType struct {\n\tsync.RWMutex\n\tRings map[string]*consistent.Consistent\n}\n\n// for alert_rule sharding\nvar HostDatasource int64 = 99999999\nvar DatasourceHashRing = DatasourceHashRingType{Rings: make(map[string]*consistent.Consistent)}\n\nfunc NewConsistentHashRing(replicas int32, nodes []string) *consistent.Consistent {\n\tret := consistent.New()\n\tret.NumberOfReplicas = int(replicas)\n\tfor i := 0; i < len(nodes); i++ {\n\t\tret.Add(nodes[i])\n\t}\n\treturn ret\n}\n\nfunc RebuildConsistentHashRing(datasourceId string, nodes []string) {\n\tr := consistent.New()\n\tr.NumberOfReplicas = NodeReplicas\n\tfor i := 0; i < len(nodes); i++ {\n\t\tr.Add(nodes[i])\n\t}\n\n\tDatasourceHashRing.Set(datasourceId, r)\n\tlogger.Infof(\"hash ring %s rebuild %+v\", datasourceId, r.Members())\n}\n\nfunc (chr *DatasourceHashRingType) GetNode(datasourceId string, pk string) (string, error) {\n\tchr.Lock()\n\tdefer chr.Unlock()\n\t_, exists := chr.Rings[datasourceId]\n\tif !exists {\n\t\tchr.Rings[datasourceId] = NewConsistentHashRing(int32(NodeReplicas), []string{})\n\t}\n\n\treturn chr.Rings[datasourceId].Get(pk)\n}\n\nfunc (chr *DatasourceHashRingType) IsHit(datasourceId string, pk string, currentNode string) bool {\n\tnode, err := chr.GetNode(datasourceId, pk)\n\tif err != nil {\n\t\tif !errors.Is(err, consistent.ErrEmptyCircle) {\n\t\t\tlogger.Errorf(\"rule id:%s is not work, datasource id:%s failed to get node from hashring:%v\", pk, datasourceId, err)\n\t\t}\n\t\treturn false\n\t}\n\treturn node == currentNode\n}\n\nfunc (chr *DatasourceHashRingType) Set(datasourceId string, r *consistent.Consistent) {\n\tchr.Lock()\n\tdefer chr.Unlock()\n\tchr.Rings[datasourceId] = r\n}\n\nfunc (chr *DatasourceHashRingType) Del(datasourceId string) {\n\tchr.Lock()\n\tdefer chr.Unlock()\n\tdelete(chr.Rings, datasourceId)\n}\n\nfunc (chr *DatasourceHashRingType) Clear(engineName string) {\n\tchr.Lock()\n\tdefer chr.Unlock()\n\tfor id := range chr.Rings {\n\t\tif id == engineName {\n\t\t\tcontinue\n\t\t}\n\t\tdelete(chr.Rings, id)\n\t}\n}\n"
},
{
"path": "alert/naming/heartbeat.go",
"content": "package naming\n\nimport (\n\t\"fmt\"\n\t\"sort\"\n\t\"strings\"\n\t\"time\"\n\n\t\"github.com/ccfos/nightingale/v6/alert/aconf\"\n\t\"github.com/ccfos/nightingale/v6/alert/astats\"\n\t\"github.com/ccfos/nightingale/v6/models\"\n\t\"github.com/ccfos/nightingale/v6/pkg/ctx\"\n\t\"github.com/ccfos/nightingale/v6/pkg/poster\"\n\n\t\"github.com/toolkits/pkg/logger\"\n)\n\ntype Naming struct {\n\tctx *ctx.Context\n\theartbeatConfig aconf.HeartbeatConfig\n\tastats *astats.Stats\n}\n\nfunc NewNaming(ctx *ctx.Context, heartbeat aconf.HeartbeatConfig, alertStats *astats.Stats) *Naming {\n\tnaming := &Naming{\n\t\tctx: ctx,\n\t\theartbeatConfig: heartbeat,\n\t\tastats: alertStats,\n\t}\n\tnaming.Heartbeats()\n\treturn naming\n}\n\n// local servers\nvar localss map[int64]string\nvar localHostServers map[string]string\n\nfunc (n *Naming) Heartbeats() error {\n\tlocalss = make(map[int64]string)\n\tlocalHostServers = make(map[string]string)\n\tif err := n.heartbeat(); err != nil {\n\t\tfmt.Println(\"failed to heartbeat:\", err)\n\t\treturn err\n\t}\n\n\tgo n.loopHeartbeat()\n\tgo n.loopDeleteInactiveInstances()\n\treturn nil\n}\n\nfunc (n *Naming) loopDeleteInactiveInstances() {\n\tif !n.ctx.IsCenter {\n\t\treturn\n\t}\n\n\tinterval := time.Duration(10) * time.Minute\n\tfor {\n\t\ttime.Sleep(interval)\n\t\tn.DeleteInactiveInstances()\n\t}\n}\n\nfunc (n *Naming) DeleteInactiveInstances() {\n\terr := models.DB(n.ctx).Where(\"clock < ?\", time.Now().Unix()-600).Delete(new(models.AlertingEngines)).Error\n\tif err != nil {\n\t\tlogger.Errorf(\"delete inactive instances err:%v\", err)\n\t}\n}\n\nfunc (n *Naming) loopHeartbeat() {\n\tinterval := time.Duration(n.heartbeatConfig.Interval) * time.Millisecond\n\tfor {\n\t\ttime.Sleep(interval)\n\t\tif err := n.heartbeat(); err != nil {\n\t\t\tlogger.Warning(err)\n\t\t}\n\t}\n}\n\nfunc (n *Naming) heartbeat() error {\n\tvar datasourceIds []int64\n\tvar err error\n\n\t// 在页面上维护实例和集群的对应关系\n\tdatasourceIds, err = models.GetDatasourceIdsByEngineName(n.ctx, n.heartbeatConfig.EngineName)\n\tif err != nil {\n\t\treturn err\n\t}\n\n\tif len(datasourceIds) == 0 {\n\t\terr := models.AlertingEngineHeartbeatWithCluster(n.ctx, n.heartbeatConfig.Endpoint, n.heartbeatConfig.EngineName, 0)\n\t\tif err != nil {\n\t\t\tlogger.Warningf(\"heartbeat with cluster %s err:%v\", \"\", err)\n\t\t\tn.astats.CounterHeartbeatErrorTotal.WithLabelValues().Inc()\n\t\t}\n\t} else {\n\t\tfor i := 0; i < len(datasourceIds); i++ {\n\t\t\terr := models.AlertingEngineHeartbeatWithCluster(n.ctx, n.heartbeatConfig.Endpoint, n.heartbeatConfig.EngineName, datasourceIds[i])\n\t\t\tif err != nil {\n\t\t\t\tlogger.Warningf(\"heartbeat with cluster %d err:%v\", datasourceIds[i], err)\n\t\t\t\tn.astats.CounterHeartbeatErrorTotal.WithLabelValues().Inc()\n\t\t\t}\n\t\t}\n\t}\n\n\tif len(datasourceIds) == 0 {\n\t\tDatasourceHashRing.Clear(n.heartbeatConfig.EngineName)\n\t\tfor dsId := range localss {\n\t\t\tdelete(localss, dsId)\n\t\t}\n\t}\n\n\tnewDatasource := make(map[int64]struct{})\n\tfor i := 0; i < len(datasourceIds); i++ {\n\t\tnewDatasource[datasourceIds[i]] = struct{}{}\n\t\tservers, err := n.ActiveServers(datasourceIds[i])\n\t\tif err != nil {\n\t\t\tlogger.Warningf(\"heartbeat %d get active server err:%v\", datasourceIds[i], err)\n\t\t\tn.astats.CounterHeartbeatErrorTotal.WithLabelValues().Inc()\n\t\t\tcontinue\n\t\t}\n\n\t\tsort.Strings(servers)\n\t\tnewss := strings.Join(servers, \" \")\n\n\t\toldss, exists := localss[datasourceIds[i]]\n\t\tif exists && oldss == newss {\n\t\t\tcontinue\n\t\t}\n\n\t\tRebuildConsistentHashRing(fmt.Sprintf(\"%d\", datasourceIds[i]), servers)\n\t\tlocalss[datasourceIds[i]] = newss\n\t}\n\n\tfor dsId := range localss {\n\t\tif _, exists := newDatasource[dsId]; !exists {\n\t\t\tdelete(localss, dsId)\n\t\t\tDatasourceHashRing.Del(fmt.Sprintf(\"%d\", dsId))\n\t\t}\n\t}\n\n\t// host 告警使用的是 hash ring\n\terr = models.AlertingEngineHeartbeatWithCluster(n.ctx, n.heartbeatConfig.Endpoint, n.heartbeatConfig.EngineName, HostDatasource)\n\tif err != nil {\n\t\tlogger.Warningf(\"heartbeat with cluster %s err:%v\", \"\", err)\n\t\tn.astats.CounterHeartbeatErrorTotal.WithLabelValues().Inc()\n\t}\n\n\tservers, err := n.ActiveServersByEngineName()\n\tif err != nil {\n\t\tlogger.Warningf(\"heartbeat %d get active server err:%v\", HostDatasource, err)\n\t\tn.astats.CounterHeartbeatErrorTotal.WithLabelValues().Inc()\n\t\treturn nil\n\t}\n\n\tsort.Strings(servers)\n\tnewss := strings.Join(servers, \" \")\n\n\toldss, exists := localHostServers[n.heartbeatConfig.EngineName]\n\tif exists && oldss == newss {\n\t\treturn nil\n\t}\n\n\tRebuildConsistentHashRing(n.heartbeatConfig.EngineName, servers)\n\tlocalHostServers[n.heartbeatConfig.EngineName] = newss\n\n\treturn nil\n}\n\nfunc (n *Naming) ActiveServers(datasourceId int64) ([]string, error) {\n\tif datasourceId == -1 {\n\t\treturn nil, fmt.Errorf(\"cluster is empty\")\n\t}\n\n\tif !n.ctx.IsCenter {\n\t\tlst, err := poster.GetByUrls[[]string](n.ctx, \"/v1/n9e/servers-active?dsid=\"+fmt.Sprintf(\"%d\", datasourceId))\n\t\treturn lst, err\n\t}\n\n\t// 30秒内有心跳,就认为是活的\n\treturn models.AlertingEngineGetsInstances(n.ctx, \"datasource_id = ? and clock > ?\", datasourceId, time.Now().Unix()-30)\n}\n\nfunc (n *Naming) ActiveServersByEngineName() ([]string, error) {\n\tif !n.ctx.IsCenter {\n\t\tlst, err := poster.GetByUrls[[]string](n.ctx, \"/v1/n9e/servers-active?engine_name=\"+n.heartbeatConfig.EngineName)\n\t\treturn lst, err\n\t}\n\n\t// 30秒内有心跳,就认为是活的\n\treturn models.AlertingEngineGetsInstances(n.ctx, \"engine_cluster = ? and clock > ?\", n.heartbeatConfig.EngineName, time.Now().Unix()-30)\n}\n"
},
{
"path": "alert/naming/leader.go",
"content": "package naming\n\nimport (\n\t\"sort\"\n\n\t\"github.com/toolkits/pkg/logger\"\n)\n\nfunc (n *Naming) IamLeader() bool {\n\tif !n.ctx.IsCenter {\n\t\treturn false\n\t}\n\n\tservers, err := n.ActiveServersByEngineName()\n\tif err != nil {\n\t\tlogger.Errorf(\"failed to get active servers: %v\", err)\n\t\treturn false\n\t}\n\n\tif len(servers) == 0 {\n\t\tlogger.Errorf(\"active servers empty\")\n\t\treturn false\n\t}\n\n\tsort.Strings(servers)\n\n\treturn n.heartbeatConfig.Endpoint == servers[0]\n}\n"
},
{
"path": "alert/pipeline/engine/engine.go",
"content": "package engine\n\nimport (\n\t\"fmt\"\n\t\"time\"\n\n\t\"github.com/ccfos/nightingale/v6/models\"\n\t\"github.com/ccfos/nightingale/v6/pkg/ctx\"\n\t\"github.com/google/uuid\"\n\t\"github.com/toolkits/pkg/logger\"\n)\n\ntype WorkflowEngine struct {\n\tctx *ctx.Context\n}\n\nfunc NewWorkflowEngine(c *ctx.Context) *WorkflowEngine {\n\treturn &WorkflowEngine{ctx: c}\n}\n\nfunc (e *WorkflowEngine) Execute(pipeline *models.EventPipeline, event *models.AlertCurEvent, triggerCtx *models.WorkflowTriggerContext) (*models.AlertCurEvent, *models.WorkflowResult, error) {\n\tstartTime := time.Now()\n\n\twfCtx := e.initWorkflowContext(pipeline, event, triggerCtx)\n\n\tnodes := pipeline.GetWorkflowNodes()\n\tconnections := pipeline.GetWorkflowConnections()\n\n\tif len(nodes) == 0 {\n\t\treturn event, &models.WorkflowResult{\n\t\t\tEvent: event,\n\t\t\tStatus: models.ExecutionStatusSuccess,\n\t\t\tMessage: \"no nodes to execute\",\n\t\t}, nil\n\t}\n\n\tnodeMap := make(map[string]*models.WorkflowNode)\n\tfor i := range nodes {\n\t\tif nodes[i].RetryInterval == 0 {\n\t\t\tnodes[i].RetryInterval = 1\n\t\t}\n\n\t\tif nodes[i].MaxRetries == 0 {\n\t\t\tnodes[i].MaxRetries = 1\n\t\t}\n\n\t\tnodeMap[nodes[i].ID] = &nodes[i]\n\t}\n\n\tresult := e.executeDAG(nodeMap, connections, wfCtx)\n\tresult.Event = wfCtx.Event\n\n\tduration := time.Since(startTime).Milliseconds()\n\n\tif triggerCtx != nil && triggerCtx.Mode != \"\" {\n\t\te.saveExecutionRecord(pipeline, wfCtx, result, triggerCtx, startTime.Unix(), duration)\n\t}\n\n\treturn wfCtx.Event, result, nil\n}\n\nfunc (e *WorkflowEngine) initWorkflowContext(pipeline *models.EventPipeline, event *models.AlertCurEvent, triggerCtx *models.WorkflowTriggerContext) *models.WorkflowContext {\n\t// 合并输入参数\n\tinputs := pipeline.GetInputsMap()\n\tif triggerCtx != nil && triggerCtx.InputsOverrides != nil {\n\t\tfor k, v := range triggerCtx.InputsOverrides {\n\t\t\tinputs[k] = v\n\t\t}\n\t}\n\n\tmetadata := map[string]string{\n\t\t\"start_time\": fmt.Sprintf(\"%d\", time.Now().Unix()),\n\t\t\"pipeline_id\": fmt.Sprintf(\"%d\", pipeline.ID),\n\t}\n\n\t// 是否启用流式输出\n\tstream := false\n\tif triggerCtx != nil {\n\t\tmetadata[\"request_id\"] = triggerCtx.RequestID\n\t\tmetadata[\"trigger_mode\"] = triggerCtx.Mode\n\t\tmetadata[\"trigger_by\"] = triggerCtx.TriggerBy\n\t\tstream = triggerCtx.Stream\n\t}\n\n\treturn &models.WorkflowContext{\n\t\tEvent: event,\n\t\tInputs: inputs,\n\t\tVars: make(map[string]interface{}), // 初始化空的 Vars,供节点间传递数据\n\t\tMetadata: metadata,\n\t\tStream: stream,\n\t}\n}\n\n// executeDAG 使用 Kahn 算法执行 DAG\nfunc (e *WorkflowEngine) executeDAG(nodeMap map[string]*models.WorkflowNode, connections models.Connections, wfCtx *models.WorkflowContext) *models.WorkflowResult {\n\tresult := &models.WorkflowResult{\n\t\tStatus: models.ExecutionStatusSuccess,\n\t\tNodeResults: make([]*models.NodeExecutionResult, 0),\n\t\tStream: wfCtx.Stream, // 从上下文继承流式输出设置\n\t}\n\n\t// 计算每个节点的入度\n\tinDegree := make(map[string]int)\n\tfor nodeID := range nodeMap {\n\t\tinDegree[nodeID] = 0\n\t}\n\n\t// 遍历连接,计算入度\n\tfor _, nodeConns := range connections {\n\t\tfor _, targets := range nodeConns.Main {\n\t\t\tfor _, target := range targets {\n\t\t\t\tinDegree[target.Node]++\n\t\t\t}\n\t\t}\n\t}\n\n\t// 找到所有入度为 0 的节点(起始节点)\n\tqueue := make([]string, 0)\n\tfor nodeID, degree := range inDegree {\n\t\tif degree == 0 {\n\t\t\tqueue = append(queue, nodeID)\n\t\t}\n\t}\n\n\t// 如果没有起始节点,说明存在循环依赖\n\tif len(queue) == 0 && len(nodeMap) > 0 {\n\t\tresult.Status = models.ExecutionStatusFailed\n\t\tresult.Message = \"workflow has circular dependency\"\n\t\treturn result\n\t}\n\n\t// 记录已执行的节点\n\texecuted := make(map[string]bool)\n\t// 记录节点的分支选择结果\n\tbranchResults := make(map[string]*int)\n\n\tfor len(queue) > 0 {\n\t\t// 取出队首节点\n\t\tnodeID := queue[0]\n\t\tqueue = queue[1:]\n\n\t\t// 检查是否已执行\n\t\tif executed[nodeID] {\n\t\t\tcontinue\n\t\t}\n\n\t\tnode, exists := nodeMap[nodeID]\n\t\tif !exists {\n\t\t\tcontinue\n\t\t}\n\n\t\t// 执行节点\n\t\tnodeResult, nodeOutput := e.executeNode(node, wfCtx)\n\t\tresult.NodeResults = append(result.NodeResults, nodeResult)\n\n\t\tif nodeOutput != nil && nodeOutput.Stream && nodeOutput.StreamChan != nil {\n\t\t\t// 流式输出节点通常是最后一个节点\n\t\t\t// 直接传递 StreamChan 给 WorkflowResult,不阻塞等待\n\t\t\tresult.Stream = true\n\t\t\tresult.StreamChan = nodeOutput.StreamChan\n\t\t\tresult.Event = wfCtx.Event\n\t\t\tresult.Status = \"streaming\"\n\t\t\tresult.Message = fmt.Sprintf(\"streaming output from node: %s\", node.Name)\n\n\t\t\t// 更新节点状态为 streaming\n\t\t\tnodeResult.Status = \"streaming\"\n\t\t\tnodeResult.Message = \"streaming in progress\"\n\n\t\t\t// 立即返回,让 API 层处理流式响应\n\t\t\treturn result\n\t\t}\n\t\texecuted[nodeID] = true\n\n\t\t// 保存分支结果\n\t\tif nodeResult.BranchIndex != nil {\n\t\t\tbranchResults[nodeID] = nodeResult.BranchIndex\n\t\t}\n\n\t\t// 检查执行状态\n\t\tif nodeResult.Status == \"failed\" {\n\t\t\tif !node.ContinueOnFail {\n\t\t\t\tresult.Status = models.ExecutionStatusFailed\n\t\t\t\tresult.ErrorNode = nodeID\n\t\t\t\tresult.Message = fmt.Sprintf(\"node %s failed: %s\", node.Name, nodeResult.Error)\n\t\t\t}\n\t\t}\n\n\t\t// 检查是否终止\n\t\tif nodeResult.Status == \"terminated\" {\n\t\t\tresult.Message = fmt.Sprintf(\"workflow terminated at node %s\", node.Name)\n\t\t\treturn result\n\t\t}\n\n\t\t// 更新后继节点的入度\n\t\tif nodeConns, ok := connections[nodeID]; ok {\n\t\t\tfor outputIndex, targets := range nodeConns.Main {\n\t\t\t\t// 检查是否应该走这个分支\n\t\t\t\tif !e.shouldFollowBranch(nodeID, outputIndex, branchResults) {\n\t\t\t\t\tcontinue\n\t\t\t\t}\n\n\t\t\t\tfor _, target := range targets {\n\t\t\t\t\tinDegree[target.Node]--\n\t\t\t\t\tif inDegree[target.Node] == 0 {\n\t\t\t\t\t\tqueue = append(queue, target.Node)\n\t\t\t\t\t}\n\t\t\t\t}\n\t\t\t}\n\t\t}\n\t}\n\n\treturn result\n}\n\n// executeNode 执行单个节点\n// 返回:节点执行结果、节点输出(用于流式输出检测)\nfunc (e *WorkflowEngine) executeNode(node *models.WorkflowNode, wfCtx *models.WorkflowContext) (*models.NodeExecutionResult, *models.NodeOutput) {\n\tstartTime := time.Now()\n\tnodeResult := &models.NodeExecutionResult{\n\t\tNodeID: node.ID,\n\t\tNodeName: node.Name,\n\t\tNodeType: node.Type,\n\t\tStartedAt: startTime.Unix(),\n\t}\n\n\tvar nodeOutput *models.NodeOutput\n\n\t// 跳过禁用的节点\n\tif node.Disabled {\n\t\tnodeResult.Status = \"skipped\"\n\t\tnodeResult.Message = \"node is disabled\"\n\t\tnodeResult.FinishedAt = time.Now().Unix()\n\t\tnodeResult.DurationMs = time.Since(startTime).Milliseconds()\n\t\treturn nodeResult, nil\n\t}\n\n\t// 获取处理器\n\tprocessor, err := models.GetProcessorByType(node.Type, node.Config)\n\tif err != nil {\n\t\tnodeResult.Status = \"failed\"\n\t\tnodeResult.Error = fmt.Sprintf(\"failed to get processor: %v\", err)\n\t\tnodeResult.FinishedAt = time.Now().Unix()\n\t\tnodeResult.DurationMs = time.Since(startTime).Milliseconds()\n\t\treturn nodeResult, nil\n\t}\n\n\t// 执行处理器(带重试)\n\tvar retries int\n\tmaxRetries := node.MaxRetries\n\tif !node.RetryOnFail {\n\t\tmaxRetries = 0\n\t}\n\n\tfor retries <= maxRetries {\n\t\t// 检查是否为分支处理器\n\t\tif branchProcessor, ok := processor.(models.BranchProcessor); ok {\n\t\t\toutput, err := branchProcessor.ProcessWithBranch(e.ctx, wfCtx)\n\t\t\tif err != nil {\n\t\t\t\tif retries < maxRetries {\n\t\t\t\t\tretries++\n\t\t\t\t\ttime.Sleep(time.Duration(node.RetryInterval) * time.Second)\n\t\t\t\t\tcontinue\n\t\t\t\t}\n\t\t\t\tnodeResult.Status = \"failed\"\n\t\t\t\tnodeResult.Error = err.Error()\n\t\t\t} else {\n\t\t\t\tnodeResult.Status = \"success\"\n\t\t\t\tif output != nil {\n\t\t\t\t\tnodeOutput = output\n\t\t\t\t\tif output.WfCtx != nil {\n\t\t\t\t\t\twfCtx = output.WfCtx\n\t\t\t\t\t}\n\t\t\t\t\tnodeResult.Message = output.Message\n\t\t\t\t\tnodeResult.BranchIndex = output.BranchIndex\n\t\t\t\t\tif output.Terminate {\n\t\t\t\t\t\tnodeResult.Status = \"terminated\"\n\t\t\t\t\t}\n\t\t\t\t}\n\t\t\t}\n\t\t\tbreak\n\t\t}\n\n\t\t// 普通处理器\n\t\tnewWfCtx, msg, err := processor.Process(e.ctx, wfCtx)\n\t\tif err != nil {\n\t\t\tif retries < maxRetries {\n\t\t\t\tretries++\n\t\t\t\ttime.Sleep(time.Duration(node.RetryInterval) * time.Second)\n\t\t\t\tcontinue\n\t\t\t}\n\t\t\tnodeResult.Status = \"failed\"\n\t\t\tnodeResult.Error = err.Error()\n\t\t} else {\n\t\t\tnodeResult.Status = \"success\"\n\t\t\tnodeResult.Message = msg\n\t\t\tif newWfCtx != nil {\n\t\t\t\twfCtx = newWfCtx\n\n\t\t\t\t// 检测流式输出标记\n\t\t\t\tif newWfCtx.Stream && newWfCtx.StreamChan != nil {\n\t\t\t\t\tnodeOutput = &models.NodeOutput{\n\t\t\t\t\t\tWfCtx: newWfCtx,\n\t\t\t\t\t\tMessage: msg,\n\t\t\t\t\t\tStream: true,\n\t\t\t\t\t\tStreamChan: newWfCtx.StreamChan,\n\t\t\t\t\t}\n\t\t\t\t}\n\t\t\t}\n\n\t\t\t// 如果事件被 drop(返回 nil 或 Event 为 nil),标记为终止\n\t\t\tif newWfCtx == nil || newWfCtx.Event == nil {\n\t\t\t\tnodeResult.Status = \"terminated\"\n\t\t\t\tnodeResult.Message = msg\n\t\t\t}\n\t\t}\n\t\tbreak\n\t}\n\n\tnodeResult.FinishedAt = time.Now().Unix()\n\tnodeResult.DurationMs = time.Since(startTime).Milliseconds()\n\n\tlogger.Infof(\"workflow: executed node %s (type=%s) status=%s msg=%s duration=%dms\",\n\t\tnode.Name, node.Type, nodeResult.Status, nodeResult.Message, nodeResult.DurationMs)\n\n\treturn nodeResult, nodeOutput\n}\n\n// shouldFollowBranch 判断是否应该走某个分支\nfunc (e *WorkflowEngine) shouldFollowBranch(nodeID string, outputIndex int, branchResults map[string]*int) bool {\n\tbranchIndex, hasBranch := branchResults[nodeID]\n\tif !hasBranch {\n\t\t// 没有分支结果,说明不是分支节点,只走第一个输出\n\t\treturn outputIndex == 0\n\t}\n\n\tif branchIndex == nil {\n\t\t// branchIndex 为 nil,走默认分支(通常是最后一个)\n\t\treturn true\n\t}\n\n\t// 只走选中的分支\n\treturn outputIndex == *branchIndex\n}\n\nfunc (e *WorkflowEngine) saveExecutionRecord(pipeline *models.EventPipeline, wfCtx *models.WorkflowContext, result *models.WorkflowResult, triggerCtx *models.WorkflowTriggerContext, startTime int64, duration int64) {\n\texecutionID := triggerCtx.RequestID\n\tif executionID == \"\" {\n\t\texecutionID = uuid.New().String()\n\t}\n\n\texecution := &models.EventPipelineExecution{\n\t\tID: executionID,\n\t\tPipelineID: pipeline.ID,\n\t\tPipelineName: pipeline.Name,\n\t\tMode: triggerCtx.Mode,\n\t\tStatus: result.Status,\n\t\tErrorMessage: result.Message,\n\t\tErrorNode: result.ErrorNode,\n\t\tCreatedAt: startTime,\n\t\tFinishedAt: time.Now().Unix(),\n\t\tDurationMs: duration,\n\t\tTriggerBy: triggerCtx.TriggerBy,\n\t}\n\n\tif wfCtx.Event != nil {\n\t\texecution.EventID = wfCtx.Event.Id\n\t}\n\n\tif err := execution.SetNodeResults(result.NodeResults); err != nil {\n\t\tlogger.Errorf(\"workflow: failed to set node results: pipeline_id=%d, error=%v\", pipeline.ID, err)\n\t}\n\n\tif err := execution.SetInputsSnapshot(wfCtx.Inputs); err != nil {\n\t\tlogger.Errorf(\"workflow: failed to set inputs snapshot: pipeline_id=%d, error=%v\", pipeline.ID, err)\n\t}\n\n\tif err := models.CreateEventPipelineExecution(e.ctx, execution); err != nil {\n\t\tlogger.Errorf(\"workflow: failed to save execution record: pipeline_id=%d, error=%v\", pipeline.ID, err)\n\t}\n}\n"
},
{
"path": "alert/pipeline/pipeline.go",
"content": "package pipeline\n\nimport (\n\t_ \"github.com/ccfos/nightingale/v6/alert/pipeline/processor/aisummary\"\n\t_ \"github.com/ccfos/nightingale/v6/alert/pipeline/processor/callback\"\n\t_ \"github.com/ccfos/nightingale/v6/alert/pipeline/processor/eventdrop\"\n\t_ \"github.com/ccfos/nightingale/v6/alert/pipeline/processor/eventupdate\"\n\t_ \"github.com/ccfos/nightingale/v6/alert/pipeline/processor/logic\"\n\t_ \"github.com/ccfos/nightingale/v6/alert/pipeline/processor/relabel\"\n)\n\nfunc Init() {\n}\n"
},
{
"path": "alert/pipeline/processor/aisummary/ai_summary.go",
"content": "package aisummary\n\nimport (\n\t\"bytes\"\n\t\"crypto/tls\"\n\t\"encoding/json\"\n\t\"fmt\"\n\t\"io\"\n\t\"net/http\"\n\t\"net/url\"\n\t\"strconv\"\n\t\"strings\"\n\t\"text/template\"\n\t\"time\"\n\n\t\"github.com/ccfos/nightingale/v6/alert/pipeline/processor/callback\"\n\t\"github.com/ccfos/nightingale/v6/alert/pipeline/processor/common\"\n\t\"github.com/ccfos/nightingale/v6/models\"\n\t\"github.com/ccfos/nightingale/v6/pkg/ctx\"\n\t\"github.com/ccfos/nightingale/v6/pkg/tplx\"\n)\n\nconst (\n\tHTTP_STATUS_SUCCESS_MAX = 299\n)\n\n// AISummaryConfig 配置结构体\ntype AISummaryConfig struct {\n\tcallback.HTTPConfig\n\tModelName string `json:\"model_name\"`\n\tAPIKey string `json:\"api_key\"`\n\tPromptTemplate string `json:\"prompt_template\"`\n\tCustomParams map[string]interface{} `json:\"custom_params\"`\n}\n\ntype Message struct {\n\tRole string `json:\"role\"`\n\tContent string `json:\"content\"`\n}\n\ntype ChatCompletionResponse struct {\n\tChoices []struct {\n\t\tMessage struct {\n\t\t\tContent string `json:\"content\"`\n\t\t} `json:\"message\"`\n\t} `json:\"choices\"`\n}\n\nfunc init() {\n\tmodels.RegisterProcessor(\"ai_summary\", &AISummaryConfig{})\n}\n\nfunc (c *AISummaryConfig) Init(settings interface{}) (models.Processor, error) {\n\tresult, err := common.InitProcessor[*AISummaryConfig](settings)\n\treturn result, err\n}\n\nfunc (c *AISummaryConfig) Process(ctx *ctx.Context, wfCtx *models.WorkflowContext) (*models.WorkflowContext, string, error) {\n\tevent := wfCtx.Event\n\tif c.Client == nil {\n\t\tif err := c.initHTTPClient(); err != nil {\n\t\t\treturn wfCtx, \"\", fmt.Errorf(\"failed to initialize HTTP client: %v processor: %v\", err, c)\n\t\t}\n\t}\n\n\t// 准备告警事件信息\n\teventInfo, err := c.prepareEventInfo(wfCtx)\n\tif err != nil {\n\t\treturn wfCtx, \"\", fmt.Errorf(\"failed to prepare event info: %v processor: %v\", err, c)\n\t}\n\n\t// 调用AI模型生成总结\n\tsummary, err := c.generateAISummary(eventInfo)\n\tif err != nil {\n\t\treturn wfCtx, \"\", fmt.Errorf(\"failed to generate AI summary: %v processor: %v\", err, c)\n\t}\n\n\t// 将总结添加到annotations字段\n\tif event.AnnotationsJSON == nil {\n\t\tevent.AnnotationsJSON = make(map[string]string)\n\t}\n\tevent.AnnotationsJSON[\"ai_summary\"] = summary\n\n\t// 更新Annotations字段\n\tb, err := json.Marshal(event.AnnotationsJSON)\n\tif err != nil {\n\t\treturn wfCtx, \"\", fmt.Errorf(\"failed to marshal annotations: %v processor: %v\", err, c)\n\t}\n\tevent.Annotations = string(b)\n\n\treturn wfCtx, \"\", nil\n}\n\nfunc (c *AISummaryConfig) initHTTPClient() error {\n\ttransport := &http.Transport{\n\t\tTLSClientConfig: &tls.Config{InsecureSkipVerify: c.SkipSSLVerify},\n\t}\n\n\tif c.Proxy != \"\" {\n\t\tproxyURL, err := url.Parse(c.Proxy)\n\t\tif err != nil {\n\t\t\treturn fmt.Errorf(\"failed to parse proxy url: %v\", err)\n\t\t}\n\t\ttransport.Proxy = http.ProxyURL(proxyURL)\n\t}\n\n\tc.Client = &http.Client{\n\t\tTimeout: time.Duration(c.Timeout) * time.Millisecond,\n\t\tTransport: transport,\n\t}\n\treturn nil\n}\n\nfunc (c *AISummaryConfig) prepareEventInfo(wfCtx *models.WorkflowContext) (string, error) {\n\tvar defs = []string{\n\t\t\"{{$event := .Event}}\",\n\t\t\"{{$inputs := .Inputs}}\",\n\t}\n\n\ttext := strings.Join(append(defs, c.PromptTemplate), \"\")\n\tt, err := template.New(\"prompt\").Funcs(template.FuncMap(tplx.TemplateFuncMap)).Parse(text)\n\tif err != nil {\n\t\treturn \"\", fmt.Errorf(\"failed to parse prompt template: %v\", err)\n\t}\n\n\tvar body bytes.Buffer\n\terr = t.Execute(&body, wfCtx)\n\tif err != nil {\n\t\treturn \"\", fmt.Errorf(\"failed to execute prompt template: %v\", err)\n\t}\n\n\treturn body.String(), nil\n}\n\nfunc (c *AISummaryConfig) generateAISummary(eventInfo string) (string, error) {\n\t// 构建基础请求参数\n\treqParams := map[string]interface{}{\n\t\t\"model\": c.ModelName,\n\t\t\"messages\": []Message{\n\t\t\t{\n\t\t\t\tRole: \"user\",\n\t\t\t\tContent: eventInfo,\n\t\t\t},\n\t\t},\n\t}\n\n\t// 合并自定义参数\n\tfor k, v := range c.CustomParams {\n\t\tconverted, err := convertCustomParam(v)\n\t\tif err != nil {\n\t\t\treturn \"\", fmt.Errorf(\"failed to convert custom param %s: %v\", k, err)\n\t\t}\n\t\treqParams[k] = converted\n\t}\n\n\t// 序列化请求体\n\tjsonData, err := json.Marshal(reqParams)\n\tif err != nil {\n\t\treturn \"\", fmt.Errorf(\"failed to marshal request body: %v\", err)\n\t}\n\n\t// 创建HTTP请求\n\treq, err := http.NewRequest(\"POST\", c.URL, bytes.NewBuffer(jsonData))\n\tif err != nil {\n\t\treturn \"\", fmt.Errorf(\"failed to create request: %v\", err)\n\t}\n\n\t// 设置请求头\n\treq.Header.Set(\"Authorization\", \"Bearer \"+c.APIKey)\n\treq.Header.Set(\"Content-Type\", \"application/json\")\n\tfor k, v := range c.Headers {\n\t\treq.Header.Set(k, v)\n\t}\n\n\t// 发送请求\n\tresp, err := c.Client.Do(req)\n\tif err != nil {\n\t\treturn \"\", fmt.Errorf(\"failed to send request: %v\", err)\n\t}\n\tdefer resp.Body.Close()\n\n\t// 检查响应状态码\n\tif resp.StatusCode > HTTP_STATUS_SUCCESS_MAX {\n\t\tbody, _ := io.ReadAll(resp.Body)\n\t\treturn \"\", fmt.Errorf(\"unexpected status code: %d, body: %s\", resp.StatusCode, string(body))\n\t}\n\n\t// 读取响应\n\tbody, err := io.ReadAll(resp.Body)\n\tif err != nil {\n\t\treturn \"\", fmt.Errorf(\"failed to read response body: %v\", err)\n\t}\n\n\t// 解析响应\n\tvar chatResp ChatCompletionResponse\n\tif err := json.Unmarshal(body, &chatResp); err != nil {\n\t\treturn \"\", fmt.Errorf(\"failed to unmarshal response: %v\", err)\n\t}\n\n\tif len(chatResp.Choices) == 0 {\n\t\treturn \"\", fmt.Errorf(\"no response from AI model\")\n\t}\n\n\treturn chatResp.Choices[0].Message.Content, nil\n}\n\n// convertCustomParam 将前端传入的参数转换为正确的类型\nfunc convertCustomParam(value interface{}) (interface{}, error) {\n\tif value == nil {\n\t\treturn nil, nil\n\t}\n\n\t// 如果是字符串,尝试转换为其他类型\n\tif str, ok := value.(string); ok {\n\t\t// 尝试转换为数字\n\t\tif f, err := strconv.ParseFloat(str, 64); err == nil {\n\t\t\t// 检查是否为整数\n\t\t\tif f == float64(int64(f)) {\n\t\t\t\treturn int64(f), nil\n\t\t\t}\n\t\t\treturn f, nil\n\t\t}\n\n\t\t// 尝试转换为布尔值\n\t\tif b, err := strconv.ParseBool(str); err == nil {\n\t\t\treturn b, nil\n\t\t}\n\n\t\t// 尝试解析为JSON数组\n\t\tif strings.HasPrefix(strings.TrimSpace(str), \"[\") {\n\t\t\tvar arr []interface{}\n\t\t\tif err := json.Unmarshal([]byte(str), &arr); err == nil {\n\t\t\t\treturn arr, nil\n\t\t\t}\n\t\t}\n\n\t\t// 尝试解析为JSON对象\n\t\tif strings.HasPrefix(strings.TrimSpace(str), \"{\") {\n\t\t\tvar obj map[string]interface{}\n\t\t\tif err := json.Unmarshal([]byte(str), &obj); err == nil {\n\t\t\t\treturn obj, nil\n\t\t\t}\n\t\t}\n\t}\n\treturn value, nil\n}\n"
},
{
"path": "alert/pipeline/processor/aisummary/ai_summary_test.go",
"content": "package aisummary\n\nimport (\n\t\"testing\"\n\n\t\"github.com/ccfos/nightingale/v6/alert/pipeline/processor/callback\"\n\t\"github.com/ccfos/nightingale/v6/models\"\n\t\"github.com/ccfos/nightingale/v6/pkg/ctx\"\n\t\"github.com/stretchr/testify/assert\"\n)\n\nfunc TestAISummaryConfig_Process(t *testing.T) {\n\t// 创建测试配置\n\tconfig := &AISummaryConfig{\n\t\tHTTPConfig: callback.HTTPConfig{\n\t\t\tURL: \"https://generativelanguage.googleapis.com/v1beta/openai/chat/completions\",\n\t\t\tTimeout: 30000,\n\t\t\tSkipSSLVerify: true,\n\t\t\tHeaders: map[string]string{\n\t\t\t\t\"Content-Type\": \"application/json\",\n\t\t\t},\n\t\t},\n\t\tModelName: \"gemini-2.0-flash\",\n\t\tAPIKey: \"*\",\n\t\tPromptTemplate: \"告警规则:{{$event.RuleName}}\\n严重程度:{{$event.Severity}}\",\n\t\tCustomParams: map[string]interface{}{\n\t\t\t\"temperature\": 0.7,\n\t\t\t\"max_tokens\": 2000,\n\t\t\t\"top_p\": 0.9,\n\t\t},\n\t}\n\n\t// 创建测试事件\n\tevent := &models.AlertCurEvent{\n\t\tRuleName: \"Test Rule\",\n\t\tSeverity: 1,\n\t\tTagsMap: map[string]string{\n\t\t\t\"host\": \"test-host\",\n\t\t},\n\t\tAnnotationsJSON: map[string]string{\n\t\t\t\"description\": \"Test alert\",\n\t\t},\n\t}\n\n\t// 创建 WorkflowContext\n\twfCtx := &models.WorkflowContext{\n\t\tEvent: event,\n\t\tInputs: map[string]string{},\n\t}\n\n\t// 测试模板处理\n\teventInfo, err := config.prepareEventInfo(wfCtx)\n\tassert.NoError(t, err)\n\tassert.Contains(t, eventInfo, \"Test Rule\")\n\tassert.Contains(t, eventInfo, \"1\")\n\n\t// 测试配置初始化\n\tprocessor, err := config.Init(config)\n\tassert.NoError(t, err)\n\tassert.NotNil(t, processor)\n\n\t// 测试处理函数\n\tresult, _, err := processor.Process(&ctx.Context{}, wfCtx)\n\tassert.NoError(t, err)\n\tassert.NotNil(t, result)\n\tassert.NotEmpty(t, result.Event.AnnotationsJSON[\"ai_summary\"])\n\n\t// 展示处理结果\n\tt.Log(\"\\n=== 处理结果 ===\")\n\tt.Logf(\"告警规则: %s\", result.Event.RuleName)\n\tt.Logf(\"严重程度: %d\", result.Event.Severity)\n\tt.Logf(\"标签: %v\", result.Event.TagsMap)\n\tt.Logf(\"原始注释: %v\", result.Event.AnnotationsJSON[\"description\"])\n\tt.Logf(\"AI总结: %s\", result.Event.AnnotationsJSON[\"ai_summary\"])\n}\n\nfunc TestConvertCustomParam(t *testing.T) {\n\ttests := []struct {\n\t\tname string\n\t\tinput interface{}\n\t\texpected interface{}\n\t\thasError bool\n\t}{\n\t\t{\n\t\t\tname: \"nil value\",\n\t\t\tinput: nil,\n\t\t\texpected: nil,\n\t\t\thasError: false,\n\t\t},\n\t\t{\n\t\t\tname: \"string number to int64\",\n\t\t\tinput: \"123\",\n\t\t\texpected: int64(123),\n\t\t\thasError: false,\n\t\t},\n\t\t{\n\t\t\tname: \"string float to float64\",\n\t\t\tinput: \"123.45\",\n\t\t\texpected: 123.45,\n\t\t\thasError: false,\n\t\t},\n\t\t{\n\t\t\tname: \"string boolean to bool\",\n\t\t\tinput: \"true\",\n\t\t\texpected: true,\n\t\t\thasError: false,\n\t\t},\n\t\t{\n\t\t\tname: \"string false to bool\",\n\t\t\tinput: \"false\",\n\t\t\texpected: false,\n\t\t\thasError: false,\n\t\t},\n\t\t{\n\t\t\tname: \"JSON array string to slice\",\n\t\t\tinput: `[\"a\", \"b\", \"c\"]`,\n\t\t\texpected: []interface{}{\"a\", \"b\", \"c\"},\n\t\t\thasError: false,\n\t\t},\n\t\t{\n\t\t\tname: \"JSON object string to map\",\n\t\t\tinput: `{\"key\": \"value\", \"num\": 123}`,\n\t\t\texpected: map[string]interface{}{\"key\": \"value\", \"num\": float64(123)},\n\t\t\thasError: false,\n\t\t},\n\t\t{\n\t\t\tname: \"plain string remains string\",\n\t\t\tinput: \"hello world\",\n\t\t\texpected: \"hello world\",\n\t\t\thasError: false,\n\t\t},\n\t}\n\n\tfor _, test := range tests {\n\t\tt.Run(test.name, func(t *testing.T) {\n\t\t\tconverted, err := convertCustomParam(test.input)\n\t\t\tif test.hasError {\n\t\t\t\tassert.Error(t, err)\n\t\t\t\treturn\n\t\t\t}\n\t\t\tassert.NoError(t, err)\n\t\t\tassert.Equal(t, test.expected, converted)\n\t\t})\n\t}\n}\n"
},
{
"path": "alert/pipeline/processor/callback/callback.go",
"content": "package callback\n\nimport (\n\t\"crypto/tls\"\n\t\"encoding/json\"\n\t\"fmt\"\n\t\"io\"\n\t\"net/http\"\n\t\"net/url\"\n\t\"strings\"\n\t\"time\"\n\n\t\"github.com/ccfos/nightingale/v6/alert/pipeline/processor/common\"\n\t\"github.com/ccfos/nightingale/v6/alert/pipeline/processor/utils\"\n\t\"github.com/ccfos/nightingale/v6/models\"\n\t\"github.com/ccfos/nightingale/v6/pkg/ctx\"\n\t\"github.com/toolkits/pkg/logger\"\n)\n\ntype HTTPConfig struct {\n\tURL string `json:\"url\"`\n\tMethod string `json:\"method,omitempty\"`\n\tBody string `json:\"body,omitempty\"`\n\tHeaders map[string]string `json:\"header\"`\n\tAuthUsername string `json:\"auth_username\"`\n\tAuthPassword string `json:\"auth_password\"`\n\tTimeout int `json:\"timeout\"` // 单位:ms\n\tSkipSSLVerify bool `json:\"skip_ssl_verify\"`\n\tProxy string `json:\"proxy\"`\n\tClient *http.Client `json:\"-\"`\n}\n\n// RelabelConfig\ntype CallbackConfig struct {\n\tHTTPConfig\n}\n\nfunc init() {\n\tmodels.RegisterProcessor(\"callback\", &CallbackConfig{})\n}\n\nfunc (c *CallbackConfig) Init(settings interface{}) (models.Processor, error) {\n\tresult, err := common.InitProcessor[*CallbackConfig](settings)\n\treturn result, err\n}\n\nfunc (c *CallbackConfig) Process(ctx *ctx.Context, wfCtx *models.WorkflowContext) (*models.WorkflowContext, string, error) {\n\tevent := wfCtx.Event\n\tif c.Client == nil {\n\t\ttransport := &http.Transport{\n\t\t\tTLSClientConfig: &tls.Config{InsecureSkipVerify: c.SkipSSLVerify},\n\t\t}\n\n\t\tif c.Proxy != \"\" {\n\t\t\tproxyURL, err := url.Parse(c.Proxy)\n\t\t\tif err != nil {\n\t\t\t\treturn wfCtx, \"\", fmt.Errorf(\"failed to parse proxy url: %v processor: %v\", err, c)\n\t\t\t} else {\n\t\t\t\ttransport.Proxy = http.ProxyURL(proxyURL)\n\t\t\t}\n\t\t}\n\n\t\tc.Client = &http.Client{\n\t\t\tTimeout: time.Duration(c.Timeout) * time.Millisecond,\n\t\t\tTransport: transport,\n\t\t}\n\t}\n\n\theaders := make(map[string]string)\n\theaders[\"Content-Type\"] = \"application/json\"\n\tfor k, v := range c.Headers {\n\t\theaders[k] = v\n\t}\n\n\turl, err := utils.TplRender(wfCtx, c.URL)\n\tif err != nil {\n\t\treturn wfCtx, \"\", fmt.Errorf(\"failed to render url template: %v processor: %v\", err, c)\n\t}\n\n\tbody, err := json.Marshal(event)\n\tif err != nil {\n\t\treturn wfCtx, \"\", fmt.Errorf(\"failed to marshal event: %v processor: %v\", err, c)\n\t}\n\n\treq, err := http.NewRequest(\"POST\", url, strings.NewReader(string(body)))\n\tif err != nil {\n\t\treturn wfCtx, \"\", fmt.Errorf(\"failed to create request: %v processor: %v\", err, c)\n\t}\n\n\tfor k, v := range headers {\n\t\treq.Header.Set(k, v)\n\t}\n\n\tif c.AuthUsername != \"\" && c.AuthPassword != \"\" {\n\t\treq.SetBasicAuth(c.AuthUsername, c.AuthPassword)\n\t}\n\n\tresp, err := c.Client.Do(req)\n\tif err != nil {\n\t\treturn wfCtx, \"\", fmt.Errorf(\"failed to send request: %v processor: %v\", err, c)\n\t}\n\n\tb, err := io.ReadAll(resp.Body)\n\tif err != nil {\n\t\treturn wfCtx, \"\", fmt.Errorf(\"failed to read response body: %v processor: %v\", err, c)\n\t}\n\n\tlogger.Debugf(\"callback processor response body: %s\", string(b))\n\treturn wfCtx, \"callback success\", nil\n}\n"
},
{
"path": "alert/pipeline/processor/common/common.go",
"content": "package common\n\nimport (\n\t\"encoding/json\"\n)\n\n// InitProcessor 是一个通用的初始化处理器的方法\n// 使用泛型简化处理器初始化逻辑\n// T 必须是 models.Processor 接口的实现\nfunc InitProcessor[T any](settings interface{}) (T, error) {\n\tvar zero T\n\tb, err := json.Marshal(settings)\n\tif err != nil {\n\t\treturn zero, err\n\t}\n\n\tvar result T\n\terr = json.Unmarshal(b, &result)\n\tif err != nil {\n\t\treturn zero, err\n\t}\n\n\treturn result, nil\n}\n"
},
{
"path": "alert/pipeline/processor/eventdrop/event_drop.go",
"content": "package eventdrop\n\nimport (\n\t\"bytes\"\n\t\"fmt\"\n\t\"strings\"\n\ttexttemplate \"text/template\"\n\n\t\"github.com/ccfos/nightingale/v6/alert/pipeline/processor/common\"\n\t\"github.com/ccfos/nightingale/v6/models\"\n\t\"github.com/ccfos/nightingale/v6/pkg/ctx\"\n\t\"github.com/ccfos/nightingale/v6/pkg/tplx\"\n\t\"github.com/toolkits/pkg/logger\"\n)\n\ntype EventDropConfig struct {\n\tContent string `json:\"content\"`\n}\n\nfunc init() {\n\tmodels.RegisterProcessor(\"event_drop\", &EventDropConfig{})\n}\n\nfunc (c *EventDropConfig) Init(settings interface{}) (models.Processor, error) {\n\tresult, err := common.InitProcessor[*EventDropConfig](settings)\n\treturn result, err\n}\n\nfunc (c *EventDropConfig) Process(ctx *ctx.Context, wfCtx *models.WorkflowContext) (*models.WorkflowContext, string, error) {\n\t// 使用背景是可以根据此处理器,实现对事件进行更加灵活的过滤的逻辑\n\t// 在标签过滤和属性过滤都不满足需求时可以使用\n\t// 如果模板执行结果为 true,则删除该事件\n\tevent := wfCtx.Event\n\n\tvar defs = []string{\n\t\t\"{{ $event := .Event }}\",\n\t\t\"{{ $labels := .Event.TagsMap }}\",\n\t\t\"{{ $value := .Event.TriggerValue }}\",\n\t\t\"{{ $inputs := .Inputs }}\",\n\t}\n\n\ttext := strings.Join(append(defs, c.Content), \"\")\n\n\ttpl, err := texttemplate.New(\"eventdrop\").Funcs(tplx.TemplateFuncMap).Parse(text)\n\tif err != nil {\n\t\treturn wfCtx, \"\", fmt.Errorf(\"processor failed to parse template: %v processor: %v\", err, c)\n\t}\n\n\tvar body bytes.Buffer\n\tif err = tpl.Execute(&body, wfCtx); err != nil {\n\t\treturn wfCtx, \"\", fmt.Errorf(\"processor failed to execute template: %v processor: %v\", err, c)\n\t}\n\n\tresult := strings.TrimSpace(body.String())\n\tlogger.Infof(\"processor eventdrop result: %v\", result)\n\tif result == \"true\" {\n\t\twfCtx.Event = nil\n\t\tlogger.Infof(\"processor eventdrop drop event: %s\", event.Hash)\n\t\treturn wfCtx, \"drop event success\", nil\n\t}\n\n\treturn wfCtx, \"drop event failed\", nil\n}\n"
},
{
"path": "alert/pipeline/processor/eventupdate/event_update.go",
"content": "package eventupdate\n\nimport (\n\t\"crypto/tls\"\n\t\"encoding/json\"\n\t\"fmt\"\n\t\"io\"\n\t\"net/http\"\n\t\"net/url\"\n\t\"strings\"\n\t\"time\"\n\n\t\"github.com/ccfos/nightingale/v6/alert/pipeline/processor/callback\"\n\t\"github.com/ccfos/nightingale/v6/alert/pipeline/processor/common\"\n\t\"github.com/ccfos/nightingale/v6/models\"\n\t\"github.com/ccfos/nightingale/v6/pkg/ctx\"\n\t\"github.com/toolkits/pkg/logger\"\n)\n\n// RelabelConfig\ntype EventUpdateConfig struct {\n\tcallback.HTTPConfig\n}\n\nfunc init() {\n\tmodels.RegisterProcessor(\"event_update\", &EventUpdateConfig{})\n}\n\nfunc (c *EventUpdateConfig) Init(settings interface{}) (models.Processor, error) {\n\tresult, err := common.InitProcessor[*EventUpdateConfig](settings)\n\treturn result, err\n}\n\nfunc (c *EventUpdateConfig) Process(ctx *ctx.Context, wfCtx *models.WorkflowContext) (*models.WorkflowContext, string, error) {\n\tevent := wfCtx.Event\n\tif c.Client == nil {\n\t\ttransport := &http.Transport{\n\t\t\tTLSClientConfig: &tls.Config{InsecureSkipVerify: c.SkipSSLVerify},\n\t\t}\n\n\t\tif c.Proxy != \"\" {\n\t\t\tproxyURL, err := url.Parse(c.Proxy)\n\t\t\tif err != nil {\n\t\t\t\treturn wfCtx, \"\", fmt.Errorf(\"failed to parse proxy url: %v processor: %v\", err, c)\n\t\t\t} else {\n\t\t\t\ttransport.Proxy = http.ProxyURL(proxyURL)\n\t\t\t}\n\t\t}\n\n\t\tc.Client = &http.Client{\n\t\t\tTimeout: time.Duration(c.Timeout) * time.Millisecond,\n\t\t\tTransport: transport,\n\t\t}\n\t}\n\n\theaders := make(map[string]string)\n\theaders[\"Content-Type\"] = \"application/json\"\n\tfor k, v := range c.Headers {\n\t\theaders[k] = v\n\t}\n\n\tbody, err := json.Marshal(event)\n\tif err != nil {\n\t\treturn wfCtx, \"\", fmt.Errorf(\"failed to marshal event: %v processor: %v\", err, c)\n\t}\n\n\treq, err := http.NewRequest(\"POST\", c.URL, strings.NewReader(string(body)))\n\tif err != nil {\n\t\treturn wfCtx, \"\", fmt.Errorf(\"failed to create request: %v processor: %v\", err, c)\n\t}\n\n\tfor k, v := range headers {\n\t\treq.Header.Set(k, v)\n\t}\n\n\tif c.AuthUsername != \"\" && c.AuthPassword != \"\" {\n\t\treq.SetBasicAuth(c.AuthUsername, c.AuthPassword)\n\t}\n\n\tresp, err := c.Client.Do(req)\n\tif err != nil {\n\t\treturn wfCtx, \"\", fmt.Errorf(\"failed to send request: %v processor: %v\", err, c)\n\t}\n\n\tb, err := io.ReadAll(resp.Body)\n\tif err != nil {\n\t\treturn nil, \"\", fmt.Errorf(\"failed to read response body: %v processor: %v\", err, c)\n\t}\n\tlogger.Debugf(\"event update processor response body: %s\", string(b))\n\n\terr = json.Unmarshal(b, &event)\n\tif err != nil {\n\t\treturn wfCtx, \"\", fmt.Errorf(\"failed to unmarshal response body: %v processor: %v\", err, c)\n\t}\n\n\treturn wfCtx, \"\", nil\n}\n"
},
{
"path": "alert/pipeline/processor/logic/if.go",
"content": "package logic\n\nimport (\n\t\"bytes\"\n\t\"fmt\"\n\t\"strings\"\n\t\"text/template\"\n\n\talertCommon \"github.com/ccfos/nightingale/v6/alert/common\"\n\t\"github.com/ccfos/nightingale/v6/alert/pipeline/processor/common\"\n\t\"github.com/ccfos/nightingale/v6/models\"\n\t\"github.com/ccfos/nightingale/v6/pkg/ctx\"\n\t\"github.com/ccfos/nightingale/v6/pkg/tplx\"\n)\n\n// 判断模式常量\nconst (\n\tConditionModeExpression = \"expression\" // 表达式模式(默认)\n\tConditionModeTags = \"tags\" // 标签/属性模式\n)\n\n// IfConfig If 条件处理器配置\ntype IfConfig struct {\n\t// 判断模式:expression(表达式)或 tags(标签/属性)\n\tMode string `json:\"mode,omitempty\"`\n\n\t// 表达式模式配置\n\t// 条件表达式(支持 Go 模板语法)\n\t// 例如:{{ if eq .Severity 1 }}true{{ end }}\n\tCondition string `json:\"condition,omitempty\"`\n\n\t// 标签/属性模式配置\n\tLabelKeys []models.TagFilter `json:\"label_keys,omitempty\"` // 适用标签\n\tAttributes []models.TagFilter `json:\"attributes,omitempty\"` // 适用属性\n\n\t// 内部使用,解析后的过滤器\n\tparsedLabelKeys []models.TagFilter `json:\"-\"`\n\tparsedAttributes []models.TagFilter `json:\"-\"`\n}\n\nfunc init() {\n\tmodels.RegisterProcessor(\"logic.if\", &IfConfig{})\n}\n\nfunc (c *IfConfig) Init(settings interface{}) (models.Processor, error) {\n\tresult, err := common.InitProcessor[*IfConfig](settings)\n\tif err != nil {\n\t\treturn nil, err\n\t}\n\n\t// 解析标签过滤器\n\tif len(result.LabelKeys) > 0 {\n\t\t// Deep copy to avoid concurrent map writes on cached objects\n\t\tlabelKeysCopy := make([]models.TagFilter, len(result.LabelKeys))\n\t\tcopy(labelKeysCopy, result.LabelKeys)\n\t\tfor i := range labelKeysCopy {\n\t\t\tif labelKeysCopy[i].Func == \"\" {\n\t\t\t\tlabelKeysCopy[i].Func = labelKeysCopy[i].Op\n\t\t\t}\n\t\t}\n\t\tresult.parsedLabelKeys, err = models.ParseTagFilter(labelKeysCopy)\n\t\tif err != nil {\n\t\t\treturn nil, fmt.Errorf(\"failed to parse label_keys: %v\", err)\n\t\t}\n\t}\n\n\t// 解析属性过滤器\n\tif len(result.Attributes) > 0 {\n\t\t// Deep copy to avoid concurrent map writes on cached objects\n\t\tattributesCopy := make([]models.TagFilter, len(result.Attributes))\n\t\tcopy(attributesCopy, result.Attributes)\n\t\tfor i := range attributesCopy {\n\t\t\tif attributesCopy[i].Func == \"\" {\n\t\t\t\tattributesCopy[i].Func = attributesCopy[i].Op\n\t\t\t}\n\t\t}\n\t\tresult.parsedAttributes, err = models.ParseTagFilter(attributesCopy)\n\t\tif err != nil {\n\t\t\treturn nil, fmt.Errorf(\"failed to parse attributes: %v\", err)\n\t\t}\n\t}\n\n\treturn result, nil\n}\n\n// Process 实现 Processor 接口(兼容旧模式)\nfunc (c *IfConfig) Process(ctx *ctx.Context, wfCtx *models.WorkflowContext) (*models.WorkflowContext, string, error) {\n\tresult, err := c.evaluateCondition(wfCtx)\n\tif err != nil {\n\t\treturn wfCtx, \"\", fmt.Errorf(\"if processor: failed to evaluate condition: %v\", err)\n\t}\n\n\tif result {\n\t\treturn wfCtx, \"condition matched (true branch)\", nil\n\t}\n\treturn wfCtx, \"condition not matched (false branch)\", nil\n}\n\n// ProcessWithBranch 实现 BranchProcessor 接口\nfunc (c *IfConfig) ProcessWithBranch(ctx *ctx.Context, wfCtx *models.WorkflowContext) (*models.NodeOutput, error) {\n\tresult, err := c.evaluateCondition(wfCtx)\n\tif err != nil {\n\t\treturn nil, fmt.Errorf(\"if processor: failed to evaluate condition: %v\", err)\n\t}\n\n\toutput := &models.NodeOutput{\n\t\tWfCtx: wfCtx,\n\t}\n\n\tif result {\n\t\t// 条件为 true,走输出 0(true 分支)\n\t\tbranchIndex := 0\n\t\toutput.BranchIndex = &branchIndex\n\t\toutput.Message = \"condition matched (true branch)\"\n\t} else {\n\t\t// 条件为 false,走输出 1(false 分支)\n\t\tbranchIndex := 1\n\t\toutput.BranchIndex = &branchIndex\n\t\toutput.Message = \"condition not matched (false branch)\"\n\t}\n\n\treturn output, nil\n}\n\n// evaluateCondition 评估条件\nfunc (c *IfConfig) evaluateCondition(wfCtx *models.WorkflowContext) (bool, error) {\n\tmode := c.Mode\n\tif mode == \"\" {\n\t\tmode = ConditionModeExpression // 默认表达式模式\n\t}\n\n\tswitch mode {\n\tcase ConditionModeTags:\n\t\treturn c.evaluateTagsCondition(wfCtx.Event)\n\tdefault:\n\t\treturn c.evaluateExpressionCondition(wfCtx)\n\t}\n}\n\n// evaluateExpressionCondition 评估表达式条件\nfunc (c *IfConfig) evaluateExpressionCondition(wfCtx *models.WorkflowContext) (bool, error) {\n\tif c.Condition == \"\" {\n\t\treturn true, nil\n\t}\n\n\t// 构建模板数据\n\tvar defs = []string{\n\t\t\"{{ $event := .Event }}\",\n\t\t\"{{ $labels := .Event.TagsMap }}\",\n\t\t\"{{ $value := .Event.TriggerValue }}\",\n\t\t\"{{ $inputs := .Inputs }}\",\n\t}\n\n\ttext := strings.Join(append(defs, c.Condition), \"\")\n\n\ttpl, err := template.New(\"if_condition\").Funcs(tplx.TemplateFuncMap).Parse(text)\n\tif err != nil {\n\t\treturn false, err\n\t}\n\n\tvar buf bytes.Buffer\n\tif err = tpl.Execute(&buf, wfCtx); err != nil {\n\t\treturn false, err\n\t}\n\n\tresult := strings.TrimSpace(strings.ToLower(buf.String()))\n\treturn result == \"true\" || result == \"1\", nil\n}\n\n// evaluateTagsCondition 评估标签/属性条件\nfunc (c *IfConfig) evaluateTagsCondition(event *models.AlertCurEvent) (bool, error) {\n\t// 如果没有配置任何过滤条件,默认返回 true\n\tif len(c.parsedLabelKeys) == 0 && len(c.parsedAttributes) == 0 {\n\t\treturn true, nil\n\t}\n\n\t// 匹配标签 (TagsMap)\n\tif len(c.parsedLabelKeys) > 0 {\n\t\ttagsMap := event.TagsMap\n\t\tif tagsMap == nil {\n\t\t\ttagsMap = make(map[string]string)\n\t\t}\n\t\tif !alertCommon.MatchTags(tagsMap, c.parsedLabelKeys) {\n\t\t\treturn false, nil\n\t\t}\n\t}\n\n\t// 匹配属性 (JsonTagsAndValue - 所有 JSON 字段)\n\tif len(c.parsedAttributes) > 0 {\n\t\tattributesMap := event.JsonTagsAndValue()\n\t\tif !alertCommon.MatchTags(attributesMap, c.parsedAttributes) {\n\t\t\treturn false, nil\n\t\t}\n\t}\n\n\treturn true, nil\n}\n"
},
{
"path": "alert/pipeline/processor/logic/switch.go",
"content": "package logic\n\nimport (\n\t\"bytes\"\n\t\"fmt\"\n\t\"strings\"\n\t\"text/template\"\n\n\talertCommon \"github.com/ccfos/nightingale/v6/alert/common\"\n\t\"github.com/ccfos/nightingale/v6/alert/pipeline/processor/common\"\n\t\"github.com/ccfos/nightingale/v6/models\"\n\t\"github.com/ccfos/nightingale/v6/pkg/ctx\"\n\t\"github.com/ccfos/nightingale/v6/pkg/tplx\"\n)\n\n// SwitchCase Switch 分支定义\ntype SwitchCase struct {\n\t// 判断模式:expression(表达式)或 tags(标签/属性)\n\tMode string `json:\"mode,omitempty\"`\n\n\t// 表达式模式配置\n\t// 条件表达式(支持 Go 模板语法)\n\tCondition string `json:\"condition,omitempty\"`\n\n\t// 标签/属性模式配置\n\tLabelKeys []models.TagFilter `json:\"label_keys,omitempty\"` // 适用标签\n\tAttributes []models.TagFilter `json:\"attributes,omitempty\"` // 适用属性\n\n\t// 分支名称(可选,用于日志)\n\tName string `json:\"name,omitempty\"`\n\n\t// 内部使用,解析后的过滤器\n\tparsedLabelKeys []models.TagFilter `json:\"-\"`\n\tparsedAttributes []models.TagFilter `json:\"-\"`\n}\n\n// SwitchConfig Switch 多分支处理器配置\ntype SwitchConfig struct {\n\t// 分支条件列表\n\t// 按顺序匹配,第一个为 true 的分支将被选中\n\tCases []SwitchCase `json:\"cases\"`\n\t// 是否允许多个分支同时匹配(默认 false,只走第一个匹配的)\n\tAllowMultiple bool `json:\"allow_multiple,omitempty\"`\n}\n\nfunc init() {\n\tmodels.RegisterProcessor(\"logic.switch\", &SwitchConfig{})\n}\n\nfunc (c *SwitchConfig) Init(settings interface{}) (models.Processor, error) {\n\tresult, err := common.InitProcessor[*SwitchConfig](settings)\n\tif err != nil {\n\t\treturn nil, err\n\t}\n\n\t// 解析每个 case 的标签和属性过滤器\n\tfor i := range result.Cases {\n\t\tif len(result.Cases[i].LabelKeys) > 0 {\n\t\t\t// Deep copy to avoid concurrent map writes on cached objects\n\t\t\tlabelKeysCopy := make([]models.TagFilter, len(result.Cases[i].LabelKeys))\n\t\t\tcopy(labelKeysCopy, result.Cases[i].LabelKeys)\n\t\t\tfor j := range labelKeysCopy {\n\t\t\t\tif labelKeysCopy[j].Func == \"\" {\n\t\t\t\t\tlabelKeysCopy[j].Func = labelKeysCopy[j].Op\n\t\t\t\t}\n\t\t\t}\n\t\t\tresult.Cases[i].parsedLabelKeys, err = models.ParseTagFilter(labelKeysCopy)\n\t\t\tif err != nil {\n\t\t\t\treturn nil, fmt.Errorf(\"failed to parse label_keys for case[%d]: %v\", i, err)\n\t\t\t}\n\t\t}\n\n\t\tif len(result.Cases[i].Attributes) > 0 {\n\t\t\t// Deep copy to avoid concurrent map writes on cached objects\n\t\t\tattributesCopy := make([]models.TagFilter, len(result.Cases[i].Attributes))\n\t\t\tcopy(attributesCopy, result.Cases[i].Attributes)\n\t\t\tfor j := range attributesCopy {\n\t\t\t\tif attributesCopy[j].Func == \"\" {\n\t\t\t\t\tattributesCopy[j].Func = attributesCopy[j].Op\n\t\t\t\t}\n\t\t\t}\n\t\t\tresult.Cases[i].parsedAttributes, err = models.ParseTagFilter(attributesCopy)\n\t\t\tif err != nil {\n\t\t\t\treturn nil, fmt.Errorf(\"failed to parse attributes for case[%d]: %v\", i, err)\n\t\t\t}\n\t\t}\n\t}\n\n\treturn result, nil\n}\n\n// Process 实现 Processor 接口(兼容旧模式)\nfunc (c *SwitchConfig) Process(ctx *ctx.Context, wfCtx *models.WorkflowContext) (*models.WorkflowContext, string, error) {\n\tindex, caseName, err := c.evaluateCases(wfCtx)\n\tif err != nil {\n\t\treturn wfCtx, \"\", fmt.Errorf(\"switch processor: failed to evaluate cases: %v\", err)\n\t}\n\n\tif index >= 0 {\n\t\tif caseName != \"\" {\n\t\t\treturn wfCtx, fmt.Sprintf(\"matched case[%d]: %s\", index, caseName), nil\n\t\t}\n\t\treturn wfCtx, fmt.Sprintf(\"matched case[%d]\", index), nil\n\t}\n\n\t// 走默认分支(最后一个输出)\n\treturn wfCtx, \"no case matched, using default branch\", nil\n}\n\n// ProcessWithBranch 实现 BranchProcessor 接口\nfunc (c *SwitchConfig) ProcessWithBranch(ctx *ctx.Context, wfCtx *models.WorkflowContext) (*models.NodeOutput, error) {\n\tindex, caseName, err := c.evaluateCases(wfCtx)\n\tif err != nil {\n\t\treturn nil, fmt.Errorf(\"switch processor: failed to evaluate cases: %v\", err)\n\t}\n\n\toutput := &models.NodeOutput{\n\t\tWfCtx: wfCtx,\n\t}\n\n\tif index >= 0 {\n\t\toutput.BranchIndex = &index\n\t\tif caseName != \"\" {\n\t\t\toutput.Message = fmt.Sprintf(\"matched case[%d]: %s\", index, caseName)\n\t\t} else {\n\t\t\toutput.Message = fmt.Sprintf(\"matched case[%d]\", index)\n\t\t}\n\t} else {\n\t\t// 默认分支的索引是 cases 数量(即最后一个输出端口)\n\t\tdefaultIndex := len(c.Cases)\n\t\toutput.BranchIndex = &defaultIndex\n\t\toutput.Message = \"no case matched, using default branch\"\n\t}\n\n\treturn output, nil\n}\n\n// evaluateCases 评估所有分支条件\n// 返回匹配的分支索引和分支名称,如果没有匹配返回 -1\nfunc (c *SwitchConfig) evaluateCases(wfCtx *models.WorkflowContext) (int, string, error) {\n\tfor i := range c.Cases {\n\t\tmatched, err := c.evaluateCaseCondition(&c.Cases[i], wfCtx)\n\t\tif err != nil {\n\t\t\treturn -1, \"\", fmt.Errorf(\"case[%d] evaluation error: %v\", i, err)\n\t\t}\n\t\tif matched {\n\t\t\treturn i, c.Cases[i].Name, nil\n\t\t}\n\t}\n\treturn -1, \"\", nil\n}\n\n// evaluateCaseCondition 评估单个分支条件\nfunc (c *SwitchConfig) evaluateCaseCondition(caseItem *SwitchCase, wfCtx *models.WorkflowContext) (bool, error) {\n\tmode := caseItem.Mode\n\tif mode == \"\" {\n\t\tmode = ConditionModeExpression // 默认表达式模式\n\t}\n\n\tswitch mode {\n\tcase ConditionModeTags:\n\t\treturn c.evaluateTagsCondition(caseItem, wfCtx.Event)\n\tdefault:\n\t\treturn c.evaluateExpressionCondition(caseItem.Condition, wfCtx)\n\t}\n}\n\n// evaluateExpressionCondition 评估表达式条件\nfunc (c *SwitchConfig) evaluateExpressionCondition(condition string, wfCtx *models.WorkflowContext) (bool, error) {\n\tif condition == \"\" {\n\t\treturn false, nil\n\t}\n\n\tvar defs = []string{\n\t\t\"{{ $event := .Event }}\",\n\t\t\"{{ $labels := .Event.TagsMap }}\",\n\t\t\"{{ $value := .Event.TriggerValue }}\",\n\t\t\"{{ $inputs := .Inputs }}\",\n\t}\n\n\ttext := strings.Join(append(defs, condition), \"\")\n\n\ttpl, err := template.New(\"switch_condition\").Funcs(tplx.TemplateFuncMap).Parse(text)\n\tif err != nil {\n\t\treturn false, err\n\t}\n\n\tvar buf bytes.Buffer\n\tif err = tpl.Execute(&buf, wfCtx); err != nil {\n\t\treturn false, err\n\t}\n\n\tresult := strings.TrimSpace(strings.ToLower(buf.String()))\n\treturn result == \"true\" || result == \"1\", nil\n}\n\n// evaluateTagsCondition 评估标签/属性条件\nfunc (c *SwitchConfig) evaluateTagsCondition(caseItem *SwitchCase, event *models.AlertCurEvent) (bool, error) {\n\t// 如果没有配置任何过滤条件,默认返回 false(不匹配)\n\tif len(caseItem.parsedLabelKeys) == 0 && len(caseItem.parsedAttributes) == 0 {\n\t\treturn false, nil\n\t}\n\n\t// 匹配标签 (TagsMap)\n\tif len(caseItem.parsedLabelKeys) > 0 {\n\t\ttagsMap := event.TagsMap\n\t\tif tagsMap == nil {\n\t\t\ttagsMap = make(map[string]string)\n\t\t}\n\t\tif !alertCommon.MatchTags(tagsMap, caseItem.parsedLabelKeys) {\n\t\t\treturn false, nil\n\t\t}\n\t}\n\n\t// 匹配属性 (JsonTagsAndValue - 所有 JSON 字段)\n\tif len(caseItem.parsedAttributes) > 0 {\n\t\tattributesMap := event.JsonTagsAndValue()\n\t\tif !alertCommon.MatchTags(attributesMap, caseItem.parsedAttributes) {\n\t\t\treturn false, nil\n\t\t}\n\t}\n\n\treturn true, nil\n}\n"
},
{
"path": "alert/pipeline/processor/relabel/relabel.go",
"content": "package relabel\n\nimport (\n\t\"fmt\"\n\t\"regexp\"\n\t\"strings\"\n\n\t\"github.com/ccfos/nightingale/v6/alert/pipeline/processor/common\"\n\t\"github.com/ccfos/nightingale/v6/models\"\n\t\"github.com/ccfos/nightingale/v6/pkg/ctx\"\n\t\"github.com/ccfos/nightingale/v6/pushgw/pconf\"\n\t\"github.com/ccfos/nightingale/v6/pushgw/writer\"\n\n\t\"github.com/prometheus/common/model\"\n\t\"github.com/prometheus/prometheus/prompb\"\n)\n\nconst (\n\tREPLACE_DOT = \"___\"\n)\n\n// RelabelConfig\ntype RelabelConfig struct {\n\tSourceLabels []string `json:\"source_labels\"`\n\tSeparator string `json:\"separator\"`\n\tRegex string `json:\"regex\"`\n\tRegexCompiled *regexp.Regexp\n\tIf string `json:\"if\"`\n\tIfRegex *regexp.Regexp\n\tModulus uint64 `json:\"modulus\"`\n\tTargetLabel string `json:\"target_label\"`\n\tReplacement string `json:\"replacement\"`\n\tAction string `json:\"action\"`\n}\n\nfunc init() {\n\tmodels.RegisterProcessor(\"relabel\", &RelabelConfig{})\n}\n\nfunc (r *RelabelConfig) Init(settings interface{}) (models.Processor, error) {\n\tresult, err := common.InitProcessor[*RelabelConfig](settings)\n\treturn result, err\n}\n\nfunc (r *RelabelConfig) Process(ctx *ctx.Context, wfCtx *models.WorkflowContext) (*models.WorkflowContext, string, error) {\n\tsourceLabels := make([]model.LabelName, len(r.SourceLabels))\n\tfor i := range r.SourceLabels {\n\t\tsourceLabels[i] = model.LabelName(strings.ReplaceAll(r.SourceLabels[i], \".\", REPLACE_DOT))\n\t}\n\n\trelabelConfigs := []*pconf.RelabelConfig{\n\t\t{\n\t\t\tSourceLabels: sourceLabels,\n\t\t\tSeparator: r.Separator,\n\t\t\tRegex: r.Regex,\n\t\t\tRegexCompiled: r.RegexCompiled,\n\t\t\tIf: r.If,\n\t\t\tIfRegex: r.IfRegex,\n\t\t\tModulus: r.Modulus,\n\t\t\tTargetLabel: r.TargetLabel,\n\t\t\tReplacement: r.Replacement,\n\t\t\tAction: r.Action,\n\t\t},\n\t}\n\n\tEventRelabel(wfCtx.Event, relabelConfigs)\n\treturn wfCtx, \"\", nil\n}\n\nfunc EventRelabel(event *models.AlertCurEvent, relabelConfigs []*pconf.RelabelConfig) {\n\tlabels := make([]prompb.Label, len(event.TagsJSON))\n\tevent.OriginalTagsJSON = make([]string, len(event.TagsJSON))\n\tfor i, tag := range event.TagsJSON {\n\t\tlabel := strings.SplitN(tag, \"=\", 2)\n\t\tif len(label) != 2 {\n\t\t\tcontinue\n\t\t}\n\t\tevent.OriginalTagsJSON[i] = tag\n\n\t\tlabel[0] = strings.ReplaceAll(string(label[0]), \".\", REPLACE_DOT)\n\t\tlabels[i] = prompb.Label{Name: label[0], Value: label[1]}\n\t}\n\n\tfor i := 0; i < len(relabelConfigs); i++ {\n\t\tif relabelConfigs[i].Replacement == \"\" {\n\t\t\trelabelConfigs[i].Replacement = \"$1\"\n\t\t}\n\n\t\tif relabelConfigs[i].Separator == \"\" {\n\t\t\trelabelConfigs[i].Separator = \";\"\n\t\t}\n\n\t\tif relabelConfigs[i].Regex == \"\" {\n\t\t\trelabelConfigs[i].Regex = \"(.*)\"\n\t\t}\n\t}\n\n\tgotLabels := writer.Process(labels, relabelConfigs...)\n\tevent.TagsJSON = make([]string, len(gotLabels))\n\tevent.TagsMap = make(map[string]string, len(gotLabels))\n\tfor i, label := range gotLabels {\n\t\tlabel.Name = strings.ReplaceAll(string(label.Name), REPLACE_DOT, \".\")\n\t\tevent.TagsJSON[i] = fmt.Sprintf(\"%s=%s\", label.Name, label.Value)\n\t\tevent.TagsMap[label.Name] = label.Value\n\t}\n\tevent.Tags = strings.Join(event.TagsJSON, \",,\")\n}\n"
},
{
"path": "alert/pipeline/processor/utils/utils.go",
"content": "package utils\n\nimport (\n\t\"bytes\"\n\t\"fmt\"\n\t\"strings\"\n\t\"text/template\"\n\n\t\"github.com/ccfos/nightingale/v6/models\"\n\t\"github.com/ccfos/nightingale/v6/pkg/tplx\"\n)\n\nfunc TplRender(wfCtx *models.WorkflowContext, content string) (string, error) {\n\tvar defs = []string{\n\t\t\"{{ $event := .Event }}\",\n\t\t\"{{ $labels := .Event.TagsMap }}\",\n\t\t\"{{ $value := .Event.TriggerValue }}\",\n\t\t\"{{ $inputs := .Inputs }}\",\n\t}\n\ttext := strings.Join(append(defs, content), \"\")\n\ttpl, err := template.New(\"tpl\").Funcs(tplx.TemplateFuncMap).Parse(text)\n\tif err != nil {\n\t\treturn \"\", fmt.Errorf(\"failed to parse template: %v\", err)\n\t}\n\n\tvar body bytes.Buffer\n\tif err = tpl.Execute(&body, wfCtx); err != nil {\n\t\treturn \"\", fmt.Errorf(\"failed to execute template: %v\", err)\n\t}\n\n\treturn strings.TrimSpace(body.String()), nil\n}\n"
},
{
"path": "alert/process/alert_cur_event.go",
"content": "package process\n\nimport (\n\t\"sync\"\n\n\t\"github.com/ccfos/nightingale/v6/models\"\n)\n\ntype AlertCurEventMap struct {\n\tsync.RWMutex\n\tData map[string]*models.AlertCurEvent\n}\n\nfunc NewAlertCurEventMap(data map[string]*models.AlertCurEvent) *AlertCurEventMap {\n\tif data == nil {\n\t\treturn &AlertCurEventMap{\n\t\t\tData: make(map[string]*models.AlertCurEvent),\n\t\t}\n\t}\n\treturn &AlertCurEventMap{\n\t\tData: data,\n\t}\n}\n\nfunc (a *AlertCurEventMap) SetAll(data map[string]*models.AlertCurEvent) {\n\ta.Lock()\n\tdefer a.Unlock()\n\ta.Data = data\n}\n\nfunc (a *AlertCurEventMap) Set(key string, value *models.AlertCurEvent) {\n\ta.Lock()\n\tdefer a.Unlock()\n\ta.Data[key] = value\n}\n\nfunc (a *AlertCurEventMap) Get(key string) (*models.AlertCurEvent, bool) {\n\ta.RLock()\n\tdefer a.RUnlock()\n\tevent, exists := a.Data[key]\n\treturn event, exists\n}\n\nfunc (a *AlertCurEventMap) UpdateLastEvalTime(key string, lastEvalTime int64) {\n\ta.Lock()\n\tdefer a.Unlock()\n\tevent, exists := a.Data[key]\n\tif !exists {\n\t\treturn\n\t}\n\tevent.LastEvalTime = lastEvalTime\n}\n\nfunc (a *AlertCurEventMap) Delete(key string) {\n\ta.Lock()\n\tdefer a.Unlock()\n\tdelete(a.Data, key)\n}\n\nfunc (a *AlertCurEventMap) Keys() []string {\n\ta.RLock()\n\tdefer a.RUnlock()\n\tkeys := make([]string, 0, len(a.Data))\n\tfor k := range a.Data {\n\t\tkeys = append(keys, k)\n\t}\n\treturn keys\n}\n\nfunc (a *AlertCurEventMap) GetAll() map[string]*models.AlertCurEvent {\n\ta.RLock()\n\tdefer a.RUnlock()\n\treturn a.Data\n}\n"
},
{
"path": "alert/process/process.go",
"content": "package process\n\nimport (\n\t\"bytes\"\n\t\"encoding/json\"\n\t\"fmt\"\n\t\"html/template\"\n\t\"sort\"\n\t\"strings\"\n\t\"sync\"\n\t\"time\"\n\n\t\"github.com/ccfos/nightingale/v6/alert/astats\"\n\t\"github.com/ccfos/nightingale/v6/alert/common\"\n\t\"github.com/ccfos/nightingale/v6/alert/dispatch\"\n\t\"github.com/ccfos/nightingale/v6/alert/mute\"\n\t\"github.com/ccfos/nightingale/v6/alert/pipeline/processor/relabel\"\n\t\"github.com/ccfos/nightingale/v6/alert/queue\"\n\t\"github.com/ccfos/nightingale/v6/memsto\"\n\t\"github.com/ccfos/nightingale/v6/models\"\n\t\"github.com/ccfos/nightingale/v6/pkg/ctx\"\n\t\"github.com/ccfos/nightingale/v6/pkg/tplx\"\n\n\t\"github.com/robfig/cron/v3\"\n\t\"github.com/toolkits/pkg/logger\"\n\t\"github.com/toolkits/pkg/str\"\n)\n\ntype ExternalProcessorsType struct {\n\tExternalLock sync.RWMutex\n\tProcessors map[string]*Processor\n}\n\nvar ExternalProcessors ExternalProcessorsType\n\nfunc NewExternalProcessors() *ExternalProcessorsType {\n\treturn &ExternalProcessorsType{\n\t\tProcessors: make(map[string]*Processor),\n\t}\n}\n\nfunc (e *ExternalProcessorsType) GetExternalAlertRule(datasourceId, id int64) (*Processor, bool) {\n\te.ExternalLock.RLock()\n\tdefer e.ExternalLock.RUnlock()\n\tprocessor, has := e.Processors[common.RuleKey(datasourceId, id)]\n\treturn processor, has\n}\n\ntype HandleEventFunc func(event *models.AlertCurEvent)\n\ntype Processor struct {\n\tdatasourceId int64\n\tEngineName string\n\n\trule *models.AlertRule\n\tfires *AlertCurEventMap\n\tpendings *AlertCurEventMap\n\tpendingsUseByRecover *AlertCurEventMap\n\tinhibit bool\n\n\ttagsMap map[string]string\n\ttagsArr []string\n\tgroupName string\n\n\talertRuleCache *memsto.AlertRuleCacheType\n\tTargetCache *memsto.TargetCacheType\n\tTargetsOfAlertRuleCache *memsto.TargetsOfAlertRuleCacheType\n\tBusiGroupCache *memsto.BusiGroupCacheType\n\talertMuteCache *memsto.AlertMuteCacheType\n\tdatasourceCache *memsto.DatasourceCacheType\n\n\tctx *ctx.Context\n\tStats *astats.Stats\n\n\tHandleFireEventHook HandleEventFunc\n\tHandleRecoverEventHook HandleEventFunc\n\n\tScheduleEntry cron.Entry\n\tPromEvalInterval int\n}\n\nfunc (p *Processor) Key() string {\n\treturn common.RuleKey(p.datasourceId, p.rule.Id)\n}\n\nfunc (p *Processor) DatasourceId() int64 {\n\treturn p.datasourceId\n}\n\nfunc (p *Processor) Hash() string {\n\treturn str.MD5(fmt.Sprintf(\"%d_%s_%s_%d\",\n\t\tp.rule.Id,\n\t\tp.rule.CronPattern,\n\t\tp.rule.RuleConfig,\n\t\tp.datasourceId,\n\t))\n}\n\nfunc NewProcessor(engineName string, rule *models.AlertRule, datasourceId int64, alertRuleCache *memsto.AlertRuleCacheType,\n\ttargetCache *memsto.TargetCacheType, targetsOfAlertRuleCache *memsto.TargetsOfAlertRuleCacheType,\n\tbusiGroupCache *memsto.BusiGroupCacheType, alertMuteCache *memsto.AlertMuteCacheType, datasourceCache *memsto.DatasourceCacheType, ctx *ctx.Context,\n\tstats *astats.Stats) *Processor {\n\n\tp := &Processor{\n\t\tEngineName: engineName,\n\t\tdatasourceId: datasourceId,\n\t\trule: rule,\n\n\t\tTargetCache: targetCache,\n\t\tTargetsOfAlertRuleCache: targetsOfAlertRuleCache,\n\t\tBusiGroupCache: busiGroupCache,\n\t\talertMuteCache: alertMuteCache,\n\t\talertRuleCache: alertRuleCache,\n\t\tdatasourceCache: datasourceCache,\n\n\t\tctx: ctx,\n\t\tStats: stats,\n\n\t\tHandleFireEventHook: func(event *models.AlertCurEvent) {},\n\t\tHandleRecoverEventHook: func(event *models.AlertCurEvent) {},\n\t}\n\n\tp.mayHandleGroup()\n\treturn p\n}\n\nfunc (p *Processor) Handle(anomalyPoints []models.AnomalyPoint, from string, inhibit bool) {\n\t// 有可能rule的一些配置已经发生变化,比如告警接收人、callbacks等\n\t// 这些信息的修改是不会引起worker restart的,但是确实会影响告警处理逻辑\n\t// 所以,这里直接从memsto.AlertRuleCache中获取并覆盖\n\tp.inhibit = inhibit\n\tcachedRule := p.alertRuleCache.Get(p.rule.Id)\n\tif cachedRule == nil {\n\t\tlogger.Warningf(\"alert_eval_%d datasource_%d handle error: rule not found, maybe rule has been deleted, anomalyPoints:%+v\", p.rule.Id, p.datasourceId, anomalyPoints)\n\t\tp.Stats.CounterRuleEvalErrorTotal.WithLabelValues(fmt.Sprintf(\"%v\", p.DatasourceId()), \"handle_event\", p.BusiGroupCache.GetNameByBusiGroupId(p.rule.GroupId), fmt.Sprintf(\"%v\", p.rule.Id)).Inc()\n\t\treturn\n\t}\n\n\t// 在 rule 变化之前取到 ruleHash\n\truleHash := p.rule.Hash()\n\n\tp.rule = cachedRule\n\tnow := time.Now().Unix()\n\talertingKeys := map[string]struct{}{}\n\n\t// 根据 event 的 tag 将 events 分组,处理告警抑制的情况\n\teventsMap := make(map[string][]*models.AlertCurEvent)\n\tfor _, anomalyPoint := range anomalyPoints {\n\t\tevent := p.BuildEvent(anomalyPoint, from, now, ruleHash)\n\t\tevent.NotifyRuleIds = cachedRule.NotifyRuleIds\n\t\t// 如果 event 被 mute 了,本质也是 fire 的状态,这里无论如何都添加到 alertingKeys 中,防止 fire 的事件自动恢复了\n\t\thash := event.Hash\n\t\talertingKeys[hash] = struct{}{}\n\n\t\t// event processor\n\t\teventCopy := event.DeepCopy()\n\t\tevent = dispatch.HandleEventPipeline(cachedRule.PipelineConfigs, eventCopy, event, dispatch.EventProcessorCache, p.ctx, cachedRule.Id, \"alert_rule\")\n\t\tif event == nil {\n\t\t\tlogger.Infof(\"alert_eval_%d datasource_%d is muted drop by pipeline event:%s\", p.rule.Id, p.datasourceId, eventCopy.Hash)\n\t\t\tcontinue\n\t\t}\n\n\t\t// event mute\n\t\tisMuted, detail, muteId := mute.IsMuted(cachedRule, event, p.TargetCache, p.alertMuteCache)\n\t\tif isMuted {\n\t\t\tlogger.Infof(\"alert_eval_%d datasource_%d is muted, detail:%s event:%s\", p.rule.Id, p.datasourceId, detail, event.Hash)\n\t\t\tp.Stats.CounterMuteTotal.WithLabelValues(\n\t\t\t\tfmt.Sprintf(\"%v\", event.GroupName),\n\t\t\t\tfmt.Sprintf(\"%v\", p.rule.Id),\n\t\t\t\tfmt.Sprintf(\"%v\", muteId),\n\t\t\t\tfmt.Sprintf(\"%v\", p.datasourceId),\n\t\t\t).Inc()\n\t\t\tcontinue\n\t\t}\n\n\t\tif dispatch.EventMuteHook(event) {\n\t\t\tlogger.Infof(\"alert_eval_%d datasource_%d is muted by hook event:%s\", p.rule.Id, p.datasourceId, event.Hash)\n\t\t\tp.Stats.CounterMuteTotal.WithLabelValues(\n\t\t\t\tfmt.Sprintf(\"%v\", event.GroupName),\n\t\t\t\tfmt.Sprintf(\"%v\", p.rule.Id),\n\t\t\t\tfmt.Sprintf(\"%v\", 0),\n\t\t\t\tfmt.Sprintf(\"%v\", p.datasourceId),\n\t\t\t).Inc()\n\t\t\tcontinue\n\t\t}\n\n\t\ttagHash := TagHash(anomalyPoint)\n\t\teventsMap[tagHash] = append(eventsMap[tagHash], event)\n\t}\n\n\tfor _, events := range eventsMap {\n\t\tp.handleEvent(events)\n\t}\n\n\tif from == \"inner\" {\n\t\tp.HandleRecover(alertingKeys, now, inhibit)\n\t}\n}\n\nfunc (p *Processor) BuildEvent(anomalyPoint models.AnomalyPoint, from string, now int64, ruleHash string) *models.AlertCurEvent {\n\tp.fillTags(anomalyPoint)\n\n\thash := Hash(p.rule.Id, p.datasourceId, anomalyPoint)\n\tds := p.datasourceCache.GetById(p.datasourceId)\n\tvar dsName string\n\tif ds != nil {\n\t\tdsName = ds.Name\n\t}\n\n\tevent := p.rule.GenerateNewEvent(p.ctx)\n\n\tbg := p.BusiGroupCache.GetByBusiGroupId(p.rule.GroupId)\n\tif bg != nil {\n\t\tevent.GroupName = bg.Name\n\t}\n\n\tevent.TriggerTime = anomalyPoint.Timestamp\n\tevent.TagsMap = p.tagsMap\n\tevent.DatasourceId = p.datasourceId\n\tevent.Cluster = dsName\n\tevent.Hash = hash\n\tevent.TriggerValue = anomalyPoint.ReadableValue()\n\tevent.TriggerValues = anomalyPoint.Values\n\tevent.TriggerValuesJson = models.EventTriggerValues{ValuesWithUnit: anomalyPoint.ValuesUnit}\n\tevent.TagsJSON = p.tagsArr\n\tevent.Tags = strings.Join(p.tagsArr, \",,\")\n\tevent.IsRecovered = false\n\tevent.Callbacks = p.rule.Callbacks\n\tevent.CallbacksJSON = p.rule.CallbacksJSON\n\tevent.Annotations = p.rule.Annotations\n\tevent.RuleConfig = p.rule.RuleConfig\n\tevent.RuleConfigJson = p.rule.RuleConfigJson\n\tevent.Severity = anomalyPoint.Severity\n\tevent.ExtraConfig = p.rule.ExtraConfigJSON\n\tevent.PromQl = anomalyPoint.Query\n\tevent.RecoverConfig = anomalyPoint.RecoverConfig\n\tevent.RuleHash = ruleHash\n\n\tif anomalyPoint.TriggerType == models.TriggerTypeNodata {\n\t\tevent.TriggerValue = \"nodata\"\n\t\truleConfig := models.RuleQuery{}\n\t\tjson.Unmarshal([]byte(p.rule.RuleConfig), &ruleConfig)\n\t\truleConfig.TriggerType = anomalyPoint.TriggerType\n\t\tb, _ := json.Marshal(ruleConfig)\n\t\tevent.RuleConfig = string(b)\n\t}\n\n\tif err := json.Unmarshal([]byte(p.rule.Annotations), &event.AnnotationsJSON); err != nil {\n\t\tevent.AnnotationsJSON = make(map[string]string) // 解析失败时使用空 map\n\t\tlogger.Warningf(\"alert_eval_%d datasource_%d unmarshal annotations json failed: %v\", p.rule.Id, p.datasourceId, err)\n\t}\n\n\tif event.TriggerValues != \"\" && strings.Count(event.TriggerValues, \"$\") > 1 {\n\t\t// TriggerValues 有多个变量,将多个变量都放到 TriggerValue 中\n\t\tevent.TriggerValue = event.TriggerValues\n\t}\n\n\tif from == \"inner\" {\n\t\tevent.LastEvalTime = now\n\t} else {\n\t\tevent.LastEvalTime = event.TriggerTime\n\t}\n\n\t// 生成事件之后,立马进程 relabel 处理\n\tRelabel(p.rule, event)\n\n\t// 放到 Relabel(p.rule, event) 下面,为了处理 relabel 之后,标签里才出现 ident 的情况\n\tp.mayHandleIdent(event)\n\n\tif event.TargetIdent != \"\" {\n\t\tif pt, exist := p.TargetCache.Get(event.TargetIdent); exist {\n\t\t\tpt.GroupNames = p.BusiGroupCache.GetNamesByBusiGroupIds(pt.GroupIds)\n\t\t\tevent.Target = pt\n\t\t} else {\n\t\t\tlogger.Infof(\"alert_eval_%d datasource_%d fill event target error, ident: %s doesn't exist in cache.\", p.rule.Id, p.datasourceId, event.TargetIdent)\n\t\t}\n\t}\n\n\treturn event\n}\n\nfunc Relabel(rule *models.AlertRule, event *models.AlertCurEvent) {\n\tif rule == nil {\n\t\treturn\n\t}\n\n\t// need to keep the original label\n\tevent.OriginalTags = event.Tags\n\tevent.OriginalTagsJSON = event.TagsJSON\n\n\tif len(rule.EventRelabelConfig) == 0 {\n\t\treturn\n\t}\n\n\trelabel.EventRelabel(event, rule.EventRelabelConfig)\n}\n\nfunc (p *Processor) HandleRecover(alertingKeys map[string]struct{}, now int64, inhibit bool) {\n\tfor _, hash := range p.pendings.Keys() {\n\t\tif _, has := alertingKeys[hash]; has {\n\t\t\tcontinue\n\t\t}\n\t\tp.pendings.Delete(hash)\n\t}\n\n\thashArr := make([]string, 0, len(alertingKeys))\n\tfor hash, _ := range p.fires.GetAll() {\n\t\tif _, has := alertingKeys[hash]; has {\n\t\t\tcontinue\n\t\t}\n\n\t\thashArr = append(hashArr, hash)\n\t}\n\tp.HandleRecoverEvent(hashArr, now, inhibit)\n\n}\n\nfunc (p *Processor) HandleRecoverEvent(hashArr []string, now int64, inhibit bool) {\n\tcachedRule := p.rule\n\tif cachedRule == nil {\n\t\treturn\n\t}\n\n\tif !inhibit {\n\t\tfor _, hash := range hashArr {\n\t\t\tp.RecoverSingle(false, hash, now, nil)\n\t\t}\n\t\treturn\n\t}\n\n\teventMap := make(map[string]models.AlertCurEvent)\n\tfor _, hash := range hashArr {\n\t\tevent, has := p.fires.Get(hash)\n\t\tif !has {\n\t\t\tcontinue\n\t\t}\n\n\t\te, exists := eventMap[event.Tags]\n\t\tif !exists {\n\t\t\teventMap[event.Tags] = *event\n\t\t\tcontinue\n\t\t}\n\n\t\tif e.Severity > event.Severity {\n\t\t\t// hash 对应的恢复事件的被抑制了,把之前的事件删除\n\t\t\tp.fires.Delete(e.Hash)\n\t\t\tp.pendings.Delete(e.Hash)\n\t\t\tmodels.AlertCurEventDelByHash(p.ctx, e.Hash)\n\t\t\teventMap[event.Tags] = *event\n\t\t}\n\t}\n\n\tfor _, event := range eventMap {\n\t\tp.RecoverSingle(false, event.Hash, now, nil)\n\t}\n}\n\nfunc (p *Processor) RecoverSingle(byRecover bool, hash string, now int64, value *string, values ...string) {\n\tcachedRule := p.rule\n\tif cachedRule == nil {\n\t\treturn\n\t}\n\n\tevent, has := p.fires.Get(hash)\n\tif !has {\n\t\treturn\n\t}\n\n\t// 如果配置了留观时长,就不能立马恢复了\n\tif cachedRule.RecoverDuration > 0 {\n\t\tlastPendingEvent, has := p.pendingsUseByRecover.Get(hash)\n\t\tif !has {\n\t\t\t// 说明没有产生过异常点,就不需要恢复了\n\t\t\tlogger.Debugf(\"alert_eval_%d datasource_%d event:%s do not has pending event, not recover\", p.rule.Id, p.datasourceId, event.Hash)\n\t\t\treturn\n\t\t}\n\n\t\tif now-lastPendingEvent.LastEvalTime < cachedRule.RecoverDuration {\n\t\t\tlogger.Debugf(\"alert_eval_%d datasource_%d event:%s not recover\", p.rule.Id, p.datasourceId, event.Hash)\n\t\t\treturn\n\t\t}\n\t}\n\n\t// 如果设置了恢复条件,则不能在此处恢复,必须依靠 recoverPoint 来恢复\n\tif event.RecoverConfig.JudgeType != models.Origin && !byRecover {\n\t\tlogger.Debugf(\"alert_eval_%d datasource_%d event:%s not recover\", p.rule.Id, p.datasourceId, event.Hash)\n\t\treturn\n\t}\n\n\tif value != nil {\n\t\tevent.TriggerValue = *value\n\t\tif len(values) > 0 {\n\t\t\tevent.TriggerValues = values[0]\n\t\t}\n\t}\n\n\t// 没查到触发阈值的vector,姑且就认为这个vector的值恢复了\n\t// 我确实无法分辨,是prom中有值但是未满足阈值所以没返回,还是prom中确实丢了一些点导致没有数据可以返回,尴尬\n\tp.fires.Delete(hash)\n\tp.pendings.Delete(hash)\n\tp.pendingsUseByRecover.Delete(hash)\n\n\t// 可能是因为调整了promql才恢复的,所以事件里边要体现最新的promql,否则用户会比较困惑\n\t// 当然,其实rule的各个字段都可能发生变化了,都更新一下吧\n\tcachedRule.UpdateEvent(event)\n\tevent.IsRecovered = true\n\tevent.LastEvalTime = now\n\n\tp.HandleRecoverEventHook(event)\n\tp.pushEventToQueue(event)\n}\n\nfunc (p *Processor) handleEvent(events []*models.AlertCurEvent) {\n\tvar fireEvents []*models.AlertCurEvent\n\t// severity 初始为最低优先级, 一定为遇到比自己优先级高的事件\n\tseverity := models.SeverityLowest\n\tfor _, event := range events {\n\t\tif event == nil {\n\t\t\tcontinue\n\t\t}\n\n\t\tif _, has := p.pendingsUseByRecover.Get(event.Hash); has {\n\t\t\tp.pendingsUseByRecover.UpdateLastEvalTime(event.Hash, event.LastEvalTime)\n\t\t} else {\n\t\t\tp.pendingsUseByRecover.Set(event.Hash, event)\n\t\t}\n\n\t\tevent.PromEvalInterval = p.PromEvalInterval\n\t\tif p.rule.PromForDuration == 0 {\n\t\t\tfireEvents = append(fireEvents, event)\n\t\t\tif severity > event.Severity {\n\t\t\t\tseverity = event.Severity\n\t\t\t}\n\t\t\tcontinue\n\t\t}\n\n\t\tvar preEvalTime int64 // 第一个 pending event 的检测时间\n\t\tpreEvent, has := p.pendings.Get(event.Hash)\n\t\tif has {\n\t\t\tp.pendings.UpdateLastEvalTime(event.Hash, event.LastEvalTime)\n\t\t\tpreEvalTime = preEvent.FirstEvalTime\n\t\t} else {\n\t\t\tevent.FirstEvalTime = event.LastEvalTime\n\t\t\tp.pendings.Set(event.Hash, event)\n\t\t\tpreEvalTime = event.FirstEvalTime\n\t\t}\n\n\t\tif event.LastEvalTime-preEvalTime+int64(event.PromEvalInterval) >= int64(p.rule.PromForDuration) {\n\t\t\tfireEvents = append(fireEvents, event)\n\t\t\tif severity > event.Severity {\n\t\t\t\tseverity = event.Severity\n\t\t\t}\n\t\t\tcontinue\n\t\t}\n\t}\n\n\tp.inhibitEvent(fireEvents, severity)\n}\n\nfunc (p *Processor) inhibitEvent(events []*models.AlertCurEvent, highSeverity int) {\n\tfor _, event := range events {\n\t\tif p.inhibit && event.Severity > highSeverity {\n\t\t\tlogger.Debugf(\"alert_eval_%d datasource_%d event:%s inhibit highSeverity:%d\", p.rule.Id, p.datasourceId, event.Hash, highSeverity)\n\t\t\tcontinue\n\t\t}\n\t\tp.fireEvent(event)\n\t}\n}\n\nfunc (p *Processor) fireEvent(event *models.AlertCurEvent) {\n\t// As p.rule maybe outdated, use rule from cache\n\tcachedRule := p.rule\n\tif cachedRule == nil {\n\t\treturn\n\t}\n\n\tmessage := \"unknown\"\n\tdefer func() {\n\t\tlogger.Infof(\"alert_eval_%d datasource_%d event-hash-%s %s\", p.rule.Id, p.datasourceId, event.Hash, message)\n\t}()\n\n\tif fired, has := p.fires.Get(event.Hash); has {\n\t\tp.fires.UpdateLastEvalTime(event.Hash, event.LastEvalTime)\n\t\tevent.FirstTriggerTime = fired.FirstTriggerTime\n\t\tp.HandleFireEventHook(event)\n\n\t\tif cachedRule.NotifyRepeatStep == 0 {\n\t\t\tmessage = \"stalled, rule.notify_repeat_step is 0, no need to repeat notify\"\n\t\t\treturn\n\t\t}\n\n\t\t// 之前发送过告警了,这次是否要继续发送,要看是否过了通道静默时间\n\t\tif event.LastEvalTime >= fired.LastSentTime+int64(cachedRule.NotifyRepeatStep)*60 {\n\t\t\tif cachedRule.NotifyMaxNumber == 0 {\n\t\t\t\t// 最大可以发送次数如果是0,表示不想限制最大发送次数,一直发即可\n\t\t\t\tevent.NotifyCurNumber = fired.NotifyCurNumber + 1\n\t\t\t\tmessage = fmt.Sprintf(\"fired, notify_repeat_step_matched(%d >= %d + %d * 60) notify_max_number_ignore(#%d / %d)\", event.LastEvalTime, fired.LastSentTime, cachedRule.NotifyRepeatStep, event.NotifyCurNumber, cachedRule.NotifyMaxNumber)\n\t\t\t\tp.pushEventToQueue(event)\n\t\t\t} else {\n\t\t\t\t// 有最大发送次数的限制,就要看已经发了几次了,是否达到了最大发送次数\n\t\t\t\tif fired.NotifyCurNumber >= cachedRule.NotifyMaxNumber {\n\t\t\t\t\tmessage = fmt.Sprintf(\"stalled, notify_repeat_step_matched(%d >= %d + %d * 60) notify_max_number_not_matched(#%d / %d)\", event.LastEvalTime, fired.LastSentTime, cachedRule.NotifyRepeatStep, fired.NotifyCurNumber, cachedRule.NotifyMaxNumber)\n\t\t\t\t\treturn\n\t\t\t\t} else {\n\t\t\t\t\tevent.NotifyCurNumber = fired.NotifyCurNumber + 1\n\t\t\t\t\tmessage = fmt.Sprintf(\"fired, notify_repeat_step_matched(%d >= %d + %d * 60) notify_max_number_matched(#%d / %d)\", event.LastEvalTime, fired.LastSentTime, cachedRule.NotifyRepeatStep, event.NotifyCurNumber, cachedRule.NotifyMaxNumber)\n\t\t\t\t\tp.pushEventToQueue(event)\n\t\t\t\t}\n\t\t\t}\n\t\t} else {\n\t\t\tmessage = fmt.Sprintf(\"stalled, notify_repeat_step_not_matched(%d < %d + %d * 60)\", event.LastEvalTime, fired.LastSentTime, cachedRule.NotifyRepeatStep)\n\t\t}\n\t} else {\n\t\tevent.NotifyCurNumber = 1\n\t\tevent.FirstTriggerTime = event.TriggerTime\n\t\tmessage = fmt.Sprintf(\"fired, first_trigger_time: %d\", event.FirstTriggerTime)\n\t\tp.HandleFireEventHook(event)\n\t\tp.pushEventToQueue(event)\n\t}\n}\n\nfunc (p *Processor) pushEventToQueue(e *models.AlertCurEvent) {\n\tif !e.IsRecovered {\n\t\te.LastSentTime = e.LastEvalTime\n\t\tp.fires.Set(e.Hash, e)\n\t}\n\n\tdispatch.LogEvent(e, \"push_queue\")\n\tif !queue.EventQueue.PushFront(e) {\n\t\tlogger.Warningf(\"alert_eval_%d datasource_%d event_push_queue: queue is full, event:%s\", p.rule.Id, p.datasourceId, e.Hash)\n\t\tp.Stats.CounterRuleEvalErrorTotal.WithLabelValues(fmt.Sprintf(\"%v\", p.DatasourceId()), \"push_event_queue\", p.BusiGroupCache.GetNameByBusiGroupId(p.rule.GroupId), fmt.Sprintf(\"%v\", p.rule.Id)).Inc()\n\t}\n}\n\nfunc (p *Processor) RecoverAlertCurEventFromDb() {\n\tp.pendings = NewAlertCurEventMap(nil)\n\tp.pendingsUseByRecover = NewAlertCurEventMap(nil)\n\n\tcurEvents, err := models.AlertCurEventGetByRuleIdAndDsId(p.ctx, p.rule.Id, p.datasourceId)\n\tif err != nil {\n\t\tlogger.Errorf(\"alert_eval_%d datasource_%d recover event from db failed, err:%s\", p.rule.Id, p.datasourceId, err)\n\t\tp.Stats.CounterRuleEvalErrorTotal.WithLabelValues(fmt.Sprintf(\"%v\", p.DatasourceId()), \"get_recover_event\", p.BusiGroupCache.GetNameByBusiGroupId(p.rule.GroupId), fmt.Sprintf(\"%v\", p.rule.Id)).Inc()\n\t\tp.fires = NewAlertCurEventMap(nil)\n\t\treturn\n\t}\n\n\tfireMap := make(map[string]*models.AlertCurEvent)\n\tpendingsUseByRecoverMap := make(map[string]*models.AlertCurEvent)\n\tfor _, event := range curEvents {\n\t\talertRule := p.alertRuleCache.Get(event.RuleId)\n\t\tif alertRule == nil {\n\t\t\tcontinue\n\t\t}\n\t\tevent.NotifyRuleIds = alertRule.NotifyRuleIds\n\n\t\tif event.Cate == models.HOST {\n\t\t\ttarget, exists := p.TargetCache.Get(event.TargetIdent)\n\t\t\tif exists && target.EngineName != p.EngineName && !(p.ctx.IsCenter && target.EngineName == \"\") {\n\t\t\t\t// 如果是 host rule,且 target 的 engineName 不是当前的 engineName 或者是中心机房 target EngineName 为空,就跳过\n\t\t\t\tcontinue\n\t\t\t}\n\t\t}\n\n\t\tevent.DB2Mem()\n\t\ttarget, exists := p.TargetCache.Get(event.TargetIdent)\n\t\tif exists {\n\t\t\ttarget.GroupNames = p.BusiGroupCache.GetNamesByBusiGroupIds(target.GroupIds)\n\t\t\tevent.Target = target\n\t\t}\n\n\t\tfireMap[event.Hash] = event\n\t\te := *event\n\t\tpendingsUseByRecoverMap[event.Hash] = &e\n\t}\n\n\tp.fires = NewAlertCurEventMap(fireMap)\n\n\t// 修改告警规则,或者进程重启之后,需要重新加载 pendingsUseByRecover\n\tp.pendingsUseByRecover = NewAlertCurEventMap(pendingsUseByRecoverMap)\n}\n\nfunc (p *Processor) fillTags(anomalyPoint models.AnomalyPoint) {\n\t// handle series tags\n\ttagsMap := make(map[string]string)\n\tfor label, value := range anomalyPoint.Labels {\n\t\ttagsMap[string(label)] = string(value)\n\t}\n\n\tvar e = &models.AlertCurEvent{\n\t\tTagsMap: tagsMap,\n\t}\n\n\t// handle rule tags\n\ttags := p.rule.AppendTagsJSON\n\ttags = append(tags, \"rulename=\"+p.rule.Name)\n\tfor _, tag := range tags {\n\t\tarr := strings.SplitN(tag, \"=\", 2)\n\n\t\tvar defs = []string{\n\t\t\t\"{{$labels := .TagsMap}}\",\n\t\t\t\"{{$value := .TriggerValue}}\",\n\t\t}\n\t\ttagValue := arr[1]\n\t\ttext := strings.Join(append(defs, tagValue), \"\")\n\t\tt, err := template.New(fmt.Sprint(p.rule.Id)).Funcs(template.FuncMap(tplx.TemplateFuncMap)).Parse(text)\n\t\tif err != nil {\n\t\t\ttagValue = fmt.Sprintf(\"parse tag value failed, err:%s\", err)\n\t\t\ttagsMap[arr[0]] = tagValue\n\t\t\tcontinue\n\t\t}\n\n\t\tvar body bytes.Buffer\n\t\terr = t.Execute(&body, e)\n\t\tif err != nil {\n\t\t\ttagValue = fmt.Sprintf(\"parse tag value failed, err:%s\", err)\n\t\t\ttagsMap[arr[0]] = tagValue\n\t\t\tcontinue\n\t\t}\n\n\t\ttagsMap[arr[0]] = body.String()\n\t}\n\tp.tagsMap = tagsMap\n\n\t// handle tagsArr\n\tp.tagsArr = labelMapToArr(tagsMap)\n}\n\nfunc (p *Processor) mayHandleIdent(event *models.AlertCurEvent) {\n\t// handle ident\n\tif ident, has := event.TagsMap[\"ident\"]; has {\n\t\tif target, exists := p.TargetCache.Get(ident); exists {\n\t\t\tevent.TargetIdent = target.Ident\n\t\t\tevent.TargetNote = target.Note\n\t\t} else {\n\t\t\tevent.TargetIdent = ident\n\t\t\tevent.TargetNote = \"\"\n\t\t}\n\t} else {\n\t\tevent.TargetIdent = \"\"\n\t\tevent.TargetNote = \"\"\n\t}\n}\n\nfunc (p *Processor) mayHandleGroup() {\n\t// handle bg\n\tbg := p.BusiGroupCache.GetByBusiGroupId(p.rule.GroupId)\n\tif bg != nil {\n\t\tp.groupName = bg.Name\n\t}\n}\n\nfunc (p *Processor) DeleteProcessEvent(hash string) {\n\tp.fires.Delete(hash)\n\tp.pendings.Delete(hash)\n\tp.pendingsUseByRecover.Delete(hash)\n}\n\nfunc labelMapToArr(m map[string]string) []string {\n\tnumLabels := len(m)\n\n\tlabelStrings := make([]string, 0, numLabels)\n\tfor label, value := range m {\n\t\tlabelStrings = append(labelStrings, fmt.Sprintf(\"%s=%s\", label, value))\n\t}\n\n\tif numLabels > 1 {\n\t\tsort.Strings(labelStrings)\n\t}\n\treturn labelStrings\n}\n\nfunc Hash(ruleId, datasourceId int64, vector models.AnomalyPoint) string {\n\treturn str.MD5(fmt.Sprintf(\"%d_%s_%d_%d_%s\", ruleId, vector.Labels.String(), datasourceId, vector.Severity, vector.Query))\n}\n\nfunc TagHash(vector models.AnomalyPoint) string {\n\treturn str.MD5(vector.Labels.String())\n}\n"
},
{
"path": "alert/queue/queue.go",
"content": "package queue\n\nimport (\n\t\"time\"\n\n\t\"github.com/ccfos/nightingale/v6/alert/astats\"\n\t\"github.com/toolkits/pkg/container/list\"\n)\n\nvar EventQueue = list.NewSafeListLimited(10000000)\n\nfunc ReportQueueSize(stats *astats.Stats) {\n\tfor {\n\t\ttime.Sleep(time.Second)\n\n\t\tstats.GaugeAlertQueueSize.Set(float64(EventQueue.Len()))\n\t}\n}\n"
},
{
"path": "alert/record/prom_rule.go",
"content": "package record\n\nimport (\n\t\"context\"\n\t\"fmt\"\n\t\"strings\"\n\t\"time\"\n\n\t\"github.com/ccfos/nightingale/v6/alert/astats\"\n\t\"github.com/ccfos/nightingale/v6/models\"\n\t\"github.com/ccfos/nightingale/v6/prom\"\n\t\"github.com/ccfos/nightingale/v6/pushgw/writer\"\n\t\"github.com/robfig/cron/v3\"\n\n\t\"github.com/toolkits/pkg/logger\"\n\t\"github.com/toolkits/pkg/str\"\n)\n\ntype RecordRuleContext struct {\n\tdatasourceId int64\n\tquit chan struct{}\n\n\tscheduler *cron.Cron\n\trule *models.RecordingRule\n\tpromClients *prom.PromClientMap\n\tstats *astats.Stats\n}\n\nfunc NewRecordRuleContext(rule *models.RecordingRule, datasourceId int64, promClients *prom.PromClientMap, writers *writer.WritersType, stats *astats.Stats) *RecordRuleContext {\n\trrc := &RecordRuleContext{\n\t\tdatasourceId: datasourceId,\n\t\tquit: make(chan struct{}),\n\t\trule: rule,\n\t\tpromClients: promClients,\n\t\tstats: stats,\n\t}\n\n\tif rule.CronPattern == \"\" && rule.PromEvalInterval != 0 {\n\t\trule.CronPattern = fmt.Sprintf(\"@every %ds\", rule.PromEvalInterval)\n\t}\n\n\trrc.scheduler = cron.New(cron.WithSeconds(), cron.WithChain(cron.SkipIfStillRunning(cron.DefaultLogger)))\n\t_, err := rrc.scheduler.AddFunc(rule.CronPattern, func() {\n\t\trrc.Eval()\n\t})\n\n\tif err != nil {\n\t\tlogger.Errorf(\"add cron pattern error: %v\", err)\n\t}\n\n\treturn rrc\n}\n\nfunc (rrc *RecordRuleContext) Key() string {\n\treturn fmt.Sprintf(\"record-%d-%d\", rrc.datasourceId, rrc.rule.Id)\n}\n\nfunc (rrc *RecordRuleContext) Hash() string {\n\treturn str.MD5(fmt.Sprintf(\"%d_%s_%s_%d_%s_%s\",\n\t\trrc.rule.Id,\n\t\trrc.rule.CronPattern,\n\t\trrc.rule.PromQl,\n\t\trrc.datasourceId,\n\t\trrc.rule.AppendTags,\n\t\trrc.rule.Name,\n\t))\n}\n\nfunc (rrc *RecordRuleContext) Prepare() {}\n\nfunc (rrc *RecordRuleContext) Start() {\n\tlogger.Infof(\"eval:%s started\", rrc.Key())\n\trrc.scheduler.Start()\n}\n\nfunc (rrc *RecordRuleContext) Eval() {\n\trrc.stats.CounterRecordEval.WithLabelValues(fmt.Sprintf(\"%d\", rrc.datasourceId)).Inc()\n\tpromql := strings.TrimSpace(rrc.rule.PromQl)\n\tif promql == \"\" {\n\t\tlogger.Errorf(\"eval:%s promql is blank\", rrc.Key())\n\t\treturn\n\t}\n\n\tif rrc.promClients.IsNil(rrc.datasourceId) {\n\t\tlogger.Errorf(\"eval:%s reader client is nil\", rrc.Key())\n\t\trrc.stats.CounterRecordEvalErrorTotal.WithLabelValues(fmt.Sprintf(\"%d\", rrc.datasourceId)).Inc()\n\t\treturn\n\t}\n\n\tvalue, warnings, err := rrc.promClients.GetCli(rrc.datasourceId).Query(context.Background(), promql, time.Now())\n\tif err != nil {\n\t\tlogger.Errorf(\"eval:%s promql:%s, error:%v\", rrc.Key(), promql, err)\n\t\trrc.stats.CounterRecordEvalErrorTotal.WithLabelValues(fmt.Sprintf(\"%d\", rrc.datasourceId)).Inc()\n\t\treturn\n\t}\n\n\tif len(warnings) > 0 {\n\t\tlogger.Errorf(\"eval:%s promql:%s, warnings:%v\", rrc.Key(), promql, warnings)\n\t\trrc.stats.CounterRecordEvalErrorTotal.WithLabelValues(fmt.Sprintf(\"%d\", rrc.datasourceId)).Inc()\n\t\treturn\n\t}\n\n\tts := ConvertToTimeSeries(value, rrc.rule)\n\tif len(ts) != 0 {\n\t\terr := rrc.promClients.GetWriterCli(rrc.datasourceId).Write(ts)\n\t\tif err != nil {\n\t\t\tlogger.Errorf(\"eval:%s promql:%s, error:%v\", rrc.Key(), promql, err)\n\t\t\trrc.stats.CounterRecordEvalErrorTotal.WithLabelValues(fmt.Sprintf(\"%d\", rrc.datasourceId)).Inc()\n\t\t}\n\t}\n}\n\nfunc (rrc *RecordRuleContext) Stop() {\n\tlogger.Infof(\"%s stopped\", rrc.Key())\n\n\tc := rrc.scheduler.Stop()\n\t<-c.Done()\n\tclose(rrc.quit)\n}\n"
},
{
"path": "alert/record/sample.go",
"content": "package record\n\nimport (\n\t\"math\"\n\t\"strings\"\n\t\"time\"\n\n\t\"github.com/ccfos/nightingale/v6/models\"\n\n\t\"github.com/prometheus/common/model\"\n\t\"github.com/prometheus/prometheus/prompb\"\n)\n\nconst (\n\tLabelName = \"__name__\"\n)\n\nfunc ConvertToTimeSeries(value model.Value, rule *models.RecordingRule) (lst []prompb.TimeSeries) {\n\tswitch value.Type() {\n\tcase model.ValVector:\n\t\titems, ok := value.(model.Vector)\n\t\tif !ok {\n\t\t\treturn\n\t\t}\n\n\t\tfor _, item := range items {\n\t\t\tif math.IsNaN(float64(item.Value)) {\n\t\t\t\tcontinue\n\t\t\t}\n\t\t\ts := prompb.Sample{}\n\t\t\ts.Timestamp = time.Unix(item.Timestamp.Unix(), 0).UnixNano() / 1e6\n\t\t\ts.Value = float64(item.Value)\n\t\t\tl := labelsToLabelsProto(item.Metric, rule)\n\t\t\tlst = append(lst, prompb.TimeSeries{\n\t\t\t\tLabels: l,\n\t\t\t\tSamples: []prompb.Sample{s},\n\t\t\t})\n\t\t}\n\tcase model.ValMatrix:\n\t\titems, ok := value.(model.Matrix)\n\t\tif !ok {\n\t\t\treturn\n\t\t}\n\n\t\tfor _, item := range items {\n\t\t\tif len(item.Values) == 0 {\n\t\t\t\treturn\n\t\t\t}\n\n\t\t\tlast := item.Values[len(item.Values)-1]\n\n\t\t\tif math.IsNaN(float64(last.Value)) {\n\t\t\t\tcontinue\n\t\t\t}\n\t\t\tl := labelsToLabelsProto(item.Metric, rule)\n\t\t\tvar slst []prompb.Sample\n\t\t\tfor _, v := range item.Values {\n\t\t\t\tif math.IsNaN(float64(v.Value)) {\n\t\t\t\t\tcontinue\n\t\t\t\t}\n\t\t\t\tslst = append(slst, prompb.Sample{\n\t\t\t\t\tTimestamp: time.Unix(v.Timestamp.Unix(), 0).UnixNano() / 1e6,\n\t\t\t\t\tValue: float64(v.Value),\n\t\t\t\t})\n\t\t\t}\n\t\t\tlst = append(lst, prompb.TimeSeries{\n\t\t\t\tLabels: l,\n\t\t\t\tSamples: slst,\n\t\t\t})\n\t\t}\n\tcase model.ValScalar:\n\t\titem, ok := value.(*model.Scalar)\n\t\tif !ok {\n\t\t\treturn\n\t\t}\n\n\t\tif math.IsNaN(float64(item.Value)) {\n\t\t\treturn\n\t\t}\n\n\t\tlst = append(lst, prompb.TimeSeries{\n\t\t\tLabels: nil,\n\t\t\tSamples: []prompb.Sample{{Value: float64(item.Value), Timestamp: time.Unix(item.Timestamp.Unix(), 0).UnixNano() / 1e6}},\n\t\t})\n\tdefault:\n\t\treturn\n\t}\n\n\treturn\n}\n\nfunc labelsToLabelsProto(labels model.Metric, rule *models.RecordingRule) (result []prompb.Label) {\n\t//name\n\tnameLs := prompb.Label{\n\t\tName: LabelName,\n\t\tValue: rule.Name,\n\t}\n\tresult = append(result, nameLs)\n\tfor k, v := range labels {\n\t\tif k == LabelName {\n\t\t\tcontinue\n\t\t}\n\t\tif model.LabelNameRE.MatchString(string(k)) {\n\t\t\tresult = append(result, prompb.Label{\n\t\t\t\tName: string(k),\n\t\t\t\tValue: string(v),\n\t\t\t})\n\t\t}\n\t}\n\tif len(rule.AppendTagsJSON) != 0 {\n\t\tfor _, v := range rule.AppendTagsJSON {\n\t\t\tindex := strings.Index(v, \"=\")\n\t\t\tif model.LabelNameRE.MatchString(v[:index]) {\n\t\t\t\tresult = append(result, prompb.Label{\n\t\t\t\t\tName: v[:index],\n\t\t\t\t\tValue: v[index+1:],\n\t\t\t\t})\n\t\t\t}\n\t\t}\n\t}\n\treturn result\n}\n"
},
{
"path": "alert/record/scheduler.go",
"content": "package record\n\nimport (\n\t\"context\"\n\t\"fmt\"\n\t\"strconv\"\n\t\"time\"\n\n\t\"github.com/ccfos/nightingale/v6/alert/aconf\"\n\t\"github.com/ccfos/nightingale/v6/alert/astats\"\n\t\"github.com/ccfos/nightingale/v6/alert/naming\"\n\t\"github.com/ccfos/nightingale/v6/memsto\"\n\t\"github.com/ccfos/nightingale/v6/prom\"\n\t\"github.com/ccfos/nightingale/v6/pushgw/writer\"\n)\n\ntype Scheduler struct {\n\t// key: hash\n\trecordRules map[string]*RecordRuleContext\n\n\taconf aconf.Alert\n\n\trecordingRuleCache *memsto.RecordingRuleCacheType\n\n\tpromClients *prom.PromClientMap\n\twriters *writer.WritersType\n\n\tstats *astats.Stats\n\n\tdatasourceCache *memsto.DatasourceCacheType\n}\n\nfunc NewScheduler(aconf aconf.Alert, rrc *memsto.RecordingRuleCacheType, promClients *prom.PromClientMap, writers *writer.WritersType, stats *astats.Stats, datasourceCache *memsto.DatasourceCacheType) *Scheduler {\n\tscheduler := &Scheduler{\n\t\taconf: aconf,\n\t\trecordRules: make(map[string]*RecordRuleContext),\n\n\t\trecordingRuleCache: rrc,\n\n\t\tpromClients: promClients,\n\t\twriters: writers,\n\n\t\tstats: stats,\n\n\t\tdatasourceCache: datasourceCache,\n\t}\n\n\tgo scheduler.LoopSyncRules(context.Background())\n\treturn scheduler\n}\n\nfunc (s *Scheduler) LoopSyncRules(ctx context.Context) {\n\ttime.Sleep(time.Duration(s.aconf.EngineDelay) * time.Second)\n\tduration := 9000 * time.Millisecond\n\tfor {\n\t\tselect {\n\t\tcase <-ctx.Done():\n\t\t\treturn\n\t\tcase <-time.After(duration):\n\t\t\ts.syncRecordRules()\n\t\t}\n\t}\n}\n\nfunc (s *Scheduler) syncRecordRules() {\n\tids := s.recordingRuleCache.GetRuleIds()\n\trecordRules := make(map[string]*RecordRuleContext)\n\tfor _, id := range ids {\n\t\trule := s.recordingRuleCache.Get(id)\n\t\tif rule == nil {\n\t\t\tcontinue\n\t\t}\n\n\t\tdatasourceIds := s.datasourceCache.GetIDsByDsCateAndQueries(\"prometheus\", rule.DatasourceQueries)\n\t\tfor _, dsId := range datasourceIds {\n\t\t\tif !naming.DatasourceHashRing.IsHit(strconv.FormatInt(dsId, 10), fmt.Sprintf(\"%d\", rule.Id), s.aconf.Heartbeat.Endpoint) {\n\t\t\t\tcontinue\n\t\t\t}\n\n\t\t\trecordRule := NewRecordRuleContext(rule, dsId, s.promClients, s.writers, s.stats)\n\t\t\trecordRules[recordRule.Hash()] = recordRule\n\t\t}\n\t}\n\n\tfor hash, rule := range recordRules {\n\t\tif _, has := s.recordRules[hash]; !has {\n\t\t\trule.Prepare()\n\t\t\trule.Start()\n\t\t\ts.recordRules[hash] = rule\n\t\t}\n\t}\n\n\tfor hash, rule := range s.recordRules {\n\t\tif _, has := recordRules[hash]; !has {\n\t\t\trule.Stop()\n\t\t\tdelete(s.recordRules, hash)\n\t\t}\n\t}\n}\n"
},
{
"path": "alert/router/router.go",
"content": "package router\n\nimport (\n\t\"net/http\"\n\n\t\"github.com/ccfos/nightingale/v6/alert/aconf\"\n\t\"github.com/ccfos/nightingale/v6/alert/astats\"\n\t\"github.com/ccfos/nightingale/v6/alert/process\"\n\t\"github.com/ccfos/nightingale/v6/memsto\"\n\t\"github.com/ccfos/nightingale/v6/pkg/ctx\"\n\t\"github.com/ccfos/nightingale/v6/pkg/httpx\"\n\n\t\"github.com/gin-gonic/gin\"\n)\n\ntype Router struct {\n\tHTTP httpx.Config\n\tAlert aconf.Alert\n\tAlertMuteCache *memsto.AlertMuteCacheType\n\tTargetCache *memsto.TargetCacheType\n\tBusiGroupCache *memsto.BusiGroupCacheType\n\tAlertStats *astats.Stats\n\tCtx *ctx.Context\n\tExternalProcessors *process.ExternalProcessorsType\n\tLogDir string\n}\n\nfunc New(httpConfig httpx.Config, alert aconf.Alert, amc *memsto.AlertMuteCacheType, tc *memsto.TargetCacheType, bgc *memsto.BusiGroupCacheType,\n\tastats *astats.Stats, ctx *ctx.Context, externalProcessors *process.ExternalProcessorsType, logDir string) *Router {\n\treturn &Router{\n\t\tHTTP: httpConfig,\n\t\tAlert: alert,\n\t\tAlertMuteCache: amc,\n\t\tTargetCache: tc,\n\t\tBusiGroupCache: bgc,\n\t\tAlertStats: astats,\n\t\tCtx: ctx,\n\t\tExternalProcessors: externalProcessors,\n\t\tLogDir: logDir,\n\t}\n}\n\nfunc (rt *Router) Config(r *gin.Engine) {\n\tif !rt.HTTP.APIForService.Enable {\n\t\treturn\n\t}\n\n\tservice := r.Group(\"/v1/n9e\")\n\tif len(rt.HTTP.APIForService.BasicAuth) > 0 {\n\t\tservice.Use(gin.BasicAuth(rt.HTTP.APIForService.BasicAuth))\n\t}\n\tservice.POST(\"/event\", rt.pushEventToQueue)\n\tservice.POST(\"/event-persist\", rt.eventPersist)\n\tservice.POST(\"/make-event\", rt.makeEvent)\n\tservice.GET(\"/event-detail/:hash\", rt.eventDetail)\n\tservice.GET(\"/alert-eval-detail/:id\", rt.alertEvalDetail)\n\tservice.GET(\"/trace-logs/:traceid\", rt.traceLogs)\n}\n\nfunc Render(c *gin.Context, data, msg interface{}) {\n\tif msg == nil {\n\t\tif data == nil {\n\t\t\tdata = struct{}{}\n\t\t}\n\t\tc.JSON(http.StatusOK, gin.H{\"data\": data, \"error\": \"\"})\n\t} else {\n\t\tc.JSON(http.StatusOK, gin.H{\"error\": gin.H{\"message\": msg}})\n\t}\n}\n\nfunc Dangerous(c *gin.Context, v interface{}, code ...int) {\n\tif v == nil {\n\t\treturn\n\t}\n\n\tswitch t := v.(type) {\n\tcase string:\n\t\tif t != \"\" {\n\t\t\tc.JSON(http.StatusOK, gin.H{\"error\": gin.H{\"message\": v}})\n\t\t}\n\tcase error:\n\t\tc.JSON(http.StatusOK, gin.H{\"error\": gin.H{\"message\": t.Error()}})\n\t}\n}\n"
},
{
"path": "alert/router/router_alert_eval_detail.go",
"content": "package router\n\nimport (\n\t\"fmt\"\n\n\t\"github.com/ccfos/nightingale/v6/pkg/loggrep\"\n\t\"github.com/ccfos/nightingale/v6/pkg/ginx\"\n\n\t\"github.com/gin-gonic/gin\"\n)\n\nfunc (rt *Router) alertEvalDetail(c *gin.Context) {\n\tid := ginx.UrlParamStr(c, \"id\")\n\tif !loggrep.IsValidRuleID(id) {\n\t\tginx.Bomb(200, \"invalid rule id format\")\n\t}\n\n\tinstance := fmt.Sprintf(\"%s:%d\", rt.Alert.Heartbeat.IP, rt.HTTP.Port)\n\n\tkeyword := fmt.Sprintf(\"alert_eval_%s\", id)\n\tlogs, err := loggrep.GrepLogDir(rt.LogDir, keyword)\n\tginx.Dangerous(err)\n\n\tginx.NewRender(c).Data(loggrep.EventDetailResp{\n\t\tLogs: logs,\n\t\tInstance: instance,\n\t}, nil)\n}\n"
},
{
"path": "alert/router/router_event.go",
"content": "package router\n\nimport (\n\t\"fmt\"\n\t\"strconv\"\n\t\"strings\"\n\t\"time\"\n\n\t\"github.com/ccfos/nightingale/v6/alert/dispatch\"\n\t\"github.com/ccfos/nightingale/v6/alert/mute\"\n\t\"github.com/ccfos/nightingale/v6/alert/naming\"\n\t\"github.com/ccfos/nightingale/v6/alert/process\"\n\t\"github.com/ccfos/nightingale/v6/alert/queue\"\n\t\"github.com/ccfos/nightingale/v6/models\"\n\t\"github.com/ccfos/nightingale/v6/pkg/poster\"\n\t\"github.com/ccfos/nightingale/v6/pkg/ginx\"\n\n\t\"github.com/gin-gonic/gin\"\n\t\"github.com/toolkits/pkg/logger\"\n)\n\nfunc (rt *Router) pushEventToQueue(c *gin.Context) {\n\tvar event *models.AlertCurEvent\n\tginx.BindJSON(c, &event)\n\tif event.RuleId == 0 {\n\t\tginx.Bomb(200, \"event is illegal\")\n\t}\n\tevent.FE2DB()\n\n\tevent.TagsMap = make(map[string]string)\n\tfor i := 0; i < len(event.TagsJSON); i++ {\n\t\tpair := strings.TrimSpace(event.TagsJSON[i])\n\t\tif pair == \"\" {\n\t\t\tcontinue\n\t\t}\n\n\t\tarr := strings.SplitN(pair, \"=\", 2)\n\t\tif len(arr) != 2 {\n\t\t\tcontinue\n\t\t}\n\n\t\tevent.TagsMap[arr[0]] = arr[1]\n\t}\n\thit, _ := mute.EventMuteStrategy(event, rt.AlertMuteCache)\n\tif hit {\n\t\tlogger.Infof(\"event_muted: rule_id=%d %s\", event.RuleId, event.Hash)\n\t\tginx.NewRender(c).Message(nil)\n\t\treturn\n\t}\n\n\tif err := event.ParseRule(\"rule_name\"); err != nil {\n\t\tevent.RuleName = fmt.Sprintf(\"failed to parse rule name: %v\", err)\n\t}\n\n\tif err := event.ParseRule(\"rule_note\"); err != nil {\n\t\tevent.RuleNote = fmt.Sprintf(\"failed to parse rule note: %v\", err)\n\t}\n\n\tif err := event.ParseRule(\"annotations\"); err != nil {\n\t\tevent.RuleNote = fmt.Sprintf(\"failed to parse rule note: %v\", err)\n\t}\n\n\t// 如果 rule_note 中有 ; 前缀,则使用 rule_note 替换 tags 中的内容\n\tif strings.HasPrefix(event.RuleNote, \";\") {\n\t\tevent.RuleNote = strings.TrimPrefix(event.RuleNote, \";\")\n\t\tevent.Tags = strings.ReplaceAll(event.RuleNote, \" \", \",,\")\n\t\tevent.TagsJSON = strings.Split(event.Tags, \",,\")\n\t} else {\n\t\tevent.Tags = strings.Join(event.TagsJSON, \",,\")\n\t}\n\n\tevent.Callbacks = strings.Join(event.CallbacksJSON, \" \")\n\tevent.NotifyChannels = strings.Join(event.NotifyChannelsJSON, \" \")\n\tevent.NotifyGroups = strings.Join(event.NotifyGroupsJSON, \" \")\n\n\tdispatch.LogEvent(event, \"http_push_queue\")\n\tif !queue.EventQueue.PushFront(event) {\n\t\tmsg := fmt.Sprintf(\"event:%s push_queue err: queue is full\", event.Hash)\n\t\tginx.Bomb(200, msg)\n\t\tlogger.Warningf(msg)\n\t}\n\tginx.NewRender(c).Message(nil)\n}\n\nfunc (rt *Router) eventPersist(c *gin.Context) {\n\tvar event *models.AlertCurEvent\n\tginx.BindJSON(c, &event)\n\tevent.FE2DB()\n\terr := models.EventPersist(rt.Ctx, event)\n\tginx.NewRender(c).Data(event.Id, err)\n}\n\ntype eventForm struct {\n\tAlert bool `json:\"alert\"`\n\tAnomalyPoints []models.AnomalyPoint `json:\"vectors\"`\n\tRuleId int64 `json:\"rule_id\"`\n\tDatasourceId int64 `json:\"datasource_id\"`\n\tInhibit bool `json:\"inhibit\"`\n}\n\nfunc (rt *Router) makeEvent(c *gin.Context) {\n\tvar events []*eventForm\n\tginx.BindJSON(c, &events)\n\t//now := time.Now().Unix()\n\tfor i := 0; i < len(events); i++ {\n\t\tnode, err := naming.DatasourceHashRing.GetNode(strconv.FormatInt(events[i].DatasourceId, 10), fmt.Sprintf(\"%d\", events[i].RuleId))\n\t\tif err != nil {\n\t\t\tlogger.Warningf(\"event(rule_id=%d ds_id=%d) get node err:%v\", events[i].RuleId, events[i].DatasourceId, err)\n\t\t\tginx.Bomb(200, \"event node not exists\")\n\t\t}\n\n\t\tif node != rt.Alert.Heartbeat.Endpoint {\n\t\t\terr := forwardEvent(events[i], node)\n\t\t\tif err != nil {\n\t\t\t\tlogger.Warningf(\"event(rule_id=%d ds_id=%d) forward err:%v\", events[i].RuleId, events[i].DatasourceId, err)\n\t\t\t\tginx.Bomb(200, \"event forward error\")\n\t\t\t}\n\t\t\tcontinue\n\t\t}\n\n\t\truleWorker, exists := rt.ExternalProcessors.GetExternalAlertRule(events[i].DatasourceId, events[i].RuleId)\n\t\tlogger.Debugf(\"handle event(rule_id=%d ds_id=%d) exists:%v\", events[i].RuleId, events[i].DatasourceId, exists)\n\t\tif !exists {\n\t\t\tginx.Bomb(200, \"rule not exists\")\n\t\t}\n\n\t\tif events[i].Alert {\n\t\t\tgo ruleWorker.Handle(events[i].AnomalyPoints, \"http\", events[i].Inhibit)\n\t\t} else {\n\t\t\tfor _, vector := range events[i].AnomalyPoints {\n\t\t\t\treadableString := vector.ReadableValue()\n\t\t\t\tgo ruleWorker.RecoverSingle(false, process.Hash(events[i].RuleId, events[i].DatasourceId, vector), vector.Timestamp, &readableString)\n\t\t\t}\n\t\t}\n\t}\n\tginx.NewRender(c).Message(nil)\n}\n\n// event 不归本实例处理,转发给对应的实例\nfunc forwardEvent(event *eventForm, instance string) error {\n\tur := fmt.Sprintf(\"http://%s/v1/n9e/make-event\", instance)\n\tres, code, err := poster.PostJSON(ur, time.Second*5, []*eventForm{event}, 3)\n\tif err != nil {\n\t\treturn err\n\t}\n\tlogger.Infof(\"forward event: result=succ url=%s code=%d rule_id=%d response=%s\", ur, code, event.RuleId, string(res))\n\treturn nil\n}\n"
},
{
"path": "alert/router/router_event_detail.go",
"content": "package router\n\nimport (\n\t\"fmt\"\n\n\t\"github.com/ccfos/nightingale/v6/pkg/loggrep\"\n\t\"github.com/ccfos/nightingale/v6/pkg/ginx\"\n\n\t\"github.com/gin-gonic/gin\"\n)\n\nfunc (rt *Router) eventDetail(c *gin.Context) {\n\thash := ginx.UrlParamStr(c, \"hash\")\n\tif !loggrep.IsValidHash(hash) {\n\t\tginx.Bomb(200, \"invalid hash format\")\n\t}\n\n\tinstance := fmt.Sprintf(\"%s:%d\", rt.Alert.Heartbeat.IP, rt.HTTP.Port)\n\n\tlogs, err := loggrep.GrepLogDir(rt.LogDir, hash)\n\tginx.Dangerous(err)\n\n\tginx.NewRender(c).Data(loggrep.EventDetailResp{\n\t\tLogs: logs,\n\t\tInstance: instance,\n\t}, nil)\n}\n"
},
{
"path": "alert/router/router_trace_logs.go",
"content": "package router\n\nimport (\n\t\"fmt\"\n\n\t\"github.com/ccfos/nightingale/v6/pkg/ginx\"\n\t\"github.com/ccfos/nightingale/v6/pkg/loggrep\"\n\n\t\"github.com/gin-gonic/gin\"\n)\n\nfunc (rt *Router) traceLogs(c *gin.Context) {\n\ttraceId := ginx.UrlParamStr(c, \"traceid\")\n\tif !loggrep.IsValidTraceID(traceId) {\n\t\tginx.Bomb(200, \"invalid trace id format\")\n\t}\n\n\tinstance := fmt.Sprintf(\"%s:%d\", rt.Alert.Heartbeat.IP, rt.HTTP.Port)\n\n\tkeyword := \"trace_id=\" + traceId\n\tlogs, err := loggrep.GrepLatestLogFiles(rt.LogDir, keyword)\n\tginx.Dangerous(err)\n\n\tginx.NewRender(c).Data(loggrep.EventDetailResp{\n\t\tLogs: logs,\n\t\tInstance: instance,\n\t}, nil)\n}\n"
},
{
"path": "alert/sender/callback.go",
"content": "package sender\n\nimport (\n\t\"fmt\"\n\t\"html/template\"\n\t\"net/url\"\n\t\"strings\"\n\t\"time\"\n\n\t\"github.com/ccfos/nightingale/v6/alert/astats\"\n\t\"github.com/ccfos/nightingale/v6/memsto\"\n\t\"github.com/ccfos/nightingale/v6/models\"\n\t\"github.com/ccfos/nightingale/v6/pkg/ctx\"\n\t\"github.com/ccfos/nightingale/v6/pkg/poster\"\n\n\t\"github.com/toolkits/pkg/logger\"\n)\n\ntype (\n\t// CallBacker 进行回调的接口\n\tCallBacker interface {\n\t\tCallBack(ctx CallBackContext)\n\t}\n\n\t// CallBackContext 回调时所需的上下文\n\tCallBackContext struct {\n\t\tCtx *ctx.Context\n\t\tCallBackURL string\n\t\tUsers []*models.User\n\t\tRule *models.AlertRule\n\t\tEvents []*models.AlertCurEvent\n\t\tStats *astats.Stats\n\t\tBatchSend bool\n\t}\n\n\tDefaultCallBacker struct{}\n)\n\nfunc BuildCallBackContext(ctx *ctx.Context, callBackURL string, rule *models.AlertRule, events []*models.AlertCurEvent,\n\tuids []int64, userCache *memsto.UserCacheType, batchSend bool, stats *astats.Stats) CallBackContext {\n\tusers := userCache.GetByUserIds(uids)\n\n\tnewCallBackUrl, _ := events[0].ParseURL(callBackURL)\n\treturn CallBackContext{\n\t\tCtx: ctx,\n\t\tCallBackURL: newCallBackUrl,\n\t\tRule: rule,\n\t\tEvents: events,\n\t\tUsers: users,\n\t\tBatchSend: batchSend,\n\t\tStats: stats,\n\t}\n}\n\nfunc ExtractAtsParams(rawURL string) []string {\n\tans := make([]string, 0, 1)\n\tparsedURL, err := url.Parse(rawURL)\n\tif err != nil {\n\t\tlogger.Errorf(\"ExtractAtsParams(url=%s), err: %v\", rawURL, err)\n\t\treturn ans\n\t}\n\n\tqueryParams := parsedURL.Query()\n\tatParam := queryParams.Get(\"ats\")\n\tif atParam == \"\" {\n\t\treturn ans\n\t}\n\n\t// Split the atParam by comma and return the result as a slice\n\treturn strings.Split(atParam, \",\")\n}\n\nfunc NewCallBacker(\n\tkey string,\n\ttargetCache *memsto.TargetCacheType,\n\tuserCache *memsto.UserCacheType,\n\ttaskTplCache *memsto.TaskTplCache,\n\ttpls map[string]*template.Template,\n) CallBacker {\n\n\tswitch key {\n\tcase models.IbexDomain: // Distribute to Ibex\n\t\treturn &IbexCallBacker{\n\t\t\ttargetCache: targetCache,\n\t\t\tuserCache: userCache,\n\t\t\ttaskTplCache: taskTplCache,\n\t\t}\n\tcase models.DefaultDomain: // default callback\n\t\treturn &DefaultCallBacker{}\n\tcase models.DingtalkDomain:\n\t\treturn &DingtalkSender{tpl: tpls[models.Dingtalk]}\n\tcase models.WecomDomain:\n\t\treturn &WecomSender{tpl: tpls[models.Wecom]}\n\tcase models.FeishuDomain:\n\t\treturn &FeishuSender{tpl: tpls[models.Feishu]}\n\tcase models.FeishuCardDomain:\n\t\treturn &FeishuCardSender{tpl: tpls[models.FeishuCard]}\n\t//case models.Mm:\n\t//\treturn &MmSender{tpl: tpls[models.Mm]}\n\tcase models.TelegramDomain:\n\t\treturn &TelegramSender{tpl: tpls[models.Telegram]}\n\tcase models.LarkDomain:\n\t\treturn &LarkSender{tpl: tpls[models.Lark]}\n\tcase models.LarkCardDomain:\n\t\treturn &LarkCardSender{tpl: tpls[models.LarkCard]}\n\t}\n\n\treturn nil\n}\n\nfunc (c *DefaultCallBacker) CallBack(ctx CallBackContext) {\n\tif len(ctx.CallBackURL) == 0 || len(ctx.Events) == 0 {\n\t\treturn\n\t}\n\n\tevent := ctx.Events[0]\n\n\tif ctx.BatchSend {\n\t\twebhookConf := &models.Webhook{\n\t\t\tType: models.RuleCallback,\n\t\t\tEnable: true,\n\t\t\tUrl: ctx.CallBackURL,\n\t\t\tTimeout: 5,\n\t\t\tRetryCount: 3,\n\t\t\tRetryInterval: 10,\n\t\t\tBatch: 1000,\n\t\t}\n\n\t\tPushCallbackEvent(ctx.Ctx, webhookConf, event, ctx.Stats)\n\t\treturn\n\t}\n\n\tdoSendAndRecord(ctx.Ctx, ctx.CallBackURL, ctx.CallBackURL, event, \"callback\", ctx.Stats, ctx.Events)\n}\n\nfunc doSendAndRecord(ctx *ctx.Context, url, token string, body interface{}, channel string,\n\tstats *astats.Stats, events []*models.AlertCurEvent) {\n\tres, err := doSend(url, body, channel, stats)\n\tNotifyRecord(ctx, events, 0, channel, token, res, err)\n}\n\nfunc NotifyRecord(ctx *ctx.Context, evts []*models.AlertCurEvent, notifyRuleID int64, channel, target, res string, err error) {\n\t// 一个通知可能对应多个 event,都需要记录\n\tnotis := make([]*models.NotificationRecord, 0, len(evts))\n\tfor _, evt := range evts {\n\t\tnoti := models.NewNotificationRecord(evt, notifyRuleID, channel, target)\n\t\tif err != nil {\n\t\t\tnoti.SetStatus(models.NotiStatusFailure)\n\t\t\tnoti.SetDetails(err.Error())\n\t\t} else if res != \"\" {\n\t\t\tnoti.SetDetails(string(res))\n\t\t}\n\t\tnotis = append(notis, noti)\n\t}\n\n\tif !ctx.IsCenter {\n\t\terr := poster.PostByUrls(ctx, \"/v1/n9e/notify-record\", notis)\n\t\tif err != nil {\n\t\t\tlogger.Errorf(\"add notis:%v failed, err: %v\", notis, err)\n\t\t}\n\t\treturn\n\t}\n\n\tPushNotifyRecords(notis)\n}\n\nfunc doSend(url string, body interface{}, channel string, stats *astats.Stats) (string, error) {\n\tstats.AlertNotifyTotal.WithLabelValues(channel).Inc()\n\n\tstart := time.Now()\n\tres, code, err := poster.PostJSON(url, time.Second*5, body, 3)\n\tres = []byte(fmt.Sprintf(\"duration: %d ms status_code:%d, response:%s\", time.Since(start).Milliseconds(), code, string(res)))\n\tif err != nil {\n\t\tlogger.Errorf(\"%s_sender: result=fail url=%s code=%d error=%v req:%v response=%s\", channel, url, code, err, body, string(res))\n\t\tstats.AlertNotifyErrorTotal.WithLabelValues(channel).Inc()\n\t\treturn string(res), err\n\t}\n\n\tlogger.Infof(\"%s_sender: result=succ url=%s code=%d req:%v response=%s\", channel, url, code, body, string(res))\n\treturn string(res), nil\n}\n\ntype TaskCreateReply struct {\n\tErr string `json:\"err\"`\n\tDat int64 `json:\"dat\"` // task.id\n}\n\nfunc PushCallbackEvent(ctx *ctx.Context, webhook *models.Webhook, event *models.AlertCurEvent, stats *astats.Stats) {\n\tCallbackEventQueueLock.RLock()\n\tqueue := CallbackEventQueue[webhook.Url]\n\tCallbackEventQueueLock.RUnlock()\n\n\tif queue == nil {\n\t\tqueue = &WebhookQueue{\n\t\t\teventQueue: NewSafeEventQueue(QueueMaxSize),\n\t\t\tcloseCh: make(chan struct{}),\n\t\t}\n\n\t\tCallbackEventQueueLock.Lock()\n\t\tCallbackEventQueue[webhook.Url] = queue\n\t\tCallbackEventQueueLock.Unlock()\n\n\t\tStartConsumer(ctx, queue, webhook.Batch, webhook, stats)\n\t}\n\n\tsucc := queue.eventQueue.Push(event)\n\tif !succ {\n\t\tlogger.Warningf(\"Write channel(%s) full, current channel size: %d event:%s\", webhook.Url, queue.eventQueue.Len(), event.Hash)\n\t}\n}\n"
},
{
"path": "alert/sender/dingtalk.go",
"content": "package sender\n\nimport (\n\t\"html/template\"\n\t\"strings\"\n\n\t\"github.com/ccfos/nightingale/v6/models\"\n)\n\ntype dingtalkMarkdown struct {\n\tTitle string `json:\"title\"`\n\tText string `json:\"text\"`\n}\n\ntype dingtalkAt struct {\n\tAtMobiles []string `json:\"atMobiles\"`\n\tIsAtAll bool `json:\"isAtAll\"`\n}\n\ntype dingtalk struct {\n\tMsgtype string `json:\"msgtype\"`\n\tMarkdown dingtalkMarkdown `json:\"markdown\"`\n\tAt dingtalkAt `json:\"at\"`\n}\n\nvar (\n\t_ CallBacker = (*DingtalkSender)(nil)\n)\n\ntype DingtalkSender struct {\n\ttpl *template.Template\n}\n\nfunc (ds *DingtalkSender) Send(ctx MessageContext) {\n\tif len(ctx.Users) == 0 || len(ctx.Events) == 0 {\n\t\treturn\n\t}\n\n\turls, ats, tokens := ds.extract(ctx.Users)\n\tif len(urls) == 0 {\n\t\treturn\n\t}\n\tmessage := BuildTplMessage(models.Dingtalk, ds.tpl, ctx.Events)\n\n\tfor i, url := range urls {\n\t\tvar body dingtalk\n\t\t// NoAt in url\n\t\tif strings.Contains(url, \"noat=1\") {\n\t\t\tbody = dingtalk{\n\t\t\t\tMsgtype: \"markdown\",\n\t\t\t\tMarkdown: dingtalkMarkdown{\n\t\t\t\t\tTitle: ctx.Events[0].RuleName,\n\t\t\t\t\tText: message,\n\t\t\t\t},\n\t\t\t}\n\t\t} else {\n\t\t\tbody = dingtalk{\n\t\t\t\tMsgtype: \"markdown\",\n\t\t\t\tMarkdown: dingtalkMarkdown{\n\t\t\t\t\tTitle: ctx.Events[0].RuleName,\n\t\t\t\t\tText: message + \"\\n\" + strings.Join(ats, \" \"),\n\t\t\t\t},\n\t\t\t\tAt: dingtalkAt{\n\t\t\t\t\tAtMobiles: ats,\n\t\t\t\t\tIsAtAll: false,\n\t\t\t\t},\n\t\t\t}\n\t\t}\n\n\t\tdoSendAndRecord(ctx.Ctx, url, tokens[i], body, models.Dingtalk, ctx.Stats, ctx.Events)\n\t}\n}\n\nfunc (ds *DingtalkSender) CallBack(ctx CallBackContext) {\n\tif len(ctx.Events) == 0 || len(ctx.CallBackURL) == 0 {\n\t\treturn\n\t}\n\n\tbody := dingtalk{\n\t\tMsgtype: \"markdown\",\n\t\tMarkdown: dingtalkMarkdown{\n\t\t\tTitle: ctx.Events[0].RuleName,\n\t\t},\n\t}\n\n\tats := ExtractAtsParams(ctx.CallBackURL)\n\tmessage := BuildTplMessage(models.Dingtalk, ds.tpl, ctx.Events)\n\n\tif len(ats) > 0 {\n\t\tbody.Markdown.Text = message + \"\\n@\" + strings.Join(ats, \"@\")\n\t\tbody.At = dingtalkAt{\n\t\t\tAtMobiles: ats,\n\t\t\tIsAtAll: false,\n\t\t}\n\t} else {\n\t\t// NoAt in url\n\t\tbody.Markdown.Text = message\n\t}\n\n\tdoSendAndRecord(ctx.Ctx, ctx.CallBackURL, ctx.CallBackURL, body, \"callback\", ctx.Stats, ctx.Events)\n}\n\n// extract urls and ats from Users\nfunc (ds *DingtalkSender) extract(users []*models.User) ([]string, []string, []string) {\n\turls := make([]string, 0, len(users))\n\tats := make([]string, 0, len(users))\n\ttokens := make([]string, 0, len(users))\n\n\tfor _, user := range users {\n\t\tif user.Phone != \"\" {\n\t\t\tats = append(ats, \"@\"+user.Phone)\n\t\t}\n\t\tif token, has := user.ExtractToken(models.Dingtalk); has {\n\t\t\turl := token\n\t\t\tif !strings.HasPrefix(token, \"https://\") && !strings.HasPrefix(token, \"http://\") {\n\t\t\t\turl = \"https://oapi.dingtalk.com/robot/send?access_token=\" + token\n\t\t\t}\n\t\t\turls = append(urls, url)\n\t\t\ttokens = append(tokens, token)\n\t\t}\n\t}\n\treturn urls, ats, tokens\n}\n"
},
{
"path": "alert/sender/email.go",
"content": "package sender\n\nimport (\n\t\"crypto/tls\"\n\t\"errors\"\n\t\"html/template\"\n\t\"time\"\n\n\t\"github.com/ccfos/nightingale/v6/alert/aconf\"\n\t\"github.com/ccfos/nightingale/v6/memsto\"\n\t\"github.com/ccfos/nightingale/v6/models\"\n\t\"github.com/ccfos/nightingale/v6/pkg/ctx\"\n\n\t\"github.com/toolkits/pkg/logger\"\n\n\t\"gopkg.in/gomail.v2\"\n)\n\nvar mailch chan *EmailContext\n\ntype EmailSender struct {\n\tsubjectTpl *template.Template\n\tcontentTpl *template.Template\n\tsmtp aconf.SMTPConfig\n}\n\ntype EmailContext struct {\n\tevents []*models.AlertCurEvent\n\tmail *gomail.Message\n}\n\nfunc (es *EmailSender) Send(ctx MessageContext) {\n\tif len(ctx.Users) == 0 || len(ctx.Events) == 0 {\n\t\treturn\n\t}\n\ttos := extract(ctx.Users)\n\tvar subject string\n\n\tif es.subjectTpl != nil {\n\t\tsubject = BuildTplMessage(models.Email, es.subjectTpl, []*models.AlertCurEvent{ctx.Events[0]})\n\t} else {\n\t\tsubject = ctx.Events[0].RuleName\n\t}\n\tcontent := BuildTplMessage(models.Email, es.contentTpl, ctx.Events)\n\tes.WriteEmail(subject, content, tos, ctx.Events)\n\n\tctx.Stats.AlertNotifyTotal.WithLabelValues(models.Email).Add(float64(len(tos)))\n}\n\nfunc extract(users []*models.User) []string {\n\ttos := make([]string, 0, len(users))\n\tfor _, u := range users {\n\t\tif u.Email != \"\" {\n\t\t\ttos = append(tos, u.Email)\n\t\t}\n\t}\n\treturn tos\n}\n\nfunc SendEmail(subject, content string, tos []string, stmp aconf.SMTPConfig) error {\n\tconf := stmp\n\n\td := gomail.NewDialer(conf.Host, conf.Port, conf.User, conf.Pass)\n\tif conf.InsecureSkipVerify {\n\t\td.TLSConfig = &tls.Config{InsecureSkipVerify: true}\n\t}\n\n\tm := gomail.NewMessage()\n\n\tm.SetHeader(\"From\", stmp.From)\n\tm.SetHeader(\"To\", tos...)\n\tm.SetHeader(\"Subject\", subject)\n\tm.SetBody(\"text/html\", content)\n\n\terr := d.DialAndSend(m)\n\tif err != nil {\n\t\treturn errors.New(\"email_sender: failed to send: \" + err.Error())\n\t}\n\treturn nil\n}\n\nfunc (es *EmailSender) WriteEmail(subject, content string, tos []string, events []*models.AlertCurEvent) {\n\tm := gomail.NewMessage()\n\n\tm.SetHeader(\"From\", es.smtp.From)\n\tm.SetHeader(\"To\", tos...)\n\tm.SetHeader(\"Subject\", subject)\n\tm.SetBody(\"text/html\", content)\n\n\tmailch <- &EmailContext{events, m}\n}\n\nfunc dialSmtp(d *gomail.Dialer) gomail.SendCloser {\n\tfor {\n\t\tselect {\n\t\tcase <-mailQuit:\n\t\t\t// Note that Sendcloser is not obtained below,\n\t\t\t// and the outgoing signal (with configuration changes) exits the current dial\n\t\t\treturn nil\n\t\tdefault:\n\t\t\tif s, err := d.Dial(); err != nil {\n\t\t\t\tlogger.Errorf(\"email_sender: failed to dial smtp: %s\", err)\n\t\t\t} else {\n\t\t\t\treturn s\n\t\t\t}\n\t\t\ttime.Sleep(time.Second)\n\t\t}\n\t}\n}\n\nvar mailQuit = make(chan struct{})\n\nfunc RestartEmailSender(ctx *ctx.Context, smtp aconf.SMTPConfig) {\n\t// Notify internal start exit\n\tmailQuit <- struct{}{}\n\tstartEmailSender(ctx, smtp)\n}\n\nvar smtpConfig aconf.SMTPConfig\n\nfunc InitEmailSender(ctx *ctx.Context, ncc *memsto.NotifyConfigCacheType) {\n\tmailch = make(chan *EmailContext, 100000)\n\tgo updateSmtp(ctx, ncc)\n\tsmtpConfig = ncc.GetSMTP()\n\tgo startEmailSender(ctx, smtpConfig)\n}\n\nfunc updateSmtp(ctx *ctx.Context, ncc *memsto.NotifyConfigCacheType) {\n\tfor {\n\t\ttime.Sleep(1 * time.Minute)\n\t\tsmtp := ncc.GetSMTP()\n\t\tif smtpConfig.Host != smtp.Host || smtpConfig.Batch != smtp.Batch || smtpConfig.From != smtp.From ||\n\t\t\tsmtpConfig.Pass != smtp.Pass || smtpConfig.User != smtp.User || smtpConfig.Port != smtp.Port ||\n\t\t\tsmtpConfig.InsecureSkipVerify != smtp.InsecureSkipVerify { //diff\n\t\t\tsmtpConfig = smtp\n\t\t\tRestartEmailSender(ctx, smtp)\n\t\t}\n\t}\n}\n\nfunc startEmailSender(ctx *ctx.Context, smtp aconf.SMTPConfig) {\n\tconf := smtp\n\tif conf.Host == \"\" || conf.Port == 0 {\n\t\tlogger.Debug(\"SMTP configurations invalid\")\n\t\t<-mailQuit\n\t\treturn\n\t}\n\tlogger.Infof(\"start email sender... conf.Host:%+v,conf.Port:%+v\", conf.Host, conf.Port)\n\n\td := gomail.NewDialer(conf.Host, conf.Port, conf.User, conf.Pass)\n\tif conf.InsecureSkipVerify {\n\t\td.TLSConfig = &tls.Config{InsecureSkipVerify: true}\n\t}\n\n\tvar s gomail.SendCloser\n\tvar open bool\n\tvar size int\n\tfor {\n\t\tselect {\n\t\tcase <-mailQuit:\n\t\t\treturn\n\t\tcase m, ok := <-mailch:\n\t\t\tif !ok {\n\t\t\t\treturn\n\t\t\t}\n\n\t\t\tif !open {\n\t\t\t\ts = dialSmtp(d)\n\t\t\t\tif s == nil {\n\t\t\t\t\t// Indicates that the dialing failed and exited the current goroutine directly,\n\t\t\t\t\t// but put the Message back in the mailch\n\t\t\t\t\tmailch <- m\n\t\t\t\t\treturn\n\t\t\t\t}\n\t\t\t\topen = true\n\t\t\t}\n\t\t\tvar err error\n\t\t\tif err = gomail.Send(s, m.mail); err != nil {\n\t\t\t\tlogger.Errorf(\"email_sender: failed to send: %s\", err)\n\n\t\t\t\t// close and retry\n\t\t\t\tif err := s.Close(); err != nil {\n\t\t\t\t\tlogger.Warningf(\"email_sender: failed to close smtp connection: %s\", err)\n\t\t\t\t}\n\n\t\t\t\ts = dialSmtp(d)\n\t\t\t\tif s == nil {\n\t\t\t\t\t// Indicates that the dialing failed and exited the current goroutine directly,\n\t\t\t\t\t// but put the Message back in the mailch\n\t\t\t\t\tmailch <- m\n\t\t\t\t\treturn\n\t\t\t\t}\n\t\t\t\topen = true\n\n\t\t\t\tif err = gomail.Send(s, m.mail); err != nil {\n\t\t\t\t\tlogger.Errorf(\"email_sender: failed to retry send: %s\", err)\n\t\t\t\t}\n\t\t\t} else {\n\t\t\t\tlogger.Infof(\"email_sender: result=succ subject=%v to=%v\",\n\t\t\t\t\tm.mail.GetHeader(\"Subject\"), m.mail.GetHeader(\"To\"))\n\t\t\t}\n\n\t\t\tfor _, to := range m.mail.GetHeader(\"To\") {\n\t\t\t\tmsg := \"\"\n\t\t\t\tif err == nil {\n\t\t\t\t\tmsg = \"ok\"\n\t\t\t\t}\n\t\t\t\tNotifyRecord(ctx, m.events, 0, models.Email, to, msg, err)\n\t\t\t}\n\n\t\t\tsize++\n\n\t\t\tif size >= conf.Batch {\n\t\t\t\tif err := s.Close(); err != nil {\n\t\t\t\t\tlogger.Warningf(\"email_sender: failed to close smtp connection: %s\", err)\n\t\t\t\t}\n\t\t\t\topen = false\n\t\t\t\tsize = 0\n\t\t\t}\n\n\t\t// Close the connection to the SMTP server if no email was sent in\n\t\t// the last 30 seconds.\n\t\tcase <-time.After(30 * time.Second):\n\t\t\tif open {\n\t\t\t\tif err := s.Close(); err != nil {\n\t\t\t\t\tlogger.Warningf(\"email_sender: failed to close smtp connection: %s\", err)\n\t\t\t\t}\n\t\t\t\topen = false\n\t\t\t}\n\t\t}\n\t}\n}\n"
},
{
"path": "alert/sender/feishu.go",
"content": "package sender\n\nimport (\n\t\"fmt\"\n\t\"html/template\"\n\t\"strings\"\n\n\t\"github.com/ccfos/nightingale/v6/models\"\n)\n\ntype feishuContent struct {\n\tText string `json:\"text\"`\n}\n\ntype feishuAt struct {\n\tAtMobiles []string `json:\"atMobiles\"`\n\tIsAtAll bool `json:\"isAtAll\"`\n}\n\ntype feishu struct {\n\tMsgtype string `json:\"msg_type\"`\n\tContent feishuContent `json:\"content\"`\n\tAt feishuAt `json:\"at\"`\n}\n\nvar (\n\t_ CallBacker = (*FeishuSender)(nil)\n)\n\ntype FeishuSender struct {\n\ttpl *template.Template\n}\n\nfunc (fs *FeishuSender) CallBack(ctx CallBackContext) {\n\tif len(ctx.Events) == 0 || len(ctx.CallBackURL) == 0 {\n\t\treturn\n\t}\n\n\tats := ExtractAtsParams(ctx.CallBackURL)\n\tmessage := BuildTplMessage(models.Feishu, fs.tpl, ctx.Events)\n\n\tif len(ats) > 0 {\n\t\tatTags := \"\"\n\t\tfor _, at := range ats {\n\t\t\tatTags += fmt.Sprintf(\"/prometheus pattern\n\t\tre := regexp.MustCompile(`/select/(\\d+)/prometheus`)\n\t\tmatches := re.FindStringSubmatch(ds.HTTPJson.Url)\n\t\tif len(matches) > 0 && matches[1] != \"\" {\n\t\t\taccountID, err := strconv.Atoi(matches[1])\n\t\t\tif err != nil {\n\t\t\t\tginx.Bomb(http.StatusInternalServerError, \"invalid accountID: %s\", matches[1])\n\t\t\t}\n\t\t\turl = fmt.Sprintf(\"http://%s/delete/%d/prometheus/api/v1/admin/tsdb/delete_series?%s\", target.Host, accountID, matchQuery)\n\t\t} else {\n\t\t\turl = fmt.Sprintf(\"http://%s/api/v1/admin/tsdb/delete_series?%s\", target.Host, matchQuery)\n\t\t}\n\t\tgo func() {\n\t\t\tresp, err := httplib.Get(url).SetTimeout(timeout).Response()\n\t\t\tif err != nil {\n\t\t\t\tlogger.Errorf(\"delete series failed | datasource_id: %d, datasource_name: %s, match: %s, start: %s, end: %s, err: %v\",\n\t\t\t\t\tddsf.DatasourceID, ds.Name, ddsf.Match, ddsf.Start, ddsf.End, err)\n\t\t\t\treturn\n\t\t\t}\n\t\t\tlogger.Infof(\"sending delete series request | datasource_id: %d, datasource_name: %s, match: %s, start: %s, end: %s, respBody: %s\",\n\t\t\t\tddsf.DatasourceID, ds.Name, ddsf.Match, ddsf.Start, ddsf.End, resp.Body)\n\t\t}()\n\tdefault:\n\t\tginx.Bomb(http.StatusBadRequest, \"not support delete series yet\")\n\t}\n\n\tginx.NewRender(c).Data(nil, nil)\n}\n"
},
{
"path": "center/router/router_query.go",
"content": "package router\n\nimport (\n\t\"fmt\"\n\t\"sort\"\n\t\"sync\"\n\n\t\"github.com/ccfos/nightingale/v6/alert/eval\"\n\t\"github.com/ccfos/nightingale/v6/dscache\"\n\t\"github.com/ccfos/nightingale/v6/models\"\n\t\"github.com/ccfos/nightingale/v6/pkg/logx\"\n\t\"github.com/ccfos/nightingale/v6/pkg/ginx\"\n\t\"github.com/gin-gonic/gin\"\n)\n\ntype CheckDsPermFunc func(c *gin.Context, dsId int64, cate string, q interface{}) bool\n\nvar CheckDsPerm CheckDsPermFunc = func(c *gin.Context, dsId int64, cate string, q interface{}) bool {\n\t// todo: 后续需要根据 cate 判断是否需要权限\n\treturn true\n}\n\ntype QueryFrom struct {\n\tQueries []Query `json:\"queries\"`\n\tExps []Exp `json:\"exps\"`\n}\n\ntype Query struct {\n\tRef string `json:\"ref\"`\n\tDid int64 `json:\"ds_id\"`\n\tDsCate string `json:\"ds_cate\"`\n\tQuery interface{} `json:\"query\"`\n}\n\ntype Exp struct {\n\tExp string `json:\"exp\"`\n\tRef string `json:\"ref\"`\n}\n\ntype LogResp struct {\n\tTotal int64 `json:\"total\"`\n\tList []interface{} `json:\"list\"`\n}\n\nfunc QueryLogBatchConcurrently(anonymousAccess bool, ctx *gin.Context, f QueryFrom) (LogResp, error) {\n\tvar resp LogResp\n\tvar mu sync.Mutex\n\tvar wg sync.WaitGroup\n\tvar errs []error\n\trctx := ctx.Request.Context()\n\n\tfor _, q := range f.Queries {\n\t\tif !anonymousAccess && !CheckDsPerm(ctx, q.Did, q.DsCate, q) {\n\t\t\treturn LogResp{}, fmt.Errorf(\"forbidden\")\n\t\t}\n\n\t\tplug, exists := dscache.DsCache.Get(q.DsCate, q.Did)\n\t\tif !exists {\n\t\t\tlogx.Warningf(rctx, \"cluster:%d not exists query:%+v\", q.Did, q)\n\t\t\treturn LogResp{}, fmt.Errorf(\"cluster not exists\")\n\t\t}\n\n\t\t// 根据数据源类型对 Query 进行模板渲染处理\n\t\terr := eval.ExecuteQueryTemplate(q.DsCate, q.Query, nil)\n\t\tif err != nil {\n\t\t\tlogx.Warningf(rctx, \"query template execute error: %v\", err)\n\t\t\treturn LogResp{}, fmt.Errorf(\"query template execute error: %v\", err)\n\t\t}\n\n\t\twg.Add(1)\n\t\tgo func(query Query) {\n\t\t\tdefer wg.Done()\n\n\t\t\tdata, total, err := plug.QueryLog(rctx, query.Query)\n\t\t\tmu.Lock()\n\t\t\tdefer mu.Unlock()\n\t\t\tif err != nil {\n\t\t\t\terrMsg := fmt.Sprintf(\"query data error: %v query:%v\\n \", err, query)\n\t\t\t\tlogx.Warningf(rctx, \"%s\", errMsg)\n\t\t\t\terrs = append(errs, err)\n\t\t\t\treturn\n\t\t\t}\n\n\t\t\tm := make(map[string]interface{})\n\t\t\tm[\"ref\"] = query.Ref\n\t\t\tm[\"ds_id\"] = query.Did\n\t\t\tm[\"ds_cate\"] = query.DsCate\n\t\t\tm[\"data\"] = data\n\n\t\t\tresp.List = append(resp.List, m)\n\t\t\tresp.Total += total\n\t\t}(q)\n\t}\n\n\twg.Wait()\n\n\tif len(errs) > 0 {\n\t\treturn LogResp{}, errs[0]\n\t}\n\n\tif len(resp.List) == 0 {\n\t\treturn LogResp{}, fmt.Errorf(\"no data\")\n\t}\n\n\treturn resp, nil\n}\n\nfunc (rt *Router) QueryLogBatch(c *gin.Context) {\n\tvar f QueryFrom\n\tginx.BindJSON(c, &f)\n\n\tresp, err := QueryLogBatchConcurrently(rt.Center.AnonymousAccess.PromQuerier, c, f)\n\tif err != nil {\n\t\tginx.Bomb(200, \"err:%v\", err)\n\t}\n\n\tginx.NewRender(c).Data(resp, nil)\n}\n\nfunc QueryDataConcurrently(anonymousAccess bool, ctx *gin.Context, f models.QueryParam) ([]models.DataResp, error) {\n\tvar resp []models.DataResp\n\tvar mu sync.Mutex\n\tvar wg sync.WaitGroup\n\tvar errs []error\n\trctx := ctx.Request.Context()\n\n\tfor _, q := range f.Queries {\n\t\tif !anonymousAccess && !CheckDsPerm(ctx, f.DatasourceId, f.Cate, q) {\n\t\t\treturn nil, fmt.Errorf(\"forbidden\")\n\t\t}\n\n\t\tplug, exists := dscache.DsCache.Get(f.Cate, f.DatasourceId)\n\t\tif !exists {\n\t\t\tlogx.Warningf(rctx, \"cluster:%d not exists\", f.DatasourceId)\n\t\t\treturn nil, fmt.Errorf(\"cluster not exists\")\n\t\t}\n\n\t\twg.Add(1)\n\t\tgo func(query interface{}) {\n\t\t\tdefer wg.Done()\n\n\t\t\tdata, err := plug.QueryData(rctx, query)\n\t\t\tif err != nil {\n\t\t\t\tlogx.Warningf(rctx, \"query data error: req:%+v err:%v\", query, err)\n\t\t\t\tmu.Lock()\n\t\t\t\terrs = append(errs, err)\n\t\t\t\tmu.Unlock()\n\t\t\t\treturn\n\t\t\t}\n\n\t\t\tlogx.Debugf(rctx, \"query data: req:%+v resp:%+v\", query, data)\n\t\t\tmu.Lock()\n\t\t\tresp = append(resp, data...)\n\t\t\tmu.Unlock()\n\t\t}(q)\n\t}\n\n\twg.Wait()\n\n\tif len(errs) > 0 {\n\t\treturn nil, errs[0]\n\t}\n\n\t// 面向API的统一处理\n\t// 按照 .Metric 排序\n\t// 确保仪表盘中相同图例的曲线颜色相同\n\tif len(resp) > 1 {\n\t\tsort.Slice(resp, func(i, j int) bool {\n\t\t\tif resp[i].Metric != nil && resp[j].Metric != nil {\n\t\t\t\treturn resp[i].Metric.String() < resp[j].Metric.String()\n\t\t\t}\n\t\t\treturn false\n\t\t})\n\t}\n\n\treturn resp, nil\n}\n\nfunc (rt *Router) QueryData(c *gin.Context) {\n\tvar f models.QueryParam\n\tginx.BindJSON(c, &f)\n\n\tresp, err := QueryDataConcurrently(rt.Center.AnonymousAccess.PromQuerier, c, f)\n\tif err != nil {\n\t\tginx.Bomb(200, \"err:%v\", err)\n\t}\n\n\tginx.NewRender(c).Data(resp, nil)\n}\n\n// QueryLogConcurrently 并发查询日志\nfunc QueryLogConcurrently(anonymousAccess bool, ctx *gin.Context, f models.QueryParam) (LogResp, error) {\n\tvar resp LogResp\n\tvar mu sync.Mutex\n\tvar wg sync.WaitGroup\n\tvar errs []error\n\trctx := ctx.Request.Context()\n\n\tfor _, q := range f.Queries {\n\t\tif !anonymousAccess && !CheckDsPerm(ctx, f.DatasourceId, f.Cate, q) {\n\t\t\treturn LogResp{}, fmt.Errorf(\"forbidden\")\n\t\t}\n\n\t\tplug, exists := dscache.DsCache.Get(f.Cate, f.DatasourceId)\n\t\tif !exists {\n\t\t\tlogx.Warningf(rctx, \"cluster:%d not exists query:%+v\", f.DatasourceId, f)\n\t\t\treturn LogResp{}, fmt.Errorf(\"cluster not exists\")\n\t\t}\n\n\t\twg.Add(1)\n\t\tgo func(query interface{}) {\n\t\t\tdefer wg.Done()\n\n\t\t\tdata, total, err := plug.QueryLog(rctx, query)\n\t\t\tlogx.Debugf(rctx, \"query log: req:%+v resp:%+v\", query, data)\n\t\t\tif err != nil {\n\t\t\t\terrMsg := fmt.Sprintf(\"query data error: %v query:%v\\n \", err, query)\n\t\t\t\tlogx.Warningf(rctx, \"%s\", errMsg)\n\t\t\t\tmu.Lock()\n\t\t\t\terrs = append(errs, err)\n\t\t\t\tmu.Unlock()\n\t\t\t\treturn\n\t\t\t}\n\n\t\t\tmu.Lock()\n\t\t\tresp.List = append(resp.List, data...)\n\t\t\tresp.Total += total\n\t\t\tmu.Unlock()\n\t\t}(q)\n\t}\n\n\twg.Wait()\n\n\tif len(errs) > 0 {\n\t\treturn LogResp{}, errs[0]\n\t}\n\n\tif len(resp.List) == 0 {\n\t\treturn LogResp{}, fmt.Errorf(\"no data\")\n\t}\n\n\treturn resp, nil\n}\n\nfunc (rt *Router) QueryLogV2(c *gin.Context) {\n\tvar f models.QueryParam\n\tginx.BindJSON(c, &f)\n\n\tresp, err := QueryLogConcurrently(rt.Center.AnonymousAccess.PromQuerier, c, f)\n\tginx.NewRender(c).Data(resp, err)\n}\n\nfunc (rt *Router) QueryLog(c *gin.Context) {\n\tvar f models.QueryParam\n\tginx.BindJSON(c, &f)\n\trctx := c.Request.Context()\n\n\tvar resp []interface{}\n\tfor _, q := range f.Queries {\n\t\tif !rt.Center.AnonymousAccess.PromQuerier && !CheckDsPerm(c, f.DatasourceId, f.Cate, q) {\n\t\t\tginx.Bomb(200, \"forbidden\")\n\t\t}\n\n\t\tplug, exists := dscache.DsCache.Get(\"elasticsearch\", f.DatasourceId)\n\t\tif !exists {\n\t\t\tlogx.Warningf(rctx, \"cluster:%d not exists\", f.DatasourceId)\n\t\t\tginx.Bomb(200, \"cluster not exists\")\n\t\t}\n\n\t\tdata, _, err := plug.QueryLog(rctx, q)\n\t\tif err != nil {\n\t\t\tlogx.Warningf(rctx, \"query data error: %v\", err)\n\t\t\tginx.Bomb(200, \"err:%v\", err)\n\t\t\tcontinue\n\t\t}\n\t\tresp = append(resp, data...)\n\t}\n\n\tginx.NewRender(c).Data(resp, nil)\n}\n"
},
{
"path": "center/router/router_recording_rule.go",
"content": "package router\n\nimport (\n\t\"encoding/json\"\n\t\"net/http\"\n\t\"time\"\n\n\t\"github.com/ccfos/nightingale/v6/models\"\n\t\"github.com/ccfos/nightingale/v6/pkg/strx\"\n\t\"github.com/ccfos/nightingale/v6/pkg/ginx\"\n\n\t\"github.com/gin-gonic/gin\"\n)\n\nfunc (rt *Router) recordingRuleGets(c *gin.Context) {\n\tbusiGroupId := ginx.UrlParamInt64(c, \"id\")\n\tars, err := models.RecordingRuleGets(rt.Ctx, busiGroupId)\n\tif err == nil {\n\t\tmodels.FillUpdateByNicknames(rt.Ctx, ars)\n\t}\n\tginx.NewRender(c).Data(ars, err)\n}\n\nfunc (rt *Router) recordingRuleGetsByGids(c *gin.Context) {\n\tgids := strx.IdsInt64ForAPI(ginx.QueryStr(c, \"gids\", \"\"), \",\")\n\tif len(gids) > 0 {\n\t\tfor _, gid := range gids {\n\t\t\trt.bgroCheck(c, gid)\n\t\t}\n\t} else {\n\t\tme := c.MustGet(\"user\").(*models.User)\n\t\tif !me.IsAdmin() {\n\t\t\tvar err error\n\t\t\tgids, err = models.MyBusiGroupIds(rt.Ctx, me.Id)\n\t\t\tginx.Dangerous(err)\n\n\t\t\tif len(gids) == 0 {\n\t\t\t\tginx.NewRender(c).Data([]int{}, nil)\n\t\t\t\treturn\n\t\t\t}\n\t\t}\n\t}\n\n\tars, err := models.RecordingRuleGetsByBGIds(rt.Ctx, gids)\n\tif err == nil {\n\t\tmodels.FillUpdateByNicknames(rt.Ctx, ars)\n\t}\n\tginx.NewRender(c).Data(ars, err)\n}\n\nfunc (rt *Router) recordingRuleGetsByService(c *gin.Context) {\n\tars, err := models.RecordingRuleEnabledGets(rt.Ctx)\n\tginx.NewRender(c).Data(ars, err)\n}\n\nfunc (rt *Router) recordingRuleGet(c *gin.Context) {\n\trrid := ginx.UrlParamInt64(c, \"rrid\")\n\n\tar, err := models.RecordingRuleGetById(rt.Ctx, rrid)\n\tginx.Dangerous(err)\n\n\tif ar == nil {\n\t\tginx.NewRender(c, http.StatusNotFound).Message(\"No such recording rule\")\n\t\treturn\n\t}\n\n\tginx.NewRender(c).Data(ar, err)\n}\n\nfunc (rt *Router) recordingRuleAddByFE(c *gin.Context) {\n\tusername := c.MustGet(\"username\").(string)\n\n\tvar lst []models.RecordingRule\n\tginx.BindJSON(c, &lst)\n\n\tcount := len(lst)\n\tif count == 0 {\n\t\tginx.Bomb(http.StatusBadRequest, \"input json is empty\")\n\t}\n\n\tfor i := range lst {\n\t\tif len(lst[i].DatasourceQueries) == 0 {\n\t\t\tlst[i].DatasourceQueries = []models.DatasourceQuery{\n\t\t\t\tmodels.DataSourceQueryAll,\n\t\t\t}\n\t\t}\n\t}\n\n\tbgid := ginx.UrlParamInt64(c, \"id\")\n\treterr := make(map[string]string)\n\tfor i := 0; i < count; i++ {\n\t\tlst[i].Id = 0\n\t\tlst[i].GroupId = bgid\n\t\tlst[i].CreateBy = username\n\t\tlst[i].UpdateBy = username\n\t\tlst[i].FE2DB()\n\n\t\tif err := lst[i].Add(rt.Ctx); err != nil {\n\t\t\treterr[lst[i].Name] = err.Error()\n\t\t} else {\n\t\t\treterr[lst[i].Name] = \"\"\n\t\t}\n\t}\n\tginx.NewRender(c).Data(reterr, nil)\n}\n\nfunc (rt *Router) recordingRulePutByFE(c *gin.Context) {\n\tvar f models.RecordingRule\n\tginx.BindJSON(c, &f)\n\n\trrid := ginx.UrlParamInt64(c, \"rrid\")\n\tar, err := models.RecordingRuleGetById(rt.Ctx, rrid)\n\tginx.Dangerous(err)\n\n\tif ar == nil {\n\t\tginx.NewRender(c, http.StatusNotFound).Message(\"No such recording rule\")\n\t\treturn\n\t}\n\n\trt.bgrwCheck(c, ar.GroupId)\n\trt.bgroCheck(c, f.GroupId)\n\n\tf.UpdateBy = c.MustGet(\"username\").(string)\n\tginx.NewRender(c).Message(ar.Update(rt.Ctx, f))\n\n}\n\nfunc (rt *Router) recordingRuleDel(c *gin.Context) {\n\tvar f idsForm\n\tginx.BindJSON(c, &f)\n\tf.Verify()\n\n\tginx.NewRender(c).Message(models.RecordingRuleDels(rt.Ctx, f.Ids, ginx.UrlParamInt64(c, \"id\")))\n\n}\n\ntype recordRuleFieldForm struct {\n\tIds []int64 `json:\"ids\"`\n\tFields map[string]interface{} `json:\"fields\"`\n}\n\nfunc (rt *Router) recordingRulePutFields(c *gin.Context) {\n\tvar f recordRuleFieldForm\n\tginx.BindJSON(c, &f)\n\n\tif len(f.Fields) == 0 {\n\t\tginx.Bomb(http.StatusBadRequest, \"fields empty\")\n\t}\n\n\tf.Fields[\"update_by\"] = c.MustGet(\"username\").(string)\n\tf.Fields[\"update_at\"] = time.Now().Unix()\n\n\tif datasourceQueries, ok := f.Fields[\"datasource_queries\"]; ok {\n\t\tbytes, err := json.Marshal(datasourceQueries)\n\t\tginx.Dangerous(err)\n\t\tf.Fields[\"datasource_queries\"] = string(bytes)\n\t}\n\n\tif datasourceIds, ok := f.Fields[\"datasource_ids\"]; ok {\n\t\tbytes, err := json.Marshal(datasourceIds)\n\t\tginx.Dangerous(err)\n\t\tf.Fields[\"datasource_ids\"] = string(bytes)\n\t}\n\n\tfor i := 0; i < len(f.Ids); i++ {\n\t\tar, err := models.RecordingRuleGetById(rt.Ctx, f.Ids[i])\n\t\tginx.Dangerous(err)\n\n\t\tif ar == nil {\n\t\t\tcontinue\n\t\t}\n\n\t\tginx.Dangerous(ar.UpdateFieldsMap(rt.Ctx, f.Fields))\n\t}\n\n\tginx.NewRender(c).Message(nil)\n}\n"
},
{
"path": "center/router/router_role.go",
"content": "package router\n\nimport (\n\t\"net/http\"\n\t\"strings\"\n\n\t\"github.com/ccfos/nightingale/v6/center/cconf\"\n\t\"github.com/ccfos/nightingale/v6/models\"\n\t\"github.com/ccfos/nightingale/v6/pkg/ginx\"\n\n\t\"github.com/gin-gonic/gin\"\n)\n\nfunc (rt *Router) rolesGets(c *gin.Context) {\n\tlst, err := models.RoleGetsAll(rt.Ctx)\n\tginx.NewRender(c).Data(lst, err)\n}\n\nfunc (rt *Router) permsGets(c *gin.Context) {\n\tuser := c.MustGet(\"user\").(*models.User)\n\tif user.IsAdmin() {\n\t\tvar lst []string\n\t\tfor _, ops := range cconf.Operations.Ops {\n\t\t\tfor _, op := range ops.Ops {\n\t\t\t\tlst = append(lst, op.Name)\n\t\t\t}\n\t\t}\n\t\tginx.NewRender(c).Data(lst, nil)\n\t\treturn\n\t}\n\n\tlst, err := models.OperationsOfRole(rt.Ctx, strings.Fields(user.Roles))\n\tginx.NewRender(c).Data(lst, err)\n}\n\n// 创建角色\nfunc (rt *Router) roleAdd(c *gin.Context) {\n\tvar f models.Role\n\tginx.BindJSON(c, &f)\n\n\terr := f.Add(rt.Ctx)\n\tginx.NewRender(c).Message(err)\n}\n\n// 更新角色\nfunc (rt *Router) rolePut(c *gin.Context) {\n\tvar f models.Role\n\tginx.BindJSON(c, &f)\n\toldRule, err := models.RoleGet(rt.Ctx, \"id=?\", f.Id)\n\tginx.Dangerous(err)\n\n\tif oldRule == nil {\n\t\tginx.Bomb(http.StatusOK, \"role not found\")\n\t}\n\n\tif oldRule.Name == \"Admin\" {\n\t\tginx.Bomb(http.StatusOK, \"admin role can not be modified\")\n\t}\n\n\tif oldRule.Name != f.Name {\n\t\t// name changed, check duplication\n\t\tnum, err := models.RoleCount(rt.Ctx, \"name=? and id<>?\", f.Name, oldRule.Id)\n\t\tginx.Dangerous(err)\n\n\t\tif num > 0 {\n\t\t\tginx.Bomb(http.StatusOK, \"role name already exists\")\n\t\t}\n\t}\n\n\toldRule.Name = f.Name\n\toldRule.Note = f.Note\n\n\tginx.NewRender(c).Message(oldRule.Update(rt.Ctx, \"name\", \"note\"))\n}\n\nfunc (rt *Router) roleDel(c *gin.Context) {\n\tid := ginx.UrlParamInt64(c, \"id\")\n\ttarget, err := models.RoleGet(rt.Ctx, \"id=?\", id)\n\tginx.Dangerous(err)\n\n\tif target.Name == \"Admin\" {\n\t\tginx.Bomb(http.StatusOK, \"admin role can not be modified\")\n\t}\n\n\tif target == nil {\n\t\tginx.NewRender(c).Message(nil)\n\t\treturn\n\t}\n\n\tginx.NewRender(c).Message(target.Del(rt.Ctx))\n}\n\n// 角色列表\nfunc (rt *Router) roleGets(c *gin.Context) {\n\tlst, err := models.RoleGetsAll(rt.Ctx)\n\tginx.NewRender(c).Data(lst, err)\n}\n\nfunc (rt *Router) allPerms(c *gin.Context) {\n\troles, err := models.RoleGetsAll(rt.Ctx)\n\tginx.Dangerous(err)\n\tm := make(map[string][]string)\n\tfor _, r := range roles {\n\t\tlst, err := models.OperationsOfRole(rt.Ctx, strings.Fields(r.Name))\n\t\tif err != nil {\n\t\t\tcontinue\n\t\t}\n\t\tm[r.Name] = lst\n\t}\n\n\tginx.NewRender(c).Data(m, err)\n}\n"
},
{
"path": "center/router/router_role_operation.go",
"content": "package router\n\nimport (\n\t\"net/http\"\n\n\t\"github.com/ccfos/nightingale/v6/center/cconf\"\n\t\"github.com/ccfos/nightingale/v6/models\"\n\t\"github.com/ccfos/nightingale/v6/pkg/ginx\"\n\t\"github.com/gin-gonic/gin\"\n\t\"github.com/toolkits/pkg/i18n\"\n)\n\nfunc (rt *Router) operationOfRole(c *gin.Context) {\n\tvar (\n\t\trole *models.Role\n\t\terr error\n\t\tres []string\n\t\troleOperations []string\n\t)\n\n\tid := ginx.UrlParamInt64(c, \"id\")\n\trole, err = models.RoleGet(rt.Ctx, \"id=?\", id)\n\tginx.Dangerous(err)\n\tif role == nil {\n\t\tginx.Bomb(http.StatusOK, \"role not found\")\n\t}\n\n\tif role.Name == \"Admin\" {\n\t\tfor _, ops := range cconf.Operations.Ops {\n\t\t\tfor i := range ops.Ops {\n\t\t\t\tres = append(res, ops.Ops[i].Name)\n\t\t\t}\n\t\t}\n\t} else {\n\t\troleOperations, err = models.OperationsOfRole(rt.Ctx, []string{role.Name})\n\t\tres = roleOperations\n\t}\n\n\tginx.NewRender(c).Data(res, err)\n}\n\nfunc (rt *Router) roleBindOperation(c *gin.Context) {\n\tid := ginx.UrlParamInt64(c, \"id\")\n\trole, err := models.RoleGet(rt.Ctx, \"id=?\", id)\n\tginx.Dangerous(err)\n\tif role == nil {\n\t\tginx.Bomb(http.StatusOK, \"role not found\")\n\t}\n\n\tif role.Name == \"Admin\" {\n\t\tginx.Bomb(http.StatusOK, \"admin role can not be modified\")\n\t}\n\n\tvar ops []string\n\tginx.BindJSON(c, &ops)\n\n\tginx.NewRender(c).Message(models.RoleOperationBind(rt.Ctx, role.Name, ops))\n}\n\nfunc (rt *Router) operations(c *gin.Context) {\n\tvar ops []cconf.Ops\n\tfor _, v := range rt.Operations.Ops {\n\t\tnewOp := cconf.Ops{\n\t\t\tName: v.Name,\n\t\t\tCname: i18n.Sprintf(c.GetHeader(\"X-Language\"), v.Cname),\n\t\t\tOps: []cconf.SingleOp{},\n\t\t}\n\t\tfor i := range v.Ops {\n\t\t\top := cconf.SingleOp{\n\t\t\t\tName: v.Ops[i].Name,\n\t\t\t\tCname: i18n.Sprintf(c.GetHeader(\"X-Language\"), v.Ops[i].Cname),\n\t\t\t}\n\t\t\tnewOp.Ops = append(newOp.Ops, op)\n\t\t}\n\t\tops = append(ops, newOp)\n\t}\n\tginx.NewRender(c).Data(ops, nil)\n}\n"
},
{
"path": "center/router/router_saved_view.go",
"content": "package router\n\nimport (\n\t\"net/http\"\n\n\t\"github.com/ccfos/nightingale/v6/models\"\n\t\"github.com/ccfos/nightingale/v6/pkg/slice\"\n\t\"github.com/ccfos/nightingale/v6/pkg/ginx\"\n\n\t\"github.com/gin-gonic/gin\"\n)\n\nfunc (rt *Router) savedViewGets(c *gin.Context) {\n\tpage := ginx.QueryStr(c, \"page\", \"\")\n\n\tme := c.MustGet(\"user\").(*models.User)\n\n\tlst, err := models.SavedViewGets(rt.Ctx, page)\n\tif err != nil {\n\t\tginx.NewRender(c).Data(nil, err)\n\t\treturn\n\t}\n\tmodels.FillUpdateByNicknames(rt.Ctx, lst)\n\n\tuserGids, err := models.MyGroupIds(rt.Ctx, me.Id)\n\tif err != nil {\n\t\tginx.NewRender(c).Data(nil, err)\n\t\treturn\n\t}\n\n\tfavoriteMap, err := models.SavedViewFavoriteGetByUserId(rt.Ctx, me.Id)\n\tif err != nil {\n\t\tginx.NewRender(c).Data(nil, err)\n\t\treturn\n\t}\n\n\tfavoriteViews := make([]models.SavedView, 0)\n\tnormalViews := make([]models.SavedView, 0)\n\n\tfor _, view := range lst {\n\t\tvisible := view.CreateBy == me.Username ||\n\t\t\tview.PublicCate == 2 ||\n\t\t\t(view.PublicCate == 1 && slice.HaveIntersection[int64](userGids, view.Gids))\n\n\t\tif !visible {\n\t\t\tcontinue\n\t\t}\n\n\t\tview.IsFavorite = favoriteMap[view.Id]\n\n\t\t// 收藏的排前面\n\t\tif view.IsFavorite {\n\t\t\tfavoriteViews = append(favoriteViews, view)\n\t\t} else {\n\t\t\tnormalViews = append(normalViews, view)\n\t\t}\n\t}\n\n\tginx.NewRender(c).Data(append(favoriteViews, normalViews...), nil)\n}\n\nfunc (rt *Router) savedViewAdd(c *gin.Context) {\n\tvar f models.SavedView\n\tginx.BindJSON(c, &f)\n\n\tme := c.MustGet(\"user\").(*models.User)\n\tf.Id = 0\n\tf.CreateBy = me.Username\n\tf.UpdateBy = me.Username\n\n\terr := models.SavedViewAdd(rt.Ctx, &f)\n\tginx.NewRender(c).Data(f.Id, err)\n}\n\nfunc (rt *Router) savedViewPut(c *gin.Context) {\n\tid := ginx.UrlParamInt64(c, \"id\")\n\n\tview, err := models.SavedViewGetById(rt.Ctx, id)\n\tif err != nil {\n\t\tginx.NewRender(c).Data(nil, err)\n\t\treturn\n\t}\n\tif view == nil {\n\t\tginx.NewRender(c, http.StatusNotFound).Message(\"saved view not found\")\n\t\treturn\n\t}\n\n\tme := c.MustGet(\"user\").(*models.User)\n\t// 只有创建者可以更新\n\tif view.CreateBy != me.Username && !me.IsAdmin() {\n\t\tginx.NewRender(c, http.StatusForbidden).Message(\"forbidden\")\n\t\treturn\n\t}\n\n\tvar f models.SavedView\n\tginx.BindJSON(c, &f)\n\n\tview.Name = f.Name\n\tview.Filter = f.Filter\n\tview.PublicCate = f.PublicCate\n\tview.Gids = f.Gids\n\n\terr = models.SavedViewUpdate(rt.Ctx, view, me.Username)\n\tginx.NewRender(c).Message(err)\n}\n\nfunc (rt *Router) savedViewDel(c *gin.Context) {\n\tid := ginx.UrlParamInt64(c, \"id\")\n\n\tview, err := models.SavedViewGetById(rt.Ctx, id)\n\tif err != nil {\n\t\tginx.NewRender(c).Data(nil, err)\n\t\treturn\n\t}\n\tif view == nil {\n\t\tginx.NewRender(c, http.StatusNotFound).Message(\"saved view not found\")\n\t\treturn\n\t}\n\n\tme := c.MustGet(\"user\").(*models.User)\n\t// 只有创建者或管理员可以删除\n\tif view.CreateBy != me.Username && !me.IsAdmin() {\n\t\tginx.NewRender(c, http.StatusForbidden).Message(\"forbidden\")\n\t\treturn\n\t}\n\n\terr = models.SavedViewDel(rt.Ctx, id)\n\tginx.NewRender(c).Message(err)\n}\n\nfunc (rt *Router) savedViewFavoriteAdd(c *gin.Context) {\n\tid := ginx.UrlParamInt64(c, \"id\")\n\tme := c.MustGet(\"user\").(*models.User)\n\n\terr := models.UserViewFavoriteAdd(rt.Ctx, id, me.Id)\n\tginx.NewRender(c).Message(err)\n}\n\nfunc (rt *Router) savedViewFavoriteDel(c *gin.Context) {\n\tid := ginx.UrlParamInt64(c, \"id\")\n\tme := c.MustGet(\"user\").(*models.User)\n\n\terr := models.UserViewFavoriteDel(rt.Ctx, id, me.Id)\n\tginx.NewRender(c).Message(err)\n}\n"
},
{
"path": "center/router/router_self.go",
"content": "package router\n\nimport (\n\t\"github.com/ccfos/nightingale/v6/models\"\n\t\"github.com/ccfos/nightingale/v6/pkg/flashduty\"\n\t\"github.com/ccfos/nightingale/v6/pkg/ormx\"\n\t\"github.com/ccfos/nightingale/v6/pkg/secu\"\n\t\"github.com/ccfos/nightingale/v6/pkg/ginx\"\n\t\"github.com/google/uuid\"\n\n\t\"github.com/gin-gonic/gin\"\n\t\"github.com/toolkits/pkg/logger\"\n)\n\nfunc (rt *Router) selfProfileGet(c *gin.Context) {\n\tuser := c.MustGet(\"user\").(*models.User)\n\tif user.IsAdmin() {\n\t\tuser.Admin = true\n\t}\n\tginx.NewRender(c).Data(user, nil)\n}\n\ntype selfProfileForm struct {\n\tNickname string `json:\"nickname\"`\n\tPhone string `json:\"phone\"`\n\tEmail string `json:\"email\"`\n\tPortrait string `json:\"portrait\"`\n\tContacts ormx.JSONObj `json:\"contacts\"`\n}\n\nfunc (rt *Router) selfProfilePut(c *gin.Context) {\n\tvar f selfProfileForm\n\tginx.BindJSON(c, &f)\n\n\tuser := c.MustGet(\"user\").(*models.User)\n\toldInfo := models.User{\n\t\tUsername: user.Username,\n\t\tPhone: user.Phone,\n\t\tEmail: user.Email,\n\t}\n\tuser.Nickname = f.Nickname\n\tuser.Phone = f.Phone\n\tuser.Email = f.Email\n\tuser.Portrait = f.Portrait\n\tuser.Contacts = f.Contacts\n\tuser.UpdateBy = user.Username\n\n\tif flashduty.NeedSyncUser(rt.Ctx) {\n\t\tflashduty.UpdateUser(rt.Ctx, oldInfo, f.Email, f.Phone)\n\t}\n\n\tginx.NewRender(c).Message(user.UpdateAllFields(rt.Ctx))\n}\n\ntype selfPasswordForm struct {\n\tOldPass string `json:\"oldpass\" binding:\"required\"`\n\tNewPass string `json:\"newpass\" binding:\"required\"`\n}\n\nfunc (rt *Router) selfPasswordPut(c *gin.Context) {\n\tvar f selfPasswordForm\n\tginx.BindJSON(c, &f)\n\tuser := c.MustGet(\"user\").(*models.User)\n\n\tnewPassWord := f.NewPass\n\toldPassWord := f.OldPass\n\tif rt.HTTP.RSA.OpenRSA {\n\t\tvar err error\n\t\tnewPassWord, err = secu.Decrypt(f.NewPass, rt.HTTP.RSA.RSAPrivateKey, rt.HTTP.RSA.RSAPassWord)\n\t\tif err != nil {\n\t\t\tlogger.Errorf(\"RSA Decrypt failed: %v username: %s\", err, user.Username)\n\t\t\tginx.NewRender(c).Message(err)\n\t\t\treturn\n\t\t}\n\n\t\toldPassWord, err = secu.Decrypt(f.OldPass, rt.HTTP.RSA.RSAPrivateKey, rt.HTTP.RSA.RSAPassWord)\n\t\tif err != nil {\n\t\t\tlogger.Errorf(\"RSA Decrypt failed: %v username: %s\", err, user.Username)\n\t\t\tginx.NewRender(c).Message(err)\n\t\t\treturn\n\t\t}\n\t}\n\n\tginx.NewRender(c).Message(user.ChangePassword(rt.Ctx, oldPassWord, newPassWord))\n}\n\ntype tokenForm struct {\n\tTokenName string `json:\"token_name\"`\n\tToken string `json:\"token\"`\n}\n\nfunc (rt *Router) getToken(c *gin.Context) {\n\tusername := c.MustGet(\"username\").(string)\n\ttokens, err := models.GetTokensByUsername(rt.Ctx, username)\n\tginx.NewRender(c).Data(tokens, err)\n}\n\nfunc (rt *Router) addToken(c *gin.Context) {\n\tvar f tokenForm\n\tginx.BindJSON(c, &f)\n\n\tusername := c.MustGet(\"username\").(string)\n\n\ttokens, err := models.GetTokensByUsername(rt.Ctx, username)\n\tginx.Dangerous(err)\n\n\tfor _, token := range tokens {\n\t\tif token.TokenName == f.TokenName {\n\t\t\tginx.NewRender(c).Message(\"token name already exists\")\n\t\t\treturn\n\t\t}\n\t}\n\n\ttoken, err := models.AddToken(rt.Ctx, username, uuid.New().String(), f.TokenName)\n\tginx.NewRender(c).Data(token, err)\n}\n\nfunc (rt *Router) deleteToken(c *gin.Context) {\n\tid := ginx.UrlParamInt64(c, \"id\")\n\tusername := c.MustGet(\"username\").(string)\n\ttokenCount, err := models.CountToken(rt.Ctx, username)\n\tginx.Dangerous(err)\n\n\tif tokenCount <= 1 {\n\t\tginx.NewRender(c).Message(\"cannot delete the last token\")\n\t\treturn\n\t}\n\n\tginx.NewRender(c).Message(models.DeleteToken(rt.Ctx, id))\n}\n"
},
{
"path": "center/router/router_server.go",
"content": "package router\n\nimport (\n\t\"time\"\n\n\t\"github.com/ccfos/nightingale/v6/models\"\n\t\"github.com/ccfos/nightingale/v6/pkg/ginx\"\n\n\t\"github.com/gin-gonic/gin\"\n)\n\nfunc (rt *Router) serversGet(c *gin.Context) {\n\tlist, err := models.AlertingEngineGets(rt.Ctx, \"\")\n\tginx.NewRender(c).Data(list, err)\n}\n\nfunc (rt *Router) serverClustersGet(c *gin.Context) {\n\tlist, err := models.AlertingEngineGetsClusters(rt.Ctx, \"\")\n\tginx.NewRender(c).Data(list, err)\n}\n\nfunc (rt *Router) serverHeartbeat(c *gin.Context) {\n\tvar req models.HeartbeatInfo\n\tginx.BindJSON(c, &req)\n\terr := models.AlertingEngineHeartbeatWithCluster(rt.Ctx, req.Instance, req.EngineCluster, req.DatasourceId)\n\tginx.NewRender(c).Message(err)\n}\n\nfunc (rt *Router) serversActive(c *gin.Context) {\n\tdatasourceId := ginx.QueryInt64(c, \"dsid\", 0)\n\tengineName := ginx.QueryStr(c, \"engine_name\", \"\")\n\tif engineName != \"\" {\n\t\tservers, err := models.AlertingEngineGetsInstances(rt.Ctx, \"engine_cluster = ? and clock > ?\", engineName, time.Now().Unix()-30)\n\t\tginx.NewRender(c).Data(servers, err)\n\t\treturn\n\t}\n\n\tif datasourceId == 0 {\n\t\tginx.NewRender(c).Message(\"dsid is required\")\n\t\treturn\n\t}\n\tservers, err := models.AlertingEngineGetsInstances(rt.Ctx, \"datasource_id = ? and clock > ?\", datasourceId, time.Now().Unix()-30)\n\tginx.NewRender(c).Data(servers, err)\n}\n"
},
{
"path": "center/router/router_source_token.go",
"content": "package router\n\nimport (\n\t\"net/http\"\n\t\"time\"\n\n\t\"github.com/ccfos/nightingale/v6/models\"\n\t\"github.com/ccfos/nightingale/v6/pkg/ginx\"\n\t\"github.com/google/uuid\"\n\n\t\"github.com/gin-gonic/gin\"\n)\n\n// sourceTokenAdd 生成新的源令牌\nfunc (rt *Router) sourceTokenAdd(c *gin.Context) {\n\tvar f models.SourceToken\n\tginx.BindJSON(c, &f)\n\n\tif f.ExpireAt > 0 && f.ExpireAt <= time.Now().Unix() {\n\t\tginx.Bomb(http.StatusBadRequest, \"expire time must be in the future\")\n\t}\n\n\ttoken := uuid.New().String()\n\n\tusername := c.MustGet(\"username\").(string)\n\n\tf.Token = token\n\tf.CreateBy = username\n\tf.CreateAt = time.Now().Unix()\n\n\terr := f.Add(rt.Ctx)\n\tginx.Dangerous(err)\n\n\tgo models.CleanupExpiredTokens(rt.Ctx)\n\tginx.NewRender(c).Data(token, nil)\n}\n"
},
{
"path": "center/router/router_target.go",
"content": "package router\n\nimport (\n\t\"context\"\n\t\"encoding/json\"\n\t\"fmt\"\n\t\"net/http\"\n\t\"strings\"\n\t\"time\"\n\n\t\"github.com/ccfos/nightingale/v6/models\"\n\t\"github.com/ccfos/nightingale/v6/pkg/ctx\"\n\t\"github.com/ccfos/nightingale/v6/pkg/strx\"\n\t\"github.com/ccfos/nightingale/v6/pushgw/idents\"\n\t\"github.com/ccfos/nightingale/v6/storage\"\n\t\"github.com/ccfos/nightingale/v6/pkg/ginx\"\n\n\t\"github.com/gin-gonic/gin\"\n\t\"github.com/prometheus/common/model\"\n\t\"github.com/toolkits/pkg/logger\"\n)\n\ntype TargetQuery struct {\n\tFilters []models.HostQuery `json:\"queries\"`\n\tP int `json:\"p\"`\n\tLimit int `json:\"limit\"`\n}\n\nfunc (rt *Router) targetGetsByHostFilter(c *gin.Context) {\n\tvar f TargetQuery\n\tginx.BindJSON(c, &f)\n\n\tquery := models.GetHostsQuery(f.Filters)\n\n\thosts, err := models.TargetGetsByFilter(rt.Ctx, query, f.Limit, (f.P-1)*f.Limit)\n\tginx.Dangerous(err)\n\n\ttotal, err := models.TargetCountByFilter(rt.Ctx, query)\n\tginx.Dangerous(err)\n\n\tmodels.FillTargetsBeatTime(rt.Redis, hosts)\n\tnow := time.Now().Unix()\n\tfor i := 0; i < len(hosts); i++ {\n\t\tif now-hosts[i].BeatTime < 60 {\n\t\t\thosts[i].TargetUp = 2\n\t\t} else if now-hosts[i].BeatTime < 180 {\n\t\t\thosts[i].TargetUp = 1\n\t\t}\n\t}\n\n\tginx.NewRender(c).Data(gin.H{\n\t\t\"list\": hosts,\n\t\t\"total\": total,\n\t}, nil)\n}\n\nfunc (rt *Router) targetGets(c *gin.Context) {\n\tbgids := strx.IdsInt64ForAPI(ginx.QueryStr(c, \"gids\", \"\"), \",\")\n\tquery := ginx.QueryStr(c, \"query\", \"\")\n\tlimit := ginx.QueryInt(c, \"limit\", 30)\n\tdowntime := ginx.QueryInt64(c, \"downtime\", 0)\n\tdsIds := queryDatasourceIds(c)\n\n\torder := ginx.QueryStr(c, \"order\", \"ident\")\n\tdesc := ginx.QueryBool(c, \"desc\", false)\n\n\thosts := queryStrListField(c, \"hosts\", \",\", \" \", \"\\n\")\n\n\tvar err error\n\tif len(bgids) > 0 {\n\t\tfor _, gid := range bgids {\n\t\t\tif gid > 0 {\n\t\t\t\trt.bgroCheck(c, gid)\n\t\t\t}\n\t\t}\n\t} else {\n\t\tuser := c.MustGet(\"user\").(*models.User)\n\t\tif !user.IsAdmin() {\n\t\t\t// 如果是非 admin 用户,全部对象的情况,找到用户有权限的业务组\n\t\t\tvar err error\n\t\t\tbgids, err = models.MyBusiGroupIds(rt.Ctx, user.Id)\n\t\t\tginx.Dangerous(err)\n\n\t\t\t// 将未分配业务组的对象也加入到列表中\n\t\t\tbgids = append(bgids, 0)\n\t\t}\n\t}\n\n\toptions := []models.BuildTargetWhereOption{\n\t\tmodels.BuildTargetWhereWithBgids(bgids),\n\t\tmodels.BuildTargetWhereWithDsIds(dsIds),\n\t\tmodels.BuildTargetWhereWithQuery(query),\n\t\tmodels.BuildTargetWhereWithHosts(hosts),\n\t}\n\n\t// downtime 筛选:从缓存获取心跳时间,选择较小的集合用 IN 或 NOT IN 过滤\n\tif downtime != 0 {\n\t\tdowntimeOpt, hasMatch := rt.downtimeFilter(downtime)\n\t\tif !hasMatch {\n\t\t\tginx.NewRender(c).Data(gin.H{\n\t\t\t\t\"list\": []*models.Target{},\n\t\t\t\t\"total\": 0,\n\t\t\t}, nil)\n\t\t\treturn\n\t\t}\n\t\tif downtimeOpt != nil {\n\t\t\toptions = append(options, downtimeOpt)\n\t\t}\n\t}\n\n\ttotal, err := models.TargetTotal(rt.Ctx, options...)\n\tginx.Dangerous(err)\n\n\tlist, err := models.TargetGets(rt.Ctx, limit,\n\t\tginx.Offset(c, limit), order, desc, options...)\n\tginx.Dangerous(err)\n\n\ttgs, err := models.TargetBusiGroupsGetAll(rt.Ctx)\n\tginx.Dangerous(err)\n\n\tfor _, t := range list {\n\t\tt.GroupIds = tgs[t.Ident]\n\t}\n\n\tif err == nil {\n\t\tnow := time.Now()\n\t\tcache := make(map[int64]*models.BusiGroup)\n\n\t\t// 从 Redis 补全 BeatTime\n\t\tmodels.FillTargetsBeatTime(rt.Redis, list)\n\n\t\tvar keys []string\n\t\tfor i := 0; i < len(list); i++ {\n\t\t\tginx.Dangerous(list[i].FillGroup(rt.Ctx, cache))\n\t\t\tkeys = append(keys, models.WrapIdent(list[i].Ident))\n\n\t\t\tif now.Unix()-list[i].BeatTime < 60 {\n\t\t\t\tlist[i].TargetUp = 2\n\t\t\t} else if now.Unix()-list[i].BeatTime < 180 {\n\t\t\t\tlist[i].TargetUp = 1\n\t\t\t}\n\t\t}\n\n\t\tif len(keys) > 0 {\n\t\t\tmetaMap := make(map[string]*models.HostMeta)\n\t\t\tvals := storage.MGet(context.Background(), rt.Redis, keys)\n\t\t\tfor _, value := range vals {\n\t\t\t\tvar meta models.HostMeta\n\t\t\t\tif value == nil {\n\t\t\t\t\tcontinue\n\t\t\t\t}\n\t\t\t\terr := json.Unmarshal(value, &meta)\n\t\t\t\tif err != nil {\n\t\t\t\t\tlogger.Warningf(\"unmarshal %v host meta failed: %v\", value, err)\n\t\t\t\t\tcontinue\n\t\t\t\t}\n\t\t\t\tmetaMap[meta.Hostname] = &meta\n\t\t\t}\n\n\t\t\tfor i := 0; i < len(list); i++ {\n\t\t\t\tif meta, ok := metaMap[list[i].Ident]; ok {\n\t\t\t\t\tlist[i].FillMeta(meta)\n\t\t\t\t} else {\n\t\t\t\t\t// 未上报过元数据的主机,cpuNum默认为-1, 用于前端展示 unknown\n\t\t\t\t\tlist[i].CpuNum = -1\n\t\t\t\t}\n\t\t\t}\n\t\t}\n\n\t}\n\n\tginx.NewRender(c).Data(gin.H{\n\t\t\"list\": list,\n\t\t\"total\": total,\n\t}, nil)\n}\n\n// downtimeFilter 从缓存获取心跳时间,生成 downtime 筛选条件\n// 选择匹配集和非匹配集中较小的一方,用 IN 或 NOT IN 来减少 SQL 参数量\n// 返回值:\n// - option: 筛选条件,nil 表示所有 target 都符合条件(无需过滤)\n// - hasMatch: 是否有符合条件的 target,false 表示无匹配应返回空结果\nfunc (rt *Router) downtimeFilter(downtime int64) (option models.BuildTargetWhereOption, hasMatch bool) {\n\tnow := time.Now().Unix()\n\ttargets := rt.TargetCache.GetAll()\n\tvar matchIdents, nonMatchIdents []string\n\tfor _, target := range targets {\n\t\tmatched := false\n\t\tif downtime > 0 {\n\t\t\tmatched = target.BeatTime < now-downtime\n\t\t} else if downtime < 0 {\n\t\t\tmatched = target.BeatTime > now+downtime\n\t\t}\n\t\tif matched {\n\t\t\tmatchIdents = append(matchIdents, target.Ident)\n\t\t} else {\n\t\t\tnonMatchIdents = append(nonMatchIdents, target.Ident)\n\t\t}\n\t}\n\n\tif len(matchIdents) == 0 {\n\t\treturn nil, false\n\t}\n\n\tif len(nonMatchIdents) == 0 {\n\t\treturn nil, true\n\t}\n\n\tif len(matchIdents) <= len(nonMatchIdents) {\n\t\treturn models.BuildTargetWhereWithIdents(matchIdents), true\n\t}\n\treturn models.BuildTargetWhereExcludeIdents(nonMatchIdents), true\n}\n\nfunc (rt *Router) targetExtendInfoByIdent(c *gin.Context) {\n\tident := ginx.QueryStr(c, \"ident\", \"\")\n\tkey := models.WrapExtendIdent(ident)\n\tvals := storage.MGet(context.Background(), rt.Redis, []string{key})\n\tif len(vals) > 0 {\n\t\textInfo := string(vals[0])\n\t\tif extInfo == \"null\" {\n\t\t\textInfo = \"\"\n\t\t}\n\t\tginx.NewRender(c).Data(gin.H{\n\t\t\t\"extend_info\": extInfo,\n\t\t\t\"ident\": ident,\n\t\t}, nil)\n\t\treturn\n\t}\n\tginx.NewRender(c).Data(gin.H{\n\t\t\"extend_info\": \"\",\n\t\t\"ident\": ident,\n\t}, nil)\n}\n\nfunc (rt *Router) targetGetsByService(c *gin.Context) {\n\tlst, err := models.TargetGetsAll(rt.Ctx)\n\tginx.NewRender(c).Data(lst, err)\n}\n\nfunc (rt *Router) targetGetTags(c *gin.Context) {\n\tidents := ginx.QueryStr(c, \"idents\", \"\")\n\tidents = strings.ReplaceAll(idents, \",\", \" \")\n\tignoreHostTag := ginx.QueryBool(c, \"ignore_host_tag\", false)\n\tlst, err := models.TargetGetTags(rt.Ctx, strings.Fields(idents), ignoreHostTag, \"\")\n\tginx.NewRender(c).Data(lst, err)\n}\n\ntype targetTagsForm struct {\n\tIdents []string `json:\"idents\" binding:\"required_without=HostIps\"`\n\tHostIps []string `json:\"host_ips\" binding:\"required_without=Idents\"`\n\tTags []string `json:\"tags\" binding:\"required\"`\n}\n\nfunc (rt *Router) targetBindTagsByFE(c *gin.Context) {\n\tvar f targetTagsForm\n\tvar err error\n\tvar failedResults = make(map[string]string)\n\tginx.BindJSON(c, &f)\n\n\tif len(f.Idents) == 0 && len(f.HostIps) == 0 {\n\t\tginx.Bomb(http.StatusBadRequest, \"idents or host_ips must be provided\")\n\t}\n\t// Acquire idents by idents and hostIps\n\tfailedResults, f.Idents, err = models.TargetsGetIdentsByIdentsAndHostIps(rt.Ctx, f.Idents, f.HostIps)\n\tif err != nil {\n\t\tginx.Bomb(http.StatusBadRequest, err.Error())\n\t}\n\n\trt.checkTargetPerm(c, f.Idents)\n\n\tginx.NewRender(c).Data(rt.targetBindTags(f, failedResults))\n}\n\nfunc (rt *Router) targetBindTagsByService(c *gin.Context) {\n\tvar f targetTagsForm\n\tvar err error\n\tvar failedResults = make(map[string]string)\n\tginx.BindJSON(c, &f)\n\n\tif len(f.Idents) == 0 && len(f.HostIps) == 0 {\n\t\tginx.Bomb(http.StatusBadRequest, \"idents or host_ips must be provided\")\n\t}\n\t// Acquire idents by idents and hostIps\n\tfailedResults, f.Idents, err = models.TargetsGetIdentsByIdentsAndHostIps(rt.Ctx, f.Idents, f.HostIps)\n\tif err != nil {\n\t\tginx.Bomb(http.StatusBadRequest, err.Error())\n\t}\n\n\tginx.NewRender(c).Data(rt.targetBindTags(f, failedResults))\n}\n\nfunc (rt *Router) targetBindTags(f targetTagsForm, failedIdents map[string]string) (map[string]string, error) {\n\t// 1. Check tags\n\tif err := rt.validateTags(f.Tags); err != nil {\n\t\treturn nil, err\n\t}\n\n\t// 2. Acquire targets by idents\n\ttargets, err := models.TargetsGetByIdents(rt.Ctx, f.Idents)\n\tif err != nil {\n\t\treturn nil, err\n\t}\n\n\t// 3. Add tags to targets\n\tfor _, target := range targets {\n\t\tif err = rt.addTagsToTarget(target, f.Tags); err != nil {\n\t\t\tfailedIdents[target.Ident] = err.Error()\n\t\t}\n\t}\n\n\treturn failedIdents, nil\n}\n\nfunc (rt *Router) validateTags(tags []string) error {\n\tfor _, tag := range tags {\n\t\tarr := strings.Split(tag, \"=\")\n\t\tif len(arr) != 2 {\n\t\t\treturn fmt.Errorf(\"invalid tag format: %s (expected format: key=value)\", tag)\n\t\t}\n\n\t\tkey, value := strings.TrimSpace(arr[0]), strings.TrimSpace(arr[1])\n\t\tif key == \"\" {\n\t\t\treturn fmt.Errorf(\"invalid tag: key is empty in tag %s\", tag)\n\t\t}\n\t\tif value == \"\" {\n\t\t\treturn fmt.Errorf(\"invalid tag: value is empty in tag %s\", tag)\n\t\t}\n\n\t\tif strings.Contains(key, \".\") {\n\t\t\treturn fmt.Errorf(\"invalid tag key: %s (key cannot contain '.')\", key)\n\t\t}\n\n\t\tif strings.Contains(key, \"-\") {\n\t\t\treturn fmt.Errorf(\"invalid tag key: %s (key cannot contain '-')\", key)\n\t\t}\n\n\t\tif !model.LabelNameRE.MatchString(key) {\n\t\t\treturn fmt.Errorf(\"invalid tag key: %s \"+\n\t\t\t\t\"(key must start with a letter or underscore, followed by letters, digits, or underscores)\", key)\n\t\t}\n\t}\n\n\treturn nil\n}\n\nfunc (rt *Router) addTagsToTarget(target *models.Target, tags []string) error {\n\tfor _, tag := range tags {\n\t\ttagKey := strings.Split(tag, \"=\")[0]\n\t\tif _, exist := target.TagsMap[tagKey]; exist {\n\t\t\treturn fmt.Errorf(\"duplicate tagkey(%s)\", tagKey)\n\t\t}\n\t}\n\n\treturn target.AddTags(rt.Ctx, tags)\n}\n\nfunc (rt *Router) targetUnbindTagsByFE(c *gin.Context) {\n\tvar f targetTagsForm\n\tvar err error\n\tvar failedResults = make(map[string]string)\n\tginx.BindJSON(c, &f)\n\n\tif len(f.Idents) == 0 && len(f.HostIps) == 0 {\n\t\tginx.Bomb(http.StatusBadRequest, \"idents or host_ips must be provided\")\n\t}\n\t// Acquire idents by idents and hostIps\n\tfailedResults, f.Idents, err = models.TargetsGetIdentsByIdentsAndHostIps(rt.Ctx, f.Idents, f.HostIps)\n\tif err != nil {\n\t\tginx.Bomb(http.StatusBadRequest, err.Error())\n\t}\n\n\trt.checkTargetPerm(c, f.Idents)\n\n\tginx.NewRender(c).Data(rt.targetUnbindTags(f, failedResults))\n}\n\nfunc (rt *Router) targetUnbindTagsByService(c *gin.Context) {\n\tvar f targetTagsForm\n\tvar err error\n\tvar failedResults = make(map[string]string)\n\tginx.BindJSON(c, &f)\n\n\tif len(f.Idents) == 0 && len(f.HostIps) == 0 {\n\t\tginx.Bomb(http.StatusBadRequest, \"idents or host_ips must be provided\")\n\t}\n\t// Acquire idents by idents and hostIps\n\tfailedResults, f.Idents, err = models.TargetsGetIdentsByIdentsAndHostIps(rt.Ctx, f.Idents, f.HostIps)\n\tif err != nil {\n\t\tginx.Bomb(http.StatusBadRequest, err.Error())\n\t}\n\n\tginx.NewRender(c).Data(rt.targetUnbindTags(f, failedResults))\n}\n\nfunc (rt *Router) targetUnbindTags(f targetTagsForm, failedIdents map[string]string) (map[string]string, error) {\n\t// 1. Acquire targets by idents\n\ttargets, err := models.TargetsGetByIdents(rt.Ctx, f.Idents)\n\tif err != nil {\n\t\treturn nil, err\n\t}\n\n\t// 2. Remove tags from targets\n\tfor _, target := range targets {\n\t\terr = target.DelTags(rt.Ctx, f.Tags)\n\t\tif err != nil {\n\t\t\tfailedIdents[target.Ident] = err.Error()\n\t\t\tcontinue\n\t\t}\n\t}\n\n\treturn failedIdents, nil\n}\n\ntype targetNoteForm struct {\n\tIdents []string `json:\"idents\" binding:\"required_without=HostIps\"`\n\tHostIps []string `json:\"host_ips\" binding:\"required_without=Idents\"`\n\tNote string `json:\"note\"`\n}\n\nfunc (rt *Router) targetUpdateNote(c *gin.Context) {\n\tvar f targetNoteForm\n\tvar err error\n\tvar failedResults = make(map[string]string)\n\tginx.BindJSON(c, &f)\n\n\tif len(f.Idents) == 0 && len(f.HostIps) == 0 {\n\t\tginx.Bomb(http.StatusBadRequest, \"idents or host_ips must be provided\")\n\t}\n\n\t// Acquire idents by idents and hostIps\n\tfailedResults, f.Idents, err = models.TargetsGetIdentsByIdentsAndHostIps(rt.Ctx, f.Idents, f.HostIps)\n\tif err != nil {\n\t\tginx.Bomb(http.StatusBadRequest, err.Error())\n\t}\n\n\trt.checkTargetPerm(c, f.Idents)\n\n\tginx.NewRender(c).Data(failedResults, models.TargetUpdateNote(rt.Ctx, f.Idents, f.Note))\n}\n\nfunc (rt *Router) targetUpdateNoteByService(c *gin.Context) {\n\tvar f targetNoteForm\n\tvar err error\n\tvar failedResults = make(map[string]string)\n\tginx.BindJSON(c, &f)\n\n\tif len(f.Idents) == 0 && len(f.HostIps) == 0 {\n\t\tginx.Bomb(http.StatusBadRequest, \"idents or host_ips must be provided\")\n\t}\n\n\t// Acquire idents by idents and hostIps\n\tfailedResults, f.Idents, err = models.TargetsGetIdentsByIdentsAndHostIps(rt.Ctx, f.Idents, f.HostIps)\n\tif err != nil {\n\t\tginx.Bomb(http.StatusBadRequest, err.Error())\n\t}\n\n\tginx.NewRender(c).Data(failedResults, models.TargetUpdateNote(rt.Ctx, f.Idents, f.Note))\n}\n\ntype targetBgidForm struct {\n\tIdents []string `json:\"idents\" binding:\"required_without=HostIps\"`\n\tHostIps []string `json:\"host_ips\" binding:\"required_without=Idents\"`\n\tBgid int64 `json:\"bgid\"`\n}\n\ntype targetBgidsForm struct {\n\tIdents []string `json:\"idents\" binding:\"required_without=HostIps\"`\n\tHostIps []string `json:\"host_ips\" binding:\"required_without=Idents\"`\n\tBgids []int64 `json:\"bgids\"`\n\tTags []string `json:\"tags\"`\n\tAction string `json:\"action\"` // add del reset\n}\n\nfunc haveNeverGroupedIdent(ctx *ctx.Context, idents []string) (bool, error) {\n\tfor _, ident := range idents {\n\t\tbgids, err := models.TargetGroupIdsGetByIdent(ctx, ident)\n\t\tif err != nil {\n\t\t\treturn false, err\n\t\t}\n\n\t\tif len(bgids) <= 0 {\n\t\t\treturn true, nil\n\t\t}\n\t}\n\n\treturn false, nil\n}\n\nfunc (rt *Router) targetBindBgids(c *gin.Context) {\n\tvar f targetBgidsForm\n\tvar err error\n\tvar failedResults = make(map[string]string)\n\tginx.BindJSON(c, &f)\n\n\tif len(f.Idents) == 0 && len(f.HostIps) == 0 {\n\t\tginx.Bomb(http.StatusBadRequest, \"idents or host_ips must be provided\")\n\t}\n\n\t// Acquire idents by idents and hostIps\n\tfailedResults, f.Idents, err = models.TargetsGetIdentsByIdentsAndHostIps(rt.Ctx, f.Idents, f.HostIps)\n\tif err != nil {\n\t\tginx.Bomb(http.StatusBadRequest, err.Error())\n\t}\n\n\tuser := c.MustGet(\"user\").(*models.User)\n\tif !user.IsAdmin() {\n\t\t// 普通用户,检查用户是否有权限操作所有请求的业务组\n\t\texisting, _, err := models.SeparateTargetIdents(rt.Ctx, f.Idents)\n\t\tginx.Dangerous(err)\n\t\trt.checkTargetPerm(c, existing)\n\n\t\tvar groupIds []int64\n\t\tif f.Action == \"reset\" {\n\t\t\t// 如果是复写,则需要检查用户是否有权限操作机器之前的业务组\n\t\t\tbgids, err := models.TargetGroupIdsGetByIdents(rt.Ctx, f.Idents)\n\t\t\tginx.Dangerous(err)\n\n\t\t\tgroupIds = append(groupIds, bgids...)\n\t\t}\n\t\tgroupIds = append(groupIds, f.Bgids...)\n\n\t\tfor _, bgid := range groupIds {\n\t\t\tbg := BusiGroup(rt.Ctx, bgid)\n\t\t\tcan, err := user.CanDoBusiGroup(rt.Ctx, bg, \"rw\")\n\t\t\tginx.Dangerous(err)\n\n\t\t\tif !can {\n\t\t\t\tginx.Bomb(http.StatusForbidden, \"forbidden\")\n\t\t\t}\n\t\t}\n\t\tisNeverGrouped, checkErr := haveNeverGroupedIdent(rt.Ctx, f.Idents)\n\t\tginx.Dangerous(checkErr)\n\n\t\tif isNeverGrouped {\n\t\t\tcan, err := user.CheckPerm(rt.Ctx, \"/targets/bind\")\n\t\t\tginx.Dangerous(err)\n\t\t\tif !can {\n\t\t\t\tginx.Bomb(http.StatusForbidden, \"forbidden\")\n\t\t\t}\n\t\t}\n\t}\n\n\tswitch f.Action {\n\tcase \"add\":\n\t\tginx.NewRender(c).Data(failedResults, models.TargetBindBgids(rt.Ctx, f.Idents, f.Bgids, f.Tags))\n\tcase \"del\":\n\t\tginx.NewRender(c).Data(failedResults, models.TargetUnbindBgids(rt.Ctx, f.Idents, f.Bgids))\n\tcase \"reset\":\n\t\tginx.NewRender(c).Data(failedResults, models.TargetOverrideBgids(rt.Ctx, f.Idents, f.Bgids, f.Tags))\n\tdefault:\n\t\tginx.Bomb(http.StatusBadRequest, \"invalid action\")\n\t}\n}\n\nfunc (rt *Router) targetUpdateBgidByService(c *gin.Context) {\n\tvar f targetBgidForm\n\tvar err error\n\tvar failedResults = make(map[string]string)\n\tginx.BindJSON(c, &f)\n\n\tif len(f.Idents) == 0 && len(f.HostIps) == 0 {\n\t\tginx.Bomb(http.StatusBadRequest, \"idents or host_ips must be provided\")\n\t}\n\n\t// Acquire idents by idents and hostIps\n\tfailedResults, f.Idents, err = models.TargetsGetIdentsByIdentsAndHostIps(rt.Ctx, f.Idents, f.HostIps)\n\tif err != nil {\n\t\tginx.Bomb(http.StatusBadRequest, err.Error())\n\t}\n\n\tginx.NewRender(c).Data(failedResults, models.TargetOverrideBgids(rt.Ctx, f.Idents, []int64{f.Bgid}, nil))\n}\n\ntype identsForm struct {\n\tIdents []string `json:\"idents\" binding:\"required_without=HostIps\"`\n\tHostIps []string `json:\"host_ips\" binding:\"required_without=Idents\"`\n}\n\nfunc (rt *Router) targetDel(c *gin.Context) {\n\tvar f identsForm\n\tvar err error\n\tvar failedResults = make(map[string]string)\n\tginx.BindJSON(c, &f)\n\n\tif len(f.Idents) == 0 && len(f.HostIps) == 0 {\n\t\tginx.Bomb(http.StatusBadRequest, \"idents or host_ips must be provided\")\n\t}\n\n\t// Acquire idents by idents and hostIps\n\tfailedResults, f.Idents, err = models.TargetsGetIdentsByIdentsAndHostIps(rt.Ctx, f.Idents, f.HostIps)\n\tif err != nil {\n\t\tginx.Bomb(http.StatusBadRequest, err.Error())\n\t}\n\n\tginx.NewRender(c).Data(failedResults, models.TargetDel(rt.Ctx, f.Idents, rt.TargetDeleteHook))\n}\n\nfunc (rt *Router) targetDelByService(c *gin.Context) {\n\tvar f identsForm\n\tvar err error\n\tvar failedResults = make(map[string]string)\n\tginx.BindJSON(c, &f)\n\n\tif len(f.Idents) == 0 && len(f.HostIps) == 0 {\n\t\tginx.Bomb(http.StatusBadRequest, \"idents or host_ips must be provided\")\n\t}\n\n\t// Acquire idents by idents and hostIps\n\tfailedResults, f.Idents, err = models.TargetsGetIdentsByIdentsAndHostIps(rt.Ctx, f.Idents, f.HostIps)\n\tif err != nil {\n\t\tginx.Bomb(http.StatusBadRequest, err.Error())\n\t}\n\n\tginx.NewRender(c).Data(failedResults, models.TargetDel(rt.Ctx, f.Idents, rt.TargetDeleteHook))\n}\n\nfunc (rt *Router) checkTargetPerm(c *gin.Context, idents []string) {\n\tuser := c.MustGet(\"user\").(*models.User)\n\tnopri, err := user.NopriIdents(rt.Ctx, idents)\n\tginx.Dangerous(err)\n\n\tif len(nopri) > 0 {\n\t\tginx.Bomb(http.StatusForbidden, \"forbidden\")\n\t}\n}\n\nfunc (rt *Router) targetsOfAlertRule(c *gin.Context) {\n\tengineName := ginx.QueryStr(c, \"engine_name\", \"\")\n\tm, err := models.GetTargetsOfHostAlertRule(rt.Ctx, engineName)\n\tret := make(map[string]map[int64][]string)\n\tfor en, v := range m {\n\t\tif en != engineName {\n\t\t\tcontinue\n\t\t}\n\n\t\tret[en] = make(map[int64][]string)\n\t\tfor rid, idents := range v {\n\t\t\tret[en][rid] = idents\n\t\t}\n\t}\n\n\tginx.NewRender(c).Data(ret, err)\n}\n\nfunc (rt *Router) checkTargetsExistByIndent(idents []string) {\n\tnotExists, err := models.TargetNoExistIdents(rt.Ctx, idents)\n\tginx.Dangerous(err)\n\n\tif len(notExists) > 0 {\n\t\tginx.Bomb(http.StatusBadRequest, \"targets not exist: %s\", strings.Join(notExists, \", \"))\n\t}\n}\n\nfunc (rt *Router) targetsOfHostQuery(c *gin.Context) {\n\tvar queries []models.HostQuery\n\tginx.BindJSON(c, &queries)\n\n\thostsQuery := models.GetHostsQuery(queries)\n\tsession := models.TargetFilterQueryBuild(rt.Ctx, hostsQuery, 0, 0)\n\tvar lst []*models.Target\n\terr := session.Find(&lst).Error\n\tif err != nil {\n\t\tginx.Bomb(http.StatusInternalServerError, err.Error())\n\t}\n\n\tginx.NewRender(c).Data(lst, nil)\n}\n\nfunc (rt *Router) targetStats(c *gin.Context) {\n\tbgids := strx.IdsInt64ForAPI(ginx.QueryStr(c, \"gids\", \"\"), \",\")\n\n\tvar err error\n\tif len(bgids) > 0 {\n\t\tfor _, gid := range bgids {\n\t\t\tif gid > 0 {\n\t\t\t\trt.bgroCheck(c, gid)\n\t\t\t}\n\t\t}\n\t} else {\n\t\tuser := c.MustGet(\"user\").(*models.User)\n\t\tif !user.IsAdmin() {\n\t\t\tbgids, err = models.MyBusiGroupIds(rt.Ctx, user.Id)\n\t\t\tginx.Dangerous(err)\n\t\t\tbgids = append(bgids, 0)\n\t\t}\n\t}\n\n\ttargets := rt.TargetCache.GetAll()\n\tnow := time.Now().Unix()\n\n\tvar count, aliveCount, deadCount int64\n\tmemUsage := map[string]int64{\"-1\": 0, \"20\": 0, \"40\": 0, \"60\": 0, \"80\": 0, \"100\": 0}\n\tcpuUsage := map[string]int64{\"-1\": 0, \"20\": 0, \"40\": 0, \"60\": 0, \"80\": 0, \"100\": 0}\n\tversions := make(map[string]int64)\n\n\tbgidSet := make(map[int64]struct{}, len(bgids))\n\tfor _, gid := range bgids {\n\t\tbgidSet[gid] = struct{}{}\n\t}\n\thasBgidFilter := len(bgids) > 0\n\n\tfor _, t := range targets {\n\t\tif hasBgidFilter {\n\t\t\tmatched := false\n\t\t\tif _, ok := bgidSet[0]; ok && len(t.GroupIds) == 0 {\n\t\t\t\tmatched = true\n\t\t\t}\n\t\t\tif !matched {\n\t\t\t\tfor _, gid := range t.GroupIds {\n\t\t\t\t\tif _, ok := bgidSet[gid]; ok {\n\t\t\t\t\t\tmatched = true\n\t\t\t\t\t\tbreak\n\t\t\t\t\t}\n\t\t\t\t}\n\t\t\t}\n\t\t\tif !matched {\n\t\t\t\tcontinue\n\t\t\t}\n\t\t}\n\n\t\tcount++\n\n\t\tif now-t.BeatTime < 180 {\n\t\t\taliveCount++\n\t\t} else {\n\t\t\tdeadCount++\n\t\t}\n\n\t\tif t.CpuNum <= 0 {\n\t\t\tcpuUsage[\"-1\"]++\n\t\t\tmemUsage[\"-1\"]++\n\t\t} else {\n\t\t\tcpuUsage[usageBucket(t.CpuUtil)]++\n\t\t\tmemUsage[usageBucket(t.MemUtil)]++\n\t\t}\n\n\t\tver := t.AgentVersion\n\t\tif ver == \"\" {\n\t\t\tver = \"unknown\"\n\t\t}\n\t\tversions[ver]++\n\t}\n\n\tginx.NewRender(c).Data(gin.H{\n\t\t\"count\": count,\n\t\t\"alive_count\": aliveCount,\n\t\t\"dead_count\": deadCount,\n\t\t\"mem_usage\": memUsage,\n\t\t\"cpu_usage\": cpuUsage,\n\t\t\"versions\": versions,\n\t}, nil)\n}\n\nfunc usageBucket(val float64) string {\n\tswitch {\n\tcase val < 20:\n\t\treturn \"20\"\n\tcase val < 40:\n\t\treturn \"40\"\n\tcase val < 60:\n\t\treturn \"60\"\n\tcase val < 80:\n\t\treturn \"80\"\n\tdefault:\n\t\treturn \"100\"\n\t}\n}\n\nfunc (rt *Router) targetUpdate(c *gin.Context) {\n\tvar f idents.TargetUpdate\n\tginx.BindJSON(c, &f)\n\n\tginx.NewRender(c).Message(rt.IdentSet.UpdateTargets(f.Lst, f.Now))\n}\n"
},
{
"path": "center/router/router_task.go",
"content": "package router\n\nimport (\n\t\"strings\"\n\t\"time\"\n\n\t\"github.com/ccfos/nightingale/v6/alert/sender\"\n\t\"github.com/ccfos/nightingale/v6/models\"\n\t\"github.com/ccfos/nightingale/v6/pkg/strx\"\n\t\"github.com/ccfos/nightingale/v6/pkg/ginx\"\n\n\t\"github.com/gin-gonic/gin\"\n\t\"github.com/toolkits/pkg/i18n\"\n)\n\nfunc (rt *Router) taskGets(c *gin.Context) {\n\tbgid := ginx.UrlParamInt64(c, \"id\")\n\tmine := ginx.QueryBool(c, \"mine\", false)\n\tdays := ginx.QueryInt64(c, \"days\", 7)\n\tlimit := ginx.QueryInt(c, \"limit\", 20)\n\tquery := ginx.QueryStr(c, \"query\", \"\")\n\tuser := c.MustGet(\"user\").(*models.User)\n\n\tcreator := \"\"\n\tif mine {\n\t\tcreator = user.Username\n\t}\n\n\tbeginTime := time.Now().Unix() - days*24*3600\n\n\ttotal, err := models.TaskRecordTotal(rt.Ctx, []int64{bgid}, beginTime, creator, query)\n\tginx.Dangerous(err)\n\n\tlist, err := models.TaskRecordGets(rt.Ctx, []int64{bgid}, beginTime, creator, query, limit, ginx.Offset(c, limit))\n\tginx.Dangerous(err)\n\n\tginx.NewRender(c).Data(gin.H{\n\t\t\"total\": total,\n\t\t\"list\": list,\n\t}, nil)\n}\n\nfunc (rt *Router) taskGetsByGids(c *gin.Context) {\n\tgids := strx.IdsInt64ForAPI(ginx.QueryStr(c, \"gids\", \"\"), \",\")\n\tif len(gids) > 0 {\n\t\tfor _, gid := range gids {\n\t\t\trt.bgroCheck(c, gid)\n\t\t}\n\t} else {\n\t\tme := c.MustGet(\"user\").(*models.User)\n\t\tif !me.IsAdmin() {\n\t\t\tvar err error\n\t\t\tgids, err = models.MyBusiGroupIds(rt.Ctx, me.Id)\n\t\t\tginx.Dangerous(err)\n\n\t\t\tif len(gids) == 0 {\n\t\t\t\tginx.NewRender(c).Data([]int{}, nil)\n\t\t\t\treturn\n\t\t\t}\n\t\t}\n\t}\n\n\tmine := ginx.QueryBool(c, \"mine\", false)\n\tdays := ginx.QueryInt64(c, \"days\", 7)\n\tlimit := ginx.QueryInt(c, \"limit\", 20)\n\tquery := ginx.QueryStr(c, \"query\", \"\")\n\tuser := c.MustGet(\"user\").(*models.User)\n\n\tcreator := \"\"\n\tif mine {\n\t\tcreator = user.Username\n\t}\n\n\tbeginTime := time.Now().Unix() - days*24*3600\n\n\ttotal, err := models.TaskRecordTotal(rt.Ctx, gids, beginTime, creator, query)\n\tginx.Dangerous(err)\n\n\tlist, err := models.TaskRecordGets(rt.Ctx, gids, beginTime, creator, query, limit, ginx.Offset(c, limit))\n\tginx.Dangerous(err)\n\n\tginx.NewRender(c).Data(gin.H{\n\t\t\"total\": total,\n\t\t\"list\": list,\n\t}, nil)\n}\n\nfunc (rt *Router) taskRecordAdd(c *gin.Context) {\n\tvar f *models.TaskRecord\n\tginx.BindJSON(c, &f)\n\tginx.NewRender(c).Message(f.Add(rt.Ctx))\n}\n\nfunc (rt *Router) taskAdd(c *gin.Context) {\n\tif !rt.Ibex.Enable {\n\t\tginx.Bomb(400, i18n.Sprintf(c.GetHeader(\"X-Language\"), \"This functionality has not been enabled. Please contact the system administrator to activate it.\"))\n\t\treturn\n\t}\n\n\tvar f models.TaskForm\n\tginx.BindJSON(c, &f)\n\t// 把 f.Hosts 中的空字符串过滤掉\n\thosts := make([]string, 0, len(f.Hosts))\n\tfor i := range f.Hosts {\n\t\tif strings.TrimSpace(f.Hosts[i]) != \"\" {\n\t\t\thosts = append(hosts, strings.TrimSpace(f.Hosts[i]))\n\t\t}\n\t}\n\tf.Hosts = hosts\n\n\tbgid := ginx.UrlParamInt64(c, \"id\")\n\tuser := c.MustGet(\"user\").(*models.User)\n\tf.Creator = user.Username\n\n\trt.checkTargetsExistByIndent(f.Hosts)\n\n\terr := f.Verify()\n\tginx.Dangerous(err)\n\n\tf.HandleFH(f.Hosts[0])\n\n\t// check permission\n\trt.checkTargetPerm(c, f.Hosts)\n\n\t// call ibex\n\ttaskId, err := sender.TaskAdd(f, user.Username, rt.Ctx.IsCenter)\n\tginx.Dangerous(err)\n\n\tif taskId <= 0 {\n\t\tginx.Dangerous(\"created task.id is zero\")\n\t}\n\n\t// write db\n\trecord := models.TaskRecord{\n\t\tId: taskId,\n\t\tGroupId: bgid,\n\t\tTitle: f.Title,\n\t\tAccount: f.Account,\n\t\tBatch: f.Batch,\n\t\tTolerance: f.Tolerance,\n\t\tTimeout: f.Timeout,\n\t\tPause: f.Pause,\n\t\tScript: f.Script,\n\t\tArgs: f.Args,\n\t\tCreateAt: time.Now().Unix(),\n\t\tCreateBy: f.Creator,\n\t}\n\n\terr = record.Add(rt.Ctx)\n\tginx.NewRender(c).Data(taskId, err)\n}\n"
},
{
"path": "center/router/router_task_tpl.go",
"content": "package router\n\nimport (\n\t\"net/http\"\n\t\"sort\"\n\t\"strings\"\n\t\"time\"\n\n\t\"github.com/ccfos/nightingale/v6/models\"\n\t\"github.com/ccfos/nightingale/v6/pkg/strx\"\n\t\"github.com/ccfos/nightingale/v6/pkg/ginx\"\n\n\t\"github.com/gin-gonic/gin\"\n\t\"github.com/toolkits/pkg/i18n\"\n\t\"github.com/toolkits/pkg/str\"\n)\n\nfunc (rt *Router) taskTplGets(c *gin.Context) {\n\tquery := ginx.QueryStr(c, \"query\", \"\")\n\tlimit := ginx.QueryInt(c, \"limit\", 20)\n\tgroupId := ginx.UrlParamInt64(c, \"id\")\n\n\ttotal, err := models.TaskTplTotal(rt.Ctx, []int64{groupId}, query)\n\tginx.Dangerous(err)\n\n\tlist, err := models.TaskTplGets(rt.Ctx, []int64{groupId}, query, limit, ginx.Offset(c, limit))\n\tginx.Dangerous(err)\n\tmodels.FillUpdateByNicknames(rt.Ctx, list)\n\n\tginx.NewRender(c).Data(gin.H{\n\t\t\"total\": total,\n\t\t\"list\": list,\n\t}, nil)\n}\n\nfunc (rt *Router) taskTplGetsByGids(c *gin.Context) {\n\tquery := ginx.QueryStr(c, \"query\", \"\")\n\tlimit := ginx.QueryInt(c, \"limit\", 20)\n\n\tgids := strx.IdsInt64ForAPI(ginx.QueryStr(c, \"gids\", \"\"), \",\")\n\tif len(gids) > 0 {\n\t\tfor _, gid := range gids {\n\t\t\trt.bgroCheck(c, gid)\n\t\t}\n\t} else {\n\t\tme := c.MustGet(\"user\").(*models.User)\n\t\tif !me.IsAdmin() {\n\t\t\tvar err error\n\t\t\tgids, err = models.MyBusiGroupIds(rt.Ctx, me.Id)\n\t\t\tginx.Dangerous(err)\n\n\t\t\tif len(gids) == 0 {\n\t\t\t\tginx.NewRender(c).Data([]int{}, nil)\n\t\t\t\treturn\n\t\t\t}\n\t\t}\n\t}\n\n\ttotal, err := models.TaskTplTotal(rt.Ctx, gids, query)\n\tginx.Dangerous(err)\n\n\tlist, err := models.TaskTplGets(rt.Ctx, gids, query, limit, ginx.Offset(c, limit))\n\tginx.Dangerous(err)\n\tmodels.FillUpdateByNicknames(rt.Ctx, list)\n\n\tginx.NewRender(c).Data(gin.H{\n\t\t\"total\": total,\n\t\t\"list\": list,\n\t}, nil)\n}\n\nfunc (rt *Router) taskTplGet(c *gin.Context) {\n\ttid := ginx.UrlParamInt64(c, \"tid\")\n\n\ttpl, err := models.TaskTplGet(rt.Ctx, \"id = ?\", tid)\n\tginx.Dangerous(err)\n\n\tif tpl == nil {\n\t\tginx.Bomb(404, \"no such task template\")\n\t}\n\n\thosts, err := tpl.Hosts(rt.Ctx)\n\n\tginx.NewRender(c).Data(gin.H{\n\t\t\"tpl\": tpl,\n\t\t\"hosts\": hosts,\n\t}, err)\n}\n\nfunc (rt *Router) taskTplGetByService(c *gin.Context) {\n\ttid := ginx.UrlParamInt64(c, \"tid\")\n\n\ttpl, err := models.TaskTplGetById(rt.Ctx, tid)\n\tginx.Dangerous(err)\n\n\tif tpl == nil {\n\t\tginx.Bomb(404, \"no such task template\")\n\t}\n\n\tginx.NewRender(c).Data(tpl, err)\n}\n\nfunc (rt *Router) taskTplGetsByService(c *gin.Context) {\n\tginx.NewRender(c).Data(models.TaskTplGetAll(rt.Ctx))\n}\n\nfunc (rt *Router) taskTplStatistics(c *gin.Context) {\n\tginx.NewRender(c).Data(models.TaskTplStatistics(rt.Ctx))\n}\n\ntype taskTplForm struct {\n\tTitle string `json:\"title\" binding:\"required\"`\n\tBatch int `json:\"batch\"`\n\tTolerance int `json:\"tolerance\"`\n\tTimeout int `json:\"timeout\"`\n\tPause string `json:\"pause\"`\n\tScript string `json:\"script\"`\n\tArgs string `json:\"args\"`\n\tTags []string `json:\"tags\"`\n\tAccount string `json:\"account\"`\n\tHosts []string `json:\"hosts\"`\n}\n\nfunc (f *taskTplForm) Verify() {\n\t// 传入的 f.Hosts 可能是 []string{\"\", \"a\", \"b\"},需要过滤掉空字符串\n\targs := make([]string, 0, len(f.Hosts))\n\tfor _, ident := range f.Hosts {\n\t\tif strings.TrimSpace(ident) != \"\" {\n\t\t\targs = append(args, strings.TrimSpace(ident))\n\t\t}\n\t}\n\n\tf.Hosts = args\n}\n\nfunc (rt *Router) taskTplAdd(c *gin.Context) {\n\tif !rt.Ibex.Enable {\n\t\tginx.Bomb(400, i18n.Sprintf(c.GetHeader(\"X-Language\"), \"This functionality has not been enabled. Please contact the system administrator to activate it.\"))\n\t\treturn\n\t}\n\n\tvar f taskTplForm\n\tginx.BindJSON(c, &f)\n\tf.Verify()\n\n\tuser := c.MustGet(\"user\").(*models.User)\n\tnow := time.Now().Unix()\n\n\trt.checkTargetsExistByIndent(f.Hosts)\n\n\tsort.Strings(f.Tags)\n\n\ttpl := &models.TaskTpl{\n\t\tGroupId: ginx.UrlParamInt64(c, \"id\"),\n\t\tTitle: f.Title,\n\t\tBatch: f.Batch,\n\t\tTolerance: f.Tolerance,\n\t\tTimeout: f.Timeout,\n\t\tPause: f.Pause,\n\t\tScript: f.Script,\n\t\tArgs: f.Args,\n\t\tTags: strings.Join(f.Tags, \" \") + \" \",\n\t\tAccount: f.Account,\n\t\tCreateBy: user.Username,\n\t\tUpdateBy: user.Username,\n\t\tCreateAt: now,\n\t\tUpdateAt: now,\n\t}\n\n\tginx.NewRender(c).Message(tpl.Save(rt.Ctx, f.Hosts))\n}\n\nfunc (rt *Router) taskTplPut(c *gin.Context) {\n\ttid := ginx.UrlParamInt64(c, \"tid\")\n\n\ttpl, err := models.TaskTplGet(rt.Ctx, \"id = ?\", tid)\n\tginx.Dangerous(err)\n\n\tif tpl == nil {\n\t\tginx.NewRender(c).Message(\"no such task template\")\n\t\treturn\n\t}\n\n\tuser := c.MustGet(\"user\").(*models.User)\n\n\tvar f taskTplForm\n\tginx.BindJSON(c, &f)\n\tf.Verify()\n\n\trt.checkTargetsExistByIndent(f.Hosts)\n\n\tsort.Strings(f.Tags)\n\n\ttpl.Title = f.Title\n\ttpl.Batch = f.Batch\n\ttpl.Tolerance = f.Tolerance\n\ttpl.Timeout = f.Timeout\n\ttpl.Pause = f.Pause\n\ttpl.Script = f.Script\n\ttpl.Args = f.Args\n\ttpl.Tags = strings.Join(f.Tags, \" \") + \" \"\n\ttpl.Account = f.Account\n\ttpl.UpdateBy = user.Username\n\ttpl.UpdateAt = time.Now().Unix()\n\n\tginx.NewRender(c).Message(tpl.Update(rt.Ctx, f.Hosts))\n}\n\nfunc (rt *Router) taskTplDel(c *gin.Context) {\n\ttid := ginx.UrlParamInt64(c, \"tid\")\n\n\ttpl, err := models.TaskTplGet(rt.Ctx, \"id = ?\", tid)\n\tginx.Dangerous(err)\n\n\tif tpl == nil {\n\t\tginx.NewRender(c).Message(nil)\n\t\treturn\n\t}\n\n\tids, err := models.GetAlertRuleIdsByTaskId(rt.Ctx, tid)\n\tginx.Dangerous(err)\n\tif len(ids) > 0 {\n\t\tginx.NewRender(c).Message(\"can't del this task tpl, used by alert rule ids(%v) \", ids)\n\t\treturn\n\t}\n\n\tginx.NewRender(c).Message(tpl.Del(rt.Ctx))\n}\n\ntype tplTagsForm struct {\n\tIds []int64 `json:\"ids\" binding:\"required\"`\n\tTags []string `json:\"tags\" binding:\"required\"`\n}\n\nfunc (f *tplTagsForm) Verify() {\n\tif len(f.Ids) == 0 {\n\t\tginx.Bomb(http.StatusBadRequest, \"arg(ids) empty\")\n\t}\n\n\tif len(f.Tags) == 0 {\n\t\tginx.Bomb(http.StatusBadRequest, \"arg(tags) empty\")\n\t}\n\n\tnewTags := make([]string, 0, len(f.Tags))\n\tfor i := 0; i < len(f.Tags); i++ {\n\t\ttag := strings.TrimSpace(f.Tags[i])\n\t\tif tag == \"\" {\n\t\t\tcontinue\n\t\t}\n\n\t\tif str.Dangerous(tag) {\n\t\t\tginx.Bomb(http.StatusBadRequest, \"arg(tags) invalid\")\n\t\t}\n\n\t\tnewTags = append(newTags, tag)\n\t}\n\n\tf.Tags = newTags\n\tif len(f.Tags) == 0 {\n\t\tginx.Bomb(http.StatusBadRequest, \"arg(tags) empty\")\n\t}\n}\n\nfunc (rt *Router) taskTplBindTags(c *gin.Context) {\n\tvar f tplTagsForm\n\tginx.BindJSON(c, &f)\n\tf.Verify()\n\n\tusername := c.MustGet(\"username\").(string)\n\n\tfor i := 0; i < len(f.Ids); i++ {\n\t\ttpl, err := models.TaskTplGet(rt.Ctx, \"id = ?\", f.Ids[i])\n\t\tginx.Dangerous(err)\n\n\t\tif tpl == nil {\n\t\t\tcontinue\n\t\t}\n\n\t\tginx.Dangerous(tpl.AddTags(rt.Ctx, f.Tags, username))\n\t}\n\n\tginx.NewRender(c).Message(nil)\n}\n\nfunc (rt *Router) taskTplUnbindTags(c *gin.Context) {\n\tvar f tplTagsForm\n\tginx.BindJSON(c, &f)\n\tf.Verify()\n\n\tusername := c.MustGet(\"username\").(string)\n\n\tfor i := 0; i < len(f.Ids); i++ {\n\t\ttpl, err := models.TaskTplGet(rt.Ctx, \"id = ?\", f.Ids[i])\n\t\tginx.Dangerous(err)\n\n\t\tif tpl == nil {\n\t\t\tcontinue\n\t\t}\n\n\t\tginx.Dangerous(tpl.DelTags(rt.Ctx, f.Tags, username))\n\t}\n\n\tginx.NewRender(c).Message(nil)\n}\n"
},
{
"path": "center/router/router_tdengine.go",
"content": "package router\n\nimport (\n\t\"fmt\"\n\t\"net/http\"\n\n\t\"github.com/ccfos/nightingale/v6/center/cconf\"\n\t\"github.com/ccfos/nightingale/v6/datasource/tdengine\"\n\t\"github.com/ccfos/nightingale/v6/dscache\"\n\t\"github.com/ccfos/nightingale/v6/models\"\n\t\"github.com/ccfos/nightingale/v6/pkg/ginx\"\n\t\"github.com/gin-gonic/gin\"\n)\n\ntype databasesQueryForm struct {\n\tCate string `json:\"cate\" form:\"cate\"`\n\tDatasourceId int64 `json:\"datasource_id\" form:\"datasource_id\"`\n}\n\nfunc (rt *Router) tdengineDatabases(c *gin.Context) {\n\tvar f databasesQueryForm\n\tginx.BindJSON(c, &f)\n\n\tdatasource, hit := dscache.DsCache.Get(f.Cate, f.DatasourceId)\n\tif _, ok := datasource.(*tdengine.TDengine); !hit || !ok {\n\t\tginx.NewRender(c, http.StatusNotFound).Message(\"No such datasource\")\n\t\treturn\n\t}\n\n\tdatabases, err := datasource.(*tdengine.TDengine).ShowDatabases(rt.Ctx.Ctx)\n\tginx.NewRender(c).Data(databases, err)\n}\n\ntype tablesQueryForm struct {\n\tCate string `json:\"cate\"`\n\tDatasourceId int64 `json:\"datasource_id\" `\n\tDatabase string `json:\"db\"`\n\tIsStable bool `json:\"is_stable\"`\n}\n\ntype Column struct {\n\tName string `json:\"name\"`\n\tType string `json:\"type\"`\n\tSize int `json:\"size\"`\n}\n\n// get tdengine tables\nfunc (rt *Router) tdengineTables(c *gin.Context) {\n\tvar f tablesQueryForm\n\tginx.BindJSON(c, &f)\n\n\tdatasource, hit := dscache.DsCache.Get(f.Cate, f.DatasourceId)\n\tif _, ok := datasource.(*tdengine.TDengine); !hit || !ok {\n\t\tginx.NewRender(c, http.StatusNotFound).Message(\"No such datasource\")\n\t\treturn\n\t}\n\n\tdatabase := fmt.Sprintf(\"%s.tables\", f.Database)\n\tif f.IsStable {\n\t\tdatabase = fmt.Sprintf(\"%s.stables\", f.Database)\n\t}\n\n\ttables, err := datasource.(*tdengine.TDengine).ShowTables(rt.Ctx.Ctx, database)\n\tginx.NewRender(c).Data(tables, err)\n}\n\ntype columnsQueryForm struct {\n\tCate string `json:\"cate\"`\n\tDatasourceId int64 `json:\"datasource_id\" `\n\tDatabase string `json:\"db\"`\n\tTable string `json:\"table\"`\n}\n\nfunc (rt *Router) tdengineColumns(c *gin.Context) {\n\tvar f columnsQueryForm\n\tginx.BindJSON(c, &f)\n\n\tdatasource, hit := dscache.DsCache.Get(f.Cate, f.DatasourceId)\n\tif _, ok := datasource.(*tdengine.TDengine); !hit || !ok {\n\t\tginx.NewRender(c, http.StatusNotFound).Message(\"No such datasource\")\n\t\treturn\n\t}\n\n\tquery := map[string]string{\n\t\t\"database\": f.Database,\n\t\t\"table\": f.Table,\n\t}\n\n\tcolumns, err := datasource.(*tdengine.TDengine).DescribeTable(rt.Ctx.Ctx, query)\n\t// 对齐前端,后续可以将 tdEngine 的查数据的接口都统一\n\ttdColumns := make([]Column, len(columns))\n\tfor i, column := range columns {\n\t\ttdColumns[i] = Column{\n\t\t\tName: column.Field,\n\t\t\tType: column.Type,\n\t\t}\n\t}\n\tginx.NewRender(c).Data(tdColumns, err)\n}\n\n// query sql template\nfunc (rt *Router) QuerySqlTemplate(c *gin.Context) {\n\tcate := ginx.QueryStr(c, \"cate\")\n\tm := make(map[string]string)\n\tswitch cate {\n\tcase models.TDENGINE:\n\t\tm = cconf.TDengineSQLTpl\n\t}\n\tginx.NewRender(c).Data(m, nil)\n}\n"
},
{
"path": "center/router/router_trace_logs.go",
"content": "package router\n\nimport (\n\t\"encoding/json\"\n\t\"fmt\"\n\t\"io\"\n\t\"net/http\"\n\t\"time\"\n\n\t\"github.com/ccfos/nightingale/v6/models\"\n\t\"github.com/ccfos/nightingale/v6/pkg/ginx\"\n\t\"github.com/ccfos/nightingale/v6/pkg/loggrep\"\n\t\"github.com/toolkits/pkg/logger\"\n\n\t\"github.com/gin-gonic/gin\"\n)\n\n// traceLogsPage renders an HTML log viewer page for trace logs.\nfunc (rt *Router) traceLogsPage(c *gin.Context) {\n\ttraceId := ginx.UrlParamStr(c, \"traceid\")\n\tif !loggrep.IsValidTraceID(traceId) {\n\t\tc.String(http.StatusBadRequest, \"invalid trace id format\")\n\t\treturn\n\t}\n\n\tlogs, instance, err := rt.getTraceLogs(traceId)\n\tif err != nil {\n\t\tc.String(http.StatusInternalServerError, \"Error: %v\", err)\n\t\treturn\n\t}\n\n\tc.Header(\"Content-Type\", \"text/html; charset=utf-8\")\n\terr = loggrep.RenderTraceLogsHTML(c.Writer, loggrep.TraceLogsPageData{\n\t\tTraceID: traceId,\n\t\tInstance: instance,\n\t\tLogs: logs,\n\t\tTotal: len(logs),\n\t})\n\tif err != nil {\n\t\tc.String(http.StatusInternalServerError, \"render error: %v\", err)\n\t}\n}\n\n// traceLogsJSON returns JSON for trace logs.\nfunc (rt *Router) traceLogsJSON(c *gin.Context) {\n\ttraceId := ginx.UrlParamStr(c, \"traceid\")\n\tif !loggrep.IsValidTraceID(traceId) {\n\t\tginx.Bomb(200, \"invalid trace id format\")\n\t}\n\n\tlogs, instance, err := rt.getTraceLogs(traceId)\n\tginx.Dangerous(err)\n\n\tginx.NewRender(c).Data(loggrep.EventDetailResp{\n\t\tLogs: logs,\n\t\tInstance: instance,\n\t}, nil)\n}\n\n// getTraceLogs finds the same-engine instances and queries each one\n// until trace logs are found. Trace logs belong to a single instance.\nfunc (rt *Router) getTraceLogs(traceId string) ([]string, string, error) {\n\tkeyword := \"trace_id=\" + traceId\n\tinstance := fmt.Sprintf(\"%s:%d\", rt.Alert.Heartbeat.IP, rt.HTTP.Port)\n\tengineName := rt.Alert.Heartbeat.EngineName\n\n\t// try local first\n\tlogs, err := loggrep.GrepLatestLogFiles(rt.LogDir, keyword)\n\tif err == nil && len(logs) > 0 {\n\t\treturn logs, instance, nil\n\t}\n\n\t// find all instances with the same engineName\n\tservers, err := models.AlertingEngineGetsInstances(rt.Ctx,\n\t\t\"engine_cluster = ? and clock > ?\",\n\t\tengineName, time.Now().Unix()-30)\n\tif err != nil {\n\t\treturn nil, \"\", err\n\t}\n\n\t// loop through remote instances until we find logs\n\tfor _, node := range servers {\n\t\tif node == instance {\n\t\t\tcontinue // already tried local\n\t\t}\n\n\t\tlogs, nodeAddr, err := rt.forwardTraceLogs(node, traceId)\n\t\tif err != nil {\n\t\t\tlogger.Errorf(\"forwardTraceLogs failed: %v\", err)\n\t\t\tcontinue\n\t\t}\n\t\tif len(logs) > 0 {\n\t\t\treturn logs, nodeAddr, nil\n\t\t}\n\t}\n\n\treturn nil, instance, nil\n}\n\nfunc (rt *Router) forwardTraceLogs(node, traceId string) ([]string, string, error) {\n\turl := fmt.Sprintf(\"http://%s/v1/n9e/trace-logs/%s\", node, traceId)\n\treq, err := http.NewRequest(\"GET\", url, nil)\n\tif err != nil {\n\t\treturn nil, node, err\n\t}\n\n\tfor user, pass := range rt.HTTP.APIForService.BasicAuth {\n\t\treq.SetBasicAuth(user, pass)\n\t\tbreak\n\t}\n\n\tclient := &http.Client{Timeout: 15 * time.Second}\n\tresp, err := client.Do(req)\n\tif err != nil {\n\t\treturn nil, node, fmt.Errorf(\"forward to %s failed: %v\", node, err)\n\t}\n\tdefer resp.Body.Close()\n\n\tbody, err := io.ReadAll(io.LimitReader(resp.Body, 10*1024*1024))\n\tif err != nil {\n\t\treturn nil, node, err\n\t}\n\n\tvar result struct {\n\t\tDat loggrep.EventDetailResp `json:\"dat\"`\n\t\tErr string `json:\"err\"`\n\t}\n\tif err := json.Unmarshal(body, &result); err != nil {\n\t\treturn nil, node, err\n\t}\n\tif result.Err != \"\" {\n\t\treturn nil, node, fmt.Errorf(\"%s\", result.Err)\n\t}\n\n\treturn result.Dat.Logs, result.Dat.Instance, nil\n}\n"
},
{
"path": "center/router/router_user.go",
"content": "package router\n\nimport (\n\t\"fmt\"\n\t\"net/http\"\n\t\"strings\"\n\n\t\"github.com/ccfos/nightingale/v6/models\"\n\t\"github.com/ccfos/nightingale/v6/pkg/flashduty\"\n\t\"github.com/ccfos/nightingale/v6/pkg/ormx\"\n\t\"github.com/ccfos/nightingale/v6/pkg/secu\"\n\t\"github.com/ccfos/nightingale/v6/pkg/ginx\"\n\n\t\"github.com/gin-gonic/gin\"\n\t\"github.com/toolkits/pkg/logger\"\n\t\"gorm.io/gorm\"\n)\n\nfunc (rt *Router) userBusiGroupsGets(c *gin.Context) {\n\tuserid := ginx.QueryInt64(c, \"userid\", 0)\n\tusername := ginx.QueryStr(c, \"username\", \"\")\n\n\tif userid == 0 && username == \"\" {\n\t\tginx.Bomb(http.StatusBadRequest, \"userid or username required\")\n\t}\n\n\tvar user *models.User\n\tvar err error\n\tif userid > 0 {\n\t\tuser, err = models.UserGetById(rt.Ctx, userid)\n\t} else {\n\t\tuser, err = models.UserGetByUsername(rt.Ctx, username)\n\t}\n\n\tginx.Dangerous(err)\n\n\tgroups, err := user.BusiGroups(rt.Ctx, 10000, \"\")\n\tginx.NewRender(c).Data(groups, err)\n}\n\nfunc (rt *Router) userFindAll(c *gin.Context) {\n\tlist, err := models.UserGetAll(rt.Ctx)\n\tginx.NewRender(c).Data(list, err)\n}\n\nfunc (rt *Router) userGets(c *gin.Context) {\n\tstime, etime := getTimeRange(c)\n\tlimit := ginx.QueryInt(c, \"limit\", 20)\n\tquery := ginx.QueryStr(c, \"query\", \"\")\n\torder := ginx.QueryStr(c, \"order\", \"username\")\n\tdesc := ginx.QueryBool(c, \"desc\", false)\n\tusernames := strings.Split(ginx.QueryStr(c, \"usernames\", \"\"), \",\")\n\tphones := strings.Split(ginx.QueryStr(c, \"phones\", \"\"), \",\")\n\temails := strings.Split(ginx.QueryStr(c, \"emails\", \"\"), \",\")\n\n\tif len(usernames) == 1 && usernames[0] == \"\" {\n\t\tusernames = []string{}\n\t}\n\n\tif len(phones) == 1 && phones[0] == \"\" {\n\t\tphones = []string{}\n\t}\n\n\tif len(emails) == 1 && emails[0] == \"\" {\n\t\temails = []string{}\n\t}\n\n\tgo rt.UserCache.UpdateUsersLastActiveTime()\n\ttotal, err := models.UserTotal(rt.Ctx, query, stime, etime)\n\tginx.Dangerous(err)\n\n\tlist, err := models.UserGets(rt.Ctx, query, limit, ginx.Offset(c, limit), stime, etime, order, desc, usernames, phones, emails)\n\tginx.Dangerous(err)\n\n\tuser := c.MustGet(\"user\").(*models.User)\n\n\tginx.NewRender(c).Data(gin.H{\n\t\t\"list\": list,\n\t\t\"total\": total,\n\t\t\"admin\": user.IsAdmin(),\n\t}, nil)\n}\n\ntype userAddForm struct {\n\tUsername string `json:\"username\" binding:\"required\"`\n\tPassword string `json:\"password\" binding:\"required\"`\n\tNickname string `json:\"nickname\"`\n\tPhone string `json:\"phone\"`\n\tEmail string `json:\"email\"`\n\tPortrait string `json:\"portrait\"`\n\tRoles []string `json:\"roles\" binding:\"required\"`\n\tContacts ormx.JSONObj `json:\"contacts\"`\n}\n\nfunc (rt *Router) userAddPost(c *gin.Context) {\n\tvar f userAddForm\n\tginx.BindJSON(c, &f)\n\n\tauthPassWord := f.Password\n\tif rt.HTTP.RSA.OpenRSA {\n\t\tdecPassWord, err := secu.Decrypt(f.Password, rt.HTTP.RSA.RSAPrivateKey, rt.HTTP.RSA.RSAPassWord)\n\t\tif err != nil {\n\t\t\tlogger.Errorf(\"RSA Decrypt failed: %v username: %s\", err, f.Username)\n\t\t\tginx.NewRender(c).Message(err)\n\t\t\treturn\n\t\t}\n\t\tauthPassWord = decPassWord\n\t}\n\n\tpassword, err := models.CryptoPass(rt.Ctx, authPassWord)\n\tginx.Dangerous(err)\n\n\tif len(f.Roles) == 0 {\n\t\tginx.Bomb(http.StatusBadRequest, \"roles empty\")\n\t}\n\n\tusername := Username(c)\n\n\tu := models.User{\n\t\tUsername: f.Username,\n\t\tPassword: password,\n\t\tNickname: f.Nickname,\n\t\tPhone: f.Phone,\n\t\tEmail: f.Email,\n\t\tPortrait: f.Portrait,\n\t\tRoles: strings.Join(f.Roles, \" \"),\n\t\tContacts: f.Contacts,\n\t\tCreateBy: username,\n\t\tUpdateBy: username,\n\t}\n\n\tginx.Dangerous(u.Verify())\n\tginx.NewRender(c).Message(u.Add(rt.Ctx))\n}\n\nfunc (rt *Router) userProfileGet(c *gin.Context) {\n\tuser := User(rt.Ctx, ginx.UrlParamInt64(c, \"id\"))\n\tginx.NewRender(c).Data(user, nil)\n}\n\ntype userProfileForm struct {\n\tNickname string `json:\"nickname\"`\n\tPhone string `json:\"phone\"`\n\tEmail string `json:\"email\"`\n\tRoles []string `json:\"roles\"`\n\tContacts ormx.JSONObj `json:\"contacts\"`\n}\n\nfunc (rt *Router) userProfilePutByService(c *gin.Context) {\n\tvar f models.User\n\tginx.BindJSON(c, &f)\n\n\tif len(f.RolesLst) == 0 {\n\t\tginx.Bomb(http.StatusBadRequest, \"roles empty\")\n\t}\n\n\tpassword, err := models.CryptoPass(rt.Ctx, f.Password)\n\tginx.Dangerous(err)\n\n\ttarget := User(rt.Ctx, ginx.UrlParamInt64(c, \"id\"))\n\ttarget.Nickname = f.Nickname\n\ttarget.Password = password\n\ttarget.Phone = f.Phone\n\ttarget.Email = f.Email\n\ttarget.Portrait = f.Portrait\n\ttarget.Roles = strings.Join(f.RolesLst, \" \")\n\ttarget.Contacts = f.Contacts\n\ttarget.UpdateBy = Username(c)\n\n\tginx.NewRender(c).Message(target.UpdateAllFields(rt.Ctx))\n}\n\nfunc (rt *Router) userProfilePut(c *gin.Context) {\n\tvar f userProfileForm\n\tginx.BindJSON(c, &f)\n\n\tif len(f.Roles) == 0 {\n\t\tginx.Bomb(http.StatusBadRequest, \"roles empty\")\n\t}\n\n\ttarget := User(rt.Ctx, ginx.UrlParamInt64(c, \"id\"))\n\toldInfo := models.User{\n\t\tUsername: target.Username,\n\t\tPhone: target.Phone,\n\t\tEmail: target.Email,\n\t}\n\ttarget.Nickname = f.Nickname\n\ttarget.Phone = f.Phone\n\ttarget.Email = f.Email\n\ttarget.Roles = strings.Join(f.Roles, \" \")\n\ttarget.Contacts = f.Contacts\n\ttarget.UpdateBy = c.MustGet(\"username\").(string)\n\n\tif flashduty.NeedSyncUser(rt.Ctx) {\n\t\tflashduty.UpdateUser(rt.Ctx, oldInfo, f.Email, f.Phone)\n\t}\n\n\tginx.NewRender(c).Message(target.UpdateAllFields(rt.Ctx))\n}\n\ntype userPasswordForm struct {\n\tPassword string `json:\"password\" binding:\"required\"`\n}\n\nfunc (rt *Router) userPasswordPut(c *gin.Context) {\n\tvar f userPasswordForm\n\tginx.BindJSON(c, &f)\n\n\ttarget := User(rt.Ctx, ginx.UrlParamInt64(c, \"id\"))\n\n\tauthPassWord := f.Password\n\tif rt.HTTP.RSA.OpenRSA {\n\t\tdecPassWord, err := secu.Decrypt(f.Password, rt.HTTP.RSA.RSAPrivateKey, rt.HTTP.RSA.RSAPassWord)\n\t\tif err != nil {\n\t\t\tlogger.Errorf(\"RSA Decrypt failed: %v username: %s\", err, target.Username)\n\t\t\tginx.NewRender(c).Message(err)\n\t\t\treturn\n\t\t}\n\t\tauthPassWord = decPassWord\n\t}\n\n\tcryptoPass, err := models.CryptoPass(rt.Ctx, authPassWord)\n\tginx.Dangerous(err)\n\n\tginx.NewRender(c).Message(target.UpdatePassword(rt.Ctx, cryptoPass, c.MustGet(\"username\").(string)))\n}\n\nfunc (rt *Router) userDel(c *gin.Context) {\n\tid := ginx.UrlParamInt64(c, \"id\")\n\ttarget, err := models.UserGetById(rt.Ctx, id)\n\tginx.Dangerous(err)\n\n\tif target == nil {\n\t\tginx.NewRender(c).Message(nil)\n\t\treturn\n\t}\n\n\t// 如果要删除的用户是 admin 角色,检查是否是最后一个 admin\n\tif target.IsAdmin() {\n\t\tadminCount, err := models.CountAdminUsers(rt.Ctx)\n\t\tginx.Dangerous(err)\n\n\t\tif adminCount <= 1 {\n\t\t\tginx.Bomb(http.StatusBadRequest, \"Cannot delete the last admin user\")\n\t\t}\n\t}\n\n\tginx.NewRender(c).Message(target.Del(rt.Ctx))\n}\n\nfunc (rt *Router) installDateGet(c *gin.Context) {\n\trootUser, err := models.UserGetByUsername(rt.Ctx, \"root\")\n\tif err != nil {\n\t\tlogger.Errorf(\"get root user failed: %v\", err)\n\t\tginx.NewRender(c).Data(0, nil)\n\t\treturn\n\t}\n\n\tif rootUser == nil {\n\t\tlogger.Errorf(\"root user not found\")\n\t\tginx.NewRender(c).Data(0, nil)\n\t\treturn\n\t}\n\n\tginx.NewRender(c).Data(rootUser.CreateAt, nil)\n}\n\n// usersPhoneEncrypt 统一手机号加密\nfunc (rt *Router) usersPhoneEncrypt(c *gin.Context) {\n\tusers, err := models.UserGetAll(rt.Ctx)\n\tif err != nil {\n\t\tginx.NewRender(c).Message(fmt.Errorf(\"get users failed: %v\", err))\n\t\treturn\n\t}\n\n\t// 获取RSA密钥\n\t_, publicKey, _, err := models.GetRSAKeys(rt.Ctx)\n\tif err != nil {\n\t\tginx.NewRender(c).Message(fmt.Errorf(\"get RSA keys failed: %v\", err))\n\t\treturn\n\t}\n\n\t// 先启用手机号加密功能\n\terr = models.SetPhoneEncryptionEnabled(rt.Ctx, true)\n\tif err != nil {\n\t\tginx.NewRender(c).Message(fmt.Errorf(\"enable phone encryption failed: %v\", err))\n\t\treturn\n\t}\n\n\t// 刷新配置缓存\n\terr = models.RefreshPhoneEncryptionCache(rt.Ctx)\n\tif err != nil {\n\t\tlogger.Errorf(\"Failed to refresh phone encryption cache: %v\", err)\n\t\t// 回滚配置\n\t\tmodels.SetPhoneEncryptionEnabled(rt.Ctx, false)\n\t\tginx.NewRender(c).Message(fmt.Errorf(\"refresh cache failed: %v\", err))\n\t\treturn\n\t}\n\n\tsuccessCount := 0\n\tfailCount := 0\n\tvar failedUsers []string\n\n\t// 使用事务处理所有用户的手机号加密\n\terr = models.DB(rt.Ctx).Transaction(func(tx *gorm.DB) error {\n\t\t// 对每个用户的手机号进行加密\n\t\tfor _, user := range users {\n\t\t\tif user.Phone == \"\" {\n\t\t\t\tcontinue\n\t\t\t}\n\n\t\t\tif isPhoneEncrypted(user.Phone) {\n\t\t\t\tcontinue\n\t\t\t}\n\n\t\t\tencryptedPhone, err := secu.EncryptValue(user.Phone, publicKey)\n\t\t\tif err != nil {\n\t\t\t\tlogger.Errorf(\"Failed to encrypt phone for user %s: %v\", user.Username, err)\n\t\t\t\tfailCount++\n\t\t\t\tfailedUsers = append(failedUsers, user.Username)\n\t\t\t\tcontinue\n\t\t\t}\n\n\t\t\terr = tx.Model(&models.User{}).Where(\"id = ?\", user.Id).Update(\"phone\", encryptedPhone).Error\n\t\t\tif err != nil {\n\t\t\t\tlogger.Errorf(\"Failed to update phone for user %s: %v\", user.Username, err)\n\t\t\t\tfailCount++\n\t\t\t\tfailedUsers = append(failedUsers, user.Username)\n\t\t\t\tcontinue\n\t\t\t}\n\n\t\t\tsuccessCount++\n\t\t\tlogger.Debugf(\"Successfully encrypted phone for user %s\", user.Username)\n\t\t}\n\n\t\t// 如果有失败的用户,回滚事务\n\t\tif failCount > 0 {\n\t\t\treturn fmt.Errorf(\"encrypt failed users: %d, failed users: %v\", failCount, failedUsers)\n\t\t}\n\n\t\treturn nil\n\t})\n\n\tif err != nil {\n\t\t// 加密失败,回滚配置\n\t\tmodels.SetPhoneEncryptionEnabled(rt.Ctx, false)\n\t\tmodels.RefreshPhoneEncryptionCache(rt.Ctx)\n\t\tginx.NewRender(c).Message(fmt.Errorf(\"encrypt phone failed: %v\", err))\n\t\treturn\n\t}\n\n\tginx.NewRender(c).Data(gin.H{\n\t\t\"success_count\": successCount,\n\t\t\"fail_count\": failCount,\n\t}, nil)\n}\n\nfunc (rt *Router) usersPhoneDecryptRefresh(c *gin.Context) {\n\terr := models.RefreshPhoneEncryptionCache(rt.Ctx)\n\tif err != nil {\n\t\tginx.NewRender(c).Message(fmt.Errorf(\"refresh phone encryption cache failed: %v\", err))\n\t\treturn\n\t}\n\n\tginx.NewRender(c).Message(nil)\n}\n\n// usersPhoneDecrypt 统一手机号解密\nfunc (rt *Router) usersPhoneDecrypt(c *gin.Context) {\n\t// 先关闭手机号加密功能\n\terr := models.SetPhoneEncryptionEnabled(rt.Ctx, false)\n\tif err != nil {\n\t\tginx.NewRender(c).Message(fmt.Errorf(\"disable phone encryption failed: %v\", err))\n\t\treturn\n\t}\n\n\t// 刷新配置缓存\n\terr = models.RefreshPhoneEncryptionCache(rt.Ctx)\n\tif err != nil {\n\t\tlogger.Errorf(\"Failed to refresh phone encryption cache: %v\", err)\n\t\t// 回滚配置\n\t\tmodels.SetPhoneEncryptionEnabled(rt.Ctx, true)\n\t\tginx.NewRender(c).Message(fmt.Errorf(\"refresh cache failed: %v\", err))\n\t\treturn\n\t}\n\n\t// 获取所有用户(此时加密开关已关闭,直接读取数据库原始数据)\n\tvar users []*models.User\n\terr = models.DB(rt.Ctx).Find(&users).Error\n\tif err != nil {\n\t\t// 回滚配置\n\t\tmodels.SetPhoneEncryptionEnabled(rt.Ctx, true)\n\t\tmodels.RefreshPhoneEncryptionCache(rt.Ctx)\n\t\tginx.NewRender(c).Message(fmt.Errorf(\"get users failed: %v\", err))\n\t\treturn\n\t}\n\n\t// 获取RSA密钥\n\tprivateKey, _, password, err := models.GetRSAKeys(rt.Ctx)\n\tif err != nil {\n\t\t// 回滚配置\n\t\tmodels.SetPhoneEncryptionEnabled(rt.Ctx, true)\n\t\tmodels.RefreshPhoneEncryptionCache(rt.Ctx)\n\t\tginx.NewRender(c).Message(fmt.Errorf(\"get RSA keys failed: %v\", err))\n\t\treturn\n\t}\n\n\tsuccessCount := 0\n\tfailCount := 0\n\tvar failedUsers []string\n\n\t// 使用事务处理所有用户的手机号解密\n\terr = models.DB(rt.Ctx).Transaction(func(tx *gorm.DB) error {\n\t\t// 对每个用户的手机号进行解密\n\t\tfor _, user := range users {\n\t\t\tif user.Phone == \"\" {\n\t\t\t\tcontinue\n\t\t\t}\n\n\t\t\t// 检查是否是加密的手机号\n\t\t\tif !isPhoneEncrypted(user.Phone) {\n\t\t\t\tcontinue\n\t\t\t}\n\n\t\t\t// 对手机号进行解密\n\t\t\tdecryptedPhone, err := secu.Decrypt(user.Phone, privateKey, password)\n\t\t\tif err != nil {\n\t\t\t\tlogger.Errorf(\"Failed to decrypt phone for user %s: %v\", user.Username, err)\n\t\t\t\tfailCount++\n\t\t\t\tfailedUsers = append(failedUsers, user.Username)\n\t\t\t\tcontinue\n\t\t\t}\n\n\t\t\t// 直接更新数据库中的手机号字段(绕过GORM钩子)\n\t\t\terr = tx.Model(&models.User{}).Where(\"id = ?\", user.Id).Update(\"phone\", decryptedPhone).Error\n\t\t\tif err != nil {\n\t\t\t\tlogger.Errorf(\"Failed to update phone for user %s: %v\", user.Username, err)\n\t\t\t\tfailCount++\n\t\t\t\tfailedUsers = append(failedUsers, user.Username)\n\t\t\t\tcontinue\n\t\t\t}\n\n\t\t\tsuccessCount++\n\t\t\tlogger.Debugf(\"Successfully decrypted phone for user %s\", user.Username)\n\t\t}\n\n\t\t// 如果有失败的用户,回滚事务\n\t\tif failCount > 0 {\n\t\t\treturn fmt.Errorf(\"decrypt failed users: %d, failed users: %v\", failCount, failedUsers)\n\t\t}\n\n\t\treturn nil\n\t})\n\n\tif err != nil {\n\t\t// 解密失败,回滚配置\n\t\tmodels.SetPhoneEncryptionEnabled(rt.Ctx, true)\n\t\tmodels.RefreshPhoneEncryptionCache(rt.Ctx)\n\t\tginx.NewRender(c).Message(fmt.Errorf(\"decrypt phone failed: %v\", err))\n\t\treturn\n\t}\n\n\tginx.NewRender(c).Data(gin.H{\n\t\t\"success_count\": successCount,\n\t\t\"fail_count\": failCount,\n\t}, nil)\n}\n\n// isPhoneEncrypted 检查手机号是否已经加密\nfunc isPhoneEncrypted(phone string) bool {\n\t// 检查是否有 \"enc:\" 前缀标记\n\treturn len(phone) > 4 && phone[:4] == \"enc:\"\n}\n"
},
{
"path": "center/router/router_user_group.go",
"content": "package router\n\nimport (\n\t\"net/http\"\n\t\"time\"\n\n\t\"github.com/ccfos/nightingale/v6/models\"\n\t\"github.com/ccfos/nightingale/v6/pkg/flashduty\"\n\t\"github.com/ccfos/nightingale/v6/pkg/strx\"\n\t\"github.com/ccfos/nightingale/v6/pkg/ginx\"\n\n\t\"github.com/gin-gonic/gin\"\n\t\"github.com/toolkits/pkg/logger\"\n)\n\nfunc (rt *Router) checkBusiGroupPerm(c *gin.Context) {\n\tme := c.MustGet(\"user\").(*models.User)\n\tbg := BusiGroup(rt.Ctx, ginx.UrlParamInt64(c, \"id\"))\n\n\tcan, err := me.CanDoBusiGroup(rt.Ctx, bg, ginx.UrlParamStr(c, \"perm\"))\n\tginx.NewRender(c).Data(can, err)\n}\n\nfunc (rt *Router) userGroupGets(c *gin.Context) {\n\tlimit := ginx.QueryInt(c, \"limit\", 1500)\n\tquery := ginx.QueryStr(c, \"query\", \"\")\n\n\tme := c.MustGet(\"user\").(*models.User)\n\tlst, err := me.UserGroups(rt.Ctx, limit, query)\n\tif err == nil {\n\t\tmodels.FillUpdateByNicknames(rt.Ctx, lst)\n\t}\n\n\tginx.NewRender(c).Data(lst, err)\n}\n\nfunc (rt *Router) userGroupGetsByService(c *gin.Context) {\n\tids := strx.IdsInt64ForAPI(ginx.QueryStr(c, \"ids\", \"\"))\n\n\tif len(ids) == 0 {\n\t\tlst, err := models.UserGroupGetAll(rt.Ctx)\n\t\tginx.Dangerous(err)\n\t\tfor i := 0; i < len(lst); i++ {\n\t\t\tids, err := models.MemberIds(rt.Ctx, lst[i].Id)\n\t\t\tginx.Dangerous(err)\n\n\t\t\tlst[i].Users, err = models.UserGetsByIds(rt.Ctx, ids)\n\t\t\tginx.Dangerous(err)\n\t\t}\n\t\tginx.NewRender(c).Data(lst, err)\n\t\treturn\n\t}\n\n\tlst := make([]models.UserGroup, 0)\n\tfor _, id := range ids {\n\t\tug := UserGroup(rt.Ctx, id)\n\n\t\tids, err := models.MemberIds(rt.Ctx, ug.Id)\n\t\tginx.Dangerous(err)\n\n\t\tug.Users, err = models.UserGetsByIds(rt.Ctx, ids)\n\t\tginx.Dangerous(err)\n\n\t\tlst = append(lst, *ug)\n\t}\n\n\tginx.NewRender(c).Data(lst, nil)\n}\n\n// user group member get by service\nfunc (rt *Router) userGroupMemberGetsByService(c *gin.Context) {\n\tmembers, err := models.UserGroupMemberGetAll(rt.Ctx)\n\tginx.NewRender(c).Data(members, err)\n}\n\ntype userGroupForm struct {\n\tName string `json:\"name\" binding:\"required\"`\n\tNote string `json:\"note\"`\n\tIsSyncToFlashDuty bool `json:\"is_sync_to_flashduty\"`\n}\n\nfunc (rt *Router) userGroupAdd(c *gin.Context) {\n\tvar f userGroupForm\n\tginx.BindJSON(c, &f)\n\n\tme := c.MustGet(\"user\").(*models.User)\n\n\tug := models.UserGroup{\n\t\tName: f.Name,\n\t\tNote: f.Note,\n\t\tCreateBy: me.Username,\n\t\tUpdateBy: me.Username,\n\t}\n\n\terr := ug.Add(rt.Ctx)\n\tginx.Dangerous(err)\n\n\t// Even failure is not a big deal\n\tmodels.UserGroupMemberAdd(rt.Ctx, ug.Id, me.Id)\n\n\tif f.IsSyncToFlashDuty || flashduty.NeedSyncTeam(rt.Ctx) {\n\t\tugs, err := flashduty.NewUserGroupSyncer(rt.Ctx, &ug)\n\t\tginx.Dangerous(err)\n\t\terr = ugs.SyncUGAdd()\n\t\tginx.Dangerous(err)\n\t}\n\tginx.NewRender(c).Data(ug.Id, err)\n\n}\n\nfunc (rt *Router) userGroupPut(c *gin.Context) {\n\tvar f userGroupForm\n\tginx.BindJSON(c, &f)\n\n\tme := c.MustGet(\"user\").(*models.User)\n\tug := c.MustGet(\"user_group\").(*models.UserGroup)\n\n\tif ug.Name != f.Name {\n\t\t// name changed, check duplication\n\t\tnum, err := models.UserGroupCount(rt.Ctx, \"name=? and id<>?\", f.Name, ug.Id)\n\t\tginx.Dangerous(err)\n\n\t\tif num > 0 {\n\t\t\tginx.Bomb(http.StatusOK, \"UserGroup already exists\")\n\t\t}\n\t}\n\n\tug.Name = f.Name\n\tug.Note = f.Note\n\tug.UpdateBy = me.Username\n\tug.UpdateAt = time.Now().Unix()\n\tif f.IsSyncToFlashDuty || flashduty.NeedSyncTeam(rt.Ctx) {\n\t\tugs, err := flashduty.NewUserGroupSyncer(rt.Ctx, ug)\n\t\tginx.Dangerous(err)\n\t\terr = ugs.SyncUGPut()\n\t\tginx.Dangerous(err)\n\t}\n\tginx.NewRender(c).Message(ug.Update(rt.Ctx, \"Name\", \"Note\", \"UpdateAt\", \"UpdateBy\"))\n\n}\n\n// Return all members, front-end search and paging\nfunc (rt *Router) userGroupGet(c *gin.Context) {\n\tug := UserGroup(rt.Ctx, ginx.UrlParamInt64(c, \"id\"))\n\n\tids, err := models.MemberIds(rt.Ctx, ug.Id)\n\tginx.Dangerous(err)\n\n\tlogger.Info(\"userGroupGet\", ids)\n\tusers, err := models.UserGetsByIds(rt.Ctx, ids)\n\n\tginx.NewRender(c).Data(gin.H{\n\t\t\"users\": users,\n\t\t\"user_group\": ug,\n\t}, err)\n}\n\nfunc (rt *Router) userGroupDel(c *gin.Context) {\n\tisSyncToFlashDuty := ginx.QueryBool(c, \"is_sync_to_flashduty\", false)\n\tug := c.MustGet(\"user_group\").(*models.UserGroup)\n\tif isSyncToFlashDuty || flashduty.NeedSyncTeam(rt.Ctx) {\n\t\tugs, err := flashduty.NewUserGroupSyncer(rt.Ctx, ug)\n\t\tginx.Dangerous(err)\n\t\terr = ugs.SyncUGDel()\n\t\t// 如果team 在 duty 被引用或者已经删除,会报错,可以忽略报错\n\t\tif err != nil {\n\t\t\tlogger.Warningf(\"failed to sync user group %s to flashduty's team: %v\", ug.Name, err)\n\t\t}\n\t}\n\tginx.NewRender(c).Message(ug.Del(rt.Ctx))\n\n}\n\nfunc (rt *Router) userGroupMemberAdd(c *gin.Context) {\n\tvar f idsForm\n\tginx.BindJSON(c, &f)\n\tf.Verify()\n\n\tme := c.MustGet(\"user\").(*models.User)\n\tug := c.MustGet(\"user_group\").(*models.UserGroup)\n\n\terr := ug.AddMembers(rt.Ctx, f.Ids)\n\tginx.Dangerous(err)\n\tif err == nil {\n\t\tug.UpdateAt = time.Now().Unix()\n\t\tug.UpdateBy = me.Username\n\t\tug.Update(rt.Ctx, \"UpdateAt\", \"UpdateBy\")\n\t}\n\n\tif f.IsSyncToFlashDuty || flashduty.NeedSyncTeam(rt.Ctx) {\n\t\tugs, err := flashduty.NewUserGroupSyncer(rt.Ctx, ug)\n\t\tginx.Dangerous(err)\n\t\terr = ugs.SyncMembersAdd()\n\t\tginx.Dangerous(err)\n\t}\n\tginx.NewRender(c).Message(err)\n\n}\n\nfunc (rt *Router) userGroupMemberDel(c *gin.Context) {\n\tvar f idsForm\n\tginx.BindJSON(c, &f)\n\tf.Verify()\n\n\tme := c.MustGet(\"user\").(*models.User)\n\tug := c.MustGet(\"user_group\").(*models.UserGroup)\n\n\terr := ug.DelMembers(rt.Ctx, f.Ids)\n\tif err == nil {\n\t\tug.UpdateAt = time.Now().Unix()\n\t\tug.UpdateBy = me.Username\n\t\tug.Update(rt.Ctx, \"UpdateAt\", \"UpdateBy\")\n\t}\n\tif f.IsSyncToFlashDuty || flashduty.NeedSyncTeam(rt.Ctx) {\n\t\tugs, err := flashduty.NewUserGroupSyncer(rt.Ctx, ug)\n\t\tginx.Dangerous(err)\n\t\terr = ugs.SyncMembersDel()\n\t\tginx.Dangerous(err)\n\t}\n\n\tginx.NewRender(c).Message(err)\n}\n"
},
{
"path": "center/router/router_user_variable_config.go",
"content": "package router\n\nimport (\n\t\"strings\"\n\t\"time\"\n\n\t\"github.com/ccfos/nightingale/v6/models\"\n\t\"github.com/ccfos/nightingale/v6/pkg/ginx\"\n\n\t\"github.com/gin-gonic/gin\"\n)\n\nfunc (rt *Router) userVariableConfigGets(context *gin.Context) {\n\tuserVariables, err := models.ConfigsGetUserVariable(rt.Ctx)\n\tginx.NewRender(context).Data(userVariables, err)\n}\nfunc (rt *Router) userVariableConfigAdd(context *gin.Context) {\n\tvar f models.Configs\n\tginx.BindJSON(context, &f)\n\tf.Ckey = strings.TrimSpace(f.Ckey)\n\t//insert external config. needs to make sure not plaintext for an encrypted type config\n\tusername := context.MustGet(\"username\").(string)\n\tnow := time.Now().Unix()\n\tf.CreateBy = username\n\tf.UpdateBy = username\n\tf.CreateAt = now\n\tf.UpdateAt = now\n\tginx.NewRender(context).Message(models.ConfigsUserVariableInsert(rt.Ctx, f))\n\n}\n\nfunc (rt *Router) userVariableConfigPut(context *gin.Context) {\n\tvar f models.Configs\n\tginx.BindJSON(context, &f)\n\tf.Id = ginx.UrlParamInt64(context, \"id\")\n\tf.Ckey = strings.TrimSpace(f.Ckey)\n\tf.UpdateBy = context.MustGet(\"username\").(string)\n\tf.UpdateAt = time.Now().Unix()\n\n\tuser := context.MustGet(\"user\").(*models.User)\n\tif !user.IsAdmin() && f.CreateBy != user.Username {\n\t\t// only admin or creator can update\n\t\tginx.Bomb(403, \"forbidden\")\n\t}\n\n\tginx.NewRender(context).Message(models.ConfigsUserVariableUpdate(rt.Ctx, f))\n}\n\nfunc (rt *Router) userVariableConfigDel(context *gin.Context) {\n\tid := ginx.UrlParamInt64(context, \"id\")\n\tconfigs, err := models.ConfigGet(rt.Ctx, id)\n\tginx.Dangerous(err)\n\n\tuser := context.MustGet(\"user\").(*models.User)\n\tif !user.IsAdmin() && configs.CreateBy != user.Username {\n\t\t// only admin or creator can delete\n\t\tginx.Bomb(403, \"forbidden\")\n\t}\n\n\tif configs != nil && configs.External == models.ConfigExternal {\n\t\tginx.NewRender(context).Message(models.ConfigsDel(rt.Ctx, []int64{id}))\n\t} else {\n\t\tginx.NewRender(context).Message(nil)\n\t}\n}\n\nfunc (rt *Router) userVariableGetDecryptByService(context *gin.Context) {\n\tdecryptMap, decryptErr := models.ConfigUserVariableGetDecryptMap(rt.Ctx, rt.HTTP.RSA.RSAPrivateKey, rt.HTTP.RSA.RSAPassWord)\n\tginx.NewRender(context).Data(decryptMap, decryptErr)\n}\n"
},
{
"path": "center/sso/init.go",
"content": "package sso\n\nimport (\n\t\"encoding/json\"\n\t\"fmt\"\n\t\"log\"\n\t\"time\"\n\n\t\"github.com/ccfos/nightingale/v6/center/cconf\"\n\t\"github.com/ccfos/nightingale/v6/memsto\"\n\t\"github.com/ccfos/nightingale/v6/models\"\n\t\"github.com/ccfos/nightingale/v6/pkg/cas\"\n\t\"github.com/ccfos/nightingale/v6/pkg/ctx\"\n\t\"github.com/ccfos/nightingale/v6/pkg/dingtalk\"\n\t\"github.com/ccfos/nightingale/v6/pkg/feishu\"\n\t\"github.com/ccfos/nightingale/v6/pkg/ldapx\"\n\t\"github.com/ccfos/nightingale/v6/pkg/oauth2x\"\n\t\"github.com/ccfos/nightingale/v6/pkg/oidcx\"\n\t\"github.com/ccfos/nightingale/v6/pkg/tplx\"\n\n\t\"github.com/BurntSushi/toml\"\n\t\"github.com/toolkits/pkg/logger\"\n)\n\ntype SsoClient struct {\n\tOIDC *oidcx.SsoClient\n\tLDAP *ldapx.SsoClient\n\tCAS *cas.SsoClient\n\tOAuth2 *oauth2x.SsoClient\n\tDingTalk *dingtalk.SsoClient\n\tFeiShu *feishu.SsoClient\n\tLastUpdateTime int64\n\tconfigCache *memsto.ConfigCache\n\tconfigLastUpdateTime int64\n}\n\nconst LDAP = `\nEnable = false\nHost = 'ldap.example.org'\nPort = 389\nBaseDn = 'dc=example,dc=org'\nBindUser = 'cn=manager,dc=example,dc=org'\nBindPass = '*******'\nSyncAddUsers = false\nSyncDelUsers = false\n# unit: s\nSyncInterval = 86400\n# openldap format e.g. (&(uid=%s))\n# AD format e.g. (&(sAMAccountName=%s))\nAuthFilter = '(&(uid=%s))'\nUserFilter = '(&(uid=*))'\nCoverAttributes = true\nTLS = false\nStartTLS = true\nDefaultRoles = ['Standard']\n\n[Attributes]\nUsername = 'uid'\nNickname = 'cn'\nPhone = 'mobile'\nEmail = 'mail'\n`\n\nconst OAuth2 = `\nEnable = false\nDisplayName = 'OAuth2登录'\nRedirectURL = 'http://n9e.com/callback/oauth'\nSsoAddr = 'https://sso.example.com/oauth2/authorize'\nSsoLogoutAddr = 'https://sso.example.com/oauth2/authorize/session/end'\nTokenAddr = 'https://sso.example.com/oauth2/token'\nUserInfoAddr = 'https://api.example.com/api/v1/user/info'\nTranTokenMethod = 'header'\nClientId = ''\nClientSecret = ''\nCoverAttributes = true\nDefaultRoles = ['Standard']\nUserinfoIsArray = false\nUserinfoPrefix = 'data'\nScopes = ['profile', 'email', 'phone']\n\n[Attributes]\nUsername = 'sub'\nNickname = 'nickname'\nPhone = 'phone_number'\nEmail = 'email'\n`\n\nconst CAS = `\nEnable = false\nDisplayName = 'CAS登录'\nRedirectURL = 'http://n9e.com/callback/cas'\nSsoAddr = 'https://cas.example.com/cas/'\nSsoLogoutAddr = 'https://cas.example.com/cas/session/end'\n# LoginPath = ''\nCoverAttributes = true\nDefaultRoles = ['Standard']\n\n[Attributes]\nUsername = 'sub'\nNickname = 'nickname'\nPhone = 'phone_number'\nEmail = 'email'\n`\n\nconst OIDC = `\nEnable = false\nDisplayName = 'OIDC登录'\nRedirectURL = 'http://n9e.com/callback'\nSsoAddr = 'http://sso.example.org'\nSsoLogoutAddr = 'http://sso.example.org/session/end'\nClientId = ''\nClientSecret = ''\nCoverAttributes = true\nDefaultRoles = ['Standard']\nScopes = ['openid', 'profile', 'email', 'phone']\n\n[Attributes]\nUsername = 'sub'\nNickname = 'nickname'\nPhone = 'phone_number'\nEmail = 'email'\n`\n\nfunc Init(center cconf.Center, ctx *ctx.Context, configCache *memsto.ConfigCache) *SsoClient {\n\tssoClient := new(SsoClient)\n\tm := make(map[string]string)\n\tm[\"LDAP\"] = LDAP\n\tm[\"CAS\"] = CAS\n\tm[\"OIDC\"] = OIDC\n\tm[\"OAuth2\"] = OAuth2\n\n\tfor name, config := range m {\n\t\tcount, err := models.SsoConfigCountByName(ctx, name)\n\t\tif err != nil {\n\t\t\tlogger.Error(err)\n\t\t\tcontinue\n\t\t}\n\n\t\tif count > 0 {\n\t\t\tcontinue\n\t\t}\n\n\t\tssoConfig := models.SsoConfig{\n\t\t\tName: name,\n\t\t\tContent: config,\n\t\t}\n\n\t\terr = ssoConfig.Create(ctx)\n\t\tif err != nil {\n\t\t\tlog.Fatalln(err)\n\t\t}\n\t}\n\tif configCache == nil {\n\t\tlog.Fatalln(fmt.Errorf(\"configCache is nil, sso initialization failed\"))\n\t}\n\tssoClient.configCache = configCache\n\tuserVariableMap := configCache.Get()\n\n\tconfigs, err := models.SsoConfigGets(ctx)\n\tif err != nil {\n\t\tlog.Fatalln(err)\n\t}\n\n\tfor _, cfg := range configs {\n\t\tcfg.Content = tplx.ReplaceTemplateUseText(cfg.Name, cfg.Content, userVariableMap)\n\t\tswitch cfg.Name {\n\t\tcase \"LDAP\":\n\t\t\tvar config ldapx.Config\n\t\t\terr := toml.Unmarshal([]byte(cfg.Content), &config)\n\t\t\tif err != nil {\n\t\t\t\tlog.Fatalln(\"init ldap failed\", err)\n\t\t\t}\n\t\t\tssoClient.LDAP = ldapx.New(config)\n\t\tcase \"OIDC\":\n\t\t\tvar config oidcx.Config\n\t\t\terr := toml.Unmarshal([]byte(cfg.Content), &config)\n\t\t\tif err != nil {\n\t\t\t\tlog.Fatalln(\"init oidc failed:\", err)\n\t\t\t}\n\t\t\tlogger.Info(\"init oidc..\")\n\t\t\toidcClient, err := oidcx.New(config)\n\t\t\tif err != nil {\n\t\t\t\tlogger.Error(\"init oidc failed:\", err)\n\t\t\t} else {\n\t\t\t\tssoClient.OIDC = oidcClient\n\t\t\t}\n\t\tcase \"CAS\":\n\t\t\tvar config cas.Config\n\t\t\terr := toml.Unmarshal([]byte(cfg.Content), &config)\n\t\t\tif err != nil {\n\t\t\t\tlog.Fatalln(\"init cas failed:\", err)\n\t\t\t}\n\t\t\tssoClient.CAS = cas.New(config)\n\t\tcase \"OAuth2\":\n\t\t\tvar config oauth2x.Config\n\t\t\terr := toml.Unmarshal([]byte(cfg.Content), &config)\n\t\t\tif err != nil {\n\t\t\t\tlog.Fatalln(\"init oauth2 failed:\", err)\n\t\t\t}\n\t\t\tssoClient.OAuth2 = oauth2x.New(config)\n\t\tcase dingtalk.SsoTypeName:\n\t\t\tvar config dingtalk.Config\n\t\t\terr := json.Unmarshal([]byte(cfg.Content), &config)\n\t\t\tif err != nil {\n\t\t\t\tlog.Fatalf(\"init %s failed: %s\", dingtalk.SsoTypeName, err)\n\t\t\t}\n\t\t\tssoClient.DingTalk = dingtalk.New(config)\n\t\tcase feishu.SsoTypeName:\n\t\t\tvar config feishu.Config\n\t\t\terr := json.Unmarshal([]byte(cfg.Content), &config)\n\t\t\tif err != nil {\n\t\t\t\tlog.Fatalf(\"init %s failed: %s\", feishu.SsoTypeName, err)\n\t\t\t}\n\t\t\tssoClient.FeiShu = feishu.New(config)\n\t\t}\n\t}\n\n\tgo ssoClient.SyncSsoUsers(ctx)\n\tgo ssoClient.Reload(ctx)\n\treturn ssoClient\n}\n\n// 定期更新sso配置\nfunc (s *SsoClient) reload(ctx *ctx.Context) error {\n\tlastUpdateTime, err := models.SsoConfigLastUpdateTime(ctx)\n\tif err != nil {\n\t\treturn err\n\t}\n\n\tlastCacheUpdateTime := s.configCache.GetLastUpdateTime()\n\tif lastUpdateTime == s.LastUpdateTime && lastCacheUpdateTime == s.configLastUpdateTime {\n\t\treturn nil\n\t}\n\n\tconfigs, err := models.SsoConfigGets(ctx)\n\tif err != nil {\n\t\treturn err\n\t}\n\tuserVariableMap := s.configCache.Get()\n\tssoConfigMap := make(map[string]models.SsoConfig, 0)\n\tfor _, cfg := range configs {\n\t\tssoConfigMap[cfg.Name] = cfg\n\t\tcfg.Content = tplx.ReplaceTemplateUseText(cfg.Name, cfg.Content, userVariableMap)\n\t\tswitch cfg.Name {\n\t\tcase \"LDAP\":\n\t\t\tvar config ldapx.Config\n\t\t\terr := toml.Unmarshal([]byte(cfg.Content), &config)\n\t\t\tif err != nil {\n\t\t\t\tlogger.Warning(\"reload ldap failed\", err)\n\t\t\t\tcontinue\n\t\t\t}\n\t\t\ts.LDAP.Reload(config)\n\t\tcase \"OIDC\":\n\t\t\tvar config oidcx.Config\n\t\t\terr := toml.Unmarshal([]byte(cfg.Content), &config)\n\t\t\tif err != nil {\n\t\t\t\tlogger.Warning(\"reload oidc failed:\", err)\n\t\t\t\tcontinue\n\t\t\t}\n\n\t\t\tlogger.Info(\"reload oidc..\")\n\t\t\terr = s.OIDC.Reload(config)\n\t\t\tif err != nil {\n\t\t\t\tlogger.Error(\"reload oidc failed:\", err)\n\t\t\t\tcontinue\n\t\t\t}\n\t\tcase \"CAS\":\n\t\t\tvar config cas.Config\n\t\t\terr := toml.Unmarshal([]byte(cfg.Content), &config)\n\t\t\tif err != nil {\n\t\t\t\tlogger.Warning(\"reload cas failed:\", err)\n\t\t\t\tcontinue\n\t\t\t}\n\t\t\ts.CAS.Reload(config)\n\t\tcase \"OAuth2\":\n\t\t\tvar config oauth2x.Config\n\t\t\terr := toml.Unmarshal([]byte(cfg.Content), &config)\n\t\t\tif err != nil {\n\t\t\t\tlogger.Warning(\"reload oauth2 failed:\", err)\n\t\t\t\tcontinue\n\t\t\t}\n\t\t\ts.OAuth2.Reload(config)\n\n\t\t}\n\t}\n\n\tif dingTalkConfig, ok := ssoConfigMap[dingtalk.SsoTypeName]; ok {\n\t\tvar config dingtalk.Config\n\t\terr := json.Unmarshal([]byte(dingTalkConfig.Content), &config)\n\t\tif err != nil {\n\t\t\tlogger.Warningf(\"reload %s failed: %s\", dingtalk.SsoTypeName, err)\n\t\t} else {\n\t\t\tif s.DingTalk != nil {\n\t\t\t\ts.DingTalk.Reload(config)\n\t\t\t} else {\n\t\t\t\ts.DingTalk = dingtalk.New(config)\n\t\t\t}\n\t\t}\n\t} else {\n\t\ts.DingTalk = nil\n\t}\n\n\tif feiShuConfig, ok := ssoConfigMap[feishu.SsoTypeName]; ok {\n\t\tvar config feishu.Config\n\t\terr := json.Unmarshal([]byte(feiShuConfig.Content), &config)\n\t\tif err != nil {\n\t\t\tlogger.Warningf(\"reload %s failed: %s\", feishu.SsoTypeName, err)\n\t\t} else {\n\t\t\tif s.FeiShu != nil {\n\t\t\t\ts.FeiShu.Reload(config)\n\t\t\t} else {\n\t\t\t\ts.FeiShu = feishu.New(config)\n\t\t\t}\n\t\t}\n\t} else {\n\t\ts.FeiShu = nil\n\t}\n\n\ts.LastUpdateTime = lastUpdateTime\n\ts.configLastUpdateTime = lastCacheUpdateTime\n\treturn nil\n}\n\nfunc (s *SsoClient) Reload(ctx *ctx.Context) {\n\tduration := time.Duration(9000) * time.Millisecond\n\tfor {\n\t\ttime.Sleep(duration)\n\t\tif err := s.reload(ctx); err != nil {\n\t\t\tlogger.Warning(\"reload sso client err:\", err)\n\t\t}\n\t}\n}\n"
},
{
"path": "center/sso/sync.go",
"content": "package sso\n\nimport (\n\t\"fmt\"\n\n\t\"github.com/ccfos/nightingale/v6/pkg/ctx\"\n\t\"github.com/toolkits/pkg/logger\"\n)\n\nfunc (s *SsoClient) SyncSsoUsers(ctx *ctx.Context) {\n\tif err := s.LDAP.SyncAddAndDelUsers(ctx); err != nil {\n\t\tfmt.Println(\"failed to sync the addition and deletion of ldap users:\", err)\n\t}\n\n\tif err := s.LDAP.SyncDelUsers(ctx); err != nil {\n\t\tfmt.Println(\"failed to sync deletion of ldap users:\", err)\n\t}\n\n\tgo s.loopSyncSsoUsers(ctx)\n}\n\nfunc (s *SsoClient) loopSyncSsoUsers(ctx *ctx.Context) {\n\tfor {\n\t\tselect {\n\t\tcase <-s.LDAP.Ticker.C:\n\t\t\tlc := s.LDAP.Copy()\n\n\t\t\tif err := lc.SyncAddAndDelUsers(ctx); err != nil {\n\t\t\t\tlogger.Warningf(\"failed to sync the addition and deletion of ldap users: %v\", err)\n\t\t\t}\n\n\t\t\tif err := lc.SyncDelUsers(ctx); err != nil {\n\t\t\t\tlogger.Warningf(\"failed to sync deletion of ldap users: %v\", err)\n\t\t\t}\n\t\t}\n\t}\n}\n"
},
{
"path": "cli/cli.go",
"content": "package cli\n\nimport (\n\t\"github.com/ccfos/nightingale/v6/cli/upgrade\"\n)\n\nfunc Upgrade(configFile string) error {\n\treturn upgrade.Upgrade(configFile)\n}\n"
},
{
"path": "cli/upgrade/config.go",
"content": "package upgrade\n\nimport (\n\t\"bytes\"\n\t\"path\"\n\n\t\"github.com/ccfos/nightingale/v6/pkg/cfg\"\n\t\"github.com/ccfos/nightingale/v6/pkg/ormx\"\n\t\"github.com/ccfos/nightingale/v6/pkg/tlsx\"\n\t\"github.com/koding/multiconfig\"\n)\n\ntype Config struct {\n\tDB ormx.DBConfig\n\tClusters []ClusterOptions\n}\n\ntype ClusterOptions struct {\n\tName string\n\tProm string\n\n\tBasicAuthUser string\n\tBasicAuthPass string\n\n\tHeaders []string\n\n\tTimeout int64\n\tDialTimeout int64\n\n\tUseTLS bool\n\ttlsx.ClientConfig\n\n\tMaxIdleConnsPerHost int\n}\n\nfunc Parse(fpath string, configPtr *Config) error {\n\tvar (\n\t\ttBuf []byte\n\t)\n\tloaders := []multiconfig.Loader{\n\t\t&multiconfig.TagLoader{},\n\t\t&multiconfig.EnvironmentLoader{},\n\t}\n\ts := cfg.NewFileScanner()\n\n\ts.Read(path.Join(fpath))\n\ttBuf = append(tBuf, s.Data()...)\n\ttBuf = append(tBuf, []byte(\"\\n\")...)\n\n\tif s.Err() != nil {\n\t\treturn s.Err()\n\t}\n\n\tif len(tBuf) != 0 {\n\t\tloaders = append(loaders, &multiconfig.TOMLLoader{Reader: bytes.NewReader(tBuf)})\n\t}\n\n\tm := multiconfig.DefaultLoader{\n\t\tLoader: multiconfig.MultiLoader(loaders...),\n\t\tValidator: multiconfig.MultiValidator(&multiconfig.RequiredValidator{}),\n\t}\n\treturn m.Load(configPtr)\n}\n"
},
{
"path": "cli/upgrade/readme.md",
"content": "# v5 升级 v6 手册\n0. 操作之前,记得备注下数据库!\n\n1. 需要先将你正在使用的夜莺数据源表结构更新到和 v5.15.0 一致,[release](https://github.com/ccfos/nightingale/releases) 页面有每个版本表结构的更新说明,可以根据你正在使用的版本,按照说明,逐个执行的更新表结构的语句\n\n2. 解压 n9e 安装包,导入 upgrade.sql 到 n9e_v5 数据库\n```\nmysql -h 127.0.0.1 -u root -p1234 < cli/upgrade/upgrade.sql\n```\n\n3. 执行 n9e-cli 完成数据库表结构升级, webapi.conf 为 v5 版本 n9e-webapi 正在使用的配置文件\n```\n./n9e-cli --upgrade --config webapi.conf\n```\n\n4. 修改 n9e 配置文件中的数据库为 n9e_v5,启动 n9e 进程\n```\nnohup ./n9e &> n9e.log &\n```\n\n5. n9e 监听的端口为 17000,需要将之前的 web 端口和数据上报的端口,都调整为 17000"
},
{
"path": "cli/upgrade/upgrade.go",
"content": "package upgrade\n\nimport (\n\t\"context\"\n\n\t\"github.com/ccfos/nightingale/v6/models\"\n\t\"github.com/ccfos/nightingale/v6/pkg/ctx\"\n\t\"github.com/ccfos/nightingale/v6/storage\"\n\t\"github.com/toolkits/pkg/logger\"\n)\n\nfunc Upgrade(configFile string) error {\n\tvar config Config\n\tParse(configFile, &config)\n\n\tdb, err := storage.New(config.DB)\n\tif err != nil {\n\t\treturn err\n\t}\n\n\tctx := ctx.NewContext(context.Background(), db, true)\n\tfor _, cluster := range config.Clusters {\n\t\tcount, err := models.GetDatasourcesCountByName(ctx, cluster.Name)\n\t\tif err != nil {\n\t\t\tlogger.Errorf(\"get datasource %s count error: %v\", cluster.Name, err)\n\t\t\tcontinue\n\t\t}\n\t\tif count > 0 {\n\t\t\tcontinue\n\t\t}\n\n\t\theader := make(map[string]string)\n\t\theaderCount := len(cluster.Headers)\n\t\tif headerCount > 0 && headerCount%2 == 0 {\n\t\t\tfor i := 0; i < len(cluster.Headers); i += 2 {\n\t\t\t\theader[cluster.Headers[i]] = cluster.Headers[i+1]\n\t\t\t}\n\t\t}\n\n\t\tauthJson := models.Auth{\n\t\t\tBasicAuthUser: cluster.BasicAuthUser,\n\t\t\tBasicAuthPassword: cluster.BasicAuthPass,\n\t\t}\n\n\t\thttpJson := models.HTTP{\n\t\t\tTimeout: cluster.Timeout,\n\t\t\tDialTimeout: cluster.DialTimeout,\n\t\t\tTLS: models.TLS{\n\t\t\t\tSkipTlsVerify: cluster.UseTLS,\n\t\t\t},\n\t\t\tMaxIdleConnsPerHost: cluster.MaxIdleConnsPerHost,\n\t\t\tUrl: cluster.Prom,\n\t\t\tHeaders: header,\n\t\t}\n\n\t\tdatasource := models.Datasource{\n\t\t\tPluginId: 1,\n\t\t\tPluginType: \"prometheus\",\n\t\t\tPluginTypeName: \"Prometheus Like\",\n\t\t\tName: cluster.Name,\n\t\t\tHTTPJson: httpJson,\n\t\t\tAuthJson: authJson,\n\t\t\tClusterName: \"default\",\n\t\t\tStatus: \"enabled\",\n\t\t}\n\n\t\terr = datasource.Add(ctx)\n\t\tif err != nil {\n\t\t\tlogger.Errorf(\"add datasource %s error: %v\", cluster.Name, err)\n\t\t}\n\t}\n\n\tdatasources, err := models.GetDatasources(ctx)\n\tif err != nil {\n\t\treturn err\n\t}\n\n\tm := make(map[string]models.Datasource)\n\tfor i := 0; i < len(datasources); i++ {\n\t\tm[datasources[i].Name] = datasources[i]\n\t}\n\n\terr = models.AlertRuleUpgradeToV6(ctx, m)\n\tif err != nil {\n\t\treturn err\n\t}\n\n\t// alert mute\n\terr = models.AlertMuteUpgradeToV6(ctx, m)\n\tif err != nil {\n\t\treturn err\n\t}\n\t// alert subscribe\n\terr = models.AlertSubscribeUpgradeToV6(ctx, m)\n\tif err != nil {\n\t\treturn err\n\t}\n\n\t// recoding rule\n\terr = models.RecordingRuleUpgradeToV6(ctx, m)\n\tif err != nil {\n\t\treturn err\n\t}\n\n\t// alert cur event\n\terr = models.AlertCurEventUpgradeToV6(ctx, m)\n\tif err != nil {\n\t\treturn err\n\t}\n\n\t// alert his event\n\terr = models.AlertHisEventUpgradeToV6(ctx, m)\n\tif err != nil {\n\t\treturn err\n\t}\n\treturn nil\n}\n"
},
{
"path": "cli/upgrade/upgrade.sql",
"content": "use n9e_v5;\n\ninsert into `role_operation`(role_name, operation) values('Guest', '/log/explorer');\ninsert into `role_operation`(role_name, operation) values('Guest', '/trace/explorer');\n\ninsert into `role_operation`(role_name, operation) values('Standard', '/log/explorer');\ninsert into `role_operation`(role_name, operation) values('Standard', '/trace/explorer');\ninsert into `role_operation`(role_name, operation) values('Standard', '/alert-rules-built-in');\ninsert into `role_operation`(role_name, operation) values('Standard', '/dashboards-built-in');\ninsert into `role_operation`(role_name, operation) values('Standard', '/trace/dependencies');\ninsert into `role_operation`(role_name, operation) values('Standard', '/help/servers');\ninsert into `role_operation`(role_name, operation) values('Standard', '/help/migrate');\n\ninsert into `role_operation`(role_name, operation) values('Admin', '/help/source');\ninsert into `role_operation`(role_name, operation) values('Admin', '/help/sso');\ninsert into `role_operation`(role_name, operation) values('Admin', '/help/notification-tpls');\ninsert into `role_operation`(role_name, operation) values('Admin', '/help/notification-settings');\n\nalter table `board` add built_in tinyint(1) not null default 0 comment '0:false 1:true';\nalter table `board` add hide tinyint(1) not null default 0 comment '0:false 1:true';\n\nalter table `chart_share` add datasource_id bigint unsigned not null default 0;\n\nalter table `alert_rule` add datasource_ids varchar(255) not null default '';\nalter table `alert_rule` add rule_config text not null comment 'rule_config';\nalter table `alert_rule` add annotations text not null comment 'annotations';\n\nalter table `alert_mute` add datasource_ids varchar(255) not null default '';\nalter table `alert_mute` add periodic_mutes varchar(4096) not null default '[]';\nalter table `alert_mute` add mute_time_type tinyint(1) not null default 0;\n\nalter table `alert_subscribe` add datasource_ids varchar(255) not null default '';\nalter table `alert_subscribe` add prod varchar(255) not null default '';\nalter table `alert_subscribe` add webhooks text;\nalter table `alert_subscribe` add redefine_webhooks tinyint(1) default 0;\nalter table `alert_subscribe` add for_duration bigint not null default 0;\n\nalter table `recording_rule` add datasource_ids varchar(255) default '';\n\nalter table `target` modify cluster varchar(128) not null default '';\n\nalter table `alert_cur_event` add datasource_id bigint unsigned not null default 0;\nalter table `alert_cur_event` add annotations text not null comment 'annotations';\nalter table `alert_cur_event` add rule_config text not null comment 'rule_config';\n\nalter table `alert_his_event` add datasource_id bigint unsigned not null default 0;\nalter table `alert_his_event` add annotations text not null comment 'annotations';\nalter table `alert_his_event` add rule_config text not null comment 'rule_config';\n\nalter table `alerting_engines` add datasource_id bigint unsigned not null default 0;\nalter table `alerting_engines` change cluster engine_cluster varchar(128) not null default '' comment 'n9e engine cluster';\n\nalter table `task_record` add event_id bigint not null comment 'event id' default 0;\n\nCREATE TABLE `datasource`\n(\n `id` int unsigned NOT NULL AUTO_INCREMENT,\n `name` varchar(255) not null default '',\n `description` varchar(255) not null default '',\n `category` varchar(255) not null default '',\n `plugin_id` int unsigned not null default 0,\n `plugin_type` varchar(255) not null default '',\n `plugin_type_name` varchar(255) not null default '',\n `cluster_name` varchar(255) not null default '',\n `settings` text not null,\n `status` varchar(255) not null default '',\n `http` varchar(4096) not null default '',\n `auth` varchar(8192) not null default '',\n `created_at` bigint not null default 0,\n `created_by` varchar(64) not null default '',\n `updated_at` bigint not null default 0,\n `updated_by` varchar(64) not null default '',\n PRIMARY KEY (`id`)\n) ENGINE = InnoDB DEFAULT CHARSET = utf8mb4;\n\n-- datasource add weight field\nalter table `datasource` add `weight` int not null default 0;\n\nCREATE TABLE `builtin_cate` (\n `id` bigint unsigned not null auto_increment,\n `name` varchar(191) not null,\n `user_id` bigint not null default 0,\n PRIMARY KEY (`id`)\n) ENGINE = InnoDB DEFAULT CHARSET = utf8mb4;\n\nCREATE TABLE `notify_tpl` (\n `id` bigint unsigned not null auto_increment,\n `channel` varchar(32) not null,\n `name` varchar(255) not null,\n `content` text not null,\n PRIMARY KEY (`id`),\n UNIQUE KEY (`channel`)\n) ENGINE = InnoDB DEFAULT CHARSET = utf8mb4;\n\nCREATE TABLE `sso_config` (\n `id` bigint unsigned not null auto_increment,\n `name` varchar(191) not null,\n `content` text not null,\n PRIMARY KEY (`id`),\n UNIQUE KEY (`name`)\n) ENGINE = InnoDB DEFAULT CHARSET = utf8mb4;"
},
{
"path": "cmd/alert/main.go",
"content": "package main\n\nimport (\n\t\"flag\"\n\t\"fmt\"\n\t\"log\"\n\t\"os\"\n\t\"os/signal\"\n\t\"syscall\"\n\n\t\"github.com/ccfos/nightingale/v6/alert\"\n\t\"github.com/ccfos/nightingale/v6/pkg/osx\"\n\t\"github.com/ccfos/nightingale/v6/pkg/version\"\n\n\t\"github.com/toolkits/pkg/runner\"\n)\n\nvar (\n\tshowVersion = flag.Bool(\"version\", false, \"Show version.\")\n\tconfigDir = flag.String(\"configs\", osx.GetEnv(\"N9E_ALERT_CONFIGS\", \"etc\"), \"Specify configuration directory.(env:N9E_ALERT_CONFIGS)\")\n\tcryptoKey = flag.String(\"crypto-key\", \"\", \"Specify the secret key for configuration file field encryption.\")\n)\n\nfunc main() {\n\tflag.Parse()\n\n\tif *showVersion {\n\t\tfmt.Println(version.Version)\n\t\tos.Exit(0)\n\t}\n\n\tprintEnv()\n\n\tcleanFunc, err := alert.Initialize(*configDir, *cryptoKey)\n\tif err != nil {\n\t\tlog.Fatalln(\"failed to initialize:\", err)\n\t}\n\n\tcode := 1\n\tsc := make(chan os.Signal, 1)\n\tsignal.Notify(sc, syscall.SIGHUP, syscall.SIGINT, syscall.SIGTERM, syscall.SIGQUIT)\n\nEXIT:\n\tfor {\n\t\tsig := <-sc\n\t\tfmt.Println(\"received signal:\", sig.String())\n\t\tswitch sig {\n\t\tcase syscall.SIGQUIT, syscall.SIGTERM, syscall.SIGINT:\n\t\t\tcode = 0\n\t\t\tbreak EXIT\n\t\tcase syscall.SIGHUP:\n\t\t\t// reload configuration?\n\t\tdefault:\n\t\t\tbreak EXIT\n\t\t}\n\t}\n\n\tcleanFunc()\n\tfmt.Println(\"process exited\")\n\tos.Exit(code)\n}\n\nfunc printEnv() {\n\trunner.Init()\n\tfmt.Println(\"runner.cwd:\", runner.Cwd)\n\tfmt.Println(\"runner.hostname:\", runner.Hostname)\n\tfmt.Println(\"runner.fd_limits:\", runner.FdLimits())\n\tfmt.Println(\"runner.vm_limits:\", runner.VMLimits())\n}\n"
},
{
"path": "cmd/center/main.go",
"content": "package main\n\nimport (\n\t\"flag\"\n\t\"fmt\"\n\t\"log\"\n\t\"os\"\n\t\"os/signal\"\n\t\"syscall\"\n\n\t\"github.com/ccfos/nightingale/v6/center\"\n\t\"github.com/ccfos/nightingale/v6/pkg/osx\"\n\t\"github.com/ccfos/nightingale/v6/pkg/version\"\n\n\t\"github.com/toolkits/pkg/net/tcpx\"\n\t\"github.com/toolkits/pkg/runner\"\n)\n\nvar (\n\tshowVersion = flag.Bool(\"version\", false, \"Show version.\")\n\tconfigDir = flag.String(\"configs\", osx.GetEnv(\"N9E_CONFIGS\", \"etc\"), \"Specify configuration directory.(env:N9E_CONFIGS)\")\n\tcryptoKey = flag.String(\"crypto-key\", \"\", \"Specify the secret key for configuration file field encryption.\")\n)\n\nfunc main() {\n\tflag.Parse()\n\n\tif *showVersion {\n\t\tfmt.Println(version.Version)\n\t\tos.Exit(0)\n\t}\n\n\tprintEnv()\n\n\ttcpx.WaitHosts()\n\n\tcleanFunc, err := center.Initialize(*configDir, *cryptoKey)\n\tif err != nil {\n\t\tlog.Fatalln(\"failed to initialize:\", err)\n\t}\n\n\tcode := 1\n\tsc := make(chan os.Signal, 1)\n\tsignal.Notify(sc, syscall.SIGHUP, syscall.SIGINT, syscall.SIGTERM, syscall.SIGQUIT)\n\nEXIT:\n\tfor {\n\t\tsig := <-sc\n\t\tfmt.Println(\"received signal:\", sig.String())\n\t\tswitch sig {\n\t\tcase syscall.SIGQUIT, syscall.SIGTERM, syscall.SIGINT:\n\t\t\tcode = 0\n\t\t\tbreak EXIT\n\t\tcase syscall.SIGHUP:\n\t\t\t// reload configuration?\n\t\tdefault:\n\t\t\tbreak EXIT\n\t\t}\n\t}\n\n\tcleanFunc()\n\tfmt.Println(\"process exited\")\n\tos.Exit(code)\n}\n\nfunc printEnv() {\n\trunner.Init()\n\tfmt.Println(\"runner.cwd:\", runner.Cwd)\n\tfmt.Println(\"runner.hostname:\", runner.Hostname)\n\tfmt.Println(\"runner.fd_limits:\", runner.FdLimits())\n\tfmt.Println(\"runner.vm_limits:\", runner.VMLimits())\n}\n"
},
{
"path": "cmd/cli/main.go",
"content": "package main\n\nimport (\n\t\"flag\"\n\t\"fmt\"\n\t\"os\"\n\n\t\"github.com/ccfos/nightingale/v6/cli\"\n\t\"github.com/ccfos/nightingale/v6/pkg/version\"\n)\n\nvar (\n\tupgrade = flag.Bool(\"upgrade\", false, \"Upgrade the database.\")\n\tshowVersion = flag.Bool(\"version\", false, \"Show version.\")\n\tconfigFile = flag.String(\"config\", \"\", \"Specify webapi.conf of v5.x version\")\n)\n\nfunc main() {\n\tflag.Parse()\n\n\tif *showVersion {\n\t\tfmt.Println(version.Version)\n\t\tos.Exit(0)\n\t}\n\n\tif *upgrade {\n\t\tif *configFile == \"\" {\n\t\t\tfmt.Println(\"Please specify the configuration directory.\")\n\t\t\tos.Exit(1)\n\t\t}\n\n\t\terr := cli.Upgrade(*configFile)\n\t\tif err != nil {\n\t\t\tfmt.Println(err)\n\t\t\tos.Exit(1)\n\t\t}\n\t\tfmt.Print(\"Upgrade successfully.\")\n\t\tos.Exit(0)\n\t}\n}\n"
},
{
"path": "cmd/edge/edge.go",
"content": "package main\n\nimport (\n\t\"context\"\n\t\"errors\"\n\t\"fmt\"\n\n\t\"github.com/ccfos/nightingale/v6/alert\"\n\t\"github.com/ccfos/nightingale/v6/alert/astats\"\n\t\"github.com/ccfos/nightingale/v6/alert/dispatch\"\n\t\"github.com/ccfos/nightingale/v6/alert/process\"\n\talertrt \"github.com/ccfos/nightingale/v6/alert/router\"\n\t\"github.com/ccfos/nightingale/v6/center/metas\"\n\t\"github.com/ccfos/nightingale/v6/conf\"\n\t\"github.com/ccfos/nightingale/v6/dscache\"\n\t\"github.com/ccfos/nightingale/v6/dumper\"\n\t\"github.com/ccfos/nightingale/v6/memsto\"\n\t\"github.com/ccfos/nightingale/v6/pkg/ctx\"\n\t\"github.com/ccfos/nightingale/v6/pkg/httpx\"\n\t\"github.com/ccfos/nightingale/v6/pkg/logx\"\n\t\"github.com/ccfos/nightingale/v6/pkg/macros\"\n\t\"github.com/ccfos/nightingale/v6/prom\"\n\t\"github.com/ccfos/nightingale/v6/pushgw/idents\"\n\tpushgwrt \"github.com/ccfos/nightingale/v6/pushgw/router\"\n\t\"github.com/ccfos/nightingale/v6/pushgw/writer\"\n\t\"github.com/ccfos/nightingale/v6/storage\"\n\t\"github.com/flashcatcloud/ibex/src/cmd/ibex\"\n)\n\nfunc Initialize(configDir string, cryptoKey string) (func(), error) {\n\tconfig, err := conf.InitConfig(configDir, cryptoKey)\n\tif err != nil {\n\t\treturn nil, fmt.Errorf(\"failed to init config: %v\", err)\n\t}\n\n\tlogxClean, err := logx.Init(config.Log)\n\tif err != nil {\n\t\treturn nil, err\n\t}\n\t//check CenterApi is default value\n\tif len(config.CenterApi.Addrs) < 1 {\n\t\treturn nil, errors.New(\"failed to init config: the CenterApi configuration is missing\")\n\t}\n\tctx := ctx.NewContext(context.Background(), nil, false, config.CenterApi)\n\n\tvar redis storage.Redis\n\tredis, err = storage.NewRedis(config.Redis)\n\tif err != nil {\n\t\treturn nil, err\n\t}\n\n\tsyncStats := memsto.NewSyncStats()\n\n\ttargetCache := memsto.NewTargetCache(ctx, syncStats, redis)\n\tbusiGroupCache := memsto.NewBusiGroupCache(ctx, syncStats)\n\tconfigCvalCache := memsto.NewCvalCache(ctx, syncStats)\n\tidents := idents.New(ctx, redis, config.Pushgw)\n\tmetas := metas.New(redis)\n\twriters := writer.NewWriters(config.Pushgw)\n\tpushgwRouter := pushgwrt.New(config.HTTP, config.Pushgw, config.Alert, targetCache, busiGroupCache, idents, metas, writers, ctx)\n\tr := httpx.GinEngine(config.Global.RunMode, config.HTTP, configCvalCache.PrintBodyPaths, configCvalCache.PrintAccessLog)\n\n\tpushgwRouter.Config(r)\n\tmacros.RegisterMacro(macros.MacroInVain)\n\tdscache.Init(ctx, false)\n\n\tif !config.Alert.Disable {\n\t\tconfigCache := memsto.NewConfigCache(ctx, syncStats, nil, \"\")\n\t\talertStats := astats.NewSyncStats()\n\t\tdsCache := memsto.NewDatasourceCache(ctx, syncStats)\n\t\talertMuteCache := memsto.NewAlertMuteCache(ctx, syncStats)\n\t\talertRuleCache := memsto.NewAlertRuleCache(ctx, syncStats)\n\t\tnotifyConfigCache := memsto.NewNotifyConfigCache(ctx, configCache)\n\t\tuserCache := memsto.NewUserCache(ctx, syncStats)\n\t\tuserGroupCache := memsto.NewUserGroupCache(ctx, syncStats)\n\t\ttaskTplsCache := memsto.NewTaskTplCache(ctx)\n\t\tnotifyRuleCache := memsto.NewNotifyRuleCache(ctx, syncStats)\n\t\tnotifyChannelCache := memsto.NewNotifyChannelCache(ctx, syncStats)\n\t\tmessageTemplateCache := memsto.NewMessageTemplateCache(ctx, syncStats)\n\n\t\tpromClients := prom.NewPromClient(ctx)\n\n\t\tdispatch.InitRegisterQueryFunc(promClients)\n\n\t\texternalProcessors := process.NewExternalProcessors()\n\n\t\talert.Start(config.Alert, config.Pushgw, syncStats, alertStats, externalProcessors, targetCache, busiGroupCache, alertMuteCache,\n\t\t\talertRuleCache, notifyConfigCache, taskTplsCache, dsCache, ctx, promClients, userCache, userGroupCache, notifyRuleCache, notifyChannelCache, messageTemplateCache, configCvalCache)\n\n\t\talertrtRouter := alertrt.New(config.HTTP, config.Alert, alertMuteCache, targetCache, busiGroupCache, alertStats, ctx, externalProcessors, config.Log.Dir)\n\n\t\talertrtRouter.Config(r)\n\n\t\tif config.Ibex.Enable {\n\t\t\tibex.ServerStart(false, nil, redis, config.HTTP.APIForService.BasicAuth, config.Alert.Heartbeat, &config.CenterApi, r, nil, config.Ibex, config.HTTP.Port)\n\t\t}\n\t}\n\n\tdumper.ConfigRouter(r)\n\thttpClean := httpx.Init(config.HTTP, r)\n\n\treturn func() {\n\t\tlogxClean()\n\t\thttpClean()\n\t}, nil\n}\n"
},
{
"path": "cmd/edge/main.go",
"content": "package main\n\nimport (\n\t\"flag\"\n\t\"fmt\"\n\t\"log\"\n\t\"os\"\n\t\"os/signal\"\n\t\"syscall\"\n\n\t\"github.com/ccfos/nightingale/v6/pkg/osx\"\n\t\"github.com/ccfos/nightingale/v6/pkg/version\"\n\n\t\"github.com/toolkits/pkg/runner\"\n)\n\nvar (\n\tshowVersion = flag.Bool(\"version\", false, \"Show version.\")\n\tconfigDir = flag.String(\"configs\", osx.GetEnv(\"N9E_EDGE_CONFIGS\", \"etc\"), \"Specify configuration directory.(env:N9E_EDGE_CONFIGS)\")\n\tcryptoKey = flag.String(\"crypto-key\", \"\", \"Specify the secret key for configuration file field encryption.\")\n)\n\nfunc main() {\n\tflag.Parse()\n\n\tif *showVersion {\n\t\tfmt.Println(version.Version)\n\t\tos.Exit(0)\n\t}\n\n\tprintEnv()\n\n\tcleanFunc, err := Initialize(*configDir, *cryptoKey)\n\tif err != nil {\n\t\tlog.Fatalln(\"failed to initialize:\", err)\n\t}\n\n\tcode := 1\n\tsc := make(chan os.Signal, 1)\n\tsignal.Notify(sc, syscall.SIGHUP, syscall.SIGINT, syscall.SIGTERM, syscall.SIGQUIT)\n\nEXIT:\n\tfor {\n\t\tsig := <-sc\n\t\tfmt.Println(\"received signal:\", sig.String())\n\t\tswitch sig {\n\t\tcase syscall.SIGQUIT, syscall.SIGTERM, syscall.SIGINT:\n\t\t\tcode = 0\n\t\t\tbreak EXIT\n\t\tcase syscall.SIGHUP:\n\t\t\t// reload configuration?\n\t\tdefault:\n\t\t\tbreak EXIT\n\t\t}\n\t}\n\n\tcleanFunc()\n\tfmt.Println(\"process exited\")\n\tos.Exit(code)\n}\n\nfunc printEnv() {\n\trunner.Init()\n\tfmt.Println(\"runner.cwd:\", runner.Cwd)\n\tfmt.Println(\"runner.hostname:\", runner.Hostname)\n\tfmt.Println(\"runner.fd_limits:\", runner.FdLimits())\n\tfmt.Println(\"runner.vm_limits:\", runner.VMLimits())\n}\n"
},
{
"path": "cmd/pushgw/main.go",
"content": "package main\n\nimport (\n\t\"flag\"\n\t\"fmt\"\n\t\"log\"\n\t\"os\"\n\t\"os/signal\"\n\t\"syscall\"\n\n\t\"github.com/ccfos/nightingale/v6/pkg/osx\"\n\t\"github.com/ccfos/nightingale/v6/pkg/version\"\n\t\"github.com/ccfos/nightingale/v6/pushgw\"\n\n\t\"github.com/toolkits/pkg/runner\"\n)\n\nvar (\n\tshowVersion = flag.Bool(\"version\", false, \"Show version.\")\n\tconfigDir = flag.String(\"configs\", osx.GetEnv(\"N9E_PUSHGW_CONFIGS\", \"etc\"), \"Specify configuration directory.(env:N9E_PUSHGW_CONFIGS)\")\n\tcryptoKey = flag.String(\"crypto-key\", \"\", \"Specify the secret key for configuration file field encryption.\")\n)\n\nfunc main() {\n\tflag.Parse()\n\n\tif *showVersion {\n\t\tfmt.Println(version.Version)\n\t\tos.Exit(0)\n\t}\n\n\tprintEnv()\n\n\tcleanFunc, err := pushgw.Initialize(*configDir, *cryptoKey)\n\tif err != nil {\n\t\tlog.Fatalln(\"failed to initialize:\", err)\n\t}\n\n\tcode := 1\n\tsc := make(chan os.Signal, 1)\n\tsignal.Notify(sc, syscall.SIGHUP, syscall.SIGINT, syscall.SIGTERM, syscall.SIGQUIT)\n\nEXIT:\n\tfor {\n\t\tsig := <-sc\n\t\tfmt.Println(\"received signal:\", sig.String())\n\t\tswitch sig {\n\t\tcase syscall.SIGQUIT, syscall.SIGTERM, syscall.SIGINT:\n\t\t\tcode = 0\n\t\t\tbreak EXIT\n\t\tcase syscall.SIGHUP:\n\t\t\t// reload configuration?\n\t\tdefault:\n\t\t\tbreak EXIT\n\t\t}\n\t}\n\n\tcleanFunc()\n\tfmt.Println(\"process exited\")\n\tos.Exit(code)\n}\n\nfunc printEnv() {\n\trunner.Init()\n\tfmt.Println(\"runner.cwd:\", runner.Cwd)\n\tfmt.Println(\"runner.hostname:\", runner.Hostname)\n\tfmt.Println(\"runner.fd_limits:\", runner.FdLimits())\n\tfmt.Println(\"runner.vm_limits:\", runner.VMLimits())\n}\n"
},
{
"path": "conf/conf.go",
"content": "package conf\n\nimport (\n\t\"fmt\"\n\t\"net\"\n\t\"os\"\n\t\"strings\"\n\n\t\"github.com/ccfos/nightingale/v6/alert/aconf\"\n\t\"github.com/ccfos/nightingale/v6/center/cconf\"\n\t\"github.com/ccfos/nightingale/v6/pkg/cfg\"\n\t\"github.com/ccfos/nightingale/v6/pkg/httpx\"\n\t\"github.com/ccfos/nightingale/v6/pkg/logx\"\n\t\"github.com/ccfos/nightingale/v6/pkg/ormx\"\n\t\"github.com/ccfos/nightingale/v6/pushgw/pconf\"\n\t\"github.com/ccfos/nightingale/v6/storage\"\n)\n\ntype ConfigType struct {\n\tGlobal GlobalConfig\n\tLog logx.Config\n\tHTTP httpx.Config\n\tDB ormx.DBConfig\n\tRedis storage.RedisConfig\n\tCenterApi CenterApi\n\n\tPushgw pconf.Pushgw\n\tAlert aconf.Alert\n\tCenter cconf.Center\n\tIbex Ibex\n}\n\ntype CenterApi struct {\n\tAddrs []string\n\tBasicAuthUser string\n\tBasicAuthPass string\n\tTimeout int64\n}\n\ntype GlobalConfig struct {\n\tRunMode string\n}\n\ntype Ibex struct {\n\tEnable bool\n\tRPCListen string\n\tOutput Output\n}\n\ntype Output struct {\n\tComeFrom string\n\tAgtdPort int\n}\n\nfunc InitConfig(configDir, cryptoKey string) (*ConfigType, error) {\n\tvar config = new(ConfigType)\n\n\tif err := cfg.LoadConfigByDir(configDir, config); err != nil {\n\t\treturn nil, fmt.Errorf(\"failed to load configs of directory: %s error: %s\", configDir, err)\n\t}\n\n\tconfig.Pushgw.PreCheck()\n\tconfig.Alert.PreCheck(configDir)\n\tconfig.Center.PreCheck()\n\n\terr := decryptConfig(config, cryptoKey)\n\tif err != nil {\n\t\treturn nil, err\n\t}\n\n\tif config.Alert.Heartbeat.IP == \"\" {\n\t\t// auto detect\n\t\tconfig.Alert.Heartbeat.IP = fmt.Sprint(GetOutboundIP())\n\t\tif config.Alert.Heartbeat.IP == \"\" {\n\t\t\thostname, err := os.Hostname()\n\t\t\tif err != nil {\n\t\t\t\tfmt.Println(\"failed to get hostname:\", err)\n\t\t\t\tos.Exit(1)\n\t\t\t}\n\n\t\t\tif strings.Contains(hostname, \"localhost\") {\n\t\t\t\tfmt.Println(\"Warning! hostname contains substring localhost, setting a more unique hostname is recommended\")\n\t\t\t}\n\n\t\t\tconfig.Alert.Heartbeat.IP = hostname\n\t\t}\n\t}\n\n\tconfig.Alert.Heartbeat.Endpoint = fmt.Sprintf(\"%s:%d\", config.Alert.Heartbeat.IP, config.HTTP.Port)\n\n\treturn config, nil\n}\n\nfunc GetOutboundIP() net.IP {\n\tconn, err := net.Dial(\"udp\", \"223.5.5.5:80\")\n\tif err != nil {\n\t\tfmt.Println(\"auto get outbound ip fail:\", err)\n\t\treturn []byte{}\n\t}\n\tdefer conn.Close()\n\n\tlocalAddr := conn.LocalAddr().(*net.UDPAddr)\n\n\treturn localAddr.IP\n}\n"
},
{
"path": "conf/crypto.go",
"content": "package conf\n\nimport (\n\t\"fmt\"\n\n\t\"github.com/ccfos/nightingale/v6/pkg/secu\"\n)\n\nfunc decryptConfig(config *ConfigType, cryptoKey string) error {\n\tdecryptDsn, err := secu.DealWithDecrypt(config.DB.DSN, cryptoKey)\n\tif err != nil {\n\t\treturn fmt.Errorf(\"failed to decrypt the db dsn: %s\", err)\n\t}\n\n\tconfig.DB.DSN = decryptDsn\n\n\tdecryptRedisPwd, err := secu.DealWithDecrypt(config.Redis.Password, cryptoKey)\n\tif err != nil {\n\t\treturn fmt.Errorf(\"failed to decrypt the redis password: %s\", err)\n\t}\n\n\tconfig.Redis.Password = decryptRedisPwd\n\n\tfor k := range config.HTTP.APIForService.BasicAuth {\n\t\tdecryptPwd, err := secu.DealWithDecrypt(config.HTTP.APIForService.BasicAuth[k], cryptoKey)\n\t\tif err != nil {\n\t\t\treturn fmt.Errorf(\"failed to decrypt http basic auth password: %s\", err)\n\t\t}\n\n\t\tconfig.HTTP.APIForService.BasicAuth[k] = decryptPwd\n\t}\n\n\tfor k := range config.HTTP.APIForAgent.BasicAuth {\n\t\tdecryptPwd, err := secu.DealWithDecrypt(config.HTTP.APIForAgent.BasicAuth[k], cryptoKey)\n\t\tif err != nil {\n\t\t\treturn fmt.Errorf(\"failed to decrypt http basic auth password: %s\", err)\n\t\t}\n\n\t\tconfig.HTTP.APIForAgent.BasicAuth[k] = decryptPwd\n\t}\n\n\tfor i, v := range config.Pushgw.Writers {\n\t\tdecryptWriterPwd, err := secu.DealWithDecrypt(v.BasicAuthPass, cryptoKey)\n\t\tif err != nil {\n\t\t\treturn fmt.Errorf(\"failed to decrypt writer basic auth password: %s\", err)\n\t\t}\n\n\t\tconfig.Pushgw.Writers[i].BasicAuthPass = decryptWriterPwd\n\t}\n\n\treturn nil\n}\n"
},
{
"path": "cron/clean_notify_record.go",
"content": "package cron\n\nimport (\n\t\"time\"\n\n\t\"github.com/ccfos/nightingale/v6/models\"\n\t\"github.com/ccfos/nightingale/v6/pkg/ctx\"\n\n\t\"github.com/robfig/cron/v3\"\n\t\"github.com/toolkits/pkg/logger\"\n)\n\nfunc cleanNotifyRecord(ctx *ctx.Context, day int) {\n\tlastWeek := time.Now().Unix() - 86400*int64(day)\n\terr := models.DB(ctx).Model(&models.NotificationRecord{}).Where(\"created_at < ?\", lastWeek).Delete(&models.NotificationRecord{}).Error\n\tif err != nil {\n\t\tlogger.Errorf(\"Failed to clean notify record: %v\", err)\n\t}\n\n}\n\n// 每天凌晨1点执行清理任务\nfunc CleanNotifyRecord(ctx *ctx.Context, day int) {\n\tc := cron.New()\n\tif day < 1 {\n\t\tday = 7\n\t}\n\n\t// 使用cron表达式设置每天凌晨1点执行\n\t_, err := c.AddFunc(\"0 1 * * *\", func() {\n\t\tcleanNotifyRecord(ctx, day)\n\t})\n\n\tif err != nil {\n\t\tlogger.Errorf(\"Failed to add clean notify record cron job: %v\", err)\n\t\treturn\n\t}\n\n\t// 启动cron任务\n\tc.Start()\n}\n"
},
{
"path": "cron/clean_pipeline_execution.go",
"content": "package cron\n\nimport (\n\t\"time\"\n\n\t\"github.com/ccfos/nightingale/v6/models\"\n\t\"github.com/ccfos/nightingale/v6/pkg/ctx\"\n\n\t\"github.com/robfig/cron/v3\"\n\t\"github.com/toolkits/pkg/logger\"\n)\n\nconst (\n\tdefaultBatchSize = 100 // 每批删除数量\n\tdefaultSleepMs = 10 // 每批删除后休眠时间(毫秒)\n)\n\n// cleanPipelineExecutionInBatches 分批删除执行记录,避免大批量删除影响数据库性能\nfunc cleanPipelineExecutionInBatches(ctx *ctx.Context, day int) {\n\tthreshold := time.Now().Unix() - 86400*int64(day)\n\tvar totalDeleted int64\n\n\tfor {\n\t\tdeleted, err := models.DeleteEventPipelineExecutionsInBatches(ctx, threshold, defaultBatchSize)\n\t\tif err != nil {\n\t\t\tlogger.Errorf(\"Failed to clean pipeline execution records in batch: %v\", err)\n\t\t\treturn\n\t\t}\n\n\t\ttotalDeleted += deleted\n\n\t\t// 如果本批删除数量小于 batchSize,说明已删除完毕\n\t\tif deleted < int64(defaultBatchSize) {\n\t\t\tbreak\n\t\t}\n\n\t\t// 休眠一段时间,降低数据库压力\n\t\ttime.Sleep(time.Duration(defaultSleepMs) * time.Millisecond)\n\t}\n\n\tif totalDeleted > 0 {\n\t\tlogger.Infof(\"Cleaned %d pipeline execution records older than %d days\", totalDeleted, day)\n\t}\n}\n\n// CleanPipelineExecution starts a cron job to clean old pipeline execution records in batches\n// Runs daily at 6:00 AM\n// day: 数据保留天数,默认 7 天\n// 使用分批删除方式,每批 100 条,间隔 10ms,避免大批量删除影响数据库性能\nfunc CleanPipelineExecution(ctx *ctx.Context, day int) {\n\tc := cron.New()\n\tif day < 1 {\n\t\tday = 7 // default retention: 7 days\n\t}\n\n\t_, err := c.AddFunc(\"0 6 * * *\", func() {\n\t\tcleanPipelineExecutionInBatches(ctx, day)\n\t})\n\n\tif err != nil {\n\t\tlogger.Errorf(\"Failed to add clean pipeline execution cron job: %v\", err)\n\t\treturn\n\t}\n\n\tc.Start()\n\tlogger.Infof(\"Pipeline execution cleanup cron started, retention: %d days, batch_size: %d, sleep_ms: %d\", day, defaultBatchSize, defaultSleepMs)\n}\n"
},
{
"path": "datasource/ck/clickhouse.go",
"content": "package ck\n\nimport (\n\t\"context\"\n\t\"fmt\"\n\t\"strings\"\n\n\t\"github.com/ccfos/nightingale/v6/datasource\"\n\tck \"github.com/ccfos/nightingale/v6/dskit/clickhouse\"\n\t\"github.com/ccfos/nightingale/v6/models\"\n\t\"github.com/ccfos/nightingale/v6/pkg/macros\"\n\n\t\"github.com/mitchellh/mapstructure\"\n\t\"github.com/toolkits/pkg/logger\"\n\n\t\"github.com/ccfos/nightingale/v6/pkg/logx\"\n)\n\nconst (\n\tCKType = \"ck\"\n\n\tTimeFieldFormatEpochMilli = \"epoch_millis\"\n\tTimeFieldFormatEpochSecond = \"epoch_second\"\n\n\tDefaultLimit = 500\n)\n\nvar (\n\tckPrivBanned = []string{\n\t\t\"INSERT\",\n\t\t\"CREATE\",\n\t\t\"DROP\",\n\t\t\"DELETE\",\n\t\t\"UPDATE\",\n\t\t\"ALL\",\n\t}\n\n\tckBannedOp = map[string]struct{}{\n\t\t\"CREATE\": {},\n\t\t\"INSERT\": {},\n\t\t\"ALTER\": {},\n\t\t\"REVOKE\": {},\n\t\t\"DROP\": {},\n\t\t\"RENAME\": {},\n\t\t\"ATTACH\": {},\n\t\t\"DETACH\": {},\n\t\t\"OPTIMIZE\": {},\n\t\t\"TRUNCATE\": {},\n\t\t\"SET\": {},\n\t}\n)\n\nfunc init() {\n\tdatasource.RegisterDatasource(CKType, new(Clickhouse))\n}\n\ntype CKShard struct {\n\tAddr string `json:\"ck.addr\" mapstructure:\"ck.addr\"`\n\tUser string `json:\"ck.user\" mapstructure:\"ck.user\"`\n\tPassword string `json:\"ck.password\" mapstructure:\"ck.password\"`\n\tDatabase string `json:\"ck.db\" mapstructure:\"ck.db\"`\n\tIsEncrypted bool `json:\"ck.is_encrypt\" mapstructure:\"ck.is_encrypt\"`\n}\n\ntype QueryParam struct {\n\tLimit int `json:\"limit\" mapstructure:\"limit\"`\n\tSql string `json:\"sql\" mapstructure:\"sql\"`\n\tRef string `json:\"ref\" mapstructure:\"ref\"`\n\tFrom int64 `json:\"from\" mapstructure:\"from\"`\n\tTo int64 `json:\"to\" mapstructure:\"to\"`\n\tTimeField string `json:\"time_field\" mapstructure:\"time_field\"`\n\tTimeFormat string `json:\"time_format\" mapstructure:\"time_format\"`\n\tKeys datasource.Keys `json:\"keys\" mapstructure:\"keys\"`\n\tDatabase string `json:\"database\" mapstructure:\"database\"`\n\tTable string `json:\"table\" mapstructure:\"table\"`\n}\n\ntype Clickhouse struct {\n\tck.Clickhouse `json:\",inline\" mapstructure:\",squash\"`\n}\n\nfunc (c *Clickhouse) Init(settings map[string]interface{}) (datasource.Datasource, error) {\n\tnewest := new(Clickhouse)\n\terr := mapstructure.Decode(settings, newest)\n\treturn newest, err\n}\n\nfunc (c *Clickhouse) InitClient() error {\n\treturn c.InitCli()\n}\n\nfunc (c *Clickhouse) Validate(ctx context.Context) error {\n\tif len(c.Nodes) == 0 {\n\t\treturn fmt.Errorf(\"ck shard is invalid, please check datasource setting\")\n\t}\n\n\taddr := c.Nodes[0]\n\tif len(strings.Trim(c.User, \" \")) == 0 {\n\t\treturn fmt.Errorf(\"ck shard user is invalid, please check datasource setting\")\n\t}\n\n\tif len(strings.Trim(addr, \" \")) == 0 {\n\t\treturn fmt.Errorf(\"ck shard addr is invalid, please check datasource setting\")\n\t}\n\n\t// if len(strings.Trim(shard.Password, \" \")) == 0 {\n\t// \treturn fmt.Errorf(\"ck shard password is empty, please check datasource setting or set password for user\")\n\t// }\n\n\treturn nil\n}\n\n// Equal compares whether two objects are the same, used for caching\nfunc (c *Clickhouse) Equal(p datasource.Datasource) bool {\n\n\tplg, ok := p.(*Clickhouse)\n\tif !ok {\n\t\tlogger.Errorf(\"unexpected plugin type, expected is ck\")\n\t\treturn false\n\t}\n\n\t// only compare first shard\n\tif len(c.Nodes) == 0 {\n\t\tlogger.Errorf(\"ck shard is empty\")\n\t\treturn false\n\t}\n\taddr := c.Nodes[0]\n\n\tif len(plg.Nodes) == 0 {\n\t\tlogger.Errorf(\"new ck plugin obj shard is empty\")\n\t\treturn false\n\t}\n\tnewAddr := plg.Nodes[0]\n\n\tif c.User != plg.User {\n\t\treturn false\n\t}\n\n\tif addr != newAddr {\n\t\treturn false\n\t}\n\n\tif c.Password != plg.Password {\n\t\treturn false\n\t}\n\n\treturn true\n}\n\nfunc (c *Clickhouse) MakeLogQuery(ctx context.Context, query interface{}, eventTags []string, start, end int64) (interface{}, error) {\n\treturn nil, nil\n}\n\nfunc (c *Clickhouse) MakeTSQuery(ctx context.Context, query interface{}, eventTags []string, start, end int64) (interface{}, error) {\n\treturn nil, nil\n}\n\nfunc (c *Clickhouse) QueryMapData(ctx context.Context, query interface{}) ([]map[string]string, error) {\n\treturn nil, nil\n}\n\nfunc (c *Clickhouse) QueryData(ctx context.Context, query interface{}) ([]models.DataResp, error) {\n\n\tckQueryParam := new(ck.QueryParam)\n\tif err := mapstructure.Decode(query, ckQueryParam); err != nil {\n\t\treturn nil, err\n\t}\n\n\tif strings.Contains(ckQueryParam.Sql, \"$__\") {\n\t\tvar err error\n\t\tckQueryParam.Sql, err = macros.Macro(ckQueryParam.Sql, ckQueryParam.From, ckQueryParam.To)\n\t\tif err != nil {\n\t\t\treturn nil, err\n\t\t}\n\t}\n\n\tif ckQueryParam.Keys.ValueKey == \"\" {\n\t\treturn nil, fmt.Errorf(\"valueKey is required\")\n\t}\n\n\trows, err := c.QueryTimeseries(ctx, ckQueryParam)\n\tif err != nil {\n\t\tlogx.Warningf(ctx, \"query:%+v get data err:%v\", ckQueryParam, err)\n\t\treturn nil, err\n\t}\n\tdata := make([]models.DataResp, 0)\n\tfor i := range rows {\n\t\tdata = append(data, models.DataResp{\n\t\t\tRef: ckQueryParam.Ref,\n\t\t\tMetric: rows[i].Metric,\n\t\t\tValues: rows[i].Values,\n\t\t})\n\t}\n\n\treturn data, nil\n}\n\nfunc (c *Clickhouse) QueryLog(ctx context.Context, query interface{}) ([]interface{}, int64, error) {\n\tckQueryParam := new(QueryParam)\n\tif err := mapstructure.Decode(query, ckQueryParam); err != nil {\n\t\treturn nil, 0, err\n\t}\n\n\tif strings.Contains(ckQueryParam.Sql, \"$__\") {\n\t\tvar err error\n\t\tckQueryParam.Sql, err = macros.Macro(ckQueryParam.Sql, ckQueryParam.From, ckQueryParam.To)\n\t\tif err != nil {\n\t\t\treturn nil, 0, err\n\t\t}\n\t}\n\n\trows, err := c.Query(ctx, ckQueryParam)\n\tif err != nil {\n\t\tlogx.Warningf(ctx, \"query:%+v get data err:%v\", ckQueryParam, err)\n\t\treturn nil, 0, err\n\t}\n\n\tlimit := getLimit(len(rows), ckQueryParam.Limit)\n\n\tlogs := make([]interface{}, 0)\n\tfor i := 0; i < limit; i++ {\n\t\tlogs = append(logs, rows[i])\n\t}\n\n\treturn logs, int64(limit), nil\n}\n\nfunc getLimit(rowLen, pLimit int) int {\n\tlimit := DefaultLimit\n\tif pLimit > 0 {\n\t\tlimit = pLimit\n\t}\n\tif rowLen > limit {\n\t\treturn limit\n\t}\n\n\treturn rowLen\n}\n"
},
{
"path": "datasource/commons/eslike/eslike.go",
"content": "package eslike\n\nimport (\n\t\"context\"\n\t\"encoding/json\"\n\t\"fmt\"\n\t\"strconv\"\n\t\"strings\"\n\t\"time\"\n\n\t\"github.com/araddon/dateparse\"\n\t\"github.com/bitly/go-simplejson\"\n\t\"github.com/mitchellh/mapstructure\"\n\t\"github.com/olivere/elastic/v7\"\n\t\"github.com/prometheus/common/model\"\n\t\"github.com/toolkits/pkg/logger\"\n\n\t\"github.com/ccfos/nightingale/v6/memsto\"\n\t\"github.com/ccfos/nightingale/v6/models\"\n\t\"github.com/ccfos/nightingale/v6/pkg/logx\"\n)\n\ntype FixedField string\n\nconst (\n\tFieldIndex FixedField = \"_index\"\n\tFieldId FixedField = \"_id\"\n)\n\n// LabelSeparator 用于分隔多个标签的分隔符\n// 使用 ASCII 控制字符 Record Separator (0x1E),避免与用户数据中的 \"--\" 冲突\nconst LabelSeparator = \"\\x1e\"\n\ntype Query struct {\n\tRef string `json:\"ref\" mapstructure:\"ref\"`\n\tIndexType string `json:\"index_type\" mapstructure:\"index_type\"` // 普通索引:index 索引模式:index_pattern\n\tIndex string `json:\"index\" mapstructure:\"index\"`\n\tIndexPatternId int64 `json:\"index_pattern\" mapstructure:\"index_pattern\"`\n\tFilter string `json:\"filter\" mapstructure:\"filter\"`\n\tOffset int64 `json:\"offset\" mapstructure:\"offset\"`\n\tMetricAggr MetricAggr `json:\"value\" mapstructure:\"value\"`\n\tGroupBy []GroupBy `json:\"group_by\" mapstructure:\"group_by\"`\n\tDateField string `json:\"date_field\" mapstructure:\"date_field\"`\n\tInterval int64 `json:\"interval\" mapstructure:\"interval\"`\n\tStart int64 `json:\"start\" mapstructure:\"start\"`\n\tEnd int64 `json:\"end\" mapstructure:\"end\"`\n\tP int `json:\"page\" mapstructure:\"page\"` // 页码\n\tLimit int `json:\"limit\" mapstructure:\"limit\"` // 每页个数\n\tAscending bool `json:\"ascending\" mapstructure:\"ascending\"` // 按照DataField排序\n\n\tTimeout int `json:\"timeout\" mapstructure:\"timeout\"`\n\tMaxShard int `json:\"max_shard\" mapstructure:\"max_shard\"`\n\n\tSearchAfter *SearchAfter `json:\"search_after\" mapstructure:\"search_after\"`\n}\n\ntype SortField struct {\n\tField string `json:\"field\" mapstructure:\"field\"`\n\tAscending bool `json:\"ascending\" mapstructure:\"ascending\"`\n}\n\ntype SearchAfter struct {\n\tSortFields []SortField `json:\"sort_fields\" mapstructure:\"sort_fields\"` // 指定排序字段, 一般是timestamp:desc, _index:asc, _id:asc 三者组合,构成唯一的排序字段\n\tSearchAfter []interface{} `json:\"search_after\" mapstructure:\"search_after\"` // 指定排序字段的搜索值,搜索值必须和sort_fields的顺序一致,为上一次查询的最后一条日志的值\n}\n\ntype MetricAggr struct {\n\tField string `json:\"field\" mapstructure:\"field\"`\n\tFunc string `json:\"func\" mapstructure:\"func\"`\n\tRef string `json:\"ref\" mapstructure:\"ref\"` // 变量名,A B C\n}\n\ntype GroupBy struct {\n\tCate GroupByCate `json:\"cate\" mapstructure:\"cate\"` // 分组类型\n\tField string `json:\"field\" mapstructure:\"field\"`\n\tMinDocCount int64 `json:\"min_doc_count\" mapstructure:\"min_doc_count\"`\n\tOrder string `json:\"order\" mapstructure:\"order\"`\n\tOrderBy string `json:\"order_by\" mapstructure:\"order_by\"`\n\tSize int `json:\"size\" mapstructure:\"size\"`\n\n\tParams []Param `json:\"params\" mapstructure:\"params\"` // 类型是 filter 时使用\n\tInterval int64 `json:\"interval\" mapstructure:\"interval\"` // 分组间隔\n}\n\ntype SearchFunc func(ctx context.Context, indices []string, source interface{}, timeout int, maxShard int) (*elastic.SearchResult, error)\ntype QueryFieldsFunc func(indices []string) ([]string, error)\n\n// 分组类型\ntype GroupByCate string\n\nconst (\n\tFilters GroupByCate = \"filters\"\n\tHistogram GroupByCate = \"histogram\"\n\tTerms GroupByCate = \"terms\"\n)\n\n// 参数\ntype Param struct {\n\tAlias string `json:\"alias,omitempty\"` // 别名,a=b的形式,filter 特有\n\tQuery string `json:\"query,omitempty\"` // 查询条件,filter 特有\n}\n\ntype MetricPtr struct {\n\tData map[string][][]float64\n}\n\nfunc IterGetMap(m, ret map[string]interface{}, prefixKey string) {\n\tfor k, v := range m {\n\t\tswitch v.(type) {\n\t\tcase map[string]interface{}:\n\t\t\tvar key string\n\t\t\tif prefixKey != \"\" {\n\t\t\t\tkey = fmt.Sprintf(\"%s.%s\", prefixKey, k)\n\t\t\t} else {\n\t\t\t\tkey = k\n\t\t\t}\n\t\t\tIterGetMap(v.(map[string]interface{}), ret, key)\n\t\tdefault:\n\t\t\tret[prefixKey+\".\"+k] = []interface{}{v}\n\t\t}\n\t}\n}\n\nfunc TransferData(metric, ref string, m map[string][][]float64) []models.DataResp {\n\tvar datas []models.DataResp\n\n\tfor k, v := range m {\n\t\tdata := models.DataResp{\n\t\t\tRef: ref,\n\t\t\tMetric: make(model.Metric),\n\t\t\tLabels: k,\n\t\t\tValues: v,\n\t\t}\n\n\t\tdata.Metric[\"__name__\"] = model.LabelValue(metric)\n\t\tlabels := strings.Split(k, LabelSeparator)\n\t\tfor _, label := range labels {\n\t\t\tarr := strings.SplitN(label, \"=\", 2)\n\t\t\tif len(arr) == 2 {\n\t\t\t\tdata.Metric[model.LabelName(arr[0])] = model.LabelValue(arr[1])\n\t\t\t}\n\t\t}\n\t\tdatas = append(datas, data)\n\t}\n\n\tfor i := 0; i < len(datas); i++ {\n\t\tfor k, v := range datas[i].Metric {\n\t\t\tif k == \"__name__\" {\n\t\t\t\tdatas[i].Metric[k] = model.LabelValue(ref) + \"_\" + v\n\t\t\t}\n\t\t}\n\t}\n\n\treturn datas\n}\n\nfunc GetQueryString(filter string, q *elastic.RangeQuery) *elastic.BoolQuery {\n\tvar queryString *elastic.BoolQuery\n\tif filter != \"\" {\n\t\tif strings.Contains(filter, \":\") || strings.Contains(filter, \"AND\") || strings.Contains(filter, \"OR\") || strings.Contains(filter, \"NOT\") {\n\t\t\tqueryString = elastic.NewBoolQuery().Must(elastic.NewQueryStringQuery(filter)).Filter(q)\n\t\t} else {\n\t\t\tqueryString = elastic.NewBoolQuery().Filter(elastic.NewMultiMatchQuery(filter).Lenient(true).Type(\"phrase\")).Filter(q)\n\t\t}\n\t} else {\n\t\tqueryString = elastic.NewBoolQuery().Should(q)\n\t}\n\n\treturn queryString\n}\n\nfunc getUnixTs(timeStr string) int64 {\n\tts, err := strconv.ParseInt(timeStr, 10, 64)\n\tif err == nil {\n\t\treturn ts\n\t}\n\n\tparsedTime, err := dateparse.ParseAny(timeStr)\n\tif err != nil {\n\t\tlogger.Error(\"failed to ParseAny: \", err)\n\t\treturn 0\n\t}\n\treturn parsedTime.UnixMilli()\n}\n\nfunc GetBuckets(labelKey string, keys []string, arr []interface{}, metrics *MetricPtr, labels string, ts int64, f string) {\n\tvar err error\n\tbucketsKey := \"\"\n\tif len(keys) > 0 {\n\t\tbucketsKey = keys[0]\n\t}\n\n\tnewlabels := \"\"\n\tfor i := 0; i < len(arr); i++ {\n\t\ttmp := arr[i].(map[string]interface{})\n\t\tkeyAsString, getTs := tmp[\"key_as_string\"]\n\t\tif getTs {\n\t\t\tts = getUnixTs(keyAsString.(string))\n\t\t}\n\t\tkeyValue := tmp[\"key\"]\n\t\tswitch keyValue.(type) {\n\t\tcase json.Number, string:\n\t\t\tif !getTs {\n\t\t\t\tif labels != \"\" {\n\t\t\t\t\tnewlabels = fmt.Sprintf(\"%s%s%s=%v\", labels, LabelSeparator, labelKey, keyValue)\n\t\t\t\t} else {\n\t\t\t\t\tnewlabels = fmt.Sprintf(\"%s=%v\", labelKey, keyValue)\n\t\t\t\t}\n\t\t\t}\n\t\tdefault:\n\t\t\tcontinue\n\t\t}\n\n\t\tvar finalValue float64\n\t\tif len(keys) == 0 { // 计算 doc_count 的情况\n\t\t\tcount := tmp[\"doc_count\"]\n\t\t\tfinalValue, err = count.(json.Number).Float64()\n\t\t\tif err != nil {\n\t\t\t\tlogger.Warningf(\"labelKey:%s get value error:%v\", labelKey, err)\n\t\t\t}\n\t\t\tnewValues := []float64{float64(ts / 1000), finalValue}\n\t\t\tmetrics.Data[newlabels] = append(metrics.Data[newlabels], newValues)\n\t\t\tcontinue\n\t\t}\n\n\t\tinnerBuckets, exists := tmp[bucketsKey]\n\t\tif !exists {\n\t\t\tcontinue\n\t\t}\n\n\t\tnextBucketsArr, exists := innerBuckets.(map[string]interface{})[\"buckets\"]\n\t\tif exists {\n\t\t\tif len(keys[1:]) >= 1 {\n\t\t\t\tGetBuckets(bucketsKey, keys[1:], nextBucketsArr.([]interface{}), metrics, newlabels, ts, f)\n\t\t\t} else {\n\t\t\t\tGetBuckets(bucketsKey, []string{}, nextBucketsArr.([]interface{}), metrics, newlabels, ts, f)\n\t\t\t}\n\t\t} else {\n\n\t\t\t// doc_count\n\t\t\tif f == \"count\" || f == \"nodata\" {\n\t\t\t\tcount := tmp[\"doc_count\"]\n\t\t\t\tfinalValue, err = count.(json.Number).Float64()\n\t\t\t\tif err != nil {\n\t\t\t\t\tlogger.Warningf(\"get %v value error:%v\", count, err)\n\t\t\t\t}\n\t\t\t} else {\n\t\t\t\tvalues, exists := innerBuckets.(map[string]interface{})[\"value\"]\n\t\t\t\tif exists {\n\t\t\t\t\tswitch values.(type) {\n\t\t\t\t\tcase json.Number:\n\t\t\t\t\t\tvalue, err := values.(json.Number).Float64()\n\t\t\t\t\t\tif err != nil {\n\t\t\t\t\t\t\tlogger.Warningf(\"labelKey:%s get value error:%v\", labelKey, err)\n\t\t\t\t\t\t}\n\t\t\t\t\t\tfinalValue = value\n\t\t\t\t\t}\n\t\t\t\t} else {\n\t\t\t\t\tswitch values.(type) {\n\t\t\t\t\tcase map[string]interface{}:\n\t\t\t\t\t\tvar err error\n\t\t\t\t\t\tvalues := innerBuckets.(map[string]interface{})[\"values\"]\n\t\t\t\t\t\tfor _, v := range values.(map[string]interface{}) {\n\t\t\t\t\t\t\tfinalValue, err = v.(json.Number).Float64()\n\t\t\t\t\t\t\tif err != nil {\n\t\t\t\t\t\t\t\tlogger.Warningf(\"labelKey:%s get value error:%v\", labelKey, err)\n\t\t\t\t\t\t\t}\n\t\t\t\t\t\t}\n\t\t\t\t\tdefault:\n\t\t\t\t\t\tvalues := innerBuckets.(map[string]interface{})[\"values\"]\n\t\t\t\t\t\tfor _, v := range values.(map[string]interface{}) {\n\t\t\t\t\t\t\t// Todo 修复 v is nil 导致 panic 情况\n\t\t\t\t\t\t\tfinalValue, err = v.(json.Number).Float64()\n\t\t\t\t\t\t\tif err != nil {\n\t\t\t\t\t\t\t\tlogger.Warningf(\"labelKey:%s get value error:%v\", labelKey, err)\n\t\t\t\t\t\t\t}\n\t\t\t\t\t\t}\n\t\t\t\t\t}\n\t\t\t\t}\n\t\t\t}\n\n\t\t\tif _, exists := metrics.Data[newlabels]; !exists {\n\t\t\t\tmetrics.Data[newlabels] = [][]float64{}\n\t\t\t}\n\n\t\t\tnewValues := []float64{float64(ts / 1000), finalValue}\n\t\t\tmetrics.Data[newlabels] = append(metrics.Data[newlabels], newValues)\n\t\t}\n\t}\n}\n\nfunc MakeLogQuery(ctx context.Context, query interface{}, eventTags []string, start, end int64) (interface{}, error) {\n\tparam := new(Query)\n\tif err := mapstructure.Decode(query, param); err != nil {\n\t\treturn nil, err\n\t}\n\n\tfor i := 0; i < len(eventTags); i++ {\n\t\tarr := strings.SplitN(eventTags[i], \"=\", 2)\n\t\tif len(arr) == 2 {\n\t\t\teventTags[i] = fmt.Sprintf(\"%s:%s\", arr[0], strconv.Quote(arr[1]))\n\t\t}\n\t}\n\n\tif len(eventTags) > 0 {\n\t\tif param.Filter == \"\" {\n\t\t\tparam.Filter = strings.Join(eventTags, \" AND \")\n\t\t} else {\n\t\t\tparam.Filter = param.Filter + \" AND \" + strings.Join(eventTags, \" AND \")\n\t\t}\n\t}\n\n\tparam.Start = start\n\tparam.End = end\n\n\treturn param, nil\n}\n\nfunc MakeTSQuery(ctx context.Context, query interface{}, eventTags []string, start, end int64) (interface{}, error) {\n\tparam := new(Query)\n\tif err := mapstructure.Decode(query, param); err != nil {\n\t\treturn nil, err\n\t}\n\n\tfor i := 0; i < len(eventTags); i++ {\n\t\tarr := strings.SplitN(eventTags[i], \"=\", 2)\n\t\tif len(arr) == 2 {\n\t\t\teventTags[i] = fmt.Sprintf(\"%s:%s\", arr[0], strconv.Quote(arr[1]))\n\t\t}\n\t}\n\n\tif len(eventTags) > 0 {\n\t\tif param.Filter == \"\" {\n\t\t\tparam.Filter = strings.Join(eventTags, \" AND \")\n\t\t} else {\n\t\t\tparam.Filter = param.Filter + \" AND \" + strings.Join(eventTags, \" AND \")\n\t\t}\n\t}\n\tparam.Start = start\n\tparam.End = end\n\n\treturn param, nil\n}\n\nvar esIndexPatternCache *memsto.EsIndexPatternCacheType\n\nfunc SetEsIndexPatternCacheType(c *memsto.EsIndexPatternCacheType) {\n\tesIndexPatternCache = c\n}\n\nfunc GetEsIndexPatternCacheType() *memsto.EsIndexPatternCacheType {\n\treturn esIndexPatternCache\n}\n\nfunc QueryData(ctx context.Context, queryParam interface{}, cliTimeout int64, version string, search SearchFunc) ([]models.DataResp, error) {\n\tparam := new(Query)\n\tif err := mapstructure.Decode(queryParam, param); err != nil {\n\t\treturn nil, err\n\t}\n\n\tif param.Timeout == 0 {\n\t\tparam.Timeout = int(cliTimeout) / 1000\n\t}\n\n\tif param.Interval == 0 {\n\t\tparam.Interval = 60\n\t}\n\n\tif param.MaxShard < 1 {\n\t\tparam.MaxShard = 5\n\t}\n\n\tif param.DateField == \"\" {\n\t\tparam.DateField = \"@timestamp\"\n\t}\n\n\tvar indexArr []string\n\tif param.IndexType == \"index_pattern\" {\n\t\tif ip, ok := GetEsIndexPatternCacheType().Get(param.IndexPatternId); ok {\n\t\t\tparam.DateField = ip.TimeField\n\t\t\tindexArr = []string{ip.Name}\n\t\t\tparam.Index = ip.Name\n\t\t} else {\n\t\t\treturn nil, fmt.Errorf(\"index pattern:%d not found\", param.IndexPatternId)\n\t\t}\n\t} else {\n\t\tindexArr = strings.Split(param.Index, \",\")\n\t}\n\n\tq := elastic.NewRangeQuery(param.DateField)\n\tnow := time.Now().Unix()\n\tvar start, end int64\n\tif param.End != 0 && param.Start != 0 {\n\t\tend = param.End\n\t\tstart = param.Start\n\t} else {\n\t\tend = now\n\t\tstart = end - param.Interval\n\t}\n\n\tdelay, ok := ctx.Value(\"delay\").(int64)\n\tif ok && delay != 0 {\n\t\tend = end - delay\n\t\tstart = start - delay\n\t}\n\n\tif param.Offset > 0 {\n\t\tend = end - param.Offset\n\t\tstart = start - param.Offset\n\t}\n\n\tq.Gte(time.Unix(start, 0).UnixMilli())\n\tq.Lt(time.Unix(end, 0).UnixMilli())\n\tq.Format(\"epoch_millis\")\n\n\tfield := param.MetricAggr.Field\n\tgroupBys := param.GroupBy\n\n\tqueryString := GetQueryString(param.Filter, q)\n\n\tvar aggr elastic.Aggregation\n\tswitch param.MetricAggr.Func {\n\tcase \"avg\":\n\t\taggr = elastic.NewAvgAggregation().Field(field)\n\tcase \"max\":\n\t\taggr = elastic.NewMaxAggregation().Field(field)\n\tcase \"min\":\n\t\taggr = elastic.NewMinAggregation().Field(field)\n\tcase \"sum\":\n\t\taggr = elastic.NewSumAggregation().Field(field)\n\tcase \"count\":\n\t\taggr = elastic.NewValueCountAggregation().Field(field)\n\tcase \"p90\":\n\t\taggr = elastic.NewPercentilesAggregation().Percentiles(90).Field(field)\n\tcase \"p95\":\n\t\taggr = elastic.NewPercentilesAggregation().Percentiles(95).Field(field)\n\tcase \"p99\":\n\t\taggr = elastic.NewPercentilesAggregation().Percentiles(99).Field(field)\n\tcase \"median\":\n\t\taggr = elastic.NewPercentilesAggregation().Percentiles(50).Field(field)\n\tdefault:\n\t\treturn nil, fmt.Errorf(\"func %s not support\", param.MetricAggr.Func)\n\t}\n\n\ttsAggr := elastic.NewDateHistogramAggregation().\n\t\tField(param.DateField).\n\t\tMinDocCount(1)\n\n\tversionParts := strings.Split(version, \".\")\n\tmajor := 0\n\tif len(versionParts) > 0 {\n\t\tif m, err := strconv.Atoi(versionParts[0]); err == nil {\n\t\t\tmajor = m\n\t\t}\n\t}\n\tminor := 0\n\tif len(versionParts) > 1 {\n\t\tif m, err := strconv.Atoi(versionParts[1]); err == nil {\n\t\t\tminor = m\n\t\t}\n\t}\n\n\tif major >= 7 {\n\t\t// 添加偏移量,使第一个分桶bucket的左边界对齐为 start 时间\n\t\toffset := (start % param.Interval) - param.Interval\n\n\t\t// 使用 fixed_interval 的条件:ES 7.2+ 或者任何 major > 7(例如 ES8)\n\t\tif (major > 7) || (major == 7 && minor >= 2) {\n\t\t\t// ES 7.2+ 以及 ES8+ 使用 fixed_interval\n\t\t\ttsAggr.FixedInterval(fmt.Sprintf(\"%ds\", param.Interval)).Offset(fmt.Sprintf(\"%ds\", offset))\n\t\t} else {\n\t\t\t// 7.0-7.1 使用 interval(带 offset)\n\t\t\ttsAggr.Interval(fmt.Sprintf(\"%ds\", param.Interval)).Offset(fmt.Sprintf(\"%ds\", offset))\n\t\t}\n\t} else {\n\t\t// 兼容 7.0 以下的版本\n\t\t// OpenSearch 也使用这个字段\n\t\ttsAggr.Interval(fmt.Sprintf(\"%ds\", param.Interval))\n\t}\n\n\t// group by\n\tvar groupByAggregation elastic.Aggregation\n\tif len(groupBys) > 0 {\n\t\tgroupBy := groupBys[0]\n\n\t\tif groupBy.MinDocCount == 0 {\n\t\t\tgroupBy.MinDocCount = 1\n\t\t}\n\n\t\tif groupBy.Size == 0 {\n\t\t\tgroupBy.Size = 300\n\t\t}\n\n\t\tswitch groupBy.Cate {\n\t\tcase Terms:\n\t\t\tif param.MetricAggr.Func != \"count\" {\n\t\t\t\tgroupByAggregation = elastic.NewTermsAggregation().Field(groupBy.Field).SubAggregation(field, aggr).OrderByKeyDesc().Size(groupBy.Size).MinDocCount(int(groupBy.MinDocCount))\n\t\t\t} else {\n\t\t\t\tgroupByAggregation = elastic.NewTermsAggregation().Field(groupBy.Field).OrderByKeyDesc().Size(groupBy.Size).MinDocCount(int(groupBy.MinDocCount))\n\t\t\t}\n\t\tcase Histogram:\n\t\t\tif param.MetricAggr.Func != \"count\" {\n\t\t\t\tgroupByAggregation = elastic.NewHistogramAggregation().Field(groupBy.Field).Interval(float64(groupBy.Interval)).SubAggregation(field, aggr)\n\t\t\t} else {\n\t\t\t\tgroupByAggregation = elastic.NewHistogramAggregation().Field(groupBy.Field).Interval(float64(groupBy.Interval))\n\t\t\t}\n\t\tcase Filters:\n\t\t\tfor _, filterParam := range groupBy.Params {\n\t\t\t\tif param.MetricAggr.Func != \"count\" {\n\t\t\t\t\tgroupByAggregation = elastic.NewFilterAggregation().Filter(elastic.NewTermQuery(filterParam.Query, \"true\")).SubAggregation(field, aggr)\n\t\t\t\t} else {\n\t\t\t\t\tgroupByAggregation = elastic.NewFilterAggregation().Filter(elastic.NewTermQuery(filterParam.Query, \"true\"))\n\t\t\t\t}\n\t\t\t}\n\t\t}\n\n\t\tfor i := 1; i < len(groupBys); i++ {\n\t\t\tgroupBy := groupBys[i]\n\n\t\t\tif groupBy.MinDocCount == 0 {\n\t\t\t\tgroupBy.MinDocCount = 1\n\t\t\t}\n\n\t\t\tif groupBy.Size == 0 {\n\t\t\t\tgroupBy.Size = 300\n\t\t\t}\n\n\t\t\tswitch groupBy.Cate {\n\t\t\tcase Terms:\n\t\t\t\tgroupByAggregation = elastic.NewTermsAggregation().Field(groupBy.Field).SubAggregation(groupBys[i-1].Field, groupByAggregation).OrderByKeyDesc().Size(groupBy.Size).MinDocCount(int(groupBy.MinDocCount))\n\t\t\tcase Histogram:\n\t\t\t\tgroupByAggregation = elastic.NewHistogramAggregation().Field(groupBy.Field).Interval(float64(groupBy.Interval)).SubAggregation(groupBys[i-1].Field, groupByAggregation)\n\t\t\tcase Filters:\n\t\t\t\tfor _, filterParam := range groupBy.Params {\n\t\t\t\t\tgroupByAggregation = elastic.NewFilterAggregation().Filter(elastic.NewTermQuery(filterParam.Query, \"true\")).SubAggregation(groupBys[i-1].Field, groupByAggregation)\n\t\t\t\t}\n\t\t\t}\n\t\t}\n\n\t\ttsAggr.SubAggregation(groupBys[len(groupBys)-1].Field, groupByAggregation)\n\t} else if param.MetricAggr.Func != \"count\" {\n\t\ttsAggr.SubAggregation(field, aggr)\n\t}\n\n\tsource, _ := queryString.Source()\n\tb, _ := json.Marshal(source)\n\tlogx.Debugf(ctx, \"query_data q:%+v indexArr:%+v tsAggr:%+v query_string:%s\", param, indexArr, tsAggr, string(b))\n\n\tsearchSource := elastic.NewSearchSource().\n\t\tQuery(queryString).\n\t\tAggregation(\"ts\", tsAggr)\n\n\tsearchSourceString, err := searchSource.Source()\n\tif err != nil {\n\t\tlogx.Warningf(ctx, \"query_data searchSource:%s to string error:%v\", searchSourceString, err)\n\t}\n\n\tjsonSearchSource, err := json.Marshal(searchSourceString)\n\tif err != nil {\n\t\tlogx.Warningf(ctx, \"query_data searchSource:%s to json error:%v\", searchSourceString, err)\n\t}\n\n\tresult, err := search(ctx, indexArr, searchSource, param.Timeout, param.MaxShard)\n\tif err != nil {\n\t\tlogx.Warningf(ctx, \"query_data searchSource:%s query_data error:%v\", searchSourceString, err)\n\t\treturn nil, err\n\t}\n\n\t// 检查是否有 shard failures,有部分数据时仅记录警告继续处理\n\tif shardErr := checkShardFailures(ctx, result.Shards, \"query_data\", searchSourceString); shardErr != nil {\n\t\tif len(result.Aggregations[\"ts\"]) == 0 {\n\t\t\treturn nil, shardErr\n\t\t}\n\t\t// 有部分数据,checkShardFailures 已记录警告,继续处理\n\t}\n\n\tlogx.Infof(ctx, \"query_data searchSource:%s resp:%s\", string(jsonSearchSource), string(result.Aggregations[\"ts\"]))\n\n\tjs, err := simplejson.NewJson(result.Aggregations[\"ts\"])\n\tif err != nil {\n\t\treturn nil, err\n\t}\n\n\tbucketsData, err := js.Get(\"buckets\").Array()\n\tif err != nil {\n\t\treturn nil, err\n\t}\n\n\tvar keys []string\n\tfor i := len(groupBys) - 1; i >= 0; i-- {\n\t\tkeys = append(keys, groupBys[i].Field)\n\t}\n\n\tif param.MetricAggr.Func != \"count\" {\n\t\tkeys = append(keys, field)\n\t}\n\n\tmetrics := &MetricPtr{Data: make(map[string][][]float64)}\n\n\tGetBuckets(\"\", keys, bucketsData, metrics, \"\", 0, param.MetricAggr.Func)\n\n\t// Drop the last incomplete bucket to avoid inaccurate values at the boundary.\n\t// When the last bucket's time range extends beyond or reaches the query end time,\n\t// it may contain only partial data, making aggregated values (count, sum, etc.) artificially low.\n\tfor k, v := range metrics.Data {\n\t\tif len(v) <= 1 {\n\t\t\tcontinue\n\t\t}\n\t\tlastTs := v[len(v)-1][0]\n\t\tif int64(lastTs)+param.Interval > end {\n\t\t\tmetrics.Data[k] = v[:len(v)-1]\n\t\t}\n\t}\n\n\titems, err := TransferData(fmt.Sprintf(\"%s_%s\", field, param.MetricAggr.Func), param.Ref, metrics.Data), nil\n\n\tvar m map[string]interface{}\n\tbs, _ := json.Marshal(queryParam)\n\tjson.Unmarshal(bs, &m)\n\tm[\"index\"] = param.Index\n\tfor i := range items {\n\t\titems[i].Query = fmt.Sprintf(\"%+v\", m)\n\t}\n\treturn items, nil\n}\n\n// checkShardFailures 检查 ES 查询结果中的 shard failures,返回格式化的错误信息\nfunc checkShardFailures(ctx context.Context, shards *elastic.ShardsInfo, logPrefix string, queryContext interface{}) error {\n\tif shards == nil || shards.Failed == 0 || len(shards.Failures) == 0 {\n\t\treturn nil\n\t}\n\n\tvar failureReasons []string\n\tfor _, failure := range shards.Failures {\n\t\treason := \"\"\n\t\tif failure.Reason != nil {\n\t\t\tif reasonType, ok := failure.Reason[\"type\"].(string); ok {\n\t\t\t\treason = reasonType\n\t\t\t}\n\t\t\tif reasonMsg, ok := failure.Reason[\"reason\"].(string); ok {\n\t\t\t\tif reason != \"\" {\n\t\t\t\t\treason += \": \" + reasonMsg\n\t\t\t\t} else {\n\t\t\t\t\treason = reasonMsg\n\t\t\t\t}\n\t\t\t}\n\t\t}\n\t\tif reason != \"\" {\n\t\t\tfailureReasons = append(failureReasons, fmt.Sprintf(\"index=%s shard=%d: %s\", failure.Index, failure.Shard, reason))\n\t\t}\n\t}\n\n\tif len(failureReasons) > 0 {\n\t\terrMsg := fmt.Sprintf(\"elasticsearch shard failures (%d/%d failed): %s\", shards.Failed, shards.Total, strings.Join(failureReasons, \"; \"))\n\t\tlogx.Warningf(ctx, \"%s query:%v %s\", logPrefix, queryContext, errMsg)\n\t\treturn fmt.Errorf(\"%s\", errMsg)\n\t}\n\treturn nil\n}\n\nfunc HitFilter(typ string) bool {\n\tswitch typ {\n\tcase \"keyword\", \"date\", \"long\", \"integer\", \"short\", \"byte\", \"double\", \"float\", \"half_float\", \"scaled_float\", \"unsigned_long\":\n\t\treturn false\n\tdefault:\n\t\treturn true\n\t}\n}\n\nfunc QueryLog(ctx context.Context, queryParam interface{}, timeout int64, version string, maxShard int, search SearchFunc) ([]interface{}, int64, error) {\n\tparam := new(Query)\n\tif err := mapstructure.Decode(queryParam, param); err != nil {\n\t\treturn nil, 0, err\n\t}\n\n\tif param.Timeout == 0 {\n\t\tparam.Timeout = int(timeout)\n\t}\n\n\tvar indexArr []string\n\tif param.IndexType == \"index_pattern\" {\n\t\tif ip, ok := GetEsIndexPatternCacheType().Get(param.IndexPatternId); ok {\n\t\t\tparam.DateField = ip.TimeField\n\t\t\tindexArr = []string{ip.Name}\n\t\t} else {\n\t\t\treturn nil, 0, fmt.Errorf(\"index pattern:%d not found\", param.IndexPatternId)\n\t\t}\n\t} else {\n\t\tindexArr = strings.Split(param.Index, \",\")\n\t}\n\n\tnow := time.Now().Unix()\n\tvar start, end int64\n\tif param.End != 0 && param.Start != 0 {\n\t\tend = param.End\n\t\tstart = param.Start\n\t} else {\n\t\tend = now\n\t\tstart = end - param.Interval\n\t}\n\n\tq := elastic.NewRangeQuery(param.DateField)\n\tq.Gte(time.Unix(start, 0).UnixMilli())\n\tq.Lt(time.Unix(end, 0).UnixMilli())\n\tq.Format(\"epoch_millis\")\n\n\tqueryString := GetQueryString(param.Filter, q)\n\n\tif param.Limit <= 0 {\n\t\tparam.Limit = 10\n\t}\n\n\tif param.MaxShard < 1 {\n\t\tparam.MaxShard = maxShard\n\t}\n\t// from+size 分页方式获取日志,受es 的max_result_window参数限制,默认最多返回1w条日志, 可以使用search_after方式获取更多日志\n\tsource := elastic.NewSearchSource().\n\t\tTrackTotalHits(true).\n\t\tQuery(queryString).\n\t\tSize(param.Limit)\n\t// 是否使用search_after方式\n\tif param.SearchAfter != nil {\n\t\t// 设置默认排序字段\n\t\tif len(param.SearchAfter.SortFields) == 0 {\n\t\t\tsource = source.Sort(param.DateField, param.Ascending).Sort(string(FieldIndex), true).Sort(string(FieldId), true)\n\t\t} else {\n\t\t\tfor _, field := range param.SearchAfter.SortFields {\n\t\t\t\tsource = source.Sort(field.Field, field.Ascending)\n\t\t\t}\n\t\t}\n\t\tif len(param.SearchAfter.SearchAfter) > 0 {\n\t\t\tsource = source.SearchAfter(param.SearchAfter.SearchAfter...)\n\t\t}\n\t} else {\n\t\tsource = source.From(param.P).Sort(param.DateField, param.Ascending)\n\t}\n\tsourceBytes, _ := json.Marshal(source)\n\tresult, err := search(ctx, indexArr, source, param.Timeout, param.MaxShard)\n\tif err != nil {\n\t\tlogx.Warningf(ctx, \"query_log source:%s error:%v\", string(sourceBytes), err)\n\t\treturn nil, 0, err\n\t}\n\n\t// 检查是否有 shard failures,有部分数据时仅记录警告继续处理\n\tif shardErr := checkShardFailures(ctx, result.Shards, \"query_log\", string(sourceBytes)); shardErr != nil {\n\t\tif len(result.Hits.Hits) == 0 {\n\t\t\treturn nil, 0, shardErr\n\t\t}\n\t\t// 有部分数据,checkShardFailures 已记录警告,继续处理\n\t}\n\n\ttotal := result.TotalHits()\n\tvar ret []interface{}\n\tlogx.Debugf(ctx, \"query_log source:%s len:%d total:%d\", string(sourceBytes), len(result.Hits.Hits), total)\n\n\tresultBytes, _ := json.Marshal(result)\n\tlogx.Debugf(ctx, \"query_log source:%s result:%s\", string(sourceBytes), string(resultBytes))\n\n\tif strings.HasPrefix(version, \"6\") {\n\t\tfor i := 0; i < len(result.Hits.Hits); i++ {\n\t\t\tvar x map[string]interface{}\n\t\t\terr := json.Unmarshal(result.Hits.Hits[i].Source, &x)\n\t\t\tif err != nil {\n\t\t\t\tlogx.Warningf(ctx, \"Unmarshal source error:%v\", err)\n\t\t\t\tcontinue\n\t\t\t}\n\n\t\t\tif result.Hits.Hits[i].Fields == nil {\n\t\t\t\tresult.Hits.Hits[i].Fields = make(map[string]interface{})\n\t\t\t}\n\n\t\t\tIterGetMap(x, result.Hits.Hits[i].Fields, \"\")\n\t\t\tret = append(ret, result.Hits.Hits[i])\n\t\t}\n\t} else {\n\t\tfor _, hit := range result.Hits.Hits {\n\t\t\tret = append(ret, hit)\n\t\t}\n\t}\n\n\treturn ret, total, nil\n}\n"
},
{
"path": "datasource/datasource.go",
"content": "package datasource\n\nimport (\n\t\"context\"\n\t\"fmt\"\n\t\"strings\"\n\n\t\"github.com/ccfos/nightingale/v6/models\"\n)\n\ntype DatasourceType struct {\n\tId int64 `json:\"id\"`\n\tCategory string `json:\"category\"`\n\tPluginType string `json:\"type\"`\n\tPluginTypeName string `json:\"type_name\"`\n}\n\ntype Keys struct {\n\tValueKey string `json:\"valueKey\" mapstructure:\"valueKey\"` // 多个用空格分隔\n\tLabelKey string `json:\"labelKey\" mapstructure:\"labelKey\"` // 多个用空格分隔\n\tTimeKey string `json:\"timeKey\" mapstructure:\"timeKey\"`\n\tTimeFormat string `json:\"timeFormat\" mapstructure:\"timeFormat\"`\n}\n\nvar DatasourceTypes map[int64]DatasourceType\n\nfunc init() {\n\tDatasourceTypes = make(map[int64]DatasourceType)\n\tDatasourceTypes[1] = DatasourceType{\n\t\tId: 1,\n\t\tCategory: \"timeseries\",\n\t\tPluginType: \"prometheus\",\n\t\tPluginTypeName: \"Prometheus Like\",\n\t}\n\n\tDatasourceTypes[2] = DatasourceType{\n\t\tId: 2,\n\t\tCategory: \"logging\",\n\t\tPluginType: \"elasticsearch\",\n\t\tPluginTypeName: \"Elasticsearch\",\n\t}\n\n\tDatasourceTypes[3] = DatasourceType{\n\t\tId: 3,\n\t\tCategory: \"logging\",\n\t\tPluginType: \"aliyun-sls\",\n\t\tPluginTypeName: \"SLS\",\n\t}\n\n\tDatasourceTypes[4] = DatasourceType{\n\t\tId: 4,\n\t\tCategory: \"timeseries\",\n\t\tPluginType: \"ck\",\n\t\tPluginTypeName: \"ClickHouse\",\n\t}\n\n\tDatasourceTypes[5] = DatasourceType{\n\t\tId: 5,\n\t\tCategory: \"timeseries\",\n\t\tPluginType: \"mysql\",\n\t\tPluginTypeName: \"MySQL\",\n\t}\n\n\tDatasourceTypes[6] = DatasourceType{\n\t\tId: 6,\n\t\tCategory: \"timeseries\",\n\t\tPluginType: \"pgsql\",\n\t\tPluginTypeName: \"PostgreSQL\",\n\t}\n\n\tDatasourceTypes[7] = DatasourceType{\n\t\tId: 7,\n\t\tCategory: \"logging\",\n\t\tPluginType: \"victorialogs\",\n\t\tPluginTypeName: \"VictoriaLogs\",\n\t}\n}\n\ntype NewDatasourceFn func(settings map[string]interface{}) (Datasource, error)\n\nvar datasourceRegister = map[string]NewDatasourceFn{}\n\ntype Datasource interface {\n\tInit(settings map[string]interface{}) (Datasource, error) // 初始化配置\n\tInitClient() error // 初始化客户端\n\tValidate(ctx context.Context) error // 参数验证\n\tEqual(p Datasource) bool // 验证是否相等\n\tMakeLogQuery(ctx context.Context, query interface{}, eventTags []string, start, end int64) (interface{}, error)\n\tMakeTSQuery(ctx context.Context, query interface{}, eventTags []string, start, end int64) (interface{}, error)\n\tQueryData(ctx context.Context, query interface{}) ([]models.DataResp, error)\n\tQueryLog(ctx context.Context, query interface{}) ([]interface{}, int64, error)\n\n\t// 在生成告警事件时,会调用该方法,用于获取额外的数据\n\tQueryMapData(ctx context.Context, query interface{}) ([]map[string]string, error)\n}\n\nfunc RegisterDatasource(typ string, p Datasource) {\n\tif _, found := datasourceRegister[typ]; found {\n\t\treturn\n\t}\n\tdatasourceRegister[typ] = p.Init\n}\n\nfunc GetDatasourceByType(typ string, settings map[string]interface{}) (Datasource, error) {\n\ttyp = strings.ReplaceAll(typ, \".logging\", \"\")\n\tfn, found := datasourceRegister[typ]\n\tif !found {\n\t\treturn nil, fmt.Errorf(\"plugin type %s not found\", typ)\n\t}\n\n\tplug, err := fn(settings)\n\tif err != nil {\n\t\treturn nil, err\n\t}\n\n\treturn plug, nil\n}\n\ntype DatasourceInfo struct {\n\tId int64 `json:\"id\"`\n\tName string `json:\"name\"`\n\tIdentifier string `json:\"identifier\"`\n\tDescription string `json:\"description\"`\n\tClusterName string `json:\"cluster_name\"`\n\tCategory string `json:\"category\"`\n\tPluginId int64 `json:\"plugin_id\"`\n\tType string `json:\"plugin_type\"`\n\tPluginTypeName string `json:\"plugin_type_name\"`\n\tSettings map[string]interface{} `json:\"settings\"`\n\tHTTPJson models.HTTP `json:\"http\"`\n\tAuthJson models.Auth `json:\"auth\"`\n\tStatus string `json:\"status\"`\n\tCreatedAt int64 `json:\"created_at\"`\n\tUpdatedAt int64 `json:\"updated_at\"`\n\tIsDefault bool `json:\"is_default\"`\n\tWeight int `json:\"weight\"`\n}\n"
},
{
"path": "datasource/doris/doris.go",
"content": "package doris\n\nimport (\n\t\"context\"\n\t\"fmt\"\n\t\"strings\"\n\t\"time\"\n\n\t\"github.com/ccfos/nightingale/v6/datasource\"\n\t\"github.com/ccfos/nightingale/v6/dskit/doris\"\n\t\"github.com/ccfos/nightingale/v6/dskit/types\"\n\t\"github.com/ccfos/nightingale/v6/models\"\n\t\"github.com/ccfos/nightingale/v6/pkg/macros\"\n\n\t\"github.com/mitchellh/mapstructure\"\n\t\"github.com/toolkits/pkg/logger\"\n\n\t\"github.com/ccfos/nightingale/v6/pkg/logx\"\n)\n\nconst (\n\tDorisType = \"doris\"\n)\n\nfunc init() {\n\tdatasource.RegisterDatasource(DorisType, new(Doris))\n}\n\ntype Doris struct {\n\tdoris.Doris `json:\",inline\" mapstructure:\",squash\"`\n}\n\ntype QueryParam struct {\n\tRef string `json:\"ref\" mapstructure:\"ref\"`\n\tDatabase string `json:\"database\" mapstructure:\"database\"`\n\tTable string `json:\"table\" mapstructure:\"table\"`\n\tSQL string `json:\"sql\" mapstructure:\"sql\"`\n\tKeys datasource.Keys `json:\"keys\" mapstructure:\"keys\"`\n\tLimit int `json:\"limit\" mapstructure:\"limit\"`\n\tFrom int64 `json:\"from\" mapstructure:\"from\"`\n\tTo int64 `json:\"to\" mapstructure:\"to\"`\n\tTimeField string `json:\"time_field\" mapstructure:\"time_field\"`\n\tTimeFormat string `json:\"time_format\" mapstructure:\"time_format\"`\n\tInterval int64 `json:\"interval\" mapstructure:\"interval\"` // 查询时间间隔(秒)\n\tOffset int `json:\"offset\" mapstructure:\"offset\"` // 延迟计算,不在使用通用配置delay\n}\n\nfunc (d *Doris) InitClient() error {\n\tif len(d.Addr) == 0 {\n\t\treturn fmt.Errorf(\"not found doris addr, please check datasource config\")\n\t}\n\tif _, err := d.NewConn(context.TODO(), \"\"); err != nil {\n\t\treturn err\n\t}\n\treturn nil\n}\n\nfunc (d *Doris) Init(settings map[string]interface{}) (datasource.Datasource, error) {\n\tnewest := new(Doris)\n\terr := mapstructure.Decode(settings, newest)\n\treturn newest, err\n}\n\nfunc (d *Doris) Validate(ctx context.Context) error {\n\tif len(d.Addr) == 0 || len(strings.TrimSpace(d.Addr)) == 0 {\n\t\treturn fmt.Errorf(\"doris addr is invalid, please check datasource setting\")\n\t}\n\n\tif len(strings.TrimSpace(d.User)) == 0 {\n\t\treturn fmt.Errorf(\"doris user is invalid, please check datasource setting\")\n\t}\n\n\treturn nil\n}\n\n// Equal compares whether two objects are the same, used for caching\nfunc (d *Doris) Equal(p datasource.Datasource) bool {\n\tnewest, ok := p.(*Doris)\n\tif !ok {\n\t\tlogger.Errorf(\"unexpected plugin type, expected is doris\")\n\t\treturn false\n\t}\n\n\treturn d.Addr == newest.Addr &&\n\t\td.FeAddr == newest.FeAddr &&\n\t\td.User == newest.User &&\n\t\td.Password == newest.Password &&\n\t\td.EnableWrite == newest.EnableWrite &&\n\t\td.UserWrite == newest.UserWrite &&\n\t\td.PasswordWrite == newest.PasswordWrite &&\n\t\td.MaxQueryRows == newest.MaxQueryRows &&\n\t\td.Timeout == newest.Timeout &&\n\t\td.MaxIdleConns == newest.MaxIdleConns &&\n\t\td.MaxOpenConns == newest.MaxOpenConns &&\n\t\td.ConnMaxLifetime == newest.ConnMaxLifetime &&\n\t\td.ClusterName == newest.ClusterName\n}\n\nfunc (d *Doris) MakeLogQuery(ctx context.Context, query interface{}, eventTags []string, start, end int64) (interface{}, error) {\n\treturn nil, nil\n}\n\nfunc (d *Doris) MakeTSQuery(ctx context.Context, query interface{}, eventTags []string, start, end int64) (interface{}, error) {\n\treturn nil, nil\n}\n\nfunc (d *Doris) QueryMapData(ctx context.Context, query interface{}) ([]map[string]string, error) {\n\treturn nil, nil\n}\n\nfunc (d *Doris) QueryData(ctx context.Context, query interface{}) ([]models.DataResp, error) {\n\tdorisQueryParam := new(QueryParam)\n\tif err := mapstructure.Decode(query, dorisQueryParam); err != nil {\n\t\treturn nil, err\n\t}\n\n\tif dorisQueryParam.Keys.ValueKey == \"\" {\n\t\treturn nil, fmt.Errorf(\"valueKey is required\")\n\t}\n\n\t// 设置默认 interval\n\tif dorisQueryParam.Interval == 0 {\n\t\tdorisQueryParam.Interval = 60\n\t}\n\n\t// 计算时间范围\n\tnow := time.Now().Unix()\n\tvar start, end int64\n\tif dorisQueryParam.To != 0 && dorisQueryParam.From != 0 {\n\t\tend = dorisQueryParam.To\n\t\tstart = dorisQueryParam.From\n\t} else {\n\t\tend = now\n\t\tstart = end - dorisQueryParam.Interval\n\t}\n\n\tif dorisQueryParam.Offset != 0 {\n\t\tend -= int64(dorisQueryParam.Offset)\n\t\tstart -= int64(dorisQueryParam.Offset)\n\t}\n\n\tdorisQueryParam.From = start\n\tdorisQueryParam.To = end\n\n\tif strings.Contains(dorisQueryParam.SQL, \"$__\") {\n\t\tvar err error\n\t\tdorisQueryParam.SQL, err = macros.Macro(dorisQueryParam.SQL, dorisQueryParam.From, dorisQueryParam.To)\n\t\tif err != nil {\n\t\t\treturn nil, err\n\t\t}\n\t}\n\n\titems, err := d.QueryTimeseries(ctx, &doris.QueryParam{\n\t\tDatabase: dorisQueryParam.Database,\n\t\tSql: dorisQueryParam.SQL,\n\t\tKeys: types.Keys{\n\t\t\tValueKey: dorisQueryParam.Keys.ValueKey,\n\t\t\tLabelKey: dorisQueryParam.Keys.LabelKey,\n\t\t\tTimeKey: dorisQueryParam.Keys.TimeKey,\n\t\t\tOffset: dorisQueryParam.Offset,\n\t\t},\n\t})\n\tif err != nil {\n\t\tlogx.Warningf(ctx, \"query:%+v get data err:%v\", dorisQueryParam, err)\n\t\treturn []models.DataResp{}, err\n\t}\n\tdata := make([]models.DataResp, 0)\n\tfor i := range items {\n\t\tdata = append(data, models.DataResp{\n\t\t\tRef: dorisQueryParam.Ref,\n\t\t\tMetric: items[i].Metric,\n\t\t\tValues: items[i].Values,\n\t\t})\n\t}\n\n\t// parse resp to time series data\n\tlogx.Infof(ctx, \"req:%+v keys:%+v \\n data:%v\", dorisQueryParam, dorisQueryParam.Keys, data)\n\n\treturn data, nil\n}\n\nfunc (d *Doris) QueryLog(ctx context.Context, query interface{}) ([]interface{}, int64, error) {\n\tdorisQueryParam := new(QueryParam)\n\tif err := mapstructure.Decode(query, dorisQueryParam); err != nil {\n\t\treturn nil, 0, err\n\t}\n\n\t// 记录规则预览场景下,只传了interval, 没有传From和To\n\tnow := time.Now().Unix()\n\tif dorisQueryParam.To == 0 && dorisQueryParam.From == 0 && dorisQueryParam.Interval != 0 {\n\t\tdorisQueryParam.To = now\n\t\tdorisQueryParam.From = now - dorisQueryParam.Interval\n\t}\n\n\tif dorisQueryParam.Offset != 0 {\n\t\tdorisQueryParam.To -= int64(dorisQueryParam.Offset)\n\t\tdorisQueryParam.From -= int64(dorisQueryParam.Offset)\n\t}\n\n\tif strings.Contains(dorisQueryParam.SQL, \"$__\") {\n\t\tvar err error\n\t\tdorisQueryParam.SQL, err = macros.Macro(dorisQueryParam.SQL, dorisQueryParam.From, dorisQueryParam.To)\n\t\tif err != nil {\n\t\t\treturn nil, 0, err\n\t\t}\n\t}\n\n\titems, err := d.QueryLogs(ctx, &doris.QueryParam{\n\t\tDatabase: dorisQueryParam.Database,\n\t\tSql: dorisQueryParam.SQL,\n\t})\n\tif err != nil {\n\t\tlogx.Warningf(ctx, \"query:%+v get data err:%v\", dorisQueryParam, err)\n\t\treturn []interface{}{}, 0, err\n\t}\n\tlogs := make([]interface{}, 0)\n\tfor i := range items {\n\t\tlogs = append(logs, items[i])\n\t}\n\n\treturn logs, int64(len(logs)), nil\n}\n\nfunc (d *Doris) DescribeTable(ctx context.Context, query interface{}) ([]*types.ColumnProperty, error) {\n\tdorisQueryParam := new(QueryParam)\n\tif err := mapstructure.Decode(query, dorisQueryParam); err != nil {\n\t\treturn nil, err\n\t}\n\treturn d.DescTable(ctx, dorisQueryParam.Database, dorisQueryParam.Table)\n}\n"
},
{
"path": "datasource/es/es.go",
"content": "package es\n\nimport (\n\t\"context\"\n\t\"encoding/json\"\n\t\"fmt\"\n\t\"net\"\n\t\"net/http\"\n\t\"net/url\"\n\t\"reflect\"\n\t\"sort\"\n\t\"strings\"\n\t\"time\"\n\n\t\"github.com/ccfos/nightingale/v6/datasource\"\n\t\"github.com/ccfos/nightingale/v6/datasource/commons/eslike\"\n\t\"github.com/ccfos/nightingale/v6/models\"\n\t\"github.com/ccfos/nightingale/v6/pkg/tlsx\"\n\n\t\"github.com/mitchellh/mapstructure\"\n\t\"github.com/olivere/elastic/v7\"\n\n\t\"github.com/ccfos/nightingale/v6/pkg/logx\"\n)\n\nconst (\n\tESType = \"elasticsearch\"\n)\n\ntype Elasticsearch struct {\n\tAddr string `json:\"es.addr\" mapstructure:\"es.addr\"`\n\tNodes []string `json:\"es.nodes\" mapstructure:\"es.nodes\"`\n\tTimeout int64 `json:\"es.timeout\" mapstructure:\"es.timeout\"` // millis\n\tBasic BasicAuth `json:\"es.basic\" mapstructure:\"es.basic\"`\n\tTLS TLS `json:\"es.tls\" mapstructure:\"es.tls\"`\n\tVersion string `json:\"es.version\" mapstructure:\"es.version\"`\n\tHeaders map[string]string `json:\"es.headers\" mapstructure:\"es.headers\"`\n\tMinInterval int `json:\"es.min_interval\" mapstructure:\"es.min_interval\"` // seconds\n\tMaxShard int `json:\"es.max_shard\" mapstructure:\"es.max_shard\"`\n\tClusterName string `json:\"es.cluster_name\" mapstructure:\"es.cluster_name\"`\n\tEnableWrite bool `json:\"es.enable_write\" mapstructure:\"es.enable_write\"` // 允许写操作\n\tClient *elastic.Client `json:\"es.client\" mapstructure:\"es.client\"`\n}\n\ntype TLS struct {\n\tSkipTlsVerify bool `json:\"es.tls.skip_tls_verify\" mapstructure:\"es.tls.skip_tls_verify\"`\n}\n\ntype BasicAuth struct {\n\tEnable bool `json:\"es.auth.enable\" mapstructure:\"es.auth.enable\"`\n\tUsername string `json:\"es.user\" mapstructure:\"es.user\"`\n\tPassword string `json:\"es.password\" mapstructure:\"es.password\"`\n}\n\nfunc init() {\n\tdatasource.RegisterDatasource(ESType, new(Elasticsearch))\n}\n\nfunc (e *Elasticsearch) Init(settings map[string]interface{}) (datasource.Datasource, error) {\n\tnewest := new(Elasticsearch)\n\terr := mapstructure.Decode(settings, newest)\n\treturn newest, err\n}\n\nfunc (e *Elasticsearch) InitClient() error {\n\ttransport := &http.Transport{\n\t\tProxy: http.ProxyFromEnvironment,\n\t\tDialContext: (&net.Dialer{\n\t\t\tTimeout: time.Duration(e.Timeout) * time.Millisecond,\n\t\t}).DialContext,\n\t\tResponseHeaderTimeout: time.Duration(e.Timeout) * time.Millisecond,\n\t}\n\n\tif len(e.Nodes) > 0 {\n\t\te.Addr = e.Nodes[0]\n\t}\n\n\tif strings.Contains(e.Addr, \"https\") {\n\t\ttlsConfig := tlsx.ClientConfig{\n\t\t\tInsecureSkipVerify: e.TLS.SkipTlsVerify,\n\t\t\tUseTLS: true,\n\t\t}\n\t\tcfg, err := tlsConfig.TLSConfig()\n\t\tif err != nil {\n\t\t\treturn err\n\t\t}\n\t\ttransport.TLSClientConfig = cfg\n\t}\n\n\tvar err error\n\toptions := []elastic.ClientOptionFunc{\n\t\telastic.SetURL(e.Nodes...),\n\t}\n\n\tif e.Basic.Username != \"\" {\n\t\toptions = append(options, elastic.SetBasicAuth(e.Basic.Username, e.Basic.Password))\n\t}\n\n\theaders := http.Header{}\n\tfor k, v := range e.Headers {\n\t\theaders[k] = []string{v}\n\t}\n\n\toptions = append(options, elastic.SetHeaders(headers))\n\toptions = append(options, elastic.SetHttpClient(&http.Client{Transport: transport}))\n\toptions = append(options, elastic.SetSniff(false))\n\toptions = append(options, elastic.SetHealthcheck(false))\n\n\te.Client, err = elastic.NewClient(options...)\n\tif err != nil {\n\t\treturn err\n\t}\n\n\treturn err\n}\n\nfunc (e *Elasticsearch) Equal(other datasource.Datasource) bool {\n\tsort.Strings(e.Nodes)\n\tsort.Strings(other.(*Elasticsearch).Nodes)\n\n\tif strings.Join(e.Nodes, \",\") != strings.Join(other.(*Elasticsearch).Nodes, \",\") {\n\t\treturn false\n\t}\n\n\tif e.Basic.Username != other.(*Elasticsearch).Basic.Username {\n\t\treturn false\n\t}\n\n\tif e.Basic.Password != other.(*Elasticsearch).Basic.Password {\n\t\treturn false\n\t}\n\n\tif e.TLS.SkipTlsVerify != other.(*Elasticsearch).TLS.SkipTlsVerify {\n\t\treturn false\n\t}\n\tif e.EnableWrite != other.(*Elasticsearch).EnableWrite {\n\t\treturn false\n\t}\n\n\tif !reflect.DeepEqual(e.Headers, other.(*Elasticsearch).Headers) {\n\t\treturn false\n\t}\n\n\treturn true\n}\n\nfunc (e *Elasticsearch) Validate(ctx context.Context) (err error) {\n\tif len(e.Nodes) == 0 {\n\t\treturn fmt.Errorf(\"need a valid addr\")\n\t}\n\n\tfor _, addr := range e.Nodes {\n\t\t_, err = url.Parse(addr)\n\t\tif err != nil {\n\t\t\treturn fmt.Errorf(\"parse addr error: %v\", err)\n\t\t}\n\t}\n\n\tif e.Basic.Enable && (len(e.Basic.Username) == 0 || len(e.Basic.Password) == 0) {\n\t\treturn fmt.Errorf(\"need a valid user, password\")\n\t}\n\n\tif e.MaxShard == 0 {\n\t\te.MaxShard = 5\n\t}\n\n\tif e.MinInterval < 10 {\n\t\te.MinInterval = 10\n\t}\n\n\tif e.Timeout == 0 {\n\t\te.Timeout = 60000\n\t}\n\n\treturn nil\n}\n\nfunc (e *Elasticsearch) MakeLogQuery(ctx context.Context, query interface{}, eventTags []string, start, end int64) (interface{}, error) {\n\treturn eslike.MakeLogQuery(ctx, query, eventTags, start, end)\n}\n\nfunc (e *Elasticsearch) MakeTSQuery(ctx context.Context, query interface{}, eventTags []string, start, end int64) (interface{}, error) {\n\treturn eslike.MakeTSQuery(ctx, query, eventTags, start, end)\n}\n\nfunc (e *Elasticsearch) QueryData(ctx context.Context, queryParam interface{}) ([]models.DataResp, error) {\n\tsearch := func(ctx context.Context, indices []string, source interface{}, timeout int, maxShard int) (*elastic.SearchResult, error) {\n\t\treturn e.Client.Search().\n\t\t\tIndex(indices...).\n\t\t\tIgnoreUnavailable(true).\n\t\t\tSource(source).\n\t\t\tTimeout(fmt.Sprintf(\"%ds\", timeout)).\n\t\t\tMaxConcurrentShardRequests(maxShard).\n\t\t\tDo(ctx)\n\t}\n\treturn eslike.QueryData(ctx, queryParam, e.Timeout, e.Version, search)\n}\n\nfunc (e *Elasticsearch) QueryIndices() ([]string, error) {\n\tresult, err := e.Client.IndexNames()\n\n\treturn result, err\n}\n\nfunc (e *Elasticsearch) QueryFields(indexes []string) ([]string, error) {\n\tvar fields []string\n\tresult, err := elastic.NewGetFieldMappingService(e.Client).Index(indexes...).IgnoreUnavailable(true).Do(context.Background())\n\tif err != nil {\n\t\treturn fields, err\n\t}\n\n\tfieldMap := make(map[string]struct{})\n\tfor _, indexMap := range result {\n\t\tif m, exists := indexMap.(map[string]interface{})[\"mappings\"]; exists {\n\t\t\tfor k, v := range m.(map[string]interface{}) {\n\t\t\t\t// 兼容 es6 版本\n\t\t\t\tif k == \"doc\" && strings.HasPrefix(e.Version, \"6\") {\n\t\t\t\t\t// if k == \"doc\" {\n\t\t\t\t\tfor kk, vv := range v.(map[string]interface{}) {\n\t\t\t\t\t\ttyp := getFieldType(kk, vv.(map[string]interface{}))\n\t\t\t\t\t\tif eslike.HitFilter(typ) {\n\t\t\t\t\t\t\tcontinue\n\t\t\t\t\t\t}\n\n\t\t\t\t\t\tif _, exists := fieldMap[kk]; !exists {\n\t\t\t\t\t\t\tfieldMap[kk] = struct{}{}\n\t\t\t\t\t\t\tfields = append(fields, kk)\n\t\t\t\t\t\t}\n\t\t\t\t\t}\n\t\t\t\t} else {\n\t\t\t\t\t// es7 版本\n\t\t\t\t\ttyp := getFieldType(k, v.(map[string]interface{}))\n\t\t\t\t\tif eslike.HitFilter(typ) {\n\t\t\t\t\t\tcontinue\n\t\t\t\t\t}\n\n\t\t\t\t\tif _, exists := fieldMap[k]; !exists {\n\t\t\t\t\t\tfieldMap[k] = struct{}{}\n\t\t\t\t\t\tfields = append(fields, k)\n\t\t\t\t\t}\n\t\t\t\t}\n\n\t\t\t}\n\t\t}\n\t}\n\n\tsort.Strings(fields)\n\treturn fields, nil\n}\n\nfunc (e *Elasticsearch) QueryLog(ctx context.Context, queryParam interface{}) ([]interface{}, int64, error) {\n\n\tsearch := func(ctx context.Context, indices []string, source interface{}, timeout int, maxShard int) (*elastic.SearchResult, error) {\n\t\t// 应该是之前为了获取 fields 字段,做的这个兼容\n\t\t// fields, err := e.QueryFields(indices)\n\t\t// if err != nil {\n\t\t// \tlogger.Warningf(\"query data error:%v\", err)\n\t\t// \treturn nil, err\n\t\t// }\n\n\t\t// if source != nil && strings.HasPrefix(e.Version, \"7\") {\n\t\t// \tsource = source.(*elastic.SearchSource).DocvalueFields(fields...)\n\t\t// }\n\n\t\treturn e.Client.Search().\n\t\t\tIndex(indices...).\n\t\t\tIgnoreUnavailable(true).\n\t\t\tMaxConcurrentShardRequests(maxShard).\n\t\t\tSource(source).\n\t\t\tTimeout(fmt.Sprintf(\"%ds\", timeout)).\n\t\t\tDo(ctx)\n\t}\n\n\treturn eslike.QueryLog(ctx, queryParam, e.Timeout, e.Version, e.MaxShard, search)\n}\n\nfunc (e *Elasticsearch) QueryFieldValue(indexes []string, field string, query string) ([]string, error) {\n\tvar values []string\n\tsearch := e.Client.Search().\n\t\tIgnoreUnavailable(true).\n\t\tIndex(indexes...).\n\t\tSize(0)\n\n\tif query != \"\" {\n\t\tsearch = search.Query(elastic.NewBoolQuery().Must(elastic.NewQueryStringQuery(query)))\n\t}\n\tsearch = search.Aggregation(\"distinct\", elastic.NewTermsAggregation().Field(field).Size(10000))\n\n\tresult, err := search.Do(context.Background())\n\tif err != nil {\n\t\treturn values, err\n\t}\n\n\tagg, found := result.Aggregations.Terms(\"distinct\")\n\tif !found {\n\t\treturn values, nil\n\t}\n\n\tfor _, bucket := range agg.Buckets {\n\t\tvalues = append(values, bucket.Key.(string))\n\t}\n\n\treturn values, nil\n}\n\nfunc (e *Elasticsearch) Test(ctx context.Context) (err error) {\n\terr = e.Validate(ctx)\n\tif err != nil {\n\t\treturn err\n\t}\n\n\tif e.Addr == \"\" {\n\t\treturn fmt.Errorf(\"addr is invalid\")\n\t}\n\n\tif e.Version == \"7.10+\" {\n\t\toptions := []elastic.ClientOptionFunc{\n\t\t\telastic.SetURL(e.Addr),\n\t\t}\n\n\t\tif e.Basic.Enable {\n\t\t\toptions = append(options, elastic.SetBasicAuth(e.Basic.Username, e.Basic.Password))\n\t\t}\n\n\t\tclient, err := elastic.NewClient(options...)\n\t\tif err != nil {\n\t\t\treturn fmt.Errorf(\"config is invalid:%v\", err)\n\t\t}\n\n\t\t_, err = client.ElasticsearchVersion(e.Addr)\n\t\tif err != nil {\n\t\t\treturn fmt.Errorf(\"config is invalid:%v\", err)\n\t\t}\n\t} else {\n\t\treturn fmt.Errorf(\"version must be 7.10+\")\n\t}\n\n\treturn nil\n}\n\nfunc getFieldType(key string, m map[string]interface{}) string {\n\tif innerMap, exists := m[\"mapping\"]; exists {\n\t\tif innerM, exists := innerMap.(map[string]interface{})[key]; exists {\n\t\t\tif typ, exists := innerM.(map[string]interface{})[\"type\"]; exists {\n\t\t\t\treturn typ.(string)\n\t\t\t}\n\t\t} else {\n\t\t\tarr := strings.Split(key, \".\")\n\t\t\tif innerM, exists := innerMap.(map[string]interface{})[arr[len(arr)-1]]; exists {\n\t\t\t\tif typ, exists := innerM.(map[string]interface{})[\"type\"]; exists {\n\t\t\t\t\treturn typ.(string)\n\t\t\t\t}\n\t\t\t}\n\t\t}\n\t}\n\treturn \"\"\n}\n\nfunc (e *Elasticsearch) QueryMapData(ctx context.Context, query interface{}) ([]map[string]string, error) {\n\tsearch := func(ctx context.Context, indices []string, source interface{}, timeout int, maxShard int) (*elastic.SearchResult, error) {\n\n\t\treturn e.Client.Search().\n\t\t\tIndex(indices...).\n\t\t\tIgnoreUnavailable(true).\n\t\t\tSource(source).\n\t\t\tTimeout(fmt.Sprintf(\"%ds\", timeout)).\n\t\t\tDo(ctx)\n\t}\n\n\tparam := new(eslike.Query)\n\tif err := mapstructure.Decode(query, param); err != nil {\n\t\treturn nil, err\n\t}\n\t// 扩大查询范围, 解决上一次查询消耗时间太多,导致本次查询时间范围起止时间,滞后问题\n\tparam.Interval += 30\n\n\tres, _, err := eslike.QueryLog(ctx, param, e.Timeout, e.Version, e.MaxShard, search)\n\tif err != nil {\n\t\treturn nil, err\n\t}\n\n\tvar result []map[string]string\n\tfor _, item := range res {\n\t\tlogx.Debugf(ctx, \"query:%v item:%v\", query, item)\n\t\tif itemMap, ok := item.(*elastic.SearchHit); ok {\n\t\t\tmItem := make(map[string]string)\n\t\t\t// 遍历 fields 字段的每个键值对\n\t\t\tsourceMap := make(map[string]interface{})\n\t\t\terr := json.Unmarshal(itemMap.Source, &sourceMap)\n\t\t\tif err != nil {\n\t\t\t\tlogx.Warningf(ctx, \"unmarshal source%s error:%v\", string(itemMap.Source), err)\n\t\t\t\tcontinue\n\t\t\t}\n\n\t\t\tfor k, v := range sourceMap {\n\t\t\t\tmItem[k] = fmt.Sprintf(\"%v\", v)\n\t\t\t}\n\n\t\t\t// 将处理好的 map 添加到 m 切片中\n\t\t\tresult = append(result, mItem)\n\t\t\tif param.Limit > 0 {\n\t\t\t\tcontinue\n\t\t\t}\n\n\t\t\t// 只取第一条数据\n\t\t\tbreak\n\t\t}\n\t}\n\n\treturn result, nil\n}\n"
},
{
"path": "datasource/mysql/mysql.go",
"content": "package mysql\n\nimport (\n\t\"context\"\n\t\"fmt\"\n\t\"strings\"\n\t\"time\"\n\n\t\"github.com/ccfos/nightingale/v6/datasource\"\n\t\"github.com/ccfos/nightingale/v6/dskit/mysql\"\n\t\"github.com/ccfos/nightingale/v6/dskit/sqlbase\"\n\t\"github.com/ccfos/nightingale/v6/dskit/types\"\n\t\"github.com/ccfos/nightingale/v6/models\"\n\t\"github.com/ccfos/nightingale/v6/pkg/macros\"\n\n\t\"github.com/mitchellh/mapstructure\"\n\t\"github.com/toolkits/pkg/logger\"\n\n\t\"github.com/ccfos/nightingale/v6/pkg/logx\"\n)\n\nconst (\n\tMySQLType = \"mysql\"\n)\n\nfunc init() {\n\tdatasource.RegisterDatasource(MySQLType, new(MySQL))\n}\n\ntype MySQL struct {\n\tmysql.MySQL `json:\",inline\" mapstructure:\",squash\"`\n}\n\ntype QueryParam struct {\n\tRef string `json:\"ref\" mapstructure:\"ref\"`\n\tDatabase string `json:\"database\" mapstructure:\"database\"`\n\tTable string `json:\"table\" mapstructure:\"table\"`\n\tSQL string `json:\"sql\" mapstructure:\"sql\"`\n\tKeys datasource.Keys `json:\"keys\" mapstructure:\"keys\"`\n\tFrom int64 `json:\"from\" mapstructure:\"from\"`\n\tTo int64 `json:\"to\" mapstructure:\"to\"`\n}\n\nfunc (m *MySQL) InitClient() error {\n\tif len(m.Shards) == 0 {\n\t\treturn fmt.Errorf(\"not found mysql addr, please check datasource config\")\n\t}\n\tif _, err := m.NewConn(context.TODO(), \"\"); err != nil {\n\t\treturn err\n\t}\n\treturn nil\n}\n\nfunc (m *MySQL) Init(settings map[string]interface{}) (datasource.Datasource, error) {\n\tnewest := new(MySQL)\n\terr := mapstructure.Decode(settings, newest)\n\treturn newest, err\n}\n\nfunc (m *MySQL) Validate(ctx context.Context) error {\n\tif len(m.Shards) == 0 || len(strings.TrimSpace(m.Shards[0].Addr)) == 0 {\n\t\treturn fmt.Errorf(\"mysql addr is invalid, please check datasource setting\")\n\t}\n\n\tif len(strings.TrimSpace(m.Shards[0].User)) == 0 {\n\t\treturn fmt.Errorf(\"mysql user is invalid, please check datasource setting\")\n\t}\n\n\treturn nil\n}\n\n// Equal compares whether two objects are the same, used for caching\nfunc (m *MySQL) Equal(p datasource.Datasource) bool {\n\tnewest, ok := p.(*MySQL)\n\tif !ok {\n\t\tlogger.Errorf(\"unexpected plugin type, expected is mysql\")\n\t\treturn false\n\t}\n\n\tif len(m.Shards) == 0 || len(newest.Shards) == 0 {\n\t\treturn false\n\t}\n\n\toldShard := m.Shards[0]\n\tnewShard := newest.Shards[0]\n\n\tif oldShard.Addr != newShard.Addr {\n\t\treturn false\n\t}\n\n\tif oldShard.User != newShard.User {\n\t\treturn false\n\t}\n\n\tif oldShard.Password != newShard.Password {\n\t\treturn false\n\t}\n\n\tif oldShard.MaxQueryRows != newShard.MaxQueryRows {\n\t\treturn false\n\t}\n\n\tif oldShard.Timeout != newShard.Timeout {\n\t\treturn false\n\t}\n\n\tif oldShard.MaxIdleConns != newShard.MaxIdleConns {\n\t\treturn false\n\t}\n\n\tif oldShard.MaxOpenConns != newShard.MaxOpenConns {\n\t\treturn false\n\t}\n\n\tif oldShard.ConnMaxLifetime != newShard.ConnMaxLifetime {\n\t\treturn false\n\t}\n\n\treturn true\n}\n\nfunc (m *MySQL) MakeLogQuery(ctx context.Context, query interface{}, eventTags []string, start, end int64) (interface{}, error) {\n\treturn nil, nil\n}\n\nfunc (m *MySQL) MakeTSQuery(ctx context.Context, query interface{}, eventTags []string, start, end int64) (interface{}, error) {\n\treturn nil, nil\n}\n\nfunc (m *MySQL) QueryMapData(ctx context.Context, query interface{}) ([]map[string]string, error) {\n\treturn nil, nil\n}\n\nfunc (m *MySQL) QueryData(ctx context.Context, query interface{}) ([]models.DataResp, error) {\n\tmysqlQueryParam := new(QueryParam)\n\tif err := mapstructure.Decode(query, mysqlQueryParam); err != nil {\n\t\treturn nil, err\n\t}\n\n\tif strings.Contains(mysqlQueryParam.SQL, \"$__\") {\n\t\tvar err error\n\t\tmysqlQueryParam.SQL, err = macros.Macro(mysqlQueryParam.SQL, mysqlQueryParam.From, mysqlQueryParam.To)\n\t\tif err != nil {\n\t\t\treturn nil, err\n\t\t}\n\t}\n\n\tif mysqlQueryParam.Keys.ValueKey == \"\" {\n\t\treturn nil, fmt.Errorf(\"valueKey is required\")\n\t}\n\n\ttimeout := m.Shards[0].Timeout\n\tif timeout == 0 {\n\t\ttimeout = 60\n\t}\n\n\ttimeoutCtx, cancel := context.WithTimeout(ctx, time.Duration(timeout)*time.Second)\n\tdefer cancel()\n\n\titems, err := m.QueryTimeseries(timeoutCtx, &sqlbase.QueryParam{\n\t\tSql: mysqlQueryParam.SQL,\n\t\tKeys: types.Keys{\n\t\t\tValueKey: mysqlQueryParam.Keys.ValueKey,\n\t\t\tLabelKey: mysqlQueryParam.Keys.LabelKey,\n\t\t\tTimeKey: mysqlQueryParam.Keys.TimeKey,\n\t\t},\n\t})\n\n\tif err != nil {\n\t\tlogx.Warningf(ctx, \"query:%+v get data err:%v\", mysqlQueryParam, err)\n\t\treturn []models.DataResp{}, err\n\t}\n\tdata := make([]models.DataResp, 0)\n\tfor i := range items {\n\t\tdata = append(data, models.DataResp{\n\t\t\tRef: mysqlQueryParam.Ref,\n\t\t\tMetric: items[i].Metric,\n\t\t\tValues: items[i].Values,\n\t\t})\n\t}\n\n\treturn data, nil\n}\n\nfunc (m *MySQL) QueryLog(ctx context.Context, query interface{}) ([]interface{}, int64, error) {\n\tmysqlQueryParam := new(QueryParam)\n\tif err := mapstructure.Decode(query, mysqlQueryParam); err != nil {\n\t\treturn nil, 0, err\n\t}\n\n\tif strings.Contains(mysqlQueryParam.SQL, \"$__\") {\n\t\tvar err error\n\t\tmysqlQueryParam.SQL, err = macros.Macro(mysqlQueryParam.SQL, mysqlQueryParam.From, mysqlQueryParam.To)\n\t\tif err != nil {\n\t\t\treturn nil, 0, err\n\t\t}\n\t}\n\n\ttimeout := m.Shards[0].Timeout\n\tif timeout == 0 {\n\t\ttimeout = 60\n\t}\n\n\ttimeoutCtx, cancel := context.WithTimeout(ctx, time.Duration(timeout)*time.Second)\n\tdefer cancel()\n\n\titems, err := m.Query(timeoutCtx, &sqlbase.QueryParam{\n\t\tSql: mysqlQueryParam.SQL,\n\t})\n\n\tif err != nil {\n\t\tlogx.Warningf(ctx, \"query:%+v get data err:%v\", mysqlQueryParam, err)\n\t\treturn []interface{}{}, 0, err\n\t}\n\tlogs := make([]interface{}, 0)\n\tfor i := range items {\n\t\tlogs = append(logs, items[i])\n\t}\n\n\treturn logs, 0, nil\n}\n\nfunc (m *MySQL) DescribeTable(ctx context.Context, query interface{}) ([]*types.ColumnProperty, error) {\n\tmysqlQueryParam := new(QueryParam)\n\tif err := mapstructure.Decode(query, mysqlQueryParam); err != nil {\n\t\treturn nil, err\n\t}\n\treturn m.DescTable(ctx, mysqlQueryParam.Database, mysqlQueryParam.Table)\n}\n"
},
{
"path": "datasource/opensearch/opensearch.go",
"content": "package opensearch\n\nimport (\n\t\"bytes\"\n\t\"context\"\n\t\"encoding/json\"\n\t\"fmt\"\n\t\"io\"\n\t\"net\"\n\t\"net/http\"\n\t\"net/url\"\n\t\"reflect\"\n\t\"regexp\"\n\t\"sort\"\n\t\"strings\"\n\t\"time\"\n\n\t\"github.com/ccfos/nightingale/v6/datasource\"\n\t\"github.com/ccfos/nightingale/v6/datasource/commons/eslike\"\n\t\"github.com/ccfos/nightingale/v6/models\"\n\t\"github.com/ccfos/nightingale/v6/pkg/tlsx\"\n\n\t\"github.com/mitchellh/mapstructure\"\n\t\"github.com/olivere/elastic/v7\"\n\toscliv2 \"github.com/opensearch-project/opensearch-go/v2\"\n\tosapiv2 \"github.com/opensearch-project/opensearch-go/v2/opensearchapi\"\n)\n\nconst (\n\tOpenSearchType = \"opensearch\"\n)\n\ntype OpenSearch struct {\n\tAddr string `json:\"os.addr\" mapstructure:\"os.addr\"`\n\tNodes []string `json:\"os.nodes\" mapstructure:\"os.nodes\"`\n\tTimeout int64 `json:\"os.timeout\" mapstructure:\"os.timeout\"` // millis\n\tBasic BasicAuth `json:\"os.basic\" mapstructure:\"os.basic\"`\n\tTLS TLS `json:\"os.tls\" mapstructure:\"os.tls\"`\n\tVersion string `json:\"os.version\" mapstructure:\"os.version\"`\n\tHeaders map[string]string `json:\"os.headers\" mapstructure:\"os.headers\"`\n\tMinInterval int `json:\"os.min_interval\" mapstructure:\"os.min_interval\"` // seconds\n\tMaxShard int `json:\"os.max_shard\" mapstructure:\"os.max_shard\"`\n\tClusterName string `json:\"os.cluster_name\" mapstructure:\"os.cluster_name\"`\n\tClient *oscliv2.Client `json:\"os.client\" mapstructure:\"os.client\"`\n}\n\ntype TLS struct {\n\tSkipTlsVerify bool `json:\"os.tls.skip_tls_verify\" mapstructure:\"os.tls.skip_tls_verify\"`\n}\n\ntype BasicAuth struct {\n\tEnable bool `json:\"os.auth.enable\" mapstructure:\"os.auth.enable\"`\n\tUsername string `json:\"os.user\" mapstructure:\"os.user\"`\n\tPassword string `json:\"os.password\" mapstructure:\"os.password\"`\n}\n\nfunc init() {\n\tdatasource.RegisterDatasource(OpenSearchType, new(OpenSearch))\n}\n\nfunc (os *OpenSearch) Init(settings map[string]interface{}) (datasource.Datasource, error) {\n\tnewest := new(OpenSearch)\n\terr := mapstructure.Decode(settings, newest)\n\treturn newest, err\n}\n\nfunc (os *OpenSearch) InitClient() error {\n\ttransport := &http.Transport{\n\t\tProxy: http.ProxyFromEnvironment,\n\t\tDialContext: (&net.Dialer{\n\t\t\tTimeout: time.Duration(os.Timeout) * time.Millisecond,\n\t\t}).DialContext,\n\t\tResponseHeaderTimeout: time.Duration(os.Timeout) * time.Millisecond,\n\t}\n\n\tif len(os.Nodes) > 0 {\n\t\tos.Addr = os.Nodes[0]\n\t}\n\n\tif strings.Contains(os.Addr, \"https\") {\n\t\ttlsConfig := tlsx.ClientConfig{\n\t\t\tInsecureSkipVerify: os.TLS.SkipTlsVerify,\n\t\t\tUseTLS: true,\n\t\t}\n\t\tcfg, err := tlsConfig.TLSConfig()\n\t\tif err != nil {\n\t\t\treturn err\n\t\t}\n\t\ttransport.TLSClientConfig = cfg\n\t}\n\n\theaders := http.Header{}\n\tfor k, v := range os.Headers {\n\t\theaders[k] = []string{v}\n\t}\n\n\toptions := oscliv2.Config{\n\t\tAddresses: os.Nodes,\n\t\tTransport: transport,\n\t\tHeader: headers,\n\t}\n\n\t// 只要有用户名就添加认证,不依赖 Enable 字段\n\tif os.Basic.Username != \"\" {\n\t\toptions.Username = os.Basic.Username\n\t\toptions.Password = os.Basic.Password\n\t}\n\n\tvar err = error(nil)\n\tos.Client, err = oscliv2.NewClient(options)\n\n\treturn err\n}\n\nfunc (os *OpenSearch) Equal(other datasource.Datasource) bool {\n\tsort.Strings(os.Nodes)\n\tsort.Strings(other.(*OpenSearch).Nodes)\n\n\tif strings.Join(os.Nodes, \",\") != strings.Join(other.(*OpenSearch).Nodes, \",\") {\n\t\treturn false\n\t}\n\n\tif os.Basic.Username != other.(*OpenSearch).Basic.Username {\n\t\treturn false\n\t}\n\n\tif os.Basic.Password != other.(*OpenSearch).Basic.Password {\n\t\treturn false\n\t}\n\n\tif os.TLS.SkipTlsVerify != other.(*OpenSearch).TLS.SkipTlsVerify {\n\t\treturn false\n\t}\n\n\tif os.Timeout != other.(*OpenSearch).Timeout {\n\t\treturn false\n\t}\n\n\tif !reflect.DeepEqual(os.Headers, other.(*OpenSearch).Headers) {\n\t\treturn false\n\t}\n\n\treturn true\n}\n\nfunc (os *OpenSearch) Validate(ctx context.Context) (err error) {\n\tif len(os.Nodes) == 0 {\n\t\treturn fmt.Errorf(\"need a valid addr\")\n\t}\n\n\tfor _, addr := range os.Nodes {\n\t\t_, err = url.Parse(addr)\n\t\tif err != nil {\n\t\t\treturn fmt.Errorf(\"parse addr error: %v\", err)\n\t\t}\n\t}\n\n\t// 如果提供了用户名,必须同时提供密码\n\tif len(os.Basic.Username) > 0 && len(os.Basic.Password) == 0 {\n\t\treturn fmt.Errorf(\"password is required when username is provided\")\n\t}\n\n\tif os.MaxShard == 0 {\n\t\tos.MaxShard = 5\n\t}\n\n\tif os.MinInterval < 10 {\n\t\tos.MinInterval = 10\n\t}\n\n\tif os.Timeout == 0 {\n\t\tos.Timeout = 6000\n\t}\n\n\tif !strings.HasPrefix(os.Version, \"2\") {\n\t\treturn fmt.Errorf(\"version must be 2.0+\")\n\t}\n\n\treturn nil\n}\n\nfunc (os *OpenSearch) MakeLogQuery(ctx context.Context, query interface{}, eventTags []string, start, end int64) (interface{}, error) {\n\treturn eslike.MakeLogQuery(ctx, query, eventTags, start, end)\n}\n\nfunc (os *OpenSearch) MakeTSQuery(ctx context.Context, query interface{}, eventTags []string, start, end int64) (interface{}, error) {\n\treturn eslike.MakeTSQuery(ctx, query, eventTags, start, end)\n}\n\nfunc search(ctx context.Context, indices []string, source interface{}, timeout int, cli *oscliv2.Client) (*elastic.SearchResult, error) {\n\tvar body *bytes.Buffer = nil\n\tif source != nil {\n\t\tbody = new(bytes.Buffer)\n\t\terr := json.NewEncoder(body).Encode(source)\n\t\tif err != nil {\n\t\t\treturn nil, err\n\t\t}\n\t}\n\n\treq := osapiv2.SearchRequest{\n\t\tIndex: indices,\n\t\tBody: body,\n\t}\n\n\tif timeout > 0 {\n\t\treq.Timeout = time.Second * time.Duration(timeout)\n\t}\n\n\tresp, err := req.Do(ctx, cli)\n\tif err != nil {\n\t\treturn nil, err\n\t}\n\tdefer resp.Body.Close()\n\n\tif resp.StatusCode < 200 || resp.StatusCode >= 300 {\n\t\treturn nil, fmt.Errorf(\"opensearch response not 2xx, resp is %v\", resp)\n\t}\n\n\tbs, err := io.ReadAll(resp.Body)\n\tif err != nil {\n\t\treturn nil, err\n\t}\n\n\tresult := new(elastic.SearchResult)\n\terr = json.Unmarshal(bs, &result)\n\tif err != nil {\n\t\treturn nil, err\n\t}\n\n\treturn result, nil\n}\n\nfunc (os *OpenSearch) QueryData(ctx context.Context, queryParam interface{}) ([]models.DataResp, error) {\n\n\tsearch := func(ctx context.Context, indices []string, source interface{}, timeout int, maxShard int) (*elastic.SearchResult, error) {\n\t\treturn search(ctx, indices, source, timeout, os.Client)\n\t}\n\n\treturn eslike.QueryData(ctx, queryParam, os.Timeout, os.Version, search)\n}\n\nfunc (os *OpenSearch) QueryIndices() ([]string, error) {\n\n\tcir := osapiv2.CatIndicesRequest{\n\t\tFormat: \"json\",\n\t}\n\n\trsp, err := cir.Do(context.Background(), os.Client)\n\tif err != nil {\n\t\treturn nil, err\n\t}\n\tdefer rsp.Body.Close()\n\n\tbs, err := io.ReadAll(rsp.Body)\n\tif err != nil {\n\t\treturn nil, err\n\t}\n\n\tresp := make([]struct {\n\t\tIndex string `json:\"index\"`\n\t}, 0)\n\n\terr = json.Unmarshal(bs, &resp)\n\tif err != nil {\n\t\treturn nil, err\n\t}\n\n\tvar ret []string\n\tfor _, k := range resp {\n\t\tret = append(ret, k.Index)\n\t}\n\n\treturn ret, nil\n}\n\nfunc (os *OpenSearch) QueryFields(indices []string) ([]string, error) {\n\n\tvar fields []string\n\tmappingRequest := osapiv2.IndicesGetMappingRequest{\n\t\tIndex: indices,\n\t}\n\n\tresp, err := mappingRequest.Do(context.Background(), os.Client)\n\tif err != nil {\n\t\treturn fields, err\n\t}\n\tdefer resp.Body.Close()\n\tbs, err := io.ReadAll(resp.Body)\n\tif err != nil {\n\t\treturn fields, err\n\t}\n\n\tresult := map[string]interface{}{}\n\n\terr = json.Unmarshal(bs, &result)\n\tif err != nil {\n\t\treturn fields, err\n\t}\n\n\tidx := \"\"\n\tif len(indices) > 0 {\n\t\tidx = indices[0]\n\t}\n\n\tmappingIndex := \"\"\n\tindexReg, _ := regexp.Compile(idx)\n\tfor key, value := range result {\n\t\tmappings, ok := value.(map[string]interface{})\n\t\tif !ok {\n\t\t\tcontinue\n\t\t}\n\t\tif len(mappings) == 0 {\n\t\t\tcontinue\n\t\t}\n\t\tif key == idx || strings.Contains(key, idx) ||\n\t\t\t(indexReg != nil && indexReg.MatchString(key)) {\n\t\t\tmappingIndex = key\n\t\t\tbreak\n\t\t}\n\t}\n\n\tif len(mappingIndex) == 0 {\n\t\treturn fields, nil\n\t}\n\n\tfields = propertyMappingRange(result[mappingIndex], 1)\n\n\tsort.Strings(fields)\n\treturn fields, nil\n}\n\nfunc propertyMappingRange(v interface{}, depth int) (fields []string) {\n\tmapping, ok := v.(map[string]interface{})\n\tif !ok {\n\t\treturn\n\t}\n\tif len(mapping) == 0 {\n\t\treturn\n\t}\n\tfor key, value := range mapping {\n\t\tif reflect.TypeOf(value).Kind() == reflect.Map {\n\t\t\tvalueMap := value.(map[string]interface{})\n\t\t\tif prop, found := valueMap[\"properties\"]; found {\n\t\t\t\tsubFields := propertyMappingRange(prop, depth+1)\n\t\t\t\tfor i := range subFields {\n\t\t\t\t\tif depth == 1 {\n\t\t\t\t\t\tfields = append(fields, subFields[i])\n\t\t\t\t\t} else {\n\t\t\t\t\t\tfields = append(fields, key+\".\"+subFields[i])\n\t\t\t\t\t}\n\t\t\t\t}\n\t\t\t} else if typ, found := valueMap[\"type\"]; found {\n\t\t\t\tif eslike.HitFilter(typ.(string)) {\n\t\t\t\t\tcontinue\n\t\t\t\t}\n\t\t\t\tfields = append(fields, key)\n\t\t\t}\n\t\t}\n\t}\n\treturn\n}\n\nfunc (os *OpenSearch) QueryLog(ctx context.Context, queryParam interface{}) ([]interface{}, int64, error) {\n\n\tsearch := func(ctx context.Context, indices []string, source interface{}, timeout int, maxShard int) (*elastic.SearchResult, error) {\n\t\treturn search(ctx, indices, source, timeout, os.Client)\n\t}\n\n\treturn eslike.QueryLog(ctx, queryParam, os.Timeout, os.Version, 0, search)\n}\n\nfunc (os *OpenSearch) QueryFieldValue(indexes []string, field string, query string) ([]string, error) {\n\tvar values []string\n\tsource := elastic.NewSearchSource().\n\t\tSize(0)\n\n\tif query != \"\" {\n\t\tsource = source.Query(elastic.NewBoolQuery().Must(elastic.NewQueryStringQuery(query)))\n\t}\n\tsource = source.Aggregation(\"distinct\", elastic.NewTermsAggregation().Field(field).Size(10000))\n\n\tresult, err := search(context.Background(), indexes, source, 0, os.Client)\n\tif err != nil {\n\t\treturn values, err\n\t}\n\n\tagg, found := result.Aggregations.Terms(\"distinct\")\n\tif !found {\n\t\treturn values, nil\n\t}\n\n\tfor _, bucket := range agg.Buckets {\n\t\tvalues = append(values, bucket.Key.(string))\n\t}\n\n\treturn values, nil\n}\n\nfunc (os *OpenSearch) QueryMapData(ctx context.Context, query interface{}) ([]map[string]string, error) {\n\treturn nil, nil\n}\n"
},
{
"path": "datasource/postgresql/postgresql.go",
"content": "package postgresql\n\nimport (\n\t\"context\"\n\t\"fmt\"\n\t\"regexp\"\n\t\"strings\"\n\t\"time\"\n\n\t\"github.com/ccfos/nightingale/v6/datasource\"\n\t\"github.com/ccfos/nightingale/v6/pkg/macros\"\n\n\t\"github.com/ccfos/nightingale/v6/dskit/postgres\"\n\t\"github.com/ccfos/nightingale/v6/dskit/sqlbase\"\n\t\"github.com/ccfos/nightingale/v6/dskit/types\"\n\t\"github.com/ccfos/nightingale/v6/models\"\n\t\"github.com/mitchellh/mapstructure\"\n\t\"github.com/toolkits/pkg/logger\"\n\n\t\"github.com/ccfos/nightingale/v6/pkg/logx\"\n)\n\nconst (\n\tPostgreSQLType = \"pgsql\"\n)\n\nvar (\n\tregx = `(?i)from\\s+((?:\"[^\"]+\"|[a-zA-Z0-9_]+))\\.((?:\"[^\"]+\"|[a-zA-Z0-9_]+))\\.((?:\"[^\"]+\"|[a-zA-Z0-9_]+))`\n)\n\nfunc init() {\n\tdatasource.RegisterDatasource(PostgreSQLType, new(PostgreSQL))\n}\n\ntype PostgreSQL struct {\n\tShards []*postgres.PostgreSQL `json:\"pgsql.shards\" mapstructure:\"pgsql.shards\"`\n}\n\ntype QueryParam struct {\n\tRef string `json:\"ref\" mapstructure:\"ref\"`\n\tDatabase string `json:\"database\" mapstructure:\"database\"`\n\tTable string `json:\"table\" mapstructure:\"table\"`\n\tSQL string `json:\"sql\" mapstructure:\"sql\"`\n\tKeys datasource.Keys `json:\"keys\" mapstructure:\"keys\"`\n\tFrom int64 `json:\"from\" mapstructure:\"from\"`\n\tTo int64 `json:\"to\" mapstructure:\"to\"`\n}\n\nfunc (p *PostgreSQL) InitClient() error {\n\tif len(p.Shards) == 0 {\n\t\treturn fmt.Errorf(\"not found postgresql addr, please check datasource config\")\n\t}\n\tfor _, shard := range p.Shards {\n\t\tif db, err := shard.NewConn(context.TODO(), \"postgres\"); err != nil {\n\t\t\tdefer sqlbase.CloseDB(db)\n\t\t\treturn err\n\t\t}\n\t}\n\treturn nil\n}\n\nfunc (p *PostgreSQL) Init(settings map[string]interface{}) (datasource.Datasource, error) {\n\tnewest := new(PostgreSQL)\n\terr := mapstructure.Decode(settings, newest)\n\treturn newest, err\n}\n\nfunc (p *PostgreSQL) Validate(ctx context.Context) error {\n\tif len(p.Shards) == 0 || len(strings.TrimSpace(p.Shards[0].Addr)) == 0 {\n\t\treturn fmt.Errorf(\"postgresql addr is invalid, please check datasource setting\")\n\t}\n\n\tif len(strings.TrimSpace(p.Shards[0].User)) == 0 {\n\t\treturn fmt.Errorf(\"postgresql user is invalid, please check datasource setting\")\n\t}\n\n\treturn nil\n}\n\n// Equal compares whether two objects are the same, used for caching\nfunc (p *PostgreSQL) Equal(d datasource.Datasource) bool {\n\tnewest, ok := d.(*PostgreSQL)\n\tif !ok {\n\t\tlogger.Errorf(\"unexpected plugin type, expected is postgresql\")\n\t\treturn false\n\t}\n\n\tif len(p.Shards) == 0 || len(newest.Shards) == 0 {\n\t\treturn false\n\t}\n\n\toldShard := p.Shards[0]\n\tnewShard := newest.Shards[0]\n\n\tif oldShard.Addr != newShard.Addr {\n\t\treturn false\n\t}\n\n\tif oldShard.User != newShard.User {\n\t\treturn false\n\t}\n\n\tif oldShard.Password != newShard.Password {\n\t\treturn false\n\t}\n\n\tif oldShard.MaxQueryRows != newShard.MaxQueryRows {\n\t\treturn false\n\t}\n\n\tif oldShard.Timeout != newShard.Timeout {\n\t\treturn false\n\t}\n\n\tif oldShard.MaxIdleConns != newShard.MaxIdleConns {\n\t\treturn false\n\t}\n\n\tif oldShard.MaxOpenConns != newShard.MaxOpenConns {\n\t\treturn false\n\t}\n\n\tif oldShard.ConnMaxLifetime != newShard.ConnMaxLifetime {\n\t\treturn false\n\t}\n\n\treturn true\n}\n\nfunc (p *PostgreSQL) ShowDatabases(ctx context.Context) ([]string, error) {\n\treturn p.Shards[0].ShowDatabases(ctx, \"\")\n}\n\nfunc (p *PostgreSQL) ShowTables(ctx context.Context, database string) ([]string, error) {\n\tp.Shards[0].DB = database\n\trets, err := p.Shards[0].ShowTables(ctx, \"\")\n\tif err != nil {\n\t\treturn nil, err\n\t}\n\ttables := make([]string, 0, len(rets))\n\tfor scheme, tabs := range rets {\n\t\tfor _, tab := range tabs {\n\t\t\ttables = append(tables, scheme+\".\"+tab)\n\t\t}\n\t}\n\treturn tables, nil\n}\n\nfunc (p *PostgreSQL) MakeLogQuery(ctx context.Context, query interface{}, eventTags []string, start, end int64) (interface{}, error) {\n\treturn nil, nil\n}\n\nfunc (p *PostgreSQL) MakeTSQuery(ctx context.Context, query interface{}, eventTags []string, start, end int64) (interface{}, error) {\n\treturn nil, nil\n}\n\nfunc (p *PostgreSQL) QueryMapData(ctx context.Context, query interface{}) ([]map[string]string, error) {\n\treturn nil, nil\n}\n\nfunc (p *PostgreSQL) QueryData(ctx context.Context, query interface{}) ([]models.DataResp, error) {\n\tpostgresqlQueryParam := new(QueryParam)\n\tif err := mapstructure.Decode(query, postgresqlQueryParam); err != nil {\n\t\treturn nil, err\n\t}\n\n\tpostgresqlQueryParam.SQL = formatSQLDatabaseNameWithRegex(postgresqlQueryParam.SQL)\n\tif strings.Contains(postgresqlQueryParam.SQL, \"$__\") {\n\t\tvar err error\n\t\tpostgresqlQueryParam.SQL, err = macros.Macro(postgresqlQueryParam.SQL, postgresqlQueryParam.From, postgresqlQueryParam.To)\n\t\tif err != nil {\n\t\t\treturn nil, err\n\t\t}\n\t}\n\tif postgresqlQueryParam.Database != \"\" {\n\t\tp.Shards[0].DB = postgresqlQueryParam.Database\n\t} else {\n\t\tdb, err := parseDBName(postgresqlQueryParam.SQL)\n\t\tif err != nil {\n\t\t\treturn nil, err\n\t\t}\n\t\tp.Shards[0].DB = db\n\t}\n\n\ttimeout := p.Shards[0].Timeout\n\tif timeout == 0 {\n\t\ttimeout = 60\n\t}\n\ttimeoutCtx, cancel := context.WithTimeout(ctx, time.Duration(timeout)*time.Second)\n\tdefer cancel()\n\n\titems, err := p.Shards[0].QueryTimeseries(timeoutCtx, &sqlbase.QueryParam{\n\t\tSql: postgresqlQueryParam.SQL,\n\t\tKeys: types.Keys{\n\t\t\tValueKey: postgresqlQueryParam.Keys.ValueKey,\n\t\t\tLabelKey: postgresqlQueryParam.Keys.LabelKey,\n\t\t\tTimeKey: postgresqlQueryParam.Keys.TimeKey,\n\t\t},\n\t})\n\n\tif err != nil {\n\t\tlogx.Warningf(ctx, \"query:%+v get data err:%v\", postgresqlQueryParam, err)\n\t\treturn []models.DataResp{}, err\n\t}\n\tdata := make([]models.DataResp, 0)\n\tfor i := range items {\n\t\tdata = append(data, models.DataResp{\n\t\t\tRef: postgresqlQueryParam.Ref,\n\t\t\tMetric: items[i].Metric,\n\t\t\tValues: items[i].Values,\n\t\t})\n\t}\n\n\t// parse resp to time series data\n\tlogx.Infof(ctx, \"req:%+v keys:%+v \\n data:%v\", postgresqlQueryParam, postgresqlQueryParam.Keys, data)\n\n\treturn data, nil\n}\n\nfunc (p *PostgreSQL) QueryLog(ctx context.Context, query interface{}) ([]interface{}, int64, error) {\n\tpostgresqlQueryParam := new(QueryParam)\n\tif err := mapstructure.Decode(query, postgresqlQueryParam); err != nil {\n\t\treturn nil, 0, err\n\t}\n\tif postgresqlQueryParam.Database != \"\" {\n\t\tp.Shards[0].DB = postgresqlQueryParam.Database\n\t} else {\n\t\tdb, err := parseDBName(postgresqlQueryParam.SQL)\n\t\tif err != nil {\n\t\t\treturn nil, 0, err\n\t\t}\n\t\tp.Shards[0].DB = db\n\t}\n\n\tpostgresqlQueryParam.SQL = formatSQLDatabaseNameWithRegex(postgresqlQueryParam.SQL)\n\tif strings.Contains(postgresqlQueryParam.SQL, \"$__\") {\n\t\tvar err error\n\t\tpostgresqlQueryParam.SQL, err = macros.Macro(postgresqlQueryParam.SQL, postgresqlQueryParam.From, postgresqlQueryParam.To)\n\t\tif err != nil {\n\t\t\treturn nil, 0, err\n\t\t}\n\t}\n\n\ttimeout := p.Shards[0].Timeout\n\tif timeout == 0 {\n\t\ttimeout = 60\n\t}\n\ttimeoutCtx, cancel := context.WithTimeout(ctx, time.Duration(timeout)*time.Second)\n\tdefer cancel()\n\titems, err := p.Shards[0].Query(timeoutCtx, &sqlbase.QueryParam{\n\t\tSql: postgresqlQueryParam.SQL,\n\t})\n\tif err != nil {\n\t\tlogx.Warningf(ctx, \"query:%+v get data err:%v\", postgresqlQueryParam, err)\n\t\treturn []interface{}{}, 0, err\n\t}\n\tlogs := make([]interface{}, 0)\n\tfor i := range items {\n\t\tlogs = append(logs, items[i])\n\t}\n\n\treturn logs, 0, nil\n}\n\nfunc (p *PostgreSQL) DescribeTable(ctx context.Context, query interface{}) ([]*types.ColumnProperty, error) {\n\tpostgresqlQueryParam := new(QueryParam)\n\tif err := mapstructure.Decode(query, postgresqlQueryParam); err != nil {\n\t\treturn nil, err\n\t}\n\tp.Shards[0].DB = postgresqlQueryParam.Database\n\tpairs := strings.Split(postgresqlQueryParam.Table, \".\") // format: scheme.table_name\n\tscheme := \"\"\n\ttable := postgresqlQueryParam.Table\n\tif len(pairs) == 2 {\n\t\tscheme = pairs[0]\n\t\ttable = pairs[1]\n\t}\n\treturn p.Shards[0].DescTable(ctx, scheme, table)\n}\n\nfunc parseDBName(sql string) (db string, err error) {\n\tre := regexp.MustCompile(regx)\n\tmatches := re.FindStringSubmatch(sql)\n\tif len(matches) != 4 {\n\t\treturn \"\", fmt.Errorf(\"no valid table name in format database.schema.table found\")\n\t}\n\treturn strings.Trim(matches[1], `\"`), nil\n}\n\n// formatSQLDatabaseNameWithRegex 只对 dbname.scheme.tabname 格式进行数据库名称格式化,转为 \"dbname\".scheme.tabname\n// 在pgsql中,大小写是通过\"\" 双引号括起来区分的,默认pg都是转为小写的,所以这里转为 \"dbname\".scheme.\"tabname\"\nfunc formatSQLDatabaseNameWithRegex(sql string) string {\n\t// 匹配 from dbname.scheme.table_name 的模式\n\t// 使用捕获组来精确匹配数据库名称,确保后面跟着scheme和table\n\tre := regexp.MustCompile(`(?i)\\bfrom\\s+([a-zA-Z_][a-zA-Z0-9_]*)\\s*\\.\\s*([a-zA-Z_][a-zA-Z0-9_]*)\\s*\\.\\s*([a-zA-Z_][a-zA-Z0-9_]*)`)\n\n\treturn re.ReplaceAllString(sql, `from \"$1\".\"$2\".\"$3\"`)\n}\n\nfunc extractColumns(sql string) ([]string, error) {\n\t// 将 SQL 转换为小写以简化匹配\n\tsql = strings.ToLower(sql)\n\n\t// 匹配 SELECT 和 FROM 之间的内容\n\tre := regexp.MustCompile(`select\\s+(.*?)\\s+from`)\n\tmatches := re.FindStringSubmatch(sql)\n\n\tif len(matches) < 2 {\n\t\treturn nil, fmt.Errorf(\"no columns found or invalid SQL syntax\")\n\t}\n\n\t// 提取列部分\n\tcolumnsString := matches[1]\n\n\t// 分割列\n\tcolumns := splitColumns(columnsString)\n\n\t// 清理每个列名\n\tfor i, col := range columns {\n\t\tcolumns[i] = strings.TrimSpace(col)\n\t}\n\n\treturn columns, nil\n}\n\nfunc splitColumns(columnsString string) []string {\n\tvar columns []string\n\tvar currentColumn strings.Builder\n\tparenthesesCount := 0\n\tinQuotes := false\n\n\tfor _, char := range columnsString {\n\t\tswitch char {\n\t\tcase '(':\n\t\t\tparenthesesCount++\n\t\t\tcurrentColumn.WriteRune(char)\n\t\tcase ')':\n\t\t\tparenthesesCount--\n\t\t\tcurrentColumn.WriteRune(char)\n\t\tcase '\\'', '\"':\n\t\t\tinQuotes = !inQuotes\n\t\t\tcurrentColumn.WriteRune(char)\n\t\tcase ',':\n\t\t\tif parenthesesCount == 0 && !inQuotes {\n\t\t\t\tcolumns = append(columns, currentColumn.String())\n\t\t\t\tcurrentColumn.Reset()\n\t\t\t} else {\n\t\t\t\tcurrentColumn.WriteRune(char)\n\t\t\t}\n\t\tdefault:\n\t\t\tcurrentColumn.WriteRune(char)\n\t\t}\n\t}\n\n\tif currentColumn.Len() > 0 {\n\t\tcolumns = append(columns, currentColumn.String())\n\t}\n\n\treturn columns\n}\n"
},
{
"path": "datasource/prom/prom.go",
"content": "package prom\n\ntype Prometheus struct {\n\tPrometheusAddr string `json:\"prometheus.addr\"`\n\tPrometheusBasic struct {\n\t\tPrometheusUser string `json:\"prometheus.user\"`\n\t\tPrometheusPass string `json:\"prometheus.password\"`\n\t} `json:\"prometheus.basic\"`\n\tHeaders map[string]string `json:\"prometheus.headers\"`\n\tPrometheusTimeout int64 `json:\"prometheus.timeout\"`\n\tClusterName string `json:\"prometheus.cluster_name\"`\n\tWriteAddr string `json:\"prometheus.write_addr\"`\n\tTsdbType string `json:\"prometheus.tsdb_type\"`\n\tInternalAddr string `json:\"prometheus.internal_addr\"`\n}\n"
},
{
"path": "datasource/tdengine/tdengine.go",
"content": "package tdengine\n\nimport (\n\t\"context\"\n\t\"encoding/json\"\n\t\"fmt\"\n\t\"reflect\"\n\t\"strconv\"\n\t\"strings\"\n\t\"time\"\n\n\t\"github.com/prometheus/common/model\"\n\t\"github.com/toolkits/pkg/logger\"\n\n\t\"github.com/ccfos/nightingale/v6/pkg/logx\"\n\n\t\"github.com/ccfos/nightingale/v6/datasource\"\n\ttd \"github.com/ccfos/nightingale/v6/dskit/tdengine\"\n\t\"github.com/ccfos/nightingale/v6/models\"\n\n\t\"github.com/mitchellh/mapstructure\"\n)\n\nconst (\n\tTDEngineType = \"tdengine\"\n)\n\ntype TDengine struct {\n\ttd.Tdengine `json:\",inline\" mapstructure:\",squash\"`\n}\n\ntype TdengineQuery struct {\n\tFrom string `json:\"from\"`\n\tInterval int64 `json:\"interval\"`\n\tKeys Keys `json:\"keys\"`\n\tQuery string `json:\"query\"` // 查询条件\n\tRef string `json:\"ref\"` // 变量\n\tTo string `json:\"to\"`\n}\n\ntype Keys struct {\n\tLabelKey string `json:\"labelKey\"` // 多个用空格分隔\n\tMetricKey string `json:\"metricKey\"` // 多个用空格分隔\n\tTimeFormat string `json:\"timeFormat\"`\n}\n\nfunc init() {\n\tdatasource.RegisterDatasource(TDEngineType, new(TDengine))\n}\n\nfunc (td *TDengine) Init(settings map[string]interface{}) (datasource.Datasource, error) {\n\tnewest := new(TDengine)\n\terr := mapstructure.Decode(settings, newest)\n\treturn newest, err\n}\n\nfunc (td *TDengine) InitClient() error {\n\ttd.InitCli()\n\treturn nil\n}\n\nfunc (td *TDengine) Equal(other datasource.Datasource) bool {\n\totherTD, ok := other.(*TDengine)\n\tif !ok {\n\t\treturn false\n\t}\n\n\tif td.Addr != otherTD.Addr {\n\t\treturn false\n\t}\n\n\tif td.Basic != nil && otherTD.Basic != nil {\n\t\tif td.Basic.User != otherTD.Basic.User {\n\t\t\treturn false\n\t\t}\n\n\t\tif td.Basic.Password != otherTD.Basic.Password {\n\t\t\treturn false\n\t\t}\n\t}\n\n\tif td.Token != otherTD.Token {\n\t\treturn false\n\t}\n\n\tif td.Timeout != otherTD.Timeout {\n\t\treturn false\n\t}\n\n\tif td.DialTimeout != otherTD.DialTimeout {\n\t\treturn false\n\t}\n\n\tif td.MaxIdleConnsPerHost != otherTD.MaxIdleConnsPerHost {\n\t\treturn false\n\t}\n\n\tif len(td.Headers) != len(otherTD.Headers) {\n\t\treturn false\n\t}\n\n\tfor k, v := range td.Headers {\n\t\tif otherV, ok := otherTD.Headers[k]; !ok || v != otherV {\n\t\t\treturn false\n\t\t}\n\t}\n\treturn true\n}\n\nfunc (td *TDengine) Validate(ctx context.Context) (err error) {\n\treturn nil\n}\n\nfunc (td *TDengine) MakeLogQuery(ctx context.Context, query interface{}, eventTags []string, start, end int64) (interface{}, error) {\n\treturn nil, nil\n}\n\nfunc (td *TDengine) MakeTSQuery(ctx context.Context, query interface{}, eventTags []string, start, end int64) (interface{}, error) {\n\treturn nil, nil\n}\n\nfunc (td *TDengine) QueryData(ctx context.Context, queryParam interface{}) ([]models.DataResp, error) {\n\treturn td.Query(ctx, queryParam, 0)\n}\n\nfunc (td *TDengine) QueryLog(ctx context.Context, queryParam interface{}) ([]interface{}, int64, error) {\n\tb, err := json.Marshal(queryParam)\n\tif err != nil {\n\t\treturn nil, 0, err\n\t}\n\tvar q TdengineQuery\n\terr = json.Unmarshal(b, &q)\n\tif err != nil {\n\t\treturn nil, 0, err\n\t}\n\n\tif q.Interval == 0 {\n\t\tq.Interval = 60\n\t}\n\n\tif q.From == \"\" {\n\t\t// 2023-09-21T05:37:30.000Z format\n\t\tto := time.Now().Unix()\n\t\tq.To = time.Unix(to, 0).UTC().Format(time.RFC3339)\n\t\tfrom := to - q.Interval\n\t\tq.From = time.Unix(from, 0).UTC().Format(time.RFC3339)\n\t}\n\n\treplacements := map[string]string{\n\t\t\"$from\": fmt.Sprintf(\"'%s'\", q.From),\n\t\t\"$to\": fmt.Sprintf(\"'%s'\", q.To),\n\t\t\"$interval\": fmt.Sprintf(\"%ds\", q.Interval),\n\t}\n\n\tfor key, val := range replacements {\n\t\tq.Query = strings.ReplaceAll(q.Query, key, val)\n\t}\n\n\tif !strings.Contains(q.Query, \"limit\") {\n\t\tq.Query = q.Query + \" limit 200\"\n\t}\n\n\tdata, err := td.QueryTable(q.Query)\n\tif err != nil {\n\t\treturn nil, 0, err\n\t}\n\n\treturn ConvertToTable(data), int64(len(data.Data)), nil\n}\n\nfunc (td *TDengine) QueryMapData(ctx context.Context, query interface{}) ([]map[string]string, error) {\n\treturn nil, nil\n}\n\nfunc (td *TDengine) Query(ctx context.Context, query interface{}, delay ...int) ([]models.DataResp, error) {\n\tb, err := json.Marshal(query)\n\tif err != nil {\n\t\treturn nil, err\n\t}\n\tvar q TdengineQuery\n\terr = json.Unmarshal(b, &q)\n\tif err != nil {\n\t\treturn nil, err\n\t}\n\n\tif q.Interval == 0 {\n\t\tq.Interval = 60\n\t}\n\n\tdelaySec := 0\n\tif len(delay) > 0 {\n\t\tdelaySec = delay[0]\n\t}\n\n\tif q.From == \"\" {\n\t\t// 2023-09-21T05:37:30.000Z format\n\t\tto := time.Now().Unix() - int64(delaySec)\n\t\tq.To = time.Unix(to, 0).UTC().Format(time.RFC3339)\n\t\tfrom := to - q.Interval\n\t\tq.From = time.Unix(from, 0).UTC().Format(time.RFC3339)\n\t}\n\n\treplacements := map[string]string{\n\t\t\"$from\": fmt.Sprintf(\"'%s'\", q.From),\n\t\t\"$to\": fmt.Sprintf(\"'%s'\", q.To),\n\t\t\"$interval\": fmt.Sprintf(\"%ds\", q.Interval),\n\t}\n\n\tfor key, val := range replacements {\n\t\tq.Query = strings.ReplaceAll(q.Query, key, val)\n\t}\n\n\tdata, err := td.QueryTable(q.Query)\n\tif err != nil {\n\t\treturn nil, err\n\t}\n\tlogx.Debugf(ctx, \"tdengine query:%s result: %+v\", q.Query, data)\n\n\treturn ConvertToTStData(data, q.Keys, q.Ref)\n}\n\nfunc ConvertToTStData(src td.APIResponse, key Keys, ref string) ([]models.DataResp, error) {\n\tmetricIdxMap := make(map[string]int)\n\tlabelIdxMap := make(map[string]int)\n\n\tmetricMap := make(map[string]struct{})\n\tif key.MetricKey != \"\" {\n\t\tmetricList := strings.Split(key.MetricKey, \" \")\n\t\tfor _, metric := range metricList {\n\t\t\tmetricMap[metric] = struct{}{}\n\t\t}\n\t}\n\n\tlabelMap := make(map[string]string)\n\tif key.LabelKey != \"\" {\n\t\tlabelList := strings.Split(key.LabelKey, \" \")\n\t\tfor _, label := range labelList {\n\t\t\tlabelMap[label] = label\n\t\t}\n\t}\n\n\ttsIdx := -1\n\tfor colIndex, colData := range src.ColumnMeta {\n\t\tcolName := colData[0].(string)\n\t\tvar colType string\n\t\t// 处理v2版本数字类型和v3版本字符串类型\n\t\tswitch t := colData[1].(type) {\n\t\tcase float64:\n\t\t\t// v2版本数字类型映射\n\t\t\tswitch int(t) {\n\t\t\tcase 1:\n\t\t\t\tcolType = \"BOOL\"\n\t\t\tcase 2:\n\t\t\t\tcolType = \"TINYINT\"\n\t\t\tcase 3:\n\t\t\t\tcolType = \"SMALLINT\"\n\t\t\tcase 4:\n\t\t\t\tcolType = \"INT\"\n\t\t\tcase 5:\n\t\t\t\tcolType = \"BIGINT\"\n\t\t\tcase 6:\n\t\t\t\tcolType = \"FLOAT\"\n\t\t\tcase 7:\n\t\t\t\tcolType = \"DOUBLE\"\n\t\t\tcase 8:\n\t\t\t\tcolType = \"BINARY\"\n\t\t\tcase 9:\n\t\t\t\tcolType = \"TIMESTAMP\"\n\t\t\tcase 10:\n\t\t\t\tcolType = \"NCHAR\"\n\t\t\tdefault:\n\t\t\t\tcolType = \"UNKNOWN\"\n\t\t\t}\n\t\tcase string:\n\t\t\t// v3版本直接使用字符串类型\n\t\t\tcolType = t\n\t\tdefault:\n\t\t\tlogger.Warningf(\"unexpected column type format: %v\", colData[1])\n\t\t\tcontinue\n\t\t}\n\n\t\tswitch colType {\n\t\tcase \"TIMESTAMP\":\n\t\t\ttsIdx = colIndex\n\t\tcase \"BIGINT\", \"INT\", \"INT UNSIGNED\", \"BIGINT UNSIGNED\", \"FLOAT\", \"DOUBLE\",\n\t\t\t\"SMALLINT\", \"SMALLINT UNSIGNED\", \"TINYINT\", \"TINYINT UNSIGNED\", \"BOOL\":\n\t\t\tif len(metricMap) > 0 {\n\t\t\t\tif _, ok := metricMap[colName]; !ok {\n\t\t\t\t\tcontinue\n\t\t\t\t}\n\t\t\t\tmetricIdxMap[colName] = colIndex\n\t\t\t} else {\n\t\t\t\tmetricIdxMap[colName] = colIndex\n\t\t\t}\n\t\tdefault:\n\t\t\tif len(labelMap) > 0 {\n\t\t\t\tif _, ok := labelMap[colName]; !ok {\n\t\t\t\t\tcontinue\n\t\t\t\t}\n\t\t\t\tlabelIdxMap[colName] = colIndex\n\t\t\t} else {\n\t\t\t\tlabelIdxMap[colName] = colIndex\n\t\t\t}\n\t\t}\n\t}\n\n\tif tsIdx == -1 {\n\t\treturn nil, fmt.Errorf(\"timestamp column not found, please check your query\")\n\t}\n\n\tvar result []models.DataResp\n\tm := make(map[string]*models.DataResp)\n\tfor _, row := range src.Data {\n\t\tfor metricName, metricIdx := range metricIdxMap {\n\t\t\tvalue, err := interfaceToFloat64(row[metricIdx])\n\t\t\tif err != nil {\n\t\t\t\tlogger.Warningf(\"parse %v value failed: %v\", row, err)\n\t\t\t\tcontinue\n\t\t\t}\n\n\t\t\tmetric := make(model.Metric)\n\t\t\tfor labelName, labelIdx := range labelIdxMap {\n\t\t\t\tmetric[model.LabelName(labelName)] = model.LabelValue(row[labelIdx].(string))\n\t\t\t}\n\n\t\t\tmetric[model.MetricNameLabel] = model.LabelValue(metricName)\n\n\t\t\t// transfer 2022-06-29T05:52:16.603Z to unix timestamp\n\t\t\tt, err := parseTimeString(row[tsIdx].(string))\n\t\t\tif err != nil {\n\t\t\t\tlogger.Warningf(\"parse %v timestamp failed: %v\", row, err)\n\t\t\t\tcontinue\n\t\t\t}\n\n\t\t\ttimestamp := t.Unix()\n\t\t\tif _, ok := m[metric.String()]; !ok {\n\t\t\t\tm[metric.String()] = &models.DataResp{\n\t\t\t\t\tMetric: metric,\n\t\t\t\t\tValues: [][]float64{\n\t\t\t\t\t\t{float64(timestamp), value},\n\t\t\t\t\t},\n\t\t\t\t}\n\t\t\t} else {\n\t\t\t\tm[metric.String()].Values = append(m[metric.String()].Values, []float64{float64(timestamp), value})\n\t\t\t}\n\t\t}\n\t}\n\n\tfor _, v := range m {\n\t\tv.Ref = ref\n\t\tresult = append(result, *v)\n\t}\n\n\treturn result, nil\n}\n\nfunc interfaceToFloat64(input interface{}) (float64, error) {\n\t// Check for the kind of the value first\n\tif input == nil {\n\t\treturn 0, fmt.Errorf(\"unsupported type: %T\", input)\n\t}\n\n\tkind := reflect.TypeOf(input).Kind()\n\tswitch kind {\n\tcase reflect.Float64:\n\t\treturn input.(float64), nil\n\tcase reflect.Float32:\n\t\treturn float64(input.(float32)), nil\n\tcase reflect.Int, reflect.Int32, reflect.Int64, reflect.Int8, reflect.Int16:\n\t\treturn float64(reflect.ValueOf(input).Int()), nil\n\tcase reflect.Uint, reflect.Uint32, reflect.Uint64, reflect.Uint8, reflect.Uint16:\n\t\treturn float64(reflect.ValueOf(input).Uint()), nil\n\tcase reflect.String:\n\t\treturn strconv.ParseFloat(input.(string), 64)\n\tcase reflect.Bool:\n\t\tif input.(bool) {\n\t\t\treturn 1.0, nil\n\t\t}\n\t\treturn 0.0, nil\n\tdefault:\n\t\treturn 0, fmt.Errorf(\"unsupported type: %T\", input)\n\t}\n}\n\nfunc parseTimeString(ts string) (time.Time, error) {\n\t// 尝试不同的时间格式\n\tformats := []string{\n\t\t// 标准格式\n\t\ttime.Layout, // \"01/02 03:04:05PM '06 -0700\"\n\t\ttime.ANSIC, // \"Mon Jan _2 15:04:05 2006\"\n\t\ttime.UnixDate, // \"Mon Jan _2 15:04:05 MST 2006\"\n\t\ttime.RubyDate, // \"Mon Jan 02 15:04:05 -0700 2006\"\n\t\ttime.RFC822, // \"02 Jan 06 15:04 MST\"\n\t\ttime.RFC822Z, // \"02 Jan 06 15:04 -0700\"\n\t\ttime.RFC850, // \"Monday, 02-Jan-06 15:04:05 MST\"\n\t\ttime.RFC1123, // \"Mon, 02 Jan 2006 15:04:05 MST\"\n\t\ttime.RFC1123Z, // \"Mon, 02 Jan 2006 15:04:05 -0700\"\n\t\ttime.RFC3339, // \"2006-01-02T15:04:05Z07:00\"\n\t\ttime.RFC3339Nano, // \"2006-01-02T15:04:05.999999999Z07:00\"\n\t\ttime.Kitchen, // \"3:04PM\"\n\n\t\t// 实用时间戳格式\n\t\ttime.Stamp, // \"Jan _2 15:04:05\"\n\t\ttime.StampMilli, // \"Jan _2 15:04:05.000\"\n\t\ttime.StampMicro, // \"Jan _2 15:04:05.000000\"\n\t\ttime.StampNano, // \"Jan _2 15:04:05.000000000\"\n\t\ttime.DateTime, // \"2006-01-02 15:04:05\"\n\t\ttime.DateOnly, // \"2006-01-02\"\n\t\ttime.TimeOnly, // \"15:04:05\"\n\n\t\t// 常用自定义格式\n\t\t\"2006-01-02T15:04:05\", // 无时区的ISO格式\n\t\t\"2006-01-02T15:04:05.000Z\",\n\t\t\"2006-01-02T15:04:05Z\",\n\t\t\"2006-01-02 15:04:05.999999999\", // 纳秒\n\t\t\"2006-01-02 15:04:05.999999\", // 微秒\n\t\t\"2006-01-02 15:04:05.999\", // 毫秒\n\t\t\"2006/01/02\",\n\t\t\"20060102\",\n\t\t\"01/02/2006\",\n\t\t\"2006年01月02日\",\n\t\t\"2006年01月02日 15:04:05\",\n\t}\n\n\tvar lastErr error\n\tfor _, format := range formats {\n\t\tt, err := time.Parse(format, ts)\n\t\tif err == nil {\n\t\t\treturn t, nil\n\t\t}\n\t\tlastErr = err\n\t}\n\n\t// 尝试解析 Unix 时间戳\n\tif timestamp, err := strconv.ParseInt(ts, 10, 64); err == nil {\n\t\tswitch len(ts) {\n\t\tcase 10: // 秒\n\t\t\treturn time.Unix(timestamp, 0), nil\n\t\tcase 13: // 毫秒\n\t\t\treturn time.Unix(timestamp/1000, (timestamp%1000)*1000000), nil\n\t\tcase 16: // 微秒\n\t\t\treturn time.Unix(timestamp/1000000, (timestamp%1000000)*1000), nil\n\t\tcase 19: // 纳秒\n\t\t\treturn time.Unix(timestamp/1000000000, timestamp%1000000000), nil\n\t\t}\n\t}\n\n\treturn time.Time{}, fmt.Errorf(\"failed to parse time with any format: %v\", lastErr)\n}\n\nfunc ConvertToTable(src td.APIResponse) []interface{} {\n\tvar resp []interface{}\n\n\tfor i := range src.Data {\n\t\tcur := make(map[string]interface{})\n\t\tfor j := range src.Data[i] {\n\t\t\tcur[src.ColumnMeta[j][0].(string)] = src.Data[i][j]\n\t\t}\n\t\tresp = append(resp, cur)\n\t}\n\treturn resp\n}\n"
},
{
"path": "datasource/victorialogs/victorialogs.go",
"content": "package victorialogs\n\nimport (\n\t\"context\"\n\t\"fmt\"\n\t\"net/url\"\n\t\"reflect\"\n\t\"strconv\"\n\t\"time\"\n\n\t\"github.com/ccfos/nightingale/v6/datasource\"\n\t\"github.com/ccfos/nightingale/v6/dskit/victorialogs\"\n\t\"github.com/ccfos/nightingale/v6/models\"\n\n\t\"github.com/mitchellh/mapstructure\"\n\t\"github.com/prometheus/common/model\"\n)\n\nconst (\n\tVictoriaLogsType = \"victorialogs\"\n)\n\n// VictoriaLogs 数据源实现\ntype VictoriaLogs struct {\n\tvictorialogs.VictoriaLogs `json:\",inline\" mapstructure:\",squash\"`\n}\n\n// Query 查询参数\ntype Query struct {\n\tQuery string `json:\"query\" mapstructure:\"query\"` // LogsQL 查询语句\n\tStart int64 `json:\"start\" mapstructure:\"start\"` // 开始时间(秒)\n\tEnd int64 `json:\"end\" mapstructure:\"end\"` // 结束时间(秒)\n\tTime int64 `json:\"time\" mapstructure:\"time\"` // 单点时间(秒)- 用于告警\n\tStep string `json:\"step\" mapstructure:\"step\"` // 步长,如 \"1m\", \"5m\"\n\tLimit int `json:\"limit\" mapstructure:\"limit\"` // 限制返回数量\n\tRef string `json:\"ref\" mapstructure:\"ref\"` // 变量引用名(如 A、B)\n}\n\n// IsInstantQuery 判断是否为即时查询(告警场景)\nfunc (q *Query) IsInstantQuery() bool {\n\treturn q.Time > 0 || (q.Start >= 0 && q.Start == q.End)\n}\n\nfunc init() {\n\tdatasource.RegisterDatasource(VictoriaLogsType, new(VictoriaLogs))\n}\n\n// Init 初始化配置\nfunc (vl *VictoriaLogs) Init(settings map[string]interface{}) (datasource.Datasource, error) {\n\tnewest := new(VictoriaLogs)\n\terr := mapstructure.Decode(settings, newest)\n\treturn newest, err\n}\n\n// InitClient 初始化客户端\nfunc (vl *VictoriaLogs) InitClient() error {\n\tif err := vl.InitHTTPClient(); err != nil {\n\t\treturn fmt.Errorf(\"failed to init victorialogs http client: %w\", err)\n\t}\n\n\treturn nil\n}\n\n// Validate 参数验证\nfunc (vl *VictoriaLogs) Validate(ctx context.Context) error {\n\tif vl.VictorialogsAddr == \"\" {\n\t\treturn fmt.Errorf(\"victorialogs.addr is required\")\n\t}\n\n\t// 验证 URL 格式\n\t_, err := url.Parse(vl.VictorialogsAddr)\n\tif err != nil {\n\t\treturn fmt.Errorf(\"invalid victorialogs.addr: %w\", err)\n\t}\n\n\t// 必须同时提供用户名和密码\n\tif (vl.VictorialogsBasic.VictorialogsUser != \"\" && vl.VictorialogsBasic.VictorialogsPass == \"\") ||\n\t\t(vl.VictorialogsBasic.VictorialogsUser == \"\" && vl.VictorialogsBasic.VictorialogsPass != \"\") {\n\t\treturn fmt.Errorf(\"both username and password must be provided\")\n\t}\n\n\t// 设置默认值\n\tif vl.Timeout == 0 {\n\t\tvl.Timeout = 10000 // 默认 10 秒\n\t}\n\n\tif vl.MaxQueryRows == 0 {\n\t\tvl.MaxQueryRows = 1000\n\t}\n\n\treturn nil\n}\n\n// Equal 验证是否相等\nfunc (vl *VictoriaLogs) Equal(other datasource.Datasource) bool {\n\to, ok := other.(*VictoriaLogs)\n\tif !ok {\n\t\treturn false\n\t}\n\n\treturn vl.VictorialogsAddr == o.VictorialogsAddr &&\n\t\tvl.VictorialogsBasic.VictorialogsUser == o.VictorialogsBasic.VictorialogsUser &&\n\t\tvl.VictorialogsBasic.VictorialogsPass == o.VictorialogsBasic.VictorialogsPass &&\n\t\tvl.VictorialogsTls.SkipTlsVerify == o.VictorialogsTls.SkipTlsVerify &&\n\t\tvl.Timeout == o.Timeout &&\n\t\treflect.DeepEqual(vl.Headers, o.Headers)\n}\n\n// QueryLog 日志查询\nfunc (vl *VictoriaLogs) QueryLog(ctx context.Context, queryParam interface{}) ([]interface{}, int64, error) {\n\tparam := new(Query)\n\tif err := mapstructure.Decode(queryParam, param); err != nil {\n\t\treturn nil, 0, fmt.Errorf(\"decode query param failed: %w\", err)\n\t}\n\n\tlogs, err := vl.Query(ctx, param.Query, param.Start, param.End, param.Limit)\n\tif err != nil {\n\t\treturn nil, 0, err\n\t}\n\n\t// 转换为 interface{} 数组\n\tresult := make([]interface{}, len(logs))\n\tfor i, log := range logs {\n\t\tresult[i] = log\n\t}\n\n\t// 调用 HitsLogs 获取真实的 total\n\ttotal, err := vl.HitsLogs(ctx, param.Query, param.Start, param.End)\n\tif err != nil {\n\t\t// 如果获取 total 失败,使用当前结果数量\n\t\ttotal = int64(len(logs))\n\t}\n\n\treturn result, total, nil\n}\n\n// QueryData 指标数据查询\nfunc (vl *VictoriaLogs) QueryData(ctx context.Context, queryParam interface{}) ([]models.DataResp, error) {\n\tparam := new(Query)\n\tif err := mapstructure.Decode(queryParam, param); err != nil {\n\t\treturn nil, fmt.Errorf(\"decode query param failed: %w\", err)\n\t}\n\n\t// 判断使用哪个 API\n\tif param.IsInstantQuery() {\n\t\treturn vl.queryDataInstant(ctx, param)\n\t}\n\treturn vl.queryDataRange(ctx, param)\n}\n\n// queryDataInstant 告警场景,调用 /select/logsql/stats_query\nfunc (vl *VictoriaLogs) queryDataInstant(ctx context.Context, param *Query) ([]models.DataResp, error) {\n\tqueryTime := param.Time\n\tif queryTime == 0 {\n\t\tqueryTime = param.End // 如果没有 time,使用 end 作为查询时间点\n\t}\n\tif queryTime == 0 {\n\t\tqueryTime = time.Now().Unix()\n\t}\n\n\tresult, err := vl.StatsQuery(ctx, param.Query, queryTime)\n\tif err != nil {\n\t\treturn nil, err\n\t}\n\n\treturn convertPrometheusInstantToDataResp(result, param.Ref), nil\n}\n\n// queryDataRange 看图场景,调用 /select/logsql/stats_query_range\nfunc (vl *VictoriaLogs) queryDataRange(ctx context.Context, param *Query) ([]models.DataResp, error) {\n\tstep := param.Step\n\tif step == \"\" {\n\t\t// 根据时间范围计算合适的步长\n\t\tduration := param.End - param.Start\n\t\tif duration <= 3600 {\n\t\t\tstep = \"1m\" // 1 小时内,1 分钟步长\n\t\t} else if duration <= 86400 {\n\t\t\tstep = \"5m\" // 1 天内,5 分钟步长\n\t\t} else {\n\t\t\tstep = \"1h\" // 超过 1 天,1 小时步长\n\t\t}\n\t}\n\n\tresult, err := vl.StatsQueryRange(ctx, param.Query, param.Start, param.End, step)\n\tif err != nil {\n\t\treturn nil, err\n\t}\n\n\treturn convertPrometheusRangeToDataResp(result, param.Ref), nil\n}\n\n// convertPrometheusInstantToDataResp 将 Prometheus Instant Query 格式转换为 DataResp\nfunc convertPrometheusInstantToDataResp(resp *victorialogs.PrometheusResponse, ref string) []models.DataResp {\n\tvar dataResps []models.DataResp\n\n\tfor _, item := range resp.Data.Result {\n\t\tdataResp := models.DataResp{\n\t\t\tRef: ref,\n\t\t}\n\n\t\t// 转换 Metric\n\t\tdataResp.Metric = make(model.Metric)\n\t\tfor k, v := range item.Metric {\n\t\t\tdataResp.Metric[model.LabelName(k)] = model.LabelValue(v)\n\t\t}\n\n\t\tif len(item.Value) == 2 {\n\t\t\t// [timestamp, value]\n\t\t\ttimestamp := item.Value[0].(float64)\n\t\t\tvalue, _ := strconv.ParseFloat(item.Value[1].(string), 64)\n\n\t\t\tdataResp.Values = [][]float64{\n\t\t\t\t{timestamp, value},\n\t\t\t}\n\t\t}\n\n\t\tdataResps = append(dataResps, dataResp)\n\t}\n\n\treturn dataResps\n}\n\n// convertPrometheusRangeToDataResp 将 Prometheus Range Query 格式转换为 DataResp\nfunc convertPrometheusRangeToDataResp(resp *victorialogs.PrometheusResponse, ref string) []models.DataResp {\n\tvar dataResps []models.DataResp\n\n\tfor _, item := range resp.Data.Result {\n\t\tdataResp := models.DataResp{\n\t\t\tRef: ref,\n\t\t}\n\n\t\t// 转换 Metric\n\t\tdataResp.Metric = make(model.Metric)\n\t\tfor k, v := range item.Metric {\n\t\t\tdataResp.Metric[model.LabelName(k)] = model.LabelValue(v)\n\t\t}\n\n\t\tvar values [][]float64\n\t\tfor _, v := range item.Values {\n\t\t\tif len(v) == 2 {\n\t\t\t\ttimestamp := v[0].(float64)\n\t\t\t\tvalue, _ := strconv.ParseFloat(v[1].(string), 64)\n\n\t\t\t\tvalues = append(values, []float64{timestamp, value})\n\t\t\t}\n\t\t}\n\n\t\tdataResp.Values = values\n\t\tdataResps = append(dataResps, dataResp)\n\t}\n\n\treturn dataResps\n}\n\n// MakeLogQuery 构造日志查询参数\nfunc (vl *VictoriaLogs) MakeLogQuery(ctx context.Context, query interface{}, eventTags []string, start, end int64) (interface{}, error) {\n\tq := &Query{\n\t\tStart: start,\n\t\tEnd: end,\n\t\tLimit: 1000,\n\t}\n\n\t// 如果 query 是字符串,直接使用\n\tif queryStr, ok := query.(string); ok {\n\t\tq.Query = queryStr\n\t} else if queryMap, ok := query.(map[string]interface{}); ok {\n\t\t// 如果是 map,尝试提取 query 字段\n\t\tif qStr, exists := queryMap[\"query\"]; exists {\n\t\t\tq.Query = fmt.Sprintf(\"%v\", qStr)\n\t\t}\n\t\tif limit, exists := queryMap[\"limit\"]; exists {\n\t\t\tif limitInt, ok := limit.(int); ok {\n\t\t\t\tq.Limit = limitInt\n\t\t\t} else if limitFloat, ok := limit.(float64); ok {\n\t\t\t\tq.Limit = int(limitFloat)\n\t\t\t}\n\t\t}\n\t}\n\n\treturn q, nil\n}\n\n// MakeTSQuery 构造时序查询参数\nfunc (vl *VictoriaLogs) MakeTSQuery(ctx context.Context, query interface{}, eventTags []string, start, end int64) (interface{}, error) {\n\tq := &Query{\n\t\tStart: start,\n\t\tEnd: end,\n\t}\n\n\t// 如果 query 是字符串,直接使用\n\tif queryStr, ok := query.(string); ok {\n\t\tq.Query = queryStr\n\t} else if queryMap, ok := query.(map[string]interface{}); ok {\n\t\t// 如果是 map,提取相关字段\n\t\tif qStr, exists := queryMap[\"query\"]; exists {\n\t\t\tq.Query = fmt.Sprintf(\"%v\", qStr)\n\t\t}\n\t\tif step, exists := queryMap[\"step\"]; exists {\n\t\t\tq.Step = fmt.Sprintf(\"%v\", step)\n\t\t}\n\t}\n\n\treturn q, nil\n}\n\n// QueryMapData 用于告警事件生成时获取额外数据\nfunc (vl *VictoriaLogs) QueryMapData(ctx context.Context, query interface{}) ([]map[string]string, error) {\n\tparam := new(Query)\n\tif err := mapstructure.Decode(query, param); err != nil {\n\t\treturn nil, err\n\t}\n\n\t// 扩大查询范围,解决时间滞后问题\n\tif param.End > 0 && param.Start > 0 {\n\t\tparam.Start = param.Start - 30\n\t}\n\n\t// 限制只取 1 条\n\tparam.Limit = 1\n\n\tlogs, _, err := vl.QueryLog(ctx, param)\n\tif err != nil {\n\t\treturn nil, err\n\t}\n\n\tvar result []map[string]string\n\tfor _, log := range logs {\n\t\tif logMap, ok := log.(map[string]interface{}); ok {\n\t\t\tstrMap := make(map[string]string)\n\t\t\tfor k, v := range logMap {\n\t\t\t\tstrMap[k] = fmt.Sprintf(\"%v\", v)\n\t\t\t}\n\t\t\tresult = append(result, strMap)\n\t\t\tbreak // 只取第一条\n\t\t}\n\t}\n\n\treturn result, nil\n}\n"
},
{
"path": "doc/README.bak.md",
"content": "\n \n \n
\n\n\n\n \n\n \n\n \n\n \n
\n\n All-in-one 的开源观测平台 开箱即用 ,集数据采集、可视化、监控告警于一体 Prometheus + AlertManager + Grafana + ELK + Jaeger 组合方案到夜莺!\n
\n\n[English](./README_en.md) | [中文](./README.md)\n\n\n\n## 功能和特点\n\n- **开箱即用**\n - 支持 Docker、Helm Chart、云服务等多种部署方式,集数据采集、监控告警、可视化为一体,内置多种监控仪表盘、快捷视图、告警规则模板,导入即可快速使用,**大幅降低云原生监控系统的建设成本、学习成本、使用成本**;\n- **专业告警**\n - 可视化的告警配置和管理,支持丰富的告警规则,提供屏蔽规则、订阅规则的配置能力,支持告警多种送达渠道,支持告警自愈、告警事件管理等;\n - **推荐您使用夜莺的同时,无缝搭配[FlashDuty](https://flashcat.cloud/product/flashcat-duty/),实现告警聚合收敛、认领、升级、排班、协同,让告警的触达既高效,又确保告警处理不遗漏、做到件件有回响**。\n- **云原生**\n - 以交钥匙的方式快速构建企业级的云原生监控体系,支持 [Categraf](https://github.com/flashcatcloud/categraf)、Telegraf、Grafana-agent 等多种采集器,支持 Prometheus、VictoriaMetrics、M3DB、ElasticSearch、Jaeger 等多种数据源,兼容支持导入 Grafana 仪表盘,**与云原生生态无缝集成**;\n- **高性能 高可用**\n - 得益于夜莺的多数据源管理引擎,和夜莺引擎侧优秀的架构设计,借助于高性能时序库,可以满足数亿时间线的采集、存储、告警分析场景,节省大量成本;\n - 夜莺监控组件均可水平扩展,无单点,已在上千家企业部署落地,经受了严苛的生产实践检验。众多互联网头部公司,夜莺集群机器达百台,处理数亿级时间线,重度使用夜莺监控;\n- **灵活扩展 中心化管理**\n - 夜莺监控,可部署在 1 核 1G 的云主机,可在上百台机器集群化部署,可运行在 K8s 中;也可将时序库、告警引擎等组件下沉到各机房、各 Region,兼顾边缘部署和中心化统一管理,**解决数据割裂,缺乏统一视图的难题**;\n- **开放社区**\n - 托管于[中国计算机学会开源发展委员会](https://www.ccf.org.cn/kyfzwyh/),有[快猫星云](https://flashcat.cloud)和众多公司的持续投入,和数千名社区用户的积极参与,以及夜莺监控项目清晰明确的定位,都保证了夜莺开源社区健康、长久的发展。活跃、专业的社区用户也在持续迭代和沉淀更多的最佳实践于产品中;\n\n## 使用场景\n1. **如果您希望在一个平台中,统一管理和查看 Metrics、Logging、Tracing 数据,推荐你使用夜莺**:\n - 请参考阅读:[不止于监控,夜莺 V6 全新升级为开源观测平台](http://flashcat.cloud/blog/nightingale-v6-release/)\n2. **如果您在使用 Prometheus 过程中,有以下的一个或者多个需求场景,推荐您无缝升级到夜莺**:\n - Prometheus、Alertmanager、Grafana 等多个系统较为割裂,缺乏统一视图,无法开箱即用;\n - 通过修改配置文件来管理 Prometheus、Alertmanager 的方式,学习曲线大,协同有难度;\n - 数据量过大而无法扩展您的 Prometheus 集群;\n - 生产环境运行多套 Prometheus 集群,面临管理和使用成本高的问题;\n3. **如果您在使用 Zabbix,有以下的场景,推荐您升级到夜莺**:\n - 监控的数据量太大,希望有更好的扩展解决方案;\n - 学习曲线高,多人多团队模式下,希望有更好的协同使用效率;\n - 微服务和云原生架构下,监控数据的生命周期多变、监控数据维度基数高,Zabbix 数据模型不易适配;\n - 了解更多Zabbix和夜莺监控的对比,推荐您进一步阅读[Zabbix 和夜莺监控选型对比](https://flashcat.cloud/blog/zabbx-vs-nightingale/)\n4. **如果您在使用 [Open-Falcon](https://github.com/open-falcon/falcon-plus),我们推荐您升级到夜莺:**\n - 关于 Open-Falcon 和夜莺的详细介绍,请参考阅读:[云原生监控的十个特点和趋势](http://flashcat.cloud/blog/10-trends-of-cloudnative-monitoring/)\n - 监控系统和可观测平台的区别,请参考阅读:[从监控系统到可观测平台,Gap有多大\n](https://flashcat.cloud/blog/gap-of-monitoring-to-o11y/)\n5. **我们推荐您使用 [Categraf](https://github.com/flashcatcloud/categraf) 作为首选的监控数据采集器**:\n - [Categraf](https://github.com/flashcatcloud/categraf) 是夜莺监控的默认采集器,采用开放插件机制和 All-in-one 的设计理念,同时支持 metric、log、trace、event 的采集。Categraf 不仅可以采集 CPU、内存、网络等系统层面的指标,也集成了众多开源组件的采集能力,支持K8s生态。Categraf 内置了对应的仪表盘和告警规则,开箱即用。\n\n## 文档\n\n[English Doc](https://n9e.github.io/) | [中文文档](https://flashcat.cloud/docs/)\n\n## 产品示意图\n\nhttps://user-images.githubusercontent.com/792850/216888712-2565fcea-9df5-47bd-a49e-d60af9bd76e8.mp4\n\n## 夜莺架构\n\n夜莺监控可以接收各种采集器上报的监控数据(比如 [Categraf](https://github.com/flashcatcloud/categraf)、telegraf、grafana-agent、Prometheus),并写入多种流行的时序数据库中(可以支持Prometheus、M3DB、VictoriaMetrics、Thanos、TDEngine等),提供告警规则、屏蔽规则、订阅规则的配置能力,提供监控数据的查看能力,提供告警自愈机制(告警触发之后自动回调某个webhook地址或者执行某个脚本),提供历史告警事件的存储管理、分组查看的能力。\n\n### 中心汇聚式部署方案\n\n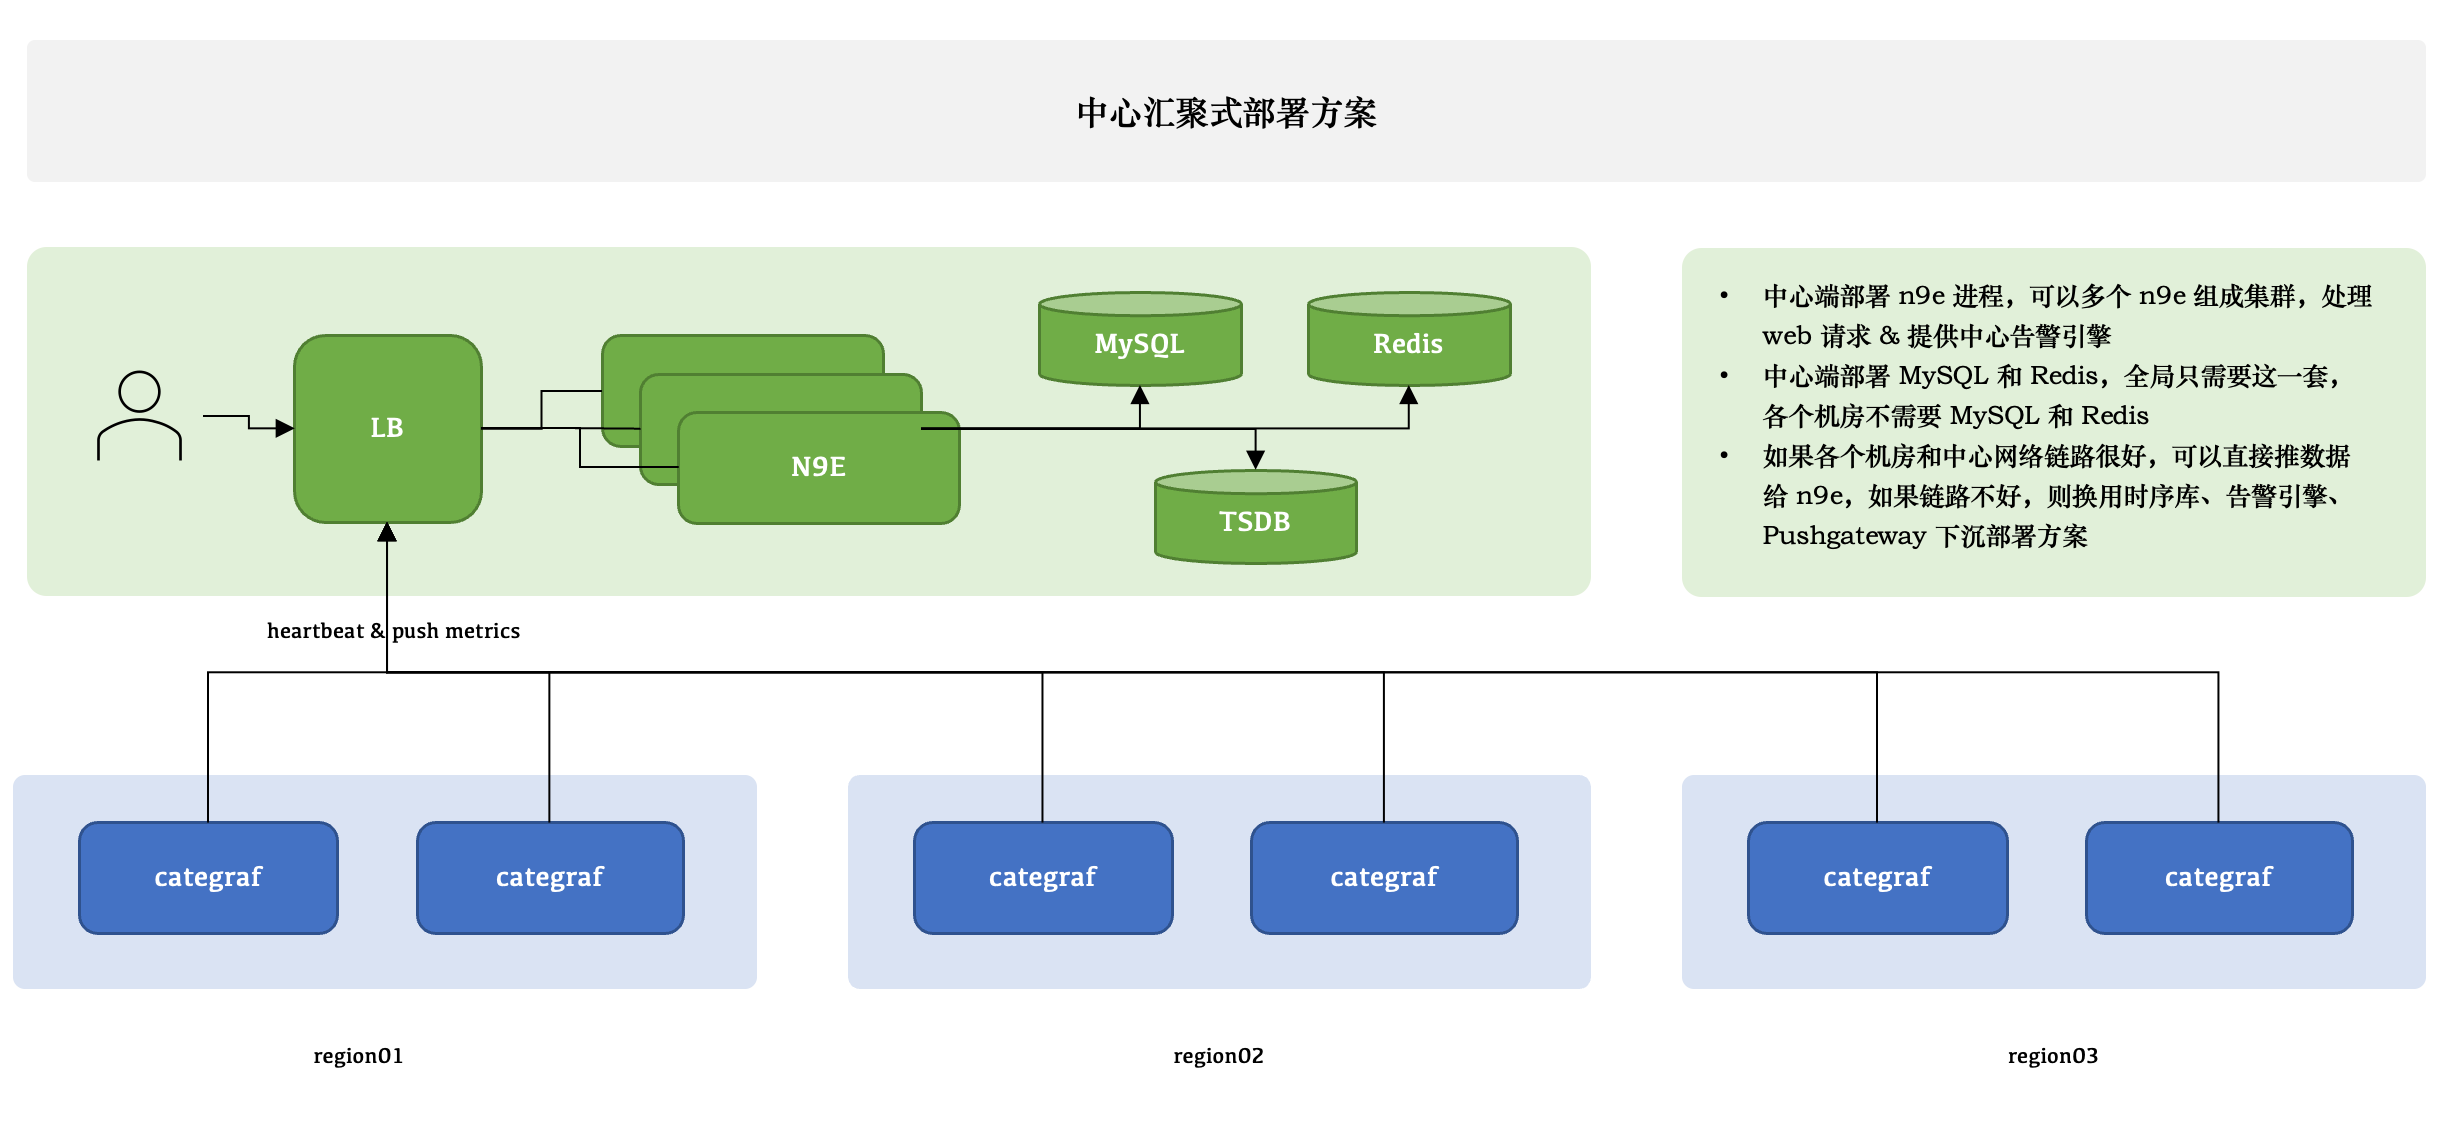\n\n夜莺只有一个模块,就是 n9e,可以部署多个 n9e 实例组成集群,n9e 依赖 2 个存储,数据库、Redis,数据库可以使用 MySQL 或 Postgres,自己按需选用。\n\nn9e 提供的是 HTTP 接口,前面负载均衡可以是 4 层的,也可以是 7 层的。一般就选用 Nginx 就可以了。\n\nn9e 这个模块接收到数据之后,需要转发给后端的时序库,相关配置是:\n\n```toml\n[Pushgw]\nLabelRewrite = true\n[[Pushgw.Writers]] \nUrl = \"http://127.0.0.1:9090/api/v1/write\"\n```\n\n> 注意:虽然数据源可以在页面配置了,但是上报转发链路,还是需要在配置文件指定。\n\n所有机房的 agent( 比如 Categraf、Telegraf、 Grafana-agent、Datadog-agent ),都直接推数据给 n9e,这个架构最为简单,维护成本最低。当然,前提是要求机房之间网络链路比较好,一般有专线。如果网络链路不好,则要使用下面的部署方式了。\n\n### 边缘下沉式混杂部署方案\n\n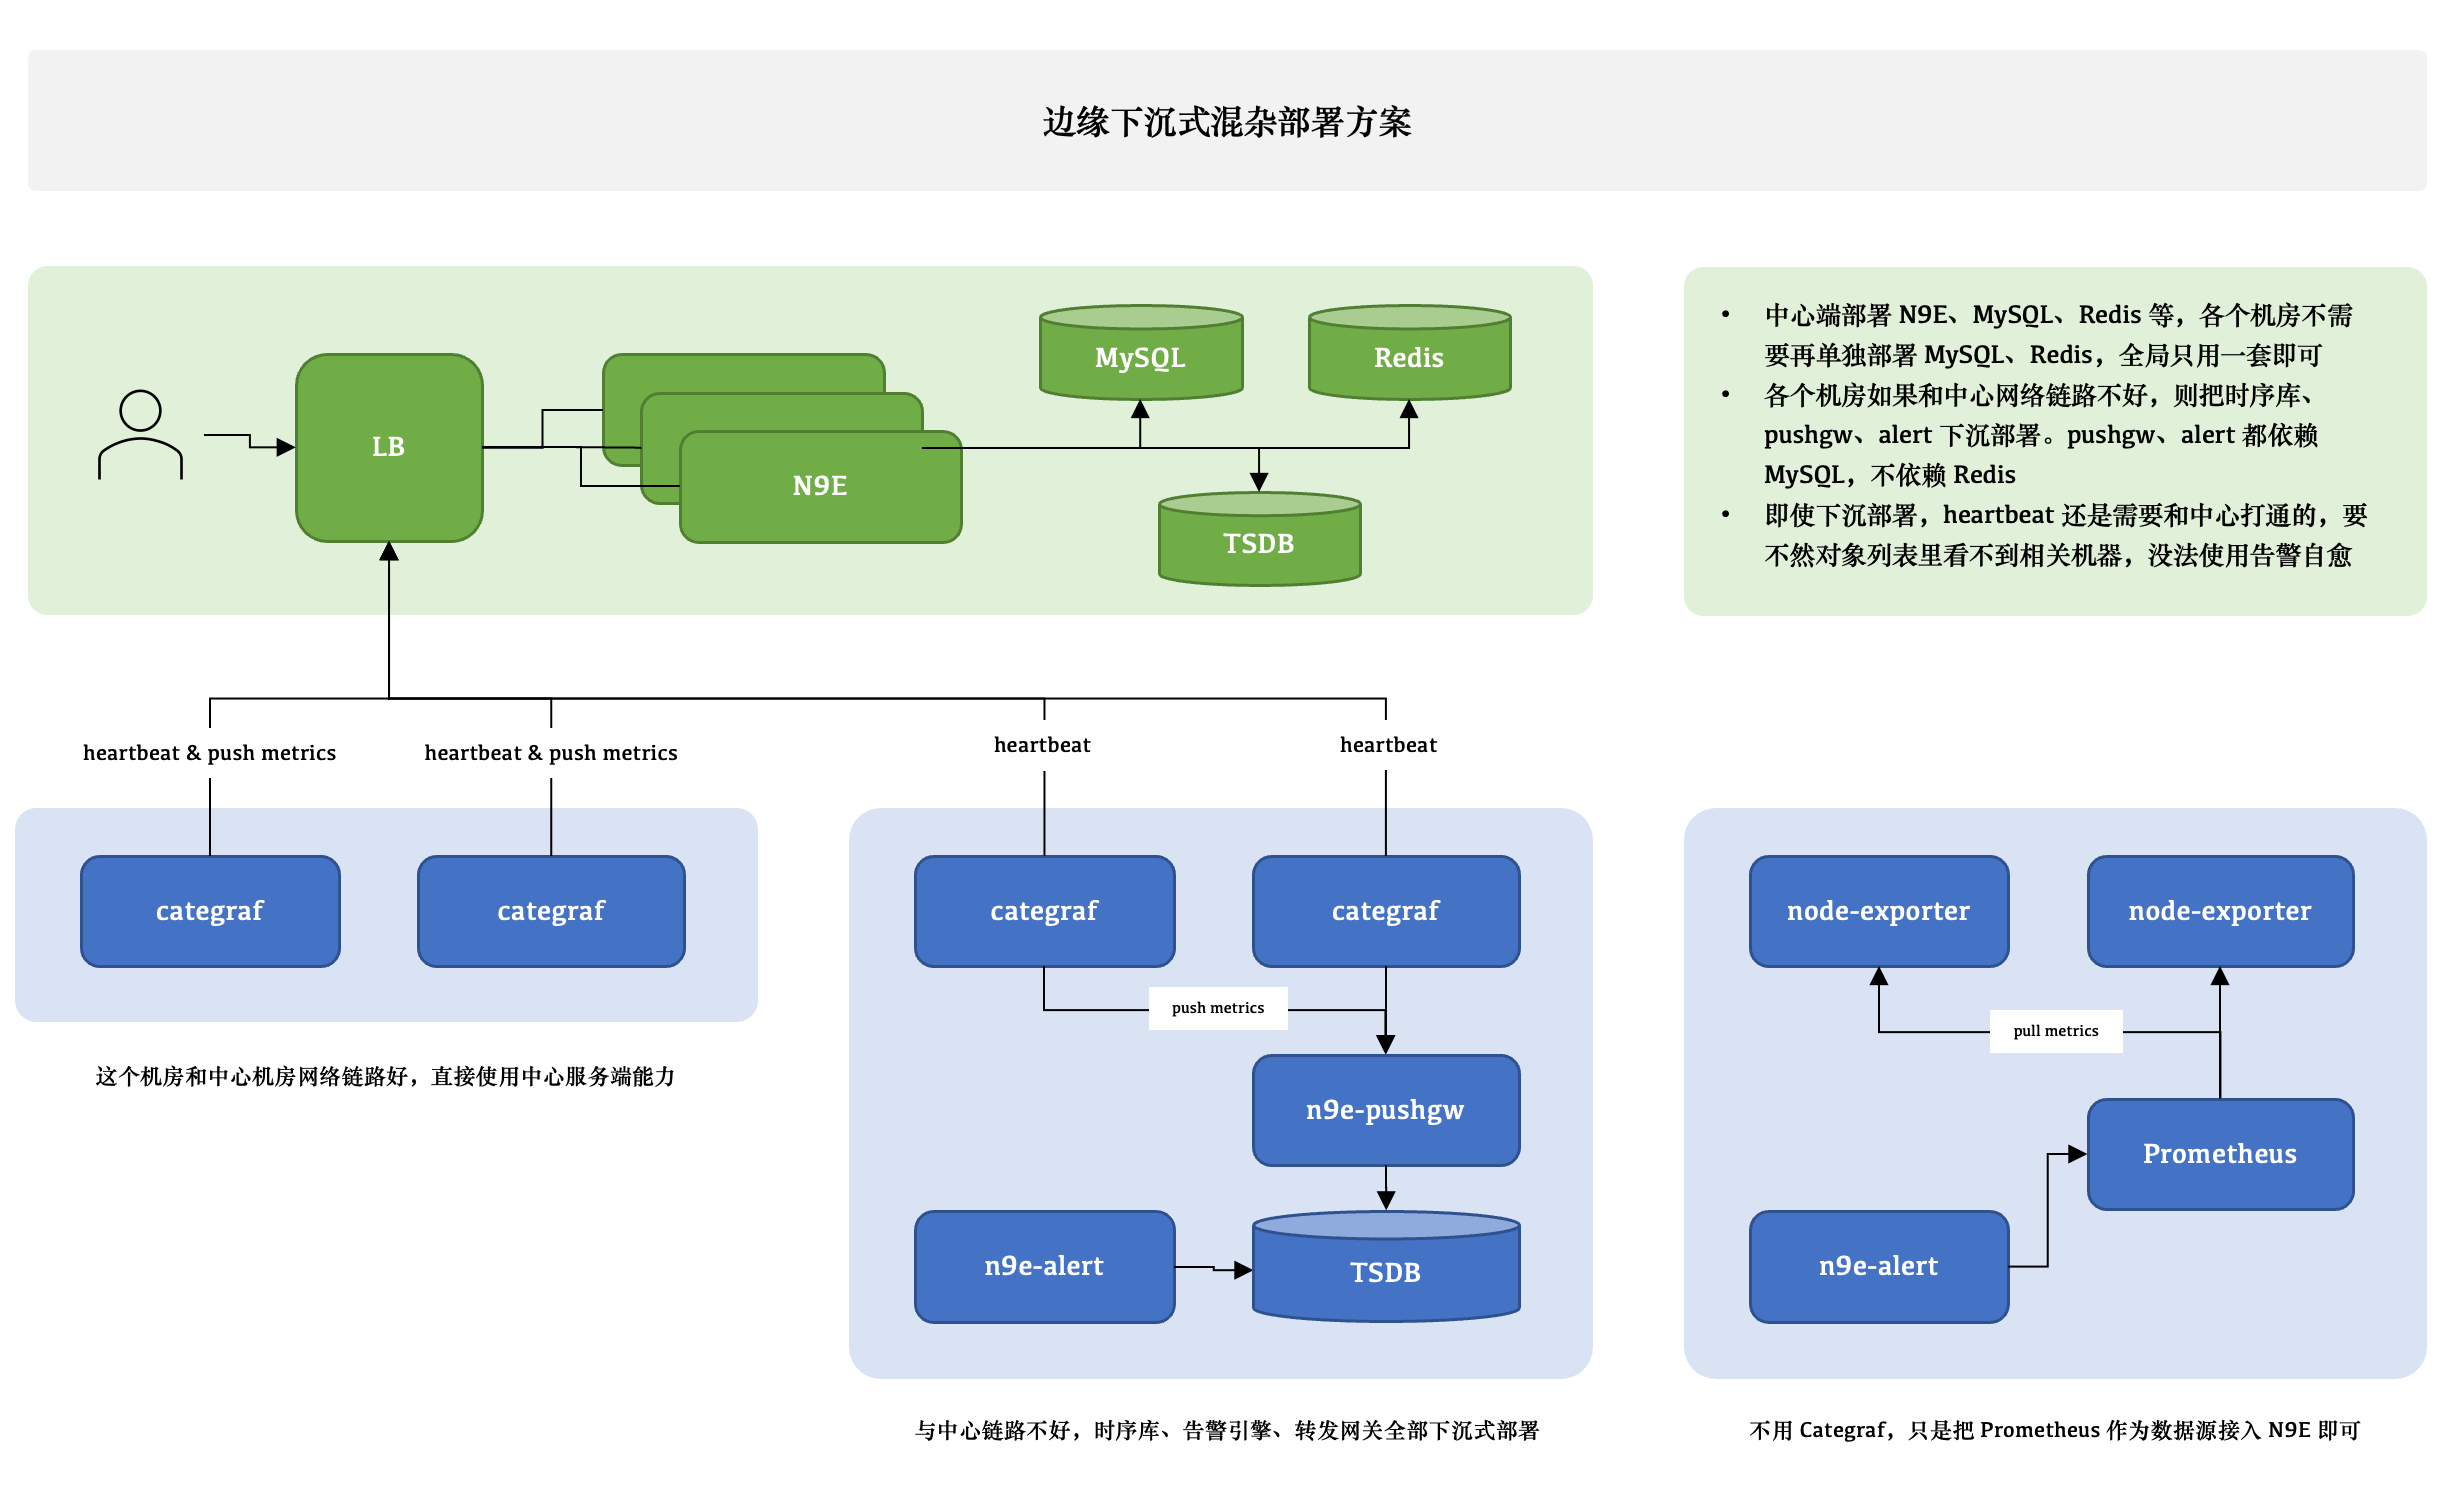\n\n这个图尝试解释 3 种不同的情形,比如 A 机房和中心网络链路很好,Categraf 可以直接汇报数据给中心 n9e 模块,另一个机房网络链路不好,就需要把时序库下沉部署,时序库下沉了,对应的告警引擎和转发网关也都要跟随下沉,这样数据不会跨机房传输,比较稳定。但是心跳还是需要往中心心跳,要不然在对象列表里看不到机器的 CPU、内存使用率。还有的时候,可能是接入的一个已有的 Prometheus,数据采集没有走 Categraf,那此时只需要把 Prometheus 作为数据源接入夜莺即可,可以在夜莺里看图、配告警规则,但是就是在对象列表里看不到,也不能使用告警自愈的功能,问题也不大,核心功能都不受影响。\n\n边缘机房,下沉部署时序库、告警引擎、转发网关的时候,要注意,告警引擎需要依赖数据库,因为要同步告警规则,转发网关也要依赖数据库,因为要注册对象到数据库里去,需要打通相关网络,告警引擎和转发网关都不用Redis,所以无需为 Redis 打通网络。 \n\n### VictoriaMetrics 集群架构\n\n \n\n## License\n[Apache License V2.0](https://github.com/ccfos/nightingale/blob/main/LICENSE)\n\n## 加入交流群\n\n\n \n"
},
{
"path": "doc/end-users.md",
"content": "## End Users\n\n- [中移动](https://github.com/ccfos/nightingale/issues/897#issuecomment-1086573166)\n- [inke](https://github.com/ccfos/nightingale/issues/897#issuecomment-1099840636)\n- [方正证券](https://github.com/ccfos/nightingale/issues/897#issuecomment-1110492461)\n"
},
{
"path": "doc/pmc.md",
"content": "### PMC Chair\n- [laiwei](https://github.com/laiwei)\n\n### PMC Co-Chair\n- [UlricQin](https://github.com/UlricQin)\n\n### PMC Member\n"
},
{
"path": "doc/server-dash.json",
"content": "{\n \"name\": \"夜莺大盘\",\n \"tags\": \"\",\n \"configs\": {\n \"var\": [],\n \"panels\": [\n {\n \"targets\": [\n {\n \"refId\": \"A\",\n \"expr\": \"rate(n9e_server_samples_received_total[1m])\"\n }\n ],\n \"name\": \"每秒接收的数据点个数\",\n \"options\": {\n \"tooltip\": {\n \"mode\": \"all\",\n \"sort\": \"none\"\n },\n \"legend\": {\n \"displayMode\": \"hidden\"\n },\n \"standardOptions\": {},\n \"thresholds\": {}\n },\n \"custom\": {\n \"drawStyle\": \"lines\",\n \"lineInterpolation\": \"smooth\",\n \"fillOpacity\": 0.5,\n \"stack\": \"off\"\n },\n \"version\": \"2.0.0\",\n \"type\": \"timeseries\",\n \"layout\": {\n \"h\": 4,\n \"w\": 12,\n \"x\": 0,\n \"y\": 0,\n \"i\": \"53fcb9dc-23f9-41e0-bc5e-121eed14c3a4\",\n \"isResizable\": true\n },\n \"id\": \"53fcb9dc-23f9-41e0-bc5e-121eed14c3a4\"\n },\n {\n \"targets\": [\n {\n \"refId\": \"A\",\n \"expr\": \"rate(n9e_server_alerts_total[10m])\"\n }\n ],\n \"name\": \"每秒产生的告警事件个数\",\n \"options\": {\n \"tooltip\": {\n \"mode\": \"all\",\n \"sort\": \"none\"\n },\n \"legend\": {\n \"displayMode\": \"hidden\"\n },\n \"standardOptions\": {},\n \"thresholds\": {}\n },\n \"custom\": {\n \"drawStyle\": \"lines\",\n \"lineInterpolation\": \"smooth\",\n \"fillOpacity\": 0.5,\n \"stack\": \"off\"\n },\n \"version\": \"2.0.0\",\n \"type\": \"timeseries\",\n \"layout\": {\n \"h\": 4,\n \"w\": 12,\n \"x\": 12,\n \"y\": 0,\n \"i\": \"47fc6252-9cc8-4b53-8e27-0c5c59a47269\",\n \"isResizable\": true\n },\n \"id\": \"f70dcb8b-b58b-4ef9-9e48-f230d9e17140\"\n },\n {\n \"targets\": [\n {\n \"refId\": \"A\",\n \"expr\": \"n9e_server_alert_queue_size\"\n }\n ],\n \"name\": \"告警事件内存队列长度\",\n \"options\": {\n \"tooltip\": {\n \"mode\": \"all\",\n \"sort\": \"none\"\n },\n \"legend\": {\n \"displayMode\": \"hidden\"\n },\n \"standardOptions\": {},\n \"thresholds\": {}\n },\n \"custom\": {\n \"drawStyle\": \"lines\",\n \"lineInterpolation\": \"smooth\",\n \"fillOpacity\": 0.5,\n \"stack\": \"off\"\n },\n \"version\": \"2.0.0\",\n \"type\": \"timeseries\",\n \"layout\": {\n \"h\": 4,\n \"w\": 12,\n \"x\": 0,\n \"y\": 4,\n \"i\": \"ad1af16c-de0c-45f4-8875-cea4e85d51d0\",\n \"isResizable\": true\n },\n \"id\": \"caf23e58-d907-42b0-9ed6-722c8c6f3c5f\"\n },\n {\n \"targets\": [\n {\n \"refId\": \"A\",\n \"expr\": \"n9e_server_http_request_duration_seconds_sum/n9e_server_http_request_duration_seconds_count\"\n }\n ],\n \"name\": \"数据接收接口平均响应时间(单位:秒)\",\n \"options\": {\n \"tooltip\": {\n \"mode\": \"all\",\n \"sort\": \"desc\"\n },\n \"legend\": {\n \"displayMode\": \"hidden\"\n },\n \"standardOptions\": {},\n \"thresholds\": {}\n },\n \"custom\": {\n \"drawStyle\": \"lines\",\n \"lineInterpolation\": \"smooth\",\n \"fillOpacity\": 0.5,\n \"stack\": \"normal\"\n },\n \"version\": \"2.0.0\",\n \"type\": \"timeseries\",\n \"layout\": {\n \"h\": 4,\n \"w\": 12,\n \"x\": 12,\n \"y\": 4,\n \"i\": \"64c3abc2-404c-4462-a82f-c109a21dac91\",\n \"isResizable\": true\n },\n \"id\": \"6b8d2db1-efca-4b9e-b429-57a9d2272bc5\"\n },\n {\n \"targets\": [\n {\n \"refId\": \"A\",\n \"expr\": \"n9e_server_sample_queue_size\"\n }\n ],\n \"name\": \"内存数据队列长度\",\n \"options\": {\n \"tooltip\": {\n \"mode\": \"all\",\n \"sort\": \"desc\"\n },\n \"legend\": {\n \"displayMode\": \"hidden\"\n },\n \"standardOptions\": {},\n \"thresholds\": {}\n },\n \"custom\": {\n \"drawStyle\": \"lines\",\n \"lineInterpolation\": \"smooth\",\n \"fillOpacity\": 0.5,\n \"stack\": \"off\"\n },\n \"version\": \"2.0.0\",\n \"type\": \"timeseries\",\n \"layout\": {\n \"h\": 4,\n \"w\": 12,\n \"x\": 0,\n \"y\": 8,\n \"i\": \"1c7da942-58c2-40dc-b42f-983e4a35b89b\",\n \"isResizable\": true\n },\n \"id\": \"bd41677d-40d3-482e-bb6e-fbd25df46d87\"\n },\n {\n \"targets\": [\n {\n \"refId\": \"A\",\n \"expr\": \"avg(n9e_server_forward_duration_seconds_sum/n9e_server_forward_duration_seconds_count)\"\n }\n ],\n \"name\": \"数据发往TSDB平均耗时(单位:秒)\",\n \"options\": {\n \"tooltip\": {\n \"mode\": \"all\",\n \"sort\": \"desc\"\n },\n \"legend\": {\n \"displayMode\": \"hidden\"\n },\n \"standardOptions\": {\n \"decimals\": 8\n },\n \"thresholds\": {}\n },\n \"custom\": {\n \"drawStyle\": \"lines\",\n \"lineInterpolation\": \"smooth\",\n \"fillOpacity\": 0.5,\n \"stack\": \"normal\"\n },\n \"version\": \"2.0.0\",\n \"type\": \"timeseries\",\n \"layout\": {\n \"h\": 4,\n \"w\": 12,\n \"x\": 12,\n \"y\": 8,\n \"i\": \"eed94a0b-954f-48ac-82e5-a2eada1c8a3d\",\n \"isResizable\": true\n },\n \"id\": \"c8642e72-f384-46a5-8410-1e6be2953c3c\"\n }\n ],\n \"version\": \"2.0.0\"\n }\n}"
},
{
"path": "docker/.dockerignore",
"content": "compose-host-network\ncompose-postgres\ncompose-bridge\ninitsql\nbuild.sh\n"
},
{
"path": "docker/Dockerfile.goreleaser",
"content": "FROM --platform=$TARGETPLATFORM python:3-slim\n\n\nWORKDIR /app\nADD n9e /app/\nADD etc /app/etc/\nADD integrations /app/integrations/\nRUN pip install requests Jinja2\n\nEXPOSE 17000\n\nCMD [\"/app/n9e\", \"-h\"]\n"
},
{
"path": "docker/Dockerfile.goreleaser.arm64",
"content": "FROM --platform=$TARGETPLATFORM python:3-slim\n\n\nWORKDIR /app\nADD n9e /app/\nADD etc /app/etc/\nADD integrations /app/integrations/\n\nEXPOSE 17000\n\nCMD [\"/app/n9e\", \"-h\"]\n"
},
{
"path": "docker/build.sh",
"content": "#!/bin/sh\nif [ $# -ne 1 ]; then\n\techo \"$0 \"\n\texit 0\nfi\n\ntag=$1\n\necho \"tag: ${tag}\"\n\nrm -rf n9e pub\ncp ../n9e .\n\ndocker build -t nightingale:${tag} .\n\ndocker tag nightingale:${tag} ulric2019/nightingale:${tag}\ndocker push ulric2019/nightingale:${tag}\n\nrm -rf n9e pub\n"
},
{
"path": "docker/compose-bridge/docker-compose.yaml",
"content": "networks:\n nightingale:\n driver: bridge\n\nservices:\n mysql:\n image: \"mysql:8\"\n container_name: mysql\n hostname: mysql\n restart: always\n environment:\n TZ: Asia/Shanghai\n MYSQL_ROOT_PASSWORD: 1234\n volumes:\n - ./mysqldata:/var/lib/mysql/\n - ../initsql:/docker-entrypoint-initdb.d/\n - ./etc-mysql/my.cnf:/etc/my.cnf\n networks:\n - nightingale\n ports:\n - \"3306:3306\"\n\n redis:\n image: \"redis:6.2\"\n container_name: redis\n hostname: redis\n restart: always\n environment:\n TZ: Asia/Shanghai\n networks:\n - nightingale\n ports:\n - \"6379:6379\"\n\n # prometheus:\n # image: prom/prometheus\n # container_name: prometheus\n # hostname: prometheus\n # restart: always\n # environment:\n # TZ: Asia/Shanghai\n # volumes:\n # - ./etc-prometheus:/etc/prometheus\n # command:\n # - \"--config.file=/etc/prometheus/prometheus.yml\"\n # - \"--storage.tsdb.path=/prometheus\"\n # - \"--web.console.libraries=/usr/share/prometheus/console_libraries\"\n # - \"--web.console.templates=/usr/share/prometheus/consoles\"\n # - \"--enable-feature=remote-write-receiver\"\n # - \"--query.lookback-delta=2m\"\n # networks:\n # - nightingale\n # ports:\n # - \"9090:9090\"\n\n victoriametrics:\n image: victoriametrics/victoria-metrics:v1.79.12\n container_name: victoriametrics\n hostname: victoriametrics\n restart: always\n environment:\n TZ: Asia/Shanghai\n ports:\n - \"8428:8428\"\n networks:\n - nightingale\n command:\n - \"--loggerTimezone=Asia/Shanghai\"\n\n nightingale:\n image: flashcatcloud/nightingale:latest\n container_name: nightingale\n hostname: nightingale\n restart: always\n environment:\n GIN_MODE: release\n TZ: Asia/Shanghai\n WAIT_HOSTS: mysql:3306, redis:6379\n volumes:\n - ./etc-nightingale:/app/etc\n networks:\n - nightingale\n ports:\n - \"17000:17000\"\n - \"20090:20090\"\n depends_on:\n - mysql\n - redis\n - victoriametrics\n command:\n - /app/n9e\n\n categraf:\n image: \"flashcatcloud/categraf:latest\"\n container_name: \"categraf\"\n hostname: \"categraf01\"\n restart: always\n environment:\n TZ: Asia/Shanghai\n HOST_PROC: /hostfs/proc\n HOST_SYS: /hostfs/sys\n HOST_MOUNT_PREFIX: /hostfs\n WAIT_HOSTS: nightingale:17000, nightingale:20090\n volumes:\n - ./etc-categraf:/etc/categraf/conf\n - /:/hostfs\n networks:\n - nightingale\n depends_on:\n - nightingale\n"
},
{
"path": "docker/compose-bridge/etc-categraf/config.toml",
"content": "[global]\n# whether print configs\nprint_configs = false\n\n# add label(agent_hostname) to series\n# \"\" -> auto detect hostname\n# \"xx\" -> use specified string xx\n# \"$hostname\" -> auto detect hostname\n# \"$ip\" -> auto detect ip\n# \"$hostname-$ip\" -> auto detect hostname and ip to replace the vars\nhostname = \"$HOSTNAME\"\n\n# will not add label(agent_hostname) if true\nomit_hostname = false\n\n# s | ms\nprecision = \"ms\"\n\n# global collect interval\ninterval = 15\n\n# [global.labels]\n# source=\"categraf\"\n# region = \"shanghai\"\n# env = \"localhost\"\n\n[writer_opt]\n# default: 2000\nbatch = 2000\n# channel(as queue) size\nchan_size = 10000\n\n[[writers]]\nurl = \"http://nightingale:17000/prometheus/v1/write\"\n\n# Basic auth username\nbasic_auth_user = \"\"\n\n# Basic auth password\nbasic_auth_pass = \"\"\n\n# timeout settings, unit: ms\ntimeout = 5000\ndial_timeout = 2500\nmax_idle_conns_per_host = 100\n\n[http]\nenable = false\naddress = \":9100\"\nprint_access = false\nrun_mode = \"release\"\n\n[heartbeat]\nenable = true\n\n# report os version cpu.util mem.util metadata\nurl = \"http://nightingale:17000/v1/n9e/heartbeat\"\n\n# interval, unit: s\ninterval = 10\n\n# Basic auth username\nbasic_auth_user = \"\"\n\n# Basic auth password\nbasic_auth_pass = \"\"\n\n## Optional headers\n# headers = [\"X-From\", \"categraf\", \"X-Xyz\", \"abc\"]\n\n# timeout settings, unit: ms\ntimeout = 5000\ndial_timeout = 2500\nmax_idle_conns_per_host = 100\n\n[ibex]\nenable = true\n## ibex flush interval\ninterval = \"1000ms\"\n## n9e ibex server rpc address\nservers = [\"nightingale:20090\"]\n## temp script dir\nmeta_dir = \"./meta\"\n"
},
{
"path": "docker/compose-bridge/etc-categraf/input.cpu/cpu.toml",
"content": "# # collect interval\n# interval = 15\n\n# # whether collect per cpu\n# collect_per_cpu = false\n"
},
{
"path": "docker/compose-bridge/etc-categraf/input.disk/disk.toml",
"content": "# # collect interval\n# interval = 15\n\n# # By default stats will be gathered for all mount points.\n# # Set mount_points will restrict the stats to only the specified mount points.\nmount_points = [\"/\"]\n\n# Ignore mount points by filesystem type.\nignore_fs = [\"tmpfs\", \"devtmpfs\", \"devfs\", \"iso9660\", \"overlay\", \"aufs\", \"squashfs\", \"nsfs\"]\n\n"
},
{
"path": "docker/compose-bridge/etc-categraf/input.diskio/diskio.toml",
"content": "# # collect interval\n# interval = 15\n\n# # By default, categraf will gather stats for all devices including disk partitions.\n# # Setting devices will restrict the stats to the specified devices.\n# devices = [\"sda\", \"sdb\", \"vd*\"]"
},
{
"path": "docker/compose-bridge/etc-categraf/input.kernel/kernel.toml",
"content": "# # collect interval\n# interval = 15\n"
},
{
"path": "docker/compose-bridge/etc-categraf/input.mem/mem.toml",
"content": "# # collect interval\n# interval = 15\n\n# # whether collect platform specified metrics\ncollect_platform_fields = true\n"
},
{
"path": "docker/compose-bridge/etc-categraf/input.mysql/mysql.toml",
"content": "[[instances]]\naddress = \"mysql:3306\"\nusername = \"root\"\npassword = \"1234\"\n\n# # set tls=custom to enable tls\n# parameters = \"tls=false\"\n\n# extra_status_metrics = true\n# extra_innodb_metrics = false\n# gather_processlist_processes_by_state = false\n# gather_processlist_processes_by_user = false\n# gather_schema_size = true\n# gather_table_size = false\n# gather_system_table_size = false\n# gather_slave_status = true\n\n# # timeout\n# timeout_seconds = 3\n\n# # interval = global.interval * interval_times\n# interval_times = 1\n\n# important! use global unique string to specify instance\nlabels = { instance=\"docker-compose-mysql\" }\n\n## Optional TLS Config\n# use_tls = false\n# tls_min_version = \"1.2\"\n# tls_ca = \"/etc/categraf/ca.pem\"\n# tls_cert = \"/etc/categraf/cert.pem\"\n# tls_key = \"/etc/categraf/key.pem\"\n## Use TLS but skip chain & host verification\n# insecure_skip_verify = true\n\n#[[instances.queries]]\n# measurement = \"lock_wait\"\n# metric_fields = [ \"total\" ]\n# timeout = \"3s\"\n# request = '''\n#SELECT count(*) as total FROM information_schema.innodb_trx WHERE trx_state='LOCK WAIT'\n#'''\n"
},
{
"path": "docker/compose-bridge/etc-categraf/input.net/net.toml",
"content": "# # collect interval\n# interval = 15\n\n# # whether collect protocol stats on Linux\n# collect_protocol_stats = false\n\n# # setting interfaces will tell categraf to gather these explicit interfaces\n# interfaces = [\"eth0\"]"
},
{
"path": "docker/compose-bridge/etc-categraf/input.netstat/netstat.toml",
"content": "# # collect interval\n# interval = 15\n"
},
{
"path": "docker/compose-bridge/etc-categraf/input.processes/processes.toml",
"content": "# # collect interval\n# interval = 15\n\n# # force use ps command to gather\n# force_ps = false\n\n# # force use /proc to gather\n# force_proc = false"
},
{
"path": "docker/compose-bridge/etc-categraf/input.prometheus/prometheus.toml",
"content": "[[instances]]\nurls = [\n \"http://nightingale:17000/metrics\"\n]"
},
{
"path": "docker/compose-bridge/etc-categraf/input.redis/redis.toml",
"content": "[[instances]]\naddress = \"redis:6379\"\nusername = \"\"\npassword = \"\"\n# pool_size = 2\n\n## 是否开启slowlog 收集\n# gather_slowlog = true\n## 最多收集少条slowlog\n# slowlog_max_len = 100\n## 收集距离现在多少秒以内的slowlog\n## 注意插件的采集周期,该参数不要小于采集周期,否则会有slowlog查不到\n# slowlog_time_window=30\n\n# 指标\n# redis_slow_log{ident=dev-01 client_addr=127.0.0.1:56364 client_name= cmd=\"info ALL\" log_id=983} 74 (单位微秒)\n\n# # Optional. Specify redis commands to retrieve values\n# commands = [\n# {command = [\"get\", \"sample-key1\"], metric = \"custom_metric_name1\"},\n# {command = [\"get\", \"sample-key2\"], metric = \"custom_metric_name2\"}\n# ]\n\n# # interval = global.interval * interval_times\n# interval_times = 1\n\n# important! use global unique string to specify instance\nlabels = { instance=\"docker-compose-redis\" }\n\n## Optional TLS Config\n# use_tls = false\n# tls_min_version = \"1.2\"\n# tls_ca = \"/etc/categraf/ca.pem\"\n# tls_cert = \"/etc/categraf/cert.pem\"\n# tls_key = \"/etc/categraf/key.pem\"\n## Use TLS but skip chain & host verification\n# insecure_skip_verify = true\n"
},
{
"path": "docker/compose-bridge/etc-categraf/input.system/system.toml",
"content": "# # collect interval\n# interval = 15\n\n# # whether collect metric: system_n_users\n# collect_user_number = false\n"
},
{
"path": "docker/compose-bridge/etc-mysql/my.cnf",
"content": "[mysqld]\npid-file\t = /var/run/mysqld/mysqld.pid\nsocket\t\t = /var/run/mysqld/mysqld.sock\ndatadir\t\t = /var/lib/mysql\nbind-address = 0.0.0.0"
},
{
"path": "docker/compose-bridge/etc-nightingale/config.toml",
"content": "[Global]\nRunMode = \"release\"\n\n[Log]\n# log write dir\nDir = \"logs\"\n# log level: DEBUG INFO WARNING ERROR\nLevel = \"INFO\"\n# stdout, stderr, file\nOutput = \"stdout\"\n# # rotate by time\n# KeepHours = 4\n# # rotate by size\n# RotateNum = 3\n# # unit: MB\n# RotateSize = 256\n\n[HTTP]\n# http listening address\nHost = \"0.0.0.0\"\n# http listening port\nPort = 17000\n# https cert file path\nCertFile = \"\"\n# https key file path\nKeyFile = \"\"\n# whether print access log\nPrintAccessLog = false\n# whether enable pprof\nPProf = false\n# expose prometheus /metrics?\nExposeMetrics = true\n# http graceful shutdown timeout, unit: s\nShutdownTimeout = 30\n# max content length: 64M\nMaxContentLength = 67108864\n# http server read timeout, unit: s\nReadTimeout = 20\n# http server write timeout, unit: s\nWriteTimeout = 40\n# http server idle timeout, unit: s\nIdleTimeout = 120\n\n[HTTP.ShowCaptcha]\nEnable = false \n\n[HTTP.APIForAgent]\nEnable = true \n# [HTTP.APIForAgent.BasicAuth]\n# user001 = \"ccc26da7b9aba533cbb263a36c07dcc5\"\n\n[HTTP.APIForService]\nEnable = false\n[HTTP.APIForService.BasicAuth]\nuser001 = \"ccc26da7b9aba533cbb263a36c07dcc5\"\n\n[HTTP.JWTAuth]\n# unit: min\nAccessExpired = 1500\n# unit: min\nRefreshExpired = 10080\nRedisKeyPrefix = \"/jwt/\"\n\n[HTTP.TokenAuth]\nEnable = false\nHeaderUserTokenKey = \"X-User-Token\"\n\n[HTTP.ProxyAuth]\n# if proxy auth enabled, jwt auth is disabled\nEnable = false\n# username key in http proxy header\nHeaderUserNameKey = \"X-User-Name\"\nDefaultRoles = [\"Standard\"]\n\n[HTTP.RSA]\n# open RSA\nOpenRSA = false\n\n[DB]\n# postgres: DSN=\"host=127.0.0.1 port=5432 user=root dbname=n9e_v6 password=1234 sslmode=disable\"\nDSN=\"root:1234@tcp(mysql:3306)/n9e_v6?charset=utf8mb4&parseTime=True&loc=Local&allowNativePasswords=true\"\n# enable debug mode or not\nDebug = false\n# mysql postgres\nDBType = \"mysql\"\n# unit: s\nMaxLifetime = 7200\n# max open connections\nMaxOpenConns = 150\n# max idle connections\nMaxIdleConns = 50\n\n[Redis]\n# address, ip:port or ip1:port,ip2:port for cluster and sentinel(SentinelAddrs)\nAddress = \"redis:6379\"\n# Username = \"\"\n# Password = \"\"\n# DB = 0\n# UseTLS = false\n# TLSMinVersion = \"1.2\"\n# standalone cluster sentinel\nRedisType = \"standalone\"\n# Mastername for sentinel type\n# MasterName = \"mymaster\"\n# SentinelUsername = \"\"\n# SentinelPassword = \"\"\n\n[Alert]\n[Alert.Heartbeat]\n# auto detect if blank\nIP = \"\"\n# unit ms\nInterval = 1000\nEngineName = \"default\"\n\n# [Alert.Alerting]\n# NotifyConcurrency = 10\n\n[Center]\nMetricsYamlFile = \"./etc/metrics.yaml\"\nI18NHeaderKey = \"X-Language\"\n\n[Center.AnonymousAccess]\nPromQuerier = false\nAlertDetail = false\n\n[Pushgw]\n# use target labels in database instead of in series\nLabelRewrite = true\nForceUseServerTS = true\n\n# [Pushgw.DebugSample]\n# ident = \"xx\"\n# __name__ = \"xx\"\n\n# [Pushgw.WriterOpt]\n# QueueMaxSize = 1000000\n# QueuePopSize = 1000\n\n[[Pushgw.Writers]] \n# Url = \"http://127.0.0.1:8480/insert/0/prometheus/api/v1/write\"\nUrl = \"http://victoriametrics:8428/api/v1/write\"\n# Basic auth username\nBasicAuthUser = \"\"\n# Basic auth password\nBasicAuthPass = \"\"\n# timeout settings, unit: ms\nHeaders = [\"X-From\", \"n9e\"]\nTimeout = 10000\nDialTimeout = 3000\nTLSHandshakeTimeout = 30000\nExpectContinueTimeout = 1000\nIdleConnTimeout = 90000\n# time duration, unit: ms\nKeepAlive = 30000\nMaxConnsPerHost = 0\nMaxIdleConns = 100\nMaxIdleConnsPerHost = 100\n## Optional TLS Config\n# UseTLS = false\n# TLSCA = \"/etc/n9e/ca.pem\"\n# TLSCert = \"/etc/n9e/cert.pem\"\n# TLSKey = \"/etc/n9e/key.pem\"\n# InsecureSkipVerify = false\n# [[Writers.WriteRelabels]]\n# Action = \"replace\"\n# SourceLabels = [\"__address__\"]\n# Regex = \"([^:]+)(?::\\\\d+)?\"\n# Replacement = \"$1:80\"\n# TargetLabel = \"__address__\"\n\n[Ibex]\nEnable = true\nRPCListen = \"0.0.0.0:20090\""
},
{
"path": "docker/compose-bridge/etc-nightingale/metrics.yaml",
"content": "zh:\n ip_conntrack_count: 连接跟踪表条目总数(单位:int, count)\n ip_conntrack_max: 连接跟踪表最大容量(单位:int, size)\n cpu_usage_idle: CPU空闲率(单位:%)\n cpu_usage_active: CPU使用率(单位:%)\n cpu_usage_system: CPU内核态时间占比(单位:%)\n cpu_usage_user: CPU用户态时间占比(单位:%)\n cpu_usage_nice: 低优先级用户态CPU时间占比,也就是进程nice值被调整为1-19之间的CPU时间。这里注意,nice可取值范围是-20到19,数值越大,优先级反而越低(单位:%)\n cpu_usage_iowait: CPU等待I/O的时间占比(单位:%)\n cpu_usage_irq: CPU处理硬中断的时间占比(单位:%)\n cpu_usage_softirq: CPU处理软中断的时间占比(单位:%)\n cpu_usage_steal: 在虚拟机环境下有该指标,表示CPU被其他虚拟机争用的时间占比,超过20就表示争抢严重(单位:%)\n cpu_usage_guest: 通过虚拟化运行其他操作系统的时间,也就是运行虚拟机的CPU时间占比(单位:%)\n cpu_usage_guest_nice: 以低优先级运行虚拟机的时间占比(单位:%)\n\n disk_free: 硬盘分区剩余量(单位:byte)\n disk_used: 硬盘分区使用量(单位:byte)\n disk_used_percent: 硬盘分区使用率(单位:%)\n disk_total: 硬盘分区总量(单位:byte)\n disk_inodes_free: 硬盘分区inode剩余量\n disk_inodes_used: 硬盘分区inode使用量\n disk_inodes_total: 硬盘分区inode总量\n\n diskio_io_time: 从设备视角来看I/O请求总时间,队列中有I/O请求就计数(单位:毫秒),counter类型,需要用函数求rate才有使用价值\n diskio_iops_in_progress: 已经分配给设备驱动且尚未完成的IO请求,不包含在队列中但尚未分配给设备驱动的IO请求,gauge类型\n diskio_merged_reads: 相邻读请求merge读的次数,counter类型\n diskio_merged_writes: 相邻写请求merge写的次数,counter类型\n diskio_read_bytes: 读取的byte数量,counter类型,需要用函数求rate才有使用价值\n diskio_read_time: 读请求总时间(单位:毫秒),counter类型,需要用函数求rate才有使用价值\n diskio_reads: 读请求次数,counter类型,需要用函数求rate才有使用价值\n diskio_weighted_io_time: 从I/O请求视角来看I/O等待总时间,如果同时有多个I/O请求,时间会叠加(单位:毫秒)\n diskio_write_bytes: 写入的byte数量,counter类型,需要用函数求rate才有使用价值\n diskio_write_time: 写请求总时间(单位:毫秒),counter类型,需要用函数求rate才有使用价值\n diskio_writes: 写请求次数,counter类型,需要用函数求rate才有使用价值\n\n kernel_boot_time: 内核启动时间\n kernel_context_switches: 内核上下文切换次数\n kernel_entropy_avail: linux系统内部的熵池\n kernel_interrupts: 内核中断次数\n kernel_processes_forked: fork的进程数\n\n mem_active: 活跃使用的内存总数(包括cache和buffer内存)\n mem_available: 可用内存大小(bytes)\n mem_available_percent: 内存剩余百分比(0~100)\n mem_buffered: 用来给文件做缓冲大小\n mem_cached: 被高速缓冲存储器(cache memory)用的内存的大小(等于 diskcache minus SwapCache )\n mem_commit_limit: 根据超额分配比率('vm.overcommit_ratio'),这是当前在系统上分配可用的内存总量,这个限制只是在模式2('vm.overcommit_memory')时启用\n mem_committed_as: 目前在系统上分配的内存量。是所有进程申请的内存的总和\n mem_dirty: 等待被写回到磁盘的内存大小\n mem_free: 空闲内存大小(bytes)\n mem_high_free: 未被使用的高位内存大小\n mem_high_total: 高位内存总大小(Highmem是指所有内存高于860MB的物理内存,Highmem区域供用户程序使用,或用于页面缓存。该区域不是直接映射到内核空间。内核必须使用不同的手法使用该段内存)\n mem_huge_page_size: 每个大页的大小\n mem_huge_pages_free: 池中尚未分配的 HugePages 数量\n mem_huge_pages_total: 预留HugePages的总个数\n mem_inactive: 空闲的内存数(包括free和available的内存)\n mem_low_free: 未被使用的低位大小\n mem_low_total: 低位内存总大小,低位可以达到高位内存一样的作用,而且它还能够被内核用来记录一些自己的数据结构\n mem_mapped: 设备和文件等映射的大小\n mem_page_tables: 管理内存分页页面的索引表的大小\n mem_shared: 多个进程共享的内存总额\n mem_slab: 内核数据结构缓存的大小,可以减少申请和释放内存带来的消耗\n mem_sreclaimable: 可收回Slab的大小\n mem_sunreclaim: 不可收回Slab的大小(SUnreclaim+SReclaimable=Slab)\n mem_swap_cached: 被高速缓冲存储器(cache memory)用的交换空间的大小,已经被交换出来的内存,但仍然被存放在swapfile中。用来在需要的时候很快的被替换而不需要再次打开I/O端口\n mem_swap_free: 未被使用交换空间的大小\n mem_swap_total: 交换空间的总大小\n mem_total: 内存总数\n mem_used: 已用内存数\n mem_used_percent: 已用内存数百分比(0~100)\n mem_vmalloc_chunk: 最大的连续未被使用的vmalloc区域\n mem_vmalloc_totalL: 可以vmalloc虚拟内存大小\n mem_vmalloc_used: vmalloc已使用的虚拟内存大小\n mem_write_back: 正在被写回到磁盘的内存大小\n mem_write_back_tmp: FUSE用于临时写回缓冲区的内存\n\n net_bytes_recv: 网卡收包总数(bytes),计算每秒速率时需要用到rate/irate函数\n net_bytes_sent: 网卡发包总数(bytes),计算每秒速率时需要用到rate/irate函数\n net_drop_in: 网卡收丢包数量\n net_drop_out: 网卡发丢包数量\n net_err_in: 网卡收包错误数量\n net_err_out: 网卡发包错误数量\n net_packets_recv: 网卡收包数量\n net_packets_sent: 网卡发包数量\n net_bits_recv: 网卡收包总数(bits),计算每秒速率时需要用到rate/irate函数\n net_bits_sent: 网卡发包总数(bits),计算每秒速率时需要用到rate/irate函数\n\n netstat_tcp_established: ESTABLISHED状态的网络链接数\n netstat_tcp_fin_wait1: FIN_WAIT1状态的网络链接数\n netstat_tcp_fin_wait2: FIN_WAIT2状态的网络链接数\n netstat_tcp_last_ack: LAST_ACK状态的网络链接数\n netstat_tcp_listen: LISTEN状态的网络链接数\n netstat_tcp_syn_recv: SYN_RECV状态的网络链接数\n netstat_tcp_syn_sent: SYN_SENT状态的网络链接数\n netstat_tcp_time_wait: TIME_WAIT状态的网络链接数\n netstat_udp_socket: UDP状态的网络链接数\n\n netstat_sockets_used: 已使用的所有协议套接字总量\n netstat_tcp_inuse: 正在使用(正在侦听)的TCP套接字数量\n netstat_tcp_orphan: 无主(不属于任何进程)的TCP连接数(无用、待销毁的TCP socket数)\n netstat_tcp_tw: TIME_WAIT状态的TCP连接数\n netstat_tcp_alloc: 已分配(已建立、已申请到sk_buff)的TCP套接字数量\n netstat_tcp_mem: TCP套接字内存Page使用量\n netstat_udp_inuse: 在使用的UDP套接字数量\n netstat_udp_mem: UDP套接字内存Page使用量\n netstat_udplite_inuse: 正在使用的 udp lite 数量\n netstat_raw_inuse: 正在使用的 raw socket 数量\n netstat_frag_inuse: ip fragment 数量\n netstat_frag_memory: ip fragment 已经分配的内存(byte)\n\n #[ping]\n ping_percent_packet_loss: ping数据包丢失百分比(%)\n ping_result_code: ping返回码('0','1')\n\n net_response_result_code: 网络探测结果,0表示正常,非0表示异常\n net_response_response_time: 网络探测时延,单位:秒\n\n processes_blocked: 不可中断的睡眠状态下的进程数('U','D','L')\n processes_dead: 回收中的进程数('X')\n processes_idle: 挂起的空闲进程数('I')\n processes_paging: 分页进程数('P')\n processes_running: 运行中的进程数('R')\n processes_sleeping: 可中断进程数('S')\n processes_stopped: 暂停状态进程数('T')\n processes_total: 总进程数\n processes_total_threads: 总线程数\n processes_unknown: 未知状态进程数\n processes_zombies: 僵尸态进程数('Z')\n\n swap_used_percent: Swap空间换出数据量\n\n system_load1: 1分钟平均load值\n system_load5: 5分钟平均load值\n system_load15: 15分钟平均load值\n system_load_norm_1: 1分钟平均load值/逻辑CPU个数\n system_load_norm_5: 5分钟平均load值/逻辑CPU个数\n system_load_norm_15: 15分钟平均load值/逻辑CPU个数\n system_n_users: 用户数\n system_n_cpus: CPU核数\n system_uptime: 系统启动时间\n\n nginx_accepts: 自nginx启动起,与客户端建立过得连接总数\n nginx_active: 当前nginx正在处理的活动连接数,等于Reading/Writing/Waiting总和\n nginx_handled: 自nginx启动起,处理过的客户端连接总数\n nginx_reading: 正在读取HTTP请求头部的连接总数\n nginx_requests: 自nginx启动起,处理过的客户端请求总数,由于存在HTTP Keep-Alive请求,该值会大于handled值\n nginx_upstream_check_fall: upstream_check模块检测到后端失败的次数\n nginx_upstream_check_rise: upstream_check模块对后端的检测次数\n nginx_upstream_check_status_code: 后端upstream的状态,up为1,down为0\n nginx_waiting: 开启 keep-alive 的情况下,这个值等于 active – (reading+writing), 意思就是 Nginx 已经处理完正在等候下一次请求指令的驻留连接\n nginx_writing: 正在向客户端发送响应的连接总数\n\n http_response_content_length: HTTP消息实体的传输长度\n http_response_http_response_code: http响应状态码\n http_response_response_time: http响应用时\n http_response_result_code: url探测结果0为正常否则url无法访问\n\n # [aws cloudwatch rds]\n cloudwatch_aws_rds_bin_log_disk_usage_average: rds 磁盘使用平均值\n cloudwatch_aws_rds_bin_log_disk_usage_maximum: rds 磁盘使用量最大值\n cloudwatch_aws_rds_bin_log_disk_usage_minimum: rds binlog 磁盘使用量最低\n cloudwatch_aws_rds_bin_log_disk_usage_sample_count: rds binlog 磁盘使用情况样本计数\n cloudwatch_aws_rds_bin_log_disk_usage_sum: rds binlog 磁盘使用总和\n cloudwatch_aws_rds_burst_balance_average: rds 突发余额平均值\n cloudwatch_aws_rds_burst_balance_maximum: rds 突发余额最大值\n cloudwatch_aws_rds_burst_balance_minimum: rds 突发余额最低\n cloudwatch_aws_rds_burst_balance_sample_count: rds 突发平衡样本计数\n cloudwatch_aws_rds_burst_balance_sum: rds 突发余额总和\n cloudwatch_aws_rds_cpu_utilization_average: rds cpu 利用率平均值\n cloudwatch_aws_rds_cpu_utilization_maximum: rds cpu 利用率最大值\n cloudwatch_aws_rds_cpu_utilization_minimum: rds cpu 利用率最低\n cloudwatch_aws_rds_cpu_utilization_sample_count: rds cpu 利用率样本计数\n cloudwatch_aws_rds_cpu_utilization_sum: rds cpu 利用率总和\n cloudwatch_aws_rds_database_connections_average: rds 数据库连接平均值\n cloudwatch_aws_rds_database_connections_maximum: rds 数据库连接数最大值\n cloudwatch_aws_rds_database_connections_minimum: rds 数据库连接最小\n cloudwatch_aws_rds_database_connections_sample_count: rds 数据库连接样本数\n cloudwatch_aws_rds_database_connections_sum: rds 数据库连接总和\n cloudwatch_aws_rds_db_load_average: rds db 平均负载\n cloudwatch_aws_rds_db_load_cpu_average: rds db 负载 cpu 平均值\n cloudwatch_aws_rds_db_load_cpu_maximum: rds db 负载 cpu 最大值\n cloudwatch_aws_rds_db_load_cpu_minimum: rds db 负载 cpu 最小值\n cloudwatch_aws_rds_db_load_cpu_sample_count: rds db 加载 CPU 样本数\n cloudwatch_aws_rds_db_load_cpu_sum: rds db 加载cpu总和\n cloudwatch_aws_rds_db_load_maximum: rds 数据库负载最大值\n cloudwatch_aws_rds_db_load_minimum: rds 数据库负载最小值\n cloudwatch_aws_rds_db_load_non_cpu_average: rds 加载非 CPU 平均值\n cloudwatch_aws_rds_db_load_non_cpu_maximum: rds 加载非 cpu 最大值\n cloudwatch_aws_rds_db_load_non_cpu_minimum: rds 加载非 cpu 最小值\n cloudwatch_aws_rds_db_load_non_cpu_sample_count: rds 加载非 cpu 样本计数\n cloudwatch_aws_rds_db_load_non_cpu_sum: rds 加载非cpu总和\n cloudwatch_aws_rds_db_load_sample_count: rds db 加载样本计数\n cloudwatch_aws_rds_db_load_sum: rds db 负载总和\n cloudwatch_aws_rds_disk_queue_depth_average: rds 磁盘队列深度平均值\n cloudwatch_aws_rds_disk_queue_depth_maximum: rds 磁盘队列深度最大值\n cloudwatch_aws_rds_disk_queue_depth_minimum: rds 磁盘队列深度最小值\n cloudwatch_aws_rds_disk_queue_depth_sample_count: rds 磁盘队列深度样本计数\n cloudwatch_aws_rds_disk_queue_depth_sum: rds 磁盘队列深度总和\n cloudwatch_aws_rds_ebs_byte_balance__average: rds ebs 字节余额平均值\n cloudwatch_aws_rds_ebs_byte_balance__maximum: rds ebs 字节余额最大值\n cloudwatch_aws_rds_ebs_byte_balance__minimum: rds ebs 字节余额最低\n cloudwatch_aws_rds_ebs_byte_balance__sample_count: rds ebs 字节余额样本数\n cloudwatch_aws_rds_ebs_byte_balance__sum: rds ebs 字节余额总和\n cloudwatch_aws_rds_ebsio_balance__average: rds ebsio 余额平均值\n cloudwatch_aws_rds_ebsio_balance__maximum: rds ebsio 余额最大值\n cloudwatch_aws_rds_ebsio_balance__minimum: rds ebsio 余额最低\n cloudwatch_aws_rds_ebsio_balance__sample_count: rds ebsio 平衡样本计数\n cloudwatch_aws_rds_ebsio_balance__sum: rds ebsio 余额总和\n cloudwatch_aws_rds_free_storage_space_average: rds 免费存储空间平均\n cloudwatch_aws_rds_free_storage_space_maximum: rds 最大可用存储空间\n cloudwatch_aws_rds_free_storage_space_minimum: rds 最低可用存储空间\n cloudwatch_aws_rds_free_storage_space_sample_count: rds 可用存储空间样本数\n cloudwatch_aws_rds_free_storage_space_sum: rds 免费存储空间总和\n cloudwatch_aws_rds_freeable_memory_average: rds 可用内存平均值\n cloudwatch_aws_rds_freeable_memory_maximum: rds 最大可用内存\n cloudwatch_aws_rds_freeable_memory_minimum: rds 最小可用内存\n cloudwatch_aws_rds_freeable_memory_sample_count: rds 可释放内存样本数\n cloudwatch_aws_rds_freeable_memory_sum: rds 可释放内存总和\n cloudwatch_aws_rds_lvm_read_iops_average: rds lvm 读取 iops 平均值\n cloudwatch_aws_rds_lvm_read_iops_maximum: rds lvm 读取 iops 最大值\n cloudwatch_aws_rds_lvm_read_iops_minimum: rds lvm 读取 iops 最低\n cloudwatch_aws_rds_lvm_read_iops_sample_count: rds lvm 读取 iops 样本计数\n cloudwatch_aws_rds_lvm_read_iops_sum: rds lvm 读取 iops 总和\n cloudwatch_aws_rds_lvm_write_iops_average: rds lvm 写入 iops 平均值\n cloudwatch_aws_rds_lvm_write_iops_maximum: rds lvm 写入 iops 最大值\n cloudwatch_aws_rds_lvm_write_iops_minimum: rds lvm 写入 iops 最低\n cloudwatch_aws_rds_lvm_write_iops_sample_count: rds lvm 写入 iops 样本计数\n cloudwatch_aws_rds_lvm_write_iops_sum: rds lvm 写入 iops 总和\n cloudwatch_aws_rds_network_receive_throughput_average: rds 网络接收吞吐量平均\n cloudwatch_aws_rds_network_receive_throughput_maximum: rds 网络接收吞吐量最大值\n cloudwatch_aws_rds_network_receive_throughput_minimum: rds 网络接收吞吐量最小值\n cloudwatch_aws_rds_network_receive_throughput_sample_count: rds 网络接收吞吐量样本计数\n cloudwatch_aws_rds_network_receive_throughput_sum: rds 网络接收吞吐量总和\n cloudwatch_aws_rds_network_transmit_throughput_average: rds 网络传输吞吐量平均值\n cloudwatch_aws_rds_network_transmit_throughput_maximum: rds 网络传输吞吐量最大\n cloudwatch_aws_rds_network_transmit_throughput_minimum: rds 网络传输吞吐量最小值\n cloudwatch_aws_rds_network_transmit_throughput_sample_count: rds 网络传输吞吐量样本计数\n cloudwatch_aws_rds_network_transmit_throughput_sum: rds 网络传输吞吐量总和\n cloudwatch_aws_rds_read_iops_average: rds 读取 iops 平均值\n cloudwatch_aws_rds_read_iops_maximum: rds 最大读取 iops\n cloudwatch_aws_rds_read_iops_minimum: rds 读取 iops 最低\n cloudwatch_aws_rds_read_iops_sample_count: rds 读取 iops 样本计数\n cloudwatch_aws_rds_read_iops_sum: rds 读取 iops 总和\n cloudwatch_aws_rds_read_latency_average: rds 读取延迟平均值\n cloudwatch_aws_rds_read_latency_maximum: rds 读取延迟最大值\n cloudwatch_aws_rds_read_latency_minimum: rds 最小读取延迟\n cloudwatch_aws_rds_read_latency_sample_count: rds 读取延迟样本计数\n cloudwatch_aws_rds_read_latency_sum: rds 读取延迟总和\n cloudwatch_aws_rds_read_throughput_average: rds 读取吞吐量平均值\n cloudwatch_aws_rds_read_throughput_maximum: rds 最大读取吞吐量\n cloudwatch_aws_rds_read_throughput_minimum: rds 最小读取吞吐量\n cloudwatch_aws_rds_read_throughput_sample_count: rds 读取吞吐量样本计数\n cloudwatch_aws_rds_read_throughput_sum: rds 读取吞吐量总和\n cloudwatch_aws_rds_swap_usage_average: rds 交换使用平均值\n cloudwatch_aws_rds_swap_usage_maximum: rds 交换使用最大值\n cloudwatch_aws_rds_swap_usage_minimum: rds 交换使用量最低\n cloudwatch_aws_rds_swap_usage_sample_count: rds 交换使用示例计数\n cloudwatch_aws_rds_swap_usage_sum: rds 交换使用总和\n cloudwatch_aws_rds_write_iops_average: rds 写入 iops 平均值\n cloudwatch_aws_rds_write_iops_maximum: rds 写入 iops 最大值\n cloudwatch_aws_rds_write_iops_minimum: rds 写入 iops 最低\n cloudwatch_aws_rds_write_iops_sample_count: rds 写入 iops 样本计数\n cloudwatch_aws_rds_write_iops_sum: rds 写入 iops 总和\n cloudwatch_aws_rds_write_latency_average: rds 写入延迟平均值\n cloudwatch_aws_rds_write_latency_maximum: rds 最大写入延迟\n cloudwatch_aws_rds_write_latency_minimum: rds 写入延迟最小值\n cloudwatch_aws_rds_write_latency_sample_count: rds 写入延迟样本计数\n cloudwatch_aws_rds_write_latency_sum: rds 写入延迟总和\n cloudwatch_aws_rds_write_throughput_average: rds 写入吞吐量平均值\n cloudwatch_aws_rds_write_throughput_maximum: rds 最大写入吞吐量\n cloudwatch_aws_rds_write_throughput_minimum: rds 写入吞吐量最小值\n cloudwatch_aws_rds_write_throughput_sample_count: rds 写入吞吐量样本计数\n cloudwatch_aws_rds_write_throughput_sum: rds 写入吞吐量总和\n\nen:\n ip_conntrack_count: the number of entries in the conntrack table(unit:int, count)\n ip_conntrack_max: the max capacity of the conntrack table(unit:int, size)\n cpu_usage_idle: \"CPU idle rate(unit:%)\"\n cpu_usage_active: \"CPU usage rate(unit:%)\"\n cpu_usage_system: \"CPU kernel state time proportion(unit:%)\"\n cpu_usage_user: \"CPU user attitude time proportion(unit:%)\"\n cpu_usage_nice: \"The proportion of low priority CPU time, that is, the process NICE value is adjusted to the CPU time between 1-19. Note here that the value range of NICE is -20 to 19, the larger the value, the lower the priority, the lower the priority(unit:%)\"\n cpu_usage_iowait: \"CPU waiting for I/O time proportion(unit:%)\"\n cpu_usage_irq: \"CPU processing hard interrupt time proportion(unit:%)\"\n cpu_usage_softirq: \"CPU processing soft interrupt time proportion(unit:%)\"\n cpu_usage_steal: \"In the virtual machine environment, there is this indicator, which means that the CPU is used by other virtual machines for the proportion of time.(unit:%)\"\n cpu_usage_guest: \"The time to run other operating systems by virtualization, that is, the proportion of CPU time running the virtual machine(unit:%)\"\n cpu_usage_guest_nice: \"The proportion of time to run the virtual machine at low priority(unit:%)\"\n\n disk_free: \"The remaining amount of the hard disk partition (unit: byte)\"\n disk_used: \"Hard disk partitional use (unit: byte)\"\n disk_used_percent: \"Hard disk partitional use rate (unit:%)\"\n disk_total: \"Total amount of hard disk partition (unit: byte)\"\n disk_inodes_free: \"Hard disk partition INODE remaining amount\"\n disk_inodes_used: \"Hard disk partition INODE usage amount\"\n disk_inodes_total: \"The total amount of hard disk partition INODE\"\n\n diskio_io_time: \"From the perspective of the device perspective, the total time of I/O request, the I/O request in the queue is count (unit: millisecond), the counter type, you need to use the function to find the value\"\n diskio_iops_in_progress: \"IO requests that have been assigned to device -driven and have not yet been completed, not included in the queue but not yet assigned to the device -driven IO request, Gauge type\"\n diskio_merged_reads: \"The number of times of adjacent reading request Merge, the counter type\"\n diskio_merged_writes: \"The number of times the request Merge writes, the counter type\"\n diskio_read_bytes: \"The number of byte reads, the counter type, you need to use the function to find the Rate to use the value\"\n diskio_read_time: \"The total time of reading request (unit: millisecond), the counter type, you need to use the function to find the Rate to have the value of use\"\n diskio_reads: \"Read the number of requests, the counter type, you need to use the function to find the Rate to use the value\"\n diskio_weighted_io_time: \"From the perspective of the I/O request perspective, I/O wait for the total time. If there are multiple I/O requests at the same time, the time will be superimposed (unit: millisecond)\"\n diskio_write_bytes: \"The number of bytes written, the counter type, you need to use the function to find the Rate to use the value\"\n diskio_write_time: \"The total time of the request (unit: millisecond), the counter type, you need to use the function to find the rate to have the value of use\"\n diskio_writes: \"Write the number of requests, the counter type, you need to use the function to find the rate to use value\"\n\n kernel_boot_time: \"Kernel startup time\"\n kernel_context_switches: \"Number of kernel context switching times\"\n kernel_entropy_avail: \"Entropy pool inside the Linux system\"\n kernel_interrupts: \"Number of kernel interruption\"\n kernel_processes_forked: \"ForK's process number\"\n\n mem_active: \"The total number of memory (including Cache and BUFFER memory)\"\n mem_available: \"Application can use memory numbers\"\n mem_available_percent: \"Memory remaining percentage (0 ~ 100)\"\n mem_buffered: \"Used to make buffer size for the file\"\n mem_cached: \"The size of the memory used by the cache memory (equal to diskcache minus Swap Cache )\"\n mem_commit_limit: \"According to the over allocation ratio ('vm.overCommit _ Ratio'), this is the current total memory that can be allocated on the system.\"\n mem_committed_as: \"Currently allocated on the system. It is the sum of the memory of all process applications\"\n mem_dirty: \"Waiting to be written back to the memory size of the disk\"\n mem_free: \"Senior memory number\"\n mem_high_free: \"Unused high memory size\"\n mem_high_total: \"The total memory size of the high memory (Highmem refers to all the physical memory that is higher than 860 MB of memory, the HighMem area is used for user programs, or for page cache. This area is not directly mapped to the kernel space. The kernels must use different methods to use this section of memory. )\"\n mem_huge_page_size: \"The size of each big page\"\n mem_huge_pages_free: \"The number of Huge Pages in the pool that have not been allocated\"\n mem_huge_pages_total: \"Reserve the total number of Huge Pages\"\n mem_inactive: \"Free memory (including the memory of free and available)\"\n mem_low_free: \"Unused low size\"\n mem_low_total: \"The total size of the low memory memory can achieve the same role of high memory, and it can be used by the kernel to record some of its own data structure\"\n mem_mapped: \"The size of the mapping of equipment and files\"\n mem_page_tables: \"The size of the index table of the management of the memory paging page\"\n mem_shared: \"The total memory shared by multiple processes\"\n mem_slab: \"The size of the kernel data structure cache can reduce the consumption of application and release memory\"\n mem_sreclaimable: \"The size of the SLAB can be recovered\"\n mem_sunreclaim: \"The size of the SLAB cannot be recovered(SUnreclaim+SReclaimable=Slab)\"\n mem_swap_cached: \"The size of the swap space used by the cache memory (cache memory), the memory that has been swapped out, but is still stored in the swapfile. Used to be quickly replaced when needed without opening the I/O port again\"\n mem_swap_free: \"The size of the switching space is not used\"\n mem_swap_total: \"The total size of the exchange space\"\n mem_total: \"Total memory\"\n mem_used: \"Memory number\"\n mem_used_percent: \"The memory has been used by several percentage (0 ~ 100)\"\n mem_vmalloc_chunk: \"The largest continuous unused vmalloc area\"\n mem_vmalloc_totalL: \"You can vmalloc virtual memory size\"\n mem_vmalloc_used: \"Vmalloc's virtual memory size\"\n mem_write_back: \"The memory size of the disk is being written back to the disk\"\n mem_write_back_tmp: \"Fuse is used to temporarily write back the memory of the buffer area\"\n\n net_bytes_recv: \"Total inbound traffic(bytes) of network card\"\n net_bytes_sent: \"Total outbound traffic(bytes) of network card\"\n net_bits_recv: \"Total inbound traffic(bits) of network card\"\n net_bits_sent: \"Total outbound traffic(bits) of network card\"\n net_drop_in: \"The number of packets for network cards\"\n net_drop_out: \"The number of packets issued by the network card\"\n net_err_in: \"The number of incorrect packets of the network card\"\n net_err_out: \"Number of incorrect number of network cards\"\n net_packets_recv: \"Net card collection quantity\"\n net_packets_sent: \"Number of network card issuance\"\n\n netstat_tcp_established: \"ESTABLISHED status network link number\"\n netstat_tcp_fin_wait1: \"FIN _ WAIT1 status network link number\"\n netstat_tcp_fin_wait2: \"FIN _ WAIT2 status number of network links\"\n netstat_tcp_last_ack: \"LAST_ ACK status number of network links\"\n netstat_tcp_listen: \"Number of network links in Listen status\"\n netstat_tcp_syn_recv: \"SYN _ RECV status number of network links\"\n netstat_tcp_syn_sent: \"SYN _ SENT status number of network links\"\n netstat_tcp_time_wait: \"Time _ WAIT status network link number\"\n netstat_udp_socket: \"Number of network links in UDP status\"\n\n processes_blocked: \"The number of processes in the unreproducible sleep state('U','D','L')\"\n processes_dead: \"Number of processes in recycling('X')\"\n processes_idle: \"Number of idle processes hanging('I')\"\n processes_paging: \"Number of paging processes('P')\"\n processes_running: \"Number of processes during operation('R')\"\n processes_sleeping: \"Can interrupt the number of processes('S')\"\n processes_stopped: \"Pushing status process number('T')\"\n processes_total: \"Total process number\"\n processes_total_threads: \"Number of threads\"\n processes_unknown: \"Unknown status process number\"\n processes_zombies: \"Number of zombies('Z')\"\n\n swap_used_percent: \"SWAP space replace the data volume\"\n\n system_load1: \"1 minute average load value\"\n system_load5: \"5 minutes average load value\"\n system_load15: \"15 minutes average load value\"\n system_load_norm_1: \"1 minute average load value/logical CPU number\"\n system_load_norm_5: \"5 minutes average load value/logical CPU number\"\n system_load_norm_15: \"15 minutes average load value/logical CPU number\"\n system_n_users: \"User number\"\n system_n_cpus: \"CPU nuclear number\"\n system_uptime: \"System startup time\"\n\n nginx_accepts: \"Since Nginx started, the total number of connections has been established with the client\"\n nginx_active: \"The current number of activity connections that Nginx is being processed is equal to Reading/Writing/Waiting\"\n nginx_handled: \"Starting from Nginx, the total number of client connections that have been processed\"\n nginx_reading: \"Reading the total number of connections on the http request header\"\n nginx_requests: \"Since nginx is started, the total number of client requests processed, due to the existence of HTTP Keep-Alive requests, this value will be greater than the handled value\"\n nginx_upstream_check_fall: \"UPStream_CHECK module detects the number of back -end failures\"\n nginx_upstream_check_rise: \"UPSTREAM _ Check module to detect the number of back -end\"\n nginx_upstream_check_status_code: \"The state of the backstream is 1, and the down is 0\"\n nginx_waiting: \"When keep-alive is enabled, this value is equal to active – (reading+writing), which means that Nginx has processed the resident connection that is waiting for the next request command\"\n nginx_writing: \"The total number of connections to send a response to the client\"\n\n http_response_content_length: \"HTTP message entity transmission length\"\n http_response_http_response_code: \"http response status code\"\n http_response_response_time: \"When http ring application\"\n http_response_result_code: \"URL detection result 0 is normal, otherwise the URL cannot be accessed\"\n\n # [mysqld_exporter]\n mysql_global_status_uptime: The number of seconds that the server has been up.(Gauge)\n mysql_global_status_uptime_since_flush_status: The number of seconds since the most recent FLUSH STATUS statement.(Gauge)\n mysql_global_status_queries: The number of statements executed by the server. This variable includes statements executed within stored programs, unlike the Questions variable. It does not count COM_PING or COM_STATISTICS commands.(Counter)\n mysql_global_status_threads_connected: The number of currently open connections.(Counter)\n mysql_global_status_connections: The number of connection attempts (successful or not) to the MySQL server.(Gauge)\n mysql_global_status_max_used_connections: The maximum number of connections that have been in use simultaneously since the server started.(Gauge)\n mysql_global_status_threads_running: The number of threads that are not sleeping.(Gauge)\n mysql_global_status_questions: The number of statements executed by the server. This includes only statements sent to the server by clients and not statements executed within stored programs, unlike the Queries variable. This variable does not count COM_PING, COM_STATISTICS, COM_STMT_PREPARE, COM_STMT_CLOSE, or COM_STMT_RESET commands.(Counter)\n mysql_global_status_threads_cached: The number of threads in the thread cache.(Counter)\n mysql_global_status_threads_created: The number of threads created to handle connections. If Threads_created is big, you may want to increase the thread_cache_size value. The cache miss rate can be calculated as Threads_created/Connections.(Counter)\n mysql_global_status_created_tmp_tables: The number of internal temporary tables created by the server while executing statements.(Counter)\n mysql_global_status_created_tmp_disk_tables: The number of internal on-disk temporary tables created by the server while executing statements. You can compare the number of internal on-disk temporary tables created to the total number of internal temporary tables created by comparing Created_tmp_disk_tables and Created_tmp_tables values.(Counter)\n mysql_global_status_created_tmp_files: How many temporary files mysqld has created.(Counter)\n mysql_global_status_select_full_join: The number of joins that perform table scans because they do not use indexes. If this value is not 0, you should carefully check the indexes of your tables.(Counter)\n mysql_global_status_select_full_range_join: The number of joins that used a range search on a reference table.(Counter)\n mysql_global_status_select_range: The number of joins that used ranges on the first table. This is normally not a critical issue even if the value is quite large.(Counter)\n mysql_global_status_select_range_check: The number of joins without keys that check for key usage after each row. If this is not 0, you should carefully check the indexes of your tables.(Counter)\n mysql_global_status_select_scan: The number of joins that did a full scan of the first table.(Counter)\n mysql_global_status_sort_rows: The number of sorted rows.(Counter)\n mysql_global_status_sort_range: The number of sorts that were done using ranges.(Counter)\n mysql_global_status_sort_merge_passes: The number of merge passes that the sort algorithm has had to do. If this value is large, you should consider increasing the value of the sort_buffer_size system variable.(Counter)\n mysql_global_status_sort_scan: The number of sorts that were done by scanning the table.(Counter)\n mysql_global_status_slow_queries: The number of queries that have taken more than long_query_time seconds. This counter increments regardless of whether the slow query log is enabled.(Counter)\n mysql_global_status_aborted_connects: The number of failed attempts to connect to the MySQL server.(Counter)\n mysql_global_status_aborted_clients: The number of connections that were aborted because the client died without closing the connection properly.(Counter)\n mysql_global_status_table_locks_immediate: The number of times that a request for a table lock could be granted immediately. Locks Immediate rising and falling is normal activity.(Counter)\n mysql_global_status_table_locks_waited: The number of times that a request for a table lock could not be granted immediately and a wait was needed. If this is high and you have performance problems, you should first optimize your queries, and then either split your table or tables or use replication.(Counter)\n mysql_global_status_bytes_received: The number of bytes received from all clients.(Counter)\n mysql_global_status_bytes_sent: The number of bytes sent to all clients.(Counter)\n mysql_global_status_innodb_page_size: InnoDB page size (default 16KB). Many values are counted in pages; the page size enables them to be easily converted to bytes.(Gauge)\n mysql_global_status_buffer_pool_pages: The number of pages in the InnoDB buffer pool.(Gauge)\n mysql_global_status_commands_total: The number of times each xxx statement has been executed.(Counter)\n mysql_global_status_handlers_total: Handler statistics are internal statistics on how MySQL is selecting, updating, inserting, and modifying rows, tables, and indexes. This is in fact the layer between the Storage Engine and MySQL.(Counter)\n mysql_global_status_opened_files: The number of files that have been opened with my_open() (a mysys library function). Parts of the server that open files without using this function do not increment the count.(Counter)\n mysql_global_status_open_tables: The number of tables that are open.(Gauge)\n mysql_global_status_opened_tables: The number of tables that have been opened. If Opened_tables is big, your table_open_cache value is probably too small.(Counter)\n mysql_global_status_table_open_cache_hits: The number of hits for open tables cache lookups.(Counter)\n mysql_global_status_table_open_cache_misses: The number of misses for open tables cache lookups.(Counter)\n mysql_global_status_table_open_cache_overflows: The number of overflows for the open tables cache.(Counter)\n mysql_global_status_innodb_num_open_files: The number of files InnoDB currently holds open.(Gauge)\n mysql_global_status_connection_errors_total: These variables provide information about errors that occur during the client connection process.(Counter)\n mysql_global_status_innodb_buffer_pool_read_requests: The number of logical read requests.(Counter)\n mysql_global_status_innodb_buffer_pool_reads: The number of logical reads that InnoDB could not satisfy from the buffer pool, and had to read directly from disk.(Counter)\n\n mysql_global_variables_thread_cache_size: How many threads the server should cache for reuse.(Gauge)\n mysql_global_variables_max_connections: The maximum permitted number of simultaneous client connections.(Gauge)\n mysql_global_variables_innodb_buffer_pool_size: The size in bytes of the buffer pool, the memory area where InnoDB caches table and index data. The default value is 134217728 bytes (128MB).(Gauge)\n mysql_global_variables_innodb_log_buffer_size: The size in bytes of the buffer that InnoDB uses to write to the log files on disk.(Gauge)\n mysql_global_variables_key_buffer_size: Index blocks for MyISAM tables are buffered and are shared by all threads.(Gauge)\n mysql_global_variables_query_cache_size: The amount of memory allocated for caching query results.(Gauge)\n mysql_global_variables_table_open_cache: The number of open tables for all threads.(Gauge)\n mysql_global_variables_open_files_limit: The number of file descriptors available to mysqld from the operating system.(Gauge)\n\n # [redis_exporter]\n redis_active_defrag_running: When activedefrag is enabled, this indicates whether defragmentation is currently active, and the CPU percentage it intends to utilize.\n redis_allocator_active_bytes: Total bytes in the allocator active pages, this includes external-fragmentation.\n redis_allocator_allocated_bytes: Total bytes allocated form the allocator, including internal-fragmentation. Normally the same as used_memory.\n redis_allocator_frag_bytes: Delta between allocator_active and allocator_allocated. See note about mem_fragmentation_bytes.\n redis_allocator_frag_ratio: Ratio between allocator_active and allocator_allocated. This is the true (external) fragmentation metric (not mem_fragmentation_ratio).\n redis_allocator_resident_bytes: Total bytes resident (RSS) in the allocator, this includes pages that can be released to the OS (by MEMORY PURGE, or just waiting).\n redis_allocator_rss_bytes: Delta between allocator_resident and allocator_active.\n redis_allocator_rss_ratio: Ratio between allocator_resident and allocator_active. This usually indicates pages that the allocator can and probably will soon release back to the OS.\n redis_aof_current_rewrite_duration_sec: Duration of the on-going AOF rewrite operation if any.\n redis_aof_enabled: Flag indicating AOF logging is activated.\n redis_aof_last_bgrewrite_status: Status of the last AOF rewrite operation.\n redis_aof_last_cow_size_bytes: The size in bytes of copy-on-write memory during the last AOF rewrite operation.\n redis_aof_last_rewrite_duration_sec: Duration of the last AOF rewrite operation in seconds.\n redis_aof_last_write_status: Status of the last write operation to the AOF.\n redis_aof_rewrite_in_progress: Flag indicating a AOF rewrite operation is on-going.\n redis_aof_rewrite_scheduled: Flag indicating an AOF rewrite operation will be scheduled once the on-going RDB save is complete.\n redis_blocked_clients: Number of clients pending on a blocking call (BLPOP, BRPOP, BRPOPLPUSH, BLMOVE, BZPOPMIN, BZPOPMAX).\n redis_client_recent_max_input_buffer_bytes: Biggest input buffer among current client connections.\n redis_client_recent_max_output_buffer_bytes: Biggest output buffer among current client connections.\n redis_cluster_enabled: Indicate Redis cluster is enabled.\n redis_commands_duration_seconds_total: The total CPU time consumed by these commands.(Counter)\n redis_commands_processed_total: Total number of commands processed by the server.(Counter)\n redis_commands_total: The number of calls that reached command execution (not rejected).(Counter)\n redis_config_maxclients: The value of the maxclients configuration directive. This is the upper limit for the sum of connected_clients, connected_slaves and cluster_connections.\n redis_config_maxmemory: The value of the maxmemory configuration directive.\n redis_connected_clients: Number of client connections (excluding connections from replicas).\n redis_connected_slaves: Number of connected replicas.\n redis_connections_received_total: Total number of connections accepted by the server.(Counter)\n redis_cpu_sys_children_seconds_total: System CPU consumed by the background processes.(Counter)\n redis_cpu_sys_seconds_total: System CPU consumed by the Redis server, which is the sum of system CPU consumed by all threads of the server process (main thread and background threads).(Counter)\n redis_cpu_user_children_seconds_total: User CPU consumed by the background processes.(Counter)\n redis_cpu_user_seconds_total: User CPU consumed by the Redis server, which is the sum of user CPU consumed by all threads of the server process (main thread and background threads).(Counter)\n redis_db_keys: Total number of keys by DB.\n redis_db_keys_expiring: Total number of expiring keys by DB\n redis_defrag_hits: Number of value reallocations performed by active the defragmentation process.\n redis_defrag_misses: Number of aborted value reallocations started by the active defragmentation process.\n redis_defrag_key_hits: Number of keys that were actively defragmented.\n redis_defrag_key_misses: Number of keys that were skipped by the active defragmentation process.\n redis_evicted_keys_total: Number of evicted keys due to maxmemory limit.(Counter)\n redis_expired_keys_total: Total number of key expiration events.(Counter)\n redis_expired_stale_percentage: The percentage of keys probably expired.\n redis_expired_time_cap_reached_total: The count of times that active expiry cycles have stopped early.\n redis_exporter_last_scrape_connect_time_seconds: The duration(in seconds) to connect when scrape.\n redis_exporter_last_scrape_duration_seconds: The last scrape duration.\n redis_exporter_last_scrape_error: The last scrape error status.\n redis_exporter_scrape_duration_seconds_count: Durations of scrapes by the exporter\n redis_exporter_scrape_duration_seconds_sum: Durations of scrapes by the exporter\n redis_exporter_scrapes_total: Current total redis scrapes.(Counter)\n redis_instance_info: Information about the Redis instance.\n redis_keyspace_hits_total: Hits total.(Counter)\n redis_keyspace_misses_total: Misses total.(Counter)\n redis_last_key_groups_scrape_duration_milliseconds: Duration of the last key group metrics scrape in milliseconds.\n redis_last_slow_execution_duration_seconds: The amount of time needed for last slow execution, in seconds.\n redis_latest_fork_seconds: The amount of time needed for last fork, in seconds.\n redis_lazyfree_pending_objects: The number of objects waiting to be freed (as a result of calling UNLINK, or FLUSHDB and FLUSHALL with the ASYNC option).\n redis_master_repl_offset: The server's current replication offset.\n redis_mem_clients_normal: Memory used by normal clients.(Gauge)\n redis_mem_clients_slaves: Memory used by replica clients - Starting Redis 7.0, replica buffers share memory with the replication backlog, so this field can show 0 when replicas don't trigger an increase of memory usage.\n redis_mem_fragmentation_bytes: Delta between used_memory_rss and used_memory. Note that when the total fragmentation bytes is low (few megabytes), a high ratio (e.g. 1.5 and above) is not an indication of an issue.\n redis_mem_fragmentation_ratio: Ratio between used_memory_rss and used_memory. Note that this doesn't only includes fragmentation, but also other process overheads (see the allocator_* metrics), and also overheads like code, shared libraries, stack, etc.\n redis_mem_not_counted_for_eviction_bytes: (Gauge)\n redis_memory_max_bytes: Max memory limit in bytes.\n redis_memory_used_bytes: Total number of bytes allocated by Redis using its allocator (either standard libc, jemalloc, or an alternative allocator such as tcmalloc)\n redis_memory_used_dataset_bytes: The size in bytes of the dataset (used_memory_overhead subtracted from used_memory)\n redis_memory_used_lua_bytes: Number of bytes used by the Lua engine.\n redis_memory_used_overhead_bytes: The sum in bytes of all overheads that the server allocated for managing its internal data structures.\n redis_memory_used_peak_bytes: Peak memory consumed by Redis (in bytes)\n redis_memory_used_rss_bytes: Number of bytes that Redis allocated as seen by the operating system (a.k.a resident set size). This is the number reported by tools such as top(1) and ps(1)\n redis_memory_used_scripts_bytes: Number of bytes used by cached Lua scripts\n redis_memory_used_startup_bytes: Initial amount of memory consumed by Redis at startup in bytes\n redis_migrate_cached_sockets_total: The number of sockets open for MIGRATE purposes\n redis_net_input_bytes_total: Total input bytes(Counter)\n redis_net_output_bytes_total: Total output bytes(Counter)\n redis_process_id: Process ID\n redis_pubsub_channels: Global number of pub/sub channels with client subscriptions\n redis_pubsub_patterns: Global number of pub/sub pattern with client subscriptions\n redis_rdb_bgsave_in_progress: Flag indicating a RDB save is on-going\n redis_rdb_changes_since_last_save: Number of changes since the last dump\n redis_rdb_current_bgsave_duration_sec: Duration of the on-going RDB save operation if any\n redis_rdb_last_bgsave_duration_sec: Duration of the last RDB save operation in seconds\n redis_rdb_last_bgsave_status: Status of the last RDB save operation\n redis_rdb_last_cow_size_bytes: The size in bytes of copy-on-write memory during the last RDB save operation\n redis_rdb_last_save_timestamp_seconds: Epoch-based timestamp of last successful RDB save\n redis_rejected_connections_total: Number of connections rejected because of maxclients limit(Counter)\n redis_repl_backlog_first_byte_offset: The master offset of the replication backlog buffer\n redis_repl_backlog_history_bytes: Size in bytes of the data in the replication backlog buffer\n redis_repl_backlog_is_active: Flag indicating replication backlog is active\n redis_replica_partial_resync_accepted: The number of accepted partial resync requests(Gauge)\n redis_replica_partial_resync_denied: The number of denied partial resync requests(Gauge)\n redis_replica_resyncs_full: The number of full resyncs with replicas\n redis_replication_backlog_bytes: Memory used by replication backlog\n redis_second_repl_offset: The offset up to which replication IDs are accepted.\n redis_slave_expires_tracked_keys: The number of keys tracked for expiry purposes (applicable only to writable replicas)(Gauge)\n redis_slowlog_last_id: Last id of slowlog\n redis_slowlog_length: Total slowlog\n redis_start_time_seconds: Start time of the Redis instance since unix epoch in seconds.\n redis_target_scrape_request_errors_total: Errors in requests to the exporter\n redis_up: Flag indicating redis instance is up\n redis_uptime_in_seconds: Number of seconds since Redis server start\n\n # [windows_exporter]\n windows_cpu_clock_interrupts_total: Total number of received and serviced clock tick interrupts(counter)\n windows_cpu_core_frequency_mhz: Core frequency in megahertz(gauge)\n windows_cpu_cstate_seconds_total: Time spent in low-power idle state(counter)\n windows_cpu_dpcs_total: Total number of received and serviced deferred procedure calls (DPCs)(counter)\n windows_cpu_idle_break_events_total: Total number of time processor was woken from idle(counter)\n windows_cpu_interrupts_total: Total number of received and serviced hardware interrupts(counter)\n windows_cpu_parking_status: Parking Status represents whether a processor is parked or not(gauge)\n windows_cpu_processor_performance: Processor Performance is the average performance of the processor while it is executing instructions, as a percentage of the nominal performance of the processor. On some processors, Processor Performance may exceed 100%(gauge)\n windows_cpu_time_total: Time that processor spent in different modes (idle, user, system, ...)(counter)\n windows_cs_hostname: Labeled system hostname information as provided by ComputerSystem.DNSHostName and ComputerSystem.Domain(gauge)\n windows_cs_logical_processors: ComputerSystem.NumberOfLogicalProcessors(gauge)\n windows_cs_physical_memory_bytes: ComputerSystem.TotalPhysicalMemory(gauge)\n windows_exporter_build_info: A metric with a constant '1' value labeled by version, revision, branch, and goversion from which windows_exporter was built.(gauge)\n windows_exporter_collector_duration_seconds: Duration of a collection.(gauge)\n windows_exporter_collector_success: Whether the collector was successful.(gauge)\n windows_exporter_collector_timeout: Whether the collector timed out.(gauge)\n windows_exporter_perflib_snapshot_duration_seconds: Duration of perflib snapshot capture(gauge)\n windows_logical_disk_free_bytes: Free space in bytes (LogicalDisk.PercentFreeSpace)(gauge)\n windows_logical_disk_idle_seconds_total: Seconds that the disk was idle (LogicalDisk.PercentIdleTime)(counter)\n windows_logical_disk_read_bytes_total: The number of bytes transferred from the disk during read operations (LogicalDisk.DiskReadBytesPerSec)(counter)\n windows_logical_disk_read_latency_seconds_total: Shows the average time, in seconds, of a read operation from the disk (LogicalDisk.AvgDiskSecPerRead)(counter)\n windows_logical_disk_read_seconds_total: Seconds that the disk was busy servicing read requests (LogicalDisk.PercentDiskReadTime)(counter)\n windows_logical_disk_read_write_latency_seconds_total: Shows the time, in seconds, of the average disk transfer (LogicalDisk.AvgDiskSecPerTransfer)(counter)\n windows_logical_disk_reads_total: The number of read operations on the disk (LogicalDisk.DiskReadsPerSec)(counter)\n windows_logical_disk_requests_queued: The number of requests queued to the disk (LogicalDisk.CurrentDiskQueueLength)(gauge)\n windows_logical_disk_size_bytes: Total space in bytes (LogicalDisk.PercentFreeSpace_Base)(gauge)\n windows_logical_disk_split_ios_total: The number of I/Os to the disk were split into multiple I/Os (LogicalDisk.SplitIOPerSec)(counter)\n windows_logical_disk_write_bytes_total: The number of bytes transferred to the disk during write operations (LogicalDisk.DiskWriteBytesPerSec)(counter)\n windows_logical_disk_write_latency_seconds_total: Shows the average time, in seconds, of a write operation to the disk (LogicalDisk.AvgDiskSecPerWrite)(counter)\n windows_logical_disk_write_seconds_total: Seconds that the disk was busy servicing write requests (LogicalDisk.PercentDiskWriteTime)(counter)\n windows_logical_disk_writes_total: The number of write operations on the disk (LogicalDisk.DiskWritesPerSec)(counter)\n windows_net_bytes_received_total: (Network.BytesReceivedPerSec)(counter)\n windows_net_bytes_sent_total: (Network.BytesSentPerSec)(counter)\n windows_net_bytes_total: (Network.BytesTotalPerSec)(counter)\n windows_net_current_bandwidth: (Network.CurrentBandwidth)(gauge)\n windows_net_packets_outbound_discarded_total: (Network.PacketsOutboundDiscarded)(counter)\n windows_net_packets_outbound_errors_total: (Network.PacketsOutboundErrors)(counter)\n windows_net_packets_received_discarded_total: (Network.PacketsReceivedDiscarded)(counter)\n windows_net_packets_received_errors_total: (Network.PacketsReceivedErrors)(counter)\n windows_net_packets_received_total: (Network.PacketsReceivedPerSec)(counter)\n windows_net_packets_received_unknown_total: (Network.PacketsReceivedUnknown)(counter)\n windows_net_packets_sent_total: (Network.PacketsSentPerSec)(counter)\n windows_net_packets_total: (Network.PacketsPerSec)(counter)\n windows_os_info: OperatingSystem.Caption, OperatingSystem.Version(gauge)\n windows_os_paging_free_bytes: OperatingSystem.FreeSpaceInPagingFiles(gauge)\n windows_os_paging_limit_bytes: OperatingSystem.SizeStoredInPagingFiles(gauge)\n windows_os_physical_memory_free_bytes: OperatingSystem.FreePhysicalMemory(gauge)\n windows_os_process_memory_limix_bytes: OperatingSystem.MaxProcessMemorySize(gauge)\n windows_os_processes: OperatingSystem.NumberOfProcesses(gauge)\n windows_os_processes_limit: OperatingSystem.MaxNumberOfProcesses(gauge)\n windows_os_time: OperatingSystem.LocalDateTime(gauge)\n windows_os_timezone: OperatingSystem.LocalDateTime(gauge)\n windows_os_users: OperatingSystem.NumberOfUsers(gauge)\n windows_os_virtual_memory_bytes: OperatingSystem.TotalVirtualMemorySize(gauge)\n windows_os_virtual_memory_free_bytes: OperatingSystem.FreeVirtualMemory(gauge)\n windows_os_visible_memory_bytes: OperatingSystem.TotalVisibleMemorySize(gauge)\n windows_service_info: A metric with a constant '1' value labeled with service information(gauge)\n windows_service_start_mode: The start mode of the service (StartMode)(gauge)\n windows_service_state: The state of the service (State)(gauge)\n windows_service_status: The status of the service (Status)(gauge)\n windows_system_context_switches_total: Total number of context switches (WMI source is PerfOS_System.ContextSwitchesPersec)(counter)\n windows_system_exception_dispatches_total: Total number of exceptions dispatched (WMI source is PerfOS_System.ExceptionDispatchesPersec)(counter)\n windows_system_processor_queue_length: Length of processor queue (WMI source is PerfOS_System.ProcessorQueueLength)(gauge)\n windows_system_system_calls_total: Total number of system calls (WMI source is PerfOS_System.SystemCallsPersec)(counter)\n windows_system_system_up_time: System boot time (WMI source is PerfOS_System.SystemUpTime)(gauge)\n windows_system_threads: Current number of threads (WMI source is PerfOS_System.Threads)(gauge)\n\n # [node_exporter]\n # SYSTEM\n # CPU context switch 次数\n node_context_switches_total: context_switches\n # Interrupts 次数\n node_intr_total: Interrupts\n # 运行的进程数\n node_procs_running: Processes in runnable state\n # 熵池大小\n node_entropy_available_bits: Entropy available to random number generators\n node_time_seconds: System time in seconds since epoch (1970)\n node_boot_time_seconds: Node boot time, in unixtime\n # CPU\n node_cpu_seconds_total: Seconds the CPUs spent in each mode\n node_load1: cpu load 1m\n node_load5: cpu load 5m\n node_load15: cpu load 15m\n\n # MEM\n # 内核态\n # 内核用于缓存数据结构供自己使用的内存\n node_memory_Slab_bytes: Memory used by the kernel to cache data structures for its own use\n # slab中可回收的部分\n node_memory_SReclaimable_bytes: SReclaimable - Part of Slab, that might be reclaimed, such as caches\n # slab中不可回收的部分\n node_memory_SUnreclaim_bytes: Part of Slab, that cannot be reclaimed on memory pressure\n # Vmalloc内存区的大小\n node_memory_VmallocTotal_bytes: Total size of vmalloc memory area\n # vmalloc已分配的内存,虚拟地址空间上的连续的内存\n node_memory_VmallocUsed_bytes: Amount of vmalloc area which is used\n # vmalloc区可用的连续最大快的大小,通过此指标可以知道vmalloc可分配连续内存的最大值\n node_memory_VmallocChunk_bytes: Largest contiguous block of vmalloc area which is free\n # 内存的硬件故障删除掉的内存页的总大小\n node_memory_HardwareCorrupted_bytes: Amount of RAM that the kernel identified as corrupted / not working\n # 用于在虚拟和物理内存地址之间映射的内存\n node_memory_PageTables_bytes: Memory used to map between virtual and physical memory addresses (gauge)\n # 内核栈内存,常驻内存,不可回收\n node_memory_KernelStack_bytes: Kernel memory stack. This is not reclaimable\n # 用来访问高端内存,复制高端内存的临时buffer,称为“bounce buffering”,会降低I/O 性能\n node_memory_Bounce_bytes: Memory used for block device bounce buffers\n #用户态\n # 单个巨页大小\n node_memory_Hugepagesize_bytes: Huge Page size\n # 系统分配的常驻巨页数\n node_memory_HugePages_Total: Total size of the pool of huge pages\n # 系统空闲的巨页数\n node_memory_HugePages_Free: Huge pages in the pool that are not yet allocated\n # 进程已申请但未使用的巨页数\n node_memory_HugePages_Rsvd: Huge pages for which a commitment to allocate from the pool has been made, but no allocation\n # 超过系统设定的常驻HugePages数量的个数\n node_memory_HugePages_Surp: Huge pages in the pool above the value in /proc/sys/vm/nr_hugepages\n # 透明巨页 Transparent HugePages (THP)\n node_memory_AnonHugePages_bytes: Memory in anonymous huge pages\n # inactivelist中的File-backed内存\n node_memory_Inactive_file_bytes: File-backed memory on inactive LRU list\n # inactivelist中的Anonymous内存\n node_memory_Inactive_anon_bytes: Anonymous and swap cache on inactive LRU list, including tmpfs (shmem)\n # activelist中的File-backed内存\n node_memory_Active_file_bytes: File-backed memory on active LRU list\n # activelist中的Anonymous内存\n node_memory_Active_anon_bytes: Anonymous and swap cache on active least-recently-used (LRU) list, including tmpfs\n # 禁止换出的页,对应 Unevictable 链表\n node_memory_Unevictable_bytes: Amount of unevictable memory that can't be swapped out for a variety of reasons\n # 共享内存\n node_memory_Shmem_bytes: Used shared memory (shared between several processes, thus including RAM disks)\n # 匿名页内存大小\n node_memory_AnonPages_bytes: Memory in user pages not backed by files\n # 被关联的内存页大小\n node_memory_Mapped_bytes: Used memory in mapped pages files which have been mapped, such as libraries\n # file-backed内存页缓存大小\n node_memory_Cached_bytes: Parked file data (file content) cache\n # 系统中有多少匿名页曾经被swap-out、现在又被swap-in并且swap-in之后页面中的内容一直没发生变化\n node_memory_SwapCached_bytes: Memory that keeps track of pages that have been fetched from swap but not yet been modified\n # 被mlock()系统调用锁定的内存大小\n node_memory_Mlocked_bytes: Size of pages locked to memory using the mlock() system call\n # 块设备(block device)所占用的缓存页\n node_memory_Buffers_bytes: Block device (e.g. harddisk) cache\n node_memory_SwapTotal_bytes: Memory information field SwapTotal_bytes\n node_memory_SwapFree_bytes: Memory information field SwapFree_bytes\n\n # DISK\n node_filesystem_avail_bytes: Filesystem space available to non-root users in byte\n node_filesystem_free_bytes: Filesystem free space in bytes\n node_filesystem_size_bytes: Filesystem size in bytes\n node_filesystem_files_free: Filesystem total free file nodes\n node_filesystem_files: Filesystem total free file nodes\n node_filefd_maximum: Max open files\n node_filefd_allocated: Open files\n node_filesystem_readonly: Filesystem read-only status\n node_filesystem_device_error: Whether an error occurred while getting statistics for the given device\n node_disk_reads_completed_total: The total number of reads completed successfully\n node_disk_writes_completed_total: The total number of writes completed successfully\n node_disk_reads_merged_total: The number of reads merged\n node_disk_writes_merged_total: The number of writes merged\n node_disk_read_bytes_total: The total number of bytes read successfully\n node_disk_written_bytes_total: The total number of bytes written successfully\n node_disk_io_time_seconds_total: Total seconds spent doing I/Os\n node_disk_read_time_seconds_total: The total number of seconds spent by all reads\n node_disk_write_time_seconds_total: The total number of seconds spent by all writes\n node_disk_io_time_weighted_seconds_total: The weighted of seconds spent doing I/Os\n\n # NET\n node_network_receive_bytes_total: Network device statistic receive_bytes (counter)\n node_network_transmit_bytes_total: Network device statistic transmit_bytes (counter)\n node_network_receive_packets_total: Network device statistic receive_bytes\n node_network_transmit_packets_total: Network device statistic transmit_bytes\n node_network_receive_errs_total: Network device statistic receive_errs\n node_network_transmit_errs_total: Network device statistic transmit_errs\n node_network_receive_drop_total: Network device statistic receive_drop\n node_network_transmit_drop_total: Network device statistic transmit_drop\n node_nf_conntrack_entries: Number of currently allocated flow entries for connection tracking\n node_sockstat_TCP_alloc: Number of TCP sockets in state alloc\n node_sockstat_TCP_inuse: Number of TCP sockets in state inuse\n node_sockstat_TCP_orphan: Number of TCP sockets in state orphan\n node_sockstat_TCP_tw: Number of TCP sockets in state tw\n node_netstat_Tcp_CurrEstab: Statistic TcpCurrEstab\n node_sockstat_sockets_used: Number of IPv4 sockets in use\n\n # [kafka_exporter]\n kafka_brokers: count of kafka_brokers (gauge)\n kafka_topic_partitions: Number of partitions for this Topic (gauge)\n kafka_topic_partition_current_offset: Current Offset of a Broker at Topic/Partition (gauge)\n kafka_consumergroup_current_offset: Current Offset of a ConsumerGroup at Topic/Partition (gauge)\n kafka_consumer_lag_millis: Current approximation of consumer lag for a ConsumerGroup at Topic/Partition (gauge)\n kafka_topic_partition_under_replicated_partition: 1 if Topic/Partition is under Replicated\n\n # [zookeeper_exporter]\n zk_znode_count: The total count of znodes stored\n zk_ephemerals_count: The number of Ephemerals nodes\n zk_watch_count: The number of watchers setup over Zookeeper nodes.\n zk_approximate_data_size: Size of data in bytes that a zookeeper server has in its data tree\n zk_outstanding_requests: Number of currently executing requests\n zk_packets_sent: Count of the number of zookeeper packets sent from a server\n zk_packets_received: Count of the number of zookeeper packets received by a server\n zk_num_alive_connections: Number of active clients connected to a zookeeper server\n zk_open_file_descriptor_count: Number of file descriptors that a zookeeper server has open\n zk_max_file_descriptor_count: Maximum number of file descriptors that a zookeeper server can open\n zk_avg_latency: Average time in milliseconds for requests to be processed\n zk_min_latency: Maximum time in milliseconds for a request to be processed\n zk_max_latency: Minimum time in milliseconds for a request to be processed\n"
},
{
"path": "docker/compose-bridge/etc-nightingale/script/notify.bak.py",
"content": "#!/usr/bin/env python\n# -*- coding: UTF-8 -*-\nimport sys\nimport json\nimport urllib2\nimport smtplib\nfrom email.mime.text import MIMEText\n\nreload(sys)\nsys.setdefaultencoding('utf8')\n\nnotify_channel_funcs = {\n \"email\":\"email\",\n \"sms\":\"sms\",\n \"voice\":\"voice\",\n \"dingtalk\":\"dingtalk\",\n \"wecom\":\"wecom\",\n \"feishu\":\"feishu\"\n}\n\nmail_host = \"smtp.163.com\"\nmail_port = 994\nmail_user = \"ulricqin\"\nmail_pass = \"password\"\nmail_from = \"ulricqin@163.com\"\n\nclass Sender(object):\n @classmethod\n def send_email(cls, payload):\n if mail_user == \"ulricqin\" and mail_pass == \"password\":\n print(\"invalid smtp configuration\")\n return\n\n users = payload.get('event').get(\"notify_users_obj\")\n\n emails = {}\n for u in users:\n if u.get(\"email\"):\n emails[u.get(\"email\")] = 1\n\n if not emails:\n return\n\n recipients = emails.keys()\n mail_body = payload.get('tpls').get(\"email.tpl\", \"email.tpl not found\")\n message = MIMEText(mail_body, 'html', 'utf-8')\n message['From'] = mail_from\n message['To'] = \", \".join(recipients)\n message[\"Subject\"] = payload.get('tpls').get(\"subject.tpl\", \"subject.tpl not found\")\n\n try:\n smtp = smtplib.SMTP_SSL(mail_host, mail_port)\n smtp.login(mail_user, mail_pass)\n smtp.sendmail(mail_from, recipients, message.as_string())\n smtp.close()\n except smtplib.SMTPException, error:\n print(error)\n\n @classmethod\n def send_wecom(cls, payload):\n users = payload.get('event').get(\"notify_users_obj\")\n\n tokens = {}\n\n for u in users:\n contacts = u.get(\"contacts\")\n if contacts.get(\"wecom_robot_token\", \"\"):\n tokens[contacts.get(\"wecom_robot_token\", \"\")] = 1\n\n opener = urllib2.build_opener(urllib2.HTTPHandler())\n method = \"POST\"\n\n for t in tokens:\n url = \"https://qyapi.weixin.qq.com/cgi-bin/webhook/send?key={}\".format(t)\n body = {\n \"msgtype\": \"markdown\",\n \"markdown\": {\n \"content\": payload.get('tpls').get(\"wecom.tpl\", \"wecom.tpl not found\")\n }\n }\n request = urllib2.Request(url, data=json.dumps(body))\n request.add_header(\"Content-Type\",'application/json;charset=utf-8')\n request.get_method = lambda: method\n try:\n connection = opener.open(request)\n print(connection.read())\n except urllib2.HTTPError, error:\n print(error)\n\n @classmethod\n def send_dingtalk(cls, payload):\n event = payload.get('event')\n users = event.get(\"notify_users_obj\")\n\n rule_name = event.get(\"rule_name\")\n event_state = \"Triggered\"\n if event.get(\"is_recovered\"):\n event_state = \"Recovered\"\n\n tokens = {}\n phones = {}\n\n for u in users:\n if u.get(\"phone\"):\n phones[u.get(\"phone\")] = 1\n\n contacts = u.get(\"contacts\")\n if contacts.get(\"dingtalk_robot_token\", \"\"):\n tokens[contacts.get(\"dingtalk_robot_token\", \"\")] = 1\n\n opener = urllib2.build_opener(urllib2.HTTPHandler())\n method = \"POST\"\n\n for t in tokens:\n url = \"https://oapi.dingtalk.com/robot/send?access_token={}\".format(t)\n body = {\n \"msgtype\": \"markdown\",\n \"markdown\": {\n \"title\": \"{} - {}\".format(event_state, rule_name),\n \"text\": payload.get('tpls').get(\"dingtalk.tpl\", \"dingtalk.tpl not found\") + ' '.join([\"@\"+i for i in phones.keys()])\n },\n \"at\": {\n \"atMobiles\": phones.keys(),\n \"isAtAll\": False\n }\n }\n request = urllib2.Request(url, data=json.dumps(body))\n request.add_header(\"Content-Type\",'application/json;charset=utf-8')\n request.get_method = lambda: method\n try:\n connection = opener.open(request)\n print(connection.read())\n except urllib2.HTTPError, error:\n print(error)\n\n @classmethod\n def send_feishu(cls, payload):\n users = payload.get('event').get(\"notify_users_obj\")\n\n tokens = {}\n phones = {}\n\n for u in users:\n if u.get(\"phone\"):\n phones[u.get(\"phone\")] = 1\n\n contacts = u.get(\"contacts\")\n if contacts.get(\"feishu_robot_token\", \"\"):\n tokens[contacts.get(\"feishu_robot_token\", \"\")] = 1\n\n opener = urllib2.build_opener(urllib2.HTTPHandler())\n method = \"POST\"\n\n for t in tokens:\n url = \"https://open.feishu.cn/open-apis/bot/v2/hook/{}\".format(t)\n body = {\n \"msg_type\": \"text\",\n \"content\": {\n \"text\": payload.get('tpls').get(\"feishu.tpl\", \"feishu.tpl not found\")\n },\n \"at\": {\n \"atMobiles\": phones.keys(),\n \"isAtAll\": False\n }\n }\n request = urllib2.Request(url, data=json.dumps(body))\n request.add_header(\"Content-Type\",'application/json;charset=utf-8')\n request.get_method = lambda: method\n try:\n connection = opener.open(request)\n print(connection.read())\n except urllib2.HTTPError, error:\n print(error)\n\n @classmethod\n def send_sms(cls, payload):\n users = payload.get('event').get(\"notify_users_obj\")\n phones = {}\n for u in users:\n if u.get(\"phone\"):\n phones[u.get(\"phone\")] = 1\n if phones:\n print(\"send_sms not implemented, phones: {}\".format(phones.keys()))\n\n @classmethod\n def send_voice(cls, payload):\n users = payload.get('event').get(\"notify_users_obj\")\n phones = {}\n for u in users:\n if u.get(\"phone\"):\n phones[u.get(\"phone\")] = 1\n if phones:\n print(\"send_voice not implemented, phones: {}\".format(phones.keys()))\n\ndef main():\n payload = json.load(sys.stdin)\n with open(\".payload\", 'w') as f:\n f.write(json.dumps(payload, indent=4))\n for ch in payload.get('event').get('notify_channels'):\n send_func_name = \"send_{}\".format(notify_channel_funcs.get(ch.strip()))\n if not hasattr(Sender, send_func_name):\n print(\"function: {} not found\", send_func_name)\n continue\n send_func = getattr(Sender, send_func_name)\n send_func(payload)\n\ndef hello():\n print(\"hello nightingale\")\n\nif __name__ == \"__main__\":\n if len(sys.argv) == 1:\n main()\n elif sys.argv[1] == \"hello\":\n hello()\n else:\n print(\"I am confused\")"
},
{
"path": "docker/compose-bridge/etc-nightingale/script/notify.py",
"content": "#!/usr/bin/env python3\n# -*- coding: UTF-8 -*-\nimport sys\nimport json\n\nclass Sender(object):\n @classmethod\n def send_email(cls, payload):\n # already done in go code\n pass\n\n @classmethod\n def send_wecom(cls, payload):\n # already done in go code\n pass\n\n @classmethod\n def send_dingtalk(cls, payload):\n # already done in go code\n pass\n\n @classmethod\n def send_feishu(cls, payload):\n # already done in go code\n pass\n\n @classmethod\n def send_mm(cls, payload):\n # already done in go code\n pass\n\n @classmethod\n def send_sms(cls, payload):\n users = payload.get('event').get(\"notify_users_obj\")\n phones = {}\n for u in users:\n if u.get(\"phone\"):\n phones[u.get(\"phone\")] = 1\n if phones:\n print(\"send_sms not implemented, phones: {}\".format(phones.keys()))\n\n @classmethod\n def send_voice(cls, payload):\n users = payload.get('event').get(\"notify_users_obj\")\n phones = {}\n for u in users:\n if u.get(\"phone\"):\n phones[u.get(\"phone\")] = 1\n if phones:\n print(\"send_voice not implemented, phones: {}\".format(phones.keys()))\n\ndef main():\n payload = json.load(sys.stdin)\n with open(\".payload\", 'w') as f:\n f.write(json.dumps(payload, indent=4))\n for ch in payload.get('event').get('notify_channels'):\n send_func_name = \"send_{}\".format(ch.strip())\n if not hasattr(Sender, send_func_name):\n print(\"function: {} not found\", send_func_name)\n continue\n send_func = getattr(Sender, send_func_name)\n send_func(payload)\n\ndef hello():\n print(\"hello nightingale\")\n\nif __name__ == \"__main__\":\n if len(sys.argv) == 1:\n main()\n elif sys.argv[1] == \"hello\":\n hello()\n else:\n print(\"I am confused\")\n"
},
{
"path": "docker/compose-bridge/etc-nightingale/script/notify_feishu.py",
"content": "#!/usr/bin/env python\n# -*- coding: UTF-8 -*-\nimport sys\nimport json\nimport requests\n\nclass Sender(object):\n @classmethod\n def send_email(cls, payload):\n # already done in go code\n pass\n\n @classmethod\n def send_wecom(cls, payload):\n # already done in go code\n pass\n\n @classmethod\n def send_dingtalk(cls, payload):\n # already done in go code\n pass\n\n @classmethod\n def send_ifeishu(cls, payload):\n users = payload.get('event').get(\"notify_users_obj\")\n tokens = {}\n phones = {}\n\n for u in users:\n if u.get(\"phone\"):\n phones[u.get(\"phone\")] = 1\n\n contacts = u.get(\"contacts\")\n if contacts.get(\"feishu_robot_token\", \"\"):\n tokens[contacts.get(\"feishu_robot_token\", \"\")] = 1\n \n headers = {\n \"Content-Type\": \"application/json;charset=utf-8\",\n \"Host\": \"open.feishu.cn\"\n }\n\n for t in tokens:\n url = \"https://open.feishu.cn/open-apis/bot/v2/hook/{}\".format(t)\n body = {\n \"msg_type\": \"text\",\n \"content\": {\n \"text\": payload.get('tpls').get(\"feishu\", \"feishu not found\")\n },\n \"at\": {\n \"atMobiles\": list(phones.keys()),\n \"isAtAll\": False\n }\n }\n\n response = requests.post(url, headers=headers, data=json.dumps(body))\n print(f\"notify_ifeishu: token={t} status_code={response.status_code} response_text={response.text}\")\n\n @classmethod\n def send_mm(cls, payload):\n # already done in go code\n pass\n\n @classmethod\n def send_sms(cls, payload):\n pass\n\n @classmethod\n def send_voice(cls, payload):\n pass\n\ndef main():\n payload = json.load(sys.stdin)\n with open(\".payload\", 'w') as f:\n f.write(json.dumps(payload, indent=4))\n for ch in payload.get('event').get('notify_channels'):\n send_func_name = \"send_{}\".format(ch.strip())\n if not hasattr(Sender, send_func_name):\n print(\"function: {} not found\", send_func_name)\n continue\n send_func = getattr(Sender, send_func_name)\n send_func(payload)\n\ndef hello():\n print(\"hello nightingale\")\n\nif __name__ == \"__main__\":\n if len(sys.argv) == 1:\n main()\n elif sys.argv[1] == \"hello\":\n hello()\n else:\n print(\"I am confused\")"
},
{
"path": "docker/compose-bridge/etc-nightingale/script/rule_converter.py",
"content": "import json\nimport yaml\n\n'''\n将promtheus/vmalert的rule转换为n9e中的rule\n支持k8s的rule configmap\n'''\n\nrule_file = 'rules.yaml'\n\n\ndef convert_interval(interval):\n if interval.endswith('s') or interval.endswith('S'):\n return int(interval[:-1])\n if interval.endswith('m') or interval.endswith('M'):\n return int(interval[:-1]) * 60\n if interval.endswith('h') or interval.endswith('H'):\n return int(interval[:-1]) * 60 * 60\n if interval.endswith('d') or interval.endswith('D'):\n return int(interval[:-1]) * 60 * 60 * 24\n return int(interval)\n\n\ndef convert_alert(rule, interval):\n name = rule['alert']\n prom_ql = rule['expr']\n if 'for' in rule:\n prom_for_duration = convert_interval(rule['for'])\n else:\n prom_for_duration = 0\n\n prom_eval_interval = convert_interval(interval)\n note = ''\n if 'annotations' in rule:\n for v in rule['annotations'].values():\n note = v\n break\n \n annotations = {}\n if 'annotations' in rule:\n for k, v in rule['annotations'].items():\n annotations[k] = v\n \n\n append_tags = []\n severity = 2\n if 'labels' in rule:\n for k, v in rule['labels'].items():\n if k != 'severity':\n append_tags.append('{}={}'.format(k, v))\n continue\n if v == 'critical':\n severity = 1\n elif v == 'info':\n severity = 3\n # elif v == 'warning':\n # severity = 2\n\n \n n9e_alert_rule = {\n \"name\": name,\n \"note\": note,\n \"severity\": severity,\n \"disabled\": 0,\n \"prom_for_duration\": prom_for_duration,\n \"prom_ql\": prom_ql,\n \"prom_eval_interval\": prom_eval_interval,\n \"enable_stime\": \"00:00\",\n \"enable_etime\": \"23:59\",\n \"enable_days_of_week\": [\n \"1\",\n \"2\",\n \"3\",\n \"4\",\n \"5\",\n \"6\",\n \"0\"\n ],\n \"enable_in_bg\": 0,\n \"notify_recovered\": 1,\n \"notify_channels\": [],\n \"notify_repeat_step\": 60,\n \"recover_duration\": 0,\n \"callbacks\": [],\n \"runbook_url\": \"\",\n \"append_tags\": append_tags,\n \"annotations\":annotations\n }\n return n9e_alert_rule\n\n\ndef convert_record(rule, interval):\n name = rule['record']\n prom_ql = rule['expr']\n prom_eval_interval = convert_interval(interval)\n note = ''\n append_tags = []\n if 'labels' in rule:\n for k, v in rule['labels'].items():\n append_tags.append('{}={}'.format(k, v))\n\n n9e_record_rule = {\n \"name\": name,\n \"note\": note,\n \"disabled\": 0,\n \"prom_ql\": prom_ql,\n \"prom_eval_interval\": prom_eval_interval,\n \"append_tags\": append_tags\n }\n return n9e_record_rule\n\n\n'''\nexample of rule group file\n---\ngroups:\n- name: example\n rules:\n - alert: HighRequestLatency\n expr: job:request_latency_seconds:mean5m{job=\"myjob\"} > 0.5\n for: 10m\n labels:\n severity: page\n annotations:\n summary: High request latency\n'''\ndef deal_group(group):\n \"\"\"\n parse single prometheus/vmalert rule group\n \"\"\"\n alert_rules = []\n record_rules = []\n\n for rule_segment in group['groups']:\n if 'interval' in rule_segment:\n interval = rule_segment['interval']\n else:\n interval = '15s'\n for rule in rule_segment['rules']:\n if 'alert' in rule:\n alert_rules.append(convert_alert(rule, interval))\n else:\n record_rules.append(convert_record(rule, interval))\n\n return alert_rules, record_rules\n\n\n'''\nexample of k8s rule configmap\n---\napiVersion: v1\nkind: ConfigMap\nmetadata:\n name: rulefiles-0\ndata:\n etcdrules.yaml: |\n groups:\n - name: etcd\n rules:\n - alert: etcdInsufficientMembers\n annotations:\n message: 'etcd cluster \"{{ $labels.job }}\": insufficient members ({{ $value}}).'\n expr: sum(up{job=~\".*etcd.*\"} == bool 1) by (job) < ((count(up{job=~\".*etcd.*\"})\n by (job) + 1) / 2)\n for: 3m\n labels:\n severity: critical\n'''\ndef deal_configmap(rule_configmap):\n \"\"\"\n parse rule configmap from k8s\n \"\"\"\n all_record_rules = []\n all_alert_rules = []\n for _, rule_group_str in rule_configmap['data'].items():\n rule_group = yaml.load(rule_group_str, Loader=yaml.FullLoader)\n alert_rules, record_rules = deal_group(rule_group)\n all_alert_rules.extend(alert_rules)\n all_record_rules.extend(record_rules)\n\n return all_alert_rules, all_record_rules\n\n\ndef main():\n with open(rule_file, 'r') as f:\n rule_config = yaml.load(f, Loader=yaml.FullLoader)\n \n # 如果文件是k8s中的configmap,使用下面的方法\n # alert_rules, record_rules = deal_configmap(rule_config)\n alert_rules, record_rules = deal_group(rule_config)\n\n with open(\"alert-rules.json\", 'w') as fw:\n json.dump(alert_rules, fw, indent=2, ensure_ascii=False)\n\n with open(\"record-rules.json\", 'w') as fw:\n json.dump(record_rules, fw, indent=2, ensure_ascii=False)\n\n\nif __name__ == '__main__':\n main()\n"
},
{
"path": "docker/compose-host-network/docker-compose.yaml",
"content": "version: \"3.7\"\n\nservices:\n mysql:\n image: \"mysql:8\"\n container_name: mysql\n hostname: mysql\n restart: always\n environment:\n TZ: Asia/Shanghai\n MYSQL_ROOT_PASSWORD: 1234\n volumes:\n - ./mysqldata:/var/lib/mysql/\n - ../initsql:/docker-entrypoint-initdb.d/\n - ./etc-mysql/my.cnf:/etc/my.cnf\n network_mode: host\n\n redis:\n image: \"redis:6.2\"\n container_name: redis\n hostname: redis\n restart: always\n environment:\n TZ: Asia/Shanghai\n network_mode: host\n\n prometheus:\n image: prom/prometheus:v2.55.1\n container_name: prometheus\n hostname: prometheus\n restart: always\n environment:\n TZ: Asia/Shanghai\n volumes:\n - ./etc-prometheus:/etc/prometheus\n network_mode: host\n command:\n - \"--config.file=/etc/prometheus/prometheus.yml\"\n - \"--storage.tsdb.path=/prometheus\"\n - \"--web.console.libraries=/usr/share/prometheus/console_libraries\"\n - \"--web.console.templates=/usr/share/prometheus/consoles\"\n - \"--enable-feature=remote-write-receiver\"\n - \"--query.lookback-delta=2m\"\n\n n9e:\n image: flashcatcloud/nightingale:latest\n container_name: n9e\n hostname: n9e\n restart: always\n environment:\n GIN_MODE: release\n TZ: Asia/Shanghai\n WAIT_HOSTS: 127.0.0.1:3306, 127.0.0.1:6379\n volumes:\n - ./etc-nightingale:/app/etc\n network_mode: host\n depends_on:\n - mysql\n - redis\n - prometheus\n command:\n - /app/n9e\n\n categraf:\n image: \"flashcatcloud/categraf:latest\"\n container_name: \"categraf\"\n hostname: \"categraf01\"\n restart: always\n environment:\n TZ: Asia/Shanghai\n HOST_PROC: /hostfs/proc\n HOST_SYS: /hostfs/sys\n HOST_MOUNT_PREFIX: /hostfs\n WAIT_HOSTS: 127.0.0.1:17000, 127.0.0.1:20090\n volumes:\n - ./etc-categraf:/etc/categraf/conf\n - /:/hostfs\n network_mode: host\n depends_on:\n - n9e"
},
{
"path": "docker/compose-host-network/etc-categraf/config.toml",
"content": "[global]\n# whether print configs\nprint_configs = false\n\n# add label(agent_hostname) to series\n# \"\" -> auto detect hostname\n# \"xx\" -> use specified string xx\n# \"$hostname\" -> auto detect hostname\n# \"$ip\" -> auto detect ip\n# \"$hostname-$ip\" -> auto detect hostname and ip to replace the vars\nhostname = \"$HOSTNAME\"\n\n# will not add label(agent_hostname) if true\nomit_hostname = false\n\n# s | ms\nprecision = \"ms\"\n\n# global collect interval\ninterval = 15\n\n[global.labels]\nsource=\"categraf\"\n# region = \"shanghai\"\n# env = \"localhost\"\n\n[writer_opt]\n# default: 2000\nbatch = 2000\n# channel(as queue) size\nchan_size = 10000\n\n[[writers]]\nurl = \"http://127.0.0.1:17000/prometheus/v1/write\"\n\n# Basic auth username\nbasic_auth_user = \"\"\n\n# Basic auth password\nbasic_auth_pass = \"\"\n\n# timeout settings, unit: ms\ntimeout = 5000\ndial_timeout = 2500\nmax_idle_conns_per_host = 100\n\n[http]\nenable = false\naddress = \":9100\"\nprint_access = false\nrun_mode = \"release\"\n\n[heartbeat]\nenable = true\n\n# report os version cpu.util mem.util metadata\nurl = \"http://127.0.0.1:17000/v1/n9e/heartbeat\"\n\n# interval, unit: s\ninterval = 10\n\n# Basic auth username\nbasic_auth_user = \"\"\n\n# Basic auth password\nbasic_auth_pass = \"\"\n\n## Optional headers\n# headers = [\"X-From\", \"categraf\", \"X-Xyz\", \"abc\"]\n\n# timeout settings, unit: ms\ntimeout = 5000\ndial_timeout = 2500\nmax_idle_conns_per_host = 100\n\n[ibex]\nenable = true\n## ibex flush interval\ninterval = \"1000ms\"\n## n9e ibex server rpc address\nservers = [\"127.0.0.1:20090\"]\n## temp script dir\nmeta_dir = \"./meta\"\n"
},
{
"path": "docker/compose-host-network/etc-categraf/input.cpu/cpu.toml",
"content": "# # collect interval\n# interval = 15\n\n# # whether collect per cpu\n# collect_per_cpu = false\n"
},
{
"path": "docker/compose-host-network/etc-categraf/input.disk/disk.toml",
"content": "# # collect interval\n# interval = 15\n\n# # By default stats will be gathered for all mount points.\n# # Set mount_points will restrict the stats to only the specified mount points.\n# mount_points = [\"/\"]\n\n# Ignore mount points by filesystem type.\nignore_fs = [\"tmpfs\", \"devtmpfs\", \"devfs\", \"iso9660\", \"overlay\", \"aufs\", \"squashfs\"]\n\nignore_mount_points = [\"/boot\"]\n"
},
{
"path": "docker/compose-host-network/etc-categraf/input.diskio/diskio.toml",
"content": "# # collect interval\n# interval = 15\n\n# # By default, categraf will gather stats for all devices including disk partitions.\n# # Setting devices will restrict the stats to the specified devices.\n# devices = [\"sda\", \"sdb\", \"vd*\"]"
},
{
"path": "docker/compose-host-network/etc-categraf/input.kernel/kernel.toml",
"content": "# # collect interval\n# interval = 15\n"
},
{
"path": "docker/compose-host-network/etc-categraf/input.mem/mem.toml",
"content": "# # collect interval\n# interval = 15\n\n# # whether collect platform specified metrics\ncollect_platform_fields = true\n"
},
{
"path": "docker/compose-host-network/etc-categraf/input.net/net.toml",
"content": "# # collect interval\n# interval = 15\n\n# # whether collect protocol stats on Linux\n# collect_protocol_stats = false\n\n# # setting interfaces will tell categraf to gather these explicit interfaces\n# interfaces = [\"eth0\"]"
},
{
"path": "docker/compose-host-network/etc-categraf/input.netstat/netstat.toml",
"content": "# # collect interval\n# interval = 15\n"
},
{
"path": "docker/compose-host-network/etc-categraf/input.processes/processes.toml",
"content": "# # collect interval\n# interval = 15\n\n# # force use ps command to gather\n# force_ps = false\n\n# # force use /proc to gather\n# force_proc = false"
},
{
"path": "docker/compose-host-network/etc-categraf/input.system/system.toml",
"content": "# # collect interval\n# interval = 15\n\n# # whether collect metric: system_n_users\n# collect_user_number = false\n"
},
{
"path": "docker/compose-host-network/etc-mysql/my.cnf",
"content": "[mysqld]\npid-file\t = /var/run/mysqld/mysqld.pid\nsocket\t\t = /var/run/mysqld/mysqld.sock\ndatadir\t\t = /var/lib/mysql\nbind-address = 127.0.0.1"
},
{
"path": "docker/compose-host-network/etc-nightingale/config.toml",
"content": "[Global]\nRunMode = \"release\"\n\n[Log]\n# log write dir\nDir = \"logs\"\n# log level: DEBUG INFO WARNING ERROR\nLevel = \"INFO\"\n# stdout, stderr, file\nOutput = \"stdout\"\n# # rotate by time\n# KeepHours = 4\n# # rotate by size\n# RotateNum = 3\n# # unit: MB\n# RotateSize = 256\n\n[HTTP]\n# http listening address\nHost = \"0.0.0.0\"\n# http listening port\nPort = 17000\n# https cert file path\nCertFile = \"\"\n# https key file path\nKeyFile = \"\"\n# whether print access log\nPrintAccessLog = false\n# whether enable pprof\nPProf = false\n# expose prometheus /metrics?\nExposeMetrics = true\n# http graceful shutdown timeout, unit: s\nShutdownTimeout = 30\n# max content length: 64M\nMaxContentLength = 67108864\n# http server read timeout, unit: s\nReadTimeout = 20\n# http server write timeout, unit: s\nWriteTimeout = 40\n# http server idle timeout, unit: s\nIdleTimeout = 120\n\n[HTTP.ShowCaptcha]\nEnable = false \n\n[HTTP.APIForAgent]\nEnable = true \n# [HTTP.APIForAgent.BasicAuth]\n# user001 = \"ccc26da7b9aba533cbb263a36c07dcc5\"\n\n[HTTP.APIForService]\nEnable = false\n[HTTP.APIForService.BasicAuth]\nuser001 = \"ccc26da7b9aba533cbb263a36c07dcc5\"\n\n[HTTP.JWTAuth]\n# unit: min\nAccessExpired = 1500\n# unit: min\nRefreshExpired = 10080\nRedisKeyPrefix = \"/jwt/\"\n\n[HTTP.ProxyAuth]\n# if proxy auth enabled, jwt auth is disabled\nEnable = false\n# username key in http proxy header\nHeaderUserNameKey = \"X-User-Name\"\nDefaultRoles = [\"Standard\"]\n\n[HTTP.RSA]\n# open RSA\nOpenRSA = false\n\n[DB]\n# postgres: host=%s port=%s user=%s dbname=%s password=%s sslmode=%s\n# postgres: DSN=\"host=127.0.0.1 port=5432 user=root dbname=n9e_v6 password=1234 sslmode=disable\"\nDSN=\"root:1234@tcp(127.0.0.1:3306)/n9e_v6?charset=utf8mb4&parseTime=True&loc=Local&allowNativePasswords=true\"\n# enable debug mode or not\nDebug = false\n# mysql postgres\nDBType = \"mysql\"\n# unit: s\nMaxLifetime = 7200\n# max open connections\nMaxOpenConns = 150\n# max idle connections\nMaxIdleConns = 50\n\n[Redis]\n# address, ip:port or ip1:port,ip2:port for cluster and sentinel(SentinelAddrs)\nAddress = \"127.0.0.1:6379\"\n# Username = \"\"\n# Password = \"\"\n# DB = 0\n# UseTLS = false\n# TLSMinVersion = \"1.2\"\n# standalone cluster sentinel\nRedisType = \"standalone\"\n# Mastername for sentinel type\n# MasterName = \"mymaster\"\n# SentinelUsername = \"\"\n# SentinelPassword = \"\"\n\n[Alert]\n[Alert.Heartbeat]\n# auto detect if blank\nIP = \"\"\n# unit ms\nInterval = 1000\nEngineName = \"default\"\n\n# [Alert.Alerting]\n# NotifyConcurrency = 10\n\n[Center]\nMetricsYamlFile = \"./etc/metrics.yaml\"\nI18NHeaderKey = \"X-Language\"\n\n[Center.AnonymousAccess]\nPromQuerier = true\nAlertDetail = true\n\n[Pushgw]\n# use target labels in database instead of in series\nLabelRewrite = true\nForceUseServerTS = true\n\n# [Pushgw.DebugSample]\n# ident = \"xx\"\n# __name__ = \"xx\"\n\n# [Pushgw.WriterOpt]\n# QueueMaxSize = 1000000\n# QueuePopSize = 1000\n\n[[Pushgw.Writers]] \n# Url = \"http://127.0.0.1:8480/insert/0/prometheus/api/v1/write\"\nUrl = \"http://127.0.0.1:9090/api/v1/write\"\n# Basic auth username\nBasicAuthUser = \"\"\n# Basic auth password\nBasicAuthPass = \"\"\n# timeout settings, unit: ms\nHeaders = [\"X-From\", \"n9e\"]\nTimeout = 10000\nDialTimeout = 3000\nTLSHandshakeTimeout = 30000\nExpectContinueTimeout = 1000\nIdleConnTimeout = 90000\n# time duration, unit: ms\nKeepAlive = 30000\nMaxConnsPerHost = 0\nMaxIdleConns = 100\nMaxIdleConnsPerHost = 100\n## Optional TLS Config\n# UseTLS = false\n# TLSCA = \"/etc/n9e/ca.pem\"\n# TLSCert = \"/etc/n9e/cert.pem\"\n# TLSKey = \"/etc/n9e/key.pem\"\n# InsecureSkipVerify = false\n# [[Writers.WriteRelabels]]\n# Action = \"replace\"\n# SourceLabels = [\"__address__\"]\n# Regex = \"([^:]+)(?::\\\\d+)?\"\n# Replacement = \"$1:80\"\n# TargetLabel = \"__address__\"\n\n[Ibex]\nEnable = true\nRPCListen = \"0.0.0.0:20090\""
},
{
"path": "docker/compose-host-network/etc-nightingale/metrics.yaml",
"content": "zh:\n ip_conntrack_count: 连接跟踪表条目总数(单位:int, count)\n ip_conntrack_max: 连接跟踪表最大容量(单位:int, size)\n cpu_usage_idle: CPU空闲率(单位:%)\n cpu_usage_active: CPU使用率(单位:%)\n cpu_usage_system: CPU内核态时间占比(单位:%)\n cpu_usage_user: CPU用户态时间占比(单位:%)\n cpu_usage_nice: 低优先级用户态CPU时间占比,也就是进程nice值被调整为1-19之间的CPU时间。这里注意,nice可取值范围是-20到19,数值越大,优先级反而越低(单位:%)\n cpu_usage_iowait: CPU等待I/O的时间占比(单位:%)\n cpu_usage_irq: CPU处理硬中断的时间占比(单位:%)\n cpu_usage_softirq: CPU处理软中断的时间占比(单位:%)\n cpu_usage_steal: 在虚拟机环境下有该指标,表示CPU被其他虚拟机争用的时间占比,超过20就表示争抢严重(单位:%)\n cpu_usage_guest: 通过虚拟化运行其他操作系统的时间,也就是运行虚拟机的CPU时间占比(单位:%)\n cpu_usage_guest_nice: 以低优先级运行虚拟机的时间占比(单位:%)\n\n disk_free: 硬盘分区剩余量(单位:byte)\n disk_used: 硬盘分区使用量(单位:byte)\n disk_used_percent: 硬盘分区使用率(单位:%)\n disk_total: 硬盘分区总量(单位:byte)\n disk_inodes_free: 硬盘分区inode剩余量\n disk_inodes_used: 硬盘分区inode使用量\n disk_inodes_total: 硬盘分区inode总量\n\n diskio_io_time: 从设备视角来看I/O请求总时间,队列中有I/O请求就计数(单位:毫秒),counter类型,需要用函数求rate才有使用价值\n diskio_iops_in_progress: 已经分配给设备驱动且尚未完成的IO请求,不包含在队列中但尚未分配给设备驱动的IO请求,gauge类型\n diskio_merged_reads: 相邻读请求merge读的次数,counter类型\n diskio_merged_writes: 相邻写请求merge写的次数,counter类型\n diskio_read_bytes: 读取的byte数量,counter类型,需要用函数求rate才有使用价值\n diskio_read_time: 读请求总时间(单位:毫秒),counter类型,需要用函数求rate才有使用价值\n diskio_reads: 读请求次数,counter类型,需要用函数求rate才有使用价值\n diskio_weighted_io_time: 从I/O请求视角来看I/O等待总时间,如果同时有多个I/O请求,时间会叠加(单位:毫秒)\n diskio_write_bytes: 写入的byte数量,counter类型,需要用函数求rate才有使用价值\n diskio_write_time: 写请求总时间(单位:毫秒),counter类型,需要用函数求rate才有使用价值\n diskio_writes: 写请求次数,counter类型,需要用函数求rate才有使用价值\n\n kernel_boot_time: 内核启动时间\n kernel_context_switches: 内核上下文切换次数\n kernel_entropy_avail: linux系统内部的熵池\n kernel_interrupts: 内核中断次数\n kernel_processes_forked: fork的进程数\n\n mem_active: 活跃使用的内存总数(包括cache和buffer内存)\n mem_available: 可用内存大小(bytes)\n mem_available_percent: 内存剩余百分比(0~100)\n mem_buffered: 用来给文件做缓冲大小\n mem_cached: 被高速缓冲存储器(cache memory)用的内存的大小(等于 diskcache minus SwapCache )\n mem_commit_limit: 根据超额分配比率('vm.overcommit_ratio'),这是当前在系统上分配可用的内存总量,这个限制只是在模式2('vm.overcommit_memory')时启用\n mem_committed_as: 目前在系统上分配的内存量。是所有进程申请的内存的总和\n mem_dirty: 等待被写回到磁盘的内存大小\n mem_free: 空闲内存大小(bytes)\n mem_high_free: 未被使用的高位内存大小\n mem_high_total: 高位内存总大小(Highmem是指所有内存高于860MB的物理内存,Highmem区域供用户程序使用,或用于页面缓存。该区域不是直接映射到内核空间。内核必须使用不同的手法使用该段内存)\n mem_huge_page_size: 每个大页的大小\n mem_huge_pages_free: 池中尚未分配的 HugePages 数量\n mem_huge_pages_total: 预留HugePages的总个数\n mem_inactive: 空闲的内存数(包括free和available的内存)\n mem_low_free: 未被使用的低位大小\n mem_low_total: 低位内存总大小,低位可以达到高位内存一样的作用,而且它还能够被内核用来记录一些自己的数据结构\n mem_mapped: 设备和文件等映射的大小\n mem_page_tables: 管理内存分页页面的索引表的大小\n mem_shared: 多个进程共享的内存总额\n mem_slab: 内核数据结构缓存的大小,可以减少申请和释放内存带来的消耗\n mem_sreclaimable: 可收回Slab的大小\n mem_sunreclaim: 不可收回Slab的大小(SUnreclaim+SReclaimable=Slab)\n mem_swap_cached: 被高速缓冲存储器(cache memory)用的交换空间的大小,已经被交换出来的内存,但仍然被存放在swapfile中。用来在需要的时候很快的被替换而不需要再次打开I/O端口\n mem_swap_free: 未被使用交换空间的大小\n mem_swap_total: 交换空间的总大小\n mem_total: 内存总数\n mem_used: 已用内存数\n mem_used_percent: 已用内存数百分比(0~100)\n mem_vmalloc_chunk: 最大的连续未被使用的vmalloc区域\n mem_vmalloc_totalL: 可以vmalloc虚拟内存大小\n mem_vmalloc_used: vmalloc已使用的虚拟内存大小\n mem_write_back: 正在被写回到磁盘的内存大小\n mem_write_back_tmp: FUSE用于临时写回缓冲区的内存\n\n net_bytes_recv: 网卡收包总数(bytes),计算每秒速率时需要用到rate/irate函数\n net_bytes_sent: 网卡发包总数(bytes),计算每秒速率时需要用到rate/irate函数\n net_drop_in: 网卡收丢包数量\n net_drop_out: 网卡发丢包数量\n net_err_in: 网卡收包错误数量\n net_err_out: 网卡发包错误数量\n net_packets_recv: 网卡收包数量\n net_packets_sent: 网卡发包数量\n net_bits_recv: 网卡收包总数(bits),计算每秒速率时需要用到rate/irate函数\n net_bits_sent: 网卡发包总数(bits),计算每秒速率时需要用到rate/irate函数\n\n netstat_tcp_established: ESTABLISHED状态的网络链接数\n netstat_tcp_fin_wait1: FIN_WAIT1状态的网络链接数\n netstat_tcp_fin_wait2: FIN_WAIT2状态的网络链接数\n netstat_tcp_last_ack: LAST_ACK状态的网络链接数\n netstat_tcp_listen: LISTEN状态的网络链接数\n netstat_tcp_syn_recv: SYN_RECV状态的网络链接数\n netstat_tcp_syn_sent: SYN_SENT状态的网络链接数\n netstat_tcp_time_wait: TIME_WAIT状态的网络链接数\n netstat_udp_socket: UDP状态的网络链接数\n\n netstat_sockets_used: 已使用的所有协议套接字总量\n netstat_tcp_inuse: 正在使用(正在侦听)的TCP套接字数量\n netstat_tcp_orphan: 无主(不属于任何进程)的TCP连接数(无用、待销毁的TCP socket数)\n netstat_tcp_tw: TIME_WAIT状态的TCP连接数\n netstat_tcp_alloc: 已分配(已建立、已申请到sk_buff)的TCP套接字数量\n netstat_tcp_mem: TCP套接字内存Page使用量\n netstat_udp_inuse: 在使用的UDP套接字数量\n netstat_udp_mem: UDP套接字内存Page使用量\n netstat_udplite_inuse: 正在使用的 udp lite 数量\n netstat_raw_inuse: 正在使用的 raw socket 数量\n netstat_frag_inuse: ip fragment 数量\n netstat_frag_memory: ip fragment 已经分配的内存(byte)\n\n #[ping]\n ping_percent_packet_loss: ping数据包丢失百分比(%)\n ping_result_code: ping返回码('0','1')\n\n net_response_result_code: 网络探测结果,0表示正常,非0表示异常\n net_response_response_time: 网络探测时延,单位:秒\n\n processes_blocked: 不可中断的睡眠状态下的进程数('U','D','L')\n processes_dead: 回收中的进程数('X')\n processes_idle: 挂起的空闲进程数('I')\n processes_paging: 分页进程数('P')\n processes_running: 运行中的进程数('R')\n processes_sleeping: 可中断进程数('S')\n processes_stopped: 暂停状态进程数('T')\n processes_total: 总进程数\n processes_total_threads: 总线程数\n processes_unknown: 未知状态进程数\n processes_zombies: 僵尸态进程数('Z')\n\n swap_used_percent: Swap空间换出数据量\n\n system_load1: 1分钟平均load值\n system_load5: 5分钟平均load值\n system_load15: 15分钟平均load值\n system_load_norm_1: 1分钟平均load值/逻辑CPU个数\n system_load_norm_5: 5分钟平均load值/逻辑CPU个数\n system_load_norm_15: 15分钟平均load值/逻辑CPU个数\n system_n_users: 用户数\n system_n_cpus: CPU核数\n system_uptime: 系统启动时间\n\n nginx_accepts: 自nginx启动起,与客户端建立过得连接总数\n nginx_active: 当前nginx正在处理的活动连接数,等于Reading/Writing/Waiting总和\n nginx_handled: 自nginx启动起,处理过的客户端连接总数\n nginx_reading: 正在读取HTTP请求头部的连接总数\n nginx_requests: 自nginx启动起,处理过的客户端请求总数,由于存在HTTP Keep-Alive请求,该值会大于handled值\n nginx_upstream_check_fall: upstream_check模块检测到后端失败的次数\n nginx_upstream_check_rise: upstream_check模块对后端的检测次数\n nginx_upstream_check_status_code: 后端upstream的状态,up为1,down为0\n nginx_waiting: 开启 keep-alive 的情况下,这个值等于 active – (reading+writing), 意思就是 Nginx 已经处理完正在等候下一次请求指令的驻留连接\n nginx_writing: 正在向客户端发送响应的连接总数\n\n http_response_content_length: HTTP消息实体的传输长度\n http_response_http_response_code: http响应状态码\n http_response_response_time: http响应用时\n http_response_result_code: url探测结果0为正常否则url无法访问\n\n # [aws cloudwatch rds]\n cloudwatch_aws_rds_bin_log_disk_usage_average: rds 磁盘使用平均值\n cloudwatch_aws_rds_bin_log_disk_usage_maximum: rds 磁盘使用量最大值\n cloudwatch_aws_rds_bin_log_disk_usage_minimum: rds binlog 磁盘使用量最低\n cloudwatch_aws_rds_bin_log_disk_usage_sample_count: rds binlog 磁盘使用情况样本计数\n cloudwatch_aws_rds_bin_log_disk_usage_sum: rds binlog 磁盘使用总和\n cloudwatch_aws_rds_burst_balance_average: rds 突发余额平均值\n cloudwatch_aws_rds_burst_balance_maximum: rds 突发余额最大值\n cloudwatch_aws_rds_burst_balance_minimum: rds 突发余额最低\n cloudwatch_aws_rds_burst_balance_sample_count: rds 突发平衡样本计数\n cloudwatch_aws_rds_burst_balance_sum: rds 突发余额总和\n cloudwatch_aws_rds_cpu_utilization_average: rds cpu 利用率平均值\n cloudwatch_aws_rds_cpu_utilization_maximum: rds cpu 利用率最大值\n cloudwatch_aws_rds_cpu_utilization_minimum: rds cpu 利用率最低\n cloudwatch_aws_rds_cpu_utilization_sample_count: rds cpu 利用率样本计数\n cloudwatch_aws_rds_cpu_utilization_sum: rds cpu 利用率总和\n cloudwatch_aws_rds_database_connections_average: rds 数据库连接平均值\n cloudwatch_aws_rds_database_connections_maximum: rds 数据库连接数最大值\n cloudwatch_aws_rds_database_connections_minimum: rds 数据库连接最小\n cloudwatch_aws_rds_database_connections_sample_count: rds 数据库连接样本数\n cloudwatch_aws_rds_database_connections_sum: rds 数据库连接总和\n cloudwatch_aws_rds_db_load_average: rds db 平均负载\n cloudwatch_aws_rds_db_load_cpu_average: rds db 负载 cpu 平均值\n cloudwatch_aws_rds_db_load_cpu_maximum: rds db 负载 cpu 最大值\n cloudwatch_aws_rds_db_load_cpu_minimum: rds db 负载 cpu 最小值\n cloudwatch_aws_rds_db_load_cpu_sample_count: rds db 加载 CPU 样本数\n cloudwatch_aws_rds_db_load_cpu_sum: rds db 加载cpu总和\n cloudwatch_aws_rds_db_load_maximum: rds 数据库负载最大值\n cloudwatch_aws_rds_db_load_minimum: rds 数据库负载最小值\n cloudwatch_aws_rds_db_load_non_cpu_average: rds 加载非 CPU 平均值\n cloudwatch_aws_rds_db_load_non_cpu_maximum: rds 加载非 cpu 最大值\n cloudwatch_aws_rds_db_load_non_cpu_minimum: rds 加载非 cpu 最小值\n cloudwatch_aws_rds_db_load_non_cpu_sample_count: rds 加载非 cpu 样本计数\n cloudwatch_aws_rds_db_load_non_cpu_sum: rds 加载非cpu总和\n cloudwatch_aws_rds_db_load_sample_count: rds db 加载样本计数\n cloudwatch_aws_rds_db_load_sum: rds db 负载总和\n cloudwatch_aws_rds_disk_queue_depth_average: rds 磁盘队列深度平均值\n cloudwatch_aws_rds_disk_queue_depth_maximum: rds 磁盘队列深度最大值\n cloudwatch_aws_rds_disk_queue_depth_minimum: rds 磁盘队列深度最小值\n cloudwatch_aws_rds_disk_queue_depth_sample_count: rds 磁盘队列深度样本计数\n cloudwatch_aws_rds_disk_queue_depth_sum: rds 磁盘队列深度总和\n cloudwatch_aws_rds_ebs_byte_balance__average: rds ebs 字节余额平均值\n cloudwatch_aws_rds_ebs_byte_balance__maximum: rds ebs 字节余额最大值\n cloudwatch_aws_rds_ebs_byte_balance__minimum: rds ebs 字节余额最低\n cloudwatch_aws_rds_ebs_byte_balance__sample_count: rds ebs 字节余额样本数\n cloudwatch_aws_rds_ebs_byte_balance__sum: rds ebs 字节余额总和\n cloudwatch_aws_rds_ebsio_balance__average: rds ebsio 余额平均值\n cloudwatch_aws_rds_ebsio_balance__maximum: rds ebsio 余额最大值\n cloudwatch_aws_rds_ebsio_balance__minimum: rds ebsio 余额最低\n cloudwatch_aws_rds_ebsio_balance__sample_count: rds ebsio 平衡样本计数\n cloudwatch_aws_rds_ebsio_balance__sum: rds ebsio 余额总和\n cloudwatch_aws_rds_free_storage_space_average: rds 免费存储空间平均\n cloudwatch_aws_rds_free_storage_space_maximum: rds 最大可用存储空间\n cloudwatch_aws_rds_free_storage_space_minimum: rds 最低可用存储空间\n cloudwatch_aws_rds_free_storage_space_sample_count: rds 可用存储空间样本数\n cloudwatch_aws_rds_free_storage_space_sum: rds 免费存储空间总和\n cloudwatch_aws_rds_freeable_memory_average: rds 可用内存平均值\n cloudwatch_aws_rds_freeable_memory_maximum: rds 最大可用内存\n cloudwatch_aws_rds_freeable_memory_minimum: rds 最小可用内存\n cloudwatch_aws_rds_freeable_memory_sample_count: rds 可释放内存样本数\n cloudwatch_aws_rds_freeable_memory_sum: rds 可释放内存总和\n cloudwatch_aws_rds_lvm_read_iops_average: rds lvm 读取 iops 平均值\n cloudwatch_aws_rds_lvm_read_iops_maximum: rds lvm 读取 iops 最大值\n cloudwatch_aws_rds_lvm_read_iops_minimum: rds lvm 读取 iops 最低\n cloudwatch_aws_rds_lvm_read_iops_sample_count: rds lvm 读取 iops 样本计数\n cloudwatch_aws_rds_lvm_read_iops_sum: rds lvm 读取 iops 总和\n cloudwatch_aws_rds_lvm_write_iops_average: rds lvm 写入 iops 平均值\n cloudwatch_aws_rds_lvm_write_iops_maximum: rds lvm 写入 iops 最大值\n cloudwatch_aws_rds_lvm_write_iops_minimum: rds lvm 写入 iops 最低\n cloudwatch_aws_rds_lvm_write_iops_sample_count: rds lvm 写入 iops 样本计数\n cloudwatch_aws_rds_lvm_write_iops_sum: rds lvm 写入 iops 总和\n cloudwatch_aws_rds_network_receive_throughput_average: rds 网络接收吞吐量平均\n cloudwatch_aws_rds_network_receive_throughput_maximum: rds 网络接收吞吐量最大值\n cloudwatch_aws_rds_network_receive_throughput_minimum: rds 网络接收吞吐量最小值\n cloudwatch_aws_rds_network_receive_throughput_sample_count: rds 网络接收吞吐量样本计数\n cloudwatch_aws_rds_network_receive_throughput_sum: rds 网络接收吞吐量总和\n cloudwatch_aws_rds_network_transmit_throughput_average: rds 网络传输吞吐量平均值\n cloudwatch_aws_rds_network_transmit_throughput_maximum: rds 网络传输吞吐量最大\n cloudwatch_aws_rds_network_transmit_throughput_minimum: rds 网络传输吞吐量最小值\n cloudwatch_aws_rds_network_transmit_throughput_sample_count: rds 网络传输吞吐量样本计数\n cloudwatch_aws_rds_network_transmit_throughput_sum: rds 网络传输吞吐量总和\n cloudwatch_aws_rds_read_iops_average: rds 读取 iops 平均值\n cloudwatch_aws_rds_read_iops_maximum: rds 最大读取 iops\n cloudwatch_aws_rds_read_iops_minimum: rds 读取 iops 最低\n cloudwatch_aws_rds_read_iops_sample_count: rds 读取 iops 样本计数\n cloudwatch_aws_rds_read_iops_sum: rds 读取 iops 总和\n cloudwatch_aws_rds_read_latency_average: rds 读取延迟平均值\n cloudwatch_aws_rds_read_latency_maximum: rds 读取延迟最大值\n cloudwatch_aws_rds_read_latency_minimum: rds 最小读取延迟\n cloudwatch_aws_rds_read_latency_sample_count: rds 读取延迟样本计数\n cloudwatch_aws_rds_read_latency_sum: rds 读取延迟总和\n cloudwatch_aws_rds_read_throughput_average: rds 读取吞吐量平均值\n cloudwatch_aws_rds_read_throughput_maximum: rds 最大读取吞吐量\n cloudwatch_aws_rds_read_throughput_minimum: rds 最小读取吞吐量\n cloudwatch_aws_rds_read_throughput_sample_count: rds 读取吞吐量样本计数\n cloudwatch_aws_rds_read_throughput_sum: rds 读取吞吐量总和\n cloudwatch_aws_rds_swap_usage_average: rds 交换使用平均值\n cloudwatch_aws_rds_swap_usage_maximum: rds 交换使用最大值\n cloudwatch_aws_rds_swap_usage_minimum: rds 交换使用量最低\n cloudwatch_aws_rds_swap_usage_sample_count: rds 交换使用示例计数\n cloudwatch_aws_rds_swap_usage_sum: rds 交换使用总和\n cloudwatch_aws_rds_write_iops_average: rds 写入 iops 平均值\n cloudwatch_aws_rds_write_iops_maximum: rds 写入 iops 最大值\n cloudwatch_aws_rds_write_iops_minimum: rds 写入 iops 最低\n cloudwatch_aws_rds_write_iops_sample_count: rds 写入 iops 样本计数\n cloudwatch_aws_rds_write_iops_sum: rds 写入 iops 总和\n cloudwatch_aws_rds_write_latency_average: rds 写入延迟平均值\n cloudwatch_aws_rds_write_latency_maximum: rds 最大写入延迟\n cloudwatch_aws_rds_write_latency_minimum: rds 写入延迟最小值\n cloudwatch_aws_rds_write_latency_sample_count: rds 写入延迟样本计数\n cloudwatch_aws_rds_write_latency_sum: rds 写入延迟总和\n cloudwatch_aws_rds_write_throughput_average: rds 写入吞吐量平均值\n cloudwatch_aws_rds_write_throughput_maximum: rds 最大写入吞吐量\n cloudwatch_aws_rds_write_throughput_minimum: rds 写入吞吐量最小值\n cloudwatch_aws_rds_write_throughput_sample_count: rds 写入吞吐量样本计数\n cloudwatch_aws_rds_write_throughput_sum: rds 写入吞吐量总和\n\nen:\n ip_conntrack_count: the number of entries in the conntrack table(unit:int, count)\n ip_conntrack_max: the max capacity of the conntrack table(unit:int, size)\n cpu_usage_idle: \"CPU idle rate(unit:%)\"\n cpu_usage_active: \"CPU usage rate(unit:%)\"\n cpu_usage_system: \"CPU kernel state time proportion(unit:%)\"\n cpu_usage_user: \"CPU user attitude time proportion(unit:%)\"\n cpu_usage_nice: \"The proportion of low priority CPU time, that is, the process NICE value is adjusted to the CPU time between 1-19. Note here that the value range of NICE is -20 to 19, the larger the value, the lower the priority, the lower the priority(unit:%)\"\n cpu_usage_iowait: \"CPU waiting for I/O time proportion(unit:%)\"\n cpu_usage_irq: \"CPU processing hard interrupt time proportion(unit:%)\"\n cpu_usage_softirq: \"CPU processing soft interrupt time proportion(unit:%)\"\n cpu_usage_steal: \"In the virtual machine environment, there is this indicator, which means that the CPU is used by other virtual machines for the proportion of time.(unit:%)\"\n cpu_usage_guest: \"The time to run other operating systems by virtualization, that is, the proportion of CPU time running the virtual machine(unit:%)\"\n cpu_usage_guest_nice: \"The proportion of time to run the virtual machine at low priority(unit:%)\"\n\n disk_free: \"The remaining amount of the hard disk partition (unit: byte)\"\n disk_used: \"Hard disk partitional use (unit: byte)\"\n disk_used_percent: \"Hard disk partitional use rate (unit:%)\"\n disk_total: \"Total amount of hard disk partition (unit: byte)\"\n disk_inodes_free: \"Hard disk partition INODE remaining amount\"\n disk_inodes_used: \"Hard disk partition INODE usage amount\"\n disk_inodes_total: \"The total amount of hard disk partition INODE\"\n\n diskio_io_time: \"From the perspective of the device perspective, the total time of I/O request, the I/O request in the queue is count (unit: millisecond), the counter type, you need to use the function to find the value\"\n diskio_iops_in_progress: \"IO requests that have been assigned to device -driven and have not yet been completed, not included in the queue but not yet assigned to the device -driven IO request, Gauge type\"\n diskio_merged_reads: \"The number of times of adjacent reading request Merge, the counter type\"\n diskio_merged_writes: \"The number of times the request Merge writes, the counter type\"\n diskio_read_bytes: \"The number of byte reads, the counter type, you need to use the function to find the Rate to use the value\"\n diskio_read_time: \"The total time of reading request (unit: millisecond), the counter type, you need to use the function to find the Rate to have the value of use\"\n diskio_reads: \"Read the number of requests, the counter type, you need to use the function to find the Rate to use the value\"\n diskio_weighted_io_time: \"From the perspective of the I/O request perspective, I/O wait for the total time. If there are multiple I/O requests at the same time, the time will be superimposed (unit: millisecond)\"\n diskio_write_bytes: \"The number of bytes written, the counter type, you need to use the function to find the Rate to use the value\"\n diskio_write_time: \"The total time of the request (unit: millisecond), the counter type, you need to use the function to find the rate to have the value of use\"\n diskio_writes: \"Write the number of requests, the counter type, you need to use the function to find the rate to use value\"\n\n kernel_boot_time: \"Kernel startup time\"\n kernel_context_switches: \"Number of kernel context switching times\"\n kernel_entropy_avail: \"Entropy pool inside the Linux system\"\n kernel_interrupts: \"Number of kernel interruption\"\n kernel_processes_forked: \"ForK's process number\"\n\n mem_active: \"The total number of memory (including Cache and BUFFER memory)\"\n mem_available: \"Application can use memory numbers\"\n mem_available_percent: \"Memory remaining percentage (0 ~ 100)\"\n mem_buffered: \"Used to make buffer size for the file\"\n mem_cached: \"The size of the memory used by the cache memory (equal to diskcache minus Swap Cache )\"\n mem_commit_limit: \"According to the over allocation ratio ('vm.overCommit _ Ratio'), this is the current total memory that can be allocated on the system.\"\n mem_committed_as: \"Currently allocated on the system. It is the sum of the memory of all process applications\"\n mem_dirty: \"Waiting to be written back to the memory size of the disk\"\n mem_free: \"Senior memory number\"\n mem_high_free: \"Unused high memory size\"\n mem_high_total: \"The total memory size of the high memory (Highmem refers to all the physical memory that is higher than 860 MB of memory, the HighMem area is used for user programs, or for page cache. This area is not directly mapped to the kernel space. The kernels must use different methods to use this section of memory. )\"\n mem_huge_page_size: \"The size of each big page\"\n mem_huge_pages_free: \"The number of Huge Pages in the pool that have not been allocated\"\n mem_huge_pages_total: \"Reserve the total number of Huge Pages\"\n mem_inactive: \"Free memory (including the memory of free and available)\"\n mem_low_free: \"Unused low size\"\n mem_low_total: \"The total size of the low memory memory can achieve the same role of high memory, and it can be used by the kernel to record some of its own data structure\"\n mem_mapped: \"The size of the mapping of equipment and files\"\n mem_page_tables: \"The size of the index table of the management of the memory paging page\"\n mem_shared: \"The total memory shared by multiple processes\"\n mem_slab: \"The size of the kernel data structure cache can reduce the consumption of application and release memory\"\n mem_sreclaimable: \"The size of the SLAB can be recovered\"\n mem_sunreclaim: \"The size of the SLAB cannot be recovered(SUnreclaim+SReclaimable=Slab)\"\n mem_swap_cached: \"The size of the swap space used by the cache memory (cache memory), the memory that has been swapped out, but is still stored in the swapfile. Used to be quickly replaced when needed without opening the I/O port again\"\n mem_swap_free: \"The size of the switching space is not used\"\n mem_swap_total: \"The total size of the exchange space\"\n mem_total: \"Total memory\"\n mem_used: \"Memory number\"\n mem_used_percent: \"The memory has been used by several percentage (0 ~ 100)\"\n mem_vmalloc_chunk: \"The largest continuous unused vmalloc area\"\n mem_vmalloc_totalL: \"You can vmalloc virtual memory size\"\n mem_vmalloc_used: \"Vmalloc's virtual memory size\"\n mem_write_back: \"The memory size of the disk is being written back to the disk\"\n mem_write_back_tmp: \"Fuse is used to temporarily write back the memory of the buffer area\"\n\n net_bytes_recv: \"Total inbound traffic(bytes) of network card\"\n net_bytes_sent: \"Total outbound traffic(bytes) of network card\"\n net_bits_recv: \"Total inbound traffic(bits) of network card\"\n net_bits_sent: \"Total outbound traffic(bits) of network card\"\n net_drop_in: \"The number of packets for network cards\"\n net_drop_out: \"The number of packets issued by the network card\"\n net_err_in: \"The number of incorrect packets of the network card\"\n net_err_out: \"Number of incorrect number of network cards\"\n net_packets_recv: \"Net card collection quantity\"\n net_packets_sent: \"Number of network card issuance\"\n\n netstat_tcp_established: \"ESTABLISHED status network link number\"\n netstat_tcp_fin_wait1: \"FIN _ WAIT1 status network link number\"\n netstat_tcp_fin_wait2: \"FIN _ WAIT2 status number of network links\"\n netstat_tcp_last_ack: \"LAST_ ACK status number of network links\"\n netstat_tcp_listen: \"Number of network links in Listen status\"\n netstat_tcp_syn_recv: \"SYN _ RECV status number of network links\"\n netstat_tcp_syn_sent: \"SYN _ SENT status number of network links\"\n netstat_tcp_time_wait: \"Time _ WAIT status network link number\"\n netstat_udp_socket: \"Number of network links in UDP status\"\n\n processes_blocked: \"The number of processes in the unreproducible sleep state('U','D','L')\"\n processes_dead: \"Number of processes in recycling('X')\"\n processes_idle: \"Number of idle processes hanging('I')\"\n processes_paging: \"Number of paging processes('P')\"\n processes_running: \"Number of processes during operation('R')\"\n processes_sleeping: \"Can interrupt the number of processes('S')\"\n processes_stopped: \"Pushing status process number('T')\"\n processes_total: \"Total process number\"\n processes_total_threads: \"Number of threads\"\n processes_unknown: \"Unknown status process number\"\n processes_zombies: \"Number of zombies('Z')\"\n\n swap_used_percent: \"SWAP space replace the data volume\"\n\n system_load1: \"1 minute average load value\"\n system_load5: \"5 minutes average load value\"\n system_load15: \"15 minutes average load value\"\n system_load_norm_1: \"1 minute average load value/logical CPU number\"\n system_load_norm_5: \"5 minutes average load value/logical CPU number\"\n system_load_norm_15: \"15 minutes average load value/logical CPU number\"\n system_n_users: \"User number\"\n system_n_cpus: \"CPU nuclear number\"\n system_uptime: \"System startup time\"\n\n nginx_accepts: \"Since Nginx started, the total number of connections has been established with the client\"\n nginx_active: \"The current number of activity connections that Nginx is being processed is equal to Reading/Writing/Waiting\"\n nginx_handled: \"Starting from Nginx, the total number of client connections that have been processed\"\n nginx_reading: \"Reading the total number of connections on the http request header\"\n nginx_requests: \"Since nginx is started, the total number of client requests processed, due to the existence of HTTP Keep-Alive requests, this value will be greater than the handled value\"\n nginx_upstream_check_fall: \"UPStream_CHECK module detects the number of back -end failures\"\n nginx_upstream_check_rise: \"UPSTREAM _ Check module to detect the number of back -end\"\n nginx_upstream_check_status_code: \"The state of the backstream is 1, and the down is 0\"\n nginx_waiting: \"When keep-alive is enabled, this value is equal to active – (reading+writing), which means that Nginx has processed the resident connection that is waiting for the next request command\"\n nginx_writing: \"The total number of connections to send a response to the client\"\n\n http_response_content_length: \"HTTP message entity transmission length\"\n http_response_http_response_code: \"http response status code\"\n http_response_response_time: \"When http ring application\"\n http_response_result_code: \"URL detection result 0 is normal, otherwise the URL cannot be accessed\"\n\n # [mysqld_exporter]\n mysql_global_status_uptime: The number of seconds that the server has been up.(Gauge)\n mysql_global_status_uptime_since_flush_status: The number of seconds since the most recent FLUSH STATUS statement.(Gauge)\n mysql_global_status_queries: The number of statements executed by the server. This variable includes statements executed within stored programs, unlike the Questions variable. It does not count COM_PING or COM_STATISTICS commands.(Counter)\n mysql_global_status_threads_connected: The number of currently open connections.(Counter)\n mysql_global_status_connections: The number of connection attempts (successful or not) to the MySQL server.(Gauge)\n mysql_global_status_max_used_connections: The maximum number of connections that have been in use simultaneously since the server started.(Gauge)\n mysql_global_status_threads_running: The number of threads that are not sleeping.(Gauge)\n mysql_global_status_questions: The number of statements executed by the server. This includes only statements sent to the server by clients and not statements executed within stored programs, unlike the Queries variable. This variable does not count COM_PING, COM_STATISTICS, COM_STMT_PREPARE, COM_STMT_CLOSE, or COM_STMT_RESET commands.(Counter)\n mysql_global_status_threads_cached: The number of threads in the thread cache.(Counter)\n mysql_global_status_threads_created: The number of threads created to handle connections. If Threads_created is big, you may want to increase the thread_cache_size value. The cache miss rate can be calculated as Threads_created/Connections.(Counter)\n mysql_global_status_created_tmp_tables: The number of internal temporary tables created by the server while executing statements.(Counter)\n mysql_global_status_created_tmp_disk_tables: The number of internal on-disk temporary tables created by the server while executing statements. You can compare the number of internal on-disk temporary tables created to the total number of internal temporary tables created by comparing Created_tmp_disk_tables and Created_tmp_tables values.(Counter)\n mysql_global_status_created_tmp_files: How many temporary files mysqld has created.(Counter)\n mysql_global_status_select_full_join: The number of joins that perform table scans because they do not use indexes. If this value is not 0, you should carefully check the indexes of your tables.(Counter)\n mysql_global_status_select_full_range_join: The number of joins that used a range search on a reference table.(Counter)\n mysql_global_status_select_range: The number of joins that used ranges on the first table. This is normally not a critical issue even if the value is quite large.(Counter)\n mysql_global_status_select_range_check: The number of joins without keys that check for key usage after each row. If this is not 0, you should carefully check the indexes of your tables.(Counter)\n mysql_global_status_select_scan: The number of joins that did a full scan of the first table.(Counter)\n mysql_global_status_sort_rows: The number of sorted rows.(Counter)\n mysql_global_status_sort_range: The number of sorts that were done using ranges.(Counter)\n mysql_global_status_sort_merge_passes: The number of merge passes that the sort algorithm has had to do. If this value is large, you should consider increasing the value of the sort_buffer_size system variable.(Counter)\n mysql_global_status_sort_scan: The number of sorts that were done by scanning the table.(Counter)\n mysql_global_status_slow_queries: The number of queries that have taken more than long_query_time seconds. This counter increments regardless of whether the slow query log is enabled.(Counter)\n mysql_global_status_aborted_connects: The number of failed attempts to connect to the MySQL server.(Counter)\n mysql_global_status_aborted_clients: The number of connections that were aborted because the client died without closing the connection properly.(Counter)\n mysql_global_status_table_locks_immediate: The number of times that a request for a table lock could be granted immediately. Locks Immediate rising and falling is normal activity.(Counter)\n mysql_global_status_table_locks_waited: The number of times that a request for a table lock could not be granted immediately and a wait was needed. If this is high and you have performance problems, you should first optimize your queries, and then either split your table or tables or use replication.(Counter)\n mysql_global_status_bytes_received: The number of bytes received from all clients.(Counter)\n mysql_global_status_bytes_sent: The number of bytes sent to all clients.(Counter)\n mysql_global_status_innodb_page_size: InnoDB page size (default 16KB). Many values are counted in pages; the page size enables them to be easily converted to bytes.(Gauge)\n mysql_global_status_buffer_pool_pages: The number of pages in the InnoDB buffer pool.(Gauge)\n mysql_global_status_commands_total: The number of times each xxx statement has been executed.(Counter)\n mysql_global_status_handlers_total: Handler statistics are internal statistics on how MySQL is selecting, updating, inserting, and modifying rows, tables, and indexes. This is in fact the layer between the Storage Engine and MySQL.(Counter)\n mysql_global_status_opened_files: The number of files that have been opened with my_open() (a mysys library function). Parts of the server that open files without using this function do not increment the count.(Counter)\n mysql_global_status_open_tables: The number of tables that are open.(Gauge)\n mysql_global_status_opened_tables: The number of tables that have been opened. If Opened_tables is big, your table_open_cache value is probably too small.(Counter)\n mysql_global_status_table_open_cache_hits: The number of hits for open tables cache lookups.(Counter)\n mysql_global_status_table_open_cache_misses: The number of misses for open tables cache lookups.(Counter)\n mysql_global_status_table_open_cache_overflows: The number of overflows for the open tables cache.(Counter)\n mysql_global_status_innodb_num_open_files: The number of files InnoDB currently holds open.(Gauge)\n mysql_global_status_connection_errors_total: These variables provide information about errors that occur during the client connection process.(Counter)\n mysql_global_status_innodb_buffer_pool_read_requests: The number of logical read requests.(Counter)\n mysql_global_status_innodb_buffer_pool_reads: The number of logical reads that InnoDB could not satisfy from the buffer pool, and had to read directly from disk.(Counter)\n\n mysql_global_variables_thread_cache_size: How many threads the server should cache for reuse.(Gauge)\n mysql_global_variables_max_connections: The maximum permitted number of simultaneous client connections.(Gauge)\n mysql_global_variables_innodb_buffer_pool_size: The size in bytes of the buffer pool, the memory area where InnoDB caches table and index data. The default value is 134217728 bytes (128MB).(Gauge)\n mysql_global_variables_innodb_log_buffer_size: The size in bytes of the buffer that InnoDB uses to write to the log files on disk.(Gauge)\n mysql_global_variables_key_buffer_size: Index blocks for MyISAM tables are buffered and are shared by all threads.(Gauge)\n mysql_global_variables_query_cache_size: The amount of memory allocated for caching query results.(Gauge)\n mysql_global_variables_table_open_cache: The number of open tables for all threads.(Gauge)\n mysql_global_variables_open_files_limit: The number of file descriptors available to mysqld from the operating system.(Gauge)\n\n # [redis_exporter]\n redis_active_defrag_running: When activedefrag is enabled, this indicates whether defragmentation is currently active, and the CPU percentage it intends to utilize.\n redis_allocator_active_bytes: Total bytes in the allocator active pages, this includes external-fragmentation.\n redis_allocator_allocated_bytes: Total bytes allocated form the allocator, including internal-fragmentation. Normally the same as used_memory.\n redis_allocator_frag_bytes: Delta between allocator_active and allocator_allocated. See note about mem_fragmentation_bytes.\n redis_allocator_frag_ratio: Ratio between allocator_active and allocator_allocated. This is the true (external) fragmentation metric (not mem_fragmentation_ratio).\n redis_allocator_resident_bytes: Total bytes resident (RSS) in the allocator, this includes pages that can be released to the OS (by MEMORY PURGE, or just waiting).\n redis_allocator_rss_bytes: Delta between allocator_resident and allocator_active.\n redis_allocator_rss_ratio: Ratio between allocator_resident and allocator_active. This usually indicates pages that the allocator can and probably will soon release back to the OS.\n redis_aof_current_rewrite_duration_sec: Duration of the on-going AOF rewrite operation if any.\n redis_aof_enabled: Flag indicating AOF logging is activated.\n redis_aof_last_bgrewrite_status: Status of the last AOF rewrite operation.\n redis_aof_last_cow_size_bytes: The size in bytes of copy-on-write memory during the last AOF rewrite operation.\n redis_aof_last_rewrite_duration_sec: Duration of the last AOF rewrite operation in seconds.\n redis_aof_last_write_status: Status of the last write operation to the AOF.\n redis_aof_rewrite_in_progress: Flag indicating a AOF rewrite operation is on-going.\n redis_aof_rewrite_scheduled: Flag indicating an AOF rewrite operation will be scheduled once the on-going RDB save is complete.\n redis_blocked_clients: Number of clients pending on a blocking call (BLPOP, BRPOP, BRPOPLPUSH, BLMOVE, BZPOPMIN, BZPOPMAX).\n redis_client_recent_max_input_buffer_bytes: Biggest input buffer among current client connections.\n redis_client_recent_max_output_buffer_bytes: Biggest output buffer among current client connections.\n redis_cluster_enabled: Indicate Redis cluster is enabled.\n redis_commands_duration_seconds_total: The total CPU time consumed by these commands.(Counter)\n redis_commands_processed_total: Total number of commands processed by the server.(Counter)\n redis_commands_total: The number of calls that reached command execution (not rejected).(Counter)\n redis_config_maxclients: The value of the maxclients configuration directive. This is the upper limit for the sum of connected_clients, connected_slaves and cluster_connections.\n redis_config_maxmemory: The value of the maxmemory configuration directive.\n redis_connected_clients: Number of client connections (excluding connections from replicas).\n redis_connected_slaves: Number of connected replicas.\n redis_connections_received_total: Total number of connections accepted by the server.(Counter)\n redis_cpu_sys_children_seconds_total: System CPU consumed by the background processes.(Counter)\n redis_cpu_sys_seconds_total: System CPU consumed by the Redis server, which is the sum of system CPU consumed by all threads of the server process (main thread and background threads).(Counter)\n redis_cpu_user_children_seconds_total: User CPU consumed by the background processes.(Counter)\n redis_cpu_user_seconds_total: User CPU consumed by the Redis server, which is the sum of user CPU consumed by all threads of the server process (main thread and background threads).(Counter)\n redis_db_keys: Total number of keys by DB.\n redis_db_keys_expiring: Total number of expiring keys by DB\n redis_defrag_hits: Number of value reallocations performed by active the defragmentation process.\n redis_defrag_misses: Number of aborted value reallocations started by the active defragmentation process.\n redis_defrag_key_hits: Number of keys that were actively defragmented.\n redis_defrag_key_misses: Number of keys that were skipped by the active defragmentation process.\n redis_evicted_keys_total: Number of evicted keys due to maxmemory limit.(Counter)\n redis_expired_keys_total: Total number of key expiration events.(Counter)\n redis_expired_stale_percentage: The percentage of keys probably expired.\n redis_expired_time_cap_reached_total: The count of times that active expiry cycles have stopped early.\n redis_exporter_last_scrape_connect_time_seconds: The duration(in seconds) to connect when scrape.\n redis_exporter_last_scrape_duration_seconds: The last scrape duration.\n redis_exporter_last_scrape_error: The last scrape error status.\n redis_exporter_scrape_duration_seconds_count: Durations of scrapes by the exporter\n redis_exporter_scrape_duration_seconds_sum: Durations of scrapes by the exporter\n redis_exporter_scrapes_total: Current total redis scrapes.(Counter)\n redis_instance_info: Information about the Redis instance.\n redis_keyspace_hits_total: Hits total.(Counter)\n redis_keyspace_misses_total: Misses total.(Counter)\n redis_last_key_groups_scrape_duration_milliseconds: Duration of the last key group metrics scrape in milliseconds.\n redis_last_slow_execution_duration_seconds: The amount of time needed for last slow execution, in seconds.\n redis_latest_fork_seconds: The amount of time needed for last fork, in seconds.\n redis_lazyfree_pending_objects: The number of objects waiting to be freed (as a result of calling UNLINK, or FLUSHDB and FLUSHALL with the ASYNC option).\n redis_master_repl_offset: The server's current replication offset.\n redis_mem_clients_normal: Memory used by normal clients.(Gauge)\n redis_mem_clients_slaves: Memory used by replica clients - Starting Redis 7.0, replica buffers share memory with the replication backlog, so this field can show 0 when replicas don't trigger an increase of memory usage.\n redis_mem_fragmentation_bytes: Delta between used_memory_rss and used_memory. Note that when the total fragmentation bytes is low (few megabytes), a high ratio (e.g. 1.5 and above) is not an indication of an issue.\n redis_mem_fragmentation_ratio: Ratio between used_memory_rss and used_memory. Note that this doesn't only includes fragmentation, but also other process overheads (see the allocator_* metrics), and also overheads like code, shared libraries, stack, etc.\n redis_mem_not_counted_for_eviction_bytes: (Gauge)\n redis_memory_max_bytes: Max memory limit in bytes.\n redis_memory_used_bytes: Total number of bytes allocated by Redis using its allocator (either standard libc, jemalloc, or an alternative allocator such as tcmalloc)\n redis_memory_used_dataset_bytes: The size in bytes of the dataset (used_memory_overhead subtracted from used_memory)\n redis_memory_used_lua_bytes: Number of bytes used by the Lua engine.\n redis_memory_used_overhead_bytes: The sum in bytes of all overheads that the server allocated for managing its internal data structures.\n redis_memory_used_peak_bytes: Peak memory consumed by Redis (in bytes)\n redis_memory_used_rss_bytes: Number of bytes that Redis allocated as seen by the operating system (a.k.a resident set size). This is the number reported by tools such as top(1) and ps(1)\n redis_memory_used_scripts_bytes: Number of bytes used by cached Lua scripts\n redis_memory_used_startup_bytes: Initial amount of memory consumed by Redis at startup in bytes\n redis_migrate_cached_sockets_total: The number of sockets open for MIGRATE purposes\n redis_net_input_bytes_total: Total input bytes(Counter)\n redis_net_output_bytes_total: Total output bytes(Counter)\n redis_process_id: Process ID\n redis_pubsub_channels: Global number of pub/sub channels with client subscriptions\n redis_pubsub_patterns: Global number of pub/sub pattern with client subscriptions\n redis_rdb_bgsave_in_progress: Flag indicating a RDB save is on-going\n redis_rdb_changes_since_last_save: Number of changes since the last dump\n redis_rdb_current_bgsave_duration_sec: Duration of the on-going RDB save operation if any\n redis_rdb_last_bgsave_duration_sec: Duration of the last RDB save operation in seconds\n redis_rdb_last_bgsave_status: Status of the last RDB save operation\n redis_rdb_last_cow_size_bytes: The size in bytes of copy-on-write memory during the last RDB save operation\n redis_rdb_last_save_timestamp_seconds: Epoch-based timestamp of last successful RDB save\n redis_rejected_connections_total: Number of connections rejected because of maxclients limit(Counter)\n redis_repl_backlog_first_byte_offset: The master offset of the replication backlog buffer\n redis_repl_backlog_history_bytes: Size in bytes of the data in the replication backlog buffer\n redis_repl_backlog_is_active: Flag indicating replication backlog is active\n redis_replica_partial_resync_accepted: The number of accepted partial resync requests(Gauge)\n redis_replica_partial_resync_denied: The number of denied partial resync requests(Gauge)\n redis_replica_resyncs_full: The number of full resyncs with replicas\n redis_replication_backlog_bytes: Memory used by replication backlog\n redis_second_repl_offset: The offset up to which replication IDs are accepted.\n redis_slave_expires_tracked_keys: The number of keys tracked for expiry purposes (applicable only to writable replicas)(Gauge)\n redis_slowlog_last_id: Last id of slowlog\n redis_slowlog_length: Total slowlog\n redis_start_time_seconds: Start time of the Redis instance since unix epoch in seconds.\n redis_target_scrape_request_errors_total: Errors in requests to the exporter\n redis_up: Flag indicating redis instance is up\n redis_uptime_in_seconds: Number of seconds since Redis server start\n\n # [windows_exporter]\n windows_cpu_clock_interrupts_total: Total number of received and serviced clock tick interrupts(counter)\n windows_cpu_core_frequency_mhz: Core frequency in megahertz(gauge)\n windows_cpu_cstate_seconds_total: Time spent in low-power idle state(counter)\n windows_cpu_dpcs_total: Total number of received and serviced deferred procedure calls (DPCs)(counter)\n windows_cpu_idle_break_events_total: Total number of time processor was woken from idle(counter)\n windows_cpu_interrupts_total: Total number of received and serviced hardware interrupts(counter)\n windows_cpu_parking_status: Parking Status represents whether a processor is parked or not(gauge)\n windows_cpu_processor_performance: Processor Performance is the average performance of the processor while it is executing instructions, as a percentage of the nominal performance of the processor. On some processors, Processor Performance may exceed 100%(gauge)\n windows_cpu_time_total: Time that processor spent in different modes (idle, user, system, ...)(counter)\n windows_cs_hostname: Labeled system hostname information as provided by ComputerSystem.DNSHostName and ComputerSystem.Domain(gauge)\n windows_cs_logical_processors: ComputerSystem.NumberOfLogicalProcessors(gauge)\n windows_cs_physical_memory_bytes: ComputerSystem.TotalPhysicalMemory(gauge)\n windows_exporter_build_info: A metric with a constant '1' value labeled by version, revision, branch, and goversion from which windows_exporter was built.(gauge)\n windows_exporter_collector_duration_seconds: Duration of a collection.(gauge)\n windows_exporter_collector_success: Whether the collector was successful.(gauge)\n windows_exporter_collector_timeout: Whether the collector timed out.(gauge)\n windows_exporter_perflib_snapshot_duration_seconds: Duration of perflib snapshot capture(gauge)\n windows_logical_disk_free_bytes: Free space in bytes (LogicalDisk.PercentFreeSpace)(gauge)\n windows_logical_disk_idle_seconds_total: Seconds that the disk was idle (LogicalDisk.PercentIdleTime)(counter)\n windows_logical_disk_read_bytes_total: The number of bytes transferred from the disk during read operations (LogicalDisk.DiskReadBytesPerSec)(counter)\n windows_logical_disk_read_latency_seconds_total: Shows the average time, in seconds, of a read operation from the disk (LogicalDisk.AvgDiskSecPerRead)(counter)\n windows_logical_disk_read_seconds_total: Seconds that the disk was busy servicing read requests (LogicalDisk.PercentDiskReadTime)(counter)\n windows_logical_disk_read_write_latency_seconds_total: Shows the time, in seconds, of the average disk transfer (LogicalDisk.AvgDiskSecPerTransfer)(counter)\n windows_logical_disk_reads_total: The number of read operations on the disk (LogicalDisk.DiskReadsPerSec)(counter)\n windows_logical_disk_requests_queued: The number of requests queued to the disk (LogicalDisk.CurrentDiskQueueLength)(gauge)\n windows_logical_disk_size_bytes: Total space in bytes (LogicalDisk.PercentFreeSpace_Base)(gauge)\n windows_logical_disk_split_ios_total: The number of I/Os to the disk were split into multiple I/Os (LogicalDisk.SplitIOPerSec)(counter)\n windows_logical_disk_write_bytes_total: The number of bytes transferred to the disk during write operations (LogicalDisk.DiskWriteBytesPerSec)(counter)\n windows_logical_disk_write_latency_seconds_total: Shows the average time, in seconds, of a write operation to the disk (LogicalDisk.AvgDiskSecPerWrite)(counter)\n windows_logical_disk_write_seconds_total: Seconds that the disk was busy servicing write requests (LogicalDisk.PercentDiskWriteTime)(counter)\n windows_logical_disk_writes_total: The number of write operations on the disk (LogicalDisk.DiskWritesPerSec)(counter)\n windows_net_bytes_received_total: (Network.BytesReceivedPerSec)(counter)\n windows_net_bytes_sent_total: (Network.BytesSentPerSec)(counter)\n windows_net_bytes_total: (Network.BytesTotalPerSec)(counter)\n windows_net_current_bandwidth: (Network.CurrentBandwidth)(gauge)\n windows_net_packets_outbound_discarded_total: (Network.PacketsOutboundDiscarded)(counter)\n windows_net_packets_outbound_errors_total: (Network.PacketsOutboundErrors)(counter)\n windows_net_packets_received_discarded_total: (Network.PacketsReceivedDiscarded)(counter)\n windows_net_packets_received_errors_total: (Network.PacketsReceivedErrors)(counter)\n windows_net_packets_received_total: (Network.PacketsReceivedPerSec)(counter)\n windows_net_packets_received_unknown_total: (Network.PacketsReceivedUnknown)(counter)\n windows_net_packets_sent_total: (Network.PacketsSentPerSec)(counter)\n windows_net_packets_total: (Network.PacketsPerSec)(counter)\n windows_os_info: OperatingSystem.Caption, OperatingSystem.Version(gauge)\n windows_os_paging_free_bytes: OperatingSystem.FreeSpaceInPagingFiles(gauge)\n windows_os_paging_limit_bytes: OperatingSystem.SizeStoredInPagingFiles(gauge)\n windows_os_physical_memory_free_bytes: OperatingSystem.FreePhysicalMemory(gauge)\n windows_os_process_memory_limix_bytes: OperatingSystem.MaxProcessMemorySize(gauge)\n windows_os_processes: OperatingSystem.NumberOfProcesses(gauge)\n windows_os_processes_limit: OperatingSystem.MaxNumberOfProcesses(gauge)\n windows_os_time: OperatingSystem.LocalDateTime(gauge)\n windows_os_timezone: OperatingSystem.LocalDateTime(gauge)\n windows_os_users: OperatingSystem.NumberOfUsers(gauge)\n windows_os_virtual_memory_bytes: OperatingSystem.TotalVirtualMemorySize(gauge)\n windows_os_virtual_memory_free_bytes: OperatingSystem.FreeVirtualMemory(gauge)\n windows_os_visible_memory_bytes: OperatingSystem.TotalVisibleMemorySize(gauge)\n windows_service_info: A metric with a constant '1' value labeled with service information(gauge)\n windows_service_start_mode: The start mode of the service (StartMode)(gauge)\n windows_service_state: The state of the service (State)(gauge)\n windows_service_status: The status of the service (Status)(gauge)\n windows_system_context_switches_total: Total number of context switches (WMI source is PerfOS_System.ContextSwitchesPersec)(counter)\n windows_system_exception_dispatches_total: Total number of exceptions dispatched (WMI source is PerfOS_System.ExceptionDispatchesPersec)(counter)\n windows_system_processor_queue_length: Length of processor queue (WMI source is PerfOS_System.ProcessorQueueLength)(gauge)\n windows_system_system_calls_total: Total number of system calls (WMI source is PerfOS_System.SystemCallsPersec)(counter)\n windows_system_system_up_time: System boot time (WMI source is PerfOS_System.SystemUpTime)(gauge)\n windows_system_threads: Current number of threads (WMI source is PerfOS_System.Threads)(gauge)\n\n # [node_exporter]\n # SYSTEM\n # CPU context switch 次数\n node_context_switches_total: context_switches\n # Interrupts 次数\n node_intr_total: Interrupts\n # 运行的进程数\n node_procs_running: Processes in runnable state\n # 熵池大小\n node_entropy_available_bits: Entropy available to random number generators\n node_time_seconds: System time in seconds since epoch (1970)\n node_boot_time_seconds: Node boot time, in unixtime\n # CPU\n node_cpu_seconds_total: Seconds the CPUs spent in each mode\n node_load1: cpu load 1m\n node_load5: cpu load 5m\n node_load15: cpu load 15m\n\n # MEM\n # 内核态\n # 内核用于缓存数据结构供自己使用的内存\n node_memory_Slab_bytes: Memory used by the kernel to cache data structures for its own use\n # slab中可回收的部分\n node_memory_SReclaimable_bytes: SReclaimable - Part of Slab, that might be reclaimed, such as caches\n # slab中不可回收的部分\n node_memory_SUnreclaim_bytes: Part of Slab, that cannot be reclaimed on memory pressure\n # Vmalloc内存区的大小\n node_memory_VmallocTotal_bytes: Total size of vmalloc memory area\n # vmalloc已分配的内存,虚拟地址空间上的连续的内存\n node_memory_VmallocUsed_bytes: Amount of vmalloc area which is used\n # vmalloc区可用的连续最大快的大小,通过此指标可以知道vmalloc可分配连续内存的最大值\n node_memory_VmallocChunk_bytes: Largest contiguous block of vmalloc area which is free\n # 内存的硬件故障删除掉的内存页的总大小\n node_memory_HardwareCorrupted_bytes: Amount of RAM that the kernel identified as corrupted / not working\n # 用于在虚拟和物理内存地址之间映射的内存\n node_memory_PageTables_bytes: Memory used to map between virtual and physical memory addresses (gauge)\n # 内核栈内存,常驻内存,不可回收\n node_memory_KernelStack_bytes: Kernel memory stack. This is not reclaimable\n # 用来访问高端内存,复制高端内存的临时buffer,称为“bounce buffering”,会降低I/O 性能\n node_memory_Bounce_bytes: Memory used for block device bounce buffers\n #用户态\n # 单个巨页大小\n node_memory_Hugepagesize_bytes: Huge Page size\n # 系统分配的常驻巨页数\n node_memory_HugePages_Total: Total size of the pool of huge pages\n # 系统空闲的巨页数\n node_memory_HugePages_Free: Huge pages in the pool that are not yet allocated\n # 进程已申请但未使用的巨页数\n node_memory_HugePages_Rsvd: Huge pages for which a commitment to allocate from the pool has been made, but no allocation\n # 超过系统设定的常驻HugePages数量的个数\n node_memory_HugePages_Surp: Huge pages in the pool above the value in /proc/sys/vm/nr_hugepages\n # 透明巨页 Transparent HugePages (THP)\n node_memory_AnonHugePages_bytes: Memory in anonymous huge pages\n # inactivelist中的File-backed内存\n node_memory_Inactive_file_bytes: File-backed memory on inactive LRU list\n # inactivelist中的Anonymous内存\n node_memory_Inactive_anon_bytes: Anonymous and swap cache on inactive LRU list, including tmpfs (shmem)\n # activelist中的File-backed内存\n node_memory_Active_file_bytes: File-backed memory on active LRU list\n # activelist中的Anonymous内存\n node_memory_Active_anon_bytes: Anonymous and swap cache on active least-recently-used (LRU) list, including tmpfs\n # 禁止换出的页,对应 Unevictable 链表\n node_memory_Unevictable_bytes: Amount of unevictable memory that can't be swapped out for a variety of reasons\n # 共享内存\n node_memory_Shmem_bytes: Used shared memory (shared between several processes, thus including RAM disks)\n # 匿名页内存大小\n node_memory_AnonPages_bytes: Memory in user pages not backed by files\n # 被关联的内存页大小\n node_memory_Mapped_bytes: Used memory in mapped pages files which have been mapped, such as libraries\n # file-backed内存页缓存大小\n node_memory_Cached_bytes: Parked file data (file content) cache\n # 系统中有多少匿名页曾经被swap-out、现在又被swap-in并且swap-in之后页面中的内容一直没发生变化\n node_memory_SwapCached_bytes: Memory that keeps track of pages that have been fetched from swap but not yet been modified\n # 被mlock()系统调用锁定的内存大小\n node_memory_Mlocked_bytes: Size of pages locked to memory using the mlock() system call\n # 块设备(block device)所占用的缓存页\n node_memory_Buffers_bytes: Block device (e.g. harddisk) cache\n node_memory_SwapTotal_bytes: Memory information field SwapTotal_bytes\n node_memory_SwapFree_bytes: Memory information field SwapFree_bytes\n\n # DISK\n node_filesystem_avail_bytes: Filesystem space available to non-root users in byte\n node_filesystem_free_bytes: Filesystem free space in bytes\n node_filesystem_size_bytes: Filesystem size in bytes\n node_filesystem_files_free: Filesystem total free file nodes\n node_filesystem_files: Filesystem total free file nodes\n node_filefd_maximum: Max open files\n node_filefd_allocated: Open files\n node_filesystem_readonly: Filesystem read-only status\n node_filesystem_device_error: Whether an error occurred while getting statistics for the given device\n node_disk_reads_completed_total: The total number of reads completed successfully\n node_disk_writes_completed_total: The total number of writes completed successfully\n node_disk_reads_merged_total: The number of reads merged\n node_disk_writes_merged_total: The number of writes merged\n node_disk_read_bytes_total: The total number of bytes read successfully\n node_disk_written_bytes_total: The total number of bytes written successfully\n node_disk_io_time_seconds_total: Total seconds spent doing I/Os\n node_disk_read_time_seconds_total: The total number of seconds spent by all reads\n node_disk_write_time_seconds_total: The total number of seconds spent by all writes\n node_disk_io_time_weighted_seconds_total: The weighted of seconds spent doing I/Os\n\n # NET\n node_network_receive_bytes_total: Network device statistic receive_bytes (counter)\n node_network_transmit_bytes_total: Network device statistic transmit_bytes (counter)\n node_network_receive_packets_total: Network device statistic receive_bytes\n node_network_transmit_packets_total: Network device statistic transmit_bytes\n node_network_receive_errs_total: Network device statistic receive_errs\n node_network_transmit_errs_total: Network device statistic transmit_errs\n node_network_receive_drop_total: Network device statistic receive_drop\n node_network_transmit_drop_total: Network device statistic transmit_drop\n node_nf_conntrack_entries: Number of currently allocated flow entries for connection tracking\n node_sockstat_TCP_alloc: Number of TCP sockets in state alloc\n node_sockstat_TCP_inuse: Number of TCP sockets in state inuse\n node_sockstat_TCP_orphan: Number of TCP sockets in state orphan\n node_sockstat_TCP_tw: Number of TCP sockets in state tw\n node_netstat_Tcp_CurrEstab: Statistic TcpCurrEstab\n node_sockstat_sockets_used: Number of IPv4 sockets in use\n\n # [kafka_exporter]\n kafka_brokers: count of kafka_brokers (gauge)\n kafka_topic_partitions: Number of partitions for this Topic (gauge)\n kafka_topic_partition_current_offset: Current Offset of a Broker at Topic/Partition (gauge)\n kafka_consumergroup_current_offset: Current Offset of a ConsumerGroup at Topic/Partition (gauge)\n kafka_consumer_lag_millis: Current approximation of consumer lag for a ConsumerGroup at Topic/Partition (gauge)\n kafka_topic_partition_under_replicated_partition: 1 if Topic/Partition is under Replicated\n\n # [zookeeper_exporter]\n zk_znode_count: The total count of znodes stored\n zk_ephemerals_count: The number of Ephemerals nodes\n zk_watch_count: The number of watchers setup over Zookeeper nodes.\n zk_approximate_data_size: Size of data in bytes that a zookeeper server has in its data tree\n zk_outstanding_requests: Number of currently executing requests\n zk_packets_sent: Count of the number of zookeeper packets sent from a server\n zk_packets_received: Count of the number of zookeeper packets received by a server\n zk_num_alive_connections: Number of active clients connected to a zookeeper server\n zk_open_file_descriptor_count: Number of file descriptors that a zookeeper server has open\n zk_max_file_descriptor_count: Maximum number of file descriptors that a zookeeper server can open\n zk_avg_latency: Average time in milliseconds for requests to be processed\n zk_min_latency: Maximum time in milliseconds for a request to be processed\n zk_max_latency: Minimum time in milliseconds for a request to be processed\n"
},
{
"path": "docker/compose-host-network/etc-nightingale/script/notify.bak.py",
"content": "#!/usr/bin/env python\n# -*- coding: UTF-8 -*-\nimport sys\nimport json\nimport urllib2\nimport smtplib\nfrom email.mime.text import MIMEText\n\nreload(sys)\nsys.setdefaultencoding('utf8')\n\nnotify_channel_funcs = {\n \"email\":\"email\",\n \"sms\":\"sms\",\n \"voice\":\"voice\",\n \"dingtalk\":\"dingtalk\",\n \"wecom\":\"wecom\",\n \"feishu\":\"feishu\"\n}\n\nmail_host = \"smtp.163.com\"\nmail_port = 994\nmail_user = \"ulricqin\"\nmail_pass = \"password\"\nmail_from = \"ulricqin@163.com\"\n\nclass Sender(object):\n @classmethod\n def send_email(cls, payload):\n if mail_user == \"ulricqin\" and mail_pass == \"password\":\n print(\"invalid smtp configuration\")\n return\n\n users = payload.get('event').get(\"notify_users_obj\")\n\n emails = {}\n for u in users:\n if u.get(\"email\"):\n emails[u.get(\"email\")] = 1\n\n if not emails:\n return\n\n recipients = emails.keys()\n mail_body = payload.get('tpls').get(\"email.tpl\", \"email.tpl not found\")\n message = MIMEText(mail_body, 'html', 'utf-8')\n message['From'] = mail_from\n message['To'] = \", \".join(recipients)\n message[\"Subject\"] = payload.get('tpls').get(\"subject.tpl\", \"subject.tpl not found\")\n\n try:\n smtp = smtplib.SMTP_SSL(mail_host, mail_port)\n smtp.login(mail_user, mail_pass)\n smtp.sendmail(mail_from, recipients, message.as_string())\n smtp.close()\n except smtplib.SMTPException, error:\n print(error)\n\n @classmethod\n def send_wecom(cls, payload):\n users = payload.get('event').get(\"notify_users_obj\")\n\n tokens = {}\n\n for u in users:\n contacts = u.get(\"contacts\")\n if contacts.get(\"wecom_robot_token\", \"\"):\n tokens[contacts.get(\"wecom_robot_token\", \"\")] = 1\n\n opener = urllib2.build_opener(urllib2.HTTPHandler())\n method = \"POST\"\n\n for t in tokens:\n url = \"https://qyapi.weixin.qq.com/cgi-bin/webhook/send?key={}\".format(t)\n body = {\n \"msgtype\": \"markdown\",\n \"markdown\": {\n \"content\": payload.get('tpls').get(\"wecom.tpl\", \"wecom.tpl not found\")\n }\n }\n request = urllib2.Request(url, data=json.dumps(body))\n request.add_header(\"Content-Type\",'application/json;charset=utf-8')\n request.get_method = lambda: method\n try:\n connection = opener.open(request)\n print(connection.read())\n except urllib2.HTTPError, error:\n print(error)\n\n @classmethod\n def send_dingtalk(cls, payload):\n event = payload.get('event')\n users = event.get(\"notify_users_obj\")\n\n rule_name = event.get(\"rule_name\")\n event_state = \"Triggered\"\n if event.get(\"is_recovered\"):\n event_state = \"Recovered\"\n\n tokens = {}\n phones = {}\n\n for u in users:\n if u.get(\"phone\"):\n phones[u.get(\"phone\")] = 1\n\n contacts = u.get(\"contacts\")\n if contacts.get(\"dingtalk_robot_token\", \"\"):\n tokens[contacts.get(\"dingtalk_robot_token\", \"\")] = 1\n\n opener = urllib2.build_opener(urllib2.HTTPHandler())\n method = \"POST\"\n\n for t in tokens:\n url = \"https://oapi.dingtalk.com/robot/send?access_token={}\".format(t)\n body = {\n \"msgtype\": \"markdown\",\n \"markdown\": {\n \"title\": \"{} - {}\".format(event_state, rule_name),\n \"text\": payload.get('tpls').get(\"dingtalk.tpl\", \"dingtalk.tpl not found\") + ' '.join([\"@\"+i for i in phones.keys()])\n },\n \"at\": {\n \"atMobiles\": phones.keys(),\n \"isAtAll\": False\n }\n }\n request = urllib2.Request(url, data=json.dumps(body))\n request.add_header(\"Content-Type\",'application/json;charset=utf-8')\n request.get_method = lambda: method\n try:\n connection = opener.open(request)\n print(connection.read())\n except urllib2.HTTPError, error:\n print(error)\n\n @classmethod\n def send_feishu(cls, payload):\n users = payload.get('event').get(\"notify_users_obj\")\n\n tokens = {}\n phones = {}\n\n for u in users:\n if u.get(\"phone\"):\n phones[u.get(\"phone\")] = 1\n\n contacts = u.get(\"contacts\")\n if contacts.get(\"feishu_robot_token\", \"\"):\n tokens[contacts.get(\"feishu_robot_token\", \"\")] = 1\n\n opener = urllib2.build_opener(urllib2.HTTPHandler())\n method = \"POST\"\n\n for t in tokens:\n url = \"https://open.feishu.cn/open-apis/bot/v2/hook/{}\".format(t)\n body = {\n \"msg_type\": \"text\",\n \"content\": {\n \"text\": payload.get('tpls').get(\"feishu.tpl\", \"feishu.tpl not found\")\n },\n \"at\": {\n \"atMobiles\": phones.keys(),\n \"isAtAll\": False\n }\n }\n request = urllib2.Request(url, data=json.dumps(body))\n request.add_header(\"Content-Type\",'application/json;charset=utf-8')\n request.get_method = lambda: method\n try:\n connection = opener.open(request)\n print(connection.read())\n except urllib2.HTTPError, error:\n print(error)\n\n @classmethod\n def send_sms(cls, payload):\n users = payload.get('event').get(\"notify_users_obj\")\n phones = {}\n for u in users:\n if u.get(\"phone\"):\n phones[u.get(\"phone\")] = 1\n if phones:\n print(\"send_sms not implemented, phones: {}\".format(phones.keys()))\n\n @classmethod\n def send_voice(cls, payload):\n users = payload.get('event').get(\"notify_users_obj\")\n phones = {}\n for u in users:\n if u.get(\"phone\"):\n phones[u.get(\"phone\")] = 1\n if phones:\n print(\"send_voice not implemented, phones: {}\".format(phones.keys()))\n\ndef main():\n payload = json.load(sys.stdin)\n with open(\".payload\", 'w') as f:\n f.write(json.dumps(payload, indent=4))\n for ch in payload.get('event').get('notify_channels'):\n send_func_name = \"send_{}\".format(notify_channel_funcs.get(ch.strip()))\n if not hasattr(Sender, send_func_name):\n print(\"function: {} not found\", send_func_name)\n continue\n send_func = getattr(Sender, send_func_name)\n send_func(payload)\n\ndef hello():\n print(\"hello nightingale\")\n\nif __name__ == \"__main__\":\n if len(sys.argv) == 1:\n main()\n elif sys.argv[1] == \"hello\":\n hello()\n else:\n print(\"I am confused\")"
},
{
"path": "docker/compose-host-network/etc-nightingale/script/notify.py",
"content": "#!/usr/bin/env python3\n# -*- coding: UTF-8 -*-\nimport sys\nimport json\n\nclass Sender(object):\n @classmethod\n def send_email(cls, payload):\n # already done in go code\n pass\n\n @classmethod\n def send_wecom(cls, payload):\n # already done in go code\n pass\n\n @classmethod\n def send_dingtalk(cls, payload):\n # already done in go code\n pass\n\n @classmethod\n def send_feishu(cls, payload):\n # already done in go code\n pass\n\n @classmethod\n def send_mm(cls, payload):\n # already done in go code\n pass\n\n @classmethod\n def send_sms(cls, payload):\n users = payload.get('event').get(\"notify_users_obj\")\n phones = {}\n for u in users:\n if u.get(\"phone\"):\n phones[u.get(\"phone\")] = 1\n if phones:\n print(\"send_sms not implemented, phones: {}\".format(phones.keys()))\n\n @classmethod\n def send_voice(cls, payload):\n users = payload.get('event').get(\"notify_users_obj\")\n phones = {}\n for u in users:\n if u.get(\"phone\"):\n phones[u.get(\"phone\")] = 1\n if phones:\n print(\"send_voice not implemented, phones: {}\".format(phones.keys()))\n\ndef main():\n payload = json.load(sys.stdin)\n with open(\".payload\", 'w') as f:\n f.write(json.dumps(payload, indent=4))\n for ch in payload.get('event').get('notify_channels'):\n send_func_name = \"send_{}\".format(ch.strip())\n if not hasattr(Sender, send_func_name):\n print(\"function: {} not found\", send_func_name)\n continue\n send_func = getattr(Sender, send_func_name)\n send_func(payload)\n\ndef hello():\n print(\"hello nightingale\")\n\nif __name__ == \"__main__\":\n if len(sys.argv) == 1:\n main()\n elif sys.argv[1] == \"hello\":\n hello()\n else:\n print(\"I am confused\")\n"
},
{
"path": "docker/compose-host-network/etc-nightingale/script/notify_feishu.py",
"content": "#!/usr/bin/env python\n# -*- coding: UTF-8 -*-\nimport sys\nimport json\nimport requests\n\nclass Sender(object):\n @classmethod\n def send_email(cls, payload):\n # already done in go code\n pass\n\n @classmethod\n def send_wecom(cls, payload):\n # already done in go code\n pass\n\n @classmethod\n def send_dingtalk(cls, payload):\n # already done in go code\n pass\n\n @classmethod\n def send_ifeishu(cls, payload):\n users = payload.get('event').get(\"notify_users_obj\")\n tokens = {}\n phones = {}\n\n for u in users:\n if u.get(\"phone\"):\n phones[u.get(\"phone\")] = 1\n\n contacts = u.get(\"contacts\")\n if contacts.get(\"feishu_robot_token\", \"\"):\n tokens[contacts.get(\"feishu_robot_token\", \"\")] = 1\n \n headers = {\n \"Content-Type\": \"application/json;charset=utf-8\",\n \"Host\": \"open.feishu.cn\"\n }\n\n for t in tokens:\n url = \"https://open.feishu.cn/open-apis/bot/v2/hook/{}\".format(t)\n body = {\n \"msg_type\": \"text\",\n \"content\": {\n \"text\": payload.get('tpls').get(\"feishu\", \"feishu not found\")\n },\n \"at\": {\n \"atMobiles\": list(phones.keys()),\n \"isAtAll\": False\n }\n }\n\n response = requests.post(url, headers=headers, data=json.dumps(body))\n print(f\"notify_ifeishu: token={t} status_code={response.status_code} response_text={response.text}\")\n\n @classmethod\n def send_mm(cls, payload):\n # already done in go code\n pass\n\n @classmethod\n def send_sms(cls, payload):\n pass\n\n @classmethod\n def send_voice(cls, payload):\n pass\n\ndef main():\n payload = json.load(sys.stdin)\n with open(\".payload\", 'w') as f:\n f.write(json.dumps(payload, indent=4))\n for ch in payload.get('event').get('notify_channels'):\n send_func_name = \"send_{}\".format(ch.strip())\n if not hasattr(Sender, send_func_name):\n print(\"function: {} not found\", send_func_name)\n continue\n send_func = getattr(Sender, send_func_name)\n send_func(payload)\n\ndef hello():\n print(\"hello nightingale\")\n\nif __name__ == \"__main__\":\n if len(sys.argv) == 1:\n main()\n elif sys.argv[1] == \"hello\":\n hello()\n else:\n print(\"I am confused\")"
},
{
"path": "docker/compose-host-network/etc-nightingale/script/rule_converter.py",
"content": "import json\nimport yaml\n\n'''\n将promtheus/vmalert的rule转换为n9e中的rule\n支持k8s的rule configmap\n'''\n\nrule_file = 'rules.yaml'\n\n\ndef convert_interval(interval):\n if interval.endswith('s') or interval.endswith('S'):\n return int(interval[:-1])\n if interval.endswith('m') or interval.endswith('M'):\n return int(interval[:-1]) * 60\n if interval.endswith('h') or interval.endswith('H'):\n return int(interval[:-1]) * 60 * 60\n if interval.endswith('d') or interval.endswith('D'):\n return int(interval[:-1]) * 60 * 60 * 24\n return int(interval)\n\n\ndef convert_alert(rule, interval):\n name = rule['alert']\n prom_ql = rule['expr']\n if 'for' in rule:\n prom_for_duration = convert_interval(rule['for'])\n else:\n prom_for_duration = 0\n\n prom_eval_interval = convert_interval(interval)\n note = ''\n if 'annotations' in rule:\n for v in rule['annotations'].values():\n note = v\n break\n \n annotations = {}\n if 'annotations' in rule:\n for k, v in rule['annotations'].items():\n annotations[k] = v\n \n\n append_tags = []\n severity = 2\n if 'labels' in rule:\n for k, v in rule['labels'].items():\n if k != 'severity':\n append_tags.append('{}={}'.format(k, v))\n continue\n if v == 'critical':\n severity = 1\n elif v == 'info':\n severity = 3\n # elif v == 'warning':\n # severity = 2\n\n \n n9e_alert_rule = {\n \"name\": name,\n \"note\": note,\n \"severity\": severity,\n \"disabled\": 0,\n \"prom_for_duration\": prom_for_duration,\n \"prom_ql\": prom_ql,\n \"prom_eval_interval\": prom_eval_interval,\n \"enable_stime\": \"00:00\",\n \"enable_etime\": \"23:59\",\n \"enable_days_of_week\": [\n \"1\",\n \"2\",\n \"3\",\n \"4\",\n \"5\",\n \"6\",\n \"0\"\n ],\n \"enable_in_bg\": 0,\n \"notify_recovered\": 1,\n \"notify_channels\": [],\n \"notify_repeat_step\": 60,\n \"recover_duration\": 0,\n \"callbacks\": [],\n \"runbook_url\": \"\",\n \"append_tags\": append_tags,\n \"annotations\":annotations\n }\n return n9e_alert_rule\n\n\ndef convert_record(rule, interval):\n name = rule['record']\n prom_ql = rule['expr']\n prom_eval_interval = convert_interval(interval)\n note = ''\n append_tags = []\n if 'labels' in rule:\n for k, v in rule['labels'].items():\n append_tags.append('{}={}'.format(k, v))\n\n n9e_record_rule = {\n \"name\": name,\n \"note\": note,\n \"disabled\": 0,\n \"prom_ql\": prom_ql,\n \"prom_eval_interval\": prom_eval_interval,\n \"append_tags\": append_tags\n }\n return n9e_record_rule\n\n\n'''\nexample of rule group file\n---\ngroups:\n- name: example\n rules:\n - alert: HighRequestLatency\n expr: job:request_latency_seconds:mean5m{job=\"myjob\"} > 0.5\n for: 10m\n labels:\n severity: page\n annotations:\n summary: High request latency\n'''\ndef deal_group(group):\n \"\"\"\n parse single prometheus/vmalert rule group\n \"\"\"\n alert_rules = []\n record_rules = []\n\n for rule_segment in group['groups']:\n if 'interval' in rule_segment:\n interval = rule_segment['interval']\n else:\n interval = '15s'\n for rule in rule_segment['rules']:\n if 'alert' in rule:\n alert_rules.append(convert_alert(rule, interval))\n else:\n record_rules.append(convert_record(rule, interval))\n\n return alert_rules, record_rules\n\n\n'''\nexample of k8s rule configmap\n---\napiVersion: v1\nkind: ConfigMap\nmetadata:\n name: rulefiles-0\ndata:\n etcdrules.yaml: |\n groups:\n - name: etcd\n rules:\n - alert: etcdInsufficientMembers\n annotations:\n message: 'etcd cluster \"{{ $labels.job }}\": insufficient members ({{ $value}}).'\n expr: sum(up{job=~\".*etcd.*\"} == bool 1) by (job) < ((count(up{job=~\".*etcd.*\"})\n by (job) + 1) / 2)\n for: 3m\n labels:\n severity: critical\n'''\ndef deal_configmap(rule_configmap):\n \"\"\"\n parse rule configmap from k8s\n \"\"\"\n all_record_rules = []\n all_alert_rules = []\n for _, rule_group_str in rule_configmap['data'].items():\n rule_group = yaml.load(rule_group_str, Loader=yaml.FullLoader)\n alert_rules, record_rules = deal_group(rule_group)\n all_alert_rules.extend(alert_rules)\n all_record_rules.extend(record_rules)\n\n return all_alert_rules, all_record_rules\n\n\ndef main():\n with open(rule_file, 'r') as f:\n rule_config = yaml.load(f, Loader=yaml.FullLoader)\n \n # 如果文件是k8s中的configmap,使用下面的方法\n # alert_rules, record_rules = deal_configmap(rule_config)\n alert_rules, record_rules = deal_group(rule_config)\n\n with open(\"alert-rules.json\", 'w') as fw:\n json.dump(alert_rules, fw, indent=2, ensure_ascii=False)\n\n with open(\"record-rules.json\", 'w') as fw:\n json.dump(record_rules, fw, indent=2, ensure_ascii=False)\n\n\nif __name__ == '__main__':\n main()\n"
},
{
"path": "docker/compose-host-network/etc-prometheus/prometheus.yml",
"content": "# my global config\nglobal:\n scrape_interval: 15s # Set the scrape interval to every 15 seconds. Default is every 1 minute.\n evaluation_interval: 15s # Evaluate rules every 15 seconds. The default is every 1 minute.\n # scrape_timeout is set to the global default (10s).\n\n# Alertmanager configuration\nalerting:\n alertmanagers:\n - static_configs:\n - targets:\n # - alertmanager:9093\n\n# Load rules once and periodically evaluate them according to the global 'evaluation_interval'.\nrule_files:\n # - \"first_rules.yml\"\n # - \"second_rules.yml\"\n\nscrape_configs:\n # The job name is added as a label `job=` to any timeseries scraped from this config.\n - job_name: 'prometheus'\n static_configs:\n - targets: ['localhost:9090']\n\n - job_name: 'nightingale'\n static_configs:\n - targets: ['localhost:17000']\n"
},
{
"path": "docker/compose-host-network-metric-log/docker-compose.yaml",
"content": "version: \"3.7\"\n\nservices:\n mysql:\n image: \"mysql:8\"\n container_name: mysql\n hostname: mysql\n restart: always\n environment:\n TZ: Asia/Shanghai\n MYSQL_ROOT_PASSWORD: 1234\n volumes:\n - ./mysqldata:/var/lib/mysql/\n - ../initsql:/docker-entrypoint-initdb.d/\n - ./etc-mysql/my.cnf:/etc/my.cnf\n network_mode: host\n\n redis:\n image: \"redis:6.2\"\n container_name: redis\n hostname: redis\n restart: always\n environment:\n TZ: Asia/Shanghai\n network_mode: host\n\n prometheus:\n image: prom/prometheus\n container_name: prometheus\n hostname: prometheus\n restart: always\n environment:\n TZ: Asia/Shanghai\n volumes:\n - ./etc-prometheus:/etc/prometheus\n network_mode: host\n command:\n - \"--config.file=/etc/prometheus/prometheus.yml\"\n - \"--storage.tsdb.path=/prometheus\"\n - \"--web.console.libraries=/usr/share/prometheus/console_libraries\"\n - \"--web.console.templates=/usr/share/prometheus/consoles\"\n - \"--enable-feature=remote-write-receiver\"\n - \"--query.lookback-delta=2m\"\n\n n9e:\n image: flashcatcloud/nightingale:latest\n container_name: n9e\n hostname: n9e\n restart: always\n environment:\n GIN_MODE: release\n TZ: Asia/Shanghai\n WAIT_HOSTS: 127.0.0.1:3306, 127.0.0.1:6379\n volumes:\n - ./etc-nightingale:/app/etc\n - ./n9e-logs:/app/logs\n network_mode: host\n depends_on:\n - mysql\n - redis\n - prometheus\n command:\n - /app/n9e\n\n categraf:\n image: \"flashcatcloud/categraf:latest\"\n container_name: \"categraf\"\n hostname: \"categraf01\"\n restart: always\n environment:\n TZ: Asia/Shanghai\n HOST_PROC: /hostfs/proc\n HOST_SYS: /hostfs/sys\n HOST_MOUNT_PREFIX: /hostfs\n WAIT_HOSTS: 127.0.0.1:17000, 127.0.0.1:20090, 127.0.0.1:9092\n volumes:\n - ./etc-categraf:/etc/categraf/conf\n - ./n9e-logs:/logs\n - /:/hostfs\n network_mode: host\n depends_on:\n - n9e\n - kafka\n\n zookeeper:\n image: bitnami/zookeeper:3.9\n container_name: \"zookeeper\"\n restart: always\n environment:\n - TZ=Asia/Shanghai\n - ALLOW_ANONYMOUS_LOGIN=yes\n network_mode: host\n depends_on:\n - n9e\n\n kafka:\n image: bitnami/kafka:3.4\n container_name: \"kafka\"\n restart: always\n environment:\n TZ: Asia/Shanghai\n KAFKA_ADVERTISED_LISTENERS: PLAINTEXT://127.0.0.1:9092\n KAFKA_LISTENERS: PLAINTEXT://0.0.0.0:9092\n KAFKA_ZOOKEEPER_CONNECT: 127.0.0.1:2181\n KAFKA_CFG_MESSAGE_MAX_BYTES: 2000000\n network_mode: host\n depends_on:\n - zookeeper\n\n elasticsearch: \n image: docker.elastic.co/elasticsearch/elasticsearch:7.10.1 \n container_name: \"elasticsearch\"\n restart: always\n environment:\n - TZ=Asia/Shanghai\n - discovery.type=single-node\n network_mode: host\n depends_on:\n - kafka \n\n logstash:\n image: docker.elastic.co/logstash/logstash:8.11.3\n container_name: \"logstash\"\n restart: always\n environment:\n - TZ=Asia/Shanghai\n - LS_JAVA_OPTS=-Xmx256m -Xms256m\n volumes:\n - ./etc-logstash/logstash.yaml:/etc/logstash/conf.d/logstash.yaml\n entrypoint:\n - logstash\n - -f\n - /etc/logstash/conf.d/logstash.yaml\n network_mode: host\n depends_on:\n - elasticsearch\n - kafka\n logging:\n driver: \"json-file\"\n options:\n max-size: \"200m\"\n max-file: \"3\"\n\n"
},
{
"path": "docker/compose-host-network-metric-log/etc-categraf/config.toml",
"content": "[global]\n# whether print configs\nprint_configs = false\n\n# add label(agent_hostname) to series\n# \"\" -> auto detect hostname\n# \"xx\" -> use specified string xx\n# \"$hostname\" -> auto detect hostname\n# \"$ip\" -> auto detect ip\n# \"$hostname-$ip\" -> auto detect hostname and ip to replace the vars\nhostname = \"$HOSTNAME\"\n\n# will not add label(agent_hostname) if true\nomit_hostname = false\n\n# s | ms\nprecision = \"ms\"\n\n# global collect interval\ninterval = 15\n\n[global.labels]\nsource=\"categraf\"\n# region = \"shanghai\"\n# env = \"localhost\"\n\n[writer_opt]\n# default: 2000\nbatch = 2000\n# channel(as queue) size\nchan_size = 10000\n\n[[writers]]\nurl = \"http://127.0.0.1:17000/prometheus/v1/write\"\n\n# Basic auth username\nbasic_auth_user = \"\"\n\n# Basic auth password\nbasic_auth_pass = \"\"\n\n# timeout settings, unit: ms\ntimeout = 5000\ndial_timeout = 2500\nmax_idle_conns_per_host = 100\n\n[http]\nenable = false\naddress = \":9100\"\nprint_access = false\nrun_mode = \"release\"\n\n[heartbeat]\nenable = true\n\n# report os version cpu.util mem.util metadata\nurl = \"http://127.0.0.1:17000/v1/n9e/heartbeat\"\n\n# interval, unit: s\ninterval = 10\n\n# Basic auth username\nbasic_auth_user = \"\"\n\n# Basic auth password\nbasic_auth_pass = \"\"\n\n## Optional headers\n# headers = [\"X-From\", \"categraf\", \"X-Xyz\", \"abc\"]\n\n# timeout settings, unit: ms\ntimeout = 5000\ndial_timeout = 2500\nmax_idle_conns_per_host = 100\n\n[ibex]\nenable = true\n## ibex flush interval\ninterval = \"1000ms\"\n## n9e ibex server rpc address\nservers = [\"127.0.0.1:20090\"]\n## temp script dir\nmeta_dir = \"./meta\"\n"
},
{
"path": "docker/compose-host-network-metric-log/etc-categraf/input.cpu/cpu.toml",
"content": "# # collect interval\n# interval = 15\n\n# # whether collect per cpu\n# collect_per_cpu = false\n"
},
{
"path": "docker/compose-host-network-metric-log/etc-categraf/input.disk/disk.toml",
"content": "# # collect interval\n# interval = 15\n\n# # By default stats will be gathered for all mount points.\n# # Set mount_points will restrict the stats to only the specified mount points.\n# mount_points = [\"/\"]\n\n# Ignore mount points by filesystem type.\nignore_fs = [\"tmpfs\", \"devtmpfs\", \"devfs\", \"iso9660\", \"overlay\", \"aufs\", \"squashfs\"]\n\nignore_mount_points = [\"/boot\"]\n"
},
{
"path": "docker/compose-host-network-metric-log/etc-categraf/input.diskio/diskio.toml",
"content": "# # collect interval\n# interval = 15\n\n# # By default, categraf will gather stats for all devices including disk partitions.\n# # Setting devices will restrict the stats to the specified devices.\n# devices = [\"sda\", \"sdb\", \"vd*\"]"
},
{
"path": "docker/compose-host-network-metric-log/etc-categraf/input.kernel/kernel.toml",
"content": "# # collect interval\n# interval = 15\n"
},
{
"path": "docker/compose-host-network-metric-log/etc-categraf/input.mem/mem.toml",
"content": "# # collect interval\n# interval = 15\n\n# # whether collect platform specified metrics\ncollect_platform_fields = true\n"
},
{
"path": "docker/compose-host-network-metric-log/etc-categraf/input.net/net.toml",
"content": "# # collect interval\n# interval = 15\n\n# # whether collect protocol stats on Linux\n# collect_protocol_stats = false\n\n# # setting interfaces will tell categraf to gather these explicit interfaces\n# interfaces = [\"eth0\"]"
},
{
"path": "docker/compose-host-network-metric-log/etc-categraf/input.netstat/netstat.toml",
"content": "# # collect interval\n# interval = 15\n"
},
{
"path": "docker/compose-host-network-metric-log/etc-categraf/input.processes/processes.toml",
"content": "# # collect interval\n# interval = 15\n\n# # force use ps command to gather\n# force_ps = false\n\n# # force use /proc to gather\n# force_proc = false"
},
{
"path": "docker/compose-host-network-metric-log/etc-categraf/input.system/system.toml",
"content": "# # collect interval\n# interval = 15\n\n# # whether collect metric: system_n_users\n# collect_user_number = false\n"
},
{
"path": "docker/compose-host-network-metric-log/etc-categraf/logs.toml",
"content": "[logs]\n## just a placeholder\napi_key = \"ef4ahfbwzwwtlwfpbertgq1i6mq0ab1q\"\n## enable log collect or not\nenable = true\n## the server receive logs, http/tcp/kafka, only kafka brokers can be multiple ip:ports with concatenation character \",\"\nsend_to = \"127.0.0.1:9092\"\n## send logs with protocol: http/tcp/kafka\nsend_type = \"kafka\"\ntopic = \"flashcatcloud\"\n## send logs with compression or not \nuse_compress = false\n## use ssl or not\nsend_with_tls = false\n## send logs in batchs\nbatch_wait = 5\n## save offset in this path \nrun_path = \"/opt/categraf/run\"\n## max files can be open \nopen_files_limit = 100\n## scan config file in 10 seconds\nscan_period = 10\n## read buffer of udp \nframe_size = 9000\n\n## channal size, default 100\n## 读取日志缓冲区,行数\nchan_size = 1000\n## pipeline num , default 4\n## 有多少线程处理日志\npipeline=4\n## configuration for kafka\n## 指定kafka版本\nkafka_version=\"2.8.1\"\n# 默认0 表示串行,如果对日志顺序有要求,保持默认配置\nbatch_max_concurrence = 0\n# 最大并发批次, 默认100\nbatch_max_size=100\n# 每次最大发送的内容上限 默认1000000\nbatch_max_contentsize=1000000\n# client timeout in seconds\nproducer_timeout= 10\n\n# 是否开启sasl模式\nsasl_enable = false\nsasl_user = \"admin\"\nsasl_password = \"admin\"\n# PLAIN\nsasl_mechanism= \"PLAIN\"\n# v1\nsasl_version=1\n# set true\nsasl_handshake = true\n# optional\n# sasl_auth_identity=\"\"\n#\n##\n# v0.3.39以上版本新增,是否开启pod日志采集\nenable_collect_container=false\n\n# 是否采集所有pod的stdout stderr\ncollect_container_all = false\n ## glog processing rules\n # [[logs.Processing_rules]]\n ## single log configure\n [[logs.items]]\n ## file/journald/tcp/udp\n type = \"file\"\n ## type=file, path is required; type=journald/tcp/udp, port is required\n path = \"/logs/*\"\n source = \"n9e\"\n service = \"n9e_service\"\n\n"
},
{
"path": "docker/compose-host-network-metric-log/etc-logstash/logstash.yaml",
"content": "input {\n kafka {\n bootstrap_servers => \"127.0.0.1:9092\"\n topics => [\"flashcatcloud\"]\n codec => json\n type => n9e\n }\n}\n\nfilter {\n grok {\n match => {\"message\" => \"%{LOGLEVEL:status}\"}\n overwrite => [\"status\"]\n }\n}\n\noutput {\n elasticsearch {\n hosts => [\"127.0.0.1:9200\"]\n index => \"n9e-%{+YYYY.MM.DD}\"\n }\n}\n"
},
{
"path": "docker/compose-host-network-metric-log/etc-mysql/my.cnf",
"content": "[mysqld]\npid-file\t = /var/run/mysqld/mysqld.pid\nsocket\t\t = /var/run/mysqld/mysqld.sock\ndatadir\t\t = /var/lib/mysql\nbind-address = 127.0.0.1"
},
{
"path": "docker/compose-host-network-metric-log/etc-nightingale/config.toml",
"content": "[Global]\nRunMode = \"release\"\n\n[Log]\n# log write dir\nDir = \"logs\"\n# log level: DEBUG INFO WARNING ERROR\nLevel = \"INFO\"\n# stdout, stderr, file\nOutput = \"file\"\n# # rotate by time\nKeepHours = 4\n# # rotate by size\n# RotateNum = 3\n# # unit: MB\n# RotateSize = 256\n\n[HTTP]\n# http listening address\nHost = \"0.0.0.0\"\n# http listening port\nPort = 17000\n# https cert file path\nCertFile = \"\"\n# https key file path\nKeyFile = \"\"\n# whether print access log\nPrintAccessLog = false\n# whether enable pprof\nPProf = false\n# expose prometheus /metrics?\nExposeMetrics = true\n# http graceful shutdown timeout, unit: s\nShutdownTimeout = 30\n# max content length: 64M\nMaxContentLength = 67108864\n# http server read timeout, unit: s\nReadTimeout = 20\n# http server write timeout, unit: s\nWriteTimeout = 40\n# http server idle timeout, unit: s\nIdleTimeout = 120\n\n[HTTP.ShowCaptcha]\nEnable = false \n\n[HTTP.APIForAgent]\nEnable = true \n# [HTTP.APIForAgent.BasicAuth]\n# user001 = \"ccc26da7b9aba533cbb263a36c07dcc5\"\n\n[HTTP.APIForService]\nEnable = false\n[HTTP.APIForService.BasicAuth]\nuser001 = \"ccc26da7b9aba533cbb263a36c07dcc5\"\n\n[HTTP.JWTAuth]\n# unit: min\nAccessExpired = 1500\n# unit: min\nRefreshExpired = 10080\nRedisKeyPrefix = \"/jwt/\"\n\n[HTTP.ProxyAuth]\n# if proxy auth enabled, jwt auth is disabled\nEnable = false\n# username key in http proxy header\nHeaderUserNameKey = \"X-User-Name\"\nDefaultRoles = [\"Standard\"]\n\n[HTTP.RSA]\n# open RSA\nOpenRSA = false\n\n[DB]\n# postgres: host=%s port=%s user=%s dbname=%s password=%s sslmode=%s\n# postgres: DSN=\"host=127.0.0.1 port=5432 user=root dbname=n9e_v6 password=1234 sslmode=disable\"\nDSN=\"root:1234@tcp(127.0.0.1:3306)/n9e_v6?charset=utf8mb4&parseTime=True&loc=Local&allowNativePasswords=true\"\n# enable debug mode or not\nDebug = false\n# mysql postgres\nDBType = \"mysql\"\n# unit: s\nMaxLifetime = 7200\n# max open connections\nMaxOpenConns = 150\n# max idle connections\nMaxIdleConns = 50\n\n[Redis]\n# address, ip:port or ip1:port,ip2:port for cluster and sentinel(SentinelAddrs)\nAddress = \"127.0.0.1:6379\"\n# Username = \"\"\n# Password = \"\"\n# DB = 0\n# UseTLS = false\n# TLSMinVersion = \"1.2\"\n# standalone cluster sentinel\nRedisType = \"standalone\"\n# Mastername for sentinel type\n# MasterName = \"mymaster\"\n# SentinelUsername = \"\"\n# SentinelPassword = \"\"\n\n[Alert]\n[Alert.Heartbeat]\n# auto detect if blank\nIP = \"\"\n# unit ms\nInterval = 1000\nEngineName = \"default\"\n\n# [Alert.Alerting]\n# NotifyConcurrency = 10\n\n[Center]\nMetricsYamlFile = \"./etc/metrics.yaml\"\nI18NHeaderKey = \"X-Language\"\n\n[Center.AnonymousAccess]\nPromQuerier = true\nAlertDetail = true\n\n[Pushgw]\n# use target labels in database instead of in series\nLabelRewrite = true\nForceUseServerTS = true\n\n# [Pushgw.DebugSample]\n# ident = \"xx\"\n# __name__ = \"xx\"\n\n# [Pushgw.WriterOpt]\n# QueueMaxSize = 1000000\n# QueuePopSize = 1000\n\n[[Pushgw.Writers]] \n# Url = \"http://127.0.0.1:8480/insert/0/prometheus/api/v1/write\"\nUrl = \"http://127.0.0.1:9090/api/v1/write\"\n# Basic auth username\nBasicAuthUser = \"\"\n# Basic auth password\nBasicAuthPass = \"\"\n# timeout settings, unit: ms\nHeaders = [\"X-From\", \"n9e\"]\nTimeout = 10000\nDialTimeout = 3000\nTLSHandshakeTimeout = 30000\nExpectContinueTimeout = 1000\nIdleConnTimeout = 90000\n# time duration, unit: ms\nKeepAlive = 30000\nMaxConnsPerHost = 0\nMaxIdleConns = 100\nMaxIdleConnsPerHost = 100\n## Optional TLS Config\n# UseTLS = false\n# TLSCA = \"/etc/n9e/ca.pem\"\n# TLSCert = \"/etc/n9e/cert.pem\"\n# TLSKey = \"/etc/n9e/key.pem\"\n# InsecureSkipVerify = false\n# [[Writers.WriteRelabels]]\n# Action = \"replace\"\n# SourceLabels = [\"__address__\"]\n# Regex = \"([^:]+)(?::\\\\d+)?\"\n# Replacement = \"$1:80\"\n# TargetLabel = \"__address__\"\n\n[Ibex]\nEnable = true\nRPCListen = \"0.0.0.0:20090\""
},
{
"path": "docker/compose-host-network-metric-log/etc-nightingale/metrics.yaml",
"content": "zh:\n ip_conntrack_count: 连接跟踪表条目总数(单位:int, count)\n ip_conntrack_max: 连接跟踪表最大容量(单位:int, size)\n cpu_usage_idle: CPU空闲率(单位:%)\n cpu_usage_active: CPU使用率(单位:%)\n cpu_usage_system: CPU内核态时间占比(单位:%)\n cpu_usage_user: CPU用户态时间占比(单位:%)\n cpu_usage_nice: 低优先级用户态CPU时间占比,也就是进程nice值被调整为1-19之间的CPU时间。这里注意,nice可取值范围是-20到19,数值越大,优先级反而越低(单位:%)\n cpu_usage_iowait: CPU等待I/O的时间占比(单位:%)\n cpu_usage_irq: CPU处理硬中断的时间占比(单位:%)\n cpu_usage_softirq: CPU处理软中断的时间占比(单位:%)\n cpu_usage_steal: 在虚拟机环境下有该指标,表示CPU被其他虚拟机争用的时间占比,超过20就表示争抢严重(单位:%)\n cpu_usage_guest: 通过虚拟化运行其他操作系统的时间,也就是运行虚拟机的CPU时间占比(单位:%)\n cpu_usage_guest_nice: 以低优先级运行虚拟机的时间占比(单位:%)\n\n disk_free: 硬盘分区剩余量(单位:byte)\n disk_used: 硬盘分区使用量(单位:byte)\n disk_used_percent: 硬盘分区使用率(单位:%)\n disk_total: 硬盘分区总量(单位:byte)\n disk_inodes_free: 硬盘分区inode剩余量\n disk_inodes_used: 硬盘分区inode使用量\n disk_inodes_total: 硬盘分区inode总量\n\n diskio_io_time: 从设备视角来看I/O请求总时间,队列中有I/O请求就计数(单位:毫秒),counter类型,需要用函数求rate才有使用价值\n diskio_iops_in_progress: 已经分配给设备驱动且尚未完成的IO请求,不包含在队列中但尚未分配给设备驱动的IO请求,gauge类型\n diskio_merged_reads: 相邻读请求merge读的次数,counter类型\n diskio_merged_writes: 相邻写请求merge写的次数,counter类型\n diskio_read_bytes: 读取的byte数量,counter类型,需要用函数求rate才有使用价值\n diskio_read_time: 读请求总时间(单位:毫秒),counter类型,需要用函数求rate才有使用价值\n diskio_reads: 读请求次数,counter类型,需要用函数求rate才有使用价值\n diskio_weighted_io_time: 从I/O请求视角来看I/O等待总时间,如果同时有多个I/O请求,时间会叠加(单位:毫秒)\n diskio_write_bytes: 写入的byte数量,counter类型,需要用函数求rate才有使用价值\n diskio_write_time: 写请求总时间(单位:毫秒),counter类型,需要用函数求rate才有使用价值\n diskio_writes: 写请求次数,counter类型,需要用函数求rate才有使用价值\n\n kernel_boot_time: 内核启动时间\n kernel_context_switches: 内核上下文切换次数\n kernel_entropy_avail: linux系统内部的熵池\n kernel_interrupts: 内核中断次数\n kernel_processes_forked: fork的进程数\n\n mem_active: 活跃使用的内存总数(包括cache和buffer内存)\n mem_available: 可用内存大小(bytes)\n mem_available_percent: 内存剩余百分比(0~100)\n mem_buffered: 用来给文件做缓冲大小\n mem_cached: 被高速缓冲存储器(cache memory)用的内存的大小(等于 diskcache minus SwapCache )\n mem_commit_limit: 根据超额分配比率('vm.overcommit_ratio'),这是当前在系统上分配可用的内存总量,这个限制只是在模式2('vm.overcommit_memory')时启用\n mem_committed_as: 目前在系统上分配的内存量。是所有进程申请的内存的总和\n mem_dirty: 等待被写回到磁盘的内存大小\n mem_free: 空闲内存大小(bytes)\n mem_high_free: 未被使用的高位内存大小\n mem_high_total: 高位内存总大小(Highmem是指所有内存高于860MB的物理内存,Highmem区域供用户程序使用,或用于页面缓存。该区域不是直接映射到内核空间。内核必须使用不同的手法使用该段内存)\n mem_huge_page_size: 每个大页的大小\n mem_huge_pages_free: 池中尚未分配的 HugePages 数量\n mem_huge_pages_total: 预留HugePages的总个数\n mem_inactive: 空闲的内存数(包括free和available的内存)\n mem_low_free: 未被使用的低位大小\n mem_low_total: 低位内存总大小,低位可以达到高位内存一样的作用,而且它还能够被内核用来记录一些自己的数据结构\n mem_mapped: 设备和文件等映射的大小\n mem_page_tables: 管理内存分页页面的索引表的大小\n mem_shared: 多个进程共享的内存总额\n mem_slab: 内核数据结构缓存的大小,可以减少申请和释放内存带来的消耗\n mem_sreclaimable: 可收回Slab的大小\n mem_sunreclaim: 不可收回Slab的大小(SUnreclaim+SReclaimable=Slab)\n mem_swap_cached: 被高速缓冲存储器(cache memory)用的交换空间的大小,已经被交换出来的内存,但仍然被存放在swapfile中。用来在需要的时候很快的被替换而不需要再次打开I/O端口\n mem_swap_free: 未被使用交换空间的大小\n mem_swap_total: 交换空间的总大小\n mem_total: 内存总数\n mem_used: 已用内存数\n mem_used_percent: 已用内存数百分比(0~100)\n mem_vmalloc_chunk: 最大的连续未被使用的vmalloc区域\n mem_vmalloc_totalL: 可以vmalloc虚拟内存大小\n mem_vmalloc_used: vmalloc已使用的虚拟内存大小\n mem_write_back: 正在被写回到磁盘的内存大小\n mem_write_back_tmp: FUSE用于临时写回缓冲区的内存\n\n net_bytes_recv: 网卡收包总数(bytes),计算每秒速率时需要用到rate/irate函数\n net_bytes_sent: 网卡发包总数(bytes),计算每秒速率时需要用到rate/irate函数\n net_drop_in: 网卡收丢包数量\n net_drop_out: 网卡发丢包数量\n net_err_in: 网卡收包错误数量\n net_err_out: 网卡发包错误数量\n net_packets_recv: 网卡收包数量\n net_packets_sent: 网卡发包数量\n net_bits_recv: 网卡收包总数(bits),计算每秒速率时需要用到rate/irate函数\n net_bits_sent: 网卡发包总数(bits),计算每秒速率时需要用到rate/irate函数\n\n netstat_tcp_established: ESTABLISHED状态的网络链接数\n netstat_tcp_fin_wait1: FIN_WAIT1状态的网络链接数\n netstat_tcp_fin_wait2: FIN_WAIT2状态的网络链接数\n netstat_tcp_last_ack: LAST_ACK状态的网络链接数\n netstat_tcp_listen: LISTEN状态的网络链接数\n netstat_tcp_syn_recv: SYN_RECV状态的网络链接数\n netstat_tcp_syn_sent: SYN_SENT状态的网络链接数\n netstat_tcp_time_wait: TIME_WAIT状态的网络链接数\n netstat_udp_socket: UDP状态的网络链接数\n\n netstat_sockets_used: 已使用的所有协议套接字总量\n netstat_tcp_inuse: 正在使用(正在侦听)的TCP套接字数量\n netstat_tcp_orphan: 无主(不属于任何进程)的TCP连接数(无用、待销毁的TCP socket数)\n netstat_tcp_tw: TIME_WAIT状态的TCP连接数\n netstat_tcp_alloc: 已分配(已建立、已申请到sk_buff)的TCP套接字数量\n netstat_tcp_mem: TCP套接字内存Page使用量\n netstat_udp_inuse: 在使用的UDP套接字数量\n netstat_udp_mem: UDP套接字内存Page使用量\n netstat_udplite_inuse: 正在使用的 udp lite 数量\n netstat_raw_inuse: 正在使用的 raw socket 数量\n netstat_frag_inuse: ip fragment 数量\n netstat_frag_memory: ip fragment 已经分配的内存(byte)\n\n #[ping]\n ping_percent_packet_loss: ping数据包丢失百分比(%)\n ping_result_code: ping返回码('0','1')\n\n net_response_result_code: 网络探测结果,0表示正常,非0表示异常\n net_response_response_time: 网络探测时延,单位:秒\n\n processes_blocked: 不可中断的睡眠状态下的进程数('U','D','L')\n processes_dead: 回收中的进程数('X')\n processes_idle: 挂起的空闲进程数('I')\n processes_paging: 分页进程数('P')\n processes_running: 运行中的进程数('R')\n processes_sleeping: 可中断进程数('S')\n processes_stopped: 暂停状态进程数('T')\n processes_total: 总进程数\n processes_total_threads: 总线程数\n processes_unknown: 未知状态进程数\n processes_zombies: 僵尸态进程数('Z')\n\n swap_used_percent: Swap空间换出数据量\n\n system_load1: 1分钟平均load值\n system_load5: 5分钟平均load值\n system_load15: 15分钟平均load值\n system_load_norm_1: 1分钟平均load值/逻辑CPU个数\n system_load_norm_5: 5分钟平均load值/逻辑CPU个数\n system_load_norm_15: 15分钟平均load值/逻辑CPU个数\n system_n_users: 用户数\n system_n_cpus: CPU核数\n system_uptime: 系统启动时间\n\n nginx_accepts: 自nginx启动起,与客户端建立过得连接总数\n nginx_active: 当前nginx正在处理的活动连接数,等于Reading/Writing/Waiting总和\n nginx_handled: 自nginx启动起,处理过的客户端连接总数\n nginx_reading: 正在读取HTTP请求头部的连接总数\n nginx_requests: 自nginx启动起,处理过的客户端请求总数,由于存在HTTP Keep-Alive请求,该值会大于handled值\n nginx_upstream_check_fall: upstream_check模块检测到后端失败的次数\n nginx_upstream_check_rise: upstream_check模块对后端的检测次数\n nginx_upstream_check_status_code: 后端upstream的状态,up为1,down为0\n nginx_waiting: 开启 keep-alive 的情况下,这个值等于 active – (reading+writing), 意思就是 Nginx 已经处理完正在等候下一次请求指令的驻留连接\n nginx_writing: 正在向客户端发送响应的连接总数\n\n http_response_content_length: HTTP消息实体的传输长度\n http_response_http_response_code: http响应状态码\n http_response_response_time: http响应用时\n http_response_result_code: url探测结果0为正常否则url无法访问\n\n # [aws cloudwatch rds]\n cloudwatch_aws_rds_bin_log_disk_usage_average: rds 磁盘使用平均值\n cloudwatch_aws_rds_bin_log_disk_usage_maximum: rds 磁盘使用量最大值\n cloudwatch_aws_rds_bin_log_disk_usage_minimum: rds binlog 磁盘使用量最低\n cloudwatch_aws_rds_bin_log_disk_usage_sample_count: rds binlog 磁盘使用情况样本计数\n cloudwatch_aws_rds_bin_log_disk_usage_sum: rds binlog 磁盘使用总和\n cloudwatch_aws_rds_burst_balance_average: rds 突发余额平均值\n cloudwatch_aws_rds_burst_balance_maximum: rds 突发余额最大值\n cloudwatch_aws_rds_burst_balance_minimum: rds 突发余额最低\n cloudwatch_aws_rds_burst_balance_sample_count: rds 突发平衡样本计数\n cloudwatch_aws_rds_burst_balance_sum: rds 突发余额总和\n cloudwatch_aws_rds_cpu_utilization_average: rds cpu 利用率平均值\n cloudwatch_aws_rds_cpu_utilization_maximum: rds cpu 利用率最大值\n cloudwatch_aws_rds_cpu_utilization_minimum: rds cpu 利用率最低\n cloudwatch_aws_rds_cpu_utilization_sample_count: rds cpu 利用率样本计数\n cloudwatch_aws_rds_cpu_utilization_sum: rds cpu 利用率总和\n cloudwatch_aws_rds_database_connections_average: rds 数据库连接平均值\n cloudwatch_aws_rds_database_connections_maximum: rds 数据库连接数最大值\n cloudwatch_aws_rds_database_connections_minimum: rds 数据库连接最小\n cloudwatch_aws_rds_database_connections_sample_count: rds 数据库连接样本数\n cloudwatch_aws_rds_database_connections_sum: rds 数据库连接总和\n cloudwatch_aws_rds_db_load_average: rds db 平均负载\n cloudwatch_aws_rds_db_load_cpu_average: rds db 负载 cpu 平均值\n cloudwatch_aws_rds_db_load_cpu_maximum: rds db 负载 cpu 最大值\n cloudwatch_aws_rds_db_load_cpu_minimum: rds db 负载 cpu 最小值\n cloudwatch_aws_rds_db_load_cpu_sample_count: rds db 加载 CPU 样本数\n cloudwatch_aws_rds_db_load_cpu_sum: rds db 加载cpu总和\n cloudwatch_aws_rds_db_load_maximum: rds 数据库负载最大值\n cloudwatch_aws_rds_db_load_minimum: rds 数据库负载最小值\n cloudwatch_aws_rds_db_load_non_cpu_average: rds 加载非 CPU 平均值\n cloudwatch_aws_rds_db_load_non_cpu_maximum: rds 加载非 cpu 最大值\n cloudwatch_aws_rds_db_load_non_cpu_minimum: rds 加载非 cpu 最小值\n cloudwatch_aws_rds_db_load_non_cpu_sample_count: rds 加载非 cpu 样本计数\n cloudwatch_aws_rds_db_load_non_cpu_sum: rds 加载非cpu总和\n cloudwatch_aws_rds_db_load_sample_count: rds db 加载样本计数\n cloudwatch_aws_rds_db_load_sum: rds db 负载总和\n cloudwatch_aws_rds_disk_queue_depth_average: rds 磁盘队列深度平均值\n cloudwatch_aws_rds_disk_queue_depth_maximum: rds 磁盘队列深度最大值\n cloudwatch_aws_rds_disk_queue_depth_minimum: rds 磁盘队列深度最小值\n cloudwatch_aws_rds_disk_queue_depth_sample_count: rds 磁盘队列深度样本计数\n cloudwatch_aws_rds_disk_queue_depth_sum: rds 磁盘队列深度总和\n cloudwatch_aws_rds_ebs_byte_balance__average: rds ebs 字节余额平均值\n cloudwatch_aws_rds_ebs_byte_balance__maximum: rds ebs 字节余额最大值\n cloudwatch_aws_rds_ebs_byte_balance__minimum: rds ebs 字节余额最低\n cloudwatch_aws_rds_ebs_byte_balance__sample_count: rds ebs 字节余额样本数\n cloudwatch_aws_rds_ebs_byte_balance__sum: rds ebs 字节余额总和\n cloudwatch_aws_rds_ebsio_balance__average: rds ebsio 余额平均值\n cloudwatch_aws_rds_ebsio_balance__maximum: rds ebsio 余额最大值\n cloudwatch_aws_rds_ebsio_balance__minimum: rds ebsio 余额最低\n cloudwatch_aws_rds_ebsio_balance__sample_count: rds ebsio 平衡样本计数\n cloudwatch_aws_rds_ebsio_balance__sum: rds ebsio 余额总和\n cloudwatch_aws_rds_free_storage_space_average: rds 免费存储空间平均\n cloudwatch_aws_rds_free_storage_space_maximum: rds 最大可用存储空间\n cloudwatch_aws_rds_free_storage_space_minimum: rds 最低可用存储空间\n cloudwatch_aws_rds_free_storage_space_sample_count: rds 可用存储空间样本数\n cloudwatch_aws_rds_free_storage_space_sum: rds 免费存储空间总和\n cloudwatch_aws_rds_freeable_memory_average: rds 可用内存平均值\n cloudwatch_aws_rds_freeable_memory_maximum: rds 最大可用内存\n cloudwatch_aws_rds_freeable_memory_minimum: rds 最小可用内存\n cloudwatch_aws_rds_freeable_memory_sample_count: rds 可释放内存样本数\n cloudwatch_aws_rds_freeable_memory_sum: rds 可释放内存总和\n cloudwatch_aws_rds_lvm_read_iops_average: rds lvm 读取 iops 平均值\n cloudwatch_aws_rds_lvm_read_iops_maximum: rds lvm 读取 iops 最大值\n cloudwatch_aws_rds_lvm_read_iops_minimum: rds lvm 读取 iops 最低\n cloudwatch_aws_rds_lvm_read_iops_sample_count: rds lvm 读取 iops 样本计数\n cloudwatch_aws_rds_lvm_read_iops_sum: rds lvm 读取 iops 总和\n cloudwatch_aws_rds_lvm_write_iops_average: rds lvm 写入 iops 平均值\n cloudwatch_aws_rds_lvm_write_iops_maximum: rds lvm 写入 iops 最大值\n cloudwatch_aws_rds_lvm_write_iops_minimum: rds lvm 写入 iops 最低\n cloudwatch_aws_rds_lvm_write_iops_sample_count: rds lvm 写入 iops 样本计数\n cloudwatch_aws_rds_lvm_write_iops_sum: rds lvm 写入 iops 总和\n cloudwatch_aws_rds_network_receive_throughput_average: rds 网络接收吞吐量平均\n cloudwatch_aws_rds_network_receive_throughput_maximum: rds 网络接收吞吐量最大值\n cloudwatch_aws_rds_network_receive_throughput_minimum: rds 网络接收吞吐量最小值\n cloudwatch_aws_rds_network_receive_throughput_sample_count: rds 网络接收吞吐量样本计数\n cloudwatch_aws_rds_network_receive_throughput_sum: rds 网络接收吞吐量总和\n cloudwatch_aws_rds_network_transmit_throughput_average: rds 网络传输吞吐量平均值\n cloudwatch_aws_rds_network_transmit_throughput_maximum: rds 网络传输吞吐量最大\n cloudwatch_aws_rds_network_transmit_throughput_minimum: rds 网络传输吞吐量最小值\n cloudwatch_aws_rds_network_transmit_throughput_sample_count: rds 网络传输吞吐量样本计数\n cloudwatch_aws_rds_network_transmit_throughput_sum: rds 网络传输吞吐量总和\n cloudwatch_aws_rds_read_iops_average: rds 读取 iops 平均值\n cloudwatch_aws_rds_read_iops_maximum: rds 最大读取 iops\n cloudwatch_aws_rds_read_iops_minimum: rds 读取 iops 最低\n cloudwatch_aws_rds_read_iops_sample_count: rds 读取 iops 样本计数\n cloudwatch_aws_rds_read_iops_sum: rds 读取 iops 总和\n cloudwatch_aws_rds_read_latency_average: rds 读取延迟平均值\n cloudwatch_aws_rds_read_latency_maximum: rds 读取延迟最大值\n cloudwatch_aws_rds_read_latency_minimum: rds 最小读取延迟\n cloudwatch_aws_rds_read_latency_sample_count: rds 读取延迟样本计数\n cloudwatch_aws_rds_read_latency_sum: rds 读取延迟总和\n cloudwatch_aws_rds_read_throughput_average: rds 读取吞吐量平均值\n cloudwatch_aws_rds_read_throughput_maximum: rds 最大读取吞吐量\n cloudwatch_aws_rds_read_throughput_minimum: rds 最小读取吞吐量\n cloudwatch_aws_rds_read_throughput_sample_count: rds 读取吞吐量样本计数\n cloudwatch_aws_rds_read_throughput_sum: rds 读取吞吐量总和\n cloudwatch_aws_rds_swap_usage_average: rds 交换使用平均值\n cloudwatch_aws_rds_swap_usage_maximum: rds 交换使用最大值\n cloudwatch_aws_rds_swap_usage_minimum: rds 交换使用量最低\n cloudwatch_aws_rds_swap_usage_sample_count: rds 交换使用示例计数\n cloudwatch_aws_rds_swap_usage_sum: rds 交换使用总和\n cloudwatch_aws_rds_write_iops_average: rds 写入 iops 平均值\n cloudwatch_aws_rds_write_iops_maximum: rds 写入 iops 最大值\n cloudwatch_aws_rds_write_iops_minimum: rds 写入 iops 最低\n cloudwatch_aws_rds_write_iops_sample_count: rds 写入 iops 样本计数\n cloudwatch_aws_rds_write_iops_sum: rds 写入 iops 总和\n cloudwatch_aws_rds_write_latency_average: rds 写入延迟平均值\n cloudwatch_aws_rds_write_latency_maximum: rds 最大写入延迟\n cloudwatch_aws_rds_write_latency_minimum: rds 写入延迟最小值\n cloudwatch_aws_rds_write_latency_sample_count: rds 写入延迟样本计数\n cloudwatch_aws_rds_write_latency_sum: rds 写入延迟总和\n cloudwatch_aws_rds_write_throughput_average: rds 写入吞吐量平均值\n cloudwatch_aws_rds_write_throughput_maximum: rds 最大写入吞吐量\n cloudwatch_aws_rds_write_throughput_minimum: rds 写入吞吐量最小值\n cloudwatch_aws_rds_write_throughput_sample_count: rds 写入吞吐量样本计数\n cloudwatch_aws_rds_write_throughput_sum: rds 写入吞吐量总和\n\nen:\n ip_conntrack_count: the number of entries in the conntrack table(unit:int, count)\n ip_conntrack_max: the max capacity of the conntrack table(unit:int, size)\n cpu_usage_idle: \"CPU idle rate(unit:%)\"\n cpu_usage_active: \"CPU usage rate(unit:%)\"\n cpu_usage_system: \"CPU kernel state time proportion(unit:%)\"\n cpu_usage_user: \"CPU user attitude time proportion(unit:%)\"\n cpu_usage_nice: \"The proportion of low priority CPU time, that is, the process NICE value is adjusted to the CPU time between 1-19. Note here that the value range of NICE is -20 to 19, the larger the value, the lower the priority, the lower the priority(unit:%)\"\n cpu_usage_iowait: \"CPU waiting for I/O time proportion(unit:%)\"\n cpu_usage_irq: \"CPU processing hard interrupt time proportion(unit:%)\"\n cpu_usage_softirq: \"CPU processing soft interrupt time proportion(unit:%)\"\n cpu_usage_steal: \"In the virtual machine environment, there is this indicator, which means that the CPU is used by other virtual machines for the proportion of time.(unit:%)\"\n cpu_usage_guest: \"The time to run other operating systems by virtualization, that is, the proportion of CPU time running the virtual machine(unit:%)\"\n cpu_usage_guest_nice: \"The proportion of time to run the virtual machine at low priority(unit:%)\"\n\n disk_free: \"The remaining amount of the hard disk partition (unit: byte)\"\n disk_used: \"Hard disk partitional use (unit: byte)\"\n disk_used_percent: \"Hard disk partitional use rate (unit:%)\"\n disk_total: \"Total amount of hard disk partition (unit: byte)\"\n disk_inodes_free: \"Hard disk partition INODE remaining amount\"\n disk_inodes_used: \"Hard disk partition INODE usage amount\"\n disk_inodes_total: \"The total amount of hard disk partition INODE\"\n\n diskio_io_time: \"From the perspective of the device perspective, the total time of I/O request, the I/O request in the queue is count (unit: millisecond), the counter type, you need to use the function to find the value\"\n diskio_iops_in_progress: \"IO requests that have been assigned to device -driven and have not yet been completed, not included in the queue but not yet assigned to the device -driven IO request, Gauge type\"\n diskio_merged_reads: \"The number of times of adjacent reading request Merge, the counter type\"\n diskio_merged_writes: \"The number of times the request Merge writes, the counter type\"\n diskio_read_bytes: \"The number of byte reads, the counter type, you need to use the function to find the Rate to use the value\"\n diskio_read_time: \"The total time of reading request (unit: millisecond), the counter type, you need to use the function to find the Rate to have the value of use\"\n diskio_reads: \"Read the number of requests, the counter type, you need to use the function to find the Rate to use the value\"\n diskio_weighted_io_time: \"From the perspective of the I/O request perspective, I/O wait for the total time. If there are multiple I/O requests at the same time, the time will be superimposed (unit: millisecond)\"\n diskio_write_bytes: \"The number of bytes written, the counter type, you need to use the function to find the Rate to use the value\"\n diskio_write_time: \"The total time of the request (unit: millisecond), the counter type, you need to use the function to find the rate to have the value of use\"\n diskio_writes: \"Write the number of requests, the counter type, you need to use the function to find the rate to use value\"\n\n kernel_boot_time: \"Kernel startup time\"\n kernel_context_switches: \"Number of kernel context switching times\"\n kernel_entropy_avail: \"Entropy pool inside the Linux system\"\n kernel_interrupts: \"Number of kernel interruption\"\n kernel_processes_forked: \"ForK's process number\"\n\n mem_active: \"The total number of memory (including Cache and BUFFER memory)\"\n mem_available: \"Application can use memory numbers\"\n mem_available_percent: \"Memory remaining percentage (0 ~ 100)\"\n mem_buffered: \"Used to make buffer size for the file\"\n mem_cached: \"The size of the memory used by the cache memory (equal to diskcache minus Swap Cache )\"\n mem_commit_limit: \"According to the over allocation ratio ('vm.overCommit _ Ratio'), this is the current total memory that can be allocated on the system.\"\n mem_committed_as: \"Currently allocated on the system. It is the sum of the memory of all process applications\"\n mem_dirty: \"Waiting to be written back to the memory size of the disk\"\n mem_free: \"Senior memory number\"\n mem_high_free: \"Unused high memory size\"\n mem_high_total: \"The total memory size of the high memory (Highmem refers to all the physical memory that is higher than 860 MB of memory, the HighMem area is used for user programs, or for page cache. This area is not directly mapped to the kernel space. The kernels must use different methods to use this section of memory. )\"\n mem_huge_page_size: \"The size of each big page\"\n mem_huge_pages_free: \"The number of Huge Pages in the pool that have not been allocated\"\n mem_huge_pages_total: \"Reserve the total number of Huge Pages\"\n mem_inactive: \"Free memory (including the memory of free and available)\"\n mem_low_free: \"Unused low size\"\n mem_low_total: \"The total size of the low memory memory can achieve the same role of high memory, and it can be used by the kernel to record some of its own data structure\"\n mem_mapped: \"The size of the mapping of equipment and files\"\n mem_page_tables: \"The size of the index table of the management of the memory paging page\"\n mem_shared: \"The total memory shared by multiple processes\"\n mem_slab: \"The size of the kernel data structure cache can reduce the consumption of application and release memory\"\n mem_sreclaimable: \"The size of the SLAB can be recovered\"\n mem_sunreclaim: \"The size of the SLAB cannot be recovered(SUnreclaim+SReclaimable=Slab)\"\n mem_swap_cached: \"The size of the swap space used by the cache memory (cache memory), the memory that has been swapped out, but is still stored in the swapfile. Used to be quickly replaced when needed without opening the I/O port again\"\n mem_swap_free: \"The size of the switching space is not used\"\n mem_swap_total: \"The total size of the exchange space\"\n mem_total: \"Total memory\"\n mem_used: \"Memory number\"\n mem_used_percent: \"The memory has been used by several percentage (0 ~ 100)\"\n mem_vmalloc_chunk: \"The largest continuous unused vmalloc area\"\n mem_vmalloc_totalL: \"You can vmalloc virtual memory size\"\n mem_vmalloc_used: \"Vmalloc's virtual memory size\"\n mem_write_back: \"The memory size of the disk is being written back to the disk\"\n mem_write_back_tmp: \"Fuse is used to temporarily write back the memory of the buffer area\"\n\n net_bytes_recv: \"Total inbound traffic(bytes) of network card\"\n net_bytes_sent: \"Total outbound traffic(bytes) of network card\"\n net_bits_recv: \"Total inbound traffic(bits) of network card\"\n net_bits_sent: \"Total outbound traffic(bits) of network card\"\n net_drop_in: \"The number of packets for network cards\"\n net_drop_out: \"The number of packets issued by the network card\"\n net_err_in: \"The number of incorrect packets of the network card\"\n net_err_out: \"Number of incorrect number of network cards\"\n net_packets_recv: \"Net card collection quantity\"\n net_packets_sent: \"Number of network card issuance\"\n\n netstat_tcp_established: \"ESTABLISHED status network link number\"\n netstat_tcp_fin_wait1: \"FIN _ WAIT1 status network link number\"\n netstat_tcp_fin_wait2: \"FIN _ WAIT2 status number of network links\"\n netstat_tcp_last_ack: \"LAST_ ACK status number of network links\"\n netstat_tcp_listen: \"Number of network links in Listen status\"\n netstat_tcp_syn_recv: \"SYN _ RECV status number of network links\"\n netstat_tcp_syn_sent: \"SYN _ SENT status number of network links\"\n netstat_tcp_time_wait: \"Time _ WAIT status network link number\"\n netstat_udp_socket: \"Number of network links in UDP status\"\n\n processes_blocked: \"The number of processes in the unreproducible sleep state('U','D','L')\"\n processes_dead: \"Number of processes in recycling('X')\"\n processes_idle: \"Number of idle processes hanging('I')\"\n processes_paging: \"Number of paging processes('P')\"\n processes_running: \"Number of processes during operation('R')\"\n processes_sleeping: \"Can interrupt the number of processes('S')\"\n processes_stopped: \"Pushing status process number('T')\"\n processes_total: \"Total process number\"\n processes_total_threads: \"Number of threads\"\n processes_unknown: \"Unknown status process number\"\n processes_zombies: \"Number of zombies('Z')\"\n\n swap_used_percent: \"SWAP space replace the data volume\"\n\n system_load1: \"1 minute average load value\"\n system_load5: \"5 minutes average load value\"\n system_load15: \"15 minutes average load value\"\n system_load_norm_1: \"1 minute average load value/logical CPU number\"\n system_load_norm_5: \"5 minutes average load value/logical CPU number\"\n system_load_norm_15: \"15 minutes average load value/logical CPU number\"\n system_n_users: \"User number\"\n system_n_cpus: \"CPU nuclear number\"\n system_uptime: \"System startup time\"\n\n nginx_accepts: \"Since Nginx started, the total number of connections has been established with the client\"\n nginx_active: \"The current number of activity connections that Nginx is being processed is equal to Reading/Writing/Waiting\"\n nginx_handled: \"Starting from Nginx, the total number of client connections that have been processed\"\n nginx_reading: \"Reading the total number of connections on the http request header\"\n nginx_requests: \"Since nginx is started, the total number of client requests processed, due to the existence of HTTP Keep-Alive requests, this value will be greater than the handled value\"\n nginx_upstream_check_fall: \"UPStream_CHECK module detects the number of back -end failures\"\n nginx_upstream_check_rise: \"UPSTREAM _ Check module to detect the number of back -end\"\n nginx_upstream_check_status_code: \"The state of the backstream is 1, and the down is 0\"\n nginx_waiting: \"When keep-alive is enabled, this value is equal to active – (reading+writing), which means that Nginx has processed the resident connection that is waiting for the next request command\"\n nginx_writing: \"The total number of connections to send a response to the client\"\n\n http_response_content_length: \"HTTP message entity transmission length\"\n http_response_http_response_code: \"http response status code\"\n http_response_response_time: \"When http ring application\"\n http_response_result_code: \"URL detection result 0 is normal, otherwise the URL cannot be accessed\"\n\n # [mysqld_exporter]\n mysql_global_status_uptime: The number of seconds that the server has been up.(Gauge)\n mysql_global_status_uptime_since_flush_status: The number of seconds since the most recent FLUSH STATUS statement.(Gauge)\n mysql_global_status_queries: The number of statements executed by the server. This variable includes statements executed within stored programs, unlike the Questions variable. It does not count COM_PING or COM_STATISTICS commands.(Counter)\n mysql_global_status_threads_connected: The number of currently open connections.(Counter)\n mysql_global_status_connections: The number of connection attempts (successful or not) to the MySQL server.(Gauge)\n mysql_global_status_max_used_connections: The maximum number of connections that have been in use simultaneously since the server started.(Gauge)\n mysql_global_status_threads_running: The number of threads that are not sleeping.(Gauge)\n mysql_global_status_questions: The number of statements executed by the server. This includes only statements sent to the server by clients and not statements executed within stored programs, unlike the Queries variable. This variable does not count COM_PING, COM_STATISTICS, COM_STMT_PREPARE, COM_STMT_CLOSE, or COM_STMT_RESET commands.(Counter)\n mysql_global_status_threads_cached: The number of threads in the thread cache.(Counter)\n mysql_global_status_threads_created: The number of threads created to handle connections. If Threads_created is big, you may want to increase the thread_cache_size value. The cache miss rate can be calculated as Threads_created/Connections.(Counter)\n mysql_global_status_created_tmp_tables: The number of internal temporary tables created by the server while executing statements.(Counter)\n mysql_global_status_created_tmp_disk_tables: The number of internal on-disk temporary tables created by the server while executing statements. You can compare the number of internal on-disk temporary tables created to the total number of internal temporary tables created by comparing Created_tmp_disk_tables and Created_tmp_tables values.(Counter)\n mysql_global_status_created_tmp_files: How many temporary files mysqld has created.(Counter)\n mysql_global_status_select_full_join: The number of joins that perform table scans because they do not use indexes. If this value is not 0, you should carefully check the indexes of your tables.(Counter)\n mysql_global_status_select_full_range_join: The number of joins that used a range search on a reference table.(Counter)\n mysql_global_status_select_range: The number of joins that used ranges on the first table. This is normally not a critical issue even if the value is quite large.(Counter)\n mysql_global_status_select_range_check: The number of joins without keys that check for key usage after each row. If this is not 0, you should carefully check the indexes of your tables.(Counter)\n mysql_global_status_select_scan: The number of joins that did a full scan of the first table.(Counter)\n mysql_global_status_sort_rows: The number of sorted rows.(Counter)\n mysql_global_status_sort_range: The number of sorts that were done using ranges.(Counter)\n mysql_global_status_sort_merge_passes: The number of merge passes that the sort algorithm has had to do. If this value is large, you should consider increasing the value of the sort_buffer_size system variable.(Counter)\n mysql_global_status_sort_scan: The number of sorts that were done by scanning the table.(Counter)\n mysql_global_status_slow_queries: The number of queries that have taken more than long_query_time seconds. This counter increments regardless of whether the slow query log is enabled.(Counter)\n mysql_global_status_aborted_connects: The number of failed attempts to connect to the MySQL server.(Counter)\n mysql_global_status_aborted_clients: The number of connections that were aborted because the client died without closing the connection properly.(Counter)\n mysql_global_status_table_locks_immediate: The number of times that a request for a table lock could be granted immediately. Locks Immediate rising and falling is normal activity.(Counter)\n mysql_global_status_table_locks_waited: The number of times that a request for a table lock could not be granted immediately and a wait was needed. If this is high and you have performance problems, you should first optimize your queries, and then either split your table or tables or use replication.(Counter)\n mysql_global_status_bytes_received: The number of bytes received from all clients.(Counter)\n mysql_global_status_bytes_sent: The number of bytes sent to all clients.(Counter)\n mysql_global_status_innodb_page_size: InnoDB page size (default 16KB). Many values are counted in pages; the page size enables them to be easily converted to bytes.(Gauge)\n mysql_global_status_buffer_pool_pages: The number of pages in the InnoDB buffer pool.(Gauge)\n mysql_global_status_commands_total: The number of times each xxx statement has been executed.(Counter)\n mysql_global_status_handlers_total: Handler statistics are internal statistics on how MySQL is selecting, updating, inserting, and modifying rows, tables, and indexes. This is in fact the layer between the Storage Engine and MySQL.(Counter)\n mysql_global_status_opened_files: The number of files that have been opened with my_open() (a mysys library function). Parts of the server that open files without using this function do not increment the count.(Counter)\n mysql_global_status_open_tables: The number of tables that are open.(Gauge)\n mysql_global_status_opened_tables: The number of tables that have been opened. If Opened_tables is big, your table_open_cache value is probably too small.(Counter)\n mysql_global_status_table_open_cache_hits: The number of hits for open tables cache lookups.(Counter)\n mysql_global_status_table_open_cache_misses: The number of misses for open tables cache lookups.(Counter)\n mysql_global_status_table_open_cache_overflows: The number of overflows for the open tables cache.(Counter)\n mysql_global_status_innodb_num_open_files: The number of files InnoDB currently holds open.(Gauge)\n mysql_global_status_connection_errors_total: These variables provide information about errors that occur during the client connection process.(Counter)\n mysql_global_status_innodb_buffer_pool_read_requests: The number of logical read requests.(Counter)\n mysql_global_status_innodb_buffer_pool_reads: The number of logical reads that InnoDB could not satisfy from the buffer pool, and had to read directly from disk.(Counter)\n\n mysql_global_variables_thread_cache_size: How many threads the server should cache for reuse.(Gauge)\n mysql_global_variables_max_connections: The maximum permitted number of simultaneous client connections.(Gauge)\n mysql_global_variables_innodb_buffer_pool_size: The size in bytes of the buffer pool, the memory area where InnoDB caches table and index data. The default value is 134217728 bytes (128MB).(Gauge)\n mysql_global_variables_innodb_log_buffer_size: The size in bytes of the buffer that InnoDB uses to write to the log files on disk.(Gauge)\n mysql_global_variables_key_buffer_size: Index blocks for MyISAM tables are buffered and are shared by all threads.(Gauge)\n mysql_global_variables_query_cache_size: The amount of memory allocated for caching query results.(Gauge)\n mysql_global_variables_table_open_cache: The number of open tables for all threads.(Gauge)\n mysql_global_variables_open_files_limit: The number of file descriptors available to mysqld from the operating system.(Gauge)\n\n # [redis_exporter]\n redis_active_defrag_running: When activedefrag is enabled, this indicates whether defragmentation is currently active, and the CPU percentage it intends to utilize.\n redis_allocator_active_bytes: Total bytes in the allocator active pages, this includes external-fragmentation.\n redis_allocator_allocated_bytes: Total bytes allocated form the allocator, including internal-fragmentation. Normally the same as used_memory.\n redis_allocator_frag_bytes: Delta between allocator_active and allocator_allocated. See note about mem_fragmentation_bytes.\n redis_allocator_frag_ratio: Ratio between allocator_active and allocator_allocated. This is the true (external) fragmentation metric (not mem_fragmentation_ratio).\n redis_allocator_resident_bytes: Total bytes resident (RSS) in the allocator, this includes pages that can be released to the OS (by MEMORY PURGE, or just waiting).\n redis_allocator_rss_bytes: Delta between allocator_resident and allocator_active.\n redis_allocator_rss_ratio: Ratio between allocator_resident and allocator_active. This usually indicates pages that the allocator can and probably will soon release back to the OS.\n redis_aof_current_rewrite_duration_sec: Duration of the on-going AOF rewrite operation if any.\n redis_aof_enabled: Flag indicating AOF logging is activated.\n redis_aof_last_bgrewrite_status: Status of the last AOF rewrite operation.\n redis_aof_last_cow_size_bytes: The size in bytes of copy-on-write memory during the last AOF rewrite operation.\n redis_aof_last_rewrite_duration_sec: Duration of the last AOF rewrite operation in seconds.\n redis_aof_last_write_status: Status of the last write operation to the AOF.\n redis_aof_rewrite_in_progress: Flag indicating a AOF rewrite operation is on-going.\n redis_aof_rewrite_scheduled: Flag indicating an AOF rewrite operation will be scheduled once the on-going RDB save is complete.\n redis_blocked_clients: Number of clients pending on a blocking call (BLPOP, BRPOP, BRPOPLPUSH, BLMOVE, BZPOPMIN, BZPOPMAX).\n redis_client_recent_max_input_buffer_bytes: Biggest input buffer among current client connections.\n redis_client_recent_max_output_buffer_bytes: Biggest output buffer among current client connections.\n redis_cluster_enabled: Indicate Redis cluster is enabled.\n redis_commands_duration_seconds_total: The total CPU time consumed by these commands.(Counter)\n redis_commands_processed_total: Total number of commands processed by the server.(Counter)\n redis_commands_total: The number of calls that reached command execution (not rejected).(Counter)\n redis_config_maxclients: The value of the maxclients configuration directive. This is the upper limit for the sum of connected_clients, connected_slaves and cluster_connections.\n redis_config_maxmemory: The value of the maxmemory configuration directive.\n redis_connected_clients: Number of client connections (excluding connections from replicas).\n redis_connected_slaves: Number of connected replicas.\n redis_connections_received_total: Total number of connections accepted by the server.(Counter)\n redis_cpu_sys_children_seconds_total: System CPU consumed by the background processes.(Counter)\n redis_cpu_sys_seconds_total: System CPU consumed by the Redis server, which is the sum of system CPU consumed by all threads of the server process (main thread and background threads).(Counter)\n redis_cpu_user_children_seconds_total: User CPU consumed by the background processes.(Counter)\n redis_cpu_user_seconds_total: User CPU consumed by the Redis server, which is the sum of user CPU consumed by all threads of the server process (main thread and background threads).(Counter)\n redis_db_keys: Total number of keys by DB.\n redis_db_keys_expiring: Total number of expiring keys by DB\n redis_defrag_hits: Number of value reallocations performed by active the defragmentation process.\n redis_defrag_misses: Number of aborted value reallocations started by the active defragmentation process.\n redis_defrag_key_hits: Number of keys that were actively defragmented.\n redis_defrag_key_misses: Number of keys that were skipped by the active defragmentation process.\n redis_evicted_keys_total: Number of evicted keys due to maxmemory limit.(Counter)\n redis_expired_keys_total: Total number of key expiration events.(Counter)\n redis_expired_stale_percentage: The percentage of keys probably expired.\n redis_expired_time_cap_reached_total: The count of times that active expiry cycles have stopped early.\n redis_exporter_last_scrape_connect_time_seconds: The duration(in seconds) to connect when scrape.\n redis_exporter_last_scrape_duration_seconds: The last scrape duration.\n redis_exporter_last_scrape_error: The last scrape error status.\n redis_exporter_scrape_duration_seconds_count: Durations of scrapes by the exporter\n redis_exporter_scrape_duration_seconds_sum: Durations of scrapes by the exporter\n redis_exporter_scrapes_total: Current total redis scrapes.(Counter)\n redis_instance_info: Information about the Redis instance.\n redis_keyspace_hits_total: Hits total.(Counter)\n redis_keyspace_misses_total: Misses total.(Counter)\n redis_last_key_groups_scrape_duration_milliseconds: Duration of the last key group metrics scrape in milliseconds.\n redis_last_slow_execution_duration_seconds: The amount of time needed for last slow execution, in seconds.\n redis_latest_fork_seconds: The amount of time needed for last fork, in seconds.\n redis_lazyfree_pending_objects: The number of objects waiting to be freed (as a result of calling UNLINK, or FLUSHDB and FLUSHALL with the ASYNC option).\n redis_master_repl_offset: The server's current replication offset.\n redis_mem_clients_normal: Memory used by normal clients.(Gauge)\n redis_mem_clients_slaves: Memory used by replica clients - Starting Redis 7.0, replica buffers share memory with the replication backlog, so this field can show 0 when replicas don't trigger an increase of memory usage.\n redis_mem_fragmentation_bytes: Delta between used_memory_rss and used_memory. Note that when the total fragmentation bytes is low (few megabytes), a high ratio (e.g. 1.5 and above) is not an indication of an issue.\n redis_mem_fragmentation_ratio: Ratio between used_memory_rss and used_memory. Note that this doesn't only includes fragmentation, but also other process overheads (see the allocator_* metrics), and also overheads like code, shared libraries, stack, etc.\n redis_mem_not_counted_for_eviction_bytes: (Gauge)\n redis_memory_max_bytes: Max memory limit in bytes.\n redis_memory_used_bytes: Total number of bytes allocated by Redis using its allocator (either standard libc, jemalloc, or an alternative allocator such as tcmalloc)\n redis_memory_used_dataset_bytes: The size in bytes of the dataset (used_memory_overhead subtracted from used_memory)\n redis_memory_used_lua_bytes: Number of bytes used by the Lua engine.\n redis_memory_used_overhead_bytes: The sum in bytes of all overheads that the server allocated for managing its internal data structures.\n redis_memory_used_peak_bytes: Peak memory consumed by Redis (in bytes)\n redis_memory_used_rss_bytes: Number of bytes that Redis allocated as seen by the operating system (a.k.a resident set size). This is the number reported by tools such as top(1) and ps(1)\n redis_memory_used_scripts_bytes: Number of bytes used by cached Lua scripts\n redis_memory_used_startup_bytes: Initial amount of memory consumed by Redis at startup in bytes\n redis_migrate_cached_sockets_total: The number of sockets open for MIGRATE purposes\n redis_net_input_bytes_total: Total input bytes(Counter)\n redis_net_output_bytes_total: Total output bytes(Counter)\n redis_process_id: Process ID\n redis_pubsub_channels: Global number of pub/sub channels with client subscriptions\n redis_pubsub_patterns: Global number of pub/sub pattern with client subscriptions\n redis_rdb_bgsave_in_progress: Flag indicating a RDB save is on-going\n redis_rdb_changes_since_last_save: Number of changes since the last dump\n redis_rdb_current_bgsave_duration_sec: Duration of the on-going RDB save operation if any\n redis_rdb_last_bgsave_duration_sec: Duration of the last RDB save operation in seconds\n redis_rdb_last_bgsave_status: Status of the last RDB save operation\n redis_rdb_last_cow_size_bytes: The size in bytes of copy-on-write memory during the last RDB save operation\n redis_rdb_last_save_timestamp_seconds: Epoch-based timestamp of last successful RDB save\n redis_rejected_connections_total: Number of connections rejected because of maxclients limit(Counter)\n redis_repl_backlog_first_byte_offset: The master offset of the replication backlog buffer\n redis_repl_backlog_history_bytes: Size in bytes of the data in the replication backlog buffer\n redis_repl_backlog_is_active: Flag indicating replication backlog is active\n redis_replica_partial_resync_accepted: The number of accepted partial resync requests(Gauge)\n redis_replica_partial_resync_denied: The number of denied partial resync requests(Gauge)\n redis_replica_resyncs_full: The number of full resyncs with replicas\n redis_replication_backlog_bytes: Memory used by replication backlog\n redis_second_repl_offset: The offset up to which replication IDs are accepted.\n redis_slave_expires_tracked_keys: The number of keys tracked for expiry purposes (applicable only to writable replicas)(Gauge)\n redis_slowlog_last_id: Last id of slowlog\n redis_slowlog_length: Total slowlog\n redis_start_time_seconds: Start time of the Redis instance since unix epoch in seconds.\n redis_target_scrape_request_errors_total: Errors in requests to the exporter\n redis_up: Flag indicating redis instance is up\n redis_uptime_in_seconds: Number of seconds since Redis server start\n\n # [windows_exporter]\n windows_cpu_clock_interrupts_total: Total number of received and serviced clock tick interrupts(counter)\n windows_cpu_core_frequency_mhz: Core frequency in megahertz(gauge)\n windows_cpu_cstate_seconds_total: Time spent in low-power idle state(counter)\n windows_cpu_dpcs_total: Total number of received and serviced deferred procedure calls (DPCs)(counter)\n windows_cpu_idle_break_events_total: Total number of time processor was woken from idle(counter)\n windows_cpu_interrupts_total: Total number of received and serviced hardware interrupts(counter)\n windows_cpu_parking_status: Parking Status represents whether a processor is parked or not(gauge)\n windows_cpu_processor_performance: Processor Performance is the average performance of the processor while it is executing instructions, as a percentage of the nominal performance of the processor. On some processors, Processor Performance may exceed 100%(gauge)\n windows_cpu_time_total: Time that processor spent in different modes (idle, user, system, ...)(counter)\n windows_cs_hostname: Labeled system hostname information as provided by ComputerSystem.DNSHostName and ComputerSystem.Domain(gauge)\n windows_cs_logical_processors: ComputerSystem.NumberOfLogicalProcessors(gauge)\n windows_cs_physical_memory_bytes: ComputerSystem.TotalPhysicalMemory(gauge)\n windows_exporter_build_info: A metric with a constant '1' value labeled by version, revision, branch, and goversion from which windows_exporter was built.(gauge)\n windows_exporter_collector_duration_seconds: Duration of a collection.(gauge)\n windows_exporter_collector_success: Whether the collector was successful.(gauge)\n windows_exporter_collector_timeout: Whether the collector timed out.(gauge)\n windows_exporter_perflib_snapshot_duration_seconds: Duration of perflib snapshot capture(gauge)\n windows_logical_disk_free_bytes: Free space in bytes (LogicalDisk.PercentFreeSpace)(gauge)\n windows_logical_disk_idle_seconds_total: Seconds that the disk was idle (LogicalDisk.PercentIdleTime)(counter)\n windows_logical_disk_read_bytes_total: The number of bytes transferred from the disk during read operations (LogicalDisk.DiskReadBytesPerSec)(counter)\n windows_logical_disk_read_latency_seconds_total: Shows the average time, in seconds, of a read operation from the disk (LogicalDisk.AvgDiskSecPerRead)(counter)\n windows_logical_disk_read_seconds_total: Seconds that the disk was busy servicing read requests (LogicalDisk.PercentDiskReadTime)(counter)\n windows_logical_disk_read_write_latency_seconds_total: Shows the time, in seconds, of the average disk transfer (LogicalDisk.AvgDiskSecPerTransfer)(counter)\n windows_logical_disk_reads_total: The number of read operations on the disk (LogicalDisk.DiskReadsPerSec)(counter)\n windows_logical_disk_requests_queued: The number of requests queued to the disk (LogicalDisk.CurrentDiskQueueLength)(gauge)\n windows_logical_disk_size_bytes: Total space in bytes (LogicalDisk.PercentFreeSpace_Base)(gauge)\n windows_logical_disk_split_ios_total: The number of I/Os to the disk were split into multiple I/Os (LogicalDisk.SplitIOPerSec)(counter)\n windows_logical_disk_write_bytes_total: The number of bytes transferred to the disk during write operations (LogicalDisk.DiskWriteBytesPerSec)(counter)\n windows_logical_disk_write_latency_seconds_total: Shows the average time, in seconds, of a write operation to the disk (LogicalDisk.AvgDiskSecPerWrite)(counter)\n windows_logical_disk_write_seconds_total: Seconds that the disk was busy servicing write requests (LogicalDisk.PercentDiskWriteTime)(counter)\n windows_logical_disk_writes_total: The number of write operations on the disk (LogicalDisk.DiskWritesPerSec)(counter)\n windows_net_bytes_received_total: (Network.BytesReceivedPerSec)(counter)\n windows_net_bytes_sent_total: (Network.BytesSentPerSec)(counter)\n windows_net_bytes_total: (Network.BytesTotalPerSec)(counter)\n windows_net_current_bandwidth: (Network.CurrentBandwidth)(gauge)\n windows_net_packets_outbound_discarded_total: (Network.PacketsOutboundDiscarded)(counter)\n windows_net_packets_outbound_errors_total: (Network.PacketsOutboundErrors)(counter)\n windows_net_packets_received_discarded_total: (Network.PacketsReceivedDiscarded)(counter)\n windows_net_packets_received_errors_total: (Network.PacketsReceivedErrors)(counter)\n windows_net_packets_received_total: (Network.PacketsReceivedPerSec)(counter)\n windows_net_packets_received_unknown_total: (Network.PacketsReceivedUnknown)(counter)\n windows_net_packets_sent_total: (Network.PacketsSentPerSec)(counter)\n windows_net_packets_total: (Network.PacketsPerSec)(counter)\n windows_os_info: OperatingSystem.Caption, OperatingSystem.Version(gauge)\n windows_os_paging_free_bytes: OperatingSystem.FreeSpaceInPagingFiles(gauge)\n windows_os_paging_limit_bytes: OperatingSystem.SizeStoredInPagingFiles(gauge)\n windows_os_physical_memory_free_bytes: OperatingSystem.FreePhysicalMemory(gauge)\n windows_os_process_memory_limix_bytes: OperatingSystem.MaxProcessMemorySize(gauge)\n windows_os_processes: OperatingSystem.NumberOfProcesses(gauge)\n windows_os_processes_limit: OperatingSystem.MaxNumberOfProcesses(gauge)\n windows_os_time: OperatingSystem.LocalDateTime(gauge)\n windows_os_timezone: OperatingSystem.LocalDateTime(gauge)\n windows_os_users: OperatingSystem.NumberOfUsers(gauge)\n windows_os_virtual_memory_bytes: OperatingSystem.TotalVirtualMemorySize(gauge)\n windows_os_virtual_memory_free_bytes: OperatingSystem.FreeVirtualMemory(gauge)\n windows_os_visible_memory_bytes: OperatingSystem.TotalVisibleMemorySize(gauge)\n windows_service_info: A metric with a constant '1' value labeled with service information(gauge)\n windows_service_start_mode: The start mode of the service (StartMode)(gauge)\n windows_service_state: The state of the service (State)(gauge)\n windows_service_status: The status of the service (Status)(gauge)\n windows_system_context_switches_total: Total number of context switches (WMI source is PerfOS_System.ContextSwitchesPersec)(counter)\n windows_system_exception_dispatches_total: Total number of exceptions dispatched (WMI source is PerfOS_System.ExceptionDispatchesPersec)(counter)\n windows_system_processor_queue_length: Length of processor queue (WMI source is PerfOS_System.ProcessorQueueLength)(gauge)\n windows_system_system_calls_total: Total number of system calls (WMI source is PerfOS_System.SystemCallsPersec)(counter)\n windows_system_system_up_time: System boot time (WMI source is PerfOS_System.SystemUpTime)(gauge)\n windows_system_threads: Current number of threads (WMI source is PerfOS_System.Threads)(gauge)\n\n # [node_exporter]\n # SYSTEM\n # CPU context switch 次数\n node_context_switches_total: context_switches\n # Interrupts 次数\n node_intr_total: Interrupts\n # 运行的进程数\n node_procs_running: Processes in runnable state\n # 熵池大小\n node_entropy_available_bits: Entropy available to random number generators\n node_time_seconds: System time in seconds since epoch (1970)\n node_boot_time_seconds: Node boot time, in unixtime\n # CPU\n node_cpu_seconds_total: Seconds the CPUs spent in each mode\n node_load1: cpu load 1m\n node_load5: cpu load 5m\n node_load15: cpu load 15m\n\n # MEM\n # 内核态\n # 内核用于缓存数据结构供自己使用的内存\n node_memory_Slab_bytes: Memory used by the kernel to cache data structures for its own use\n # slab中可回收的部分\n node_memory_SReclaimable_bytes: SReclaimable - Part of Slab, that might be reclaimed, such as caches\n # slab中不可回收的部分\n node_memory_SUnreclaim_bytes: Part of Slab, that cannot be reclaimed on memory pressure\n # Vmalloc内存区的大小\n node_memory_VmallocTotal_bytes: Total size of vmalloc memory area\n # vmalloc已分配的内存,虚拟地址空间上的连续的内存\n node_memory_VmallocUsed_bytes: Amount of vmalloc area which is used\n # vmalloc区可用的连续最大快的大小,通过此指标可以知道vmalloc可分配连续内存的最大值\n node_memory_VmallocChunk_bytes: Largest contiguous block of vmalloc area which is free\n # 内存的硬件故障删除掉的内存页的总大小\n node_memory_HardwareCorrupted_bytes: Amount of RAM that the kernel identified as corrupted / not working\n # 用于在虚拟和物理内存地址之间映射的内存\n node_memory_PageTables_bytes: Memory used to map between virtual and physical memory addresses (gauge)\n # 内核栈内存,常驻内存,不可回收\n node_memory_KernelStack_bytes: Kernel memory stack. This is not reclaimable\n # 用来访问高端内存,复制高端内存的临时buffer,称为“bounce buffering”,会降低I/O 性能\n node_memory_Bounce_bytes: Memory used for block device bounce buffers\n #用户态\n # 单个巨页大小\n node_memory_Hugepagesize_bytes: Huge Page size\n # 系统分配的常驻巨页数\n node_memory_HugePages_Total: Total size of the pool of huge pages\n # 系统空闲的巨页数\n node_memory_HugePages_Free: Huge pages in the pool that are not yet allocated\n # 进程已申请但未使用的巨页数\n node_memory_HugePages_Rsvd: Huge pages for which a commitment to allocate from the pool has been made, but no allocation\n # 超过系统设定的常驻HugePages数量的个数\n node_memory_HugePages_Surp: Huge pages in the pool above the value in /proc/sys/vm/nr_hugepages\n # 透明巨页 Transparent HugePages (THP)\n node_memory_AnonHugePages_bytes: Memory in anonymous huge pages\n # inactivelist中的File-backed内存\n node_memory_Inactive_file_bytes: File-backed memory on inactive LRU list\n # inactivelist中的Anonymous内存\n node_memory_Inactive_anon_bytes: Anonymous and swap cache on inactive LRU list, including tmpfs (shmem)\n # activelist中的File-backed内存\n node_memory_Active_file_bytes: File-backed memory on active LRU list\n # activelist中的Anonymous内存\n node_memory_Active_anon_bytes: Anonymous and swap cache on active least-recently-used (LRU) list, including tmpfs\n # 禁止换出的页,对应 Unevictable 链表\n node_memory_Unevictable_bytes: Amount of unevictable memory that can't be swapped out for a variety of reasons\n # 共享内存\n node_memory_Shmem_bytes: Used shared memory (shared between several processes, thus including RAM disks)\n # 匿名页内存大小\n node_memory_AnonPages_bytes: Memory in user pages not backed by files\n # 被关联的内存页大小\n node_memory_Mapped_bytes: Used memory in mapped pages files which have been mapped, such as libraries\n # file-backed内存页缓存大小\n node_memory_Cached_bytes: Parked file data (file content) cache\n # 系统中有多少匿名页曾经被swap-out、现在又被swap-in并且swap-in之后页面中的内容一直没发生变化\n node_memory_SwapCached_bytes: Memory that keeps track of pages that have been fetched from swap but not yet been modified\n # 被mlock()系统调用锁定的内存大小\n node_memory_Mlocked_bytes: Size of pages locked to memory using the mlock() system call\n # 块设备(block device)所占用的缓存页\n node_memory_Buffers_bytes: Block device (e.g. harddisk) cache\n node_memory_SwapTotal_bytes: Memory information field SwapTotal_bytes\n node_memory_SwapFree_bytes: Memory information field SwapFree_bytes\n\n # DISK\n node_filesystem_avail_bytes: Filesystem space available to non-root users in byte\n node_filesystem_free_bytes: Filesystem free space in bytes\n node_filesystem_size_bytes: Filesystem size in bytes\n node_filesystem_files_free: Filesystem total free file nodes\n node_filesystem_files: Filesystem total free file nodes\n node_filefd_maximum: Max open files\n node_filefd_allocated: Open files\n node_filesystem_readonly: Filesystem read-only status\n node_filesystem_device_error: Whether an error occurred while getting statistics for the given device\n node_disk_reads_completed_total: The total number of reads completed successfully\n node_disk_writes_completed_total: The total number of writes completed successfully\n node_disk_reads_merged_total: The number of reads merged\n node_disk_writes_merged_total: The number of writes merged\n node_disk_read_bytes_total: The total number of bytes read successfully\n node_disk_written_bytes_total: The total number of bytes written successfully\n node_disk_io_time_seconds_total: Total seconds spent doing I/Os\n node_disk_read_time_seconds_total: The total number of seconds spent by all reads\n node_disk_write_time_seconds_total: The total number of seconds spent by all writes\n node_disk_io_time_weighted_seconds_total: The weighted of seconds spent doing I/Os\n\n # NET\n node_network_receive_bytes_total: Network device statistic receive_bytes (counter)\n node_network_transmit_bytes_total: Network device statistic transmit_bytes (counter)\n node_network_receive_packets_total: Network device statistic receive_bytes\n node_network_transmit_packets_total: Network device statistic transmit_bytes\n node_network_receive_errs_total: Network device statistic receive_errs\n node_network_transmit_errs_total: Network device statistic transmit_errs\n node_network_receive_drop_total: Network device statistic receive_drop\n node_network_transmit_drop_total: Network device statistic transmit_drop\n node_nf_conntrack_entries: Number of currently allocated flow entries for connection tracking\n node_sockstat_TCP_alloc: Number of TCP sockets in state alloc\n node_sockstat_TCP_inuse: Number of TCP sockets in state inuse\n node_sockstat_TCP_orphan: Number of TCP sockets in state orphan\n node_sockstat_TCP_tw: Number of TCP sockets in state tw\n node_netstat_Tcp_CurrEstab: Statistic TcpCurrEstab\n node_sockstat_sockets_used: Number of IPv4 sockets in use\n\n # [kafka_exporter]\n kafka_brokers: count of kafka_brokers (gauge)\n kafka_topic_partitions: Number of partitions for this Topic (gauge)\n kafka_topic_partition_current_offset: Current Offset of a Broker at Topic/Partition (gauge)\n kafka_consumergroup_current_offset: Current Offset of a ConsumerGroup at Topic/Partition (gauge)\n kafka_consumer_lag_millis: Current approximation of consumer lag for a ConsumerGroup at Topic/Partition (gauge)\n kafka_topic_partition_under_replicated_partition: 1 if Topic/Partition is under Replicated\n\n # [zookeeper_exporter]\n zk_znode_count: The total count of znodes stored\n zk_ephemerals_count: The number of Ephemerals nodes\n zk_watch_count: The number of watchers setup over Zookeeper nodes.\n zk_approximate_data_size: Size of data in bytes that a zookeeper server has in its data tree\n zk_outstanding_requests: Number of currently executing requests\n zk_packets_sent: Count of the number of zookeeper packets sent from a server\n zk_packets_received: Count of the number of zookeeper packets received by a server\n zk_num_alive_connections: Number of active clients connected to a zookeeper server\n zk_open_file_descriptor_count: Number of file descriptors that a zookeeper server has open\n zk_max_file_descriptor_count: Maximum number of file descriptors that a zookeeper server can open\n zk_avg_latency: Average time in milliseconds for requests to be processed\n zk_min_latency: Maximum time in milliseconds for a request to be processed\n zk_max_latency: Minimum time in milliseconds for a request to be processed\n"
},
{
"path": "docker/compose-host-network-metric-log/etc-nightingale/script/notify.bak.py",
"content": "#!/usr/bin/env python\n# -*- coding: UTF-8 -*-\nimport sys\nimport json\nimport urllib2\nimport smtplib\nfrom email.mime.text import MIMEText\n\nreload(sys)\nsys.setdefaultencoding('utf8')\n\nnotify_channel_funcs = {\n \"email\":\"email\",\n \"sms\":\"sms\",\n \"voice\":\"voice\",\n \"dingtalk\":\"dingtalk\",\n \"wecom\":\"wecom\",\n \"feishu\":\"feishu\"\n}\n\nmail_host = \"smtp.163.com\"\nmail_port = 994\nmail_user = \"ulricqin\"\nmail_pass = \"password\"\nmail_from = \"ulricqin@163.com\"\n\nclass Sender(object):\n @classmethod\n def send_email(cls, payload):\n if mail_user == \"ulricqin\" and mail_pass == \"password\":\n print(\"invalid smtp configuration\")\n return\n\n users = payload.get('event').get(\"notify_users_obj\")\n\n emails = {}\n for u in users:\n if u.get(\"email\"):\n emails[u.get(\"email\")] = 1\n\n if not emails:\n return\n\n recipients = emails.keys()\n mail_body = payload.get('tpls').get(\"email.tpl\", \"email.tpl not found\")\n message = MIMEText(mail_body, 'html', 'utf-8')\n message['From'] = mail_from\n message['To'] = \", \".join(recipients)\n message[\"Subject\"] = payload.get('tpls').get(\"subject.tpl\", \"subject.tpl not found\")\n\n try:\n smtp = smtplib.SMTP_SSL(mail_host, mail_port)\n smtp.login(mail_user, mail_pass)\n smtp.sendmail(mail_from, recipients, message.as_string())\n smtp.close()\n except smtplib.SMTPException, error:\n print(error)\n\n @classmethod\n def send_wecom(cls, payload):\n users = payload.get('event').get(\"notify_users_obj\")\n\n tokens = {}\n\n for u in users:\n contacts = u.get(\"contacts\")\n if contacts.get(\"wecom_robot_token\", \"\"):\n tokens[contacts.get(\"wecom_robot_token\", \"\")] = 1\n\n opener = urllib2.build_opener(urllib2.HTTPHandler())\n method = \"POST\"\n\n for t in tokens:\n url = \"https://qyapi.weixin.qq.com/cgi-bin/webhook/send?key={}\".format(t)\n body = {\n \"msgtype\": \"markdown\",\n \"markdown\": {\n \"content\": payload.get('tpls').get(\"wecom.tpl\", \"wecom.tpl not found\")\n }\n }\n request = urllib2.Request(url, data=json.dumps(body))\n request.add_header(\"Content-Type\",'application/json;charset=utf-8')\n request.get_method = lambda: method\n try:\n connection = opener.open(request)\n print(connection.read())\n except urllib2.HTTPError, error:\n print(error)\n\n @classmethod\n def send_dingtalk(cls, payload):\n event = payload.get('event')\n users = event.get(\"notify_users_obj\")\n\n rule_name = event.get(\"rule_name\")\n event_state = \"Triggered\"\n if event.get(\"is_recovered\"):\n event_state = \"Recovered\"\n\n tokens = {}\n phones = {}\n\n for u in users:\n if u.get(\"phone\"):\n phones[u.get(\"phone\")] = 1\n\n contacts = u.get(\"contacts\")\n if contacts.get(\"dingtalk_robot_token\", \"\"):\n tokens[contacts.get(\"dingtalk_robot_token\", \"\")] = 1\n\n opener = urllib2.build_opener(urllib2.HTTPHandler())\n method = \"POST\"\n\n for t in tokens:\n url = \"https://oapi.dingtalk.com/robot/send?access_token={}\".format(t)\n body = {\n \"msgtype\": \"markdown\",\n \"markdown\": {\n \"title\": \"{} - {}\".format(event_state, rule_name),\n \"text\": payload.get('tpls').get(\"dingtalk.tpl\", \"dingtalk.tpl not found\") + ' '.join([\"@\"+i for i in phones.keys()])\n },\n \"at\": {\n \"atMobiles\": phones.keys(),\n \"isAtAll\": False\n }\n }\n request = urllib2.Request(url, data=json.dumps(body))\n request.add_header(\"Content-Type\",'application/json;charset=utf-8')\n request.get_method = lambda: method\n try:\n connection = opener.open(request)\n print(connection.read())\n except urllib2.HTTPError, error:\n print(error)\n\n @classmethod\n def send_feishu(cls, payload):\n users = payload.get('event').get(\"notify_users_obj\")\n\n tokens = {}\n phones = {}\n\n for u in users:\n if u.get(\"phone\"):\n phones[u.get(\"phone\")] = 1\n\n contacts = u.get(\"contacts\")\n if contacts.get(\"feishu_robot_token\", \"\"):\n tokens[contacts.get(\"feishu_robot_token\", \"\")] = 1\n\n opener = urllib2.build_opener(urllib2.HTTPHandler())\n method = \"POST\"\n\n for t in tokens:\n url = \"https://open.feishu.cn/open-apis/bot/v2/hook/{}\".format(t)\n body = {\n \"msg_type\": \"text\",\n \"content\": {\n \"text\": payload.get('tpls').get(\"feishu.tpl\", \"feishu.tpl not found\")\n },\n \"at\": {\n \"atMobiles\": phones.keys(),\n \"isAtAll\": False\n }\n }\n request = urllib2.Request(url, data=json.dumps(body))\n request.add_header(\"Content-Type\",'application/json;charset=utf-8')\n request.get_method = lambda: method\n try:\n connection = opener.open(request)\n print(connection.read())\n except urllib2.HTTPError, error:\n print(error)\n\n @classmethod\n def send_sms(cls, payload):\n users = payload.get('event').get(\"notify_users_obj\")\n phones = {}\n for u in users:\n if u.get(\"phone\"):\n phones[u.get(\"phone\")] = 1\n if phones:\n print(\"send_sms not implemented, phones: {}\".format(phones.keys()))\n\n @classmethod\n def send_voice(cls, payload):\n users = payload.get('event').get(\"notify_users_obj\")\n phones = {}\n for u in users:\n if u.get(\"phone\"):\n phones[u.get(\"phone\")] = 1\n if phones:\n print(\"send_voice not implemented, phones: {}\".format(phones.keys()))\n\ndef main():\n payload = json.load(sys.stdin)\n with open(\".payload\", 'w') as f:\n f.write(json.dumps(payload, indent=4))\n for ch in payload.get('event').get('notify_channels'):\n send_func_name = \"send_{}\".format(notify_channel_funcs.get(ch.strip()))\n if not hasattr(Sender, send_func_name):\n print(\"function: {} not found\", send_func_name)\n continue\n send_func = getattr(Sender, send_func_name)\n send_func(payload)\n\ndef hello():\n print(\"hello nightingale\")\n\nif __name__ == \"__main__\":\n if len(sys.argv) == 1:\n main()\n elif sys.argv[1] == \"hello\":\n hello()\n else:\n print(\"I am confused\")"
},
{
"path": "docker/compose-host-network-metric-log/etc-nightingale/script/notify.py",
"content": "#!/usr/bin/env python3\n# -*- coding: UTF-8 -*-\nimport sys\nimport json\n\nclass Sender(object):\n @classmethod\n def send_email(cls, payload):\n # already done in go code\n pass\n\n @classmethod\n def send_wecom(cls, payload):\n # already done in go code\n pass\n\n @classmethod\n def send_dingtalk(cls, payload):\n # already done in go code\n pass\n\n @classmethod\n def send_feishu(cls, payload):\n # already done in go code\n pass\n\n @classmethod\n def send_mm(cls, payload):\n # already done in go code\n pass\n\n @classmethod\n def send_sms(cls, payload):\n users = payload.get('event').get(\"notify_users_obj\")\n phones = {}\n for u in users:\n if u.get(\"phone\"):\n phones[u.get(\"phone\")] = 1\n if phones:\n print(\"send_sms not implemented, phones: {}\".format(phones.keys()))\n\n @classmethod\n def send_voice(cls, payload):\n users = payload.get('event').get(\"notify_users_obj\")\n phones = {}\n for u in users:\n if u.get(\"phone\"):\n phones[u.get(\"phone\")] = 1\n if phones:\n print(\"send_voice not implemented, phones: {}\".format(phones.keys()))\n\ndef main():\n payload = json.load(sys.stdin)\n with open(\".payload\", 'w') as f:\n f.write(json.dumps(payload, indent=4))\n for ch in payload.get('event').get('notify_channels'):\n send_func_name = \"send_{}\".format(ch.strip())\n if not hasattr(Sender, send_func_name):\n print(\"function: {} not found\", send_func_name)\n continue\n send_func = getattr(Sender, send_func_name)\n send_func(payload)\n\ndef hello():\n print(\"hello nightingale\")\n\nif __name__ == \"__main__\":\n if len(sys.argv) == 1:\n main()\n elif sys.argv[1] == \"hello\":\n hello()\n else:\n print(\"I am confused\")\n"
},
{
"path": "docker/compose-host-network-metric-log/etc-nightingale/script/notify_feishu.py",
"content": "#!/usr/bin/env python\n# -*- coding: UTF-8 -*-\nimport sys\nimport json\nimport requests\n\nclass Sender(object):\n @classmethod\n def send_email(cls, payload):\n # already done in go code\n pass\n\n @classmethod\n def send_wecom(cls, payload):\n # already done in go code\n pass\n\n @classmethod\n def send_dingtalk(cls, payload):\n # already done in go code\n pass\n\n @classmethod\n def send_ifeishu(cls, payload):\n users = payload.get('event').get(\"notify_users_obj\")\n tokens = {}\n phones = {}\n\n for u in users:\n if u.get(\"phone\"):\n phones[u.get(\"phone\")] = 1\n\n contacts = u.get(\"contacts\")\n if contacts.get(\"feishu_robot_token\", \"\"):\n tokens[contacts.get(\"feishu_robot_token\", \"\")] = 1\n \n headers = {\n \"Content-Type\": \"application/json;charset=utf-8\",\n \"Host\": \"open.feishu.cn\"\n }\n\n for t in tokens:\n url = \"https://open.feishu.cn/open-apis/bot/v2/hook/{}\".format(t)\n body = {\n \"msg_type\": \"text\",\n \"content\": {\n \"text\": payload.get('tpls').get(\"feishu\", \"feishu not found\")\n },\n \"at\": {\n \"atMobiles\": list(phones.keys()),\n \"isAtAll\": False\n }\n }\n\n response = requests.post(url, headers=headers, data=json.dumps(body))\n print(f\"notify_ifeishu: token={t} status_code={response.status_code} response_text={response.text}\")\n\n @classmethod\n def send_mm(cls, payload):\n # already done in go code\n pass\n\n @classmethod\n def send_sms(cls, payload):\n pass\n\n @classmethod\n def send_voice(cls, payload):\n pass\n\ndef main():\n payload = json.load(sys.stdin)\n with open(\".payload\", 'w') as f:\n f.write(json.dumps(payload, indent=4))\n for ch in payload.get('event').get('notify_channels'):\n send_func_name = \"send_{}\".format(ch.strip())\n if not hasattr(Sender, send_func_name):\n print(\"function: {} not found\", send_func_name)\n continue\n send_func = getattr(Sender, send_func_name)\n send_func(payload)\n\ndef hello():\n print(\"hello nightingale\")\n\nif __name__ == \"__main__\":\n if len(sys.argv) == 1:\n main()\n elif sys.argv[1] == \"hello\":\n hello()\n else:\n print(\"I am confused\")"
},
{
"path": "docker/compose-host-network-metric-log/etc-nightingale/script/rule_converter.py",
"content": "import json\nimport yaml\n\n'''\n将promtheus/vmalert的rule转换为n9e中的rule\n支持k8s的rule configmap\n'''\n\nrule_file = 'rules.yaml'\n\n\ndef convert_interval(interval):\n if interval.endswith('s') or interval.endswith('S'):\n return int(interval[:-1])\n if interval.endswith('m') or interval.endswith('M'):\n return int(interval[:-1]) * 60\n if interval.endswith('h') or interval.endswith('H'):\n return int(interval[:-1]) * 60 * 60\n if interval.endswith('d') or interval.endswith('D'):\n return int(interval[:-1]) * 60 * 60 * 24\n return int(interval)\n\n\ndef convert_alert(rule, interval):\n name = rule['alert']\n prom_ql = rule['expr']\n if 'for' in rule:\n prom_for_duration = convert_interval(rule['for'])\n else:\n prom_for_duration = 0\n\n prom_eval_interval = convert_interval(interval)\n note = ''\n if 'annotations' in rule:\n for v in rule['annotations'].values():\n note = v\n break\n \n annotations = {}\n if 'annotations' in rule:\n for k, v in rule['annotations'].items():\n annotations[k] = v\n \n\n append_tags = []\n severity = 2\n if 'labels' in rule:\n for k, v in rule['labels'].items():\n if k != 'severity':\n append_tags.append('{}={}'.format(k, v))\n continue\n if v == 'critical':\n severity = 1\n elif v == 'info':\n severity = 3\n # elif v == 'warning':\n # severity = 2\n\n \n n9e_alert_rule = {\n \"name\": name,\n \"note\": note,\n \"severity\": severity,\n \"disabled\": 0,\n \"prom_for_duration\": prom_for_duration,\n \"prom_ql\": prom_ql,\n \"prom_eval_interval\": prom_eval_interval,\n \"enable_stime\": \"00:00\",\n \"enable_etime\": \"23:59\",\n \"enable_days_of_week\": [\n \"1\",\n \"2\",\n \"3\",\n \"4\",\n \"5\",\n \"6\",\n \"0\"\n ],\n \"enable_in_bg\": 0,\n \"notify_recovered\": 1,\n \"notify_channels\": [],\n \"notify_repeat_step\": 60,\n \"recover_duration\": 0,\n \"callbacks\": [],\n \"runbook_url\": \"\",\n \"append_tags\": append_tags,\n \"annotations\":annotations\n }\n return n9e_alert_rule\n\n\ndef convert_record(rule, interval):\n name = rule['record']\n prom_ql = rule['expr']\n prom_eval_interval = convert_interval(interval)\n note = ''\n append_tags = []\n if 'labels' in rule:\n for k, v in rule['labels'].items():\n append_tags.append('{}={}'.format(k, v))\n\n n9e_record_rule = {\n \"name\": name,\n \"note\": note,\n \"disabled\": 0,\n \"prom_ql\": prom_ql,\n \"prom_eval_interval\": prom_eval_interval,\n \"append_tags\": append_tags\n }\n return n9e_record_rule\n\n\n'''\nexample of rule group file\n---\ngroups:\n- name: example\n rules:\n - alert: HighRequestLatency\n expr: job:request_latency_seconds:mean5m{job=\"myjob\"} > 0.5\n for: 10m\n labels:\n severity: page\n annotations:\n summary: High request latency\n'''\ndef deal_group(group):\n \"\"\"\n parse single prometheus/vmalert rule group\n \"\"\"\n alert_rules = []\n record_rules = []\n\n for rule_segment in group['groups']:\n if 'interval' in rule_segment:\n interval = rule_segment['interval']\n else:\n interval = '15s'\n for rule in rule_segment['rules']:\n if 'alert' in rule:\n alert_rules.append(convert_alert(rule, interval))\n else:\n record_rules.append(convert_record(rule, interval))\n\n return alert_rules, record_rules\n\n\n'''\nexample of k8s rule configmap\n---\napiVersion: v1\nkind: ConfigMap\nmetadata:\n name: rulefiles-0\ndata:\n etcdrules.yaml: |\n groups:\n - name: etcd\n rules:\n - alert: etcdInsufficientMembers\n annotations:\n message: 'etcd cluster \"{{ $labels.job }}\": insufficient members ({{ $value}}).'\n expr: sum(up{job=~\".*etcd.*\"} == bool 1) by (job) < ((count(up{job=~\".*etcd.*\"})\n by (job) + 1) / 2)\n for: 3m\n labels:\n severity: critical\n'''\ndef deal_configmap(rule_configmap):\n \"\"\"\n parse rule configmap from k8s\n \"\"\"\n all_record_rules = []\n all_alert_rules = []\n for _, rule_group_str in rule_configmap['data'].items():\n rule_group = yaml.load(rule_group_str, Loader=yaml.FullLoader)\n alert_rules, record_rules = deal_group(rule_group)\n all_alert_rules.extend(alert_rules)\n all_record_rules.extend(record_rules)\n\n return all_alert_rules, all_record_rules\n\n\ndef main():\n with open(rule_file, 'r') as f:\n rule_config = yaml.load(f, Loader=yaml.FullLoader)\n \n # 如果文件是k8s中的configmap,使用下面的方法\n # alert_rules, record_rules = deal_configmap(rule_config)\n alert_rules, record_rules = deal_group(rule_config)\n\n with open(\"alert-rules.json\", 'w') as fw:\n json.dump(alert_rules, fw, indent=2, ensure_ascii=False)\n\n with open(\"record-rules.json\", 'w') as fw:\n json.dump(record_rules, fw, indent=2, ensure_ascii=False)\n\n\nif __name__ == '__main__':\n main()\n"
},
{
"path": "docker/compose-host-network-metric-log/etc-prometheus/prometheus.yml",
"content": "# my global config\nglobal:\n scrape_interval: 15s # Set the scrape interval to every 15 seconds. Default is every 1 minute.\n evaluation_interval: 15s # Evaluate rules every 15 seconds. The default is every 1 minute.\n # scrape_timeout is set to the global default (10s).\n\n# Alertmanager configuration\nalerting:\n alertmanagers:\n - static_configs:\n - targets:\n # - alertmanager:9093\n\n# Load rules once and periodically evaluate them according to the global 'evaluation_interval'.\nrule_files:\n # - \"first_rules.yml\"\n # - \"second_rules.yml\"\n\nscrape_configs:\n # The job name is added as a label `job=` to any timeseries scraped from this config.\n - job_name: 'prometheus'\n static_configs:\n - targets: ['localhost:9090']\n\n - job_name: 'nightingale'\n static_configs:\n - targets: ['localhost:17000']\n"
},
{
"path": "docker/compose-postgres/categraf/conf/config.toml",
"content": "[global]\n# whether print configs\nprint_configs = false\n\n# add label(agent_hostname) to series\n# \"\" -> auto detect hostname\n# \"xx\" -> use specified string xx\n# \"$hostname\" -> auto detect hostname\n# \"$ip\" -> auto detect ip\n# \"$hostname-$ip\" -> auto detect hostname and ip to replace the vars\nhostname = \"$HOSTNAME\"\n\n# will not add label(agent_hostname) if true\nomit_hostname = false\n\n# s | ms\nprecision = \"ms\"\n\n# global collect interval\ninterval = 15\n\n[global.labels]\nsource=\"categraf\"\n# region = \"shanghai\"\n# env = \"localhost\"\n\n[writer_opt]\n# default: 2000\nbatch = 2000\n# channel(as queue) size\nchan_size = 10000\n\n[[writers]]\nurl = \"http://nightingale:17000/prometheus/v1/write\"\n\n# Basic auth username\nbasic_auth_user = \"\"\n\n# Basic auth password\nbasic_auth_pass = \"\"\n\n# timeout settings, unit: ms\ntimeout = 5000\ndial_timeout = 2500\nmax_idle_conns_per_host = 100\n\n[http]\nenable = false\naddress = \":9100\"\nprint_access = false\nrun_mode = \"release\"\n\n[heartbeat]\nenable = true\n\n# report os version cpu.util mem.util metadata\nurl = \"http://nightingale:17000/v1/n9e/heartbeat\"\n\n# interval, unit: s\ninterval = 10\n\n# Basic auth username\nbasic_auth_user = \"\"\n\n# Basic auth password\nbasic_auth_pass = \"\"\n\n## Optional headers\n# headers = [\"X-From\", \"categraf\", \"X-Xyz\", \"abc\"]\n\n# timeout settings, unit: ms\ntimeout = 5000\ndial_timeout = 2500\nmax_idle_conns_per_host = 100\n\n[ibex]\nenable = true\n## ibex flush interval\ninterval = \"1000ms\"\n## n9e ibex server rpc address\nservers = [\"nightingale:20090\"]\n## temp script dir\nmeta_dir = \"./meta\"\n"
},
{
"path": "docker/compose-postgres/categraf/conf/input.cpu/cpu.toml",
"content": "# # collect interval\n# interval = 15\n\n# # whether collect per cpu\n# collect_per_cpu = false\n"
},
{
"path": "docker/compose-postgres/categraf/conf/input.disk/disk.toml",
"content": "# # collect interval\n# interval = 15\n\n# # By default stats will be gathered for all mount points.\n# # Set mount_points will restrict the stats to only the specified mount points.\n# mount_points = [\"/\"]\n\n# Ignore mount points by filesystem type.\nignore_fs = [\"tmpfs\", \"devtmpfs\", \"devfs\", \"iso9660\", \"overlay\", \"aufs\", \"squashfs\"]\n\nignore_mount_points = [\"/boot\"]\n"
},
{
"path": "docker/compose-postgres/categraf/conf/input.diskio/diskio.toml",
"content": "# # collect interval\n# interval = 15\n\n# # By default, categraf will gather stats for all devices including disk partitions.\n# # Setting devices will restrict the stats to the specified devices.\n# devices = [\"sda\", \"sdb\", \"vd*\"]"
},
{
"path": "docker/compose-postgres/categraf/conf/input.docker/docker.toml",
"content": "# # collect interval\n# interval = 15\n\n[[instances]]\n# # append some labels for series\n# labels = { region=\"cloud\", product=\"n9e\" }\n\n# # interval = global.interval * interval_times\n# interval_times = 1\n\n## Docker Endpoint\n## To use TCP, set endpoint = \"tcp://[ip]:[port]\"\n## To use environment variables (ie, docker-machine), set endpoint = \"ENV\"\nendpoint = \"unix:///var/run/docker.sock\"\n\n## Set to true to collect Swarm metrics(desired_replicas, running_replicas)\ngather_services = false\ngather_extend_memstats = false\n\ncontainer_id_label_enable = true\ncontainer_id_label_short_style = true\n\n## Containers to include and exclude. Globs accepted.\n## Note that an empty array for both will include all containers\ncontainer_name_include = []\ncontainer_name_exclude = []\n\n## Container states to include and exclude. Globs accepted.\n## When empty only containers in the \"running\" state will be captured.\n## example: container_state_include = [\"created\", \"restarting\", \"running\", \"removing\", \"paused\", \"exited\", \"dead\"]\n## example: container_state_exclude = [\"created\", \"restarting\", \"running\", \"removing\", \"paused\", \"exited\", \"dead\"]\n# container_state_include = []\n# container_state_exclude = []\n\n## Timeout for docker list, info, and stats commands\ntimeout = \"5s\"\n\n## Specifies for which classes a per-device metric should be issued\n## Possible values are 'cpu' (cpu0, cpu1, ...), 'blkio' (8:0, 8:1, ...) and 'network' (eth0, eth1, ...)\n## Please note that this setting has no effect if 'perdevice' is set to 'true'\nperdevice_include = []\n\n## Specifies for which classes a total metric should be issued. Total is an aggregated of the 'perdevice' values.\n## Possible values are 'cpu', 'blkio' and 'network'\n## Total 'cpu' is reported directly by Docker daemon, and 'network' and 'blkio' totals are aggregated by this plugin.\n## Please note that this setting has no effect if 'total' is set to 'false'\ntotal_include = [\"cpu\", \"blkio\", \"network\"]\n\n## Which environment variables should we use as a tag\n##tag_env = [\"JAVA_HOME\", \"HEAP_SIZE\"]\n\n## docker labels to include and exclude as tags. Globs accepted.\n## Note that an empty array for both will include all labels as tags\ndocker_label_include = []\ndocker_label_exclude = [\"annotation*\", \"io.kubernetes*\", \"*description*\", \"*maintainer*\", \"*hash\", \"*author*\"]\n\n## Optional TLS Config\n# use_tls = false\n# tls_ca = \"/etc/telegraf/ca.pem\"\n# tls_cert = \"/etc/telegraf/cert.pem\"\n# tls_key = \"/etc/telegraf/key.pem\"\n## Use TLS but skip chain & host verification\n# insecure_skip_verify = false\n"
},
{
"path": "docker/compose-postgres/categraf/conf/input.kernel/kernel.toml",
"content": "# # collect interval\n# interval = 15\n"
},
{
"path": "docker/compose-postgres/categraf/conf/input.mem/mem.toml",
"content": "# # collect interval\n# interval = 15\n\n# # whether collect platform specified metrics\ncollect_platform_fields = true\n"
},
{
"path": "docker/compose-postgres/categraf/conf/input.net/net.toml",
"content": "# # collect interval\n# interval = 15\n\n# # whether collect protocol stats on Linux\n# collect_protocol_stats = false\n\n# # setting interfaces will tell categraf to gather these explicit interfaces\n# interfaces = [\"eth0\"]"
},
{
"path": "docker/compose-postgres/categraf/conf/input.netstat/netstat.toml",
"content": "# # collect interval\n# interval = 15\n"
},
{
"path": "docker/compose-postgres/categraf/conf/input.processes/processes.toml",
"content": "# # collect interval\n# interval = 15\n\n# # force use ps command to gather\n# force_ps = false\n\n# # force use /proc to gather\n# force_proc = false"
},
{
"path": "docker/compose-postgres/categraf/conf/input.system/system.toml",
"content": "# # collect interval\n# interval = 15\n\n# # whether collect metric: system_n_users\n# collect_user_number = false\n"
},
{
"path": "docker/compose-postgres/categraf/conf/prometheus.toml",
"content": "[prometheus]\r\n enable=true\r\n scrape_config_file=\"/etc/prometheus/prometheus.yml\"\r\n ## log level, debug warn info error\r\n log_level=\"info\"\r\n ## wal file storage path ,default ./data-agent\r\n # wal_storage_path=\"/path/to/storage\"\r\n ## wal reserve time duration, default value is 2 hour\r\n # wal_min_duration=2\r\n\r\n"
},
{
"path": "docker/compose-postgres/docker-compose.yaml",
"content": "version: \"3.7\"\n\nnetworks:\n nightingale:\n driver: bridge\n\nservices:\n postgres:\n # platform: linux/x86_64\n image: \"postgres:12-alpine\"\n container_name: postgres\n hostname: postgres\n restart: always\n ports:\n - \"5432:5432\"\n environment:\n TZ: Asia/Shanghai\n POSTGRES_USER: root\n POSTGRES_PASSWORD: 1234\n POSTGRES_DB: n9e_v6\n PGDATA: /var/lib/postgresql/data/pgdata\n volumes:\n - ./pgdata:/var/lib/postgresql/data\n - ./initsql_for_postgres:/docker-entrypoint-initdb.d/\n networks:\n - nightingale\n\n redis:\n image: \"redis:7.0-alpine\"\n container_name: redis\n hostname: redis\n restart: always\n ports:\n - \"6379:6379\"\n environment:\n TZ: Asia/Shanghai\n networks:\n - nightingale\n\n victoriametrics:\n image: victoriametrics/victoria-metrics:v1.79.12\n container_name: victoriametrics\n hostname: victoriametrics\n restart: always\n environment:\n TZ: Asia/Shanghai\n ports:\n - \"8428:8428\"\n networks:\n - nightingale\n command:\n - \"--loggerTimezone=Asia/Shanghai\"\n\n nightingale:\n image: flashcatcloud/nightingale:latest\n container_name: nightingale\n hostname: nightingale\n restart: always\n environment:\n GIN_MODE: release\n TZ: Asia/Shanghai\n WAIT_HOSTS: postgres:5432, redis:6379\n volumes:\n - ./n9eetc_pg:/app/etc\n ports:\n - \"17000:17000\"\n networks:\n - nightingale\n depends_on:\n - postgres\n - redis\n - victoriametrics\n links:\n - postgres:postgres\n - redis:redis\n - victoriametrics:victoriametrics\n command:\n - /app/n9e\n\n categraf:\n image: \"flashcatcloud/categraf:latest\"\n container_name: \"categraf\"\n hostname: \"categraf01\"\n restart: always\n environment:\n TZ: Asia/Shanghai\n HOST_PROC: /hostfs/proc\n HOST_SYS: /hostfs/sys\n HOST_MOUNT_PREFIX: /hostfs\n WAIT_HOSTS: nightingale:17000, nightingale:20090\n volumes:\n - ./categraf/conf:/etc/categraf/conf\n - /:/hostfs\n - /var/run/docker.sock:/var/run/docker.sock\n - ./prometc_vm:/etc/prometheus\n # ports:\n # - \"9100:9100/tcp\"\n networks:\n - nightingale\n depends_on:\n - nightingale\n links:\n - nightingale:nightingale"
},
{
"path": "docker/compose-postgres/initsql_for_postgres/a-n9e-for-Postgres.sql",
"content": "CREATE TABLE users (\n id bigserial,\n username varchar(64) not null,\n nickname varchar(64) not null,\n password varchar(128) not null default '',\n phone varchar(16) not null default '',\n email varchar(64) not null default '',\n portrait varchar(255) not null default '',\n roles varchar(255) not null,\n contacts varchar(1024),\n maintainer int not null default 0,\n belong varchar(16) not null default '',\n last_active_time bigint not null default 0,\n create_at bigint not null default 0,\n create_by varchar(64) not null default '',\n update_at bigint not null default 0,\n update_by varchar(64) not null default '',\n PRIMARY KEY (id),\n UNIQUE (username)\n);\n\nCOMMENT ON COLUMN users.id IS 'id';\nCOMMENT ON COLUMN users.username IS 'login name, cannot rename'; \nCOMMENT ON COLUMN users.nickname IS 'display name, chinese name';\nCOMMENT ON COLUMN users.portrait IS 'portrait image url';\nCOMMENT ON COLUMN users.roles IS 'Admin | Standard | Guest, split by space';\nCOMMENT ON COLUMN users.contacts IS 'json e.g. {wecom:xx, dingtalk_robot_token:yy}';\nCOMMENT ON COLUMN users.belong IS 'belong';\n\ninsert into users(id, username, nickname, password, roles, create_at, create_by, update_at, update_by) values(1, 'root', '超管', 'root.2020', 'Admin', date_part('epoch',current_timestamp)::int, 'system', date_part('epoch',current_timestamp)::int, 'system');\n\nCREATE TABLE user_group (\n id bigserial,\n name varchar(128) not null default '',\n note varchar(255) not null default '',\n create_at bigint not null default 0,\n create_by varchar(64) not null default '',\n update_at bigint not null default 0,\n update_by varchar(64) not null default '',\n PRIMARY KEY (id)\n) ;\nCREATE INDEX user_group_create_by_idx ON user_group (create_by);\nCREATE INDEX user_group_update_at_idx ON user_group (update_at);\n\ninsert into user_group(id, name, create_at, create_by, update_at, update_by) values(1, 'demo-root-group', date_part('epoch',current_timestamp)::int, 'root', date_part('epoch',current_timestamp)::int, 'root');\n\nCREATE TABLE user_group_member (\n id bigserial,\n group_id bigint not null,\n user_id bigint not null,\n PRIMARY KEY(id)\n) ;\nCREATE INDEX user_group_member_group_id_idx ON user_group_member (group_id);\nCREATE INDEX user_group_member_user_id_idx ON user_group_member (user_id);\n\ninsert into user_group_member(group_id, user_id) values(1, 1);\n\nCREATE TABLE configs (\n id bigserial,\n ckey varchar(191) not null,\n cval text not null default '',\n note varchar(1024) not null default '',\n external int not null default 0,\n encrypted int not null default 0,\n create_at bigint not null default 0,\n create_by varchar(64) not null default '',\n update_at bigint not null default 0,\n update_by varchar(64) not null default '',\n PRIMARY KEY (id),\n UNIQUE (ckey)\n);\n\nCREATE TABLE role (\n id bigserial,\n name varchar(191) not null default '',\n note varchar(255) not null default '',\n PRIMARY KEY (id),\n UNIQUE (name)\n) ;\n\ninsert into role(name, note) values('Admin', 'Administrator role');\ninsert into role(name, note) values('Standard', 'Ordinary user role');\ninsert into role(name, note) values('Guest', 'Readonly user role');\n\nCREATE TABLE role_operation(\n id bigserial,\n role_name varchar(128) not null,\n operation varchar(191) not null,\n PRIMARY KEY(id)\n) ;\nCREATE INDEX role_operation_role_name_idx ON role_operation (role_name);\nCREATE INDEX role_operation_operation_idx ON role_operation (operation);\n\n\n-- Admin is special, who has no concrete operation but can do anything.\ninsert into role_operation(role_name, operation) values('Guest', '/metric/explorer');\ninsert into role_operation(role_name, operation) values('Guest', '/object/explorer');\ninsert into role_operation(role_name, operation) values('Guest', '/log/explorer');\ninsert into role_operation(role_name, operation) values('Guest', '/trace/explorer');\ninsert into role_operation(role_name, operation) values('Guest', '/help/version');\ninsert into role_operation(role_name, operation) values('Guest', '/help/contact');\n\ninsert into role_operation(role_name, operation) values('Standard', '/metric/explorer');\ninsert into role_operation(role_name, operation) values('Standard', '/object/explorer');\ninsert into role_operation(role_name, operation) values('Standard', '/log/explorer');\ninsert into role_operation(role_name, operation) values('Standard', '/trace/explorer');\ninsert into role_operation(role_name, operation) values('Standard', '/help/version');\ninsert into role_operation(role_name, operation) values('Standard', '/help/contact');\ninsert into role_operation(role_name, operation) values('Standard', '/help/servers');\ninsert into role_operation(role_name, operation) values('Standard', '/help/migrate');\n\ninsert into role_operation(role_name, operation) values('Standard', '/alert-rules-built-in');\ninsert into role_operation(role_name, operation) values('Standard', '/dashboards-built-in');\ninsert into role_operation(role_name, operation) values('Standard', '/trace/dependencies');\n\ninsert into role_operation(role_name, operation) values('Admin', '/help/source');\ninsert into role_operation(role_name, operation) values('Admin', '/help/sso');\ninsert into role_operation(role_name, operation) values('Admin', '/help/notification-tpls');\ninsert into role_operation(role_name, operation) values('Admin', '/help/notification-settings');\n\ninsert into role_operation(role_name, operation) values('Standard', '/users');\ninsert into role_operation(role_name, operation) values('Standard', '/user-groups');\ninsert into role_operation(role_name, operation) values('Standard', '/user-groups/add');\ninsert into role_operation(role_name, operation) values('Standard', '/user-groups/put');\ninsert into role_operation(role_name, operation) values('Standard', '/user-groups/del');\ninsert into role_operation(role_name, operation) values('Standard', '/busi-groups');\ninsert into role_operation(role_name, operation) values('Standard', '/busi-groups/add');\ninsert into role_operation(role_name, operation) values('Standard', '/busi-groups/put');\ninsert into role_operation(role_name, operation) values('Standard', '/busi-groups/del');\ninsert into role_operation(role_name, operation) values('Standard', '/targets');\ninsert into role_operation(role_name, operation) values('Standard', '/targets/add');\ninsert into role_operation(role_name, operation) values('Standard', '/targets/put');\ninsert into role_operation(role_name, operation) values('Standard', '/targets/del');\ninsert into role_operation(role_name, operation) values('Standard', '/dashboards');\ninsert into role_operation(role_name, operation) values('Standard', '/dashboards/add');\ninsert into role_operation(role_name, operation) values('Standard', '/dashboards/put');\ninsert into role_operation(role_name, operation) values('Standard', '/dashboards/del');\ninsert into role_operation(role_name, operation) values('Standard', '/alert-rules');\ninsert into role_operation(role_name, operation) values('Standard', '/alert-rules/add');\ninsert into role_operation(role_name, operation) values('Standard', '/alert-rules/put');\ninsert into role_operation(role_name, operation) values('Standard', '/alert-rules/del');\ninsert into role_operation(role_name, operation) values('Standard', '/alert-mutes');\ninsert into role_operation(role_name, operation) values('Standard', '/alert-mutes/add');\ninsert into role_operation(role_name, operation) values('Standard', '/alert-mutes/del');\ninsert into role_operation(role_name, operation) values('Standard', '/alert-subscribes');\ninsert into role_operation(role_name, operation) values('Standard', '/alert-subscribes/add');\ninsert into role_operation(role_name, operation) values('Standard', '/alert-subscribes/put');\ninsert into role_operation(role_name, operation) values('Standard', '/alert-subscribes/del');\ninsert into role_operation(role_name, operation) values('Standard', '/alert-cur-events');\ninsert into role_operation(role_name, operation) values('Standard', '/alert-cur-events/del');\ninsert into role_operation(role_name, operation) values('Standard', '/alert-his-events');\ninsert into role_operation(role_name, operation) values('Standard', '/job-tpls');\ninsert into role_operation(role_name, operation) values('Standard', '/job-tpls/add');\ninsert into role_operation(role_name, operation) values('Standard', '/job-tpls/put');\ninsert into role_operation(role_name, operation) values('Standard', '/job-tpls/del');\ninsert into role_operation(role_name, operation) values('Standard', '/job-tasks');\ninsert into role_operation(role_name, operation) values('Standard', '/job-tasks/add');\ninsert into role_operation(role_name, operation) values('Standard', '/job-tasks/put');\ninsert into role_operation(role_name, operation) values('Standard', '/recording-rules');\ninsert into role_operation(role_name, operation) values('Standard', '/recording-rules/add');\ninsert into role_operation(role_name, operation) values('Standard', '/recording-rules/put');\ninsert into role_operation(role_name, operation) values('Standard', '/recording-rules/del');\n\n-- for alert_rule | collect_rule | mute | dashboard grouping\nCREATE TABLE busi_group (\n id bigserial,\n name varchar(191) not null,\n label_enable smallint not null default 0,\n label_value varchar(191) not null default '' ,\n create_at bigint not null default 0,\n create_by varchar(64) not null default '',\n update_at bigint not null default 0,\n update_by varchar(64) not null default '',\n PRIMARY KEY (id),\n UNIQUE (name)\n) ;\nCOMMENT ON COLUMN busi_group.label_value IS 'if label_enable: label_value can not be blank';\n\ninsert into busi_group(id, name, create_at, create_by, update_at, update_by) values(1, 'Default Busi Group', date_part('epoch',current_timestamp)::int, 'root', date_part('epoch',current_timestamp)::int, 'root');\n\nCREATE TABLE busi_group_member (\n id bigserial,\n busi_group_id bigint not null ,\n user_group_id bigint not null ,\n perm_flag char(2) not null ,\n PRIMARY KEY (id)\n) ;\nCREATE INDEX busi_group_member_busi_group_id_idx ON busi_group_member (busi_group_id);\nCREATE INDEX busi_group_member_user_group_id_idx ON busi_group_member (user_group_id);\nCOMMENT ON COLUMN busi_group_member.busi_group_id IS 'busi group id';\nCOMMENT ON COLUMN busi_group_member.user_group_id IS 'user group id';\nCOMMENT ON COLUMN busi_group_member.perm_flag IS 'ro | rw';\n\n\ninsert into busi_group_member(busi_group_id, user_group_id, perm_flag) values(1, 1, 'rw');\n\n-- for dashboard new version\nCREATE TABLE board (\n id bigserial,\n group_id bigint not null default 0 ,\n name varchar(191) not null,\n ident varchar(200) not null default '',\n tags varchar(255) not null ,\n public smallint not null default 0 ,\n built_in smallint not null default 0 ,\n hide smallint not null default 0 ,\n public_cate bigint NOT NULL DEFAULT 0,\n create_at bigint not null default 0,\n create_by varchar(64) not null default '',\n update_at bigint not null default 0,\n update_by varchar(64) not null default '',\n note varchar(1024) not null default '',\n PRIMARY KEY (id),\n UNIQUE (group_id, name)\n) ;\nCREATE INDEX board_ident_idx ON board (ident);\nCOMMENT ON COLUMN board.group_id IS 'busi group id';\nCOMMENT ON COLUMN board.tags IS 'split by space';\nCOMMENT ON COLUMN board.public IS '0:false 1:true';\nCOMMENT ON COLUMN board.built_in IS '0:false 1:true';\nCOMMENT ON COLUMN board.hide IS '0:false 1:true';\nCOMMENT ON COLUMN board.public_cate IS '0 anonymous 1 login 2 busi';\nCOMMENT ON COLUMN board.note IS 'note';\n\n\n-- for dashboard new version\nCREATE TABLE board_payload (\n id bigint not null ,\n payload text not null,\n UNIQUE (id)\n) ;\nCOMMENT ON COLUMN board_payload.id IS 'dashboard id';\n\n-- deprecated\nCREATE TABLE dashboard (\n id bigserial,\n group_id bigint not null default 0 ,\n name varchar(191) not null,\n tags varchar(255) not null ,\n configs varchar(8192) ,\n create_at bigint not null default 0,\n create_by varchar(64) not null default '',\n update_at bigint not null default 0,\n update_by varchar(64) not null default '',\n PRIMARY KEY (id),\n UNIQUE (group_id, name)\n) ;\nCOMMENT ON COLUMN dashboard.group_id IS 'busi group id';\nCOMMENT ON COLUMN dashboard.tags IS 'split by space';\nCOMMENT ON COLUMN dashboard.configs IS 'dashboard variables';\n\n-- deprecated\n-- auto create the first subclass 'Default chart group' of dashboard\nCREATE TABLE chart_group (\n id bigserial,\n dashboard_id bigint not null,\n name varchar(255) not null,\n weight int not null default 0,\n PRIMARY KEY (id)\n) ;\nCREATE INDEX chart_group_dashboard_id_idx ON chart_group (dashboard_id);\n\n-- deprecated\nCREATE TABLE chart (\n id bigserial,\n group_id bigint not null ,\n configs text,\n weight int not null default 0,\n PRIMARY KEY (id)\n) ;\nCREATE INDEX chart_group_id_idx ON chart (group_id);\nCOMMENT ON COLUMN chart.group_id IS 'chart group id';\n\n\nCREATE TABLE chart_share (\n id bigserial,\n cluster varchar(128) not null,\n datasource_id bigint not null default 0,\n configs text,\n create_at bigint not null default 0,\n create_by varchar(64) not null default '',\n primary key (id)\n) ;\nCREATE INDEX chart_share_create_at_idx ON chart_share (create_at);\n\n\nCREATE TABLE alert_rule (\n id bigserial,\n group_id bigint not null default 0 ,\n cate varchar(128) not null,\n datasource_ids varchar(255) not null default '' ,\n cluster varchar(128) not null,\n name varchar(255) not null,\n note varchar(1024) not null default '',\n prod varchar(255) not null default '',\n algorithm varchar(255) not null default '',\n algo_params varchar(255),\n delay int not null default 0,\n severity smallint not null ,\n disabled smallint not null ,\n prom_for_duration int not null ,\n rule_config text not null ,\n prom_ql text not null ,\n prom_eval_interval int not null ,\n enable_stime varchar(255) not null default '00:00',\n enable_etime varchar(255) not null default '23:59',\n enable_days_of_week varchar(255) not null default '' ,\n enable_in_bg smallint not null default 0 ,\n notify_recovered smallint not null ,\n notify_channels varchar(255) not null default '' ,\n notify_groups varchar(255) not null default '' ,\n notify_repeat_step int not null default 0 ,\n notify_max_number int not null default 0 ,\n recover_duration int not null default 0 ,\n callbacks varchar(255) not null default '' ,\n runbook_url varchar(255),\n append_tags varchar(255) not null default '' ,\n annotations text not null ,\n extra_config text not null ,\n create_at bigint not null default 0,\n create_by varchar(64) not null default '',\n update_at bigint not null default 0,\n update_by varchar(64) not null default '',\n time_zone varchar(64) not null default '',\n PRIMARY KEY (id)\n) ;\nCREATE INDEX alert_rule_group_id_idx ON alert_rule (group_id);\nCREATE INDEX alert_rule_update_at_idx ON alert_rule (update_at);\nCOMMENT ON COLUMN alert_rule.group_id IS 'busi group id';\nCOMMENT ON COLUMN alert_rule.datasource_ids IS 'datasource ids';\nCOMMENT ON COLUMN alert_rule.severity IS '1:Emergency 2:Warning 3:Notice';\nCOMMENT ON COLUMN alert_rule.disabled IS '0:enabled 1:disabled';\nCOMMENT ON COLUMN alert_rule.prom_for_duration IS 'prometheus for, unit:s';\nCOMMENT ON COLUMN alert_rule.rule_config IS 'rule_config';\nCOMMENT ON COLUMN alert_rule.prom_ql IS 'promql';\nCOMMENT ON COLUMN alert_rule.prom_eval_interval IS 'evaluate interval';\nCOMMENT ON COLUMN alert_rule.enable_stime IS '00:00';\nCOMMENT ON COLUMN alert_rule.enable_etime IS '23:59';\nCOMMENT ON COLUMN alert_rule.enable_days_of_week IS 'split by space: 0 1 2 3 4 5 6';\nCOMMENT ON COLUMN alert_rule.enable_in_bg IS '1: only this bg 0: global';\nCOMMENT ON COLUMN alert_rule.notify_recovered IS 'whether notify when recovery';\nCOMMENT ON COLUMN alert_rule.notify_channels IS 'split by space: sms voice email dingtalk wecom';\nCOMMENT ON COLUMN alert_rule.notify_groups IS 'split by space: 233 43';\nCOMMENT ON COLUMN alert_rule.notify_repeat_step IS 'unit: min';\nCOMMENT ON COLUMN alert_rule.recover_duration IS 'unit: s';\nCOMMENT ON COLUMN alert_rule.callbacks IS 'split by space: http://a.com/api/x http://a.com/api/y';\nCOMMENT ON COLUMN alert_rule.append_tags IS 'split by space: service=n9e mod=api';\nCOMMENT ON COLUMN alert_rule.annotations IS 'annotations';\nCOMMENT ON COLUMN alert_rule.extra_config IS 'extra_config';\n\nCREATE TABLE alert_mute (\n id bigserial,\n group_id bigint not null default 0 ,\n prod varchar(255) not null default '',\n note varchar(1024) not null default '',\n cate varchar(128) not null,\n cluster varchar(128) not null,\n datasource_ids varchar(255) not null default '' ,\n tags jsonb NOT NULL ,\n cause varchar(255) not null default '',\n btime bigint not null default 0 ,\n etime bigint not null default 0 ,\n disabled smallint not null default 0 ,\n mute_time_type smallint not null default 0,\n periodic_mutes varchar(4096) not null default '',\n severities varchar(32) not null default '',\n create_at bigint not null default 0,\n create_by varchar(64) not null default '',\n update_at bigint not null default 0,\n update_by varchar(64) not null default '',\n PRIMARY KEY (id)\n) ;\nCREATE INDEX alert_mute_group_id_idx ON alert_mute (group_id);\nCREATE INDEX alert_mute_update_at_idx ON alert_mute (update_at);\nCOMMENT ON COLUMN alert_mute.group_id IS 'busi group id';\nCOMMENT ON COLUMN alert_mute.datasource_ids IS 'datasource ids';\nCOMMENT ON COLUMN alert_mute.tags IS 'json,map,tagkey->regexp|value';\nCOMMENT ON COLUMN alert_mute.btime IS 'begin time';\nCOMMENT ON COLUMN alert_mute.etime IS 'end time';\nCOMMENT ON COLUMN alert_mute.disabled IS '0:enabled 1:disabled';\n\n\nCREATE TABLE alert_subscribe (\n id bigserial,\n name varchar(255) not null default '',\n disabled int not null default 0,\n group_id bigint not null default 0,\n prod varchar(255) not null default '',\n cate varchar(128) not null,\n datasource_ids varchar(255) not null default '',\n cluster varchar(128) not null,\n rule_id bigint not null default 0,\n severities varchar(32) not null default '',\n tags varchar(4096) not null default '[]',\n redefine_severity smallint default 0 ,\n new_severity smallint not null,\n redefine_channels smallint default 0 ,\n new_channels varchar(255) not null default '',\n user_group_ids varchar(250) not null,\n busi_groups VARCHAR(4096) NOT NULL DEFAULT '[]',\n note VARCHAR(1024) DEFAULT '',\n rule_ids VARCHAR(1024) DEFAULT '',\n webhooks text not null,\n extra_config text not null,\n redefine_webhooks int default 0,\n for_duration bigint not null default 0,\n create_at bigint not null default 0,\n create_by varchar(64) not null default '',\n update_at bigint not null default 0,\n update_by varchar(64) not null default '',\n PRIMARY KEY (id)\n);\n\nCREATE INDEX ON alert_subscribe (update_at);\nCREATE INDEX ON alert_subscribe (group_id);\n\nCOMMENT ON COLUMN alert_subscribe.disabled IS '0:enabled 1:disabled';\nCOMMENT ON COLUMN alert_subscribe.group_id IS 'busi group id';\nCOMMENT ON COLUMN alert_subscribe.datasource_ids IS 'datasource ids';\nCOMMENT ON COLUMN alert_subscribe.tags IS 'json,map,tagkey->regexp|value';\nCOMMENT ON COLUMN alert_subscribe.redefine_severity IS 'is redefine severity?';\nCOMMENT ON COLUMN alert_subscribe.new_severity IS '0:Emergency 1:Warning 2:Notice';\nCOMMENT ON COLUMN alert_subscribe.redefine_channels IS 'is redefine channels?';\nCOMMENT ON COLUMN alert_subscribe.new_channels IS 'split by space: sms voice email dingtalk wecom';\nCOMMENT ON COLUMN alert_subscribe.user_group_ids IS 'split by space 1 34 5, notify cc to user_group_ids';\nCOMMENT ON COLUMN alert_subscribe.note IS 'note';\nCOMMENT ON COLUMN alert_subscribe.rule_ids IS 'rule_ids';\nCOMMENT ON COLUMN alert_subscribe.extra_config IS 'extra_config';\n\n\nCREATE TABLE target (\n id bigserial,\n group_id bigint not null default 0,\n ident varchar(191) not null,\n note varchar(255) not null default '',\n tags varchar(512) not null default '',\n host_tags text,\n host_ip varchar(15) default '',\n agent_version varchar(255) default '',\n engine_name varchar(255) default '',\n os varchar(31) default '',\n update_at bigint not null default 0,\n PRIMARY KEY (id),\n UNIQUE (ident)\n);\n\nCREATE INDEX ON target (group_id);\nCREATE INDEX idx_host_ip ON target (host_ip);\nCREATE INDEX idx_agent_version ON target (agent_version);\nCREATE INDEX idx_engine_name ON target (engine_name);\nCREATE INDEX idx_os ON target (os);\n\nCOMMENT ON COLUMN target.group_id IS 'busi group id';\nCOMMENT ON COLUMN target.ident IS 'target id';\nCOMMENT ON COLUMN target.note IS 'append to alert event as field';\nCOMMENT ON COLUMN target.tags IS 'append to series data as tags, split by space, append external space at suffix';\nCOMMENT ON COLUMN target.host_tags IS 'global labels set in conf file';\nCOMMENT ON COLUMN target.host_ip IS 'IPv4 string';\nCOMMENT ON COLUMN target.agent_version IS 'agent version';\nCOMMENT ON COLUMN target.engine_name IS 'engine_name';\nCOMMENT ON COLUMN target.os IS 'os type';\n\nCREATE TABLE metric_view (\n id bigserial,\n name varchar(191) not null default '',\n cate smallint not null ,\n configs varchar(8192) not null default '',\n create_at bigint not null default 0,\n create_by bigint not null default 0,\n update_at bigint not null default 0,\n PRIMARY KEY (id)\n) ;\nCREATE INDEX metric_view_create_by_idx ON metric_view (create_by);\nCOMMENT ON COLUMN metric_view.cate IS '0: preset 1: custom';\nCOMMENT ON COLUMN metric_view.create_by IS 'user id';\n\n\ninsert into metric_view(name, cate, configs) values('Host View', 0, '{\"filters\":[{\"oper\":\"=\",\"label\":\"__name__\",\"value\":\"cpu_usage_idle\"}],\"dynamicLabels\":[],\"dimensionLabels\":[{\"label\":\"ident\",\"value\":\"\"}]}');\n \nCREATE TABLE recording_rule (\n id bigserial,\n group_id bigint not null default '0',\n datasource_ids varchar(255) not null default '',\n cluster varchar(128) not null,\n name varchar(255) not null ,\n note varchar(255) not null ,\n disabled smallint not null default 0 ,\n prom_ql varchar(8192) not null ,\n prom_eval_interval int not null ,\n append_tags varchar(255) default '' ,\n query_configs text not null ,\n create_at bigint default '0',\n create_by varchar(64) default '',\n update_at bigint default '0',\n update_by varchar(64) default '',\n PRIMARY KEY (id)\n) ;\nCREATE INDEX recording_rule_group_id_idx ON recording_rule (group_id);\nCREATE INDEX recording_rule_update_at_idx ON recording_rule (update_at);\nCOMMENT ON COLUMN recording_rule.group_id IS 'group_id';\nCOMMENT ON COLUMN recording_rule.datasource_ids IS 'datasource ids';\nCOMMENT ON COLUMN recording_rule.name IS 'new metric name';\nCOMMENT ON COLUMN recording_rule.note IS 'rule note';\nCOMMENT ON COLUMN recording_rule.disabled IS '0:enabled 1:disabled';\nCOMMENT ON COLUMN recording_rule.prom_ql IS 'promql';\nCOMMENT ON COLUMN recording_rule.prom_eval_interval IS 'evaluate interval';\nCOMMENT ON COLUMN recording_rule.append_tags IS 'split by space: service=n9e mod=api';\nCOMMENT ON COLUMN recording_rule.query_configs IS 'query configs';\n\n\nCREATE TABLE alert_aggr_view (\n id bigserial,\n name varchar(191) not null default '',\n rule varchar(2048) not null default '',\n cate smallint not null ,\n create_at bigint not null default 0,\n create_by bigint not null default 0,\n update_at bigint not null default 0,\n PRIMARY KEY (id)\n) ;\nCREATE INDEX alert_aggr_view_create_by_idx ON alert_aggr_view (create_by);\nCOMMENT ON COLUMN alert_aggr_view.cate IS '0: preset 1: custom';\nCOMMENT ON COLUMN alert_aggr_view.create_by IS 'user id';\n\n\ninsert into alert_aggr_view(name, rule, cate) values('By BusiGroup, Severity', 'field:group_name::field:severity', 0);\ninsert into alert_aggr_view(name, rule, cate) values('By RuleName', 'field:rule_name', 0);\n\nCREATE TABLE alert_cur_event (\n id bigint not null ,\n cate varchar(128) not null,\n datasource_id bigint not null default 0 ,\n cluster varchar(128) not null,\n group_id bigint not null ,\n group_name varchar(255) not null default '' ,\n hash varchar(64) not null ,\n rule_id bigint not null,\n rule_name varchar(255) not null,\n rule_note varchar(2048) not null ,\n rule_prod varchar(255) not null default '',\n rule_algo varchar(255) not null default '',\n severity smallint not null ,\n prom_for_duration int not null ,\n prom_ql varchar(8192) not null ,\n prom_eval_interval int not null ,\n callbacks varchar(255) not null default '' ,\n runbook_url varchar(255),\n notify_recovered smallint not null ,\n notify_channels varchar(255) not null default '' ,\n notify_groups varchar(255) not null default '' ,\n notify_repeat_next bigint not null default 0 ,\n notify_cur_number int not null default 0 ,\n target_ident varchar(191) not null default '' ,\n target_note varchar(191) not null default '' ,\n first_trigger_time bigint,\n trigger_time bigint not null,\n trigger_value varchar(2048) not null,\n annotations text not null ,\n rule_config text not null ,\n tags varchar(1024) not null default '' ,\n PRIMARY KEY (id)\n) ;\nCREATE INDEX alert_cur_event_hash_idx ON alert_cur_event (hash);\nCREATE INDEX alert_cur_event_rule_id_idx ON alert_cur_event (rule_id);\nCREATE INDEX alert_cur_event_tg_idx ON alert_cur_event (trigger_time, group_id);\nCREATE INDEX alert_cur_event_nrn_idx ON alert_cur_event (notify_repeat_next);\nCOMMENT ON COLUMN alert_cur_event.id IS 'use alert_his_event.id';\nCOMMENT ON COLUMN alert_cur_event.datasource_id IS 'datasource id';\nCOMMENT ON COLUMN alert_cur_event.group_id IS 'busi group id of rule';\nCOMMENT ON COLUMN alert_cur_event.group_name IS 'busi group name';\nCOMMENT ON COLUMN alert_cur_event.hash IS 'rule_id + vector_pk';\nCOMMENT ON COLUMN alert_cur_event.rule_note IS 'alert rule note';\nCOMMENT ON COLUMN alert_cur_event.severity IS '1:Emergency 2:Warning 3:Notice';\nCOMMENT ON COLUMN alert_cur_event.prom_for_duration IS 'prometheus for, unit:s';\nCOMMENT ON COLUMN alert_cur_event.prom_ql IS 'promql';\nCOMMENT ON COLUMN alert_cur_event.prom_eval_interval IS 'evaluate interval';\nCOMMENT ON COLUMN alert_cur_event.callbacks IS 'split by space: http://a.com/api/x http://a.com/api/y';\nCOMMENT ON COLUMN alert_cur_event.notify_recovered IS 'whether notify when recovery';\nCOMMENT ON COLUMN alert_cur_event.notify_channels IS 'split by space: sms voice email dingtalk wecom';\nCOMMENT ON COLUMN alert_cur_event.notify_groups IS 'split by space: 233 43';\nCOMMENT ON COLUMN alert_cur_event.notify_repeat_next IS 'next timestamp to notify, get repeat settings from rule';\nCOMMENT ON COLUMN alert_cur_event.target_ident IS 'target ident, also in tags';\nCOMMENT ON COLUMN alert_cur_event.target_note IS 'target note';\nCOMMENT ON COLUMN alert_cur_event.annotations IS 'annotations';\nCOMMENT ON COLUMN alert_cur_event.rule_config IS 'rule_config';\nCOMMENT ON COLUMN alert_cur_event.tags IS 'merge data_tags rule_tags, split by ,,';\n\n\nCREATE TABLE alert_his_event (\n id bigserial,\n is_recovered smallint not null,\n cate varchar(128) not null,\n datasource_id bigint not null default 0 ,\n cluster varchar(128) not null,\n group_id bigint not null ,\n group_name varchar(255) not null default '' ,\n hash varchar(64) not null ,\n rule_id bigint not null,\n rule_name varchar(255) not null,\n rule_note varchar(2048) not null default 'alert rule note',\n rule_prod varchar(255) not null default '',\n rule_algo varchar(255) not null default '',\n severity smallint not null ,\n prom_for_duration int not null ,\n prom_ql varchar(8192) not null ,\n prom_eval_interval int not null ,\n callbacks varchar(255) not null default '' ,\n runbook_url varchar(255),\n notify_recovered smallint not null ,\n notify_channels varchar(255) not null default '' ,\n notify_groups varchar(255) not null default '' ,\n notify_cur_number int not null default 0 ,\n target_ident varchar(191) not null default '' ,\n target_note varchar(191) not null default '' ,\n first_trigger_time bigint,\n trigger_time bigint not null,\n trigger_value varchar(2048) not null,\n recover_time bigint not null default 0,\n last_eval_time bigint not null default 0 ,\n tags varchar(1024) not null default '' ,\n annotations text not null ,\n rule_config text not null ,\n PRIMARY KEY (id)\n) ;\nCREATE INDEX alert_his_event_hash_idx ON alert_his_event (hash);\nCREATE INDEX alert_his_event_rule_id_idx ON alert_his_event (rule_id);\nCREATE INDEX alert_his_event_tg_idx ON alert_his_event (trigger_time, group_id);\nCREATE INDEX alert_his_event_nrn_idx ON alert_his_event (last_eval_time);\nCOMMENT ON COLUMN alert_his_event.group_id IS 'busi group id of rule';\nCOMMENT ON COLUMN alert_his_event.datasource_id IS 'datasource id';\nCOMMENT ON COLUMN alert_his_event.group_name IS 'busi group name';\nCOMMENT ON COLUMN alert_his_event.hash IS 'rule_id + vector_pk';\nCOMMENT ON COLUMN alert_his_event.rule_note IS 'alert rule note';\nCOMMENT ON COLUMN alert_his_event.severity IS '0:Emergency 1:Warning 2:Notice';\nCOMMENT ON COLUMN alert_his_event.prom_for_duration IS 'prometheus for, unit:s';\nCOMMENT ON COLUMN alert_his_event.prom_ql IS 'promql';\nCOMMENT ON COLUMN alert_his_event.prom_eval_interval IS 'evaluate interval';\nCOMMENT ON COLUMN alert_his_event.callbacks IS 'split by space: http://a.com/api/x http://a.com/api/y';\nCOMMENT ON COLUMN alert_his_event.notify_recovered IS 'whether notify when recovery';\nCOMMENT ON COLUMN alert_his_event.notify_channels IS 'split by space: sms voice email dingtalk wecom';\nCOMMENT ON COLUMN alert_his_event.notify_groups IS 'split by space: 233 43';\nCOMMENT ON COLUMN alert_his_event.target_ident IS 'target ident, also in tags';\nCOMMENT ON COLUMN alert_his_event.target_note IS 'target note';\nCOMMENT ON COLUMN alert_his_event.last_eval_time IS 'for time filter';\nCOMMENT ON COLUMN alert_his_event.tags IS 'merge data_tags rule_tags, split by ,,';\nCOMMENT ON COLUMN alert_his_event.annotations IS 'annotations';\nCOMMENT ON COLUMN alert_his_event.rule_config IS 'rule_config';\n\nCREATE TABLE task_tpl\n(\n id serial,\n group_id int not null ,\n title varchar(255) not null default '',\n account varchar(64) not null,\n batch int not null default 0,\n tolerance int not null default 0,\n timeout int not null default 0,\n pause varchar(255) not null default '',\n script text not null,\n args varchar(512) not null default '',\n tags varchar(255) not null default '' ,\n create_at bigint not null default 0,\n create_by varchar(64) not null default '',\n update_at bigint not null default 0,\n update_by varchar(64) not null default '',\n PRIMARY KEY (id)\n) ;\nCREATE INDEX task_tpl_group_id_idx ON task_tpl (group_id);\nCOMMENT ON COLUMN task_tpl.group_id IS 'busi group id';\nCOMMENT ON COLUMN task_tpl.tags IS 'split by space';\n\n\nCREATE TABLE task_tpl_host\n(\n ii serial,\n id int not null ,\n host varchar(128) not null ,\n PRIMARY KEY (ii)\n) ;\nCREATE INDEX task_tpl_host_id_host_idx ON task_tpl_host (id, host);\nCOMMENT ON COLUMN task_tpl_host.id IS 'task tpl id';\nCOMMENT ON COLUMN task_tpl_host.host IS 'ip or hostname';\n\n\nCREATE TABLE task_record\n(\n id bigint not null ,\n event_id bigint not null default 0,\n group_id bigint not null ,\n ibex_address varchar(128) not null,\n ibex_auth_user varchar(128) not null default '',\n ibex_auth_pass varchar(128) not null default '',\n title varchar(255) not null default '',\n account varchar(64) not null,\n batch int not null default 0,\n tolerance int not null default 0,\n timeout int not null default 0,\n pause varchar(255) not null default '',\n script text not null,\n args varchar(512) not null default '',\n create_at bigint not null default 0,\n create_by varchar(64) not null default '',\n PRIMARY KEY (id)\n) ;\nCREATE INDEX task_record_cg_idx ON task_record (create_at, group_id);\nCREATE INDEX task_record_create_by_idx ON task_record (create_by);\nCREATE INDEX task_record_event_id_idx ON task_record (event_id);\nCOMMENT ON COLUMN task_record.id IS 'ibex task id';\nCOMMENT ON COLUMN task_record.group_id IS 'busi group id';\nCOMMENT ON COLUMN task_record.event_id IS 'event id';\n\nCREATE TABLE alerting_engines\n(\n id serial,\n instance varchar(128) not null default '' ,\n datasource_id bigint not null default 0 ,\n engine_cluster varchar(128) not null default '' ,\n clock bigint not null,\n PRIMARY KEY (id)\n) ;\nCOMMENT ON COLUMN alerting_engines.instance IS 'instance identification, e.g. 10.9.0.9:9090';\nCOMMENT ON COLUMN alerting_engines.datasource_id IS 'datasource id';\nCOMMENT ON COLUMN alerting_engines.engine_cluster IS 'target reader cluster';\n\n\nCREATE TABLE datasource\n(\n id serial,\n name varchar(191) not null default '',\n identifier varchar(255) not null default '',\n description varchar(255) not null default '',\n category varchar(255) not null default '',\n plugin_id int not null default 0,\n plugin_type varchar(255) not null default '',\n plugin_type_name varchar(255) not null default '',\n cluster_name varchar(255) not null default '',\n settings text not null,\n status varchar(255) not null default '',\n http varchar(4096) not null default '',\n auth varchar(8192) not null default '',\n is_default boolean not null default false,\n weight int not null default 0,\n created_at bigint not null default 0,\n created_by varchar(64) not null default '',\n updated_at bigint not null default 0,\n updated_by varchar(64) not null default '',\n UNIQUE (name),\n PRIMARY KEY (id)\n) ;\n\nCREATE TABLE builtin_cate (\n id bigserial,\n name varchar(191) not null,\n user_id bigint not null default 0,\n PRIMARY KEY (id)\n) ;\n \nCREATE TABLE notify_tpl (\n id bigserial,\n channel varchar(32) not null,\n name varchar(255) not null,\n content text not null,\n create_at bigint not null default 0,\n create_by varchar(64) not null default '',\n update_at bigint not null default 0,\n update_by varchar(64) not null default '',\n PRIMARY KEY (id),\n UNIQUE (channel)\n);\n\nCREATE TABLE sso_config (\n id bigserial,\n name varchar(191) not null,\n content text not null,\n update_at bigint not null default 0,\n PRIMARY KEY (id),\n UNIQUE (name)\n);\n\n\nCREATE TABLE es_index_pattern (\n id bigserial,\n datasource_id bigint not null default 0,\n name varchar(191) not null,\n time_field varchar(128) not null default '@timestamp',\n allow_hide_system_indices smallint not null default 0,\n fields_format varchar(4096) not null default '',\n cross_cluster_enabled int not null default 0,\n create_at bigint default '0',\n create_by varchar(64) default '',\n update_at bigint default '0',\n update_by varchar(64) default '',\n note varchar(4096) not null default '',\n PRIMARY KEY (id),\n UNIQUE (datasource_id, name)\n) ;\nCOMMENT ON COLUMN es_index_pattern.datasource_id IS 'datasource id';\nCOMMENT ON COLUMN es_index_pattern.note IS 'description of metric in Chinese';\n\nCREATE TABLE builtin_metrics (\n id bigserial,\n collector varchar(191) NOT NULL,\n typ varchar(191) NOT NULL,\n name varchar(191) NOT NULL,\n unit varchar(191) NOT NULL,\n lang varchar(191) NOT NULL DEFAULT '',\n note varchar(4096) NOT NULL,\n expression varchar(4096) NOT NULL,\n expression_type varchar(32) NOT NULL DEFAULT 'promql',\n metric_type varchar(191) NOT NULL DEFAULT '',\n extra_fields text,\n created_at bigint NOT NULL DEFAULT 0,\n created_by varchar(191) NOT NULL DEFAULT '',\n updated_at bigint NOT NULL DEFAULT 0,\n updated_by varchar(191) NOT NULL DEFAULT '',\n uuid BIGINT NOT NULL DEFAULT 0,\n PRIMARY KEY (id),\n UNIQUE (lang, collector, typ, name)\n);\n\nCREATE INDEX idx_collector ON builtin_metrics (collector);\nCREATE INDEX idx_typ ON builtin_metrics (typ);\nCREATE INDEX idx_name ON builtin_metrics (name);\nCREATE INDEX idx_lang ON builtin_metrics (lang);\n\nCOMMENT ON COLUMN builtin_metrics.id IS 'unique identifier';\nCOMMENT ON COLUMN builtin_metrics.collector IS 'type of collector';\nCOMMENT ON COLUMN builtin_metrics.typ IS 'type of metric';\nCOMMENT ON COLUMN builtin_metrics.name IS 'name of metric';\nCOMMENT ON COLUMN builtin_metrics.unit IS 'unit of metric';\nCOMMENT ON COLUMN builtin_metrics.lang IS 'language of metric';\nCOMMENT ON COLUMN builtin_metrics.note IS 'description of metric in Chinese';\nCOMMENT ON COLUMN builtin_metrics.expression IS 'expression of metric';\nCOMMENT ON COLUMN builtin_metrics.expression_type IS 'expression type: metric_name or promql';\nCOMMENT ON COLUMN builtin_metrics.metric_type IS 'metric type like counter/gauge';\nCOMMENT ON COLUMN builtin_metrics.extra_fields IS 'custom extra fields';\nCOMMENT ON COLUMN builtin_metrics.created_at IS 'create time';\nCOMMENT ON COLUMN builtin_metrics.created_by IS 'creator';\nCOMMENT ON COLUMN builtin_metrics.updated_at IS 'update time';\nCOMMENT ON COLUMN builtin_metrics.updated_by IS 'updater';\nCOMMENT ON COLUMN builtin_metrics.uuid IS 'unique identifier';\n\nCREATE TABLE metric_filter (\n id BIGSERIAL PRIMARY KEY,\n name VARCHAR(191) NOT NULL,\n configs VARCHAR(4096) NOT NULL,\n groups_perm TEXT,\n create_at BIGINT NOT NULL DEFAULT 0,\n create_by VARCHAR(191) NOT NULL DEFAULT '',\n update_at BIGINT NOT NULL DEFAULT 0,\n update_by VARCHAR(191) NOT NULL DEFAULT ''\n);\n\nCREATE INDEX idx_metric_filter_name ON metric_filter (name);\n\nCREATE TABLE board_busigroup (\n busi_group_id BIGINT NOT NULL DEFAULT 0,\n board_id BIGINT NOT NULL DEFAULT 0,\n PRIMARY KEY (busi_group_id, board_id)\n);\n\n\nCREATE TABLE builtin_components (\n id BIGSERIAL PRIMARY KEY,\n ident VARCHAR(191) NOT NULL,\n logo VARCHAR(191) NOT NULL,\n readme TEXT NOT NULL,\n disabled INT NOT NULL DEFAULT 0,\n created_at BIGINT NOT NULL DEFAULT 0,\n created_by VARCHAR(191) NOT NULL DEFAULT '',\n updated_at BIGINT NOT NULL DEFAULT 0,\n updated_by VARCHAR(191) NOT NULL DEFAULT ''\n);\n\nCREATE INDEX idx_ident ON builtin_components (ident);\n\nCREATE TABLE builtin_payloads (\n id BIGSERIAL PRIMARY KEY,\n type VARCHAR(191) NOT NULL,\n uuid BIGINT NOT NULL DEFAULT 0,\n component VARCHAR(191) NOT NULL,\n cate VARCHAR(191) NOT NULL,\n name VARCHAR(191) NOT NULL,\n tags VARCHAR(191) NOT NULL DEFAULT '',\n content TEXT NOT NULL,\n note VARCHAR(1024) NOT NULL DEFAULT '',\n created_at BIGINT NOT NULL DEFAULT 0,\n created_by VARCHAR(191) NOT NULL DEFAULT '',\n updated_at BIGINT NOT NULL DEFAULT 0,\n updated_by VARCHAR(191) NOT NULL DEFAULT ''\n);\n\nCREATE INDEX idx_component ON builtin_payloads (component);\nCREATE INDEX idx_builtin_payloads_name ON builtin_payloads (name);\nCREATE INDEX idx_cate ON builtin_payloads (cate);\nCREATE INDEX idx_type ON builtin_payloads (type);\n\n\nCREATE TABLE dash_annotation (\n id bigserial PRIMARY KEY,\n dashboard_id bigint not null,\n panel_id varchar(191) not null,\n tags text,\n description text,\n config text,\n time_start bigint not null default 0,\n time_end bigint not null default 0,\n create_at bigint not null default 0,\n create_by varchar(64) not null default '',\n update_at bigint not null default 0,\n update_by varchar(64) not null default ''\n);\n\nCREATE TABLE source_token (\n id bigserial PRIMARY KEY,\n source_type varchar(64) NOT NULL DEFAULT '',\n source_id varchar(255) NOT NULL DEFAULT '',\n token varchar(255) NOT NULL DEFAULT '',\n expire_at bigint NOT NULL DEFAULT 0,\n create_at bigint NOT NULL DEFAULT 0,\n create_by varchar(64) NOT NULL DEFAULT ''\n);\n\nCREATE INDEX idx_source_token_type_id_token ON source_token (source_type, source_id, token);\n\nCREATE TABLE notification_record (\n id BIGSERIAL PRIMARY KEY,\n notify_rule_id BIGINT NOT NULL DEFAULT 0,\n event_id bigint NOT NULL,\n sub_id bigint DEFAULT NULL,\n channel varchar(255) NOT NULL,\n status bigint DEFAULT NULL,\n target varchar(1024) NOT NULL,\n details varchar(2048) DEFAULT '',\n created_at bigint NOT NULL\n);\n\nCREATE INDEX idx_evt ON notification_record (event_id);\n\nCOMMENT ON COLUMN notification_record.event_id IS 'event history id';\nCOMMENT ON COLUMN notification_record.sub_id IS 'subscribed rule id';\nCOMMENT ON COLUMN notification_record.channel IS 'notification channel name';\nCOMMENT ON COLUMN notification_record.status IS 'notification status';\nCOMMENT ON COLUMN notification_record.target IS 'notification target';\nCOMMENT ON COLUMN notification_record.details IS 'notification other info';\nCOMMENT ON COLUMN notification_record.created_at IS 'create time';\n\nCREATE TABLE target_busi_group (\n id BIGSERIAL PRIMARY KEY,\n target_ident varchar(191) NOT NULL,\n group_id bigint NOT NULL,\n update_at bigint NOT NULL\n);\n\nCREATE UNIQUE INDEX idx_target_group ON target_busi_group (target_ident, group_id);\n\nCREATE TABLE user_token (\n id BIGSERIAL PRIMARY KEY,\n username varchar(255) NOT NULL DEFAULT '',\n token_name varchar(255) NOT NULL DEFAULT '',\n token varchar(255) NOT NULL DEFAULT '',\n create_at bigint NOT NULL DEFAULT 0,\n last_used bigint NOT NULL DEFAULT 0\n);\n\nCREATE TABLE notify_rule (\n id bigserial PRIMARY KEY,\n name varchar(255) NOT NULL,\n description text,\n enable boolean DEFAULT false,\n user_group_ids varchar(255) NOT NULL DEFAULT '',\n notify_configs text,\n pipeline_configs text,\n create_at bigint NOT NULL DEFAULT 0,\n create_by varchar(64) NOT NULL DEFAULT '',\n update_at bigint NOT NULL DEFAULT 0,\n update_by varchar(64) NOT NULL DEFAULT ''\n);\n\nCREATE TABLE notify_channel (\n id bigserial PRIMARY KEY,\n name varchar(255) NOT NULL,\n ident varchar(255) NOT NULL,\n description text,\n enable boolean DEFAULT false,\n param_config text,\n request_type varchar(50) NOT NULL,\n request_config text,\n weight int NOT NULL DEFAULT 0,\n create_at bigint NOT NULL DEFAULT 0,\n create_by varchar(64) NOT NULL DEFAULT '',\n update_at bigint NOT NULL DEFAULT 0,\n update_by varchar(64) NOT NULL DEFAULT ''\n);\n\nCREATE TABLE message_template (\n id bigserial PRIMARY KEY,\n name varchar(64) NOT NULL,\n ident varchar(64) NOT NULL,\n content text,\n user_group_ids varchar(64),\n notify_channel_ident varchar(64) NOT NULL DEFAULT '',\n private int NOT NULL DEFAULT 0,\n weight int NOT NULL DEFAULT 0,\n create_at bigint NOT NULL DEFAULT 0,\n create_by varchar(64) NOT NULL DEFAULT '',\n update_at bigint NOT NULL DEFAULT 0,\n update_by varchar(64) NOT NULL DEFAULT ''\n);\n\nCREATE TABLE event_pipeline (\n id bigserial PRIMARY KEY,\n name varchar(128) NOT NULL,\n team_ids text,\n description varchar(255) NOT NULL DEFAULT '',\n filter_enable smallint NOT NULL DEFAULT 0,\n label_filters text,\n attribute_filters text,\n processors text,\n create_at bigint NOT NULL DEFAULT 0,\n create_by varchar(64) NOT NULL DEFAULT '',\n update_at bigint NOT NULL DEFAULT 0,\n update_by varchar(64) NOT NULL DEFAULT ''\n);\n\nCREATE TABLE embedded_product (\n id bigserial PRIMARY KEY,\n name varchar(255) DEFAULT NULL,\n url varchar(255) DEFAULT NULL,\n is_private boolean DEFAULT NULL,\n team_ids varchar(255),\n create_at bigint NOT NULL DEFAULT 0,\n create_by varchar(64) NOT NULL DEFAULT '',\n update_at bigint NOT NULL DEFAULT 0,\n update_by varchar(64) NOT NULL DEFAULT ''\n);"
},
{
"path": "docker/compose-postgres/initsql_for_postgres/b-ibex-for-Postgres.sql",
"content": "CREATE TABLE task_meta\n(\n id bigserial,\n title varchar(255) not null default '',\n account varchar(64) not null,\n batch int not null default 0,\n tolerance int not null default 0,\n timeout int not null default 0,\n pause varchar(255) not null default '',\n script text not null,\n args varchar(512) not null default '',\n stdin varchar(1024) not null default '' ,\n creator varchar(64) not null default '',\n created timestamp not null default CURRENT_TIMESTAMP,\n PRIMARY KEY (id)\n) ;\nCREATE INDEX task_meta_creator_idx ON task_meta (creator);\nCREATE INDEX task_meta_created_idx ON task_meta (created);\n\n/* start|cancel|kill|pause */\nCREATE TABLE task_action\n(\n id bigint not null,\n action varchar(32) not null,\n clock bigint not null default 0,\n PRIMARY KEY (id)\n) ;\n\nCREATE TABLE task_scheduler\n(\n id bigint not null,\n scheduler varchar(128) not null default ''\n) ;\nCREATE INDEX task_scheduler_id_scheduler_idx ON task_scheduler (id, scheduler);\n\n\nCREATE TABLE task_scheduler_health\n(\n scheduler varchar(128) not null,\n clock bigint not null,\n UNIQUE (scheduler)\n) ;\nCREATE INDEX task_scheduler_health_clock_idx ON task_scheduler_health (clock);\n\n\nCREATE TABLE task_host_doing\n(\n id bigint not null,\n host varchar(128) not null,\n clock bigint not null default 0,\n action varchar(16) not null\n) ;\nCREATE INDEX task_host_doing_id_idx ON task_host_doing (id);\nCREATE INDEX task_host_doing_host_idx ON task_host_doing (host);\n\n\nCREATE TABLE task_host_0\n(\n ii bigserial,\n id bigint not null,\n host varchar(128) not null,\n status varchar(32) not null,\n stdout text,\n stderr text,\n UNIQUE (id, host),\n PRIMARY KEY (ii)\n) ;\n\nCREATE TABLE task_host_1\n(\n ii bigserial,\n id bigint not null,\n host varchar(128) not null,\n status varchar(32) not null,\n stdout text,\n stderr text,\n UNIQUE (id, host),\n PRIMARY KEY (ii)\n) ;\n\nCREATE TABLE task_host_2\n(\n ii bigserial,\n id bigint not null,\n host varchar(128) not null,\n status varchar(32) not null,\n stdout text,\n stderr text,\n UNIQUE (id, host),\n PRIMARY KEY (ii)\n) ;\n\nCREATE TABLE task_host_3\n(\n ii bigserial,\n id bigint not null,\n host varchar(128) not null,\n status varchar(32) not null,\n stdout text,\n stderr text,\n UNIQUE (id, host),\n PRIMARY KEY (ii)\n) ;\n\nCREATE TABLE task_host_4\n(\n ii bigserial,\n id bigint not null,\n host varchar(128) not null,\n status varchar(32) not null,\n stdout text,\n stderr text,\n UNIQUE (id, host),\n PRIMARY KEY (ii)\n) ;\n\nCREATE TABLE task_host_5\n(\n ii bigserial,\n id bigint not null,\n host varchar(128) not null,\n status varchar(32) not null,\n stdout text,\n stderr text,\n UNIQUE (id, host),\n PRIMARY KEY (ii)\n) ;\n\nCREATE TABLE task_host_6\n(\n ii bigserial,\n id bigint not null,\n host varchar(128) not null,\n status varchar(32) not null,\n stdout text,\n stderr text,\n UNIQUE (id, host),\n PRIMARY KEY (ii)\n) ;\n\nCREATE TABLE task_host_7\n(\n ii bigserial,\n id bigint not null,\n host varchar(128) not null,\n status varchar(32) not null,\n stdout text,\n stderr text,\n UNIQUE (id, host),\n PRIMARY KEY (ii)\n) ;\n\nCREATE TABLE task_host_8\n(\n ii bigserial,\n id bigint not null,\n host varchar(128) not null,\n status varchar(32) not null,\n stdout text,\n stderr text,\n UNIQUE (id, host),\n PRIMARY KEY (ii)\n) ;\n\nCREATE TABLE task_host_9\n(\n ii bigserial,\n id bigint not null,\n host varchar(128) not null,\n status varchar(32) not null,\n stdout text,\n stderr text,\n UNIQUE (id, host),\n PRIMARY KEY (ii)\n) ;\n\nCREATE TABLE task_host_10\n(\n ii bigserial,\n id bigint not null,\n host varchar(128) not null,\n status varchar(32) not null,\n stdout text,\n stderr text,\n UNIQUE (id, host),\n PRIMARY KEY (ii)\n) ;\n\nCREATE TABLE task_host_11\n(\n ii bigserial,\n id bigint not null,\n host varchar(128) not null,\n status varchar(32) not null,\n stdout text,\n stderr text,\n UNIQUE (id, host),\n PRIMARY KEY (ii)\n) ;\n\nCREATE TABLE task_host_12\n(\n ii bigserial,\n id bigint not null,\n host varchar(128) not null,\n status varchar(32) not null,\n stdout text,\n stderr text,\n UNIQUE (id, host),\n PRIMARY KEY (ii)\n) ;\n\nCREATE TABLE task_host_13\n(\n ii bigserial,\n id bigint not null,\n host varchar(128) not null,\n status varchar(32) not null,\n stdout text,\n stderr text,\n UNIQUE (id, host),\n PRIMARY KEY (ii)\n) ;\n\nCREATE TABLE task_host_14\n(\n ii bigserial,\n id bigint not null,\n host varchar(128) not null,\n status varchar(32) not null,\n stdout text,\n stderr text,\n UNIQUE (id, host),\n PRIMARY KEY (ii)\n) ;\n\nCREATE TABLE task_host_15\n(\n ii bigserial,\n id bigint not null,\n host varchar(128) not null,\n status varchar(32) not null,\n stdout text,\n stderr text,\n UNIQUE (id, host),\n PRIMARY KEY (ii)\n) ;\n\nCREATE TABLE task_host_16\n(\n ii bigserial,\n id bigint not null,\n host varchar(128) not null,\n status varchar(32) not null,\n stdout text,\n stderr text,\n UNIQUE (id, host),\n PRIMARY KEY (ii)\n) ;\n\nCREATE TABLE task_host_17\n(\n ii bigserial,\n id bigint not null,\n host varchar(128) not null,\n status varchar(32) not null,\n stdout text,\n stderr text,\n UNIQUE (id, host),\n PRIMARY KEY (ii)\n) ;\n\nCREATE TABLE task_host_18\n(\n ii bigserial,\n id bigint not null,\n host varchar(128) not null,\n status varchar(32) not null,\n stdout text,\n stderr text,\n UNIQUE (id, host),\n PRIMARY KEY (ii)\n) ;\n\nCREATE TABLE task_host_19\n(\n ii bigserial,\n id bigint not null,\n host varchar(128) not null,\n status varchar(32) not null,\n stdout text,\n stderr text,\n UNIQUE (id, host),\n PRIMARY KEY (ii)\n) ;\n\nCREATE TABLE task_host_20\n(\n ii bigserial,\n id bigint not null,\n host varchar(128) not null,\n status varchar(32) not null,\n stdout text,\n stderr text,\n UNIQUE (id, host),\n PRIMARY KEY (ii)\n) ;\n\nCREATE TABLE task_host_21\n(\n ii bigserial,\n id bigint not null,\n host varchar(128) not null,\n status varchar(32) not null,\n stdout text,\n stderr text,\n UNIQUE (id, host),\n PRIMARY KEY (ii)\n) ;\n\nCREATE TABLE task_host_22\n(\n ii bigserial,\n id bigint not null,\n host varchar(128) not null,\n status varchar(32) not null,\n stdout text,\n stderr text,\n UNIQUE (id, host),\n PRIMARY KEY (ii)\n) ;\n\nCREATE TABLE task_host_23\n(\n ii bigserial,\n id bigint not null,\n host varchar(128) not null,\n status varchar(32) not null,\n stdout text,\n stderr text,\n UNIQUE (id, host),\n PRIMARY KEY (ii)\n) ;\n\nCREATE TABLE task_host_24\n(\n ii bigserial,\n id bigint not null,\n host varchar(128) not null,\n status varchar(32) not null,\n stdout text,\n stderr text,\n UNIQUE (id, host),\n PRIMARY KEY (ii)\n) ;\n\nCREATE TABLE task_host_25\n(\n ii bigserial,\n id bigint not null,\n host varchar(128) not null,\n status varchar(32) not null,\n stdout text,\n stderr text,\n UNIQUE (id, host),\n PRIMARY KEY (ii)\n) ;\n\nCREATE TABLE task_host_26\n(\n ii bigserial,\n id bigint not null,\n host varchar(128) not null,\n status varchar(32) not null,\n stdout text,\n stderr text,\n UNIQUE (id, host),\n PRIMARY KEY (ii)\n) ;\n\nCREATE TABLE task_host_27\n(\n ii bigserial,\n id bigint not null,\n host varchar(128) not null,\n status varchar(32) not null,\n stdout text,\n stderr text,\n UNIQUE (id, host),\n PRIMARY KEY (ii)\n) ;\n\nCREATE TABLE task_host_28\n(\n ii bigserial,\n id bigint not null,\n host varchar(128) not null,\n status varchar(32) not null,\n stdout text,\n stderr text,\n UNIQUE (id, host),\n PRIMARY KEY (ii)\n) ;\n\nCREATE TABLE task_host_29\n(\n ii bigserial,\n id bigint not null,\n host varchar(128) not null,\n status varchar(32) not null,\n stdout text,\n stderr text,\n UNIQUE (id, host),\n PRIMARY KEY (ii)\n) ;\n\nCREATE TABLE task_host_30\n(\n ii bigserial,\n id bigint not null,\n host varchar(128) not null,\n status varchar(32) not null,\n stdout text,\n stderr text,\n UNIQUE (id, host),\n PRIMARY KEY (ii)\n) ;\n\nCREATE TABLE task_host_31\n(\n ii bigserial,\n id bigint not null,\n host varchar(128) not null,\n status varchar(32) not null,\n stdout text,\n stderr text,\n UNIQUE (id, host),\n PRIMARY KEY (ii)\n) ;\n\nCREATE TABLE task_host_32\n(\n ii bigserial,\n id bigint not null,\n host varchar(128) not null,\n status varchar(32) not null,\n stdout text,\n stderr text,\n UNIQUE (id, host),\n PRIMARY KEY (ii)\n) ;\n\nCREATE TABLE task_host_33\n(\n ii bigserial,\n id bigint not null,\n host varchar(128) not null,\n status varchar(32) not null,\n stdout text,\n stderr text,\n UNIQUE (id, host),\n PRIMARY KEY (ii)\n) ;\n\nCREATE TABLE task_host_34\n(\n ii bigserial,\n id bigint not null,\n host varchar(128) not null,\n status varchar(32) not null,\n stdout text,\n stderr text,\n UNIQUE (id, host),\n PRIMARY KEY (ii)\n) ;\n\nCREATE TABLE task_host_35\n(\n ii bigserial,\n id bigint not null,\n host varchar(128) not null,\n status varchar(32) not null,\n stdout text,\n stderr text,\n UNIQUE (id, host),\n PRIMARY KEY (ii)\n) ;\n\nCREATE TABLE task_host_36\n(\n ii bigserial,\n id bigint not null,\n host varchar(128) not null,\n status varchar(32) not null,\n stdout text,\n stderr text,\n UNIQUE (id, host),\n PRIMARY KEY (ii)\n) ;\n\nCREATE TABLE task_host_37\n(\n ii bigserial,\n id bigint not null,\n host varchar(128) not null,\n status varchar(32) not null,\n stdout text,\n stderr text,\n UNIQUE (id, host),\n PRIMARY KEY (ii)\n) ;\n\nCREATE TABLE task_host_38\n(\n ii bigserial,\n id bigint not null,\n host varchar(128) not null,\n status varchar(32) not null,\n stdout text,\n stderr text,\n UNIQUE (id, host),\n PRIMARY KEY (ii)\n) ;\n\nCREATE TABLE task_host_39\n(\n ii bigserial,\n id bigint not null,\n host varchar(128) not null,\n status varchar(32) not null,\n stdout text,\n stderr text,\n UNIQUE (id, host),\n PRIMARY KEY (ii)\n) ;\n\nCREATE TABLE task_host_40\n(\n ii bigserial,\n id bigint not null,\n host varchar(128) not null,\n status varchar(32) not null,\n stdout text,\n stderr text,\n UNIQUE (id, host),\n PRIMARY KEY (ii)\n) ;\n\nCREATE TABLE task_host_41\n(\n ii bigserial,\n id bigint not null,\n host varchar(128) not null,\n status varchar(32) not null,\n stdout text,\n stderr text,\n UNIQUE (id, host),\n PRIMARY KEY (ii)\n) ;\n\nCREATE TABLE task_host_42\n(\n ii bigserial,\n id bigint not null,\n host varchar(128) not null,\n status varchar(32) not null,\n stdout text,\n stderr text,\n UNIQUE (id, host),\n PRIMARY KEY (ii)\n) ;\n\nCREATE TABLE task_host_43\n(\n ii bigserial,\n id bigint not null,\n host varchar(128) not null,\n status varchar(32) not null,\n stdout text,\n stderr text,\n UNIQUE (id, host),\n PRIMARY KEY (ii)\n) ;\n\nCREATE TABLE task_host_44\n(\n ii bigserial,\n id bigint not null,\n host varchar(128) not null,\n status varchar(32) not null,\n stdout text,\n stderr text,\n UNIQUE (id, host),\n PRIMARY KEY (ii)\n) ;\n\nCREATE TABLE task_host_45\n(\n ii bigserial,\n id bigint not null,\n host varchar(128) not null,\n status varchar(32) not null,\n stdout text,\n stderr text,\n UNIQUE (id, host),\n PRIMARY KEY (ii)\n) ;\n\nCREATE TABLE task_host_46\n(\n ii bigserial,\n id bigint not null,\n host varchar(128) not null,\n status varchar(32) not null,\n stdout text,\n stderr text,\n UNIQUE (id, host),\n PRIMARY KEY (ii)\n) ;\n\nCREATE TABLE task_host_47\n(\n ii bigserial,\n id bigint not null,\n host varchar(128) not null,\n status varchar(32) not null,\n stdout text,\n stderr text,\n UNIQUE (id, host),\n PRIMARY KEY (ii)\n) ;\n\nCREATE TABLE task_host_48\n(\n ii bigserial,\n id bigint not null,\n host varchar(128) not null,\n status varchar(32) not null,\n stdout text,\n stderr text,\n UNIQUE (id, host),\n PRIMARY KEY (ii)\n) ;\n\nCREATE TABLE task_host_49\n(\n ii bigserial,\n id bigint not null,\n host varchar(128) not null,\n status varchar(32) not null,\n stdout text,\n stderr text,\n UNIQUE (id, host),\n PRIMARY KEY (ii)\n) ;\n\nCREATE TABLE task_host_50\n(\n ii bigserial,\n id bigint not null,\n host varchar(128) not null,\n status varchar(32) not null,\n stdout text,\n stderr text,\n UNIQUE (id, host),\n PRIMARY KEY (ii)\n) ;\n\nCREATE TABLE task_host_51\n(\n ii bigserial,\n id bigint not null,\n host varchar(128) not null,\n status varchar(32) not null,\n stdout text,\n stderr text,\n UNIQUE (id, host),\n PRIMARY KEY (ii)\n) ;\n\nCREATE TABLE task_host_52\n(\n ii bigserial,\n id bigint not null,\n host varchar(128) not null,\n status varchar(32) not null,\n stdout text,\n stderr text,\n UNIQUE (id, host),\n PRIMARY KEY (ii)\n) ;\n\nCREATE TABLE task_host_53\n(\n ii bigserial,\n id bigint not null,\n host varchar(128) not null,\n status varchar(32) not null,\n stdout text,\n stderr text,\n UNIQUE (id, host),\n PRIMARY KEY (ii)\n) ;\n\nCREATE TABLE task_host_54\n(\n ii bigserial,\n id bigint not null,\n host varchar(128) not null,\n status varchar(32) not null,\n stdout text,\n stderr text,\n UNIQUE (id, host),\n PRIMARY KEY (ii)\n) ;\n\nCREATE TABLE task_host_55\n(\n ii bigserial,\n id bigint not null,\n host varchar(128) not null,\n status varchar(32) not null,\n stdout text,\n stderr text,\n UNIQUE (id, host),\n PRIMARY KEY (ii)\n) ;\n\nCREATE TABLE task_host_56\n(\n ii bigserial,\n id bigint not null,\n host varchar(128) not null,\n status varchar(32) not null,\n stdout text,\n stderr text,\n UNIQUE (id, host),\n PRIMARY KEY (ii)\n) ;\n\nCREATE TABLE task_host_57\n(\n ii bigserial,\n id bigint not null,\n host varchar(128) not null,\n status varchar(32) not null,\n stdout text,\n stderr text,\n UNIQUE (id, host),\n PRIMARY KEY (ii)\n) ;\n\nCREATE TABLE task_host_58\n(\n ii bigserial,\n id bigint not null,\n host varchar(128) not null,\n status varchar(32) not null,\n stdout text,\n stderr text,\n UNIQUE (id, host),\n PRIMARY KEY (ii)\n) ;\n\nCREATE TABLE task_host_59\n(\n ii bigserial,\n id bigint not null,\n host varchar(128) not null,\n status varchar(32) not null,\n stdout text,\n stderr text,\n UNIQUE (id, host),\n PRIMARY KEY (ii)\n) ;\n\nCREATE TABLE task_host_60\n(\n ii bigserial,\n id bigint not null,\n host varchar(128) not null,\n status varchar(32) not null,\n stdout text,\n stderr text,\n UNIQUE (id, host),\n PRIMARY KEY (ii)\n) ;\n\nCREATE TABLE task_host_61\n(\n ii bigserial,\n id bigint not null,\n host varchar(128) not null,\n status varchar(32) not null,\n stdout text,\n stderr text,\n UNIQUE (id, host),\n PRIMARY KEY (ii)\n) ;\n\nCREATE TABLE task_host_62\n(\n ii bigserial,\n id bigint not null,\n host varchar(128) not null,\n status varchar(32) not null,\n stdout text,\n stderr text,\n UNIQUE (id, host),\n PRIMARY KEY (ii)\n) ;\n\nCREATE TABLE task_host_63\n(\n ii bigserial,\n id bigint not null,\n host varchar(128) not null,\n status varchar(32) not null,\n stdout text,\n stderr text,\n UNIQUE (id, host),\n PRIMARY KEY (ii)\n) ;\n\nCREATE TABLE task_host_64\n(\n ii bigserial,\n id bigint not null,\n host varchar(128) not null,\n status varchar(32) not null,\n stdout text,\n stderr text,\n UNIQUE (id, host),\n PRIMARY KEY (ii)\n) ;\n\nCREATE TABLE task_host_65\n(\n ii bigserial,\n id bigint not null,\n host varchar(128) not null,\n status varchar(32) not null,\n stdout text,\n stderr text,\n UNIQUE (id, host),\n PRIMARY KEY (ii)\n) ;\n\nCREATE TABLE task_host_66\n(\n ii bigserial,\n id bigint not null,\n host varchar(128) not null,\n status varchar(32) not null,\n stdout text,\n stderr text,\n UNIQUE (id, host),\n PRIMARY KEY (ii)\n) ;\n\nCREATE TABLE task_host_67\n(\n ii bigserial,\n id bigint not null,\n host varchar(128) not null,\n status varchar(32) not null,\n stdout text,\n stderr text,\n UNIQUE (id, host),\n PRIMARY KEY (ii)\n) ;\n\nCREATE TABLE task_host_68\n(\n ii bigserial,\n id bigint not null,\n host varchar(128) not null,\n status varchar(32) not null,\n stdout text,\n stderr text,\n UNIQUE (id, host),\n PRIMARY KEY (ii)\n) ;\n\nCREATE TABLE task_host_69\n(\n ii bigserial,\n id bigint not null,\n host varchar(128) not null,\n status varchar(32) not null,\n stdout text,\n stderr text,\n UNIQUE (id, host),\n PRIMARY KEY (ii)\n) ;\n\nCREATE TABLE task_host_70\n(\n ii bigserial,\n id bigint not null,\n host varchar(128) not null,\n status varchar(32) not null,\n stdout text,\n stderr text,\n UNIQUE (id, host),\n PRIMARY KEY (ii)\n) ;\n\nCREATE TABLE task_host_71\n(\n ii bigserial,\n id bigint not null,\n host varchar(128) not null,\n status varchar(32) not null,\n stdout text,\n stderr text,\n UNIQUE (id, host),\n PRIMARY KEY (ii)\n) ;\n\nCREATE TABLE task_host_72\n(\n ii bigserial,\n id bigint not null,\n host varchar(128) not null,\n status varchar(32) not null,\n stdout text,\n stderr text,\n UNIQUE (id, host),\n PRIMARY KEY (ii)\n) ;\n\nCREATE TABLE task_host_73\n(\n ii bigserial,\n id bigint not null,\n host varchar(128) not null,\n status varchar(32) not null,\n stdout text,\n stderr text,\n UNIQUE (id, host),\n PRIMARY KEY (ii)\n) ;\n\nCREATE TABLE task_host_74\n(\n ii bigserial,\n id bigint not null,\n host varchar(128) not null,\n status varchar(32) not null,\n stdout text,\n stderr text,\n UNIQUE (id, host),\n PRIMARY KEY (ii)\n) ;\n\nCREATE TABLE task_host_75\n(\n ii bigserial,\n id bigint not null,\n host varchar(128) not null,\n status varchar(32) not null,\n stdout text,\n stderr text,\n UNIQUE (id, host),\n PRIMARY KEY (ii)\n) ;\n\nCREATE TABLE task_host_76\n(\n ii bigserial,\n id bigint not null,\n host varchar(128) not null,\n status varchar(32) not null,\n stdout text,\n stderr text,\n UNIQUE (id, host),\n PRIMARY KEY (ii)\n) ;\n\nCREATE TABLE task_host_77\n(\n ii bigserial,\n id bigint not null,\n host varchar(128) not null,\n status varchar(32) not null,\n stdout text,\n stderr text,\n UNIQUE (id, host),\n PRIMARY KEY (ii)\n) ;\n\nCREATE TABLE task_host_78\n(\n ii bigserial,\n id bigint not null,\n host varchar(128) not null,\n status varchar(32) not null,\n stdout text,\n stderr text,\n UNIQUE (id, host),\n PRIMARY KEY (ii)\n) ;\n\nCREATE TABLE task_host_79\n(\n ii bigserial,\n id bigint not null,\n host varchar(128) not null,\n status varchar(32) not null,\n stdout text,\n stderr text,\n UNIQUE (id, host),\n PRIMARY KEY (ii)\n) ;\n\nCREATE TABLE task_host_80\n(\n ii bigserial,\n id bigint not null,\n host varchar(128) not null,\n status varchar(32) not null,\n stdout text,\n stderr text,\n UNIQUE (id, host),\n PRIMARY KEY (ii)\n) ;\n\nCREATE TABLE task_host_81\n(\n ii bigserial,\n id bigint not null,\n host varchar(128) not null,\n status varchar(32) not null,\n stdout text,\n stderr text,\n UNIQUE (id, host),\n PRIMARY KEY (ii)\n) ;\n\nCREATE TABLE task_host_82\n(\n ii bigserial,\n id bigint not null,\n host varchar(128) not null,\n status varchar(32) not null,\n stdout text,\n stderr text,\n UNIQUE (id, host),\n PRIMARY KEY (ii)\n) ;\n\nCREATE TABLE task_host_83\n(\n ii bigserial,\n id bigint not null,\n host varchar(128) not null,\n status varchar(32) not null,\n stdout text,\n stderr text,\n UNIQUE (id, host),\n PRIMARY KEY (ii)\n) ;\n\nCREATE TABLE task_host_84\n(\n ii bigserial,\n id bigint not null,\n host varchar(128) not null,\n status varchar(32) not null,\n stdout text,\n stderr text,\n UNIQUE (id, host),\n PRIMARY KEY (ii)\n) ;\n\nCREATE TABLE task_host_85\n(\n ii bigserial,\n id bigint not null,\n host varchar(128) not null,\n status varchar(32) not null,\n stdout text,\n stderr text,\n UNIQUE (id, host),\n PRIMARY KEY (ii)\n) ;\n\nCREATE TABLE task_host_86\n(\n ii bigserial,\n id bigint not null,\n host varchar(128) not null,\n status varchar(32) not null,\n stdout text,\n stderr text,\n UNIQUE (id, host),\n PRIMARY KEY (ii)\n) ;\n\nCREATE TABLE task_host_87\n(\n ii bigserial,\n id bigint not null,\n host varchar(128) not null,\n status varchar(32) not null,\n stdout text,\n stderr text,\n UNIQUE (id, host),\n PRIMARY KEY (ii)\n) ;\n\nCREATE TABLE task_host_88\n(\n ii bigserial,\n id bigint not null,\n host varchar(128) not null,\n status varchar(32) not null,\n stdout text,\n stderr text,\n UNIQUE (id, host),\n PRIMARY KEY (ii)\n) ;\n\nCREATE TABLE task_host_89\n(\n ii bigserial,\n id bigint not null,\n host varchar(128) not null,\n status varchar(32) not null,\n stdout text,\n stderr text,\n UNIQUE (id, host),\n PRIMARY KEY (ii)\n) ;\n\nCREATE TABLE task_host_90\n(\n ii bigserial,\n id bigint not null,\n host varchar(128) not null,\n status varchar(32) not null,\n stdout text,\n stderr text,\n UNIQUE (id, host),\n PRIMARY KEY (ii)\n) ;\n\nCREATE TABLE task_host_91\n(\n ii bigserial,\n id bigint not null,\n host varchar(128) not null,\n status varchar(32) not null,\n stdout text,\n stderr text,\n UNIQUE (id, host),\n PRIMARY KEY (ii)\n) ;\n\nCREATE TABLE task_host_92\n(\n ii bigserial,\n id bigint not null,\n host varchar(128) not null,\n status varchar(32) not null,\n stdout text,\n stderr text,\n UNIQUE (id, host),\n PRIMARY KEY (ii)\n) ;\n\nCREATE TABLE task_host_93\n(\n ii bigserial,\n id bigint not null,\n host varchar(128) not null,\n status varchar(32) not null,\n stdout text,\n stderr text,\n UNIQUE (id, host),\n PRIMARY KEY (ii)\n) ;\n\nCREATE TABLE task_host_94\n(\n ii bigserial,\n id bigint not null,\n host varchar(128) not null,\n status varchar(32) not null,\n stdout text,\n stderr text,\n UNIQUE (id, host),\n PRIMARY KEY (ii)\n) ;\n\nCREATE TABLE task_host_95\n(\n ii bigserial,\n id bigint not null,\n host varchar(128) not null,\n status varchar(32) not null,\n stdout text,\n stderr text,\n UNIQUE (id, host),\n PRIMARY KEY (ii)\n) ;\n\nCREATE TABLE task_host_96\n(\n ii bigserial,\n id bigint not null,\n host varchar(128) not null,\n status varchar(32) not null,\n stdout text,\n stderr text,\n UNIQUE (id, host),\n PRIMARY KEY (ii)\n) ;\n\nCREATE TABLE task_host_97\n(\n ii bigserial,\n id bigint not null,\n host varchar(128) not null,\n status varchar(32) not null,\n stdout text,\n stderr text,\n UNIQUE (id, host),\n PRIMARY KEY (ii)\n) ;\n\nCREATE TABLE task_host_98\n(\n ii bigserial,\n id bigint not null,\n host varchar(128) not null,\n status varchar(32) not null,\n stdout text,\n stderr text,\n UNIQUE (id, host),\n PRIMARY KEY (ii)\n) ;\n\nCREATE TABLE task_host_99\n(\n ii bigserial,\n id bigint not null,\n host varchar(128) not null,\n status varchar(32) not null,\n stdout text,\n stderr text,\n UNIQUE (id, host),\n PRIMARY KEY (ii)\n) ;\n"
},
{
"path": "docker/compose-postgres/n9eetc_pg/config.toml",
"content": "[Global]\nRunMode = \"release\"\n\n[Log]\n# log write dir\nDir = \"logs\"\n# log level: DEBUG INFO WARNING ERROR\nLevel = \"INFO\"\n# stdout, stderr, file\nOutput = \"stdout\"\n# # rotate by time\n# KeepHours = 4\n# # rotate by size\n# RotateNum = 3\n# # unit: MB\n# RotateSize = 256\n\n[HTTP]\n# http listening address\nHost = \"0.0.0.0\"\n# http listening port\nPort = 17000\n# https cert file path\nCertFile = \"\"\n# https key file path\nKeyFile = \"\"\n# whether print access log\nPrintAccessLog = false\n# whether enable pprof\nPProf = false\n# expose prometheus /metrics?\nExposeMetrics = true\n# http graceful shutdown timeout, unit: s\nShutdownTimeout = 30\n# max content length: 64M\nMaxContentLength = 67108864\n# http server read timeout, unit: s\nReadTimeout = 20\n# http server write timeout, unit: s\nWriteTimeout = 40\n# http server idle timeout, unit: s\nIdleTimeout = 120\n\n[HTTP.ShowCaptcha]\nEnable = false \n\n[HTTP.APIForAgent]\nEnable = true \n# [HTTP.APIForAgent.BasicAuth]\n# user001 = \"ccc26da7b9aba533cbb263a36c07dcc5\"\n\n[HTTP.APIForService]\nEnable = false\n[HTTP.APIForService.BasicAuth]\nuser001 = \"ccc26da7b9aba533cbb263a36c07dcc5\"\n\n[HTTP.JWTAuth]\n# unit: min\nAccessExpired = 1500\n# unit: min\nRefreshExpired = 10080\nRedisKeyPrefix = \"/jwt/\"\n\n[HTTP.ProxyAuth]\n# if proxy auth enabled, jwt auth is disabled\nEnable = false\n# username key in http proxy header\nHeaderUserNameKey = \"X-User-Name\"\nDefaultRoles = [\"Standard\"]\n\n[HTTP.RSA]\n# open RSA\nOpenRSA = false\n# RSA public key\nRSAPublicKeyPath = \"/etc/n9e/public.pem\"\n# RSA private key\nRSAPrivateKeyPath = \"/etc/n9e/private.pem\"\n# RSA private key password\nRSAPassWord = \"\"\n\n[DB]\nDSN=\"host=postgres port=5432 user=root dbname=n9e_v6 password=1234 sslmode=disable\"\n# enable debug mode or not\nDebug = false\n# mysql postgres\nDBType = \"postgres\"\n# unit: s\nMaxLifetime = 7200\n# max open connections\nMaxOpenConns = 150\n# max idle connections\nMaxIdleConns = 50\n\n[Redis]\n# address, ip:port or ip1:port,ip2:port for cluster and sentinel(SentinelAddrs)\nAddress = \"redis:6379\"\n# Username = \"\"\n# Password = \"\"\n# DB = 0\n# UseTLS = false\n# TLSMinVersion = \"1.2\"\n# standalone cluster sentinel\nRedisType = \"standalone\"\n# Mastername for sentinel type\n# MasterName = \"mymaster\"\n# SentinelUsername = \"\"\n# SentinelPassword = \"\"\n\n[Alert]\n[Alert.Heartbeat]\n# auto detect if blank\nIP = \"\"\n# unit ms\nInterval = 1000\nEngineName = \"default\"\n\n# [Alert.Alerting]\n# NotifyConcurrency = 10\n\n[Center]\nMetricsYamlFile = \"./etc/metrics.yaml\"\nI18NHeaderKey = \"X-Language\"\n\n[Center.AnonymousAccess]\nPromQuerier = true\nAlertDetail = true\n\n[Pushgw]\n# use target labels in database instead of in series\nLabelRewrite = true\nForceUseServerTS = true\n\n# [Pushgw.DebugSample]\n# ident = \"xx\"\n# __name__ = \"xx\"\n\n# [Pushgw.WriterOpt]\n# QueueMaxSize = 1000000\n# QueuePopSize = 1000\n\n[[Pushgw.Writers]] \n# Url = \"http://127.0.0.1:8480/insert/0/prometheus/api/v1/write\"\nUrl = \"http://victoriametrics:8428/api/v1/write\"\n# Basic auth username\nBasicAuthUser = \"\"\n# Basic auth password\nBasicAuthPass = \"\"\n# timeout settings, unit: ms\nHeaders = [\"X-From\", \"n9e\"]\nTimeout = 10000\nDialTimeout = 3000\nTLSHandshakeTimeout = 30000\nExpectContinueTimeout = 1000\nIdleConnTimeout = 90000\n# time duration, unit: ms\nKeepAlive = 30000\nMaxConnsPerHost = 0\nMaxIdleConns = 100\nMaxIdleConnsPerHost = 100\n## Optional TLS Config\n# UseTLS = false\n# TLSCA = \"/etc/n9e/ca.pem\"\n# TLSCert = \"/etc/n9e/cert.pem\"\n# TLSKey = \"/etc/n9e/key.pem\"\n# InsecureSkipVerify = false\n# [[Writers.WriteRelabels]]\n# Action = \"replace\"\n# SourceLabels = [\"__address__\"]\n# Regex = \"([^:]+)(?::\\\\d+)?\"\n# Replacement = \"$1:80\"\n# TargetLabel = \"__address__\"\n\n[Ibex]\nEnable = true\nRPCListen = \"0.0.0.0:20090\""
},
{
"path": "docker/compose-postgres/n9eetc_pg/metrics.yaml",
"content": "cpu_usage_idle: CPU空闲率(单位:%)\ncpu_usage_active: CPU使用率(单位:%)\ncpu_usage_system: CPU内核态时间占比(单位:%)\ncpu_usage_user: CPU用户态时间占比(单位:%)\ncpu_usage_nice: 低优先级用户态CPU时间占比,也就是进程nice值被调整为1-19之间的CPU时间。这里注意,nice可取值范围是-20到19,数值越大,优先级反而越低(单位:%)\ncpu_usage_iowait: CPU等待I/O的时间占比(单位:%)\ncpu_usage_irq: CPU处理硬中断的时间占比(单位:%)\ncpu_usage_softirq: CPU处理软中断的时间占比(单位:%)\ncpu_usage_steal: 在虚拟机环境下有该指标,表示CPU被其他虚拟机争用的时间占比,超过20就表示争抢严重(单位:%)\ncpu_usage_guest: 通过虚拟化运行其他操作系统的时间,也就是运行虚拟机的CPU时间占比(单位:%)\ncpu_usage_guest_nice: 以低优先级运行虚拟机的时间占比(单位:%)\n\ndisk_free: 硬盘分区剩余量(单位:byte)\ndisk_used: 硬盘分区使用量(单位:byte)\ndisk_used_percent: 硬盘分区使用率(单位:%)\ndisk_total: 硬盘分区总量(单位:byte)\ndisk_inodes_free: 硬盘分区inode剩余量 \ndisk_inodes_used: 硬盘分区inode使用量\ndisk_inodes_total: 硬盘分区inode总量\n\ndiskio_io_time: 从设备视角来看I/O请求总时间,队列中有I/O请求就计数(单位:毫秒),counter类型,需要用函数求rate才有使用价值\ndiskio_iops_in_progress: 已经分配给设备驱动且尚未完成的IO请求,不包含在队列中但尚未分配给设备驱动的IO请求,gauge类型\ndiskio_merged_reads: 相邻读请求merge读的次数,counter类型\ndiskio_merged_writes: 相邻写请求merge写的次数,counter类型\ndiskio_read_bytes: 读取的byte数量,counter类型,需要用函数求rate才有使用价值\ndiskio_read_time: 读请求总时间(单位:毫秒),counter类型,需要用函数求rate才有使用价值\ndiskio_reads: 读请求次数,counter类型,需要用函数求rate才有使用价值\ndiskio_weighted_io_time: 从I/O请求视角来看I/O等待总时间,如果同时有多个I/O请求,时间会叠加(单位:毫秒)\ndiskio_write_bytes: 写入的byte数量,counter类型,需要用函数求rate才有使用价值\ndiskio_write_time: 写请求总时间(单位:毫秒),counter类型,需要用函数求rate才有使用价值\ndiskio_writes: 写请求次数,counter类型,需要用函数求rate才有使用价值\n\nkernel_boot_time: 内核启动时间\nkernel_context_switches: 内核上下文切换次数\nkernel_entropy_avail: linux系统内部的熵池\nkernel_interrupts: 内核中断次数\nkernel_processes_forked: fork的进程数\n\nmem_active: 活跃使用的内存总数(包括cache和buffer内存)\nmem_available: 应用程序可用内存数\nmem_available_percent: 内存剩余百分比(0~100)\nmem_buffered: 用来给文件做缓冲大小\nmem_cached: 被高速缓冲存储器(cache memory)用的内存的大小(等于 diskcache minus SwapCache )\nmem_commit_limit: 根据超额分配比率('vm.overcommit_ratio'),这是当前在系统上分配可用的内存总量,这个限制只是在模式2('vm.overcommit_memory')时启用\nmem_committed_as: 目前在系统上分配的内存量。是所有进程申请的内存的总和\nmem_dirty: 等待被写回到磁盘的内存大小\nmem_free: 空闲内存数\nmem_high_free: 未被使用的高位内存大小\nmem_high_total: 高位内存总大小(Highmem是指所有内存高于860MB的物理内存,Highmem区域供用户程序使用,或用于页面缓存。该区域不是直接映射到内核空间。内核必须使用不同的手法使用该段内存)\nmem_huge_page_size: 每个大页的大小\nmem_huge_pages_free: 池中尚未分配的 HugePages 数量\nmem_huge_pages_total: 预留HugePages的总个数\nmem_inactive: 空闲的内存数(包括free和available的内存)\nmem_low_free: 未被使用的低位大小\nmem_low_total: 低位内存总大小,低位可以达到高位内存一样的作用,而且它还能够被内核用来记录一些自己的数据结构\nmem_mapped: 设备和文件等映射的大小\nmem_page_tables: 管理内存分页页面的索引表的大小\nmem_shared: 多个进程共享的内存总额\nmem_slab: 内核数据结构缓存的大小,可以减少申请和释放内存带来的消耗\nmem_sreclaimable: 可收回Slab的大小\nmem_sunreclaim: 不可收回Slab的大小(SUnreclaim+SReclaimable=Slab)\nmem_swap_cached: 被高速缓冲存储器(cache memory)用的交换空间的大小,已经被交换出来的内存,但仍然被存放在swapfile中。用来在需要的时候很快的被替换而不需要再次打开I/O端口\nmem_swap_free: 未被使用交换空间的大小\nmem_swap_total: 交换空间的总大小\nmem_total: 内存总数\nmem_used: 已用内存数\nmem_used_percent: 已用内存数百分比(0~100)\nmem_vmalloc_chunk: 最大的连续未被使用的vmalloc区域\nmem_vmalloc_totalL: 可以vmalloc虚拟内存大小\nmem_vmalloc_used: vmalloc已使用的虚拟内存大小\nmem_write_back: 正在被写回到磁盘的内存大小\nmem_write_back_tmp: FUSE用于临时写回缓冲区的内存\n\nnet_bytes_recv: 网卡收包总数(bytes)\nnet_bytes_sent: 网卡发包总数(bytes)\nnet_drop_in: 网卡收丢包数量\nnet_drop_out: 网卡发丢包数量\nnet_err_in: 网卡收包错误数量\nnet_err_out: 网卡发包错误数量\nnet_packets_recv: 网卡收包数量\nnet_packets_sent: 网卡发包数量\n\nnetstat_tcp_established: ESTABLISHED状态的网络链接数\nnetstat_tcp_fin_wait1: FIN_WAIT1状态的网络链接数\nnetstat_tcp_fin_wait2: FIN_WAIT2状态的网络链接数\nnetstat_tcp_last_ack: LAST_ACK状态的网络链接数\nnetstat_tcp_listen: LISTEN状态的网络链接数\nnetstat_tcp_syn_recv: SYN_RECV状态的网络链接数\nnetstat_tcp_syn_sent: SYN_SENT状态的网络链接数\nnetstat_tcp_time_wait: TIME_WAIT状态的网络链接数\nnetstat_udp_socket: UDP状态的网络链接数\n\nprocesses_blocked: 不可中断的睡眠状态下的进程数('U','D','L')\nprocesses_dead: 回收中的进程数('X')\nprocesses_idle: 挂起的空闲进程数('I')\nprocesses_paging: 分页进程数('P')\nprocesses_running: 运行中的进程数('R')\nprocesses_sleeping: 可中断进程数('S')\nprocesses_stopped: 暂停状态进程数('T')\nprocesses_total: 总进程数\nprocesses_total_threads: 总线程数\nprocesses_unknown: 未知状态进程数\nprocesses_zombies: 僵尸态进程数('Z')\n\nswap_used_percent: Swap空间换出数据量\n\nsystem_load1: 1分钟平均load值\nsystem_load5: 5分钟平均load值\nsystem_load15: 15分钟平均load值\nsystem_n_users: 用户数\nsystem_n_cpus: CPU核数\nsystem_uptime: 系统启动时间\n\nnginx_accepts: 自nginx启动起,与客户端建立过得连接总数\nnginx_active: 当前nginx正在处理的活动连接数,等于Reading/Writing/Waiting总和\nnginx_handled: 自nginx启动起,处理过的客户端连接总数\nnginx_reading: 正在读取HTTP请求头部的连接总数\nnginx_requests: 自nginx启动起,处理过的客户端请求总数,由于存在HTTP Keep-Alive请求,该值会大于handled值\nnginx_upstream_check_fall: upstream_check模块检测到后端失败的次数\nnginx_upstream_check_rise: upstream_check模块对后端的检测次数\nnginx_upstream_check_status_code: 后端upstream的状态,up为1,down为0\nnginx_waiting: 开启 keep-alive 的情况下,这个值等于 active – (reading+writing), 意思就是 Nginx 已经处理完正在等候下一次请求指令的驻留连接\nnginx_writing: 正在向客户端发送响应的连接总数\n\nhttp_response_content_length: HTTP消息实体的传输长度\nhttp_response_http_response_code: http响应状态码\nhttp_response_response_time: http响应用时\nhttp_response_result_code: url探测结果0为正常否则url无法访问\n\n# [mysqld_exporter]\nmysql_global_status_uptime: The number of seconds that the server has been up.(Gauge)\nmysql_global_status_uptime_since_flush_status: The number of seconds since the most recent FLUSH STATUS statement.(Gauge)\nmysql_global_status_queries: The number of statements executed by the server. This variable includes statements executed within stored programs, unlike the Questions variable. It does not count COM_PING or COM_STATISTICS commands.(Counter)\nmysql_global_status_threads_connected: The number of currently open connections.(Counter)\nmysql_global_status_connections: The number of connection attempts (successful or not) to the MySQL server.(Gauge)\nmysql_global_status_max_used_connections: The maximum number of connections that have been in use simultaneously since the server started.(Gauge)\nmysql_global_status_threads_running: The number of threads that are not sleeping.(Gauge)\nmysql_global_status_questions: The number of statements executed by the server. This includes only statements sent to the server by clients and not statements executed within stored programs, unlike the Queries variable. This variable does not count COM_PING, COM_STATISTICS, COM_STMT_PREPARE, COM_STMT_CLOSE, or COM_STMT_RESET commands.(Counter)\nmysql_global_status_threads_cached: The number of threads in the thread cache.(Counter)\nmysql_global_status_threads_created: The number of threads created to handle connections. If Threads_created is big, you may want to increase the thread_cache_size value. The cache miss rate can be calculated as Threads_created/Connections.(Counter)\nmysql_global_status_created_tmp_tables: The number of internal temporary tables created by the server while executing statements.(Counter)\nmysql_global_status_created_tmp_disk_tables: The number of internal on-disk temporary tables created by the server while executing statements. You can compare the number of internal on-disk temporary tables created to the total number of internal temporary tables created by comparing Created_tmp_disk_tables and Created_tmp_tables values.(Counter)\nmysql_global_status_created_tmp_files: How many temporary files mysqld has created.(Counter)\nmysql_global_status_select_full_join: The number of joins that perform table scans because they do not use indexes. If this value is not 0, you should carefully check the indexes of your tables.(Counter)\nmysql_global_status_select_full_range_join: The number of joins that used a range search on a reference table.(Counter)\nmysql_global_status_select_range: The number of joins that used ranges on the first table. This is normally not a critical issue even if the value is quite large.(Counter)\nmysql_global_status_select_range_check: The number of joins without keys that check for key usage after each row. If this is not 0, you should carefully check the indexes of your tables.(Counter)\nmysql_global_status_select_scan: The number of joins that did a full scan of the first table.(Counter)\nmysql_global_status_sort_rows: The number of sorted rows.(Counter)\nmysql_global_status_sort_range: The number of sorts that were done using ranges.(Counter)\nmysql_global_status_sort_merge_passes: The number of merge passes that the sort algorithm has had to do. If this value is large, you should consider increasing the value of the sort_buffer_size system variable.(Counter)\nmysql_global_status_sort_scan: The number of sorts that were done by scanning the table.(Counter)\nmysql_global_status_slow_queries: The number of queries that have taken more than long_query_time seconds. This counter increments regardless of whether the slow query log is enabled.(Counter)\nmysql_global_status_aborted_connects: The number of failed attempts to connect to the MySQL server.(Counter)\nmysql_global_status_aborted_clients: The number of connections that were aborted because the client died without closing the connection properly.(Counter)\nmysql_global_status_table_locks_immediate: The number of times that a request for a table lock could be granted immediately. Locks Immediate rising and falling is normal activity.(Counter)\nmysql_global_status_table_locks_waited: The number of times that a request for a table lock could not be granted immediately and a wait was needed. If this is high and you have performance problems, you should first optimize your queries, and then either split your table or tables or use replication.(Counter)\nmysql_global_status_bytes_received: The number of bytes received from all clients.(Counter)\nmysql_global_status_bytes_sent: The number of bytes sent to all clients.(Counter)\nmysql_global_status_innodb_page_size: InnoDB page size (default 16KB). Many values are counted in pages; the page size enables them to be easily converted to bytes.(Gauge)\nmysql_global_status_buffer_pool_pages: The number of pages in the InnoDB buffer pool.(Gauge)\nmysql_global_status_commands_total: The number of times each xxx statement has been executed.(Counter)\nmysql_global_status_handlers_total: Handler statistics are internal statistics on how MySQL is selecting, updating, inserting, and modifying rows, tables, and indexes. This is in fact the layer between the Storage Engine and MySQL.(Counter)\nmysql_global_status_opened_files: The number of files that have been opened with my_open() (a mysys library function). Parts of the server that open files without using this function do not increment the count.(Counter)\nmysql_global_status_open_tables: The number of tables that are open.(Gauge)\nmysql_global_status_opened_tables: The number of tables that have been opened. If Opened_tables is big, your table_open_cache value is probably too small.(Counter)\nmysql_global_status_table_open_cache_hits: The number of hits for open tables cache lookups.(Counter)\nmysql_global_status_table_open_cache_misses: The number of misses for open tables cache lookups.(Counter)\nmysql_global_status_table_open_cache_overflows: The number of overflows for the open tables cache.(Counter)\nmysql_global_status_innodb_num_open_files: The number of files InnoDB currently holds open.(Gauge)\nmysql_global_status_connection_errors_total: These variables provide information about errors that occur during the client connection process.(Counter)\nmysql_global_status_innodb_buffer_pool_read_requests: The number of logical read requests.(Counter)\nmysql_global_status_innodb_buffer_pool_reads: The number of logical reads that InnoDB could not satisfy from the buffer pool, and had to read directly from disk.(Counter)\n\nmysql_global_variables_thread_cache_size: How many threads the server should cache for reuse.(Gauge)\nmysql_global_variables_max_connections: The maximum permitted number of simultaneous client connections.(Gauge)\nmysql_global_variables_innodb_buffer_pool_size: The size in bytes of the buffer pool, the memory area where InnoDB caches table and index data. The default value is 134217728 bytes (128MB).(Gauge)\nmysql_global_variables_innodb_log_buffer_size: The size in bytes of the buffer that InnoDB uses to write to the log files on disk.(Gauge)\nmysql_global_variables_key_buffer_size: Index blocks for MyISAM tables are buffered and are shared by all threads.(Gauge)\nmysql_global_variables_query_cache_size: The amount of memory allocated for caching query results.(Gauge)\nmysql_global_variables_table_open_cache: The number of open tables for all threads.(Gauge)\nmysql_global_variables_open_files_limit: The number of file descriptors available to mysqld from the operating system.(Gauge)\n\n# [redis_exporter]\nredis_active_defrag_running: When activedefrag is enabled, this indicates whether defragmentation is currently active, and the CPU percentage it intends to utilize.\nredis_allocator_active_bytes: Total bytes in the allocator active pages, this includes external-fragmentation.\nredis_allocator_allocated_bytes: Total bytes allocated form the allocator, including internal-fragmentation. Normally the same as used_memory.\nredis_allocator_frag_bytes: Delta between allocator_active and allocator_allocated. See note about mem_fragmentation_bytes.\nredis_allocator_frag_ratio: Ratio between allocator_active and allocator_allocated. This is the true (external) fragmentation metric (not mem_fragmentation_ratio).\nredis_allocator_resident_bytes: Total bytes resident (RSS) in the allocator, this includes pages that can be released to the OS (by MEMORY PURGE, or just waiting).\nredis_allocator_rss_bytes: Delta between allocator_resident and allocator_active.\nredis_allocator_rss_ratio: Ratio between allocator_resident and allocator_active. This usually indicates pages that the allocator can and probably will soon release back to the OS.\nredis_aof_current_rewrite_duration_sec: Duration of the on-going AOF rewrite operation if any.\nredis_aof_enabled: Flag indicating AOF logging is activated.\nredis_aof_last_bgrewrite_status: Status of the last AOF rewrite operation.\nredis_aof_last_cow_size_bytes: The size in bytes of copy-on-write memory during the last AOF rewrite operation.\nredis_aof_last_rewrite_duration_sec: Duration of the last AOF rewrite operation in seconds.\nredis_aof_last_write_status: Status of the last write operation to the AOF.\nredis_aof_rewrite_in_progress: Flag indicating a AOF rewrite operation is on-going.\nredis_aof_rewrite_scheduled: Flag indicating an AOF rewrite operation will be scheduled once the on-going RDB save is complete.\nredis_blocked_clients: Number of clients pending on a blocking call (BLPOP, BRPOP, BRPOPLPUSH, BLMOVE, BZPOPMIN, BZPOPMAX).\nredis_client_recent_max_input_buffer_bytes: Biggest input buffer among current client connections.\nredis_client_recent_max_output_buffer_bytes: Biggest output buffer among current client connections.\nredis_cluster_enabled: Indicate Redis cluster is enabled.\nredis_commands_duration_seconds_total: The total CPU time consumed by these commands.(Counter)\nredis_commands_processed_total: Total number of commands processed by the server.(Counter)\nredis_commands_total: The number of calls that reached command execution (not rejected).(Counter)\nredis_config_maxclients: The value of the maxclients configuration directive. This is the upper limit for the sum of connected_clients, connected_slaves and cluster_connections.\nredis_config_maxmemory: The value of the maxmemory configuration directive.\nredis_connected_clients: Number of client connections (excluding connections from replicas).\nredis_connected_slaves: Number of connected replicas.\nredis_connections_received_total: Total number of connections accepted by the server.(Counter)\nredis_cpu_sys_children_seconds_total: System CPU consumed by the background processes.(Counter)\nredis_cpu_sys_seconds_total: System CPU consumed by the Redis server, which is the sum of system CPU consumed by all threads of the server process (main thread and background threads).(Counter)\nredis_cpu_user_children_seconds_total: User CPU consumed by the background processes.(Counter)\nredis_cpu_user_seconds_total: User CPU consumed by the Redis server, which is the sum of user CPU consumed by all threads of the server process (main thread and background threads).(Counter)\nredis_db_keys: Total number of keys by DB.\nredis_db_keys_expiring: Total number of expiring keys by DB\nredis_defrag_hits: Number of value reallocations performed by active the defragmentation process.\nredis_defrag_misses: Number of aborted value reallocations started by the active defragmentation process.\nredis_defrag_key_hits: Number of keys that were actively defragmented.\nredis_defrag_key_misses: Number of keys that were skipped by the active defragmentation process.\nredis_evicted_keys_total: Number of evicted keys due to maxmemory limit.(Counter)\nredis_expired_keys_total: Total number of key expiration events.(Counter)\nredis_expired_stale_percentage: The percentage of keys probably expired.\nredis_expired_time_cap_reached_total: The count of times that active expiry cycles have stopped early.\nredis_exporter_last_scrape_connect_time_seconds: The duration(in seconds) to connect when scrape.\nredis_exporter_last_scrape_duration_seconds: The last scrape duration.\nredis_exporter_last_scrape_error: The last scrape error status.\nredis_exporter_scrape_duration_seconds_count: Durations of scrapes by the exporter\nredis_exporter_scrape_duration_seconds_sum: Durations of scrapes by the exporter\nredis_exporter_scrapes_total: Current total redis scrapes.(Counter)\nredis_instance_info: Information about the Redis instance.\nredis_keyspace_hits_total: Hits total.(Counter)\nredis_keyspace_misses_total: Misses total.(Counter)\nredis_last_key_groups_scrape_duration_milliseconds: Duration of the last key group metrics scrape in milliseconds.\nredis_last_slow_execution_duration_seconds: The amount of time needed for last slow execution, in seconds.\nredis_latest_fork_seconds: The amount of time needed for last fork, in seconds.\nredis_lazyfree_pending_objects: The number of objects waiting to be freed (as a result of calling UNLINK, or FLUSHDB and FLUSHALL with the ASYNC option).\nredis_master_repl_offset: The server's current replication offset. \nredis_mem_clients_normal: Memory used by normal clients.(Gauge)\nredis_mem_clients_slaves: Memory used by replica clients - Starting Redis 7.0, replica buffers share memory with the replication backlog, so this field can show 0 when replicas don't trigger an increase of memory usage.\nredis_mem_fragmentation_bytes: Delta between used_memory_rss and used_memory. Note that when the total fragmentation bytes is low (few megabytes), a high ratio (e.g. 1.5 and above) is not an indication of an issue.\nredis_mem_fragmentation_ratio: Ratio between used_memory_rss and used_memory. Note that this doesn't only includes fragmentation, but also other process overheads (see the allocator_* metrics), and also overheads like code, shared libraries, stack, etc.\nredis_mem_not_counted_for_eviction_bytes: (Gauge)\nredis_memory_max_bytes: Max memory limit in bytes.\nredis_memory_used_bytes: Total number of bytes allocated by Redis using its allocator (either standard libc, jemalloc, or an alternative allocator such as tcmalloc)\nredis_memory_used_dataset_bytes: The size in bytes of the dataset (used_memory_overhead subtracted from used_memory)\nredis_memory_used_lua_bytes: Number of bytes used by the Lua engine.\nredis_memory_used_overhead_bytes: The sum in bytes of all overheads that the server allocated for managing its internal data structures.\nredis_memory_used_peak_bytes: Peak memory consumed by Redis (in bytes)\nredis_memory_used_rss_bytes: Number of bytes that Redis allocated as seen by the operating system (a.k.a resident set size). This is the number reported by tools such as top(1) and ps(1)\nredis_memory_used_scripts_bytes: Number of bytes used by cached Lua scripts\nredis_memory_used_startup_bytes: Initial amount of memory consumed by Redis at startup in bytes\nredis_migrate_cached_sockets_total: The number of sockets open for MIGRATE purposes\nredis_net_input_bytes_total: Total input bytes(Counter)\nredis_net_output_bytes_total: Total output bytes(Counter)\nredis_process_id: Process ID\nredis_pubsub_channels: Global number of pub/sub channels with client subscriptions\nredis_pubsub_patterns: Global number of pub/sub pattern with client subscriptions\nredis_rdb_bgsave_in_progress: Flag indicating a RDB save is on-going\nredis_rdb_changes_since_last_save: Number of changes since the last dump\nredis_rdb_current_bgsave_duration_sec: Duration of the on-going RDB save operation if any\nredis_rdb_last_bgsave_duration_sec: Duration of the last RDB save operation in seconds\nredis_rdb_last_bgsave_status: Status of the last RDB save operation\nredis_rdb_last_cow_size_bytes: The size in bytes of copy-on-write memory during the last RDB save operation\nredis_rdb_last_save_timestamp_seconds: Epoch-based timestamp of last successful RDB save\nredis_rejected_connections_total: Number of connections rejected because of maxclients limit(Counter)\nredis_repl_backlog_first_byte_offset: The master offset of the replication backlog buffer\nredis_repl_backlog_history_bytes: Size in bytes of the data in the replication backlog buffer\nredis_repl_backlog_is_active: Flag indicating replication backlog is active\nredis_replica_partial_resync_accepted: The number of accepted partial resync requests(Gauge)\nredis_replica_partial_resync_denied: The number of denied partial resync requests(Gauge)\nredis_replica_resyncs_full: The number of full resyncs with replicas\nredis_replication_backlog_bytes: Memory used by replication backlog\nredis_second_repl_offset: The offset up to which replication IDs are accepted.\nredis_slave_expires_tracked_keys: The number of keys tracked for expiry purposes (applicable only to writable replicas)(Gauge)\nredis_slowlog_last_id: Last id of slowlog\nredis_slowlog_length: Total slowlog\nredis_start_time_seconds: Start time of the Redis instance since unix epoch in seconds.\nredis_target_scrape_request_errors_total: Errors in requests to the exporter\nredis_up: Flag indicating redis instance is up\nredis_uptime_in_seconds: Number of seconds since Redis server start\n\n# [windows_exporter]\nwindows_cpu_clock_interrupts_total: Total number of received and serviced clock tick interrupts(counter)\nwindows_cpu_core_frequency_mhz: Core frequency in megahertz(gauge)\nwindows_cpu_cstate_seconds_total: Time spent in low-power idle state(counter)\nwindows_cpu_dpcs_total: Total number of received and serviced deferred procedure calls (DPCs)(counter)\nwindows_cpu_idle_break_events_total: Total number of time processor was woken from idle(counter)\nwindows_cpu_interrupts_total: Total number of received and serviced hardware interrupts(counter)\nwindows_cpu_parking_status: Parking Status represents whether a processor is parked or not(gauge)\nwindows_cpu_processor_performance: Processor Performance is the average performance of the processor while it is executing instructions, as a percentage of the nominal performance of the processor. On some processors, Processor Performance may exceed 100%(gauge)\nwindows_cpu_time_total: Time that processor spent in different modes (idle, user, system, ...)(counter)\nwindows_cs_hostname: Labeled system hostname information as provided by ComputerSystem.DNSHostName and ComputerSystem.Domain(gauge)\nwindows_cs_logical_processors: ComputerSystem.NumberOfLogicalProcessors(gauge)\nwindows_cs_physical_memory_bytes: ComputerSystem.TotalPhysicalMemory(gauge)\nwindows_exporter_build_info: A metric with a constant '1' value labeled by version, revision, branch, and goversion from which windows_exporter was built.(gauge)\nwindows_exporter_collector_duration_seconds: Duration of a collection.(gauge)\nwindows_exporter_collector_success: Whether the collector was successful.(gauge)\nwindows_exporter_collector_timeout: Whether the collector timed out.(gauge)\nwindows_exporter_perflib_snapshot_duration_seconds: Duration of perflib snapshot capture(gauge)\nwindows_logical_disk_free_bytes: Free space in bytes (LogicalDisk.PercentFreeSpace)(gauge)\nwindows_logical_disk_idle_seconds_total: Seconds that the disk was idle (LogicalDisk.PercentIdleTime)(counter)\nwindows_logical_disk_read_bytes_total: The number of bytes transferred from the disk during read operations (LogicalDisk.DiskReadBytesPerSec)(counter)\nwindows_logical_disk_read_latency_seconds_total: Shows the average time, in seconds, of a read operation from the disk (LogicalDisk.AvgDiskSecPerRead)(counter)\nwindows_logical_disk_read_seconds_total: Seconds that the disk was busy servicing read requests (LogicalDisk.PercentDiskReadTime)(counter)\nwindows_logical_disk_read_write_latency_seconds_total: Shows the time, in seconds, of the average disk transfer (LogicalDisk.AvgDiskSecPerTransfer)(counter)\nwindows_logical_disk_reads_total: The number of read operations on the disk (LogicalDisk.DiskReadsPerSec)(counter)\nwindows_logical_disk_requests_queued: The number of requests queued to the disk (LogicalDisk.CurrentDiskQueueLength)(gauge)\nwindows_logical_disk_size_bytes: Total space in bytes (LogicalDisk.PercentFreeSpace_Base)(gauge)\nwindows_logical_disk_split_ios_total: The number of I/Os to the disk were split into multiple I/Os (LogicalDisk.SplitIOPerSec)(counter)\nwindows_logical_disk_write_bytes_total: The number of bytes transferred to the disk during write operations (LogicalDisk.DiskWriteBytesPerSec)(counter)\nwindows_logical_disk_write_latency_seconds_total: Shows the average time, in seconds, of a write operation to the disk (LogicalDisk.AvgDiskSecPerWrite)(counter)\nwindows_logical_disk_write_seconds_total: Seconds that the disk was busy servicing write requests (LogicalDisk.PercentDiskWriteTime)(counter)\nwindows_logical_disk_writes_total: The number of write operations on the disk (LogicalDisk.DiskWritesPerSec)(counter)\nwindows_net_bytes_received_total: (Network.BytesReceivedPerSec)(counter)\nwindows_net_bytes_sent_total: (Network.BytesSentPerSec)(counter)\nwindows_net_bytes_total: (Network.BytesTotalPerSec)(counter)\nwindows_net_current_bandwidth: (Network.CurrentBandwidth)(gauge)\nwindows_net_packets_outbound_discarded_total: (Network.PacketsOutboundDiscarded)(counter)\nwindows_net_packets_outbound_errors_total: (Network.PacketsOutboundErrors)(counter)\nwindows_net_packets_received_discarded_total: (Network.PacketsReceivedDiscarded)(counter)\nwindows_net_packets_received_errors_total: (Network.PacketsReceivedErrors)(counter)\nwindows_net_packets_received_total: (Network.PacketsReceivedPerSec)(counter)\nwindows_net_packets_received_unknown_total: (Network.PacketsReceivedUnknown)(counter)\nwindows_net_packets_sent_total: (Network.PacketsSentPerSec)(counter)\nwindows_net_packets_total: (Network.PacketsPerSec)(counter)\nwindows_os_info: OperatingSystem.Caption, OperatingSystem.Version(gauge)\nwindows_os_paging_free_bytes: OperatingSystem.FreeSpaceInPagingFiles(gauge)\nwindows_os_paging_limit_bytes: OperatingSystem.SizeStoredInPagingFiles(gauge)\nwindows_os_physical_memory_free_bytes: OperatingSystem.FreePhysicalMemory(gauge)\nwindows_os_process_memory_limix_bytes: OperatingSystem.MaxProcessMemorySize(gauge)\nwindows_os_processes: OperatingSystem.NumberOfProcesses(gauge)\nwindows_os_processes_limit: OperatingSystem.MaxNumberOfProcesses(gauge)\nwindows_os_time: OperatingSystem.LocalDateTime(gauge)\nwindows_os_timezone: OperatingSystem.LocalDateTime(gauge)\nwindows_os_users: OperatingSystem.NumberOfUsers(gauge)\nwindows_os_virtual_memory_bytes: OperatingSystem.TotalVirtualMemorySize(gauge)\nwindows_os_virtual_memory_free_bytes: OperatingSystem.FreeVirtualMemory(gauge)\nwindows_os_visible_memory_bytes: OperatingSystem.TotalVisibleMemorySize(gauge)\nwindows_service_info: A metric with a constant '1' value labeled with service information(gauge)\nwindows_service_start_mode: The start mode of the service (StartMode)(gauge)\nwindows_service_state: The state of the service (State)(gauge)\nwindows_service_status: The status of the service (Status)(gauge)\nwindows_system_context_switches_total: Total number of context switches (WMI source is PerfOS_System.ContextSwitchesPersec)(counter)\nwindows_system_exception_dispatches_total: Total number of exceptions dispatched (WMI source is PerfOS_System.ExceptionDispatchesPersec)(counter)\nwindows_system_processor_queue_length: Length of processor queue (WMI source is PerfOS_System.ProcessorQueueLength)(gauge)\nwindows_system_system_calls_total: Total number of system calls (WMI source is PerfOS_System.SystemCallsPersec)(counter)\nwindows_system_system_up_time: System boot time (WMI source is PerfOS_System.SystemUpTime)(gauge)\nwindows_system_threads: Current number of threads (WMI source is PerfOS_System.Threads)(gauge)\n\n# [node_exporter]\n# SYSTEM\n# CPU context switch 次数\nnode_context_switches_total: context_switches\n# Interrupts 次数\nnode_intr_total: Interrupts\n# 运行的进程数\nnode_procs_running: Processes in runnable state\n# 熵池大小\nnode_entropy_available_bits: Entropy available to random number generators\nnode_time_seconds: System time in seconds since epoch (1970)\nnode_boot_time_seconds: Node boot time, in unixtime\n# CPU\nnode_cpu_seconds_total: Seconds the CPUs spent in each mode\nnode_load1: cpu load 1m\nnode_load5: cpu load 5m\nnode_load15: cpu load 15m\n\n# MEM\n# 内核态\n# 用户追踪已从交换区获取但尚未修改的页面的内存\nnode_memory_SwapCached_bytes: Memory that keeps track of pages that have been fetched from swap but not yet been modified\n# 内核用于缓存数据结构供自己使用的内存\nnode_memory_Slab_bytes: Memory used by the kernel to cache data structures for its own use\n# slab中可回收的部分\nnode_memory_SReclaimable_bytes: SReclaimable - Part of Slab, that might be reclaimed, such as caches\n# slab中不可回收的部分\nnode_memory_SUnreclaim_bytes: Part of Slab, that cannot be reclaimed on memory pressure\n# Vmalloc内存区的大小\nnode_memory_VmallocTotal_bytes: Total size of vmalloc memory area\n# vmalloc已分配的内存,虚拟地址空间上的连续的内存\nnode_memory_VmallocUsed_bytes: Amount of vmalloc area which is used\n# vmalloc区可用的连续最大快的大小,通过此指标可以知道vmalloc可分配连续内存的最大值\nnode_memory_VmallocChunk_bytes: Largest contiguous block of vmalloc area which is free\n# 内存的硬件故障删除掉的内存页的总大小\nnode_memory_HardwareCorrupted_bytes: Amount of RAM that the kernel identified as corrupted / not working\n# 用于在虚拟和物理内存地址之间映射的内存\nnode_memory_PageTables_bytes: Memory used to map between virtual and physical memory addresses (gauge)\n# 内核栈内存,常驻内存,不可回收\nnode_memory_KernelStack_bytes: Kernel memory stack. This is not reclaimable\n# 用来访问高端内存,复制高端内存的临时buffer,称为“bounce buffering”,会降低I/O 性能\nnode_memory_Bounce_bytes: Memory used for block device bounce buffers\n#用户态\n# 单个巨页大小\nnode_memory_Hugepagesize_bytes: Huge Page size\n# 系统分配的常驻巨页数\nnode_memory_HugePages_Total: Total size of the pool of huge pages\n# 系统空闲的巨页数\nnode_memory_HugePages_Free: Huge pages in the pool that are not yet allocated\n# 进程已申请但未使用的巨页数\nnode_memory_HugePages_Rsvd: Huge pages for which a commitment to allocate from the pool has been made, but no allocation\n# 超过系统设定的常驻HugePages数量的个数\nnode_memory_HugePages_Surp: Huge pages in the pool above the value in /proc/sys/vm/nr_hugepages\n# 透明巨页 Transparent HugePages (THP)\nnode_memory_AnonHugePages_bytes: Memory in anonymous huge pages\n# inactivelist中的File-backed内存\nnode_memory_Inactive_file_bytes: File-backed memory on inactive LRU list\n# inactivelist中的Anonymous内存\nnode_memory_Inactive_anon_bytes: Anonymous and swap cache on inactive LRU list, including tmpfs (shmem)\n# activelist中的File-backed内存\nnode_memory_Active_file_bytes: File-backed memory on active LRU list\n# activelist中的Anonymous内存\nnode_memory_Active_anon_bytes: Anonymous and swap cache on active least-recently-used (LRU) list, including tmpfs\n# 禁止换出的页,对应 Unevictable 链表\nnode_memory_Unevictable_bytes: Amount of unevictable memory that can't be swapped out for a variety of reasons\n# 共享内存\nnode_memory_Shmem_bytes: Used shared memory (shared between several processes, thus including RAM disks)\n# 匿名页内存大小\nnode_memory_AnonPages_bytes: Memory in user pages not backed by files\n# 被关联的内存页大小\nnode_memory_Mapped_bytes: Used memory in mapped pages files which have been mapped, such as libraries\n# file-backed内存页缓存大小\nnode_memory_Cached_bytes: Parked file data (file content) cache\n# 系统中有多少匿名页曾经被swap-out、现在又被swap-in并且swap-in之后页面中的内容一直没发生变化\nnode_memory_SwapCached_bytes: Memory that keeps track of pages that have been fetched from swap but not yet been modified\n# 被mlock()系统调用锁定的内存大小\nnode_memory_Mlocked_bytes: Size of pages locked to memory using the mlock() system call\n# 块设备(block device)所占用的缓存页\nnode_memory_Buffers_bytes: Block device (e.g. harddisk) cache\nnode_memory_SwapTotal_bytes: Memory information field SwapTotal_bytes\nnode_memory_SwapFree_bytes: Memory information field SwapFree_bytes\n\n# DISK\nnode_filesystem_files_free: Filesystem space available to non-root users in byte\nnode_filesystem_free_bytes: Filesystem free space in bytes\nnode_filesystem_size_bytes: Filesystem size in bytes\nnode_filesystem_files_free: Filesystem total free file nodes\nnode_filesystem_files: Filesystem total free file nodes\nnode_filefd_maximum: Max open files\nnode_filefd_allocated: Open files\nnode_filesystem_readonly: Filesystem read-only status\nnode_filesystem_device_error: Whether an error occurred while getting statistics for the given device\nnode_disk_reads_completed_total: The total number of reads completed successfully\nnode_disk_writes_completed_total: The total number of writes completed successfully\nnode_disk_reads_merged_total: The number of reads merged\nnode_disk_writes_merged_total: The number of writes merged\nnode_disk_read_bytes_total: The total number of bytes read successfully\nnode_disk_written_bytes_total: The total number of bytes written successfully\nnode_disk_io_time_seconds_total: Total seconds spent doing I/Os\nnode_disk_read_time_seconds_total: The total number of seconds spent by all reads\nnode_disk_write_time_seconds_total: The total number of seconds spent by all writes\nnode_disk_io_time_weighted_seconds_total: The weighted of seconds spent doing I/Os\n\n# NET\nnode_network_receive_bytes_total: Network device statistic receive_bytes (counter)\nnode_network_transmit_bytes_total: Network device statistic transmit_bytes (counter)\nnode_network_receive_packets_total: Network device statistic receive_bytes\nnode_network_transmit_packets_total: Network device statistic transmit_bytes\nnode_network_receive_errs_total: Network device statistic receive_errs\nnode_network_transmit_errs_total: Network device statistic transmit_errs\nnode_network_receive_drop_total: Network device statistic receive_drop\nnode_network_transmit_drop_total: Network device statistic transmit_drop\nnode_nf_conntrack_entries: Number of currently allocated flow entries for connection tracking\nnode_sockstat_TCP_alloc: Number of TCP sockets in state alloc\nnode_sockstat_TCP_inuse: Number of TCP sockets in state inuse\nnode_sockstat_TCP_orphan: Number of TCP sockets in state orphan\nnode_sockstat_TCP_tw: Number of TCP sockets in state tw\nnode_netstat_Tcp_CurrEstab: Statistic TcpCurrEstab\nnode_sockstat_sockets_used: Number of IPv4 sockets in use\n\n# [kafka_exporter]\nkafka_brokers: count of kafka_brokers (gauge)\nkafka_topic_partitions: Number of partitions for this Topic (gauge)\nkafka_topic_partition_current_offset: Current Offset of a Broker at Topic/Partition (gauge)\nkafka_consumergroup_current_offset: Current Offset of a ConsumerGroup at Topic/Partition (gauge)\nkafka_consumer_lag_millis: Current approximation of consumer lag for a ConsumerGroup at Topic/Partition (gauge)\nkafka_topic_partition_under_replicated_partition: 1 if Topic/Partition is under Replicated\n\n# [zookeeper_exporter]\nzk_znode_count: The total count of znodes stored \nzk_ephemerals_count: The number of Ephemerals nodes\nzk_watch_count: The number of watchers setup over Zookeeper nodes.\nzk_approximate_data_size: Size of data in bytes that a zookeeper server has in its data tree\nzk_outstanding_requests: Number of currently executing requests\nzk_packets_sent: Count of the number of zookeeper packets sent from a server\nzk_packets_received: Count of the number of zookeeper packets received by a server\nzk_num_alive_connections: Number of active clients connected to a zookeeper server\nzk_open_file_descriptor_count: Number of file descriptors that a zookeeper server has open\nzk_max_file_descriptor_count: Maximum number of file descriptors that a zookeeper server can open\nzk_avg_latency: Average time in milliseconds for requests to be processed\nzk_min_latency: Maximum time in milliseconds for a request to be processed\nzk_max_latency: Minimum time in milliseconds for a request to be processed"
},
{
"path": "docker/compose-postgres/prometc_vm/prometheus.yml",
"content": "# my global config\nglobal:\n scrape_interval: 15s # Set the scrape interval to every 15 seconds. Default is every 1 minute.\n evaluation_interval: 15s # Evaluate rules every 15 seconds. The default is every 1 minute.\n # scrape_timeout is set to the global default (10s).\n\n# A scrape configuration containing exactly one endpoint to scrape:\n# Here it's Prometheus itself.\nscrape_configs:\n # The job name is added as a label `job=` to any timeseries scraped from this config.\n - job_name: 'victoriametrics'\n # metrics_path defaults to '/metrics'\n # scheme defaults to 'http'.\n static_configs:\n - targets: ['victoriametrics:8428']\n\n - job_name: 'n9e'\n # static_configs:\n # - targets: ['n9e:17000']\n file_sd_configs:\n - files:\n - targets.json\n\nremote_write:\n - url: 'http://n9e:17000/prometheus/v1/write'\n"
},
{
"path": "docker/compose-postgres/prometc_vm/targets.json",
"content": "[\n {\n \"targets\": [\n \"n9e:17000\"\n ]\n }\n]\n"
},
{
"path": "docker/initsql/a-n9e.sql",
"content": "set names utf8mb4;\n\n-- drop database if exists n9e_v6;\ncreate database n9e_v6;\nuse n9e_v6;\n\nCREATE TABLE `users` (\n `id` bigint unsigned not null auto_increment,\n `username` varchar(64) not null comment 'login name, cannot rename',\n `nickname` varchar(64) not null comment 'display name, chinese name',\n `password` varchar(128) not null default '',\n `phone` varchar(16) not null default '',\n `email` varchar(64) not null default '',\n `portrait` varchar(255) not null default '' comment 'portrait image url',\n `roles` varchar(255) not null comment 'Admin | Standard | Guest, split by space',\n `contacts` varchar(1024) comment 'json e.g. {wecom:xx, dingtalk_robot_token:yy}',\n `maintainer` tinyint(1) not null default 0,\n `belong` varchar(191) DEFAULT '' COMMENT 'belong',\n `last_active_time` bigint DEFAULT 0 COMMENT 'last_active_time',\n `create_at` bigint not null default 0,\n `create_by` varchar(64) not null default '',\n `update_at` bigint not null default 0,\n `update_by` varchar(64) not null default '',\n PRIMARY KEY (`id`),\n UNIQUE KEY (`username`)\n) ENGINE = InnoDB DEFAULT CHARSET = utf8mb4;\n\ninsert into `users`(id, username, nickname, password, roles, create_at, create_by, update_at, update_by) values(1, 'root', '超管', 'root.2020', 'Admin', unix_timestamp(now()), 'system', unix_timestamp(now()), 'system');\n\nCREATE TABLE `user_group` (\n `id` bigint unsigned not null auto_increment,\n `name` varchar(128) not null default '',\n `note` varchar(255) not null default '',\n `create_at` bigint not null default 0,\n `create_by` varchar(64) not null default '',\n `update_at` bigint not null default 0,\n `update_by` varchar(64) not null default '',\n PRIMARY KEY (`id`),\n KEY (`create_by`),\n KEY (`update_at`)\n) ENGINE = InnoDB DEFAULT CHARSET = utf8mb4;\n\ninsert into user_group(id, name, create_at, create_by, update_at, update_by) values(1, 'demo-root-group', unix_timestamp(now()), 'root', unix_timestamp(now()), 'root');\n\nCREATE TABLE `user_group_member` (\n `id` bigint unsigned not null auto_increment,\n `group_id` bigint unsigned not null,\n `user_id` bigint unsigned not null,\n KEY (`group_id`),\n KEY (`user_id`),\n PRIMARY KEY(`id`)\n) ENGINE = InnoDB DEFAULT CHARSET = utf8mb4;\n\ninsert into user_group_member(group_id, user_id) values(1, 1);\n\nCREATE TABLE `configs` (\n `id` bigint unsigned not null auto_increment,\n `ckey` varchar(191) not null,\n `note` varchar(1024) NOT NULL DEFAULT '' COMMENT 'note',\n `cval` text COMMENT 'config value',\n `external` bigint DEFAULT 0 COMMENT '0\\\\:built-in 1\\\\:external',\n `encrypted` bigint DEFAULT 0 COMMENT '0\\\\:plaintext 1\\\\:ciphertext',\n `create_at` bigint DEFAULT 0 COMMENT 'create_at',\n `create_by` varchar(64) NOT NULL DEFAULT '' COMMENT 'create_by',\n `update_at` bigint DEFAULT 0 COMMENT 'update_at',\n `update_by` varchar(64) NOT NULL DEFAULT '' COMMENT 'update_by',\n PRIMARY KEY (`id`)\n) ENGINE = InnoDB DEFAULT CHARSET = utf8mb4;\n\nCREATE TABLE `role` (\n `id` bigint unsigned not null auto_increment,\n `name` varchar(191) not null default '',\n `note` varchar(255) not null default '',\n PRIMARY KEY (`id`),\n UNIQUE KEY (`name`)\n) ENGINE = InnoDB DEFAULT CHARSET = utf8mb4;\n\ninsert into `role`(name, note) values('Admin', 'Administrator role');\ninsert into `role`(name, note) values('Standard', 'Ordinary user role');\ninsert into `role`(name, note) values('Guest', 'Readonly user role');\n\nCREATE TABLE `role_operation`(\n `id` bigint unsigned not null auto_increment,\n `role_name` varchar(128) not null,\n `operation` varchar(191) not null,\n KEY (`role_name`),\n KEY (`operation`),\n PRIMARY KEY(`id`)\n) ENGINE = InnoDB DEFAULT CHARSET = utf8mb4;\n\n-- Admin is special, who has no concrete operation but can do anything.\ninsert into `role_operation`(role_name, operation) values('Guest', '/metric/explorer');\ninsert into `role_operation`(role_name, operation) values('Guest', '/object/explorer');\ninsert into `role_operation`(role_name, operation) values('Guest', '/log/explorer');\ninsert into `role_operation`(role_name, operation) values('Guest', '/trace/explorer');\ninsert into `role_operation`(role_name, operation) values('Guest', '/help/version');\ninsert into `role_operation`(role_name, operation) values('Guest', '/help/contact');\n\ninsert into `role_operation`(role_name, operation) values('Standard', '/metric/explorer');\ninsert into `role_operation`(role_name, operation) values('Standard', '/object/explorer');\ninsert into `role_operation`(role_name, operation) values('Standard', '/log/explorer');\ninsert into `role_operation`(role_name, operation) values('Standard', '/trace/explorer');\ninsert into `role_operation`(role_name, operation) values('Standard', '/help/version');\ninsert into `role_operation`(role_name, operation) values('Standard', '/help/contact');\ninsert into `role_operation`(role_name, operation) values('Standard', '/help/servers');\ninsert into `role_operation`(role_name, operation) values('Standard', '/help/migrate');\ninsert into `role_operation`(role_name, operation) values('Standard', '/alert-rules-built-in');\ninsert into `role_operation`(role_name, operation) values('Standard', '/dashboards-built-in');\ninsert into `role_operation`(role_name, operation) values('Standard', '/trace/dependencies');\ninsert into `role_operation`(role_name, operation) values('Standard', '/users');\ninsert into `role_operation`(role_name, operation) values('Standard', '/user-groups');\ninsert into `role_operation`(role_name, operation) values('Standard', '/user-groups/add');\ninsert into `role_operation`(role_name, operation) values('Standard', '/user-groups/put');\ninsert into `role_operation`(role_name, operation) values('Standard', '/user-groups/del');\ninsert into `role_operation`(role_name, operation) values('Standard', '/busi-groups');\ninsert into `role_operation`(role_name, operation) values('Standard', '/busi-groups/add');\ninsert into `role_operation`(role_name, operation) values('Standard', '/busi-groups/put');\ninsert into `role_operation`(role_name, operation) values('Standard', '/busi-groups/del');\ninsert into `role_operation`(role_name, operation) values('Standard', '/targets');\ninsert into `role_operation`(role_name, operation) values('Standard', '/targets/add');\ninsert into `role_operation`(role_name, operation) values('Standard', '/targets/put');\ninsert into `role_operation`(role_name, operation) values('Standard', '/targets/del');\ninsert into `role_operation`(role_name, operation) values('Standard', '/dashboards');\ninsert into `role_operation`(role_name, operation) values('Standard', '/dashboards/add');\ninsert into `role_operation`(role_name, operation) values('Standard', '/dashboards/put');\ninsert into `role_operation`(role_name, operation) values('Standard', '/dashboards/del');\ninsert into `role_operation`(role_name, operation) values('Standard', '/alert-rules');\ninsert into `role_operation`(role_name, operation) values('Standard', '/alert-rules/add');\ninsert into `role_operation`(role_name, operation) values('Standard', '/alert-rules/put');\ninsert into `role_operation`(role_name, operation) values('Standard', '/alert-rules/del');\ninsert into `role_operation`(role_name, operation) values('Standard', '/alert-mutes');\ninsert into `role_operation`(role_name, operation) values('Standard', '/alert-mutes/add');\ninsert into `role_operation`(role_name, operation) values('Standard', '/alert-mutes/del');\ninsert into `role_operation`(role_name, operation) values('Standard', '/alert-subscribes');\ninsert into `role_operation`(role_name, operation) values('Standard', '/alert-subscribes/add');\ninsert into `role_operation`(role_name, operation) values('Standard', '/alert-subscribes/put');\ninsert into `role_operation`(role_name, operation) values('Standard', '/alert-subscribes/del');\ninsert into `role_operation`(role_name, operation) values('Standard', '/alert-cur-events');\ninsert into `role_operation`(role_name, operation) values('Standard', '/alert-cur-events/del');\ninsert into `role_operation`(role_name, operation) values('Standard', '/alert-his-events');\ninsert into `role_operation`(role_name, operation) values('Standard', '/job-tpls');\ninsert into `role_operation`(role_name, operation) values('Standard', '/job-tpls/add');\ninsert into `role_operation`(role_name, operation) values('Standard', '/job-tpls/put');\ninsert into `role_operation`(role_name, operation) values('Standard', '/job-tpls/del');\ninsert into `role_operation`(role_name, operation) values('Standard', '/job-tasks');\ninsert into `role_operation`(role_name, operation) values('Standard', '/job-tasks/add');\ninsert into `role_operation`(role_name, operation) values('Standard', '/job-tasks/put');\ninsert into `role_operation`(role_name, operation) values('Standard', '/recording-rules');\ninsert into `role_operation`(role_name, operation) values('Standard', '/recording-rules/add');\ninsert into `role_operation`(role_name, operation) values('Standard', '/recording-rules/put');\ninsert into `role_operation`(role_name, operation) values('Standard', '/recording-rules/del');\n\n-- for alert_rule | collect_rule | mute | dashboard grouping\nCREATE TABLE `busi_group` (\n `id` bigint unsigned not null auto_increment,\n `name` varchar(191) not null,\n `label_enable` tinyint(1) not null default 0,\n `label_value` varchar(191) not null default '' comment 'if label_enable: label_value can not be blank',\n `create_at` bigint not null default 0,\n `create_by` varchar(64) not null default '',\n `update_at` bigint not null default 0,\n `update_by` varchar(64) not null default '',\n PRIMARY KEY (`id`),\n UNIQUE KEY (`name`)\n) ENGINE = InnoDB DEFAULT CHARSET = utf8mb4;\n\ninsert into busi_group(id, name, create_at, create_by, update_at, update_by) values(1, 'Default Busi Group', unix_timestamp(now()), 'root', unix_timestamp(now()), 'root');\n\nCREATE TABLE `busi_group_member` (\n `id` bigint unsigned not null auto_increment,\n `busi_group_id` bigint not null comment 'busi group id',\n `user_group_id` bigint not null comment 'user group id',\n `perm_flag` char(2) not null comment 'ro | rw',\n PRIMARY KEY (`id`),\n KEY (`busi_group_id`),\n KEY (`user_group_id`)\n) ENGINE = InnoDB DEFAULT CHARSET = utf8mb4;\n\ninsert into busi_group_member(busi_group_id, user_group_id, perm_flag) values(1, 1, 'rw');\n\n-- for dashboard new version\nCREATE TABLE `board` (\n `id` bigint unsigned not null auto_increment,\n `group_id` bigint not null default 0 comment 'busi group id',\n `name` varchar(191) not null,\n `ident` varchar(200) not null default '',\n `tags` varchar(255) not null comment 'split by space',\n `public` tinyint(1) not null default 0 comment '0:false 1:true',\n `built_in` tinyint(1) not null default 0 comment '0:false 1:true',\n `hide` tinyint(1) not null default 0 comment '0:false 1:true',\n `create_at` bigint not null default 0,\n `create_by` varchar(64) not null default '',\n `update_at` bigint not null default 0,\n `update_by` varchar(64) not null default '',\n `note` varchar(1024) not null default '' comment 'note',\n `public_cate` bigint NOT NULL NOT NULL DEFAULT 0 COMMENT '0 anonymous 1 login 2 busi',\n PRIMARY KEY (`id`),\n UNIQUE KEY (`group_id`, `name`),\n KEY(`ident`)\n) ENGINE = InnoDB DEFAULT CHARSET = utf8mb4;\n\n-- for dashboard new version\nCREATE TABLE `board_payload` (\n `id` bigint unsigned not null comment 'dashboard id',\n `payload` mediumtext not null,\n UNIQUE KEY (`id`)\n) ENGINE = InnoDB DEFAULT CHARSET = utf8mb4;\n\n-- deprecated\nCREATE TABLE `dashboard` (\n `id` bigint unsigned not null auto_increment,\n `group_id` bigint not null default 0 comment 'busi group id',\n `name` varchar(191) not null,\n `tags` varchar(255) not null comment 'split by space',\n `configs` varchar(8192) comment 'dashboard variables',\n `create_at` bigint not null default 0,\n `create_by` varchar(64) not null default '',\n `update_at` bigint not null default 0,\n `update_by` varchar(64) not null default '',\n PRIMARY KEY (`id`),\n UNIQUE KEY (`group_id`, `name`)\n) ENGINE = InnoDB DEFAULT CHARSET = utf8mb4;\n\n-- deprecated\n-- auto create the first subclass 'Default chart group' of dashboard\nCREATE TABLE `chart_group` (\n `id` bigint unsigned not null auto_increment,\n `dashboard_id` bigint unsigned not null,\n `name` varchar(255) not null,\n `weight` int not null default 0,\n PRIMARY KEY (`id`),\n KEY (`dashboard_id`)\n) ENGINE = InnoDB DEFAULT CHARSET = utf8mb4;\n\n-- deprecated\nCREATE TABLE `chart` (\n `id` bigint unsigned not null auto_increment,\n `group_id` bigint unsigned not null comment 'chart group id',\n `configs` text,\n `weight` int not null default 0,\n PRIMARY KEY (`id`),\n KEY (`group_id`)\n) ENGINE = InnoDB DEFAULT CHARSET = utf8mb4;\n\nCREATE TABLE `chart_share` (\n `id` bigint unsigned not null auto_increment,\n `cluster` varchar(128) not null,\n `datasource_id` bigint NOT NULL NOT NULL DEFAULT 0 COMMENT 'datasource id',\n `configs` text,\n `create_at` bigint not null default 0,\n `create_by` varchar(64) not null default '',\n primary key (`id`),\n key (`create_at`)\n) ENGINE = InnoDB DEFAULT CHARSET = utf8mb4;\n\nCREATE TABLE `alert_rule` (\n `id` bigint unsigned not null auto_increment,\n `group_id` bigint not null default 0 comment 'busi group id',\n `cate` varchar(128) not null,\n `datasource_ids` varchar(255) not null default '' comment 'datasource ids',\n `cluster` varchar(128) not null,\n `name` varchar(255) not null,\n `note` varchar(1024) not null default '',\n `prod` varchar(255) not null default '',\n `algorithm` varchar(255) not null default '',\n `algo_params` varchar(255),\n `delay` int not null default 0,\n `severity` tinyint(1) not null comment '1:Emergency 2:Warning 3:Notice',\n `disabled` tinyint(1) not null comment '0:enabled 1:disabled',\n `prom_for_duration` int not null comment 'prometheus for, unit:s',\n `rule_config` text not null comment 'rule_config',\n `prom_ql` text not null comment 'promql',\n `prom_eval_interval` int not null comment 'evaluate interval',\n `enable_stime` varchar(255) not null default '00:00',\n `enable_etime` varchar(255) not null default '23:59',\n `enable_days_of_week` varchar(255) not null default '' comment 'split by space: 0 1 2 3 4 5 6',\n `enable_in_bg` tinyint(1) not null default 0 comment '1: only this bg 0: global',\n `notify_recovered` tinyint(1) not null comment 'whether notify when recovery',\n `notify_channels` varchar(255) not null default '' comment 'split by space: sms voice email dingtalk wecom',\n `notify_groups` varchar(255) not null default '' comment 'split by space: 233 43',\n `notify_repeat_step` int not null default 0 comment 'unit: min',\n `notify_max_number` int not null default 0 comment '',\n `recover_duration` int not null default 0 comment 'unit: s',\n `callbacks` varchar(4096) not null default '' comment 'split by space: http://a.com/api/x http://a.com/api/y',\n `runbook_url` varchar(4096),\n `append_tags` varchar(255) not null default '' comment 'split by space: service=n9e mod=api',\n `annotations` text not null comment 'annotations',\n `extra_config` text,\n `notify_rule_ids` varchar(1024) DEFAULT '',\n `notify_version` int DEFAULT 0,\n `create_at` bigint not null default 0,\n `create_by` varchar(64) not null default '',\n `update_at` bigint not null default 0,\n `update_by` varchar(64) not null default '',\n `cron_pattern` varchar(64),\n `time_zone` varchar(64) not null default '',\n `datasource_queries` text,\n PRIMARY KEY (`id`),\n KEY (`group_id`),\n KEY (`update_at`)\n) ENGINE=InnoDB DEFAULT CHARSET = utf8mb4;\n\nCREATE TABLE `alert_mute` (\n `id` bigint unsigned not null auto_increment,\n `group_id` bigint not null default 0 comment 'busi group id',\n `prod` varchar(255) not null default '',\n `note` varchar(1024) not null default '',\n `cate` varchar(128) not null,\n `cluster` varchar(128) not null,\n `datasource_ids` varchar(255) not null default '' comment 'datasource ids',\n `tags` varchar(4096) default '[]' comment 'json,map,tagkey->regexp|value',\n `cause` varchar(255) not null default '',\n `btime` bigint not null default 0 comment 'begin time',\n `etime` bigint not null default 0 comment 'end time',\n `disabled` tinyint(1) not null default 0 comment '0:enabled 1:disabled',\n `mute_time_type` tinyint(1) not null default 0,\n `periodic_mutes` varchar(4096) not null default '',\n `severities` varchar(32) not null default '',\n `create_at` bigint not null default 0,\n `create_by` varchar(64) not null default '',\n `update_at` bigint not null default 0,\n `update_by` varchar(64) not null default '',\n PRIMARY KEY (`id`),\n KEY (`create_at`),\n KEY (`group_id`)\n) ENGINE = InnoDB DEFAULT CHARSET = utf8mb4;\n\nCREATE TABLE `alert_subscribe` (\n `id` bigint unsigned not null auto_increment,\n `name` varchar(255) not null default '',\n `disabled` tinyint(1) not null default 0 comment '0:enabled 1:disabled',\n `group_id` bigint not null default 0 comment 'busi group id',\n `prod` varchar(255) not null default '',\n `cate` varchar(128) not null,\n `datasource_ids` varchar(255) not null default '' comment 'datasource ids',\n `cluster` varchar(128) not null,\n `rule_id` bigint not null default 0,\n `rule_ids` varchar(1024),\n `severities` varchar(32) not null default '',\n `tags` varchar(4096) not null default '' comment 'json,map,tagkey->regexp|value',\n `redefine_severity` tinyint(1) default 0 comment 'is redefine severity?',\n `new_severity` tinyint(1) not null comment '0:Emergency 1:Warning 2:Notice',\n `redefine_channels` tinyint(1) default 0 comment 'is redefine channels?',\n `new_channels` varchar(255) not null default '' comment 'split by space: sms voice email dingtalk wecom',\n `user_group_ids` varchar(250) not null comment 'split by space 1 34 5, notify cc to user_group_ids',\n `busi_groups` varchar(4096),\n `note` VARCHAR(1024) DEFAULT '' COMMENT 'note',\n `webhooks` text not null,\n `extra_config` text,\n `redefine_webhooks` tinyint(1) default 0,\n `for_duration` bigint not null default 0,\n `notify_rule_ids` varchar(1024) DEFAULT '',\n `notify_version` int DEFAULT 0,\n `create_at` bigint not null default 0,\n `create_by` varchar(64) not null default '',\n `update_at` bigint not null default 0,\n `update_by` varchar(64) not null default '',\n PRIMARY KEY (`id`),\n KEY (`update_at`),\n KEY (`group_id`)\n) ENGINE = InnoDB DEFAULT CHARSET = utf8mb4;\n\nCREATE TABLE `target` (\n `id` bigint unsigned not null auto_increment,\n `group_id` bigint not null default 0 comment 'busi group id',\n `ident` varchar(191) not null comment 'target id',\n `note` varchar(255) not null default '' comment 'append to alert event as field',\n `tags` varchar(512) not null default '' comment 'append to series data as tags, split by space, append external space at suffix',\n `host_tags` text COMMENT 'global labels set in conf file',\n `host_ip` varchar(15) default '' COMMENT 'IPv4 string',\n `agent_version` varchar(255) default '' COMMENT 'agent version',\n `engine_name` varchar(255) DEFAULT '' COMMENT 'engine name',\n `os` VARCHAR(31) DEFAULT '' COMMENT 'os type',\n `update_at` bigint not null default 0,\n PRIMARY KEY (`id`),\n UNIQUE KEY (`ident`),\n KEY (`group_id`),\n INDEX `idx_host_ip` (`host_ip`),\n INDEX `idx_agent_version` (`agent_version`),\n INDEX `idx_engine_name` (`engine_name`),\n INDEX `idx_os` (`os`)\n) ENGINE = InnoDB DEFAULT CHARSET = utf8mb4;\n\n\nCREATE TABLE `metric_view` (\n `id` bigint unsigned not null auto_increment,\n `name` varchar(191) not null default '',\n `cate` tinyint(1) not null comment '0: preset 1: custom',\n `configs` varchar(8192) not null default '',\n `create_at` bigint not null default 0,\n `create_by` bigint not null default 0 comment 'user id',\n `update_at` bigint not null default 0,\n PRIMARY KEY (`id`),\n KEY (`create_by`)\n) ENGINE=InnoDB DEFAULT CHARSET = utf8mb4;\n\ninsert into metric_view(name, cate, configs) values('Host View', 0, '{\"filters\":[{\"oper\":\"=\",\"label\":\"__name__\",\"value\":\"cpu_usage_idle\"}],\"dynamicLabels\":[],\"dimensionLabels\":[{\"label\":\"ident\",\"value\":\"\"}]}');\n\nCREATE TABLE `recording_rule` (\n `id` bigint unsigned not null auto_increment,\n `group_id` bigint not null default '0' comment 'group_id',\n `datasource_ids` varchar(255) not null default '' comment 'datasource ids',\n `cluster` varchar(128) not null,\n `name` varchar(255) not null comment 'new metric name',\n `note` varchar(255) not null comment 'rule note',\n `disabled` tinyint(1) not null default 0 comment '0:enabled 1:disabled',\n `prom_ql` varchar(8192) not null comment 'promql',\n `prom_eval_interval` int not null comment 'evaluate interval',\n `cron_pattern` varchar(255) default '' comment 'cron pattern',\n `append_tags` varchar(255) default '' comment 'split by space: service=n9e mod=api',\n `query_configs` text NOT NULL,\n `create_at` bigint default '0',\n `create_by` varchar(64) default '',\n `update_at` bigint default '0',\n `update_by` varchar(64) default '',\n `datasource_queries` text,\n PRIMARY KEY (`id`),\n KEY `group_id` (`group_id`),\n KEY `update_at` (`update_at`)\n) ENGINE=InnoDB DEFAULT CHARSET = utf8mb4;\n\nCREATE TABLE `alert_aggr_view` (\n `id` bigint unsigned not null auto_increment,\n `name` varchar(191) not null default '',\n `rule` varchar(2048) not null default '',\n `cate` tinyint(1) not null comment '0: preset 1: custom',\n `create_at` bigint not null default 0,\n `create_by` bigint not null default 0 comment 'user id',\n `update_at` bigint not null default 0,\n PRIMARY KEY (`id`),\n KEY (`create_by`)\n) ENGINE=InnoDB DEFAULT CHARSET = utf8mb4;\n\ninsert into alert_aggr_view(name, rule, cate) values('By BusiGroup, Severity', 'field:group_name::field:severity', 0);\ninsert into alert_aggr_view(name, rule, cate) values('By RuleName', 'field:rule_name', 0);\n\nCREATE TABLE `alert_cur_event` (\n `id` bigint unsigned not null comment 'use alert_his_event.id',\n `cate` varchar(128) not null,\n `datasource_id` bigint not null default 0 comment 'datasource id',\n `cluster` varchar(128) not null,\n `group_id` bigint unsigned not null comment 'busi group id of rule',\n `group_name` varchar(255) not null default '' comment 'busi group name',\n `hash` varchar(64) not null comment 'rule_id + vector_pk',\n `rule_id` bigint unsigned not null,\n `rule_name` varchar(255) not null,\n `rule_note` varchar(2048) not null default 'alert rule note',\n `rule_prod` varchar(255) not null default '',\n `rule_algo` varchar(255) not null default '',\n `severity` tinyint(1) not null comment '0:Emergency 1:Warning 2:Notice',\n `prom_for_duration` int not null comment 'prometheus for, unit:s',\n `prom_ql` varchar(8192) not null comment 'promql',\n `prom_eval_interval` int not null comment 'evaluate interval',\n `callbacks` varchar(2048) not null default '' comment 'split by space: http://a.com/api/x http://a.com/api/y',\n `runbook_url` varchar(255),\n `notify_recovered` tinyint(1) not null comment 'whether notify when recovery',\n `notify_channels` varchar(255) not null default '' comment 'split by space: sms voice email dingtalk wecom',\n `notify_groups` varchar(255) not null default '' comment 'split by space: 233 43',\n `notify_repeat_next` bigint not null default 0 comment 'next timestamp to notify, get repeat settings from rule',\n `notify_cur_number` int not null default 0 comment '',\n `target_ident` varchar(191) not null default '' comment 'target ident, also in tags',\n `target_note` varchar(191) not null default '' comment 'target note',\n `first_trigger_time` bigint,\n `trigger_time` bigint not null,\n `trigger_value` text not null,\n `annotations` text not null comment 'annotations',\n `rule_config` text not null comment 'annotations',\n `tags` varchar(1024) not null default '' comment 'merge data_tags rule_tags, split by ,,',\n `original_tags` text comment 'labels key=val,,k2=v2',\n `notify_rule_ids` text COMMENT 'notify rule ids',\n PRIMARY KEY (`id`),\n KEY (`hash`),\n KEY (`rule_id`),\n KEY (`trigger_time`, `group_id`),\n KEY (`notify_repeat_next`)\n) ENGINE=InnoDB DEFAULT CHARSET = utf8mb4;\n\nCREATE TABLE `alert_his_event` (\n `id` bigint unsigned not null AUTO_INCREMENT,\n `is_recovered` tinyint(1) not null,\n `cate` varchar(128) not null,\n `datasource_id` bigint not null default 0 comment 'datasource id',\n `cluster` varchar(128) not null,\n `group_id` bigint unsigned not null comment 'busi group id of rule',\n `group_name` varchar(255) not null default '' comment 'busi group name',\n `hash` varchar(64) not null comment 'rule_id + vector_pk',\n `rule_id` bigint unsigned not null,\n `rule_name` varchar(255) not null,\n `rule_note` varchar(2048) not null default 'alert rule note',\n `rule_prod` varchar(255) not null default '',\n `rule_algo` varchar(255) not null default '',\n `severity` tinyint(1) not null comment '0:Emergency 1:Warning 2:Notice',\n `prom_for_duration` int not null comment 'prometheus for, unit:s',\n `prom_ql` varchar(8192) not null comment 'promql',\n `prom_eval_interval` int not null comment 'evaluate interval',\n `callbacks` varchar(2048) not null default '' comment 'split by space: http://a.com/api/x http://a.com/api/y',\n `runbook_url` varchar(255),\n `notify_recovered` tinyint(1) not null comment 'whether notify when recovery',\n `notify_channels` varchar(255) not null default '' comment 'split by space: sms voice email dingtalk wecom',\n `notify_groups` varchar(255) not null default '' comment 'split by space: 233 43',\n `notify_cur_number` int not null default 0 comment '',\n `target_ident` varchar(191) not null default '' comment 'target ident, also in tags',\n `target_note` varchar(191) not null default '' comment 'target note',\n `first_trigger_time` bigint,\n `trigger_time` bigint not null,\n `trigger_value` text not null,\n `recover_time` bigint not null default 0,\n `last_eval_time` bigint not null default 0 comment 'for time filter',\n `tags` varchar(1024) not null default '' comment 'merge data_tags rule_tags, split by ,,',\n `original_tags` text comment 'labels key=val,,k2=v2',\n `annotations` text not null comment 'annotations',\n `rule_config` text not null comment 'annotations',\n `notify_rule_ids` text COMMENT 'notify rule ids',\n PRIMARY KEY (`id`),\n INDEX `idx_last_eval_time` (`last_eval_time`),\n KEY (`hash`),\n KEY (`rule_id`),\n KEY (`trigger_time`, `group_id`)\n) ENGINE=InnoDB DEFAULT CHARSET = utf8mb4;\n\nCREATE TABLE `board_busigroup` (\n `busi_group_id` bigint(20) NOT NULL DEFAULT '0' COMMENT 'busi group id',\n `board_id` bigint(20) NOT NULL DEFAULT '0' COMMENT 'board id',\n PRIMARY KEY (`busi_group_id`, `board_id`)\n) ENGINE=InnoDB DEFAULT CHARSET=utf8mb4;\n\nCREATE TABLE `builtin_components` (\n `id` bigint UNSIGNED NOT NULL AUTO_INCREMENT COMMENT 'unique identifier',\n `ident` varchar(191) NOT NULL,\n `logo` mediumtext COMMENT '''logo of component''',\n `readme` text NOT NULL COMMENT '''readme of component''',\n `created_at` bigint NOT NULL DEFAULT 0 COMMENT '''create time''',\n `created_by` varchar(191) NOT NULL DEFAULT '' COMMENT '''creator''',\n `updated_at` bigint NOT NULL DEFAULT 0 COMMENT '''update time''',\n `updated_by` varchar(191) NOT NULL DEFAULT '' COMMENT '''updater''',\n `disabled` int NOT NULL DEFAULT 0 COMMENT '''is disabled or not''',\n PRIMARY KEY (`id`),\n KEY (`ident`)\n) ENGINE=InnoDB DEFAULT CHARSET=utf8mb4;\n\nCREATE TABLE `builtin_payloads` (\n `id` bigint(20) NOT NULL AUTO_INCREMENT COMMENT '''unique identifier''',\n `component_id` bigint NOT NULL DEFAULT 0 COMMENT '''component_id of payload''',\n `uuid` bigint(20) NOT NULL COMMENT '''uuid of payload''',\n `type` varchar(191) NOT NULL COMMENT '''type of payload''',\n `component` varchar(191) NOT NULL COMMENT '''component of payload''',\n `cate` varchar(191) NOT NULL COMMENT '''category of payload''',\n `name` varchar(191) NOT NULL COMMENT '''name of payload''',\n `tags` varchar(191) NOT NULL DEFAULT '' COMMENT '''tags of payload''',\n `content` longtext NOT NULL COMMENT '''content of payload''',\n `note` varchar(1024) NOT NULL DEFAULT '' COMMENT '''note of payload''',\n `created_at` bigint(20) NOT NULL DEFAULT 0 COMMENT '''create time''',\n `created_by` varchar(191) NOT NULL DEFAULT '' COMMENT '''creator''',\n `updated_at` bigint(20) NOT NULL DEFAULT 0 COMMENT '''update time''',\n `updated_by` varchar(191) NOT NULL DEFAULT '' COMMENT '''updater''',\n PRIMARY KEY (`id`),\n KEY `idx_component` (`component`),\n KEY `idx_name` (`name`),\n KEY `idx_cate` (`cate`),\n KEY `idx_uuid` (`uuid`),\n KEY `idx_type` (`type`)\n) ENGINE=InnoDB DEFAULT CHARSET=utf8mb4;\n\nCREATE TABLE notification_record (\n `id` BIGINT PRIMARY KEY AUTO_INCREMENT,\n `notify_rule_id` BIGINT NOT NULL DEFAULT 0,\n `event_id` bigint NOT NULL COMMENT 'event history id',\n `sub_id` bigint COMMENT 'subscribed rule id',\n `channel` varchar(255) NOT NULL COMMENT 'notification channel name',\n `status` bigint COMMENT 'notification status',\n `target` varchar(1024) NOT NULL COMMENT 'notification target',\n `details` varchar(2048) DEFAULT '' COMMENT 'notification other info',\n `created_at` bigint NOT NULL COMMENT 'create time',\n INDEX idx_evt (event_id)\n) ENGINE=InnoDB DEFAULT CHARSET=utf8mb4;\n\nCREATE TABLE `task_tpl`\n(\n `id` int unsigned NOT NULL AUTO_INCREMENT,\n `group_id` int unsigned not null comment 'busi group id',\n `title` varchar(255) not null default '',\n `account` varchar(64) not null,\n `batch` int unsigned not null default 0,\n `tolerance` int unsigned not null default 0,\n `timeout` int unsigned not null default 0,\n `pause` varchar(255) not null default '',\n `script` text not null,\n `args` varchar(512) not null default '',\n `tags` varchar(255) not null default '' comment 'split by space',\n `create_at` bigint not null default 0,\n `create_by` varchar(64) not null default '',\n `update_at` bigint not null default 0,\n `update_by` varchar(64) not null default '',\n PRIMARY KEY (`id`),\n KEY (`group_id`)\n) ENGINE = InnoDB DEFAULT CHARSET = utf8mb4;\n\nCREATE TABLE `task_tpl_host`\n(\n `ii` int unsigned NOT NULL AUTO_INCREMENT,\n `id` int unsigned not null comment 'task tpl id',\n `host` varchar(128) not null comment 'ip or hostname',\n PRIMARY KEY (`ii`),\n KEY (`id`, `host`)\n) ENGINE = InnoDB DEFAULT CHARSET = utf8mb4;\n\nCREATE TABLE `task_record`\n(\n `id` bigint unsigned not null comment 'ibex task id',\n `event_id` bigint not null comment 'event id' default 0,\n `group_id` bigint not null comment 'busi group id',\n `ibex_address` varchar(128) not null,\n `ibex_auth_user` varchar(128) not null default '',\n `ibex_auth_pass` varchar(128) not null default '',\n `title` varchar(255) not null default '',\n `account` varchar(64) not null,\n `batch` int unsigned not null default 0,\n `tolerance` int unsigned not null default 0,\n `timeout` int unsigned not null default 0,\n `pause` varchar(255) not null default '',\n `script` text not null,\n `args` varchar(512) not null default '',\n `create_at` bigint not null default 0,\n `create_by` varchar(64) not null default '',\n PRIMARY KEY (`id`),\n KEY (`create_at`, `group_id`),\n KEY (`create_by`),\n INDEX `idx_event_id` (`event_id`)\n) ENGINE = InnoDB DEFAULT CHARSET = utf8mb4;\n\nCREATE TABLE `alerting_engines`\n(\n `id` int unsigned NOT NULL AUTO_INCREMENT,\n `instance` varchar(128) not null default '' comment 'instance identification, e.g. 10.9.0.9:9090',\n `datasource_id` bigint not null default 0 comment 'datasource id',\n `engine_cluster` varchar(128) not null default '' comment 'n9e-alert cluster',\n `clock` bigint not null,\n PRIMARY KEY (`id`),\n INDEX `idx_inst` (`instance`),\n INDEX `idx_clock` (`clock`)\n) ENGINE = InnoDB DEFAULT CHARSET = utf8mb4;\n\nCREATE TABLE `datasource`\n(\n `id` int unsigned NOT NULL AUTO_INCREMENT,\n `name` varchar(191) not null default '',\n `identifier` varchar(255) not null default '',\n `description` varchar(255) not null default '',\n `category` varchar(255) not null default '',\n `plugin_id` int unsigned not null default 0,\n `plugin_type` varchar(255) not null default '',\n `plugin_type_name` varchar(255) not null default '',\n `cluster_name` varchar(255) not null default '',\n `settings` text not null,\n `status` varchar(255) not null default '',\n `http` varchar(4096) not null default '',\n `auth` varchar(8192) not null default '',\n `is_default` boolean COMMENT 'is default datasource',\n `weight` int not null default 0,\n `created_at` bigint not null default 0,\n `created_by` varchar(64) not null default '',\n `updated_at` bigint not null default 0,\n `updated_by` varchar(64) not null default '',\n UNIQUE KEY (`name`),\n PRIMARY KEY (`id`)\n) ENGINE = InnoDB DEFAULT CHARSET = utf8mb4;\n\nCREATE TABLE `builtin_cate` (\n `id` bigint unsigned not null auto_increment,\n `name` varchar(191) not null,\n `user_id` bigint not null default 0,\n PRIMARY KEY (`id`)\n) ENGINE = InnoDB DEFAULT CHARSET = utf8mb4;\n\nCREATE TABLE `notify_tpl` (\n `id` bigint unsigned not null auto_increment,\n `channel` varchar(32) not null,\n `name` varchar(255) not null,\n `content` text not null,\n `create_at` bigint DEFAULT 0 COMMENT 'create_at',\n `create_by` varchar(64) DEFAULT '' COMMENT 'create_by',\n `update_at` bigint DEFAULT 0 COMMENT 'update_at',\n `update_by` varchar(64) DEFAULT '' COMMENT 'update_by',\n PRIMARY KEY (`id`),\n UNIQUE KEY (`channel`)\n) ENGINE = InnoDB DEFAULT CHARSET = utf8mb4;\n\nCREATE TABLE `sso_config` (\n `id` bigint unsigned not null auto_increment,\n `name` varchar(191) not null,\n `content` text not null,\n `update_at` bigint DEFAULT 0 COMMENT 'update_at',\n PRIMARY KEY (`id`),\n UNIQUE KEY (`name`)\n) ENGINE = InnoDB DEFAULT CHARSET = utf8mb4;\n\nCREATE TABLE `es_index_pattern` (\n `id` bigint unsigned not null auto_increment,\n `datasource_id` bigint not null default 0 comment 'datasource id',\n `name` varchar(191) not null,\n `time_field` varchar(128) not null default '@timestamp',\n `allow_hide_system_indices` tinyint(1) not null default 0,\n `fields_format` varchar(4096) not null default '',\n `cross_cluster_enabled` int not null default 0,\n `note` varchar(1024) not null default '',\n `create_at` bigint default '0',\n `create_by` varchar(64) default '',\n `update_at` bigint default '0',\n `update_by` varchar(64) default '',\n PRIMARY KEY (`id`),\n UNIQUE KEY (`datasource_id`, `name`)\n) ENGINE = InnoDB DEFAULT CHARSET = utf8mb4;\n\n\nCREATE TABLE `builtin_metrics` (\n `id` bigint unsigned NOT NULL AUTO_INCREMENT COMMENT 'unique identifier',\n `collector` varchar(191) NOT NULL COMMENT '''type of collector''',\n `typ` varchar(191) NOT NULL COMMENT '''type of metric''',\n `name` varchar(191) NOT NULL COMMENT '''name of metric''',\n `unit` varchar(191) NOT NULL COMMENT '''unit of metric''',\n `lang` varchar(191) NOT NULL DEFAULT 'zh' COMMENT '''language''',\n `note` varchar(4096) NOT NULL COMMENT '''description of metric''',\n `expression` varchar(4096) NOT NULL COMMENT '''expression of metric''',\n `expression_type` varchar(32) NOT NULL DEFAULT 'promql' COMMENT '''expression type: metric_name or promql''',\n `metric_type` varchar(191) NOT NULL DEFAULT '' COMMENT '''metric type like counter/gauge''',\n `extra_fields` text COMMENT '''custom extra fields''',\n `created_at` bigint NOT NULL DEFAULT 0 COMMENT '''create time''',\n `created_by` varchar(191) NOT NULL DEFAULT '' COMMENT '''creator''',\n `updated_at` bigint NOT NULL DEFAULT 0 COMMENT '''update time''',\n `updated_by` varchar(191) NOT NULL DEFAULT '' COMMENT '''updater''',\n `uuid` bigint NOT NULL DEFAULT 0 COMMENT '''uuid''',\n PRIMARY KEY (`id`),\n INDEX `idx_uuid` (`uuid`),\n INDEX `idx_collector` (`collector`),\n INDEX `idx_typ` (`typ`),\n INDEX `idx_builtinmetric_name` (`name` ASC),\n INDEX `idx_lang` (`lang`)\n) ENGINE=InnoDB DEFAULT CHARSET=utf8mb4;\n\nCREATE TABLE `metric_filter` (\n `id` bigint NOT NULL AUTO_INCREMENT COMMENT 'unique identifier',\n `name` varchar(191) NOT NULL COMMENT '''name of metric filter''',\n `configs` varchar(4096) NOT NULL COMMENT '''configuration of metric filter''',\n `groups_perm` text,\n `create_at` bigint NOT NULL DEFAULT 0 COMMENT '''create time''',\n `create_by` varchar(191) NOT NULL DEFAULT '' COMMENT '''creator''',\n `update_at` bigint NOT NULL DEFAULT 0 COMMENT '''update time''',\n `update_by` varchar(191) NOT NULL DEFAULT '' COMMENT '''updater''',\n PRIMARY KEY (`id`),\n INDEX `idx_metricfilter_name` (`name` ASC)\n) ENGINE=InnoDB DEFAULT CHARSET=utf8mb4;\n\nCREATE TABLE `target_busi_group` (\n `id` bigint NOT NULL AUTO_INCREMENT,\n `target_ident` varchar(191) NOT NULL,\n `group_id` bigint NOT NULL,\n `update_at` bigint NOT NULL,\n PRIMARY KEY (`id`),\n UNIQUE KEY `idx_target_group` (`target_ident`,`group_id`)\n) ENGINE=InnoDB DEFAULT CHARSET=utf8mb4;\n\n\nCREATE TABLE `dash_annotation` (\n `id` bigint unsigned not null auto_increment,\n `dashboard_id` bigint not null comment 'dashboard id',\n `panel_id` varchar(191) not null comment 'panel id',\n `tags` text comment 'tags array json string',\n `description` text comment 'annotation description',\n `config` text comment 'annotation config',\n `time_start` bigint not null default 0 comment 'start timestamp',\n `time_end` bigint not null default 0 comment 'end timestamp',\n `create_at` bigint not null default 0 comment 'create time',\n `create_by` varchar(64) not null default '' comment 'creator',\n `update_at` bigint not null default 0 comment 'update time',\n `update_by` varchar(64) not null default '' comment 'updater',\n PRIMARY KEY (`id`),\n KEY `idx_dashboard_id` (`dashboard_id`)\n) ENGINE=InnoDB DEFAULT CHARSET=utf8mb4;\n\nCREATE TABLE `user_token` (\n `id` bigint NOT NULL AUTO_INCREMENT,\n `username` varchar(255) NOT NULL DEFAULT '',\n `token_name` varchar(255) NOT NULL DEFAULT '',\n `token` varchar(255) NOT NULL DEFAULT '',\n `create_at` bigint NOT NULL DEFAULT 0,\n `last_used` bigint NOT NULL DEFAULT 0,\n PRIMARY KEY (`id`)\n) ENGINE=InnoDB DEFAULT CHARSET=utf8mb4;\n\n\nCREATE TABLE `notify_rule` (\n `id` bigint unsigned not null auto_increment,\n `name` varchar(255) not null,\n `description` text,\n `enable` tinyint(1) not null default 0,\n `user_group_ids` varchar(255) not null default '',\n `notify_configs` text,\n `pipeline_configs` text,\n `create_at` bigint not null default 0,\n `create_by` varchar(64) not null default '',\n `update_at` bigint not null default 0,\n `update_by` varchar(64) not null default '',\n PRIMARY KEY (`id`)\n) ENGINE = InnoDB DEFAULT CHARSET = utf8mb4;\n\nCREATE TABLE `notify_channel` (\n `id` bigint unsigned not null auto_increment,\n `name` varchar(255) not null,\n `ident` varchar(255) not null,\n `description` text, \n `enable` tinyint(1) not null default 0,\n `param_config` text,\n `request_type` varchar(50) not null,\n `request_config` text,\n `weight` int not null default 0,\n `create_at` bigint not null default 0,\n `create_by` varchar(64) not null default '',\n `update_at` bigint not null default 0,\n `update_by` varchar(64) not null default '',\n PRIMARY KEY (`id`)\n) ENGINE = InnoDB DEFAULT CHARSET = utf8mb4;\n\nCREATE TABLE `message_template` (\n `id` bigint unsigned not null auto_increment,\n `name` varchar(64) not null,\n `ident` varchar(64) not null,\n `content` text,\n `user_group_ids` varchar(64),\n `notify_channel_ident` varchar(64) not null default '',\n `private` int not null default 0,\n `weight` int not null default 0,\n `create_at` bigint not null default 0,\n `create_by` varchar(64) not null default '',\n `update_at` bigint not null default 0,\n `update_by` varchar(64) not null default '',\n PRIMARY KEY (`id`)\n) ENGINE = InnoDB DEFAULT CHARSET = utf8mb4;\n\nCREATE TABLE `event_pipeline` (\n `id` bigint unsigned not null auto_increment,\n `name` varchar(128) not null,\n `team_ids` text,\n `description` varchar(255) not null default '',\n `filter_enable` tinyint(1) not null default 0,\n `label_filters` text,\n `attr_filters` text,\n `processor_configs` text,\n `create_at` bigint not null default 0,\n `create_by` varchar(64) not null default '',\n `update_at` bigint not null default 0,\n `update_by` varchar(64) not null default '',\n PRIMARY KEY (`id`)\n) ENGINE = InnoDB DEFAULT CHARSET = utf8mb4;\n\nCREATE TABLE `embedded_product` (\n `id` bigint unsigned NOT NULL AUTO_INCREMENT,\n `name` varchar(255) DEFAULT NULL,\n `url` varchar(255) DEFAULT NULL,\n `is_private` boolean DEFAULT NULL,\n `team_ids` varchar(255),\n `create_at` bigint not null default 0,\n `create_by` varchar(64) not null default '',\n `update_at` bigint not null default 0,\n `update_by` varchar(64) not null default '',\n PRIMARY KEY (`id`)\n) ENGINE=InnoDB DEFAULT CHARSET=utf8mb4;\n\nCREATE TABLE `task_meta`\n(\n `id` bigint unsigned NOT NULL AUTO_INCREMENT,\n `title` varchar(255) not null default '',\n `account` varchar(64) not null,\n `batch` bigint not null default 0,\n `tolerance` bigint not null default 0,\n `timeout` bigint not null default 0,\n `pause` varchar(255) not null default '',\n `script` text not null,\n `args` varchar(512) not null default '',\n `stdin` varchar(1024) not null default '',\n `creator` varchar(64) not null default '',\n `created` timestamp not null default CURRENT_TIMESTAMP,\n PRIMARY KEY (`id`),\n KEY `idx_task_meta_creator` (`creator`),\n KEY `idx_task_meta_created` (`created`)\n) ENGINE = InnoDB\n DEFAULT CHARSET = utf8mb4;\n\n/* start|cancel|kill|pause */\nCREATE TABLE `task_action`\n(\n `id` bigint unsigned not null,\n `action` varchar(32) not null,\n `clock` bigint not null default 0,\n PRIMARY KEY (`id`)\n) ENGINE = InnoDB\n DEFAULT CHARSET = utf8mb4;\n\nCREATE TABLE `task_scheduler`\n(\n `id` bigint unsigned not null,\n `scheduler` varchar(128) not null default '',\n KEY (`id`, `scheduler`)\n) ENGINE = InnoDB\n DEFAULT CHARSET = utf8mb4;\n\nCREATE TABLE `task_scheduler_health`\n(\n `scheduler` varchar(128) NOT NULL,\n `clock` bigint not null,\n UNIQUE KEY `idx_task_scheduler_health_scheduler` (`scheduler`),\n KEY (`clock`)\n) ENGINE = InnoDB\n DEFAULT CHARSET = utf8mb4;\n\nCREATE TABLE `task_host_doing`\n(\n `id` bigint unsigned not null,\n `host` varchar(128) not null,\n `clock` bigint not null default 0,\n `action` varchar(16) not null,\n KEY `idx_task_host_doing_id` (`id`),\n KEY `idx_task_host_doing_host` (`host`)\n) ENGINE = InnoDB\n DEFAULT CHARSET = utf8mb4;\n\nCREATE TABLE task_host_0\n(\n `ii` bigint unsigned NOT NULL AUTO_INCREMENT,\n `id` bigint unsigned not null,\n `host` varchar(128) not null,\n `status` varchar(32) not null,\n `stdout` text,\n `stderr` text,\n UNIQUE KEY `idx_id_host` (`id`, `host`),\n PRIMARY KEY (`ii`)\n) ENGINE = InnoDB\n DEFAULT CHARSET = utf8mb4;\n\nCREATE TABLE task_host_1\n(\n `ii` bigint unsigned NOT NULL AUTO_INCREMENT,\n `id` bigint unsigned not null,\n `host` varchar(128) not null,\n `status` varchar(32) not null,\n `stdout` text,\n `stderr` text,\n UNIQUE KEY `idx_id_host` (`id`, `host`),\n PRIMARY KEY (`ii`)\n) ENGINE = InnoDB\n DEFAULT CHARSET = utf8mb4;\n\nCREATE TABLE task_host_2\n(\n `ii` bigint unsigned NOT NULL AUTO_INCREMENT,\n `id` bigint unsigned not null,\n `host` varchar(128) not null,\n `status` varchar(32) not null,\n `stdout` text,\n `stderr` text,\n UNIQUE KEY `idx_id_host` (`id`, `host`),\n PRIMARY KEY (`ii`)\n) ENGINE = InnoDB\n DEFAULT CHARSET = utf8mb4;\n\nCREATE TABLE task_host_3\n(\n `ii` bigint unsigned NOT NULL AUTO_INCREMENT,\n `id` bigint unsigned not null,\n `host` varchar(128) not null,\n `status` varchar(32) not null,\n `stdout` text,\n `stderr` text,\n UNIQUE KEY `idx_id_host` (`id`, `host`),\n PRIMARY KEY (`ii`)\n) ENGINE = InnoDB\n DEFAULT CHARSET = utf8mb4;\n\nCREATE TABLE task_host_4\n(\n `ii` bigint unsigned NOT NULL AUTO_INCREMENT,\n `id` bigint unsigned not null,\n `host` varchar(128) not null,\n `status` varchar(32) not null,\n `stdout` text,\n `stderr` text,\n UNIQUE KEY `idx_id_host` (`id`, `host`),\n PRIMARY KEY (`ii`)\n) ENGINE = InnoDB\n DEFAULT CHARSET = utf8mb4;\n\nCREATE TABLE task_host_5\n(\n `ii` bigint unsigned NOT NULL AUTO_INCREMENT,\n `id` bigint unsigned not null,\n `host` varchar(128) not null,\n `status` varchar(32) not null,\n `stdout` text,\n `stderr` text,\n UNIQUE KEY `idx_id_host` (`id`, `host`),\n PRIMARY KEY (`ii`)\n) ENGINE = InnoDB\n DEFAULT CHARSET = utf8mb4;\n\nCREATE TABLE task_host_6\n(\n `ii` bigint unsigned NOT NULL AUTO_INCREMENT,\n `id` bigint unsigned not null,\n `host` varchar(128) not null,\n `status` varchar(32) not null,\n `stdout` text,\n `stderr` text,\n UNIQUE KEY `idx_id_host` (`id`, `host`),\n PRIMARY KEY (`ii`)\n) ENGINE = InnoDB\n DEFAULT CHARSET = utf8mb4;\n\nCREATE TABLE task_host_7\n(\n `ii` bigint unsigned NOT NULL AUTO_INCREMENT,\n `id` bigint unsigned not null,\n `host` varchar(128) not null,\n `status` varchar(32) not null,\n `stdout` text,\n `stderr` text,\n UNIQUE KEY `idx_id_host` (`id`, `host`),\n PRIMARY KEY (`ii`)\n) ENGINE = InnoDB\n DEFAULT CHARSET = utf8mb4;\n\nCREATE TABLE task_host_8\n(\n `ii` bigint unsigned NOT NULL AUTO_INCREMENT,\n `id` bigint unsigned not null,\n `host` varchar(128) not null,\n `status` varchar(32) not null,\n `stdout` text,\n `stderr` text,\n UNIQUE KEY `idx_id_host` (`id`, `host`),\n PRIMARY KEY (`ii`)\n) ENGINE = InnoDB\n DEFAULT CHARSET = utf8mb4;\n\nCREATE TABLE task_host_9\n(\n `ii` bigint unsigned NOT NULL AUTO_INCREMENT,\n `id` bigint unsigned not null,\n `host` varchar(128) not null,\n `status` varchar(32) not null,\n `stdout` text,\n `stderr` text,\n UNIQUE KEY `idx_id_host` (`id`, `host`),\n PRIMARY KEY (`ii`)\n) ENGINE = InnoDB\n DEFAULT CHARSET = utf8mb4;\n\nCREATE TABLE task_host_10\n(\n `ii` bigint unsigned NOT NULL AUTO_INCREMENT,\n `id` bigint unsigned not null,\n `host` varchar(128) not null,\n `status` varchar(32) not null,\n `stdout` text,\n `stderr` text,\n UNIQUE KEY `idx_id_host` (`id`, `host`),\n PRIMARY KEY (`ii`)\n) ENGINE = InnoDB\n DEFAULT CHARSET = utf8mb4;\n\nCREATE TABLE task_host_11\n(\n `ii` bigint unsigned NOT NULL AUTO_INCREMENT,\n `id` bigint unsigned not null,\n `host` varchar(128) not null,\n `status` varchar(32) not null,\n `stdout` text,\n `stderr` text,\n UNIQUE KEY `idx_id_host` (`id`, `host`),\n PRIMARY KEY (`ii`)\n) ENGINE = InnoDB\n DEFAULT CHARSET = utf8mb4;\n\nCREATE TABLE task_host_12\n(\n `ii` bigint unsigned NOT NULL AUTO_INCREMENT,\n `id` bigint unsigned not null,\n `host` varchar(128) not null,\n `status` varchar(32) not null,\n `stdout` text,\n `stderr` text,\n UNIQUE KEY `idx_id_host` (`id`, `host`),\n PRIMARY KEY (`ii`)\n) ENGINE = InnoDB\n DEFAULT CHARSET = utf8mb4;\n\nCREATE TABLE task_host_13\n(\n `ii` bigint unsigned NOT NULL AUTO_INCREMENT,\n `id` bigint unsigned not null,\n `host` varchar(128) not null,\n `status` varchar(32) not null,\n `stdout` text,\n `stderr` text,\n UNIQUE KEY `idx_id_host` (`id`, `host`),\n PRIMARY KEY (`ii`)\n) ENGINE = InnoDB\n DEFAULT CHARSET = utf8mb4;\n\nCREATE TABLE task_host_14\n(\n `ii` bigint unsigned NOT NULL AUTO_INCREMENT,\n `id` bigint unsigned not null,\n `host` varchar(128) not null,\n `status` varchar(32) not null,\n `stdout` text,\n `stderr` text,\n UNIQUE KEY `idx_id_host` (`id`, `host`),\n PRIMARY KEY (`ii`)\n) ENGINE = InnoDB\n DEFAULT CHARSET = utf8mb4;\n\nCREATE TABLE task_host_15\n(\n `ii` bigint unsigned NOT NULL AUTO_INCREMENT,\n `id` bigint unsigned not null,\n `host` varchar(128) not null,\n `status` varchar(32) not null,\n `stdout` text,\n `stderr` text,\n UNIQUE KEY `idx_id_host` (`id`, `host`),\n PRIMARY KEY (`ii`)\n) ENGINE = InnoDB\n DEFAULT CHARSET = utf8mb4;\n\nCREATE TABLE task_host_16\n(\n `ii` bigint unsigned NOT NULL AUTO_INCREMENT,\n `id` bigint unsigned not null,\n `host` varchar(128) not null,\n `status` varchar(32) not null,\n `stdout` text,\n `stderr` text,\n UNIQUE KEY `idx_id_host` (`id`, `host`),\n PRIMARY KEY (`ii`)\n) ENGINE = InnoDB\n DEFAULT CHARSET = utf8mb4;\n\nCREATE TABLE task_host_17\n(\n `ii` bigint unsigned NOT NULL AUTO_INCREMENT,\n `id` bigint unsigned not null,\n `host` varchar(128) not null,\n `status` varchar(32) not null,\n `stdout` text,\n `stderr` text,\n UNIQUE KEY `idx_id_host` (`id`, `host`),\n PRIMARY KEY (`ii`)\n) ENGINE = InnoDB\n DEFAULT CHARSET = utf8mb4;\n\nCREATE TABLE task_host_18\n(\n `ii` bigint unsigned NOT NULL AUTO_INCREMENT,\n `id` bigint unsigned not null,\n `host` varchar(128) not null,\n `status` varchar(32) not null,\n `stdout` text,\n `stderr` text,\n UNIQUE KEY `idx_id_host` (`id`, `host`),\n PRIMARY KEY (`ii`)\n) ENGINE = InnoDB\n DEFAULT CHARSET = utf8mb4;\n\nCREATE TABLE task_host_19\n(\n `ii` bigint unsigned NOT NULL AUTO_INCREMENT,\n `id` bigint unsigned not null,\n `host` varchar(128) not null,\n `status` varchar(32) not null,\n `stdout` text,\n `stderr` text,\n UNIQUE KEY `idx_id_host` (`id`, `host`),\n PRIMARY KEY (`ii`)\n) ENGINE = InnoDB\n DEFAULT CHARSET = utf8mb4;\n\nCREATE TABLE task_host_20\n(\n `ii` bigint unsigned NOT NULL AUTO_INCREMENT,\n `id` bigint unsigned not null,\n `host` varchar(128) not null,\n `status` varchar(32) not null,\n `stdout` text,\n `stderr` text,\n UNIQUE KEY `idx_id_host` (`id`, `host`),\n PRIMARY KEY (`ii`)\n) ENGINE = InnoDB\n DEFAULT CHARSET = utf8mb4;\n\nCREATE TABLE task_host_21\n(\n `ii` bigint unsigned NOT NULL AUTO_INCREMENT,\n `id` bigint unsigned not null,\n `host` varchar(128) not null,\n `status` varchar(32) not null,\n `stdout` text,\n `stderr` text,\n UNIQUE KEY `idx_id_host` (`id`, `host`),\n PRIMARY KEY (`ii`)\n) ENGINE = InnoDB\n DEFAULT CHARSET = utf8mb4;\n\nCREATE TABLE task_host_22\n(\n `ii` bigint unsigned NOT NULL AUTO_INCREMENT,\n `id` bigint unsigned not null,\n `host` varchar(128) not null,\n `status` varchar(32) not null,\n `stdout` text,\n `stderr` text,\n UNIQUE KEY `idx_id_host` (`id`, `host`),\n PRIMARY KEY (`ii`)\n) ENGINE = InnoDB\n DEFAULT CHARSET = utf8mb4;\n\nCREATE TABLE task_host_23\n(\n `ii` bigint unsigned NOT NULL AUTO_INCREMENT,\n `id` bigint unsigned not null,\n `host` varchar(128) not null,\n `status` varchar(32) not null,\n `stdout` text,\n `stderr` text,\n UNIQUE KEY `idx_id_host` (`id`, `host`),\n PRIMARY KEY (`ii`)\n) ENGINE = InnoDB\n DEFAULT CHARSET = utf8mb4;\n\nCREATE TABLE task_host_24\n(\n `ii` bigint unsigned NOT NULL AUTO_INCREMENT,\n `id` bigint unsigned not null,\n `host` varchar(128) not null,\n `status` varchar(32) not null,\n `stdout` text,\n `stderr` text,\n UNIQUE KEY `idx_id_host` (`id`, `host`),\n PRIMARY KEY (`ii`)\n) ENGINE = InnoDB\n DEFAULT CHARSET = utf8mb4;\n\nCREATE TABLE task_host_25\n(\n `ii` bigint unsigned NOT NULL AUTO_INCREMENT,\n `id` bigint unsigned not null,\n `host` varchar(128) not null,\n `status` varchar(32) not null,\n `stdout` text,\n `stderr` text,\n UNIQUE KEY `idx_id_host` (`id`, `host`),\n PRIMARY KEY (`ii`)\n) ENGINE = InnoDB\n DEFAULT CHARSET = utf8mb4;\n\nCREATE TABLE task_host_26\n(\n `ii` bigint unsigned NOT NULL AUTO_INCREMENT,\n `id` bigint unsigned not null,\n `host` varchar(128) not null,\n `status` varchar(32) not null,\n `stdout` text,\n `stderr` text,\n UNIQUE KEY `idx_id_host` (`id`, `host`),\n PRIMARY KEY (`ii`)\n) ENGINE = InnoDB\n DEFAULT CHARSET = utf8mb4;\n\nCREATE TABLE task_host_27\n(\n `ii` bigint unsigned NOT NULL AUTO_INCREMENT,\n `id` bigint unsigned not null,\n `host` varchar(128) not null,\n `status` varchar(32) not null,\n `stdout` text,\n `stderr` text,\n UNIQUE KEY `idx_id_host` (`id`, `host`),\n PRIMARY KEY (`ii`)\n) ENGINE = InnoDB\n DEFAULT CHARSET = utf8mb4;\n\nCREATE TABLE task_host_28\n(\n `ii` bigint unsigned NOT NULL AUTO_INCREMENT,\n `id` bigint unsigned not null,\n `host` varchar(128) not null,\n `status` varchar(32) not null,\n `stdout` text,\n `stderr` text,\n UNIQUE KEY `idx_id_host` (`id`, `host`),\n PRIMARY KEY (`ii`)\n) ENGINE = InnoDB\n DEFAULT CHARSET = utf8mb4;\n\nCREATE TABLE task_host_29\n(\n `ii` bigint unsigned NOT NULL AUTO_INCREMENT,\n `id` bigint unsigned not null,\n `host` varchar(128) not null,\n `status` varchar(32) not null,\n `stdout` text,\n `stderr` text,\n UNIQUE KEY `idx_id_host` (`id`, `host`),\n PRIMARY KEY (`ii`)\n) ENGINE = InnoDB\n DEFAULT CHARSET = utf8mb4;\n\nCREATE TABLE task_host_30\n(\n `ii` bigint unsigned NOT NULL AUTO_INCREMENT,\n `id` bigint unsigned not null,\n `host` varchar(128) not null,\n `status` varchar(32) not null,\n `stdout` text,\n `stderr` text,\n UNIQUE KEY `idx_id_host` (`id`, `host`),\n PRIMARY KEY (`ii`)\n) ENGINE = InnoDB\n DEFAULT CHARSET = utf8mb4;\n\nCREATE TABLE task_host_31\n(\n `ii` bigint unsigned NOT NULL AUTO_INCREMENT,\n `id` bigint unsigned not null,\n `host` varchar(128) not null,\n `status` varchar(32) not null,\n `stdout` text,\n `stderr` text,\n UNIQUE KEY `idx_id_host` (`id`, `host`),\n PRIMARY KEY (`ii`)\n) ENGINE = InnoDB\n DEFAULT CHARSET = utf8mb4;\n\nCREATE TABLE task_host_32\n(\n `ii` bigint unsigned NOT NULL AUTO_INCREMENT,\n `id` bigint unsigned not null,\n `host` varchar(128) not null,\n `status` varchar(32) not null,\n `stdout` text,\n `stderr` text,\n UNIQUE KEY `idx_id_host` (`id`, `host`),\n PRIMARY KEY (`ii`)\n) ENGINE = InnoDB\n DEFAULT CHARSET = utf8mb4;\n\nCREATE TABLE task_host_33\n(\n `ii` bigint unsigned NOT NULL AUTO_INCREMENT,\n `id` bigint unsigned not null,\n `host` varchar(128) not null,\n `status` varchar(32) not null,\n `stdout` text,\n `stderr` text,\n UNIQUE KEY `idx_id_host` (`id`, `host`),\n PRIMARY KEY (`ii`)\n) ENGINE = InnoDB\n DEFAULT CHARSET = utf8mb4;\n\nCREATE TABLE task_host_34\n(\n `ii` bigint unsigned NOT NULL AUTO_INCREMENT,\n `id` bigint unsigned not null,\n `host` varchar(128) not null,\n `status` varchar(32) not null,\n `stdout` text,\n `stderr` text,\n UNIQUE KEY `idx_id_host` (`id`, `host`),\n PRIMARY KEY (`ii`)\n) ENGINE = InnoDB\n DEFAULT CHARSET = utf8mb4;\n\nCREATE TABLE task_host_35\n(\n `ii` bigint unsigned NOT NULL AUTO_INCREMENT,\n `id` bigint unsigned not null,\n `host` varchar(128) not null,\n `status` varchar(32) not null,\n `stdout` text,\n `stderr` text,\n UNIQUE KEY `idx_id_host` (`id`, `host`),\n PRIMARY KEY (`ii`)\n) ENGINE = InnoDB\n DEFAULT CHARSET = utf8mb4;\n\nCREATE TABLE task_host_36\n(\n `ii` bigint unsigned NOT NULL AUTO_INCREMENT,\n `id` bigint unsigned not null,\n `host` varchar(128) not null,\n `status` varchar(32) not null,\n `stdout` text,\n `stderr` text,\n UNIQUE KEY `idx_id_host` (`id`, `host`),\n PRIMARY KEY (`ii`)\n) ENGINE = InnoDB\n DEFAULT CHARSET = utf8mb4;\n\nCREATE TABLE task_host_37\n(\n `ii` bigint unsigned NOT NULL AUTO_INCREMENT,\n `id` bigint unsigned not null,\n `host` varchar(128) not null,\n `status` varchar(32) not null,\n `stdout` text,\n `stderr` text,\n UNIQUE KEY `idx_id_host` (`id`, `host`),\n PRIMARY KEY (`ii`)\n) ENGINE = InnoDB\n DEFAULT CHARSET = utf8mb4;\n\nCREATE TABLE task_host_38\n(\n `ii` bigint unsigned NOT NULL AUTO_INCREMENT,\n `id` bigint unsigned not null,\n `host` varchar(128) not null,\n `status` varchar(32) not null,\n `stdout` text,\n `stderr` text,\n UNIQUE KEY `idx_id_host` (`id`, `host`),\n PRIMARY KEY (`ii`)\n) ENGINE = InnoDB\n DEFAULT CHARSET = utf8mb4;\n\nCREATE TABLE task_host_39\n(\n `ii` bigint unsigned NOT NULL AUTO_INCREMENT,\n `id` bigint unsigned not null,\n `host` varchar(128) not null,\n `status` varchar(32) not null,\n `stdout` text,\n `stderr` text,\n UNIQUE KEY `idx_id_host` (`id`, `host`),\n PRIMARY KEY (`ii`)\n) ENGINE = InnoDB\n DEFAULT CHARSET = utf8mb4;\n\nCREATE TABLE task_host_40\n(\n `ii` bigint unsigned NOT NULL AUTO_INCREMENT,\n `id` bigint unsigned not null,\n `host` varchar(128) not null,\n `status` varchar(32) not null,\n `stdout` text,\n `stderr` text,\n UNIQUE KEY `idx_id_host` (`id`, `host`),\n PRIMARY KEY (`ii`)\n) ENGINE = InnoDB\n DEFAULT CHARSET = utf8mb4;\n\nCREATE TABLE task_host_41\n(\n `ii` bigint unsigned NOT NULL AUTO_INCREMENT,\n `id` bigint unsigned not null,\n `host` varchar(128) not null,\n `status` varchar(32) not null,\n `stdout` text,\n `stderr` text,\n UNIQUE KEY `idx_id_host` (`id`, `host`),\n PRIMARY KEY (`ii`)\n) ENGINE = InnoDB\n DEFAULT CHARSET = utf8mb4;\n\nCREATE TABLE task_host_42\n(\n `ii` bigint unsigned NOT NULL AUTO_INCREMENT,\n `id` bigint unsigned not null,\n `host` varchar(128) not null,\n `status` varchar(32) not null,\n `stdout` text,\n `stderr` text,\n UNIQUE KEY `idx_id_host` (`id`, `host`),\n PRIMARY KEY (`ii`)\n) ENGINE = InnoDB\n DEFAULT CHARSET = utf8mb4;\n\nCREATE TABLE task_host_43\n(\n `ii` bigint unsigned NOT NULL AUTO_INCREMENT,\n `id` bigint unsigned not null,\n `host` varchar(128) not null,\n `status` varchar(32) not null,\n `stdout` text,\n `stderr` text,\n UNIQUE KEY `idx_id_host` (`id`, `host`),\n PRIMARY KEY (`ii`)\n) ENGINE = InnoDB\n DEFAULT CHARSET = utf8mb4;\n\nCREATE TABLE task_host_44\n(\n `ii` bigint unsigned NOT NULL AUTO_INCREMENT,\n `id` bigint unsigned not null,\n `host` varchar(128) not null,\n `status` varchar(32) not null,\n `stdout` text,\n `stderr` text,\n UNIQUE KEY `idx_id_host` (`id`, `host`),\n PRIMARY KEY (`ii`)\n) ENGINE = InnoDB\n DEFAULT CHARSET = utf8mb4;\n\nCREATE TABLE task_host_45\n(\n `ii` bigint unsigned NOT NULL AUTO_INCREMENT,\n `id` bigint unsigned not null,\n `host` varchar(128) not null,\n `status` varchar(32) not null,\n `stdout` text,\n `stderr` text,\n UNIQUE KEY `idx_id_host` (`id`, `host`),\n PRIMARY KEY (`ii`)\n) ENGINE = InnoDB\n DEFAULT CHARSET = utf8mb4;\n\nCREATE TABLE task_host_46\n(\n `ii` bigint unsigned NOT NULL AUTO_INCREMENT,\n `id` bigint unsigned not null,\n `host` varchar(128) not null,\n `status` varchar(32) not null,\n `stdout` text,\n `stderr` text,\n UNIQUE KEY `idx_id_host` (`id`, `host`),\n PRIMARY KEY (`ii`)\n) ENGINE = InnoDB\n DEFAULT CHARSET = utf8mb4;\n\nCREATE TABLE task_host_47\n(\n `ii` bigint unsigned NOT NULL AUTO_INCREMENT,\n `id` bigint unsigned not null,\n `host` varchar(128) not null,\n `status` varchar(32) not null,\n `stdout` text,\n `stderr` text,\n UNIQUE KEY `idx_id_host` (`id`, `host`),\n PRIMARY KEY (`ii`)\n) ENGINE = InnoDB\n DEFAULT CHARSET = utf8mb4;\n\nCREATE TABLE task_host_48\n(\n `ii` bigint unsigned NOT NULL AUTO_INCREMENT,\n `id` bigint unsigned not null,\n `host` varchar(128) not null,\n `status` varchar(32) not null,\n `stdout` text,\n `stderr` text,\n UNIQUE KEY `idx_id_host` (`id`, `host`),\n PRIMARY KEY (`ii`)\n) ENGINE = InnoDB\n DEFAULT CHARSET = utf8mb4;\n\nCREATE TABLE task_host_49\n(\n `ii` bigint unsigned NOT NULL AUTO_INCREMENT,\n `id` bigint unsigned not null,\n `host` varchar(128) not null,\n `status` varchar(32) not null,\n `stdout` text,\n `stderr` text,\n UNIQUE KEY `idx_id_host` (`id`, `host`),\n PRIMARY KEY (`ii`)\n) ENGINE = InnoDB\n DEFAULT CHARSET = utf8mb4;\n\nCREATE TABLE task_host_50\n(\n `ii` bigint unsigned NOT NULL AUTO_INCREMENT,\n `id` bigint unsigned not null,\n `host` varchar(128) not null,\n `status` varchar(32) not null,\n `stdout` text,\n `stderr` text,\n UNIQUE KEY `idx_id_host` (`id`, `host`),\n PRIMARY KEY (`ii`)\n) ENGINE = InnoDB\n DEFAULT CHARSET = utf8mb4;\n\nCREATE TABLE task_host_51\n(\n `ii` bigint unsigned NOT NULL AUTO_INCREMENT,\n `id` bigint unsigned not null,\n `host` varchar(128) not null,\n `status` varchar(32) not null,\n `stdout` text,\n `stderr` text,\n UNIQUE KEY `idx_id_host` (`id`, `host`),\n PRIMARY KEY (`ii`)\n) ENGINE = InnoDB\n DEFAULT CHARSET = utf8mb4;\n\nCREATE TABLE task_host_52\n(\n `ii` bigint unsigned NOT NULL AUTO_INCREMENT,\n `id` bigint unsigned not null,\n `host` varchar(128) not null,\n `status` varchar(32) not null,\n `stdout` text,\n `stderr` text,\n UNIQUE KEY `idx_id_host` (`id`, `host`),\n PRIMARY KEY (`ii`)\n) ENGINE = InnoDB\n DEFAULT CHARSET = utf8mb4;\n\nCREATE TABLE task_host_53\n(\n `ii` bigint unsigned NOT NULL AUTO_INCREMENT,\n `id` bigint unsigned not null,\n `host` varchar(128) not null,\n `status` varchar(32) not null,\n `stdout` text,\n `stderr` text,\n UNIQUE KEY `idx_id_host` (`id`, `host`),\n PRIMARY KEY (`ii`)\n) ENGINE = InnoDB\n DEFAULT CHARSET = utf8mb4;\n\nCREATE TABLE task_host_54\n(\n `ii` bigint unsigned NOT NULL AUTO_INCREMENT,\n `id` bigint unsigned not null,\n `host` varchar(128) not null,\n `status` varchar(32) not null,\n `stdout` text,\n `stderr` text,\n UNIQUE KEY `idx_id_host` (`id`, `host`),\n PRIMARY KEY (`ii`)\n) ENGINE = InnoDB\n DEFAULT CHARSET = utf8mb4;\n\nCREATE TABLE task_host_55\n(\n `ii` bigint unsigned NOT NULL AUTO_INCREMENT,\n `id` bigint unsigned not null,\n `host` varchar(128) not null,\n `status` varchar(32) not null,\n `stdout` text,\n `stderr` text,\n UNIQUE KEY `idx_id_host` (`id`, `host`),\n PRIMARY KEY (`ii`)\n) ENGINE = InnoDB\n DEFAULT CHARSET = utf8mb4;\n\nCREATE TABLE task_host_56\n(\n `ii` bigint unsigned NOT NULL AUTO_INCREMENT,\n `id` bigint unsigned not null,\n `host` varchar(128) not null,\n `status` varchar(32) not null,\n `stdout` text,\n `stderr` text,\n UNIQUE KEY `idx_id_host` (`id`, `host`),\n PRIMARY KEY (`ii`)\n) ENGINE = InnoDB\n DEFAULT CHARSET = utf8mb4;\n\nCREATE TABLE task_host_57\n(\n `ii` bigint unsigned NOT NULL AUTO_INCREMENT,\n `id` bigint unsigned not null,\n `host` varchar(128) not null,\n `status` varchar(32) not null,\n `stdout` text,\n `stderr` text,\n UNIQUE KEY `idx_id_host` (`id`, `host`),\n PRIMARY KEY (`ii`)\n) ENGINE = InnoDB\n DEFAULT CHARSET = utf8mb4;\n\nCREATE TABLE task_host_58\n(\n `ii` bigint unsigned NOT NULL AUTO_INCREMENT,\n `id` bigint unsigned not null,\n `host` varchar(128) not null,\n `status` varchar(32) not null,\n `stdout` text,\n `stderr` text,\n UNIQUE KEY `idx_id_host` (`id`, `host`),\n PRIMARY KEY (`ii`)\n) ENGINE = InnoDB\n DEFAULT CHARSET = utf8mb4;\n\nCREATE TABLE task_host_59\n(\n `ii` bigint unsigned NOT NULL AUTO_INCREMENT,\n `id` bigint unsigned not null,\n `host` varchar(128) not null,\n `status` varchar(32) not null,\n `stdout` text,\n `stderr` text,\n UNIQUE KEY `idx_id_host` (`id`, `host`),\n PRIMARY KEY (`ii`)\n) ENGINE = InnoDB\n DEFAULT CHARSET = utf8mb4;\n\nCREATE TABLE task_host_60\n(\n `ii` bigint unsigned NOT NULL AUTO_INCREMENT,\n `id` bigint unsigned not null,\n `host` varchar(128) not null,\n `status` varchar(32) not null,\n `stdout` text,\n `stderr` text,\n UNIQUE KEY `idx_id_host` (`id`, `host`),\n PRIMARY KEY (`ii`)\n) ENGINE = InnoDB\n DEFAULT CHARSET = utf8mb4;\n\nCREATE TABLE task_host_61\n(\n `ii` bigint unsigned NOT NULL AUTO_INCREMENT,\n `id` bigint unsigned not null,\n `host` varchar(128) not null,\n `status` varchar(32) not null,\n `stdout` text,\n `stderr` text,\n UNIQUE KEY `idx_id_host` (`id`, `host`),\n PRIMARY KEY (`ii`)\n) ENGINE = InnoDB\n DEFAULT CHARSET = utf8mb4;\n\nCREATE TABLE task_host_62\n(\n `ii` bigint unsigned NOT NULL AUTO_INCREMENT,\n `id` bigint unsigned not null,\n `host` varchar(128) not null,\n `status` varchar(32) not null,\n `stdout` text,\n `stderr` text,\n UNIQUE KEY `idx_id_host` (`id`, `host`),\n PRIMARY KEY (`ii`)\n) ENGINE = InnoDB\n DEFAULT CHARSET = utf8mb4;\n\nCREATE TABLE task_host_63\n(\n `ii` bigint unsigned NOT NULL AUTO_INCREMENT,\n `id` bigint unsigned not null,\n `host` varchar(128) not null,\n `status` varchar(32) not null,\n `stdout` text,\n `stderr` text,\n UNIQUE KEY `idx_id_host` (`id`, `host`),\n PRIMARY KEY (`ii`)\n) ENGINE = InnoDB\n DEFAULT CHARSET = utf8mb4;\n\nCREATE TABLE task_host_64\n(\n `ii` bigint unsigned NOT NULL AUTO_INCREMENT,\n `id` bigint unsigned not null,\n `host` varchar(128) not null,\n `status` varchar(32) not null,\n `stdout` text,\n `stderr` text,\n UNIQUE KEY `idx_id_host` (`id`, `host`),\n PRIMARY KEY (`ii`)\n) ENGINE = InnoDB\n DEFAULT CHARSET = utf8mb4;\n\nCREATE TABLE task_host_65\n(\n `ii` bigint unsigned NOT NULL AUTO_INCREMENT,\n `id` bigint unsigned not null,\n `host` varchar(128) not null,\n `status` varchar(32) not null,\n `stdout` text,\n `stderr` text,\n UNIQUE KEY `idx_id_host` (`id`, `host`),\n PRIMARY KEY (`ii`)\n) ENGINE = InnoDB\n DEFAULT CHARSET = utf8mb4;\n\nCREATE TABLE task_host_66\n(\n `ii` bigint unsigned NOT NULL AUTO_INCREMENT,\n `id` bigint unsigned not null,\n `host` varchar(128) not null,\n `status` varchar(32) not null,\n `stdout` text,\n `stderr` text,\n UNIQUE KEY `idx_id_host` (`id`, `host`),\n PRIMARY KEY (`ii`)\n) ENGINE = InnoDB\n DEFAULT CHARSET = utf8mb4;\n\nCREATE TABLE task_host_67\n(\n `ii` bigint unsigned NOT NULL AUTO_INCREMENT,\n `id` bigint unsigned not null,\n `host` varchar(128) not null,\n `status` varchar(32) not null,\n `stdout` text,\n `stderr` text,\n UNIQUE KEY `idx_id_host` (`id`, `host`),\n PRIMARY KEY (`ii`)\n) ENGINE = InnoDB\n DEFAULT CHARSET = utf8mb4;\n\nCREATE TABLE task_host_68\n(\n `ii` bigint unsigned NOT NULL AUTO_INCREMENT,\n `id` bigint unsigned not null,\n `host` varchar(128) not null,\n `status` varchar(32) not null,\n `stdout` text,\n `stderr` text,\n UNIQUE KEY `idx_id_host` (`id`, `host`),\n PRIMARY KEY (`ii`)\n) ENGINE = InnoDB\n DEFAULT CHARSET = utf8mb4;\n\nCREATE TABLE task_host_69\n(\n `ii` bigint unsigned NOT NULL AUTO_INCREMENT,\n `id` bigint unsigned not null,\n `host` varchar(128) not null,\n `status` varchar(32) not null,\n `stdout` text,\n `stderr` text,\n UNIQUE KEY `idx_id_host` (`id`, `host`),\n PRIMARY KEY (`ii`)\n) ENGINE = InnoDB\n DEFAULT CHARSET = utf8mb4;\n\nCREATE TABLE task_host_70\n(\n `ii` bigint unsigned NOT NULL AUTO_INCREMENT,\n `id` bigint unsigned not null,\n `host` varchar(128) not null,\n `status` varchar(32) not null,\n `stdout` text,\n `stderr` text,\n UNIQUE KEY `idx_id_host` (`id`, `host`),\n PRIMARY KEY (`ii`)\n) ENGINE = InnoDB\n DEFAULT CHARSET = utf8mb4;\n\nCREATE TABLE task_host_71\n(\n `ii` bigint unsigned NOT NULL AUTO_INCREMENT,\n `id` bigint unsigned not null,\n `host` varchar(128) not null,\n `status` varchar(32) not null,\n `stdout` text,\n `stderr` text,\n UNIQUE KEY `idx_id_host` (`id`, `host`),\n PRIMARY KEY (`ii`)\n) ENGINE = InnoDB\n DEFAULT CHARSET = utf8mb4;\n\nCREATE TABLE task_host_72\n(\n `ii` bigint unsigned NOT NULL AUTO_INCREMENT,\n `id` bigint unsigned not null,\n `host` varchar(128) not null,\n `status` varchar(32) not null,\n `stdout` text,\n `stderr` text,\n UNIQUE KEY `idx_id_host` (`id`, `host`),\n PRIMARY KEY (`ii`)\n) ENGINE = InnoDB\n DEFAULT CHARSET = utf8mb4;\n\nCREATE TABLE task_host_73\n(\n `ii` bigint unsigned NOT NULL AUTO_INCREMENT,\n `id` bigint unsigned not null,\n `host` varchar(128) not null,\n `status` varchar(32) not null,\n `stdout` text,\n `stderr` text,\n UNIQUE KEY `idx_id_host` (`id`, `host`),\n PRIMARY KEY (`ii`)\n) ENGINE = InnoDB\n DEFAULT CHARSET = utf8mb4;\n\nCREATE TABLE task_host_74\n(\n `ii` bigint unsigned NOT NULL AUTO_INCREMENT,\n `id` bigint unsigned not null,\n `host` varchar(128) not null,\n `status` varchar(32) not null,\n `stdout` text,\n `stderr` text,\n UNIQUE KEY `idx_id_host` (`id`, `host`),\n PRIMARY KEY (`ii`)\n) ENGINE = InnoDB\n DEFAULT CHARSET = utf8mb4;\n\nCREATE TABLE task_host_75\n(\n `ii` bigint unsigned NOT NULL AUTO_INCREMENT,\n `id` bigint unsigned not null,\n `host` varchar(128) not null,\n `status` varchar(32) not null,\n `stdout` text,\n `stderr` text,\n UNIQUE KEY `idx_id_host` (`id`, `host`),\n PRIMARY KEY (`ii`)\n) ENGINE = InnoDB\n DEFAULT CHARSET = utf8mb4;\n\nCREATE TABLE task_host_76\n(\n `ii` bigint unsigned NOT NULL AUTO_INCREMENT,\n `id` bigint unsigned not null,\n `host` varchar(128) not null,\n `status` varchar(32) not null,\n `stdout` text,\n `stderr` text,\n UNIQUE KEY `idx_id_host` (`id`, `host`),\n PRIMARY KEY (`ii`)\n) ENGINE = InnoDB\n DEFAULT CHARSET = utf8mb4;\n\nCREATE TABLE task_host_77\n(\n `ii` bigint unsigned NOT NULL AUTO_INCREMENT,\n `id` bigint unsigned not null,\n `host` varchar(128) not null,\n `status` varchar(32) not null,\n `stdout` text,\n `stderr` text,\n UNIQUE KEY `idx_id_host` (`id`, `host`),\n PRIMARY KEY (`ii`)\n) ENGINE = InnoDB\n DEFAULT CHARSET = utf8mb4;\n\nCREATE TABLE task_host_78\n(\n `ii` bigint unsigned NOT NULL AUTO_INCREMENT,\n `id` bigint unsigned not null,\n `host` varchar(128) not null,\n `status` varchar(32) not null,\n `stdout` text,\n `stderr` text,\n UNIQUE KEY `idx_id_host` (`id`, `host`),\n PRIMARY KEY (`ii`)\n) ENGINE = InnoDB\n DEFAULT CHARSET = utf8mb4;\n\nCREATE TABLE task_host_79\n(\n `ii` bigint unsigned NOT NULL AUTO_INCREMENT,\n `id` bigint unsigned not null,\n `host` varchar(128) not null,\n `status` varchar(32) not null,\n `stdout` text,\n `stderr` text,\n UNIQUE KEY `idx_id_host` (`id`, `host`),\n PRIMARY KEY (`ii`)\n) ENGINE = InnoDB\n DEFAULT CHARSET = utf8mb4;\n\nCREATE TABLE task_host_80\n(\n `ii` bigint unsigned NOT NULL AUTO_INCREMENT,\n `id` bigint unsigned not null,\n `host` varchar(128) not null,\n `status` varchar(32) not null,\n `stdout` text,\n `stderr` text,\n UNIQUE KEY `idx_id_host` (`id`, `host`),\n PRIMARY KEY (`ii`)\n) ENGINE = InnoDB\n DEFAULT CHARSET = utf8mb4;\n\nCREATE TABLE task_host_81\n(\n `ii` bigint unsigned NOT NULL AUTO_INCREMENT,\n `id` bigint unsigned not null,\n `host` varchar(128) not null,\n `status` varchar(32) not null,\n `stdout` text,\n `stderr` text,\n UNIQUE KEY `idx_id_host` (`id`, `host`),\n PRIMARY KEY (`ii`)\n) ENGINE = InnoDB\n DEFAULT CHARSET = utf8mb4;\n\nCREATE TABLE task_host_82\n(\n `ii` bigint unsigned NOT NULL AUTO_INCREMENT,\n `id` bigint unsigned not null,\n `host` varchar(128) not null,\n `status` varchar(32) not null,\n `stdout` text,\n `stderr` text,\n UNIQUE KEY `idx_id_host` (`id`, `host`),\n PRIMARY KEY (`ii`)\n) ENGINE = InnoDB\n DEFAULT CHARSET = utf8mb4;\n\nCREATE TABLE task_host_83\n(\n `ii` bigint unsigned NOT NULL AUTO_INCREMENT,\n `id` bigint unsigned not null,\n `host` varchar(128) not null,\n `status` varchar(32) not null,\n `stdout` text,\n `stderr` text,\n UNIQUE KEY `idx_id_host` (`id`, `host`),\n PRIMARY KEY (`ii`)\n) ENGINE = InnoDB\n DEFAULT CHARSET = utf8mb4;\n\nCREATE TABLE task_host_84\n(\n `ii` bigint unsigned NOT NULL AUTO_INCREMENT,\n `id` bigint unsigned not null,\n `host` varchar(128) not null,\n `status` varchar(32) not null,\n `stdout` text,\n `stderr` text,\n UNIQUE KEY `idx_id_host` (`id`, `host`),\n PRIMARY KEY (`ii`)\n) ENGINE = InnoDB\n DEFAULT CHARSET = utf8mb4;\n\nCREATE TABLE task_host_85\n(\n `ii` bigint unsigned NOT NULL AUTO_INCREMENT,\n `id` bigint unsigned not null,\n `host` varchar(128) not null,\n `status` varchar(32) not null,\n `stdout` text,\n `stderr` text,\n UNIQUE KEY `idx_id_host` (`id`, `host`),\n PRIMARY KEY (`ii`)\n) ENGINE = InnoDB\n DEFAULT CHARSET = utf8mb4;\n\nCREATE TABLE task_host_86\n(\n `ii` bigint unsigned NOT NULL AUTO_INCREMENT,\n `id` bigint unsigned not null,\n `host` varchar(128) not null,\n `status` varchar(32) not null,\n `stdout` text,\n `stderr` text,\n UNIQUE KEY `idx_id_host` (`id`, `host`),\n PRIMARY KEY (`ii`)\n) ENGINE = InnoDB\n DEFAULT CHARSET = utf8mb4;\n\nCREATE TABLE task_host_87\n(\n `ii` bigint unsigned NOT NULL AUTO_INCREMENT,\n `id` bigint unsigned not null,\n `host` varchar(128) not null,\n `status` varchar(32) not null,\n `stdout` text,\n `stderr` text,\n UNIQUE KEY `idx_id_host` (`id`, `host`),\n PRIMARY KEY (`ii`)\n) ENGINE = InnoDB\n DEFAULT CHARSET = utf8mb4;\n\nCREATE TABLE task_host_88\n(\n `ii` bigint unsigned NOT NULL AUTO_INCREMENT,\n `id` bigint unsigned not null,\n `host` varchar(128) not null,\n `status` varchar(32) not null,\n `stdout` text,\n `stderr` text,\n UNIQUE KEY `idx_id_host` (`id`, `host`),\n PRIMARY KEY (`ii`)\n) ENGINE = InnoDB\n DEFAULT CHARSET = utf8mb4;\n\nCREATE TABLE task_host_89\n(\n `ii` bigint unsigned NOT NULL AUTO_INCREMENT,\n `id` bigint unsigned not null,\n `host` varchar(128) not null,\n `status` varchar(32) not null,\n `stdout` text,\n `stderr` text,\n UNIQUE KEY `idx_id_host` (`id`, `host`),\n PRIMARY KEY (`ii`)\n) ENGINE = InnoDB\n DEFAULT CHARSET = utf8mb4;\n\nCREATE TABLE task_host_90\n(\n `ii` bigint unsigned NOT NULL AUTO_INCREMENT,\n `id` bigint unsigned not null,\n `host` varchar(128) not null,\n `status` varchar(32) not null,\n `stdout` text,\n `stderr` text,\n UNIQUE KEY `idx_id_host` (`id`, `host`),\n PRIMARY KEY (`ii`)\n) ENGINE = InnoDB\n DEFAULT CHARSET = utf8mb4;\n\nCREATE TABLE task_host_91\n(\n `ii` bigint unsigned NOT NULL AUTO_INCREMENT,\n `id` bigint unsigned not null,\n `host` varchar(128) not null,\n `status` varchar(32) not null,\n `stdout` text,\n `stderr` text,\n UNIQUE KEY `idx_id_host` (`id`, `host`),\n PRIMARY KEY (`ii`)\n) ENGINE = InnoDB\n DEFAULT CHARSET = utf8mb4;\n\nCREATE TABLE task_host_92\n(\n `ii` bigint unsigned NOT NULL AUTO_INCREMENT,\n `id` bigint unsigned not null,\n `host` varchar(128) not null,\n `status` varchar(32) not null,\n `stdout` text,\n `stderr` text,\n UNIQUE KEY `idx_id_host` (`id`, `host`),\n PRIMARY KEY (`ii`)\n) ENGINE = InnoDB\n DEFAULT CHARSET = utf8mb4;\n\nCREATE TABLE task_host_93\n(\n `ii` bigint unsigned NOT NULL AUTO_INCREMENT,\n `id` bigint unsigned not null,\n `host` varchar(128) not null,\n `status` varchar(32) not null,\n `stdout` text,\n `stderr` text,\n UNIQUE KEY `idx_id_host` (`id`, `host`),\n PRIMARY KEY (`ii`)\n) ENGINE = InnoDB\n DEFAULT CHARSET = utf8mb4;\n\nCREATE TABLE task_host_94\n(\n `ii` bigint unsigned NOT NULL AUTO_INCREMENT,\n `id` bigint unsigned not null,\n `host` varchar(128) not null,\n `status` varchar(32) not null,\n `stdout` text,\n `stderr` text,\n UNIQUE KEY `idx_id_host` (`id`, `host`),\n PRIMARY KEY (`ii`)\n) ENGINE = InnoDB\n DEFAULT CHARSET = utf8mb4;\n\nCREATE TABLE task_host_95\n(\n `ii` bigint unsigned NOT NULL AUTO_INCREMENT,\n `id` bigint unsigned not null,\n `host` varchar(128) not null,\n `status` varchar(32) not null,\n `stdout` text,\n `stderr` text,\n UNIQUE KEY `idx_id_host` (`id`, `host`),\n PRIMARY KEY (`ii`)\n) ENGINE = InnoDB\n DEFAULT CHARSET = utf8mb4;\n\nCREATE TABLE task_host_96\n(\n `ii` bigint unsigned NOT NULL AUTO_INCREMENT,\n `id` bigint unsigned not null,\n `host` varchar(128) not null,\n `status` varchar(32) not null,\n `stdout` text,\n `stderr` text,\n UNIQUE KEY `idx_id_host` (`id`, `host`),\n PRIMARY KEY (`ii`)\n) ENGINE = InnoDB\n DEFAULT CHARSET = utf8mb4;\n\nCREATE TABLE task_host_97\n(\n `ii` bigint unsigned NOT NULL AUTO_INCREMENT,\n `id` bigint unsigned not null,\n `host` varchar(128) not null,\n `status` varchar(32) not null,\n `stdout` text,\n `stderr` text,\n UNIQUE KEY `idx_id_host` (`id`, `host`),\n PRIMARY KEY (`ii`)\n) ENGINE = InnoDB\n DEFAULT CHARSET = utf8mb4;\n\nCREATE TABLE task_host_98\n(\n `ii` bigint unsigned NOT NULL AUTO_INCREMENT,\n `id` bigint unsigned not null,\n `host` varchar(128) not null,\n `status` varchar(32) not null,\n `stdout` text,\n `stderr` text,\n UNIQUE KEY `idx_id_host` (`id`, `host`),\n PRIMARY KEY (`ii`)\n) ENGINE = InnoDB\n DEFAULT CHARSET = utf8mb4;\n\nCREATE TABLE task_host_99\n(\n `ii` bigint unsigned NOT NULL AUTO_INCREMENT,\n `id` bigint unsigned not null,\n `host` varchar(128) not null,\n `status` varchar(32) not null,\n `stdout` text,\n `stderr` text,\n UNIQUE KEY `idx_id_host` (`id`, `host`),\n PRIMARY KEY (`ii`)\n) ENGINE = InnoDB\n DEFAULT CHARSET = utf8mb4;\n\nCREATE TABLE `source_token` (\n `id` bigint unsigned NOT NULL AUTO_INCREMENT,\n `source_type` varchar(64) NOT NULL DEFAULT '' COMMENT 'source type',\n `source_id` varchar(255) NOT NULL DEFAULT '' COMMENT 'source identifier',\n `token` varchar(255) NOT NULL DEFAULT '' COMMENT 'access token',\n `expire_at` bigint NOT NULL DEFAULT 0 COMMENT 'expire timestamp',\n `create_at` bigint NOT NULL DEFAULT 0 COMMENT 'create timestamp',\n `create_by` varchar(64) NOT NULL DEFAULT '' COMMENT 'creator',\n PRIMARY KEY (`id`),\n KEY `idx_source_type_id_token` (`source_type`, `source_id`, `token`)\n) ENGINE=InnoDB DEFAULT CHARSET=utf8mb4;\n"
},
{
"path": "docker/initsql/c-init.sql",
"content": "CREATE USER IF NOT EXISTS 'root'@'127.0.0.1' IDENTIFIED BY '1234';\nGRANT ALL PRIVILEGES ON *.* TO 'root'@'127.0.0.1' WITH GRANT OPTION;\n\nCREATE USER IF NOT EXISTS 'root'@'localhost' IDENTIFIED BY '1234';\nGRANT ALL PRIVILEGES ON *.* TO 'root'@'localhost' WITH GRANT OPTION;\n\nCREATE USER IF NOT EXISTS 'root'@'%' IDENTIFIED BY '1234';\nGRANT ALL PRIVILEGES ON *.* TO 'root'@'%' WITH GRANT OPTION;\n\nFLUSH PRIVILEGES;\n"
},
{
"path": "docker/migratesql/migrate.sql",
"content": "/* v7.0.0-beta.3 */\nCREATE TABLE `builtin_metrics` (\n `id` bigint unsigned NOT NULL AUTO_INCREMENT COMMENT 'unique identifier',\n `collector` varchar(191) NOT NULL COMMENT 'type of collector',\n `typ` varchar(191) NOT NULL COMMENT 'type of metric',\n `name` varchar(191) NOT NULL COMMENT 'name of metric',\n `unit` varchar(191) NOT NULL COMMENT 'unit of metric',\n `lang` varchar(191) NOT NULL DEFAULT '' COMMENT 'language of metric',\n `note` varchar(4096) NOT NULL COMMENT 'description of metric in Chinese',\n `expression` varchar(4096) NOT NULL COMMENT 'expression of metric',\n `created_at` bigint NOT NULL DEFAULT 0 COMMENT 'create time',\n `created_by` varchar(191) NOT NULL DEFAULT '' COMMENT 'creator',\n `updated_at` bigint NOT NULL DEFAULT 0 COMMENT 'update time',\n `updated_by` varchar(191) NOT NULL DEFAULT '' COMMENT 'updater',\n PRIMARY KEY (`id`),\n INDEX `idx_collector` (`collector`),\n INDEX `idx_typ` (`typ`),\n INDEX `idx_name` (`name`),\n INDEX `idx_lang` (`lang`)\n) ENGINE=InnoDB DEFAULT CHARSET=utf8mb4;\n\nCREATE TABLE `metric_filter` (\n `id` bigint NOT NULL AUTO_INCREMENT COMMENT 'unique identifier',\n `name` varchar(191) NOT NULL COMMENT 'name of metric filter',\n `configs` varchar(4096) NOT NULL COMMENT 'configuration of metric filter',\n `groups_perm` text,\n `create_at` bigint NOT NULL DEFAULT '0' COMMENT 'create time',\n `create_by` varchar(191) NOT NULL DEFAULT '' COMMENT 'creator',\n `update_at` bigint NOT NULL DEFAULT '0' COMMENT 'update time',\n `update_by` varchar(191) NOT NULL DEFAULT '' COMMENT 'updater',\n PRIMARY KEY (`id`),\n KEY `idx_name` (`name`)\n) ENGINE=InnoDB DEFAULT CHARSET=utf8mb4;\n\n\nCREATE TABLE `board_busigroup` (\n `busi_group_id` bigint(20) NOT NULL DEFAULT '0' COMMENT 'busi group id',\n `board_id` bigint(20) NOT NULL DEFAULT '0' COMMENT 'board id',\n PRIMARY KEY (`busi_group_id`, `board_id`)\n) ENGINE=InnoDB DEFAULT CHARSET=utf8mb4;\n\n/* v7.0.0-beta.6 */\nCREATE TABLE `builtin_components` (\n `id` bigint(20) NOT NULL AUTO_INCREMENT COMMENT '''unique identifier''',\n `ident` varchar(191) NOT NULL COMMENT '''identifier of component''',\n `logo` varchar(191) NOT NULL COMMENT '''logo of component''',\n `readme` text NOT NULL COMMENT '''readme of component''',\n `created_at` bigint(20) NOT NULL DEFAULT 0 COMMENT '''create time''',\n `created_by` varchar(191) NOT NULL DEFAULT '' COMMENT '''creator''',\n `updated_at` bigint(20) NOT NULL DEFAULT 0 COMMENT '''update time''',\n `updated_by` varchar(191) NOT NULL DEFAULT '' COMMENT '''updater''',\n PRIMARY KEY (`id`),\n KEY `idx_ident` (`ident`)\n) ENGINE=InnoDB DEFAULT CHARSET=utf8mb4;\n\nCREATE TABLE `builtin_payloads` (\n `id` bigint(20) NOT NULL AUTO_INCREMENT COMMENT '''unique identifier''',\n `uuid` bigint(20) NOT NULL COMMENT '''uuid of payload''',\n `type` varchar(191) NOT NULL COMMENT '''type of payload''',\n `component` varchar(191) NOT NULL COMMENT '''component of payload''',\n `cate` varchar(191) NOT NULL COMMENT '''category of payload''',\n `name` varchar(191) NOT NULL COMMENT '''name of payload''',\n `tags` varchar(191) NOT NULL DEFAULT '' COMMENT '''tags of payload''',\n `content` longtext NOT NULL COMMENT '''content of payload''',\n `created_at` bigint(20) NOT NULL DEFAULT 0 COMMENT '''create time''',\n `created_by` varchar(191) NOT NULL DEFAULT '' COMMENT '''creator''',\n `updated_at` bigint(20) NOT NULL DEFAULT 0 COMMENT '''update time''',\n `updated_by` varchar(191) NOT NULL DEFAULT '' COMMENT '''updater''',\n PRIMARY KEY (`id`),\n KEY `idx_component` (`component`),\n KEY `idx_name` (`name`),\n KEY `idx_cate` (`cate`),\n KEY `idx_uuid` (`uuid`),\n KEY `idx_type` (`type`)\n) ENGINE=InnoDB DEFAULT CHARSET=utf8mb4;\n\n/* v7.0.0-beta.7 */\nALTER TABLE users ADD COLUMN last_active_time BIGINT NOT NULL DEFAULT 0;\n\n/* v7.0.0-beta.13 */\nALTER TABLE recording_rule ADD COLUMN cron_pattern VARCHAR(255) DEFAULT '' COMMENT 'cron pattern';\n\n/* v7.0.0-beta.14 */\nALTER TABLE alert_cur_event ADD COLUMN original_tags TEXT COMMENT 'labels key=val,,k2=v2';\nALTER TABLE alert_his_event ADD COLUMN original_tags TEXT COMMENT 'labels key=val,,k2=v2';\n\n/* v7.1.0 */\nALTER TABLE target ADD COLUMN os VARCHAR(31) DEFAULT '' COMMENT 'os type';\n\n/* v7.2.0 */\nCREATE TABLE notification_record (\n `id` BIGINT PRIMARY KEY AUTO_INCREMENT,\n `event_id` BIGINT NOT NULL,\n `sub_id` BIGINT NOT NULL,\n `channel` VARCHAR(255) NOT NULL,\n `status` TINYINT NOT NULL DEFAULT 0,\n `target` VARCHAR(1024) NOT NULL,\n `details` VARCHAR(2048),\n `created_at` BIGINT NOT NULL,\n INDEX idx_evt (event_id)\n) ENGINE=InnoDB DEFAULT CHARSET=utf8mb4;\n\n\n/* v7.3.0 2024-08-26 */\nALTER TABLE `target` ADD COLUMN `host_tags` TEXT COMMENT 'global labels set in conf file';\n\n/* v7.3.4 2024-08-28 */\nALTER TABLE `builtin_payloads` ADD COLUMN `component_id` bigint(20) NOT NULL DEFAULT 0 COMMENT 'component_id';\n\n/* v7.4.0 2024-09-20 */\nCREATE TABLE `target_busi_group` (\n `id` bigint NOT NULL AUTO_INCREMENT,\n `target_ident` varchar(191) NOT NULL,\n `group_id` bigint NOT NULL,\n `update_at` bigint NOT NULL,\n PRIMARY KEY (`id`),\n UNIQUE KEY `idx_target_group` (`target_ident`,`group_id`)\n) ENGINE=InnoDB DEFAULT CHARSET=utf8mb4;\n\n/* v7.7.0 2024-11-13 */\nALTER TABLE `recording_rule` ADD COLUMN `datasource_queries` TEXT;\nALTER TABLE `alert_rule` ADD COLUMN `datasource_queries` TEXT;\n\n/* v7.7.2 2024-12-02 */\nALTER TABLE alert_subscribe MODIFY COLUMN rule_ids varchar(1024);\nALTER TABLE alert_subscribe MODIFY COLUMN busi_groups varchar(4096);\n\n/* v8.0.0-beta.1 2024-12-13 */\nALTER TABLE `alert_rule` ADD COLUMN `cron_pattern` VARCHAR(64);\nALTER TABLE `builtin_components` MODIFY COLUMN `logo` mediumtext COMMENT '''logo of component''';\n\n/* v8.0.0-beta.2 2024-12-26 */\nALTER TABLE `es_index_pattern` ADD COLUMN `cross_cluster_enabled` int not null default 0;\n\n/* v8.0.0-beta.3 2025-01-03 */\nALTER TABLE `builtin_components` ADD COLUMN `disabled` INT NOT NULL DEFAULT 0 COMMENT 'is disabled or not';\n \nCREATE TABLE `dash_annotation` (\n `id` bigint unsigned not null auto_increment,\n `dashboard_id` bigint not null comment 'dashboard id',\n `panel_id` varchar(191) not null comment 'panel id',\n `tags` text comment 'tags array json string',\n `description` text comment 'annotation description',\n `config` text comment 'annotation config',\n `time_start` bigint not null default 0 comment 'start timestamp',\n `time_end` bigint not null default 0 comment 'end timestamp',\n `create_at` bigint not null default 0 comment 'create time',\n `create_by` varchar(64) not null default '' comment 'creator',\n `update_at` bigint not null default 0 comment 'update time',\n `update_by` varchar(64) not null default '' comment 'updater',\n PRIMARY KEY (`id`),\n KEY `idx_dashboard_id` (`dashboard_id`)\n) ENGINE=InnoDB DEFAULT CHARSET=utf8mb4;\n\n/* v8.0.0-beta.5 2025-02-05 */\nCREATE TABLE `user_token` (\n `id` bigint NOT NULL AUTO_INCREMENT,\n `username` varchar(255) NOT NULL DEFAULT '',\n `token_name` varchar(255) NOT NULL DEFAULT '',\n `token` varchar(255) NOT NULL DEFAULT '',\n `create_at` bigint NOT NULL DEFAULT 0,\n `last_used` bigint NOT NULL DEFAULT 0,\n PRIMARY KEY (`id`)\n) ENGINE=InnoDB DEFAULT CHARSET=utf8mb4;\n\n/* v8.0.0-beta.7 2025-03-01 */\nCREATE TABLE `notify_rule` (\n `id` bigint unsigned not null auto_increment,\n `name` varchar(255) not null,\n `description` text,\n `enable` tinyint(1) not null default 0,\n `user_group_ids` varchar(255) not null default '',\n `notify_configs` text,\n `create_at` bigint not null default 0,\n `create_by` varchar(64) not null default '',\n `update_at` bigint not null default 0,\n `update_by` varchar(64) not null default '',\n PRIMARY KEY (`id`)\n) ENGINE = InnoDB DEFAULT CHARSET = utf8mb4;\n\nCREATE TABLE `notify_channel` (\n `id` bigint unsigned not null auto_increment,\n `name` varchar(255) not null,\n `ident` varchar(255) not null,\n `description` text, \n `enable` tinyint(1) not null default 0,\n `param_config` text,\n `request_type` varchar(50) not null,\n `request_config` text,\n `create_at` bigint not null default 0,\n `create_by` varchar(64) not null default '',\n `update_at` bigint not null default 0,\n `update_by` varchar(64) not null default '',\n PRIMARY KEY (`id`)\n) ENGINE = InnoDB DEFAULT CHARSET = utf8mb4;\n\nCREATE TABLE `message_template` (\n `id` bigint unsigned not null auto_increment,\n `name` varchar(64) not null,\n `ident` varchar(64) not null,\n `content` text,\n `user_group_ids` varchar(64),\n `notify_channel_ident` varchar(64) not null default '',\n `private` int not null default 0,\n `create_at` bigint not null default 0,\n `create_by` varchar(64) not null default '',\n `update_at` bigint not null default 0,\n `update_by` varchar(64) not null default '',\n PRIMARY KEY (`id`)\n) ENGINE = InnoDB DEFAULT CHARSET = utf8mb4;\n\nALTER TABLE `alert_rule` ADD COLUMN `notify_rule_ids` varchar(1024) DEFAULT '';\nALTER TABLE `alert_rule` ADD COLUMN `notify_version` int DEFAULT 0;\n\nALTER TABLE `alert_subscribe` ADD COLUMN `notify_rule_ids` varchar(1024) DEFAULT '';\nALTER TABLE `alert_subscribe` ADD COLUMN `notify_version` int DEFAULT 0;\n\nALTER TABLE `notification_record` ADD COLUMN `notify_rule_id` BIGINT NOT NULL DEFAULT 0;\n\n\n/* v8.0.0-beta.9 2025-03-17 */\nALTER TABLE `message_template` ADD COLUMN `weight` int not null default 0;\nALTER TABLE `notify_channel` ADD COLUMN `weight` int not null default 0;\n\n/* v8.0.0-beta.11 2025-04-10 */\nALTER TABLE `es_index_pattern` ADD COLUMN `note` varchar(1024) not null default '';\nALTER TABLE `datasource` ADD COLUMN `identifier` varchar(255) not null default '';\n\n/* v8.0.0-beta.11 2025-05-15 */\nALTER TABLE `notify_rule` ADD COLUMN `pipeline_configs` text;\n\nCREATE TABLE `event_pipeline` (\n `id` bigint unsigned not null auto_increment,\n `name` varchar(128) not null,\n `team_ids` text,\n `description` varchar(255) not null default '',\n `filter_enable` tinyint(1) not null default 0,\n `attr_filters` text,\n `processor_configs` text,\n `create_at` bigint not null default 0,\n `create_by` varchar(64) not null default '',\n `update_at` bigint not null default 0,\n `update_by` varchar(64) not null default '',\n PRIMARY KEY (`id`)\n) ENGINE = InnoDB DEFAULT CHARSET = utf8mb4;\n\n/* v8.0.0 2025-05-15 */\nCREATE TABLE `embedded_product` (\n `id` bigint unsigned NOT NULL AUTO_INCREMENT,\n `name` varchar(255) DEFAULT NULL,\n `url` varchar(255) DEFAULT NULL,\n `is_private` boolean DEFAULT NULL,\n `team_ids` varchar(255),\n `create_at` bigint not null default 0,\n `create_by` varchar(64) not null default '',\n `update_at` bigint not null default 0,\n `update_by` varchar(64) not null default '',\n PRIMARY KEY (`id`)\n) ENGINE=InnoDB DEFAULT CHARSET=utf8mb4;\n\n/* v8.0.0 2025-05-29 */\nCREATE TABLE `source_token` (\n `id` bigint unsigned NOT NULL AUTO_INCREMENT,\n `source_type` varchar(64) NOT NULL DEFAULT '' COMMENT 'source type',\n `source_id` varchar(255) NOT NULL DEFAULT '' COMMENT 'source identifier',\n `token` varchar(255) NOT NULL DEFAULT '' COMMENT 'access token',\n `expire_at` bigint NOT NULL DEFAULT 0 COMMENT 'expire timestamp',\n `create_at` bigint NOT NULL DEFAULT 0 COMMENT 'create timestamp',\n `create_by` varchar(64) NOT NULL DEFAULT '' COMMENT 'creator',\n PRIMARY KEY (`id`),\n KEY `idx_source_type_id_token` (`source_type`, `source_id`, `token`)\n) ENGINE=InnoDB DEFAULT CHARSET=utf8mb4;\n\n\n\n/* v8.0.0-beta.12 2025-06-03 */\nALTER TABLE `alert_his_event` ADD COLUMN `notify_rule_ids` text COMMENT 'notify rule ids';\nALTER TABLE `alert_cur_event` ADD COLUMN `notify_rule_ids` text COMMENT 'notify rule ids';\n\n/* v8.0.0-beta.13 */\n-- 删除 builtin_metrics 表的 idx_collector_typ_name 唯一索引\nDROP INDEX IF EXISTS `idx_collector_typ_name` ON `builtin_metrics`;\n\n/* v8.0.0 2025-07-03 */\nALTER TABLE `builtin_metrics` ADD COLUMN `translation` TEXT COMMENT 'translation of metric' AFTER `lang`;\n\n/* v8.4.0 2025-10-15 */\nALTER TABLE `notify_rule` ADD COLUMN `extra_config` text COMMENT 'extra config';\n\n/* v8.4.1 2025-11-10 */\nALTER TABLE `alert_rule` ADD COLUMN `pipeline_configs` text COMMENT 'pipeline configs';\n\n/* v8.4.2 2025-11-13 */\nALTER TABLE `board` ADD COLUMN `note` varchar(1024) not null default '' comment 'note';\nALTER TABLE `builtin_payloads` ADD COLUMN `note` varchar(1024) not null default '' comment 'note of payload';\n\n/* v9 2026-01-09 */\nALTER TABLE `event_pipeline` ADD COLUMN `typ` varchar(128) NOT NULL DEFAULT '' COMMENT 'pipeline type: builtin, user-defined';\nALTER TABLE `event_pipeline` ADD COLUMN `use_case` varchar(128) NOT NULL DEFAULT '' COMMENT 'use case: metric_explorer, event_summary, event_pipeline';\nALTER TABLE `event_pipeline` ADD COLUMN `trigger_mode` varchar(128) NOT NULL DEFAULT 'event' COMMENT 'trigger mode: event, api, cron';\nALTER TABLE `event_pipeline` ADD COLUMN `disabled` tinyint(1) NOT NULL DEFAULT 0 COMMENT 'disabled flag';\nALTER TABLE `event_pipeline` ADD COLUMN `nodes` text COMMENT 'workflow nodes (JSON)';\nALTER TABLE `event_pipeline` ADD COLUMN `connections` text COMMENT 'node connections (JSON)';\nALTER TABLE `event_pipeline` ADD COLUMN `input_variables` text COMMENT 'input variables (JSON)';\nALTER TABLE `event_pipeline` ADD COLUMN `label_filters` text COMMENT 'label filters (JSON)';\n\nCREATE TABLE `event_pipeline_execution` (\n `id` varchar(36) NOT NULL COMMENT 'execution id',\n `pipeline_id` bigint NOT NULL COMMENT 'pipeline id',\n `pipeline_name` varchar(128) DEFAULT '' COMMENT 'pipeline name snapshot',\n `event_id` bigint DEFAULT 0 COMMENT 'related alert event id',\n `mode` varchar(16) NOT NULL DEFAULT 'event' COMMENT 'trigger mode: event/api/cron',\n `status` varchar(16) NOT NULL DEFAULT 'running' COMMENT 'status: running/success/failed',\n `node_results` mediumtext COMMENT 'node execution results (JSON)',\n `error_message` varchar(1024) DEFAULT '' COMMENT 'error message',\n `error_node` varchar(36) DEFAULT '' COMMENT 'error node id',\n `created_at` bigint NOT NULL DEFAULT 0 COMMENT 'start timestamp',\n `finished_at` bigint DEFAULT 0 COMMENT 'finish timestamp',\n `duration_ms` bigint DEFAULT 0 COMMENT 'duration in milliseconds',\n `trigger_by` varchar(64) DEFAULT '' COMMENT 'trigger by',\n `inputs_snapshot` text COMMENT 'inputs snapshot',\n PRIMARY KEY (`id`),\n KEY `idx_pipeline_id` (`pipeline_id`),\n KEY `idx_event_id` (`event_id`),\n KEY `idx_mode` (`mode`),\n KEY `idx_status` (`status`),\n KEY `idx_created_at` (`created_at`)\n) ENGINE=InnoDB DEFAULT CHARSET=utf8mb4 COMMENT='event pipeline execution records';\n\n/* v8.5.0 builtin_metrics new fields */\nALTER TABLE `builtin_metrics` ADD COLUMN `expression_type` varchar(32) NOT NULL DEFAULT 'promql' COMMENT 'expression type: metric_name or promql';\nALTER TABLE `builtin_metrics` ADD COLUMN `metric_type` varchar(191) NOT NULL DEFAULT '' COMMENT 'metric type like counter/gauge';\nALTER TABLE `builtin_metrics` ADD COLUMN `extra_fields` text COMMENT 'custom extra fields';\n\n/* v9 2026-01-16 saved_view */\nCREATE TABLE `saved_view` (\n `id` bigint NOT NULL AUTO_INCREMENT,\n `name` varchar(255) NOT NULL COMMENT 'view name',\n `page` varchar(64) NOT NULL COMMENT 'page identifier',\n `filter` text COMMENT 'filter config (JSON)',\n `public_cate` int NOT NULL DEFAULT 0 COMMENT 'public category: 0-self, 1-team, 2-all',\n `gids` text COMMENT 'team group ids (JSON)',\n `create_at` bigint NOT NULL DEFAULT 0 COMMENT 'create timestamp',\n `create_by` varchar(64) NOT NULL DEFAULT '' COMMENT 'creator',\n `update_at` bigint NOT NULL DEFAULT 0 COMMENT 'update timestamp',\n `update_by` varchar(64) NOT NULL DEFAULT '' COMMENT 'updater',\n PRIMARY KEY (`id`),\n KEY `idx_page` (`page`),\n KEY `idx_create_by` (`create_by`)\n) ENGINE=InnoDB DEFAULT CHARSET=utf8mb4 COMMENT='saved views for pages';\n\nCREATE TABLE `user_view_favorite` (\n `id` bigint NOT NULL AUTO_INCREMENT,\n `view_id` bigint NOT NULL COMMENT 'saved view id',\n `user_id` bigint NOT NULL COMMENT 'user id',\n `create_at` bigint NOT NULL DEFAULT 0 COMMENT 'create timestamp',\n PRIMARY KEY (`id`),\n KEY `idx_view_id` (`view_id`),\n KEY `idx_user_id` (`user_id`)\n) ENGINE=InnoDB DEFAULT CHARSET=utf8mb4 COMMENT='user favorite views';\n\n/* v9 2026-01-20 datasource weight */\nALTER TABLE `datasource` ADD COLUMN `weight` int not null default 0 COMMENT 'weight for sorting';\n\n/* v9 2026-01-20 alert_rule time_zone support */\nALTER TABLE `alert_rule` ADD COLUMN `time_zone` varchar(64) not null default '';"
},
{
"path": "docker/sqlite.sql",
"content": "CREATE TABLE `users` (\n `id` integer primary key autoincrement,\n `username` varchar(64) not null unique,\n `nickname` varchar(64) not null,\n `password` varchar(128) not null default '',\n `phone` varchar(16) not null default '',\n `email` varchar(64) not null default '',\n `portrait` varchar(255) not null default '',\n `roles` varchar(255) not null,\n `contacts` varchar(1024),\n `maintainer` tinyint(1) not null default 0,\n `belong` varchar(16) not null default '',\n `last_active_time` bigint not null default 0,\n `create_at` bigint not null default 0,\n `create_by` varchar(64) not null default '',\n `update_at` bigint not null default 0,\n `update_by` varchar(64) not null default ''\n);\n\nCREATE UNIQUE INDEX idx_users_username ON `users` (username);\n\ninsert into `users`(id, username, nickname, password, roles, create_at, create_by, update_at, update_by) values(1, 'root', '超管', 'root.2020', 'Admin', strftime('%s', 'now'), 'system', strftime('%s', 'now'), 'system');\n\nCREATE TABLE `user_group` (\n `id` integer primary key autoincrement,\n `name` varchar(128) not null default '',\n `note` varchar(255) not null default '',\n `create_at` bigint not null default 0,\n `create_by` varchar(64) not null default '',\n `update_at` bigint not null default 0,\n `update_by` varchar(64) not null default ''\n);\nCREATE INDEX `idx_user_group_create_by` ON `user_group` (`create_by` asc);\nCREATE INDEX `idx_user_group_update_at` ON `user_group` (`update_at` asc);\n\ninsert into user_group(id, name, create_at, create_by, update_at, update_by) values(1, 'demo-root-group', strftime('%s', 'now'), 'root', strftime('%s', 'now'), 'root');\n\nCREATE TABLE `user_group_member` (\n `id` integer primary key autoincrement,\n `group_id` bigint unsigned not null,\n `user_id` bigint unsigned not null\n);\nCREATE INDEX `idx_user_group_member_group_id` ON `user_group_member` (`group_id` asc);\nCREATE INDEX `idx_user_group_member_user_id` ON `user_group_member` (`user_id` asc);\n\ninsert into user_group_member(group_id, user_id) values(1, 1);\n\nCREATE TABLE `configs` (\n `id` integer primary key autoincrement,\n `ckey` varchar(191) not null,\n `cval` text not null,\n `note` varchar(1024) not null default '',\n `external` tinyint(1) not null default 0,\n `encrypted` tinyint(1) not null default 0,\n `create_at` bigint not null default 0,\n `create_by` varchar(64) not null default '',\n `update_at` bigint not null default 0,\n `update_by` varchar(64) not null default ''\n);\n\nCREATE TABLE `role` (\n `id` integer primary key autoincrement,\n `name` varchar(191) not null unique default '',\n `note` varchar(255) not null default ''\n);\n\ninsert into `role`(name, note) values('Admin', 'Administrator role');\ninsert into `role`(name, note) values('Standard', 'Ordinary user role');\ninsert into `role`(name, note) values('Guest', 'Readonly user role');\n\n\nCREATE TABLE `role_operation`(\n `id` integer primary key autoincrement,\n `role_name` varchar(128) not null,\n `operation` varchar(191) not null\n);\nCREATE INDEX `idx_role_operation_role_name` ON `role_operation` (`role_name` asc);\nCREATE INDEX `idx_role_operation_operation` ON `role_operation` (`operation` asc);\n\n-- Admin is special, who has no concrete operation but can do anything.\ninsert into `role_operation`(role_name, operation) values('Guest', '/metric/explorer');\ninsert into `role_operation`(role_name, operation) values('Guest', '/object/explorer');\ninsert into `role_operation`(role_name, operation) values('Guest', '/log/explorer');\ninsert into `role_operation`(role_name, operation) values('Guest', '/trace/explorer');\ninsert into `role_operation`(role_name, operation) values('Guest', '/help/version');\ninsert into `role_operation`(role_name, operation) values('Guest', '/help/contact');\n\ninsert into `role_operation`(role_name, operation) values('Standard', '/metric/explorer');\ninsert into `role_operation`(role_name, operation) values('Standard', '/object/explorer');\ninsert into `role_operation`(role_name, operation) values('Standard', '/log/explorer');\ninsert into `role_operation`(role_name, operation) values('Standard', '/trace/explorer');\ninsert into `role_operation`(role_name, operation) values('Standard', '/help/version');\ninsert into `role_operation`(role_name, operation) values('Standard', '/help/contact');\ninsert into `role_operation`(role_name, operation) values('Standard', '/help/servers');\ninsert into `role_operation`(role_name, operation) values('Standard', '/help/migrate');\ninsert into `role_operation`(role_name, operation) values('Standard', '/alert-rules-built-in');\ninsert into `role_operation`(role_name, operation) values('Standard', '/dashboards-built-in');\ninsert into `role_operation`(role_name, operation) values('Standard', '/trace/dependencies');\n\ninsert into `role_operation`(role_name, operation) values('Admin', '/help/source');\ninsert into `role_operation`(role_name, operation) values('Admin', '/help/sso');\ninsert into `role_operation`(role_name, operation) values('Admin', '/help/notification-tpls');\ninsert into `role_operation`(role_name, operation) values('Admin', '/help/notification-settings');\n\ninsert into `role_operation`(role_name, operation) values('Standard', '/users');\ninsert into `role_operation`(role_name, operation) values('Standard', '/user-groups');\ninsert into `role_operation`(role_name, operation) values('Standard', '/user-groups/add');\ninsert into `role_operation`(role_name, operation) values('Standard', '/user-groups/put');\ninsert into `role_operation`(role_name, operation) values('Standard', '/user-groups/del');\ninsert into `role_operation`(role_name, operation) values('Standard', '/busi-groups');\ninsert into `role_operation`(role_name, operation) values('Standard', '/busi-groups/add');\ninsert into `role_operation`(role_name, operation) values('Standard', '/busi-groups/put');\ninsert into `role_operation`(role_name, operation) values('Standard', '/busi-groups/del');\ninsert into `role_operation`(role_name, operation) values('Standard', '/targets');\ninsert into `role_operation`(role_name, operation) values('Standard', '/targets/add');\ninsert into `role_operation`(role_name, operation) values('Standard', '/targets/put');\ninsert into `role_operation`(role_name, operation) values('Standard', '/targets/del');\ninsert into `role_operation`(role_name, operation) values('Standard', '/dashboards');\ninsert into `role_operation`(role_name, operation) values('Standard', '/dashboards/add');\ninsert into `role_operation`(role_name, operation) values('Standard', '/dashboards/put');\ninsert into `role_operation`(role_name, operation) values('Standard', '/dashboards/del');\ninsert into `role_operation`(role_name, operation) values('Standard', '/alert-rules');\ninsert into `role_operation`(role_name, operation) values('Standard', '/alert-rules/add');\ninsert into `role_operation`(role_name, operation) values('Standard', '/alert-rules/put');\ninsert into `role_operation`(role_name, operation) values('Standard', '/alert-rules/del');\ninsert into `role_operation`(role_name, operation) values('Standard', '/alert-mutes');\ninsert into `role_operation`(role_name, operation) values('Standard', '/alert-mutes/add');\ninsert into `role_operation`(role_name, operation) values('Standard', '/alert-mutes/del');\ninsert into `role_operation`(role_name, operation) values('Standard', '/alert-subscribes');\ninsert into `role_operation`(role_name, operation) values('Standard', '/alert-subscribes/add');\ninsert into `role_operation`(role_name, operation) values('Standard', '/alert-subscribes/put');\ninsert into `role_operation`(role_name, operation) values('Standard', '/alert-subscribes/del');\ninsert into `role_operation`(role_name, operation) values('Standard', '/alert-cur-events');\ninsert into `role_operation`(role_name, operation) values('Standard', '/alert-cur-events/del');\ninsert into `role_operation`(role_name, operation) values('Standard', '/alert-his-events');\ninsert into `role_operation`(role_name, operation) values('Standard', '/job-tpls');\ninsert into `role_operation`(role_name, operation) values('Standard', '/job-tpls/add');\ninsert into `role_operation`(role_name, operation) values('Standard', '/job-tpls/put');\ninsert into `role_operation`(role_name, operation) values('Standard', '/job-tpls/del');\ninsert into `role_operation`(role_name, operation) values('Standard', '/job-tasks');\ninsert into `role_operation`(role_name, operation) values('Standard', '/job-tasks/add');\ninsert into `role_operation`(role_name, operation) values('Standard', '/job-tasks/put');\ninsert into `role_operation`(role_name, operation) values('Standard', '/recording-rules');\ninsert into `role_operation`(role_name, operation) values('Standard', '/recording-rules/add');\ninsert into `role_operation`(role_name, operation) values('Standard', '/recording-rules/put');\ninsert into `role_operation`(role_name, operation) values('Standard', '/recording-rules/del');\n\n-- for alert_rule | collect_rule | mute | dashboard grouping\nCREATE TABLE `busi_group` (\n `id` integer primary key autoincrement,\n `name` varchar(191) not null unique,\n `label_enable` tinyint(1) not null default 0,\n `label_value` varchar(191) not null default '',\n `create_at` bigint not null default 0,\n `create_by` varchar(64) not null default '',\n `update_at` bigint not null default 0,\n `update_by` varchar(64) not null default ''\n);\n\ninsert into busi_group(id, name, create_at, create_by, update_at, update_by) values(1, 'Default Busi Group', strftime('%s', 'now'), 'root', strftime('%s', 'now'), 'root');\n\nCREATE TABLE `busi_group_member` (\n `id` integer primary key autoincrement,\n `busi_group_id` bigint not null,\n `user_group_id` bigint not null,\n `perm_flag` char(2) not null\n);\nCREATE INDEX `idx_busi_group_member_busi_group_id` ON `busi_group_member` (`busi_group_id` asc);\nCREATE INDEX `idx_busi_group_member_user_group_id` ON `busi_group_member` (`user_group_id` asc);\n\ninsert into busi_group_member(busi_group_id, user_group_id, perm_flag) values(1, 1, 'rw');\n\n-- for dashboard new version\nCREATE TABLE `board` (\n `id` integer primary key autoincrement,\n `group_id` bigint not null default 0,\n `name` varchar(191) not null,\n `ident` varchar(200) not null default '',\n `tags` varchar(255) not null,\n `public` tinyint(1) not null default 0,\n `built_in` tinyint(1) not null default 0,\n `hide` tinyint(1) not null default 0,\n `create_at` bigint not null default 0,\n `create_by` varchar(64) not null default '',\n `update_at` bigint not null default 0,\n `update_by` varchar(64) not null default '',\n `note` varchar(1024) not null default '',\n `public_cate` bigint not null default 0\n);\nCREATE UNIQUE INDEX idx_board_group_id_name ON `board` (group_id, name);\nCREATE INDEX `idx_board_ident` ON `board` (`ident` asc);\n\n-- for dashboard new version\nCREATE TABLE `board_payload` (\n `id` bigint unsigned not null unique,\n `payload` mediumtext not null\n);\n\nCREATE TABLE `chart` (\n `id` integer primary key autoincrement,\n `group_id` integer not null,\n `configs` text,\n `weight` integer not null default 0\n);\n\nCREATE INDEX idx_chart_group_id ON `chart` (group_id);\n\nCREATE TABLE `chart_share` (\n `id` integer primary key autoincrement,\n `cluster` varchar(128) not null,\n `datasource_id` bigint unsigned not null default 0,\n `configs` text,\n `create_at` bigint not null default 0,\n `create_by` varchar(64) not null default ''\n);\nCREATE INDEX `idx_chart_share_create_at` ON `chart_share` (`create_at` asc);\n\nCREATE TABLE `alert_rule` (\n `id` integer primary key autoincrement,\n `group_id` bigint not null default 0,\n `cate` varchar(128) not null,\n `datasource_ids` varchar(255) not null default '',\n `cluster` varchar(128) not null,\n `name` varchar(255) not null,\n `note` varchar(1024) not null default '',\n `prod` varchar(255) not null default '',\n `algorithm` varchar(255) not null default '',\n `algo_params` varchar(255),\n `delay` int not null default 0,\n `severity` tinyint(1) not null,\n `disabled` tinyint(1) not null,\n `prom_for_duration` int not null,\n `rule_config` text not null,\n `prom_ql` text not null,\n `prom_eval_interval` int not null,\n `enable_stime` varchar(255) not null default '00:00',\n `enable_etime` varchar(255) not null default '23:59',\n `enable_days_of_week` varchar(255) not null default '',\n `enable_in_bg` tinyint(1) not null default 0,\n `notify_recovered` tinyint(1) not null,\n `notify_channels` varchar(255) not null default '',\n `notify_groups` varchar(255) not null default '',\n `notify_repeat_step` int not null default 0,\n `notify_max_number` int not null default 0,\n `recover_duration` int not null default 0 ,\n `callbacks` varchar(4096) not null default '',\n `runbook_url` varchar(4096),\n `append_tags` varchar(255) not null default '',\n `annotations` text not null,\n `extra_config` text not null,\n `create_at` bigint not null default 0,\n `create_by` varchar(64) not null default '',\n `update_at` bigint not null default 0,\n `update_by` varchar(64) not null default '',\n `cron_pattern` varchar(64),\n `time_zone` varchar(64) not null default '',\n `datasource_queries` text\n);\nCREATE INDEX `idx_alert_rule_group_id` ON `alert_rule` (`group_id` asc);\nCREATE INDEX `idx_alert_rule_update_at` ON `alert_rule` (`update_at` asc);\n\nCREATE TABLE `alert_mute` (\n `id` integer primary key autoincrement,\n `group_id` bigint not null default 0,\n `prod` varchar(255) not null default '',\n `note` varchar(1024) not null default '',\n `cate` varchar(128) not null,\n `cluster` varchar(128) not null,\n `datasource_ids` varchar(255) not null default '',\n `tags` varchar(4096) default '[]',\n `cause` varchar(255) not null default '',\n `btime` bigint not null default 0,\n `etime` bigint not null default 0,\n `disabled` tinyint(1) not null default 0,\n `mute_time_type` tinyint(1) not null default 0,\n `periodic_mutes` varchar(4096) not null default '',\n `severities` varchar(32) not null default '',\n `create_at` bigint not null default 0,\n `create_by` varchar(64) not null default '',\n `update_at` bigint not null default 0,\n `update_by` varchar(64) not null default ''\n);\nCREATE INDEX `idx_alert_mute_create_at` ON `alert_mute` (`create_at` asc);\nCREATE INDEX `idx_alert_mute_group_id` ON `alert_mute` (`group_id` asc);\n\nCREATE TABLE `alert_subscribe` (\n `id` integer primary key autoincrement,\n `name` varchar(255) not null default '',\n `disabled` tinyint(1) not null default 0,\n `group_id` bigint not null default 0,\n `prod` varchar(255) not null default '',\n `cate` varchar(128) not null,\n `datasource_ids` varchar(255) not null default '',\n `cluster` varchar(128) not null,\n `rule_id` bigint not null default 0,\n `severities` varchar(32) not null default '',\n `tags` varchar(4096) not null default '',\n `redefine_severity` tinyint(1) default 0,\n `new_severity` tinyint(1) not null,\n `redefine_channels` tinyint(1) default 0,\n `new_channels` varchar(255) not null default '',\n `user_group_ids` varchar(250) not null,\n `busi_groups` VARCHAR(4096) NOT NULL DEFAULT '[]',\n `note` VARCHAR(1024) DEFAULT '',\n `rule_ids` VARCHAR(1024) DEFAULT '',\n `webhooks` text not null,\n `extra_config` text not null,\n `redefine_webhooks` tinyint(1) default 0,\n `for_duration` bigint not null default 0,\n `create_at` bigint not null default 0,\n `create_by` varchar(64) not null default '',\n `update_at` bigint not null default 0,\n `update_by` varchar(64) not null default ''\n);\nCREATE INDEX `idx_alert_subscribe_update_at` ON `alert_subscribe` (`update_at` asc);\nCREATE INDEX `idx_alert_subscribe_group_id` ON `alert_subscribe` (`group_id` asc);\n\n\nCREATE TABLE `target` (\n `id` integer primary key autoincrement,\n `group_id` bigint not null default 0,\n `ident` varchar(191) not null unique,\n `note` varchar(255) not null default '',\n `tags` varchar(512) not null default '',\n `host_ip` varchar(15) default '',\n `agent_version` varchar(255) default '',\n `host_tags` text,\n `engine_name` varchar(255) default '',\n `os` varchar(31) default '',\n `update_at` bigint not null default 0\n);\n\nCREATE INDEX `idx_target_group_id` ON `target` (`group_id` asc);\nCREATE UNIQUE INDEX idx_target_ident ON `target` (ident);\nCREATE INDEX idx_host_ip ON `target` (host_ip);\nCREATE INDEX idx_agent_version ON `target` (agent_version);\nCREATE INDEX idx_engine_name ON `target` (engine_name);\nCREATE INDEX idx_os ON `target` (os);\n\nCREATE TABLE `metric_view` (\n `id` integer primary key autoincrement,\n `name` varchar(191) not null default '',\n `cate` tinyint(1) not null,\n `configs` varchar(8192) not null default '',\n `create_at` bigint not null default 0,\n `create_by` bigint not null default 0,\n `update_at` bigint not null default 0\n);\nCREATE INDEX `idx_metric_view_create_by` ON `metric_view` (`create_by` asc);\n\ninsert into metric_view(name, cate, configs) values('Host View', 0, '{\"filters\":[{\"oper\":\"=\",\"label\":\"__name__\",\"value\":\"cpu_usage_idle\"}],\"dynamicLabels\":[],\"dimensionLabels\":[{\"label\":\"ident\",\"value\":\"\"}]}');\n\nCREATE TABLE `recording_rule` (\n `id` integer primary key autoincrement,\n `group_id` bigint not null default '0',\n `datasource_ids` varchar(255) not null default '',\n `cluster` varchar(128) not null,\n `name` varchar(255) not null,\n `note` varchar(255) not null,\n `disabled` tinyint(1) not null default 0,\n `prom_ql` varchar(8192) not null,\n `prom_eval_interval` int not null,\n `cron_pattern` varchar(255) default '',\n `append_tags` varchar(255) default '',\n `query_configs` text not null,\n `create_at` bigint default '0',\n `create_by` varchar(64) default '',\n `update_at` bigint default '0',\n `update_by` varchar(64) default '',\n `datasource_queries` text\n);\nCREATE INDEX `idx_recording_rule_group_id` ON `recording_rule` (`group_id` asc);\nCREATE INDEX `idx_recording_rule_update_at` ON `recording_rule` (`update_at` asc);\n\nCREATE TABLE `alert_aggr_view` (\n `id` integer primary key autoincrement,\n `name` varchar(191) not null default '',\n `rule` varchar(2048) not null default '',\n `cate` tinyint(1) not null,\n `create_at` bigint not null default 0,\n `create_by` bigint not null default 0,\n `update_at` bigint not null default 0\n);\nCREATE INDEX `idx_alert_aggr_view_create_by` ON `alert_aggr_view` (`create_by` asc);\n\ninsert into alert_aggr_view(name, rule, cate) values('By BusiGroup, Severity', 'field:group_name::field:severity', 0);\ninsert into alert_aggr_view(name, rule, cate) values('By RuleName', 'field:rule_name', 0);\n\nCREATE TABLE `alert_cur_event` (\n `id` integer primary key autoincrement,\n `cate` varchar(128) not null,\n `datasource_id` bigint not null default 0,\n `cluster` varchar(128) not null,\n `group_id` bigint unsigned not null,\n `group_name` varchar(255) not null default '',\n `hash` varchar(64) not null,\n `rule_id` bigint unsigned not null,\n `rule_name` varchar(255) not null,\n `rule_note` varchar(2048) not null default 'alert rule note',\n `rule_prod` varchar(255) not null default '',\n `rule_algo` varchar(255) not null default '',\n `severity` tinyint(1) not null,\n `prom_for_duration` int not null,\n `prom_ql` varchar(8192) not null,\n `prom_eval_interval` int not null,\n `callbacks` varchar(255) not null default '',\n `runbook_url` varchar(255),\n `notify_recovered` tinyint(1) not null,\n `notify_channels` varchar(255) not null default '',\n `notify_groups` varchar(255) not null default '',\n `notify_repeat_next` bigint not null default 0,\n `notify_cur_number` int not null default 0,\n `target_ident` varchar(191) not null default '',\n `target_note` varchar(191) not null default '',\n `first_trigger_time` bigint,\n `trigger_time` bigint not null,\n `trigger_value` varchar(2048) not null,\n `annotations` text not null,\n `rule_config` text not null,\n `tags` varchar(1024) not null default ''\n);\nCREATE INDEX `idx_alert_cur_event_hash` ON `alert_cur_event` (`hash` asc);\nCREATE INDEX `idx_alert_cur_event_rule_id` ON `alert_cur_event` (`rule_id` asc);\nCREATE INDEX `idx_alert_cur_event_trigger_time_group_id` ON `alert_cur_event` (`trigger_time`, `group_id` asc);\nCREATE INDEX `idx_alert_cur_event_notify_repeat_next` ON `alert_cur_event` (`notify_repeat_next` asc);\n\nCREATE TABLE `alert_his_event` (\n `id` integer primary key autoincrement,\n `is_recovered` tinyint(1) not null,\n `cate` varchar(128) not null,\n `datasource_id` bigint not null default 0,\n `cluster` varchar(128) not null,\n `group_id` bigint unsigned not null,\n `group_name` varchar(255) not null default '',\n `hash` varchar(64) not null,\n `rule_id` bigint unsigned not null,\n `rule_name` varchar(255) not null,\n `rule_note` varchar(2048) not null default 'alert rule note',\n `rule_prod` varchar(255) not null default '',\n `rule_algo` varchar(255) not null default '',\n `severity` tinyint(1) not null,\n `prom_for_duration` int not null,\n `prom_ql` varchar(8192) not null,\n `prom_eval_interval` int not null,\n `callbacks` varchar(255) not null default '',\n `runbook_url` varchar(255),\n `notify_recovered` tinyint(1) not null,\n `notify_channels` varchar(255) not null default '',\n `notify_groups` varchar(255) not null default '',\n `notify_cur_number` int not null default 0,\n `target_ident` varchar(191) not null default '',\n `target_note` varchar(191) not null default '',\n `first_trigger_time` bigint,\n `trigger_time` bigint not null,\n `trigger_value` varchar(2048) not null,\n `recover_time` bigint not null default 0,\n `last_eval_time` bigint not null default 0,\n `original_tags` varchar(8192),\n `tags` varchar(1024) not null default '',\n `annotations` text not null,\n `rule_config` text not null\n);\nCREATE INDEX `idx_alert_his_event_last_eval_time` ON `alert_his_event` (`last_eval_time` asc);\nCREATE INDEX `idx_alert_his_event_hash` ON `alert_his_event` (`hash` asc);\nCREATE INDEX `idx_alert_his_event_rule_id` ON `alert_his_event` (`rule_id` asc);\nCREATE INDEX `idx_alert_his_event_trigger_time_group_id` ON `alert_his_event` (`trigger_time`, `group_id` asc);\n\nCREATE TABLE `board_busigroup` (\n `busi_group_id` bigint(20) NOT NULL DEFAULT '0',\n `board_id` bigint(20) NOT NULL DEFAULT '0',\n primary key (`busi_group_id`, `board_id`)\n);\n\nCREATE TABLE `builtin_components` (\n `id` integer primary key autoincrement,\n `ident` varchar(191) not null,\n `logo` varchar(191) not null,\n `readme` text not null,\n `created_at` bigint(20) not null default 0,\n `created_by` varchar(191) not null default '',\n `updated_at` bigint(20) not null default 0,\n `updated_by` varchar(191) not null default ''\n);\nCREATE INDEX `idx_builtin_components_ident` ON `builtin_components` (`ident` asc);\n\nCREATE TABLE `builtin_payloads` (\n `id` integer primary key autoincrement,\n `component_id` integer not null default 0,\n `uuid` integer not null,\n `type` varchar(191) not null,\n `component` varchar(191) not null,\n `cate` varchar(191) not null,\n `name` varchar(191) not null,\n `tags` varchar(191) not null default '',\n `content` longtext not null,\n `note` varchar(1024) not null default '',\n `created_at` bigint(20) not null default 0,\n `created_by` varchar(191) not null default '',\n `updated_at` bigint(20) not null default 0,\n `updated_by` varchar(191) not null default ''\n);\nCREATE INDEX `idx_builtin_payloads_component` ON `builtin_payloads` (`component` asc);\nCREATE INDEX `idx_builtin_payloads_name` ON `builtin_payloads` (`name` asc);\nCREATE INDEX `idx_builtin_payloads_cate` ON `builtin_payloads` (`cate` asc);\nCREATE INDEX `idx_builtin_payloads_type` ON `builtin_payloads` (`type` asc);\nCREATE INDEX idx_uuid ON `builtin_payloads` (uuid);\n\n\nCREATE TABLE `notification_record` (\n `id` integer primary key autoincrement,\n `event_id` integer not null,\n `sub_id` integer,\n `channel` varchar(255) not null,\n `status` integer,\n `target` varchar(1024) not null,\n `details` varchar(2048) default '',\n `created_at` integer not null\n);\nCREATE INDEX idx_evt ON notification_record (event_id);\n\nCREATE TABLE `task_tpl` (\n `id` integer primary key autoincrement,\n `group_id` int unsigned not null,\n `title` varchar(255) not null default '',\n `account` varchar(64) not null,\n `batch` int unsigned not null default 0,\n `tolerance` int unsigned not null default 0,\n `timeout` int unsigned not null default 0,\n `pause` varchar(255) not null default '',\n `script` text not null,\n `args` varchar(512) not null default '',\n `tags` varchar(255) not null default '',\n `create_at` bigint not null default 0,\n `create_by` varchar(64) not null default '',\n `update_at` bigint not null default 0,\n `update_by` varchar(64) not null default ''\n);\nCREATE INDEX `idx_task_tpl_group_id` ON `task_tpl` (`group_id` asc);\n\nCREATE TABLE `task_tpl_host` (\n `ii` integer primary key autoincrement,\n `id` int unsigned not null,\n `host` varchar(128) not null\n);\nCREATE INDEX `idx_task_tpl_host_id_host` ON `task_tpl_host` (`id`, `host` asc);\n\nCREATE TABLE `task_record` (\n `id` integer primary key autoincrement,\n `event_id` bigint not null default 0,\n `group_id` bigint not null,\n `ibex_address` varchar(128) not null,\n `ibex_auth_user` varchar(128) not null default '',\n `ibex_auth_pass` varchar(128) not null default '',\n `title` varchar(255) not null default '',\n `account` varchar(64) not null,\n `batch` int unsigned not null default 0,\n `tolerance` int unsigned not null default 0,\n `timeout` int unsigned not null default 0,\n `pause` varchar(255) not null default '',\n `script` text not null,\n `args` varchar(512) not null default '',\n `create_at` bigint not null default 0,\n `create_by` varchar(64) not null default ''\n);\nCREATE INDEX `idx_task_record_create_at_group_id` ON `task_record` (`create_at`, `group_id` asc);\nCREATE INDEX `idx_task_record_create_by` ON `task_record` (`create_by` asc);\nCREATE INDEX `idx_task_record_event_id` ON `task_record` (`event_id` asc);\n\n\nCREATE TABLE `alerting_engines` (\n `id` integer primary key autoincrement,\n `instance` varchar(128) not null default '',\n `datasource_id` bigint not null default 0,\n `engine_cluster` varchar(128) not null default '',\n `clock` bigint not null\n);\n\nCREATE TABLE `datasource`\n(\n `id` integer primary key autoincrement,\n `name` varchar(191) not null default '' unique,\n `description` varchar(255) not null default '',\n `category` varchar(255) not null default '',\n `plugin_id` int unsigned not null default 0,\n `plugin_type` varchar(255) not null default '',\n `plugin_type_name` varchar(255) not null default '',\n `cluster_name` varchar(255) not null default '',\n `settings` text not null,\n `status` varchar(255) not null default '',\n `http` varchar(4096) not null default '',\n `auth` varchar(8192) not null default '',\n `is_default` tinyint not null default 0,\n `weight` int not null default 0,\n `created_at` bigint not null default 0,\n `created_by` varchar(64) not null default '',\n `updated_at` bigint not null default 0,\n `updated_by` varchar(64) not null default ''\n);\n\nCREATE UNIQUE INDEX idx_datasource_name ON datasource (name);\n\nCREATE TABLE `builtin_cate` (\n `id` integer primary key autoincrement,\n `name` varchar(191) not null,\n `user_id` bigint not null default 0\n);\n\nCREATE TABLE `notify_tpl` (\n `id` integer primary key autoincrement,\n `channel` varchar(32) not null unique,\n `name` varchar(255) not null,\n `content` text not null,\n `create_at` bigint not null default 0,\n `create_by` varchar(64) not null default '',\n `update_at` bigint not null default 0,\n `update_by` varchar(64) not null default ''\n);\n\nCREATE UNIQUE INDEX idx_notify_tpl_channel ON notify_tpl (channel);\n\nCREATE TABLE `sso_config` (\n `id` integer primary key autoincrement,\n `name` varchar(191) not null unique,\n `content` text not null,\n `update_at` bigint not null default 0\n);\n\nCREATE UNIQUE INDEX idx_sso_config_name ON sso_config (name);\n\nCREATE TABLE `es_index_pattern` (\n `id` integer primary key autoincrement,\n `datasource_id` bigint not null default 0,\n `name` varchar(191) not null,\n `time_field` varchar(128) not null default '@timestamp',\n `allow_hide_system_indices` tinyint(1) not null default 0,\n `fields_format` varchar(4096) not null default '',\n `cross_cluster_enabled` int not null default 0,\n `create_at` bigint default '0',\n `create_by` varchar(64) default '',\n `update_at` bigint default '0',\n `update_by` varchar(64) default '',\n unique (`datasource_id`, `name`)\n);\n\nCREATE UNIQUE INDEX idx_es_index_pattern_datasource_id_name ON es_index_pattern (datasource_id, name);\n\nCREATE TABLE `builtin_metrics` (\n `id` integer primary key autoincrement,\n `collector` varchar(191) NOT NULL,\n `typ` varchar(191) NOT NULL,\n `name` varchar(191) NOT NULL,\n `unit` varchar(191) NOT NULL,\n `lang` varchar(191) NOT NULL DEFAULT '',\n `note` varchar(4096) NOT NULL,\n `expression` varchar(4096) NOT NULL,\n `expression_type` varchar(32) NOT NULL DEFAULT 'promql',\n `metric_type` varchar(191) NOT NULL DEFAULT '',\n `extra_fields` text,\n `created_at` bigint NOT NULL DEFAULT 0,\n `created_by` varchar(191) NOT NULL DEFAULT '',\n `updated_at` bigint NOT NULL DEFAULT 0,\n `updated_by` varchar(191) NOT NULL DEFAULT '',\n `uuid integer` not null default 0\n);\n\nCREATE INDEX idx_collector ON builtin_metrics (collector);\nCREATE INDEX idx_typ ON builtin_metrics (typ);\nCREATE INDEX idx_builtinmetric_name ON builtin_metrics (name);\nCREATE INDEX idx_lang ON builtin_metrics (lang);\n\n\nCREATE TABLE `metric_filter` (\n `id` integer primary key autoincrement,\n `name` varchar(191) NOT NULL,\n `configs` varchar(4096) NOT NULL,\n `groups_perm` text,\n `create_at` bigint NOT NULL DEFAULT '0',\n `create_by` varchar(191) NOT NULL DEFAULT '',\n `update_at` bigint NOT NULL DEFAULT '0',\n `update_by` varchar(191) NOT NULL DEFAULT ''\n);\nCREATE INDEX `idx_metric_filter_name` ON `metric_filter` (`name` asc);\n\nCREATE TABLE `target_busi_group` (\n `id` integer primary key autoincrement,\n `target_ident` varchar(191) not null,\n `group_id` integer not null,\n `update_at` integer not null\n);\n\nCREATE UNIQUE INDEX idx_target_busi_group ON target_busi_group (target_ident, group_id);\n\n\nCREATE TABLE `dash_annotation` (\n `id` integer primary key autoincrement,\n `dashboard_id` bigint not null,\n `panel_id` varchar(191) not null,\n `tags` text,\n `description` text,\n `config` text,\n `time_start` bigint not null default 0,\n `time_end` bigint not null default 0,\n `create_at` bigint not null default 0,\n `create_by` varchar(64) not null default '',\n `update_at` bigint not null default 0,\n `update_by` varchar(64) not null default ''\n);\n\nCREATE TABLE `task_meta`\n(\n `id` integer primary key autoincrement,\n `title` varchar(255) not null default '',\n `account` varchar(64) not null,\n `batch` int unsigned not null default 0,\n `tolerance` int unsigned not null default 0,\n `timeout` int unsigned not null default 0,\n `pause` varchar(255) not null default '',\n `script` text not null,\n `args` varchar(512) not null default '',\n `stdin` varchar(1024) not null default '',\n `creator` varchar(64) not null default '',\n `created` timestamp not null default CURRENT_TIMESTAMP\n);\nCREATE INDEX `idx_task_meta_creator` ON `task_meta` (`creator` asc);\nCREATE INDEX `idx_task_meta_created` ON `task_meta` (`created` asc);\n\n\n/* start|cancel|kill|pause */\nCREATE TABLE `task_action`\n(\n `id` integer primary key autoincrement,\n `action` varchar(32) not null,\n `clock` bigint not null default 0\n);\n\nCREATE TABLE `task_scheduler`\n(\n `id` bigint unsigned not null,\n `scheduler` varchar(128) not null default ''\n);\nCREATE INDEX `idx_task_scheduler_id_scheduler` ON `task_scheduler` (`id`, `scheduler` asc);\n\nCREATE TABLE `task_scheduler_health`\n(\n `scheduler` varchar(128) not null unique,\n `clock` bigint not null\n);\nCREATE INDEX `idx_task_scheduler_health_clock` ON `task_scheduler_health` (`clock` asc);\n\nCREATE TABLE `task_host_doing`\n(\n `id` bigint unsigned not null,\n `host` varchar(128) not null,\n `clock` bigint not null default 0,\n `action` varchar(16) not null\n);\nCREATE INDEX `idx_task_host_doing_id` ON `task_host_doing` (`id` asc);\nCREATE INDEX `idx_task_host_doing_host` ON `task_host_doing` (`host` asc);\n\nCREATE TABLE task_host_0\n(\n `ii` integer primary key autoincrement,\n `id` bigint unsigned not null,\n `host` varchar(128) not null,\n `status` varchar(32) not null,\n `stdout` text,\n `stderr` text,\n unique (`id`, `host`)\n);\n\nCREATE TABLE task_host_1\n(\n `ii` integer primary key autoincrement,\n `id` bigint unsigned not null,\n `host` varchar(128) not null,\n `status` varchar(32) not null,\n `stdout` text,\n `stderr` text,\n unique (`id`, `host`)\n);\n\nCREATE TABLE task_host_2\n(\n `ii` integer primary key autoincrement,\n `id` bigint unsigned not null,\n `host` varchar(128) not null,\n `status` varchar(32) not null,\n `stdout` text,\n `stderr` text,\n unique (`id`, `host`)\n);\n\nCREATE TABLE task_host_3\n(\n `ii` integer primary key autoincrement,\n `id` bigint unsigned not null,\n `host` varchar(128) not null,\n `status` varchar(32) not null,\n `stdout` text,\n `stderr` text,\n unique (`id`, `host`)\n);\n\nCREATE TABLE task_host_4\n(\n `ii` integer primary key autoincrement,\n `id` bigint unsigned not null,\n `host` varchar(128) not null,\n `status` varchar(32) not null,\n `stdout` text,\n `stderr` text,\n unique (`id`, `host`)\n);\n\nCREATE TABLE task_host_5\n(\n `ii` integer primary key autoincrement,\n `id` bigint unsigned not null,\n `host` varchar(128) not null,\n `status` varchar(32) not null,\n `stdout` text,\n `stderr` text,\n unique (`id`, `host`)\n);\n\nCREATE TABLE task_host_6\n(\n `ii` integer primary key autoincrement,\n `id` bigint unsigned not null,\n `host` varchar(128) not null,\n `status` varchar(32) not null,\n `stdout` text,\n `stderr` text,\n unique (`id`, `host`)\n);\n\nCREATE TABLE task_host_7\n(\n `ii` integer primary key autoincrement,\n `id` bigint unsigned not null,\n `host` varchar(128) not null,\n `status` varchar(32) not null,\n `stdout` text,\n `stderr` text,\n unique (`id`, `host`)\n);\n\nCREATE TABLE task_host_8\n(\n `ii` integer primary key autoincrement,\n `id` bigint unsigned not null,\n `host` varchar(128) not null,\n `status` varchar(32) not null,\n `stdout` text,\n `stderr` text,\n unique (`id`, `host`)\n);\n\nCREATE TABLE task_host_9\n(\n `ii` integer primary key autoincrement,\n `id` bigint unsigned not null,\n `host` varchar(128) not null,\n `status` varchar(32) not null,\n `stdout` text,\n `stderr` text,\n unique (`id`, `host`)\n);\n\nCREATE TABLE task_host_10\n(\n `ii` integer primary key autoincrement,\n `id` bigint unsigned not null,\n `host` varchar(128) not null,\n `status` varchar(32) not null,\n `stdout` text,\n `stderr` text,\n unique (`id`, `host`)\n);\n\nCREATE TABLE task_host_11\n(\n `ii` integer primary key autoincrement,\n `id` bigint unsigned not null,\n `host` varchar(128) not null,\n `status` varchar(32) not null,\n `stdout` text,\n `stderr` text,\n unique (`id`, `host`)\n);\n\nCREATE TABLE task_host_12\n(\n `ii` integer primary key autoincrement,\n `id` bigint unsigned not null,\n `host` varchar(128) not null,\n `status` varchar(32) not null,\n `stdout` text,\n `stderr` text,\n unique (`id`, `host`)\n);\n\nCREATE TABLE task_host_13\n(\n `ii` integer primary key autoincrement,\n `id` bigint unsigned not null,\n `host` varchar(128) not null,\n `status` varchar(32) not null,\n `stdout` text,\n `stderr` text,\n unique (`id`, `host`)\n);\n\nCREATE TABLE task_host_14\n(\n `ii` integer primary key autoincrement,\n `id` bigint unsigned not null,\n `host` varchar(128) not null,\n `status` varchar(32) not null,\n `stdout` text,\n `stderr` text,\n unique (`id`, `host`)\n);\n\nCREATE TABLE task_host_15\n(\n `ii` integer primary key autoincrement,\n `id` bigint unsigned not null,\n `host` varchar(128) not null,\n `status` varchar(32) not null,\n `stdout` text,\n `stderr` text,\n unique (`id`, `host`)\n);\n\nCREATE TABLE task_host_16\n(\n `ii` integer primary key autoincrement,\n `id` bigint unsigned not null,\n `host` varchar(128) not null,\n `status` varchar(32) not null,\n `stdout` text,\n `stderr` text,\n unique (`id`, `host`)\n);\n\nCREATE TABLE task_host_17\n(\n `ii` integer primary key autoincrement,\n `id` bigint unsigned not null,\n `host` varchar(128) not null,\n `status` varchar(32) not null,\n `stdout` text,\n `stderr` text,\n unique (`id`, `host`)\n);\n\nCREATE TABLE task_host_18\n(\n `ii` integer primary key autoincrement,\n `id` bigint unsigned not null,\n `host` varchar(128) not null,\n `status` varchar(32) not null,\n `stdout` text,\n `stderr` text,\n unique (`id`, `host`)\n);\n\nCREATE TABLE task_host_19\n(\n `ii` integer primary key autoincrement,\n `id` bigint unsigned not null,\n `host` varchar(128) not null,\n `status` varchar(32) not null,\n `stdout` text,\n `stderr` text,\n unique (`id`, `host`)\n);\n\nCREATE TABLE task_host_20\n(\n `ii` integer primary key autoincrement,\n `id` bigint unsigned not null,\n `host` varchar(128) not null,\n `status` varchar(32) not null,\n `stdout` text,\n `stderr` text,\n unique (`id`, `host`)\n);\n\nCREATE TABLE task_host_21\n(\n `ii` integer primary key autoincrement,\n `id` bigint unsigned not null,\n `host` varchar(128) not null,\n `status` varchar(32) not null,\n `stdout` text,\n `stderr` text,\n unique (`id`, `host`)\n);\n\nCREATE TABLE task_host_22\n(\n `ii` integer primary key autoincrement,\n `id` bigint unsigned not null,\n `host` varchar(128) not null,\n `status` varchar(32) not null,\n `stdout` text,\n `stderr` text,\n unique (`id`, `host`)\n);\n\nCREATE TABLE task_host_23\n(\n `ii` integer primary key autoincrement,\n `id` bigint unsigned not null,\n `host` varchar(128) not null,\n `status` varchar(32) not null,\n `stdout` text,\n `stderr` text,\n unique (`id`, `host`)\n);\n\nCREATE TABLE task_host_24\n(\n `ii` integer primary key autoincrement,\n `id` bigint unsigned not null,\n `host` varchar(128) not null,\n `status` varchar(32) not null,\n `stdout` text,\n `stderr` text,\n unique (`id`, `host`)\n);\n\nCREATE TABLE task_host_25\n(\n `ii` integer primary key autoincrement,\n `id` bigint unsigned not null,\n `host` varchar(128) not null,\n `status` varchar(32) not null,\n `stdout` text,\n `stderr` text,\n unique (`id`, `host`)\n);\n\nCREATE TABLE task_host_26\n(\n `ii` integer primary key autoincrement,\n `id` bigint unsigned not null,\n `host` varchar(128) not null,\n `status` varchar(32) not null,\n `stdout` text,\n `stderr` text,\n unique (`id`, `host`)\n);\n\nCREATE TABLE task_host_27\n(\n `ii` integer primary key autoincrement,\n `id` bigint unsigned not null,\n `host` varchar(128) not null,\n `status` varchar(32) not null,\n `stdout` text,\n `stderr` text,\n unique (`id`, `host`)\n);\n\nCREATE TABLE task_host_28\n(\n `ii` integer primary key autoincrement,\n `id` bigint unsigned not null,\n `host` varchar(128) not null,\n `status` varchar(32) not null,\n `stdout` text,\n `stderr` text,\n unique (`id`, `host`)\n);\n\nCREATE TABLE task_host_29\n(\n `ii` integer primary key autoincrement,\n `id` bigint unsigned not null,\n `host` varchar(128) not null,\n `status` varchar(32) not null,\n `stdout` text,\n `stderr` text,\n unique (`id`, `host`)\n);\n\nCREATE TABLE task_host_30\n(\n `ii` integer primary key autoincrement,\n `id` bigint unsigned not null,\n `host` varchar(128) not null,\n `status` varchar(32) not null,\n `stdout` text,\n `stderr` text,\n unique (`id`, `host`)\n);\n\nCREATE TABLE task_host_31\n(\n `ii` integer primary key autoincrement,\n `id` bigint unsigned not null,\n `host` varchar(128) not null,\n `status` varchar(32) not null,\n `stdout` text,\n `stderr` text,\n unique (`id`, `host`)\n);\n\nCREATE TABLE task_host_32\n(\n `ii` integer primary key autoincrement,\n `id` bigint unsigned not null,\n `host` varchar(128) not null,\n `status` varchar(32) not null,\n `stdout` text,\n `stderr` text,\n unique (`id`, `host`)\n);\n\nCREATE TABLE task_host_33\n(\n `ii` integer primary key autoincrement,\n `id` bigint unsigned not null,\n `host` varchar(128) not null,\n `status` varchar(32) not null,\n `stdout` text,\n `stderr` text,\n unique (`id`, `host`)\n);\n\nCREATE TABLE task_host_34\n(\n `ii` integer primary key autoincrement,\n `id` bigint unsigned not null,\n `host` varchar(128) not null,\n `status` varchar(32) not null,\n `stdout` text,\n `stderr` text,\n unique (`id`, `host`)\n);\n\nCREATE TABLE task_host_35\n(\n `ii` integer primary key autoincrement,\n `id` bigint unsigned not null,\n `host` varchar(128) not null,\n `status` varchar(32) not null,\n `stdout` text,\n `stderr` text,\n unique (`id`, `host`)\n);\n\nCREATE TABLE task_host_36\n(\n `ii` integer primary key autoincrement,\n `id` bigint unsigned not null,\n `host` varchar(128) not null,\n `status` varchar(32) not null,\n `stdout` text,\n `stderr` text,\n unique (`id`, `host`)\n);\n\nCREATE TABLE task_host_37\n(\n `ii` integer primary key autoincrement,\n `id` bigint unsigned not null,\n `host` varchar(128) not null,\n `status` varchar(32) not null,\n `stdout` text,\n `stderr` text,\n unique (`id`, `host`)\n);\n\nCREATE TABLE task_host_38\n(\n `ii` integer primary key autoincrement,\n `id` bigint unsigned not null,\n `host` varchar(128) not null,\n `status` varchar(32) not null,\n `stdout` text,\n `stderr` text,\n unique (`id`, `host`)\n);\n\nCREATE TABLE task_host_39\n(\n `ii` integer primary key autoincrement,\n `id` bigint unsigned not null,\n `host` varchar(128) not null,\n `status` varchar(32) not null,\n `stdout` text,\n `stderr` text,\n unique (`id`, `host`)\n);\n\nCREATE TABLE task_host_40\n(\n `ii` integer primary key autoincrement,\n `id` bigint unsigned not null,\n `host` varchar(128) not null,\n `status` varchar(32) not null,\n `stdout` text,\n `stderr` text,\n unique (`id`, `host`)\n);\n\nCREATE TABLE task_host_41\n(\n `ii` integer primary key autoincrement,\n `id` bigint unsigned not null,\n `host` varchar(128) not null,\n `status` varchar(32) not null,\n `stdout` text,\n `stderr` text,\n unique (`id`, `host`)\n);\n\nCREATE TABLE task_host_42\n(\n `ii` integer primary key autoincrement,\n `id` bigint unsigned not null,\n `host` varchar(128) not null,\n `status` varchar(32) not null,\n `stdout` text,\n `stderr` text,\n unique (`id`, `host`)\n);\n\nCREATE TABLE task_host_43\n(\n `ii` integer primary key autoincrement,\n `id` bigint unsigned not null,\n `host` varchar(128) not null,\n `status` varchar(32) not null,\n `stdout` text,\n `stderr` text,\n unique (`id`, `host`)\n);\n\nCREATE TABLE task_host_44\n(\n `ii` integer primary key autoincrement,\n `id` bigint unsigned not null,\n `host` varchar(128) not null,\n `status` varchar(32) not null,\n `stdout` text,\n `stderr` text,\n unique (`id`, `host`)\n);\n\nCREATE TABLE task_host_45\n(\n `ii` integer primary key autoincrement,\n `id` bigint unsigned not null,\n `host` varchar(128) not null,\n `status` varchar(32) not null,\n `stdout` text,\n `stderr` text,\n unique (`id`, `host`)\n);\n\nCREATE TABLE task_host_46\n(\n `ii` integer primary key autoincrement,\n `id` bigint unsigned not null,\n `host` varchar(128) not null,\n `status` varchar(32) not null,\n `stdout` text,\n `stderr` text,\n unique (`id`, `host`)\n);\n\nCREATE TABLE task_host_47\n(\n `ii` integer primary key autoincrement,\n `id` bigint unsigned not null,\n `host` varchar(128) not null,\n `status` varchar(32) not null,\n `stdout` text,\n `stderr` text,\n unique (`id`, `host`)\n);\n\nCREATE TABLE task_host_48\n(\n `ii` integer primary key autoincrement,\n `id` bigint unsigned not null,\n `host` varchar(128) not null,\n `status` varchar(32) not null,\n `stdout` text,\n `stderr` text,\n unique (`id`, `host`)\n);\n\nCREATE TABLE task_host_49\n(\n `ii` integer primary key autoincrement,\n `id` bigint unsigned not null,\n `host` varchar(128) not null,\n `status` varchar(32) not null,\n `stdout` text,\n `stderr` text,\n unique (`id`, `host`)\n);\n\nCREATE TABLE task_host_50\n(\n `ii` integer primary key autoincrement,\n `id` bigint unsigned not null,\n `host` varchar(128) not null,\n `status` varchar(32) not null,\n `stdout` text,\n `stderr` text,\n unique (`id`, `host`)\n);\n\nCREATE TABLE task_host_51\n(\n `ii` integer primary key autoincrement,\n `id` bigint unsigned not null,\n `host` varchar(128) not null,\n `status` varchar(32) not null,\n `stdout` text,\n `stderr` text,\n unique (`id`, `host`)\n);\n\nCREATE TABLE task_host_52\n(\n `ii` integer primary key autoincrement,\n `id` bigint unsigned not null,\n `host` varchar(128) not null,\n `status` varchar(32) not null,\n `stdout` text,\n `stderr` text,\n unique (`id`, `host`)\n);\n\nCREATE TABLE task_host_53\n(\n `ii` integer primary key autoincrement,\n `id` bigint unsigned not null,\n `host` varchar(128) not null,\n `status` varchar(32) not null,\n `stdout` text,\n `stderr` text,\n unique (`id`, `host`)\n);\n\nCREATE TABLE task_host_54\n(\n `ii` integer primary key autoincrement,\n `id` bigint unsigned not null,\n `host` varchar(128) not null,\n `status` varchar(32) not null,\n `stdout` text,\n `stderr` text,\n unique (`id`, `host`)\n);\n\nCREATE TABLE task_host_55\n(\n `ii` integer primary key autoincrement,\n `id` bigint unsigned not null,\n `host` varchar(128) not null,\n `status` varchar(32) not null,\n `stdout` text,\n `stderr` text,\n unique (`id`, `host`)\n);\n\nCREATE TABLE task_host_56\n(\n `ii` integer primary key autoincrement,\n `id` bigint unsigned not null,\n `host` varchar(128) not null,\n `status` varchar(32) not null,\n `stdout` text,\n `stderr` text,\n unique (`id`, `host`)\n);\n\nCREATE TABLE task_host_57\n(\n `ii` integer primary key autoincrement,\n `id` bigint unsigned not null,\n `host` varchar(128) not null,\n `status` varchar(32) not null,\n `stdout` text,\n `stderr` text,\n unique (`id`, `host`)\n);\n\nCREATE TABLE task_host_58\n(\n `ii` integer primary key autoincrement,\n `id` bigint unsigned not null,\n `host` varchar(128) not null,\n `status` varchar(32) not null,\n `stdout` text,\n `stderr` text,\n unique (`id`, `host`)\n);\n\nCREATE TABLE task_host_59\n(\n `ii` integer primary key autoincrement,\n `id` bigint unsigned not null,\n `host` varchar(128) not null,\n `status` varchar(32) not null,\n `stdout` text,\n `stderr` text,\n unique (`id`, `host`)\n);\n\nCREATE TABLE task_host_60\n(\n `ii` integer primary key autoincrement,\n `id` bigint unsigned not null,\n `host` varchar(128) not null,\n `status` varchar(32) not null,\n `stdout` text,\n `stderr` text,\n unique (`id`, `host`)\n);\n\nCREATE TABLE task_host_61\n(\n `ii` integer primary key autoincrement,\n `id` bigint unsigned not null,\n `host` varchar(128) not null,\n `status` varchar(32) not null,\n `stdout` text,\n `stderr` text,\n unique (`id`, `host`)\n);\n\nCREATE TABLE task_host_62\n(\n `ii` integer primary key autoincrement,\n `id` bigint unsigned not null,\n `host` varchar(128) not null,\n `status` varchar(32) not null,\n `stdout` text,\n `stderr` text,\n unique (`id`, `host`)\n);\n\nCREATE TABLE task_host_63\n(\n `ii` integer primary key autoincrement,\n `id` bigint unsigned not null,\n `host` varchar(128) not null,\n `status` varchar(32) not null,\n `stdout` text,\n `stderr` text,\n unique (`id`, `host`)\n);\n\nCREATE TABLE task_host_64\n(\n `ii` integer primary key autoincrement,\n `id` bigint unsigned not null,\n `host` varchar(128) not null,\n `status` varchar(32) not null,\n `stdout` text,\n `stderr` text,\n unique (`id`, `host`)\n);\n\nCREATE TABLE task_host_65\n(\n `ii` integer primary key autoincrement,\n `id` bigint unsigned not null,\n `host` varchar(128) not null,\n `status` varchar(32) not null,\n `stdout` text,\n `stderr` text,\n unique (`id`, `host`)\n);\n\nCREATE TABLE task_host_66\n(\n `ii` integer primary key autoincrement,\n `id` bigint unsigned not null,\n `host` varchar(128) not null,\n `status` varchar(32) not null,\n `stdout` text,\n `stderr` text,\n unique (`id`, `host`)\n);\n\nCREATE TABLE task_host_67\n(\n `ii` integer primary key autoincrement,\n `id` bigint unsigned not null,\n `host` varchar(128) not null,\n `status` varchar(32) not null,\n `stdout` text,\n `stderr` text,\n unique (`id`, `host`)\n);\n\nCREATE TABLE task_host_68\n(\n `ii` integer primary key autoincrement,\n `id` bigint unsigned not null,\n `host` varchar(128) not null,\n `status` varchar(32) not null,\n `stdout` text,\n `stderr` text,\n unique (`id`, `host`)\n);\n\nCREATE TABLE task_host_69\n(\n `ii` integer primary key autoincrement,\n `id` bigint unsigned not null,\n `host` varchar(128) not null,\n `status` varchar(32) not null,\n `stdout` text,\n `stderr` text,\n unique (`id`, `host`)\n);\n\nCREATE TABLE task_host_70\n(\n `ii` integer primary key autoincrement,\n `id` bigint unsigned not null,\n `host` varchar(128) not null,\n `status` varchar(32) not null,\n `stdout` text,\n `stderr` text,\n unique (`id`, `host`)\n);\n\nCREATE TABLE task_host_71\n(\n `ii` integer primary key autoincrement,\n `id` bigint unsigned not null,\n `host` varchar(128) not null,\n `status` varchar(32) not null,\n `stdout` text,\n `stderr` text,\n unique (`id`, `host`)\n);\n\nCREATE TABLE task_host_72\n(\n `ii` integer primary key autoincrement,\n `id` bigint unsigned not null,\n `host` varchar(128) not null,\n `status` varchar(32) not null,\n `stdout` text,\n `stderr` text,\n unique (`id`, `host`)\n);\n\nCREATE TABLE task_host_73\n(\n `ii` integer primary key autoincrement,\n `id` bigint unsigned not null,\n `host` varchar(128) not null,\n `status` varchar(32) not null,\n `stdout` text,\n `stderr` text,\n unique (`id`, `host`)\n);\n\nCREATE TABLE task_host_74\n(\n `ii` integer primary key autoincrement,\n `id` bigint unsigned not null,\n `host` varchar(128) not null,\n `status` varchar(32) not null,\n `stdout` text,\n `stderr` text,\n unique (`id`, `host`)\n);\n\nCREATE TABLE task_host_75\n(\n `ii` integer primary key autoincrement,\n `id` bigint unsigned not null,\n `host` varchar(128) not null,\n `status` varchar(32) not null,\n `stdout` text,\n `stderr` text,\n unique (`id`, `host`)\n);\n\nCREATE TABLE task_host_76\n(\n `ii` integer primary key autoincrement,\n `id` bigint unsigned not null,\n `host` varchar(128) not null,\n `status` varchar(32) not null,\n `stdout` text,\n `stderr` text,\n unique (`id`, `host`)\n);\n\nCREATE TABLE task_host_77\n(\n `ii` integer primary key autoincrement,\n `id` bigint unsigned not null,\n `host` varchar(128) not null,\n `status` varchar(32) not null,\n `stdout` text,\n `stderr` text,\n unique (`id`, `host`)\n);\n\nCREATE TABLE task_host_78\n(\n `ii` integer primary key autoincrement,\n `id` bigint unsigned not null,\n `host` varchar(128) not null,\n `status` varchar(32) not null,\n `stdout` text,\n `stderr` text,\n unique (`id`, `host`)\n);\n\nCREATE TABLE task_host_79\n(\n `ii` integer primary key autoincrement,\n `id` bigint unsigned not null,\n `host` varchar(128) not null,\n `status` varchar(32) not null,\n `stdout` text,\n `stderr` text,\n unique (`id`, `host`)\n);\n\nCREATE TABLE task_host_80\n(\n `ii` integer primary key autoincrement,\n `id` bigint unsigned not null,\n `host` varchar(128) not null,\n `status` varchar(32) not null,\n `stdout` text,\n `stderr` text,\n unique (`id`, `host`)\n);\n\nCREATE TABLE task_host_81\n(\n `ii` integer primary key autoincrement,\n `id` bigint unsigned not null,\n `host` varchar(128) not null,\n `status` varchar(32) not null,\n `stdout` text,\n `stderr` text,\n unique (`id`, `host`)\n);\n\nCREATE TABLE task_host_82\n(\n `ii` integer primary key autoincrement,\n `id` bigint unsigned not null,\n `host` varchar(128) not null,\n `status` varchar(32) not null,\n `stdout` text,\n `stderr` text,\n unique (`id`, `host`)\n);\n\nCREATE TABLE task_host_83\n(\n `ii` integer primary key autoincrement,\n `id` bigint unsigned not null,\n `host` varchar(128) not null,\n `status` varchar(32) not null,\n `stdout` text,\n `stderr` text,\n unique (`id`, `host`)\n);\n\nCREATE TABLE task_host_84\n(\n `ii` integer primary key autoincrement,\n `id` bigint unsigned not null,\n `host` varchar(128) not null,\n `status` varchar(32) not null,\n `stdout` text,\n `stderr` text,\n unique (`id`, `host`)\n);\n\nCREATE TABLE task_host_85\n(\n `ii` integer primary key autoincrement,\n `id` bigint unsigned not null,\n `host` varchar(128) not null,\n `status` varchar(32) not null,\n `stdout` text,\n `stderr` text,\n unique (`id`, `host`)\n);\n\nCREATE TABLE task_host_86\n(\n `ii` integer primary key autoincrement,\n `id` bigint unsigned not null,\n `host` varchar(128) not null,\n `status` varchar(32) not null,\n `stdout` text,\n `stderr` text,\n unique (`id`, `host`)\n);\n\nCREATE TABLE task_host_87\n(\n `ii` integer primary key autoincrement,\n `id` bigint unsigned not null,\n `host` varchar(128) not null,\n `status` varchar(32) not null,\n `stdout` text,\n `stderr` text,\n unique (`id`, `host`)\n);\n\nCREATE TABLE task_host_88\n(\n `ii` integer primary key autoincrement,\n `id` bigint unsigned not null,\n `host` varchar(128) not null,\n `status` varchar(32) not null,\n `stdout` text,\n `stderr` text,\n unique (`id`, `host`)\n);\n\nCREATE TABLE task_host_89\n(\n `ii` integer primary key autoincrement,\n `id` bigint unsigned not null,\n `host` varchar(128) not null,\n `status` varchar(32) not null,\n `stdout` text,\n `stderr` text,\n unique (`id`, `host`)\n);\n\nCREATE TABLE task_host_90\n(\n `ii` integer primary key autoincrement,\n `id` bigint unsigned not null,\n `host` varchar(128) not null,\n `status` varchar(32) not null,\n `stdout` text,\n `stderr` text,\n unique (`id`, `host`)\n);\n\nCREATE TABLE task_host_91\n(\n `ii` integer primary key autoincrement,\n `id` bigint unsigned not null,\n `host` varchar(128) not null,\n `status` varchar(32) not null,\n `stdout` text,\n `stderr` text,\n unique (`id`, `host`)\n);\n\nCREATE TABLE task_host_92\n(\n `ii` integer primary key autoincrement,\n `id` bigint unsigned not null,\n `host` varchar(128) not null,\n `status` varchar(32) not null,\n `stdout` text,\n `stderr` text,\n unique (`id`, `host`)\n);\n\nCREATE TABLE task_host_93\n(\n `ii` integer primary key autoincrement,\n `id` bigint unsigned not null,\n `host` varchar(128) not null,\n `status` varchar(32) not null,\n `stdout` text,\n `stderr` text,\n unique (`id`, `host`)\n);\n\nCREATE TABLE task_host_94\n(\n `ii` integer primary key autoincrement,\n `id` bigint unsigned not null,\n `host` varchar(128) not null,\n `status` varchar(32) not null,\n `stdout` text,\n `stderr` text,\n unique (`id`, `host`)\n);\n\nCREATE TABLE task_host_95\n(\n `ii` integer primary key autoincrement,\n `id` bigint unsigned not null,\n `host` varchar(128) not null,\n `status` varchar(32) not null,\n `stdout` text,\n `stderr` text,\n unique (`id`, `host`)\n);\n\nCREATE TABLE task_host_96\n(\n `ii` integer primary key autoincrement,\n `id` bigint unsigned not null,\n `host` varchar(128) not null,\n `status` varchar(32) not null,\n `stdout` text,\n `stderr` text,\n unique (`id`, `host`)\n);\n\nCREATE TABLE task_host_97\n(\n `ii` integer primary key autoincrement,\n `id` bigint unsigned not null,\n `host` varchar(128) not null,\n `status` varchar(32) not null,\n `stdout` text,\n `stderr` text,\n unique (`id`, `host`)\n);\n\nCREATE TABLE task_host_98\n(\n `ii` integer primary key autoincrement,\n `id` bigint unsigned not null,\n `host` varchar(128) not null,\n `status` varchar(32) not null,\n `stdout` text,\n `stderr` text,\n unique (`id`, `host`)\n);\n\nCREATE TABLE task_host_99\n(\n `ii` integer primary key autoincrement,\n `id` bigint unsigned not null,\n `host` varchar(128) not null,\n `status` varchar(32) not null,\n `stdout` text,\n `stderr` text,\n unique (`id`, `host`)\n);\n"
},
{
"path": "dscache/cache.go",
"content": "package dscache\n\nimport (\n\t\"sync\"\n\n\t\"github.com/ccfos/nightingale/v6/datasource\"\n\t\"github.com/toolkits/pkg/logger\"\n)\n\ntype Cache struct {\n\tdatas map[string]map[int64]datasource.Datasource\n\tmutex *sync.RWMutex\n}\n\nvar DsCache = Cache{\n\tdatas: make(map[string]map[int64]datasource.Datasource),\n\tmutex: new(sync.RWMutex),\n}\n\nfunc (cs *Cache) Put(cate string, dsId int64, ds datasource.Datasource) {\n\tcs.mutex.Lock()\n\tif _, found := cs.datas[cate]; !found {\n\t\tcs.datas[cate] = make(map[int64]datasource.Datasource)\n\t}\n\n\tif _, found := cs.datas[cate][dsId]; found {\n\t\tif cs.datas[cate][dsId].Equal(ds) {\n\t\t\tcs.mutex.Unlock()\n\t\t\treturn\n\t\t}\n\t}\n\tcs.mutex.Unlock()\n\n\t// InitClient() 在用户配置错误或远端不可用时, 会非常耗时, mutex被长期持有, 导致Get()会超时\n\terr := ds.InitClient()\n\tif err != nil {\n\t\tlogger.Errorf(\"init plugin:%s %d %+v client fail: %v\", cate, dsId, ds, err)\n\t\treturn\n\t}\n\n\tlogger.Debugf(\"init plugin:%s %d %+v client success\", cate, dsId, ds)\n\tcs.mutex.Lock()\n\tcs.datas[cate][dsId] = ds\n\tcs.mutex.Unlock()\n}\n\nfunc (cs *Cache) Get(cate string, dsId int64) (datasource.Datasource, bool) {\n\tcs.mutex.RLock()\n\tdefer cs.mutex.RUnlock()\n\tif _, found := cs.datas[cate]; !found {\n\t\treturn nil, false\n\t}\n\n\tif _, found := cs.datas[cate][dsId]; !found {\n\t\treturn nil, false\n\t}\n\n\treturn cs.datas[cate][dsId], true\n}\n\nfunc (cs *Cache) Delete(cate string, dsId int64) {\n\tcs.mutex.Lock()\n\tdefer cs.mutex.Unlock()\n\tif _, found := cs.datas[cate]; !found {\n\t\treturn\n\t}\n\tdelete(cs.datas[cate], dsId)\n\n\tlogger.Debugf(\"delete plugin:%s %d from cache\", cate, dsId)\n}\n\n// GetAllIds 返回缓存中所有数据源的 ID,按类型分组\nfunc (cs *Cache) GetAllIds() map[string][]int64 {\n\tcs.mutex.RLock()\n\tdefer cs.mutex.RUnlock()\n\tresult := make(map[string][]int64)\n\tfor cate, dsMap := range cs.datas {\n\t\tids := make([]int64, 0, len(dsMap))\n\t\tfor dsId := range dsMap {\n\t\t\tids = append(ids, dsId)\n\t\t}\n\t\tresult[cate] = ids\n\t}\n\treturn result\n}\n"
},
{
"path": "dscache/sync.go",
"content": "package dscache\n\nimport (\n\t\"context\"\n\t\"encoding/base64\"\n\t\"strings\"\n\t\"sync/atomic\"\n\t\"time\"\n\n\t\"github.com/ccfos/nightingale/v6/datasource\"\n\t_ \"github.com/ccfos/nightingale/v6/datasource/ck\"\n\t_ \"github.com/ccfos/nightingale/v6/datasource/doris\"\n\t\"github.com/ccfos/nightingale/v6/datasource/es\"\n\t_ \"github.com/ccfos/nightingale/v6/datasource/mysql\"\n\t_ \"github.com/ccfos/nightingale/v6/datasource/opensearch\"\n\t_ \"github.com/ccfos/nightingale/v6/datasource/postgresql\"\n\t_ \"github.com/ccfos/nightingale/v6/datasource/victorialogs\"\n\t\"github.com/ccfos/nightingale/v6/dskit/tdengine\"\n\t\"github.com/ccfos/nightingale/v6/models\"\n\t\"github.com/ccfos/nightingale/v6/pkg/ctx\"\n\t\"github.com/ccfos/nightingale/v6/pkg/poster\"\n\n\t\"github.com/toolkits/pkg/logger\"\n)\n\nvar FromAPIHook func()\n\nvar DatasourceProcessHook func(items []datasource.DatasourceInfo) []datasource.DatasourceInfo\n\nfunc Init(ctx *ctx.Context, fromAPI bool) {\n\tif !ctx.IsCenter {\n\t\t// 从 center 同步密钥\n\t\tvar rsaConfig = new(models.RsaConfig)\n\t\tc, err := poster.GetByUrls[*models.RsaConfig](ctx, \"/v1/n9e/datasource-rsa-config\")\n\t\tif err != nil || c == nil {\n\t\t\tlogger.Fatalf(\"failed to get datasource rsa-config, error: %v\", err)\n\t\t}\n\t\trsaConfig = c\n\t\tif c.OpenRSA {\n\t\t\tlogger.Infof(\"datasource rsa is open in n9e-plus\")\n\t\t\trsaConfig.PrivateKeyBytes, err = base64.StdEncoding.DecodeString(c.RSAPrivateKey)\n\t\t\tif err != nil {\n\t\t\t\tlogger.Fatalf(\"failed to decode rsa-config, error: %v\", err)\n\t\t\t}\n\t\t}\n\t\tmodels.SetRsaConfig(rsaConfig)\n\t}\n\n\tgo getDatasourcesFromDBLoop(ctx, fromAPI)\n}\n\ntype ListInput struct {\n\tPage int `json:\"p\"`\n\tLimit int `json:\"limit\"`\n\tCategory string `json:\"category\"`\n\tPluginType string `json:\"plugin_type\"` // prometheus\n\tStatus string `json:\"status\"`\n}\n\ntype DSReply struct {\n\tRequestID string `json:\"request_id\"`\n\tData struct {\n\t\tItems []datasource.DatasourceInfo `json:\"items\"`\n\t} `json:\"data\"`\n}\n\ntype DSReplyEncrypt struct {\n\tRequestID string `json:\"request_id\"`\n\tData string `json:\"data\"`\n}\n\nvar PromDefaultDatasourceId int64\n\nfunc getDatasourcesFromDBLoop(ctx *ctx.Context, fromAPI bool) {\n\tfor {\n\t\tif !fromAPI {\n\t\t\tfoundDefaultDatasource := false\n\t\t\titems, err := models.GetDatasources(ctx)\n\t\t\tif err != nil {\n\t\t\t\tlogger.Errorf(\"get datasource from database fail: %v\", err)\n\t\t\t\t//stat.CounterExternalErrorTotal.WithLabelValues(\"db\", \"get_cluster\").Inc()\n\t\t\t\ttime.Sleep(time.Second * 2)\n\t\t\t\tcontinue\n\t\t\t}\n\t\t\tvar dss []datasource.DatasourceInfo\n\t\t\tfor _, item := range items {\n\n\t\t\t\tif item.PluginType == \"prometheus\" && item.IsDefault {\n\t\t\t\t\tatomic.StoreInt64(&PromDefaultDatasourceId, item.Id)\n\t\t\t\t\tfoundDefaultDatasource = true\n\t\t\t\t}\n\n\t\t\t\t// logger.Debugf(\"get datasource: %+v\", item)\n\t\t\t\tds := datasource.DatasourceInfo{\n\t\t\t\t\tId: item.Id,\n\t\t\t\t\tName: item.Name,\n\t\t\t\t\tDescription: item.Description,\n\t\t\t\t\tCategory: item.Category,\n\t\t\t\t\tPluginId: item.PluginId,\n\t\t\t\t\tType: item.PluginType,\n\t\t\t\t\tPluginTypeName: item.PluginTypeName,\n\t\t\t\t\tSettings: item.SettingsJson,\n\t\t\t\t\tHTTPJson: item.HTTPJson,\n\t\t\t\t\tAuthJson: item.AuthJson,\n\t\t\t\t\tStatus: item.Status,\n\t\t\t\t\tIsDefault: item.IsDefault,\n\t\t\t\t\tWeight: item.Weight,\n\t\t\t\t}\n\n\t\t\t\tif item.PluginType == \"elasticsearch\" {\n\t\t\t\t\tesN9eToDatasourceInfo(&ds, item)\n\t\t\t\t} else if item.PluginType == \"tdengine\" {\n\t\t\t\t\ttdN9eToDatasourceInfo(&ds, item)\n\t\t\t\t} else {\n\t\t\t\t\tds.Settings = make(map[string]interface{})\n\t\t\t\t\tfor k, v := range item.SettingsJson {\n\t\t\t\t\t\tds.Settings[k] = v\n\t\t\t\t\t}\n\t\t\t\t}\n\t\t\t\tdss = append(dss, ds)\n\t\t\t}\n\n\t\t\tif !foundDefaultDatasource && atomic.LoadInt64(&PromDefaultDatasourceId) != 0 {\n\t\t\t\tlogger.Debugf(\"no default datasource found\")\n\t\t\t\tatomic.StoreInt64(&PromDefaultDatasourceId, 0)\n\t\t\t}\n\n\t\t\tif DatasourceProcessHook != nil {\n\t\t\t\tdss = DatasourceProcessHook(dss)\n\t\t\t}\n\n\t\t\tPutDatasources(dss)\n\t\t} else {\n\t\t\tFromAPIHook()\n\t\t}\n\n\t\ttime.Sleep(time.Second * 2)\n\t}\n}\n\nfunc tdN9eToDatasourceInfo(ds *datasource.DatasourceInfo, item models.Datasource) {\n\tds.Settings = make(map[string]interface{})\n\tds.Settings[\"tdengine.cluster_name\"] = item.Name\n\tds.Settings[\"tdengine.addr\"] = item.HTTPJson.Url\n\tds.Settings[\"tdengine.timeout\"] = item.HTTPJson.Timeout\n\tds.Settings[\"tdengine.dial_timeout\"] = item.HTTPJson.DialTimeout\n\tds.Settings[\"tdengine.max_idle_conns_per_host\"] = item.HTTPJson.MaxIdleConnsPerHost\n\tds.Settings[\"tdengine.headers\"] = item.HTTPJson.Headers\n\tds.Settings[\"tdengine.basic\"] = tdengine.TDengineBasicAuth{\n\t\tUser: item.AuthJson.BasicAuthUser,\n\t\tPassword: item.AuthJson.BasicAuthPassword,\n\t}\n}\n\nfunc esN9eToDatasourceInfo(ds *datasource.DatasourceInfo, item models.Datasource) {\n\tds.Settings = make(map[string]interface{})\n\tds.Settings[\"es.nodes\"] = []string{item.HTTPJson.Url}\n\tif len(item.HTTPJson.Urls) > 0 {\n\t\tds.Settings[\"es.nodes\"] = item.HTTPJson.Urls\n\t}\n\tds.Settings[\"es.timeout\"] = item.HTTPJson.Timeout\n\tds.Settings[\"es.basic\"] = es.BasicAuth{\n\t\tUsername: item.AuthJson.BasicAuthUser,\n\t\tPassword: item.AuthJson.BasicAuthPassword,\n\t}\n\tds.Settings[\"es.tls\"] = es.TLS{\n\t\tSkipTlsVerify: item.HTTPJson.TLS.SkipTlsVerify,\n\t}\n\tds.Settings[\"es.version\"] = item.SettingsJson[\"version\"]\n\tds.Settings[\"es.headers\"] = item.HTTPJson.Headers\n\tds.Settings[\"es.min_interval\"] = item.SettingsJson[\"min_interval\"]\n\tds.Settings[\"es.max_shard\"] = item.SettingsJson[\"max_shard\"]\n\tds.Settings[\"es.enable_write\"] = item.SettingsJson[\"enable_write\"]\n}\n\nfunc PutDatasources(items []datasource.DatasourceInfo) {\n\t// 记录当前有效的数据源 ID,按类型分组\n\tvalidIds := make(map[string]map[int64]struct{})\n\tids := make([]int64, 0)\n\n\tfor _, item := range items {\n\t\tif item.Type == \"prometheus\" {\n\t\t\tcontinue\n\t\t}\n\n\t\tif item.Type == \"loki\" {\n\t\t\tcontinue\n\t\t}\n\n\t\tif item.Name == \"\" {\n\t\t\tlogger.Warningf(\"cluster name is empty, ignore %+v\", item)\n\t\t\tcontinue\n\t\t}\n\t\ttyp := strings.ReplaceAll(item.Type, \".logging\", \"\")\n\n\t\tds, err := datasource.GetDatasourceByType(typ, item.Settings)\n\t\tif err != nil {\n\t\t\tlogger.Debugf(\"get plugin:%+v fail: %v\", item, err)\n\t\t\tcontinue\n\t\t}\n\n\t\terr = ds.Validate(context.Background())\n\t\tif err != nil {\n\t\t\tlogger.Warningf(\"get plugin:%+v fail: %v\", item, err)\n\t\t\tcontinue\n\t\t}\n\t\tids = append(ids, item.Id)\n\n\t\t// 记录有效的数据源 ID\n\t\tif _, ok := validIds[typ]; !ok {\n\t\t\tvalidIds[typ] = make(map[int64]struct{})\n\t\t}\n\t\tvalidIds[typ][item.Id] = struct{}{}\n\n\t\t// 异步初始化 client 不然数据源同步的会很慢\n\t\tgo func() {\n\t\t\tdefer func() {\n\t\t\t\tif r := recover(); r != nil {\n\t\t\t\t\tlogger.Errorf(\"panic in datasource item: %+v panic:%v\", item, r)\n\t\t\t\t}\n\t\t\t}()\n\t\t\tDsCache.Put(typ, item.Id, ds)\n\t\t}()\n\t}\n\n\t// 删除 items 中不存在但 DsCache 中存在的数据源\n\tcachedIds := DsCache.GetAllIds()\n\tfor cate, dsIds := range cachedIds {\n\t\tfor _, dsId := range dsIds {\n\t\t\tif _, ok := validIds[cate]; !ok {\n\t\t\t\t// 该类型在 items 中完全不存在,删除缓存中的所有该类型数据源\n\t\t\t\tDsCache.Delete(cate, dsId)\n\t\t\t} else if _, ok := validIds[cate][dsId]; !ok {\n\t\t\t\t// 该数据源 ID 在 items 中不存在,删除\n\t\t\t\tDsCache.Delete(cate, dsId)\n\t\t\t}\n\t\t}\n\t}\n\n\t// logger.Debugf(\"get plugin by type success Ids:%v\", ids)\n}\n"
},
{
"path": "dskit/clickhouse/clickhouse.go",
"content": "package clickhouse\n\nimport (\n\t\"context\"\n\t\"crypto/tls\"\n\t\"database/sql\"\n\t\"errors\"\n\t\"fmt\"\n\t\"strings\"\n\t\"time\"\n\n\t\"github.com/ccfos/nightingale/v6/dskit/sqlbase\"\n\t\"github.com/ccfos/nightingale/v6/dskit/types\"\n\n\t\"github.com/ClickHouse/clickhouse-go/v2\"\n\t\"github.com/mitchellh/mapstructure\"\n\t\"github.com/toolkits/pkg/logger\"\n\tckDriver \"gorm.io/driver/clickhouse\"\n\t\"gorm.io/gorm\"\n)\n\nconst (\n\tckDataSource = \"clickhouse://%s:%s@%s?read_timeout=10s\"\n\n\tDefaultLimit = 500\n)\n\ntype Clickhouse struct {\n\tNodes []string `json:\"ck.nodes\" mapstructure:\"ck.nodes\"`\n\tUser string `json:\"ck.user\" mapstructure:\"ck.user\"`\n\tPassword string `json:\"ck.password\" mapstructure:\"ck.password\"`\n\tTimeout int `json:\"ck.timeout\" mapstructure:\"ck.timeout\"`\n\tMaxQueryRows int `json:\"ck.max_query_rows\" mapstructure:\"ck.max_query_rows\"`\n\tProtocol string `json:\"ck.protocol\" mapstructure:\"ck.protocol\"`\n\tSkipSSLVerify bool `json:\"ck.skip_ssl_verify\" mapstructure:\"ck.skip_ssl_verify\"`\n\tSecureConnection bool `json:\"ck.secure_connection\" mapstructure:\"ck.secure_connection\"`\n\n\t// 连接池配置(可选)\n\tMaxIdleConns int `json:\"ck.max_idle_conns\" mapstructure:\"ck.max_idle_conns\"` // 最大空闲连接数\n\tMaxOpenConns int `json:\"ck.max_open_conns\" mapstructure:\"ck.max_open_conns\"` // 最大打开连接数\n\tConnMaxLifetime int `json:\"ck.conn_max_lifetime\" mapstructure:\"ck.conn_max_lifetime\"` // 连接最大生命周期(秒)\n\n\tClient *gorm.DB `json:\"-\"`\n\tClientByHTTP *sql.DB `json:\"-\"`\n}\n\nfunc (c *Clickhouse) InitCli() error {\n\tif c.MaxQueryRows == 0 {\n\t\tc.MaxQueryRows = DefaultLimit\n\t}\n\n\tif len(c.Nodes) == 0 {\n\t\treturn fmt.Errorf(\"not found ck shard, please check datasource config\")\n\t}\n\t// 前端只允许 host:port,直接使用第一个节点\n\taddr := c.Nodes[0]\n\n\tprot := strings.ToLower(strings.TrimSpace(c.Protocol))\n\t// 如果用户显式指定 protocol,只允许 http 或 native\n\tif prot != \"\" {\n\t\tif prot != \"http\" && prot != \"native\" {\n\t\t\treturn fmt.Errorf(\"unsupported clickhouse protocol: %s, only `http`, `https` or `native` allowed\", c.Protocol)\n\t\t}\n\n\t\t// HTTP(S) 路径(使用 clickhouse-go HTTP client)\n\t\tif prot == \"http\" {\n\t\t\topts := &clickhouse.Options{\n\t\t\t\tAddr: []string{addr},\n\t\t\t\tAuth: clickhouse.Auth{Username: c.User, Password: c.Password},\n\t\t\t\tSettings: clickhouse.Settings{\"max_execution_time\": 60},\n\t\t\t\tDialTimeout: 10 * time.Second,\n\t\t\t\tProtocol: clickhouse.HTTP,\n\t\t\t}\n\t\t\t// 仅当显式指定 https 时才启用 TLS 并使用 SkipSSL 控制 InsecureSkipVerify\n\t\t\tif c.SecureConnection {\n\t\t\t\topts.TLS = &tls.Config{InsecureSkipVerify: c.SkipSSLVerify}\n\t\t\t}\n\t\t\tckconn := clickhouse.OpenDB(opts)\n\t\t\tif ckconn == nil {\n\t\t\t\treturn errors.New(\"db conn failed\")\n\t\t\t}\n\t\t\t// 应用连接池配置到 HTTP sql.DB\n\t\t\tif c.MaxIdleConns > 0 {\n\t\t\t\tckconn.SetMaxIdleConns(c.MaxIdleConns)\n\t\t\t}\n\t\t\tif c.MaxOpenConns > 0 {\n\t\t\t\tckconn.SetMaxOpenConns(c.MaxOpenConns)\n\t\t\t}\n\t\t\tif c.ConnMaxLifetime > 0 {\n\t\t\t\tckconn.SetConnMaxLifetime(time.Duration(c.ConnMaxLifetime) * time.Second)\n\t\t\t}\n\t\t\tc.ClientByHTTP = ckconn\n\t\t\treturn nil\n\t\t}\n\n\t\t// native 路径(使用 gorm + native driver)\n\t\tdsn := fmt.Sprintf(ckDataSource, c.User, c.Password, addr)\n\t\t// 如果启用了 SecureConnection,为 DSN 添加 TLS 参数;SkipSSLVerify 控制是否跳过证书校验\n\t\tif c.SecureConnection {\n\t\t\tdsn = dsn + \"&secure=true\"\n\t\t\tif c.SkipSSLVerify {\n\t\t\t\tdsn = dsn + \"&skip_verify=true\"\n\t\t\t}\n\t\t}\n\t\tdb, err := gorm.Open(\n\t\t\tckDriver.New(\n\t\t\t\tckDriver.Config{\n\t\t\t\t\tDSN: dsn,\n\t\t\t\t\tDisableDatetimePrecision: true,\n\t\t\t\t\tDontSupportRenameColumn: true,\n\t\t\t\t\tSkipInitializeWithVersion: false,\n\t\t\t\t}),\n\t\t)\n\t\tif err != nil {\n\t\t\treturn err\n\t\t}\n\t\t// 应用连接池配置到 gorm 底层 *sql.DB\n\t\tif sqlDB, derr := db.DB(); derr == nil {\n\t\t\tif c.MaxIdleConns > 0 {\n\t\t\t\tsqlDB.SetMaxIdleConns(c.MaxIdleConns)\n\t\t\t}\n\t\t\tif c.MaxOpenConns > 0 {\n\t\t\t\tsqlDB.SetMaxOpenConns(c.MaxOpenConns)\n\t\t\t}\n\t\t\tif c.ConnMaxLifetime > 0 {\n\t\t\t\tsqlDB.SetConnMaxLifetime(time.Duration(c.ConnMaxLifetime) * time.Second)\n\t\t\t}\n\t\t} else {\n\t\t\tlogger.Debugf(\"clickhouse: get native sql DB failed: %v\", derr)\n\t\t}\n\t\tc.Client = db\n\t\treturn nil\n\t}\n\n\topts := &clickhouse.Options{\n\t\tAddr: []string{addr},\n\t\tAuth: clickhouse.Auth{Username: c.User, Password: c.Password},\n\t\tSettings: clickhouse.Settings{\"max_execution_time\": 60},\n\t\tDialTimeout: 10 * time.Second,\n\t\tProtocol: clickhouse.HTTP,\n\t}\n\n\tckconn := clickhouse.OpenDB(opts)\n\tif ckconn != nil {\n\t\t// 做一次 Ping 校验,避免把 native 端口误当作 HTTP 使用\n\t\tif err := ckconn.Ping(); err == nil {\n\t\t\tif c.MaxIdleConns > 0 {\n\t\t\t\tckconn.SetMaxIdleConns(c.MaxIdleConns)\n\t\t\t}\n\t\t\tif c.MaxOpenConns > 0 {\n\t\t\t\tckconn.SetMaxOpenConns(c.MaxOpenConns)\n\t\t\t}\n\t\t\tif c.ConnMaxLifetime > 0 {\n\t\t\t\tckconn.SetConnMaxLifetime(time.Duration(c.ConnMaxLifetime) * time.Second)\n\t\t\t}\n\t\t\tc.ClientByHTTP = ckconn\n\t\t\treturn nil\n\t\t} else {\n\t\t\tlogger.Debugf(\"clickhouse http ping failed for %s, fallback to native: %v\", addr, err)\n\t\t\t_ = ckconn.Close()\n\t\t}\n\t}\n\n\t// 作为最后回退,尝试 native 连接\n\thost := strings.TrimPrefix(strings.TrimPrefix(addr, \"http://\"), \"https://\")\n\tdsn := fmt.Sprintf(ckDataSource, c.User, c.Password, host)\n\t// 如果启用了 SecureConnection,为 DSN 添加 TLS 参数;SkipSSLVerify 控制是否跳过证书校验\n\tif c.SecureConnection {\n\t\tdsn = dsn + \"&secure=true\"\n\t\tif c.SkipSSLVerify {\n\t\t\tdsn = dsn + \"&skip_verify=true\"\n\t\t}\n\t}\n\tdb, err := gorm.Open(\n\t\tckDriver.New(\n\t\t\tckDriver.Config{\n\t\t\t\tDSN: dsn,\n\t\t\t\tDisableDatetimePrecision: true,\n\t\t\t\tDontSupportRenameColumn: true,\n\t\t\t\tSkipInitializeWithVersion: false,\n\t\t\t}),\n\t)\n\tif err != nil {\n\t\treturn err\n\t}\n\tif sqlDB, derr := db.DB(); derr == nil {\n\t\tif c.MaxIdleConns > 0 {\n\t\t\tsqlDB.SetMaxIdleConns(c.MaxIdleConns)\n\t\t}\n\t\tif c.MaxOpenConns > 0 {\n\t\t\tsqlDB.SetMaxOpenConns(c.MaxOpenConns)\n\t\t}\n\t\tif c.ConnMaxLifetime > 0 {\n\t\t\tsqlDB.SetConnMaxLifetime(time.Duration(c.ConnMaxLifetime) * time.Second)\n\t\t}\n\t}\n\tc.Client = db\n\treturn nil\n}\n\nconst (\n\tShowDatabases = \"SHOW DATABASES\"\n\tShowTables = \"SELECT name FROM system.tables WHERE database = '%s'\"\n\tDescTable = \"SELECT name,type FROM system.columns WHERE database='%s' AND table = '%s';\"\n)\n\nfunc (c *Clickhouse) QueryRows(ctx context.Context, query string) (*sql.Rows, error) {\n\tvar (\n\t\trows *sql.Rows\n\t\terr error\n\t)\n\n\tif c.ClientByHTTP != nil {\n\t\trows, err = c.ClientByHTTP.Query(query)\n\t\tif err != nil {\n\t\t\treturn nil, err\n\t\t}\n\t} else if c.Client != nil {\n\t\trows, err = c.Client.Raw(query).Rows()\n\t\tif err != nil {\n\t\t\treturn nil, err\n\t\t}\n\t} else {\n\t\treturn nil, fmt.Errorf(\"clickhouse client is nil\")\n\t}\n\n\treturn rows, nil\n}\n\n// ShowDatabases lists all databases in Clickhouse\nfunc (c *Clickhouse) ShowDatabases(ctx context.Context) ([]string, error) {\n\tres := make([]string, 0)\n\n\trows, err := c.QueryRows(ctx, ShowDatabases)\n\tif err != nil {\n\t\treturn nil, err\n\t}\n\n\tfor rows.Next() {\n\t\tvar r string\n\t\tif err := rows.Scan(&r); err != nil {\n\t\t\treturn nil, err\n\t\t}\n\t\tres = append(res, r)\n\t}\n\n\treturn res, nil\n}\n\n// ShowTables lists all tables in a given database\nfunc (c *Clickhouse) ShowTables(ctx context.Context, database string) ([]string, error) {\n\tres := make([]string, 0)\n\n\tshowTables := fmt.Sprintf(ShowTables, database)\n\trows, err := c.QueryRows(ctx, showTables)\n\tif err != nil {\n\t\treturn nil, err\n\t}\n\n\tfor rows.Next() {\n\t\tvar r string\n\t\tif err := rows.Scan(&r); err != nil {\n\t\t\treturn nil, err\n\t\t}\n\t\tres = append(res, r)\n\t}\n\n\treturn res, nil\n}\n\n// DescribeTable describes the schema of a specified table in Clickhouse\nfunc (c *Clickhouse) DescribeTable(ctx context.Context, query interface{}) ([]*types.ColumnProperty, error) {\n\tvar (\n\t\tret []*types.ColumnProperty\n\t)\n\n\tckQueryParam := new(QueryParam)\n\tif err := mapstructure.Decode(query, ckQueryParam); err != nil {\n\t\treturn nil, err\n\t}\n\tdescTable := fmt.Sprintf(DescTable, ckQueryParam.Database, ckQueryParam.Table)\n\n\trows, err := c.QueryRows(ctx, descTable)\n\tif err != nil {\n\t\treturn nil, err\n\t}\n\n\tfor rows.Next() {\n\t\tvar column types.ColumnProperty\n\t\tif err := rows.Scan(&column.Field, &column.Type); err != nil {\n\t\t\treturn nil, err\n\t\t}\n\t\tret = append(ret, &column)\n\t}\n\n\treturn ret, nil\n}\n\nfunc (c *Clickhouse) ExecQueryBySqlDB(ctx context.Context, sql string) ([]map[string]interface{}, error) {\n\trows, err := c.QueryRows(ctx, sql)\n\n\tif err != nil {\n\t\treturn nil, err\n\t}\n\tdefer rows.Close()\n\n\tcolumns, err := rows.Columns()\n\tif err != nil {\n\t\treturn nil, err\n\t}\n\n\tvar results []map[string]interface{}\n\n\tfor rows.Next() {\n\t\tcolumnValues := make([]interface{}, len(columns))\n\t\tcolumnPointers := make([]interface{}, len(columns))\n\t\tfor i := range columnValues {\n\t\t\tcolumnPointers[i] = &columnValues[i]\n\t\t}\n\n\t\tif err := rows.Scan(columnPointers...); err != nil {\n\t\t\tcontinue\n\t\t}\n\n\t\trowMap := make(map[string]interface{})\n\t\tfor i, colName := range columns {\n\t\t\tval := columnValues[i]\n\t\t\tbytes, ok := val.([]byte)\n\t\t\tif ok {\n\t\t\t\trowMap[colName] = string(bytes)\n\t\t\t} else {\n\t\t\t\trowMap[colName] = val\n\t\t\t}\n\t\t}\n\t\tresults = append(results, rowMap)\n\t}\n\treturn results, nil\n}\n\nfunc (c *Clickhouse) Query(ctx context.Context, query interface{}) ([]map[string]interface{}, error) {\n\n\tckQuery := new(QueryParam)\n\tif err := mapstructure.Decode(query, ckQuery); err != nil {\n\t\treturn nil, err\n\t}\n\n\t// 校验SQL的合法性, 过滤掉 write请求\n\tsqlItem := strings.Split(strings.ToUpper(ckQuery.Sql), \" \")\n\tfor _, item := range sqlItem {\n\t\tif _, ok := ckBannedOp[item]; ok {\n\t\t\treturn nil, fmt.Errorf(\"operation %s is forbid, only read db, please check your sql\", item)\n\t\t}\n\t}\n\n\t// 检查匹配数据长度,防止数据量过大\n\terr := c.CheckMaxQueryRows(ctx, ckQuery.Sql)\n\tif err != nil {\n\t\treturn nil, err\n\t}\n\n\tdbRows := make([]map[string]interface{}, 0)\n\n\tif c.ClientByHTTP != nil {\n\t\tdbRows, err = c.ExecQueryBySqlDB(ctx, ckQuery.Sql)\n\t} else {\n\t\terr = c.Client.Raw(ckQuery.Sql).Find(&dbRows).Error\n\t}\n\tif err != nil {\n\t\treturn nil, fmt.Errorf(\"fetch data failed, sql is %s, err is %s\", ckQuery.Sql, err.Error())\n\t}\n\n\treturn dbRows, nil\n}\n\nfunc (c *Clickhouse) CheckMaxQueryRows(ctx context.Context, sql string) error {\n\n\tsubSql := strings.ReplaceAll(sql, \";\", \"\")\n\tsubSql = fmt.Sprintf(\"SELECT COUNT(*) as count FROM (%s) AS subquery;\", subSql)\n\n\tdbRows, err := c.ExecQueryBySqlDB(ctx, subSql)\n\tif err != nil {\n\t\treturn fmt.Errorf(\"fetch data failed, sql is %s, err is %s\", subSql, err.Error())\n\t}\n\n\tif len(dbRows) > 0 {\n\t\tif count, exists := dbRows[0][\"count\"]; exists {\n\t\t\tv, err := sqlbase.ParseFloat64Value(count)\n\t\t\tif err != nil {\n\t\t\t\treturn err\n\t\t\t}\n\n\t\t\tif v > float64(c.MaxQueryRows) {\n\t\t\t\treturn fmt.Errorf(\"query result rows count %d exceeds the maximum limit %d\", int(v), c.MaxQueryRows)\n\t\t\t}\n\t\t}\n\t}\n\n\treturn nil\n}\n"
},
{
"path": "dskit/clickhouse/clickhouse_test.go",
"content": "package clickhouse\n\nimport (\n\t\"context\"\n\t\"encoding/json\"\n\t\"fmt\"\n\t\"testing\"\n\t\"time\"\n\n\t\"github.com/ccfos/nightingale/v6/dskit/types\"\n)\n\nfunc Test_Timeseries(t *testing.T) {\n\tck := &Clickhouse{\n\t\tNodes: []string{\"127.0.0.1:8123\"},\n\t\tUser: \"default\",\n\t\tPassword: \"123456\",\n\t}\n\n\terr := ck.InitCli()\n\tif err != nil {\n\t\tt.Fatal(err)\n\t}\n\n\tdata, err := ck.QueryTimeseries(context.TODO(), &QueryParam{\n\t\tSql: `select * from default.student limit 20`,\n\t\tFrom: time.Now().Unix() - 300,\n\t\tTo: time.Now().Unix(),\n\t\tTimeField: \"created_at\",\n\t\tTimeFormat: \"datetime\",\n\t\tKeys: types.Keys{\n\t\t\tLabelKey: \"age\",\n\t\t},\n\t})\n\tif err != nil {\n\t\tt.Fatal(err)\n\t}\n\tbs, err := json.Marshal(data)\n\tif err != nil {\n\t\tt.Fatal(err)\n\t}\n\tfmt.Println(string(bs))\n}\n"
},
{
"path": "dskit/clickhouse/timeseries.go",
"content": "package clickhouse\n\nimport (\n\t\"context\"\n\t\"fmt\"\n\n\t\"github.com/ccfos/nightingale/v6/dskit/sqlbase\"\n\t\"github.com/ccfos/nightingale/v6/dskit/types\"\n)\n\nconst (\n\tTimeFieldFormatEpochMilli = \"epoch_millis\"\n\tTimeFieldFormatEpochSecond = \"epoch_second\"\n)\n\n// 时序数据相关的API\ntype QueryParam struct {\n\tLimit int `json:\"limit\" mapstructure:\"limit\"`\n\tSql string `json:\"sql\" mapstructure:\"sql\"`\n\tRef string `json:\"ref\" mapstructure:\"ref\"`\n\tFrom int64 `json:\"from\" mapstructure:\"from\"`\n\tTo int64 `json:\"to\" mapstructure:\"to\"`\n\tTimeField string `json:\"time_field\" mapstructure:\"time_field\"`\n\tTimeFormat string `json:\"time_format\" mapstructure:\"time_format\"`\n\tKeys types.Keys `json:\"keys\" mapstructure:\"keys\"`\n\tDatabase string `json:\"database\" mapstructure:\"database\"`\n\tTable string `json:\"table\" mapstructure:\"table\"`\n}\n\nvar (\n\tckBannedOp = map[string]struct{}{\n\t\t\"CREATE\": {},\n\t\t\"INSERT\": {},\n\t\t\"ALTER\": {},\n\t\t\"REVOKE\": {},\n\t\t\"DROP\": {},\n\t\t\"RENAME\": {},\n\t\t\"ATTACH\": {},\n\t\t\"DETACH\": {},\n\t\t\"OPTIMIZE\": {},\n\t\t\"TRUNCATE\": {},\n\t\t\"SET\": {},\n\t}\n)\n\nfunc (c *Clickhouse) QueryTimeseries(ctx context.Context, query *QueryParam) ([]types.MetricValues, error) {\n\tif query.Keys.ValueKey == \"\" {\n\t\treturn nil, fmt.Errorf(\"valueKey is required\")\n\t}\n\n\trows, err := c.Query(ctx, query)\n\tif err != nil {\n\t\treturn nil, err\n\t}\n\n\t// 构造成时续数据\n\treturn sqlbase.FormatMetricValues(query.Keys, rows, true), nil\n}\n"
},
{
"path": "dskit/doris/doris.go",
"content": "package doris\n\nimport (\n\t\"context\"\n\t\"database/sql\"\n\t\"encoding/json\"\n\t\"errors\"\n\t\"fmt\"\n\t\"reflect\"\n\t\"strings\"\n\t\"time\"\n\t\"unicode\"\n\n\t\"github.com/ccfos/nightingale/v6/dskit/pool\"\n\t\"github.com/ccfos/nightingale/v6/dskit/types\"\n\n\t_ \"github.com/go-sql-driver/mysql\" // MySQL driver\n\t\"github.com/mitchellh/mapstructure\"\n)\n\nconst (\n\tShowIndexFieldIndexType = \"index_type\"\n\tShowIndexFieldColumnName = \"column_name\"\n\tShowIndexKeyName = \"key_name\"\n\n\tSQLShowIndex = \"SHOW INDEX FROM \"\n)\n\n// Doris struct to hold connection details and the connection object\ntype Doris struct {\n\tAddr string `json:\"doris.addr\" mapstructure:\"doris.addr\"` // fe mysql endpoint\n\tFeAddr string `json:\"doris.fe_addr\" mapstructure:\"doris.fe_addr\"` // fe http endpoint\n\tUser string `json:\"doris.user\" mapstructure:\"doris.user\"` //\n\tPassword string `json:\"doris.password\" mapstructure:\"doris.password\"` //\n\tTimeout int `json:\"doris.timeout\" mapstructure:\"doris.timeout\"` // ms\n\tMaxIdleConns int `json:\"doris.max_idle_conns\" mapstructure:\"doris.max_idle_conns\"`\n\tMaxOpenConns int `json:\"doris.max_open_conns\" mapstructure:\"doris.max_open_conns\"`\n\tConnMaxLifetime int `json:\"doris.conn_max_lifetime\" mapstructure:\"doris.conn_max_lifetime\"`\n\tMaxQueryRows int `json:\"doris.max_query_rows\" mapstructure:\"doris.max_query_rows\"`\n\tClusterName string `json:\"doris.cluster_name\" mapstructure:\"doris.cluster_name\"`\n\tEnableWrite bool `json:\"doris.enable_write\" mapstructure:\"doris.enable_write\"`\n\t// 写用户,用来区分读写用户,减少数据源\n\tUserWrite string `json:\"doris.user_write\" mapstructure:\"doris.user_write\"`\n\tPasswordWrite string `json:\"doris.password_write\" mapstructure:\"doris.password_write\"`\n}\n\n// NewDorisWithSettings initializes a new Doris instance with the given settings\nfunc NewDorisWithSettings(ctx context.Context, settings interface{}) (*Doris, error) {\n\tnewest := new(Doris)\n\tsettingsMap := map[string]interface{}{}\n\tif reflect.TypeOf(settings).Kind() == reflect.String {\n\t\tif err := json.Unmarshal([]byte(settings.(string)), &settingsMap); err != nil {\n\t\t\treturn nil, err\n\t\t}\n\t} else {\n\t\tvar assert bool\n\t\tsettingsMap, assert = settings.(map[string]interface{})\n\t\tif !assert {\n\t\t\treturn nil, errors.New(\"settings type invalid\")\n\t\t}\n\t}\n\tif err := mapstructure.Decode(settingsMap, newest); err != nil {\n\t\treturn nil, err\n\t}\n\n\treturn newest, nil\n}\n\n// NewConn establishes a new connection to Doris\nfunc (d *Doris) NewConn(ctx context.Context, database string) (*sql.DB, error) {\n\tif len(d.Addr) == 0 {\n\t\treturn nil, errors.New(\"empty fe-node addr\")\n\t}\n\n\t// Set default values similar to postgres implementation\n\tif d.Timeout == 0 {\n\t\td.Timeout = 60000\n\t}\n\tif d.MaxIdleConns == 0 {\n\t\td.MaxIdleConns = 10\n\t}\n\tif d.MaxOpenConns == 0 {\n\t\td.MaxOpenConns = 100\n\t}\n\tif d.ConnMaxLifetime == 0 {\n\t\td.ConnMaxLifetime = 14400\n\t}\n\tif d.MaxQueryRows == 0 {\n\t\td.MaxQueryRows = 500\n\t}\n\n\tvar keys []string\n\tkeys = append(keys, d.Addr)\n\tkeys = append(keys, d.User, d.Password)\n\tif len(database) > 0 {\n\t\tkeys = append(keys, database)\n\t}\n\tcachedKey := strings.Join(keys, \":\")\n\t// cache conn with database\n\tconn, ok := pool.PoolClient.Load(cachedKey)\n\tif ok {\n\t\treturn conn.(*sql.DB), nil\n\t}\n\tvar db *sql.DB\n\tvar err error\n\tdefer func() {\n\t\tif db != nil && err == nil {\n\t\t\tpool.PoolClient.Store(cachedKey, db)\n\t\t}\n\t}()\n\n\t// Simplified connection logic for Doris using MySQL driver\n\tdsn := fmt.Sprintf(\"%s:%s@tcp(%s)/%s?charset=utf8\", d.User, d.Password, d.Addr, database)\n\tdb, err = sql.Open(\"mysql\", dsn)\n\tif err != nil {\n\t\treturn nil, err\n\t}\n\n\t// Set connection pool configuration\n\tdb.SetMaxIdleConns(d.MaxIdleConns)\n\tdb.SetMaxOpenConns(d.MaxOpenConns)\n\tdb.SetConnMaxLifetime(time.Duration(d.ConnMaxLifetime) * time.Second)\n\n\treturn db, nil\n}\n\n// NewWriteConn establishes a new connection to Doris for write operations\n// When EnableWrite is true and UserWrite is configured, it uses the write user credentials\n// Otherwise, it reuses the read connection from NewConn\nfunc (d *Doris) NewWriteConn(ctx context.Context, database string) (*sql.DB, error) {\n\t// If write user is not configured, reuse the read connection\n\tif !d.EnableWrite || len(d.UserWrite) == 0 {\n\t\treturn d.NewConn(ctx, database)\n\t}\n\n\tif len(d.Addr) == 0 {\n\t\treturn nil, errors.New(\"empty fe-node addr\")\n\t}\n\n\t// Set default values similar to postgres implementation\n\tif d.Timeout == 0 {\n\t\td.Timeout = 60000\n\t}\n\tif d.MaxIdleConns == 0 {\n\t\td.MaxIdleConns = 10\n\t}\n\tif d.MaxOpenConns == 0 {\n\t\td.MaxOpenConns = 100\n\t}\n\tif d.ConnMaxLifetime == 0 {\n\t\td.ConnMaxLifetime = 14400\n\t}\n\tif d.MaxQueryRows == 0 {\n\t\td.MaxQueryRows = 500\n\t}\n\n\t// Use write user credentials\n\tuser := d.UserWrite\n\tpassword := d.PasswordWrite\n\n\tvar keys []string\n\tkeys = append(keys, d.Addr)\n\tkeys = append(keys, user, password)\n\tif len(database) > 0 {\n\t\tkeys = append(keys, database)\n\t}\n\tcachedKey := strings.Join(keys, \":\")\n\t// cache conn with database\n\tconn, ok := pool.PoolClient.Load(cachedKey)\n\tif ok {\n\t\treturn conn.(*sql.DB), nil\n\t}\n\tvar db *sql.DB\n\tvar err error\n\tdefer func() {\n\t\tif db != nil && err == nil {\n\t\t\tpool.PoolClient.Store(cachedKey, db)\n\t\t}\n\t}()\n\n\t// Simplified connection logic for Doris using MySQL driver\n\tdsn := fmt.Sprintf(\"%s:%s@tcp(%s)/%s?charset=utf8\", user, password, d.Addr, database)\n\tdb, err = sql.Open(\"mysql\", dsn)\n\tif err != nil {\n\t\treturn nil, err\n\t}\n\n\t// Set connection pool configuration for write connections\n\t// Use more conservative values since write operations are typically less frequent\n\twriteMaxIdleConns := max(d.MaxIdleConns/5, 2)\n\twriteMaxOpenConns := max(d.MaxOpenConns/10, 5)\n\n\tdb.SetMaxIdleConns(writeMaxIdleConns)\n\tdb.SetMaxOpenConns(writeMaxOpenConns)\n\tdb.SetConnMaxLifetime(time.Duration(d.ConnMaxLifetime) * time.Second)\n\n\treturn db, nil\n}\n\n// createTimeoutContext creates a context with timeout based on Doris configuration\nfunc (d *Doris) createTimeoutContext(ctx context.Context) (context.Context, context.CancelFunc) {\n\ttimeout := d.Timeout\n\tif timeout == 0 {\n\t\ttimeout = 60000\n\t}\n\treturn context.WithTimeout(ctx, time.Duration(timeout)*time.Millisecond)\n}\n\n// ShowDatabases lists all databases in Doris\nfunc (d *Doris) ShowDatabases(ctx context.Context) ([]string, error) {\n\ttimeoutCtx, cancel := d.createTimeoutContext(ctx)\n\tdefer cancel()\n\n\tdb, err := d.NewConn(timeoutCtx, \"\")\n\tif err != nil {\n\t\treturn []string{}, err\n\t}\n\n\trows, err := db.QueryContext(timeoutCtx, \"SHOW DATABASES\")\n\tif err != nil {\n\t\treturn nil, err\n\t}\n\tdefer rows.Close()\n\n\tdatabases := make([]string, 0)\n\tfor rows.Next() {\n\t\tvar dbName string\n\t\tif err := rows.Scan(&dbName); err != nil {\n\t\t\tcontinue\n\t\t}\n\t\tdatabases = append(databases, dbName)\n\t}\n\treturn databases, nil\n}\n\n// ShowResources lists all resources with type resourceType in Doris\nfunc (d *Doris) ShowResources(ctx context.Context, resourceType string) ([]string, error) {\n\ttimeoutCtx, cancel := d.createTimeoutContext(ctx)\n\tdefer cancel()\n\n\tdb, err := d.NewConn(timeoutCtx, \"\")\n\tif err != nil {\n\t\treturn []string{}, err\n\t}\n\n\t// 使用 SHOW RESOURCES 命令\n\tquery := fmt.Sprintf(\"SHOW RESOURCES WHERE RESOURCETYPE = '%s'\", resourceType)\n\trows, err := db.QueryContext(timeoutCtx, query)\n\tif err != nil {\n\t\treturn nil, fmt.Errorf(\"failed to execute query: %w\", err)\n\t}\n\tdefer rows.Close()\n\n\tdistinctName := make(map[string]struct{})\n\n\t// 获取列信息\n\tcolumns, err := rows.Columns()\n\tif err != nil {\n\t\treturn nil, fmt.Errorf(\"failed to get columns: %w\", err)\n\t}\n\n\t// 准备接收数据的变量\n\tvalues := make([]interface{}, len(columns))\n\tvaluePtrs := make([]interface{}, len(columns))\n\tfor i := range values {\n\t\tvaluePtrs[i] = &values[i]\n\t}\n\n\t// 遍历结果集\n\tfor rows.Next() {\n\t\terr := rows.Scan(valuePtrs...)\n\t\tif err != nil {\n\t\t\treturn nil, fmt.Errorf(\"error scanning row: %w\", err)\n\t\t}\n\t\t// 提取资源名称并添加到 map 中(自动去重)\n\t\tif name, ok := values[0].([]byte); ok {\n\t\t\tdistinctName[string(name)] = struct{}{}\n\t\t} else if nameStr, ok := values[0].(string); ok {\n\t\t\tdistinctName[nameStr] = struct{}{}\n\t\t}\n\t}\n\n\tif err := rows.Err(); err != nil {\n\t\treturn nil, fmt.Errorf(\"error iterating rows: %w\", err)\n\t}\n\n\t// 将 map 转换为切片\n\tresources := make([]string, 0)\n\tfor name := range distinctName {\n\t\tresources = append(resources, name)\n\t}\n\n\treturn resources, nil\n}\n\n// ShowTables lists all tables in a given database\nfunc (d *Doris) ShowTables(ctx context.Context, database string) ([]string, error) {\n\ttimeoutCtx, cancel := d.createTimeoutContext(ctx)\n\tdefer cancel()\n\n\tdb, err := d.NewConn(timeoutCtx, database)\n\tif err != nil {\n\t\treturn nil, err\n\t}\n\n\tquery := fmt.Sprintf(\"SHOW TABLES IN %s\", database)\n\trows, err := db.QueryContext(timeoutCtx, query)\n\tif err != nil {\n\t\treturn nil, err\n\t}\n\tdefer rows.Close()\n\n\ttables := make([]string, 0)\n\tfor rows.Next() {\n\t\tvar tableName string\n\t\tif err := rows.Scan(&tableName); err != nil {\n\t\t\tcontinue\n\t\t}\n\t\ttables = append(tables, tableName)\n\t}\n\treturn tables, nil\n}\n\n// DescTable describes the schema of a specified table in Doris\nfunc (d *Doris) DescTable(ctx context.Context, database, table string) ([]*types.ColumnProperty, error) {\n\ttimeoutCtx, cancel := d.createTimeoutContext(ctx)\n\tdefer cancel()\n\n\tdb, err := d.NewConn(timeoutCtx, database)\n\tif err != nil {\n\t\treturn nil, err\n\t}\n\n\tquery := fmt.Sprintf(\"DESCRIBE %s.%s\", database, table)\n\trows, err := db.QueryContext(timeoutCtx, query)\n\tif err != nil {\n\t\treturn nil, err\n\t}\n\tdefer rows.Close()\n\n\t// 日志报表中需要把 .type 转化成内部类型\n\t// TODO: 是否有复合类型, Array/JSON/Tuple/Nested, 是否有更多的类型\n\tconvertDorisType := func(origin string) (string, bool) {\n\t\tlower := strings.ToLower(origin)\n\t\tswitch lower {\n\t\tcase \"double\":\n\t\t\treturn types.LogExtractValueTypeFloat, true\n\n\t\tcase \"datetime\", \"date\":\n\t\t\treturn types.LogExtractValueTypeDate, false\n\n\t\tcase \"text\":\n\t\t\treturn types.LogExtractValueTypeText, true\n\n\t\tdefault:\n\t\t\tif strings.Contains(lower, \"int\") {\n\t\t\t\treturn types.LogExtractValueTypeLong, true\n\t\t\t}\n\t\t\t// 日期类型统一按照.date处理\n\t\t\tif strings.HasPrefix(lower, \"date\") {\n\t\t\t\treturn types.LogExtractValueTypeDate, false\n\t\t\t}\n\t\t\tif strings.HasPrefix(lower, \"varchar\") || strings.HasPrefix(lower, \"char\") {\n\t\t\t\treturn types.LogExtractValueTypeText, true\n\t\t\t}\n\t\t\tif strings.HasPrefix(lower, \"decimal\") {\n\t\t\t\treturn types.LogExtractValueTypeFloat, true\n\t\t\t}\n\t\t}\n\n\t\treturn origin, false\n\t}\n\n\tvar columns []*types.ColumnProperty\n\tfor rows.Next() {\n\t\tvar (\n\t\t\tfield string\n\t\t\ttyp string\n\t\t\tnull string\n\t\t\tkey string\n\t\t\tdefaultValue sql.NullString\n\t\t\textra string\n\t\t)\n\t\tif err := rows.Scan(&field, &typ, &null, &key, &defaultValue, &extra); err != nil {\n\t\t\tcontinue\n\t\t}\n\t\ttype2, indexable := convertDorisType(typ)\n\t\tcolumns = append(columns, &types.ColumnProperty{\n\t\t\tField: field,\n\t\t\tType: typ, // You might want to convert MySQL types to your custom types\n\n\t\t\tType2: type2,\n\t\t\tIndexable: indexable,\n\t\t})\n\t}\n\treturn columns, nil\n}\n\ntype TableIndexInfo struct {\n\tColumnName string `json:\"column_name\"`\n\tIndexName string `json:\"index_name\"`\n\tIndexType string `json:\"index_type\"`\n}\n\n// ShowIndexes 查询表的所有索引信息\nfunc (d *Doris) ShowIndexes(ctx context.Context, database, table string) ([]TableIndexInfo, error) {\n\tif database == \"\" || table == \"\" {\n\t\treturn nil, fmt.Errorf(\"database and table names cannot be empty\")\n\t}\n\n\ttCtx, cancel := d.createTimeoutContext(ctx)\n\tdefer cancel()\n\n\tdb, err := d.NewConn(tCtx, database)\n\tif err != nil {\n\t\treturn nil, err\n\t}\n\n\tquerySQL := fmt.Sprintf(\"%s `%s`.`%s`\", SQLShowIndex, database, table)\n\trows, err := db.QueryContext(tCtx, querySQL)\n\tif err != nil {\n\t\treturn nil, fmt.Errorf(\"failed to query indexes: %w\", err)\n\t}\n\tdefer rows.Close()\n\n\tcolumns, err := rows.Columns()\n\tif err != nil {\n\t\treturn nil, fmt.Errorf(\"failed to get columns: %w\", err)\n\t}\n\tcount := len(columns)\n\n\t// 预映射列索引\n\tcolIdx := map[string]int{\n\t\tShowIndexKeyName: -1,\n\t\tShowIndexFieldColumnName: -1,\n\t\tShowIndexFieldIndexType: -1,\n\t}\n\tfor i, col := range columns {\n\t\tlCol := strings.ToLower(col)\n\t\tif lCol == ShowIndexKeyName || lCol == ShowIndexFieldColumnName || lCol == ShowIndexFieldIndexType {\n\t\t\tcolIdx[lCol] = i\n\t\t}\n\t}\n\n\tvar result []TableIndexInfo\n\tfor rows.Next() {\n\t\t// 使用 sql.RawBytes 可以接受任何类型并转为 string,避免复杂的类型断言\n\t\tscanArgs := make([]interface{}, count)\n\t\tvalues := make([]sql.RawBytes, count)\n\t\tfor i := range values {\n\t\t\tscanArgs[i] = &values[i]\n\t\t}\n\n\t\tif err = rows.Scan(scanArgs...); err != nil {\n\t\t\treturn nil, err\n\t\t}\n\n\t\tinfo := TableIndexInfo{}\n\t\tif i := colIdx[ShowIndexFieldColumnName]; i != -1 && i < count {\n\t\t\tinfo.ColumnName = string(values[i])\n\t\t}\n\t\tif i := colIdx[ShowIndexKeyName]; i != -1 && i < count {\n\t\t\tinfo.IndexName = string(values[i])\n\t\t}\n\t\tif i := colIdx[ShowIndexFieldIndexType]; i != -1 && i < count {\n\t\t\tinfo.IndexType = string(values[i])\n\t\t}\n\n\t\tif info.ColumnName != \"\" {\n\t\t\tresult = append(result, info)\n\t\t}\n\t}\n\n\tif err = rows.Err(); err != nil {\n\t\treturn nil, fmt.Errorf(\"error iterating rows: %w\", err)\n\t}\n\n\treturn result, nil\n}\n\n// SelectRows selects rows from a specified table in Doris based on a given query with MaxQueryRows check\nfunc (d *Doris) SelectRows(ctx context.Context, database, table, query string) ([]map[string]interface{}, error) {\n\tsql := fmt.Sprintf(\"SELECT * FROM %s.%s\", database, table)\n\tif query != \"\" {\n\t\tsql += \" \" + query\n\t}\n\n\t// 检查查询结果行数\n\terr := d.CheckMaxQueryRows(ctx, database, sql)\n\tif err != nil {\n\t\treturn nil, err\n\t}\n\n\treturn d.ExecQuery(ctx, database, sql)\n}\n\n// ExecQuery executes a given SQL query in Doris and returns the results\nfunc (d *Doris) ExecQuery(ctx context.Context, database string, sql string) ([]map[string]interface{}, error) {\n\ttimeoutCtx, cancel := d.createTimeoutContext(ctx)\n\tdefer cancel()\n\n\tdb, err := d.NewConn(timeoutCtx, database)\n\tif err != nil {\n\t\treturn nil, err\n\t}\n\n\trows, err := db.QueryContext(timeoutCtx, sql)\n\tif err != nil {\n\t\treturn nil, err\n\t}\n\tdefer rows.Close()\n\n\tcolumns, err := rows.Columns()\n\tif err != nil {\n\t\treturn nil, err\n\t}\n\n\tvar results []map[string]interface{}\n\n\tfor rows.Next() {\n\t\tcolumnValues := make([]interface{}, len(columns))\n\t\tcolumnPointers := make([]interface{}, len(columns))\n\t\tfor i := range columnValues {\n\t\t\tcolumnPointers[i] = &columnValues[i]\n\t\t}\n\n\t\tif err := rows.Scan(columnPointers...); err != nil {\n\t\t\tcontinue\n\t\t}\n\n\t\trowMap := make(map[string]interface{})\n\t\tfor i, colName := range columns {\n\t\t\tval := columnValues[i]\n\t\t\tbytes, ok := val.([]byte)\n\t\t\tif ok {\n\t\t\t\trowMap[colName] = string(bytes)\n\t\t\t} else {\n\t\t\t\trowMap[colName] = val\n\t\t\t}\n\t\t}\n\t\tresults = append(results, rowMap)\n\t}\n\treturn results, nil\n}\n\n// ExecContext executes a given SQL query in Doris and returns the results\nfunc (d *Doris) ExecContext(ctx context.Context, database string, sql string) error {\n\ttimeoutCtx, cancel := d.createTimeoutContext(ctx)\n\tdefer cancel()\n\n\tdb, err := d.NewWriteConn(timeoutCtx, database)\n\tif err != nil {\n\t\treturn err\n\t}\n\n\t_, err = db.ExecContext(timeoutCtx, sql)\n\treturn err\n}\n\n// ExecBatchSQL 执行多条 SQL 语句\nfunc (d *Doris) ExecBatchSQL(ctx context.Context, database string, sqlBatch string) error {\n\t// 分割 SQL 语句\n\tsqlStatements := SplitSQLStatements(sqlBatch)\n\n\t// 逐条执行 SQL 语句\n\tfor _, ql := range sqlStatements {\n\t\t// 跳过空语句\n\t\tql = strings.TrimSpace(ql)\n\t\tif ql == \"\" {\n\t\t\tcontinue\n\t\t}\n\n\t\t// 检查是否是 CREATE DATABASE 语句\n\t\tisCreateDB := strings.HasPrefix(strings.ToUpper(ql), \"CREATE DATABASE\")\n\t\t// strings.HasPrefix(strings.ToUpper(sql), \"CREATE SCHEMA\") // 暂时不支持CREATE SCHEMA\n\n\t\t// 对于 CREATE DATABASE 语句,使用空数据库名连接\n\t\tcurrentDB := database\n\t\tif isCreateDB {\n\t\t\tcurrentDB = \"\"\n\t\t}\n\n\t\t// 执行单条 SQL,ExecContext 内部已经包含超时处理\n\t\terr := d.ExecContext(ctx, currentDB, ql)\n\t\tif err != nil {\n\t\t\treturn fmt.Errorf(\"exec sql failed, sql:%s, err:%w\", sqlBatch, err)\n\t\t}\n\t}\n\n\treturn nil\n}\n\n// SplitSQLStatements 将多条 SQL 语句分割成单独的语句\nfunc SplitSQLStatements(sqlBatch string) []string {\n\tvar statements []string\n\tvar currentStatement strings.Builder\n\n\t// 状态标记\n\tvar (\n\t\tinString bool // 是否在字符串内\n\t\tinComment bool // 是否在单行注释内\n\t\tinMultilineComment bool // 是否在多行注释内\n\t\tescaped bool // 前一个字符是否为转义字符\n\t)\n\n\tfor i := 0; i < len(sqlBatch); i++ {\n\t\tchar := sqlBatch[i]\n\t\tcurrentStatement.WriteByte(char)\n\n\t\t// 处理转义字符\n\t\tif inString && char == '\\\\' {\n\t\t\tescaped = !escaped\n\t\t\tcontinue\n\t\t}\n\n\t\t// 处理字符串\n\t\tif char == '\\'' && !inComment && !inMultilineComment {\n\t\t\tif !escaped {\n\t\t\t\tinString = !inString\n\t\t\t}\n\t\t\tescaped = false\n\t\t\tcontinue\n\t\t}\n\n\t\t// 处理单行注释\n\t\tif !inString && !inMultilineComment && !inComment && char == '-' && i+1 < len(sqlBatch) && sqlBatch[i+1] == '-' {\n\t\t\tinComment = true\n\t\t\tcurrentStatement.WriteByte(sqlBatch[i+1]) // 写入第二个'-'\n\t\t\ti++\n\t\t\tcontinue\n\t\t}\n\n\t\t// 处理多行注释开始\n\t\tif !inString && !inComment && char == '/' && i+1 < len(sqlBatch) && sqlBatch[i+1] == '*' {\n\t\t\tinMultilineComment = true\n\t\t\tcurrentStatement.WriteByte(sqlBatch[i+1]) // 写入'*'\n\t\t\ti++\n\t\t\tcontinue\n\t\t}\n\n\t\t// 处理多行注释结束\n\t\tif inMultilineComment && char == '*' && i+1 < len(sqlBatch) && sqlBatch[i+1] == '/' {\n\t\t\tinMultilineComment = false\n\t\t\tcurrentStatement.WriteByte(sqlBatch[i+1]) // 写入'/'\n\t\t\ti++\n\t\t\tcontinue\n\t\t}\n\n\t\t// 处理换行符,结束单行注释\n\t\tif inComment && (char == '\\n' || char == '\\r') {\n\t\t\tinComment = false\n\t\t}\n\n\t\t// 分割SQL语句\n\t\tif char == ';' && !inString && !inMultilineComment && !inComment {\n\t\t\t// 收集到分号后面的单行注释(如果有)\n\t\t\tfor j := i + 1; j < len(sqlBatch); j++ {\n\t\t\t\tnextChar := sqlBatch[j]\n\n\t\t\t\t// 检查是否是注释开始\n\t\t\t\tif nextChar == '-' && j+1 < len(sqlBatch) && sqlBatch[j+1] == '-' {\n\t\t\t\t\t// 找到了注释,添加到当前语句\n\t\t\t\t\tcurrentStatement.WriteByte(nextChar) // 添加'-'\n\t\t\t\t\tcurrentStatement.WriteByte(sqlBatch[j+1]) // 添加第二个'-'\n\t\t\t\t\tj++\n\n\t\t\t\t\t// 读取直到行尾\n\t\t\t\t\tfor k := j + 1; k < len(sqlBatch); k++ {\n\t\t\t\t\t\tcommentChar := sqlBatch[k]\n\t\t\t\t\t\tcurrentStatement.WriteByte(commentChar)\n\t\t\t\t\t\tj = k\n\n\t\t\t\t\t\tif commentChar == '\\n' || commentChar == '\\r' {\n\t\t\t\t\t\t\tbreak\n\t\t\t\t\t\t}\n\t\t\t\t\t}\n\t\t\t\t\ti = j\n\t\t\t\t\tbreak\n\t\t\t\t} else if !isWhitespace(nextChar) {\n\t\t\t\t\t// 非注释且非空白字符,停止收集\n\t\t\t\t\tbreak\n\t\t\t\t} else {\n\t\t\t\t\t// 是空白字符,添加到当前语句\n\t\t\t\t\tcurrentStatement.WriteByte(nextChar)\n\t\t\t\t\ti = j\n\t\t\t\t}\n\t\t\t}\n\n\t\t\tstatements = append(statements, strings.TrimSpace(currentStatement.String()))\n\t\t\tcurrentStatement.Reset()\n\t\t\tcontinue\n\t\t}\n\n\t\tescaped = false\n\t}\n\n\t// 处理最后一条可能没有分号的语句\n\tlastStatement := strings.TrimSpace(currentStatement.String())\n\tif lastStatement != \"\" {\n\t\tstatements = append(statements, lastStatement)\n\t}\n\n\treturn statements\n}\n\n// 判断字符是否为空白字符\nfunc isWhitespace(c byte) bool {\n\treturn unicode.IsSpace(rune(c))\n}\n"
},
{
"path": "dskit/doris/logs.go",
"content": "package doris\n\nimport (\n\t\"context\"\n\t\"sort\"\n)\n\n// 日志相关的操作\nconst (\n\tTimeseriesAggregationTimestamp = \"__ts__\"\n)\n\n// TODO: 待测试, MAP/ARRAY/STRUCT/JSON 等类型能否处理\nfunc (d *Doris) QueryLogs(ctx context.Context, query *QueryParam) ([]map[string]interface{}, error) {\n\t// 等同于 Query()\n\treturn d.Query(ctx, query)\n}\n\n// 本质是查询时序数据, 取第一组, SQL由上层封装, 不再做复杂的解析和截断\nfunc (d *Doris) QueryHistogram(ctx context.Context, query *QueryParam) ([][]float64, error) {\n\tvalues, err := d.QueryTimeseries(ctx, query)\n\tif err != nil {\n\t\treturn [][]float64{}, nil\n\t}\n\tif len(values) > 0 && len(values[0].Values) > 0 {\n\t\titems := values[0].Values\n\t\tsort.Slice(items, func(i, j int) bool {\n\t\t\tif len(items[i]) > 0 && len(items[j]) > 0 {\n\t\t\t\treturn items[i][0] < items[j][0]\n\t\t\t}\n\t\t\treturn false\n\t\t})\n\t\treturn items, nil\n\t}\n\treturn [][]float64{}, nil\n}\n"
},
{
"path": "dskit/doris/sql_analyzer.go",
"content": "package doris\n\nimport (\n\t\"regexp\"\n\t\"strings\"\n\n\t\"github.com/pingcap/tidb/pkg/parser\"\n\t\"github.com/pingcap/tidb/pkg/parser/ast\"\n\t_ \"github.com/pingcap/tidb/pkg/parser/test_driver\" // required for parser\n)\n\n// mapAccessPattern matches Doris map/array access syntax like `col['key']` or col[\"key\"]\nvar mapAccessPattern = regexp.MustCompile(`\\[['\"]\\w+['\"]\\]`)\n\n// castStringPattern matches Doris CAST(... AS STRING) syntax\nvar castStringPattern = regexp.MustCompile(`(?i)\\bAS\\s+STRING\\b`)\n\n// macro patterns\nvar timeGroupPattern = regexp.MustCompile(`\\$__timeGroup\\([^)]+\\)`)\nvar timeFilterPattern = regexp.MustCompile(`\\$__timeFilter\\([^)]+\\)`)\nvar intervalPattern = regexp.MustCompile(`\\$__interval`)\n\n// SQLAnalyzeResult holds the analysis result of a SQL statement\ntype SQLAnalyzeResult struct {\n\tIsSelectLike bool // whether the statement is a SELECT-like query\n\tHasTopAgg bool // whether the top-level query has aggregate functions\n\tLimitConst *int64 // top-level LIMIT constant value (nil if no LIMIT or non-constant)\n}\n\n// AnalyzeSQL analyzes a SQL statement and extracts top-level features\nfunc AnalyzeSQL(sql string) (*SQLAnalyzeResult, error) {\n\t// Preprocess SQL to remove Doris-specific syntax that TiDB parser doesn't support\n\tpreprocessedSQL := preprocessDorisSQL(sql)\n\n\tp := parser.New()\n\tstmtNodes, _, err := p.Parse(preprocessedSQL, \"\", \"\")\n\tif err != nil {\n\t\treturn nil, err\n\t}\n\tif len(stmtNodes) == 0 {\n\t\treturn &SQLAnalyzeResult{}, nil\n\t}\n\n\tresult := &SQLAnalyzeResult{}\n\tstmt := stmtNodes[0]\n\n\tswitch s := stmt.(type) {\n\tcase *ast.SelectStmt:\n\t\tresult.IsSelectLike = true\n\t\tanalyzeSelectStmt(s, result)\n\tcase *ast.SetOprStmt: // UNION / INTERSECT / EXCEPT\n\t\tresult.IsSelectLike = true\n\t\tanalyzeSetOprStmt(s, result)\n\tdefault:\n\t\tresult.IsSelectLike = false\n\t}\n\n\treturn result, nil\n}\n\n// analyzeSelectStmt analyzes a SELECT statement\nfunc analyzeSelectStmt(sel *ast.SelectStmt, result *SQLAnalyzeResult) {\n\t// Check if top-level SELECT has aggregate functions\n\tif sel.Fields != nil {\n\t\tfor _, field := range sel.Fields.Fields {\n\t\t\tif field.Expr != nil && hasAggregateFunc(field.Expr) {\n\t\t\t\tresult.HasTopAgg = true\n\t\t\t\tbreak\n\t\t\t}\n\t\t}\n\t}\n\n\t// Check if any CTE has aggregate functions\n\tif !result.HasTopAgg && sel.With != nil {\n\t\tfor _, cte := range sel.With.CTEs {\n\t\t\tif selectHasAggregate(cte.Query) {\n\t\t\t\tresult.HasTopAgg = true\n\t\t\t\tbreak\n\t\t\t}\n\t\t}\n\t}\n\n\t// Extract top-level LIMIT\n\tif sel.Limit != nil && sel.Limit.Count != nil {\n\t\tif val, ok := extractConstValue(sel.Limit.Count); ok {\n\t\t\tresult.LimitConst = &val\n\t\t}\n\t}\n}\n\n// selectHasAggregate checks if a node (SELECT, UNION, or SubqueryExpr) has aggregate functions\nfunc selectHasAggregate(node ast.Node) bool {\n\tswitch n := node.(type) {\n\tcase *ast.SelectStmt:\n\t\tif n.Fields != nil {\n\t\t\tfor _, field := range n.Fields.Fields {\n\t\t\t\tif field.Expr != nil && hasAggregateFunc(field.Expr) {\n\t\t\t\t\treturn true\n\t\t\t\t}\n\t\t\t}\n\t\t}\n\tcase *ast.SetOprStmt:\n\t\t// For UNION, check all branches\n\t\tif n.SelectList != nil {\n\t\t\tfor _, sel := range n.SelectList.Selects {\n\t\t\t\tif selectHasAggregate(sel) {\n\t\t\t\t\treturn true\n\t\t\t\t}\n\t\t\t}\n\t\t}\n\tcase *ast.SubqueryExpr:\n\t\t// CTE query is wrapped in SubqueryExpr\n\t\tif n.Query != nil {\n\t\t\treturn selectHasAggregate(n.Query)\n\t\t}\n\t}\n\treturn false\n}\n\n// analyzeSetOprStmt analyzes UNION/INTERSECT/EXCEPT statements\nfunc analyzeSetOprStmt(setOpr *ast.SetOprStmt, result *SQLAnalyzeResult) {\n\t// UNION's LIMIT is at the outermost level\n\tif setOpr.Limit != nil && setOpr.Limit.Count != nil {\n\t\tif val, ok := extractConstValue(setOpr.Limit.Count); ok {\n\t\t\tresult.LimitConst = &val\n\t\t}\n\t}\n\n\t// Check if all branches are aggregates (conservative: if any is non-aggregate, don't skip)\n\tif setOpr.SelectList == nil || len(setOpr.SelectList.Selects) == 0 {\n\t\treturn\n\t}\n\n\tallAgg := true\n\tfor _, sel := range setOpr.SelectList.Selects {\n\t\tif selectStmt, ok := sel.(*ast.SelectStmt); ok {\n\t\t\tif selectStmt.Fields != nil {\n\t\t\t\thasAgg := false\n\t\t\t\tfor _, field := range selectStmt.Fields.Fields {\n\t\t\t\t\tif field.Expr != nil && hasAggregateFunc(field.Expr) {\n\t\t\t\t\t\thasAgg = true\n\t\t\t\t\t\tbreak\n\t\t\t\t\t}\n\t\t\t\t}\n\t\t\t\tif !hasAgg {\n\t\t\t\t\tallAgg = false\n\t\t\t\t\tbreak\n\t\t\t\t}\n\t\t\t}\n\t\t}\n\t}\n\tresult.HasTopAgg = allAgg\n}\n\n// hasAggregateFunc checks if an expression contains aggregate functions (without entering subqueries)\nfunc hasAggregateFunc(expr ast.ExprNode) bool {\n\tchecker := &aggregateChecker{}\n\texpr.Accept(checker)\n\treturn checker.found\n}\n\n// aggregateChecker implements ast.Visitor to find aggregate functions\ntype aggregateChecker struct {\n\tfound bool\n}\n\nfunc (c *aggregateChecker) Enter(n ast.Node) (ast.Node, bool) {\n\tif c.found {\n\t\treturn n, true // stop traversal\n\t}\n\n\tswitch node := n.(type) {\n\tcase *ast.SubqueryExpr:\n\t\treturn n, true // don't enter subquery\n\tcase *ast.AggregateFuncExpr:\n\t\tc.found = true\n\t\treturn n, true\n\tcase *ast.FuncCallExpr:\n\t\t// Check for Doris-specific aggregate/statistic functions\n\t\tfuncName := strings.ToUpper(node.FnName.L)\n\t\tif isDorisAggregateFunc(funcName) {\n\t\t\tc.found = true\n\t\t\treturn n, true\n\t\t}\n\t}\n\treturn n, false // continue traversal\n}\n\nfunc (c *aggregateChecker) Leave(n ast.Node) (ast.Node, bool) {\n\treturn n, true\n}\n\n// isDorisAggregateFunc checks if a function is a Doris-specific aggregate/statistic function\nfunc isDorisAggregateFunc(funcName string) bool {\n\tdorisAggFuncs := map[string]bool{\n\t\t// Standard aggregates (in case parser doesn't recognize them)\n\t\t\"COUNT\": true,\n\t\t\"SUM\": true,\n\t\t\"AVG\": true,\n\t\t\"MIN\": true,\n\t\t\"MAX\": true,\n\t\t\"ANY\": true,\n\t\t\"ANY_VALUE\": true,\n\n\t\t// HLL related\n\t\t\"HLL_UNION_AGG\": true,\n\t\t\"HLL_RAW_AGG\": true,\n\t\t\"HLL_CARDINALITY\": true,\n\t\t\"HLL_UNION\": true,\n\t\t\"HLL_HASH\": true,\n\n\t\t// Bitmap related\n\t\t\"BITMAP_UNION\": true,\n\t\t\"BITMAP_UNION_COUNT\": true,\n\t\t\"BITMAP_INTERSECT\": true,\n\t\t\"BITMAP_COUNT\": true,\n\t\t\"BITMAP_AND_COUNT\": true,\n\t\t\"BITMAP_OR_COUNT\": true,\n\t\t\"BITMAP_XOR_COUNT\": true,\n\t\t\"BITMAP_AND_NOT_COUNT\": true,\n\n\t\t// Other aggregates\n\t\t\"PERCENTILE\": true,\n\t\t\"PERCENTILE_APPROX\": true,\n\t\t\"APPROX_COUNT_DISTINCT\": true,\n\t\t\"NDV\": true,\n\t\t\"COLLECT_LIST\": true,\n\t\t\"COLLECT_SET\": true,\n\t\t\"GROUP_CONCAT\": true,\n\t\t\"GROUP_BIT_AND\": true,\n\t\t\"GROUP_BIT_OR\": true,\n\t\t\"GROUP_BIT_XOR\": true,\n\t\t\"GROUPING\": true,\n\t\t\"GROUPING_ID\": true,\n\n\t\t// Statistical functions\n\t\t\"STDDEV\": true,\n\t\t\"STDDEV_POP\": true,\n\t\t\"STDDEV_SAMP\": true,\n\t\t\"STD\": true,\n\t\t\"VARIANCE\": true,\n\t\t\"VAR_POP\": true,\n\t\t\"VAR_SAMP\": true,\n\t\t\"COVAR_POP\": true,\n\t\t\"COVAR_SAMP\": true,\n\t\t\"CORR\": true,\n\n\t\t// Window functions that are also aggregates\n\t\t\"FIRST_VALUE\": true,\n\t\t\"LAST_VALUE\": true,\n\t\t\"LAG\": true,\n\t\t\"LEAD\": true,\n\t\t\"ROW_NUMBER\": true,\n\t\t\"RANK\": true,\n\t\t\"DENSE_RANK\": true,\n\t\t\"NTILE\": true,\n\t\t\"CUME_DIST\": true,\n\t\t\"PERCENT_RANK\": true,\n\t}\n\treturn dorisAggFuncs[funcName]\n}\n\n// extractConstValue extracts constant integer value from an expression\nfunc extractConstValue(expr ast.ExprNode) (int64, bool) {\n\tswitch v := expr.(type) {\n\tcase ast.ValueExpr:\n\t\tswitch val := v.GetValue().(type) {\n\t\tcase int64:\n\t\t\treturn val, true\n\t\tcase uint64:\n\t\t\treturn int64(val), true\n\t\tcase float64:\n\t\t\treturn int64(val), true\n\t\tcase int:\n\t\t\treturn int64(val), true\n\t\t}\n\t}\n\treturn 0, false\n}\n\n// preprocessDorisSQL removes Doris-specific syntax that TiDB parser doesn't support\nfunc preprocessDorisSQL(sql string) string {\n\t// Remove map/array access syntax like ['key'] or [\"key\"]\n\t// This is used in Doris for accessing map/variant/json fields\n\tsql = mapAccessPattern.ReplaceAllString(sql, \"\")\n\n\t// Replace Doris CAST(... AS STRING) with CAST(... AS CHAR)\n\tsql = castStringPattern.ReplaceAllString(sql, \"AS CHAR\")\n\n\t// Replace macros with valid SQL equivalents\n\tsql = timeGroupPattern.ReplaceAllString(sql, \"ts\")\n\tsql = timeFilterPattern.ReplaceAllString(sql, \"1=1\")\n\tsql = intervalPattern.ReplaceAllString(sql, \"60\")\n\n\treturn sql\n}\n\n// NeedsRowCountCheck determines if a SQL query needs row count checking\n// Returns: needsCheck bool, directReject bool, rejectReason string\nfunc NeedsRowCountCheck(sql string, maxQueryRows int) (bool, bool, string) {\n\tresult, err := AnalyzeSQL(sql)\n\tif err != nil {\n\t\t// Parse failed, fall back to probe check\n\t\treturn true, false, \"\"\n\t}\n\n\tif !result.IsSelectLike {\n\t\t// Not a SELECT query, skip check\n\t\treturn false, false, \"\"\n\t}\n\n\t// Rule 1: Top-level has aggregate functions -> skip check\n\tif result.HasTopAgg {\n\t\treturn false, false, \"\"\n\t}\n\n\t// Rule 2: Top-level LIMIT <= maxRows -> skip check\n\tif result.LimitConst != nil && *result.LimitConst <= int64(maxQueryRows) {\n\t\treturn false, false, \"\"\n\t}\n\n\t// Otherwise, needs probe check (including LIMIT > maxRows, since actual result may be smaller)\n\treturn true, false, \"\"\n}\n"
},
{
"path": "dskit/doris/sql_analyzer_test.go",
"content": "package doris\n\nimport (\n\t\"testing\"\n)\n\nfunc TestAnalyzeSQL_AggregateQueries(t *testing.T) {\n\ttests := []struct {\n\t\tname string\n\t\tsql string\n\t\twantHasAgg bool\n\t\twantIsSelect bool\n\t}{\n\t\t// Standard aggregate functions - should skip check\n\t\t{\n\t\t\tname: \"COUNT(*)\",\n\t\t\tsql: \"SELECT COUNT(*) AS `cnt`, FLOOR(UNIX_TIMESTAMP(event_date) DIV 10) * 10 AS `time`, CAST(`labels`['event'] AS STRING) AS `labels.event` FROM `db_insight_doris`.`ewall_event` WHERE `event_date` BETWEEN FROM_UNIXTIME(1768965669) AND FROM_UNIXTIME(1768965969) GROUP BY `time`, `labels.event` ORDER BY `time` ASC\",\n\t\t\twantHasAgg: true,\n\t\t\twantIsSelect: true,\n\t\t},\n\t\t{\n\t\t\tname: \"COUNT with column\",\n\t\t\tsql: \"SELECT COUNT(id) FROM users\",\n\t\t\twantHasAgg: true,\n\t\t\twantIsSelect: true,\n\t\t},\n\t\t{\n\t\t\tname: \"SUM function\",\n\t\t\tsql: \"SELECT SUM(amount) FROM orders\",\n\t\t\twantHasAgg: true,\n\t\t\twantIsSelect: true,\n\t\t},\n\t\t{\n\t\t\tname: \"AVG function\",\n\t\t\tsql: \"SELECT AVG(price) FROM products\",\n\t\t\twantHasAgg: true,\n\t\t\twantIsSelect: true,\n\t\t},\n\t\t{\n\t\t\tname: \"MIN function\",\n\t\t\tsql: \"SELECT MIN(created_at) FROM logs\",\n\t\t\twantHasAgg: true,\n\t\t\twantIsSelect: true,\n\t\t},\n\t\t{\n\t\t\tname: \"MAX function\",\n\t\t\tsql: \"SELECT MAX(score) FROM results\",\n\t\t\twantHasAgg: true,\n\t\t\twantIsSelect: true,\n\t\t},\n\t\t{\n\t\t\tname: \"Multiple aggregates\",\n\t\t\tsql: \"SELECT COUNT(*), SUM(amount), AVG(price) FROM orders\",\n\t\t\twantHasAgg: true,\n\t\t\twantIsSelect: true,\n\t\t},\n\t\t{\n\t\t\tname: \"Aggregate with GROUP BY\",\n\t\t\tsql: \"SELECT user_id, COUNT(*) FROM orders GROUP BY user_id\",\n\t\t\twantHasAgg: true,\n\t\t\twantIsSelect: true,\n\t\t},\n\t\t{\n\t\t\tname: \"Aggregate with WHERE and GROUP BY\",\n\t\t\tsql: \"SELECT category, SUM(sales) FROM products WHERE status = 'active' GROUP BY category\",\n\t\t\twantHasAgg: true,\n\t\t\twantIsSelect: true,\n\t\t},\n\t\t{\n\t\t\tname: \"Aggregate with HAVING\",\n\t\t\tsql: \"SELECT user_id, COUNT(*) as cnt FROM orders GROUP BY user_id HAVING cnt > 10\",\n\t\t\twantHasAgg: true,\n\t\t\twantIsSelect: true,\n\t\t},\n\t\t// macro queries with aggregates\n\t\t{\n\t\t\tname: \"COUNT with timeGroup\",\n\t\t\tsql: \"SELECT COUNT(*) AS `cnt`, $__timeGroup(timestamp,$__interval) AS `time` FROM `apm`.`traces_span` WHERE (`service_name` = 'demo-logic-server') AND $__timeFilter(`timestamp`) GROUP BY `time` ORDER BY `time` ASC\",\n\t\t\twantHasAgg: true,\n\t\t\twantIsSelect: true,\n\t\t},\n\t\t{\n\t\t\tname: \"CTE with ratio calculation\",\n\t\t\tsql: \"WITH `time_totals` AS (SELECT $__timeGroup(timestamp,$__interval) AS `time`, COUNT(*) AS `total_count` FROM `apm`.`traces_span` WHERE $__timeFilter(`timestamp`) GROUP BY `time`), `time_counts` AS (SELECT ANY_VALUE(`service_name`) AS `service_name`, $__timeGroup(timestamp,$__interval) AS `time`, COUNT(*) AS `count` FROM `apm`.`traces_span` WHERE (`service_name` = 'demo-logic-server') AND $__timeFilter(`timestamp`) GROUP BY `time`) SELECT tc.`service_name`, tc.`time`, ROUND(tc.`count` * 100.0 / tt.`total_count`, 2) AS `ratio` FROM `time_counts` tc JOIN `time_totals` tt ON tc.`time` = tt.`time` ORDER BY tc.`time` ASC\",\n\t\t\twantHasAgg: true, // CTE has aggregate functions\n\t\t\twantIsSelect: true,\n\t\t},\n\t\t{\n\t\t\tname: \"CTE with top values and ratio\",\n\t\t\tsql: \"WITH `top_values` AS (SELECT `service_name` FROM `apm`.`traces_span` WHERE $__timeFilter(`timestamp`) GROUP BY `service_name` ORDER BY COUNT(*) DESC LIMIT 5), `time_totals` AS (SELECT $__timeGroup(timestamp,$__interval) AS `time`, COUNT(*) AS `total_count` FROM `apm`.`traces_span` WHERE $__timeFilter(`timestamp`) GROUP BY `time`), `time_counts` AS (SELECT `service_name`, $__timeGroup(timestamp,$__interval) AS `time`, COUNT(*) AS `count` FROM `apm`.`traces_span` WHERE $__timeFilter(`timestamp`) AND `service_name` IN (SELECT `service_name` FROM `top_values`) GROUP BY `service_name`, `time`) SELECT tc.`service_name`, tc.`time`, ROUND(tc.`count` * 100.0 / tt.`total_count`, 2) AS `ratio` FROM `time_counts` tc JOIN `time_totals` tt ON tc.`time` = tt.`time` ORDER BY tc.`time` ASC\",\n\t\t\twantHasAgg: true, // CTE has aggregate functions\n\t\t\twantIsSelect: true,\n\t\t},\n\t\t{\n\t\t\tname: \"PERCENTILE_APPROX with timeGroup\",\n\t\t\tsql: \"SELECT PERCENTILE_APPROX(`duration`, 0.95) AS `p95`, $__timeGroup(timestamp,$__interval) AS `time` FROM `apm`.`traces_span` WHERE $__timeFilter(`timestamp`) GROUP BY `time` ORDER BY `time` ASC\",\n\t\t\twantHasAgg: true,\n\t\t\twantIsSelect: true,\n\t\t},\n\t\t{\n\t\t\tname: \"COUNT DISTINCT with timeGroup\",\n\t\t\tsql: \"SELECT COUNT(DISTINCT `duration`) AS `unique_count`, $__timeGroup(timestamp,$__interval) AS `time` FROM `apm`.`traces_span` WHERE $__timeFilter(`timestamp`) GROUP BY `time` ORDER BY `time` ASC\",\n\t\t\twantHasAgg: true,\n\t\t\twantIsSelect: true,\n\t\t},\n\t\t{\n\t\t\tname: \"CASE WHEN with COUNT and ROUND\",\n\t\t\tsql: \"SELECT ROUND(COUNT(CASE WHEN `duration` IS NOT NULL THEN 1 END) * 100.0 / COUNT(*), 2) AS `exist_ratio`, $__timeGroup(timestamp,$__interval) AS `time` FROM `apm`.`traces_span` WHERE $__timeFilter(`timestamp`) GROUP BY `time` ORDER BY `time` ASC\",\n\t\t\twantHasAgg: true,\n\t\t\twantIsSelect: true,\n\t\t},\n\t\t{\n\t\t\tname: \"AVG with timeGroup\",\n\t\t\tsql: \"SELECT AVG(`duration`) AS `avg`, $__timeGroup(timestamp,$__interval) AS `time` FROM `apm`.`traces_span` WHERE $__timeFilter(`timestamp`) GROUP BY `time` ORDER BY `time` ASC\",\n\t\t\twantHasAgg: true,\n\t\t\twantIsSelect: true,\n\t\t},\n\t\t{\n\t\t\tname: \"Simple COUNT with timeFilter\",\n\t\t\tsql: \"SELECT COUNT(*) AS `cnt` FROM `apm`.`traces_span` WHERE (`span_name` = 'GET /backend/detail') AND $__timeFilter(`timestamp`)\",\n\t\t\twantHasAgg: true,\n\t\t\twantIsSelect: true,\n\t\t},\n\t\t{\n\t\t\tname: \"CTE with CROSS JOIN ratio\",\n\t\t\tsql: \"WITH `total` AS (SELECT COUNT(*) AS `total_count` FROM `apm`.`traces_span` WHERE $__timeFilter(`timestamp`)), `value_counts` AS (SELECT ANY_VALUE(`span_kind`) AS `span_kind`, COUNT(*) AS `count` FROM `apm`.`traces_span` WHERE (`span_kind` = 'SPAN_KIND_SERVER') AND $__timeFilter(`timestamp`)) SELECT vc.`span_kind`, vc.`count` AS `count`, ROUND(vc.`count` * 100.0 / t.`total_count`, 2) AS `ratio` FROM `value_counts` vc CROSS JOIN `total` t ORDER BY vc.`count` DESC;\",\n\t\t\twantHasAgg: true, // CTE has aggregate functions\n\t\t\twantIsSelect: true,\n\t\t},\n\t\t// Non-aggregate queries - should not skip check\n\t\t{\n\t\t\tname: \"Simple SELECT *\",\n\t\t\tsql: \"SELECT * FROM users\",\n\t\t\twantHasAgg: false,\n\t\t\twantIsSelect: true,\n\t\t},\n\t\t{\n\t\t\tname: \"SELECT with columns\",\n\t\t\tsql: \"SELECT id, name, email FROM users\",\n\t\t\twantHasAgg: false,\n\t\t\twantIsSelect: true,\n\t\t},\n\t\t{\n\t\t\tname: \"SELECT with WHERE\",\n\t\t\tsql: \"SELECT * FROM users WHERE status = 'active'\",\n\t\t\twantHasAgg: false,\n\t\t\twantIsSelect: true,\n\t\t},\n\t\t{\n\t\t\tname: \"SELECT with JOIN\",\n\t\t\tsql: \"SELECT u.name, o.amount FROM users u JOIN orders o ON u.id = o.user_id\",\n\t\t\twantHasAgg: false,\n\t\t\twantIsSelect: true,\n\t\t},\n\t}\n\n\tfor _, tt := range tests {\n\t\tt.Run(tt.name, func(t *testing.T) {\n\t\t\tresult, err := AnalyzeSQL(tt.sql)\n\t\t\tif err != nil {\n\t\t\t\tt.Fatalf(\"AnalyzeSQL() error = %v\", err)\n\t\t\t}\n\t\t\tif result.HasTopAgg != tt.wantHasAgg {\n\t\t\t\tt.Errorf(\"name: %s, HasTopAgg = %v, want %v\", tt.name, result.HasTopAgg, tt.wantHasAgg)\n\t\t\t}\n\t\t\tif result.IsSelectLike != tt.wantIsSelect {\n\t\t\t\tt.Errorf(\"IsSelectLike = %v, want %v\", result.IsSelectLike, tt.wantIsSelect)\n\t\t\t}\n\t\t})\n\t}\n}\n\nfunc TestAnalyzeSQL_SubqueryWithAggregate(t *testing.T) {\n\t// Aggregate in subquery should NOT skip check for main query\n\ttests := []struct {\n\t\tname string\n\t\tsql string\n\t\twantHasAgg bool\n\t}{\n\t\t{\n\t\t\tname: \"Aggregate in subquery only\",\n\t\t\tsql: \"SELECT * FROM (SELECT user_id, COUNT(*) as cnt FROM orders GROUP BY user_id) t\",\n\t\t\twantHasAgg: false, // top-level has no aggregate\n\t\t},\n\t\t{\n\t\t\tname: \"Aggregate in WHERE subquery\",\n\t\t\tsql: \"SELECT * FROM users WHERE id IN (SELECT user_id FROM orders GROUP BY user_id HAVING COUNT(*) > 5)\",\n\t\t\twantHasAgg: false, // top-level has no aggregate\n\t\t},\n\t\t{\n\t\t\tname: \"Both top-level and subquery aggregates\",\n\t\t\tsql: \"SELECT COUNT(*) FROM (SELECT user_id FROM orders GROUP BY user_id) t\",\n\t\t\twantHasAgg: true, // top-level has aggregate\n\t\t},\n\t}\n\n\tfor _, tt := range tests {\n\t\tt.Run(tt.name, func(t *testing.T) {\n\t\t\tresult, err := AnalyzeSQL(tt.sql)\n\t\t\tif err != nil {\n\t\t\t\tt.Fatalf(\"AnalyzeSQL() error = %v\", err)\n\t\t\t}\n\t\t\tif result.HasTopAgg != tt.wantHasAgg {\n\t\t\t\tt.Errorf(\"HasTopAgg = %v, want %v\", result.HasTopAgg, tt.wantHasAgg)\n\t\t\t}\n\t\t})\n\t}\n}\n\nfunc TestAnalyzeSQL_LimitQueries(t *testing.T) {\n\ttests := []struct {\n\t\tname string\n\t\tsql string\n\t\twantLimit *int64\n\t\twantIsSelect bool\n\t}{\n\t\t{\n\t\t\tname: \"LIMIT 10\",\n\t\t\tsql: \"SELECT * FROM users LIMIT 10\",\n\t\t\twantLimit: ptr(int64(10)),\n\t\t\twantIsSelect: true,\n\t\t},\n\t\t{\n\t\t\tname: \"LIMIT 100\",\n\t\t\tsql: \"SELECT * FROM users LIMIT 100\",\n\t\t\twantLimit: ptr(int64(100)),\n\t\t\twantIsSelect: true,\n\t\t},\n\t\t{\n\t\t\tname: \"LIMIT 1000\",\n\t\t\tsql: \"SELECT * FROM users LIMIT 1000\",\n\t\t\twantLimit: ptr(int64(1000)),\n\t\t\twantIsSelect: true,\n\t\t},\n\t\t{\n\t\t\tname: \"LIMIT with OFFSET\",\n\t\t\tsql: \"SELECT * FROM users LIMIT 50 OFFSET 100\",\n\t\t\twantLimit: ptr(int64(50)),\n\t\t\twantIsSelect: true,\n\t\t},\n\t\t{\n\t\t\tname: \"No LIMIT\",\n\t\t\tsql: \"SELECT * FROM users\",\n\t\t\twantLimit: nil,\n\t\t\twantIsSelect: true,\n\t\t},\n\t\t{\n\t\t\tname: \"LIMIT 0\",\n\t\t\tsql: \"SELECT * FROM users LIMIT 0\",\n\t\t\twantLimit: ptr(int64(0)),\n\t\t\twantIsSelect: true,\n\t\t},\n\t\t{\n\t\t\tname: \"LIMIT 1\",\n\t\t\tsql: \"SELECT * FROM users LIMIT 1\",\n\t\t\twantLimit: ptr(int64(1)),\n\t\t\twantIsSelect: true,\n\t\t},\n\t}\n\n\tfor _, tt := range tests {\n\t\tt.Run(tt.name, func(t *testing.T) {\n\t\t\tresult, err := AnalyzeSQL(tt.sql)\n\t\t\tif err != nil {\n\t\t\t\tt.Fatalf(\"AnalyzeSQL() error = %v\", err)\n\t\t\t}\n\t\t\tif result.IsSelectLike != tt.wantIsSelect {\n\t\t\t\tt.Errorf(\"IsSelectLike = %v, want %v\", result.IsSelectLike, tt.wantIsSelect)\n\t\t\t}\n\t\t\tif tt.wantLimit == nil {\n\t\t\t\tif result.LimitConst != nil {\n\t\t\t\t\tt.Errorf(\"LimitConst = %v, want nil\", *result.LimitConst)\n\t\t\t\t}\n\t\t\t} else {\n\t\t\t\tif result.LimitConst == nil {\n\t\t\t\t\tt.Errorf(\"LimitConst = nil, want %v\", *tt.wantLimit)\n\t\t\t\t} else if *result.LimitConst != *tt.wantLimit {\n\t\t\t\t\tt.Errorf(\"LimitConst = %v, want %v\", *result.LimitConst, *tt.wantLimit)\n\t\t\t\t}\n\t\t\t}\n\t\t})\n\t}\n}\n\nfunc TestAnalyzeSQL_UnionQueries(t *testing.T) {\n\ttests := []struct {\n\t\tname string\n\t\tsql string\n\t\twantHasAgg bool\n\t\twantLimit *int64\n\t}{\n\t\t{\n\t\t\tname: \"UNION without aggregate\",\n\t\t\tsql: \"SELECT id, name FROM users UNION SELECT id, name FROM admins\",\n\t\t\twantHasAgg: false,\n\t\t\twantLimit: nil,\n\t\t},\n\t\t{\n\t\t\tname: \"UNION ALL without aggregate\",\n\t\t\tsql: \"SELECT * FROM users UNION ALL SELECT * FROM admins\",\n\t\t\twantHasAgg: false,\n\t\t\twantLimit: nil,\n\t\t},\n\t\t{\n\t\t\tname: \"UNION with aggregate in all branches\",\n\t\t\tsql: \"SELECT COUNT(*) FROM users UNION SELECT COUNT(*) FROM admins\",\n\t\t\twantHasAgg: true,\n\t\t\twantLimit: nil,\n\t\t},\n\t\t{\n\t\t\tname: \"UNION with aggregate in one branch only\",\n\t\t\tsql: \"SELECT COUNT(*) FROM users UNION SELECT id FROM admins\",\n\t\t\twantHasAgg: false, // not all branches have aggregate\n\t\t\twantLimit: nil,\n\t\t},\n\t\t{\n\t\t\tname: \"UNION with outer LIMIT\",\n\t\t\tsql: \"SELECT * FROM users UNION SELECT * FROM admins LIMIT 100\",\n\t\t\twantHasAgg: false,\n\t\t\twantLimit: ptr(int64(100)),\n\t\t},\n\t}\n\n\tfor _, tt := range tests {\n\t\tt.Run(tt.name, func(t *testing.T) {\n\t\t\tresult, err := AnalyzeSQL(tt.sql)\n\t\t\tif err != nil {\n\t\t\t\tt.Fatalf(\"AnalyzeSQL() error = %v\", err)\n\t\t\t}\n\t\t\tif result.HasTopAgg != tt.wantHasAgg {\n\t\t\t\tt.Errorf(\"HasTopAgg = %v, want %v\", result.HasTopAgg, tt.wantHasAgg)\n\t\t\t}\n\t\t\tif tt.wantLimit == nil {\n\t\t\t\tif result.LimitConst != nil {\n\t\t\t\t\tt.Errorf(\"LimitConst = %v, want nil\", *result.LimitConst)\n\t\t\t\t}\n\t\t\t} else {\n\t\t\t\tif result.LimitConst == nil {\n\t\t\t\t\tt.Errorf(\"LimitConst = nil, want %v\", *tt.wantLimit)\n\t\t\t\t} else if *result.LimitConst != *tt.wantLimit {\n\t\t\t\t\tt.Errorf(\"LimitConst = %v, want %v\", *result.LimitConst, *tt.wantLimit)\n\t\t\t\t}\n\t\t\t}\n\t\t})\n\t}\n}\n\nfunc TestAnalyzeSQL_NonSelectStatements(t *testing.T) {\n\ttests := []struct {\n\t\tname string\n\t\tsql string\n\t\twantIsSelect bool\n\t}{\n\t\t{\n\t\t\tname: \"SHOW DATABASES\",\n\t\t\tsql: \"SHOW DATABASES\",\n\t\t\twantIsSelect: false,\n\t\t},\n\t\t{\n\t\t\tname: \"SHOW TABLES\",\n\t\t\tsql: \"SHOW TABLES\",\n\t\t\twantIsSelect: false,\n\t\t},\n\t\t{\n\t\t\tname: \"DESCRIBE table\",\n\t\t\tsql: \"DESCRIBE users\",\n\t\t\twantIsSelect: false,\n\t\t},\n\t}\n\n\tfor _, tt := range tests {\n\t\tt.Run(tt.name, func(t *testing.T) {\n\t\t\tresult, err := AnalyzeSQL(tt.sql)\n\t\t\tif err != nil {\n\t\t\t\t// Some statements may not be parseable, which is fine\n\t\t\t\treturn\n\t\t\t}\n\t\t\tif result.IsSelectLike != tt.wantIsSelect {\n\t\t\t\tt.Errorf(\"IsSelectLike = %v, want %v\", result.IsSelectLike, tt.wantIsSelect)\n\t\t\t}\n\t\t})\n\t}\n}\n\nfunc TestNeedsRowCountCheck(t *testing.T) {\n\tmaxRows := 500\n\n\ttests := []struct {\n\t\tname string\n\t\tsql string\n\t\twantNeedCheck bool\n\t\twantReject bool\n\t}{\n\t\t// Should skip check (needsCheck = false)\n\t\t{\n\t\t\tname: \"Aggregate COUNT(*)\",\n\t\t\tsql: \"SELECT COUNT(*) FROM users\",\n\t\t\twantNeedCheck: false,\n\t\t\twantReject: false,\n\t\t},\n\t\t{\n\t\t\tname: \"Aggregate SUM\",\n\t\t\tsql: \"SELECT SUM(amount) FROM orders\",\n\t\t\twantNeedCheck: false,\n\t\t\twantReject: false,\n\t\t},\n\t\t{\n\t\t\tname: \"Aggregate with GROUP BY\",\n\t\t\tsql: \"SELECT user_id, COUNT(*) FROM orders GROUP BY user_id\",\n\t\t\twantNeedCheck: false,\n\t\t\twantReject: false,\n\t\t},\n\t\t{\n\t\t\tname: \"LIMIT equal to max\",\n\t\t\tsql: \"SELECT * FROM users LIMIT 500\",\n\t\t\twantNeedCheck: false,\n\t\t\twantReject: false,\n\t\t},\n\t\t{\n\t\t\tname: \"LIMIT less than max\",\n\t\t\tsql: \"SELECT * FROM users LIMIT 100\",\n\t\t\twantNeedCheck: false,\n\t\t\twantReject: false,\n\t\t},\n\t\t{\n\t\t\tname: \"LIMIT 1\",\n\t\t\tsql: \"SELECT * FROM users LIMIT 1\",\n\t\t\twantNeedCheck: false,\n\t\t\twantReject: false,\n\t\t},\n\n\t\t// LIMIT > maxRows still needs probe check (actual result might be smaller)\n\t\t{\n\t\t\tname: \"LIMIT exceeds max\",\n\t\t\tsql: \"SELECT * FROM users LIMIT 1000\",\n\t\t\twantNeedCheck: true,\n\t\t\twantReject: false,\n\t\t},\n\t\t{\n\t\t\tname: \"LIMIT much larger than max\",\n\t\t\tsql: \"SELECT * FROM users LIMIT 10000\",\n\t\t\twantNeedCheck: true,\n\t\t\twantReject: false,\n\t\t},\n\n\t\t// Should execute probe check (needsCheck = true)\n\t\t{\n\t\t\tname: \"No LIMIT no aggregate\",\n\t\t\tsql: \"SELECT * FROM users\",\n\t\t\twantNeedCheck: true,\n\t\t\twantReject: false,\n\t\t},\n\t\t{\n\t\t\tname: \"SELECT with WHERE no LIMIT\",\n\t\t\tsql: \"SELECT * FROM users WHERE status = 'active'\",\n\t\t\twantNeedCheck: true,\n\t\t\twantReject: false,\n\t\t},\n\t\t{\n\t\t\tname: \"SELECT with JOIN no LIMIT\",\n\t\t\tsql: \"SELECT u.*, o.* FROM users u JOIN orders o ON u.id = o.user_id\",\n\t\t\twantNeedCheck: true,\n\t\t\twantReject: false,\n\t\t},\n\t\t{\n\t\t\tname: \"Aggregate in subquery only\",\n\t\t\tsql: \"SELECT * FROM (SELECT user_id, COUNT(*) as cnt FROM orders GROUP BY user_id) t\",\n\t\t\twantNeedCheck: true,\n\t\t\twantReject: false,\n\t\t},\n\t}\n\n\tfor _, tt := range tests {\n\t\tt.Run(tt.name, func(t *testing.T) {\n\t\t\tneedsCheck, directReject, _ := NeedsRowCountCheck(tt.sql, maxRows)\n\t\t\tif needsCheck != tt.wantNeedCheck {\n\t\t\t\tt.Errorf(\"needsCheck = %v, want %v\", needsCheck, tt.wantNeedCheck)\n\t\t\t}\n\t\t\tif directReject != tt.wantReject {\n\t\t\t\tt.Errorf(\"directReject = %v, want %v\", directReject, tt.wantReject)\n\t\t\t}\n\t\t})\n\t}\n}\n\nfunc TestNeedsRowCountCheck_DorisSpecificFunctions(t *testing.T) {\n\tmaxRows := 500\n\n\ttests := []struct {\n\t\tname string\n\t\tsql string\n\t\twantNeedCheck bool\n\t}{\n\t\t// Doris HLL functions\n\t\t{\n\t\t\tname: \"HLL_UNION_AGG\",\n\t\t\tsql: \"SELECT HLL_UNION_AGG(hll_col) FROM user_stats\",\n\t\t\twantNeedCheck: false,\n\t\t},\n\t\t{\n\t\t\tname: \"HLL_CARDINALITY\",\n\t\t\tsql: \"SELECT HLL_CARDINALITY(hll_col) FROM user_stats\",\n\t\t\twantNeedCheck: false,\n\t\t},\n\t\t// Doris Bitmap functions\n\t\t{\n\t\t\tname: \"BITMAP_UNION_COUNT\",\n\t\t\tsql: \"SELECT BITMAP_UNION_COUNT(bitmap_col) FROM user_tags\",\n\t\t\twantNeedCheck: false,\n\t\t},\n\t\t{\n\t\t\tname: \"BITMAP_UNION\",\n\t\t\tsql: \"SELECT BITMAP_UNION(bitmap_col) FROM user_tags GROUP BY category\",\n\t\t\twantNeedCheck: false,\n\t\t},\n\t\t// Other Doris aggregate functions\n\t\t{\n\t\t\tname: \"APPROX_COUNT_DISTINCT\",\n\t\t\tsql: \"SELECT APPROX_COUNT_DISTINCT(user_id) FROM events\",\n\t\t\twantNeedCheck: false,\n\t\t},\n\t\t{\n\t\t\tname: \"GROUP_CONCAT\",\n\t\t\tsql: \"SELECT GROUP_CONCAT(name) FROM users GROUP BY department\",\n\t\t\twantNeedCheck: false,\n\t\t},\n\t\t{\n\t\t\tname: \"PERCENTILE_APPROX\",\n\t\t\tsql: \"SELECT PERCENTILE_APPROX(latency, 0.99) FROM requests\",\n\t\t\twantNeedCheck: false,\n\t\t},\n\t}\n\n\tfor _, tt := range tests {\n\t\tt.Run(tt.name, func(t *testing.T) {\n\t\t\tneedsCheck, _, _ := NeedsRowCountCheck(tt.sql, maxRows)\n\t\t\tif needsCheck != tt.wantNeedCheck {\n\t\t\t\tt.Errorf(\"needsCheck = %v, want %v (should skip check for Doris aggregate functions)\", needsCheck, tt.wantNeedCheck)\n\t\t\t}\n\t\t})\n\t}\n}\n\nfunc TestNeedsRowCountCheck_ComplexQueries(t *testing.T) {\n\tmaxRows := 500\n\n\ttests := []struct {\n\t\tname string\n\t\tsql string\n\t\twantNeedCheck bool\n\t\twantReject bool\n\t}{\n\t\t{\n\t\t\tname: \"CTE with aggregate\",\n\t\t\tsql: \"WITH user_counts AS (SELECT user_id, COUNT(*) as cnt FROM orders GROUP BY user_id) SELECT * FROM user_counts\",\n\t\t\twantNeedCheck: false, // CTE has aggregate, skip check\n\t\t\twantReject: false,\n\t\t},\n\t\t{\n\t\t\tname: \"Complex JOIN with aggregate\",\n\t\t\tsql: \"SELECT u.department, COUNT(*) FROM users u JOIN orders o ON u.id = o.user_id GROUP BY u.department\",\n\t\t\twantNeedCheck: false, // has aggregate\n\t\t\twantReject: false,\n\t\t},\n\t\t{\n\t\t\tname: \"Nested subquery\",\n\t\t\tsql: \"SELECT * FROM users WHERE id IN (SELECT user_id FROM orders WHERE amount > 100)\",\n\t\t\twantNeedCheck: true,\n\t\t\twantReject: false,\n\t\t},\n\t\t{\n\t\t\tname: \"DISTINCT query\",\n\t\t\tsql: \"SELECT DISTINCT category FROM products\",\n\t\t\twantNeedCheck: true, // DISTINCT is not aggregate\n\t\t\twantReject: false,\n\t\t},\n\t\t{\n\t\t\tname: \"ORDER BY with LIMIT\",\n\t\t\tsql: \"SELECT * FROM users ORDER BY created_at DESC LIMIT 100\",\n\t\t\twantNeedCheck: false, // has valid LIMIT\n\t\t\twantReject: false,\n\t\t},\n\t\t{\n\t\t\tname: \"Multiple aggregates in single query\",\n\t\t\tsql: \"SELECT COUNT(*), SUM(amount), AVG(amount), MIN(amount), MAX(amount) FROM orders\",\n\t\t\twantNeedCheck: false,\n\t\t\twantReject: false,\n\t\t},\n\t}\n\n\tfor _, tt := range tests {\n\t\tt.Run(tt.name, func(t *testing.T) {\n\t\t\tneedsCheck, directReject, _ := NeedsRowCountCheck(tt.sql, maxRows)\n\t\t\tif needsCheck != tt.wantNeedCheck {\n\t\t\t\tt.Errorf(\"needsCheck = %v, want %v\", needsCheck, tt.wantNeedCheck)\n\t\t\t}\n\t\t\tif directReject != tt.wantReject {\n\t\t\t\tt.Errorf(\"directReject = %v, want %v\", directReject, tt.wantReject)\n\t\t\t}\n\t\t})\n\t}\n}\n\nfunc TestNeedsRowCountCheck_EdgeCases(t *testing.T) {\n\tmaxRows := 500\n\n\ttests := []struct {\n\t\tname string\n\t\tsql string\n\t\twantNeedCheck bool\n\t\twantReject bool\n\t}{\n\t\t{\n\t\t\tname: \"Empty-ish LIMIT 0\",\n\t\t\tsql: \"SELECT * FROM users LIMIT 0\",\n\t\t\twantNeedCheck: false,\n\t\t\twantReject: false,\n\t\t},\n\t\t{\n\t\t\tname: \"LIMIT at boundary\",\n\t\t\tsql: \"SELECT * FROM users LIMIT 501\",\n\t\t\twantNeedCheck: true, // 501 > 500, needs probe check\n\t\t\twantReject: false,\n\t\t},\n\t\t{\n\t\t\tname: \"SELECT with trailing semicolon\",\n\t\t\tsql: \"SELECT * FROM users;\",\n\t\t\twantNeedCheck: true,\n\t\t\twantReject: false,\n\t\t},\n\t\t{\n\t\t\tname: \"SELECT with extra whitespace\",\n\t\t\tsql: \" SELECT * FROM users \",\n\t\t\twantNeedCheck: true,\n\t\t\twantReject: false,\n\t\t},\n\t\t{\n\t\t\tname: \"Lowercase keywords\",\n\t\t\tsql: \"select count(*) from users\",\n\t\t\twantNeedCheck: false,\n\t\t\twantReject: false,\n\t\t},\n\t\t{\n\t\t\tname: \"Mixed case keywords\",\n\t\t\tsql: \"Select Count(*) From users\",\n\t\t\twantNeedCheck: false,\n\t\t\twantReject: false,\n\t\t},\n\t}\n\n\tfor _, tt := range tests {\n\t\tt.Run(tt.name, func(t *testing.T) {\n\t\t\tneedsCheck, directReject, _ := NeedsRowCountCheck(tt.sql, maxRows)\n\t\t\tif needsCheck != tt.wantNeedCheck {\n\t\t\t\tt.Errorf(\"needsCheck = %v, want %v\", needsCheck, tt.wantNeedCheck)\n\t\t\t}\n\t\t\tif directReject != tt.wantReject {\n\t\t\t\tt.Errorf(\"directReject = %v, want %v\", directReject, tt.wantReject)\n\t\t\t}\n\t\t})\n\t}\n}\n\nfunc TestNeedsRowCountCheck_DifferentMaxRows(t *testing.T) {\n\ttests := []struct {\n\t\tname string\n\t\tsql string\n\t\tmaxRows int\n\t\twantNeedCheck bool\n\t\twantReject bool\n\t}{\n\t\t{\n\t\t\tname: \"LIMIT 100 with maxRows 50\",\n\t\t\tsql: \"SELECT * FROM users LIMIT 100\",\n\t\t\tmaxRows: 50,\n\t\t\twantNeedCheck: true, // LIMIT > maxRows, needs probe check\n\t\t\twantReject: false,\n\t\t},\n\t\t{\n\t\t\tname: \"LIMIT 100 with maxRows 100\",\n\t\t\tsql: \"SELECT * FROM users LIMIT 100\",\n\t\t\tmaxRows: 100,\n\t\t\twantNeedCheck: false,\n\t\t\twantReject: false,\n\t\t},\n\t\t{\n\t\t\tname: \"LIMIT 100 with maxRows 200\",\n\t\t\tsql: \"SELECT * FROM users LIMIT 100\",\n\t\t\tmaxRows: 200,\n\t\t\twantNeedCheck: false,\n\t\t\twantReject: false,\n\t\t},\n\t\t{\n\t\t\tname: \"No LIMIT with maxRows 1000\",\n\t\t\tsql: \"SELECT * FROM users\",\n\t\t\tmaxRows: 1000,\n\t\t\twantNeedCheck: true,\n\t\t\twantReject: false,\n\t\t},\n\t}\n\n\tfor _, tt := range tests {\n\t\tt.Run(tt.name, func(t *testing.T) {\n\t\t\tneedsCheck, directReject, _ := NeedsRowCountCheck(tt.sql, tt.maxRows)\n\t\t\tif needsCheck != tt.wantNeedCheck {\n\t\t\t\tt.Errorf(\"needsCheck = %v, want %v\", needsCheck, tt.wantNeedCheck)\n\t\t\t}\n\t\t\tif directReject != tt.wantReject {\n\t\t\t\tt.Errorf(\"directReject = %v, want %v\", directReject, tt.wantReject)\n\t\t\t}\n\t\t})\n\t}\n}\n\n// TestSummary_SkipProbeCheck prints a summary of which SQL patterns skip the probe check\nfunc TestSummary_SkipProbeCheck(t *testing.T) {\n\tmaxRows := 500\n\n\tskipCheckCases := []struct {\n\t\tcategory string\n\t\tsql string\n\t}{\n\t\t// Aggregate functions\n\t\t{\"Aggregate - COUNT(*)\", \"SELECT COUNT(*) FROM users\"},\n\t\t{\"Aggregate - COUNT(col)\", \"SELECT COUNT(id) FROM users\"},\n\t\t{\"Aggregate - SUM\", \"SELECT SUM(amount) FROM orders\"},\n\t\t{\"Aggregate - AVG\", \"SELECT AVG(price) FROM products\"},\n\t\t{\"Aggregate - MIN\", \"SELECT MIN(created_at) FROM logs\"},\n\t\t{\"Aggregate - MAX\", \"SELECT MAX(score) FROM results\"},\n\t\t{\"Aggregate - GROUP BY\", \"SELECT user_id, COUNT(*) FROM orders GROUP BY user_id\"},\n\t\t{\"Aggregate - HAVING\", \"SELECT user_id, SUM(amount) FROM orders GROUP BY user_id HAVING SUM(amount) > 1000\"},\n\n\t\t// Doris specific aggregates\n\t\t{\"Doris - HLL_UNION_AGG\", \"SELECT HLL_UNION_AGG(hll_col) FROM stats\"},\n\t\t{\"Doris - BITMAP_UNION_COUNT\", \"SELECT BITMAP_UNION_COUNT(bitmap_col) FROM tags\"},\n\t\t{\"Doris - APPROX_COUNT_DISTINCT\", \"SELECT APPROX_COUNT_DISTINCT(user_id) FROM events\"},\n\t\t{\"Doris - GROUP_CONCAT\", \"SELECT GROUP_CONCAT(name) FROM users GROUP BY dept\"},\n\n\t\t// LIMIT <= maxRows\n\t\t{\"LIMIT - Equal to max\", \"SELECT * FROM users LIMIT 500\"},\n\t\t{\"LIMIT - Less than max\", \"SELECT * FROM users LIMIT 100\"},\n\t\t{\"LIMIT - With OFFSET\", \"SELECT * FROM users LIMIT 100 OFFSET 50\"},\n\t\t{\"LIMIT - Value 1\", \"SELECT * FROM users LIMIT 1\"},\n\t\t{\"LIMIT - Value 0\", \"SELECT * FROM users LIMIT 0\"},\n\t}\n\n\tt.Log(\"=== SQL patterns that SKIP probe check (no extra query needed) ===\")\n\tfor _, tc := range skipCheckCases {\n\t\tneedsCheck, _, _ := NeedsRowCountCheck(tc.sql, maxRows)\n\t\tstatus := \"✓ SKIP\"\n\t\tif needsCheck {\n\t\t\tstatus = \"✗ NEEDS CHECK (unexpected)\"\n\t\t}\n\t\tt.Logf(\" %s: %s\\n SQL: %s\", status, tc.category, tc.sql)\n\t}\n\n\tneedsCheckCases := []struct {\n\t\tcategory string\n\t\tsql string\n\t}{\n\t\t{\"No LIMIT - Simple SELECT\", \"SELECT * FROM users\"},\n\t\t{\"No LIMIT - With WHERE\", \"SELECT * FROM users WHERE status = 'active'\"},\n\t\t{\"No LIMIT - With JOIN\", \"SELECT u.*, o.* FROM users u JOIN orders o ON u.id = o.user_id\"},\n\t\t{\"No LIMIT - Subquery with agg\", \"SELECT * FROM (SELECT user_id, COUNT(*) FROM orders GROUP BY user_id) t\"},\n\t\t{\"No LIMIT - DISTINCT\", \"SELECT DISTINCT category FROM products\"},\n\t\t{\"LIMIT > max (actual may be smaller)\", \"SELECT * FROM users LIMIT 1000\"},\n\t\t{\"LIMIT >> max\", \"SELECT * FROM users LIMIT 10000\"},\n\t}\n\n\tt.Log(\"\\n=== SQL patterns that NEED probe check ===\")\n\tfor _, tc := range needsCheckCases {\n\t\tneedsCheck, _, _ := NeedsRowCountCheck(tc.sql, maxRows)\n\t\tstatus := \"✓ NEEDS CHECK\"\n\t\tif !needsCheck {\n\t\t\tstatus = \"✗ SKIP (unexpected)\"\n\t\t}\n\t\tt.Logf(\" %s: %s\\n SQL: %s\", status, tc.category, tc.sql)\n\t}\n}\n\n// ptr is a helper function to create a pointer to int64\nfunc ptr(v int64) *int64 {\n\treturn &v\n}\n"
},
{
"path": "dskit/doris/template.md",
"content": "## SQL变量\n\n| 字段名 | 含义 | 使用场景 |\n| ---- | ---- | ---- | \n|database|数据库|无|\n|table|表名||\n|time_field|时间戳的字段||\n|query|查询条件|日志原文|\n|from|开始时间||\n|to|结束时间||\n|aggregation|聚合算法|时序图|\n|field|聚合的字段|时序图|\n|limit|分页参数|日志原文|\n|offset|分页参数|日志原文|\n|interval|直方图的时间粒度|直方图|\n\n## 日志原文\n### 直方图\n\n```\n# 如何计算interval的值\nmax := 60 // 最多60个柱子\ninterval := ($to-$from) / max\ninterval = interval - interval%10\nif interval <= 0 {\n\tinterval = 60\n}\n```\n\n```\nSELECT count() as cnt,\n\tFLOOR(UNIX_TIMESTAMP($time_field) / $interval) * $interval AS __ts__ \n\t\tFROM $table\n\tWHERE $time_field BETWEEN FROM_UNIXTIME($from) AND FROM_UNIXTIME($to)\n\tGROUP BY __ts__;\n```\n\n```\n{\n\t\"database\":\"$database\",\n\t\"sql\":\"$sql\",\n\t\"keys:\": {\n\t\t\"valueKey\":\"cnt\",\n\t\t\"timeKey\":\"__ts__\"\n\t}\n}\n```\n\n### 日志原文\n\n```\nSELECT * from $table\n\tWHERE $time_field BETWEEN FROM_UNIXTIME($from) AND FROM_UNIXTIME($to)\n\tORDER by $time_filed\n\tLIMIT $limit OFFSET $offset;\n```\n\n```\n{\n\t\"database\":\"$database\",\n\t\"sql\":\"$sql\"\n}\n```\n\n## 时序图\n\n### 日志行数\n\n```\nSELECT COUNT() AS cnt, DATE_FORMAT(date, '%Y-%m-%d %H:%i:00') AS __ts__ \n\tFROM nginx_access_log\n\tWHERE $time_field BETWEEN FROM_UNIXTIME($from) AND FROM_UNIXTIME($to)\n\tGROUP BY __ts__\n```\n\n```\n{\n\t\"database\":\"$database\",\n\t\"sql\":\"$sql\",\n\t\"keys:\": {\n\t\t\"valueKey\":\"cnt\",\n\t\t\"timeKey\":\"__ts__\"\n\t}\n}\n```\n\n### max/min/avg/sum\n\n```\nSELECT $aggregation($field) AS series, DATE_FORMAT(date, '%Y-%m-%d %H:%i:00') AS __ts__ \n\tFROM nginx_access_log\n\tWHERE $time_field BETWEEN FROM_UNIXTIME($from) AND FROM_UNIXTIME($to)\n\tGROUP BY __ts__\n```\n\n```\n{\n\t\"database\":\"$database\",\n\t\"sql\":\"$sql\",\n\t\"keys:\": {\n\t\t\"valueKey\":\"series\",\n\t\t\"timeKey\":\"__ts__\"\n\t}\n}\n```\n\n\n### 分位值\n\n```\nSELECT percentile($field, 0.95) AS series, DATE_FORMAT(date, '%Y-%m-%d %H:%i:00') AS __ts__ \n\tFROM nginx_access_log\n\tWHERE $time_field BETWEEN FROM_UNIXTIME($from) AND FROM_UNIXTIME($to)\n\tGROUP BY __ts__\n```\n\n```\n{\n\t\"database\":\"$database\",\n\t\"sql\":\"$sql\",\n\t\"keys:\": {\n\t\t\"valueKey\":\"series\",\n\t\t\"timeKey\":\"__ts__\"\n\t}\n}\n```"
},
{
"path": "dskit/doris/timeseries.go",
"content": "package doris\n\nimport (\n\t\"context\"\n\t\"fmt\"\n\t\"strings\"\n\n\t\"github.com/ccfos/nightingale/v6/dskit/sqlbase\"\n\t\"github.com/ccfos/nightingale/v6/dskit/types\"\n)\n\nconst (\n\tTimeFieldFormatEpochMilli = \"epoch_millis\"\n\tTimeFieldFormatEpochSecond = \"epoch_second\"\n\tTimeFieldFormatDateTime = \"datetime\"\n)\n\n// 不再拼接SQL, 完全信赖用户的输入\ntype QueryParam struct {\n\tDatabase string `json:\"database\"`\n\tSql string `json:\"sql\"`\n\tKeys types.Keys `json:\"keys\" mapstructure:\"keys\"`\n}\n\nvar (\n\tDorisBannedOp = map[string]struct{}{\n\t\t\"CREATE\": {},\n\t\t\"INSERT\": {},\n\t\t\"ALTER\": {},\n\t\t\"REVOKE\": {},\n\t\t\"DROP\": {},\n\t\t\"RENAME\": {},\n\t\t\"ATTACH\": {},\n\t\t\"DETACH\": {},\n\t\t\"OPTIMIZE\": {},\n\t\t\"TRUNCATE\": {},\n\t\t\"SET\": {},\n\t}\n)\n\n// Query executes a given SQL query in Doris and returns the results with MaxQueryRows check\nfunc (d *Doris) Query(ctx context.Context, query *QueryParam) ([]map[string]interface{}, error) {\n\t// 校验SQL的合法性, 过滤掉 write请求\n\tsqlItem := strings.Split(strings.ToUpper(query.Sql), \" \")\n\tfor _, item := range sqlItem {\n\t\tif _, ok := DorisBannedOp[item]; ok {\n\t\t\treturn nil, fmt.Errorf(\"operation %s is forbid, only read db, please check your sql\", item)\n\t\t}\n\t}\n\n\t// 检查查询结果行数\n\terr := d.CheckMaxQueryRows(ctx, query.Database, query.Sql)\n\tif err != nil {\n\t\treturn nil, err\n\t}\n\n\trows, err := d.ExecQuery(ctx, query.Database, query.Sql)\n\tif err != nil {\n\t\treturn nil, err\n\t}\n\treturn rows, nil\n}\n\n// QueryTimeseries executes a time series data query using the given parameters with MaxQueryRows check\nfunc (d *Doris) QueryTimeseries(ctx context.Context, query *QueryParam) ([]types.MetricValues, error) {\n\t// 使用 Query 方法执行查询,Query方法内部已包含MaxQueryRows检查\n\trows, err := d.Query(ctx, query)\n\tif err != nil {\n\t\treturn nil, err\n\t}\n\n\treturn sqlbase.FormatMetricValues(query.Keys, rows), nil\n}\n\n// CheckMaxQueryRows checks if the query result exceeds the maximum allowed rows\n// It uses SQL analysis to skip unnecessary checks for aggregate queries or queries with LIMIT <= maxRows\n// For queries that need checking, it uses probe approach (LIMIT maxRows+1) instead of COUNT(*) for better performance\nfunc (d *Doris) CheckMaxQueryRows(ctx context.Context, database, sql string) error {\n\tmaxQueryRows := d.MaxQueryRows\n\tif maxQueryRows == 0 {\n\t\tmaxQueryRows = 500\n\t}\n\n\tcleanedSQL := strings.TrimSpace(strings.TrimSuffix(strings.TrimSpace(sql), \";\"))\n\n\t// Step 1: Analyze SQL to determine if check is needed\n\tneedsCheck, _, _ := NeedsRowCountCheck(cleanedSQL, maxQueryRows)\n\tif !needsCheck {\n\t\treturn nil\n\t}\n\n\t// Step 2: Execute probe query (more efficient than COUNT(*))\n\treturn d.probeRowCount(ctx, database, cleanedSQL, maxQueryRows)\n}\n\n// probeRowCount uses threshold probing to check row count\n// It reads at most maxRows+1 rows, which is O(maxRows) instead of O(totalRows) for COUNT(*)\n// Doris optimizes LIMIT queries by stopping scan early once limit is reached\nfunc (d *Doris) probeRowCount(ctx context.Context, database, sql string, maxRows int) error {\n\ttimeoutCtx, cancel := d.createTimeoutContext(ctx)\n\tdefer cancel()\n\n\t// Probe SQL: only need to check if exceeds threshold, not actual data\n\tprobeSQL := fmt.Sprintf(\"SELECT 1 FROM (%s) AS __probe_chk LIMIT %d\", sql, maxRows+1)\n\n\tresults, err := d.ExecQuery(timeoutCtx, database, probeSQL)\n\tif err != nil {\n\t\treturn err\n\t}\n\n\t// If returned rows > maxRows, it exceeds the limit\n\tif len(results) > maxRows {\n\t\treturn fmt.Errorf(\"query result rows count exceeds the maximum limit %d\", maxRows)\n\t}\n\n\treturn nil\n}\n"
},
{
"path": "dskit/mysql/mysql.go",
"content": "// @Author: Ciusyan 5/10/24\n\npackage mysql\n\nimport (\n\t\"context\"\n\t\"encoding/json\"\n\t\"errors\"\n\t\"fmt\"\n\t\"strings\"\n\t\"time\"\n\n\t\"github.com/ccfos/nightingale/v6/dskit/pool\"\n\t\"github.com/ccfos/nightingale/v6/dskit/sqlbase\"\n\t\"github.com/ccfos/nightingale/v6/dskit/types\"\n\n\t_ \"github.com/go-sql-driver/mysql\" // MySQL driver\n\t\"github.com/mitchellh/mapstructure\"\n\t\"gorm.io/driver/mysql\"\n\t\"gorm.io/gorm\"\n)\n\ntype MySQL struct {\n\tShards []Shard `json:\"mysql.shards\" mapstructure:\"mysql.shards\"`\n}\n\ntype Shard struct {\n\tAddr string `json:\"mysql.addr\" mapstructure:\"mysql.addr\"`\n\tDB string `json:\"mysql.db\" mapstructure:\"mysql.db\"`\n\tUser string `json:\"mysql.user\" mapstructure:\"mysql.user\"`\n\tPassword string `json:\"mysql.password\" mapstructure:\"mysql.password\"`\n\tTimeout int `json:\"mysql.timeout\" mapstructure:\"mysql.timeout\"`\n\tMaxIdleConns int `json:\"mysql.max_idle_conns\" mapstructure:\"mysql.max_idle_conns\"`\n\tMaxOpenConns int `json:\"mysql.max_open_conns\" mapstructure:\"mysql.max_open_conns\"`\n\tConnMaxLifetime int `json:\"mysql.conn_max_lifetime\" mapstructure:\"mysql.conn_max_lifetime\"`\n\tMaxQueryRows int `json:\"mysql.max_query_rows\" mapstructure:\"mysql.max_query_rows\"`\n}\n\nfunc NewMySQLWithSettings(ctx context.Context, settings interface{}) (*MySQL, error) {\n\tnewest := new(MySQL)\n\tsettingsMap := map[string]interface{}{}\n\n\tswitch s := settings.(type) {\n\tcase string:\n\t\tif err := json.Unmarshal([]byte(s), &settingsMap); err != nil {\n\t\t\treturn nil, err\n\t\t}\n\tcase map[string]interface{}:\n\t\tsettingsMap = s\n\tdefault:\n\t\treturn nil, errors.New(\"unsupported settings type\")\n\t}\n\n\tif err := mapstructure.Decode(settingsMap, newest); err != nil {\n\t\treturn nil, err\n\t}\n\n\treturn newest, nil\n}\n\n// NewConn establishes a new connection to MySQL\nfunc (m *MySQL) NewConn(ctx context.Context, database string) (*gorm.DB, error) {\n\tif len(m.Shards) == 0 {\n\t\treturn nil, errors.New(\"empty pgsql shards\")\n\t}\n\n\tshard := m.Shards[0]\n\n\tif shard.Timeout == 0 {\n\t\tshard.Timeout = 300\n\t}\n\n\tif shard.MaxIdleConns == 0 {\n\t\tshard.MaxIdleConns = 10\n\t}\n\n\tif shard.MaxOpenConns == 0 {\n\t\tshard.MaxOpenConns = 100\n\t}\n\n\tif shard.ConnMaxLifetime == 0 {\n\t\tshard.ConnMaxLifetime = 300\n\t}\n\n\tif shard.MaxQueryRows == 0 {\n\t\tshard.MaxQueryRows = 100\n\t}\n\n\tif len(shard.Addr) == 0 {\n\t\treturn nil, errors.New(\"empty addr\")\n\t}\n\n\tif len(shard.Addr) == 0 {\n\t\treturn nil, errors.New(\"empty addr\")\n\t}\n\tvar keys []string\n\tvar err error\n\tkeys = append(keys, shard.Addr)\n\n\tkeys = append(keys, shard.Password, shard.User)\n\tif len(database) > 0 {\n\t\tkeys = append(keys, database)\n\t}\n\tcachedKey := strings.Join(keys, \":\")\n\t// cache conn with database\n\tconn, ok := pool.PoolClient.Load(cachedKey)\n\tif ok {\n\t\treturn conn.(*gorm.DB), nil\n\t}\n\tvar db *gorm.DB\n\tdefer func() {\n\t\tif db != nil && err == nil {\n\t\t\tpool.PoolClient.Store(cachedKey, db)\n\t\t}\n\t}()\n\n\tdsn := fmt.Sprintf(\"%s:%s@tcp(%s)/%s?charset=utf8&parseTime=True\", shard.User, shard.Password, shard.Addr, database)\n\tdb, err = sqlbase.NewDB(\n\t\tctx,\n\t\tmysql.Open(dsn),\n\t\tshard.MaxIdleConns,\n\t\tshard.MaxOpenConns,\n\t\ttime.Duration(shard.ConnMaxLifetime)*time.Second,\n\t)\n\treturn db, err\n}\n\nfunc (m *MySQL) ShowDatabases(ctx context.Context) ([]string, error) {\n\tdb, err := m.NewConn(ctx, \"\")\n\tif err != nil {\n\t\treturn nil, err\n\t}\n\n\treturn sqlbase.ShowDatabases(ctx, db, \"SHOW DATABASES\")\n}\n\nfunc (m *MySQL) ShowTables(ctx context.Context, database string) ([]string, error) {\n\tdb, err := m.NewConn(ctx, database)\n\tif err != nil {\n\t\treturn nil, err\n\t}\n\n\treturn sqlbase.ShowTables(ctx, db, \"SHOW TABLES\")\n}\n\nfunc (m *MySQL) DescTable(ctx context.Context, database, table string) ([]*types.ColumnProperty, error) {\n\tdb, err := m.NewConn(ctx, database)\n\tif err != nil {\n\t\treturn nil, err\n\t}\n\n\tquery := fmt.Sprintf(\"DESCRIBE %s\", table)\n\treturn sqlbase.DescTable(ctx, db, query)\n}\n\nfunc (m *MySQL) SelectRows(ctx context.Context, database, table, query string) ([]map[string]interface{}, error) {\n\tdb, err := m.NewConn(ctx, database)\n\tif err != nil {\n\t\treturn nil, err\n\t}\n\n\treturn sqlbase.SelectRows(ctx, db, table, query)\n}\n\nfunc (m *MySQL) ExecQuery(ctx context.Context, database string, sql string) ([]map[string]interface{}, error) {\n\tdb, err := m.NewConn(ctx, database)\n\tif err != nil {\n\t\treturn nil, err\n\t}\n\n\treturn sqlbase.ExecQuery(ctx, db, sql)\n}\n"
},
{
"path": "dskit/mysql/mysql_test.go",
"content": "// @Author: Ciusyan 5/11/24\n\npackage mysql\n\nimport (\n\t\"context\"\n\t\"testing\"\n\n\t\"github.com/stretchr/testify/require\"\n)\n\nfunc TestNewMySQLWithSettings(t *testing.T) {\n\ttests := []struct {\n\t\tname string\n\t\tsettings interface{}\n\t\twantErr bool\n\t}{\n\t\t{\n\t\t\tname: \"valid string settings\",\n\t\t\tsettings: `{\"mysql.addr\":\"localhost:3306\",\"mysql.user\":\"root\",\"mysql.password\":\"root\",\"mysql.maxIdleConns\":5,\"mysql.maxOpenConns\":10,\"mysql.connMaxLifetime\":30}`,\n\t\t\twantErr: false,\n\t\t},\n\t\t{\n\t\t\tname: \"invalid settings type\",\n\t\t\tsettings: 12345,\n\t\t\twantErr: true,\n\t\t},\n\t}\n\n\tfor _, tt := range tests {\n\t\tt.Run(tt.name, func(t *testing.T) {\n\t\t\tgot, err := NewMySQLWithSettings(context.Background(), tt.settings)\n\t\t\tif (err != nil) != tt.wantErr {\n\t\t\t\tt.Errorf(\"NewMySQLWithSettings() error = %v, wantErr %v\", err, tt.wantErr)\n\t\t\t}\n\t\t\tt.Log(got)\n\t\t})\n\t}\n}\n\nfunc TestNewConn(t *testing.T) {\n\tctx := context.Background()\n\tsettings := `{\"mysql.addr\":\"localhost:3306\",\"mysql.user\":\"root\",\"mysql.password\":\"root\",\"mysql.maxIdleConns\":5,\"mysql.maxOpenConns\":10,\"mysql.connMaxLifetime\":30}`\n\tmysql, err := NewMySQLWithSettings(ctx, settings)\n\trequire.NoError(t, err)\n\n\ttests := []struct {\n\t\tname string\n\t\tdatabase string\n\t\twantErr bool\n\t}{\n\t\t{\n\t\t\tname: \"valid connection\",\n\t\t\tdatabase: \"db1\",\n\t\t\twantErr: false,\n\t\t},\n\t}\n\n\tfor _, tt := range tests {\n\t\tt.Run(tt.name, func(t *testing.T) {\n\t\t\t_, err := mysql.NewConn(ctx, tt.database)\n\t\t\tif (err != nil) != tt.wantErr {\n\t\t\t\tt.Errorf(\"NewConn() error = %v, wantErr %v\", err, tt.wantErr)\n\t\t\t\treturn\n\t\t\t}\n\t\t})\n\t}\n}\n\nfunc TestShowDatabases(t *testing.T) {\n\tctx := context.Background()\n\tsettings := `{\"mysql.addr\":\"localhost:3306\",\"mysql.user\":\"root\",\"mysql.password\":\"root\",\"mysql.maxIdleConns\":5,\"mysql.maxOpenConns\":10,\"mysql.connMaxLifetime\":30}`\n\tmysql, err := NewMySQLWithSettings(ctx, settings)\n\trequire.NoError(t, err)\n\n\tdatabases, err := mysql.ShowDatabases(ctx)\n\trequire.NoError(t, err)\n\tt.Log(databases)\n}\n\nfunc TestShowTables(t *testing.T) {\n\tctx := context.Background()\n\tsettings := `{\"mysql.addr\":\"localhost:3306\",\"mysql.user\":\"root\",\"mysql.password\":\"root\",\"mysql.maxIdleConns\":5,\"mysql.maxOpenConns\":10,\"mysql.connMaxLifetime\":30}`\n\tmysql, err := NewMySQLWithSettings(ctx, settings)\n\trequire.NoError(t, err)\n\n\ttables, err := mysql.ShowTables(ctx, \"db1\")\n\trequire.NoError(t, err)\n\tt.Log(tables)\n}\n\nfunc TestDescTable(t *testing.T) {\n\tctx := context.Background()\n\tsettings := `{\"mysql.addr\":\"localhost:3306\",\"mysql.user\":\"root\",\"mysql.password\":\"root\",\"mysql.maxIdleConns\":5,\"mysql.maxOpenConns\":10,\"mysql.connMaxLifetime\":30}`\n\tmysql, err := NewMySQLWithSettings(ctx, settings)\n\trequire.NoError(t, err)\n\n\tdescTable, err := mysql.DescTable(ctx, \"db1\", \"students\")\n\trequire.NoError(t, err)\n\tfor _, desc := range descTable {\n\t\tt.Logf(\"%+v\", *desc)\n\t}\n}\n\nfunc TestExecQuery(t *testing.T) {\n\tctx := context.Background()\n\tsettings := `{\"mysql.addr\":\"localhost:3306\",\"mysql.user\":\"root\",\"mysql.password\":\"root\",\"mysql.maxIdleConns\":5,\"mysql.maxOpenConns\":10,\"mysql.connMaxLifetime\":30}`\n\tmysql, err := NewMySQLWithSettings(ctx, settings)\n\trequire.NoError(t, err)\n\n\trows, err := mysql.ExecQuery(ctx, \"db1\", \"SELECT * FROM students WHERE id = 10008\")\n\trequire.NoError(t, err)\n\tfor _, row := range rows {\n\t\tt.Log(row)\n\t}\n}\n\nfunc TestSelectRows(t *testing.T) {\n\tctx := context.Background()\n\tsettings := `{\"mysql.addr\":\"localhost:3306\",\"mysql.user\":\"root\",\"mysql.password\":\"root\",\"mysql.maxIdleConns\":5,\"mysql.maxOpenConns\":10,\"mysql.connMaxLifetime\":30}`\n\tmysql, err := NewMySQLWithSettings(ctx, settings)\n\trequire.NoError(t, err)\n\n\trows, err := mysql.SelectRows(ctx, \"db1\", \"students\", \"id > 10008\")\n\trequire.NoError(t, err)\n\tfor _, row := range rows {\n\t\tt.Log(row)\n\t}\n}\n"
},
{
"path": "dskit/mysql/timeseries.go",
"content": "package mysql\n\nimport (\n\t\"context\"\n\t\"fmt\"\n\t\"strings\"\n\n\t\"github.com/ccfos/nightingale/v6/dskit/sqlbase\"\n\t\"github.com/ccfos/nightingale/v6/dskit/types\"\n\n\t\"gorm.io/gorm\"\n)\n\n// Query executes a given SQL query in MySQL and returns the results\nfunc (m *MySQL) Query(ctx context.Context, query *sqlbase.QueryParam) ([]map[string]interface{}, error) {\n\tdb, err := m.NewConn(ctx, \"\")\n\tif err != nil {\n\t\treturn nil, err\n\t}\n\n\terr = m.CheckMaxQueryRows(db, ctx, query)\n\tif err != nil {\n\t\treturn nil, err\n\t}\n\n\treturn sqlbase.Query(ctx, db, query)\n}\n\n// QueryTimeseries executes a time series data query using the given parameters\nfunc (m *MySQL) QueryTimeseries(ctx context.Context, query *sqlbase.QueryParam) ([]types.MetricValues, error) {\n\tdb, err := m.NewConn(ctx, \"\")\n\tif err != nil {\n\t\treturn nil, err\n\t}\n\n\terr = m.CheckMaxQueryRows(db, ctx, query)\n\tif err != nil {\n\t\treturn nil, err\n\t}\n\n\treturn sqlbase.QueryTimeseries(ctx, db, query)\n}\n\nfunc (m *MySQL) CheckMaxQueryRows(db *gorm.DB, ctx context.Context, query *sqlbase.QueryParam) error {\n\tsql := strings.ReplaceAll(query.Sql, \";\", \"\")\n\tcheckQuery := &sqlbase.QueryParam{\n\t\tSql: fmt.Sprintf(\"SELECT COUNT(*) as count FROM (%s) AS subquery;\", sql),\n\t}\n\n\tres, err := sqlbase.Query(ctx, db, checkQuery)\n\tif err != nil {\n\t\treturn err\n\t}\n\n\tif len(res) > 0 {\n\t\tif count, exists := res[0][\"count\"]; exists {\n\t\t\tv, err := sqlbase.ParseFloat64Value(count)\n\t\t\tif err != nil {\n\t\t\t\treturn err\n\t\t\t}\n\n\t\t\tmaxQueryRows := m.Shards[0].MaxQueryRows\n\t\t\tif maxQueryRows == 0 {\n\t\t\t\tmaxQueryRows = 500\n\t\t\t}\n\n\t\t\tif v > float64(maxQueryRows) {\n\t\t\t\treturn fmt.Errorf(\"query result rows count %d exceeds the maximum limit %d\", int(v), maxQueryRows)\n\t\t\t}\n\t\t}\n\t}\n\n\treturn nil\n}\n"
},
{
"path": "dskit/mysql/timeseries_test.go",
"content": "// @Author: Ciusyan 5/11/24\n\npackage mysql\n\nimport (\n\t\"context\"\n\t\"testing\"\n\n\t\"github.com/ccfos/nightingale/v6/dskit/sqlbase\"\n\t\"github.com/ccfos/nightingale/v6/dskit/types\"\n\n\t\"github.com/stretchr/testify/require\"\n)\n\nfunc TestQuery(t *testing.T) {\n\tctx := context.Background()\n\tsettings := `{\"mysql.addr\":\"localhost:3306\",\"mysql.user\":\"root\",\"mysql.password\":\"root\",\"mysql.maxIdleConns\":5,\"mysql.maxOpenConns\":10,\"mysql.connMaxLifetime\":30}`\n\tmysql, err := NewMySQLWithSettings(ctx, settings)\n\trequire.NoError(t, err)\n\n\tparam := &sqlbase.QueryParam{\n\t\tSql: \"SELECT * FROM students WHERE id > 10900\",\n\t\tKeys: types.Keys{\n\t\t\tValueKey: \"\",\n\t\t\tLabelKey: \"\",\n\t\t\tTimeKey: \"\",\n\t\t\tTimeFormat: \"\",\n\t\t},\n\t}\n\n\trows, err := mysql.Query(ctx, param)\n\trequire.NoError(t, err)\n\tfor _, row := range rows {\n\t\tt.Log(row)\n\t}\n}\n\nfunc TestQueryTimeseries(t *testing.T) {\n\tctx := context.Background()\n\tsettings := `{\"mysql.addr\":\"localhost:3306\",\"mysql.user\":\"root\",\"mysql.password\":\"root\",\"mysql.maxIdleConns\":5,\"mysql.maxOpenConns\":10,\"mysql.connMaxLifetime\":30}`\n\tmysql, err := NewMySQLWithSettings(ctx, settings)\n\trequire.NoError(t, err)\n\n\t// Prepare a test query parameter\n\tparam := &sqlbase.QueryParam{\n\t\tSql: \"SELECT id, grade, student_name, a_grade, update_time FROM students WHERE grade > 20000\", // Modify SQL query to select specific columns\n\t\tKeys: types.Keys{\n\t\t\tValueKey: \"grade a_grade\", // Set the value key to the column name containing the metric value\n\t\t\tLabelKey: \"id student_name\", // Set the label key to the column name containing the metric label\n\t\t\tTimeKey: \"update_time\", // Set the time key to the column name containing the timestamp\n\t\t\tTimeFormat: \"2006-01-02 15:04:05 +0000 UTC\", // Provide the time format according to the timestamp column's format\n\t\t},\n\t}\n\n\t// Execute the query and retrieve the time series data\n\tmetricValues, err := mysql.QueryTimeseries(ctx, param)\n\trequire.NoError(t, err)\n\n\tfor _, metric := range metricValues {\n\t\tt.Log(metric)\n\t}\n}\n"
},
{
"path": "dskit/pool/pool.go",
"content": "package pool\n\nimport (\n\t\"bytes\"\n\t\"sync\"\n\t\"time\"\n\n\tgc \"github.com/patrickmn/go-cache\"\n)\n\nvar (\n\tPoolClient = new(sync.Map)\n)\n\nvar (\n\t// default cache instance, do not use this if you want to specify the defaultExpiration\n\tDefaultCache = gc.New(time.Hour*24, time.Hour)\n)\n\nvar (\n\tbytesPool = sync.Pool{\n\t\tNew: func() interface{} { return new(bytes.Buffer) },\n\t}\n)\n\nfunc PoolGetBytesBuffer() *bytes.Buffer {\n\tbuf := bytesPool.Get().(*bytes.Buffer)\n\tbuf.Reset()\n\treturn buf\n}\n\nfunc PoolPutBytesBuffer(buf *bytes.Buffer) {\n\tif buf == nil {\n\t\treturn\n\t}\n\tbytesPool.Put(buf)\n}\n"
},
{
"path": "dskit/postgres/postgres.go",
"content": "// @Author: Ciusyan 5/20/24\n\npackage postgres\n\nimport (\n\t\"context\"\n\t\"encoding/json\"\n\t\"errors\"\n\t\"fmt\"\n\t\"net/url\"\n\t\"strings\"\n\t\"time\"\n\n\t\"github.com/ccfos/nightingale/v6/dskit/pool\"\n\t\"github.com/ccfos/nightingale/v6/dskit/sqlbase\"\n\t\"github.com/ccfos/nightingale/v6/dskit/types\"\n\n\t_ \"github.com/lib/pq\" // PostgreSQL driver\n\t\"github.com/mitchellh/mapstructure\"\n\t\"gorm.io/driver/postgres\"\n\t\"gorm.io/gorm\"\n)\n\ntype PostgreSQL struct {\n\tShard `json:\",inline\" mapstructure:\",squash\"`\n}\n\ntype Shard struct {\n\tAddr string `json:\"pgsql.addr\" mapstructure:\"pgsql.addr\"`\n\tDB string `json:\"pgsql.db\" mapstructure:\"pgsql.db\"`\n\tUser string `json:\"pgsql.user\" mapstructure:\"pgsql.user\"`\n\tPassword string `json:\"pgsql.password\" mapstructure:\"pgsql.password\" `\n\tTimeout int `json:\"pgsql.timeout\" mapstructure:\"pgsql.timeout\"`\n\tMaxIdleConns int `json:\"pgsql.max_idle_conns\" mapstructure:\"pgsql.max_idle_conns\"`\n\tMaxOpenConns int `json:\"pgsql.max_open_conns\" mapstructure:\"pgsql.max_open_conns\"`\n\tConnMaxLifetime int `json:\"pgsql.conn_max_lifetime\" mapstructure:\"pgsql.conn_max_lifetime\"`\n\tMaxQueryRows int `json:\"pgsql.max_query_rows\" mapstructure:\"pgsql.max_query_rows\"`\n}\n\n// NewPostgreSQLWithSettings initializes a new PostgreSQL instance with the given settings\nfunc NewPostgreSQLWithSettings(ctx context.Context, settings interface{}) (*PostgreSQL, error) {\n\tnewest := new(PostgreSQL)\n\tsettingsMap := map[string]interface{}{}\n\n\tswitch s := settings.(type) {\n\tcase string:\n\t\tif err := json.Unmarshal([]byte(s), &settingsMap); err != nil {\n\t\t\treturn nil, err\n\t\t}\n\tcase map[string]interface{}:\n\t\tsettingsMap = s\n\tcase *PostgreSQL:\n\t\treturn s, nil\n\tcase PostgreSQL:\n\t\treturn &s, nil\n\tcase Shard:\n\t\tnewest.Shard = s\n\t\treturn newest, nil\n\tcase *Shard:\n\t\tnewest.Shard = *s\n\t\treturn newest, nil\n\tdefault:\n\t\treturn nil, errors.New(\"unsupported settings type\")\n\t}\n\n\tif err := mapstructure.Decode(settingsMap, newest); err != nil {\n\t\treturn nil, err\n\t}\n\n\treturn newest, nil\n}\n\n// NewConn establishes a new connection to PostgreSQL\nfunc (p *PostgreSQL) NewConn(ctx context.Context, database string) (*gorm.DB, error) {\n\tif len(p.DB) == 0 && len(database) == 0 {\n\t\treturn nil, errors.New(\"empty pgsql database\") // 兼容阿里实时数仓Holgres, 连接时必须指定db名字\n\t}\n\n\tif p.Shard.Timeout == 0 {\n\t\tp.Shard.Timeout = 60\n\t}\n\n\tif p.Shard.MaxIdleConns == 0 {\n\t\tp.Shard.MaxIdleConns = 10\n\t}\n\n\tif p.Shard.MaxOpenConns == 0 {\n\t\tp.Shard.MaxOpenConns = 100\n\t}\n\n\tif p.Shard.ConnMaxLifetime == 0 {\n\t\tp.Shard.ConnMaxLifetime = 14400\n\t}\n\n\tif len(p.Shard.Addr) == 0 {\n\t\treturn nil, errors.New(\"empty fe-node addr\")\n\t}\n\tvar keys []string\n\tvar err error\n\tkeys = append(keys, p.Shard.Addr)\n\n\tkeys = append(keys, p.Shard.Password, p.Shard.User)\n\tif len(database) > 0 {\n\t\tkeys = append(keys, database)\n\t}\n\tcachedKey := strings.Join(keys, \":\")\n\t// cache conn with database\n\tconn, ok := pool.PoolClient.Load(cachedKey)\n\tif ok {\n\t\treturn conn.(*gorm.DB), nil\n\t}\n\n\tvar db *gorm.DB\n\tdefer func() {\n\t\tif db != nil && err == nil {\n\t\t\tpool.PoolClient.Store(cachedKey, db)\n\t\t}\n\t}()\n\n\t// Simplified connection logic for PostgreSQL\n\tdsn := fmt.Sprintf(\"postgres://%s:%s@%s/%s?sslmode=disable&TimeZone=Asia/Shanghai\", url.QueryEscape(p.Shard.User), url.QueryEscape(p.Shard.Password), p.Shard.Addr, database)\n\n\tdb, err = sqlbase.NewDB(\n\t\tctx,\n\t\tpostgres.Open(dsn),\n\t\tp.Shard.MaxIdleConns,\n\t\tp.Shard.MaxOpenConns,\n\t\ttime.Duration(p.Shard.ConnMaxLifetime)*time.Second,\n\t)\n\n\tif err != nil {\n\t\tif db != nil {\n\t\t\tsqlDB, _ := db.DB()\n\t\t\tif sqlDB != nil {\n\t\t\t\tsqlDB.Close()\n\t\t\t}\n\t\t}\n\t\treturn nil, err\n\t}\n\n\treturn db, nil\n}\n\n// ShowDatabases lists all databases in PostgreSQL\nfunc (p *PostgreSQL) ShowDatabases(ctx context.Context, searchKeyword string) ([]string, error) {\n\tdb, err := p.NewConn(ctx, \"postgres\")\n\tif err != nil {\n\t\treturn nil, err\n\t}\n\tsql := fmt.Sprintf(\"SELECT datname FROM pg_database WHERE datistemplate = false AND datname LIKE %s\",\n\t\t\"'%\"+searchKeyword+\"%'\")\n\treturn sqlbase.ShowDatabases(ctx, db, sql)\n}\n\n// ShowTables lists all tables in a given database\nfunc (p *PostgreSQL) ShowTables(ctx context.Context, searchKeyword string) (map[string][]string, error) {\n\tdb, err := p.NewConn(ctx, p.DB)\n\tif err != nil {\n\t\treturn nil, err\n\t}\n\tsql := fmt.Sprintf(\"SELECT schemaname, tablename FROM pg_tables WHERE schemaname !='information_schema' and schemaname !='pg_catalog' and tablename LIKE %s\",\n\t\t\"'%\"+searchKeyword+\"%'\")\n\trets, err := sqlbase.ExecQuery(ctx, db, sql)\n\tif err != nil {\n\t\treturn nil, err\n\t}\n\ttabs := make(map[string][]string, 3)\n\tfor _, row := range rets {\n\t\tif val, ok := row[\"schemaname\"].(string); ok {\n\t\t\ttabs[val] = append(tabs[val], row[\"tablename\"].(string))\n\t\t}\n\t}\n\treturn tabs, nil\n}\n\n// DescTable describes the schema of a specified table in PostgreSQL\n// scheme default: public if not specified\nfunc (p *PostgreSQL) DescTable(ctx context.Context, scheme, table string) ([]*types.ColumnProperty, error) {\n\tdb, err := p.NewConn(ctx, p.DB)\n\tif err != nil {\n\t\treturn nil, err\n\t}\n\tif scheme == \"\" {\n\t\tscheme = \"public\"\n\t}\n\n\tquery := fmt.Sprintf(\"SELECT column_name, data_type, is_nullable, column_default FROM information_schema.columns WHERE table_name = '%s' AND table_schema = '%s'\", table, scheme)\n\treturn sqlbase.DescTable(ctx, db, query)\n}\n\n// SelectRows selects rows from a specified table in PostgreSQL based on a given query\nfunc (p *PostgreSQL) SelectRows(ctx context.Context, table, where string) ([]map[string]interface{}, error) {\n\tdb, err := p.NewConn(ctx, p.DB)\n\tif err != nil {\n\t\treturn nil, err\n\t}\n\n\treturn sqlbase.SelectRows(ctx, db, table, where)\n}\n\n// ExecQuery executes a SQL query in PostgreSQL\nfunc (p *PostgreSQL) ExecQuery(ctx context.Context, sql string) ([]map[string]interface{}, error) {\n\tdb, err := p.NewConn(ctx, p.DB)\n\tif err != nil {\n\t\treturn nil, err\n\t}\n\n\treturn sqlbase.ExecQuery(ctx, db, sql)\n}\n"
},
{
"path": "dskit/postgres/timeseries.go",
"content": "package postgres\n\nimport (\n\t\"context\"\n\t\"fmt\"\n\t\"strings\"\n\n\t\"github.com/ccfos/nightingale/v6/dskit/sqlbase\"\n\t\"github.com/ccfos/nightingale/v6/dskit/types\"\n\t\"gorm.io/gorm\"\n)\n\n// Query executes a given SQL query in PostgreSQL and returns the results\nfunc (p *PostgreSQL) Query(ctx context.Context, query *sqlbase.QueryParam) ([]map[string]interface{}, error) {\n\tdb, err := p.NewConn(ctx, p.Shard.DB)\n\tif err != nil {\n\t\treturn nil, err\n\t}\n\n\terr = p.CheckMaxQueryRows(db, ctx, query)\n\tif err != nil {\n\t\treturn nil, err\n\t}\n\n\treturn sqlbase.Query(ctx, db, query)\n}\n\n// QueryTimeseries executes a time series data query using the given parameters\nfunc (p *PostgreSQL) QueryTimeseries(ctx context.Context, query *sqlbase.QueryParam) ([]types.MetricValues, error) {\n\tdb, err := p.NewConn(ctx, p.Shard.DB)\n\tif err != nil {\n\t\treturn nil, err\n\t}\n\n\terr = p.CheckMaxQueryRows(db, ctx, query)\n\tif err != nil {\n\t\treturn nil, err\n\t}\n\n\treturn sqlbase.QueryTimeseries(ctx, db, query, true)\n}\n\nfunc (p *PostgreSQL) CheckMaxQueryRows(db *gorm.DB, ctx context.Context, query *sqlbase.QueryParam) error {\n\tsql := strings.ReplaceAll(query.Sql, \";\", \"\")\n\tcheckQuery := &sqlbase.QueryParam{\n\t\tSql: fmt.Sprintf(\"SELECT COUNT(*) as count FROM (%s) AS subquery;\", sql),\n\t}\n\n\tres, err := sqlbase.Query(ctx, db, checkQuery)\n\tif err != nil {\n\t\treturn err\n\t}\n\n\tif len(res) > 0 {\n\t\tif count, exists := res[0][\"count\"]; exists {\n\t\t\tv, err := sqlbase.ParseFloat64Value(count)\n\t\t\tif err != nil {\n\t\t\t\treturn err\n\t\t\t}\n\n\t\t\tmaxQueryRows := p.Shard.MaxQueryRows\n\t\t\tif maxQueryRows == 0 {\n\t\t\t\tmaxQueryRows = 500\n\t\t\t}\n\n\t\t\tif v > float64(maxQueryRows) {\n\t\t\t\treturn fmt.Errorf(\"query result rows count %d exceeds the maximum limit %d\", int(v), maxQueryRows)\n\t\t\t}\n\t\t}\n\t}\n\n\treturn nil\n}\n"
},
{
"path": "dskit/sqlbase/base.go",
"content": "// @Author: Ciusyan 5/19/24\n\npackage sqlbase\n\nimport (\n\t\"context\"\n\t\"database/sql\"\n\t\"fmt\"\n\t\"strings\"\n\t\"time\"\n\n\t\"gorm.io/gorm\"\n\n\t\"github.com/ccfos/nightingale/v6/dskit/types\"\n)\n\n// NewDB creates a new Gorm DB instance based on the provided gorm.Dialector and configures the connection pool\nfunc NewDB(ctx context.Context, dialector gorm.Dialector, maxIdleConns, maxOpenConns int, connMaxLifetime time.Duration) (*gorm.DB, error) {\n\t// Create a new Gorm DB instance\n\tdb, err := gorm.Open(dialector, &gorm.Config{})\n\tif err != nil {\n\t\treturn db, err\n\t}\n\n\t// Configure the connection pool\n\tsqlDB, err := db.DB()\n\tif err != nil {\n\t\treturn nil, err\n\t}\n\n\tsqlDB.SetMaxIdleConns(maxIdleConns)\n\tsqlDB.SetMaxOpenConns(maxOpenConns)\n\tsqlDB.SetConnMaxLifetime(connMaxLifetime)\n\n\treturn db.WithContext(ctx), sqlDB.Ping()\n}\n\nfunc CloseDB(db *gorm.DB) error {\n\tif db != nil {\n\t\tsqlDb, err := db.DB()\n\t\tif err != nil {\n\t\t\treturn err\n\t\t}\n\t\treturn sqlDb.Close()\n\t}\n\treturn nil\n}\n\n// ShowTables retrieves a list of all tables in the specified database\nfunc ShowTables(ctx context.Context, db *gorm.DB, query string) ([]string, error) {\n\ttables := make([]string, 0)\n\n\trows, err := db.WithContext(ctx).Raw(query).Rows()\n\tif err != nil {\n\t\treturn nil, err\n\t}\n\tdefer rows.Close()\n\n\tfor rows.Next() {\n\t\tvar table string\n\t\tif err := rows.Scan(&table); err != nil {\n\t\t\treturn nil, err\n\t\t}\n\t\ttables = append(tables, table)\n\t}\n\n\treturn tables, nil\n}\n\n// ShowDatabases retrieves a list of all databases in the connected database server\nfunc ShowDatabases(ctx context.Context, db *gorm.DB, query string) ([]string, error) {\n\tvar databases []string\n\n\trows, err := db.WithContext(ctx).Raw(query).Rows()\n\tif err != nil {\n\t\treturn nil, err\n\t}\n\tdefer rows.Close()\n\n\tfor rows.Next() {\n\t\tvar database string\n\t\tif err := rows.Scan(&database); err != nil {\n\t\t\treturn nil, err\n\t\t}\n\t\tdatabases = append(databases, database)\n\t}\n\n\treturn databases, nil\n}\n\n// DescTable describes the schema of a specified table in MySQL or PostgreSQL\nfunc DescTable(ctx context.Context, db *gorm.DB, query string) ([]*types.ColumnProperty, error) {\n\trows, err := db.WithContext(ctx).Raw(query).Rows()\n\tif err != nil {\n\t\treturn nil, err\n\t}\n\tdefer rows.Close()\n\n\tvar columns []*types.ColumnProperty\n\tfor rows.Next() {\n\t\tvar (\n\t\t\tfield string\n\t\t\ttyp string\n\t\t\tnull string\n\t\t\tkey sql.NullString\n\t\t\tdefaultValue sql.NullString\n\t\t\textra sql.NullString\n\t\t)\n\n\t\tswitch db.Dialector.Name() {\n\t\tcase \"mysql\":\n\t\t\tif err := rows.Scan(&field, &typ, &null, &key, &defaultValue, &extra); err != nil {\n\t\t\t\tcontinue\n\t\t\t}\n\t\tcase \"postgres\", \"sqlserver\":\n\t\t\tif err := rows.Scan(&field, &typ, &null, &defaultValue); err != nil {\n\t\t\t\tcontinue\n\t\t\t}\n\t\tcase \"oracle\":\n\t\t\tif err := rows.Scan(&field, &typ, &null); err != nil {\n\t\t\t\tcontinue\n\t\t\t}\n\t\t}\n\n\t\t// Convert the database-specific type to internal type\n\t\ttype2, indexable := ConvertDBType(db.Dialector.Name(), typ)\n\t\tcolumns = append(columns, &types.ColumnProperty{\n\t\t\tField: field,\n\t\t\tType: typ,\n\t\t\tType2: type2,\n\t\t\tIndexable: indexable,\n\t\t})\n\t}\n\treturn columns, nil\n}\n\n// ExecQuery executes the specified query and returns the result rows\nfunc ExecQuery(ctx context.Context, db *gorm.DB, sql string) ([]map[string]interface{}, error) {\n\trows, err := db.WithContext(ctx).Raw(sql).Rows()\n\tif err != nil {\n\t\treturn nil, err\n\t}\n\tdefer rows.Close()\n\n\tcolumns, err := rows.Columns()\n\tif err != nil {\n\t\treturn nil, err\n\t}\n\n\tvar results []map[string]interface{}\n\n\tfor rows.Next() {\n\t\tcolumnValues := make([]interface{}, len(columns))\n\t\tcolumnPointers := make([]interface{}, len(columns))\n\t\tfor i := range columnValues {\n\t\t\tcolumnPointers[i] = &columnValues[i]\n\t\t}\n\n\t\tif err := rows.Scan(columnPointers...); err != nil {\n\t\t\tcontinue\n\t\t}\n\n\t\trowMap := make(map[string]interface{})\n\t\tfor i, colName := range columns {\n\t\t\tval := columnValues[i]\n\t\t\tbytes, ok := val.([]byte)\n\t\t\tif ok {\n\t\t\t\trowMap[colName] = string(bytes)\n\t\t\t} else {\n\t\t\t\trowMap[colName] = val\n\t\t\t}\n\t\t}\n\t\tresults = append(results, rowMap)\n\t}\n\treturn results, nil\n}\n\n// SelectRows selects rows from a specified table based on a given query\nfunc SelectRows(ctx context.Context, db *gorm.DB, table, query string) ([]map[string]interface{}, error) {\n\tsql := fmt.Sprintf(\"SELECT * FROM %s\", table)\n\tif query != \"\" {\n\t\tsql += \" WHERE \" + query\n\t}\n\n\treturn ExecQuery(ctx, db, sql)\n}\n\n// convertDBType converts MySQL or PostgreSQL data types to custom internal types and determines if they are indexable\nfunc ConvertDBType(dialect, dbType string) (string, bool) {\n\ttyp := strings.ToLower(dbType)\n\n\t// Common type conversions\n\tswitch {\n\tcase strings.HasPrefix(typ, \"int\"), strings.HasPrefix(typ, \"tinyint\"),\n\t\tstrings.HasPrefix(typ, \"smallint\"), strings.HasPrefix(typ, \"mediumint\"),\n\t\tstrings.HasPrefix(typ, \"bigint\"), strings.HasPrefix(typ, \"serial\"),\n\t\tstrings.HasPrefix(typ, \"bigserial\"):\n\t\treturn types.LogExtractValueTypeLong, true\n\n\tcase strings.HasPrefix(typ, \"varchar\"), strings.HasPrefix(typ, \"text\"),\n\t\tstrings.HasPrefix(typ, \"char\"), strings.HasPrefix(typ, \"tinytext\"),\n\t\tstrings.HasPrefix(typ, \"mediumtext\"), strings.HasPrefix(typ, \"longtext\"),\n\t\tstrings.HasPrefix(typ, \"character varying\"), strings.HasPrefix(typ, \"nvarchar\"),\n\t\tstrings.HasPrefix(typ, \"nchar\"), strings.HasPrefix(typ, \"bpchar\"):\n\t\treturn types.LogExtractValueTypeText, true\n\n\tcase strings.HasPrefix(typ, \"float\"), strings.HasPrefix(typ, \"double\"),\n\t\tstrings.HasPrefix(typ, \"decimal\"), strings.HasPrefix(typ, \"numeric\"),\n\t\tstrings.HasPrefix(typ, \"real\"), strings.HasPrefix(typ, \"double precision\"):\n\t\treturn types.LogExtractValueTypeFloat, true\n\n\tcase strings.HasPrefix(typ, \"date\"), strings.HasPrefix(typ, \"datetime\"),\n\t\tstrings.HasPrefix(typ, \"timestamp\"), strings.HasPrefix(typ, \"timestamptz\"),\n\t\tstrings.HasPrefix(typ, \"time\"), strings.HasPrefix(typ, \"smalldatetime\"):\n\t\treturn types.LogExtractValueTypeDate, false\n\n\tcase strings.HasPrefix(typ, \"boolean\"), strings.HasPrefix(typ, \"bit\"), strings.HasPrefix(typ, \"bool\"):\n\t\treturn types.LogExtractValueTypeBool, false\n\t}\n\n\t// Specific type conversions for MySQL\n\tif dialect == \"mysql\" {\n\t\tswitch {\n\t\tdefault:\n\t\t\treturn typ, false\n\t\t}\n\t}\n\n\t// Specific type conversions for PostgreSQL\n\tif dialect == \"postgres\" {\n\t\tswitch {\n\t\tdefault:\n\t\t\treturn typ, false\n\t\t}\n\t}\n\n\tif dialect == \"oracle\" {\n\t\tswitch {\n\t\tdefault:\n\t\t\treturn typ, false\n\t\t}\n\t}\n\n\t// Can continue to add specific 'dialect' type ...\n\n\treturn typ, false\n}\n"
},
{
"path": "dskit/sqlbase/timeseries.go",
"content": "// @Author: Ciusyan 5/20/24\n\npackage sqlbase\n\nimport (\n\t\"context\"\n\t\"crypto/md5\"\n\t\"encoding/json\"\n\t\"fmt\"\n\t\"math\"\n\t\"reflect\"\n\t\"sort\"\n\t\"strconv\"\n\t\"strings\"\n\t\"time\"\n\n\t\"github.com/ccfos/nightingale/v6/dskit/types\"\n\n\t\"github.com/prometheus/common/model\"\n\t\"gorm.io/gorm\"\n)\n\ntype QueryParam struct {\n\tSql string `json:\"sql\"`\n\tKeys types.Keys `json:\"keys\" mapstructure:\"keys\"`\n}\n\nvar (\n\tBannedOp = map[string]struct{}{\n\t\t\"CREATE\": {},\n\t\t\"INSERT\": {},\n\t\t\"UPDATE\": {},\n\t\t\"DELETE\": {},\n\t\t\"ALTER\": {},\n\t\t\"REVOKE\": {},\n\t\t\"DROP\": {},\n\t\t\"RENAME\": {},\n\t\t\"TRUNCATE\": {},\n\t\t\"SET\": {},\n\t}\n)\n\n// Query executes a given SQL query and returns the results\nfunc Query(ctx context.Context, db *gorm.DB, query *QueryParam) ([]map[string]interface{}, error) {\n\t// Validate SQL to prevent write operations if needed\n\tsqlItem := strings.Split(strings.ToUpper(query.Sql), \" \")\n\tfor _, item := range sqlItem {\n\t\tif _, ok := BannedOp[item]; ok {\n\t\t\treturn nil, fmt.Errorf(\"operation %s is forbidden, only read operations are allowed, please check your SQL\", item)\n\t\t}\n\t}\n\n\treturn ExecQuery(ctx, db, query.Sql)\n}\n\n// QueryTimeseries executes a time series data query using the given parameters\nfunc QueryTimeseries(ctx context.Context, db *gorm.DB, query *QueryParam, ignoreDefault ...bool) ([]types.MetricValues, error) {\n\trows, err := Query(ctx, db, query)\n\tif err != nil {\n\t\treturn nil, err\n\t}\n\n\treturn FormatMetricValues(query.Keys, rows, ignoreDefault...), nil\n}\n\nfunc FormatMetricValues(keys types.Keys, rows []map[string]interface{}, ignoreDefault ...bool) []types.MetricValues {\n\tignore := false\n\tif len(ignoreDefault) > 0 {\n\t\tignore = ignoreDefault[0]\n\t}\n\n\tkeyMap := make(map[string]string)\n\tfor _, valueMetric := range strings.Split(keys.ValueKey, \" \") {\n\t\tkeyMap[valueMetric] = \"value\"\n\t}\n\n\tfor _, labelMetric := range strings.Split(keys.LabelKey, \" \") {\n\t\tkeyMap[labelMetric] = \"label\"\n\t}\n\n\tif keys.TimeKey == \"\" {\n\t\t// 默认支持 __time__ 和 time 作为时间字段\n\t\t// 用户可以使用 as __time__ 来避免与表中已有的 time 字段冲突\n\t\tkeyMap[\"__time__\"] = \"time\"\n\t\tkeyMap[\"time\"] = \"time\"\n\t} else {\n\t\tkeyMap[keys.TimeKey] = \"time\"\n\t}\n\n\tvar dataResps []types.MetricValues\n\tdataMap := make(map[string]*types.MetricValues)\n\n\tfor _, row := range rows {\n\t\tlabels := make(map[string]string)\n\t\tmetricValue := make(map[string]float64)\n\t\tmetricTs := make(map[string]float64)\n\n\t\t// Process each column based on its designated role (value, label, time)\n\t\tfor k, v := range row {\n\t\t\tswitch keyMap[k] {\n\t\t\tcase \"value\":\n\t\t\t\tval, err := ParseFloat64Value(v)\n\t\t\t\tif err != nil {\n\t\t\t\t\tcontinue\n\t\t\t\t}\n\t\t\t\tmetricValue[k] = val\n\t\t\tcase \"label\":\n\t\t\t\tlabels[k] = fmt.Sprintf(\"%v\", v)\n\t\t\tcase \"time\":\n\t\t\t\tts, err := ParseTime(v, keys.TimeFormat)\n\t\t\t\tif err != nil {\n\t\t\t\t\tcontinue\n\t\t\t\t}\n\t\t\t\tmetricTs[k] = float64(ts.Unix())\n\t\t\tdefault:\n\t\t\t\t// Default to labels for any unrecognized columns\n\t\t\t\tif !ignore && keys.LabelKey == \"\" {\n\t\t\t\t\t// 只有当 labelKey 为空时,才将剩余的列作为 label\n\t\t\t\t\tlabels[k] = fmt.Sprintf(\"%v\", v)\n\t\t\t\t}\n\t\t\t}\n\t\t}\n\n\t\t// Compile and store the metric values\n\t\tfor metricName, value := range metricValue {\n\t\t\t// NaN 无法执行json.Marshal(), 接口会报错\n\t\t\tif math.IsNaN(value) {\n\t\t\t\tcontinue\n\t\t\t}\n\n\t\t\tmetrics := make(model.Metric)\n\t\t\tvar labelsStr []string\n\n\t\t\tfor k1, v1 := range labels {\n\t\t\t\tmetrics[model.LabelName(k1)] = model.LabelValue(v1)\n\t\t\t\tlabelsStr = append(labelsStr, fmt.Sprintf(\"%s=%s\", k1, v1))\n\t\t\t}\n\t\t\tmetrics[\"__name__\"] = model.LabelValue(metricName)\n\t\t\tlabelsStr = append(labelsStr, fmt.Sprintf(\"__name__=%s\", metricName))\n\n\t\t\t// Hash the labels to use as a key\n\t\t\tsort.Strings(labelsStr)\n\t\t\tlabelsStrHash := fmt.Sprintf(\"%x\", md5.Sum([]byte(strings.Join(labelsStr, \",\"))))\n\n\t\t\t// Append new values to the existing metric, if present\n\t\t\tvar ts float64\n\t\t\tvar exists bool\n\n\t\t\tif keys.TimeKey == \"\" {\n\t\t\t\t// 没有配置 timeKey,按优先级查找:__time__ > time\n\t\t\t\tts, exists = metricTs[\"__time__\"]\n\t\t\t\tif !exists {\n\t\t\t\t\tts, exists = metricTs[\"time\"]\n\t\t\t\t}\n\t\t\t} else {\n\t\t\t\t// 用户配置了 timeKey,使用用户配置的\n\t\t\t\tts, exists = metricTs[keys.TimeKey]\n\t\t\t}\n\n\t\t\tif !exists {\n\t\t\t\t// Default to current time if not specified\n\t\t\t\t// 大多数情况下offset为空\n\t\t\t\t// 对于记录规则延迟计算的情况,统计值的时间戳需要有偏移,以便跟统计值对应\n\t\t\t\tts = float64(time.Now().Unix()) - float64(keys.Offset)\n\t\t\t}\n\n\t\t\tvaluePair := []float64{ts, value}\n\t\t\tif existing, ok := dataMap[labelsStrHash]; ok {\n\t\t\t\texisting.Values = append(existing.Values, valuePair)\n\t\t\t} else {\n\t\t\t\tdataResp := types.MetricValues{\n\t\t\t\t\tMetric: metrics,\n\t\t\t\t\tValues: [][]float64{valuePair},\n\t\t\t\t}\n\t\t\t\tdataMap[labelsStrHash] = &dataResp\n\t\t\t}\n\t\t}\n\t}\n\n\t// Convert the map to a slice for the response\n\tfor _, v := range dataMap {\n\t\tsort.Slice(v.Values, func(i, j int) bool { return v.Values[i][0] < v.Values[j][0] }) // Sort by timestamp\n\t\tdataResps = append(dataResps, *v)\n\t}\n\n\treturn dataResps\n}\n\n// ParseFloat64Value attempts to convert an interface{} to float64 using reflection\nfunc ParseFloat64Value(val interface{}) (float64, error) {\n\tv := reflect.ValueOf(val)\n\tswitch v.Kind() {\n\tcase reflect.Float64, reflect.Float32:\n\t\treturn v.Float(), nil\n\tcase reflect.Int, reflect.Int8, reflect.Int16, reflect.Int32, reflect.Int64:\n\t\treturn float64(v.Int()), nil\n\tcase reflect.Uint, reflect.Uint8, reflect.Uint16, reflect.Uint32, reflect.Uint64:\n\t\treturn float64(v.Uint()), nil\n\tcase reflect.String:\n\t\treturn strconv.ParseFloat(v.String(), 64)\n\tcase reflect.Slice:\n\t\tif v.Type().Elem().Kind() == reflect.Uint8 {\n\t\t\treturn strconv.ParseFloat(string(v.Bytes()), 64)\n\t\t}\n\tcase reflect.Interface:\n\t\treturn ParseFloat64Value(v.Interface())\n\tcase reflect.Ptr:\n\t\tif !v.IsNil() {\n\t\t\treturn ParseFloat64Value(v.Elem().Interface())\n\t\t}\n\tcase reflect.Struct:\n\t\tif num, ok := val.(json.Number); ok {\n\t\t\treturn num.Float64()\n\t\t}\n\t}\n\treturn 0, fmt.Errorf(\"cannot convert type %T to float64\", val)\n}\n\n// ParseTime attempts to parse a time value from an interface{} using a specified format\nfunc ParseTime(val interface{}, format string) (time.Time, error) {\n\tv := reflect.ValueOf(val)\n\tswitch v.Kind() {\n\tcase reflect.String:\n\t\tstr := v.String()\n\t\treturn parseTimeFromString(str, format)\n\tcase reflect.Slice:\n\t\tif v.Type().Elem().Kind() == reflect.Uint8 {\n\t\t\tstr := string(v.Bytes())\n\t\t\treturn parseTimeFromString(str, format)\n\t\t}\n\tcase reflect.Int, reflect.Int64:\n\t\treturn time.Unix(v.Int(), 0), nil\n\tcase reflect.Float64:\n\t\treturn time.Unix(int64(v.Float()), 0), nil\n\tcase reflect.Interface:\n\t\treturn ParseTime(v.Interface(), format)\n\tcase reflect.Ptr:\n\t\tif !v.IsNil() {\n\t\t\treturn ParseTime(v.Elem().Interface(), format)\n\t\t}\n\tcase reflect.Struct:\n\t\tif t, ok := val.(time.Time); ok {\n\t\t\treturn t, nil\n\t\t}\n\t}\n\treturn time.Time{}, fmt.Errorf(\"invalid time value type: %v\", val)\n}\n\nfunc parseTimeFromString(str, format string) (time.Time, error) {\n\t// If a custom time format is provided, use it to parse the string\n\tif format != \"\" {\n\t\tparsedTime, err := time.Parse(format, str)\n\t\tif err == nil {\n\t\t\treturn parsedTime, nil\n\t\t}\n\t\treturn time.Time{}, fmt.Errorf(\"failed to parse time '%s' with format '%s': %v\", str, format, err)\n\t}\n\n\t// Try to parse the string as RFC3339, RFC3339Nano, or Unix timestamp\n\tif parsedTime, err := time.Parse(time.RFC3339, str); err == nil {\n\t\treturn parsedTime, nil\n\t}\n\n\tif parsedTime, err := time.Parse(time.DateTime, str); err == nil {\n\t\treturn parsedTime, nil\n\t}\n\n\tif parsedTime, err := time.Parse(\"2006-01-02 15:04:05.000000\", str); err == nil {\n\t\treturn parsedTime, nil\n\t}\n\tif parsedTime, err := time.Parse(time.RFC3339Nano, str); err == nil {\n\t\treturn parsedTime, nil\n\t}\n\tif timestamp, err := strconv.ParseInt(str, 10, 64); err == nil {\n\t\treturn time.Unix(timestamp, 0), nil\n\t}\n\tif timestamp, err := strconv.ParseFloat(str, 64); err == nil {\n\t\treturn time.Unix(int64(timestamp), 0), nil\n\t}\n\n\treturn time.Time{}, fmt.Errorf(\"failed to parse time '%s'\", str)\n}\n"
},
{
"path": "dskit/sqlbase/timeseries_test.go",
"content": "// @Author: Ciusyan 5/17/24\n\npackage sqlbase\n\nimport (\n\t\"encoding/json\"\n\t\"testing\"\n\t\"time\"\n\n\t\"github.com/ccfos/nightingale/v6/dskit/types\"\n)\n\nfunc TestFormatMetricValues(t *testing.T) {\n\ttests := []struct {\n\t\tname string\n\t\tkeys types.Keys\n\t\trows []map[string]interface{}\n\t\twant []types.MetricValues\n\t}{\n\t\t{\n\t\t\tname: \"cases1\",\n\t\t\tkeys: types.Keys{\n\t\t\t\tValueKey: \"grade a_grade\",\n\t\t\t\tLabelKey: \"id student_name\",\n\t\t\t\tTimeKey: \"update_time\",\n\t\t\t\tTimeFormat: \"2006-01-02 15:04:05\",\n\t\t\t},\n\t\t\trows: []map[string]interface{}{\n\t\t\t\t{\n\t\t\t\t\t\"id\": \"10007\",\n\t\t\t\t\t\"grade\": 20003,\n\t\t\t\t\t\"student_name\": \"邵子韬\",\n\t\t\t\t\t\"a_grade\": 69,\n\t\t\t\t\t\"update_time\": \"2024-05-14 10:00:00\",\n\t\t\t\t},\n\t\t\t\t{\n\t\t\t\t\t\"id\": \"10007\",\n\t\t\t\t\t\"grade\": 20003,\n\t\t\t\t\t\"student_name\": \"邵子韬\",\n\t\t\t\t\t\"a_grade\": 69,\n\t\t\t\t\t\"update_time\": \"2024-05-14 10:05:00\",\n\t\t\t\t},\n\t\t\t\t{\n\t\t\t\t\t\"id\": \"10007\",\n\t\t\t\t\t\"grade\": 20003,\n\t\t\t\t\t\"student_name\": \"邵子韬\",\n\t\t\t\t\t\"a_grade\": 69,\n\t\t\t\t\t\"update_time\": \"2024-05-14 10:10:00\",\n\t\t\t\t},\n\t\t\t\t{\n\t\t\t\t\t\"id\": \"10008\",\n\t\t\t\t\t\"grade\": 20004,\n\t\t\t\t\t\"student_name\": \"Ciusyan\",\n\t\t\t\t\t\"a_grade\": 100,\n\t\t\t\t\t\"update_time\": \"2024-05-14 12:00:00\",\n\t\t\t\t},\n\t\t\t},\n\t\t},\n\t\t{\n\t\t\tname: \"test __time__ priority over time\",\n\t\t\tkeys: types.Keys{\n\t\t\t\tValueKey: \"value\",\n\t\t\t\tLabelKey: \"host\",\n\t\t\t},\n\t\t\trows: []map[string]interface{}{\n\t\t\t\t{\n\t\t\t\t\t\"host\": \"server1\",\n\t\t\t\t\t\"value\": 100,\n\t\t\t\t\t\"time\": int64(1715642100), // 这个应该被忽略\n\t\t\t\t\t\"__time__\": int64(1715642135), // 这个应该被使用\n\t\t\t\t},\n\t\t\t},\n\t\t},\n\t\t{\n\t\t\tname: \"test fallback to time when __time__ not exists\",\n\t\t\tkeys: types.Keys{\n\t\t\t\tValueKey: \"value\",\n\t\t\t\tLabelKey: \"host\",\n\t\t\t},\n\t\t\trows: []map[string]interface{}{\n\t\t\t\t{\n\t\t\t\t\t\"host\": \"server2\",\n\t\t\t\t\t\"value\": 200,\n\t\t\t\t\t\"time\": int64(1715642200), // 应该使用这个\n\t\t\t\t},\n\t\t\t},\n\t\t},\n\t\t{\n\t\t\tname: \"test __time__ alone without time field\",\n\t\t\tkeys: types.Keys{\n\t\t\t\tValueKey: \"value\",\n\t\t\t\tLabelKey: \"host\",\n\t\t\t},\n\t\t\trows: []map[string]interface{}{\n\t\t\t\t{\n\t\t\t\t\t\"host\": \"server3\",\n\t\t\t\t\t\"value\": 300,\n\t\t\t\t\t\"__time__\": int64(1715642300), // 应该使用这个\n\t\t\t\t},\n\t\t\t},\n\t\t},\n\t}\n\n\tfor _, tt := range tests {\n\t\tt.Run(tt.name, func(t *testing.T) {\n\t\t\tgot := FormatMetricValues(tt.keys, tt.rows)\n\t\t\tfor _, g := range got {\n\t\t\t\tt.Log(g)\n\t\t\t}\n\t\t})\n\t}\n}\n\nfunc TestParseFloat64Value(t *testing.T) {\n\n\tptr := func(val float64) *float64 {\n\t\treturn &val\n\t}\n\n\ttests := []struct {\n\t\tname string\n\t\tinput interface{}\n\t\twant float64\n\t\twantErr bool\n\t}{\n\t\t{\"float64\", 1.23, 1.23, false},\n\t\t{\"float32\", float32(1.23), float64(float32(1.23)), false},\n\t\t{\"int\", 123, 123, false},\n\t\t{\"int64\", int64(123), 123, false},\n\t\t{\"uint\", uint(123), 123, false},\n\t\t{\"uint64\", uint64(123), 123, false},\n\t\t{\"string\", \"1.23\", 1.23, false},\n\t\t{\"[]byte\", []byte(\"1.23\"), 1.23, false},\n\t\t{\"json.Number\", json.Number(\"1.23\"), 1.23, false},\n\t\t{\"interface\", interface{}(1.23), 1.23, false},\n\t\t{\"pointer\", ptr(1.23), 1.23, false},\n\t\t{\"invalid string\", \"abc\", 0, true},\n\t\t{\"invalid type\", struct{}{}, 0, true},\n\t}\n\n\tfor _, tt := range tests {\n\t\tt.Run(tt.name, func(t *testing.T) {\n\t\t\tgot, err := ParseFloat64Value(tt.input)\n\t\t\tif (err != nil) != tt.wantErr {\n\t\t\t\tt.Errorf(\"parseFloat64Value() error = %v, wantErr %v\", err, tt.wantErr)\n\t\t\t\treturn\n\t\t\t}\n\t\t\tif got != tt.want {\n\t\t\t\tt.Errorf(\"parseFloat64Value() = %v, want %v\", got, tt.want)\n\t\t\t}\n\t\t})\n\t}\n}\n\nfunc TestParseTime(t *testing.T) {\n\n\tptrTime := func(t time.Time) *time.Time {\n\t\treturn &t\n\t}\n\n\ttests := []struct {\n\t\tname string\n\t\tinput interface{}\n\t\tformat string\n\t\twant time.Time\n\t\twantErr bool\n\t}{\n\t\t{\"RFC3339\", \"2024-05-14T12:34:56Z\", \"\", time.Date(2024, 5, 14, 12, 34, 56, 0, time.UTC), false},\n\t\t{\"RFC3339Nano\", \"2024-05-14T12:34:56.789Z\", \"\", time.Date(2024, 5, 14, 12, 34, 56, 789000000, time.UTC), false},\n\t\t{\"Unix timestamp int\", int64(1715642135), \"\", time.Unix(1715642135, 0), false},\n\t\t{\"Unix timestamp float64\", 1715642135.0, \"\", time.Unix(int64(1715642135), 0), false},\n\t\t{\"custom format\", \"14/05/2024\", \"02/01/2006\", time.Date(2024, 5, 14, 0, 0, 0, 0, time.UTC), false},\n\t\t{\"slice\", []byte(\"2024-05-14T12:34:56Z\"), \"\", time.Date(2024, 5, 14, 12, 34, 56, 0, time.UTC), false},\n\t\t{\"interface\", interface{}(\"2024-05-14T12:34:56Z\"), \"\", time.Date(2024, 5, 14, 12, 34, 56, 0, time.UTC), false},\n\t\t{\"pointer\", ptrTime(time.Date(2024, 5, 14, 12, 34, 56, 0, time.UTC)), \"\", time.Date(2024, 5, 14, 12, 34, 56, 0, time.UTC), false},\n\t\t{\"invalid format\", \"14-05-2024\", \"02/01/2006\", time.Time{}, true},\n\t\t{\"invalid type\", struct{}{}, \"\", time.Time{}, true},\n\t}\n\n\tfor _, tt := range tests {\n\t\tt.Run(tt.name, func(t *testing.T) {\n\t\t\tgot, err := ParseTime(tt.input, tt.format)\n\t\t\tif (err != nil) != tt.wantErr {\n\t\t\t\tt.Errorf(\"ParseTime() error = %v, wantErr %v\", err, tt.wantErr)\n\t\t\t\treturn\n\t\t\t}\n\t\t\tif !got.Equal(tt.want) {\n\t\t\t\tt.Errorf(\"ParseTime() = %v, want %v\", got, tt.want)\n\t\t\t}\n\t\t})\n\t}\n}\n"
},
{
"path": "dskit/tdengine/tdengine.go",
"content": "package tdengine\n\nimport (\n\t\"context\"\n\t\"encoding/base64\"\n\t\"encoding/json\"\n\t\"fmt\"\n\t\"net\"\n\t\"net/http\"\n\t\"strings\"\n\t\"time\"\n\n\t\"github.com/ccfos/nightingale/v6/dskit/types\"\n\t\"github.com/ccfos/nightingale/v6/pkg/tlsx\"\n\n\t\"github.com/toolkits/pkg/logger\"\n)\n\ntype Tdengine struct {\n\tAddr string `json:\"tdengine.addr\" mapstructure:\"tdengine.addr\"`\n\tBasic *TDengineBasicAuth `json:\"tdengine.basic\" mapstructure:\"tdengine.basic\"`\n\tToken string `json:\"tdengine.token\" mapstructure:\"tdengine.token\"`\n\tTimeout int64 `json:\"tdengine.timeout\" mapstructure:\"tdengine.timeout\"`\n\tDialTimeout int64 `json:\"tdengine.dial_timeout\" mapstructure:\"tdengine.dial_timeout\"`\n\tMaxIdleConnsPerHost int `json:\"tdengine.max_idle_conns_per_host\" mapstructure:\"tdengine.max_idle_conns_per_host\"`\n\tHeaders map[string]string `json:\"tdengine.headers\" mapstructure:\"tdengine.headers\"`\n\tSkipTlsVerify bool `json:\"tdengine.skip_tls_verify\" mapstructure:\"tdengine.skip_tls_verify\"`\n\n\ttlsx.ClientConfig\n\n\theader map[string][]string `json:\"-\"`\n\tclient *http.Client `json:\"-\"`\n}\n\ntype TDengineBasicAuth struct {\n\tUser string `json:\"tdengine.user\" mapstructure:\"tdengine.user\"`\n\tPassword string `json:\"tdengine.password\" mapstructure:\"tdengine.password\"`\n\tIsEncrypt bool `json:\"tdengine.is_encrypt\" mapstructure:\"tdengine.is_encrypt\"`\n}\n\ntype APIResponse struct {\n\tCode int `json:\"code\"`\n\tColumnMeta [][]interface{} `json:\"column_meta\"`\n\tData [][]interface{} `json:\"data\"`\n\tRows int `json:\"rows\"`\n}\n\ntype QueryParam struct {\n\tDatabase string `json:\"database\"`\n\tTable string `json:\"table\"`\n}\n\nfunc (tc *Tdengine) InitCli() {\n\n\ttc.client = &http.Client{\n\t\tTransport: &http.Transport{\n\t\t\tProxy: http.ProxyFromEnvironment,\n\t\t\tDialContext: (&net.Dialer{\n\t\t\t\tTimeout: 30 * time.Second,\n\t\t\t\tKeepAlive: 30 * time.Second,\n\t\t\t}).DialContext,\n\t\t\tIdleConnTimeout: 90 * time.Second,\n\t\t\tTLSHandshakeTimeout: 10 * time.Second,\n\t\t\tExpectContinueTimeout: 1 * time.Second,\n\t\t\tDisableCompression: true,\n\t\t},\n\t}\n\n\ttc.header = map[string][]string{\n\t\t\"Connection\": {\"keep-alive\"},\n\t}\n\n\tfor k, v := range tc.Headers {\n\t\tkv := strings.Split(v, \":\")\n\t\tif len(kv) != 2 {\n\t\t\tcontinue\n\t\t}\n\t\ttc.header[k] = []string{v}\n\t}\n\n\tif tc.Basic != nil {\n\t\tbasic := base64.StdEncoding.EncodeToString([]byte(tc.Basic.User + \":\" + tc.Basic.Password))\n\t\ttc.header[\"Authorization\"] = []string{fmt.Sprintf(\"Basic %s\", basic)}\n\t}\n}\n\nfunc (tc *Tdengine) QueryTable(query string) (APIResponse, error) {\n\tvar apiResp APIResponse\n\treq, err := http.NewRequest(\"POST\", tc.Addr+\"/rest/sql\", strings.NewReader(query))\n\tif err != nil {\n\t\treturn apiResp, err\n\t}\n\n\tfor k, v := range tc.header {\n\t\treq.Header[k] = v\n\t}\n\n\treq.Header.Set(\"Content-Type\", \"application/x-www-form-urlencoded\")\n\tresp, err := tc.client.Do(req)\n\tif err != nil {\n\t\treturn apiResp, err\n\t}\n\tdefer resp.Body.Close()\n\n\t// 限制响应体大小为10MB\n\tmaxSize := int64(10 * 1024 * 1024) // 10MB\n\tlimitedReader := http.MaxBytesReader(nil, resp.Body, maxSize)\n\n\tif resp.StatusCode != http.StatusOK {\n\t\treturn apiResp, fmt.Errorf(\"HTTP error, status: %s\", resp.Status)\n\t}\n\n\terr = json.NewDecoder(limitedReader).Decode(&apiResp)\n\tif err != nil {\n\t\tif strings.Contains(err.Error(), \"http: request body too large\") {\n\t\t\treturn apiResp, fmt.Errorf(\"response body exceeds 10MB limit\")\n\t\t}\n\t\treturn apiResp, err\n\t}\n\n\treturn apiResp, nil\n}\n\nfunc (tc *Tdengine) ShowDatabases(context.Context) ([]string, error) {\n\tdatabases := make([]string, 0)\n\tdata, err := tc.QueryTable(\"show databases\")\n\tif err != nil {\n\t\treturn databases, err\n\t}\n\n\tfor _, row := range data.Data {\n\t\tdatabases = append(databases, row[0].(string))\n\t}\n\treturn databases, nil\n}\n\nfunc (tc *Tdengine) ShowTables(ctx context.Context, database string) ([]string, error) {\n\ttables := make([]string, 0)\n\tsql := fmt.Sprintf(\"show %s\", database)\n\tdata, err := tc.QueryTable(sql)\n\tif err != nil {\n\t\treturn tables, err\n\t}\n\n\tfor _, row := range data.Data {\n\t\ttables = append(tables, row[0].(string))\n\t}\n\treturn tables, nil\n}\n\nfunc (tc *Tdengine) DescribeTable(ctx context.Context, query interface{}) ([]*types.ColumnProperty, error) {\n\tvar columns []*types.ColumnProperty\n\tqueryMap, ok := query.(map[string]string)\n\tif !ok {\n\t\treturn nil, fmt.Errorf(\"invalid query\")\n\t}\n\tsql := fmt.Sprintf(\"select * from %s.%s limit 1\", queryMap[\"database\"], queryMap[\"table\"])\n\tdata, err := tc.QueryTable(sql)\n\tif err != nil {\n\t\treturn columns, err\n\t}\n\tfor _, row := range data.ColumnMeta {\n\t\tvar colType string\n\t\tswitch t := row[1].(type) {\n\t\tcase float64:\n\t\t\t// v2版本数字类型映射\n\t\t\tswitch int(t) {\n\t\t\tcase 1:\n\t\t\t\tcolType = \"BOOL\"\n\t\t\tcase 2:\n\t\t\t\tcolType = \"TINYINT\"\n\t\t\tcase 3:\n\t\t\t\tcolType = \"SMALLINT\"\n\t\t\tcase 4:\n\t\t\t\tcolType = \"INT\"\n\t\t\tcase 5:\n\t\t\t\tcolType = \"BIGINT\"\n\t\t\tcase 6:\n\t\t\t\tcolType = \"FLOAT\"\n\t\t\tcase 7:\n\t\t\t\tcolType = \"DOUBLE\"\n\t\t\tcase 8:\n\t\t\t\tcolType = \"BINARY\"\n\t\t\tcase 9:\n\t\t\t\tcolType = \"TIMESTAMP\"\n\t\t\tcase 10:\n\t\t\t\tcolType = \"NCHAR\"\n\t\t\tdefault:\n\t\t\t\tcolType = \"UNKNOWN\"\n\t\t\t}\n\t\tcase string:\n\t\t\t// v3版本直接使用字符串类型\n\t\t\tcolType = t\n\t\tdefault:\n\t\t\tlogger.Warningf(\"unexpected column type format: %v\", row[1])\n\t\t\tcolType = \"UNKNOWN\"\n\t\t}\n\n\t\tcolumn := &types.ColumnProperty{\n\t\t\tField: row[0].(string),\n\t\t\tType: colType,\n\t\t}\n\t\tcolumns = append(columns, column)\n\t}\n\n\treturn columns, nil\n}\n"
},
{
"path": "dskit/types/timeseries.go",
"content": "package types\n\nimport (\n\t\"bytes\"\n\t\"fmt\"\n\t\"strconv\"\n\n\t\"github.com/prometheus/common/model\"\n)\n\n// 时序数据\ntype MetricValues struct {\n\tMetric model.Metric `json:\"metric\"`\n\tValues [][]float64 `json:\"values\"`\n}\n\ntype HistogramValues struct {\n\tTotal int64 `json:\"total\"`\n\tValues [][]float64 `json:\"values\"`\n}\n\n// 瞬时值\ntype AggregateValues struct {\n\tLabels map[string]string `json:\"labels\"`\n\tValues map[string]float64 `json:\"values\"`\n}\n\n// string\nfunc (m *MetricValues) String() string {\n\tvar buf bytes.Buffer\n\tbuf.WriteString(fmt.Sprintf(\"Metric: %+v \", m.Metric))\n\tbuf.WriteString(\"Values: \")\n\tfor _, v := range m.Values {\n\t\tbuf.WriteString(\" [\")\n\t\tfor i, ts := range v {\n\t\t\tif i > 0 {\n\t\t\t\tbuf.WriteString(\", \")\n\t\t\t}\n\t\t\tbuf.WriteString(strconv.FormatFloat(ts, 'f', -1, 64))\n\t\t}\n\t\tbuf.WriteString(\"] \")\n\t}\n\treturn buf.String()\n}\n\ntype Keys struct {\n\tValueKey string `json:\"valueKey\" mapstructure:\"valueKey\"` // 多个用空格分隔\n\tLabelKey string `json:\"labelKey\" mapstructure:\"labelKey\"` // 多个用空格分隔\n\tTimeKey string `json:\"timeKey\" mapstructure:\"timeKey\"`\n\tTimeFormat string `json:\"timeFormat\" mapstructure:\"timeFormat\"` // not used anymore\n\tOffset int `json:\"offset\" mapstructure:\"offset\"`\n}\n"
},
{
"path": "dskit/types/types.go",
"content": "package types\n\nconst (\n\tLogExtractValueTypeLong = \"long\"\n\tLogExtractValueTypeFloat = \"float\"\n\tLogExtractValueTypeText = \"text\"\n\tLogExtractValueTypeDate = \"date\"\n\tLogExtractValueTypeBool = \"bool\"\n\tLogExtractValueTypeObject = \"object\"\n\tLogExtractValueTypeArray = \"array\"\n\tLogExtractValueTypeJSON = \"json\"\n)\n\ntype ColumnProperty struct {\n\tField string `json:\"field\"`\n\tType string `json:\"type\"`\n\tType2 string `json:\"type2,omitempty\"` // field_property.Type\n\tIndexable bool `json:\"indexable\"` // 是否可以索引\n}\n"
},
{
"path": "dskit/victorialogs/victorialogs.go",
"content": "package victorialogs\n\nimport (\n\t\"bufio\"\n\t\"context\"\n\t\"crypto/tls\"\n\t\"encoding/json\"\n\t\"fmt\"\n\t\"io\"\n\t\"net/http\"\n\t\"net/url\"\n\t\"strconv\"\n\t\"strings\"\n\t\"time\"\n)\n\ntype VictoriaLogs struct {\n\tVictorialogsAddr string `json:\"victorialogs.addr\" mapstructure:\"victorialogs.addr\"`\n\tVictorialogsBasic struct {\n\t\tVictorialogsUser string `json:\"victorialogs.user\" mapstructure:\"victorialogs.user\"`\n\t\tVictorialogsPass string `json:\"victorialogs.password\" mapstructure:\"victorialogs.password\"`\n\t\tIsEncrypt bool `json:\"victorialogs.is_encrypt\" mapstructure:\"victorialogs.is_encrypt\"`\n\t} `json:\"victorialogs.basic\" mapstructure:\"victorialogs.basic\"`\n\tVictorialogsTls struct {\n\t\tSkipTlsVerify bool `json:\"victorialogs.tls.skip_tls_verify\" mapstructure:\"victorialogs.tls.skip_tls_verify\"`\n\t} `json:\"victorialogs.tls\" mapstructure:\"victorialogs.tls\"`\n\tHeaders map[string]string `json:\"victorialogs.headers\" mapstructure:\"victorialogs.headers\"`\n\tTimeout int64 `json:\"victorialogs.timeout\" mapstructure:\"victorialogs.timeout\"` // millis\n\tClusterName string `json:\"victorialogs.cluster_name\" mapstructure:\"victorialogs.cluster_name\"`\n\tMaxQueryRows int `json:\"victorialogs.max_query_rows\" mapstructure:\"victorialogs.max_query_rows\"`\n\n\tHTTPClient *http.Client `json:\"-\" mapstructure:\"-\"`\n}\n\n// LogEntry 日志条目\ntype LogEntry map[string]interface{}\n\n// PrometheusResponse Prometheus 响应格式\ntype PrometheusResponse struct {\n\tStatus string `json:\"status\"`\n\tData PrometheusData `json:\"data\"`\n\tError string `json:\"error,omitempty\"`\n}\n\n// PrometheusData Prometheus 数据部分\ntype PrometheusData struct {\n\tResultType string `json:\"resultType\"`\n\tResult []PrometheusItem `json:\"result\"`\n}\n\n// PrometheusItem Prometheus 数据项\ntype PrometheusItem struct {\n\tMetric map[string]string `json:\"metric\"`\n\tValue []interface{} `json:\"value,omitempty\"` // [timestamp, value]\n\tValues [][]interface{} `json:\"values,omitempty\"` // [[timestamp, value], ...]\n}\n\n// HitsResult hits 查询响应\ntype HitsResult struct {\n\tHits []struct {\n\t\tTotal int64 `json:\"total\"`\n\t}\n}\n\n// InitHTTPClient 初始化 HTTP 客户端\nfunc (vl *VictoriaLogs) InitHTTPClient() error {\n\ttransport := &http.Transport{\n\t\tMaxIdleConns: 100,\n\t\tMaxIdleConnsPerHost: 10,\n\t\tIdleConnTimeout: 90 * time.Second,\n\t\tTLSClientConfig: &tls.Config{\n\t\t\tInsecureSkipVerify: vl.VictorialogsTls.SkipTlsVerify,\n\t\t},\n\t}\n\n\ttimeout := time.Duration(vl.Timeout) * time.Millisecond\n\tif timeout == 0 {\n\t\ttimeout = 60 * time.Second\n\t}\n\n\tvl.HTTPClient = &http.Client{\n\t\tTransport: transport,\n\t\tTimeout: timeout,\n\t}\n\n\treturn nil\n}\n\n// Query 执行日志查询\n// GET/POST /select/logsql/query?query=&start=&end=&limit=\nfunc (vl *VictoriaLogs) Query(ctx context.Context, query string, start, end int64, limit int) ([]LogEntry, error) {\n\tparams := url.Values{}\n\tparams.Set(\"query\", query)\n\n\tif start > 0 {\n\t\tparams.Set(\"start\", strconv.FormatInt(start, 10))\n\t}\n\tif end > 0 {\n\t\tparams.Set(\"end\", strconv.FormatInt(end, 10))\n\t}\n\tif limit > 0 {\n\t\tparams.Set(\"limit\", strconv.Itoa(limit))\n\t} else {\n\t\tparams.Set(\"limit\", strconv.Itoa(vl.MaxQueryRows)) // 默认 1000 条\n\t}\n\n\tendpoint := fmt.Sprintf(\"%s/select/logsql/query\", vl.VictorialogsAddr)\n\n\tresp, err := vl.doRequest(ctx, \"POST\", endpoint, params)\n\tif err != nil {\n\t\treturn nil, err\n\t}\n\tdefer resp.Body.Close()\n\n\tbody, err := io.ReadAll(resp.Body)\n\tif err != nil {\n\t\treturn nil, fmt.Errorf(\"read response body failed: %w\", err)\n\t}\n\n\tif resp.StatusCode != http.StatusOK {\n\t\treturn nil, fmt.Errorf(\"query failed: status=%d, body=%s\", resp.StatusCode, string(body))\n\t}\n\n\t// VictoriaLogs returns NDJSON format (one JSON object per line)\n\tvar logs []LogEntry\n\tscanner := bufio.NewScanner(strings.NewReader(string(body)))\n\tfor scanner.Scan() {\n\t\tline := scanner.Text()\n\t\tif line == \"\" {\n\t\t\tcontinue\n\t\t}\n\t\tvar entry LogEntry\n\t\tif err := json.Unmarshal([]byte(line), &entry); err != nil {\n\t\t\treturn nil, fmt.Errorf(\"decode log entry failed: %w, line=%s\", err, line)\n\t\t}\n\t\tlogs = append(logs, entry)\n\t}\n\tif err := scanner.Err(); err != nil {\n\t\treturn nil, fmt.Errorf(\"scan response failed: %w\", err)\n\t}\n\n\treturn logs, nil\n}\n\n// StatsQuery 执行统计查询(单点时间)\n// POST /select/logsql/stats_query?query=&time=\nfunc (vl *VictoriaLogs) StatsQuery(ctx context.Context, query string, time int64) (*PrometheusResponse, error) {\n\tparams := url.Values{}\n\tparams.Set(\"query\", query)\n\n\tif time > 0 {\n\t\tparams.Set(\"time\", strconv.FormatInt(time, 10))\n\t}\n\n\tendpoint := fmt.Sprintf(\"%s/select/logsql/stats_query\", vl.VictorialogsAddr)\n\n\tresp, err := vl.doRequest(ctx, \"POST\", endpoint, params)\n\tif err != nil {\n\t\treturn nil, err\n\t}\n\tdefer resp.Body.Close()\n\n\tbody, err := io.ReadAll(resp.Body)\n\tif err != nil {\n\t\treturn nil, fmt.Errorf(\"read response body failed: %w\", err)\n\t}\n\n\tif resp.StatusCode != http.StatusOK {\n\t\treturn nil, fmt.Errorf(\"stats query failed: status=%d, body=%s\", resp.StatusCode, string(body))\n\t}\n\n\tvar result PrometheusResponse\n\tif err := json.Unmarshal(body, &result); err != nil {\n\t\treturn nil, fmt.Errorf(\"decode response failed: %w, body=%s\", err, string(body))\n\t}\n\n\tif result.Status != \"success\" {\n\t\treturn nil, fmt.Errorf(\"query failed: %s\", result.Error)\n\t}\n\n\treturn &result, nil\n}\n\n// StatsQueryRange 执行统计查询(时间范围)\n// POST /select/logsql/stats_query_range?query=&start=&end=&step=\nfunc (vl *VictoriaLogs) StatsQueryRange(ctx context.Context, query string, start, end int64, step string) (*PrometheusResponse, error) {\n\tparams := url.Values{}\n\tparams.Set(\"query\", query)\n\n\tif start > 0 {\n\t\tparams.Set(\"start\", strconv.FormatInt(start, 10))\n\t}\n\tif end > 0 {\n\t\tparams.Set(\"end\", strconv.FormatInt(end, 10))\n\t}\n\tif step != \"\" {\n\t\tparams.Set(\"step\", step)\n\t}\n\n\tendpoint := fmt.Sprintf(\"%s/select/logsql/stats_query_range\", vl.VictorialogsAddr)\n\n\tresp, err := vl.doRequest(ctx, \"POST\", endpoint, params)\n\tif err != nil {\n\t\treturn nil, err\n\t}\n\tdefer resp.Body.Close()\n\n\tbody, err := io.ReadAll(resp.Body)\n\tif err != nil {\n\t\treturn nil, fmt.Errorf(\"read response body failed: %w\", err)\n\t}\n\n\tif resp.StatusCode != http.StatusOK {\n\t\treturn nil, fmt.Errorf(\"stats query range failed: status=%d, body=%s\", resp.StatusCode, string(body))\n\t}\n\n\tvar result PrometheusResponse\n\tif err := json.Unmarshal(body, &result); err != nil {\n\t\treturn nil, fmt.Errorf(\"decode response failed: %w, body=%s\", err, string(body))\n\t}\n\n\tif result.Status != \"success\" {\n\t\treturn nil, fmt.Errorf(\"query failed: %s\", result.Error)\n\t}\n\n\treturn &result, nil\n}\n\n// HitsLogs 返回查询命中的日志数量,用于计算 total\n// POST /select/logsql/hits?query=&start=&end=\nfunc (vl *VictoriaLogs) HitsLogs(ctx context.Context, query string, start, end int64) (int64, error) {\n\tparams := url.Values{}\n\tparams.Set(\"query\", query)\n\n\tif start > 0 {\n\t\tparams.Set(\"start\", strconv.FormatInt(start, 10))\n\t}\n\tif end > 0 {\n\t\tparams.Set(\"end\", strconv.FormatInt(end, 10))\n\t}\n\n\tendpoint := fmt.Sprintf(\"%s/select/logsql/hits\", vl.VictorialogsAddr)\n\n\tresp, err := vl.doRequest(ctx, \"POST\", endpoint, params)\n\tif err != nil {\n\t\treturn 0, err\n\t}\n\tdefer resp.Body.Close()\n\n\tbody, err := io.ReadAll(resp.Body)\n\tif err != nil {\n\t\treturn 0, fmt.Errorf(\"read response body failed: %w\", err)\n\t}\n\n\tif resp.StatusCode != http.StatusOK {\n\t\treturn 0, fmt.Errorf(\"hits query failed: status=%d, body=%s\", resp.StatusCode, string(body))\n\t}\n\n\tvar result HitsResult\n\tif err := json.Unmarshal(body, &result); err != nil {\n\t\treturn 0, fmt.Errorf(\"decode response failed: %w, body=%s\", err, string(body))\n\t}\n\n\tif len(result.Hits) == 0 {\n\t\treturn 0, nil\n\t}\n\n\treturn result.Hits[0].Total, nil\n}\n\n// doRequest 执行 HTTP 请求\nfunc (vl *VictoriaLogs) doRequest(ctx context.Context, method, endpoint string, params url.Values) (*http.Response, error) {\n\tvar req *http.Request\n\tvar err error\n\n\tif method == \"GET\" {\n\t\tfullURL := endpoint\n\t\tif len(params) > 0 {\n\t\t\tfullURL = fmt.Sprintf(\"%s?%s\", endpoint, params.Encode())\n\t\t}\n\t\treq, err = http.NewRequestWithContext(ctx, method, fullURL, nil)\n\t} else {\n\t\t// POST with form data\n\t\treq, err = http.NewRequestWithContext(ctx, method, endpoint, strings.NewReader(params.Encode()))\n\t\tif err == nil {\n\t\t\treq.Header.Set(\"Content-Type\", \"application/x-www-form-urlencoded\")\n\t\t}\n\t}\n\n\tif err != nil {\n\t\treturn nil, fmt.Errorf(\"create request failed: %w\", err)\n\t}\n\n\tif vl.VictorialogsBasic.VictorialogsUser != \"\" {\n\t\treq.SetBasicAuth(vl.VictorialogsBasic.VictorialogsUser, vl.VictorialogsBasic.VictorialogsPass)\n\t}\n\n\t// Custom Headers\n\tfor k, v := range vl.Headers {\n\t\treq.Header.Set(k, v)\n\t}\n\n\treturn vl.HTTPClient.Do(req)\n}\n"
},
{
"path": "dskit/victorialogs/victorialogs_test.go",
"content": "package victorialogs\n\nimport (\n\t\"context\"\n\t\"testing\"\n\t\"time\"\n)\n\nvar v = VictoriaLogs{\n\tVictorialogsAddr: \"http://127.0.0.1:9428\",\n\tHeaders: make(map[string]string),\n\tTimeout: 10000, // 10 seconds in milliseconds\n}\n\nfunc TestVictoriaLogs_InitHTTPClient(t *testing.T) {\n\tif err := v.InitHTTPClient(); err != nil {\n\t\tt.Fatalf(\"InitHTTPClient failed: %v\", err)\n\t}\n\tif v.HTTPClient == nil {\n\t\tt.Fatal(\"HTTPClient should not be nil after initialization\")\n\t}\n}\n\nfunc TestVictoriaLogs_Query(t *testing.T) {\n\tctx := context.Background()\n\tif err := v.InitHTTPClient(); err != nil {\n\t\tt.Fatalf(\"InitHTTPClient failed: %v\", err)\n\t}\n\n\t// Query logs with basic query\n\tnow := time.Now().UnixNano()\n\tstart := now - int64(time.Hour) // 1 hour ago\n\tend := now\n\n\tlogs, err := v.Query(ctx, \"*\", start, end, 10)\n\tif err != nil {\n\t\tt.Fatalf(\"Query failed: %v\", err)\n\t}\n\tt.Logf(\"Query returned %d log entries\", len(logs))\n\tfor i, log := range logs {\n\t\tt.Logf(\"Log[%d]: %v\", i, log)\n\t}\n}\n\nfunc TestVictoriaLogs_StatsQuery(t *testing.T) {\n\tctx := context.Background()\n\tif err := v.InitHTTPClient(); err != nil {\n\t\tt.Fatalf(\"InitHTTPClient failed: %v\", err)\n\t}\n\n\t// Stats query with count\n\tnow := time.Now().UnixNano()\n\tresult, err := v.StatsQuery(ctx, \"* | stats count() as total\", now)\n\tif err != nil {\n\t\tt.Fatalf(\"StatsQuery failed: %v\", err)\n\t}\n\tt.Logf(\"StatsQuery result: status=%s, resultType=%s\", result.Status, result.Data.ResultType)\n\tfor i, item := range result.Data.Result {\n\t\tt.Logf(\"Result[%d]: metric=%v, value=%v\", i, item.Metric, item.Value)\n\t}\n}\n\nfunc TestVictoriaLogs_StatsQueryRange(t *testing.T) {\n\tctx := context.Background()\n\tif err := v.InitHTTPClient(); err != nil {\n\t\tt.Fatalf(\"InitHTTPClient failed: %v\", err)\n\t}\n\n\t// Stats query range\n\tnow := time.Now().UnixNano()\n\tstart := now - int64(time.Hour) // 1 hour ago\n\tend := now\n\n\tresult, err := v.StatsQueryRange(ctx, \"* | stats count() as total\", start, end, \"5m\")\n\tif err != nil {\n\t\tt.Fatalf(\"StatsQueryRange failed: %v\", err)\n\t}\n\tt.Logf(\"StatsQueryRange result: status=%s, resultType=%s\", result.Status, result.Data.ResultType)\n\tfor i, item := range result.Data.Result {\n\t\tt.Logf(\"Result[%d]: metric=%v, values count=%d\", i, item.Metric, len(item.Values))\n\t}\n}\n\nfunc TestVictoriaLogs_HitsLogs(t *testing.T) {\n\tctx := context.Background()\n\tif err := v.InitHTTPClient(); err != nil {\n\t\tt.Fatalf(\"InitHTTPClient failed: %v\", err)\n\t}\n\n\t// Get total hits count\n\tnow := time.Now().UnixNano()\n\tstart := now - int64(time.Hour) // 1 hour ago\n\tend := now\n\n\tcount, err := v.HitsLogs(ctx, \"*\", start, end)\n\tif err != nil {\n\t\tt.Fatalf(\"HitsLogs failed: %v\", err)\n\t}\n\tt.Logf(\"HitsLogs total count: %d\", count)\n}\n\nfunc TestVictoriaLogs_QueryWithFilter(t *testing.T) {\n\tctx := context.Background()\n\tif err := v.InitHTTPClient(); err != nil {\n\t\tt.Fatalf(\"InitHTTPClient failed: %v\", err)\n\t}\n\n\t// Query with a filter condition\n\tnow := time.Now().UnixNano()\n\tstart := now - int64(time.Hour)\n\tend := now\n\n\tlogs, err := v.Query(ctx, \"_stream:{app=\\\"test\\\"}\", start, end, 5)\n\tif err != nil {\n\t\tt.Fatalf(\"Query with filter failed: %v\", err)\n\t}\n\tt.Logf(\"Query with filter returned %d log entries\", len(logs))\n}\n\nfunc TestVictoriaLogs_StatsQueryByField(t *testing.T) {\n\tctx := context.Background()\n\tif err := v.InitHTTPClient(); err != nil {\n\t\tt.Fatalf(\"InitHTTPClient failed: %v\", err)\n\t}\n\n\t// Stats query grouped by field\n\tnow := time.Now().UnixNano()\n\tresult, err := v.StatsQuery(ctx, \"* | stats by (level) count() as cnt\", now)\n\tif err != nil {\n\t\tt.Fatalf(\"StatsQuery by field failed: %v\", err)\n\t}\n\tt.Logf(\"StatsQuery by field result: status=%s\", result.Status)\n\tfor i, item := range result.Data.Result {\n\t\tt.Logf(\"Result[%d]: metric=%v, value=%v\", i, item.Metric, item.Value)\n\t}\n}\n"
},
{
"path": "dumper/dumper.go",
"content": "package dumper\n\nimport \"github.com/gin-gonic/gin\"\n\n// package level functions\nfunc ConfigRouter(r *gin.Engine) {\n\tsyncDumper.ConfigRouter(r)\n}\n"
},
{
"path": "dumper/sync.go",
"content": "package dumper\n\nimport (\n\t\"fmt\"\n\t\"strings\"\n\t\"sync\"\n\n\t\"github.com/gin-gonic/gin\"\n\t\"github.com/toolkits/pkg/time\"\n)\n\ntype SyncRecord struct {\n\tTimestamp int64\n\tMills int64\n\tCount int\n\tMessage string\n}\n\nfunc (sr *SyncRecord) String() string {\n\tvar sb strings.Builder\n\tsb.WriteString(\"timestamp: \")\n\tsb.WriteString(time.Format(sr.Timestamp))\n\tsb.WriteString(\", mills: \")\n\tsb.WriteString(fmt.Sprint(sr.Mills, \"ms\"))\n\tsb.WriteString(\", count: \")\n\tsb.WriteString(fmt.Sprint(sr.Count))\n\tsb.WriteString(\", message: \")\n\tsb.WriteString(sr.Message)\n\n\treturn sb.String()\n}\n\ntype SyncRecords struct {\n\tCurrent *SyncRecord\n\tLast *SyncRecord\n}\n\ntype SyncDumper struct {\n\tsync.RWMutex\n\trecords map[string]*SyncRecords\n}\n\nfunc NewSyncDumper() *SyncDumper {\n\treturn &SyncDumper{\n\t\trecords: make(map[string]*SyncRecords),\n\t}\n}\n\nvar syncDumper = NewSyncDumper()\n\nfunc (sd *SyncDumper) Put(key string, timestamp, mills int64, count int, message string) {\n\tsr := &SyncRecord{\n\t\tTimestamp: timestamp,\n\t\tMills: mills,\n\t\tCount: count,\n\t\tMessage: message,\n\t}\n\n\tsd.Lock()\n\tdefer sd.Unlock()\n\n\tif _, ok := sd.records[key]; !ok {\n\t\tsd.records[key] = &SyncRecords{Current: sr}\n\t\treturn\n\t}\n\n\tsd.records[key].Last = sd.records[key].Current\n\tsd.records[key].Current = sr\n}\n\n// busi_groups:\n// last: timestamp, mills, count\n// curr: timestamp, mills, count\nfunc (sd *SyncDumper) Sprint() string {\n\tsd.RLock()\n\tdefer sd.RUnlock()\n\n\tvar sb strings.Builder\n\tsb.WriteString(\"\\n\")\n\n\tfor k, v := range sd.records {\n\t\tsb.WriteString(k)\n\t\tsb.WriteString(\":\\n\")\n\t\tif v.Last != nil {\n\t\t\tsb.WriteString(\"last: \")\n\t\t\tsb.WriteString(v.Last.String())\n\t\t\tsb.WriteString(\"\\n\")\n\t\t}\n\t\tsb.WriteString(\"curr: \")\n\t\tsb.WriteString(v.Current.String())\n\t\tsb.WriteString(\"\\n\\n\")\n\t}\n\n\treturn sb.String()\n}\n\nfunc (sd *SyncDumper) ConfigRouter(r *gin.Engine) {\n\tr.GET(\"/dumper/sync\", func(c *gin.Context) {\n\t\tclientIP := c.ClientIP()\n\t\tif clientIP != \"127.0.0.1\" && clientIP != \"::1\" {\n\t\t\tc.String(403, \"forbidden\")\n\t\t\treturn\n\t\t}\n\t\tc.String(200, sd.Sprint())\n\t})\n}\n\nfunc PutSyncRecord(key string, timestamp, mills int64, count int, message string) {\n\tsyncDumper.Put(key, timestamp, mills, count, message)\n}\n"
},
{
"path": "etc/config.toml",
"content": "[Global]\nRunMode = \"release\"\n\n[Log]\n# log write dir\nDir = \"logs\"\n# log level: DEBUG INFO WARNING ERROR\nLevel = \"DEBUG\"\n# stdout, stderr, file\nOutput = \"stdout\"\n# # rotate by time\n# KeepHours = 4\n# # rotate by size\n# RotateNum = 3\n# # unit: MB\n# RotateSize = 256\n\n[HTTP]\n# http listening address\nHost = \"0.0.0.0\"\n# http listening port\nPort = 17000\n# https cert file path\nCertFile = \"\"\n# https key file path\nKeyFile = \"\"\n# whether print access log\nPrintAccessLog = false\n# whether enable pprof\nPProf = true\n# expose prometheus /metrics?\nExposeMetrics = true\n# http graceful shutdown timeout, unit: s\nShutdownTimeout = 30\n# max content length: 64M\nMaxContentLength = 67108864\n# http server read timeout, unit: s\nReadTimeout = 20\n# http server write timeout, unit: s\nWriteTimeout = 40\n# http server idle timeout, unit: s\nIdleTimeout = 120\n\n[HTTP.ShowCaptcha]\nEnable = false\n\n[HTTP.APIForAgent]\nEnable = true\n# [HTTP.APIForAgent.BasicAuth]\n# user001 = \"ccc26da7b9aba533cbb263a36c07dcc5\"\n\n[HTTP.APIForService]\nEnable = false\n[HTTP.APIForService.BasicAuth]\nuser001 = \"ccc26da7b9aba533cbb263a36c07dcc5\"\n\n[HTTP.JWTAuth]\n# unit: min\nAccessExpired = 1500\n# unit: min\nRefreshExpired = 10080\nRedisKeyPrefix = \"/jwt/\"\n\n[HTTP.ProxyAuth]\n# if proxy auth enabled, jwt auth is disabled\nEnable = false\n# username key in http proxy header\nHeaderUserNameKey = \"X-User-Name\"\nDefaultRoles = [\"Standard\"]\n\n[HTTP.TokenAuth]\nEnable = true\n\n[HTTP.RSA]\n# open RSA\nOpenRSA = false\n\n[DB]\n# mysql postgres sqlite\nDBType = \"sqlite\"\n# postgres: host=%s port=%s user=%s dbname=%s password=%s sslmode=%s\n# postgres: DSN=\"host=127.0.0.1 port=5432 user=root dbname=n9e_v6 password=1234 sslmode=disable\"\n# mysql: DSN=\"root:1234@tcp(localhost:3306)/n9e_v6?charset=utf8mb4&parseTime=True&loc=Local\"\nDSN = \"n9e.db\"\n# enable debug mode or not\nDebug = false\n# unit: s\nMaxLifetime = 7200\n# max open connections\nMaxOpenConns = 150\n# max idle connections\nMaxIdleConns = 50\n\n[Redis]\n# address, ip:port or ip1:port,ip2:port for cluster and sentinel(SentinelAddrs)\nAddress = \"127.0.0.1:6379\"\n# Username = \"\"\n# Password = \"\"\n# DB = 0\n# UseTLS = false\n# TLSMinVersion = \"1.2\"\n# standalone cluster sentinel miniredis\nRedisType = \"miniredis\"\n# Mastername for sentinel type\n# MasterName = \"mymaster\"\n# SentinelUsername = \"\"\n# SentinelPassword = \"\"\n\n[Alert]\n[Alert.Heartbeat]\n# auto detect if blank\nIP = \"\"\n# unit ms\nInterval = 1000\nEngineName = \"default\"\n\n# [Alert.Alerting]\n# NotifyConcurrency = 10\n\n[Center]\nMetricsYamlFile = \"./etc/metrics.yaml\"\nI18NHeaderKey = \"X-Language\"\n\n[Center.AnonymousAccess]\nPromQuerier = true\nAlertDetail = true\n\n[Pushgw]\n# use target labels in database instead of in series\nLabelRewrite = true\nForceUseServerTS = true\n\n# [Pushgw.DebugSample]\n# ident = \"xx\"\n# __name__ = \"xx\"\n\n# [Pushgw.WriterOpt]\n# QueueMaxSize = 1000000\n# QueuePopSize = 1000\n\n[[Pushgw.Writers]] \n# Url = \"http://127.0.0.1:8480/insert/0/prometheus/api/v1/write\"\nUrl = \"http://127.0.0.1:9090/api/v1/write\"\n# Basic auth username\nBasicAuthUser = \"\"\n# Basic auth password\nBasicAuthPass = \"\"\n# timeout settings, unit: ms\nHeaders = [\"X-From\", \"n9e\"]\nTimeout = 10000\nDialTimeout = 3000\nTLSHandshakeTimeout = 30000\nExpectContinueTimeout = 1000\nIdleConnTimeout = 90000\n# time duration, unit: ms\nKeepAlive = 30000\nMaxConnsPerHost = 0\nMaxIdleConns = 100\nMaxIdleConnsPerHost = 100\n## Optional TLS Config\n# UseTLS = false\n# TLSCA = \"/etc/n9e/ca.pem\"\n# TLSCert = \"/etc/n9e/cert.pem\"\n# TLSKey = \"/etc/n9e/key.pem\"\n# InsecureSkipVerify = false\n# [[Pushgw.Writers.WriteRelabels]]\n# Action = \"replace\"\n# SourceLabels = [\"__address__\"]\n# Regex = \"([^:]+)(?::\\\\d+)?\"\n# Replacement = \"$1:80\"\n# TargetLabel = \"__address__\"\n\n# [[Pushgw.KafkaWriters]]\n# Brokers = [\"127.0.0.1:9092\"]\n# Topic = \"n9e-metrics\"\n# [Pushgw.KafkaWriters.SASL]\n# Enable = true\n# User = \"admin\"\n# Password = \"admin\"\n# Mechanism = \"PLAIN\"\n# Version = 1\n# Handshake = true\n# AuthIdentity = \"\"\n\n[Ibex]\nEnable = true\nRPCListen = \"0.0.0.0:20090\"\n"
},
{
"path": "etc/edge/edge.toml",
"content": "[Global]\nRunMode = \"release\"\n\n[CenterApi]\nAddrs = [\"http://127.0.0.1:17000\"]\nBasicAuthUser = \"user001\"\nBasicAuthPass = \"ccc26da7b9aba533cbb263a36c07dcc5\"\n# unit: ms\nTimeout = 9000\n\n[Log]\n# log write dir\nDir = \"logs\"\n# log level: DEBUG INFO WARNING ERROR\nLevel = \"DEBUG\"\n# stdout, stderr, file\nOutput = \"stdout\"\n# # rotate by time\n# KeepHours = 4\n# # rotate by size\n# RotateNum = 3\n# # unit: MB\n# RotateSize = 256\n\n[HTTP]\n# http listening address\nHost = \"0.0.0.0\"\n# http listening port\nPort = 19000\n# https cert file path\nCertFile = \"\"\n# https key file path\nKeyFile = \"\"\n# whether print access log\nPrintAccessLog = false\n# whether enable pprof\nPProf = false\n# expose prometheus /metrics?\nExposeMetrics = true\n# http graceful shutdown timeout, unit: s\nShutdownTimeout = 30\n# max content length: 64M\nMaxContentLength = 67108864\n# http server read timeout, unit: s\nReadTimeout = 20\n# http server write timeout, unit: s\nWriteTimeout = 40\n# http server idle timeout, unit: s\nIdleTimeout = 120\n\n[HTTP.APIForAgent]\nEnable = true \n# [HTTP.APIForAgent.BasicAuth]\n# user001 = \"ccc26da7b9aba533cbb263a36c07dcc5\"\n\n[HTTP.APIForService]\nEnable = false\n[HTTP.APIForService.BasicAuth]\nuser001 = \"ccc26da7b9aba533cbb263a36c07dcc5\"\n\n[Alert]\n[Alert.Heartbeat]\n# auto detect if blank\nIP = \"\"\n# unit ms\nInterval = 1000\nEngineName = \"edge\"\n\n# [Alert.Alerting]\n# NotifyConcurrency = 10\n\n[Pushgw]\n# use target labels in database instead of in series\nLabelRewrite = true\n# # default busigroup key name\n# BusiGroupLabelKey = \"busigroup\"\nForceUseServerTS = true\n\n# [Pushgw.DebugSample]\n# ident = \"xx\"\n# __name__ = \"xx\"\n\n# [Pushgw.WriterOpt]\n# QueueMaxSize = 1000000\n# QueuePopSize = 1000\n\n[[Pushgw.Writers]] \n# Url = \"http://127.0.0.1:8480/insert/0/prometheus/api/v1/write\"\nUrl = \"http://127.0.0.1:9090/api/v1/write\"\n# Basic auth username\nBasicAuthUser = \"\"\n# Basic auth password\nBasicAuthPass = \"\"\n# timeout settings, unit: ms\nHeaders = [\"X-From\", \"n9e\"]\nTimeout = 10000\nDialTimeout = 3000\nTLSHandshakeTimeout = 30000\nExpectContinueTimeout = 1000\nIdleConnTimeout = 90000\n# time duration, unit: ms\nKeepAlive = 30000\nMaxConnsPerHost = 0\nMaxIdleConns = 100\nMaxIdleConnsPerHost = 100\n## Optional TLS Config\n# UseTLS = false\n# TLSCA = \"/etc/n9e/ca.pem\"\n# TLSCert = \"/etc/n9e/cert.pem\"\n# TLSKey = \"/etc/n9e/key.pem\"\n# InsecureSkipVerify = false\n# [[Writers.WriteRelabels]]\n# Action = \"replace\"\n# SourceLabels = [\"__address__\"]\n# Regex = \"([^:]+)(?::\\\\d+)?\"\n# Replacement = \"$1:80\"\n# TargetLabel = \"__address__\"\n\n[Ibex]\nEnable = false\nRPCListen = \"0.0.0.0:20090\"\n\n# n9e-edge cannot directly reuse the redis that n9e relies on at the center.\n# It needs to deploy a separate redis in the edge region for n9e-edge to use.\n[Redis]\n# address, ip:port or ip1:port,ip2:port for cluster and sentinel(SentinelAddrs)\nAddress = \"127.0.0.1:6379\"\n# Username = \"\"\n# Password = \"\"\n# DB = 0\n# UseTLS = false\n# TLSMinVersion = \"1.2\"\n# standalone cluster sentinel\nRedisType = \"standalone\"\n# Mastername for sentinel type\n# MasterName = \"mymaster\"\n# SentinelUsername = \"\"\n# SentinelPassword = \"\"\n"
},
{
"path": "etc/metrics.yaml",
"content": "zh:\n ip_conntrack_count: 连接跟踪表条目总数(单位:int, count)\n ip_conntrack_max: 连接跟踪表最大容量(单位:int, size)\n cpu_usage_idle: CPU空闲率(单位:%)\n cpu_usage_active: CPU使用率(单位:%)\n cpu_usage_system: CPU内核态时间占比(单位:%)\n cpu_usage_user: CPU用户态时间占比(单位:%)\n cpu_usage_nice: 低优先级用户态CPU时间占比,也就是进程nice值被调整为1-19之间的CPU时间。这里注意,nice可取值范围是-20到19,数值越大,优先级反而越低(单位:%)\n cpu_usage_iowait: CPU等待I/O的时间占比(单位:%)\n cpu_usage_irq: CPU处理硬中断的时间占比(单位:%)\n cpu_usage_softirq: CPU处理软中断的时间占比(单位:%)\n cpu_usage_steal: 在虚拟机环境下有该指标,表示CPU被其他虚拟机争用的时间占比,超过20就表示争抢严重(单位:%)\n cpu_usage_guest: 通过虚拟化运行其他操作系统的时间,也就是运行虚拟机的CPU时间占比(单位:%)\n cpu_usage_guest_nice: 以低优先级运行虚拟机的时间占比(单位:%)\n\n disk_free: 硬盘分区剩余量(单位:byte)\n disk_used: 硬盘分区使用量(单位:byte)\n disk_used_percent: 硬盘分区使用率(单位:%)\n disk_total: 硬盘分区总量(单位:byte)\n disk_inodes_free: 硬盘分区inode剩余量\n disk_inodes_used: 硬盘分区inode使用量\n disk_inodes_total: 硬盘分区inode总量\n\n diskio_io_time: 从设备视角来看I/O请求总时间,队列中有I/O请求就计数(单位:毫秒),counter类型,需要用函数求rate才有使用价值\n diskio_iops_in_progress: 已经分配给设备驱动且尚未完成的IO请求,不包含在队列中但尚未分配给设备驱动的IO请求,gauge类型\n diskio_merged_reads: 相邻读请求merge读的次数,counter类型\n diskio_merged_writes: 相邻写请求merge写的次数,counter类型\n diskio_read_bytes: 读取的byte数量,counter类型,需要用函数求rate才有使用价值\n diskio_read_time: 读请求总时间(单位:毫秒),counter类型,需要用函数求rate才有使用价值\n diskio_reads: 读请求次数,counter类型,需要用函数求rate才有使用价值\n diskio_weighted_io_time: 从I/O请求视角来看I/O等待总时间,如果同时有多个I/O请求,时间会叠加(单位:毫秒)\n diskio_write_bytes: 写入的byte数量,counter类型,需要用函数求rate才有使用价值\n diskio_write_time: 写请求总时间(单位:毫秒),counter类型,需要用函数求rate才有使用价值\n diskio_writes: 写请求次数,counter类型,需要用函数求rate才有使用价值\n\n kernel_boot_time: 内核启动时间\n kernel_context_switches: 内核上下文切换次数\n kernel_entropy_avail: linux系统内部的熵池\n kernel_interrupts: 内核中断次数\n kernel_processes_forked: fork的进程数\n\n mem_active: 活跃使用的内存总数(包括cache和buffer内存)\n mem_available: 可用内存大小(bytes)\n mem_available_percent: 内存剩余百分比(0~100)\n mem_buffered: 用来给文件做缓冲大小\n mem_cached: 被高速缓冲存储器(cache memory)用的内存的大小(等于 diskcache minus SwapCache )\n mem_commit_limit: 根据超额分配比率('vm.overcommit_ratio'),这是当前在系统上分配可用的内存总量,这个限制只是在模式2('vm.overcommit_memory')时启用\n mem_committed_as: 目前在系统上分配的内存量。是所有进程申请的内存的总和\n mem_dirty: 等待被写回到磁盘的内存大小\n mem_free: 空闲内存大小(bytes)\n mem_high_free: 未被使用的高位内存大小\n mem_high_total: 高位内存总大小(Highmem是指所有内存高于860MB的物理内存,Highmem区域供用户程序使用,或用于页面缓存。该区域不是直接映射到内核空间。内核必须使用不同的手法使用该段内存)\n mem_huge_page_size: 每个大页的大小\n mem_huge_pages_free: 池中尚未分配的 HugePages 数量\n mem_huge_pages_total: 预留HugePages的总个数\n mem_inactive: 空闲的内存数(包括free和available的内存)\n mem_low_free: 未被使用的低位大小\n mem_low_total: 低位内存总大小,低位可以达到高位内存一样的作用,而且它还能够被内核用来记录一些自己的数据结构\n mem_mapped: 设备和文件等映射的大小\n mem_page_tables: 管理内存分页页面的索引表的大小\n mem_shared: 多个进程共享的内存总额\n mem_slab: 内核数据结构缓存的大小,可以减少申请和释放内存带来的消耗\n mem_sreclaimable: 可收回Slab的大小\n mem_sunreclaim: 不可收回Slab的大小(SUnreclaim+SReclaimable=Slab)\n mem_swap_cached: 被高速缓冲存储器(cache memory)用的交换空间的大小,已经被交换出来的内存,但仍然被存放在swapfile中。用来在需要的时候很快的被替换而不需要再次打开I/O端口\n mem_swap_free: 未被使用交换空间的大小\n mem_swap_total: 交换空间的总大小\n mem_total: 内存总数\n mem_used: 已用内存数\n mem_used_percent: 已用内存数百分比(0~100)\n mem_vmalloc_chunk: 最大的连续未被使用的vmalloc区域\n mem_vmalloc_totalL: 可以vmalloc虚拟内存大小\n mem_vmalloc_used: vmalloc已使用的虚拟内存大小\n mem_write_back: 正在被写回到磁盘的内存大小\n mem_write_back_tmp: FUSE用于临时写回缓冲区的内存\n\n net_bytes_recv: 网卡收包总数(bytes),计算每秒速率时需要用到rate/irate函数\n net_bytes_sent: 网卡发包总数(bytes),计算每秒速率时需要用到rate/irate函数\n net_drop_in: 网卡收丢包数量\n net_drop_out: 网卡发丢包数量\n net_err_in: 网卡收包错误数量\n net_err_out: 网卡发包错误数量\n net_packets_recv: 网卡收包数量\n net_packets_sent: 网卡发包数量\n net_bits_recv: 网卡收包总数(bits),计算每秒速率时需要用到rate/irate函数\n net_bits_sent: 网卡发包总数(bits),计算每秒速率时需要用到rate/irate函数\n\n netstat_tcp_established: ESTABLISHED状态的网络链接数\n netstat_tcp_fin_wait1: FIN_WAIT1状态的网络链接数\n netstat_tcp_fin_wait2: FIN_WAIT2状态的网络链接数\n netstat_tcp_last_ack: LAST_ACK状态的网络链接数\n netstat_tcp_listen: LISTEN状态的网络链接数\n netstat_tcp_syn_recv: SYN_RECV状态的网络链接数\n netstat_tcp_syn_sent: SYN_SENT状态的网络链接数\n netstat_tcp_time_wait: TIME_WAIT状态的网络链接数\n netstat_udp_socket: UDP状态的网络链接数\n\n netstat_sockets_used: 已使用的所有协议套接字总量\n netstat_tcp_inuse: 正在使用(正在侦听)的TCP套接字数量\n netstat_tcp_orphan: 无主(不属于任何进程)的TCP连接数(无用、待销毁的TCP socket数)\n netstat_tcp_tw: TIME_WAIT状态的TCP连接数\n netstat_tcp_alloc: 已分配(已建立、已申请到sk_buff)的TCP套接字数量\n netstat_tcp_mem: TCP套接字内存Page使用量\n netstat_udp_inuse: 在使用的UDP套接字数量\n netstat_udp_mem: UDP套接字内存Page使用量\n netstat_udplite_inuse: 正在使用的 udp lite 数量\n netstat_raw_inuse: 正在使用的 raw socket 数量\n netstat_frag_inuse: ip fragment 数量\n netstat_frag_memory: ip fragment 已经分配的内存(byte)\n\n #[ping]\n ping_percent_packet_loss: ping数据包丢失百分比(%)\n ping_result_code: ping返回码('0','1')\n\n net_response_result_code: 网络探测结果,0表示正常,非0表示异常\n net_response_response_time: 网络探测时延,单位:秒\n\n processes_blocked: 不可中断的睡眠状态下的进程数('U','D','L')\n processes_dead: 回收中的进程数('X')\n processes_idle: 挂起的空闲进程数('I')\n processes_paging: 分页进程数('P')\n processes_running: 运行中的进程数('R')\n processes_sleeping: 可中断进程数('S')\n processes_stopped: 暂停状态进程数('T')\n processes_total: 总进程数\n processes_total_threads: 总线程数\n processes_unknown: 未知状态进程数\n processes_zombies: 僵尸态进程数('Z')\n\n swap_used_percent: Swap空间换出数据量\n\n system_load1: 1分钟平均load值\n system_load5: 5分钟平均load值\n system_load15: 15分钟平均load值\n system_load_norm_1: 1分钟平均load值/逻辑CPU个数\n system_load_norm_5: 5分钟平均load值/逻辑CPU个数\n system_load_norm_15: 15分钟平均load值/逻辑CPU个数\n system_n_users: 用户数\n system_n_cpus: CPU核数\n system_uptime: 系统启动时间\n\n nginx_accepts: 自nginx启动起,与客户端建立过得连接总数\n nginx_active: 当前nginx正在处理的活动连接数,等于Reading/Writing/Waiting总和\n nginx_handled: 自nginx启动起,处理过的客户端连接总数\n nginx_reading: 正在读取HTTP请求头部的连接总数\n nginx_requests: 自nginx启动起,处理过的客户端请求总数,由于存在HTTP Keep-Alive请求,该值会大于handled值\n nginx_upstream_check_fall: upstream_check模块检测到后端失败的次数\n nginx_upstream_check_rise: upstream_check模块对后端的检测次数\n nginx_upstream_check_status_code: 后端upstream的状态,up为1,down为0\n nginx_waiting: 开启 keep-alive 的情况下,这个值等于 active – (reading+writing), 意思就是 Nginx 已经处理完正在等候下一次请求指令的驻留连接\n nginx_writing: 正在向客户端发送响应的连接总数\n\n http_response_content_length: HTTP消息实体的传输长度\n http_response_http_response_code: http响应状态码\n http_response_response_time: http响应用时\n http_response_result_code: url探测结果0为正常否则url无法访问\n\n # [aws cloudwatch rds]\n cloudwatch_aws_rds_bin_log_disk_usage_average: rds 磁盘使用平均值\n cloudwatch_aws_rds_bin_log_disk_usage_maximum: rds 磁盘使用量最大值\n cloudwatch_aws_rds_bin_log_disk_usage_minimum: rds binlog 磁盘使用量最低\n cloudwatch_aws_rds_bin_log_disk_usage_sample_count: rds binlog 磁盘使用情况样本计数\n cloudwatch_aws_rds_bin_log_disk_usage_sum: rds binlog 磁盘使用总和\n cloudwatch_aws_rds_burst_balance_average: rds 突发余额平均值\n cloudwatch_aws_rds_burst_balance_maximum: rds 突发余额最大值\n cloudwatch_aws_rds_burst_balance_minimum: rds 突发余额最低\n cloudwatch_aws_rds_burst_balance_sample_count: rds 突发平衡样本计数\n cloudwatch_aws_rds_burst_balance_sum: rds 突发余额总和\n cloudwatch_aws_rds_cpu_utilization_average: rds cpu 利用率平均值\n cloudwatch_aws_rds_cpu_utilization_maximum: rds cpu 利用率最大值\n cloudwatch_aws_rds_cpu_utilization_minimum: rds cpu 利用率最低\n cloudwatch_aws_rds_cpu_utilization_sample_count: rds cpu 利用率样本计数\n cloudwatch_aws_rds_cpu_utilization_sum: rds cpu 利用率总和\n cloudwatch_aws_rds_database_connections_average: rds 数据库连接平均值\n cloudwatch_aws_rds_database_connections_maximum: rds 数据库连接数最大值\n cloudwatch_aws_rds_database_connections_minimum: rds 数据库连接最小\n cloudwatch_aws_rds_database_connections_sample_count: rds 数据库连接样本数\n cloudwatch_aws_rds_database_connections_sum: rds 数据库连接总和\n cloudwatch_aws_rds_db_load_average: rds db 平均负载\n cloudwatch_aws_rds_db_load_cpu_average: rds db 负载 cpu 平均值\n cloudwatch_aws_rds_db_load_cpu_maximum: rds db 负载 cpu 最大值\n cloudwatch_aws_rds_db_load_cpu_minimum: rds db 负载 cpu 最小值\n cloudwatch_aws_rds_db_load_cpu_sample_count: rds db 加载 CPU 样本数\n cloudwatch_aws_rds_db_load_cpu_sum: rds db 加载cpu总和\n cloudwatch_aws_rds_db_load_maximum: rds 数据库负载最大值\n cloudwatch_aws_rds_db_load_minimum: rds 数据库负载最小值\n cloudwatch_aws_rds_db_load_non_cpu_average: rds 加载非 CPU 平均值\n cloudwatch_aws_rds_db_load_non_cpu_maximum: rds 加载非 cpu 最大值\n cloudwatch_aws_rds_db_load_non_cpu_minimum: rds 加载非 cpu 最小值\n cloudwatch_aws_rds_db_load_non_cpu_sample_count: rds 加载非 cpu 样本计数\n cloudwatch_aws_rds_db_load_non_cpu_sum: rds 加载非cpu总和\n cloudwatch_aws_rds_db_load_sample_count: rds db 加载样本计数\n cloudwatch_aws_rds_db_load_sum: rds db 负载总和\n cloudwatch_aws_rds_disk_queue_depth_average: rds 磁盘队列深度平均值\n cloudwatch_aws_rds_disk_queue_depth_maximum: rds 磁盘队列深度最大值\n cloudwatch_aws_rds_disk_queue_depth_minimum: rds 磁盘队列深度最小值\n cloudwatch_aws_rds_disk_queue_depth_sample_count: rds 磁盘队列深度样本计数\n cloudwatch_aws_rds_disk_queue_depth_sum: rds 磁盘队列深度总和\n cloudwatch_aws_rds_ebs_byte_balance__average: rds ebs 字节余额平均值\n cloudwatch_aws_rds_ebs_byte_balance__maximum: rds ebs 字节余额最大值\n cloudwatch_aws_rds_ebs_byte_balance__minimum: rds ebs 字节余额最低\n cloudwatch_aws_rds_ebs_byte_balance__sample_count: rds ebs 字节余额样本数\n cloudwatch_aws_rds_ebs_byte_balance__sum: rds ebs 字节余额总和\n cloudwatch_aws_rds_ebsio_balance__average: rds ebsio 余额平均值\n cloudwatch_aws_rds_ebsio_balance__maximum: rds ebsio 余额最大值\n cloudwatch_aws_rds_ebsio_balance__minimum: rds ebsio 余额最低\n cloudwatch_aws_rds_ebsio_balance__sample_count: rds ebsio 平衡样本计数\n cloudwatch_aws_rds_ebsio_balance__sum: rds ebsio 余额总和\n cloudwatch_aws_rds_free_storage_space_average: rds 免费存储空间平均\n cloudwatch_aws_rds_free_storage_space_maximum: rds 最大可用存储空间\n cloudwatch_aws_rds_free_storage_space_minimum: rds 最低可用存储空间\n cloudwatch_aws_rds_free_storage_space_sample_count: rds 可用存储空间样本数\n cloudwatch_aws_rds_free_storage_space_sum: rds 免费存储空间总和\n cloudwatch_aws_rds_freeable_memory_average: rds 可用内存平均值\n cloudwatch_aws_rds_freeable_memory_maximum: rds 最大可用内存\n cloudwatch_aws_rds_freeable_memory_minimum: rds 最小可用内存\n cloudwatch_aws_rds_freeable_memory_sample_count: rds 可释放内存样本数\n cloudwatch_aws_rds_freeable_memory_sum: rds 可释放内存总和\n cloudwatch_aws_rds_lvm_read_iops_average: rds lvm 读取 iops 平均值\n cloudwatch_aws_rds_lvm_read_iops_maximum: rds lvm 读取 iops 最大值\n cloudwatch_aws_rds_lvm_read_iops_minimum: rds lvm 读取 iops 最低\n cloudwatch_aws_rds_lvm_read_iops_sample_count: rds lvm 读取 iops 样本计数\n cloudwatch_aws_rds_lvm_read_iops_sum: rds lvm 读取 iops 总和\n cloudwatch_aws_rds_lvm_write_iops_average: rds lvm 写入 iops 平均值\n cloudwatch_aws_rds_lvm_write_iops_maximum: rds lvm 写入 iops 最大值\n cloudwatch_aws_rds_lvm_write_iops_minimum: rds lvm 写入 iops 最低\n cloudwatch_aws_rds_lvm_write_iops_sample_count: rds lvm 写入 iops 样本计数\n cloudwatch_aws_rds_lvm_write_iops_sum: rds lvm 写入 iops 总和\n cloudwatch_aws_rds_network_receive_throughput_average: rds 网络接收吞吐量平均\n cloudwatch_aws_rds_network_receive_throughput_maximum: rds 网络接收吞吐量最大值\n cloudwatch_aws_rds_network_receive_throughput_minimum: rds 网络接收吞吐量最小值\n cloudwatch_aws_rds_network_receive_throughput_sample_count: rds 网络接收吞吐量样本计数\n cloudwatch_aws_rds_network_receive_throughput_sum: rds 网络接收吞吐量总和\n cloudwatch_aws_rds_network_transmit_throughput_average: rds 网络传输吞吐量平均值\n cloudwatch_aws_rds_network_transmit_throughput_maximum: rds 网络传输吞吐量最大\n cloudwatch_aws_rds_network_transmit_throughput_minimum: rds 网络传输吞吐量最小值\n cloudwatch_aws_rds_network_transmit_throughput_sample_count: rds 网络传输吞吐量样本计数\n cloudwatch_aws_rds_network_transmit_throughput_sum: rds 网络传输吞吐量总和\n cloudwatch_aws_rds_read_iops_average: rds 读取 iops 平均值\n cloudwatch_aws_rds_read_iops_maximum: rds 最大读取 iops\n cloudwatch_aws_rds_read_iops_minimum: rds 读取 iops 最低\n cloudwatch_aws_rds_read_iops_sample_count: rds 读取 iops 样本计数\n cloudwatch_aws_rds_read_iops_sum: rds 读取 iops 总和\n cloudwatch_aws_rds_read_latency_average: rds 读取延迟平均值\n cloudwatch_aws_rds_read_latency_maximum: rds 读取延迟最大值\n cloudwatch_aws_rds_read_latency_minimum: rds 最小读取延迟\n cloudwatch_aws_rds_read_latency_sample_count: rds 读取延迟样本计数\n cloudwatch_aws_rds_read_latency_sum: rds 读取延迟总和\n cloudwatch_aws_rds_read_throughput_average: rds 读取吞吐量平均值\n cloudwatch_aws_rds_read_throughput_maximum: rds 最大读取吞吐量\n cloudwatch_aws_rds_read_throughput_minimum: rds 最小读取吞吐量\n cloudwatch_aws_rds_read_throughput_sample_count: rds 读取吞吐量样本计数\n cloudwatch_aws_rds_read_throughput_sum: rds 读取吞吐量总和\n cloudwatch_aws_rds_swap_usage_average: rds 交换使用平均值\n cloudwatch_aws_rds_swap_usage_maximum: rds 交换使用最大值\n cloudwatch_aws_rds_swap_usage_minimum: rds 交换使用量最低\n cloudwatch_aws_rds_swap_usage_sample_count: rds 交换使用示例计数\n cloudwatch_aws_rds_swap_usage_sum: rds 交换使用总和\n cloudwatch_aws_rds_write_iops_average: rds 写入 iops 平均值\n cloudwatch_aws_rds_write_iops_maximum: rds 写入 iops 最大值\n cloudwatch_aws_rds_write_iops_minimum: rds 写入 iops 最低\n cloudwatch_aws_rds_write_iops_sample_count: rds 写入 iops 样本计数\n cloudwatch_aws_rds_write_iops_sum: rds 写入 iops 总和\n cloudwatch_aws_rds_write_latency_average: rds 写入延迟平均值\n cloudwatch_aws_rds_write_latency_maximum: rds 最大写入延迟\n cloudwatch_aws_rds_write_latency_minimum: rds 写入延迟最小值\n cloudwatch_aws_rds_write_latency_sample_count: rds 写入延迟样本计数\n cloudwatch_aws_rds_write_latency_sum: rds 写入延迟总和\n cloudwatch_aws_rds_write_throughput_average: rds 写入吞吐量平均值\n cloudwatch_aws_rds_write_throughput_maximum: rds 最大写入吞吐量\n cloudwatch_aws_rds_write_throughput_minimum: rds 写入吞吐量最小值\n cloudwatch_aws_rds_write_throughput_sample_count: rds 写入吞吐量样本计数\n cloudwatch_aws_rds_write_throughput_sum: rds 写入吞吐量总和\n\nen:\n ip_conntrack_count: the number of entries in the conntrack table(unit:int, count)\n ip_conntrack_max: the max capacity of the conntrack table(unit:int, size)\n cpu_usage_idle: \"CPU idle rate(unit:%)\"\n cpu_usage_active: \"CPU usage rate(unit:%)\"\n cpu_usage_system: \"CPU kernel state time proportion(unit:%)\"\n cpu_usage_user: \"CPU user attitude time proportion(unit:%)\"\n cpu_usage_nice: \"The proportion of low priority CPU time, that is, the process NICE value is adjusted to the CPU time between 1-19. Note here that the value range of NICE is -20 to 19, the larger the value, the lower the priority, the lower the priority(unit:%)\"\n cpu_usage_iowait: \"CPU waiting for I/O time proportion(unit:%)\"\n cpu_usage_irq: \"CPU processing hard interrupt time proportion(unit:%)\"\n cpu_usage_softirq: \"CPU processing soft interrupt time proportion(unit:%)\"\n cpu_usage_steal: \"In the virtual machine environment, there is this indicator, which means that the CPU is used by other virtual machines for the proportion of time.(unit:%)\"\n cpu_usage_guest: \"The time to run other operating systems by virtualization, that is, the proportion of CPU time running the virtual machine(unit:%)\"\n cpu_usage_guest_nice: \"The proportion of time to run the virtual machine at low priority(unit:%)\"\n\n disk_free: \"The remaining amount of the hard disk partition (unit: byte)\"\n disk_used: \"Hard disk partitional use (unit: byte)\"\n disk_used_percent: \"Hard disk partitional use rate (unit:%)\"\n disk_total: \"Total amount of hard disk partition (unit: byte)\"\n disk_inodes_free: \"Hard disk partition INODE remaining amount\"\n disk_inodes_used: \"Hard disk partition INODE usage amount\"\n disk_inodes_total: \"The total amount of hard disk partition INODE\"\n\n diskio_io_time: \"From the perspective of the device perspective, the total time of I/O request, the I/O request in the queue is count (unit: millisecond), the counter type, you need to use the function to find the value\"\n diskio_iops_in_progress: \"IO requests that have been assigned to device -driven and have not yet been completed, not included in the queue but not yet assigned to the device -driven IO request, Gauge type\"\n diskio_merged_reads: \"The number of times of adjacent reading request Merge, the counter type\"\n diskio_merged_writes: \"The number of times the request Merge writes, the counter type\"\n diskio_read_bytes: \"The number of byte reads, the counter type, you need to use the function to find the Rate to use the value\"\n diskio_read_time: \"The total time of reading request (unit: millisecond), the counter type, you need to use the function to find the Rate to have the value of use\"\n diskio_reads: \"Read the number of requests, the counter type, you need to use the function to find the Rate to use the value\"\n diskio_weighted_io_time: \"From the perspective of the I/O request perspective, I/O wait for the total time. If there are multiple I/O requests at the same time, the time will be superimposed (unit: millisecond)\"\n diskio_write_bytes: \"The number of bytes written, the counter type, you need to use the function to find the Rate to use the value\"\n diskio_write_time: \"The total time of the request (unit: millisecond), the counter type, you need to use the function to find the rate to have the value of use\"\n diskio_writes: \"Write the number of requests, the counter type, you need to use the function to find the rate to use value\"\n\n kernel_boot_time: \"Kernel startup time\"\n kernel_context_switches: \"Number of kernel context switching times\"\n kernel_entropy_avail: \"Entropy pool inside the Linux system\"\n kernel_interrupts: \"Number of kernel interruption\"\n kernel_processes_forked: \"ForK's process number\"\n\n mem_active: \"The total number of memory (including Cache and BUFFER memory)\"\n mem_available: \"Application can use memory numbers\"\n mem_available_percent: \"Memory remaining percentage (0 ~ 100)\"\n mem_buffered: \"Used to make buffer size for the file\"\n mem_cached: \"The size of the memory used by the cache memory (equal to diskcache minus Swap Cache )\"\n mem_commit_limit: \"According to the over allocation ratio ('vm.overCommit _ Ratio'), this is the current total memory that can be allocated on the system.\"\n mem_committed_as: \"Currently allocated on the system. It is the sum of the memory of all process applications\"\n mem_dirty: \"Waiting to be written back to the memory size of the disk\"\n mem_free: \"Senior memory number\"\n mem_high_free: \"Unused high memory size\"\n mem_high_total: \"The total memory size of the high memory (Highmem refers to all the physical memory that is higher than 860 MB of memory, the HighMem area is used for user programs, or for page cache. This area is not directly mapped to the kernel space. The kernels must use different methods to use this section of memory. )\"\n mem_huge_page_size: \"The size of each big page\"\n mem_huge_pages_free: \"The number of Huge Pages in the pool that have not been allocated\"\n mem_huge_pages_total: \"Reserve the total number of Huge Pages\"\n mem_inactive: \"Free memory (including the memory of free and available)\"\n mem_low_free: \"Unused low size\"\n mem_low_total: \"The total size of the low memory memory can achieve the same role of high memory, and it can be used by the kernel to record some of its own data structure\"\n mem_mapped: \"The size of the mapping of equipment and files\"\n mem_page_tables: \"The size of the index table of the management of the memory paging page\"\n mem_shared: \"The total memory shared by multiple processes\"\n mem_slab: \"The size of the kernel data structure cache can reduce the consumption of application and release memory\"\n mem_sreclaimable: \"The size of the SLAB can be recovered\"\n mem_sunreclaim: \"The size of the SLAB cannot be recovered(SUnreclaim+SReclaimable=Slab)\"\n mem_swap_cached: \"The size of the swap space used by the cache memory (cache memory), the memory that has been swapped out, but is still stored in the swapfile. Used to be quickly replaced when needed without opening the I/O port again\"\n mem_swap_free: \"The size of the switching space is not used\"\n mem_swap_total: \"The total size of the exchange space\"\n mem_total: \"Total memory\"\n mem_used: \"Memory number\"\n mem_used_percent: \"The memory has been used by several percentage (0 ~ 100)\"\n mem_vmalloc_chunk: \"The largest continuous unused vmalloc area\"\n mem_vmalloc_totalL: \"You can vmalloc virtual memory size\"\n mem_vmalloc_used: \"Vmalloc's virtual memory size\"\n mem_write_back: \"The memory size of the disk is being written back to the disk\"\n mem_write_back_tmp: \"Fuse is used to temporarily write back the memory of the buffer area\"\n\n net_bytes_recv: \"Total inbound traffic(bytes) of network card\"\n net_bytes_sent: \"Total outbound traffic(bytes) of network card\"\n net_bits_recv: \"Total inbound traffic(bits) of network card\"\n net_bits_sent: \"Total outbound traffic(bits) of network card\"\n net_drop_in: \"The number of packets for network cards\"\n net_drop_out: \"The number of packets issued by the network card\"\n net_err_in: \"The number of incorrect packets of the network card\"\n net_err_out: \"Number of incorrect number of network cards\"\n net_packets_recv: \"Net card collection quantity\"\n net_packets_sent: \"Number of network card issuance\"\n\n netstat_tcp_established: \"ESTABLISHED status network link number\"\n netstat_tcp_fin_wait1: \"FIN _ WAIT1 status network link number\"\n netstat_tcp_fin_wait2: \"FIN _ WAIT2 status number of network links\"\n netstat_tcp_last_ack: \"LAST_ ACK status number of network links\"\n netstat_tcp_listen: \"Number of network links in Listen status\"\n netstat_tcp_syn_recv: \"SYN _ RECV status number of network links\"\n netstat_tcp_syn_sent: \"SYN _ SENT status number of network links\"\n netstat_tcp_time_wait: \"Time _ WAIT status network link number\"\n netstat_udp_socket: \"Number of network links in UDP status\"\n\n processes_blocked: \"The number of processes in the unreproducible sleep state('U','D','L')\"\n processes_dead: \"Number of processes in recycling('X')\"\n processes_idle: \"Number of idle processes hanging('I')\"\n processes_paging: \"Number of paging processes('P')\"\n processes_running: \"Number of processes during operation('R')\"\n processes_sleeping: \"Can interrupt the number of processes('S')\"\n processes_stopped: \"Pushing status process number('T')\"\n processes_total: \"Total process number\"\n processes_total_threads: \"Number of threads\"\n processes_unknown: \"Unknown status process number\"\n processes_zombies: \"Number of zombies('Z')\"\n\n swap_used_percent: \"SWAP space replace the data volume\"\n\n system_load1: \"1 minute average load value\"\n system_load5: \"5 minutes average load value\"\n system_load15: \"15 minutes average load value\"\n system_load_norm_1: \"1 minute average load value/logical CPU number\"\n system_load_norm_5: \"5 minutes average load value/logical CPU number\"\n system_load_norm_15: \"15 minutes average load value/logical CPU number\"\n system_n_users: \"User number\"\n system_n_cpus: \"CPU nuclear number\"\n system_uptime: \"System startup time\"\n\n nginx_accepts: \"Since Nginx started, the total number of connections has been established with the client\"\n nginx_active: \"The current number of activity connections that Nginx is being processed is equal to Reading/Writing/Waiting\"\n nginx_handled: \"Starting from Nginx, the total number of client connections that have been processed\"\n nginx_reading: \"Reading the total number of connections on the http request header\"\n nginx_requests: \"Since nginx is started, the total number of client requests processed, due to the existence of HTTP Keep-Alive requests, this value will be greater than the handled value\"\n nginx_upstream_check_fall: \"UPStream_CHECK module detects the number of back -end failures\"\n nginx_upstream_check_rise: \"UPSTREAM _ Check module to detect the number of back -end\"\n nginx_upstream_check_status_code: \"The state of the backstream is 1, and the down is 0\"\n nginx_waiting: \"When keep-alive is enabled, this value is equal to active – (reading+writing), which means that Nginx has processed the resident connection that is waiting for the next request command\"\n nginx_writing: \"The total number of connections to send a response to the client\"\n\n http_response_content_length: \"HTTP message entity transmission length\"\n http_response_http_response_code: \"http response status code\"\n http_response_response_time: \"When http ring application\"\n http_response_result_code: \"URL detection result 0 is normal, otherwise the URL cannot be accessed\"\n\n # [mysqld_exporter]\n mysql_global_status_uptime: The number of seconds that the server has been up.(Gauge)\n mysql_global_status_uptime_since_flush_status: The number of seconds since the most recent FLUSH STATUS statement.(Gauge)\n mysql_global_status_queries: The number of statements executed by the server. This variable includes statements executed within stored programs, unlike the Questions variable. It does not count COM_PING or COM_STATISTICS commands.(Counter)\n mysql_global_status_threads_connected: The number of currently open connections.(Counter)\n mysql_global_status_connections: The number of connection attempts (successful or not) to the MySQL server.(Gauge)\n mysql_global_status_max_used_connections: The maximum number of connections that have been in use simultaneously since the server started.(Gauge)\n mysql_global_status_threads_running: The number of threads that are not sleeping.(Gauge)\n mysql_global_status_questions: The number of statements executed by the server. This includes only statements sent to the server by clients and not statements executed within stored programs, unlike the Queries variable. This variable does not count COM_PING, COM_STATISTICS, COM_STMT_PREPARE, COM_STMT_CLOSE, or COM_STMT_RESET commands.(Counter)\n mysql_global_status_threads_cached: The number of threads in the thread cache.(Counter)\n mysql_global_status_threads_created: The number of threads created to handle connections. If Threads_created is big, you may want to increase the thread_cache_size value. The cache miss rate can be calculated as Threads_created/Connections.(Counter)\n mysql_global_status_created_tmp_tables: The number of internal temporary tables created by the server while executing statements.(Counter)\n mysql_global_status_created_tmp_disk_tables: The number of internal on-disk temporary tables created by the server while executing statements. You can compare the number of internal on-disk temporary tables created to the total number of internal temporary tables created by comparing Created_tmp_disk_tables and Created_tmp_tables values.(Counter)\n mysql_global_status_created_tmp_files: How many temporary files mysqld has created.(Counter)\n mysql_global_status_select_full_join: The number of joins that perform table scans because they do not use indexes. If this value is not 0, you should carefully check the indexes of your tables.(Counter)\n mysql_global_status_select_full_range_join: The number of joins that used a range search on a reference table.(Counter)\n mysql_global_status_select_range: The number of joins that used ranges on the first table. This is normally not a critical issue even if the value is quite large.(Counter)\n mysql_global_status_select_range_check: The number of joins without keys that check for key usage after each row. If this is not 0, you should carefully check the indexes of your tables.(Counter)\n mysql_global_status_select_scan: The number of joins that did a full scan of the first table.(Counter)\n mysql_global_status_sort_rows: The number of sorted rows.(Counter)\n mysql_global_status_sort_range: The number of sorts that were done using ranges.(Counter)\n mysql_global_status_sort_merge_passes: The number of merge passes that the sort algorithm has had to do. If this value is large, you should consider increasing the value of the sort_buffer_size system variable.(Counter)\n mysql_global_status_sort_scan: The number of sorts that were done by scanning the table.(Counter)\n mysql_global_status_slow_queries: The number of queries that have taken more than long_query_time seconds. This counter increments regardless of whether the slow query log is enabled.(Counter)\n mysql_global_status_aborted_connects: The number of failed attempts to connect to the MySQL server.(Counter)\n mysql_global_status_aborted_clients: The number of connections that were aborted because the client died without closing the connection properly.(Counter)\n mysql_global_status_table_locks_immediate: The number of times that a request for a table lock could be granted immediately. Locks Immediate rising and falling is normal activity.(Counter)\n mysql_global_status_table_locks_waited: The number of times that a request for a table lock could not be granted immediately and a wait was needed. If this is high and you have performance problems, you should first optimize your queries, and then either split your table or tables or use replication.(Counter)\n mysql_global_status_bytes_received: The number of bytes received from all clients.(Counter)\n mysql_global_status_bytes_sent: The number of bytes sent to all clients.(Counter)\n mysql_global_status_innodb_page_size: InnoDB page size (default 16KB). Many values are counted in pages; the page size enables them to be easily converted to bytes.(Gauge)\n mysql_global_status_buffer_pool_pages: The number of pages in the InnoDB buffer pool.(Gauge)\n mysql_global_status_commands_total: The number of times each xxx statement has been executed.(Counter)\n mysql_global_status_handlers_total: Handler statistics are internal statistics on how MySQL is selecting, updating, inserting, and modifying rows, tables, and indexes. This is in fact the layer between the Storage Engine and MySQL.(Counter)\n mysql_global_status_opened_files: The number of files that have been opened with my_open() (a mysys library function). Parts of the server that open files without using this function do not increment the count.(Counter)\n mysql_global_status_open_tables: The number of tables that are open.(Gauge)\n mysql_global_status_opened_tables: The number of tables that have been opened. If Opened_tables is big, your table_open_cache value is probably too small.(Counter)\n mysql_global_status_table_open_cache_hits: The number of hits for open tables cache lookups.(Counter)\n mysql_global_status_table_open_cache_misses: The number of misses for open tables cache lookups.(Counter)\n mysql_global_status_table_open_cache_overflows: The number of overflows for the open tables cache.(Counter)\n mysql_global_status_innodb_num_open_files: The number of files InnoDB currently holds open.(Gauge)\n mysql_global_status_connection_errors_total: These variables provide information about errors that occur during the client connection process.(Counter)\n mysql_global_status_innodb_buffer_pool_read_requests: The number of logical read requests.(Counter)\n mysql_global_status_innodb_buffer_pool_reads: The number of logical reads that InnoDB could not satisfy from the buffer pool, and had to read directly from disk.(Counter)\n\n mysql_global_variables_thread_cache_size: How many threads the server should cache for reuse.(Gauge)\n mysql_global_variables_max_connections: The maximum permitted number of simultaneous client connections.(Gauge)\n mysql_global_variables_innodb_buffer_pool_size: The size in bytes of the buffer pool, the memory area where InnoDB caches table and index data. The default value is 134217728 bytes (128MB).(Gauge)\n mysql_global_variables_innodb_log_buffer_size: The size in bytes of the buffer that InnoDB uses to write to the log files on disk.(Gauge)\n mysql_global_variables_key_buffer_size: Index blocks for MyISAM tables are buffered and are shared by all threads.(Gauge)\n mysql_global_variables_query_cache_size: The amount of memory allocated for caching query results.(Gauge)\n mysql_global_variables_table_open_cache: The number of open tables for all threads.(Gauge)\n mysql_global_variables_open_files_limit: The number of file descriptors available to mysqld from the operating system.(Gauge)\n\n # [redis_exporter]\n redis_active_defrag_running: When activedefrag is enabled, this indicates whether defragmentation is currently active, and the CPU percentage it intends to utilize.\n redis_allocator_active_bytes: Total bytes in the allocator active pages, this includes external-fragmentation.\n redis_allocator_allocated_bytes: Total bytes allocated form the allocator, including internal-fragmentation. Normally the same as used_memory.\n redis_allocator_frag_bytes: Delta between allocator_active and allocator_allocated. See note about mem_fragmentation_bytes.\n redis_allocator_frag_ratio: Ratio between allocator_active and allocator_allocated. This is the true (external) fragmentation metric (not mem_fragmentation_ratio).\n redis_allocator_resident_bytes: Total bytes resident (RSS) in the allocator, this includes pages that can be released to the OS (by MEMORY PURGE, or just waiting).\n redis_allocator_rss_bytes: Delta between allocator_resident and allocator_active.\n redis_allocator_rss_ratio: Ratio between allocator_resident and allocator_active. This usually indicates pages that the allocator can and probably will soon release back to the OS.\n redis_aof_current_rewrite_duration_sec: Duration of the on-going AOF rewrite operation if any.\n redis_aof_enabled: Flag indicating AOF logging is activated.\n redis_aof_last_bgrewrite_status: Status of the last AOF rewrite operation.\n redis_aof_last_cow_size_bytes: The size in bytes of copy-on-write memory during the last AOF rewrite operation.\n redis_aof_last_rewrite_duration_sec: Duration of the last AOF rewrite operation in seconds.\n redis_aof_last_write_status: Status of the last write operation to the AOF.\n redis_aof_rewrite_in_progress: Flag indicating a AOF rewrite operation is on-going.\n redis_aof_rewrite_scheduled: Flag indicating an AOF rewrite operation will be scheduled once the on-going RDB save is complete.\n redis_blocked_clients: Number of clients pending on a blocking call (BLPOP, BRPOP, BRPOPLPUSH, BLMOVE, BZPOPMIN, BZPOPMAX).\n redis_client_recent_max_input_buffer_bytes: Biggest input buffer among current client connections.\n redis_client_recent_max_output_buffer_bytes: Biggest output buffer among current client connections.\n redis_cluster_enabled: Indicate Redis cluster is enabled.\n redis_commands_duration_seconds_total: The total CPU time consumed by these commands.(Counter)\n redis_commands_processed_total: Total number of commands processed by the server.(Counter)\n redis_commands_total: The number of calls that reached command execution (not rejected).(Counter)\n redis_config_maxclients: The value of the maxclients configuration directive. This is the upper limit for the sum of connected_clients, connected_slaves and cluster_connections.\n redis_config_maxmemory: The value of the maxmemory configuration directive.\n redis_connected_clients: Number of client connections (excluding connections from replicas).\n redis_connected_slaves: Number of connected replicas.\n redis_connections_received_total: Total number of connections accepted by the server.(Counter)\n redis_cpu_sys_children_seconds_total: System CPU consumed by the background processes.(Counter)\n redis_cpu_sys_seconds_total: System CPU consumed by the Redis server, which is the sum of system CPU consumed by all threads of the server process (main thread and background threads).(Counter)\n redis_cpu_user_children_seconds_total: User CPU consumed by the background processes.(Counter)\n redis_cpu_user_seconds_total: User CPU consumed by the Redis server, which is the sum of user CPU consumed by all threads of the server process (main thread and background threads).(Counter)\n redis_db_keys: Total number of keys by DB.\n redis_db_keys_expiring: Total number of expiring keys by DB\n redis_defrag_hits: Number of value reallocations performed by active the defragmentation process.\n redis_defrag_misses: Number of aborted value reallocations started by the active defragmentation process.\n redis_defrag_key_hits: Number of keys that were actively defragmented.\n redis_defrag_key_misses: Number of keys that were skipped by the active defragmentation process.\n redis_evicted_keys_total: Number of evicted keys due to maxmemory limit.(Counter)\n redis_expired_keys_total: Total number of key expiration events.(Counter)\n redis_expired_stale_percentage: The percentage of keys probably expired.\n redis_expired_time_cap_reached_total: The count of times that active expiry cycles have stopped early.\n redis_exporter_last_scrape_connect_time_seconds: The duration(in seconds) to connect when scrape.\n redis_exporter_last_scrape_duration_seconds: The last scrape duration.\n redis_exporter_last_scrape_error: The last scrape error status.\n redis_exporter_scrape_duration_seconds_count: Durations of scrapes by the exporter\n redis_exporter_scrape_duration_seconds_sum: Durations of scrapes by the exporter\n redis_exporter_scrapes_total: Current total redis scrapes.(Counter)\n redis_instance_info: Information about the Redis instance.\n redis_keyspace_hits_total: Hits total.(Counter)\n redis_keyspace_misses_total: Misses total.(Counter)\n redis_last_key_groups_scrape_duration_milliseconds: Duration of the last key group metrics scrape in milliseconds.\n redis_last_slow_execution_duration_seconds: The amount of time needed for last slow execution, in seconds.\n redis_latest_fork_seconds: The amount of time needed for last fork, in seconds.\n redis_lazyfree_pending_objects: The number of objects waiting to be freed (as a result of calling UNLINK, or FLUSHDB and FLUSHALL with the ASYNC option).\n redis_master_repl_offset: The server's current replication offset.\n redis_mem_clients_normal: Memory used by normal clients.(Gauge)\n redis_mem_clients_slaves: Memory used by replica clients - Starting Redis 7.0, replica buffers share memory with the replication backlog, so this field can show 0 when replicas don't trigger an increase of memory usage.\n redis_mem_fragmentation_bytes: Delta between used_memory_rss and used_memory. Note that when the total fragmentation bytes is low (few megabytes), a high ratio (e.g. 1.5 and above) is not an indication of an issue.\n redis_mem_fragmentation_ratio: Ratio between used_memory_rss and used_memory. Note that this doesn't only includes fragmentation, but also other process overheads (see the allocator_* metrics), and also overheads like code, shared libraries, stack, etc.\n redis_mem_not_counted_for_eviction_bytes: (Gauge)\n redis_memory_max_bytes: Max memory limit in bytes.\n redis_memory_used_bytes: Total number of bytes allocated by Redis using its allocator (either standard libc, jemalloc, or an alternative allocator such as tcmalloc)\n redis_memory_used_dataset_bytes: The size in bytes of the dataset (used_memory_overhead subtracted from used_memory)\n redis_memory_used_lua_bytes: Number of bytes used by the Lua engine.\n redis_memory_used_overhead_bytes: The sum in bytes of all overheads that the server allocated for managing its internal data structures.\n redis_memory_used_peak_bytes: Peak memory consumed by Redis (in bytes)\n redis_memory_used_rss_bytes: Number of bytes that Redis allocated as seen by the operating system (a.k.a resident set size). This is the number reported by tools such as top(1) and ps(1)\n redis_memory_used_scripts_bytes: Number of bytes used by cached Lua scripts\n redis_memory_used_startup_bytes: Initial amount of memory consumed by Redis at startup in bytes\n redis_migrate_cached_sockets_total: The number of sockets open for MIGRATE purposes\n redis_net_input_bytes_total: Total input bytes(Counter)\n redis_net_output_bytes_total: Total output bytes(Counter)\n redis_process_id: Process ID\n redis_pubsub_channels: Global number of pub/sub channels with client subscriptions\n redis_pubsub_patterns: Global number of pub/sub pattern with client subscriptions\n redis_rdb_bgsave_in_progress: Flag indicating a RDB save is on-going\n redis_rdb_changes_since_last_save: Number of changes since the last dump\n redis_rdb_current_bgsave_duration_sec: Duration of the on-going RDB save operation if any\n redis_rdb_last_bgsave_duration_sec: Duration of the last RDB save operation in seconds\n redis_rdb_last_bgsave_status: Status of the last RDB save operation\n redis_rdb_last_cow_size_bytes: The size in bytes of copy-on-write memory during the last RDB save operation\n redis_rdb_last_save_timestamp_seconds: Epoch-based timestamp of last successful RDB save\n redis_rejected_connections_total: Number of connections rejected because of maxclients limit(Counter)\n redis_repl_backlog_first_byte_offset: The master offset of the replication backlog buffer\n redis_repl_backlog_history_bytes: Size in bytes of the data in the replication backlog buffer\n redis_repl_backlog_is_active: Flag indicating replication backlog is active\n redis_replica_partial_resync_accepted: The number of accepted partial resync requests(Gauge)\n redis_replica_partial_resync_denied: The number of denied partial resync requests(Gauge)\n redis_replica_resyncs_full: The number of full resyncs with replicas\n redis_replication_backlog_bytes: Memory used by replication backlog\n redis_second_repl_offset: The offset up to which replication IDs are accepted.\n redis_slave_expires_tracked_keys: The number of keys tracked for expiry purposes (applicable only to writable replicas)(Gauge)\n redis_slowlog_last_id: Last id of slowlog\n redis_slowlog_length: Total slowlog\n redis_start_time_seconds: Start time of the Redis instance since unix epoch in seconds.\n redis_target_scrape_request_errors_total: Errors in requests to the exporter\n redis_up: Flag indicating redis instance is up\n redis_uptime_in_seconds: Number of seconds since Redis server start\n\n # [windows_exporter]\n windows_cpu_clock_interrupts_total: Total number of received and serviced clock tick interrupts(counter)\n windows_cpu_core_frequency_mhz: Core frequency in megahertz(gauge)\n windows_cpu_cstate_seconds_total: Time spent in low-power idle state(counter)\n windows_cpu_dpcs_total: Total number of received and serviced deferred procedure calls (DPCs)(counter)\n windows_cpu_idle_break_events_total: Total number of time processor was woken from idle(counter)\n windows_cpu_interrupts_total: Total number of received and serviced hardware interrupts(counter)\n windows_cpu_parking_status: Parking Status represents whether a processor is parked or not(gauge)\n windows_cpu_processor_performance: Processor Performance is the average performance of the processor while it is executing instructions, as a percentage of the nominal performance of the processor. On some processors, Processor Performance may exceed 100%(gauge)\n windows_cpu_time_total: Time that processor spent in different modes (idle, user, system, ...)(counter)\n windows_cs_hostname: Labeled system hostname information as provided by ComputerSystem.DNSHostName and ComputerSystem.Domain(gauge)\n windows_cs_logical_processors: ComputerSystem.NumberOfLogicalProcessors(gauge)\n windows_cs_physical_memory_bytes: ComputerSystem.TotalPhysicalMemory(gauge)\n windows_exporter_build_info: A metric with a constant '1' value labeled by version, revision, branch, and goversion from which windows_exporter was built.(gauge)\n windows_exporter_collector_duration_seconds: Duration of a collection.(gauge)\n windows_exporter_collector_success: Whether the collector was successful.(gauge)\n windows_exporter_collector_timeout: Whether the collector timed out.(gauge)\n windows_exporter_perflib_snapshot_duration_seconds: Duration of perflib snapshot capture(gauge)\n windows_logical_disk_free_bytes: Free space in bytes (LogicalDisk.PercentFreeSpace)(gauge)\n windows_logical_disk_idle_seconds_total: Seconds that the disk was idle (LogicalDisk.PercentIdleTime)(counter)\n windows_logical_disk_read_bytes_total: The number of bytes transferred from the disk during read operations (LogicalDisk.DiskReadBytesPerSec)(counter)\n windows_logical_disk_read_latency_seconds_total: Shows the average time, in seconds, of a read operation from the disk (LogicalDisk.AvgDiskSecPerRead)(counter)\n windows_logical_disk_read_seconds_total: Seconds that the disk was busy servicing read requests (LogicalDisk.PercentDiskReadTime)(counter)\n windows_logical_disk_read_write_latency_seconds_total: Shows the time, in seconds, of the average disk transfer (LogicalDisk.AvgDiskSecPerTransfer)(counter)\n windows_logical_disk_reads_total: The number of read operations on the disk (LogicalDisk.DiskReadsPerSec)(counter)\n windows_logical_disk_requests_queued: The number of requests queued to the disk (LogicalDisk.CurrentDiskQueueLength)(gauge)\n windows_logical_disk_size_bytes: Total space in bytes (LogicalDisk.PercentFreeSpace_Base)(gauge)\n windows_logical_disk_split_ios_total: The number of I/Os to the disk were split into multiple I/Os (LogicalDisk.SplitIOPerSec)(counter)\n windows_logical_disk_write_bytes_total: The number of bytes transferred to the disk during write operations (LogicalDisk.DiskWriteBytesPerSec)(counter)\n windows_logical_disk_write_latency_seconds_total: Shows the average time, in seconds, of a write operation to the disk (LogicalDisk.AvgDiskSecPerWrite)(counter)\n windows_logical_disk_write_seconds_total: Seconds that the disk was busy servicing write requests (LogicalDisk.PercentDiskWriteTime)(counter)\n windows_logical_disk_writes_total: The number of write operations on the disk (LogicalDisk.DiskWritesPerSec)(counter)\n windows_net_bytes_received_total: (Network.BytesReceivedPerSec)(counter)\n windows_net_bytes_sent_total: (Network.BytesSentPerSec)(counter)\n windows_net_bytes_total: (Network.BytesTotalPerSec)(counter)\n windows_net_current_bandwidth: (Network.CurrentBandwidth)(gauge)\n windows_net_packets_outbound_discarded_total: (Network.PacketsOutboundDiscarded)(counter)\n windows_net_packets_outbound_errors_total: (Network.PacketsOutboundErrors)(counter)\n windows_net_packets_received_discarded_total: (Network.PacketsReceivedDiscarded)(counter)\n windows_net_packets_received_errors_total: (Network.PacketsReceivedErrors)(counter)\n windows_net_packets_received_total: (Network.PacketsReceivedPerSec)(counter)\n windows_net_packets_received_unknown_total: (Network.PacketsReceivedUnknown)(counter)\n windows_net_packets_sent_total: (Network.PacketsSentPerSec)(counter)\n windows_net_packets_total: (Network.PacketsPerSec)(counter)\n windows_os_info: OperatingSystem.Caption, OperatingSystem.Version(gauge)\n windows_os_paging_free_bytes: OperatingSystem.FreeSpaceInPagingFiles(gauge)\n windows_os_paging_limit_bytes: OperatingSystem.SizeStoredInPagingFiles(gauge)\n windows_os_physical_memory_free_bytes: OperatingSystem.FreePhysicalMemory(gauge)\n windows_os_process_memory_limix_bytes: OperatingSystem.MaxProcessMemorySize(gauge)\n windows_os_processes: OperatingSystem.NumberOfProcesses(gauge)\n windows_os_processes_limit: OperatingSystem.MaxNumberOfProcesses(gauge)\n windows_os_time: OperatingSystem.LocalDateTime(gauge)\n windows_os_timezone: OperatingSystem.LocalDateTime(gauge)\n windows_os_users: OperatingSystem.NumberOfUsers(gauge)\n windows_os_virtual_memory_bytes: OperatingSystem.TotalVirtualMemorySize(gauge)\n windows_os_virtual_memory_free_bytes: OperatingSystem.FreeVirtualMemory(gauge)\n windows_os_visible_memory_bytes: OperatingSystem.TotalVisibleMemorySize(gauge)\n windows_service_info: A metric with a constant '1' value labeled with service information(gauge)\n windows_service_start_mode: The start mode of the service (StartMode)(gauge)\n windows_service_state: The state of the service (State)(gauge)\n windows_service_status: The status of the service (Status)(gauge)\n windows_system_context_switches_total: Total number of context switches (WMI source is PerfOS_System.ContextSwitchesPersec)(counter)\n windows_system_exception_dispatches_total: Total number of exceptions dispatched (WMI source is PerfOS_System.ExceptionDispatchesPersec)(counter)\n windows_system_processor_queue_length: Length of processor queue (WMI source is PerfOS_System.ProcessorQueueLength)(gauge)\n windows_system_system_calls_total: Total number of system calls (WMI source is PerfOS_System.SystemCallsPersec)(counter)\n windows_system_system_up_time: System boot time (WMI source is PerfOS_System.SystemUpTime)(gauge)\n windows_system_threads: Current number of threads (WMI source is PerfOS_System.Threads)(gauge)\n\n # [node_exporter]\n # SYSTEM\n # CPU context switch 次数\n node_context_switches_total: context_switches\n # Interrupts 次数\n node_intr_total: Interrupts\n # 运行的进程数\n node_procs_running: Processes in runnable state\n # 熵池大小\n node_entropy_available_bits: Entropy available to random number generators\n node_time_seconds: System time in seconds since epoch (1970)\n node_boot_time_seconds: Node boot time, in unixtime\n # CPU\n node_cpu_seconds_total: Seconds the CPUs spent in each mode\n node_load1: cpu load 1m\n node_load5: cpu load 5m\n node_load15: cpu load 15m\n\n # MEM\n # 内核态\n # 内核用于缓存数据结构供自己使用的内存\n node_memory_Slab_bytes: Memory used by the kernel to cache data structures for its own use\n # slab中可回收的部分\n node_memory_SReclaimable_bytes: SReclaimable - Part of Slab, that might be reclaimed, such as caches\n # slab中不可回收的部分\n node_memory_SUnreclaim_bytes: Part of Slab, that cannot be reclaimed on memory pressure\n # Vmalloc内存区的大小\n node_memory_VmallocTotal_bytes: Total size of vmalloc memory area\n # vmalloc已分配的内存,虚拟地址空间上的连续的内存\n node_memory_VmallocUsed_bytes: Amount of vmalloc area which is used\n # vmalloc区可用的连续最大快的大小,通过此指标可以知道vmalloc可分配连续内存的最大值\n node_memory_VmallocChunk_bytes: Largest contiguous block of vmalloc area which is free\n # 内存的硬件故障删除掉的内存页的总大小\n node_memory_HardwareCorrupted_bytes: Amount of RAM that the kernel identified as corrupted / not working\n # 用于在虚拟和物理内存地址之间映射的内存\n node_memory_PageTables_bytes: Memory used to map between virtual and physical memory addresses (gauge)\n # 内核栈内存,常驻内存,不可回收\n node_memory_KernelStack_bytes: Kernel memory stack. This is not reclaimable\n # 用来访问高端内存,复制高端内存的临时buffer,称为“bounce buffering”,会降低I/O 性能\n node_memory_Bounce_bytes: Memory used for block device bounce buffers\n #用户态\n # 单个巨页大小\n node_memory_Hugepagesize_bytes: Huge Page size\n # 系统分配的常驻巨页数\n node_memory_HugePages_Total: Total size of the pool of huge pages\n # 系统空闲的巨页数\n node_memory_HugePages_Free: Huge pages in the pool that are not yet allocated\n # 进程已申请但未使用的巨页数\n node_memory_HugePages_Rsvd: Huge pages for which a commitment to allocate from the pool has been made, but no allocation\n # 超过系统设定的常驻HugePages数量的个数\n node_memory_HugePages_Surp: Huge pages in the pool above the value in /proc/sys/vm/nr_hugepages\n # 透明巨页 Transparent HugePages (THP)\n node_memory_AnonHugePages_bytes: Memory in anonymous huge pages\n # inactivelist中的File-backed内存\n node_memory_Inactive_file_bytes: File-backed memory on inactive LRU list\n # inactivelist中的Anonymous内存\n node_memory_Inactive_anon_bytes: Anonymous and swap cache on inactive LRU list, including tmpfs (shmem)\n # activelist中的File-backed内存\n node_memory_Active_file_bytes: File-backed memory on active LRU list\n # activelist中的Anonymous内存\n node_memory_Active_anon_bytes: Anonymous and swap cache on active least-recently-used (LRU) list, including tmpfs\n # 禁止换出的页,对应 Unevictable 链表\n node_memory_Unevictable_bytes: Amount of unevictable memory that can't be swapped out for a variety of reasons\n # 共享内存\n node_memory_Shmem_bytes: Used shared memory (shared between several processes, thus including RAM disks)\n # 匿名页内存大小\n node_memory_AnonPages_bytes: Memory in user pages not backed by files\n # 被关联的内存页大小\n node_memory_Mapped_bytes: Used memory in mapped pages files which have been mapped, such as libraries\n # file-backed内存页缓存大小\n node_memory_Cached_bytes: Parked file data (file content) cache\n # 系统中有多少匿名页曾经被swap-out、现在又被swap-in并且swap-in之后页面中的内容一直没发生变化\n node_memory_SwapCached_bytes: Memory that keeps track of pages that have been fetched from swap but not yet been modified\n # 被mlock()系统调用锁定的内存大小\n node_memory_Mlocked_bytes: Size of pages locked to memory using the mlock() system call\n # 块设备(block device)所占用的缓存页\n node_memory_Buffers_bytes: Block device (e.g. harddisk) cache\n node_memory_SwapTotal_bytes: Memory information field SwapTotal_bytes\n node_memory_SwapFree_bytes: Memory information field SwapFree_bytes\n\n # DISK\n node_filesystem_avail_bytes: Filesystem space available to non-root users in byte\n node_filesystem_free_bytes: Filesystem free space in bytes\n node_filesystem_size_bytes: Filesystem size in bytes\n node_filesystem_files_free: Filesystem total free file nodes\n node_filesystem_files: Filesystem total free file nodes\n node_filefd_maximum: Max open files\n node_filefd_allocated: Open files\n node_filesystem_readonly: Filesystem read-only status\n node_filesystem_device_error: Whether an error occurred while getting statistics for the given device\n node_disk_reads_completed_total: The total number of reads completed successfully\n node_disk_writes_completed_total: The total number of writes completed successfully\n node_disk_reads_merged_total: The number of reads merged\n node_disk_writes_merged_total: The number of writes merged\n node_disk_read_bytes_total: The total number of bytes read successfully\n node_disk_written_bytes_total: The total number of bytes written successfully\n node_disk_io_time_seconds_total: Total seconds spent doing I/Os\n node_disk_read_time_seconds_total: The total number of seconds spent by all reads\n node_disk_write_time_seconds_total: The total number of seconds spent by all writes\n node_disk_io_time_weighted_seconds_total: The weighted of seconds spent doing I/Os\n\n # NET\n node_network_receive_bytes_total: Network device statistic receive_bytes (counter)\n node_network_transmit_bytes_total: Network device statistic transmit_bytes (counter)\n node_network_receive_packets_total: Network device statistic receive_bytes\n node_network_transmit_packets_total: Network device statistic transmit_bytes\n node_network_receive_errs_total: Network device statistic receive_errs\n node_network_transmit_errs_total: Network device statistic transmit_errs\n node_network_receive_drop_total: Network device statistic receive_drop\n node_network_transmit_drop_total: Network device statistic transmit_drop\n node_nf_conntrack_entries: Number of currently allocated flow entries for connection tracking\n node_sockstat_TCP_alloc: Number of TCP sockets in state alloc\n node_sockstat_TCP_inuse: Number of TCP sockets in state inuse\n node_sockstat_TCP_orphan: Number of TCP sockets in state orphan\n node_sockstat_TCP_tw: Number of TCP sockets in state tw\n node_netstat_Tcp_CurrEstab: Statistic TcpCurrEstab\n node_sockstat_sockets_used: Number of IPv4 sockets in use\n\n # [kafka_exporter]\n kafka_brokers: count of kafka_brokers (gauge)\n kafka_topic_partitions: Number of partitions for this Topic (gauge)\n kafka_topic_partition_current_offset: Current Offset of a Broker at Topic/Partition (gauge)\n kafka_consumergroup_current_offset: Current Offset of a ConsumerGroup at Topic/Partition (gauge)\n kafka_consumer_lag_millis: Current approximation of consumer lag for a ConsumerGroup at Topic/Partition (gauge)\n kafka_topic_partition_under_replicated_partition: 1 if Topic/Partition is under Replicated\n\n # [zookeeper_exporter]\n zk_znode_count: The total count of znodes stored\n zk_ephemerals_count: The number of Ephemerals nodes\n zk_watch_count: The number of watchers setup over Zookeeper nodes.\n zk_approximate_data_size: Size of data in bytes that a zookeeper server has in its data tree\n zk_outstanding_requests: Number of currently executing requests\n zk_packets_sent: Count of the number of zookeeper packets sent from a server\n zk_packets_received: Count of the number of zookeeper packets received by a server\n zk_num_alive_connections: Number of active clients connected to a zookeeper server\n zk_open_file_descriptor_count: Number of file descriptors that a zookeeper server has open\n zk_max_file_descriptor_count: Maximum number of file descriptors that a zookeeper server can open\n zk_avg_latency: Average time in milliseconds for requests to be processed\n zk_min_latency: Maximum time in milliseconds for a request to be processed\n zk_max_latency: Minimum time in milliseconds for a request to be processed\n"
},
{
"path": "etc/script/notify.bak.py",
"content": "#!/usr/bin/env python\n# -*- coding: UTF-8 -*-\nimport sys\nimport json\nimport urllib2\nimport smtplib\nfrom email.mime.text import MIMEText\n\nreload(sys)\nsys.setdefaultencoding('utf8')\n\nnotify_channel_funcs = {\n \"email\":\"email\",\n \"sms\":\"sms\",\n \"voice\":\"voice\",\n \"dingtalk\":\"dingtalk\",\n \"wecom\":\"wecom\",\n \"feishu\":\"feishu\"\n}\n\nmail_host = \"smtp.163.com\"\nmail_port = 994\nmail_user = \"ulricqin\"\nmail_pass = \"password\"\nmail_from = \"ulricqin@163.com\"\n\nclass Sender(object):\n @classmethod\n def send_email(cls, payload):\n if mail_user == \"ulricqin\" and mail_pass == \"password\":\n print(\"invalid smtp configuration\")\n return\n\n users = payload.get('event').get(\"notify_users_obj\")\n\n emails = {}\n for u in users:\n if u.get(\"email\"):\n emails[u.get(\"email\")] = 1\n\n if not emails:\n return\n\n recipients = emails.keys()\n mail_body = payload.get('tpls').get(\"email.tpl\", \"email.tpl not found\")\n message = MIMEText(mail_body, 'html', 'utf-8')\n message['From'] = mail_from\n message['To'] = \", \".join(recipients)\n message[\"Subject\"] = payload.get('tpls').get(\"subject.tpl\", \"subject.tpl not found\")\n\n try:\n smtp = smtplib.SMTP_SSL(mail_host, mail_port)\n smtp.login(mail_user, mail_pass)\n smtp.sendmail(mail_from, recipients, message.as_string())\n smtp.close()\n except smtplib.SMTPException, error:\n print(error)\n\n @classmethod\n def send_wecom(cls, payload):\n users = payload.get('event').get(\"notify_users_obj\")\n\n tokens = {}\n\n for u in users:\n contacts = u.get(\"contacts\")\n if contacts.get(\"wecom_robot_token\", \"\"):\n tokens[contacts.get(\"wecom_robot_token\", \"\")] = 1\n\n opener = urllib2.build_opener(urllib2.HTTPHandler())\n method = \"POST\"\n\n for t in tokens:\n url = \"https://qyapi.weixin.qq.com/cgi-bin/webhook/send?key={}\".format(t)\n body = {\n \"msgtype\": \"markdown\",\n \"markdown\": {\n \"content\": payload.get('tpls').get(\"wecom.tpl\", \"wecom.tpl not found\")\n }\n }\n request = urllib2.Request(url, data=json.dumps(body))\n request.add_header(\"Content-Type\",'application/json;charset=utf-8')\n request.get_method = lambda: method\n try:\n connection = opener.open(request)\n print(connection.read())\n except urllib2.HTTPError, error:\n print(error)\n\n @classmethod\n def send_dingtalk(cls, payload):\n event = payload.get('event')\n users = event.get(\"notify_users_obj\")\n\n rule_name = event.get(\"rule_name\")\n event_state = \"Triggered\"\n if event.get(\"is_recovered\"):\n event_state = \"Recovered\"\n\n tokens = {}\n phones = {}\n\n for u in users:\n if u.get(\"phone\"):\n phones[u.get(\"phone\")] = 1\n\n contacts = u.get(\"contacts\")\n if contacts.get(\"dingtalk_robot_token\", \"\"):\n tokens[contacts.get(\"dingtalk_robot_token\", \"\")] = 1\n\n opener = urllib2.build_opener(urllib2.HTTPHandler())\n method = \"POST\"\n\n for t in tokens:\n url = \"https://oapi.dingtalk.com/robot/send?access_token={}\".format(t)\n body = {\n \"msgtype\": \"markdown\",\n \"markdown\": {\n \"title\": \"{} - {}\".format(event_state, rule_name),\n \"text\": payload.get('tpls').get(\"dingtalk.tpl\", \"dingtalk.tpl not found\") + ' '.join([\"@\"+i for i in phones.keys()])\n },\n \"at\": {\n \"atMobiles\": phones.keys(),\n \"isAtAll\": False\n }\n }\n request = urllib2.Request(url, data=json.dumps(body))\n request.add_header(\"Content-Type\",'application/json;charset=utf-8')\n request.get_method = lambda: method\n try:\n connection = opener.open(request)\n print(connection.read())\n except urllib2.HTTPError, error:\n print(error)\n\n @classmethod\n def send_feishu(cls, payload):\n users = payload.get('event').get(\"notify_users_obj\")\n\n tokens = {}\n phones = {}\n\n for u in users:\n if u.get(\"phone\"):\n phones[u.get(\"phone\")] = 1\n\n contacts = u.get(\"contacts\")\n if contacts.get(\"feishu_robot_token\", \"\"):\n tokens[contacts.get(\"feishu_robot_token\", \"\")] = 1\n\n opener = urllib2.build_opener(urllib2.HTTPHandler())\n method = \"POST\"\n\n for t in tokens:\n url = \"https://open.feishu.cn/open-apis/bot/v2/hook/{}\".format(t)\n body = {\n \"msg_type\": \"text\",\n \"content\": {\n \"text\": payload.get('tpls').get(\"feishu.tpl\", \"feishu.tpl not found\")\n },\n \"at\": {\n \"atMobiles\": phones.keys(),\n \"isAtAll\": False\n }\n }\n request = urllib2.Request(url, data=json.dumps(body))\n request.add_header(\"Content-Type\",'application/json;charset=utf-8')\n request.get_method = lambda: method\n try:\n connection = opener.open(request)\n print(connection.read())\n except urllib2.HTTPError, error:\n print(error)\n\n @classmethod\n def send_sms(cls, payload):\n users = payload.get('event').get(\"notify_users_obj\")\n phones = {}\n for u in users:\n if u.get(\"phone\"):\n phones[u.get(\"phone\")] = 1\n if phones:\n print(\"send_sms not implemented, phones: {}\".format(phones.keys()))\n\n @classmethod\n def send_voice(cls, payload):\n users = payload.get('event').get(\"notify_users_obj\")\n phones = {}\n for u in users:\n if u.get(\"phone\"):\n phones[u.get(\"phone\")] = 1\n if phones:\n print(\"send_voice not implemented, phones: {}\".format(phones.keys()))\n\ndef main():\n payload = json.load(sys.stdin)\n with open(\".payload\", 'w') as f:\n f.write(json.dumps(payload, indent=4))\n for ch in payload.get('event').get('notify_channels'):\n send_func_name = \"send_{}\".format(notify_channel_funcs.get(ch.strip()))\n if not hasattr(Sender, send_func_name):\n print(\"function: {} not found\", send_func_name)\n continue\n send_func = getattr(Sender, send_func_name)\n send_func(payload)\n\ndef hello():\n print(\"hello nightingale\")\n\nif __name__ == \"__main__\":\n if len(sys.argv) == 1:\n main()\n elif sys.argv[1] == \"hello\":\n hello()\n else:\n print(\"I am confused\")"
},
{
"path": "etc/script/notify.py",
"content": "#!/usr/bin/env python3\n# -*- coding: UTF-8 -*-\nimport sys\nimport json\n\nclass Sender(object):\n @classmethod\n def send_email(cls, payload):\n # already done in go code\n pass\n\n @classmethod\n def send_wecom(cls, payload):\n # already done in go code\n pass\n\n @classmethod\n def send_dingtalk(cls, payload):\n # already done in go code\n pass\n\n @classmethod\n def send_feishu(cls, payload):\n # already done in go code\n pass\n\n @classmethod\n def send_mm(cls, payload):\n # already done in go code\n pass\n\n @classmethod\n def send_sms(cls, payload):\n users = payload.get('event').get(\"notify_users_obj\")\n phones = {}\n for u in users:\n if u.get(\"phone\"):\n phones[u.get(\"phone\")] = 1\n if phones:\n print(\"send_sms not implemented, phones: {}\".format(phones.keys()))\n\n @classmethod\n def send_voice(cls, payload):\n users = payload.get('event').get(\"notify_users_obj\")\n phones = {}\n for u in users:\n if u.get(\"phone\"):\n phones[u.get(\"phone\")] = 1\n if phones:\n print(\"send_voice not implemented, phones: {}\".format(phones.keys()))\n\ndef main():\n payload = json.load(sys.stdin)\n with open(\".payload\", 'w') as f:\n f.write(json.dumps(payload, indent=4))\n for ch in payload.get('event').get('notify_channels'):\n send_func_name = \"send_{}\".format(ch.strip())\n if not hasattr(Sender, send_func_name):\n print(\"function: {} not found\", send_func_name)\n continue\n send_func = getattr(Sender, send_func_name)\n send_func(payload)\n\ndef hello():\n print(\"hello nightingale\")\n\nif __name__ == \"__main__\":\n if len(sys.argv) == 1:\n main()\n elif sys.argv[1] == \"hello\":\n hello()\n else:\n print(\"I am confused\")\n"
},
{
"path": "etc/script/notify_feishu.py",
"content": "#!/usr/bin/env python\n# -*- coding: UTF-8 -*-\nimport sys\nimport json\nimport requests\n\nclass Sender(object):\n @classmethod\n def send_email(cls, payload):\n # already done in go code\n pass\n\n @classmethod\n def send_wecom(cls, payload):\n # already done in go code\n pass\n\n @classmethod\n def send_dingtalk(cls, payload):\n # already done in go code\n pass\n\n @classmethod\n def send_ifeishu(cls, payload):\n users = payload.get('event').get(\"notify_users_obj\")\n tokens = {}\n phones = {}\n\n for u in users:\n if u.get(\"phone\"):\n phones[u.get(\"phone\")] = 1\n\n contacts = u.get(\"contacts\")\n if contacts.get(\"feishu_robot_token\", \"\"):\n tokens[contacts.get(\"feishu_robot_token\", \"\")] = 1\n \n headers = {\n \"Content-Type\": \"application/json;charset=utf-8\",\n \"Host\": \"open.feishu.cn\"\n }\n\n for t in tokens:\n url = \"https://open.feishu.cn/open-apis/bot/v2/hook/{}\".format(t)\n body = {\n \"msg_type\": \"text\",\n \"content\": {\n \"text\": payload.get('tpls').get(\"feishu\", \"feishu not found\")\n },\n \"at\": {\n \"atMobiles\": list(phones.keys()),\n \"isAtAll\": False\n }\n }\n\n response = requests.post(url, headers=headers, data=json.dumps(body))\n print(f\"notify_ifeishu: token={t} status_code={response.status_code} response_text={response.text}\")\n\n @classmethod\n def send_mm(cls, payload):\n # already done in go code\n pass\n\n @classmethod\n def send_sms(cls, payload):\n pass\n\n @classmethod\n def send_voice(cls, payload):\n pass\n\ndef main():\n payload = json.load(sys.stdin)\n with open(\".payload\", 'w') as f:\n f.write(json.dumps(payload, indent=4))\n for ch in payload.get('event').get('notify_channels'):\n send_func_name = \"send_{}\".format(ch.strip())\n if not hasattr(Sender, send_func_name):\n print(\"function: {} not found\", send_func_name)\n continue\n send_func = getattr(Sender, send_func_name)\n send_func(payload)\n\ndef hello():\n print(\"hello nightingale\")\n\nif __name__ == \"__main__\":\n if len(sys.argv) == 1:\n main()\n elif sys.argv[1] == \"hello\":\n hello()\n else:\n print(\"I am confused\")"
},
{
"path": "etc/script/rule_converter.py",
"content": "import json\nimport yaml\n\n'''\n将promtheus/vmalert的rule转换为n9e中的rule\n支持k8s的rule configmap\n'''\n\nrule_file = 'rules.yaml'\n\n\ndef convert_interval(interval):\n if interval.endswith('s') or interval.endswith('S'):\n return int(interval[:-1])\n if interval.endswith('m') or interval.endswith('M'):\n return int(interval[:-1]) * 60\n if interval.endswith('h') or interval.endswith('H'):\n return int(interval[:-1]) * 60 * 60\n if interval.endswith('d') or interval.endswith('D'):\n return int(interval[:-1]) * 60 * 60 * 24\n return int(interval)\n\n\ndef convert_alert(rule, interval):\n name = rule['alert']\n prom_ql = rule['expr']\n if 'for' in rule:\n prom_for_duration = convert_interval(rule['for'])\n else:\n prom_for_duration = 0\n\n prom_eval_interval = convert_interval(interval)\n note = ''\n if 'annotations' in rule:\n for v in rule['annotations'].values():\n note = v\n break\n \n annotations = {}\n if 'annotations' in rule:\n for k, v in rule['annotations'].items():\n annotations[k] = v\n \n\n append_tags = []\n severity = 2\n if 'labels' in rule:\n for k, v in rule['labels'].items():\n if k != 'severity':\n append_tags.append('{}={}'.format(k, v))\n continue\n if v == 'critical':\n severity = 1\n elif v == 'info':\n severity = 3\n # elif v == 'warning':\n # severity = 2\n\n \n n9e_alert_rule = {\n \"name\": name,\n \"note\": note,\n \"severity\": severity,\n \"disabled\": 0,\n \"prom_for_duration\": prom_for_duration,\n \"prom_ql\": prom_ql,\n \"prom_eval_interval\": prom_eval_interval,\n \"enable_stime\": \"00:00\",\n \"enable_etime\": \"23:59\",\n \"enable_days_of_week\": [\n \"1\",\n \"2\",\n \"3\",\n \"4\",\n \"5\",\n \"6\",\n \"0\"\n ],\n \"enable_in_bg\": 0,\n \"notify_recovered\": 1,\n \"notify_channels\": [],\n \"notify_repeat_step\": 60,\n \"recover_duration\": 0,\n \"callbacks\": [],\n \"runbook_url\": \"\",\n \"append_tags\": append_tags,\n \"annotations\":annotations\n }\n return n9e_alert_rule\n\n\ndef convert_record(rule, interval):\n name = rule['record']\n prom_ql = rule['expr']\n prom_eval_interval = convert_interval(interval)\n note = ''\n append_tags = []\n if 'labels' in rule:\n for k, v in rule['labels'].items():\n append_tags.append('{}={}'.format(k, v))\n\n n9e_record_rule = {\n \"name\": name,\n \"note\": note,\n \"disabled\": 0,\n \"prom_ql\": prom_ql,\n \"prom_eval_interval\": prom_eval_interval,\n \"append_tags\": append_tags\n }\n return n9e_record_rule\n\n\n'''\nexample of rule group file\n---\ngroups:\n- name: example\n rules:\n - alert: HighRequestLatency\n expr: job:request_latency_seconds:mean5m{job=\"myjob\"} > 0.5\n for: 10m\n labels:\n severity: page\n annotations:\n summary: High request latency\n'''\ndef deal_group(group):\n \"\"\"\n parse single prometheus/vmalert rule group\n \"\"\"\n alert_rules = []\n record_rules = []\n\n for rule_segment in group['groups']:\n if 'interval' in rule_segment:\n interval = rule_segment['interval']\n else:\n interval = '15s'\n for rule in rule_segment['rules']:\n if 'alert' in rule:\n alert_rules.append(convert_alert(rule, interval))\n else:\n record_rules.append(convert_record(rule, interval))\n\n return alert_rules, record_rules\n\n\n'''\nexample of k8s rule configmap\n---\napiVersion: v1\nkind: ConfigMap\nmetadata:\n name: rulefiles-0\ndata:\n etcdrules.yaml: |\n groups:\n - name: etcd\n rules:\n - alert: etcdInsufficientMembers\n annotations:\n message: 'etcd cluster \"{{ $labels.job }}\": insufficient members ({{ $value}}).'\n expr: sum(up{job=~\".*etcd.*\"} == bool 1) by (job) < ((count(up{job=~\".*etcd.*\"})\n by (job) + 1) / 2)\n for: 3m\n labels:\n severity: critical\n'''\ndef deal_configmap(rule_configmap):\n \"\"\"\n parse rule configmap from k8s\n \"\"\"\n all_record_rules = []\n all_alert_rules = []\n for _, rule_group_str in rule_configmap['data'].items():\n rule_group = yaml.load(rule_group_str, Loader=yaml.FullLoader)\n alert_rules, record_rules = deal_group(rule_group)\n all_alert_rules.extend(alert_rules)\n all_record_rules.extend(record_rules)\n\n return all_alert_rules, all_record_rules\n\n\ndef main():\n with open(rule_file, 'r') as f:\n rule_config = yaml.load(f, Loader=yaml.FullLoader)\n \n # 如果文件是k8s中的configmap,使用下面的方法\n # alert_rules, record_rules = deal_configmap(rule_config)\n alert_rules, record_rules = deal_group(rule_config)\n\n with open(\"alert-rules.json\", 'w') as fw:\n json.dump(alert_rules, fw, indent=2, ensure_ascii=False)\n\n with open(\"record-rules.json\", 'w') as fw:\n json.dump(record_rules, fw, indent=2, ensure_ascii=False)\n\n\nif __name__ == '__main__':\n main()\n"
},
{
"path": "fe.sh",
"content": "#!/bin/bash\n\ncp -f ./docker/initsql/a-n9e.sql n9e.sql\n\nif [ ! -d \"./pub\" ]; then\n TAG=$(curl -sX GET https://api.github.com/repos/n9e/fe/releases/latest | awk '/tag_name/{print $4;exit}' FS='[\"\"]')\n\n if ! curl -o n9e-fe-${TAG}.tar.gz -L https://github.com/n9e/fe/releases/download/${TAG}/n9e-fe-${TAG}.tar.gz; then\n echo \"failed to download n9e-fe-${TAG}.tar.gz!\"\n exit 1\n fi\n\n if ! tar zxf n9e-fe-${TAG}.tar.gz; then\n echo \"failed to untar n9e-fe-${TAG}.tar.gz!\"\n exit 2\n fi\nfi\n\nGOPATH=$(go env GOPATH)\nGOPATH=${GOPATH:-/home/runner/go}\n\n# Embed files into a go binary\n# go install github.com/rakyll/statik\nif ! $GOPATH/bin/statik -src=./pub -dest=./front; then\n echo \"failed to embed files into a go binary!\"\n exit 4\nfi\n"
},
{
"path": "go.mod",
"content": "module github.com/ccfos/nightingale/v6\n\ngo 1.24.0\n\nrequire (\n\tgithub.com/BurntSushi/toml v1.4.0\n\tgithub.com/ClickHouse/clickhouse-go/v2 v2.23.2\n\tgithub.com/IBM/sarama v1.45.0\n\tgithub.com/VictoriaMetrics/metricsql v0.81.1\n\tgithub.com/alibabacloud-go/darabonba-openapi/v2 v2.1.13\n\tgithub.com/alibabacloud-go/dingtalk v1.6.95\n\tgithub.com/alibabacloud-go/gateway-dingtalk v1.0.2\n\tgithub.com/alibabacloud-go/openapi-util v0.1.1\n\tgithub.com/alibabacloud-go/tea v1.3.13\n\tgithub.com/alibabacloud-go/tea-utils/v2 v2.0.7\n\tgithub.com/araddon/dateparse v0.0.0-20210429162001-6b43995a97de\n\tgithub.com/bitly/go-simplejson v0.5.1\n\tgithub.com/coreos/go-oidc v2.2.1+incompatible\n\tgithub.com/davecgh/go-spew v1.1.2-0.20180830191138-d8f796af33cc\n\tgithub.com/dgrijalva/jwt-go v3.2.0+incompatible\n\tgithub.com/expr-lang/expr v1.16.1\n\tgithub.com/flashcatcloud/ibex v1.3.6\n\tgithub.com/gin-contrib/pprof v1.4.0\n\tgithub.com/gin-gonic/gin v1.9.1\n\tgithub.com/glebarez/sqlite v1.11.0\n\tgithub.com/go-ldap/ldap/v3 v3.4.4\n\tgithub.com/gogo/protobuf v1.3.2\n\tgithub.com/golang-jwt/jwt v3.2.2+incompatible\n\tgithub.com/golang/protobuf v1.5.4\n\tgithub.com/golang/snappy v0.0.4\n\tgithub.com/google/uuid v1.6.0\n\tgithub.com/hashicorp/go-version v1.6.0\n\tgithub.com/jinzhu/copier v0.4.0\n\tgithub.com/json-iterator/go v1.1.12\n\tgithub.com/koding/multiconfig v0.0.0-20171124222453-69c27309b2d7\n\tgithub.com/larksuite/oapi-sdk-go/v3 v3.5.1\n\tgithub.com/lib/pq v1.10.9\n\tgithub.com/mailru/easyjson v0.7.7\n\tgithub.com/mattn/go-isatty v0.0.19\n\tgithub.com/mitchellh/mapstructure v1.5.0\n\tgithub.com/mojocn/base64Captcha v1.3.6\n\tgithub.com/olivere/elastic/v7 v7.0.32\n\tgithub.com/opensearch-project/opensearch-go/v2 v2.3.0\n\tgithub.com/patrickmn/go-cache v2.1.0+incompatible\n\tgithub.com/pelletier/go-toml/v2 v2.0.8\n\tgithub.com/pingcap/tidb/pkg/parser v0.0.0-20260120034856-e15515e804da\n\tgithub.com/pkg/errors v0.9.1\n\tgithub.com/prometheus/client_golang v1.20.5\n\tgithub.com/prometheus/common v0.60.1\n\tgithub.com/prometheus/prometheus v0.47.1\n\tgithub.com/rakyll/statik v0.1.7\n\tgithub.com/redis/go-redis/v9 v9.0.2\n\tgithub.com/spaolacci/murmur3 v1.1.0\n\tgithub.com/stretchr/testify v1.10.0\n\tgithub.com/tidwall/gjson v1.14.2\n\tgithub.com/toolkits/pkg v1.3.8\n\tgolang.org/x/exp v0.0.0-20231006140011-7918f672742d\n\tgolang.org/x/oauth2 v0.27.0\n\tgopkg.in/gomail.v2 v2.0.0-20160411212932-81ebce5c23df\n\tgopkg.in/yaml.v2 v2.4.0\n\tgorm.io/driver/clickhouse v0.6.1\n\tgorm.io/driver/mysql v1.4.4\n\tgorm.io/driver/postgres v1.5.11\n\tgorm.io/driver/sqlite v1.5.5\n\tgorm.io/gorm v1.25.10\n)\n\nrequire (\n\tgithub.com/ClickHouse/ch-go v0.61.5 // indirect\n\tgithub.com/andybalholm/brotli v1.1.0 // indirect\n\tgithub.com/go-faster/city v1.0.1 // indirect\n\tgithub.com/go-faster/errors v0.7.1 // indirect\n\tgithub.com/klauspost/compress v1.17.11 // indirect\n\tgithub.com/munnerz/goautoneg v0.0.0-20191010083416-a7dc8b61c822 // indirect\n\tgithub.com/paulmach/orb v0.11.1 // indirect\n\tgithub.com/pierrec/lz4/v4 v4.1.22 // indirect\n\tgithub.com/pmezard/go-difflib v1.0.1-0.20181226105442-5d4384ee4fb2 // indirect\n\tgithub.com/segmentio/asm v1.2.0 // indirect\n\tgithub.com/shopspring/decimal v1.4.0 // indirect\n\tgo.opentelemetry.io/otel v1.32.0 // indirect\n\tgo.opentelemetry.io/otel/trace v1.32.0 // indirect\n)\n\nrequire (\n\tgithub.com/VictoriaMetrics/metrics v1.34.0 // indirect\n\tgithub.com/alibabacloud-go/alibabacloud-gateway-spi v0.0.5 // indirect\n\tgithub.com/alibabacloud-go/debug v1.0.1 // indirect\n\tgithub.com/alicebob/gopher-json v0.0.0-20200520072559-a9ecdc9d1d3a // indirect\n\tgithub.com/aliyun/credentials-go v1.4.6 // indirect\n\tgithub.com/clbanning/mxj/v2 v2.7.0 // indirect\n\tgithub.com/dustin/go-humanize v1.0.1 // indirect\n\tgithub.com/eapache/go-resiliency v1.7.0 // indirect\n\tgithub.com/eapache/go-xerial-snappy v0.0.0-20230731223053-c322873962e3 // indirect\n\tgithub.com/eapache/queue v1.1.0 // indirect\n\tgithub.com/glebarez/go-sqlite v1.21.2 // indirect\n\tgithub.com/hashicorp/errwrap v1.1.0 // indirect\n\tgithub.com/hashicorp/go-multierror v1.1.1 // indirect\n\tgithub.com/hashicorp/go-uuid v1.0.3 // indirect\n\tgithub.com/jackc/pgx/v5 v5.7.1 // indirect\n\tgithub.com/jackc/puddle/v2 v2.2.2 // indirect\n\tgithub.com/jcmturner/aescts/v2 v2.0.0 // indirect\n\tgithub.com/jcmturner/dnsutils/v2 v2.0.0 // indirect\n\tgithub.com/jcmturner/gofork v1.7.6 // indirect\n\tgithub.com/jcmturner/gokrb5/v8 v8.4.4 // indirect\n\tgithub.com/jcmturner/rpc/v2 v2.0.3 // indirect\n\tgithub.com/pingcap/errors v0.11.5-0.20250523034308-74f78ae071ee // indirect\n\tgithub.com/pingcap/failpoint v0.0.0-20240528011301-b51a646c7c86 // indirect\n\tgithub.com/pingcap/log v1.1.0 // indirect\n\tgithub.com/rcrowley/go-metrics v0.0.0-20201227073835-cf1acfcdf475 // indirect\n\tgithub.com/remyoudompheng/bigfft v0.0.0-20230129092748-24d4a6f8daec // indirect\n\tgithub.com/rogpeppe/go-internal v1.13.1 // indirect\n\tgithub.com/tjfoc/gmsm v1.4.1 // indirect\n\tgithub.com/valyala/fastrand v1.1.0 // indirect\n\tgithub.com/valyala/histogram v1.2.0 // indirect\n\tgithub.com/yuin/gopher-lua v1.1.1 // indirect\n\tgo.uber.org/multierr v1.11.0 // indirect\n\tgo.uber.org/zap v1.27.0 // indirect\n\tgolang.org/x/sync v0.18.0 // indirect\n\tgopkg.in/ini.v1 v1.67.0 // indirect\n\tgopkg.in/natefinch/lumberjack.v2 v2.2.1 // indirect\n\tmodernc.org/libc v1.22.5 // indirect\n\tmodernc.org/mathutil v1.6.0 // indirect\n\tmodernc.org/memory v1.5.0 // indirect\n\tmodernc.org/sqlite v1.23.1 // indirect\n)\n\nrequire (\n\tgithub.com/Azure/go-ntlmssp v0.0.0-20220621081337-cb9428e4ac1e // indirect\n\tgithub.com/alicebob/miniredis/v2 v2.33.0\n\tgithub.com/beorn7/perks v1.0.1 // indirect\n\tgithub.com/bytedance/sonic v1.9.1 // indirect\n\tgithub.com/cespare/xxhash/v2 v2.3.0 // indirect\n\tgithub.com/chenzhuoyu/base64x v0.0.0-20221115062448-fe3a3abad311 // indirect\n\tgithub.com/dennwc/varint v1.0.0 // indirect\n\tgithub.com/dgryski/go-rendezvous v0.0.0-20200823014737-9f7001d12a5f // indirect\n\tgithub.com/fatih/camelcase v1.0.0 // indirect\n\tgithub.com/fatih/structs v1.1.0 // indirect\n\tgithub.com/gabriel-vasile/mimetype v1.4.2 // indirect\n\tgithub.com/gin-contrib/sse v0.1.0 // indirect\n\tgithub.com/go-asn1-ber/asn1-ber v1.5.4 // indirect\n\tgithub.com/go-kit/log v0.2.1 // indirect\n\tgithub.com/go-logfmt/logfmt v0.6.0 // indirect\n\tgithub.com/go-playground/locales v0.14.1 // indirect\n\tgithub.com/go-playground/universal-translator v0.18.1 // indirect\n\tgithub.com/go-playground/validator/v10 v10.14.0 // indirect\n\tgithub.com/go-sql-driver/mysql v1.7.1\n\tgithub.com/goccy/go-json v0.10.2 // indirect\n\tgithub.com/golang/freetype v0.0.0-20170609003504-e2365dfdc4a0 // indirect\n\tgithub.com/grafana/regexp v0.0.0-20221122212121-6b5c0a4cb7fd // indirect\n\tgithub.com/jackc/pgpassfile v1.0.0 // indirect\n\tgithub.com/jackc/pgservicefile v0.0.0-20240606120523-5a60cdf6a761 // indirect\n\tgithub.com/jinzhu/inflection v1.0.0 // indirect\n\tgithub.com/jinzhu/now v1.1.5 // indirect\n\tgithub.com/josharian/intern v1.0.0 // indirect\n\tgithub.com/klauspost/cpuid/v2 v2.2.5 // indirect\n\tgithub.com/leodido/go-urn v1.2.4 // indirect\n\tgithub.com/mattn/go-sqlite3 v1.14.17 // indirect\n\tgithub.com/modern-go/concurrent v0.0.0-20180306012644-bacd9c7ef1dd // indirect\n\tgithub.com/modern-go/reflect2 v1.0.2 // indirect\n\tgithub.com/pquerna/cachecontrol v0.1.0 // indirect\n\tgithub.com/prometheus/client_model v0.6.1 // indirect\n\tgithub.com/prometheus/procfs v0.15.1 // indirect\n\tgithub.com/robfig/cron/v3 v3.0.1\n\tgithub.com/tidwall/match v1.1.1\n\tgithub.com/tidwall/pretty v1.2.0 // indirect\n\tgithub.com/twitchyliquid64/golang-asm v0.15.1 // indirect\n\tgithub.com/ugorji/go/codec v1.2.11 // indirect\n\tgo.uber.org/atomic v1.11.0 // indirect\n\tgo.uber.org/automaxprocs v1.5.2 // indirect\n\tgolang.org/x/arch v0.3.0 // indirect\n\tgolang.org/x/crypto v0.45.0 // indirect\n\tgolang.org/x/image v0.18.0 // indirect\n\tgolang.org/x/net v0.47.0 // indirect\n\tgolang.org/x/sys v0.38.0 // indirect\n\tgolang.org/x/text v0.31.0 // indirect\n\tgoogle.golang.org/protobuf v1.35.1 // indirect\n\tgopkg.in/alexcesaro/quotedprintable.v3 v3.0.0-20150716171945-2caba252f4dc // indirect\n\tgopkg.in/square/go-jose.v2 v2.6.0 // indirect\n\tgopkg.in/yaml.v3 v3.0.1 // indirect\n)\n\nreplace golang.org/x/exp v0.0.0-20231006140011-7918f672742d => golang.org/x/exp v0.0.0-20230713183714-613f0c0eb8a1\n\nreplace github.com/olivere/elastic/v7 => github.com/n9e/elastic/v7 v7.0.33-0.20251031061708-f480a2dfcfa7\n\n// replace github.com/flashcatcloud/ibex => ../github.com/flashcatcloud/ibex\n"
},
{
"path": "go.sum",
"content": "cloud.google.com/go v0.26.0/go.mod h1:aQUYkXzVsufM+DwF1aE+0xfcU+56JwCaLick0ClmMTw=\ngithub.com/Azure/azure-sdk-for-go v65.0.0+incompatible h1:HzKLt3kIwMm4KeJYTdx9EbjRYTySD/t8i1Ee/W5EGXw=\ngithub.com/Azure/azure-sdk-for-go/sdk/azcore v1.7.0 h1:8q4SaHjFsClSvuVne0ID/5Ka8u3fcIHyqkLjcFpNRHQ=\ngithub.com/Azure/azure-sdk-for-go/sdk/azcore v1.7.0/go.mod h1:bjGvMhVMb+EEm3VRNQawDMUyMMjo+S5ewNjflkep/0Q=\ngithub.com/Azure/azure-sdk-for-go/sdk/azidentity v1.3.0 h1:vcYCAze6p19qBW7MhZybIsqD8sMV8js0NyQM8JDnVtg=\ngithub.com/Azure/azure-sdk-for-go/sdk/azidentity v1.3.0/go.mod h1:OQeznEEkTZ9OrhHJoDD8ZDq51FHgXjqtP9z6bEwBq9U=\ngithub.com/Azure/azure-sdk-for-go/sdk/internal v1.3.0 h1:sXr+ck84g/ZlZUOZiNELInmMgOsuGwdjjVkEIde0OtY=\ngithub.com/Azure/azure-sdk-for-go/sdk/internal v1.3.0/go.mod h1:okt5dMMTOFjX/aovMlrjvvXoPMBVSPzk9185BT0+eZM=\ngithub.com/Azure/go-ntlmssp v0.0.0-20220621081337-cb9428e4ac1e h1:NeAW1fUYUEWhft7pkxDf6WoUvEZJ/uOKsvtpjLnn8MU=\ngithub.com/Azure/go-ntlmssp v0.0.0-20220621081337-cb9428e4ac1e/go.mod h1:chxPXzSsl7ZWRAuOIE23GDNzjWuZquvFlgA8xmpunjU=\ngithub.com/AzureAD/microsoft-authentication-library-for-go v1.0.0 h1:OBhqkivkhkMqLPymWEppkm7vgPQY2XsHoEkaMQ0AdZY=\ngithub.com/AzureAD/microsoft-authentication-library-for-go v1.0.0/go.mod h1:kgDmCTgBzIEPFElEF+FK0SdjAor06dRq2Go927dnQ6o=\ngithub.com/BurntSushi/toml v0.3.1/go.mod h1:xHWCNGjB5oqiDr8zfno3MHue2Ht5sIBksp03qcyfWMU=\ngithub.com/BurntSushi/toml v1.4.0 h1:kuoIxZQy2WRRk1pttg9asf+WVv6tWQuBNVmK8+nqPr0=\ngithub.com/BurntSushi/toml v1.4.0/go.mod h1:ukJfTF/6rtPPRCnwkur4qwRxa8vTRFBF0uk2lLoLwho=\ngithub.com/ClickHouse/ch-go v0.61.5 h1:zwR8QbYI0tsMiEcze/uIMK+Tz1D3XZXLdNrlaOpeEI4=\ngithub.com/ClickHouse/ch-go v0.61.5/go.mod h1:s1LJW/F/LcFs5HJnuogFMta50kKDO0lf9zzfrbl0RQg=\ngithub.com/ClickHouse/clickhouse-go/v2 v2.23.2 h1:+DAKPMnxLS7pduQZsrJc8OhdLS2L9MfDEJ2TS+hpYDM=\ngithub.com/ClickHouse/clickhouse-go/v2 v2.23.2/go.mod h1:aNap51J1OM3yxQJRgM+AlP/MPkGBCL8A74uQThoQhR0=\ngithub.com/IBM/sarama v1.45.0 h1:IzeBevTn809IJ/dhNKhP5mpxEXTmELuezO2tgHD9G5E=\ngithub.com/IBM/sarama v1.45.0/go.mod h1:EEay63m8EZkeumco9TDXf2JT3uDnZsZqFgV46n4yZdY=\ngithub.com/VictoriaMetrics/metrics v1.34.0 h1:0i8k/gdOJdSoZB4Z9pikVnVQXfhcIvnG7M7h2WaQW2w=\ngithub.com/VictoriaMetrics/metrics v1.34.0/go.mod h1:r7hveu6xMdUACXvB8TYdAj8WEsKzWB0EkpJN+RDtOf8=\ngithub.com/VictoriaMetrics/metricsql v0.81.1 h1:1gpqI3Mwru1tCM8nZiKxBG0P+DNkjlRwLhRPII3cuho=\ngithub.com/VictoriaMetrics/metricsql v0.81.1/go.mod h1:1g4hdCwlbJZ851PU9VN65xy9Rdlzupo6fx3SNZ8Z64U=\ngithub.com/alecthomas/units v0.0.0-20211218093645-b94a6e3cc137 h1:s6gZFSlWYmbqAuRjVTiNNhvNRfY2Wxp9nhfyel4rklc=\ngithub.com/alecthomas/units v0.0.0-20211218093645-b94a6e3cc137/go.mod h1:OMCwj8VM1Kc9e19TLln2VL61YJF0x1XFtfdL4JdbSyE=\ngithub.com/alibabacloud-go/alibabacloud-gateway-pop v0.0.6 h1:eIf+iGJxdU4U9ypaUfbtOWCsZSbTb8AUHvyPrxu6mAA=\ngithub.com/alibabacloud-go/alibabacloud-gateway-pop v0.0.6/go.mod h1:4EUIoxs/do24zMOGGqYVWgw0s9NtiylnJglOeEB5UJo=\ngithub.com/alibabacloud-go/alibabacloud-gateway-spi v0.0.4/go.mod h1:sCavSAvdzOjul4cEqeVtvlSaSScfNsTQ+46HwlTL1hc=\ngithub.com/alibabacloud-go/alibabacloud-gateway-spi v0.0.5 h1:zE8vH9C7JiZLNJJQ5OwjU9mSi4T9ef9u3BURT6LCLC8=\ngithub.com/alibabacloud-go/alibabacloud-gateway-spi v0.0.5/go.mod h1:tWnyE9AjF8J8qqLk645oUmVUnFybApTQWklQmi5tY6g=\ngithub.com/alibabacloud-go/darabonba-array v0.1.0 h1:vR8s7b1fWAQIjEjWnuF0JiKsCvclSRTfDzZHTYqfufY=\ngithub.com/alibabacloud-go/darabonba-array v0.1.0/go.mod h1:BLKxr0brnggqOJPqT09DFJ8g3fsDshapUD3C3aOEFaI=\ngithub.com/alibabacloud-go/darabonba-encode-util v0.0.2 h1:1uJGrbsGEVqWcWxrS9MyC2NG0Ax+GpOM5gtupki31XE=\ngithub.com/alibabacloud-go/darabonba-encode-util v0.0.2/go.mod h1:JiW9higWHYXm7F4PKuMgEUETNZasrDM6vqVr/Can7H8=\ngithub.com/alibabacloud-go/darabonba-map v0.0.2 h1:qvPnGB4+dJbJIxOOfawxzF3hzMnIpjmafa0qOTp6udc=\ngithub.com/alibabacloud-go/darabonba-map v0.0.2/go.mod h1:28AJaX8FOE/ym8OUFWga+MtEzBunJwQGceGQlvaPGPc=\ngithub.com/alibabacloud-go/darabonba-openapi/v2 v2.0.12/go.mod h1:cgtLEj8i4ddXMcQgq4PnpVQvlzS+y5B+QtdSfmcLM3A=\ngithub.com/alibabacloud-go/darabonba-openapi/v2 v2.1.13 h1:Q00FU3H94Ts0ZIHDmY+fYGgB7dV9D/YX6FGsgorQPgw=\ngithub.com/alibabacloud-go/darabonba-openapi/v2 v2.1.13/go.mod h1:lxFGfobinVsQ49ntjpgWghXmIF0/Sm4+wvBJ1h5RtaE=\ngithub.com/alibabacloud-go/darabonba-signature-util v0.0.7 h1:UzCnKvsjPFzApvODDNEYqBHMFt1w98wC7FOo0InLyxg=\ngithub.com/alibabacloud-go/darabonba-signature-util v0.0.7/go.mod h1:oUzCYV2fcCH797xKdL6BDH8ADIHlzrtKVjeRtunBNTQ=\ngithub.com/alibabacloud-go/darabonba-string v1.0.2 h1:E714wms5ibdzCqGeYJ9JCFywE5nDyvIXIIQbZVFkkqo=\ngithub.com/alibabacloud-go/darabonba-string v1.0.2/go.mod h1:93cTfV3vuPhhEwGGpKKqhVW4jLe7tDpo3LUM0i0g6mA=\ngithub.com/alibabacloud-go/debug v0.0.0-20190504072949-9472017b5c68/go.mod h1:6pb/Qy8c+lqua8cFpEy7g39NRRqOWc3rOwAy8m5Y2BY=\ngithub.com/alibabacloud-go/debug v1.0.0/go.mod h1:8gfgZCCAC3+SCzjWtY053FrOcd4/qlH6IHTI4QyICOc=\ngithub.com/alibabacloud-go/debug v1.0.1 h1:MsW9SmUtbb1Fnt3ieC6NNZi6aEwrXfDksD4QA6GSbPg=\ngithub.com/alibabacloud-go/debug v1.0.1/go.mod h1:8gfgZCCAC3+SCzjWtY053FrOcd4/qlH6IHTI4QyICOc=\ngithub.com/alibabacloud-go/dingtalk v1.6.95 h1:fUSo0CaMYI8AUYIKZ8+xxyElTqcisqA0EyvFAJ6wpgQ=\ngithub.com/alibabacloud-go/dingtalk v1.6.95/go.mod h1:mUcgNRgMGQzABtiZtTK8a3b6LwQBQ8t9WsDKzklqVpg=\ngithub.com/alibabacloud-go/endpoint-util v1.1.0 h1:r/4D3VSw888XGaeNpP994zDUaxdgTSHBbVfZlzf6b5Q=\ngithub.com/alibabacloud-go/endpoint-util v1.1.0/go.mod h1:O5FuCALmCKs2Ff7JFJMudHs0I5EBgecXXxZRyswlEjE=\ngithub.com/alibabacloud-go/gateway-dingtalk v1.0.2 h1:+etjmc64QTmYvHlc6eFkH9y2DOc3UPcyD2nF3IXsVqw=\ngithub.com/alibabacloud-go/gateway-dingtalk v1.0.2/go.mod h1:JUvHpkJtlPFpgJcfXqc9Y4mk2JnoRn5XpKbRz38jJho=\ngithub.com/alibabacloud-go/openapi-util v0.1.0/go.mod h1:sQuElr4ywwFRlCCberQwKRFhRzIyG4QTP/P4y1CJ6Ws=\ngithub.com/alibabacloud-go/openapi-util v0.1.1 h1:ujGErJjG8ncRW6XtBBMphzHTvCxn4DjrVw4m04HsS28=\ngithub.com/alibabacloud-go/openapi-util v0.1.1/go.mod h1:/UehBSE2cf1gYT43GV4E+RxTdLRzURImCYY0aRmlXpw=\ngithub.com/alibabacloud-go/tea v1.1.0/go.mod h1:IkGyUSX4Ba1V+k4pCtJUc6jDpZLFph9QMy2VUPTwukg=\ngithub.com/alibabacloud-go/tea v1.1.7/go.mod h1:/tmnEaQMyb4Ky1/5D+SE1BAsa5zj/KeGOFfwYm3N/p4=\ngithub.com/alibabacloud-go/tea v1.1.8/go.mod h1:/tmnEaQMyb4Ky1/5D+SE1BAsa5zj/KeGOFfwYm3N/p4=\ngithub.com/alibabacloud-go/tea v1.1.11/go.mod h1:/tmnEaQMyb4Ky1/5D+SE1BAsa5zj/KeGOFfwYm3N/p4=\ngithub.com/alibabacloud-go/tea v1.1.17/go.mod h1:nXxjm6CIFkBhwW4FQkNrolwbfon8Svy6cujmKFUq98A=\ngithub.com/alibabacloud-go/tea v1.1.20/go.mod h1:nXxjm6CIFkBhwW4FQkNrolwbfon8Svy6cujmKFUq98A=\ngithub.com/alibabacloud-go/tea v1.2.2/go.mod h1:CF3vOzEMAG+bR4WOql8gc2G9H3EkH3ZLAQdpmpXMgwk=\ngithub.com/alibabacloud-go/tea v1.3.13 h1:WhGy6LIXaMbBM6VBYcsDCz6K/TPsT1Ri2hPmmZffZ94=\ngithub.com/alibabacloud-go/tea v1.3.13/go.mod h1:A560v/JTQ1n5zklt2BEpurJzZTI8TUT+Psg2drWlxRg=\ngithub.com/alibabacloud-go/tea-utils v1.3.1/go.mod h1:EI/o33aBfj3hETm4RLiAxF/ThQdSngxrpF8rKUDJjPE=\ngithub.com/alibabacloud-go/tea-utils/v2 v2.0.1/go.mod h1:U5MTY10WwlquGPS34DOeomUGBB0gXbLueiq5Trwu0C4=\ngithub.com/alibabacloud-go/tea-utils/v2 v2.0.5/go.mod h1:dL6vbUT35E4F4bFTHL845eUloqaerYBYPsdWR2/jhe4=\ngithub.com/alibabacloud-go/tea-utils/v2 v2.0.6/go.mod h1:qxn986l+q33J5VkialKMqT/TTs3E+U9MJpd001iWQ9I=\ngithub.com/alibabacloud-go/tea-utils/v2 v2.0.7 h1:WDx5qW3Xa5ZgJ1c8NfqJkF6w+AU5wB8835UdhPr6Ax0=\ngithub.com/alibabacloud-go/tea-utils/v2 v2.0.7/go.mod h1:qxn986l+q33J5VkialKMqT/TTs3E+U9MJpd001iWQ9I=\ngithub.com/alibabacloud-go/tea-xml v1.1.3/go.mod h1:Rq08vgCcCAjHyRi/M7xlHKUykZCEtyBy9+DPF6GgEu8=\ngithub.com/alicebob/gopher-json v0.0.0-20200520072559-a9ecdc9d1d3a h1:HbKu58rmZpUGpz5+4FfNmIU+FmZg2P3Xaj2v2bfNWmk=\ngithub.com/alicebob/gopher-json v0.0.0-20200520072559-a9ecdc9d1d3a/go.mod h1:SGnFV6hVsYE877CKEZ6tDNTjaSXYUk6QqoIK6PrAtcc=\ngithub.com/alicebob/miniredis/v2 v2.33.0 h1:uvTF0EDeu9RLnUEG27Db5I68ESoIxTiXbNUiji6lZrA=\ngithub.com/alicebob/miniredis/v2 v2.33.0/go.mod h1:MhP4a3EU7aENRi9aO+tHfTBZicLqQevyi/DJpoj6mi0=\ngithub.com/aliyun/credentials-go v1.1.2/go.mod h1:ozcZaMR5kLM7pwtCMEpVmQ242suV6qTJya2bDq4X1Tw=\ngithub.com/aliyun/credentials-go v1.3.1/go.mod h1:8jKYhQuDawt8x2+fusqa1Y6mPxemTsBEN04dgcAcYz0=\ngithub.com/aliyun/credentials-go v1.3.6/go.mod h1:1LxUuX7L5YrZUWzBrRyk0SwSdH4OmPrib8NVePL3fxM=\ngithub.com/aliyun/credentials-go v1.4.5/go.mod h1:Jm6d+xIgwJVLVWT561vy67ZRP4lPTQxMbEYRuT2Ti1U=\ngithub.com/aliyun/credentials-go v1.4.6 h1:CG8rc/nxCNKfXbZWpWDzI9GjF4Tuu3Es14qT8Y0ClOk=\ngithub.com/aliyun/credentials-go v1.4.6/go.mod h1:Jm6d+xIgwJVLVWT561vy67ZRP4lPTQxMbEYRuT2Ti1U=\ngithub.com/andybalholm/brotli v1.1.0 h1:eLKJA0d02Lf0mVpIDgYnqXcUn0GqVmEFny3VuID1U3M=\ngithub.com/andybalholm/brotli v1.1.0/go.mod h1:sms7XGricyQI9K10gOSf56VKKWS4oLer58Q+mhRPtnY=\ngithub.com/araddon/dateparse v0.0.0-20210429162001-6b43995a97de h1:FxWPpzIjnTlhPwqqXc4/vE0f7GvRjuAsbW+HOIe8KnA=\ngithub.com/araddon/dateparse v0.0.0-20210429162001-6b43995a97de/go.mod h1:DCaWoUhZrYW9p1lxo/cm8EmUOOzAPSEZNGF2DK1dJgw=\ngithub.com/aws/aws-sdk-go v1.44.263/go.mod h1:aVsgQcEevwlmQ7qHE9I3h+dtQgpqhFB+i8Phjh7fkwI=\ngithub.com/aws/aws-sdk-go v1.44.302 h1:ST3ko6GrJKn3Xi+nAvxjG3uk/V1pW8KC52WLeIxqqNk=\ngithub.com/aws/aws-sdk-go v1.44.302/go.mod h1:aVsgQcEevwlmQ7qHE9I3h+dtQgpqhFB+i8Phjh7fkwI=\ngithub.com/aws/aws-sdk-go-v2 v1.18.0/go.mod h1:uzbQtefpm44goOPmdKyAlXSNcwlRgF3ePWVW6EtJvvw=\ngithub.com/aws/aws-sdk-go-v2/config v1.18.25/go.mod h1:dZnYpD5wTW/dQF0rRNLVypB396zWCcPiBIvdvSWHEg4=\ngithub.com/aws/aws-sdk-go-v2/credentials v1.13.24/go.mod h1:jYPYi99wUOPIFi0rhiOvXeSEReVOzBqFNOX5bXYoG2o=\ngithub.com/aws/aws-sdk-go-v2/feature/ec2/imds v1.13.3/go.mod h1:4Q0UFP0YJf0NrsEuEYHpM9fTSEVnD16Z3uyEF7J9JGM=\ngithub.com/aws/aws-sdk-go-v2/internal/configsources v1.1.33/go.mod h1:7i0PF1ME/2eUPFcjkVIwq+DOygHEoK92t5cDqNgYbIw=\ngithub.com/aws/aws-sdk-go-v2/internal/endpoints/v2 v2.4.27/go.mod h1:UrHnn3QV/d0pBZ6QBAEQcqFLf8FAzLmoUfPVIueOvoM=\ngithub.com/aws/aws-sdk-go-v2/internal/ini v1.3.34/go.mod h1:Etz2dj6UHYuw+Xw830KfzCfWGMzqvUTCjUj5b76GVDc=\ngithub.com/aws/aws-sdk-go-v2/service/internal/presigned-url v1.9.27/go.mod h1:EOwBD4J4S5qYszS5/3DpkejfuK+Z5/1uzICfPaZLtqw=\ngithub.com/aws/aws-sdk-go-v2/service/sso v1.12.10/go.mod h1:ouy2P4z6sJN70fR3ka3wD3Ro3KezSxU6eKGQI2+2fjI=\ngithub.com/aws/aws-sdk-go-v2/service/ssooidc v1.14.10/go.mod h1:AFvkxc8xfBe8XA+5St5XIHHrQQtkxqrRincx4hmMHOk=\ngithub.com/aws/aws-sdk-go-v2/service/sts v1.19.0/go.mod h1:BgQOMsg8av8jset59jelyPW7NoZcZXLVpDsXunGDrk8=\ngithub.com/aws/smithy-go v1.13.5/go.mod h1:Tg+OJXh4MB2R/uN61Ko2f6hTZwB/ZYGOtib8J3gBHzA=\ngithub.com/benbjohnson/clock v1.1.0/go.mod h1:J11/hYXuz8f4ySSvYwY0FKfm+ezbsZBKZxNJlLklBHA=\ngithub.com/beorn7/perks v1.0.1 h1:VlbKKnNfV8bJzeqoa4cOKqO6bYr3WgKZxO8Z16+hsOM=\ngithub.com/beorn7/perks v1.0.1/go.mod h1:G2ZrVWU2WbWT9wwq4/hrbKbnv/1ERSJQ0ibhJ6rlkpw=\ngithub.com/bitly/go-simplejson v0.5.1 h1:xgwPbetQScXt1gh9BmoJ6j9JMr3TElvuIyjR8pgdoow=\ngithub.com/bitly/go-simplejson v0.5.1/go.mod h1:YOPVLzCfwK14b4Sff3oP1AmGhI9T9Vsg84etUnlyp+Q=\ngithub.com/bsm/ginkgo/v2 v2.5.0 h1:aOAnND1T40wEdAtkGSkvSICWeQ8L3UASX7YVCqQx+eQ=\ngithub.com/bsm/ginkgo/v2 v2.5.0/go.mod h1:AiKlXPm7ItEHNc/2+OkrNG4E0ITzojb9/xWzvQ9XZ9w=\ngithub.com/bsm/gomega v1.20.0 h1:JhAwLmtRzXFTx2AkALSLa8ijZafntmhSoU63Ok18Uq8=\ngithub.com/bsm/gomega v1.20.0/go.mod h1:JifAceMQ4crZIWYUKrlGcmbN3bqHogVTADMD2ATsbwk=\ngithub.com/bytedance/sonic v1.5.0/go.mod h1:ED5hyg4y6t3/9Ku1R6dU/4KyJ48DZ4jPhfY1O2AihPM=\ngithub.com/bytedance/sonic v1.9.1 h1:6iJ6NqdoxCDr6mbY8h18oSO+cShGSMRGCEo7F2h0x8s=\ngithub.com/bytedance/sonic v1.9.1/go.mod h1:i736AoUSYt75HyZLoJW9ERYxcy6eaN6h4BZXU064P/U=\ngithub.com/census-instrumentation/opencensus-proto v0.2.1/go.mod h1:f6KPmirojxKA12rnyqOA5BBL4O983OfeGPqjHWSTneU=\ngithub.com/cespare/xxhash/v2 v2.3.0 h1:UL815xU9SqsFlibzuggzjXhog7bL6oX9BbNZnL2UFvs=\ngithub.com/cespare/xxhash/v2 v2.3.0/go.mod h1:VGX0DQ3Q6kWi7AoAeZDth3/j3BFtOZR5XLFGgcrjCOs=\ngithub.com/chenzhuoyu/base64x v0.0.0-20211019084208-fb5309c8db06/go.mod h1:DH46F32mSOjUmXrMHnKwZdA8wcEefY7UVqBKYGjpdQY=\ngithub.com/chenzhuoyu/base64x v0.0.0-20221115062448-fe3a3abad311 h1:qSGYFH7+jGhDF8vLC+iwCD4WpbV1EBDSzWkJODFLams=\ngithub.com/chenzhuoyu/base64x v0.0.0-20221115062448-fe3a3abad311/go.mod h1:b583jCggY9gE99b6G5LEC39OIiVsWj+R97kbl5odCEk=\ngithub.com/clbanning/mxj/v2 v2.5.5/go.mod h1:hNiWqW14h+kc+MdF9C6/YoRfjEJoR3ou6tn/Qo+ve2s=\ngithub.com/clbanning/mxj/v2 v2.7.0 h1:WA/La7UGCanFe5NpHF0Q3DNtnCsVoxbPKuyBNHWRyME=\ngithub.com/clbanning/mxj/v2 v2.7.0/go.mod h1:hNiWqW14h+kc+MdF9C6/YoRfjEJoR3ou6tn/Qo+ve2s=\ngithub.com/client9/misspell v0.3.4/go.mod h1:qj6jICC3Q7zFZvVWo7KLAzC3yx5G7kyvSDkc90ppPyw=\ngithub.com/cncf/udpa/go v0.0.0-20191209042840-269d4d468f6f/go.mod h1:M8M6+tZqaGXZJjfX53e64911xZQV5JYwmTeXPW+k8Sc=\ngithub.com/coreos/go-oidc v2.2.1+incompatible h1:mh48q/BqXqgjVHpy2ZY7WnWAbenxRjsz9N1i1YxjHAk=\ngithub.com/coreos/go-oidc v2.2.1+incompatible/go.mod h1:CgnwVTmzoESiwO9qyAFEMiHoZ1nMCKZlZ9V6mm3/LKc=\ngithub.com/creack/pty v1.1.9/go.mod h1:oKZEueFk5CKHvIhNR5MUki03XCEU+Q6VDXinZuGJ33E=\ngithub.com/davecgh/go-spew v1.1.0/go.mod h1:J7Y8YcW2NihsgmVo/mv3lAwl/skON4iLHjSsI+c5H38=\ngithub.com/davecgh/go-spew v1.1.1/go.mod h1:J7Y8YcW2NihsgmVo/mv3lAwl/skON4iLHjSsI+c5H38=\ngithub.com/davecgh/go-spew v1.1.2-0.20180830191138-d8f796af33cc h1:U9qPSI2PIWSS1VwoXQT9A3Wy9MM3WgvqSxFWenqJduM=\ngithub.com/davecgh/go-spew v1.1.2-0.20180830191138-d8f796af33cc/go.mod h1:J7Y8YcW2NihsgmVo/mv3lAwl/skON4iLHjSsI+c5H38=\ngithub.com/dennwc/varint v1.0.0 h1:kGNFFSSw8ToIy3obO/kKr8U9GZYUAxQEVuix4zfDWzE=\ngithub.com/dennwc/varint v1.0.0/go.mod h1:hnItb35rvZvJrbTALZtY/iQfDs48JKRG1RPpgziApxA=\ngithub.com/dgrijalva/jwt-go v3.2.0+incompatible h1:7qlOGliEKZXTDg6OTjfoBKDXWrumCAMpl/TFQ4/5kLM=\ngithub.com/dgrijalva/jwt-go v3.2.0+incompatible/go.mod h1:E3ru+11k8xSBh+hMPgOLZmtrrCbhqsmaPHjLKYnJCaQ=\ngithub.com/dgryski/go-rendezvous v0.0.0-20200823014737-9f7001d12a5f h1:lO4WD4F/rVNCu3HqELle0jiPLLBs70cWOduZpkS1E78=\ngithub.com/dgryski/go-rendezvous v0.0.0-20200823014737-9f7001d12a5f/go.mod h1:cuUVRXasLTGF7a8hSLbxyZXjz+1KgoB3wDUb6vlszIc=\ngithub.com/dustin/go-humanize v1.0.1 h1:GzkhY7T5VNhEkwH0PVJgjz+fX1rhBrR7pRT3mDkpeCY=\ngithub.com/dustin/go-humanize v1.0.1/go.mod h1:Mu1zIs6XwVuF/gI1OepvI0qD18qycQx+mFykh5fBlto=\ngithub.com/eapache/go-resiliency v1.7.0 h1:n3NRTnBn5N0Cbi/IeOHuQn9s2UwVUH7Ga0ZWcP+9JTA=\ngithub.com/eapache/go-resiliency v1.7.0/go.mod h1:5yPzW0MIvSe0JDsv0v+DvcjEv2FyD6iZYSs1ZI+iQho=\ngithub.com/eapache/go-xerial-snappy v0.0.0-20230731223053-c322873962e3 h1:Oy0F4ALJ04o5Qqpdz8XLIpNA3WM/iSIXqxtqo7UGVws=\ngithub.com/eapache/go-xerial-snappy v0.0.0-20230731223053-c322873962e3/go.mod h1:YvSRo5mw33fLEx1+DlK6L2VV43tJt5Eyel9n9XBcR+0=\ngithub.com/eapache/queue v1.1.0 h1:YOEu7KNc61ntiQlcEeUIoDTJ2o8mQznoNvUhiigpIqc=\ngithub.com/eapache/queue v1.1.0/go.mod h1:6eCeP0CKFpHLu8blIFXhExK/dRa7WDZfr6jVFPTqq+I=\ngithub.com/envoyproxy/go-control-plane v0.9.0/go.mod h1:YTl/9mNaCwkRvm6d1a2C3ymFceY/DCBVvsKhRF0iEA4=\ngithub.com/envoyproxy/go-control-plane v0.9.4/go.mod h1:6rpuAdCZL397s3pYoYcLgu1mIlRU8Am5FuJP05cCM98=\ngithub.com/envoyproxy/protoc-gen-validate v0.1.0/go.mod h1:iSmxcyjqTsJpI2R4NaDN7+kN2VEUnK/pcBlmesArF7c=\ngithub.com/expr-lang/expr v1.16.1 h1:Na8CUcMdyGbnNpShY7kzcHCU7WqxuL+hnxgHZ4vaz/A=\ngithub.com/expr-lang/expr v1.16.1/go.mod h1:uCkhfG+x7fcZ5A5sXHKuQ07jGZRl6J0FCAaf2k4PtVQ=\ngithub.com/fatih/camelcase v1.0.0 h1:hxNvNX/xYBp0ovncs8WyWZrOrpBNub/JfaMvbURyft8=\ngithub.com/fatih/camelcase v1.0.0/go.mod h1:yN2Sb0lFhZJUdVvtELVWefmrXpuZESvPmqwoZc+/fpc=\ngithub.com/fatih/structs v1.1.0 h1:Q7juDM0QtcnhCpeyLGQKyg4TOIghuNXrkL32pHAUMxo=\ngithub.com/fatih/structs v1.1.0/go.mod h1:9NiDSp5zOcgEDl+j00MP/WkGVPOlPRLejGD8Ga6PJ7M=\ngithub.com/flashcatcloud/ibex v1.3.6 h1:lJShPFxcZksmkB0w99a3uROGB+Fie1NsqOlkAdar12A=\ngithub.com/flashcatcloud/ibex v1.3.6/go.mod h1:iTU1dKT9TnDNllRPRHUOjXe+HDTQkPH2TeaucHtSuh4=\ngithub.com/fortytw2/leaktest v1.3.0 h1:u8491cBMTQ8ft8aeV+adlcytMZylmA5nnwwkRZjI8vw=\ngithub.com/fortytw2/leaktest v1.3.0/go.mod h1:jDsjWgpAGjm2CA7WthBh/CdZYEPF31XHquHwclZch5g=\ngithub.com/gabriel-vasile/mimetype v1.4.2 h1:w5qFW6JKBz9Y393Y4q372O9A7cUSequkh1Q7OhCmWKU=\ngithub.com/gabriel-vasile/mimetype v1.4.2/go.mod h1:zApsH/mKG4w07erKIaJPFiX0Tsq9BFQgN3qGY5GnNgA=\ngithub.com/garyburd/redigo v1.6.2/go.mod h1:NR3MbYisc3/PwhQ00EMzDiPmrwpPxAn5GI05/YaO1SY=\ngithub.com/gin-contrib/pprof v1.4.0 h1:XxiBSf5jWZ5i16lNOPbMTVdgHBdhfGRD5PZ1LWazzvg=\ngithub.com/gin-contrib/pprof v1.4.0/go.mod h1:RrehPJasUVBPK6yTUwOl8/NP6i0vbUgmxtis+Z5KE90=\ngithub.com/gin-contrib/sse v0.1.0 h1:Y/yl/+YNO8GZSjAhjMsSuLt29uWRFHdHYUb5lYOV9qE=\ngithub.com/gin-contrib/sse v0.1.0/go.mod h1:RHrZQHXnP2xjPF+u1gW/2HnVO7nvIa9PG3Gm+fLHvGI=\ngithub.com/gin-gonic/gin v1.8.1/go.mod h1:ji8BvRH1azfM+SYow9zQ6SZMvR8qOMZHmsCuWR9tTTk=\ngithub.com/gin-gonic/gin v1.9.1 h1:4idEAncQnU5cB7BeOkPtxjfCSye0AAm1R0RVIqJ+Jmg=\ngithub.com/gin-gonic/gin v1.9.1/go.mod h1:hPrL7YrpYKXt5YId3A/Tnip5kqbEAP+KLuI3SUcPTeU=\ngithub.com/glebarez/go-sqlite v1.21.2 h1:3a6LFC4sKahUunAmynQKLZceZCOzUthkRkEAl9gAXWo=\ngithub.com/glebarez/go-sqlite v1.21.2/go.mod h1:sfxdZyhQjTM2Wry3gVYWaW072Ri1WMdWJi0k6+3382k=\ngithub.com/glebarez/sqlite v1.11.0 h1:wSG0irqzP6VurnMEpFGer5Li19RpIRi2qvQz++w0GMw=\ngithub.com/glebarez/sqlite v1.11.0/go.mod h1:h8/o8j5wiAsqSPoWELDUdJXhjAhsVliSn7bWZjOhrgQ=\ngithub.com/go-asn1-ber/asn1-ber v1.5.4 h1:vXT6d/FNDiELJnLb6hGNa309LMsrCoYFvpwHDF0+Y1A=\ngithub.com/go-asn1-ber/asn1-ber v1.5.4/go.mod h1:hEBeB/ic+5LoWskz+yKT7vGhhPYkProFKoKdwZRWMe0=\ngithub.com/go-faster/city v1.0.1 h1:4WAxSZ3V2Ws4QRDrscLEDcibJY8uf41H6AhXDrNDcGw=\ngithub.com/go-faster/city v1.0.1/go.mod h1:jKcUJId49qdW3L1qKHH/3wPeUstCVpVSXTM6vO3VcTw=\ngithub.com/go-faster/errors v0.7.1 h1:MkJTnDoEdi9pDabt1dpWf7AA8/BaSYZqibYyhZ20AYg=\ngithub.com/go-faster/errors v0.7.1/go.mod h1:5ySTjWFiphBs07IKuiL69nxdfd5+fzh1u7FPGZP2quo=\ngithub.com/go-kit/log v0.2.1 h1:MRVx0/zhvdseW+Gza6N9rVzU/IVzaeE1SFI4raAhmBU=\ngithub.com/go-kit/log v0.2.1/go.mod h1:NwTd00d/i8cPZ3xOwwiv2PO5MOcx78fFErGNcVmBjv0=\ngithub.com/go-ldap/ldap/v3 v3.4.4 h1:qPjipEpt+qDa6SI/h1fzuGWoRUY+qqQ9sOZq67/PYUs=\ngithub.com/go-ldap/ldap/v3 v3.4.4/go.mod h1:fe1MsuN5eJJ1FeLT/LEBVdWfNWKh459R7aXgXtJC+aI=\ngithub.com/go-logfmt/logfmt v0.6.0 h1:wGYYu3uicYdqXVgoYbvnkrPVXkuLM1p1ifugDMEdRi4=\ngithub.com/go-logfmt/logfmt v0.6.0/go.mod h1:WYhtIu8zTZfxdn5+rREduYbwxfcBr/Vr6KEVveWlfTs=\ngithub.com/go-playground/assert/v2 v2.0.1/go.mod h1:VDjEfimB/XKnb+ZQfWdccd7VUvScMdVu0Titje2rxJ4=\ngithub.com/go-playground/assert/v2 v2.2.0 h1:JvknZsQTYeFEAhQwI4qEt9cyV5ONwRHC+lYKSsYSR8s=\ngithub.com/go-playground/assert/v2 v2.2.0/go.mod h1:VDjEfimB/XKnb+ZQfWdccd7VUvScMdVu0Titje2rxJ4=\ngithub.com/go-playground/locales v0.14.0/go.mod h1:sawfccIbzZTqEDETgFXqTho0QybSa7l++s0DH+LDiLs=\ngithub.com/go-playground/locales v0.14.1 h1:EWaQ/wswjilfKLTECiXz7Rh+3BjFhfDFKv/oXslEjJA=\ngithub.com/go-playground/locales v0.14.1/go.mod h1:hxrqLVvrK65+Rwrd5Fc6F2O76J/NuW9t0sjnWqG1slY=\ngithub.com/go-playground/universal-translator v0.18.0/go.mod h1:UvRDBj+xPUEGrFYl+lu/H90nyDXpg0fqeB/AQUGNTVA=\ngithub.com/go-playground/universal-translator v0.18.1 h1:Bcnm0ZwsGyWbCzImXv+pAJnYK9S473LQFuzCbDbfSFY=\ngithub.com/go-playground/universal-translator v0.18.1/go.mod h1:xekY+UJKNuX9WP91TpwSH2VMlDf28Uj24BCp08ZFTUY=\ngithub.com/go-playground/validator/v10 v10.10.0/go.mod h1:74x4gJWsvQexRdW8Pn3dXSGrTK4nAUsbPlLADvpJkos=\ngithub.com/go-playground/validator/v10 v10.14.0 h1:vgvQWe3XCz3gIeFDm/HnTIbj6UGmg/+t63MyGU2n5js=\ngithub.com/go-playground/validator/v10 v10.14.0/go.mod h1:9iXMNT7sEkjXb0I+enO7QXmzG6QCsPWY4zveKFVRSyU=\ngithub.com/go-sql-driver/mysql v1.6.0/go.mod h1:DCzpHaOWr8IXmIStZouvnhqoel9Qv2LBy8hT2VhHyBg=\ngithub.com/go-sql-driver/mysql v1.7.1 h1:lUIinVbN1DY0xBg0eMOzmmtGoHwWBbvnWubQUrtU8EI=\ngithub.com/go-sql-driver/mysql v1.7.1/go.mod h1:OXbVy3sEdcQ2Doequ6Z5BW6fXNQTmx+9S1MCJN5yJMI=\ngithub.com/goccy/go-json v0.9.7/go.mod h1:6MelG93GURQebXPDq3khkgXZkazVtN9CRI+MGFi0w8I=\ngithub.com/goccy/go-json v0.10.2 h1:CrxCmQqYDkv1z7lO7Wbh2HN93uovUHgrECaO5ZrCXAU=\ngithub.com/goccy/go-json v0.10.2/go.mod h1:6MelG93GURQebXPDq3khkgXZkazVtN9CRI+MGFi0w8I=\ngithub.com/gogo/protobuf v1.3.2 h1:Ov1cvc58UF3b5XjBnZv7+opcTcQFZebYjWzi34vdm4Q=\ngithub.com/gogo/protobuf v1.3.2/go.mod h1:P1XiOD3dCwIKUDQYPy72D8LYyHL2YPYrpS2s69NZV8Q=\ngithub.com/golang-jwt/jwt v3.2.2+incompatible h1:IfV12K8xAKAnZqdXVzCZ+TOjboZ2keLg81eXfW3O+oY=\ngithub.com/golang-jwt/jwt v3.2.2+incompatible/go.mod h1:8pz2t5EyA70fFQQSrl6XZXzqecmYZeUEB8OUGHkxJ+I=\ngithub.com/golang-jwt/jwt/v4 v4.5.0 h1:7cYmW1XlMY7h7ii7UhUyChSgS5wUJEnm9uZVTGqOWzg=\ngithub.com/golang-jwt/jwt/v4 v4.5.0/go.mod h1:m21LjoU+eqJr34lmDMbreY2eSTRJ1cv77w39/MY0Ch0=\ngithub.com/golang/freetype v0.0.0-20170609003504-e2365dfdc4a0 h1:DACJavvAHhabrF08vX0COfcOBJRhZ8lUbR+ZWIs0Y5g=\ngithub.com/golang/freetype v0.0.0-20170609003504-e2365dfdc4a0/go.mod h1:E/TSTwGwJL78qG/PmXZO1EjYhfJinVAhrmmHX6Z8B9k=\ngithub.com/golang/glog v0.0.0-20160126235308-23def4e6c14b/go.mod h1:SBH7ygxi8pfUlaOkMMuAQtPIUF8ecWP5IEl/CR7VP2Q=\ngithub.com/golang/mock v1.1.1/go.mod h1:oTYuIxOrZwtPieC+H1uAHpcLFnEyAGVDL/k47Jfbm0A=\ngithub.com/golang/protobuf v1.2.0/go.mod h1:6lQm79b+lXiMfvg/cZm0SGofjICqVBUtrP5yJMmIC1U=\ngithub.com/golang/protobuf v1.3.2/go.mod h1:6lQm79b+lXiMfvg/cZm0SGofjICqVBUtrP5yJMmIC1U=\ngithub.com/golang/protobuf v1.3.3/go.mod h1:vzj43D7+SQXF/4pzW/hwtAqwc6iTitCiVSaWz5lYuqw=\ngithub.com/golang/protobuf v1.4.0-rc.1/go.mod h1:ceaxUfeHdC40wWswd/P6IGgMaK3YpKi5j83Wpe3EHw8=\ngithub.com/golang/protobuf v1.4.0-rc.1.0.20200221234624-67d41d38c208/go.mod h1:xKAWHe0F5eneWXFV3EuXVDTCmh+JuBKY0li0aMyXATA=\ngithub.com/golang/protobuf v1.4.0-rc.2/go.mod h1:LlEzMj4AhA7rCAGe4KMBDvJI+AwstrUpVNzEA03Pprs=\ngithub.com/golang/protobuf v1.4.0-rc.4.0.20200313231945-b860323f09d0/go.mod h1:WU3c8KckQ9AFe+yFwt9sWVRKCVIyN9cPHBJSNnbL67w=\ngithub.com/golang/protobuf v1.4.0/go.mod h1:jodUvKwWbYaEsadDk5Fwe5c77LiNKVO9IDvqG2KuDX0=\ngithub.com/golang/protobuf v1.4.2/go.mod h1:oDoupMAO8OvCJWAcko0GGGIgR6R6ocIYbsSw735rRwI=\ngithub.com/golang/protobuf v1.5.0/go.mod h1:FsONVRAS9T7sI+LIUmWTfcYkHO4aIWwzhcaSAoJOfIk=\ngithub.com/golang/protobuf v1.5.4 h1:i7eJL8qZTpSEXOPTxNKhASYpMn+8e5Q6AdndVa1dWek=\ngithub.com/golang/protobuf v1.5.4/go.mod h1:lnTiLA8Wa4RWRcIUkrtSVa5nRhsEGBg48fD6rSs7xps=\ngithub.com/golang/snappy v0.0.1/go.mod h1:/XxbfmMg8lxefKM7IXC3fBNl/7bRcc72aCRzEWrmP2Q=\ngithub.com/golang/snappy v0.0.4 h1:yAGX7huGHXlcLOEtBnF4w7FQwA26wojNCwOYAEhLjQM=\ngithub.com/golang/snappy v0.0.4/go.mod h1:/XxbfmMg8lxefKM7IXC3fBNl/7bRcc72aCRzEWrmP2Q=\ngithub.com/google/go-cmp v0.2.0/go.mod h1:oXzfMopK8JAjlY9xF4vHSVASa0yLyX7SntLO5aqRK0M=\ngithub.com/google/go-cmp v0.3.0/go.mod h1:8QqcDgzrUqlUb/G2PQTWiueGozuR1884gddMywk6iLU=\ngithub.com/google/go-cmp v0.3.1/go.mod h1:8QqcDgzrUqlUb/G2PQTWiueGozuR1884gddMywk6iLU=\ngithub.com/google/go-cmp v0.4.0/go.mod h1:v8dTdLbMG2kIc/vJvl+f65V22dbkXbowE6jgT/gNBxE=\ngithub.com/google/go-cmp v0.5.2/go.mod h1:v8dTdLbMG2kIc/vJvl+f65V22dbkXbowE6jgT/gNBxE=\ngithub.com/google/go-cmp v0.5.5/go.mod h1:v8dTdLbMG2kIc/vJvl+f65V22dbkXbowE6jgT/gNBxE=\ngithub.com/google/go-cmp v0.5.8/go.mod h1:17dUlkBOakJ0+DkrSSNjCkIjxS6bF9zb3elmeNGIjoY=\ngithub.com/google/go-cmp v0.6.0 h1:ofyhxvXcZhMsU5ulbFiLKl/XBFqE1GSq7atu8tAmTRI=\ngithub.com/google/go-cmp v0.6.0/go.mod h1:17dUlkBOakJ0+DkrSSNjCkIjxS6bF9zb3elmeNGIjoY=\ngithub.com/google/gofuzz v1.0.0/go.mod h1:dBl0BpW6vV/+mYPU4Po3pmUjxk6FQPldtuIdl/M65Eg=\ngithub.com/google/pprof v0.0.0-20230705174524-200ffdc848b8 h1:n6vlPhxsA+BW/XsS5+uqi7GyzaLa5MH7qlSLBZtRdiA=\ngithub.com/google/pprof v0.0.0-20230705174524-200ffdc848b8/go.mod h1:Jh3hGz2jkYak8qXPD19ryItVnUgpgeqzdkY/D0EaeuA=\ngithub.com/google/uuid v1.6.0 h1:NIvaJDMOsjHA8n1jAhLSgzrAzy1Hgr+hNrb57e+94F0=\ngithub.com/google/uuid v1.6.0/go.mod h1:TIyPZe4MgqvfeYDBFedMoGGpEw/LqOeaOT+nhxU+yHo=\ngithub.com/gopherjs/gopherjs v0.0.0-20181017120253-0766667cb4d1/go.mod h1:wJfORRmW1u3UXTncJ5qlYoELFm8eSnnEO6hX4iZ3EWY=\ngithub.com/gopherjs/gopherjs v0.0.0-20200217142428-fce0ec30dd00/go.mod h1:wJfORRmW1u3UXTncJ5qlYoELFm8eSnnEO6hX4iZ3EWY=\ngithub.com/gorilla/securecookie v1.1.1/go.mod h1:ra0sb63/xPlUeL+yeDciTfxMRAA+MP+HVt/4epWDjd4=\ngithub.com/gorilla/sessions v1.2.1/go.mod h1:dk2InVEVJ0sfLlnXv9EAgkf6ecYs/i80K/zI+bUmuGM=\ngithub.com/gorilla/websocket v1.5.0/go.mod h1:YR8l580nyteQvAITg2hZ9XVh4b55+EU/adAjf1fMHhE=\ngithub.com/grafana/regexp v0.0.0-20221122212121-6b5c0a4cb7fd h1:PpuIBO5P3e9hpqBD0O/HjhShYuM6XE0i/lbE6J94kww=\ngithub.com/grafana/regexp v0.0.0-20221122212121-6b5c0a4cb7fd/go.mod h1:M5qHK+eWfAv8VR/265dIuEpL3fNfeC21tXXp9itM24A=\ngithub.com/hashicorp/errwrap v1.0.0/go.mod h1:YH+1FKiLXxHSkmPseP+kNlulaMuP3n2brvKWEqk/Jc4=\ngithub.com/hashicorp/errwrap v1.1.0 h1:OxrOeh75EUXMY8TBjag2fzXGZ40LB6IKw45YeGUDY2I=\ngithub.com/hashicorp/errwrap v1.1.0/go.mod h1:YH+1FKiLXxHSkmPseP+kNlulaMuP3n2brvKWEqk/Jc4=\ngithub.com/hashicorp/go-multierror v1.1.1 h1:H5DkEtf6CXdFp0N0Em5UCwQpXMWke8IA0+lD48awMYo=\ngithub.com/hashicorp/go-multierror v1.1.1/go.mod h1:iw975J/qwKPdAO1clOe2L8331t/9/fmwbPZ6JB6eMoM=\ngithub.com/hashicorp/go-uuid v1.0.2/go.mod h1:6SBZvOh/SIDV7/2o3Jml5SYk/TvGqwFJ/bN7x4byOro=\ngithub.com/hashicorp/go-uuid v1.0.3 h1:2gKiV6YVmrJ1i2CKKa9obLvRieoRGviZFL26PcT/Co8=\ngithub.com/hashicorp/go-uuid v1.0.3/go.mod h1:6SBZvOh/SIDV7/2o3Jml5SYk/TvGqwFJ/bN7x4byOro=\ngithub.com/hashicorp/go-version v1.6.0 h1:feTTfFNnjP967rlCxM/I9g701jU+RN74YKx2mOkIeek=\ngithub.com/hashicorp/go-version v1.6.0/go.mod h1:fltr4n8CU8Ke44wwGCBoEymUuxUHl09ZGVZPK5anwXA=\ngithub.com/jackc/pgpassfile v1.0.0 h1:/6Hmqy13Ss2zCq62VdNG8tM1wchn8zjSGOBJ6icpsIM=\ngithub.com/jackc/pgpassfile v1.0.0/go.mod h1:CEx0iS5ambNFdcRtxPj5JhEz+xB6uRky5eyVu/W2HEg=\ngithub.com/jackc/pgservicefile v0.0.0-20240606120523-5a60cdf6a761 h1:iCEnooe7UlwOQYpKFhBabPMi4aNAfoODPEFNiAnClxo=\ngithub.com/jackc/pgservicefile v0.0.0-20240606120523-5a60cdf6a761/go.mod h1:5TJZWKEWniPve33vlWYSoGYefn3gLQRzjfDlhSJ9ZKM=\ngithub.com/jackc/pgx/v5 v5.7.1 h1:x7SYsPBYDkHDksogeSmZZ5xzThcTgRz++I5E+ePFUcs=\ngithub.com/jackc/pgx/v5 v5.7.1/go.mod h1:e7O26IywZZ+naJtWWos6i6fvWK+29etgITqrqHLfoZA=\ngithub.com/jackc/puddle/v2 v2.2.2 h1:PR8nw+E/1w0GLuRFSmiioY6UooMp6KJv0/61nB7icHo=\ngithub.com/jackc/puddle/v2 v2.2.2/go.mod h1:vriiEXHvEE654aYKXXjOvZM39qJ0q+azkZFrfEOc3H4=\ngithub.com/jcmturner/aescts/v2 v2.0.0 h1:9YKLH6ey7H4eDBXW8khjYslgyqG2xZikXP0EQFKrle8=\ngithub.com/jcmturner/aescts/v2 v2.0.0/go.mod h1:AiaICIRyfYg35RUkr8yESTqvSy7csK90qZ5xfvvsoNs=\ngithub.com/jcmturner/dnsutils/v2 v2.0.0 h1:lltnkeZGL0wILNvrNiVCR6Ro5PGU/SeBvVO/8c/iPbo=\ngithub.com/jcmturner/dnsutils/v2 v2.0.0/go.mod h1:b0TnjGOvI/n42bZa+hmXL+kFJZsFT7G4t3HTlQ184QM=\ngithub.com/jcmturner/gofork v1.7.6 h1:QH0l3hzAU1tfT3rZCnW5zXl+orbkNMMRGJfdJjHVETg=\ngithub.com/jcmturner/gofork v1.7.6/go.mod h1:1622LH6i/EZqLloHfE7IeZ0uEJwMSUyQ/nDd82IeqRo=\ngithub.com/jcmturner/goidentity/v6 v6.0.1 h1:VKnZd2oEIMorCTsFBnJWbExfNN7yZr3EhJAxwOkZg6o=\ngithub.com/jcmturner/goidentity/v6 v6.0.1/go.mod h1:X1YW3bgtvwAXju7V3LCIMpY0Gbxyjn/mY9zx4tFonSg=\ngithub.com/jcmturner/gokrb5/v8 v8.4.4 h1:x1Sv4HaTpepFkXbt2IkL29DXRf8sOfZXo8eRKh687T8=\ngithub.com/jcmturner/gokrb5/v8 v8.4.4/go.mod h1:1btQEpgT6k+unzCwX1KdWMEwPPkkgBtP+F6aCACiMrs=\ngithub.com/jcmturner/rpc/v2 v2.0.3 h1:7FXXj8Ti1IaVFpSAziCZWNzbNuZmnvw/i6CqLNdWfZY=\ngithub.com/jcmturner/rpc/v2 v2.0.3/go.mod h1:VUJYCIDm3PVOEHw8sgt091/20OJjskO/YJki3ELg/Hc=\ngithub.com/jinzhu/copier v0.4.0 h1:w3ciUoD19shMCRargcpm0cm91ytaBhDvuRpz1ODO/U8=\ngithub.com/jinzhu/copier v0.4.0/go.mod h1:DfbEm0FYsaqBcKcFuvmOZb218JkPGtvSHsKg8S8hyyg=\ngithub.com/jinzhu/inflection v1.0.0 h1:K317FqzuhWc8YvSVlFMCCUb36O/S9MCKRDI7QkRKD/E=\ngithub.com/jinzhu/inflection v1.0.0/go.mod h1:h+uFLlag+Qp1Va5pdKtLDYj+kHp5pxUVkryuEj+Srlc=\ngithub.com/jinzhu/now v1.1.4/go.mod h1:d3SSVoowX0Lcu0IBviAWJpolVfI5UJVZZ7cO71lE/z8=\ngithub.com/jinzhu/now v1.1.5 h1:/o9tlHleP7gOFmsnYNz3RGnqzefHA47wQpKrrdTIwXQ=\ngithub.com/jinzhu/now v1.1.5/go.mod h1:d3SSVoowX0Lcu0IBviAWJpolVfI5UJVZZ7cO71lE/z8=\ngithub.com/jmespath/go-jmespath v0.4.0 h1:BEgLn5cpjn8UN1mAw4NjwDrS35OdebyEtFe+9YPoQUg=\ngithub.com/jmespath/go-jmespath v0.4.0/go.mod h1:T8mJZnbsbmF+m6zOOFylbeCJqk5+pHWvzYPziyZiYoo=\ngithub.com/jmespath/go-jmespath/internal/testify v1.5.1/go.mod h1:L3OGu8Wl2/fWfCI6z80xFu9LTZmf1ZRjMHUOPmWr69U=\ngithub.com/josharian/intern v1.0.0 h1:vlS4z54oSdjm0bgjRigI+G1HpF+tI+9rE5LLzOg8HmY=\ngithub.com/josharian/intern v1.0.0/go.mod h1:5DoeVV0s6jJacbCEi61lwdGj/aVlrQvzHFFd8Hwg//Y=\ngithub.com/jpillora/backoff v1.0.0 h1:uvFg412JmmHBHw7iwprIxkPMI+sGQ4kzOWsMeHnm2EA=\ngithub.com/jpillora/backoff v1.0.0/go.mod h1:J/6gKK9jxlEcS3zixgDgUAsiuZ7yrSoa/FX5e0EB2j4=\ngithub.com/json-iterator/go v1.1.10/go.mod h1:KdQUCv79m/52Kvf8AW2vK1V8akMuk1QjK/uOdHXbAo4=\ngithub.com/json-iterator/go v1.1.12 h1:PV8peI4a0ysnczrg+LtxykD8LfKY9ML6u2jnxaEnrnM=\ngithub.com/json-iterator/go v1.1.12/go.mod h1:e30LSqwooZae/UwlEbR2852Gd8hjQvJoHmT4TnhNGBo=\ngithub.com/jtolds/gls v4.20.0+incompatible/go.mod h1:QJZ7F/aHp+rZTRtaJ1ow/lLfFfVYBRgL+9YlvaHOwJU=\ngithub.com/kisielk/errcheck v1.5.0/go.mod h1:pFxgyoBC7bSaBwPgfKdkLd5X25qrDl4LWUI2bnpBCr8=\ngithub.com/kisielk/gotool v1.0.0/go.mod h1:XhKaO+MFFWcvkIS/tQcRk01m1F5IRFswLeQ+oQHNcck=\ngithub.com/klauspost/compress v1.13.6/go.mod h1:/3/Vjq9QcHkK5uEr5lBEmyoZ1iFhe47etQ6QUkpK6sk=\ngithub.com/klauspost/compress v1.17.11 h1:In6xLpyWOi1+C7tXUUWv2ot1QvBjxevKAaI6IXrJmUc=\ngithub.com/klauspost/compress v1.17.11/go.mod h1:pMDklpSncoRMuLFrf1W9Ss9KT+0rH90U12bZKk7uwG0=\ngithub.com/klauspost/cpuid/v2 v2.0.9/go.mod h1:FInQzS24/EEf25PyTYn52gqo7WaD8xa0213Md/qVLRg=\ngithub.com/klauspost/cpuid/v2 v2.2.4/go.mod h1:RVVoqg1df56z8g3pUjL/3lE5UfnlrJX8tyFgg4nqhuY=\ngithub.com/klauspost/cpuid/v2 v2.2.5 h1:0E5MSMDEoAulmXNFquVs//DdoomxaoTY1kUhbc/qbZg=\ngithub.com/klauspost/cpuid/v2 v2.2.5/go.mod h1:Lcz8mBdAVJIBVzewtcLocK12l3Y+JytZYpaMropDUws=\ngithub.com/koding/multiconfig v0.0.0-20171124222453-69c27309b2d7 h1:SWlt7BoQNASbhTUD0Oy5yysI2seJ7vWuGUp///OM4TM=\ngithub.com/koding/multiconfig v0.0.0-20171124222453-69c27309b2d7/go.mod h1:Y2SaZf2Rzd0pXkLVhLlCiAXFCLSXAIbTKDivVgff/AM=\ngithub.com/kr/pretty v0.1.0/go.mod h1:dAy3ld7l9f0ibDNOQOHHMYYIIbhfbHSm3C4ZsoJORNo=\ngithub.com/kr/pretty v0.2.1/go.mod h1:ipq/a2n7PKx3OHsz4KJII5eveXtPO4qwEXGdVfWzfnI=\ngithub.com/kr/pretty v0.3.0/go.mod h1:640gp4NfQd8pI5XOwp5fnNeVWj67G7CFk/SaSQn7NBk=\ngithub.com/kr/pretty v0.3.1 h1:flRD4NNwYAUpkphVc1HcthR4KEIFJ65n8Mw5qdRn3LE=\ngithub.com/kr/pretty v0.3.1/go.mod h1:hoEshYVHaxMs3cyo3Yncou5ZscifuDolrwPKZanG3xk=\ngithub.com/kr/pty v1.1.1/go.mod h1:pFQYn66WHrOpPYNljwOMqo10TkYh1fy3cYio2l3bCsQ=\ngithub.com/kr/text v0.1.0/go.mod h1:4Jbv+DJW3UT/LiOwJeYQe1efqtUx/iVham/4vfdArNI=\ngithub.com/kr/text v0.2.0 h1:5Nx0Ya0ZqY2ygV366QzturHI13Jq95ApcVaJBhpS+AY=\ngithub.com/kr/text v0.2.0/go.mod h1:eLer722TekiGuMkidMxC/pM04lWEeraHUUmBw8l2grE=\ngithub.com/kylelemons/godebug v1.1.0 h1:RPNrshWIDI6G2gRW9EHilWtl7Z6Sb1BR0xunSBf0SNc=\ngithub.com/kylelemons/godebug v1.1.0/go.mod h1:9/0rRGxNHcop5bhtWyNeEfOS8JIWk580+fNqagV/RAw=\ngithub.com/larksuite/oapi-sdk-go/v3 v3.5.1 h1:gX4dz92YU70inuIX+ug+PBe64eHToIN9rHB4Vupv5Eg=\ngithub.com/larksuite/oapi-sdk-go/v3 v3.5.1/go.mod h1:ZEplY+kwuIrj/nqw5uSCINNATcH3KdxSN7y+UxYY5fI=\ngithub.com/leodido/go-urn v1.2.1/go.mod h1:zt4jvISO2HfUBqxjfIshjdMTYS56ZS/qv49ictyFfxY=\ngithub.com/leodido/go-urn v1.2.4 h1:XlAE/cm/ms7TE/VMVoduSpNBoyc2dOxHs5MZSwAN63Q=\ngithub.com/leodido/go-urn v1.2.4/go.mod h1:7ZrI8mTSeBSHl/UaRyKQW1qZeMgak41ANeCNaVckg+4=\ngithub.com/lib/pq v1.10.9 h1:YXG7RB+JIjhP29X+OtkiDnYaXQwpS4JEWq7dtCCRUEw=\ngithub.com/lib/pq v1.10.9/go.mod h1:AlVN5x4E4T544tWzH6hKfbfQvm3HdbOxrmggDNAPY9o=\ngithub.com/mailru/easyjson v0.7.7 h1:UGYAvKxe3sBsEDzO8ZeWOSlIQfWFlxbzLZe7hwFURr0=\ngithub.com/mailru/easyjson v0.7.7/go.mod h1:xzfreul335JAWq5oZzymOObrkdz5UnU4kGfJJLY9Nlc=\ngithub.com/mattn/go-isatty v0.0.14/go.mod h1:7GGIvUiUoEMVVmxf/4nioHXj79iQHKdU27kJ6hsGG94=\ngithub.com/mattn/go-isatty v0.0.19 h1:JITubQf0MOLdlGRuRq+jtsDlekdYPia9ZFsB8h/APPA=\ngithub.com/mattn/go-isatty v0.0.19/go.mod h1:W+V8PltTTMOvKvAeJH7IuucS94S2C6jfK/D7dTCTo3Y=\ngithub.com/mattn/go-runewidth v0.0.10/go.mod h1:RAqKPSqVFrSLVXbA8x7dzmKdmGzieGRCM46jaSJTDAk=\ngithub.com/mattn/go-sqlite3 v1.14.17 h1:mCRHCLDUBXgpKAqIKsaAaAsrAlbkeomtRFKXh2L6YIM=\ngithub.com/mattn/go-sqlite3 v1.14.17/go.mod h1:2eHXhiwb8IkHr+BDWZGa96P6+rkvnG63S2DGjv9HUNg=\ngithub.com/mitchellh/mapstructure v1.5.0 h1:jeMsZIYE/09sWLaz43PL7Gy6RuMjD2eJVyuac5Z2hdY=\ngithub.com/mitchellh/mapstructure v1.5.0/go.mod h1:bFUtVrKA4DC2yAKiSyO/QUcy7e+RRV2QTWOzhPopBRo=\ngithub.com/modern-go/concurrent v0.0.0-20180228061459-e0a39a4cb421/go.mod h1:6dJC0mAP4ikYIbvyc7fijjWJddQyLn8Ig3JB5CqoB9Q=\ngithub.com/modern-go/concurrent v0.0.0-20180306012644-bacd9c7ef1dd h1:TRLaZ9cD/w8PVh93nsPXa1VrQ6jlwL5oN8l14QlcNfg=\ngithub.com/modern-go/concurrent v0.0.0-20180306012644-bacd9c7ef1dd/go.mod h1:6dJC0mAP4ikYIbvyc7fijjWJddQyLn8Ig3JB5CqoB9Q=\ngithub.com/modern-go/reflect2 v0.0.0-20180701023420-4b7aa43c6742/go.mod h1:bx2lNnkwVCuqBIxFjflWJWanXIb3RllmbCylyMrvgv0=\ngithub.com/modern-go/reflect2 v1.0.1/go.mod h1:bx2lNnkwVCuqBIxFjflWJWanXIb3RllmbCylyMrvgv0=\ngithub.com/modern-go/reflect2 v1.0.2 h1:xBagoLtFs94CBntxluKeaWgTMpvLxC4ur3nMaC9Gz0M=\ngithub.com/modern-go/reflect2 v1.0.2/go.mod h1:yWuevngMOJpCy52FWWMvUC8ws7m/LJsjYzDa0/r8luk=\ngithub.com/mojocn/base64Captcha v1.3.6 h1:gZEKu1nsKpttuIAQgWHO+4Mhhls8cAKyiV2Ew03H+Tw=\ngithub.com/mojocn/base64Captcha v1.3.6/go.mod h1:i5CtHvm+oMbj1UzEPXaA8IH/xHFZ3DGY3Wh3dBpZ28E=\ngithub.com/montanaflynn/stats v0.0.0-20171201202039-1bf9dbcd8cbe/go.mod h1:wL8QJuTMNUDYhXwkmfOly8iTdp5TEcJFWZD2D7SIkUc=\ngithub.com/munnerz/goautoneg v0.0.0-20191010083416-a7dc8b61c822 h1:C3w9PqII01/Oq1c1nUAm88MOHcQC9l5mIlSMApZMrHA=\ngithub.com/munnerz/goautoneg v0.0.0-20191010083416-a7dc8b61c822/go.mod h1:+n7T8mK8HuQTcFwEeznm/DIxMOiR9yIdICNftLE1DvQ=\ngithub.com/mwitkow/go-conntrack v0.0.0-20190716064945-2f068394615f h1:KUppIJq7/+SVif2QVs3tOP0zanoHgBEVAwHxUSIzRqU=\ngithub.com/mwitkow/go-conntrack v0.0.0-20190716064945-2f068394615f/go.mod h1:qRWi+5nqEBWmkhHvq77mSJWrCKwh8bxhgT7d/eI7P4U=\ngithub.com/n9e/elastic/v7 v7.0.33-0.20251031061708-f480a2dfcfa7 h1:fPs1GClmnQZ6E/nzrJCieQKJNM46eqMkHaBg3SoHcgY=\ngithub.com/n9e/elastic/v7 v7.0.33-0.20251031061708-f480a2dfcfa7/go.mod h1:/kVskIy0Pd8nAiKtPtcI4XnzOM+pM6MWQ+zP6YqPVFI=\ngithub.com/niemeyer/pretty v0.0.0-20200227124842-a10e7caefd8e/go.mod h1:zD1mROLANZcx1PVRCS0qkT7pwLkGfwJo4zjcN/Tysno=\ngithub.com/oklog/ulid v1.3.1 h1:EGfNDEx6MqHz8B3uNV6QAib1UR2Lm97sHi3ocA6ESJ4=\ngithub.com/oklog/ulid v1.3.1/go.mod h1:CirwcVhetQ6Lv90oh/F+FBtV6XMibvdAFo93nm5qn4U=\ngithub.com/opensearch-project/opensearch-go/v2 v2.3.0 h1:nQIEMr+A92CkhHrZgUhcfsrZjibvB3APXf2a1VwCmMQ=\ngithub.com/opensearch-project/opensearch-go/v2 v2.3.0/go.mod h1:8LDr9FCgUTVoT+5ESjc2+iaZuldqE+23Iq0r1XeNue8=\ngithub.com/patrickmn/go-cache v2.1.0+incompatible h1:HRMgzkcYKYpi3C8ajMPV8OFXaaRUnok+kx1WdO15EQc=\ngithub.com/patrickmn/go-cache v2.1.0+incompatible/go.mod h1:3Qf8kWWT7OJRJbdiICTKqZju1ZixQ/KpMGzzAfe6+WQ=\ngithub.com/paulmach/orb v0.11.1 h1:3koVegMC4X/WeiXYz9iswopaTwMem53NzTJuTF20JzU=\ngithub.com/paulmach/orb v0.11.1/go.mod h1:5mULz1xQfs3bmQm63QEJA6lNGujuRafwA5S/EnuLaLU=\ngithub.com/paulmach/protoscan v0.2.1/go.mod h1:SpcSwydNLrxUGSDvXvO0P7g7AuhJ7lcKfDlhJCDw2gY=\ngithub.com/pelletier/go-toml/v2 v2.0.1/go.mod h1:r9LEWfGN8R5k0VXJ+0BkIe7MYkRdwZOjgMj2KwnJFUo=\ngithub.com/pelletier/go-toml/v2 v2.0.8 h1:0ctb6s9mE31h0/lhu+J6OPmVeDxJn+kYnJc2jZR9tGQ=\ngithub.com/pelletier/go-toml/v2 v2.0.8/go.mod h1:vuYfssBdrU2XDZ9bYydBu6t+6a6PYNcZljzZR9VXg+4=\ngithub.com/pierrec/lz4/v4 v4.1.22 h1:cKFw6uJDK+/gfw5BcDL0JL5aBsAFdsIT18eRtLj7VIU=\ngithub.com/pierrec/lz4/v4 v4.1.22/go.mod h1:gZWDp/Ze/IJXGXf23ltt2EXimqmTUXEy0GFuRQyBid4=\ngithub.com/pingcap/errors v0.11.0/go.mod h1:Oi8TUi2kEtXXLMJk9l1cGmz20kV3TaQ0usTwv5KuLY8=\ngithub.com/pingcap/errors v0.11.5-0.20250523034308-74f78ae071ee h1:/IDPbpzkzA97t1/Z1+C3KlxbevjMeaI6BQYxvivu4u8=\ngithub.com/pingcap/errors v0.11.5-0.20250523034308-74f78ae071ee/go.mod h1:X2r9ueLEUZgtx2cIogM0v4Zj5uvvzhuuiu7Pn8HzMPg=\ngithub.com/pingcap/failpoint v0.0.0-20240528011301-b51a646c7c86 h1:tdMsjOqUR7YXHoBitzdebTvOjs/swniBTOLy5XiMtuE=\ngithub.com/pingcap/failpoint v0.0.0-20240528011301-b51a646c7c86/go.mod h1:exzhVYca3WRtd6gclGNErRWb1qEgff3LYta0LvRmON4=\ngithub.com/pingcap/log v1.1.0 h1:ELiPxACz7vdo1qAvvaWJg1NrYFoY6gqAh/+Uo6aXdD8=\ngithub.com/pingcap/log v1.1.0/go.mod h1:DWQW5jICDR7UJh4HtxXSM20Churx4CQL0fwL/SoOSA4=\ngithub.com/pingcap/tidb/pkg/parser v0.0.0-20260120034856-e15515e804da h1:PhkRZgMWdq9kTsu7vtVbcDs+SBXjHfFj84027WVZCzI=\ngithub.com/pingcap/tidb/pkg/parser v0.0.0-20260120034856-e15515e804da/go.mod h1:oHE+ub2QaDERd+UNHe4z2BhFV2jZrm7VNOe6atR9AF4=\ngithub.com/pkg/browser v0.0.0-20210911075715-681adbf594b8 h1:KoWmjvw+nsYOo29YJK9vDA65RGE3NrOnUtO7a+RF9HU=\ngithub.com/pkg/browser v0.0.0-20210911075715-681adbf594b8/go.mod h1:HKlIX3XHQyzLZPlr7++PzdhaXEj94dEiJgZDTsxEqUI=\ngithub.com/pkg/diff v0.0.0-20210226163009-20ebb0f2a09e/go.mod h1:pJLUxLENpZxwdsKMEsNbx1VGcRFpLqf3715MtcvvzbA=\ngithub.com/pkg/errors v0.8.1/go.mod h1:bwawxfHBFNV+L2hUp1rHADufV3IMtnDRdf1r5NINEl0=\ngithub.com/pkg/errors v0.9.1 h1:FEBLx1zS214owpjy7qsBeixbURkuhQAwrK5UwLGTwt4=\ngithub.com/pkg/errors v0.9.1/go.mod h1:bwawxfHBFNV+L2hUp1rHADufV3IMtnDRdf1r5NINEl0=\ngithub.com/pmezard/go-difflib v1.0.0/go.mod h1:iKH77koFhYxTK1pcRnkKkqfTogsbg7gZNVY4sRDYZ/4=\ngithub.com/pmezard/go-difflib v1.0.1-0.20181226105442-5d4384ee4fb2 h1:Jamvg5psRIccs7FGNTlIRMkT8wgtp5eCXdBlqhYGL6U=\ngithub.com/pmezard/go-difflib v1.0.1-0.20181226105442-5d4384ee4fb2/go.mod h1:iKH77koFhYxTK1pcRnkKkqfTogsbg7gZNVY4sRDYZ/4=\ngithub.com/pquerna/cachecontrol v0.1.0 h1:yJMy84ti9h/+OEWa752kBTKv4XC30OtVVHYv/8cTqKc=\ngithub.com/pquerna/cachecontrol v0.1.0/go.mod h1:NrUG3Z7Rdu85UNR3vm7SOsl1nFIeSiQnrHV5K9mBcUI=\ngithub.com/prashantv/gostub v1.1.0 h1:BTyx3RfQjRHnUWaGF9oQos79AlQ5k8WNktv7VGvVH4g=\ngithub.com/prashantv/gostub v1.1.0/go.mod h1:A5zLQHz7ieHGG7is6LLXLz7I8+3LZzsrV0P1IAHhP5U=\ngithub.com/prometheus/client_golang v1.20.5 h1:cxppBPuYhUnsO6yo/aoRol4L7q7UFfdm+bR9r+8l63Y=\ngithub.com/prometheus/client_golang v1.20.5/go.mod h1:PIEt8X02hGcP8JWbeHyeZ53Y/jReSnHgO035n//V5WE=\ngithub.com/prometheus/client_model v0.0.0-20190812154241-14fe0d1b01d4/go.mod h1:xMI15A0UPsDsEKsMN9yxemIoYk6Tm2C1GtYGdfGttqA=\ngithub.com/prometheus/client_model v0.6.1 h1:ZKSh/rekM+n3CeS952MLRAdFwIKqeY8b62p8ais2e9E=\ngithub.com/prometheus/client_model v0.6.1/go.mod h1:OrxVMOVHjw3lKMa8+x6HeMGkHMQyHDk9E3jmP2AmGiY=\ngithub.com/prometheus/common v0.60.1 h1:FUas6GcOw66yB/73KC+BOZoFJmbo/1pojoILArPAaSc=\ngithub.com/prometheus/common v0.60.1/go.mod h1:h0LYf1R1deLSKtD4Vdg8gy4RuOvENW2J/h19V5NADQw=\ngithub.com/prometheus/common/sigv4 v0.1.0 h1:qoVebwtwwEhS85Czm2dSROY5fTo2PAPEVdDeppTwGX4=\ngithub.com/prometheus/common/sigv4 v0.1.0/go.mod h1:2Jkxxk9yYvCkE5G1sQT7GuEXm57JrvHu9k5YwTjsNtI=\ngithub.com/prometheus/procfs v0.15.1 h1:YagwOFzUgYfKKHX6Dr+sHT7km/hxC76UB0learggepc=\ngithub.com/prometheus/procfs v0.15.1/go.mod h1:fB45yRUv8NstnjriLhBQLuOUt+WW4BsoGhij/e3PBqk=\ngithub.com/prometheus/prometheus v0.47.1 h1:bd2LiZyxzHn9Oo2Ei4eK2D86vz/L/OiqR1qYo0XmMBo=\ngithub.com/prometheus/prometheus v0.47.1/go.mod h1:J/bmOSjgH7lFxz2gZhrWEZs2i64vMS+HIuZfmYNhJ/M=\ngithub.com/rakyll/statik v0.1.7 h1:OF3QCZUuyPxuGEP7B4ypUa7sB/iHtqOTDYZXGM8KOdQ=\ngithub.com/rakyll/statik v0.1.7/go.mod h1:AlZONWzMtEnMs7W4e/1LURLiI49pIMmp6V9Unghqrcc=\ngithub.com/rcrowley/go-metrics v0.0.0-20201227073835-cf1acfcdf475 h1:N/ElC8H3+5XpJzTSTfLsJV/mx9Q9g7kxmchpfZyxgzM=\ngithub.com/rcrowley/go-metrics v0.0.0-20201227073835-cf1acfcdf475/go.mod h1:bCqnVzQkZxMG4s8nGwiZ5l3QUCyqpo9Y+/ZMZ9VjZe4=\ngithub.com/redis/go-redis/v9 v9.0.2 h1:BA426Zqe/7r56kCcvxYLWe1mkaz71LKF77GwgFzSxfE=\ngithub.com/redis/go-redis/v9 v9.0.2/go.mod h1:/xDTe9EF1LM61hek62Poq2nzQSGj0xSrEtEHbBQevps=\ngithub.com/remyoudompheng/bigfft v0.0.0-20230129092748-24d4a6f8daec h1:W09IVJc94icq4NjY3clb7Lk8O1qJ8BdBEF8z0ibU0rE=\ngithub.com/remyoudompheng/bigfft v0.0.0-20230129092748-24d4a6f8daec/go.mod h1:qqbHyh8v60DhA7CoWK5oRCqLrMHRGoxYCSS9EjAz6Eo=\ngithub.com/rivo/uniseg v0.1.0/go.mod h1:J6wj4VEh+S6ZtnVlnTBMWIodfgj8LQOQFoIToxlJtxc=\ngithub.com/robfig/cron/v3 v3.0.1 h1:WdRxkvbJztn8LMz/QEvLN5sBU+xKpSqwwUO1Pjr4qDs=\ngithub.com/robfig/cron/v3 v3.0.1/go.mod h1:eQICP3HwyT7UooqI/z+Ov+PtYAWygg1TEWWzGIFLtro=\ngithub.com/robfig/go-cache v0.0.0-20130306151617-9fc39e0dbf62/go.mod h1:65XQgovT59RWatovFwnwocoUxiI/eENTnOY5GK3STuY=\ngithub.com/rogpeppe/go-internal v1.6.1/go.mod h1:xXDCJY+GAPziupqXw64V24skbSoqbTEfhy4qGm1nDQc=\ngithub.com/rogpeppe/go-internal v1.8.0/go.mod h1:WmiCO8CzOY8rg0OYDC4/i/2WRWAB6poM+XZ2dLUbcbE=\ngithub.com/rogpeppe/go-internal v1.13.1 h1:KvO1DLK/DRN07sQ1LQKScxyZJuNnedQ5/wKSR38lUII=\ngithub.com/rogpeppe/go-internal v1.13.1/go.mod h1:uMEvuHeurkdAXX61udpOXGD/AzZDWNMNyH2VO9fmH0o=\ngithub.com/scylladb/termtables v0.0.0-20191203121021-c4c0b6d42ff4/go.mod h1:C1a7PQSMz9NShzorzCiG2fk9+xuCgLkPeCvMHYR2OWg=\ngithub.com/segmentio/asm v1.2.0 h1:9BQrFxC+YOHJlTlHGkTrFWf59nbL3XnCoFLTwDCI7ys=\ngithub.com/segmentio/asm v1.2.0/go.mod h1:BqMnlJP91P8d+4ibuonYZw9mfnzI9HfxselHZr5aAcs=\ngithub.com/shopspring/decimal v1.4.0 h1:bxl37RwXBklmTi0C79JfXCEBD1cqqHt0bbgBAGFp81k=\ngithub.com/shopspring/decimal v1.4.0/go.mod h1:gawqmDU56v4yIKSwfBSFip1HdCCXN8/+DMd9qYNcwME=\ngithub.com/smartystreets/assertions v0.0.0-20180927180507-b2de0cb4f26d/go.mod h1:OnSkiWE9lh6wB0YB77sQom3nweQdgAjqCqsofrRNTgc=\ngithub.com/smartystreets/assertions v1.1.0/go.mod h1:tcbTF8ujkAEcZ8TElKY+i30BzYlVhC/LOxJk7iOWnoo=\ngithub.com/smartystreets/goconvey v1.6.4/go.mod h1:syvi0/a8iFYH4r/RixwvyeAJjdLS9QV7WQ/tjFTllLA=\ngithub.com/spaolacci/murmur3 v1.1.0 h1:7c1g84S4BPRrfL5Xrdp6fOJ206sU9y293DDHaoy0bLI=\ngithub.com/spaolacci/murmur3 v1.1.0/go.mod h1:JwIasOWyU6f++ZhiEuf87xNszmSA2myDM2Kzu9HwQUA=\ngithub.com/stretchr/objx v0.1.0/go.mod h1:HFkY916IF+rwdDfMAkV7OtwuqBVzrE8GR6GFx+wExME=\ngithub.com/stretchr/objx v0.2.0/go.mod h1:qt09Ya8vawLte6SNmTgCsAVtYtaKzEcn8ATUoHMkEqE=\ngithub.com/stretchr/objx v0.4.0/go.mod h1:YvHI0jy2hoMjB+UWwv71VJQ9isScKT/TqJzVSSt89Yw=\ngithub.com/stretchr/objx v0.5.0/go.mod h1:Yh+to48EsGEfYuaHDzXPcE3xhTkx73EhmCGUpEOglKo=\ngithub.com/stretchr/testify v1.3.0/go.mod h1:M5WIy9Dh21IEIfnGCwXGc5bZfKNJtfHm1UVUgZn+9EI=\ngithub.com/stretchr/testify v1.4.0/go.mod h1:j7eGeouHqKxXV5pUuKE4zz7dFj8WfuZ+81PSLYec5m4=\ngithub.com/stretchr/testify v1.5.1/go.mod h1:5W2xD1RspED5o8YsWQXVCued0rvSQ+mT+I5cxcmMvtA=\ngithub.com/stretchr/testify v1.6.1/go.mod h1:6Fq8oRcR53rry900zMqJjRRixrwX3KX962/h/Wwjteg=\ngithub.com/stretchr/testify v1.7.0/go.mod h1:6Fq8oRcR53rry900zMqJjRRixrwX3KX962/h/Wwjteg=\ngithub.com/stretchr/testify v1.7.1/go.mod h1:6Fq8oRcR53rry900zMqJjRRixrwX3KX962/h/Wwjteg=\ngithub.com/stretchr/testify v1.7.2/go.mod h1:R6va5+xMeoiuVRoj+gSkQ7d3FALtqAAGI1FQKckRals=\ngithub.com/stretchr/testify v1.8.0/go.mod h1:yNjHg4UonilssWZ8iaSj1OCr/vHnekPRkoO+kdMU+MU=\ngithub.com/stretchr/testify v1.8.1/go.mod h1:w2LPCIKwWwSfY2zedu0+kehJoqGctiVI29o6fzry7u4=\ngithub.com/stretchr/testify v1.8.2/go.mod h1:w2LPCIKwWwSfY2zedu0+kehJoqGctiVI29o6fzry7u4=\ngithub.com/stretchr/testify v1.8.3/go.mod h1:sz/lmYIOXD/1dqDmKjjqLyZ2RngseejIcXlSw2iwfAo=\ngithub.com/stretchr/testify v1.10.0 h1:Xv5erBjTwe/5IxqUQTdXv5kgmIvbHo3QQyRwhJsOfJA=\ngithub.com/stretchr/testify v1.10.0/go.mod h1:r2ic/lqez/lEtzL7wO/rwa5dbSLXVDPFyf8C91i36aY=\ngithub.com/tidwall/gjson v1.14.2 h1:6BBkirS0rAHjumnjHF6qgy5d2YAJ1TLIaFE2lzfOLqo=\ngithub.com/tidwall/gjson v1.14.2/go.mod h1:/wbyibRr2FHMks5tjHJ5F8dMZh3AcwJEMf5vlfC0lxk=\ngithub.com/tidwall/match v1.1.1 h1:+Ho715JplO36QYgwN9PGYNhgZvoUSc9X2c80KVTi+GA=\ngithub.com/tidwall/match v1.1.1/go.mod h1:eRSPERbgtNPcGhD8UCthc6PmLEQXEWd3PRB5JTxsfmM=\ngithub.com/tidwall/pretty v1.0.0/go.mod h1:XNkn88O1ChpSDQmQeStsy+sBenx6DDtFZJxhVysOjyk=\ngithub.com/tidwall/pretty v1.2.0 h1:RWIZEg2iJ8/g6fDDYzMpobmaoGh5OLl4AXtGUGPcqCs=\ngithub.com/tidwall/pretty v1.2.0/go.mod h1:ITEVvHYasfjBbM0u2Pg8T2nJnzm8xPwvNhhsoaGGjNU=\ngithub.com/tjfoc/gmsm v1.3.2/go.mod h1:HaUcFuY0auTiaHB9MHFGCPx5IaLhTUd2atbCFBQXn9w=\ngithub.com/tjfoc/gmsm v1.4.1 h1:aMe1GlZb+0bLjn+cKTPEvvn9oUEBlJitaZiiBwsbgho=\ngithub.com/tjfoc/gmsm v1.4.1/go.mod h1:j4INPkHWMrhJb38G+J6W4Tw0AbuN8Thu3PbdVYhVcTE=\ngithub.com/toolkits/pkg v1.3.8 h1:2yamC20c5mHRtbcGiLY99Lm/2mVitFn6onE8KKvMT1o=\ngithub.com/toolkits/pkg v1.3.8/go.mod h1:M9ecwFGW1vxCTUFM9sr2ZjXSKb04N+1sTQ6SA3RNAIU=\ngithub.com/twitchyliquid64/golang-asm v0.15.1 h1:SU5vSMR7hnwNxj24w34ZyCi/FmDZTkS4MhqMhdFk5YI=\ngithub.com/twitchyliquid64/golang-asm v0.15.1/go.mod h1:a1lVb/DtPvCB8fslRZhAngC2+aY1QWCk3Cedj/Gdt08=\ngithub.com/ugorji/go v1.2.7/go.mod h1:nF9osbDWLy6bDVv/Rtoh6QgnvNDpmCalQV5urGCCS6M=\ngithub.com/ugorji/go/codec v1.2.7/go.mod h1:WGN1fab3R1fzQlVQTkfxVtIBhWDRqOviHU95kRgeqEY=\ngithub.com/ugorji/go/codec v1.2.11 h1:BMaWp1Bb6fHwEtbplGBGJ498wD+LKlNSl25MjdZY4dU=\ngithub.com/ugorji/go/codec v1.2.11/go.mod h1:UNopzCgEMSXjBc6AOMqYvWC1ktqTAfzJZUZgYf6w6lg=\ngithub.com/valyala/fastrand v1.1.0 h1:f+5HkLW4rsgzdNoleUOB69hyT9IlD2ZQh9GyDMfb5G8=\ngithub.com/valyala/fastrand v1.1.0/go.mod h1:HWqCzkrkg6QXT8V2EXWvXCoow7vLwOFN002oeRzjapQ=\ngithub.com/valyala/histogram v1.2.0 h1:wyYGAZZt3CpwUiIb9AU/Zbllg1llXyrtApRS815OLoQ=\ngithub.com/valyala/histogram v1.2.0/go.mod h1:Hb4kBwb4UxsaNbbbh+RRz8ZR6pdodR57tzWUS3BUzXY=\ngithub.com/xdg-go/pbkdf2 v1.0.0/go.mod h1:jrpuAogTd400dnrH08LKmI/xc1MbPOebTwRqcT5RDeI=\ngithub.com/xdg-go/scram v1.1.1/go.mod h1:RaEWvsqvNKKvBPvcKeFjrG2cJqOkHTiyTpzz23ni57g=\ngithub.com/xdg-go/stringprep v1.0.3/go.mod h1:W3f5j4i+9rC0kuIEJL0ky1VpHXQU3ocBgklLGvcBnW8=\ngithub.com/youmark/pkcs8 v0.0.0-20181117223130-1be2e3e5546d/go.mod h1:rHwXgn7JulP+udvsHwJoVG1YGAP6VLg4y9I5dyZdqmA=\ngithub.com/yuin/goldmark v1.1.27/go.mod h1:3hX8gzYuyVAZsxl0MRgGTJEmQBFcNTphYh9decYSb74=\ngithub.com/yuin/goldmark v1.1.30/go.mod h1:3hX8gzYuyVAZsxl0MRgGTJEmQBFcNTphYh9decYSb74=\ngithub.com/yuin/goldmark v1.2.1/go.mod h1:3hX8gzYuyVAZsxl0MRgGTJEmQBFcNTphYh9decYSb74=\ngithub.com/yuin/goldmark v1.4.13/go.mod h1:6yULJ656Px+3vBD8DxQVa3kxgyrAnzto9xy5taEt/CY=\ngithub.com/yuin/gopher-lua v1.1.1 h1:kYKnWBjvbNP4XLT3+bPEwAXJx262OhaHDWDVOPjL46M=\ngithub.com/yuin/gopher-lua v1.1.1/go.mod h1:GBR0iDaNXjAgGg9zfCvksxSRnQx76gclCIb7kdAd1Pw=\ngo.mongodb.org/mongo-driver v1.11.4/go.mod h1:PTSz5yu21bkT/wXpkS7WR5f0ddqw5quethTUn9WM+2g=\ngo.opentelemetry.io/otel v1.32.0 h1:WnBN+Xjcteh0zdk01SVqV55d/m62NJLJdIyb4y/WO5U=\ngo.opentelemetry.io/otel v1.32.0/go.mod h1:00DCVSB0RQcnzlwyTfqtxSm+DRr9hpYrHjNGiBHVQIg=\ngo.opentelemetry.io/otel/trace v1.32.0 h1:WIC9mYrXf8TmY/EXuULKc8hR17vE+Hjv2cssQDe03fM=\ngo.opentelemetry.io/otel/trace v1.32.0/go.mod h1:+i4rkvCraA+tG6AzwloGaCtkx53Fa+L+V8e9a7YvhT8=\ngo.uber.org/atomic v1.6.0/go.mod h1:sABNBOSYdrvTF6hTgEIbc7YasKWGhgEQZyfxyTvoXHQ=\ngo.uber.org/atomic v1.7.0/go.mod h1:fEN4uk6kAWBTFdckzkM89CLk9XfWZrxpCo0nPH17wJc=\ngo.uber.org/atomic v1.9.0/go.mod h1:fEN4uk6kAWBTFdckzkM89CLk9XfWZrxpCo0nPH17wJc=\ngo.uber.org/atomic v1.11.0 h1:ZvwS0R+56ePWxUNi+Atn9dWONBPp/AUETXlHW0DxSjE=\ngo.uber.org/atomic v1.11.0/go.mod h1:LUxbIzbOniOlMKjJjyPfpl4v+PKK2cNJn91OQbhoJI0=\ngo.uber.org/automaxprocs v1.4.0/go.mod h1:/mTEdr7LvHhs0v7mjdxDreTz1OG5zdZGqgOnhWiR/+Q=\ngo.uber.org/automaxprocs v1.5.2 h1:2LxUOGiR3O6tw8ui5sZa2LAaHnsviZdVOUZw4fvbnME=\ngo.uber.org/automaxprocs v1.5.2/go.mod h1:eRbA25aqJrxAbsLO0xy5jVwPt7FQnRgjW+efnwa1WM0=\ngo.uber.org/goleak v1.1.10/go.mod h1:8a7PlsEVH3e/a/GLqe5IIrQx6GzcnRmZEufDUTk4A7A=\ngo.uber.org/goleak v1.3.0 h1:2K3zAYmnTNqV73imy9J1T3WC+gmCePx2hEGkimedGto=\ngo.uber.org/goleak v1.3.0/go.mod h1:CoHD4mav9JJNrW/WLlf7HGZPjdw8EucARQHekz1X6bE=\ngo.uber.org/multierr v1.6.0/go.mod h1:cdWPpRnG4AhwMwsgIHip0KRBQjJy5kYEpYjJxpXp9iU=\ngo.uber.org/multierr v1.7.0/go.mod h1:7EAYxJLBy9rStEaz58O2t4Uvip6FSURkq8/ppBp95ak=\ngo.uber.org/multierr v1.11.0 h1:blXXJkSxSSfBVBlC76pxqeO+LN3aDfLQo+309xJstO0=\ngo.uber.org/multierr v1.11.0/go.mod h1:20+QtiLqy0Nd6FdQB9TLXag12DsQkrbs3htMFfDN80Y=\ngo.uber.org/zap v1.19.0/go.mod h1:xg/QME4nWcxGxrpdeYfq7UvYrLh66cuVKdrbD1XF/NI=\ngo.uber.org/zap v1.27.0 h1:aJMhYGrd5QSmlpLMr2MftRKl7t8J8PTZPA732ud/XR8=\ngo.uber.org/zap v1.27.0/go.mod h1:GB2qFLM7cTU87MWRP2mPIjqfIDnGu+VIO4V/SdhGo2E=\ngolang.org/x/arch v0.0.0-20210923205945-b76863e36670/go.mod h1:5om86z9Hs0C8fWVUuoMHwpExlXzs5Tkyp9hOrfG7pp8=\ngolang.org/x/arch v0.3.0 h1:02VY4/ZcO/gBOH6PUaoiptASxtXU10jazRCP865E97k=\ngolang.org/x/arch v0.3.0/go.mod h1:5om86z9Hs0C8fWVUuoMHwpExlXzs5Tkyp9hOrfG7pp8=\ngolang.org/x/crypto v0.0.0-20190308221718-c2843e01d9a2/go.mod h1:djNgcEr1/C05ACkg1iLfiJU5Ep61QUkGW8qpdssI0+w=\ngolang.org/x/crypto v0.0.0-20191011191535-87dc89f01550/go.mod h1:yigFU9vqHzYiE8UmvKecakEJjdnWj3jj499lnFckfCI=\ngolang.org/x/crypto v0.0.0-20191219195013-becbf705a915/go.mod h1:LzIPMQfyMNhhGPhUkYOs5KpL4U8rLKemX1yGLhDgUto=\ngolang.org/x/crypto v0.0.0-20200510223506-06a226fb4e37/go.mod h1:LzIPMQfyMNhhGPhUkYOs5KpL4U8rLKemX1yGLhDgUto=\ngolang.org/x/crypto v0.0.0-20200622213623-75b288015ac9/go.mod h1:LzIPMQfyMNhhGPhUkYOs5KpL4U8rLKemX1yGLhDgUto=\ngolang.org/x/crypto v0.0.0-20201012173705-84dcc777aaee/go.mod h1:LzIPMQfyMNhhGPhUkYOs5KpL4U8rLKemX1yGLhDgUto=\ngolang.org/x/crypto v0.0.0-20210711020723-a769d52b0f97/go.mod h1:GvvjBRRGRdwPK5ydBHafDWAxML/pGHZbMvKqRZ5+Abc=\ngolang.org/x/crypto v0.0.0-20210921155107-089bfa567519/go.mod h1:GvvjBRRGRdwPK5ydBHafDWAxML/pGHZbMvKqRZ5+Abc=\ngolang.org/x/crypto v0.0.0-20220622213112-05595931fe9d/go.mod h1:IxCIyHEi3zRg3s0A5j5BB6A9Jmi73HwBIUl50j+osU4=\ngolang.org/x/crypto v0.6.0/go.mod h1:OFC/31mSvZgRz0V1QTNCzfAI1aIRzbiufJtkMIlEp58=\ngolang.org/x/crypto v0.7.0/go.mod h1:pYwdfH91IfpZVANVyUOhSIPZaFoJGxTFbZhFTx+dXZU=\ngolang.org/x/crypto v0.9.0/go.mod h1:yrmDGqONDYtNj3tH8X9dzUun2m2lzPa9ngI6/RUPGR0=\ngolang.org/x/crypto v0.13.0/go.mod h1:y6Z2r+Rw4iayiXXAIxJIDAJ1zMW4yaTpebo8fPOliYc=\ngolang.org/x/crypto v0.14.0/go.mod h1:MVFd36DqK4CsrnJYDkBA3VC4m2GkXAM0PvzMCn4JQf4=\ngolang.org/x/crypto v0.18.0/go.mod h1:R0j02AL6hcrfOiy9T4ZYp/rcWeMxM3L6QYxlOuEG1mg=\ngolang.org/x/crypto v0.19.0/go.mod h1:Iy9bg/ha4yyC70EfRS8jz+B6ybOBKMaSxLj6P6oBDfU=\ngolang.org/x/crypto v0.21.0/go.mod h1:0BP7YvVV9gBbVKyeTG0Gyn+gZm94bibOW5BjDEYAOMs=\ngolang.org/x/crypto v0.23.0/go.mod h1:CKFgDieR+mRhux2Lsu27y0fO304Db0wZe70UKqHu0v8=\ngolang.org/x/crypto v0.24.0/go.mod h1:Z1PMYSOR5nyMcyAVAIQSKCDwalqy85Aqn1x3Ws4L5DM=\ngolang.org/x/crypto v0.45.0 h1:jMBrvKuj23MTlT0bQEOBcAE0mjg8mK9RXFhRH6nyF3Q=\ngolang.org/x/crypto v0.45.0/go.mod h1:XTGrrkGJve7CYK7J8PEww4aY7gM3qMCElcJQ8n8JdX4=\ngolang.org/x/exp v0.0.0-20190121172915-509febef88a4/go.mod h1:CJ0aWSM057203Lf6IL+f9T1iT9GByDxfZKAQTCR3kQA=\ngolang.org/x/exp v0.0.0-20230713183714-613f0c0eb8a1 h1:MGwJjxBy0HJshjDNfLsYO8xppfqWlA5ZT9OhtUUhTNw=\ngolang.org/x/exp v0.0.0-20230713183714-613f0c0eb8a1/go.mod h1:FXUEEKJgO7OQYeo8N01OfiKP8RXMtf6e8aTskBGqWdc=\ngolang.org/x/image v0.13.0/go.mod h1:6mmbMOeV28HuMTgA6OSRkdXKYw/t5W9Uwn2Yv1r3Yxk=\ngolang.org/x/image v0.18.0 h1:jGzIakQa/ZXI1I0Fxvaa9W7yP25TqT6cHIHn+6CqvSQ=\ngolang.org/x/image v0.18.0/go.mod h1:4yyo5vMFQjVjUcVk4jEQcU9MGy/rulF5WvUILseCM2E=\ngolang.org/x/lint v0.0.0-20181026193005-c67002cb31c3/go.mod h1:UVdnD1Gm6xHRNCYTkRU2/jEulfH38KcIWyp/GAMgvoE=\ngolang.org/x/lint v0.0.0-20190227174305-5b3e6a55c961/go.mod h1:wehouNa3lNwaWXcvxsM5YxQ5yQlVC4a0KAMCusXpPoU=\ngolang.org/x/lint v0.0.0-20190313153728-d0100b6bd8b3/go.mod h1:6SW0HCj/g11FgYtHlgUYUwCkIfeOF89ocIRzGO/8vkc=\ngolang.org/x/lint v0.0.0-20190930215403-16217165b5de/go.mod h1:6SW0HCj/g11FgYtHlgUYUwCkIfeOF89ocIRzGO/8vkc=\ngolang.org/x/mod v0.2.0/go.mod h1:s0Qsj1ACt9ePp/hMypM3fl4fZqREWJwdYDEqhRiZZUA=\ngolang.org/x/mod v0.3.0/go.mod h1:s0Qsj1ACt9ePp/hMypM3fl4fZqREWJwdYDEqhRiZZUA=\ngolang.org/x/mod v0.6.0-dev.0.20220419223038-86c51ed26bb4/go.mod h1:jJ57K6gSWd91VN4djpZkiMVwK6gcyfeH4XE8wZrZaV4=\ngolang.org/x/mod v0.8.0/go.mod h1:iBbtSCu2XBx23ZKBPSOrRkjjQPZFPuis4dIYUhu/chs=\ngolang.org/x/mod v0.12.0/go.mod h1:iBbtSCu2XBx23ZKBPSOrRkjjQPZFPuis4dIYUhu/chs=\ngolang.org/x/mod v0.15.0/go.mod h1:hTbmBsO62+eylJbnUtE2MGJUyE7QWk4xUqPFrRgJ+7c=\ngolang.org/x/mod v0.17.0/go.mod h1:hTbmBsO62+eylJbnUtE2MGJUyE7QWk4xUqPFrRgJ+7c=\ngolang.org/x/net v0.0.0-20180724234803-3673e40ba225/go.mod h1:mL1N/T3taQHkDXs73rZJwtUhF3w3ftmwwsq0BUmARs4=\ngolang.org/x/net v0.0.0-20180826012351-8a410e7b638d/go.mod h1:mL1N/T3taQHkDXs73rZJwtUhF3w3ftmwwsq0BUmARs4=\ngolang.org/x/net v0.0.0-20190213061140-3a22650c66bd/go.mod h1:mL1N/T3taQHkDXs73rZJwtUhF3w3ftmwwsq0BUmARs4=\ngolang.org/x/net v0.0.0-20190311183353-d8887717615a/go.mod h1:t9HGtf8HONx5eT2rtn7q6eTqICYqUVnKs3thJo3Qplg=\ngolang.org/x/net v0.0.0-20190404232315-eb5bcb51f2a3/go.mod h1:t9HGtf8HONx5eT2rtn7q6eTqICYqUVnKs3thJo3Qplg=\ngolang.org/x/net v0.0.0-20190620200207-3b0461eec859/go.mod h1:z5CRVTTTmAJ677TzLLGU+0bjPO0LkuOLi4/5GtJWs/s=\ngolang.org/x/net v0.0.0-20200114155413-6afb5195e5aa/go.mod h1:z5CRVTTTmAJ677TzLLGU+0bjPO0LkuOLi4/5GtJWs/s=\ngolang.org/x/net v0.0.0-20200226121028-0de0cce0169b/go.mod h1:z5CRVTTTmAJ677TzLLGU+0bjPO0LkuOLi4/5GtJWs/s=\ngolang.org/x/net v0.0.0-20200506145744-7e3656a0809f/go.mod h1:qpuaurCH72eLCgpAm/N6yyVIVM9cpaDIP3A8BGJEC5A=\ngolang.org/x/net v0.0.0-20201010224723-4f7140c49acb/go.mod h1:sp8m0HH+o8qH0wwXwYZr8TS3Oi6o0r6Gce1SSxlDquU=\ngolang.org/x/net v0.0.0-20201021035429-f5854403a974/go.mod h1:sp8m0HH+o8qH0wwXwYZr8TS3Oi6o0r6Gce1SSxlDquU=\ngolang.org/x/net v0.0.0-20210226172049-e18ecbb05110/go.mod h1:m0MpNAwzfU5UDzcl9v0D8zg8gWTRqZa9RBIspLL5mdg=\ngolang.org/x/net v0.0.0-20211112202133-69e39bad7dc2/go.mod h1:9nx3DQGgdP8bBQD5qxJ1jj9UTztislL4KSBs9R2vV5Y=\ngolang.org/x/net v0.0.0-20220722155237-a158d28d115b/go.mod h1:XRhObCWvk6IyKnWLug+ECip1KBveYUHfp+8e9klMJ9c=\ngolang.org/x/net v0.1.0/go.mod h1:Cx3nUiGt4eDBEyega/BKRp+/AlGL8hYe7U9odMt2Cco=\ngolang.org/x/net v0.6.0/go.mod h1:2Tu9+aMcznHK/AK1HMvgo6xiTLG5rD5rZLDS+rp2Bjs=\ngolang.org/x/net v0.7.0/go.mod h1:2Tu9+aMcznHK/AK1HMvgo6xiTLG5rD5rZLDS+rp2Bjs=\ngolang.org/x/net v0.8.0/go.mod h1:QVkue5JL9kW//ek3r6jTKnTFis1tRmNAW2P1shuFdJc=\ngolang.org/x/net v0.10.0/go.mod h1:0qNGK6F8kojg2nk9dLZ2mShWaEBan6FAoqfSigmmuDg=\ngolang.org/x/net v0.15.0/go.mod h1:idbUs1IY1+zTqbi8yxTbhexhEEk5ur9LInksu6HrEpk=\ngolang.org/x/net v0.17.0/go.mod h1:NxSsAGuq816PNPmqtQdLE42eU2Fs7NoRIZrHJAlaCOE=\ngolang.org/x/net v0.20.0/go.mod h1:z8BVo6PvndSri0LbOE3hAn0apkU+1YvI6E70E9jsnvY=\ngolang.org/x/net v0.21.0/go.mod h1:bIjVDfnllIU7BJ2DNgfnXvpSvtn8VRwhlsaeUTyUS44=\ngolang.org/x/net v0.23.0/go.mod h1:JKghWKKOSdJwpW2GEx0Ja7fmaKnMsbu+MWVZTokSYmg=\ngolang.org/x/net v0.25.0/go.mod h1:JkAGAh7GEvH74S6FOH42FLoXpXbE/aqXSrIQjXgsiwM=\ngolang.org/x/net v0.26.0/go.mod h1:5YKkiSynbBIh3p6iOc/vibscux0x38BZDkn8sCUPxHE=\ngolang.org/x/net v0.47.0 h1:Mx+4dIFzqraBXUugkia1OOvlD6LemFo1ALMHjrXDOhY=\ngolang.org/x/net v0.47.0/go.mod h1:/jNxtkgq5yWUGYkaZGqo27cfGZ1c5Nen03aYrrKpVRU=\ngolang.org/x/oauth2 v0.0.0-20180821212333-d2e6202438be/go.mod h1:N/0e6XlmueqKjAGxoOufVs8QHGRruUQn6yWY3a++T0U=\ngolang.org/x/oauth2 v0.27.0 h1:da9Vo7/tDv5RH/7nZDz1eMGS/q1Vv1N/7FCrBhI9I3M=\ngolang.org/x/oauth2 v0.27.0/go.mod h1:onh5ek6nERTohokkhCD/y2cV4Do3fxFHFuAejCkRWT8=\ngolang.org/x/sync v0.0.0-20180314180146-1d60e4601c6f/go.mod h1:RxMgew5VJxzue5/jJTE5uejpjVlOe/izrB70Jof72aM=\ngolang.org/x/sync v0.0.0-20181108010431-42b317875d0f/go.mod h1:RxMgew5VJxzue5/jJTE5uejpjVlOe/izrB70Jof72aM=\ngolang.org/x/sync v0.0.0-20190423024810-112230192c58/go.mod h1:RxMgew5VJxzue5/jJTE5uejpjVlOe/izrB70Jof72aM=\ngolang.org/x/sync v0.0.0-20190911185100-cd5d95a43a6e/go.mod h1:RxMgew5VJxzue5/jJTE5uejpjVlOe/izrB70Jof72aM=\ngolang.org/x/sync v0.0.0-20200317015054-43a5402ce75a/go.mod h1:RxMgew5VJxzue5/jJTE5uejpjVlOe/izrB70Jof72aM=\ngolang.org/x/sync v0.0.0-20201020160332-67f06af15bc9/go.mod h1:RxMgew5VJxzue5/jJTE5uejpjVlOe/izrB70Jof72aM=\ngolang.org/x/sync v0.0.0-20210220032951-036812b2e83c/go.mod h1:RxMgew5VJxzue5/jJTE5uejpjVlOe/izrB70Jof72aM=\ngolang.org/x/sync v0.0.0-20220722155255-886fb9371eb4/go.mod h1:RxMgew5VJxzue5/jJTE5uejpjVlOe/izrB70Jof72aM=\ngolang.org/x/sync v0.1.0/go.mod h1:RxMgew5VJxzue5/jJTE5uejpjVlOe/izrB70Jof72aM=\ngolang.org/x/sync v0.3.0/go.mod h1:FU7BRWz2tNW+3quACPkgCx/L+uEAv1htQ0V83Z9Rj+Y=\ngolang.org/x/sync v0.6.0/go.mod h1:Czt+wKu1gCyEFDUtn0jG5QVvpJ6rzVqr5aXyt9drQfk=\ngolang.org/x/sync v0.7.0/go.mod h1:Czt+wKu1gCyEFDUtn0jG5QVvpJ6rzVqr5aXyt9drQfk=\ngolang.org/x/sync v0.18.0 h1:kr88TuHDroi+UVf+0hZnirlk8o8T+4MrK6mr60WkH/I=\ngolang.org/x/sync v0.18.0/go.mod h1:9KTHXmSnoGruLpwFjVSX0lNNA75CykiMECbovNTZqGI=\ngolang.org/x/sys v0.0.0-20180830151530-49385e6e1522/go.mod h1:STP8DvDyc/dI5b8T5hshtkjS+E42TnysNCUPdjciGhY=\ngolang.org/x/sys v0.0.0-20190215142949-d0b11bdaac8a/go.mod h1:STP8DvDyc/dI5b8T5hshtkjS+E42TnysNCUPdjciGhY=\ngolang.org/x/sys v0.0.0-20190412213103-97732733099d/go.mod h1:h1NjWce9XRLGQEsW7wpKNCjG9DtNlClVuFLEZdDNbEs=\ngolang.org/x/sys v0.0.0-20200323222414-85ca7c5b95cd/go.mod h1:h1NjWce9XRLGQEsW7wpKNCjG9DtNlClVuFLEZdDNbEs=\ngolang.org/x/sys v0.0.0-20200509044756-6aff5f38e54f/go.mod h1:h1NjWce9XRLGQEsW7wpKNCjG9DtNlClVuFLEZdDNbEs=\ngolang.org/x/sys v0.0.0-20200930185726-fdedc70b468f/go.mod h1:h1NjWce9XRLGQEsW7wpKNCjG9DtNlClVuFLEZdDNbEs=\ngolang.org/x/sys v0.0.0-20201119102817-f84b799fce68/go.mod h1:h1NjWce9XRLGQEsW7wpKNCjG9DtNlClVuFLEZdDNbEs=\ngolang.org/x/sys v0.0.0-20210423082822-04245dca01da/go.mod h1:h1NjWce9XRLGQEsW7wpKNCjG9DtNlClVuFLEZdDNbEs=\ngolang.org/x/sys v0.0.0-20210615035016-665e8c7367d1/go.mod h1:oPkhp1MJrh7nUepCBck5+mAzfO9JrbApNNgaTdGDITg=\ngolang.org/x/sys v0.0.0-20210630005230-0f9fa26af87c/go.mod h1:oPkhp1MJrh7nUepCBck5+mAzfO9JrbApNNgaTdGDITg=\ngolang.org/x/sys v0.0.0-20210806184541-e5e7981a1069/go.mod h1:oPkhp1MJrh7nUepCBck5+mAzfO9JrbApNNgaTdGDITg=\ngolang.org/x/sys v0.0.0-20220520151302-bc2c85ada10a/go.mod h1:oPkhp1MJrh7nUepCBck5+mAzfO9JrbApNNgaTdGDITg=\ngolang.org/x/sys v0.0.0-20220704084225-05e143d24a9e/go.mod h1:oPkhp1MJrh7nUepCBck5+mAzfO9JrbApNNgaTdGDITg=\ngolang.org/x/sys v0.0.0-20220722155257-8c9f86f7a55f/go.mod h1:oPkhp1MJrh7nUepCBck5+mAzfO9JrbApNNgaTdGDITg=\ngolang.org/x/sys v0.1.0/go.mod h1:oPkhp1MJrh7nUepCBck5+mAzfO9JrbApNNgaTdGDITg=\ngolang.org/x/sys v0.5.0/go.mod h1:oPkhp1MJrh7nUepCBck5+mAzfO9JrbApNNgaTdGDITg=\ngolang.org/x/sys v0.6.0/go.mod h1:oPkhp1MJrh7nUepCBck5+mAzfO9JrbApNNgaTdGDITg=\ngolang.org/x/sys v0.8.0/go.mod h1:oPkhp1MJrh7nUepCBck5+mAzfO9JrbApNNgaTdGDITg=\ngolang.org/x/sys v0.12.0/go.mod h1:oPkhp1MJrh7nUepCBck5+mAzfO9JrbApNNgaTdGDITg=\ngolang.org/x/sys v0.13.0/go.mod h1:oPkhp1MJrh7nUepCBck5+mAzfO9JrbApNNgaTdGDITg=\ngolang.org/x/sys v0.15.0/go.mod h1:/VUhepiaJMQUp4+oa/7Zr1D23ma6VTLIYjOOTFZPUcA=\ngolang.org/x/sys v0.16.0/go.mod h1:/VUhepiaJMQUp4+oa/7Zr1D23ma6VTLIYjOOTFZPUcA=\ngolang.org/x/sys v0.17.0/go.mod h1:/VUhepiaJMQUp4+oa/7Zr1D23ma6VTLIYjOOTFZPUcA=\ngolang.org/x/sys v0.18.0/go.mod h1:/VUhepiaJMQUp4+oa/7Zr1D23ma6VTLIYjOOTFZPUcA=\ngolang.org/x/sys v0.20.0/go.mod h1:/VUhepiaJMQUp4+oa/7Zr1D23ma6VTLIYjOOTFZPUcA=\ngolang.org/x/sys v0.21.0/go.mod h1:/VUhepiaJMQUp4+oa/7Zr1D23ma6VTLIYjOOTFZPUcA=\ngolang.org/x/sys v0.38.0 h1:3yZWxaJjBmCWXqhN1qh02AkOnCQ1poK6oF+a7xWL6Gc=\ngolang.org/x/sys v0.38.0/go.mod h1:OgkHotnGiDImocRcuBABYBEXf8A9a87e/uXjp9XT3ks=\ngolang.org/x/telemetry v0.0.0-20240228155512-f48c80bd79b2/go.mod h1:TeRTkGYfJXctD9OcfyVLyj2J3IxLnKwHJR8f4D8a3YE=\ngolang.org/x/term v0.0.0-20201126162022-7de9c90e9dd1/go.mod h1:bj7SfCRtBDWHUb9snDiAeCFNEtKQo2Wmx5Cou7ajbmo=\ngolang.org/x/term v0.0.0-20210927222741-03fcf44c2211/go.mod h1:jbD1KX2456YbFQfuXm/mYQcufACuNUgVhRMnK/tPxf8=\ngolang.org/x/term v0.1.0/go.mod h1:jbD1KX2456YbFQfuXm/mYQcufACuNUgVhRMnK/tPxf8=\ngolang.org/x/term v0.5.0/go.mod h1:jMB1sMXY+tzblOD4FWmEbocvup2/aLOaQEp7JmGp78k=\ngolang.org/x/term v0.6.0/go.mod h1:m6U89DPEgQRMq3DNkDClhWw02AUbt2daBVO4cn4Hv9U=\ngolang.org/x/term v0.8.0/go.mod h1:xPskH00ivmX89bAKVGSKKtLOWNx2+17Eiy94tnKShWo=\ngolang.org/x/term v0.12.0/go.mod h1:owVbMEjm3cBLCHdkQu9b1opXd4ETQWc3BhuQGKgXgvU=\ngolang.org/x/term v0.13.0/go.mod h1:LTmsnFJwVN6bCy1rVCoS+qHT1HhALEFxKncY3WNNh4U=\ngolang.org/x/term v0.16.0/go.mod h1:yn7UURbUtPyrVJPGPq404EukNFxcm/foM+bV/bfcDsY=\ngolang.org/x/term v0.17.0/go.mod h1:lLRBjIVuehSbZlaOtGMbcMncT+aqLLLmKrsjNrUguwk=\ngolang.org/x/term v0.18.0/go.mod h1:ILwASektA3OnRv7amZ1xhE/KTR+u50pbXfZ03+6Nx58=\ngolang.org/x/term v0.20.0/go.mod h1:8UkIAJTvZgivsXaD6/pH6U9ecQzZ45awqEOzuCvwpFY=\ngolang.org/x/term v0.21.0/go.mod h1:ooXLefLobQVslOqselCNF4SxFAaoS6KujMbsGzSDmX0=\ngolang.org/x/text v0.3.0/go.mod h1:NqM8EUOU14njkJ3fqMW+pc6Ldnwhi/IjpwHt7yyuwOQ=\ngolang.org/x/text v0.3.2/go.mod h1:bEr9sfX3Q8Zfm5fL9x+3itogRgK3+ptLWKqgva+5dAk=\ngolang.org/x/text v0.3.3/go.mod h1:5Zoc/QRtKVWzQhOtBMvqHzDpF6irO9z98xDceosuGiQ=\ngolang.org/x/text v0.3.6/go.mod h1:5Zoc/QRtKVWzQhOtBMvqHzDpF6irO9z98xDceosuGiQ=\ngolang.org/x/text v0.3.7/go.mod h1:u+2+/6zg+i71rQMx5EYifcz6MCKuco9NR6JIITiCfzQ=\ngolang.org/x/text v0.3.8/go.mod h1:E6s5w1FMmriuDzIBO73fBruAKo1PCIq6d2Q6DHfQ8WQ=\ngolang.org/x/text v0.4.0/go.mod h1:mrYo+phRRbMaCq/xk9113O4dZlRixOauAjOtrjsXDZ8=\ngolang.org/x/text v0.7.0/go.mod h1:mrYo+phRRbMaCq/xk9113O4dZlRixOauAjOtrjsXDZ8=\ngolang.org/x/text v0.8.0/go.mod h1:e1OnstbJyHTd6l/uOt8jFFHp6TRDWZR/bV3emEE/zU8=\ngolang.org/x/text v0.9.0/go.mod h1:e1OnstbJyHTd6l/uOt8jFFHp6TRDWZR/bV3emEE/zU8=\ngolang.org/x/text v0.13.0/go.mod h1:TvPlkZtksWOMsz7fbANvkp4WM8x/WCo/om8BMLbz+aE=\ngolang.org/x/text v0.14.0/go.mod h1:18ZOQIKpY8NJVqYksKHtTdi31H5itFRjB5/qKTNYzSU=\ngolang.org/x/text v0.15.0/go.mod h1:18ZOQIKpY8NJVqYksKHtTdi31H5itFRjB5/qKTNYzSU=\ngolang.org/x/text v0.16.0/go.mod h1:GhwF1Be+LQoKShO3cGOHzqOgRrGaYc9AvblQOmPVHnI=\ngolang.org/x/text v0.31.0 h1:aC8ghyu4JhP8VojJ2lEHBnochRno1sgL6nEi9WGFGMM=\ngolang.org/x/text v0.31.0/go.mod h1:tKRAlv61yKIjGGHX/4tP1LTbc13YSec1pxVEWXzfoeM=\ngolang.org/x/tools v0.0.0-20180917221912-90fa682c2a6e/go.mod h1:n7NCudcB/nEzxVGmLbDWY5pfWTLqBcC2KZ6jyYvM4mQ=\ngolang.org/x/tools v0.0.0-20190114222345-bf090417da8b/go.mod h1:n7NCudcB/nEzxVGmLbDWY5pfWTLqBcC2KZ6jyYvM4mQ=\ngolang.org/x/tools v0.0.0-20190226205152-f727befe758c/go.mod h1:9Yl7xja0Znq3iFh3HoIrodX9oNMXvdceNzlUR8zjMvY=\ngolang.org/x/tools v0.0.0-20190311212946-11955173bddd/go.mod h1:LCzVGOaR6xXOjkQ3onu1FJEFr0SW1gC7cKk1uF8kGRs=\ngolang.org/x/tools v0.0.0-20190328211700-ab21143f2384/go.mod h1:LCzVGOaR6xXOjkQ3onu1FJEFr0SW1gC7cKk1uF8kGRs=\ngolang.org/x/tools v0.0.0-20190524140312-2c0ae7006135/go.mod h1:RgjU9mgBXZiqYHBnxXauZ1Gv1EHHAz9KjViQ78xBX0Q=\ngolang.org/x/tools v0.0.0-20191029041327-9cc4af7d6b2c/go.mod h1:b+2E5dAYhXwXZwtnZ6UAqBI28+e2cm9otk0dWdXHAEo=\ngolang.org/x/tools v0.0.0-20191108193012-7d206e10da11/go.mod h1:b+2E5dAYhXwXZwtnZ6UAqBI28+e2cm9otk0dWdXHAEo=\ngolang.org/x/tools v0.0.0-20191119224855-298f0cb1881e/go.mod h1:b+2E5dAYhXwXZwtnZ6UAqBI28+e2cm9otk0dWdXHAEo=\ngolang.org/x/tools v0.0.0-20200509030707-2212a7e161a5/go.mod h1:EkVYQZoAsY45+roYkvgYkIh4xh/qjgUK9TdY2XT94GE=\ngolang.org/x/tools v0.0.0-20200619180055-7c47624df98f/go.mod h1:EkVYQZoAsY45+roYkvgYkIh4xh/qjgUK9TdY2XT94GE=\ngolang.org/x/tools v0.0.0-20210106214847-113979e3529a/go.mod h1:emZCQorbCU4vsT4fOWvOPXz4eW1wZW4PmDk9uLelYpA=\ngolang.org/x/tools v0.1.12/go.mod h1:hNGJHUnrk76NpqgfD5Aqm5Crs+Hm0VOH/i9J2+nxYbc=\ngolang.org/x/tools v0.6.0/go.mod h1:Xwgl3UAJ/d3gWutnCtw505GrjyAbvKui8lOU390QaIU=\ngolang.org/x/tools v0.13.0/go.mod h1:HvlwmtVNQAhOuCjW7xxvovg8wbNq7LwfXh/k7wXUl58=\ngolang.org/x/tools v0.21.1-0.20240508182429-e35e4ccd0d2d/go.mod h1:aiJjzUbINMkxbQROHiO6hDPo2LHcIPhhQsa9DLh0yGk=\ngolang.org/x/xerrors v0.0.0-20190717185122-a985d3407aa7/go.mod h1:I/5z698sn9Ka8TeJc9MKroUUfqBBauWjQqLJ2OPfmY0=\ngolang.org/x/xerrors v0.0.0-20191011141410-1b5146add898/go.mod h1:I/5z698sn9Ka8TeJc9MKroUUfqBBauWjQqLJ2OPfmY0=\ngolang.org/x/xerrors v0.0.0-20191204190536-9bdfabe68543/go.mod h1:I/5z698sn9Ka8TeJc9MKroUUfqBBauWjQqLJ2OPfmY0=\ngolang.org/x/xerrors v0.0.0-20200804184101-5ec99f83aff1/go.mod h1:I/5z698sn9Ka8TeJc9MKroUUfqBBauWjQqLJ2OPfmY0=\ngoogle.golang.org/appengine v1.1.0/go.mod h1:EbEs0AVv82hx2wNQdGPgUI5lhzA/G0D9YwlJXL52JkM=\ngoogle.golang.org/appengine v1.4.0/go.mod h1:xpcJRLb0r/rnEns0DIKYYv+WjYCduHsrkT7/EB5XEv4=\ngoogle.golang.org/genproto v0.0.0-20180817151627-c66870c02cf8/go.mod h1:JiN7NxoALGmiZfu7CAH4rXhgtRTLTxftemlI0sWmxmc=\ngoogle.golang.org/genproto v0.0.0-20190819201941-24fa4b261c55/go.mod h1:DMBHOl98Agz4BDEuKkezgsaosCRResVns1a3J2ZsMNc=\ngoogle.golang.org/grpc v1.19.0/go.mod h1:mqu4LbDTu4XGKhr4mRzUsmM4RtVoemTSY81AxZiDr8c=\ngoogle.golang.org/grpc v1.23.0/go.mod h1:Y5yQAOtifL1yxbo5wqy6BxZv8vAUGQwXBOALyacEbxg=\ngoogle.golang.org/grpc v1.25.1/go.mod h1:c3i+UQWmh7LiEpx4sFZnkU36qjEYZ0imhYfXVyQciAY=\ngoogle.golang.org/grpc v1.31.0/go.mod h1:N36X2cJ7JwdamYAgDz+s+rVMFjt3numwzf/HckM8pak=\ngoogle.golang.org/protobuf v0.0.0-20200109180630-ec00e32a8dfd/go.mod h1:DFci5gLYBciE7Vtevhsrf46CRTquxDuWsQurQQe4oz8=\ngoogle.golang.org/protobuf v0.0.0-20200221191635-4d8936d0db64/go.mod h1:kwYJMbMJ01Woi6D6+Kah6886xMZcty6N08ah7+eCXa0=\ngoogle.golang.org/protobuf v0.0.0-20200228230310-ab0ca4ff8a60/go.mod h1:cfTl7dwQJ+fmap5saPgwCLgHXTUD7jkjRqWcaiX5VyM=\ngoogle.golang.org/protobuf v1.20.1-0.20200309200217-e05f789c0967/go.mod h1:A+miEFZTKqfCUM6K7xSMQL9OKL/b6hQv+e19PK+JZNE=\ngoogle.golang.org/protobuf v1.21.0/go.mod h1:47Nbq4nVaFHyn7ilMalzfO3qCViNmqZ2kzikPIcrTAo=\ngoogle.golang.org/protobuf v1.23.0/go.mod h1:EGpADcykh3NcUnDUJcl1+ZksZNG86OlYog2l/sGQquU=\ngoogle.golang.org/protobuf v1.26.0-rc.1/go.mod h1:jlhhOSvTdKEhbULTjvd4ARK9grFBp09yW+WbY/TyQbw=\ngoogle.golang.org/protobuf v1.27.1/go.mod h1:9q0QmTI4eRPtz6boOQmLYwt+qCgq0jsYwAQnmE0givc=\ngoogle.golang.org/protobuf v1.28.0/go.mod h1:HV8QOd/L58Z+nl8r43ehVNZIU/HEI6OcFqwMG9pJV4I=\ngoogle.golang.org/protobuf v1.30.0/go.mod h1:HV8QOd/L58Z+nl8r43ehVNZIU/HEI6OcFqwMG9pJV4I=\ngoogle.golang.org/protobuf v1.35.1 h1:m3LfL6/Ca+fqnjnlqQXNpFPABW1UD7mjh8KO2mKFytA=\ngoogle.golang.org/protobuf v1.35.1/go.mod h1:9fA7Ob0pmnwhb644+1+CVWFRbNajQ6iRojtC/QF5bRE=\ngopkg.in/alexcesaro/quotedprintable.v3 v3.0.0-20150716171945-2caba252f4dc h1:2gGKlE2+asNV9m7xrywl36YYNnBG5ZQ0r/BOOxqPpmk=\ngopkg.in/alexcesaro/quotedprintable.v3 v3.0.0-20150716171945-2caba252f4dc/go.mod h1:m7x9LTH6d71AHyAX77c9yqWCCa3UKHcVEj9y7hAtKDk=\ngopkg.in/check.v1 v0.0.0-20161208181325-20d25e280405/go.mod h1:Co6ibVJAznAaIkqp8huTwlJQCZ016jof/cbN4VW5Yz0=\ngopkg.in/check.v1 v1.0.0-20180628173108-788fd7840127/go.mod h1:Co6ibVJAznAaIkqp8huTwlJQCZ016jof/cbN4VW5Yz0=\ngopkg.in/check.v1 v1.0.0-20200227125254-8fa46927fb4f/go.mod h1:Co6ibVJAznAaIkqp8huTwlJQCZ016jof/cbN4VW5Yz0=\ngopkg.in/check.v1 v1.0.0-20201130134442-10cb98267c6c h1:Hei/4ADfdWqJk1ZMxUNpqntNwaWcugrBjAiHlqqRiVk=\ngopkg.in/check.v1 v1.0.0-20201130134442-10cb98267c6c/go.mod h1:JHkPIbrfpd72SG/EVd6muEfDQjcINNoR0C8j2r3qZ4Q=\ngopkg.in/errgo.v2 v2.1.0/go.mod h1:hNsd1EY+bozCKY1Ytp96fpM3vjJbqLJn88ws8XvfDNI=\ngopkg.in/gomail.v2 v2.0.0-20160411212932-81ebce5c23df h1:n7WqCuqOuCbNr617RXOY0AWRXxgwEyPp2z+p0+hgMuE=\ngopkg.in/gomail.v2 v2.0.0-20160411212932-81ebce5c23df/go.mod h1:LRQQ+SO6ZHR7tOkpBDuZnXENFzX8qRjMDMyPD6BRkCw=\ngopkg.in/ini.v1 v1.56.0/go.mod h1:pNLf8WUiyNEtQjuu5G5vTm06TEv9tsIgeAvK8hOrP4k=\ngopkg.in/ini.v1 v1.67.0 h1:Dgnx+6+nfE+IfzjUEISNeydPJh9AXNNsWbGP9KzCsOA=\ngopkg.in/ini.v1 v1.67.0/go.mod h1:pNLf8WUiyNEtQjuu5G5vTm06TEv9tsIgeAvK8hOrP4k=\ngopkg.in/natefinch/lumberjack.v2 v2.0.0/go.mod h1:l0ndWWf7gzL7RNwBG7wST/UCcT4T24xpD6X8LsfU/+k=\ngopkg.in/natefinch/lumberjack.v2 v2.2.1 h1:bBRl1b0OH9s/DuPhuXpNl+VtCaJXFZ5/uEFST95x9zc=\ngopkg.in/natefinch/lumberjack.v2 v2.2.1/go.mod h1:YD8tP3GAjkrDg1eZH7EGmyESg/lsYskCTPBJVb9jqSc=\ngopkg.in/square/go-jose.v2 v2.6.0 h1:NGk74WTnPKBNUhNzQX7PYcTLUjoq7mzKk2OKbvwk2iI=\ngopkg.in/square/go-jose.v2 v2.6.0/go.mod h1:M9dMgbHiYLoDGQrXy7OpJDJWiKiU//h+vD76mk0e1AI=\ngopkg.in/yaml.v2 v2.2.2/go.mod h1:hI93XBmqTisBFMUTm0b8Fm+jr3Dg1NNxqwp+5A1VGuI=\ngopkg.in/yaml.v2 v2.2.8/go.mod h1:hI93XBmqTisBFMUTm0b8Fm+jr3Dg1NNxqwp+5A1VGuI=\ngopkg.in/yaml.v2 v2.4.0 h1:D8xgwECY7CYvx+Y2n4sBz93Jn9JRvxdiyyo8CTfuKaY=\ngopkg.in/yaml.v2 v2.4.0/go.mod h1:RDklbk79AGWmwhnvt/jBztapEOGDOx6ZbXqjP6csGnQ=\ngopkg.in/yaml.v3 v3.0.0-20200313102051-9f266ea9e77c/go.mod h1:K4uyk7z7BCEPqu6E+C64Yfv1cQ7kz7rIZviUmN+EgEM=\ngopkg.in/yaml.v3 v3.0.0-20210107192922-496545a6307b/go.mod h1:K4uyk7z7BCEPqu6E+C64Yfv1cQ7kz7rIZviUmN+EgEM=\ngopkg.in/yaml.v3 v3.0.1 h1:fxVm/GzAzEWqLHuvctI91KS9hhNmmWOoWu0XTYJS7CA=\ngopkg.in/yaml.v3 v3.0.1/go.mod h1:K4uyk7z7BCEPqu6E+C64Yfv1cQ7kz7rIZviUmN+EgEM=\ngorm.io/driver/clickhouse v0.6.1 h1:t7JMB6sLBXxN8hEO6RdzCbJCwq/jAEVZdwXlmQs1Sd4=\ngorm.io/driver/clickhouse v0.6.1/go.mod h1:riMYpJcGZ3sJ/OAZZ1rEP1j/Y0H6cByOAnwz7fo2AyM=\ngorm.io/driver/mysql v1.4.4 h1:MX0K9Qvy0Na4o7qSC/YI7XxqUw5KDw01umqgID+svdQ=\ngorm.io/driver/mysql v1.4.4/go.mod h1:BCg8cKI+R0j/rZRQxeKis/forqRwRSYOR8OM3Wo6hOM=\ngorm.io/driver/postgres v1.5.11 h1:ubBVAfbKEUld/twyKZ0IYn9rSQh448EdelLYk9Mv314=\ngorm.io/driver/postgres v1.5.11/go.mod h1:DX3GReXH+3FPWGrrgffdvCk3DQ1dwDPdmbenSkweRGI=\ngorm.io/driver/sqlite v1.5.5 h1:7MDMtUZhV065SilG62E0MquljeArQZNfJnjd9i9gx3E=\ngorm.io/driver/sqlite v1.5.5/go.mod h1:6NgQ7sQWAIFsPrJJl1lSNSu2TABh0ZZ/zm5fosATavE=\ngorm.io/gorm v1.23.8/go.mod h1:l2lP/RyAtc1ynaTjFksBde/O8v9oOGIApu2/xRitmZk=\ngorm.io/gorm v1.25.10 h1:dQpO+33KalOA+aFYGlK+EfxcI5MbO7EP2yYygwh9h+s=\ngorm.io/gorm v1.25.10/go.mod h1:hbnx/Oo0ChWMn1BIhpy1oYozzpM15i4YPuHDmfYtwg8=\nhonnef.co/go/tools v0.0.0-20190102054323-c2f93a96b099/go.mod h1:rf3lG4BRIbNafJWhAfAdb/ePZxsR/4RtNHQocxwk9r4=\nhonnef.co/go/tools v0.0.0-20190523083050-ea95bdfd59fc/go.mod h1:rf3lG4BRIbNafJWhAfAdb/ePZxsR/4RtNHQocxwk9r4=\nmodernc.org/libc v1.22.5 h1:91BNch/e5B0uPbJFgqbxXuOnxBQjlS//icfQEGmvyjE=\nmodernc.org/libc v1.22.5/go.mod h1:jj+Z7dTNX8fBScMVNRAYZ/jF91K8fdT2hYMThc3YjBY=\nmodernc.org/mathutil v1.6.0 h1:fRe9+AmYlaej+64JsEEhoWuAYBkOtQiMEU7n/XgfYi4=\nmodernc.org/mathutil v1.6.0/go.mod h1:Ui5Q9q1TR2gFm0AQRqQUaBWFLAhQpCwNcuhBOSedWPo=\nmodernc.org/memory v1.5.0 h1:N+/8c5rE6EqugZwHii4IFsaJ7MUhoWX07J5tC/iI5Ds=\nmodernc.org/memory v1.5.0/go.mod h1:PkUhL0Mugw21sHPeskwZW4D6VscE/GQJOnIpCnW6pSU=\nmodernc.org/sqlite v1.23.1 h1:nrSBg4aRQQwq59JpvGEQ15tNxoO5pX/kUjcRNwSAGQM=\nmodernc.org/sqlite v1.23.1/go.mod h1:OrDj17Mggn6MhE+iPbBNf7RGKODDE9NFT0f3EwDzJqk=\nrsc.io/pdf v0.1.1/go.mod h1:n8OzWcQ6Sp37PL01nO98y4iUCRdTGarVfzxY20ICaU4=\n"
},
{
"path": "integrations/AMD_ROCm_SMI/collect/amd_rocm_smi/rocm.toml",
"content": "# Query statistics from AMD Graphics cards using rocm-smi binary\n# bin_path = \"/opt/rocm/bin/rocm-smi\"\n\n## Optional: timeout for GPU polling\n# timeout = \"5s\""
},
{
"path": "integrations/AMD_ROCm_SMI/markdown/README.md",
"content": "# AMD ROCm System Management Interface (SMI) Input Plugin\n\nforked from [telegraf/amd_rocm_smi](https://github.com/influxdata/telegraf/blob/master/plugins/inputs/amd_rocm_smi)\n\nThis plugin uses a query on the [`rocm-smi`][1] binary to pull GPU stats\nincluding memory and GPU usage, temperatures and other.\n\n[1]: https://github.com/RadeonOpenCompute/rocm_smi_lib/tree/master/python_smi_tools\n\n## Global configuration options \n\nIn addition to the plugin-specific configuration settings, plugins support\nadditional global and plugin configuration settings. These settings are used to\nmodify metrics, tags, and field or create aliases and configure ordering, etc.\nSee the [CONFIGURATION.md][CONFIGURATION.md] for more details.\n\n[CONFIGURATION.md]: https://github.com/influxdata/telegraf/blob/master/docs/CONFIGURATION.md#plugins\n\n## Configuration\n\n```toml \n# Query statistics from AMD Graphics cards using rocm-smi binary\n# bin_path = \"/opt/rocm/bin/rocm-smi\"\n# bin_path 不设置 则不采集\n\n## Optional: timeout for GPU polling\n# timeout = \"5s\"\n```\n\n## Metrics\n\n- measurement: `amd_rocm_smi`\n - tags\n - `name` (entry name assigned by rocm-smi executable)\n - `gpu_id` (id of the GPU according to rocm-smi)\n - `gpu_unique_id` (unique id of the GPU)\n\n - fields\n - `driver_version` (integer)\n - `fan_speed`(integer)\n - `memory_total`(integer B)\n - `memory_used`(integer B)\n - `memory_free`(integer B)\n - `temperature_sensor_edge` (float, Celsius)\n - `temperature_sensor_junction` (float, Celsius)\n - `temperature_sensor_memory` (float, Celsius)\n - `utilization_gpu` (integer, percentage)\n - `utilization_memory` (integer, percentage)\n - `clocks_current_sm` (integer, Mhz)\n - `clocks_current_memory` (integer, Mhz)\n - `power_draw` (float, Watt)\n\n## Troubleshooting\n\nCheck the full output by running `rocm-smi` binary manually.\n\nLinux:\n\n```sh\nrocm-smi rocm-smi -o -l -m -M -g -c -t -u -i -f -p -P -s -S -v --showreplaycount --showpids --showdriverversion --showmemvendor --showfwinfo --showproductname --showserial --showuniqueid --showbus --showpendingpages --showpagesinfo --showretiredpages --showunreservablepages --showmemuse --showvoltage --showtopo --showtopoweight --showtopohops --showtopotype --showtoponuma --showmeminfo all --json\n```\n\nPlease include the output of this command if opening a GitHub issue, together\nwith ROCm version.\n\n## Example Output\n\n```text\namd_rocm_smi,gpu_id=0x6861,gpu_unique_id=0x2150e7d042a1124,host=ali47xl,name=card0 clocks_current_memory=167i,clocks_current_sm=852i,driver_version=51114i,fan_speed=14i,memory_free=17145282560i,memory_total=17163091968i,memory_used=17809408i,power_draw=7,temperature_sensor_edge=28,temperature_sensor_junction=29,temperature_sensor_memory=92,utilization_gpu=0i 1630572551000000000\namd_rocm_smi,gpu_id=0x6861,gpu_unique_id=0x2150e7d042a1124,host=ali47xl,name=card0 clocks_current_memory=167i,clocks_current_sm=852i,driver_version=51114i,fan_speed=14i,memory_free=17145282560i,memory_total=17163091968i,memory_used=17809408i,power_draw=7,temperature_sensor_edge=29,temperature_sensor_junction=30,temperature_sensor_memory=91,utilization_gpu=0i 1630572701000000000\namd_rocm_smi,gpu_id=0x6861,gpu_unique_id=0x2150e7d042a1124,host=ali47xl,name=card0 clocks_current_memory=167i,clocks_current_sm=852i,driver_version=51114i,fan_speed=14i,memory_free=17145282560i,memory_total=17163091968i,memory_used=17809408i,power_draw=7,temperature_sensor_edge=29,temperature_sensor_junction=29,temperature_sensor_memory=92,utilization_gpu=0i 1630572749000000000\n```\n\n## Limitations and notices\n\nPlease notice that this plugin has been developed and tested on a limited number\nof versions and small set of GPUs. Currently the latest ROCm version tested is\n4.3.0. Notice that depending on the device and driver versions the amount of\ninformation provided by `rocm-smi` can vary so that some fields would start/stop\nappearing in the metrics upon updates. The `rocm-smi` JSON output is not\nperfectly homogeneous and is possibly changing in the future, hence parsing and\nunmarshaling can start failing upon updating ROCm.\n\nInspired by the current state of the art of the `nvidia-smi` plugin."
},
{
"path": "integrations/AliYun/collect/aliyun/cloud.toml",
"content": "# # collect interval\n# interval = 60\n[[instances]]\n# # endpoint region 参考 https://help.aliyun.com/document_detail/28616.html#section-72p-xhs-6qt\n# region=\"cn-beijing\"\n# endpoint=\"metrics.cn-hangzhou.aliyuncs.com\"\n# access_key_id=\"your-access-key-id\"\n# access_key_secret=\"your-access-key-secret\"\n# interval_times=4\n# delay=\"10m\"\n# period=\"60s\"\n# # namespace 参考 https://help.aliyun.com/document_detail/163515.htm?spm=a2c4g.11186623.0.0.44d65c58mhgNw3\n# namespaces=[\"acs_ecs_dashboard\"]\n# [[instances.metric_filters]]\n# # metric name 参考 https://help.aliyun.com/document_detail/163515.htm?spm=a2c4g.11186623.0.0.401d15c73Z0dZh\n# # 参考页面中的Metric Id 填入下面的metricName ,页面中包含中文的Metric Name对应接口中的Description\n# metric_names=[\"cpu_cores\",\"vm.TcpCount\"]\n# namespace=\"\"\n# ratelimit=25\n# catch_ttl=\"1h\"\n# timeout=\"5s\"\n"
},
{
"path": "integrations/AliYun/dashboards/arms-api.json",
"content": "{\n \"id\": 0,\n \"group_id\": 0,\n \"name\": \"ARMS-API\",\n \"ident\": \"\",\n \"tags\": \"ARMS JVM\",\n \"create_at\": 0,\n \"create_by\": \"\",\n \"update_at\": 0,\n \"update_by\": \"\",\n \"configs\": {\n \"links\": [],\n \"panels\": [\n {\n \"collapsed\": true,\n \"id\": \"2309f230-83bc-4e48-8422-5d9556154af1\",\n \"layout\": {\n \"h\": 1,\n \"i\": \"2309f230-83bc-4e48-8422-5d9556154af1\",\n \"isResizable\": false,\n \"w\": 24,\n \"x\": 0,\n \"y\": 0\n },\n \"name\": \"指标汇总\",\n \"panels\": [],\n \"type\": \"row\",\n \"version\": \"3.0.0\"\n },\n {\n \"custom\": {\n \"aggrDimension\": [\n \"host\"\n ],\n \"calc\": \"lastNotNull\",\n \"colorMode\": \"value\",\n \"displayMode\": \"labelValuesToRows\",\n \"showHeader\": true,\n \"sortOrder\": \"ascend\"\n },\n \"datasourceCate\": \"prometheus\",\n \"datasourceValue\": \"${datasource}\",\n \"description\": \"展示选定时段内承载了接口R的机器指标\",\n \"id\": \"76a4644d-7b96-4e4c-8486-7f93b6fda1e6\",\n \"layout\": {\n \"h\": 6,\n \"i\": \"73025dc0-5732-4753-8eac-c56adf1e42b1\",\n \"isResizable\": true,\n \"w\": 24,\n \"x\": 0,\n \"y\": 1\n },\n \"links\": [],\n \"maxPerRow\": 4,\n \"name\": \"机器维度-指标列表(选定时段)\",\n \"options\": {\n \"standardOptions\": {}\n },\n \"overrides\": [\n {}\n ],\n \"targets\": [\n {\n \"expr\": \"sum by (host) (sum_over_time(arms_app_requests_count{service=\\\"$service\\\",rpc=\\\"$rpc\\\",callType=~\\\"^dsf$|^http$|^dubbo$|^mq$|^user_method$|^producer$|^thrift$|^hsf$|^server$|^grpc$\\\",prpc=\\\"__all__\\\",ppid=\\\"__all__\\\",endpoint=\\\"__all__\\\",destId=\\\"__all__\\\"}[$__range]))\",\n \"legend\": \"请求总量\",\n \"refId\": \"A\"\n },\n {\n \"expr\": \"sum by (host) (sum_over_time(arms_app_requests_error_count{service=\\\"$service\\\",rpc=\\\"$rpc\\\",callType=~\\\"^dsf$|^http$|^dubbo$|^mq$|^user_method$|^producer$|^thrift$|^hsf$|^server$|^grpc$\\\",prpc=\\\"__all__\\\",ppid=\\\"__all__\\\",endpoint=\\\"__all__\\\",destId=\\\"__all__\\\"}[$__range]))\",\n \"legend\": \"错误总数\",\n \"refId\": \"B\"\n },\n {\n \"expr\": \"sum by (host) (sum_over_time(arms_app_requests_seconds{service=\\\"$service\\\",rpc=\\\"$rpc\\\",callType=~\\\"^dsf$|^http$|^dubbo$|^mq$|^user_method$|^producer$|^thrift$|^hsf$|^server$|^grpc$\\\",prpc=\\\"__all__\\\",ppid=\\\"__all__\\\",endpoint=\\\"__all__\\\",destId=\\\"__all__\\\"}[$__range]))/sum by (host) (sum_over_time(arms_app_requests_count{service=\\\"$service\\\",rpc=\\\"$rpc\\\",callType=~\\\"^dsf$|^http$|^dubbo$|^mq$|^user_method$|^producer$|^thrift$|^hsf$|^server$|^grpc$\\\",prpc=\\\"__all__\\\",ppid=\\\"__all__\\\",endpoint=\\\"__all__\\\",destId=\\\"__all__\\\"}[$__range]))\",\n \"legend\": \"平均耗时\",\n \"refId\": \"C\"\n },\n {\n \"expr\": \"sum by (host) (sum_over_time(arms_exception_requests_count{service=\\\"$service\\\",rpc=\\\"$rpc\\\"}[$__range])) or on (host) (group by (host) (max_over_time(arms_app_requests_count{service=\\\"$service\\\",rpc=\\\"$rpc\\\",callType=~\\\"^dsf$|^http$|^dubbo$|^mq$|^user_method$|^producer$|^thrift$|^hsf$|^server$|^grpc$\\\",prpc=\\\"__all__\\\",ppid=\\\"__all__\\\",endpoint=\\\"__all__\\\",destId=\\\"__all__\\\"}[$__range]))-1)\",\n \"legend\": \"异常数\",\n \"refId\": \"G\"\n },\n {\n \"expr\": \"max by (host) (max_over_time(arms_http_requests_latency_seconds{service=\\\"$service\\\",rpc=\\\"$rpc\\\",quantile=\\\"0.75\\\"}[$__range])) or on (host) (group by (host) (max_over_time(arms_app_requests_count{service=\\\"$service\\\",rpc=\\\"$rpc\\\",callType=~\\\"^dsf$|^http$|^dubbo$|^mq$|^user_method$|^producer$|^thrift$|^hsf$|^server$|^grpc$\\\",prpc=\\\"__all__\\\",ppid=\\\"__all__\\\",endpoint=\\\"__all__\\\",destId=\\\"__all__\\\"}[$__range]))-1)\",\n \"legend\": \"75分位延时\",\n \"refId\": \"D\"\n },\n {\n \"expr\": \"max by (host) (max_over_time(arms_http_requests_latency_seconds{service=\\\"$service\\\",rpc=\\\"$rpc\\\",quantile=\\\"0.9\\\"}[$__range])) or on (host) (group by (host) (max_over_time(arms_app_requests_count{service=\\\"$service\\\",rpc=\\\"$rpc\\\",callType=~\\\"^dsf$|^http$|^dubbo$|^mq$|^user_method$|^producer$|^thrift$|^hsf$|^server$|^grpc$\\\",prpc=\\\"__all__\\\",ppid=\\\"__all__\\\",endpoint=\\\"__all__\\\",destId=\\\"__all__\\\"}[$__range]))-1)\",\n \"legend\": \"90分位延时\",\n \"refId\": \"E\"\n },\n {\n \"expr\": \"max by (host) (max_over_time(arms_http_requests_latency_seconds{service=\\\"$service\\\",rpc=\\\"$rpc\\\",quantile=\\\"0.99\\\"}[$__range])) or on (host) (group by (host) (max_over_time(arms_app_requests_count{service=\\\"$service\\\",rpc=\\\"$rpc\\\",callType=~\\\"^dsf$|^http$|^dubbo$|^mq$|^user_method$|^producer$|^thrift$|^hsf$|^server$|^grpc$\\\",prpc=\\\"__all__\\\",ppid=\\\"__all__\\\",endpoint=\\\"__all__\\\",destId=\\\"__all__\\\"}[$__range]))-1)\",\n \"legend\": \"{{host}}:99分位\",\n \"refId\": \"F\"\n }\n ],\n \"transformations\": [\n {\n \"id\": \"organize\",\n \"options\": {}\n }\n ],\n \"type\": \"table\",\n \"version\": \"3.0.0\"\n },\n {\n \"collapsed\": true,\n \"id\": \"66d6b812-fbc3-4a71-a9a8-0d6b72dafe04\",\n \"layout\": {\n \"h\": 1,\n \"i\": \"66d6b812-fbc3-4a71-a9a8-0d6b72dafe04\",\n \"isResizable\": false,\n \"w\": 24,\n \"x\": 0,\n \"y\": 7\n },\n \"name\": \"概览\",\n \"panels\": [],\n \"type\": \"row\",\n \"version\": \"3.0.0\"\n },\n {\n \"custom\": {\n \"drawStyle\": \"lines\",\n \"fillOpacity\": 0.3,\n \"gradientMode\": \"opacity\",\n \"lineInterpolation\": \"linear\",\n \"lineWidth\": 2,\n \"stack\": \"off\",\n \"version\": \"3.0.0\"\n },\n \"datasourceCate\": \"prometheus\",\n \"datasourceValue\": \"${datasource}\",\n \"id\": \"17655cb8-e070-48cc-ba16-cba9d5c3e984\",\n \"layout\": {\n \"h\": 8,\n \"i\": \"17655cb8-e070-48cc-ba16-cba9d5c3e984\",\n \"isResizable\": true,\n \"w\": 12,\n \"x\": 0,\n \"y\": 8\n },\n \"links\": [],\n \"maxPerRow\": 4,\n \"name\": \"接口耗时堆叠图\",\n \"options\": {\n \"legend\": {\n \"displayMode\": \"hidden\"\n },\n \"thresholds\": {\n \"steps\": [\n {\n \"color\": \"#634CD9\",\n \"type\": \"base\",\n \"value\": null\n }\n ]\n },\n \"tooltip\": {\n \"mode\": \"all\",\n \"sort\": \"none\"\n }\n },\n \"targets\": [\n {\n \"expr\": \"(sum by (callType) (arms_app_requests_seconds{service=\\\"$service\\\",rpc=\\\"$rpc\\\",callType=~\\\"^dubbo_client$|^http_client$|^mongodb$|^oracle$|^client$|^redis$|^dmdb$|^thrift_client$|^dsf_client$|^db$|^mq_client$|^grpc_client$|^hsf_client$|^mysql$|^postgresql$|^memcached$|^consumer$\\\"}) or label_replace(sum(arms_app_requests_seconds{service=\\\"$service\\\",rpc=\\\"$rpc\\\",callType=~\\\"^dsf$|^http$|^dubbo$|^mq$|^user_method$|^producer$|^thrift$|^hsf$|^server$|^grpc$\\\"})- sum(arms_app_requests_seconds{service=\\\"$service\\\",rpc=\\\"$rpc\\\",callType=~\\\"^dubbo_client$|^http_client$|^mongodb$|^oracle$|^client$|^redis$|^dmdb$|^thrift_client$|^dsf_client$|^db$|^mq_client$|^grpc_client$|^hsf_client$|^mysql$|^postgresql$|^memcached$|^consumer$\\\"}),\\\"callType\\\",\\\"other\\\",\\\"callType\\\",\\\".*\\\"))/ on () group_left() sum(arms_app_requests_count{service=\\\"$service\\\",rpc=\\\"$rpc\\\",callType=~\\\"^dsf$|^http$|^dubbo$|^mq$|^user_method$|^producer$|^thrift$|^hsf$|^server$|^grpc$\\\"})\",\n \"legend\": \"{{callType}}\",\n \"refId\": \"A\"\n }\n ],\n \"type\": \"timeseries\",\n \"version\": \"3.0.0\"\n },\n {\n \"custom\": {\n \"drawStyle\": \"lines\",\n \"fillOpacity\": 0.3,\n \"gradientMode\": \"opacity\",\n \"lineInterpolation\": \"linear\",\n \"lineWidth\": 2,\n \"stack\": \"off\",\n \"version\": \"3.0.0\"\n },\n \"datasourceCate\": \"prometheus\",\n \"datasourceValue\": \"${datasource}\",\n \"id\": \"e2d00781-a62e-4e7e-8808-05b89c986141\",\n \"layout\": {\n \"h\": 8,\n \"i\": \"e2d00781-a62e-4e7e-8808-05b89c986141\",\n \"isResizable\": true,\n \"w\": 12,\n \"x\": 12,\n \"y\": 8\n },\n \"links\": [],\n \"maxPerRow\": 4,\n \"name\": \"响应时间/每分钟\",\n \"options\": {\n \"legend\": {\n \"displayMode\": \"hidden\"\n },\n \"thresholds\": {\n \"steps\": [\n {\n \"color\": \"#634CD9\",\n \"type\": \"base\",\n \"value\": null\n }\n ]\n },\n \"tooltip\": {\n \"mode\": \"all\",\n \"sort\": \"none\"\n }\n },\n \"targets\": [\n {\n \"expr\": \"sum by (callType) (sum_over_time(arms_app_requests_seconds{service=\\\"$service\\\",rpc=\\\"$rpc\\\",host=~\\\"$host\\\",callType=~\\\"^dsf$|^http$|^dubbo$|^mq$|^user_method$|^producer$|^thrift$|^hsf$|^server$|^grpc$\\\",prpc=\\\"__all__\\\",ppid=\\\"__all__\\\",endpoint=\\\"__all__\\\",destId=\\\"__all__\\\"}[1m]))/sum by (callType) (sum_over_time(arms_app_requests_count{service=\\\"$service\\\",rpc=\\\"$rpc\\\",host=~\\\"$host\\\",callType=~\\\"^dsf$|^http$|^dubbo$|^mq$|^user_method$|^producer$|^thrift$|^hsf$|^server$|^grpc$\\\",prpc=\\\"__all__\\\",ppid=\\\"__all__\\\",endpoint=\\\"__all__\\\",destId=\\\"__all__\\\"}[1m]))\",\n \"legend\": \"{{callType}}入口\",\n \"refId\": \"A\"\n }\n ],\n \"type\": \"timeseries\",\n \"version\": \"3.0.0\"\n },\n {\n \"custom\": {\n \"drawStyle\": \"lines\",\n \"fillOpacity\": 0.3,\n \"gradientMode\": \"opacity\",\n \"lineInterpolation\": \"linear\",\n \"lineWidth\": 2,\n \"stack\": \"off\",\n \"version\": \"3.0.0\"\n },\n \"datasourceCate\": \"prometheus\",\n \"datasourceValue\": \"${datasource}\",\n \"id\": \"5df881f7-c6a0-49ff-8756-ad0fa079e7a4\",\n \"layout\": {\n \"h\": 8,\n \"i\": \"5df881f7-c6a0-49ff-8756-ad0fa079e7a4\",\n \"isResizable\": true,\n \"w\": 12,\n \"x\": 0,\n \"y\": 16\n },\n \"links\": [],\n \"maxPerRow\": 4,\n \"name\": \"请求数/每分钟\",\n \"options\": {\n \"legend\": {\n \"displayMode\": \"hidden\"\n },\n \"thresholds\": {\n \"steps\": [\n {\n \"color\": \"#634CD9\",\n \"type\": \"base\",\n \"value\": null\n }\n ]\n },\n \"tooltip\": {\n \"mode\": \"all\",\n \"sort\": \"none\"\n }\n },\n \"targets\": [\n {\n \"expr\": \"sum by (callType) (sum_over_time(arms_app_requests_count{service=\\\"$service\\\",rpc=\\\"$rpc\\\",host=~\\\"$host\\\",callType=~\\\"^dsf$|^http$|^dubbo$|^mq$|^user_method$|^producer$|^thrift$|^hsf$|^server$|^grpc$\\\",prpc=\\\"__all__\\\",ppid=\\\"__all__\\\",endpoint=\\\"__all__\\\",destId=\\\"__all__\\\"}[1m]))\",\n \"legend\": \"{{callType}}入口\",\n \"refId\": \"A\"\n }\n ],\n \"type\": \"timeseries\",\n \"version\": \"3.0.0\"\n },\n {\n \"custom\": {\n \"drawStyle\": \"lines\",\n \"fillOpacity\": 0.3,\n \"gradientMode\": \"opacity\",\n \"lineInterpolation\": \"linear\",\n \"lineWidth\": 2,\n \"stack\": \"off\",\n \"version\": \"3.0.0\"\n },\n \"datasourceCate\": \"prometheus\",\n \"datasourceValue\": \"${datasource}\",\n \"id\": \"929ab59e-08fe-4665-beed-8327cc5e4a96\",\n \"layout\": {\n \"h\": 8,\n \"i\": \"929ab59e-08fe-4665-beed-8327cc5e4a96\",\n \"isResizable\": true,\n \"w\": 12,\n \"x\": 12,\n \"y\": 16\n },\n \"links\": [],\n \"maxPerRow\": 4,\n \"name\": \"HTTP-状态码统计\",\n \"options\": {\n \"legend\": {\n \"displayMode\": \"hidden\"\n },\n \"thresholds\": {\n \"steps\": [\n {\n \"color\": \"#634CD9\",\n \"type\": \"base\",\n \"value\": null\n }\n ]\n },\n \"tooltip\": {\n \"mode\": \"all\",\n \"sort\": \"none\"\n }\n },\n \"targets\": [\n {\n \"expr\": \"sum by (status) (sum_over_time(arms_requests_by_status_count{service=\\\"$service\\\",callType=\\\"http\\\",rpc=\\\"$rpc\\\",host=~\\\"$host\\\"}[1m]))\",\n \"legend\": \"{{status}}\",\n \"refId\": \"A\"\n }\n ],\n \"type\": \"timeseries\",\n \"version\": \"3.0.0\"\n },\n {\n \"custom\": {\n \"drawStyle\": \"lines\",\n \"fillOpacity\": 0.3,\n \"gradientMode\": \"opacity\",\n \"lineInterpolation\": \"linear\",\n \"lineWidth\": 2,\n \"stack\": \"off\",\n \"version\": \"3.0.0\"\n },\n \"datasourceCate\": \"prometheus\",\n \"datasourceValue\": \"${datasource}\",\n \"id\": \"0d1843e3-d786-4763-9e2d-4e7b1621a372\",\n \"layout\": {\n \"h\": 8,\n \"i\": \"0d1843e3-d786-4763-9e2d-4e7b1621a372\",\n \"isResizable\": true,\n \"w\": 12,\n \"x\": 0,\n \"y\": 24\n },\n \"links\": [],\n \"maxPerRow\": 4,\n \"name\": \"响应时间-分数位指标\",\n \"options\": {\n \"legend\": {\n \"displayMode\": \"hidden\"\n },\n \"thresholds\": {\n \"steps\": [\n {\n \"color\": \"#634CD9\",\n \"type\": \"base\",\n \"value\": null\n }\n ]\n },\n \"tooltip\": {\n \"mode\": \"all\",\n \"sort\": \"none\"\n }\n },\n \"targets\": [\n {\n \"expr\": \"max(arms_http_requests_latency_seconds{service=\\\"$service\\\",rpc=\\\"$rpc\\\",host=~\\\"$host\\\",quantile=\\\"0.75\\\"})\",\n \"legend\": \"p75\",\n \"refId\": \"A\"\n },\n {\n \"expr\": \"max(arms_http_requests_latency_seconds{service=\\\"$service\\\",rpc=\\\"$rpc\\\",host=~\\\"$host\\\",quantile=\\\"0.9\\\"})\",\n \"legend\": \"p90\",\n \"refId\": \"B\"\n },\n {\n \"expr\": \"max(arms_http_requests_latency_seconds{service=\\\"$service\\\",rpc=\\\"$rpc\\\",host=~\\\"$host\\\",quantile=\\\"0.99\\\"})\",\n \"legend\": \"p99\",\n \"refId\": \"C\"\n }\n ],\n \"type\": \"timeseries\",\n \"version\": \"3.0.0\"\n },\n {\n \"custom\": {\n \"drawStyle\": \"lines\",\n \"fillOpacity\": 0.3,\n \"gradientMode\": \"opacity\",\n \"lineInterpolation\": \"linear\",\n \"lineWidth\": 2,\n \"stack\": \"off\",\n \"version\": \"3.0.0\"\n },\n \"datasourceCate\": \"prometheus\",\n \"datasourceValue\": \"${datasource}\",\n \"id\": \"808cfbe5-57dd-44c5-82c7-1877c632519f\",\n \"layout\": {\n \"h\": 8,\n \"i\": \"808cfbe5-57dd-44c5-82c7-1877c632519f\",\n \"isResizable\": true,\n \"w\": 12,\n \"x\": 12,\n \"y\": 29\n },\n \"links\": [],\n \"maxPerRow\": 4,\n \"name\": \"错误数/每分钟\",\n \"options\": {\n \"legend\": {\n \"displayMode\": \"hidden\"\n },\n \"thresholds\": {\n \"steps\": [\n {\n \"color\": \"#634CD9\",\n \"type\": \"base\",\n \"value\": null\n }\n ]\n },\n \"tooltip\": {\n \"mode\": \"all\",\n \"sort\": \"none\"\n }\n },\n \"targets\": [\n {\n \"expr\": \"sum by (callType) (sum_over_time(arms_app_requests_error_count{service=\\\"$service\\\",rpc=\\\"$rpc\\\",host=~\\\"$host\\\",callType=~\\\"^dsf$|^http$|^dubbo$|^mq$|^user_method$|^producer$|^thrift$|^hsf$|^server$|^grpc$\\\",prpc=\\\"__all__\\\",ppid=\\\"__all__\\\",endpoint=\\\"__all__\\\",destId=\\\"__all__\\\"}[1m]))\",\n \"legend\": \"{{callType}}入口\",\n \"refId\": \"A\"\n }\n ],\n \"type\": \"timeseries\",\n \"version\": \"3.0.0\"\n },\n {\n \"collapsed\": true,\n \"id\": \"dfb801f2-06b2-4cdf-824a-c48b6a579085\",\n \"layout\": {\n \"h\": 1,\n \"i\": \"dfb801f2-06b2-4cdf-824a-c48b6a579085\",\n \"isResizable\": false,\n \"w\": 24,\n \"x\": 0,\n \"y\": 33\n },\n \"name\": \"链路上游\",\n \"panels\": [],\n \"type\": \"row\",\n \"version\": \"3.0.0\"\n },\n {\n \"custom\": {\n \"aggrDimension\": [\n \"uniq\"\n ],\n \"calc\": \"lastNotNull\",\n \"colorMode\": \"value\",\n \"displayMode\": \"labelValuesToRows\",\n \"showHeader\": true,\n \"sortOrder\": \"ascend\"\n },\n \"datasourceCate\": \"prometheus\",\n \"datasourceValue\": \"${datasource}\",\n \"description\": \"展示选定时段内调用了部署在机器N(默认为All,表示所有机器)上的接口R的上游服务的相关指标\",\n \"id\": \"2386728f-9a8f-406b-98d5-5d5f0eda2c21\",\n \"layout\": {\n \"h\": 6,\n \"i\": \"2386728f-9a8f-406b-98d5-5d5f0eda2c21\",\n \"isResizable\": true,\n \"w\": 24,\n \"x\": 0,\n \"y\": 34\n },\n \"links\": [],\n \"maxPerRow\": 4,\n \"name\": \"链路上游\",\n \"options\": {\n \"standardOptions\": {}\n },\n \"overrides\": [\n {}\n ],\n \"targets\": [\n {\n \"expr\": \"label_join(sum by (prpc,parent) (sum_over_time(arms_app_requests_count{service=\\\"$service\\\",rpc=\\\"$rpc\\\",prpc!=\\\"nil\\\",prpc!=\\\"\\\",host=~\\\"$host\\\",parent!=\\\"\\\",parent!=\\\"nil\\\",rpc!=\\\"__all__\\\",endpoint!=\\\"__all__\\\",destId!=\\\"__all__\\\"}[$__range])),\\\"uniq\\\",\\\"-\\\",\\\"parent\\\",\\\"prpc\\\")\",\n \"legend\": \"\",\n \"refId\": \"A\"\n },\n {\n \"expr\": \"sum by (uniq) (label_join(sum_over_time(arms_app_requests_seconds{service=\\\"$service\\\",rpc=\\\"$rpc\\\",prpc!=\\\"nil\\\",prpc!=\\\"\\\",parent!=\\\"\\\",parent!=\\\"nil\\\",host=~\\\"$host\\\",rpc!=\\\"__all__\\\",endpoint!=\\\"__all__\\\",destId!=\\\"__all__\\\"}[$__range]),\\\"uniq\\\",\\\"-\\\",\\\"parent\\\",\\\"prpc\\\"))/sum by (uniq) (label_join(sum_over_time(arms_app_requests_count{service=\\\"$service\\\",rpc=\\\"$rpc\\\",prpc!=\\\"nil\\\",prpc!=\\\"\\\",parent!=\\\"\\\",parent!=\\\"nil\\\",host=~\\\"$host\\\",rpc!=\\\"__all__\\\",endpoint!=\\\"__all__\\\",destId!=\\\"__all__\\\"}[$__range]),\\\"uniq\\\",\\\"-\\\",\\\"parent\\\",\\\"prpc\\\"))\",\n \"legend\": \"耗时\",\n \"refId\": \"B\"\n },\n {\n \"expr\": \"sum by (uniq) (label_join(sum_over_time(arms_app_requests_error_count{service=\\\"$service\\\",rpc=\\\"$rpc\\\",prpc!=\\\"\\\",prpc!=\\\"nil\\\",parent!=\\\"nil\\\",parent!=\\\"\\\",host=~\\\"$host\\\",rpc!=\\\"__all__\\\",endpoint!=\\\"__all__\\\",destId!=\\\"__all__\\\"}[$__range]),\\\"uniq\\\",\\\"-\\\",\\\"parent\\\",\\\"prpc\\\"))\",\n \"legend\": \"错误数\",\n \"refId\": \"C\"\n }\n ],\n \"transformations\": [\n {\n \"id\": \"organize\",\n \"options\": {}\n }\n ],\n \"type\": \"table\",\n \"version\": \"3.0.0\"\n },\n {\n \"custom\": {\n \"drawStyle\": \"lines\",\n \"fillOpacity\": 0.3,\n \"gradientMode\": \"opacity\",\n \"lineInterpolation\": \"linear\",\n \"lineWidth\": 2,\n \"stack\": \"off\",\n \"version\": \"3.0.0\"\n },\n \"datasourceCate\": \"prometheus\",\n \"datasourceValue\": \"${datasource}\",\n \"id\": \"c7571f5a-9fde-4483-8d53-8841486a5351\",\n \"layout\": {\n \"h\": 8,\n \"i\": \"c7571f5a-9fde-4483-8d53-8841486a5351\",\n \"isResizable\": true,\n \"w\": 24,\n \"x\": 0,\n \"y\": 40\n },\n \"links\": [],\n \"maxPerRow\": 4,\n \"name\": \"请求数/每分钟\",\n \"options\": {\n \"legend\": {\n \"displayMode\": \"hidden\"\n },\n \"thresholds\": {\n \"steps\": [\n {\n \"color\": \"#634CD9\",\n \"type\": \"base\",\n \"value\": null\n }\n ]\n },\n \"tooltip\": {\n \"mode\": \"all\",\n \"sort\": \"none\"\n }\n },\n \"targets\": [\n {\n \"expr\": \"sum by (parent,prpc) (sum_over_time(arms_app_requests_count{service=\\\"$service\\\",rpc=\\\"$rpc\\\",prpc!=\\\"\\\",prpc!=\\\"nil\\\",parent!=\\\"\\\",parent!=\\\"nil\\\",host=~\\\"$host\\\",rpc!=\\\"__all__\\\",endpoint!=\\\"__all__\\\",destId!=\\\"__all__\\\"}[1m]))\",\n \"legend\": \"{{parent}}:{{prpc}}\",\n \"refId\": \"C\"\n }\n ],\n \"type\": \"timeseries\",\n \"version\": \"3.0.0\"\n },\n {\n \"custom\": {\n \"drawStyle\": \"lines\",\n \"fillOpacity\": 0.3,\n \"gradientMode\": \"opacity\",\n \"lineInterpolation\": \"linear\",\n \"lineWidth\": 2,\n \"stack\": \"off\",\n \"version\": \"3.0.0\"\n },\n \"datasourceCate\": \"prometheus\",\n \"datasourceValue\": \"${datasource}\",\n \"id\": \"853de6b3-5655-4011-bb2d-144b42f0ddc9\",\n \"layout\": {\n \"h\": 9,\n \"i\": \"853de6b3-5655-4011-bb2d-144b42f0ddc9\",\n \"isResizable\": true,\n \"w\": 24,\n \"x\": 0,\n \"y\": 48\n },\n \"links\": [],\n \"maxPerRow\": 4,\n \"name\": \"错误数/每分钟\",\n \"options\": {\n \"legend\": {\n \"displayMode\": \"hidden\"\n },\n \"thresholds\": {\n \"steps\": [\n {\n \"color\": \"#634CD9\",\n \"type\": \"base\",\n \"value\": null\n }\n ]\n },\n \"tooltip\": {\n \"mode\": \"all\",\n \"sort\": \"none\"\n }\n },\n \"targets\": [\n {\n \"expr\": \"sum by (parent,prpc) (sum_over_time(arms_app_requests_error_count{service=\\\"$service\\\",rpc=\\\"$rpc\\\",prpc!=\\\"\\\",prpc!=\\\"nil\\\",parent!=\\\"\\\",parent!=\\\"nil\\\",host=~\\\"$host\\\",rpc!=\\\"__all__\\\",endpoint!=\\\"__all__\\\",destId!=\\\"__all__\\\"}[1m]))\",\n \"legend\": \"{{parent}}:{{prpc}}\",\n \"refId\": \"C\"\n }\n ],\n \"type\": \"timeseries\",\n \"version\": \"3.0.0\"\n },\n {\n \"custom\": {\n \"drawStyle\": \"lines\",\n \"fillOpacity\": 0.3,\n \"gradientMode\": \"opacity\",\n \"lineInterpolation\": \"linear\",\n \"lineWidth\": 2,\n \"stack\": \"off\",\n \"version\": \"3.0.0\"\n },\n \"datasourceCate\": \"prometheus\",\n \"datasourceValue\": \"${datasource}\",\n \"id\": \"5c5c26c1-d291-477f-bc9e-8d12eefc9536\",\n \"layout\": {\n \"h\": 8,\n \"i\": \"5c5c26c1-d291-477f-bc9e-8d12eefc9536\",\n \"isResizable\": true,\n \"w\": 24,\n \"x\": 0,\n \"y\": 57\n },\n \"links\": [],\n \"maxPerRow\": 4,\n \"name\": \"耗时/每分钟\",\n \"options\": {\n \"legend\": {\n \"displayMode\": \"hidden\"\n },\n \"thresholds\": {\n \"steps\": [\n {\n \"color\": \"#634CD9\",\n \"type\": \"base\",\n \"value\": null\n }\n ]\n },\n \"tooltip\": {\n \"mode\": \"all\",\n \"sort\": \"none\"\n }\n },\n \"targets\": [\n {\n \"expr\": \"sum by (parent,prpc) (sum_over_time(arms_app_requests_seconds{service=\\\"$service\\\",rpc=\\\"$rpc\\\",prpc!=\\\"\\\",prpc!=\\\"nil\\\",parent!=\\\"\\\",parent!=\\\"nil\\\",host=~\\\"$host\\\",rpc!=\\\"__all__\\\",endpoint!=\\\"__all__\\\",destId!=\\\"__all__\\\"}[1m]))/sum by (parent,prpc) (sum_over_time(arms_app_requests_count{service=\\\"$service\\\",rpc=\\\"$rpc\\\",prpc!=\\\"\\\",prpc!=\\\"nil\\\",parent!=\\\"\\\",parent!=\\\"nil\\\",host=~\\\"$host\\\",rpc!=\\\"__all__\\\",endpoint!=\\\"__all__\\\",destId!=\\\"__all__\\\"}[1m]))\",\n \"legend\": \"{{parent}}=\\u003e{{prpc}}\",\n \"refId\": \"B\"\n }\n ],\n \"type\": \"timeseries\",\n \"version\": \"3.0.0\"\n },\n {\n \"collapsed\": true,\n \"id\": \"077fbbac-ab18-4cd6-9898-6730733ae356\",\n \"layout\": {\n \"h\": 1,\n \"i\": \"077fbbac-ab18-4cd6-9898-6730733ae356\",\n \"isResizable\": false,\n \"w\": 24,\n \"x\": 0,\n \"y\": 65\n },\n \"name\": \"链路下游\",\n \"panels\": [],\n \"type\": \"row\",\n \"version\": \"3.0.0\"\n },\n {\n \"custom\": {\n \"aggrDimension\": [\n \"uniq\"\n ],\n \"calc\": \"lastNotNull\",\n \"colorMode\": \"value\",\n \"displayMode\": \"labelValuesToRows\",\n \"showHeader\": true,\n \"sortOrder\": \"ascend\"\n },\n \"datasourceCate\": \"prometheus\",\n \"datasourceValue\": \"${datasource}\",\n \"description\": \"展示选定时段内部署在机器N(默认为All,表示所有机器)上的接口R所调用的下游服务的相关指标\",\n \"id\": \"ab72abb7-a807-4560-891c-449a223ac89d\",\n \"layout\": {\n \"h\": 9,\n \"i\": \"ab72abb7-a807-4560-891c-449a223ac89d\",\n \"isResizable\": true,\n \"w\": 24,\n \"x\": 0,\n \"y\": 66\n },\n \"links\": [],\n \"maxPerRow\": 4,\n \"name\": \"链路下游\",\n \"options\": {\n \"standardOptions\": {}\n },\n \"overrides\": [\n {}\n ],\n \"targets\": [\n {\n \"expr\": \"label_join(sum by (service,rpc) (sum_over_time(arms_app_requests_count{prpc=\\\"$rpc\\\",parent=\\\"$service\\\",rpc!=\\\"__all\\\",endpoint!=\\\"__all__\\\",destId!=\\\"__all__\\\"}[$__range])),\\\"uniq\\\",\\\"-\\\",\\\"service\\\",\\\"rpc\\\")\",\n \"legend\": \"\",\n \"refId\": \"A\"\n },\n {\n \"expr\": \"sum by (uniq) (label_join(sum_over_time(arms_app_requests_seconds{parent=\\\"$service\\\",prpc=\\\"$rpc\\\",rpc!=\\\"__all\\\",endpoint!=\\\"__all__\\\",destId!=\\\"__all__\\\"}[$__range]),\\\"uniq\\\",\\\"-\\\",\\\"service\\\",\\\"rpc\\\"))/sum by (uniq) (label_join(sum_over_time(arms_app_requests_count{parent=\\\"$service\\\",prpc=\\\"$rpc\\\",rpc!=\\\"__all\\\",endpoint!=\\\"__all__\\\",destId!=\\\"__all__\\\"}[$__range]),\\\"uniq\\\",\\\"-\\\",\\\"service\\\",\\\"rpc\\\"))\",\n \"legend\": \"耗时\",\n \"refId\": \"B\"\n },\n {\n \"expr\": \"sum by (uniq) (label_join(sum_over_time(arms_app_requests_error_count{parent=\\\"$service\\\",prpc=\\\"$rpc\\\",rpc!=\\\"__all\\\",endpoint!=\\\"__all__\\\",destId!=\\\"__all__\\\"}[$__range]),\\\"uniq\\\",\\\"-\\\",\\\"service\\\",\\\"rpc\\\"))\",\n \"legend\": \"错误数\",\n \"refId\": \"C\"\n }\n ],\n \"transformations\": [\n {\n \"id\": \"organize\",\n \"options\": {}\n }\n ],\n \"type\": \"table\",\n \"version\": \"3.0.0\"\n },\n {\n \"custom\": {\n \"drawStyle\": \"lines\",\n \"fillOpacity\": 0.3,\n \"gradientMode\": \"opacity\",\n \"lineInterpolation\": \"linear\",\n \"lineWidth\": 2,\n \"stack\": \"off\",\n \"version\": \"3.0.0\"\n },\n \"datasourceCate\": \"prometheus\",\n \"datasourceValue\": \"${datasource}\",\n \"id\": \"edcbe109-e76f-4730-b3d3-64a649f93c3f\",\n \"layout\": {\n \"h\": 9,\n \"i\": \"edcbe109-e76f-4730-b3d3-64a649f93c3f\",\n \"isResizable\": true,\n \"w\": 24,\n \"x\": 0,\n \"y\": 75\n },\n \"links\": [],\n \"maxPerRow\": 4,\n \"name\": \"请求数/每分钟\",\n \"options\": {\n \"legend\": {\n \"displayMode\": \"hidden\"\n },\n \"thresholds\": {\n \"steps\": [\n {\n \"color\": \"#634CD9\",\n \"type\": \"base\",\n \"value\": null\n }\n ]\n },\n \"tooltip\": {\n \"mode\": \"all\",\n \"sort\": \"none\"\n }\n },\n \"targets\": [\n {\n \"expr\": \"sum by (service,rpc) (sum_over_time(arms_app_requests_count{prpc=\\\"$rpc\\\",parent=\\\"$service\\\",rpc!=\\\"__all\\\",endpoint!=\\\"__all__\\\",destId!=\\\"__all__\\\"}[1m]))\",\n \"legend\": \"{{service}}:{{rpc}}\",\n \"refId\": \"A\"\n }\n ],\n \"type\": \"timeseries\",\n \"version\": \"3.0.0\"\n },\n {\n \"custom\": {\n \"drawStyle\": \"lines\",\n \"fillOpacity\": 0.3,\n \"gradientMode\": \"opacity\",\n \"lineInterpolation\": \"linear\",\n \"lineWidth\": 2,\n \"stack\": \"off\",\n \"version\": \"3.0.0\"\n },\n \"datasourceCate\": \"prometheus\",\n \"datasourceValue\": \"${datasource}\",\n \"id\": \"9091d039-6524-4c81-9573-17152a2f7970\",\n \"layout\": {\n \"h\": 9,\n \"i\": \"9091d039-6524-4c81-9573-17152a2f7970\",\n \"isResizable\": true,\n \"w\": 24,\n \"x\": 0,\n \"y\": 84\n },\n \"links\": [],\n \"maxPerRow\": 4,\n \"name\": \"耗时/每分钟\",\n \"options\": {\n \"legend\": {\n \"displayMode\": \"hidden\"\n },\n \"thresholds\": {\n \"steps\": [\n {\n \"color\": \"#634CD9\",\n \"type\": \"base\",\n \"value\": null\n }\n ]\n },\n \"tooltip\": {\n \"mode\": \"all\",\n \"sort\": \"none\"\n }\n },\n \"targets\": [\n {\n \"expr\": \"sum by (service,rpc) (sum_over_time(arms_app_requests_seconds{parent=\\\"$service\\\",prpc=\\\"$rpc\\\",rpc!=\\\"__all\\\",endpoint!=\\\"__all__\\\",destId!=\\\"__all__\\\"}[1m]))/sum by (service,rpc) (sum_over_time(arms_app_requests_count{parent=\\\"$service\\\",prpc=\\\"$rpc\\\",rpc!=\\\"__all\\\",endpoint!=\\\"__all__\\\",destId!=\\\"__all__\\\"}[1m]))\",\n \"legend\": \"{{service}}:{{rpc}}\",\n \"refId\": \"B\"\n }\n ],\n \"type\": \"timeseries\",\n \"version\": \"3.0.0\"\n },\n {\n \"custom\": {\n \"drawStyle\": \"lines\",\n \"fillOpacity\": 0.3,\n \"gradientMode\": \"opacity\",\n \"lineInterpolation\": \"linear\",\n \"lineWidth\": 2,\n \"stack\": \"off\",\n \"version\": \"3.0.0\"\n },\n \"datasourceCate\": \"prometheus\",\n \"datasourceValue\": \"${datasource}\",\n \"id\": \"e1681553-ba5c-431f-9a46-0ef56a2d62b8\",\n \"layout\": {\n \"h\": 9,\n \"i\": \"e1681553-ba5c-431f-9a46-0ef56a2d62b8\",\n \"isResizable\": true,\n \"w\": 24,\n \"x\": 0,\n \"y\": 93\n },\n \"links\": [],\n \"maxPerRow\": 4,\n \"name\": \"错误数/每分钟\",\n \"options\": {\n \"legend\": {\n \"displayMode\": \"hidden\"\n },\n \"thresholds\": {\n \"steps\": [\n {\n \"color\": \"#634CD9\",\n \"type\": \"base\",\n \"value\": null\n }\n ]\n },\n \"tooltip\": {\n \"mode\": \"all\",\n \"sort\": \"none\"\n }\n },\n \"targets\": [\n {\n \"expr\": \"sum by (service,rpc) (sum_over_time(arms_app_requests_error_count{parent=\\\"$service\\\",prpc=\\\"$rpc\\\",rpc!=\\\"__all\\\",endpoint!=\\\"__all__\\\",destId!=\\\"__all__\\\"}[1m]))\",\n \"legend\": \"{{service}}:{{rpc}}\",\n \"refId\": \"C\"\n }\n ],\n \"type\": \"timeseries\",\n \"version\": \"3.0.0\"\n }\n ],\n \"var\": [\n {\n \"definition\": \"prometheus\",\n \"name\": \"datasource\",\n \"type\": \"datasource\"\n },\n {\n \"allOption\": false,\n \"datasource\": {\n \"cate\": \"prometheus\",\n \"value\": \"${datasource}\"\n },\n \"definition\": \"label_values(arms_system_cpu_idle,service)\",\n \"multi\": false,\n \"name\": \"service\",\n \"reg\": \"\",\n \"type\": \"query\"\n },\n {\n \"allOption\": false,\n \"datasource\": {\n \"cate\": \"prometheus\",\n \"value\": \"${datasource}\"\n },\n \"definition\": \"label_values(arms_app_requests_count{service=\\\"$service\\\",callType=~\\\"^dsf$|^http$|^dubbo$|^mq$|^user_method$|^producer$|^thrift$|^hsf$|^server$|^grpc$\\\",rpc!=\\\"__all__\\\"},rpc)\",\n \"multi\": false,\n \"name\": \"rpc\",\n \"reg\": \"\",\n \"type\": \"query\"\n },\n {\n \"allOption\": true,\n \"allValue\": \".*\",\n \"datasource\": {\n \"cate\": \"prometheus\",\n \"value\": \"${datasource}\"\n },\n \"definition\": \"label_values(arms_system_cpu_idle{service=\\\"$service\\\"},host)\",\n \"multi\": false,\n \"name\": \"host\",\n \"reg\": \"\",\n \"type\": \"query\"\n }\n ],\n \"version\": \"3.0.0\"\n },\n \"public\": 0,\n \"public_cate\": 0,\n \"bgids\": null,\n \"built_in\": 0,\n \"hide\": 0,\n \"uuid\": 1717556327083057000\n}"
},
{
"path": "integrations/AliYun/dashboards/arms-application.json",
"content": "{\n \"id\": 0,\n \"group_id\": 0,\n \"name\": \"ARMS-Application\",\n \"ident\": \"\",\n \"tags\": \"JVM ARMS\",\n \"create_at\": 0,\n \"create_by\": \"\",\n \"update_at\": 0,\n \"update_by\": \"\",\n \"configs\": {\n \"links\": [],\n \"panels\": [\n {\n \"collapsed\": true,\n \"id\": \"faaf0534-b773-4f49-85bf-fc9ea18b6323\",\n \"layout\": {\n \"h\": 1,\n \"i\": \"faaf0534-b773-4f49-85bf-fc9ea18b6323\",\n \"isResizable\": false,\n \"w\": 24,\n \"x\": 0,\n \"y\": 0\n },\n \"name\": \"总计\",\n \"panels\": [],\n \"type\": \"row\",\n \"version\": \"3.0.0\"\n },\n {\n \"custom\": {\n \"calc\": \"lastNotNull\",\n \"colorMode\": \"value\",\n \"textMode\": \"value\",\n \"version\": \"3.0.0\"\n },\n \"datasourceCate\": \"prometheus\",\n \"datasourceValue\": \"${datasource}\",\n \"description\": \"取最后一个非0点的实例数\",\n \"id\": \"6dd1e508-b12a-4180-a9e0-616b4cbcaaf8\",\n \"layout\": {\n \"h\": 4,\n \"i\": \"6dd1e508-b12a-4180-a9e0-616b4cbcaaf8\",\n \"isResizable\": true,\n \"w\": 3,\n \"x\": 0,\n \"y\": 1\n },\n \"links\": [],\n \"maxPerRow\": 4,\n \"name\": \"实例数(实时)\",\n \"options\": {\n \"legend\": {\n \"displayMode\": \"list\"\n },\n \"standardOptions\": {\n \"util\": \"none\"\n },\n \"thresholds\": {\n \"mode\": \"absolute\",\n \"steps\": [\n {\n \"color\": \"#73BF69\",\n \"type\": \"base\",\n \"value\": null\n },\n {\n \"color\": \"#F2495C\",\n \"value\": 80\n }\n ],\n \"style\": \"line\"\n },\n \"tooltip\": {\n \"mode\": \"multi\"\n },\n \"valueMappings\": [\n {\n \"options\": {\n \"match\": \"null\",\n \"result\": {\n \"text\": \"N/A\"\n }\n },\n \"type\": \"special\"\n }\n ]\n },\n \"targets\": [\n {\n \"expr\": \"count(count by (host) (arms_system_cpu_idle{service=\\\"$service\\\"}))\",\n \"legend\": \"\",\n \"refId\": \"A\"\n }\n ],\n \"type\": \"stat\",\n \"version\": \"3.0.0\"\n },\n {\n \"custom\": {\n \"calc\": \"lastNotNull\",\n \"colorMode\": \"value\",\n \"textMode\": \"value\",\n \"version\": \"3.0.0\"\n },\n \"datasourceCate\": \"prometheus\",\n \"datasourceValue\": \"${datasource}\",\n \"id\": \"497d0189-6877-4d07-89a7-36b529d16750\",\n \"layout\": {\n \"h\": 4,\n \"i\": \"497d0189-6877-4d07-89a7-36b529d16750\",\n \"isResizable\": true,\n \"w\": 3,\n \"x\": 3,\n \"y\": 1\n },\n \"links\": [],\n \"maxPerRow\": 4,\n \"name\": \"累计请求量(选定时段)\",\n \"options\": {\n \"legend\": {\n \"displayMode\": \"list\"\n },\n \"standardOptions\": {\n \"util\": \"none\"\n },\n \"thresholds\": {\n \"mode\": \"absolute\",\n \"steps\": [\n {\n \"color\": \"#73BF69\",\n \"type\": \"base\",\n \"value\": null\n },\n {\n \"color\": \"#F2495C\",\n \"value\": 80\n }\n ],\n \"style\": \"line\"\n },\n \"tooltip\": {\n \"mode\": \"multi\"\n },\n \"valueMappings\": [\n {\n \"options\": {\n \"match\": \"null\",\n \"result\": {\n \"text\": \"N/A\"\n }\n },\n \"type\": \"special\"\n }\n ]\n },\n \"targets\": [\n {\n \"expr\": \"sum(sum_over_time(arms_app_requests_count{service=\\\"$service\\\",host=~\\\"$host\\\",callType=~\\\"^dsf$|^http$|^dubbo$|^mq$|^user_method$|^producer$|^thrift$|^hsf$|^server$|^grpc$\\\",rpc=\\\"__all__\\\",prpc=\\\"__all__\\\",ppid=\\\"__all__\\\",endpoint=\\\"__all__\\\",destId=\\\"__all__\\\"}[$__range]))\",\n \"legend\": \"当前\",\n \"refId\": \"A\"\n }\n ],\n \"type\": \"stat\",\n \"version\": \"3.0.0\"\n },\n {\n \"custom\": {\n \"calc\": \"lastNotNull\",\n \"colorMode\": \"value\",\n \"textMode\": \"value\",\n \"version\": \"3.0.0\"\n },\n \"datasourceCate\": \"prometheus\",\n \"datasourceValue\": \"${datasource}\",\n \"description\": \"选定时段的总耗时/选定时段的总请求数\",\n \"id\": \"69247449-841c-4e5e-a7d0-4e68c7bee923\",\n \"layout\": {\n \"h\": 4,\n \"i\": \"69247449-841c-4e5e-a7d0-4e68c7bee923\",\n \"isResizable\": true,\n \"w\": 4,\n \"x\": 6,\n \"y\": 1\n },\n \"links\": [],\n \"maxPerRow\": 4,\n \"name\": \"平均耗时(选定时段)\",\n \"options\": {\n \"legend\": {\n \"displayMode\": \"list\"\n },\n \"standardOptions\": {\n \"util\": \"seconds\"\n },\n \"thresholds\": {\n \"mode\": \"absolute\",\n \"steps\": [\n {\n \"color\": \"#73BF69\",\n \"type\": \"base\",\n \"value\": null\n },\n {\n \"color\": \"#F2495C\",\n \"value\": 80\n }\n ],\n \"style\": \"line\"\n },\n \"tooltip\": {\n \"mode\": \"multi\"\n },\n \"valueMappings\": [\n {\n \"options\": {\n \"match\": \"null\",\n \"result\": {\n \"text\": \"N/A\"\n }\n },\n \"type\": \"special\"\n }\n ]\n },\n \"targets\": [\n {\n \"expr\": \"sum(sum_over_time(arms_app_requests_seconds{service=\\\"$service\\\",callType=~\\\"^dsf$|^http$|^dubbo$|^mq$|^user_method$|^producer$|^thrift$|^hsf$|^server$|^grpc$\\\",rpc=\\\"__all__\\\",prpc=\\\"__all__\\\",ppid=\\\"__all__\\\",endpoint=\\\"__all__\\\",destId=\\\"__all__\\\"}[$__range]))/sum(sum_over_time(arms_app_requests_count{service=\\\"$service\\\",callType=~\\\"^dsf$|^http$|^dubbo$|^mq$|^user_method$|^producer$|^thrift$|^hsf$|^server$|^grpc$\\\",rpc=\\\"__all__\\\",prpc=\\\"__all__\\\",ppid=\\\"__all__\\\",endpoint=\\\"__all__\\\",destId=\\\"__all__\\\"}[$__range]))\",\n \"legend\": \"当前\",\n \"refId\": \"A\"\n }\n ],\n \"type\": \"stat\",\n \"version\": \"3.0.0\"\n },\n {\n \"custom\": {\n \"calc\": \"lastNotNull\",\n \"colorMode\": \"value\",\n \"textMode\": \"value\",\n \"version\": \"3.0.0\"\n },\n \"datasourceCate\": \"prometheus\",\n \"datasourceValue\": \"${datasource}\",\n \"id\": \"ae5f63cc-f736-4e3e-8483-2aa49eaddd65\",\n \"layout\": {\n \"h\": 4,\n \"i\": \"ae5f63cc-f736-4e3e-8483-2aa49eaddd65\",\n \"isResizable\": true,\n \"w\": 3,\n \"x\": 10,\n \"y\": 1\n },\n \"links\": [],\n \"maxPerRow\": 4,\n \"name\": \"累计错误数(选定时段)\",\n \"options\": {\n \"legend\": {\n \"displayMode\": \"list\"\n },\n \"standardOptions\": {\n \"util\": \"none\"\n },\n \"thresholds\": {\n \"mode\": \"absolute\",\n \"steps\": [\n {\n \"color\": \"#73BF69\",\n \"type\": \"base\",\n \"value\": null\n },\n {\n \"color\": \"#F2495C\",\n \"value\": 80\n }\n ],\n \"style\": \"line\"\n },\n \"tooltip\": {\n \"mode\": \"multi\"\n },\n \"valueMappings\": [\n {\n \"options\": {\n \"match\": \"null\",\n \"result\": {\n \"text\": \"N/A\"\n }\n },\n \"type\": \"special\"\n }\n ]\n },\n \"targets\": [\n {\n \"expr\": \"sum(sum_over_time(arms_app_requests_error_count{service=\\\"$service\\\",host=~\\\"$host\\\",callType=~\\\"^dsf$|^http$|^dubbo$|^mq$|^user_method$|^producer$|^thrift$|^hsf$|^server$|^grpc$\\\",rpc=\\\"__all__\\\",prpc=\\\"__all__\\\",ppid=\\\"__all__\\\",endpoint=\\\"__all__\\\",destId=\\\"__all__\\\"}[$__range]))\",\n \"legend\": \"当前\",\n \"refId\": \"A\"\n }\n ],\n \"type\": \"stat\",\n \"version\": \"3.0.0\"\n },\n {\n \"custom\": {\n \"calc\": \"lastNotNull\",\n \"colorMode\": \"value\",\n \"textMode\": \"value\",\n \"version\": \"3.0.0\"\n },\n \"datasourceCate\": \"prometheus\",\n \"datasourceValue\": \"${datasource}\",\n \"id\": \"6fc2cab9-69f5-43ab-a988-bd559ce91d79\",\n \"layout\": {\n \"h\": 4,\n \"i\": \"6fc2cab9-69f5-43ab-a988-bd559ce91d79\",\n \"isResizable\": true,\n \"w\": 3,\n \"x\": 13,\n \"y\": 1\n },\n \"links\": [],\n \"maxPerRow\": 4,\n \"name\": \"累计异常数(选定时段)\",\n \"options\": {\n \"legend\": {\n \"displayMode\": \"list\"\n },\n \"standardOptions\": {\n \"util\": \"none\"\n },\n \"thresholds\": {\n \"mode\": \"absolute\",\n \"steps\": [\n {\n \"color\": \"#73BF69\",\n \"type\": \"base\",\n \"value\": null\n },\n {\n \"color\": \"#F2495C\",\n \"value\": 80\n }\n ],\n \"style\": \"line\"\n },\n \"tooltip\": {\n \"mode\": \"multi\"\n },\n \"valueMappings\": [\n {\n \"options\": {\n \"match\": \"null\",\n \"result\": {\n \"text\": \"N/A\"\n }\n },\n \"type\": \"special\"\n }\n ]\n },\n \"targets\": [\n {\n \"expr\": \"sum(sum_over_time(arms_exception_requests_count{service=\\\"$service\\\",rpc=\\\"__all__\\\",exceptionId!=\\\"\\\",exceptionId!=\\\"nil\\\"}[$__range]))\",\n \"legend\": \"当前\",\n \"refId\": \"A\"\n }\n ],\n \"type\": \"stat\",\n \"version\": \"3.0.0\"\n },\n {\n \"custom\": {\n \"calc\": \"avg\",\n \"colorMode\": \"value\",\n \"textMode\": \"value\",\n \"version\": \"3.0.0\"\n },\n \"datasourceCate\": \"prometheus\",\n \"datasourceValue\": \"${datasource}\",\n \"description\": \"选定时间端内FullGC的次数\",\n \"id\": \"c76990b4-0756-44ed-808a-62d1bf0e0b44\",\n \"layout\": {\n \"h\": 4,\n \"i\": \"c76990b4-0756-44ed-808a-62d1bf0e0b44\",\n \"isResizable\": true,\n \"w\": 4,\n \"x\": 16,\n \"y\": 1\n },\n \"links\": [],\n \"maxPerRow\": 4,\n \"name\": \"累计Full GC次数(选定时段)\",\n \"options\": {\n \"legend\": {\n \"displayMode\": \"list\"\n },\n \"standardOptions\": {\n \"util\": \"none\"\n },\n \"thresholds\": {\n \"mode\": \"absolute\",\n \"steps\": [\n {\n \"color\": \"#73BF69\",\n \"type\": \"base\",\n \"value\": null\n },\n {\n \"color\": \"#F2495C\",\n \"value\": 80\n }\n ],\n \"style\": \"line\"\n },\n \"tooltip\": {\n \"mode\": \"multi\"\n },\n \"valueMappings\": [\n {\n \"options\": {\n \"match\": \"null\",\n \"result\": {\n \"text\": \"N/A\"\n }\n },\n \"type\": \"special\"\n }\n ]\n },\n \"targets\": [\n {\n \"expr\": \"sum(sum_over_time(arms_jvm_gc_delta{service=\\\"$service\\\",host=~\\\"$host\\\",gen=\\\"old\\\"}[$__range]))\",\n \"legend\": \"当前\",\n \"refId\": \"A\"\n }\n ],\n \"type\": \"stat\",\n \"version\": \"3.0.0\"\n },\n {\n \"custom\": {\n \"calc\": \"avg\",\n \"colorMode\": \"value\",\n \"textMode\": \"value\",\n \"version\": \"3.0.0\"\n },\n \"datasourceCate\": \"prometheus\",\n \"datasourceValue\": \"${datasource}\",\n \"description\": \"耗时大于5ms\",\n \"id\": \"3f913af5-09ff-41f5-a9b6-3628dc28e951\",\n \"layout\": {\n \"h\": 4,\n \"i\": \"3f913af5-09ff-41f5-a9b6-3628dc28e951\",\n \"isResizable\": true,\n \"w\": 4,\n \"x\": 20,\n \"y\": 1\n },\n \"links\": [],\n \"maxPerRow\": 4,\n \"name\": \"累计慢SQL(选定时段)\",\n \"options\": {\n \"legend\": {\n \"displayMode\": \"list\"\n },\n \"standardOptions\": {\n \"util\": \"none\"\n },\n \"thresholds\": {\n \"mode\": \"absolute\",\n \"steps\": [\n {\n \"color\": \"#73BF69\",\n \"type\": \"base\",\n \"value\": null\n },\n {\n \"color\": \"#F2495C\",\n \"value\": 80\n }\n ],\n \"style\": \"line\"\n },\n \"tooltip\": {\n \"mode\": \"multi\"\n },\n \"valueMappings\": [\n {\n \"options\": {\n \"match\": \"null\",\n \"result\": {\n \"text\": \"N/A\"\n }\n },\n \"type\": \"special\"\n }\n ]\n },\n \"targets\": [\n {\n \"expr\": \"sum(sum_over_time(arms_db_requests_slow_count{service=\\\"$service\\\",host=~\\\"$host\\\",rpc=\\\"__all__\\\"}[$__range]))\",\n \"legend\": \"当前\",\n \"refId\": \"A\"\n }\n ],\n \"type\": \"stat\",\n \"version\": \"3.0.0\"\n },\n {\n \"collapsed\": true,\n \"id\": \"4b534f0c-da5f-4e33-add7-7fe9af733656\",\n \"layout\": {\n \"h\": 1,\n \"i\": \"4b534f0c-da5f-4e33-add7-7fe9af733656\",\n \"isResizable\": false,\n \"w\": 24,\n \"x\": 0,\n \"y\": 5\n },\n \"name\": \"概览\",\n \"panels\": [],\n \"type\": \"row\",\n \"version\": \"3.0.0\"\n },\n {\n \"custom\": {\n \"aggrDimension\": [\n \"rpc\"\n ],\n \"calc\": \"lastNotNull\",\n \"colorMode\": \"value\",\n \"displayMode\": \"labelValuesToRows\",\n \"showHeader\": true\n },\n \"datasourceCate\": \"prometheus\",\n \"datasourceValue\": \"${datasource}\",\n \"description\": \"展示选定时段内服务S的接口指标\",\n \"id\": \"834ea39f-f630-45d9-a4a0-0e506baee4f2\",\n \"layout\": {\n \"h\": 8,\n \"i\": \"834ea39f-f630-45d9-a4a0-0e506baee4f2\",\n \"isResizable\": true,\n \"w\": 24,\n \"x\": 0,\n \"y\": 6\n },\n \"links\": [],\n \"maxPerRow\": 4,\n \"name\": \"接口指标汇总(选定时段)\",\n \"options\": {\n \"standardOptions\": {}\n },\n \"overrides\": [\n {}\n ],\n \"targets\": [\n {\n \"expr\": \"sum by (rpc) (sum_over_time(arms_app_requests_count{service=\\\"$service\\\",callType=~\\\"^dsf$|^http$|^dubbo$|^mq$|^user_method$|^producer$|^thrift$|^hsf$|^server$|^grpc$\\\",prpc=\\\"__all__\\\",ppid=\\\"__all__\\\",endpoint=\\\"__all__\\\",destId=\\\"__all__\\\",rpc!=\\\"__all__\\\"}[$__range]))\",\n \"legend\": \"请求总量\",\n \"refId\": \"A\"\n },\n {\n \"expr\": \"sum by (rpc) (sum_over_time(arms_app_requests_error_count{service=\\\"$service\\\",callType=~\\\"^dsf$|^http$|^dubbo$|^mq$|^user_method$|^producer$|^thrift$|^hsf$|^server$|^grpc$\\\",prpc=\\\"__all__\\\",ppid=\\\"__all__\\\",endpoint=\\\"__all__\\\",destId=\\\"__all__\\\",rpc!=\\\"__all__\\\"}[$__range]))\",\n \"legend\": \"错误数\",\n \"refId\": \"B\"\n },\n {\n \"expr\": \"sum by (rpc) (sum_over_time(arms_app_requests_seconds{service=\\\"$service\\\",callType=~\\\"^dsf$|^http$|^dubbo$|^mq$|^user_method$|^producer$|^thrift$|^hsf$|^server$|^grpc$\\\",prpc=\\\"__all__\\\",ppid=\\\"__all__\\\",endpoint=\\\"__all__\\\",destId=\\\"__all__\\\",rpc!=\\\"__all__\\\"}[$__range]))/sum by (rpc) (sum_over_time(arms_app_requests_count{service=\\\"$service\\\",callType=~\\\"^dsf$|^http$|^dubbo$|^mq$|^user_method$|^producer$|^thrift$|^hsf$|^server$|^grpc$\\\",prpc=\\\"__all__\\\",ppid=\\\"__all__\\\",endpoint=\\\"__all__\\\",destId=\\\"__all__\\\",rpc!=\\\"__all__\\\"}[$__range]))\",\n \"legend\": \"平均请求耗时\",\n \"refId\": \"C\"\n },\n {\n \"expr\": \"sum by (rpc) (sum_over_time(arms_exception_requests_count{service=\\\"$service\\\",exceptionId!=\\\"\\\",rpc!=\\\"__all__\\\"}[$__range])) or on (rpc) group by (rpc) (max_over_time(arms_app_requests_count{service=\\\"$service\\\",callType=~\\\"^dsf$|^http$|^dubbo$|^mq$|^user_method$|^producer$|^thrift$|^hsf$|^server$|^grpc$\\\",prpc=\\\"__all__\\\",ppid=\\\"__all__\\\",endpoint=\\\"__all__\\\",destId=\\\"__all__\\\",rpc!=\\\"__all__\\\"}[$__range]))-1\",\n \"legend\": \"异常数量\",\n \"refId\": \"G\"\n },\n {\n \"expr\": \"max by (rpc) (max_over_time(arms_http_requests_latency_seconds{service=\\\"$service\\\",quantile=\\\"0.75\\\"}[$__range])) or on (rpc) group by (rpc) (max_over_time(arms_app_requests_count{service=\\\"$service\\\",callType=~\\\"^dsf$|^http$|^dubbo$|^mq$|^user_method$|^producer$|^thrift$|^hsf$|^server$|^grpc$\\\",prpc=\\\"__all__\\\",ppid=\\\"__all__\\\",endpoint=\\\"__all__\\\",destId=\\\"__all__\\\",rpc!=\\\"__all__\\\"}[$__range]))-1\",\n \"legend\": \"75分位延时\",\n \"refId\": \"D\"\n },\n {\n \"expr\": \"max by (rpc) (max_over_time(arms_http_requests_latency_seconds{service=\\\"$service\\\",quantile=\\\"0.9\\\"}[$__range])) or on (rpc) group by (rpc) (max_over_time(arms_app_requests_count{service=\\\"$service\\\",callType=~\\\"^dsf$|^http$|^dubbo$|^mq$|^user_method$|^producer$|^thrift$|^hsf$|^server$|^grpc$\\\",prpc=\\\"__all__\\\",ppid=\\\"__all__\\\",endpoint=\\\"__all__\\\",destId=\\\"__all__\\\",rpc!=\\\"__all__\\\"}[$__range]))-1\",\n \"legend\": \"90分位延迟\",\n \"refId\": \"E\"\n },\n {\n \"expr\": \"max by (rpc) (max_over_time(arms_http_requests_latency_seconds{service=\\\"$service\\\",quantile=\\\"0.99\\\"}[$__range])) or on (rpc) group by (rpc) (max_over_time(arms_app_requests_count{service=\\\"$service\\\",callType=~\\\"^dsf$|^http$|^dubbo$|^mq$|^user_method$|^producer$|^thrift$|^hsf$|^server$|^grpc$\\\",prpc=\\\"__all__\\\",ppid=\\\"__all__\\\",endpoint=\\\"__all__\\\",destId=\\\"__all__\\\",rpc!=\\\"__all__\\\"}[$__range]))-1\",\n \"legend\": \"99分位延迟\",\n \"refId\": \"F\"\n }\n ],\n \"transformations\": [\n {\n \"id\": \"organize\",\n \"options\": {}\n }\n ],\n \"type\": \"table\",\n \"version\": \"3.0.0\"\n },\n {\n \"custom\": {\n \"drawStyle\": \"lines\",\n \"fillOpacity\": 0.3,\n \"gradientMode\": \"opacity\",\n \"lineInterpolation\": \"linear\",\n \"lineWidth\": 2,\n \"stack\": \"off\",\n \"version\": \"3.0.0\"\n },\n \"datasourceCate\": \"prometheus\",\n \"datasourceValue\": \"${datasource}\",\n \"id\": \"aa244cb8-b9a7-4f90-b383-403a1fa750bb\",\n \"layout\": {\n \"h\": 8,\n \"i\": \"aa244cb8-b9a7-4f90-b383-403a1fa750bb\",\n \"isResizable\": true,\n \"w\": 12,\n \"x\": 0,\n \"y\": 14\n },\n \"links\": [],\n \"maxPerRow\": 4,\n \"name\": \"请求数/每分钟\",\n \"options\": {\n \"legend\": {\n \"displayMode\": \"hidden\"\n },\n \"thresholds\": {\n \"steps\": [\n {\n \"color\": \"#634CD9\",\n \"type\": \"base\",\n \"value\": null\n }\n ]\n },\n \"tooltip\": {\n \"mode\": \"all\",\n \"sort\": \"none\"\n }\n },\n \"targets\": [\n {\n \"expr\": \"sum by (callType) (sum_over_time(arms_app_requests_count{service=\\\"$service\\\",host=~\\\"$host\\\",callType=~\\\"^dsf$|^http$|^dubbo$|^mq$|^user_method$|^producer$|^thrift$|^hsf$|^server$|^grpc$\\\",rpc=\\\"__all__\\\",prpc=\\\"__all__\\\",ppid=\\\"__all__\\\",endpoint=\\\"__all__\\\",destId=\\\"__all__\\\"}[1m]))\",\n \"legend\": \"{{callType}}入口\",\n \"refId\": \"A\"\n }\n ],\n \"type\": \"timeseries\",\n \"version\": \"3.0.0\"\n },\n {\n \"custom\": {\n \"drawStyle\": \"lines\",\n \"fillOpacity\": 0.3,\n \"gradientMode\": \"opacity\",\n \"lineInterpolation\": \"linear\",\n \"lineWidth\": 2,\n \"stack\": \"off\",\n \"version\": \"3.0.0\"\n },\n \"datasourceCate\": \"prometheus\",\n \"datasourceValue\": \"${datasource}\",\n \"id\": \"a681c948-c021-4f3f-a7ca-96740dba068d\",\n \"layout\": {\n \"h\": 8,\n \"i\": \"a681c948-c021-4f3f-a7ca-96740dba068d\",\n \"isResizable\": true,\n \"w\": 12,\n \"x\": 12,\n \"y\": 14\n },\n \"links\": [],\n \"maxPerRow\": 4,\n \"name\": \"响应时间/每分钟\",\n \"options\": {\n \"legend\": {\n \"displayMode\": \"hidden\"\n },\n \"thresholds\": {\n \"steps\": [\n {\n \"color\": \"#634CD9\",\n \"type\": \"base\",\n \"value\": null\n }\n ]\n },\n \"tooltip\": {\n \"mode\": \"all\",\n \"sort\": \"none\"\n }\n },\n \"targets\": [\n {\n \"expr\": \"sum by (callType) (arms_app_requests_seconds{service=\\\"$service\\\",host=~\\\"$host\\\",callType=~\\\"^dsf$|^http$|^dubbo$|^mq$|^user_method$|^producer$|^thrift$|^hsf$|^server$|^grpc$\\\",rpc=\\\"__all__\\\",prpc=\\\"__all__\\\",ppid=\\\"__all__\\\",endpoint=\\\"__all__\\\",destId=\\\"__all__\\\"})/sum by (callType) (arms_app_requests_count{service=\\\"$service\\\",host=~\\\"$host\\\",callType=~\\\"^dsf$|^http$|^dubbo$|^mq$|^user_method$|^producer$|^thrift$|^hsf$|^server$|^grpc$\\\",rpc=\\\"__all__\\\",prpc=\\\"__all__\\\",ppid=\\\"__all__\\\",endpoint=\\\"__all__\\\",destId=\\\"__all__\\\"})\",\n \"legend\": \"{{callType}}入口\",\n \"refId\": \"A\"\n }\n ],\n \"type\": \"timeseries\",\n \"version\": \"3.0.0\"\n },\n {\n \"custom\": {\n \"drawStyle\": \"lines\",\n \"fillOpacity\": 0.3,\n \"gradientMode\": \"opacity\",\n \"lineInterpolation\": \"linear\",\n \"lineWidth\": 2,\n \"stack\": \"off\",\n \"version\": \"3.0.0\"\n },\n \"datasourceCate\": \"prometheus\",\n \"datasourceValue\": \"${datasource}\",\n \"id\": \"9e75c715-5012-4698-aeda-f16223fd1214\",\n \"layout\": {\n \"h\": 8,\n \"i\": \"9e75c715-5012-4698-aeda-f16223fd1214\",\n \"isResizable\": true,\n \"w\": 12,\n \"x\": 0,\n \"y\": 22\n },\n \"links\": [],\n \"maxPerRow\": 4,\n \"name\": \"错误数/每分钟\",\n \"options\": {\n \"legend\": {\n \"displayMode\": \"hidden\"\n },\n \"thresholds\": {\n \"steps\": [\n {\n \"color\": \"#634CD9\",\n \"type\": \"base\",\n \"value\": null\n }\n ]\n },\n \"tooltip\": {\n \"mode\": \"all\",\n \"sort\": \"none\"\n }\n },\n \"targets\": [\n {\n \"expr\": \"sum by (callType) (sum_over_time(arms_app_requests_error_count{service=\\\"$service\\\",host=~\\\"$host\\\",callType=~\\\"^dsf$|^http$|^dubbo$|^mq$|^user_method$|^producer$|^thrift$|^hsf$|^server$|^grpc$\\\",rpc=\\\"__all__\\\",prpc=\\\"__all__\\\",ppid=\\\"__all__\\\",endpoint=\\\"__all__\\\",destId=\\\"__all__\\\"}[1m]))\",\n \"legend\": \"{{callType}}入口\",\n \"refId\": \"A\"\n }\n ],\n \"type\": \"timeseries\",\n \"version\": \"3.0.0\"\n },\n {\n \"custom\": {\n \"drawStyle\": \"lines\",\n \"fillOpacity\": 0.3,\n \"gradientMode\": \"opacity\",\n \"lineInterpolation\": \"linear\",\n \"lineWidth\": 2,\n \"stack\": \"off\",\n \"version\": \"3.0.0\"\n },\n \"datasourceCate\": \"prometheus\",\n \"datasourceValue\": \"${datasource}\",\n \"id\": \"f1476512-6731-446e-bb8d-c37652d3b045\",\n \"layout\": {\n \"h\": 8,\n \"i\": \"f1476512-6731-446e-bb8d-c37652d3b045\",\n \"isResizable\": true,\n \"w\": 12,\n \"x\": 12,\n \"y\": 22\n },\n \"links\": [],\n \"maxPerRow\": 4,\n \"name\": \"HTTP-状态码统计\",\n \"options\": {\n \"legend\": {\n \"displayMode\": \"hidden\"\n },\n \"thresholds\": {\n \"steps\": [\n {\n \"color\": \"#634CD9\",\n \"type\": \"base\",\n \"value\": null\n }\n ]\n },\n \"tooltip\": {\n \"mode\": \"all\",\n \"sort\": \"none\"\n }\n },\n \"targets\": [\n {\n \"expr\": \"sum by (status) (sum_over_time(arms_requests_by_status_count{service=\\\"$service\\\",host=~\\\"$host\\\",callType=~\\\"^dsf$|^http$|^dubbo$|^mq$|^user_method$|^producer$|^thrift$|^hsf$|^server$|^grpc$\\\",rpc=\\\"__all__\\\"}[1m]))\",\n \"legend\": \"{{status}}\",\n \"refId\": \"A\"\n }\n ],\n \"type\": \"timeseries\",\n \"version\": \"3.0.0\"\n },\n {\n \"collapsed\": true,\n \"id\": \"a57dc9af-ac9b-4d19-983e-e243bf2f4f06\",\n \"layout\": {\n \"h\": 1,\n \"i\": \"a57dc9af-ac9b-4d19-983e-e243bf2f4f06\",\n \"isResizable\": false,\n \"w\": 24,\n \"x\": 0,\n \"y\": 30\n },\n \"name\": \"应用依赖服务\",\n \"panels\": [],\n \"type\": \"row\",\n \"version\": \"3.0.0\"\n },\n {\n \"custom\": {\n \"drawStyle\": \"lines\",\n \"fillOpacity\": 0.3,\n \"gradientMode\": \"opacity\",\n \"lineInterpolation\": \"linear\",\n \"lineWidth\": 2,\n \"stack\": \"off\",\n \"version\": \"3.0.0\"\n },\n \"datasourceCate\": \"prometheus\",\n \"datasourceValue\": \"${datasource}\",\n \"id\": \"be7ee9e3-717b-4ac6-9c9c-66c7ddd7d135\",\n \"layout\": {\n \"h\": 8,\n \"i\": \"be7ee9e3-717b-4ac6-9c9c-66c7ddd7d135\",\n \"isResizable\": true,\n \"w\": 12,\n \"x\": 0,\n \"y\": 31\n },\n \"links\": [],\n \"maxPerRow\": 4,\n \"name\": \"应用依赖服务请求量/每分钟\",\n \"options\": {\n \"legend\": {\n \"displayMode\": \"hidden\"\n },\n \"thresholds\": {\n \"steps\": [\n {\n \"color\": \"#634CD9\",\n \"type\": \"base\",\n \"value\": null\n }\n ]\n },\n \"tooltip\": {\n \"mode\": \"all\",\n \"sort\": \"none\"\n }\n },\n \"targets\": [\n {\n \"expr\": \"sum by (callType) (sum_over_time(arms_app_requests_count{callType=~\\\"^dubbo_client$|^http_client$|^mongodb$|^oracle$|^client$|^redis$|^dmdb$|^thrift_client$|^dsf_client$|^db$|^mq_client$|^grpc_client$|^hsf_client$|^mysql$|^postgresql$|^memcached$|^consumer$\\\",service=\\\"$service\\\",rpc=\\\"__all__\\\",prpc=\\\"__all__\\\",ppid=\\\"__all__\\\",endpoint=\\\"__all__\\\",destId=\\\"__all__\\\"}[1m]))\",\n \"legend\": \"调用{{callType}}\",\n \"refId\": \"A\"\n }\n ],\n \"type\": \"timeseries\",\n \"version\": \"3.0.0\"\n },\n {\n \"custom\": {\n \"drawStyle\": \"lines\",\n \"fillOpacity\": 0.3,\n \"gradientMode\": \"opacity\",\n \"lineInterpolation\": \"linear\",\n \"lineWidth\": 2,\n \"stack\": \"off\",\n \"version\": \"3.0.0\"\n },\n \"datasourceCate\": \"prometheus\",\n \"datasourceValue\": \"${datasource}\",\n \"id\": \"0443a553-2398-4865-a121-807e24e412ea\",\n \"layout\": {\n \"h\": 8,\n \"i\": \"0443a553-2398-4865-a121-807e24e412ea\",\n \"isResizable\": true,\n \"w\": 12,\n \"x\": 12,\n \"y\": 31\n },\n \"links\": [],\n \"maxPerRow\": 4,\n \"name\": \"应用依赖服务平均响应时间/每分钟\",\n \"options\": {\n \"legend\": {\n \"displayMode\": \"hidden\"\n },\n \"thresholds\": {\n \"steps\": [\n {\n \"color\": \"#634CD9\",\n \"type\": \"base\",\n \"value\": null\n }\n ]\n },\n \"tooltip\": {\n \"mode\": \"all\",\n \"sort\": \"none\"\n }\n },\n \"targets\": [\n {\n \"expr\": \"sum by (callType) (sum_over_time(arms_app_requests_seconds{service=\\\"$service\\\",callType=~\\\"^dubbo_client$|^http_client$|^mongodb$|^oracle$|^client$|^redis$|^dmdb$|^thrift_client$|^dsf_client$|^db$|^mq_client$|^grpc_client$|^hsf_client$|^mysql$|^postgresql$|^memcached$|^consumer$\\\",rpc=\\\"__all__\\\",prpc=\\\"__all__\\\",ppid=\\\"__all__\\\",endpoint=\\\"__all__\\\",destId=\\\"__all__\\\"}[1m]))/sum by (callType) (sum_over_time(arms_app_requests_count{service=\\\"$service\\\",callType=~\\\"^dubbo_client$|^http_client$|^mongodb$|^oracle$|^client$|^redis$|^dmdb$|^thrift_client$|^dsf_client$|^db$|^mq_client$|^grpc_client$|^hsf_client$|^mysql$|^postgresql$|^memcached$|^consumer$\\\",rpc=\\\"__all__\\\",prpc=\\\"__all__\\\",ppid=\\\"__all__\\\",endpoint=\\\"__all__\\\",destId=\\\"__all__\\\"}[1m]))\",\n \"legend\": \"调用{{callType}}\",\n \"refId\": \"A\"\n }\n ],\n \"type\": \"timeseries\",\n \"version\": \"3.0.0\"\n },\n {\n \"collapsed\": true,\n \"id\": \"3919eb57-3713-4092-93ff-f302a6cfaee9\",\n \"layout\": {\n \"h\": 1,\n \"i\": \"3919eb57-3713-4092-93ff-f302a6cfaee9\",\n \"isResizable\": false,\n \"w\": 24,\n \"x\": 0,\n \"y\": 39\n },\n \"name\": \"应用提供服务\",\n \"panels\": [],\n \"type\": \"row\",\n \"version\": \"3.0.0\"\n },\n {\n \"custom\": {\n \"drawStyle\": \"lines\",\n \"fillOpacity\": 0.3,\n \"gradientMode\": \"opacity\",\n \"lineInterpolation\": \"linear\",\n \"lineWidth\": 2,\n \"stack\": \"off\",\n \"version\": \"3.0.0\"\n },\n \"datasourceCate\": \"prometheus\",\n \"datasourceValue\": \"${datasource}\",\n \"id\": \"e0c59484-6787-486d-aa58-6a13e17dfcc9\",\n \"layout\": {\n \"h\": 8,\n \"i\": \"e0c59484-6787-486d-aa58-6a13e17dfcc9\",\n \"isResizable\": true,\n \"w\": 12,\n \"x\": 0,\n \"y\": 40\n },\n \"links\": [],\n \"maxPerRow\": 4,\n \"name\": \"应用提供服务请求量 / 每分钟\",\n \"options\": {\n \"legend\": {\n \"displayMode\": \"hidden\"\n },\n \"thresholds\": {\n \"steps\": [\n {\n \"color\": \"#634CD9\",\n \"type\": \"base\",\n \"value\": null\n }\n ]\n },\n \"tooltip\": {\n \"mode\": \"all\",\n \"sort\": \"none\"\n }\n },\n \"targets\": [\n {\n \"expr\": \"sum by (callType) (sum_over_time(arms_app_requests_count{service=\\\"$service\\\",callType=~\\\"^dsf$|^http$|^dubbo$|^mq$|^user_method$|^producer$|^thrift$|^hsf$|^server$|^grpc$\\\",rpc=\\\"__all__\\\",prpc=\\\"__all__\\\",ppid=\\\"__all__\\\",endpoint=\\\"__all__\\\",destId=\\\"__all__\\\"}[1m]))\",\n \"legend\": \"{{callType}}入口\",\n \"refId\": \"A\"\n }\n ],\n \"type\": \"timeseries\",\n \"version\": \"3.0.0\"\n },\n {\n \"custom\": {\n \"drawStyle\": \"lines\",\n \"fillOpacity\": 0.3,\n \"gradientMode\": \"opacity\",\n \"lineInterpolation\": \"linear\",\n \"lineWidth\": 2,\n \"stack\": \"off\",\n \"version\": \"3.0.0\"\n },\n \"datasourceCate\": \"prometheus\",\n \"datasourceValue\": \"${datasource}\",\n \"id\": \"48201d41-5145-412d-abea-7c1679ee444f\",\n \"layout\": {\n \"h\": 8,\n \"i\": \"48201d41-5145-412d-abea-7c1679ee444f\",\n \"isResizable\": true,\n \"w\": 12,\n \"x\": 12,\n \"y\": 40\n },\n \"links\": [],\n \"maxPerRow\": 4,\n \"name\": \"应用提供服务平均响应时间 / 每分钟\",\n \"options\": {\n \"legend\": {\n \"displayMode\": \"hidden\"\n },\n \"thresholds\": {\n \"steps\": [\n {\n \"color\": \"#634CD9\",\n \"type\": \"base\",\n \"value\": null\n }\n ]\n },\n \"tooltip\": {\n \"mode\": \"all\",\n \"sort\": \"none\"\n }\n },\n \"targets\": [\n {\n \"expr\": \"sum by (callType) (sum_over_time(arms_app_requests_seconds{service=\\\"$service\\\",callType=~\\\"^dsf$|^http$|^dubbo$|^mq$|^user_method$|^producer$|^thrift$|^hsf$|^server$|^grpc$\\\",rpc=\\\"__all__\\\",prpc=\\\"__all__\\\",ppid=\\\"__all__\\\",endpoint=\\\"__all__\\\",destId=\\\"__all__\\\"}[1m]))/sum by (callType) (sum_over_time(arms_app_requests_count{service=\\\"$service\\\",callType=~\\\"^dsf$|^http$|^dubbo$|^mq$|^user_method$|^producer$|^thrift$|^hsf$|^server$|^grpc$\\\",rpc=\\\"__all__\\\",prpc=\\\"__all__\\\",ppid=\\\"__all__\\\",endpoint=\\\"__all__\\\",destId=\\\"__all__\\\"}[1m]))\",\n \"legend\": \"{{callType}}入口\",\n \"refId\": \"A\"\n }\n ],\n \"type\": \"timeseries\",\n \"version\": \"3.0.0\"\n },\n {\n \"collapsed\": true,\n \"id\": \"10af00a6-3b12-4abe-90b2-9ae04ccd4bff\",\n \"layout\": {\n \"h\": 1,\n \"i\": \"10af00a6-3b12-4abe-90b2-9ae04ccd4bff\",\n \"isResizable\": false,\n \"w\": 24,\n \"x\": 0,\n \"y\": 48\n },\n \"name\": \"JVM监控\",\n \"panels\": [],\n \"type\": \"row\",\n \"version\": \"3.0.0\"\n },\n {\n \"custom\": {\n \"drawStyle\": \"lines\",\n \"fillOpacity\": 0.3,\n \"gradientMode\": \"opacity\",\n \"lineInterpolation\": \"linear\",\n \"lineWidth\": 2,\n \"stack\": \"off\",\n \"version\": \"3.0.0\"\n },\n \"datasourceCate\": \"prometheus\",\n \"datasourceValue\": \"${datasource}\",\n \"id\": \"bd95a6c2-1387-42b5-967c-82a266bf670e\",\n \"layout\": {\n \"h\": 8,\n \"i\": \"bd95a6c2-1387-42b5-967c-82a266bf670e\",\n \"isResizable\": true,\n \"w\": 12,\n \"x\": 0,\n \"y\": 49\n },\n \"links\": [],\n \"maxPerRow\": 4,\n \"name\": \"GC次数/每分钟\",\n \"options\": {\n \"legend\": {\n \"displayMode\": \"hidden\"\n },\n \"thresholds\": {\n \"steps\": [\n {\n \"color\": \"#634CD9\",\n \"type\": \"base\",\n \"value\": null\n }\n ]\n },\n \"tooltip\": {\n \"mode\": \"all\",\n \"sort\": \"none\"\n }\n },\n \"targets\": [\n {\n \"expr\": \"sum(sum_over_time(arms_jvm_gc_delta{service=\\\"$service\\\",host=~\\\"$host\\\",gen=\\\"old\\\"}[1m]))\",\n \"legend\": \"FullGC次数-瞬时值\",\n \"refId\": \"A\"\n },\n {\n \"expr\": \"sum(max_over_time(arms_jvm_gc_total{service=\\\"$service\\\",host=~\\\"$host\\\",gen=\\\"old\\\"}[1m]))\",\n \"legend\": \"FullGC次数-累计值\",\n \"refId\": \"B\"\n },\n {\n \"expr\": \"sum(sum_over_time(arms_jvm_gc_delta{service=\\\"$service\\\",host=~\\\"$host\\\",gen=\\\"young\\\"}[1m]))\",\n \"legend\": \"YoungGC次数-瞬时值\",\n \"refId\": \"C\"\n },\n {\n \"expr\": \"sum(max_over_time(arms_jvm_gc_total{service=\\\"$service\\\",host=~\\\"$host\\\",gen=\\\"young\\\"}[1m]))\",\n \"legend\": \"YoungGC次数-累计值\",\n \"refId\": \"E\"\n }\n ],\n \"type\": \"timeseries\",\n \"version\": \"3.0.0\"\n },\n {\n \"custom\": {\n \"drawStyle\": \"lines\",\n \"fillOpacity\": 0.3,\n \"gradientMode\": \"opacity\",\n \"lineInterpolation\": \"linear\",\n \"lineWidth\": 2,\n \"stack\": \"off\",\n \"version\": \"3.0.0\"\n },\n \"datasourceCate\": \"prometheus\",\n \"datasourceValue\": \"${datasource}\",\n \"description\": \"\",\n \"id\": \"1cb12b4a-66f2-45d6-bd48-70fc565374b0\",\n \"layout\": {\n \"h\": 8,\n \"i\": \"1cb12b4a-66f2-45d6-bd48-70fc565374b0\",\n \"isResizable\": true,\n \"w\": 12,\n \"x\": 12,\n \"y\": 49\n },\n \"links\": [],\n \"maxPerRow\": 4,\n \"name\": \"GC耗时/每分钟\",\n \"options\": {\n \"legend\": {\n \"displayMode\": \"hidden\"\n },\n \"thresholds\": {\n \"steps\": [\n {\n \"color\": \"#634CD9\",\n \"type\": \"base\",\n \"value\": null\n }\n ]\n },\n \"tooltip\": {\n \"mode\": \"all\",\n \"sort\": \"none\"\n }\n },\n \"targets\": [\n {\n \"expr\": \"sum(sum_over_time(arms_jvm_gc_seconds_delta{service=\\\"$service\\\",host=~\\\"$host\\\",gen=\\\"young\\\"}[1m]))\",\n \"legend\": \"YoungGC耗时-瞬时值\",\n \"refId\": \"A\"\n },\n {\n \"expr\": \"max(max_over_time(arms_jvm_gc_seconds_total{service=\\\"$service\\\",host=~\\\"$host\\\",gen=\\\"young\\\"}[1m]))\",\n \"legend\": \"YoungGC耗时-累计值\",\n \"refId\": \"B\"\n },\n {\n \"expr\": \"sum(sum_over_time(arms_jvm_gc_seconds_delta{service=\\\"$service\\\",host=~\\\"$host\\\",gen=\\\"old\\\"}[1m]))\",\n \"legend\": \"FullGC耗时-瞬时值\",\n \"refId\": \"C\"\n },\n {\n \"expr\": \"max(max_over_time(arms_jvm_gc_seconds_total{service=\\\"$service\\\",host=~\\\"$host\\\",gen=\\\"old\\\"}[1m]))\",\n \"legend\": \"FullGC耗时-累计值\",\n \"refId\": \"D\"\n }\n ],\n \"type\": \"timeseries\",\n \"version\": \"3.0.0\"\n },\n {\n \"custom\": {\n \"drawStyle\": \"lines\",\n \"fillOpacity\": 0.3,\n \"gradientMode\": \"opacity\",\n \"lineInterpolation\": \"linear\",\n \"lineWidth\": 2,\n \"stack\": \"off\",\n \"version\": \"3.0.0\"\n },\n \"datasourceCate\": \"prometheus\",\n \"datasourceValue\": \"${datasource}\",\n \"id\": \"44f7673a-a614-425e-82f4-0dd92945040f\",\n \"layout\": {\n \"h\": 8,\n \"i\": \"44f7673a-a614-425e-82f4-0dd92945040f\",\n \"isResizable\": true,\n \"w\": 12,\n \"x\": 0,\n \"y\": 57\n },\n \"links\": [],\n \"maxPerRow\": 4,\n \"name\": \"堆内存详情/每分钟\",\n \"options\": {\n \"legend\": {\n \"displayMode\": \"hidden\"\n },\n \"thresholds\": {\n \"steps\": [\n {\n \"color\": \"#634CD9\",\n \"type\": \"base\",\n \"value\": null\n }\n ]\n },\n \"tooltip\": {\n \"mode\": \"all\",\n \"sort\": \"none\"\n }\n },\n \"targets\": [\n {\n \"expr\": \"max by (id) (max_over_time(arms_jvm_mem_used_bytes{service=\\\"$service\\\",host=~\\\"$host\\\",area=\\\"heap\\\"}[1m]))\",\n \"legend\": \"{{id}}\",\n \"refId\": \"A\"\n }\n ],\n \"type\": \"timeseries\",\n \"version\": \"3.0.0\"\n },\n {\n \"custom\": {\n \"drawStyle\": \"lines\",\n \"fillOpacity\": 0.3,\n \"gradientMode\": \"opacity\",\n \"lineInterpolation\": \"linear\",\n \"lineWidth\": 2,\n \"stack\": \"off\",\n \"version\": \"3.0.0\"\n },\n \"datasourceCate\": \"prometheus\",\n \"datasourceValue\": \"${datasource}\",\n \"id\": \"60223b1e-8429-4c13-8421-131307645a39\",\n \"layout\": {\n \"h\": 8,\n \"i\": \"60223b1e-8429-4c13-8421-131307645a39\",\n \"isResizable\": true,\n \"w\": 12,\n \"x\": 12,\n \"y\": 57\n },\n \"links\": [],\n \"maxPerRow\": 4,\n \"name\": \"元空间/每分钟\",\n \"options\": {\n \"legend\": {\n \"displayMode\": \"hidden\"\n },\n \"thresholds\": {\n \"steps\": [\n {\n \"color\": \"#634CD9\",\n \"type\": \"base\",\n \"value\": null\n }\n ]\n },\n \"tooltip\": {\n \"mode\": \"all\",\n \"sort\": \"none\"\n }\n },\n \"targets\": [\n {\n \"expr\": \"max(max_over_time(arms_jvm_mem_used_bytes{service=\\\"$service\\\",host=~\\\"$host\\\",area=\\\"nonheap\\\",id=\\\"metaspace\\\"}[1m]))\",\n \"legend\": \"元空间\",\n \"refId\": \"A\"\n }\n ],\n \"type\": \"timeseries\",\n \"version\": \"3.0.0\"\n },\n {\n \"custom\": {\n \"drawStyle\": \"lines\",\n \"fillOpacity\": 0.3,\n \"gradientMode\": \"opacity\",\n \"lineInterpolation\": \"linear\",\n \"lineWidth\": 2,\n \"stack\": \"off\",\n \"version\": \"3.0.0\"\n },\n \"datasourceCate\": \"prometheus\",\n \"datasourceValue\": \"${datasource}\",\n \"id\": \"8a40080f-738b-46ca-8a42-04be4860b4ee\",\n \"layout\": {\n \"h\": 8,\n \"i\": \"8a40080f-738b-46ca-8a42-04be4860b4ee\",\n \"isResizable\": true,\n \"w\": 12,\n \"x\": 0,\n \"y\": 65\n },\n \"links\": [],\n \"maxPerRow\": 4,\n \"name\": \"非堆内存/每分钟\",\n \"options\": {\n \"legend\": {\n \"displayMode\": \"hidden\"\n },\n \"thresholds\": {\n \"steps\": [\n {\n \"color\": \"#634CD9\",\n \"type\": \"base\",\n \"value\": null\n }\n ]\n },\n \"tooltip\": {\n \"mode\": \"all\",\n \"sort\": \"none\"\n }\n },\n \"targets\": [\n {\n \"expr\": \"max(max_over_time(arms_jvm_mem_committed_bytes{service=\\\"$service\\\",host=~\\\"$host\\\",area=\\\"nonheap\\\"}[1m]))\",\n \"legend\": \"提交字节数\",\n \"refId\": \"A\"\n },\n {\n \"expr\": \"max(max_over_time(arms_jvm_mem_init_bytes{service=\\\"$service\\\",host=~\\\"$host\\\",area=\\\"nonheap\\\"}[1m]))\",\n \"legend\": \"初始字节数\",\n \"refId\": \"B\"\n },\n {\n \"expr\": \"max(max_over_time(arms_jvm_mem_max_bytes{service=\\\"$service\\\",host=~\\\"$host\\\",area=\\\"nonheap\\\"}[1m]))\",\n \"legend\": \"最大字节数\",\n \"refId\": \"C\"\n }\n ],\n \"type\": \"timeseries\",\n \"version\": \"3.0.0\"\n },\n {\n \"custom\": {\n \"drawStyle\": \"lines\",\n \"fillOpacity\": 0.3,\n \"gradientMode\": \"opacity\",\n \"lineInterpolation\": \"linear\",\n \"lineWidth\": 2,\n \"stack\": \"off\",\n \"version\": \"3.0.0\"\n },\n \"datasourceCate\": \"prometheus\",\n \"datasourceValue\": \"${datasource}\",\n \"id\": \"4a99dcc2-d230-45bc-b0ad-b718bb21eeb6\",\n \"layout\": {\n \"h\": 8,\n \"i\": \"4a99dcc2-d230-45bc-b0ad-b718bb21eeb6\",\n \"isResizable\": true,\n \"w\": 12,\n \"x\": 12,\n \"y\": 65\n },\n \"links\": [],\n \"maxPerRow\": 4,\n \"name\": \"直接缓冲区/每分钟\",\n \"options\": {\n \"legend\": {\n \"displayMode\": \"hidden\"\n },\n \"thresholds\": {\n \"steps\": [\n {\n \"color\": \"#634CD9\",\n \"type\": \"base\",\n \"value\": null\n }\n ]\n },\n \"tooltip\": {\n \"mode\": \"all\",\n \"sort\": \"none\"\n }\n },\n \"targets\": [\n {\n \"expr\": \"max(max_over_time(arms_jvm_buffer_pool_total_bytes{service=\\\"$service\\\",host=~\\\"$host\\\",id=\\\"direct\\\"}[1m]))\",\n \"legend\": \"DirectBuffer总大小\",\n \"refId\": \"A\"\n },\n {\n \"expr\": \"max(max_over_time(arms_jvm_buffer_pool_used_bytes{service=\\\"$service\\\",host=~\\\"$host\\\",id=\\\"direct\\\"}[1m]))\",\n \"legend\": \"DirectBuffer使用大小\",\n \"refId\": \"B\"\n }\n ],\n \"type\": \"timeseries\",\n \"version\": \"3.0.0\"\n },\n {\n \"custom\": {\n \"drawStyle\": \"lines\",\n \"fillOpacity\": 0.3,\n \"gradientMode\": \"opacity\",\n \"lineInterpolation\": \"linear\",\n \"lineWidth\": 2,\n \"stack\": \"off\",\n \"version\": \"3.0.0\"\n },\n \"datasourceCate\": \"prometheus\",\n \"datasourceValue\": \"${datasource}\",\n \"id\": \"34635d94-e8a2-44a8-a246-a984bd415a99\",\n \"layout\": {\n \"h\": 8,\n \"i\": \"34635d94-e8a2-44a8-a246-a984bd415a99\",\n \"isResizable\": true,\n \"w\": 24,\n \"x\": 0,\n \"y\": 73\n },\n \"links\": [],\n \"maxPerRow\": 4,\n \"name\": \"JVM线程数\",\n \"options\": {\n \"legend\": {\n \"displayMode\": \"hidden\"\n },\n \"thresholds\": {\n \"steps\": [\n {\n \"color\": \"#634CD9\",\n \"type\": \"base\",\n \"value\": null\n }\n ]\n },\n \"tooltip\": {\n \"mode\": \"all\",\n \"sort\": \"none\"\n }\n },\n \"targets\": [\n {\n \"expr\": \"sum by (state) (arms_jvm_threads_count{service=\\\"$service\\\",host=~\\\"$host\\\"})\",\n \"legend\": \"{{state}}\",\n \"refId\": \"A\"\n }\n ],\n \"type\": \"timeseries\",\n \"version\": \"3.0.0\"\n },\n {\n \"collapsed\": true,\n \"id\": \"bd920da4-1bd1-4c73-81be-ec62a6c814fb\",\n \"layout\": {\n \"h\": 1,\n \"i\": \"bd920da4-1bd1-4c73-81be-ec62a6c814fb\",\n \"isResizable\": false,\n \"w\": 24,\n \"x\": 0,\n \"y\": 81\n },\n \"name\": \"主机监控\",\n \"panels\": [],\n \"type\": \"row\",\n \"version\": \"3.0.0\"\n },\n {\n \"custom\": {\n \"drawStyle\": \"lines\",\n \"fillOpacity\": 0.3,\n \"gradientMode\": \"opacity\",\n \"lineInterpolation\": \"linear\",\n \"lineWidth\": 2,\n \"stack\": \"off\",\n \"version\": \"3.0.0\"\n },\n \"datasourceCate\": \"prometheus\",\n \"datasourceValue\": \"${datasource}\",\n \"id\": \"8dcb1609-c1fc-423f-8b94-ac1e48a14c64\",\n \"layout\": {\n \"h\": 9,\n \"i\": \"8dcb1609-c1fc-423f-8b94-ac1e48a14c64\",\n \"isResizable\": true,\n \"w\": 6,\n \"x\": 0,\n \"y\": 82\n },\n \"links\": [],\n \"maxPerRow\": 4,\n \"name\": \"CPU/每分钟\",\n \"options\": {\n \"legend\": {\n \"displayMode\": \"hidden\"\n },\n \"thresholds\": {\n \"steps\": [\n {\n \"color\": \"#634CD9\",\n \"type\": \"base\",\n \"value\": null\n }\n ]\n },\n \"tooltip\": {\n \"mode\": \"all\",\n \"sort\": \"none\"\n }\n },\n \"targets\": [\n {\n \"expr\": \"max(max_over_time(arms_system_cpu_system{service=\\\"$service\\\",host=~\\\"$host\\\"}[1m]))\",\n \"legend\": \"系统CPU使用率\",\n \"refId\": \"A\"\n },\n {\n \"expr\": \"max(max_over_time(arms_system_cpu_user{service=\\\"$service\\\",host=~\\\"$host\\\"}[1m]))\",\n \"legend\": \"用户CPU使用率\",\n \"refId\": \"B\"\n },\n {\n \"expr\": \"max(max_over_time(arms_system_cpu_io_wait{service=\\\"$service\\\",host=~\\\"$host\\\"}[1m]))\",\n \"legend\": \"等待IO完成的CPU使用率\",\n \"refId\": \"C\"\n },\n {\n \"expr\": \"max(max_over_time(arms_system_cpu_system{service=\\\"$service\\\",host=~\\\"$host\\\"}[1m]))+max(max_over_time(arms_system_cpu_io_wait{service=\\\"$service\\\",host=~\\\"$host\\\"}[1m]))+max(max_over_time(arms_system_cpu_user{service=\\\"$service\\\",host=~\\\"$host\\\"}[1m]))\",\n \"legend\": \"总和\",\n \"refId\": \"D\"\n }\n ],\n \"type\": \"timeseries\",\n \"version\": \"3.0.0\"\n },\n {\n \"custom\": {\n \"drawStyle\": \"lines\",\n \"fillOpacity\": 0.3,\n \"gradientMode\": \"opacity\",\n \"lineInterpolation\": \"linear\",\n \"lineWidth\": 2,\n \"stack\": \"off\",\n \"version\": \"3.0.0\"\n },\n \"datasourceCate\": \"prometheus\",\n \"datasourceValue\": \"${datasource}\",\n \"id\": \"037f2e66-80b4-4616-b31b-5a2ae62fd587\",\n \"layout\": {\n \"h\": 9,\n \"i\": \"037f2e66-80b4-4616-b31b-5a2ae62fd587\",\n \"isResizable\": true,\n \"w\": 6,\n \"x\": 6,\n \"y\": 82\n },\n \"links\": [],\n \"maxPerRow\": 4,\n \"name\": \"物理内存/每分钟\",\n \"options\": {\n \"legend\": {\n \"displayMode\": \"hidden\"\n },\n \"thresholds\": {\n \"steps\": [\n {\n \"color\": \"#634CD9\",\n \"type\": \"base\",\n \"value\": null\n }\n ]\n },\n \"tooltip\": {\n \"mode\": \"all\",\n \"sort\": \"none\"\n }\n },\n \"targets\": [\n {\n \"expr\": \"max(max_over_time(arms_system_mem_free_bytes{service=\\\"$service\\\",host=~\\\"$host\\\"}[1m]))\",\n \"legend\": \"系统的空闲内存\",\n \"refId\": \"A\"\n },\n {\n \"expr\": \"max(max_over_time(arms_system_mem_buffers_bytes{service=\\\"$service\\\",host=~\\\"$host\\\"}[1m]))\",\n \"legend\": \"系统的BufferCache的内存数\",\n \"refId\": \"E\"\n },\n {\n \"expr\": \"max(max_over_time(arms_system_mem_cached_bytes{service=\\\"$service\\\",host=~\\\"$host\\\"}[1m]))\",\n \"legend\": \"系统的PageCache里的内存数\",\n \"refId\": \"B\"\n },\n {\n \"expr\": \"max(max_over_time(arms_system_mem_total_bytes{service=\\\"$service\\\",host=~\\\"$host\\\"}[1m]))\",\n \"legend\": \"总和\",\n \"refId\": \"F\"\n },\n {\n \"expr\": \"max(max_over_time(arms_system_mem_used_bytes{service=\\\"$service\\\",host=~\\\"$host\\\"}[1m]))\",\n \"legend\": \"系统的已经使用的内存\",\n \"refId\": \"G\"\n }\n ],\n \"type\": \"timeseries\",\n \"version\": \"3.0.0\"\n },\n {\n \"custom\": {\n \"drawStyle\": \"lines\",\n \"fillOpacity\": 0.3,\n \"gradientMode\": \"opacity\",\n \"lineInterpolation\": \"linear\",\n \"lineWidth\": 2,\n \"stack\": \"off\",\n \"version\": \"3.0.0\"\n },\n \"datasourceCate\": \"prometheus\",\n \"datasourceValue\": \"${datasource}\",\n \"id\": \"409c5294-7b00-408f-8156-124504283162\",\n \"layout\": {\n \"h\": 9,\n \"i\": \"409c5294-7b00-408f-8156-124504283162\",\n \"isResizable\": true,\n \"w\": 6,\n \"x\": 12,\n \"y\": 82\n },\n \"links\": [],\n \"maxPerRow\": 4,\n \"name\": \"负载/每分钟\",\n \"options\": {\n \"legend\": {\n \"displayMode\": \"hidden\"\n },\n \"thresholds\": {\n \"steps\": [\n {\n \"color\": \"#634CD9\",\n \"type\": \"base\",\n \"value\": null\n }\n ]\n },\n \"tooltip\": {\n \"mode\": \"all\",\n \"sort\": \"none\"\n }\n },\n \"targets\": [\n {\n \"expr\": \"max(max_over_time(arms_system_load{service=\\\"$service\\\",host=~\\\"$host\\\"}[1m]))\",\n \"legend\": \"load\",\n \"refId\": \"A\"\n }\n ],\n \"type\": \"timeseries\",\n \"version\": \"3.0.0\"\n },\n {\n \"custom\": {\n \"drawStyle\": \"lines\",\n \"fillOpacity\": 0.3,\n \"gradientMode\": \"opacity\",\n \"lineInterpolation\": \"linear\",\n \"lineWidth\": 2,\n \"stack\": \"off\",\n \"version\": \"3.0.0\"\n },\n \"datasourceCate\": \"prometheus\",\n \"datasourceValue\": \"${datasource}\",\n \"id\": \"182bc839-efd6-4c9c-b7ac-017fc2aa28c8\",\n \"layout\": {\n \"h\": 9,\n \"i\": \"182bc839-efd6-4c9c-b7ac-017fc2aa28c8\",\n \"isResizable\": true,\n \"w\": 6,\n \"x\": 18,\n \"y\": 82\n },\n \"links\": [],\n \"maxPerRow\": 4,\n \"name\": \"磁盘可用容量/每分钟\",\n \"options\": {\n \"legend\": {\n \"displayMode\": \"hidden\"\n },\n \"thresholds\": {\n \"steps\": [\n {\n \"color\": \"#634CD9\",\n \"type\": \"base\",\n \"value\": null\n }\n ]\n },\n \"tooltip\": {\n \"mode\": \"all\",\n \"sort\": \"none\"\n }\n },\n \"targets\": [\n {\n \"expr\": \"max(max_over_time(arms_system_disk_free_bytes{service=\\\"$service\\\",host=~\\\"$host\\\"}[1m]))\",\n \"legend\": \"磁盘空闲数\",\n \"refId\": \"A\"\n },\n {\n \"expr\": \"max(max_over_time(arms_system_disk_total_bytes{service=\\\"$service\\\",host=~\\\"$host\\\"}[1m]))-max(max_over_time(arms_system_disk_free_bytes{service=\\\"$service\\\",host=~\\\"$host\\\"}[1m]))\",\n \"legend\": \"磁盘使用数\",\n \"refId\": \"B\"\n },\n {\n \"expr\": \"max(max_over_time(arms_system_disk_total_bytes{service=\\\"$service\\\",host=~\\\"$host\\\"}[1m]))\",\n \"legend\": \"总和\",\n \"refId\": \"C\"\n }\n ],\n \"type\": \"timeseries\",\n \"version\": \"3.0.0\"\n },\n {\n \"custom\": {\n \"drawStyle\": \"lines\",\n \"fillOpacity\": 0.3,\n \"gradientMode\": \"opacity\",\n \"lineInterpolation\": \"linear\",\n \"lineWidth\": 2,\n \"stack\": \"off\",\n \"version\": \"3.0.0\"\n },\n \"datasourceCate\": \"prometheus\",\n \"datasourceValue\": \"${datasource}\",\n \"id\": \"e36b674a-e3b9-4687-9a75-6e07c03815a8\",\n \"layout\": {\n \"h\": 9,\n \"i\": \"e36b674a-e3b9-4687-9a75-6e07c03815a8\",\n \"isResizable\": true,\n \"w\": 12,\n \"x\": 0,\n \"y\": 91\n },\n \"links\": [],\n \"maxPerRow\": 4,\n \"name\": \"网络流量(Byte)/每分钟\",\n \"options\": {\n \"legend\": {\n \"displayMode\": \"hidden\"\n },\n \"thresholds\": {\n \"steps\": [\n {\n \"color\": \"#634CD9\",\n \"type\": \"base\",\n \"value\": null\n }\n ]\n },\n \"tooltip\": {\n \"mode\": \"all\",\n \"sort\": \"none\"\n }\n },\n \"targets\": [\n {\n \"expr\": \"max(max_over_time(arms_system_net_in_bytes{service=\\\"$service\\\",host=~\\\"$host\\\"}[1m]))\",\n \"legend\": \"网络接收的字节数\",\n \"refId\": \"A\"\n },\n {\n \"expr\": \"max(max_over_time(arms_system_net_out_bytes{service=\\\"$service\\\",host=~\\\"$host\\\"}[1m]))\",\n \"legend\": \"网络发送的字节数\",\n \"refId\": \"B\"\n }\n ],\n \"type\": \"timeseries\",\n \"version\": \"3.0.0\"\n },\n {\n \"custom\": {\n \"drawStyle\": \"lines\",\n \"fillOpacity\": 0.3,\n \"gradientMode\": \"opacity\",\n \"lineInterpolation\": \"linear\",\n \"lineWidth\": 2,\n \"stack\": \"off\",\n \"version\": \"3.0.0\"\n },\n \"datasourceCate\": \"prometheus\",\n \"datasourceValue\": \"${datasource}\",\n \"id\": \"95dad73c-8716-481e-a49c-72a7b3c5fa91\",\n \"layout\": {\n \"h\": 9,\n \"i\": \"95dad73c-8716-481e-a49c-72a7b3c5fa91\",\n \"isResizable\": true,\n \"w\": 12,\n \"x\": 12,\n \"y\": 91\n },\n \"links\": [],\n \"maxPerRow\": 4,\n \"name\": \"网络数据包(个)/每分钟\",\n \"options\": {\n \"legend\": {\n \"displayMode\": \"hidden\"\n },\n \"thresholds\": {\n \"steps\": [\n {\n \"color\": \"#634CD9\",\n \"type\": \"base\",\n \"value\": null\n }\n ]\n },\n \"tooltip\": {\n \"mode\": \"all\",\n \"sort\": \"none\"\n }\n },\n \"targets\": [\n {\n \"expr\": \"max(max_over_time(arms_system_net_in_packets{service=\\\"$service\\\",host=~\\\"$host\\\"}[1m]))\",\n \"legend\": \"网络接收的报文数\",\n \"refId\": \"A\"\n },\n {\n \"expr\": \"max(max_over_time(arms_system_net_out_packets{service=\\\"$service\\\",host=~\\\"$host\\\"}[1m]))\",\n \"legend\": \"网络发送的报文数\",\n \"refId\": \"B\"\n },\n {\n \"expr\": \"max(max_over_time(arms_system_net_in_errs{service=\\\"$service\\\",host=~\\\"$host\\\"}[1m]))\",\n \"legend\": \"网络接收的错误数\",\n \"refId\": \"C\"\n },\n {\n \"expr\": \"max(max_over_time(arms_system_net_out_errs{service=\\\"$service\\\",host=~\\\"$host\\\"}[1m]))\",\n \"legend\": \"网络丢弃报文数\",\n \"refId\": \"D\"\n }\n ],\n \"type\": \"timeseries\",\n \"version\": \"3.0.0\"\n }\n ],\n \"var\": [\n {\n \"definition\": \"prometheus\",\n \"name\": \"datasource\",\n \"type\": \"datasource\"\n },\n {\n \"allOption\": false,\n \"datasource\": {\n \"cate\": \"prometheus\",\n \"value\": \"${datasource}\"\n },\n \"definition\": \"label_values(arms_system_cpu_idle,service)\",\n \"multi\": false,\n \"name\": \"service\",\n \"reg\": \"\",\n \"type\": \"query\"\n },\n {\n \"allOption\": true,\n \"allValue\": \".*\",\n \"datasource\": {\n \"cate\": \"prometheus\",\n \"value\": \"${datasource}\"\n },\n \"definition\": \"label_values(arms_system_cpu_idle{service=\\\"$service\\\"},host)\",\n \"multi\": false,\n \"name\": \"host\",\n \"reg\": \"\",\n \"type\": \"query\"\n }\n ],\n \"version\": \"3.0.0\"\n },\n \"public\": 0,\n \"public_cate\": 0,\n \"bgids\": null,\n \"built_in\": 0,\n \"hide\": 0,\n \"uuid\": 1717556327089363000\n}"
},
{
"path": "integrations/AliYun/dashboards/arms-db.json",
"content": "{\n \"id\": 0,\n \"group_id\": 0,\n \"name\": \"ARMS-DB\",\n \"ident\": \"\",\n \"tags\": \"ARMS\",\n \"create_at\": 0,\n \"create_by\": \"\",\n \"update_at\": 0,\n \"update_by\": \"\",\n \"configs\": {\n \"links\": [],\n \"panels\": [\n {\n \"collapsed\": true,\n \"id\": \"bd8c0aac-06df-4b2d-9456-cad8e7389499\",\n \"layout\": {\n \"h\": 1,\n \"i\": \"bd8c0aac-06df-4b2d-9456-cad8e7389499\",\n \"w\": 24,\n \"x\": 0,\n \"y\": 0\n },\n \"name\": \"概览(DB级别)\",\n \"panels\": [],\n \"type\": \"row\",\n \"version\": \"3.0.0\"\n },\n {\n \"custom\": {\n \"drawStyle\": \"lines\",\n \"fillOpacity\": 0.3,\n \"gradientMode\": \"opacity\",\n \"lineInterpolation\": \"linear\",\n \"lineWidth\": 2,\n \"stack\": \"off\",\n \"version\": \"3.0.0\"\n },\n \"datasourceCate\": \"prometheus\",\n \"datasourceValue\": \"${datasource}\",\n \"id\": \"8d2da301-e5e8-4b2f-9b31-59aa0835c312\",\n \"layout\": {\n \"h\": 8,\n \"i\": \"8d2da301-e5e8-4b2f-9b31-59aa0835c312\",\n \"w\": 12,\n \"x\": 0,\n \"y\": 1\n },\n \"links\": [],\n \"maxPerRow\": 4,\n \"name\": \"请求数/每分钟\",\n \"options\": {\n \"legend\": {\n \"displayMode\": \"hidden\"\n },\n \"thresholds\": {\n \"steps\": [\n {\n \"color\": \"#634CD9\",\n \"type\": \"base\",\n \"value\": null\n }\n ]\n },\n \"tooltip\": {\n \"mode\": \"all\",\n \"sort\": \"none\"\n }\n },\n \"targets\": [\n {\n \"expr\": \"sum by (callType) (sum_over_time(arms_db_requests_count{endpoint=\\\"${instance}\\\",destId=~\\\"${db}\\\"}[1m]))\",\n \"legend\": \"{{callType}}入口\",\n \"refId\": \"B\"\n }\n ],\n \"type\": \"timeseries\",\n \"version\": \"3.0.0\"\n },\n {\n \"custom\": {\n \"drawStyle\": \"lines\",\n \"fillOpacity\": 0.3,\n \"gradientMode\": \"opacity\",\n \"lineInterpolation\": \"linear\",\n \"lineWidth\": 2,\n \"stack\": \"off\",\n \"version\": \"3.0.0\"\n },\n \"datasourceCate\": \"prometheus\",\n \"datasourceValue\": \"${datasource}\",\n \"id\": \"ab2b0969-50e7-4e4b-962a-58be133e6aef\",\n \"layout\": {\n \"h\": 8,\n \"i\": \"ab2b0969-50e7-4e4b-962a-58be133e6aef\",\n \"w\": 12,\n \"x\": 12,\n \"y\": 1\n },\n \"links\": [],\n \"maxPerRow\": 4,\n \"name\": \"响应时间/每分钟\",\n \"options\": {\n \"legend\": {\n \"displayMode\": \"hidden\"\n },\n \"thresholds\": {\n \"steps\": [\n {\n \"color\": \"#634CD9\",\n \"type\": \"base\",\n \"value\": null\n }\n ]\n },\n \"tooltip\": {\n \"mode\": \"all\",\n \"sort\": \"none\"\n }\n },\n \"targets\": [\n {\n \"expr\": \"sum by (callType) (sum_over_time(arms_db_requests_seconds{endpoint=\\\"$instance\\\",destId=~\\\"^$db$\\\"}[1m]))/sum by (callType) (sum_over_time(arms_db_requests_count{endpoint=\\\"$instance\\\",destId=~\\\"^$db$\\\"}[1m]))\",\n \"legend\": \"{{callType}}入口\",\n \"refId\": \"A\"\n }\n ],\n \"type\": \"timeseries\",\n \"version\": \"3.0.0\"\n },\n {\n \"custom\": {\n \"drawStyle\": \"lines\",\n \"fillOpacity\": 0.3,\n \"gradientMode\": \"opacity\",\n \"lineInterpolation\": \"linear\",\n \"lineWidth\": 2,\n \"stack\": \"off\",\n \"version\": \"3.0.0\"\n },\n \"datasourceCate\": \"prometheus\",\n \"datasourceValue\": \"${datasource}\",\n \"id\": \"6bd5d219-0a94-4f90-b2e0-93ed3eeca9f0\",\n \"layout\": {\n \"h\": 8,\n \"i\": \"6bd5d219-0a94-4f90-b2e0-93ed3eeca9f0\",\n \"w\": 12,\n \"x\": 0,\n \"y\": 9\n },\n \"links\": [],\n \"maxPerRow\": 4,\n \"name\": \"错误数/每分钟\",\n \"options\": {\n \"legend\": {\n \"displayMode\": \"hidden\"\n },\n \"thresholds\": {\n \"steps\": [\n {\n \"color\": \"#634CD9\",\n \"type\": \"base\",\n \"value\": null\n }\n ]\n },\n \"tooltip\": {\n \"mode\": \"all\",\n \"sort\": \"none\"\n }\n },\n \"targets\": [\n {\n \"expr\": \"sum by (callType) (sum_over_time(arms_db_requests_error_count{endpoint=\\\"$instance\\\",destId=~\\\"$db\\\"}[1m]))\",\n \"legend\": \"{{callType}}入口\",\n \"refId\": \"A\"\n }\n ],\n \"type\": \"timeseries\",\n \"version\": \"3.0.0\"\n },\n {\n \"custom\": {\n \"drawStyle\": \"lines\",\n \"fillOpacity\": 0.3,\n \"gradientMode\": \"opacity\",\n \"lineInterpolation\": \"linear\",\n \"lineWidth\": 2,\n \"stack\": \"off\",\n \"version\": \"3.0.0\"\n },\n \"datasourceCate\": \"prometheus\",\n \"datasourceValue\": \"${datasource}\",\n \"description\": \"针对所有SQL的聚和指标\",\n \"id\": \"d9093b86-5796-471a-a28c-fe1d8daf1721\",\n \"layout\": {\n \"h\": 8,\n \"i\": \"d9093b86-5796-471a-a28c-fe1d8daf1721\",\n \"w\": 12,\n \"x\": 12,\n \"y\": 9\n },\n \"links\": [],\n \"maxPerRow\": 4,\n \"name\": \"性能一览/每分钟\",\n \"options\": {\n \"legend\": {\n \"displayMode\": \"hidden\"\n },\n \"thresholds\": {\n \"steps\": [\n {\n \"color\": \"#634CD9\",\n \"type\": \"base\",\n \"value\": null\n }\n ]\n },\n \"tooltip\": {\n \"mode\": \"all\",\n \"sort\": \"none\"\n }\n },\n \"targets\": [\n {\n \"expr\": \"sum(sum_over_time(arms_db_requests_count{endpoint=\\\"$instance\\\",destId=~\\\"$db\\\"}[1m]))\",\n \"legend\": \"请求次数\",\n \"refId\": \"A\"\n },\n {\n \"expr\": \"sum(sum_over_time(arms_db_requests_seconds{endpoint=\\\"$instance\\\",destId=~\\\"$db\\\"}[1m]))/sum(sum_over_time(arms_db_requests_count{endpoint=\\\"$instance\\\",destId=~\\\"$db\\\"}[1m]))\",\n \"legend\": \"平均耗时\",\n \"refId\": \"B\"\n }\n ],\n \"type\": \"timeseries\",\n \"version\": \"3.0.0\"\n }\n ],\n \"var\": [\n {\n \"definition\": \"prometheus\",\n \"name\": \"datasource\",\n \"type\": \"datasource\"\n },\n {\n \"allOption\": false,\n \"datasource\": {\n \"cate\": \"prometheus\",\n \"value\": \"${datasource}\"\n },\n \"definition\": \"label_values(arms_system_cpu_idle,service)\",\n \"multi\": false,\n \"name\": \"service\",\n \"reg\": \"\",\n \"type\": \"query\"\n },\n {\n \"allOption\": false,\n \"datasource\": {\n \"cate\": \"prometheus\",\n \"value\": \"${datasource}\"\n },\n \"definition\": \"label_values(arms_db_requests_count{service=\\\"$service\\\"},endpoint)\",\n \"multi\": false,\n \"name\": \"instance\",\n \"reg\": \"\",\n \"type\": \"query\"\n },\n {\n \"allOption\": true,\n \"allValue\": \".*\",\n \"datasource\": {\n \"cate\": \"prometheus\",\n \"value\": \"${datasource}\"\n },\n \"definition\": \"label_values(arms_db_requests_count{endpoint=\\\"${instance}\\\"},destId)\",\n \"multi\": false,\n \"name\": \"db\",\n \"reg\": \"\",\n \"type\": \"query\"\n }\n ],\n \"version\": \"3.0.0\"\n },\n \"public\": 0,\n \"public_cate\": 0,\n \"bgids\": null,\n \"built_in\": 0,\n \"hide\": 0,\n \"uuid\": 1717556327092680000\n}"
},
{
"path": "integrations/AliYun/dashboards/arms-jvm-service.json",
"content": "{\n \"id\": 0,\n \"group_id\": 0,\n \"name\": \"阿里云 ARMS-JVM-SERVICE\",\n \"ident\": \"\",\n \"tags\": \"JVM ARMS\",\n \"create_at\": 0,\n \"create_by\": \"\",\n \"update_at\": 0,\n \"update_by\": \"\",\n \"configs\": {\n \"panels\": [\n {\n \"collapsed\": true,\n \"id\": \"a26c5c3d-7b60-4746-bd1f-ca95581cf2fd\",\n \"layout\": {\n \"h\": 1,\n \"i\": \"a26c5c3d-7b60-4746-bd1f-ca95581cf2fd\",\n \"isResizable\": false,\n \"w\": 24,\n \"x\": 0,\n \"y\": 0\n },\n \"name\": \"Basic Info\",\n \"type\": \"row\"\n },\n {\n \"custom\": {\n \"drawStyle\": \"lines\",\n \"fillOpacity\": 0.3,\n \"gradientMode\": \"opacity\",\n \"lineInterpolation\": \"smooth\",\n \"lineWidth\": 2,\n \"scaleDistribution\": {\n \"type\": \"linear\"\n },\n \"spanNulls\": false,\n \"stack\": \"off\"\n },\n \"datasourceCate\": \"prometheus\",\n \"datasourceValue\": \"${prom}\",\n \"id\": \"2e921e92-069e-46fe-a0ef-d2f37dc22575\",\n \"layout\": {\n \"h\": 6,\n \"i\": \"96c82fd7-ec94-473e-b2e0-ead52ab390fc\",\n \"isResizable\": true,\n \"w\": 8,\n \"x\": 0,\n \"y\": 1\n },\n \"maxPerRow\": 4,\n \"name\": \"Threads Count\",\n \"options\": {\n \"legend\": {\n \"displayMode\": \"hidden\"\n },\n \"standardOptions\": {\n \"decimals\": 1,\n \"util\": \"none\"\n },\n \"thresholds\": {\n \"steps\": [\n {\n \"color\": \"#634CD9\",\n \"type\": \"base\",\n \"value\": null\n }\n ]\n },\n \"tooltip\": {\n \"mode\": \"all\",\n \"sort\": \"desc\"\n }\n },\n \"targets\": [\n {\n \"expr\": \"arms_jvm_threads_count{service=\\\"$service\\\",host=\\\"$host\\\"}\",\n \"legend\": \"State {{state}}\",\n \"refId\": \"A\"\n }\n ],\n \"transformations\": [\n {\n \"id\": \"organize\",\n \"options\": {}\n }\n ],\n \"type\": \"timeseries\",\n \"version\": \"3.0.0\"\n },\n {\n \"custom\": {\n \"drawStyle\": \"lines\",\n \"fillOpacity\": 0.3,\n \"gradientMode\": \"opacity\",\n \"lineInterpolation\": \"smooth\",\n \"lineWidth\": 2,\n \"scaleDistribution\": {\n \"type\": \"linear\"\n },\n \"spanNulls\": false,\n \"stack\": \"off\"\n },\n \"datasourceCate\": \"prometheus\",\n \"datasourceValue\": \"${prom}\",\n \"id\": \"9d8055bd-4c57-4eaa-afc6-b0a727a238f6\",\n \"layout\": {\n \"h\": 6,\n \"i\": \"afbd0af8-6c44-4c15-bd7f-c047ad41d0d7\",\n \"isResizable\": true,\n \"w\": 8,\n \"x\": 8,\n \"y\": 1\n },\n \"maxPerRow\": 4,\n \"name\": \"Mem Committed Bytes\",\n \"options\": {\n \"legend\": {\n \"displayMode\": \"hidden\"\n },\n \"standardOptions\": {\n \"decimals\": 1,\n \"util\": \"bytesSI\"\n },\n \"thresholds\": {\n \"steps\": [\n {\n \"color\": \"#634CD9\",\n \"type\": \"base\",\n \"value\": null\n }\n ]\n },\n \"tooltip\": {\n \"mode\": \"all\",\n \"sort\": \"desc\"\n }\n },\n \"targets\": [\n {\n \"expr\": \"arms_jvm_mem_committed_bytes{service=\\\"$service\\\",host=\\\"$host\\\"}\",\n \"legend\": \"area {{area}}\",\n \"refId\": \"A\"\n }\n ],\n \"transformations\": [\n {\n \"id\": \"organize\",\n \"options\": {}\n }\n ],\n \"type\": \"timeseries\",\n \"version\": \"3.0.0\"\n },\n {\n \"custom\": {\n \"drawStyle\": \"lines\",\n \"fillOpacity\": 0.3,\n \"gradientMode\": \"opacity\",\n \"lineInterpolation\": \"smooth\",\n \"lineWidth\": 2,\n \"scaleDistribution\": {\n \"type\": \"linear\"\n },\n \"spanNulls\": false,\n \"stack\": \"off\"\n },\n \"datasourceCate\": \"prometheus\",\n \"datasourceValue\": \"${prom}\",\n \"id\": \"8092fb90-1b91-4e57-82bf-e170bba9099f\",\n \"layout\": {\n \"h\": 6,\n \"i\": \"84b76aba-c00a-49de-b9f4-1613d2d497af\",\n \"isResizable\": true,\n \"w\": 8,\n \"x\": 16,\n \"y\": 1\n },\n \"maxPerRow\": 4,\n \"name\": \"Mem Init Bytes\",\n \"options\": {\n \"legend\": {\n \"displayMode\": \"hidden\"\n },\n \"standardOptions\": {\n \"decimals\": 1,\n \"util\": \"bytesSI\"\n },\n \"thresholds\": {\n \"steps\": [\n {\n \"color\": \"#634CD9\",\n \"type\": \"base\",\n \"value\": null\n }\n ]\n },\n \"tooltip\": {\n \"mode\": \"all\",\n \"sort\": \"desc\"\n }\n },\n \"targets\": [\n {\n \"expr\": \"arms_jvm_mem_init_bytes{service=\\\"$service\\\",host=\\\"$host\\\"}\",\n \"legend\": \"area: {{area}} id:{{id}}\",\n \"refId\": \"A\"\n }\n ],\n \"transformations\": [\n {\n \"id\": \"organize\",\n \"options\": {}\n }\n ],\n \"type\": \"timeseries\",\n \"version\": \"3.0.0\"\n },\n {\n \"collapsed\": true,\n \"id\": \"705c90e0-e8b6-4f1c-b35c-c8a785009a20\",\n \"layout\": {\n \"h\": 1,\n \"i\": \"705c90e0-e8b6-4f1c-b35c-c8a785009a20\",\n \"isResizable\": false,\n \"w\": 24,\n \"x\": 0,\n \"y\": 7\n },\n \"name\": \"JVM Memory\",\n \"type\": \"row\"\n },\n {\n \"custom\": {\n \"drawStyle\": \"lines\",\n \"fillOpacity\": 0.3,\n \"gradientMode\": \"opacity\",\n \"lineInterpolation\": \"smooth\",\n \"lineWidth\": 2,\n \"scaleDistribution\": {\n \"type\": \"linear\"\n },\n \"spanNulls\": false,\n \"stack\": \"off\"\n },\n \"datasourceCate\": \"prometheus\",\n \"datasourceValue\": \"${prom}\",\n \"id\": \"c7741620-977b-417d-8db0-1c9f7f98d8f8\",\n \"layout\": {\n \"h\": 7,\n \"i\": \"81090d87-c72c-4243-b016-000ccdd8a9e7\",\n \"isResizable\": true,\n \"w\": 12,\n \"x\": 0,\n \"y\": 8\n },\n \"maxPerRow\": 4,\n \"name\": \"JVM Memory(total)\",\n \"options\": {\n \"legend\": {\n \"displayMode\": \"hidden\"\n },\n \"standardOptions\": {\n \"decimals\": 1,\n \"util\": \"bytesIEC\"\n },\n \"thresholds\": {\n \"steps\": [\n {\n \"color\": \"#634CD9\",\n \"type\": \"base\",\n \"value\": null\n }\n ]\n },\n \"tooltip\": {\n \"mode\": \"all\",\n \"sort\": \"desc\"\n }\n },\n \"targets\": [\n {\n \"expr\": \"arms_jvm_mem_used_bytes{service=\\\"$service\\\",host=\\\"$host\\\", area=\\\"total\\\"}\",\n \"legend\": \"Used {{id}}\",\n \"refId\": \"A\"\n },\n {\n \"expr\": \"arms_jvm_mem_max_bytes{service=\\\"$service\\\",host=\\\"$host\\\", area=\\\"total\\\"}\",\n \"legend\": \"Max {{id}}\",\n \"refId\": \"B\"\n }\n ],\n \"transformations\": [\n {\n \"id\": \"organize\",\n \"options\": {}\n }\n ],\n \"type\": \"timeseries\",\n \"version\": \"3.0.0\"\n },\n {\n \"custom\": {\n \"drawStyle\": \"lines\",\n \"fillOpacity\": 0.3,\n \"gradientMode\": \"opacity\",\n \"lineInterpolation\": \"smooth\",\n \"lineWidth\": 2,\n \"scaleDistribution\": {\n \"type\": \"linear\"\n },\n \"spanNulls\": false,\n \"stack\": \"off\"\n },\n \"datasourceCate\": \"prometheus\",\n \"datasourceValue\": \"${prom}\",\n \"id\": \"5455e2f2-f6bb-4888-9d88-240d7e12cce2\",\n \"layout\": {\n \"h\": 7,\n \"i\": \"5455e2f2-f6bb-4888-9d88-240d7e12cce2\",\n \"isResizable\": true,\n \"w\": 12,\n \"x\": 12,\n \"y\": 8\n },\n \"maxPerRow\": 4,\n \"name\": \"JVM Memory(heap)\",\n \"options\": {\n \"legend\": {\n \"displayMode\": \"hidden\"\n },\n \"standardOptions\": {\n \"decimals\": 1,\n \"util\": \"bytesIEC\"\n },\n \"thresholds\": {\n \"steps\": [\n {\n \"color\": \"#634CD9\",\n \"type\": \"base\",\n \"value\": null\n }\n ]\n },\n \"tooltip\": {\n \"mode\": \"all\",\n \"sort\": \"desc\"\n }\n },\n \"targets\": [\n {\n \"expr\": \"arms_jvm_mem_used_bytes{service=\\\"$service\\\",host=\\\"$host\\\", area=\\\"heap\\\"}\",\n \"legend\": \"Used {{id}}\",\n \"refId\": \"A\"\n },\n {\n \"expr\": \"arms_jvm_mem_max_bytes{service=\\\"$service\\\",host=\\\"$host\\\", area=\\\"heap\\\"}\",\n \"legend\": \"Max {{id}}\",\n \"refId\": \"B\"\n }\n ],\n \"transformations\": [\n {\n \"id\": \"organize\",\n \"options\": {}\n }\n ],\n \"type\": \"timeseries\",\n \"version\": \"3.0.0\"\n },\n {\n \"custom\": {\n \"drawStyle\": \"lines\",\n \"fillOpacity\": 0.3,\n \"gradientMode\": \"opacity\",\n \"lineInterpolation\": \"smooth\",\n \"lineWidth\": 2,\n \"scaleDistribution\": {\n \"type\": \"linear\"\n },\n \"spanNulls\": false,\n \"stack\": \"off\"\n },\n \"datasourceCate\": \"prometheus\",\n \"datasourceValue\": \"${prom}\",\n \"id\": \"c268f732-f9c8-4a36-977b-7554f63d84db\",\n \"layout\": {\n \"h\": 7,\n \"i\": \"7826a7a7-d2bf-474e-aec0-359470732007\",\n \"isResizable\": true,\n \"w\": 12,\n \"x\": 0,\n \"y\": 15\n },\n \"maxPerRow\": 4,\n \"name\": \"JVM Memory(noheap)\",\n \"options\": {\n \"legend\": {\n \"displayMode\": \"hidden\"\n },\n \"standardOptions\": {\n \"decimals\": 1,\n \"util\": \"bytesIEC\"\n },\n \"thresholds\": {\n \"steps\": [\n {\n \"color\": \"#634CD9\",\n \"type\": \"base\",\n \"value\": null\n }\n ]\n },\n \"tooltip\": {\n \"mode\": \"all\",\n \"sort\": \"desc\"\n }\n },\n \"targets\": [\n {\n \"expr\": \"arms_jvm_mem_used_bytes{service=\\\"$service\\\",host=\\\"$host\\\", area=\\\"nonheap\\\"}\",\n \"legend\": \"Used {{id}}\",\n \"refId\": \"A\"\n },\n {\n \"expr\": \"arms_jvm_mem_max_bytes{service=\\\"$service\\\",host=\\\"$host\\\", area=\\\"nonheap\\\"}\",\n \"legend\": \"Max {{id}}\",\n \"refId\": \"B\"\n }\n ],\n \"transformations\": [\n {\n \"id\": \"organize\",\n \"options\": {}\n }\n ],\n \"type\": \"timeseries\",\n \"version\": \"3.0.0\"\n },\n {\n \"custom\": {\n \"drawStyle\": \"lines\",\n \"fillOpacity\": 0.3,\n \"gradientMode\": \"opacity\",\n \"lineInterpolation\": \"smooth\",\n \"lineWidth\": 2,\n \"scaleDistribution\": {\n \"type\": \"linear\"\n },\n \"spanNulls\": false,\n \"stack\": \"off\"\n },\n \"datasourceCate\": \"prometheus\",\n \"datasourceValue\": \"${prom}\",\n \"id\": \"66fc2b8f-9d66-4421-9acb-fe8af891ffe1\",\n \"layout\": {\n \"h\": 7,\n \"i\": \"c01f392d-f225-4615-b49a-eee689295c53\",\n \"isResizable\": true,\n \"w\": 12,\n \"x\": 12,\n \"y\": 15\n },\n \"maxPerRow\": 4,\n \"name\": \"JVM Buffer Pool\",\n \"options\": {\n \"legend\": {\n \"displayMode\": \"hidden\"\n },\n \"standardOptions\": {\n \"decimals\": 1,\n \"util\": \"none\"\n },\n \"thresholds\": {\n \"steps\": [\n {\n \"color\": \"#634CD9\",\n \"type\": \"base\",\n \"value\": null\n }\n ]\n },\n \"tooltip\": {\n \"mode\": \"all\",\n \"sort\": \"desc\"\n }\n },\n \"targets\": [\n {\n \"expr\": \"arms_jvm_buffer_pool_count{service=\\\"$service\\\",host=\\\"$host\\\"}\",\n \"legend\": \"id {{id}}\",\n \"refId\": \"A\"\n }\n ],\n \"transformations\": [\n {\n \"id\": \"organize\",\n \"options\": {}\n }\n ],\n \"type\": \"timeseries\",\n \"version\": \"3.0.0\"\n },\n {\n \"custom\": {\n \"drawStyle\": \"lines\",\n \"fillOpacity\": 0.3,\n \"gradientMode\": \"opacity\",\n \"lineInterpolation\": \"smooth\",\n \"lineWidth\": 2,\n \"scaleDistribution\": {\n \"type\": \"linear\"\n },\n \"spanNulls\": false,\n \"stack\": \"off\"\n },\n \"datasourceCate\": \"prometheus\",\n \"datasourceValue\": \"${prom}\",\n \"id\": \"ee48523f-948d-4828-a606-309ce683e694\",\n \"layout\": {\n \"h\": 7,\n \"i\": \"ca327ef3-1b8a-4b9a-9b42-62fd41aefb31\",\n \"isResizable\": true,\n \"w\": 12,\n \"x\": 0,\n \"y\": 22\n },\n \"maxPerRow\": 4,\n \"name\": \"JVM Buffer Pool Total Bytes\",\n \"options\": {\n \"legend\": {\n \"displayMode\": \"hidden\"\n },\n \"standardOptions\": {\n \"decimals\": 1,\n \"util\": \"bytesIEC\"\n },\n \"thresholds\": {\n \"steps\": [\n {\n \"color\": \"#634CD9\",\n \"type\": \"base\",\n \"value\": null\n }\n ]\n },\n \"tooltip\": {\n \"mode\": \"all\",\n \"sort\": \"desc\"\n }\n },\n \"targets\": [\n {\n \"expr\": \"arms_jvm_buffer_pool_total_bytes{service=\\\"$service\\\",host=\\\"$host\\\"}\",\n \"legend\": \"id {{id}}\",\n \"refId\": \"A\"\n }\n ],\n \"transformations\": [\n {\n \"id\": \"organize\",\n \"options\": {}\n }\n ],\n \"type\": \"timeseries\",\n \"version\": \"3.0.0\"\n },\n {\n \"custom\": {\n \"drawStyle\": \"lines\",\n \"fillOpacity\": 0.3,\n \"gradientMode\": \"opacity\",\n \"lineInterpolation\": \"smooth\",\n \"lineWidth\": 2,\n \"scaleDistribution\": {\n \"type\": \"linear\"\n },\n \"spanNulls\": false,\n \"stack\": \"off\"\n },\n \"datasourceCate\": \"prometheus\",\n \"datasourceValue\": \"${prom}\",\n \"id\": \"22b24a2d-9976-47d9-ad4d-bef92880a53e\",\n \"layout\": {\n \"h\": 7,\n \"i\": \"db4b7e4d-74b2-44fc-aca8-c0cb2635daad\",\n \"isResizable\": true,\n \"w\": 12,\n \"x\": 12,\n \"y\": 22\n },\n \"maxPerRow\": 4,\n \"name\": \"JVM Buffer Pool Used Bytes\",\n \"options\": {\n \"legend\": {\n \"displayMode\": \"hidden\"\n },\n \"standardOptions\": {\n \"decimals\": 1,\n \"util\": \"bytesIEC\"\n },\n \"thresholds\": {\n \"steps\": [\n {\n \"color\": \"#634CD9\",\n \"type\": \"base\",\n \"value\": null\n }\n ]\n },\n \"tooltip\": {\n \"mode\": \"all\",\n \"sort\": \"desc\"\n }\n },\n \"targets\": [\n {\n \"expr\": \"arms_jvm_buffer_pool_used_bytes{service=\\\"$service\\\",host=\\\"$host\\\"}\",\n \"legend\": \"id {{id}}\",\n \"refId\": \"A\"\n }\n ],\n \"transformations\": [\n {\n \"id\": \"organize\",\n \"options\": {}\n }\n ],\n \"type\": \"timeseries\",\n \"version\": \"3.0.0\"\n },\n {\n \"collapsed\": true,\n \"id\": \"0aaf3516-4938-41e3-b7cb-323de6de75d9\",\n \"layout\": {\n \"h\": 1,\n \"i\": \"0aaf3516-4938-41e3-b7cb-323de6de75d9\",\n \"isResizable\": false,\n \"w\": 24,\n \"x\": 0,\n \"y\": 29\n },\n \"name\": \"GC\",\n \"type\": \"row\"\n },\n {\n \"custom\": {\n \"drawStyle\": \"lines\",\n \"fillOpacity\": 0.3,\n \"gradientMode\": \"opacity\",\n \"lineInterpolation\": \"smooth\",\n \"lineWidth\": 2,\n \"scaleDistribution\": {\n \"type\": \"linear\"\n },\n \"spanNulls\": false,\n \"stack\": \"off\"\n },\n \"datasourceCate\": \"prometheus\",\n \"datasourceValue\": \"${prom}\",\n \"id\": \"5303bda0-47c2-4aca-bb12-1da512500f4a\",\n \"layout\": {\n \"h\": 6,\n \"i\": \"5303bda0-47c2-4aca-bb12-1da512500f4a\",\n \"isResizable\": true,\n \"w\": 12,\n \"x\": 0,\n \"y\": 30\n },\n \"maxPerRow\": 4,\n \"name\": \"过去一分钟GC耗时(秒)\",\n \"options\": {\n \"legend\": {\n \"displayMode\": \"hidden\"\n },\n \"standardOptions\": {\n \"util\": \"none\"\n },\n \"thresholds\": {\n \"steps\": [\n {\n \"color\": \"#634CD9\",\n \"type\": \"base\",\n \"value\": null\n }\n ]\n },\n \"tooltip\": {\n \"mode\": \"all\",\n \"sort\": \"desc\"\n }\n },\n \"targets\": [\n {\n \"expr\": \"increase(arms_jvm_gc_seconds_total{service=\\\"$service\\\",host=\\\"$host\\\"}[1m])\",\n \"refId\": \"A\"\n }\n ],\n \"transformations\": [\n {\n \"id\": \"organize\",\n \"options\": {}\n }\n ],\n \"type\": \"timeseries\",\n \"version\": \"3.0.0\"\n },\n {\n \"custom\": {\n \"drawStyle\": \"lines\",\n \"fillOpacity\": 0.3,\n \"gradientMode\": \"opacity\",\n \"lineInterpolation\": \"smooth\",\n \"lineWidth\": 2,\n \"scaleDistribution\": {\n \"type\": \"linear\"\n },\n \"spanNulls\": false,\n \"stack\": \"off\"\n },\n \"datasourceCate\": \"prometheus\",\n \"datasourceValue\": \"${prom}\",\n \"id\": \"cf410459-b5df-4aca-a410-ecda091d6097\",\n \"layout\": {\n \"h\": 6,\n \"i\": \"cf410459-b5df-4aca-a410-ecda091d6097\",\n \"isResizable\": true,\n \"w\": 12,\n \"x\": 12,\n \"y\": 30\n },\n \"maxPerRow\": 4,\n \"name\": \"过去一分钟GC次数\",\n \"options\": {\n \"legend\": {\n \"displayMode\": \"hidden\"\n },\n \"standardOptions\": {\n \"util\": \"none\"\n },\n \"thresholds\": {\n \"steps\": [\n {\n \"color\": \"#634CD9\",\n \"type\": \"base\",\n \"value\": null\n }\n ]\n },\n \"tooltip\": {\n \"mode\": \"all\",\n \"sort\": \"desc\"\n }\n },\n \"targets\": [\n {\n \"expr\": \"increase(arms_jvm_gc_total{service=\\\"$service\\\",host=\\\"$host\\\"}[1m])\",\n \"legend\": \"\",\n \"refId\": \"A\"\n }\n ],\n \"transformations\": [\n {\n \"id\": \"organize\",\n \"options\": {}\n }\n ],\n \"type\": \"timeseries\",\n \"version\": \"3.0.0\"\n }\n ],\n \"var\": [\n {\n \"definition\": \"prometheus\",\n \"name\": \"prom\",\n \"type\": \"datasource\"\n },\n {\n \"datasource\": {\n \"cate\": \"prometheus\",\n \"value\": \"${prom}\"\n },\n \"definition\": \"label_values(arms_jvm_buffer_pool_count, service)\",\n \"label\": \"service\",\n \"name\": \"service\",\n \"type\": \"query\"\n },\n {\n \"datasource\": {\n \"cate\": \"prometheus\",\n \"value\": \"${prom}\"\n },\n \"definition\": \"label_values(arms_jvm_buffer_pool_count{service=\\\"$service\\\"}, host)\",\n \"label\": \"host\",\n \"name\": \"host\",\n \"type\": \"query\"\n }\n ],\n \"version\": \"3.0.0\"\n },\n \"public\": 0,\n \"public_cate\": 0,\n \"bgids\": null,\n \"built_in\": 0,\n \"hide\": 0,\n \"uuid\": 1717556327094704000\n}"
},
{
"path": "integrations/AliYun/dashboards/arms-machine.json",
"content": "{\n \"id\": 0,\n \"group_id\": 0,\n \"name\": \"ARMS-Machine\",\n \"ident\": \"\",\n \"tags\": \"ARMS\",\n \"create_at\": 0,\n \"create_by\": \"\",\n \"update_at\": 0,\n \"update_by\": \"\",\n \"configs\": {\n \"links\": [],\n \"panels\": [\n {\n \"collapsed\": true,\n \"id\": \"8865eacb-f0f6-45fa-912a-8494907c48d6\",\n \"layout\": {\n \"h\": 1,\n \"i\": \"8865eacb-f0f6-45fa-912a-8494907c48d6\",\n \"w\": 24,\n \"x\": 0,\n \"y\": 0\n },\n \"name\": \"系统信息\",\n \"panels\": [],\n \"type\": \"row\",\n \"version\": \"3.0.0\"\n },\n {\n \"custom\": {\n \"drawStyle\": \"lines\",\n \"fillOpacity\": 0.3,\n \"gradientMode\": \"opacity\",\n \"lineInterpolation\": \"linear\",\n \"lineWidth\": 2,\n \"stack\": \"off\",\n \"version\": \"3.0.0\"\n },\n \"datasourceCate\": \"prometheus\",\n \"datasourceValue\": \"${datasource}\",\n \"id\": \"7fd3186b-6190-44c7-ad05-1c81993f27c9\",\n \"layout\": {\n \"h\": 9,\n \"i\": \"7fd3186b-6190-44c7-ad05-1c81993f27c9\",\n \"w\": 24,\n \"x\": 0,\n \"y\": 1\n },\n \"links\": [],\n \"maxPerRow\": 4,\n \"name\": \"CPU\",\n \"options\": {\n \"legend\": {\n \"displayMode\": \"hidden\"\n },\n \"thresholds\": {\n \"steps\": [\n {\n \"color\": \"#634CD9\",\n \"type\": \"base\",\n \"value\": null\n }\n ]\n },\n \"tooltip\": {\n \"mode\": \"all\",\n \"sort\": \"none\"\n }\n },\n \"targets\": [\n {\n \"expr\": \"max(arms_system_cpu_system{host=~\\\"$host\\\"})\",\n \"legend\": \"系统CPU使用率\",\n \"refId\": \"A\"\n },\n {\n \"expr\": \"max(arms_system_cpu_io_wait{host=~\\\"$host\\\"})\",\n \"legend\": \"等待IO完成的CPU使用率\",\n \"refId\": \"B\"\n },\n {\n \"expr\": \"max(arms_system_cpu_user{host=~\\\"$host\\\"})\",\n \"legend\": \"用户CPU使用率\",\n \"refId\": \"C\"\n },\n {\n \"expr\": \"max(arms_system_cpu_system{host=\\\"$host\\\"})+max(arms_system_cpu_io_wait{host=~\\\"$host\\\"})+max(arms_system_cpu_user{host=\\\"$host\\\"})\",\n \"legend\": \"总和\",\n \"refId\": \"D\"\n }\n ],\n \"type\": \"timeseries\",\n \"version\": \"3.0.0\"\n },\n {\n \"custom\": {\n \"drawStyle\": \"lines\",\n \"fillOpacity\": 0.3,\n \"gradientMode\": \"opacity\",\n \"lineInterpolation\": \"linear\",\n \"lineWidth\": 2,\n \"stack\": \"off\",\n \"version\": \"3.0.0\"\n },\n \"datasourceCate\": \"prometheus\",\n \"datasourceValue\": \"${datasource}\",\n \"id\": \"60fc127b-b565-40de-9346-860062d5ea58\",\n \"layout\": {\n \"h\": 9,\n \"i\": \"60fc127b-b565-40de-9346-860062d5ea58\",\n \"w\": 24,\n \"x\": 0,\n \"y\": 10\n },\n \"links\": [],\n \"maxPerRow\": 4,\n \"name\": \"内存\",\n \"options\": {\n \"legend\": {\n \"displayMode\": \"hidden\"\n },\n \"thresholds\": {\n \"steps\": [\n {\n \"color\": \"#634CD9\",\n \"type\": \"base\",\n \"value\": null\n }\n ]\n },\n \"tooltip\": {\n \"mode\": \"all\",\n \"sort\": \"none\"\n }\n },\n \"targets\": [\n {\n \"expr\": \"max(arms_system_mem_used_bytes{host=\\\"$host\\\"})\",\n \"legend\": \"系统的已经使用的内存\",\n \"refId\": \"A\"\n },\n {\n \"expr\": \"max(arms_system_mem_total_bytes{host=\\\"$host\\\"})\",\n \"legend\": \"总和\",\n \"refId\": \"C\"\n },\n {\n \"expr\": \"max(arms_system_mem_buffers_bytes{host=\\\"$host\\\"})\",\n \"legend\": \"系统的BufferCache的内存数\",\n \"refId\": \"D\"\n },\n {\n \"expr\": \"max(arms_system_mem_cached_bytes{host=\\\"$host\\\"})\",\n \"legend\": \"系统的PageCache里的内存数\",\n \"refId\": \"E\"\n },\n {\n \"expr\": \"max(arms_system_mem_free_bytes{host=\\\"$host\\\"})\",\n \"legend\": \"系统的空闲内存\",\n \"refId\": \"B\"\n }\n ],\n \"type\": \"timeseries\",\n \"version\": \"3.0.0\"\n },\n {\n \"custom\": {\n \"drawStyle\": \"lines\",\n \"fillOpacity\": 0.3,\n \"gradientMode\": \"opacity\",\n \"lineInterpolation\": \"linear\",\n \"lineWidth\": 2,\n \"stack\": \"off\",\n \"version\": \"3.0.0\"\n },\n \"datasourceCate\": \"prometheus\",\n \"datasourceValue\": \"${datasource}\",\n \"id\": \"5229fd8c-3e26-44e6-a091-145c3caef46f\",\n \"layout\": {\n \"h\": 9,\n \"i\": \"5229fd8c-3e26-44e6-a091-145c3caef46f\",\n \"w\": 24,\n \"x\": 0,\n \"y\": 19\n },\n \"links\": [],\n \"maxPerRow\": 4,\n \"name\": \"负载\",\n \"options\": {\n \"legend\": {\n \"displayMode\": \"hidden\"\n },\n \"thresholds\": {\n \"steps\": [\n {\n \"color\": \"#634CD9\",\n \"type\": \"base\",\n \"value\": null\n }\n ]\n },\n \"tooltip\": {\n \"mode\": \"all\",\n \"sort\": \"none\"\n }\n },\n \"targets\": [\n {\n \"expr\": \"max(arms_system_load{host=\\\"$host\\\"})\",\n \"legend\": \"负载\",\n \"refId\": \"A\"\n }\n ],\n \"type\": \"timeseries\",\n \"version\": \"3.0.0\"\n },\n {\n \"custom\": {\n \"drawStyle\": \"lines\",\n \"fillOpacity\": 0.3,\n \"gradientMode\": \"opacity\",\n \"lineInterpolation\": \"linear\",\n \"lineWidth\": 2,\n \"stack\": \"off\",\n \"version\": \"3.0.0\"\n },\n \"datasourceCate\": \"prometheus\",\n \"datasourceValue\": \"${datasource}\",\n \"id\": \"60872e48-5445-4ee1-b0a2-19be72b6f737\",\n \"layout\": {\n \"h\": 9,\n \"i\": \"60872e48-5445-4ee1-b0a2-19be72b6f737\",\n \"w\": 24,\n \"x\": 0,\n \"y\": 28\n },\n \"links\": [],\n \"maxPerRow\": 4,\n \"name\": \"磁盘\",\n \"options\": {\n \"legend\": {\n \"displayMode\": \"hidden\"\n },\n \"thresholds\": {\n \"steps\": [\n {\n \"color\": \"#634CD9\",\n \"type\": \"base\",\n \"value\": null\n }\n ]\n },\n \"tooltip\": {\n \"mode\": \"all\",\n \"sort\": \"none\"\n }\n },\n \"targets\": [\n {\n \"expr\": \"max(arms_system_disk_free_bytes{host=\\\"$host\\\"})\",\n \"legend\": \"可用磁盘容量\",\n \"refId\": \"A\"\n },\n {\n \"expr\": \"max(arms_system_disk_total_bytes{host=\\\"$host\\\"})\",\n \"legend\": \"总磁盘容量\",\n \"refId\": \"B\"\n },\n {\n \"expr\": \"max(arms_system_disk_total_bytes{host=~\\\"$host\\\"})-max(arms_system_disk_free_bytes{host=~\\\"$host\\\"})\",\n \"legend\": \"已使用磁盘容量\",\n \"refId\": \"C\"\n }\n ],\n \"type\": \"timeseries\",\n \"version\": \"3.0.0\"\n },\n {\n \"custom\": {\n \"drawStyle\": \"lines\",\n \"fillOpacity\": 0.3,\n \"gradientMode\": \"opacity\",\n \"lineInterpolation\": \"linear\",\n \"lineWidth\": 2,\n \"stack\": \"off\",\n \"version\": \"3.0.0\"\n },\n \"datasourceCate\": \"prometheus\",\n \"datasourceValue\": \"${datasource}\",\n \"id\": \"517cc410-c4a0-4923-a902-3c102f06cd0c\",\n \"layout\": {\n \"h\": 9,\n \"i\": \"517cc410-c4a0-4923-a902-3c102f06cd0c\",\n \"w\": 24,\n \"x\": 0,\n \"y\": 37\n },\n \"links\": [],\n \"maxPerRow\": 4,\n \"name\": \"网络流量(Byte)/每分钟\",\n \"options\": {\n \"legend\": {\n \"displayMode\": \"hidden\"\n },\n \"thresholds\": {\n \"steps\": [\n {\n \"color\": \"#634CD9\",\n \"type\": \"base\",\n \"value\": null\n }\n ]\n },\n \"tooltip\": {\n \"mode\": \"all\",\n \"sort\": \"none\"\n }\n },\n \"targets\": [\n {\n \"expr\": \"max(max_over_time(arms_system_net_in_bytes{host=~\\\"$host\\\"}[1m]))\",\n \"legend\": \"网络接收的字节数\",\n \"refId\": \"A\"\n },\n {\n \"expr\": \"max(max_over_time(arms_system_net_out_bytes{host=~\\\"$host\\\"}[1m]))\",\n \"legend\": \"网络发送的字节数\",\n \"refId\": \"B\"\n }\n ],\n \"type\": \"timeseries\",\n \"version\": \"3.0.0\"\n },\n {\n \"custom\": {\n \"drawStyle\": \"lines\",\n \"fillOpacity\": 0.3,\n \"gradientMode\": \"opacity\",\n \"lineInterpolation\": \"linear\",\n \"lineWidth\": 2,\n \"stack\": \"off\",\n \"version\": \"3.0.0\"\n },\n \"datasourceCate\": \"prometheus\",\n \"datasourceValue\": \"${datasource}\",\n \"id\": \"752d89ce-1136-4ddf-b4b9-1a232a8840db\",\n \"layout\": {\n \"h\": 9,\n \"i\": \"752d89ce-1136-4ddf-b4b9-1a232a8840db\",\n \"w\": 24,\n \"x\": 0,\n \"y\": 46\n },\n \"links\": [],\n \"maxPerRow\": 4,\n \"name\": \"网络数据包(个)/每分钟\",\n \"options\": {\n \"legend\": {\n \"displayMode\": \"hidden\"\n },\n \"thresholds\": {\n \"steps\": [\n {\n \"color\": \"#634CD9\",\n \"type\": \"base\",\n \"value\": null\n }\n ]\n },\n \"tooltip\": {\n \"mode\": \"all\",\n \"sort\": \"none\"\n }\n },\n \"targets\": [\n {\n \"expr\": \"max(max_over_time(arms_system_net_in_packets{host=~\\\"$host\\\"}[1m]))\",\n \"legend\": \"网络接收的报文数\",\n \"refId\": \"A\"\n },\n {\n \"expr\": \"max(max_over_time(arms_system_net_out_packets{host=~\\\"$host\\\"}[1m]))\",\n \"legend\": \"网络发送的报文数\",\n \"refId\": \"C\"\n },\n {\n \"expr\": \"max(max_over_time(arms_system_net_in_errs{host=~\\\"$host\\\"}[1m]))\",\n \"legend\": \"网络接收的错误数\",\n \"refId\": \"D\"\n },\n {\n \"expr\": \"max(max_over_time(arms_system_net_out_errs{host=~\\\"$host\\\"}[1m]))\",\n \"legend\": \"网络丢弃报文数\",\n \"refId\": \"E\"\n }\n ],\n \"type\": \"timeseries\",\n \"version\": \"3.0.0\"\n }\n ],\n \"var\": [\n {\n \"definition\": \"prometheus\",\n \"name\": \"datasource\",\n \"type\": \"datasource\"\n },\n {\n \"allOption\": false,\n \"datasource\": {\n \"cate\": \"prometheus\",\n \"value\": \"${datasource}\"\n },\n \"definition\": \"label_values(arms_system_cpu_idle,service)\",\n \"multi\": false,\n \"name\": \"service\",\n \"reg\": \"\",\n \"type\": \"query\"\n },\n {\n \"allOption\": false,\n \"allValue\": \"*\",\n \"datasource\": {\n \"cate\": \"prometheus\",\n \"value\": \"${datasource}\"\n },\n \"definition\": \"label_values(arms_system_cpu_idle{service=\\\"$service\\\"},host)\",\n \"multi\": false,\n \"name\": \"host\",\n \"reg\": \"\",\n \"type\": \"query\"\n }\n ],\n \"version\": \"3.0.0\"\n },\n \"public\": 0,\n \"public_cate\": 0,\n \"bgids\": null,\n \"built_in\": 0,\n \"hide\": 0,\n \"uuid\": 1717556327098444000\n}"
},
{
"path": "integrations/AliYun/dashboards/arms_jvm.json",
"content": "{\n \"id\": 0,\n \"group_id\": 0,\n \"name\": \"阿里云 ARMS-JVM\",\n \"ident\": \"\",\n \"tags\": \"JVM ARMS\",\n \"create_at\": 0,\n \"create_by\": \"\",\n \"update_at\": 0,\n \"update_by\": \"\",\n \"configs\": {\n \"panels\": [\n {\n \"collapsed\": true,\n \"id\": \"a26c5c3d-7b60-4746-bd1f-ca95581cf2fd\",\n \"layout\": {\n \"h\": 1,\n \"i\": \"a26c5c3d-7b60-4746-bd1f-ca95581cf2fd\",\n \"isResizable\": false,\n \"w\": 24,\n \"x\": 0,\n \"y\": 0\n },\n \"name\": \"Basic Info\",\n \"type\": \"row\"\n },\n {\n \"custom\": {\n \"drawStyle\": \"lines\",\n \"fillOpacity\": 0.3,\n \"gradientMode\": \"opacity\",\n \"lineInterpolation\": \"smooth\",\n \"lineWidth\": 2,\n \"scaleDistribution\": {\n \"type\": \"linear\"\n },\n \"spanNulls\": false,\n \"stack\": \"off\"\n },\n \"datasourceCate\": \"prometheus\",\n \"datasourceValue\": \"${prom}\",\n \"id\": \"2e921e92-069e-46fe-a0ef-d2f37dc22575\",\n \"layout\": {\n \"h\": 6,\n \"i\": \"96c82fd7-ec94-473e-b2e0-ead52ab390fc\",\n \"isResizable\": true,\n \"w\": 8,\n \"x\": 0,\n \"y\": 1\n },\n \"maxPerRow\": 4,\n \"name\": \"Threads Count\",\n \"options\": {\n \"legend\": {\n \"displayMode\": \"hidden\"\n },\n \"standardOptions\": {\n \"decimals\": 1,\n \"util\": \"none\"\n },\n \"thresholds\": {\n \"steps\": [\n {\n \"color\": \"#634CD9\",\n \"type\": \"base\",\n \"value\": null\n }\n ]\n },\n \"tooltip\": {\n \"mode\": \"all\",\n \"sort\": \"desc\"\n }\n },\n \"targets\": [\n {\n \"expr\": \"arms_jvm_threads_count{app=\\\"$app\\\",host=\\\"$host\\\"}\",\n \"legend\": \"State {{state}}\",\n \"refId\": \"A\"\n }\n ],\n \"transformations\": [\n {\n \"id\": \"organize\",\n \"options\": {}\n }\n ],\n \"type\": \"timeseries\",\n \"version\": \"3.0.0\"\n },\n {\n \"custom\": {\n \"drawStyle\": \"lines\",\n \"fillOpacity\": 0.3,\n \"gradientMode\": \"opacity\",\n \"lineInterpolation\": \"smooth\",\n \"lineWidth\": 2,\n \"scaleDistribution\": {\n \"type\": \"linear\"\n },\n \"spanNulls\": false,\n \"stack\": \"off\"\n },\n \"datasourceCate\": \"prometheus\",\n \"datasourceValue\": \"${prom}\",\n \"id\": \"9d8055bd-4c57-4eaa-afc6-b0a727a238f6\",\n \"layout\": {\n \"h\": 6,\n \"i\": \"afbd0af8-6c44-4c15-bd7f-c047ad41d0d7\",\n \"isResizable\": true,\n \"w\": 8,\n \"x\": 8,\n \"y\": 1\n },\n \"maxPerRow\": 4,\n \"name\": \"Mem Committed Bytes\",\n \"options\": {\n \"legend\": {\n \"displayMode\": \"hidden\"\n },\n \"standardOptions\": {\n \"decimals\": 1,\n \"util\": \"bytesSI\"\n },\n \"thresholds\": {\n \"steps\": [\n {\n \"color\": \"#634CD9\",\n \"type\": \"base\",\n \"value\": null\n }\n ]\n },\n \"tooltip\": {\n \"mode\": \"all\",\n \"sort\": \"desc\"\n }\n },\n \"targets\": [\n {\n \"expr\": \"arms_jvm_mem_committed_bytes{app=\\\"$app\\\",host=\\\"$host\\\"}\",\n \"legend\": \"area {{area}}\",\n \"refId\": \"A\"\n }\n ],\n \"transformations\": [\n {\n \"id\": \"organize\",\n \"options\": {}\n }\n ],\n \"type\": \"timeseries\",\n \"version\": \"3.0.0\"\n },\n {\n \"custom\": {\n \"drawStyle\": \"lines\",\n \"fillOpacity\": 0.3,\n \"gradientMode\": \"opacity\",\n \"lineInterpolation\": \"smooth\",\n \"lineWidth\": 2,\n \"scaleDistribution\": {\n \"type\": \"linear\"\n },\n \"spanNulls\": false,\n \"stack\": \"off\"\n },\n \"datasourceCate\": \"prometheus\",\n \"datasourceValue\": \"${prom}\",\n \"id\": \"8092fb90-1b91-4e57-82bf-e170bba9099f\",\n \"layout\": {\n \"h\": 6,\n \"i\": \"84b76aba-c00a-49de-b9f4-1613d2d497af\",\n \"isResizable\": true,\n \"w\": 8,\n \"x\": 16,\n \"y\": 1\n },\n \"maxPerRow\": 4,\n \"name\": \"Mem Init Bytes\",\n \"options\": {\n \"legend\": {\n \"displayMode\": \"hidden\"\n },\n \"standardOptions\": {\n \"decimals\": 1,\n \"util\": \"bytesSI\"\n },\n \"thresholds\": {\n \"steps\": [\n {\n \"color\": \"#634CD9\",\n \"type\": \"base\",\n \"value\": null\n }\n ]\n },\n \"tooltip\": {\n \"mode\": \"all\",\n \"sort\": \"desc\"\n }\n },\n \"targets\": [\n {\n \"expr\": \"arms_jvm_mem_init_bytes{app=\\\"$app\\\",host=\\\"$host\\\"}\",\n \"legend\": \"area: {{area}} id:{{id}}\",\n \"refId\": \"A\"\n }\n ],\n \"transformations\": [\n {\n \"id\": \"organize\",\n \"options\": {}\n }\n ],\n \"type\": \"timeseries\",\n \"version\": \"3.0.0\"\n },\n {\n \"collapsed\": true,\n \"id\": \"705c90e0-e8b6-4f1c-b35c-c8a785009a20\",\n \"layout\": {\n \"h\": 1,\n \"i\": \"705c90e0-e8b6-4f1c-b35c-c8a785009a20\",\n \"isResizable\": false,\n \"w\": 24,\n \"x\": 0,\n \"y\": 7\n },\n \"name\": \"JVM Memory\",\n \"type\": \"row\"\n },\n {\n \"custom\": {\n \"drawStyle\": \"lines\",\n \"fillOpacity\": 0.3,\n \"gradientMode\": \"opacity\",\n \"lineInterpolation\": \"smooth\",\n \"lineWidth\": 2,\n \"scaleDistribution\": {\n \"type\": \"linear\"\n },\n \"spanNulls\": false,\n \"stack\": \"off\"\n },\n \"datasourceCate\": \"prometheus\",\n \"datasourceValue\": \"${prom}\",\n \"id\": \"c7741620-977b-417d-8db0-1c9f7f98d8f8\",\n \"layout\": {\n \"h\": 7,\n \"i\": \"81090d87-c72c-4243-b016-000ccdd8a9e7\",\n \"isResizable\": true,\n \"w\": 12,\n \"x\": 0,\n \"y\": 8\n },\n \"maxPerRow\": 4,\n \"name\": \"JVM Memory(total)\",\n \"options\": {\n \"legend\": {\n \"displayMode\": \"hidden\"\n },\n \"standardOptions\": {\n \"decimals\": 1,\n \"util\": \"bytesIEC\"\n },\n \"thresholds\": {\n \"steps\": [\n {\n \"color\": \"#634CD9\",\n \"type\": \"base\",\n \"value\": null\n }\n ]\n },\n \"tooltip\": {\n \"mode\": \"all\",\n \"sort\": \"desc\"\n }\n },\n \"targets\": [\n {\n \"expr\": \"arms_jvm_mem_used_bytes{app=\\\"$app\\\",host=\\\"$host\\\", area=\\\"total\\\"}\",\n \"legend\": \"Used {{id}}\",\n \"refId\": \"A\"\n },\n {\n \"expr\": \"arms_jvm_mem_max_bytes{app=\\\"$app\\\",host=\\\"$host\\\", area=\\\"total\\\"}\",\n \"legend\": \"Max {{id}}\",\n \"refId\": \"B\"\n }\n ],\n \"transformations\": [\n {\n \"id\": \"organize\",\n \"options\": {}\n }\n ],\n \"type\": \"timeseries\",\n \"version\": \"3.0.0\"\n },\n {\n \"custom\": {\n \"drawStyle\": \"lines\",\n \"fillOpacity\": 0.3,\n \"gradientMode\": \"opacity\",\n \"lineInterpolation\": \"smooth\",\n \"lineWidth\": 2,\n \"scaleDistribution\": {\n \"type\": \"linear\"\n },\n \"spanNulls\": false,\n \"stack\": \"off\"\n },\n \"datasourceCate\": \"prometheus\",\n \"datasourceValue\": \"${prom}\",\n \"id\": \"5455e2f2-f6bb-4888-9d88-240d7e12cce2\",\n \"layout\": {\n \"h\": 7,\n \"i\": \"5455e2f2-f6bb-4888-9d88-240d7e12cce2\",\n \"isResizable\": true,\n \"w\": 12,\n \"x\": 12,\n \"y\": 8\n },\n \"maxPerRow\": 4,\n \"name\": \"JVM Memory(heap)\",\n \"options\": {\n \"legend\": {\n \"displayMode\": \"hidden\"\n },\n \"standardOptions\": {\n \"decimals\": 1,\n \"util\": \"bytesIEC\"\n },\n \"thresholds\": {\n \"steps\": [\n {\n \"color\": \"#634CD9\",\n \"type\": \"base\",\n \"value\": null\n }\n ]\n },\n \"tooltip\": {\n \"mode\": \"all\",\n \"sort\": \"desc\"\n }\n },\n \"targets\": [\n {\n \"expr\": \"arms_jvm_mem_used_bytes{app=\\\"$app\\\",host=\\\"$host\\\", area=\\\"heap\\\"}\",\n \"legend\": \"Used {{id}}\",\n \"refId\": \"A\"\n },\n {\n \"expr\": \"arms_jvm_mem_max_bytes{app=\\\"$app\\\",host=\\\"$host\\\", area=\\\"heap\\\"}\",\n \"legend\": \"Max {{id}}\",\n \"refId\": \"B\"\n }\n ],\n \"transformations\": [\n {\n \"id\": \"organize\",\n \"options\": {}\n }\n ],\n \"type\": \"timeseries\",\n \"version\": \"3.0.0\"\n },\n {\n \"custom\": {\n \"drawStyle\": \"lines\",\n \"fillOpacity\": 0.3,\n \"gradientMode\": \"opacity\",\n \"lineInterpolation\": \"smooth\",\n \"lineWidth\": 2,\n \"scaleDistribution\": {\n \"type\": \"linear\"\n },\n \"spanNulls\": false,\n \"stack\": \"off\"\n },\n \"datasourceCate\": \"prometheus\",\n \"datasourceValue\": \"${prom}\",\n \"id\": \"c268f732-f9c8-4a36-977b-7554f63d84db\",\n \"layout\": {\n \"h\": 7,\n \"i\": \"7826a7a7-d2bf-474e-aec0-359470732007\",\n \"isResizable\": true,\n \"w\": 12,\n \"x\": 0,\n \"y\": 15\n },\n \"maxPerRow\": 4,\n \"name\": \"JVM Memory(noheap)\",\n \"options\": {\n \"legend\": {\n \"displayMode\": \"hidden\"\n },\n \"standardOptions\": {\n \"decimals\": 1,\n \"util\": \"bytesIEC\"\n },\n \"thresholds\": {\n \"steps\": [\n {\n \"color\": \"#634CD9\",\n \"type\": \"base\",\n \"value\": null\n }\n ]\n },\n \"tooltip\": {\n \"mode\": \"all\",\n \"sort\": \"desc\"\n }\n },\n \"targets\": [\n {\n \"expr\": \"arms_jvm_mem_used_bytes{app=\\\"$app\\\",host=\\\"$host\\\", area=\\\"nonheap\\\"}\",\n \"legend\": \"Used {{id}}\",\n \"refId\": \"A\"\n },\n {\n \"expr\": \"arms_jvm_mem_max_bytes{app=\\\"$app\\\",host=\\\"$host\\\", area=\\\"nonheap\\\"}\",\n \"legend\": \"Max {{id}}\",\n \"refId\": \"B\"\n }\n ],\n \"transformations\": [\n {\n \"id\": \"organize\",\n \"options\": {}\n }\n ],\n \"type\": \"timeseries\",\n \"version\": \"3.0.0\"\n },\n {\n \"custom\": {\n \"drawStyle\": \"lines\",\n \"fillOpacity\": 0.3,\n \"gradientMode\": \"opacity\",\n \"lineInterpolation\": \"smooth\",\n \"lineWidth\": 2,\n \"scaleDistribution\": {\n \"type\": \"linear\"\n },\n \"spanNulls\": false,\n \"stack\": \"off\"\n },\n \"datasourceCate\": \"prometheus\",\n \"datasourceValue\": \"${prom}\",\n \"id\": \"66fc2b8f-9d66-4421-9acb-fe8af891ffe1\",\n \"layout\": {\n \"h\": 7,\n \"i\": \"c01f392d-f225-4615-b49a-eee689295c53\",\n \"isResizable\": true,\n \"w\": 12,\n \"x\": 12,\n \"y\": 15\n },\n \"maxPerRow\": 4,\n \"name\": \"JVM Buffer Pool\",\n \"options\": {\n \"legend\": {\n \"displayMode\": \"hidden\"\n },\n \"standardOptions\": {\n \"decimals\": 1,\n \"util\": \"none\"\n },\n \"thresholds\": {\n \"steps\": [\n {\n \"color\": \"#634CD9\",\n \"type\": \"base\",\n \"value\": null\n }\n ]\n },\n \"tooltip\": {\n \"mode\": \"all\",\n \"sort\": \"desc\"\n }\n },\n \"targets\": [\n {\n \"expr\": \"arms_jvm_buffer_pool_count{app=\\\"$app\\\",host=\\\"$host\\\"}\",\n \"legend\": \"id {{id}}\",\n \"refId\": \"A\"\n }\n ],\n \"transformations\": [\n {\n \"id\": \"organize\",\n \"options\": {}\n }\n ],\n \"type\": \"timeseries\",\n \"version\": \"3.0.0\"\n },\n {\n \"custom\": {\n \"drawStyle\": \"lines\",\n \"fillOpacity\": 0.3,\n \"gradientMode\": \"opacity\",\n \"lineInterpolation\": \"smooth\",\n \"lineWidth\": 2,\n \"scaleDistribution\": {\n \"type\": \"linear\"\n },\n \"spanNulls\": false,\n \"stack\": \"off\"\n },\n \"datasourceCate\": \"prometheus\",\n \"datasourceValue\": \"${prom}\",\n \"id\": \"ee48523f-948d-4828-a606-309ce683e694\",\n \"layout\": {\n \"h\": 7,\n \"i\": \"ca327ef3-1b8a-4b9a-9b42-62fd41aefb31\",\n \"isResizable\": true,\n \"w\": 12,\n \"x\": 0,\n \"y\": 22\n },\n \"maxPerRow\": 4,\n \"name\": \"JVM Buffer Pool Total Bytes\",\n \"options\": {\n \"legend\": {\n \"displayMode\": \"hidden\"\n },\n \"standardOptions\": {\n \"decimals\": 1,\n \"util\": \"bytesIEC\"\n },\n \"thresholds\": {\n \"steps\": [\n {\n \"color\": \"#634CD9\",\n \"type\": \"base\",\n \"value\": null\n }\n ]\n },\n \"tooltip\": {\n \"mode\": \"all\",\n \"sort\": \"desc\"\n }\n },\n \"targets\": [\n {\n \"expr\": \"arms_jvm_buffer_pool_total_bytes{app=\\\"$app\\\",host=\\\"$host\\\"}\",\n \"legend\": \"id {{id}}\",\n \"refId\": \"A\"\n }\n ],\n \"transformations\": [\n {\n \"id\": \"organize\",\n \"options\": {}\n }\n ],\n \"type\": \"timeseries\",\n \"version\": \"3.0.0\"\n },\n {\n \"custom\": {\n \"drawStyle\": \"lines\",\n \"fillOpacity\": 0.3,\n \"gradientMode\": \"opacity\",\n \"lineInterpolation\": \"smooth\",\n \"lineWidth\": 2,\n \"scaleDistribution\": {\n \"type\": \"linear\"\n },\n \"spanNulls\": false,\n \"stack\": \"off\"\n },\n \"datasourceCate\": \"prometheus\",\n \"datasourceValue\": \"${prom}\",\n \"id\": \"22b24a2d-9976-47d9-ad4d-bef92880a53e\",\n \"layout\": {\n \"h\": 7,\n \"i\": \"db4b7e4d-74b2-44fc-aca8-c0cb2635daad\",\n \"isResizable\": true,\n \"w\": 12,\n \"x\": 12,\n \"y\": 22\n },\n \"maxPerRow\": 4,\n \"name\": \"JVM Buffer Pool Used Bytes\",\n \"options\": {\n \"legend\": {\n \"displayMode\": \"hidden\"\n },\n \"standardOptions\": {\n \"decimals\": 1,\n \"util\": \"bytesIEC\"\n },\n \"thresholds\": {\n \"steps\": [\n {\n \"color\": \"#634CD9\",\n \"type\": \"base\",\n \"value\": null\n }\n ]\n },\n \"tooltip\": {\n \"mode\": \"all\",\n \"sort\": \"desc\"\n }\n },\n \"targets\": [\n {\n \"expr\": \"arms_jvm_buffer_pool_used_bytes{app=\\\"$app\\\",host=\\\"$host\\\"}\",\n \"legend\": \"id {{id}}\",\n \"refId\": \"A\"\n }\n ],\n \"transformations\": [\n {\n \"id\": \"organize\",\n \"options\": {}\n }\n ],\n \"type\": \"timeseries\",\n \"version\": \"3.0.0\"\n },\n {\n \"collapsed\": true,\n \"id\": \"0aaf3516-4938-41e3-b7cb-323de6de75d9\",\n \"layout\": {\n \"h\": 1,\n \"i\": \"0aaf3516-4938-41e3-b7cb-323de6de75d9\",\n \"isResizable\": false,\n \"w\": 24,\n \"x\": 0,\n \"y\": 29\n },\n \"name\": \"GC\",\n \"type\": \"row\"\n },\n {\n \"custom\": {\n \"drawStyle\": \"lines\",\n \"fillOpacity\": 0.3,\n \"gradientMode\": \"opacity\",\n \"lineInterpolation\": \"smooth\",\n \"lineWidth\": 2,\n \"scaleDistribution\": {\n \"type\": \"linear\"\n },\n \"spanNulls\": false,\n \"stack\": \"off\"\n },\n \"datasourceCate\": \"prometheus\",\n \"datasourceValue\": \"${prom}\",\n \"id\": \"5303bda0-47c2-4aca-bb12-1da512500f4a\",\n \"layout\": {\n \"h\": 6,\n \"i\": \"5303bda0-47c2-4aca-bb12-1da512500f4a\",\n \"isResizable\": true,\n \"w\": 12,\n \"x\": 0,\n \"y\": 30\n },\n \"maxPerRow\": 4,\n \"name\": \"过去一分钟GC耗时(秒)\",\n \"options\": {\n \"legend\": {\n \"displayMode\": \"hidden\"\n },\n \"standardOptions\": {\n \"util\": \"none\"\n },\n \"thresholds\": {\n \"steps\": [\n {\n \"color\": \"#634CD9\",\n \"type\": \"base\",\n \"value\": null\n }\n ]\n },\n \"tooltip\": {\n \"mode\": \"all\",\n \"sort\": \"desc\"\n }\n },\n \"targets\": [\n {\n \"expr\": \"increase(arms_jvm_gc_seconds_total{app=\\\"$app\\\",host=\\\"$host\\\"}[1m])\",\n \"refId\": \"A\"\n }\n ],\n \"transformations\": [\n {\n \"id\": \"organize\",\n \"options\": {}\n }\n ],\n \"type\": \"timeseries\",\n \"version\": \"3.0.0\"\n },\n {\n \"custom\": {\n \"drawStyle\": \"lines\",\n \"fillOpacity\": 0.3,\n \"gradientMode\": \"opacity\",\n \"lineInterpolation\": \"smooth\",\n \"lineWidth\": 2,\n \"scaleDistribution\": {\n \"type\": \"linear\"\n },\n \"spanNulls\": false,\n \"stack\": \"off\"\n },\n \"datasourceCate\": \"prometheus\",\n \"datasourceValue\": \"${prom}\",\n \"id\": \"cf410459-b5df-4aca-a410-ecda091d6097\",\n \"layout\": {\n \"h\": 6,\n \"i\": \"cf410459-b5df-4aca-a410-ecda091d6097\",\n \"isResizable\": true,\n \"w\": 12,\n \"x\": 12,\n \"y\": 30\n },\n \"maxPerRow\": 4,\n \"name\": \"过去一分钟GC次数\",\n \"options\": {\n \"legend\": {\n \"displayMode\": \"hidden\"\n },\n \"standardOptions\": {\n \"util\": \"none\"\n },\n \"thresholds\": {\n \"steps\": [\n {\n \"color\": \"#634CD9\",\n \"type\": \"base\",\n \"value\": null\n }\n ]\n },\n \"tooltip\": {\n \"mode\": \"all\",\n \"sort\": \"desc\"\n }\n },\n \"targets\": [\n {\n \"expr\": \"increase(arms_jvm_gc_total{app=\\\"$app\\\",host=\\\"$host\\\"}[1m])\",\n \"legend\": \"\",\n \"refId\": \"A\"\n }\n ],\n \"transformations\": [\n {\n \"id\": \"organize\",\n \"options\": {}\n }\n ],\n \"type\": \"timeseries\",\n \"version\": \"3.0.0\"\n }\n ],\n \"var\": [\n {\n \"definition\": \"prometheus\",\n \"name\": \"prom\",\n \"type\": \"datasource\"\n },\n {\n \"datasource\": {\n \"cate\": \"prometheus\",\n \"value\": \"${prom}\"\n },\n \"definition\": \"label_values(arms_jvm_buffer_pool_count, app)\",\n \"label\": \"app\",\n \"name\": \"app\",\n \"type\": \"query\"\n },\n {\n \"datasource\": {\n \"cate\": \"prometheus\",\n \"value\": \"${prom}\"\n },\n \"definition\": \"label_values(arms_jvm_buffer_pool_count{app=\\\"$app\\\"}, host)\",\n \"label\": \"host\",\n \"name\": \"host\",\n \"type\": \"query\"\n }\n ],\n \"version\": \"3.0.0\"\n },\n \"public\": 0,\n \"public_cate\": 0,\n \"bgids\": null,\n \"built_in\": 0,\n \"hide\": 0,\n \"uuid\": 1717556327100994000\n}"
},
{
"path": "integrations/AliYun/dashboards/cdn.json",
"content": "{\n \"id\": 0,\n \"group_id\": 0,\n \"name\": \"阿里云CDN\",\n \"ident\": \"\",\n \"tags\": \"CDN\",\n \"create_at\": 0,\n \"create_by\": \"\",\n \"update_at\": 0,\n \"update_by\": \"\",\n \"configs\": {\n \"panels\": [\n {\n \"custom\": {\n \"drawStyle\": \"lines\",\n \"fillOpacity\": 0.3,\n \"gradientMode\": \"opacity\",\n \"lineInterpolation\": \"smooth\",\n \"lineWidth\": 2,\n \"scaleDistribution\": {\n \"type\": \"linear\"\n },\n \"spanNulls\": true,\n \"stack\": \"off\"\n },\n \"datasourceCate\": \"prometheus\",\n \"datasourceValue\": \"${datasource}\",\n \"id\": \"0430c7e9-7372-45e3-9bb2-c5939baf6bfa\",\n \"layout\": {\n \"h\": 4,\n \"i\": \"0430c7e9-7372-45e3-9bb2-c5939baf6bfa\",\n \"isResizable\": true,\n \"w\": 8,\n \"x\": 0,\n \"y\": 0\n },\n \"maxPerRow\": 4,\n \"name\": \"网络带宽(bits/s)\",\n \"options\": {\n \"legend\": {\n \"displayMode\": \"hidden\"\n },\n \"standardOptions\": {},\n \"thresholds\": {\n \"steps\": [\n {\n \"color\": \"#634CD9\",\n \"type\": \"base\",\n \"value\": null\n }\n ]\n },\n \"tooltip\": {\n \"mode\": \"all\",\n \"sort\": \"none\"\n }\n },\n \"targets\": [\n {\n \"expr\": \"aliyun_acs_cdn_bps_isp_value{instance_id=\\\"$instance_id\\\"}\",\n \"legend\": \"峰值 {{instance_id}\",\n \"refId\": \"A\"\n },\n {\n \"expr\": \"aliyun_acs_cdn_internet_out_average{instance_id=\\\"$instance_id\\\"}\",\n \"legend\": \"均值 {{instance_id}}\",\n \"refId\": \"B\"\n }\n ],\n \"transformations\": [\n {\n \"id\": \"organize\",\n \"options\": {}\n }\n ],\n \"type\": \"timeseries\",\n \"version\": \"3.0.0\"\n },\n {\n \"custom\": {\n \"drawStyle\": \"lines\",\n \"fillOpacity\": 0.3,\n \"gradientMode\": \"opacity\",\n \"lineInterpolation\": \"smooth\",\n \"lineWidth\": 2,\n \"scaleDistribution\": {\n \"type\": \"linear\"\n },\n \"spanNulls\": false,\n \"stack\": \"off\"\n },\n \"datasourceCate\": \"prometheus\",\n \"datasourceValue\": \"${datasource}\",\n \"id\": \"b438ae81-3dfc-4ed8-b66f-262a4b507e4b\",\n \"layout\": {\n \"h\": 4,\n \"i\": \"b438ae81-3dfc-4ed8-b66f-262a4b507e4b\",\n \"isResizable\": true,\n \"w\": 8,\n \"x\": 8,\n \"y\": 0\n },\n \"maxPerRow\": 4,\n \"name\": \"下行流量(bytes)\",\n \"options\": {\n \"legend\": {\n \"displayMode\": \"hidden\"\n },\n \"standardOptions\": {},\n \"thresholds\": {\n \"steps\": [\n {\n \"color\": \"#634CD9\",\n \"type\": \"base\",\n \"value\": null\n }\n ]\n },\n \"tooltip\": {\n \"mode\": \"all\",\n \"sort\": \"none\"\n }\n },\n \"targets\": [\n {\n \"expr\": \"aliyun_acs_cdn_internet_out_isp_value{instance_id=\\\"$instance_id\\\"}\",\n \"legend\": \"{{instance_id}}\",\n \"refId\": \"A\"\n }\n ],\n \"transformations\": [\n {\n \"id\": \"organize\",\n \"options\": {}\n }\n ],\n \"type\": \"timeseries\",\n \"version\": \"3.0.0\"\n },\n {\n \"custom\": {\n \"drawStyle\": \"lines\",\n \"fillOpacity\": 0.3,\n \"gradientMode\": \"opacity\",\n \"lineInterpolation\": \"smooth\",\n \"lineWidth\": 2,\n \"scaleDistribution\": {\n \"type\": \"linear\"\n },\n \"spanNulls\": false,\n \"stack\": \"off\"\n },\n \"datasourceCate\": \"prometheus\",\n \"datasourceValue\": \"${datasource}\",\n \"id\": \"af0874c7-3123-437a-93bc-448f6de8b43b\",\n \"layout\": {\n \"h\": 4,\n \"i\": \"c6e41c04-d591-4117-bdf1-5dc6e1f4c084\",\n \"isResizable\": true,\n \"w\": 8,\n \"x\": 16,\n \"y\": 0\n },\n \"maxPerRow\": 4,\n \"name\": \"每秒访问次数(个)\",\n \"options\": {\n \"legend\": {\n \"displayMode\": \"hidden\"\n },\n \"standardOptions\": {},\n \"thresholds\": {\n \"steps\": [\n {\n \"color\": \"#634CD9\",\n \"type\": \"base\",\n \"value\": null\n }\n ]\n },\n \"tooltip\": {\n \"mode\": \"all\",\n \"sort\": \"none\"\n }\n },\n \"targets\": [\n {\n \"expr\": \"aliyun_acs_cdn_qps_isp_value{instance_id=\\\"$instance_id\\\"}\",\n \"legend\": \"{{instance_id}}\",\n \"refId\": \"A\"\n }\n ],\n \"transformations\": [\n {\n \"id\": \"organize\",\n \"options\": {}\n }\n ],\n \"type\": \"timeseries\",\n \"version\": \"3.0.0\"\n },\n {\n \"custom\": {\n \"drawStyle\": \"lines\",\n \"fillOpacity\": 0.3,\n \"gradientMode\": \"opacity\",\n \"lineInterpolation\": \"smooth\",\n \"lineWidth\": 2,\n \"scaleDistribution\": {\n \"type\": \"linear\"\n },\n \"spanNulls\": true,\n \"stack\": \"off\"\n },\n \"datasourceCate\": \"prometheus\",\n \"datasourceValue\": \"${datasource}\",\n \"id\": \"ec8fcf96-1691-4e45-9a5f-2f183021b434\",\n \"layout\": {\n \"h\": 4,\n \"i\": \"ec8fcf96-1691-4e45-9a5f-2f183021b434\",\n \"isResizable\": true,\n \"w\": 8,\n \"x\": 0,\n \"y\": 4\n },\n \"maxPerRow\": 4,\n \"name\": \"边缘状态码4XX占比(%)\",\n \"options\": {\n \"legend\": {\n \"displayMode\": \"hidden\"\n },\n \"standardOptions\": {\n \"util\": \"percent\"\n },\n \"thresholds\": {\n \"steps\": [\n {\n \"color\": \"#634CD9\",\n \"type\": \"base\",\n \"value\": null\n }\n ]\n },\n \"tooltip\": {\n \"mode\": \"all\",\n \"sort\": \"none\"\n }\n },\n \"targets\": [\n {\n \"expr\": \"aliyun_acs_cdn_code4xx_isp_value{instance_id=\\\"$instance_id\\\"}\",\n \"legend\": \"峰值{{instance_id}}\",\n \"refId\": \"A\"\n },\n {\n \"expr\": \"aliyun_acs_cdn_bps_average{instance_id=\\\"$instance_id\\\"}\",\n \"legend\": \"均值 {{instance_id}}\",\n \"refId\": \"B\"\n }\n ],\n \"transformations\": [\n {\n \"id\": \"organize\",\n \"options\": {}\n }\n ],\n \"type\": \"timeseries\",\n \"version\": \"3.0.0\"\n },\n {\n \"custom\": {\n \"drawStyle\": \"lines\",\n \"fillOpacity\": 0.3,\n \"gradientMode\": \"opacity\",\n \"lineInterpolation\": \"smooth\",\n \"lineWidth\": 2,\n \"scaleDistribution\": {\n \"type\": \"linear\"\n },\n \"spanNulls\": true,\n \"stack\": \"off\"\n },\n \"datasourceCate\": \"prometheus\",\n \"datasourceValue\": \"${datasource}\",\n \"id\": \"25b6e3fa-f6dd-4452-8025-3c7d9a9a592c\",\n \"layout\": {\n \"h\": 4,\n \"i\": \"e884b781-1bd4-476c-a807-a68a6417764e\",\n \"isResizable\": true,\n \"w\": 8,\n \"x\": 8,\n \"y\": 4\n },\n \"maxPerRow\": 4,\n \"name\": \"边缘状态码5XX占比(%)\",\n \"options\": {\n \"legend\": {\n \"displayMode\": \"hidden\"\n },\n \"standardOptions\": {\n \"util\": \"percent\"\n },\n \"thresholds\": {\n \"steps\": [\n {\n \"color\": \"#634CD9\",\n \"type\": \"base\",\n \"value\": null\n }\n ]\n },\n \"tooltip\": {\n \"mode\": \"all\",\n \"sort\": \"none\"\n }\n },\n \"targets\": [\n {\n \"expr\": \"aliyun_acs_cdn_code5xx_isp_value{instance_id=\\\"$instance_id\\\"}\",\n \"legend\": \"峰值{{instance_id}}\",\n \"refId\": \"A\"\n },\n {\n \"expr\": \"aliyun_acs_cdn_bps_average{instance_id=\\\"$instance_id\\\"}\",\n \"legend\": \"均值 {{instance_id}}\",\n \"refId\": \"B\"\n }\n ],\n \"transformations\": [\n {\n \"id\": \"organize\",\n \"options\": {}\n }\n ],\n \"type\": \"timeseries\",\n \"version\": \"3.0.0\"\n }\n ],\n \"var\": [\n {\n \"definition\": \"prometheus\",\n \"label\": \"datasource\",\n \"name\": \"datasource\",\n \"type\": \"datasource\"\n },\n {\n \"datasource\": {\n \"cate\": \"prometheus\",\n \"value\": \"${datasource}\"\n },\n \"definition\": \"label_values(aliyun_acs_cdn_qps_isp_value, instance_id)\",\n \"label\": \"instance_id\",\n \"name\": \"instance_id\",\n \"type\": \"query\"\n }\n ],\n \"version\": \"3.0.0\"\n },\n \"public\": 0,\n \"public_cate\": 0,\n \"bgids\": null,\n \"built_in\": 0,\n \"hide\": 0,\n \"uuid\": 1717556327104499000\n}"
},
{
"path": "integrations/AliYun/dashboards/ecs.json",
"content": "{\n \"id\": 0,\n \"group_id\": 0,\n \"name\": \"阿里云ECS\",\n \"ident\": \"\",\n \"tags\": \"\",\n \"create_at\": 0,\n \"create_by\": \"\",\n \"update_at\": 0,\n \"update_by\": \"\",\n \"configs\": {\n \"panels\": [\n {\n \"custom\": {\n \"drawStyle\": \"lines\",\n \"fillOpacity\": 0.3,\n \"gradientMode\": \"opacity\",\n \"lineInterpolation\": \"smooth\",\n \"lineWidth\": 2,\n \"scaleDistribution\": {\n \"type\": \"linear\"\n },\n \"spanNulls\": false,\n \"stack\": \"off\"\n },\n \"datasourceCate\": \"prometheus\",\n \"datasourceName\": \"Default\",\n \"datasourceValue\": \"${datasource}\",\n \"id\": \"8606d5ad-c3c7-4b1d-86bf-474d3302ee17\",\n \"layout\": {\n \"h\": 4,\n \"i\": \"8606d5ad-c3c7-4b1d-86bf-474d3302ee17\",\n \"isResizable\": true,\n \"w\": 12,\n \"x\": 0,\n \"y\": 0\n },\n \"maxPerRow\": 4,\n \"name\": \"CPU平均使用率\",\n \"options\": {\n \"legend\": {\n \"displayMode\": \"hidden\"\n },\n \"standardOptions\": {},\n \"thresholds\": {\n \"steps\": [\n {\n \"color\": \"#634CD9\",\n \"type\": \"base\",\n \"value\": null\n }\n ]\n },\n \"tooltip\": {\n \"mode\": \"all\",\n \"sort\": \"none\"\n }\n },\n \"targets\": [\n {\n \"expr\": \"sum(aliyun_acs_ecs_dashboard_cpu_utilization_average{ident=~\\\"$ident\\\"}) by (ident,instance_id)\",\n \"refId\": \"A\"\n }\n ],\n \"type\": \"timeseries\",\n \"version\": \"2.0.0\"\n },\n {\n \"custom\": {\n \"drawStyle\": \"lines\",\n \"fillOpacity\": 0.3,\n \"gradientMode\": \"opacity\",\n \"lineInterpolation\": \"smooth\",\n \"lineWidth\": 2,\n \"scaleDistribution\": {\n \"type\": \"linear\"\n },\n \"spanNulls\": false,\n \"stack\": \"off\"\n },\n \"datasourceCate\": \"prometheus\",\n \"datasourceName\": \"Default\",\n \"datasourceValue\": \"${datasource}\",\n \"id\": \"c7034fe3-5521-4867-a8bd-429767cc03a2\",\n \"layout\": {\n \"h\": 4,\n \"i\": \"55404296-0bd9-409d-aeaf-e9c7cceea0dd\",\n \"isResizable\": true,\n \"w\": 12,\n \"x\": 12,\n \"y\": 0\n },\n \"maxPerRow\": 4,\n \"name\": \"内存平均使用率\",\n \"options\": {\n \"legend\": {\n \"displayMode\": \"hidden\"\n },\n \"standardOptions\": {},\n \"thresholds\": {\n \"steps\": [\n {\n \"color\": \"#634CD9\",\n \"type\": \"base\",\n \"value\": null\n }\n ]\n },\n \"tooltip\": {\n \"mode\": \"all\",\n \"sort\": \"none\"\n }\n },\n \"targets\": [\n {\n \"expr\": \"sum(aliyun_acs_ecs_dashboard_memory_usedutilization_average{ident=~\\\"$ident\\\"}) by (ident,instance_id)\",\n \"refId\": \"A\"\n }\n ],\n \"type\": \"timeseries\",\n \"version\": \"2.0.0\"\n },\n {\n \"custom\": {\n \"drawStyle\": \"lines\",\n \"fillOpacity\": 0.3,\n \"gradientMode\": \"opacity\",\n \"lineInterpolation\": \"smooth\",\n \"lineWidth\": 2,\n \"scaleDistribution\": {\n \"type\": \"linear\"\n },\n \"spanNulls\": false,\n \"stack\": \"off\"\n },\n \"datasourceCate\": \"prometheus\",\n \"datasourceName\": \"Default\",\n \"datasourceValue\": \"${datasource}\",\n \"id\": \"e4c11925-b359-4edb-9269-4bdd4d230224\",\n \"layout\": {\n \"h\": 4,\n \"i\": \"0c7b3a5a-ef12-4349-be9b-7a245bf01418\",\n \"isResizable\": true,\n \"w\": 12,\n \"x\": 0,\n \"y\": 4\n },\n \"maxPerRow\": 4,\n \"name\": \"系统负载[5m]\",\n \"options\": {\n \"legend\": {\n \"displayMode\": \"hidden\"\n },\n \"standardOptions\": {\n \"util\": \"percent\"\n },\n \"thresholds\": {\n \"steps\": [\n {\n \"color\": \"#634CD9\",\n \"type\": \"base\",\n \"value\": null\n }\n ]\n },\n \"tooltip\": {\n \"mode\": \"all\",\n \"sort\": \"none\"\n }\n },\n \"targets\": [\n {\n \"expr\": \"sum(aliyun_acs_ecs_dashboard_load_5m_average{ident=~\\\"$ident\\\"}) by (ident,instance_id)\",\n \"legend\": \"{{ident}} {{instance_id}} 5分钟负载\",\n \"refId\": \"B\"\n }\n ],\n \"type\": \"timeseries\",\n \"version\": \"2.0.0\"\n },\n {\n \"custom\": {\n \"drawStyle\": \"lines\",\n \"fillOpacity\": 0.3,\n \"gradientMode\": \"opacity\",\n \"lineInterpolation\": \"smooth\",\n \"lineWidth\": 2,\n \"scaleDistribution\": {\n \"type\": \"linear\"\n },\n \"spanNulls\": false,\n \"stack\": \"off\"\n },\n \"datasourceCate\": \"prometheus\",\n \"datasourceName\": \"Default\",\n \"datasourceValue\": \"${datasource}\",\n \"id\": \"388d4da6-eb1f-48f1-955d-37579809dfec\",\n \"layout\": {\n \"h\": 4,\n \"i\": \"5abea3d2-ea82-4bdb-a4f0-4dd1316c0377\",\n \"isResizable\": true,\n \"w\": 12,\n \"x\": 12,\n \"y\": 5\n },\n \"maxPerRow\": 4,\n \"name\": \"磁盘平均使用率\",\n \"options\": {\n \"legend\": {\n \"displayMode\": \"hidden\"\n },\n \"standardOptions\": {\n \"util\": \"percent\"\n },\n \"thresholds\": {\n \"steps\": [\n {\n \"color\": \"#634CD9\",\n \"type\": \"base\",\n \"value\": null\n }\n ]\n },\n \"tooltip\": {\n \"mode\": \"all\",\n \"sort\": \"none\"\n }\n },\n \"targets\": [\n {\n \"expr\": \"sum(aliyun_acs_ecs_dashboard_diskusage_utilization_average{ident=~\\\"$ident\\\"}) by (ident,instance_id)\",\n \"refId\": \"A\"\n }\n ],\n \"type\": \"timeseries\",\n \"version\": \"2.0.0\"\n },\n {\n \"custom\": {\n \"drawStyle\": \"lines\",\n \"fillOpacity\": 0.3,\n \"gradientMode\": \"opacity\",\n \"lineInterpolation\": \"smooth\",\n \"lineWidth\": 2,\n \"scaleDistribution\": {\n \"type\": \"linear\"\n },\n \"spanNulls\": false,\n \"stack\": \"off\"\n },\n \"datasourceCate\": \"prometheus\",\n \"datasourceValue\": \"${datasource}\",\n \"id\": \"f8d19cc9-0168-4c13-b9a9-c7980eced974\",\n \"layout\": {\n \"h\": 4,\n \"i\": \"f8d19cc9-0168-4c13-b9a9-c7980eced974\",\n \"w\": 12,\n \"x\": 0,\n \"y\": 9\n },\n \"maxPerRow\": 4,\n \"name\": \"网络流量\",\n \"options\": {\n \"legend\": {\n \"displayMode\": \"hidden\"\n },\n \"standardOptions\": {\n \"util\": \"bitsSI\"\n },\n \"thresholds\": {\n \"steps\": [\n {\n \"color\": \"#634CD9\",\n \"type\": \"base\",\n \"value\": null\n }\n ]\n },\n \"tooltip\": {\n \"mode\": \"all\",\n \"sort\": \"none\"\n }\n },\n \"targets\": [\n {\n \"expr\": \"sum(aliyun_acs_ecs_dashboard_intranet_in_average{ident=~\\\"$ident\\\"}) by (ident,instance_id)\",\n \"legend\": \"主机:{{ident}} 实例ID: {{instance_id}} 入流量\",\n \"refId\": \"A\",\n \"step\": 300,\n \"time\": {\n \"end\": \"now\",\n \"start\": \"now-5m\"\n }\n },\n {\n \"expr\": \"sum(aliyun_acs_ecs_dashboard_intranet_out_average{ident=~\\\"$ident\\\"}) by (ident,instance_id)\",\n \"legend\": \"主机:{{ident}} 实例ID: {{instance_id}} 出流量\",\n \"refId\": \"B\",\n \"step\": 300,\n \"time\": {\n \"end\": \"now\",\n \"start\": \"now-5m\"\n }\n }\n ],\n \"type\": \"timeseries\",\n \"version\": \"2.0.0\"\n }\n ],\n \"var\": [\n {\n \"definition\": \"prometheus\",\n \"name\": \"datasource\",\n \"type\": \"datasource\"\n },\n {\n \"allOption\": true,\n \"datasource\": {\n \"cate\": \"prometheus\",\n \"value\": \"${datasource}\"\n },\n \"definition\": \"label_values(aliyun_acs_ecs_dashboard_cpu_utilization_average,ident)\",\n \"multi\": true,\n \"name\": \"ident\",\n \"type\": \"query\"\n }\n ],\n \"version\": \"3.0.0\"\n },\n \"public\": 0,\n \"public_cate\": 0,\n \"bgids\": null,\n \"built_in\": 0,\n \"hide\": 0,\n \"uuid\": 1717556327106006000\n}"
},
{
"path": "integrations/AliYun/dashboards/mongodb.json",
"content": "{\n \"id\": 0,\n \"group_id\": 0,\n \"name\": \"阿里云MongoDB\",\n \"ident\": \"\",\n \"tags\": \"\",\n \"create_at\": 0,\n \"create_by\": \"\",\n \"update_at\": 0,\n \"update_by\": \"\",\n \"configs\": {\n \"panels\": [\n {\n \"collapsed\": false,\n \"id\": \"971ae452-1cf4-4137-b6e3-1fffd1cf1036\",\n \"layout\": {\n \"h\": 1,\n \"i\": \"971ae452-1cf4-4137-b6e3-1fffd1cf1036\",\n \"isResizable\": false,\n \"w\": 24,\n \"x\": 0,\n \"y\": 0\n },\n \"name\": \"分组\",\n \"type\": \"row\"\n },\n {\n \"custom\": {\n \"drawStyle\": \"lines\",\n \"fillOpacity\": 0.3,\n \"gradientMode\": \"opacity\",\n \"lineInterpolation\": \"smooth\",\n \"lineWidth\": 2,\n \"scaleDistribution\": {\n \"type\": \"linear\"\n },\n \"spanNulls\": false,\n \"stack\": \"off\"\n },\n \"datasourceCate\": \"prometheus\",\n \"datasourceValue\": \"${datasource}\",\n \"id\": \"c43eb882-915f-4c38-a0b5-8f33c21ab44a\",\n \"layout\": {\n \"h\": 4,\n \"i\": \"09903231-6557-42be-9cf3-2873878e9bf2\",\n \"isResizable\": true,\n \"w\": 6,\n \"x\": 0,\n \"y\": 1\n },\n \"maxPerRow\": 4,\n \"name\": \"CPU平均使用率\",\n \"options\": {\n \"legend\": {\n \"displayMode\": \"hidden\"\n },\n \"standardOptions\": {},\n \"thresholds\": {\n \"steps\": [\n {\n \"color\": \"#634CD9\",\n \"type\": \"base\",\n \"value\": null\n }\n ]\n },\n \"tooltip\": {\n \"mode\": \"all\",\n \"sort\": \"none\"\n }\n },\n \"targets\": [\n {\n \"expr\": \"aliyun_acs_mongodb_cpu_utilization_average{instance_id=\\\"$instance_id\\\"}\",\n \"legend\": \"\",\n \"refId\": \"A\"\n }\n ],\n \"transformations\": [\n {\n \"id\": \"organize\",\n \"options\": {}\n }\n ],\n \"type\": \"timeseries\",\n \"version\": \"3.0.0\"\n },\n {\n \"custom\": {\n \"drawStyle\": \"lines\",\n \"fillOpacity\": 0.3,\n \"gradientMode\": \"opacity\",\n \"lineInterpolation\": \"smooth\",\n \"lineWidth\": 2,\n \"scaleDistribution\": {\n \"type\": \"linear\"\n },\n \"spanNulls\": true,\n \"stack\": \"off\"\n },\n \"datasourceCate\": \"prometheus\",\n \"datasourceValue\": \"${datasource}\",\n \"id\": \"8ab40b92-d31d-419d-b353-1b08ce5ddc25\",\n \"layout\": {\n \"h\": 4,\n \"i\": \"0a7aeee9-2a64-4484-a66e-0a084a7d507f\",\n \"isResizable\": true,\n \"w\": 6,\n \"x\": 6,\n \"y\": 1\n },\n \"maxPerRow\": 4,\n \"name\": \"内存平均使用率\",\n \"options\": {\n \"legend\": {\n \"displayMode\": \"hidden\"\n },\n \"standardOptions\": {},\n \"thresholds\": {\n \"steps\": [\n {\n \"color\": \"#634CD9\",\n \"type\": \"base\",\n \"value\": null\n }\n ]\n },\n \"tooltip\": {\n \"mode\": \"all\",\n \"sort\": \"none\"\n }\n },\n \"targets\": [\n {\n \"expr\": \"aliyun_acs_mongodb_memory_utilization_average{instance_id=\\\"$instance_id\\\"}\",\n \"legend\": \"\",\n \"refId\": \"A\"\n }\n ],\n \"transformations\": [\n {\n \"id\": \"organize\",\n \"options\": {}\n }\n ],\n \"type\": \"timeseries\",\n \"version\": \"3.0.0\"\n },\n {\n \"custom\": {\n \"drawStyle\": \"lines\",\n \"fillOpacity\": 0.3,\n \"gradientMode\": \"opacity\",\n \"lineInterpolation\": \"smooth\",\n \"lineWidth\": 2,\n \"scaleDistribution\": {\n \"type\": \"linear\"\n },\n \"spanNulls\": false,\n \"stack\": \"off\"\n },\n \"datasourceCate\": \"prometheus\",\n \"datasourceValue\": \"${datasource}\",\n \"id\": \"5ce5974c-a74a-4e14-8acd-bace8a24efcc\",\n \"layout\": {\n \"h\": 4,\n \"i\": \"ca23d79c-ae7a-462b-8ada-22a01437e4b1\",\n \"isResizable\": true,\n \"w\": 6,\n \"x\": 12,\n \"y\": 1\n },\n \"maxPerRow\": 4,\n \"name\": \"磁盘平均使用率\",\n \"options\": {\n \"legend\": {\n \"displayMode\": \"hidden\"\n },\n \"standardOptions\": {},\n \"thresholds\": {\n \"steps\": [\n {\n \"color\": \"#634CD9\",\n \"type\": \"base\",\n \"value\": null\n }\n ]\n },\n \"tooltip\": {\n \"mode\": \"all\",\n \"sort\": \"none\"\n }\n },\n \"targets\": [\n {\n \"expr\": \"aliyun_acs_mongodb_disk_utilization_average{instance_id=\\\"$instance_id\\\"}\",\n \"legend\": \"\",\n \"refId\": \"A\"\n }\n ],\n \"transformations\": [\n {\n \"id\": \"organize\",\n \"options\": {}\n }\n ],\n \"type\": \"timeseries\",\n \"version\": \"3.0.0\"\n },\n {\n \"custom\": {\n \"drawStyle\": \"lines\",\n \"fillOpacity\": 0.3,\n \"gradientMode\": \"opacity\",\n \"lineInterpolation\": \"smooth\",\n \"lineWidth\": 2,\n \"scaleDistribution\": {\n \"type\": \"linear\"\n },\n \"spanNulls\": false,\n \"stack\": \"off\"\n },\n \"datasourceCate\": \"prometheus\",\n \"datasourceValue\": \"${datasource}\",\n \"id\": \"657686c3-0529-4ebe-995a-edef9e3f6ee6\",\n \"layout\": {\n \"h\": 4,\n \"i\": \"3775178d-206e-43a6-9d4e-8cbf4ce56790\",\n \"isResizable\": true,\n \"w\": 6,\n \"x\": 18,\n \"y\": 1\n },\n \"maxPerRow\": 4,\n \"name\": \"IOPS平均使用率\",\n \"options\": {\n \"legend\": {\n \"displayMode\": \"hidden\"\n },\n \"standardOptions\": {},\n \"thresholds\": {\n \"steps\": [\n {\n \"color\": \"#634CD9\",\n \"type\": \"base\",\n \"value\": null\n }\n ]\n },\n \"tooltip\": {\n \"mode\": \"all\",\n \"sort\": \"none\"\n }\n },\n \"targets\": [\n {\n \"expr\": \"aliyun_acs_mongodb_iops_utilization_average{instance_id=\\\"$instance_id\\\"}\",\n \"legend\": \"\",\n \"refId\": \"A\"\n }\n ],\n \"transformations\": [\n {\n \"id\": \"organize\",\n \"options\": {}\n }\n ],\n \"type\": \"timeseries\",\n \"version\": \"3.0.0\"\n },\n {\n \"custom\": {\n \"drawStyle\": \"lines\",\n \"fillOpacity\": 0.3,\n \"gradientMode\": \"opacity\",\n \"lineInterpolation\": \"smooth\",\n \"lineWidth\": 2,\n \"scaleDistribution\": {\n \"type\": \"linear\"\n },\n \"spanNulls\": false,\n \"stack\": \"off\"\n },\n \"datasourceCate\": \"prometheus\",\n \"datasourceValue\": \"${datasource}\",\n \"id\": \"752381f7-6b74-4593-b174-aabee757c011\",\n \"layout\": {\n \"h\": 4,\n \"i\": \"acccdbbc-22cb-46e9-9a77-81c6c368cfe9\",\n \"isResizable\": true,\n \"w\": 6,\n \"x\": 0,\n \"y\": 5\n },\n \"maxPerRow\": 4,\n \"name\": \"连接数平均使用率\",\n \"options\": {\n \"legend\": {\n \"displayMode\": \"hidden\"\n },\n \"standardOptions\": {},\n \"thresholds\": {\n \"steps\": [\n {\n \"color\": \"#634CD9\",\n \"type\": \"base\",\n \"value\": null\n }\n ]\n },\n \"tooltip\": {\n \"mode\": \"all\",\n \"sort\": \"none\"\n }\n },\n \"targets\": [\n {\n \"expr\": \"aliyun_acs_mongodb_connection_utilization_average{instance_id=\\\"$instance_id\\\"}\",\n \"legend\": \"\",\n \"refId\": \"A\"\n }\n ],\n \"transformations\": [\n {\n \"id\": \"organize\",\n \"options\": {}\n }\n ],\n \"type\": \"timeseries\",\n \"version\": \"3.0.0\"\n },\n {\n \"custom\": {\n \"drawStyle\": \"lines\",\n \"fillOpacity\": 0.3,\n \"gradientMode\": \"opacity\",\n \"lineInterpolation\": \"smooth\",\n \"lineWidth\": 2,\n \"scaleDistribution\": {\n \"type\": \"linear\"\n },\n \"spanNulls\": false,\n \"stack\": \"off\"\n },\n \"datasourceCate\": \"prometheus\",\n \"datasourceValue\": \"${datasource}\",\n \"id\": \"1e75956d-2cf6-4fed-9700-b279ff229d10\",\n \"layout\": {\n \"h\": 4,\n \"i\": \"5d10e936-d4d9-48ac-93f4-a16b2c1eae81\",\n \"isResizable\": true,\n \"w\": 6,\n \"x\": 6,\n \"y\": 5\n },\n \"maxPerRow\": 4,\n \"name\": \"每秒访问次数\",\n \"options\": {\n \"legend\": {\n \"displayMode\": \"hidden\"\n },\n \"standardOptions\": {},\n \"thresholds\": {\n \"steps\": [\n {\n \"color\": \"#634CD9\",\n \"type\": \"base\",\n \"value\": null\n }\n ]\n },\n \"tooltip\": {\n \"mode\": \"all\",\n \"sort\": \"none\"\n }\n },\n \"targets\": [\n {\n \"expr\": \"aliyun_acs_mongodb_qps_average{instance_id=\\\"$instance_id\\\"}\",\n \"legend\": \"\",\n \"refId\": \"A\"\n }\n ],\n \"transformations\": [\n {\n \"id\": \"organize\",\n \"options\": {}\n }\n ],\n \"type\": \"timeseries\",\n \"version\": \"3.0.0\"\n },\n {\n \"custom\": {\n \"drawStyle\": \"lines\",\n \"fillOpacity\": 0.3,\n \"gradientMode\": \"opacity\",\n \"lineInterpolation\": \"smooth\",\n \"lineWidth\": 2,\n \"scaleDistribution\": {\n \"type\": \"linear\"\n },\n \"spanNulls\": false,\n \"stack\": \"off\"\n },\n \"datasourceCate\": \"prometheus\",\n \"datasourceValue\": \"${datasource}\",\n \"id\": \"b255683e-e324-49e4-b538-0c25411f27e5\",\n \"layout\": {\n \"h\": 4,\n \"i\": \"a1b04dc5-bce7-4c1b-b9d3-51b209afc714\",\n \"isResizable\": true,\n \"w\": 6,\n \"x\": 12,\n \"y\": 5\n },\n \"maxPerRow\": 4,\n \"name\": \"连接数使用量\",\n \"options\": {\n \"legend\": {\n \"displayMode\": \"hidden\"\n },\n \"standardOptions\": {},\n \"thresholds\": {\n \"steps\": [\n {\n \"color\": \"#634CD9\",\n \"type\": \"base\",\n \"value\": null\n }\n ]\n },\n \"tooltip\": {\n \"mode\": \"all\",\n \"sort\": \"none\"\n }\n },\n \"targets\": [\n {\n \"expr\": \"aliyun_acs_mongodb_connection_amount_average{instance_id=\\\"$instance_id\\\"}\",\n \"legend\": \"\",\n \"refId\": \"A\"\n }\n ],\n \"transformations\": [\n {\n \"id\": \"organize\",\n \"options\": {}\n }\n ],\n \"type\": \"timeseries\",\n \"version\": \"3.0.0\"\n },\n {\n \"collapsed\": true,\n \"id\": \"4aa42dc8-8c4b-42d1-939e-ed733cbcb126\",\n \"layout\": {\n \"h\": 1,\n \"i\": \"4aa42dc8-8c4b-42d1-939e-ed733cbcb126\",\n \"isResizable\": false,\n \"w\": 24,\n \"x\": 0,\n \"y\": 9\n },\n \"name\": \"磁盘容量\",\n \"type\": \"row\"\n },\n {\n \"custom\": {\n \"drawStyle\": \"lines\",\n \"fillOpacity\": 0.3,\n \"gradientMode\": \"opacity\",\n \"lineInterpolation\": \"smooth\",\n \"lineWidth\": 2,\n \"scaleDistribution\": {\n \"type\": \"linear\"\n },\n \"spanNulls\": false,\n \"stack\": \"off\"\n },\n \"datasourceCate\": \"prometheus\",\n \"datasourceValue\": \"${datasource}\",\n \"id\": \"0b6f8633-3b4a-47bf-8972-39d128d686eb\",\n \"layout\": {\n \"h\": 4,\n \"i\": \"263f341f-79ea-4d40-ad35-88eb2dfa6286\",\n \"isResizable\": true,\n \"w\": 6,\n \"x\": 0,\n \"y\": 10\n },\n \"maxPerRow\": 4,\n \"name\": \"实例占用磁盘空间量(bytes)\",\n \"options\": {\n \"legend\": {\n \"displayMode\": \"hidden\"\n },\n \"standardOptions\": {\n \"util\": \"bytesSI\"\n },\n \"thresholds\": {\n \"steps\": [\n {\n \"color\": \"#634CD9\",\n \"type\": \"base\",\n \"value\": null\n }\n ]\n },\n \"tooltip\": {\n \"mode\": \"all\",\n \"sort\": \"none\"\n }\n },\n \"targets\": [\n {\n \"expr\": \"aliyun_acs_mongodb_instance_disk_amount_average{instance_id=\\\"$instance_id\\\"}\",\n \"legend\": \"\",\n \"refId\": \"A\"\n }\n ],\n \"transformations\": [\n {\n \"id\": \"organize\",\n \"options\": {}\n }\n ],\n \"type\": \"timeseries\",\n \"version\": \"3.0.0\"\n },\n {\n \"custom\": {\n \"drawStyle\": \"lines\",\n \"fillOpacity\": 0.3,\n \"gradientMode\": \"opacity\",\n \"lineInterpolation\": \"smooth\",\n \"lineWidth\": 2,\n \"scaleDistribution\": {\n \"type\": \"linear\"\n },\n \"spanNulls\": false,\n \"stack\": \"off\"\n },\n \"datasourceCate\": \"prometheus\",\n \"datasourceValue\": \"${datasource}\",\n \"id\": \"388cf815-fdd7-4d94-abe2-6866680a2d5d\",\n \"layout\": {\n \"h\": 4,\n \"i\": \"6f7771c0-0692-4be1-9953-7803825ce57a\",\n \"isResizable\": true,\n \"w\": 6,\n \"x\": 6,\n \"y\": 10\n },\n \"maxPerRow\": 4,\n \"name\": \"数据占用磁盘空间量(bytes)\",\n \"options\": {\n \"legend\": {\n \"displayMode\": \"hidden\"\n },\n \"standardOptions\": {\n \"util\": \"bytesSI\"\n },\n \"thresholds\": {\n \"steps\": [\n {\n \"color\": \"#634CD9\",\n \"type\": \"base\",\n \"value\": null\n }\n ]\n },\n \"tooltip\": {\n \"mode\": \"all\",\n \"sort\": \"none\"\n }\n },\n \"targets\": [\n {\n \"expr\": \"aliyun_acs_mongodb_data_disk_amount_average{instance_id=\\\"$instance_id\\\"}\",\n \"legend\": \"\",\n \"refId\": \"A\"\n }\n ],\n \"transformations\": [\n {\n \"id\": \"organize\",\n \"options\": {}\n }\n ],\n \"type\": \"timeseries\",\n \"version\": \"3.0.0\"\n },\n {\n \"custom\": {\n \"drawStyle\": \"lines\",\n \"fillOpacity\": 0.3,\n \"gradientMode\": \"opacity\",\n \"lineInterpolation\": \"smooth\",\n \"lineWidth\": 2,\n \"scaleDistribution\": {\n \"type\": \"linear\"\n },\n \"spanNulls\": false,\n \"stack\": \"off\"\n },\n \"datasourceCate\": \"prometheus\",\n \"datasourceValue\": \"${datasource}\",\n \"id\": \"3d80f914-2b42-479c-9ecc-544490b92d49\",\n \"layout\": {\n \"h\": 4,\n \"i\": \"2928fb03-7062-469d-ba31-a06a0cbc2d55\",\n \"isResizable\": true,\n \"w\": 6,\n \"x\": 12,\n \"y\": 10\n },\n \"maxPerRow\": 4,\n \"name\": \"日志占用磁盘空间量(bytes)\",\n \"options\": {\n \"legend\": {\n \"displayMode\": \"hidden\"\n },\n \"standardOptions\": {\n \"util\": \"bytesSI\"\n },\n \"thresholds\": {\n \"steps\": [\n {\n \"color\": \"#634CD9\",\n \"type\": \"base\",\n \"value\": null\n }\n ]\n },\n \"tooltip\": {\n \"mode\": \"all\",\n \"sort\": \"none\"\n }\n },\n \"targets\": [\n {\n \"expr\": \"aliyun_acs_mongodb_log_disk_amount_average{instance_id=\\\"$instance_id\\\"}\",\n \"legend\": \"\",\n \"refId\": \"A\"\n }\n ],\n \"transformations\": [\n {\n \"id\": \"organize\",\n \"options\": {}\n }\n ],\n \"type\": \"timeseries\",\n \"version\": \"3.0.0\"\n },\n {\n \"collapsed\": true,\n \"id\": \"c15834bc-c823-40d7-8c36-1a4931401a5d\",\n \"layout\": {\n \"h\": 1,\n \"i\": \"c15834bc-c823-40d7-8c36-1a4931401a5d\",\n \"isResizable\": false,\n \"w\": 24,\n \"x\": 0,\n \"y\": 14\n },\n \"name\": \"网络请求\",\n \"type\": \"row\"\n },\n {\n \"custom\": {\n \"drawStyle\": \"lines\",\n \"fillOpacity\": 0.3,\n \"gradientMode\": \"opacity\",\n \"lineInterpolation\": \"smooth\",\n \"lineWidth\": 2,\n \"scaleDistribution\": {\n \"type\": \"linear\"\n },\n \"spanNulls\": false,\n \"stack\": \"off\"\n },\n \"datasourceCate\": \"prometheus\",\n \"datasourceValue\": \"${datasource}\",\n \"id\": \"3f30d533-bbcd-4264-861d-aa29a9d9c47b\",\n \"layout\": {\n \"h\": 4,\n \"i\": \"63b08762-b208-473d-8645-0bdd087631a8\",\n \"isResizable\": true,\n \"w\": 6,\n \"x\": 0,\n \"y\": 15\n },\n \"maxPerRow\": 4,\n \"name\": \"内网入流量(bytes)\",\n \"options\": {\n \"legend\": {\n \"displayMode\": \"hidden\"\n },\n \"standardOptions\": {\n \"util\": \"bytesSI\"\n },\n \"thresholds\": {\n \"steps\": [\n {\n \"color\": \"#634CD9\",\n \"type\": \"base\",\n \"value\": null\n }\n ]\n },\n \"tooltip\": {\n \"mode\": \"all\",\n \"sort\": \"none\"\n }\n },\n \"targets\": [\n {\n \"expr\": \"aliyun_acs_mongodb_intranet_in_average{instance_id=\\\"$instance_id\\\"}\",\n \"legend\": \"\",\n \"refId\": \"A\"\n }\n ],\n \"transformations\": [\n {\n \"id\": \"organize\",\n \"options\": {}\n }\n ],\n \"type\": \"timeseries\",\n \"version\": \"3.0.0\"\n },\n {\n \"custom\": {\n \"drawStyle\": \"lines\",\n \"fillOpacity\": 0.3,\n \"gradientMode\": \"opacity\",\n \"lineInterpolation\": \"smooth\",\n \"lineWidth\": 2,\n \"scaleDistribution\": {\n \"type\": \"linear\"\n },\n \"spanNulls\": false,\n \"stack\": \"off\"\n },\n \"datasourceCate\": \"prometheus\",\n \"datasourceValue\": \"${datasource}\",\n \"id\": \"57726e1a-7288-4d77-8871-92894dd71014\",\n \"layout\": {\n \"h\": 4,\n \"i\": \"081050c1-6535-4f3a-8a4b-6c87bc9e0d23\",\n \"isResizable\": true,\n \"w\": 6,\n \"x\": 6,\n \"y\": 15\n },\n \"maxPerRow\": 4,\n \"name\": \"内网出流量(bytes)\",\n \"options\": {\n \"legend\": {\n \"displayMode\": \"hidden\"\n },\n \"standardOptions\": {\n \"util\": \"bytesSI\"\n },\n \"thresholds\": {\n \"steps\": [\n {\n \"color\": \"#634CD9\",\n \"type\": \"base\",\n \"value\": null\n }\n ]\n },\n \"tooltip\": {\n \"mode\": \"all\",\n \"sort\": \"none\"\n }\n },\n \"targets\": [\n {\n \"expr\": \"aliyun_acs_mongodb_intranet_out_average{instance_id=\\\"$instance_id\\\"}\",\n \"legend\": \"\",\n \"refId\": \"A\"\n }\n ],\n \"transformations\": [\n {\n \"id\": \"organize\",\n \"options\": {}\n }\n ],\n \"type\": \"timeseries\",\n \"version\": \"3.0.0\"\n },\n {\n \"custom\": {\n \"drawStyle\": \"lines\",\n \"fillOpacity\": 0.3,\n \"gradientMode\": \"opacity\",\n \"lineInterpolation\": \"smooth\",\n \"lineWidth\": 2,\n \"scaleDistribution\": {\n \"type\": \"linear\"\n },\n \"spanNulls\": false,\n \"stack\": \"off\"\n },\n \"datasourceCate\": \"prometheus\",\n \"datasourceValue\": \"${datasource}\",\n \"id\": \"047e624a-9c12-4d83-9445-747f07ed766a\",\n \"layout\": {\n \"h\": 4,\n \"i\": \"2b8e3e40-241f-41eb-adaa-7e2c08061f00\",\n \"isResizable\": true,\n \"w\": 6,\n \"x\": 12,\n \"y\": 15\n },\n \"maxPerRow\": 4,\n \"name\": \"请求数(个)\",\n \"options\": {\n \"legend\": {\n \"displayMode\": \"hidden\"\n },\n \"standardOptions\": {\n \"util\": \"none\"\n },\n \"thresholds\": {\n \"steps\": [\n {\n \"color\": \"#634CD9\",\n \"type\": \"base\",\n \"value\": null\n }\n ]\n },\n \"tooltip\": {\n \"mode\": \"all\",\n \"sort\": \"none\"\n }\n },\n \"targets\": [\n {\n \"expr\": \"aliyun_acs_mongodb_number_requests_average{instance_id=\\\"$instance_id\\\"}\",\n \"legend\": \"\",\n \"refId\": \"A\"\n }\n ],\n \"transformations\": [\n {\n \"id\": \"organize\",\n \"options\": {}\n }\n ],\n \"type\": \"timeseries\",\n \"version\": \"3.0.0\"\n },\n {\n \"collapsed\": true,\n \"id\": \"aef60aa0-4896-4da1-8517-b9bfd4a386f1\",\n \"layout\": {\n \"h\": 1,\n \"i\": \"aef60aa0-4896-4da1-8517-b9bfd4a386f1\",\n \"isResizable\": false,\n \"w\": 24,\n \"x\": 0,\n \"y\": 19\n },\n \"name\": \"操作次数\",\n \"type\": \"row\"\n },\n {\n \"custom\": {\n \"drawStyle\": \"lines\",\n \"fillOpacity\": 0.3,\n \"gradientMode\": \"opacity\",\n \"lineInterpolation\": \"smooth\",\n \"lineWidth\": 2,\n \"scaleDistribution\": {\n \"type\": \"linear\"\n },\n \"spanNulls\": false,\n \"stack\": \"off\"\n },\n \"datasourceCate\": \"prometheus\",\n \"datasourceValue\": \"${datasource}\",\n \"id\": \"b4be1ae2-bd11-4b1b-a01a-41e1ca62e791\",\n \"layout\": {\n \"h\": 4,\n \"i\": \"c823f96f-d671-4173-9cf0-c2b420271c49\",\n \"isResizable\": true,\n \"w\": 6,\n \"x\": 0,\n \"y\": 20\n },\n \"maxPerRow\": 4,\n \"name\": \"Insert操作次数(个)\",\n \"options\": {\n \"legend\": {\n \"displayMode\": \"hidden\"\n },\n \"standardOptions\": {\n \"util\": \"none\"\n },\n \"thresholds\": {\n \"steps\": [\n {\n \"color\": \"#634CD9\",\n \"type\": \"base\",\n \"value\": null\n }\n ]\n },\n \"tooltip\": {\n \"mode\": \"all\",\n \"sort\": \"none\"\n }\n },\n \"targets\": [\n {\n \"expr\": \"aliyun_acs_mongodb_op_insert_average{instance_id=\\\"$instance_id\\\"}\",\n \"legend\": \"\",\n \"refId\": \"A\"\n }\n ],\n \"transformations\": [\n {\n \"id\": \"organize\",\n \"options\": {}\n }\n ],\n \"type\": \"timeseries\",\n \"version\": \"3.0.0\"\n },\n {\n \"custom\": {\n \"drawStyle\": \"lines\",\n \"fillOpacity\": 0.3,\n \"gradientMode\": \"opacity\",\n \"lineInterpolation\": \"smooth\",\n \"lineWidth\": 2,\n \"scaleDistribution\": {\n \"type\": \"linear\"\n },\n \"spanNulls\": false,\n \"stack\": \"off\"\n },\n \"datasourceCate\": \"prometheus\",\n \"datasourceValue\": \"${datasource}\",\n \"id\": \"0a02e31c-5ebc-438e-8012-69f4ef3cc3dd\",\n \"layout\": {\n \"h\": 4,\n \"i\": \"13a9905c-9eae-4189-bc96-95332d46c8b9\",\n \"isResizable\": true,\n \"w\": 6,\n \"x\": 6,\n \"y\": 20\n },\n \"maxPerRow\": 4,\n \"name\": \"Query操作次数(Frequency)\",\n \"options\": {\n \"legend\": {\n \"displayMode\": \"hidden\"\n },\n \"standardOptions\": {\n \"util\": \"none\"\n },\n \"thresholds\": {\n \"steps\": [\n {\n \"color\": \"#634CD9\",\n \"type\": \"base\",\n \"value\": null\n }\n ]\n },\n \"tooltip\": {\n \"mode\": \"all\",\n \"sort\": \"none\"\n }\n },\n \"targets\": [\n {\n \"expr\": \"aliyun_acs_mongodb_op_query_average{instance_id=\\\"$instance_id\\\"}\",\n \"legend\": \"\",\n \"refId\": \"A\"\n }\n ],\n \"transformations\": [\n {\n \"id\": \"organize\",\n \"options\": {}\n }\n ],\n \"type\": \"timeseries\",\n \"version\": \"3.0.0\"\n },\n {\n \"custom\": {\n \"drawStyle\": \"lines\",\n \"fillOpacity\": 0.3,\n \"gradientMode\": \"opacity\",\n \"lineInterpolation\": \"smooth\",\n \"lineWidth\": 2,\n \"scaleDistribution\": {\n \"type\": \"linear\"\n },\n \"spanNulls\": false,\n \"stack\": \"off\"\n },\n \"datasourceCate\": \"prometheus\",\n \"datasourceValue\": \"${datasource}\",\n \"id\": \"35ae128a-e23c-4a0c-b5c1-62289148452f\",\n \"layout\": {\n \"h\": 4,\n \"i\": \"6cc5c897-2ddb-4790-bfda-0938f8b7cf3d\",\n \"isResizable\": true,\n \"w\": 6,\n \"x\": 12,\n \"y\": 20\n },\n \"maxPerRow\": 4,\n \"name\": \"Update操作次数(Frequency)\",\n \"options\": {\n \"legend\": {\n \"displayMode\": \"hidden\"\n },\n \"standardOptions\": {\n \"util\": \"none\"\n },\n \"thresholds\": {\n \"steps\": [\n {\n \"color\": \"#634CD9\",\n \"type\": \"base\",\n \"value\": null\n }\n ]\n },\n \"tooltip\": {\n \"mode\": \"all\",\n \"sort\": \"none\"\n }\n },\n \"targets\": [\n {\n \"expr\": \"aliyun_acs_mongodb_op_update_average{instance_id=\\\"$instance_id\\\"}\",\n \"legend\": \"\",\n \"refId\": \"A\"\n }\n ],\n \"transformations\": [\n {\n \"id\": \"organize\",\n \"options\": {}\n }\n ],\n \"type\": \"timeseries\",\n \"version\": \"3.0.0\"\n },\n {\n \"custom\": {\n \"drawStyle\": \"lines\",\n \"fillOpacity\": 0.3,\n \"gradientMode\": \"opacity\",\n \"lineInterpolation\": \"smooth\",\n \"lineWidth\": 2,\n \"scaleDistribution\": {\n \"type\": \"linear\"\n },\n \"spanNulls\": false,\n \"stack\": \"off\"\n },\n \"datasourceCate\": \"prometheus\",\n \"datasourceValue\": \"${datasource}\",\n \"id\": \"1b21c3a5-246b-4473-884b-439af496644e\",\n \"layout\": {\n \"h\": 4,\n \"i\": \"0aca0c41-4c99-47a2-9298-00d1fe73914f\",\n \"isResizable\": true,\n \"w\": 6,\n \"x\": 18,\n \"y\": 20\n },\n \"maxPerRow\": 4,\n \"name\": \"Delete操作次数(Frequency)\",\n \"options\": {\n \"legend\": {\n \"displayMode\": \"hidden\"\n },\n \"standardOptions\": {\n \"util\": \"none\"\n },\n \"thresholds\": {\n \"steps\": [\n {\n \"color\": \"#634CD9\",\n \"type\": \"base\",\n \"value\": null\n }\n ]\n },\n \"tooltip\": {\n \"mode\": \"all\",\n \"sort\": \"none\"\n }\n },\n \"targets\": [\n {\n \"expr\": \"aliyun_acs_mongodb_op_delete_average{instance_id=\\\"$instance_id\\\"}\",\n \"legend\": \"\",\n \"refId\": \"A\"\n }\n ],\n \"transformations\": [\n {\n \"id\": \"organize\",\n \"options\": {}\n }\n ],\n \"type\": \"timeseries\",\n \"version\": \"3.0.0\"\n },\n {\n \"custom\": {\n \"drawStyle\": \"lines\",\n \"fillOpacity\": 0.3,\n \"gradientMode\": \"opacity\",\n \"lineInterpolation\": \"smooth\",\n \"lineWidth\": 2,\n \"scaleDistribution\": {\n \"type\": \"linear\"\n },\n \"spanNulls\": false,\n \"stack\": \"off\"\n },\n \"datasourceCate\": \"prometheus\",\n \"datasourceValue\": \"${datasource}\",\n \"id\": \"42e9cbb6-2219-4ff1-ac71-209f1c8cd120\",\n \"layout\": {\n \"h\": 4,\n \"i\": \"b3cdc370-248f-4dbe-9d47-7e00df2888c2\",\n \"isResizable\": true,\n \"w\": 6,\n \"x\": 0,\n \"y\": 24\n },\n \"maxPerRow\": 4,\n \"name\": \"Getmore操作次数(Frequency)\",\n \"options\": {\n \"legend\": {\n \"displayMode\": \"hidden\"\n },\n \"standardOptions\": {\n \"util\": \"none\"\n },\n \"thresholds\": {\n \"steps\": [\n {\n \"color\": \"#634CD9\",\n \"type\": \"base\",\n \"value\": null\n }\n ]\n },\n \"tooltip\": {\n \"mode\": \"all\",\n \"sort\": \"none\"\n }\n },\n \"targets\": [\n {\n \"expr\": \"aliyun_acs_mongodb_op_getmore_average{instance_id=\\\"$instance_id\\\"}\",\n \"legend\": \"\",\n \"refId\": \"A\"\n }\n ],\n \"transformations\": [\n {\n \"id\": \"organize\",\n \"options\": {}\n }\n ],\n \"type\": \"timeseries\",\n \"version\": \"3.0.0\"\n },\n {\n \"custom\": {\n \"drawStyle\": \"lines\",\n \"fillOpacity\": 0.3,\n \"gradientMode\": \"opacity\",\n \"lineInterpolation\": \"smooth\",\n \"lineWidth\": 2,\n \"scaleDistribution\": {\n \"type\": \"linear\"\n },\n \"spanNulls\": false,\n \"stack\": \"off\"\n },\n \"datasourceCate\": \"prometheus\",\n \"datasourceValue\": \"${datasource}\",\n \"id\": \"877b8ba6-0f7d-437d-b29a-08015c02b1ce\",\n \"layout\": {\n \"h\": 4,\n \"i\": \"6aa9e8ca-ea2a-4cb6-be1b-59c165aed5d5\",\n \"isResizable\": true,\n \"w\": 6,\n \"x\": 6,\n \"y\": 24\n },\n \"maxPerRow\": 4,\n \"name\": \"Command操作次数(Frequency)\",\n \"options\": {\n \"legend\": {\n \"displayMode\": \"hidden\"\n },\n \"standardOptions\": {\n \"util\": \"none\"\n },\n \"thresholds\": {\n \"steps\": [\n {\n \"color\": \"#634CD9\",\n \"type\": \"base\",\n \"value\": null\n }\n ]\n },\n \"tooltip\": {\n \"mode\": \"all\",\n \"sort\": \"none\"\n }\n },\n \"targets\": [\n {\n \"expr\": \"aliyun_acs_mongodb_op_command_average{instance_id=\\\"$instance_id\\\"}\",\n \"legend\": \"\",\n \"refId\": \"A\"\n }\n ],\n \"transformations\": [\n {\n \"id\": \"organize\",\n \"options\": {}\n }\n ],\n \"type\": \"timeseries\",\n \"version\": \"3.0.0\"\n }\n ],\n \"var\": [\n {\n \"definition\": \"prometheus\",\n \"name\": \"datasource\",\n \"type\": \"datasource\"\n },\n {\n \"datasource\": {\n \"cate\": \"prometheus\",\n \"value\": \"${datasource}\"\n },\n \"definition\": \"label_values(aliyun_acs_mongodb_qps_average,instance_id)\",\n \"multi\": false,\n \"name\": \"instance_id\",\n \"type\": \"query\"\n }\n ],\n \"version\": \"3.0.0\"\n },\n \"public\": 0,\n \"public_cate\": 0,\n \"bgids\": null,\n \"built_in\": 0,\n \"hide\": 0,\n \"uuid\": 1717556327107424000\n}"
},
{
"path": "integrations/AliYun/dashboards/mse.json",
"content": "{\n \"id\": 0,\n \"group_id\": 0,\n \"name\": \"MSE监控大盘\",\n \"ident\": \"MSE-Monitor\",\n \"tags\": \"\",\n \"create_at\": 0,\n \"create_by\": \"\",\n \"update_at\": 0,\n \"update_by\": \"\",\n \"configs\": {\n \"panels\": [\n {\n \"custom\": {\n \"calc\": \"lastNotNull\",\n \"colSpan\": 1,\n \"colorMode\": \"value\",\n \"graphMode\": \"none\",\n \"textMode\": \"valueAndName\",\n \"textSize\": {},\n \"valueField\": \"Value\"\n },\n \"datasourceCate\": \"prometheus\",\n \"datasourceValue\": 7,\n \"id\": \"aba69dc0-5a11-4bcd-add9-335b5a677bee\",\n \"layout\": {\n \"h\": 5,\n \"i\": \"aba69dc0-5a11-4bcd-add9-335b5a677bee\",\n \"isResizable\": true,\n \"w\": 6,\n \"x\": 0,\n \"y\": 0\n },\n \"maxPerRow\": 4,\n \"name\": \"PV(一分钟)\",\n \"options\": {\n \"standardOptions\": {},\n \"thresholds\": {\n \"steps\": [\n {\n \"color\": \"#634CD9\",\n \"type\": \"base\",\n \"value\": null\n }\n ]\n }\n },\n \"targets\": [\n {\n \"expr\": \"sum(delta(envoy_http_rq_total{envoy_clusterid=\\\"$envoy_clusterid\\\"}[1m]))\",\n \"refId\": \"A\"\n }\n ],\n \"transformations\": [\n {\n \"id\": \"organize\",\n \"options\": {}\n }\n ],\n \"type\": \"stat\",\n \"version\": \"3.0.0\"\n },\n {\n \"custom\": {\n \"calc\": \"lastNotNull\",\n \"detailName\": \"详情\",\n \"legengPosition\": \"right\"\n },\n \"datasourceCate\": \"prometheus\",\n \"datasourceValue\": 7,\n \"id\": \"e34a272e-6125-4afa-a2c1-80d7d9078673\",\n \"layout\": {\n \"h\": 5,\n \"i\": \"116a5607-5860-426e-a560-d3241da88b57\",\n \"isResizable\": true,\n \"w\": 9,\n \"x\": 6,\n \"y\": 0\n },\n \"maxPerRow\": 4,\n \"name\": \"请求成功率\",\n \"options\": {\n \"standardOptions\": {\n \"decimals\": 0,\n \"util\": \"percentUnit\"\n }\n },\n \"targets\": [\n {\n \"expr\": \"sum(delta(envoy_http_downstream_rq{envoy_clusterid=\\\"$envoy_clusterid\\\"}[3m])) by (response_code_class)\",\n \"legend\": \"\",\n \"refId\": \"A\"\n }\n ],\n \"transformations\": [\n {\n \"id\": \"organize\",\n \"options\": {}\n }\n ],\n \"type\": \"pie\",\n \"version\": \"3.0.0\"\n },\n {\n \"custom\": {\n \"drawStyle\": \"lines\",\n \"fillOpacity\": 0.3,\n \"gradientMode\": \"opacity\",\n \"lineInterpolation\": \"smooth\",\n \"lineWidth\": 2,\n \"scaleDistribution\": {\n \"type\": \"linear\"\n },\n \"spanNulls\": false,\n \"stack\": \"off\"\n },\n \"datasourceCate\": \"prometheus\",\n \"datasourceValue\": 7,\n \"id\": \"a8917108-58a6-479a-8ec4-571f1b5a79c2\",\n \"layout\": {\n \"h\": 5,\n \"i\": \"9be66a1f-c0bb-47dc-a3c0-ad43b588789b\",\n \"isResizable\": true,\n \"w\": 9,\n \"x\": 15,\n \"y\": 0\n },\n \"maxPerRow\": 4,\n \"name\": \"请求量(一分钟)\",\n \"options\": {\n \"legend\": {\n \"displayMode\": \"list\"\n },\n \"standardOptions\": {\n \"util\": \"bytesSI\"\n },\n \"thresholds\": {\n \"steps\": [\n {\n \"color\": \"#634CD9\",\n \"type\": \"base\",\n \"value\": null\n }\n ]\n },\n \"tooltip\": {\n \"mode\": \"all\",\n \"sort\": \"none\"\n }\n },\n \"targets\": [\n {\n \"expr\": \"sum(delta(envoy_http_downstream_cx_rx_bytes_total{envoy_clusterid=\\\"$envoy_clusterid\\\"}[1m]))\",\n \"legend\": \"\",\n \"refId\": \"A\"\n }\n ],\n \"transformations\": [\n {\n \"id\": \"organize\",\n \"options\": {}\n }\n ],\n \"type\": \"timeseries\",\n \"version\": \"3.0.0\"\n },\n {\n \"custom\": {\n \"drawStyle\": \"lines\",\n \"fillOpacity\": 0.3,\n \"gradientMode\": \"opacity\",\n \"lineInterpolation\": \"smooth\",\n \"lineWidth\": 2,\n \"scaleDistribution\": {\n \"type\": \"linear\"\n },\n \"spanNulls\": false,\n \"stack\": \"off\"\n },\n \"datasourceCate\": \"prometheus\",\n \"datasourceValue\": 7,\n \"id\": \"1b102bee-ccc9-49a0-a1d1-cc097bb6a987\",\n \"layout\": {\n \"h\": 6,\n \"i\": \"1b102bee-ccc9-49a0-a1d1-cc097bb6a987\",\n \"isResizable\": true,\n \"w\": 8,\n \"x\": 0,\n \"y\": 5\n },\n \"maxPerRow\": 4,\n \"name\": \"平均延迟\",\n \"options\": {\n \"legend\": {\n \"displayMode\": \"list\"\n },\n \"standardOptions\": {\n \"util\": \"milliseconds\"\n },\n \"thresholds\": {\n \"steps\": [\n {\n \"color\": \"#634CD9\",\n \"type\": \"base\",\n \"value\": null\n }\n ]\n },\n \"tooltip\": {\n \"mode\": \"all\",\n \"sort\": \"none\"\n }\n },\n \"targets\": [\n {\n \"expr\": \"sum(rate(envoy_http_downstream_rq_time_sum{envoy_clusterid=\\\"$envoy_clusterid\\\"}[10m])) / sum(rate(envoy_http_downstream_rq_time_count{envoy_clusterid=\\\"$envoy_clusterid\\\"}[10m]))\",\n \"legend\": \"\",\n \"refId\": \"A\"\n }\n ],\n \"transformations\": [\n {\n \"id\": \"organize\",\n \"options\": {}\n }\n ],\n \"type\": \"timeseries\",\n \"version\": \"3.0.0\"\n },\n {\n \"custom\": {\n \"drawStyle\": \"lines\",\n \"fillOpacity\": 0.3,\n \"gradientMode\": \"opacity\",\n \"lineInterpolation\": \"smooth\",\n \"lineWidth\": 2,\n \"scaleDistribution\": {\n \"type\": \"linear\"\n },\n \"spanNulls\": false,\n \"stack\": \"off\"\n },\n \"datasourceCate\": \"prometheus\",\n \"datasourceValue\": 7,\n \"id\": \"b432fc11-2f9d-4b72-826b-6ca787401859\",\n \"layout\": {\n \"h\": 6,\n \"i\": \"ea4c1073-07d3-4adc-a4d3-4812cc55ad7c\",\n \"isResizable\": true,\n \"w\": 8,\n \"x\": 8,\n \"y\": 5\n },\n \"maxPerRow\": 4,\n \"name\": \"P95\",\n \"options\": {\n \"legend\": {\n \"displayMode\": \"list\"\n },\n \"standardOptions\": {\n \"util\": \"milliseconds\"\n },\n \"thresholds\": {\n \"steps\": [\n {\n \"color\": \"#634CD9\",\n \"type\": \"base\",\n \"value\": null\n }\n ]\n },\n \"tooltip\": {\n \"mode\": \"all\",\n \"sort\": \"none\"\n }\n },\n \"targets\": [\n {\n \"expr\": \"histogram_quantile(0.95, sum(rate(envoy_http_downstream_rq_time_bucket{envoy_clusterid=\\\"$envoy_clusterid\\\"}[10m])) by (le, service))\",\n \"legend\": \"\",\n \"refId\": \"A\"\n }\n ],\n \"transformations\": [\n {\n \"id\": \"organize\",\n \"options\": {}\n }\n ],\n \"type\": \"timeseries\",\n \"version\": \"3.0.0\"\n },\n {\n \"custom\": {\n \"drawStyle\": \"lines\",\n \"fillOpacity\": 0.3,\n \"gradientMode\": \"opacity\",\n \"lineInterpolation\": \"smooth\",\n \"lineWidth\": 2,\n \"scaleDistribution\": {\n \"type\": \"linear\"\n },\n \"spanNulls\": false,\n \"stack\": \"off\"\n },\n \"datasourceCate\": \"prometheus\",\n \"datasourceValue\": 7,\n \"id\": \"9062d707-d8a7-4a93-82e5-46f6059e8d70\",\n \"layout\": {\n \"h\": 6,\n \"i\": \"d36246b9-4a9c-4ab0-9171-c5ac330be0ca\",\n \"isResizable\": true,\n \"w\": 8,\n \"x\": 16,\n \"y\": 5\n },\n \"maxPerRow\": 4,\n \"name\": \"QPS\",\n \"options\": {\n \"legend\": {\n \"displayMode\": \"list\"\n },\n \"standardOptions\": {\n \"util\": \"none\"\n },\n \"thresholds\": {\n \"steps\": [\n {\n \"color\": \"#634CD9\",\n \"type\": \"base\",\n \"value\": null\n }\n ]\n },\n \"tooltip\": {\n \"mode\": \"all\",\n \"sort\": \"none\"\n }\n },\n \"targets\": [\n {\n \"expr\": \"sum(irate(envoy_http_downstream_rq{envoy_clusterid=\\\"$envoy_clusterid\\\"}[2m]))\",\n \"legend\": \"\",\n \"refId\": \"A\"\n }\n ],\n \"transformations\": [\n {\n \"id\": \"organize\",\n \"options\": {}\n }\n ],\n \"type\": \"timeseries\",\n \"version\": \"3.0.0\"\n },\n {\n \"custom\": {\n \"baseColor\": \"#9470FF\",\n \"calc\": \"lastNotNull\",\n \"serieWidth\": 40,\n \"sortOrder\": \"desc\"\n },\n \"datasourceCate\": \"prometheus\",\n \"datasourceValue\": 7,\n \"id\": \"c3f64cfd-adb2-4316-bb84-55f88ed513a3\",\n \"layout\": {\n \"h\": 6,\n \"i\": \"807c34f9-bd61-4da3-ad88-41bb3e045605\",\n \"isResizable\": true,\n \"w\": 24,\n \"x\": 0,\n \"y\": 11\n },\n \"maxPerRow\": 4,\n \"name\": \"Top Service Request\",\n \"options\": {\n \"standardOptions\": {}\n },\n \"targets\": [\n {\n \"expr\": \"label_replace(label_replace(topk(10, sum(delta(envoy_cluster_upstream_rq_total{envoy_clusterid=\\\"$envoy_clusterid\\\", cluster_name=~\\\"outbound_([0-9]+)_(.*)_(.*).svc.cluster.local$\\\", cluster_name!~\\\".*waf-proxy.static\\\", cluster_name!~\\\"outbound_([0-9]+)_(.*)_kubernetes.default.svc.cluster.local\\\", cluster_name!~\\\"outbound_([0-9]+)_(.*)_(.*).kube-system.svc.cluster.local\\\", cluster_name!~\\\"outbound_([0-9]+)_(.*)_(.*).arms-prom.svc.cluster.local\\\"}[1m])) by (cluster_name)), \\\"service_name\\\", \\\"$3\\\", \\\"cluster_name\\\", \\\"outbound_([0-9]+)_(.*)_(.*).svc.cluster.local$\\\"), \\\"port\\\", \\\"$1\\\", \\\"cluster_name\\\", \\\"outbound_([0-9]+)_(.*)_(.*).svc.cluster.local$\\\")\",\n \"legend\": \"{{service_name}}:{{port}}\",\n \"refId\": \"A\"\n }\n ],\n \"transformations\": [\n {\n \"id\": \"organize\",\n \"options\": {}\n }\n ],\n \"type\": \"barGauge\",\n \"version\": \"3.0.0\"\n },\n {\n \"custom\": {\n \"drawStyle\": \"lines\",\n \"fillOpacity\": 0.3,\n \"gradientMode\": \"opacity\",\n \"lineInterpolation\": \"smooth\",\n \"lineWidth\": 2,\n \"scaleDistribution\": {\n \"type\": \"linear\"\n },\n \"spanNulls\": false,\n \"stack\": \"off\"\n },\n \"datasourceCate\": \"prometheus\",\n \"datasourceValue\": 7,\n \"id\": \"8df57678-ff19-4b63-b768-4dad3f12222b\",\n \"layout\": {\n \"h\": 5,\n \"i\": \"44f413ba-3262-4ccf-a4b1-c1165bafaaff\",\n \"isResizable\": true,\n \"w\": 24,\n \"x\": 0,\n \"y\": 17\n },\n \"maxPerRow\": 4,\n \"name\": \"Top Service RT\",\n \"options\": {\n \"legend\": {\n \"displayMode\": \"hidden\"\n },\n \"standardOptions\": {\n \"util\": \"milliseconds\"\n },\n \"thresholds\": {\n \"steps\": [\n {\n \"color\": \"#634CD9\",\n \"type\": \"base\",\n \"value\": null\n }\n ]\n },\n \"tooltip\": {\n \"mode\": \"all\",\n \"sort\": \"none\"\n }\n },\n \"targets\": [\n {\n \"expr\": \"label_replace(label_replace(avg(delta(envoy_cluster_upstream_rq_time_sum{envoy_clusterid=\\\"$envoy_clusterid\\\", cluster_name=~\\\"outbound_([0-9]+)_(.*)_(.*)$\\\"}[3m])) by (cluster_name) / avg(delta(envoy_cluster_upstream_rq_time_count{envoy_clusterid=\\\"$envoy_clusterid\\\", cluster_name=~\\\"outbound_([0-9]+)_(.*)_(.*)$\\\"}[1m])) by (cluster_name), \\\"service_name\\\", \\\"$3\\\", \\\"cluster_name\\\", \\\"outbound_([0-9]+)_(.*)_(.*)$\\\"), \\\"port\\\", \\\"$1\\\", \\\"cluster_name\\\", \\\"outbound_([0-9]+)_(.*)_(.*)$\\\")\",\n \"legend\": \"{{service_name}}:{{port}}\",\n \"refId\": \"A\"\n }\n ],\n \"transformations\": [\n {\n \"id\": \"organize\",\n \"options\": {}\n }\n ],\n \"type\": \"timeseries\",\n \"version\": \"3.0.0\"\n }\n ],\n \"var\": [\n {\n \"definition\": \"prometheus\",\n \"name\": \"datasource\",\n \"type\": \"datasource\"\n },\n {\n \"datasource\": {\n \"cate\": \"prometheus\",\n \"value\": \"${datasource}\"\n },\n \"definition\": \"label_values(envoy_cluster_bind_errors, envoy_clusterid)\",\n \"hide\": false,\n \"label\": \"envoy_clusterid\",\n \"multi\": false,\n \"name\": \"envoy_clusterid\",\n \"type\": \"query\"\n }\n ],\n \"version\": \"3.0.0\"\n },\n \"public\": 0,\n \"public_cate\": 0,\n \"bgids\": null,\n \"built_in\": 0,\n \"hide\": 0,\n \"uuid\": 1717556327111860000\n}"
},
{
"path": "integrations/AliYun/dashboards/mysql.json",
"content": "{\n \"name\": \"阿里云MySQL\",\n \"tags\": \"阿里云 mysql\",\n \"ident\": \"\",\n \"configs\": {\n \"panels\": [\n {\n \"type\": \"row\",\n \"id\": \"1cb8caf3-ef35-4572-9ecc-71b9f063a685\",\n \"name\": \"关键指标\",\n \"collapsed\": true,\n \"layout\": {\n \"h\": 1,\n \"w\": 24,\n \"x\": 0,\n \"y\": 0,\n \"i\": \"1cb8caf3-ef35-4572-9ecc-71b9f063a685\",\n \"isResizable\": false\n },\n \"panels\": []\n },\n {\n \"type\": \"timeseries\",\n \"id\": \"5aad17df-354e-40de-a643-61da6668939b\",\n \"layout\": {\n \"h\": 5,\n \"w\": 24,\n \"x\": 0,\n \"y\": 1,\n \"i\": \"fcf9515d-3a56-4596-8b3a-d7d8631aa218\",\n \"isResizable\": true\n },\n \"version\": \"3.0.0\",\n \"datasourceCate\": \"prometheus\",\n \"datasourceValue\": \"${datasource}\",\n \"targets\": [\n {\n \"expr\": \"AliyunRds_MySQL_SlowQueries{instanceName=\\\"$instance\\\"}\",\n \"legend\": \"{{instanceName}}\",\n \"refId\": \"A\",\n \"maxDataPoints\": 240\n }\n ],\n \"transformations\": [\n {\n \"id\": \"organize\",\n \"options\": {}\n }\n ],\n \"name\": \"每秒慢查询数量(countS)\",\n \"maxPerRow\": 4,\n \"options\": {\n \"tooltip\": {\n \"mode\": \"all\",\n \"sort\": \"none\"\n },\n \"legend\": {\n \"displayMode\": \"hidden\",\n \"behaviour\": \"showItem\"\n },\n \"standardOptions\": {},\n \"thresholds\": {\n \"steps\": [\n {\n \"color\": \"#634CD9\",\n \"value\": null,\n \"type\": \"base\"\n }\n ]\n }\n },\n \"custom\": {\n \"drawStyle\": \"lines\",\n \"lineInterpolation\": \"smooth\",\n \"spanNulls\": false,\n \"lineWidth\": 2,\n \"fillOpacity\": 0.3,\n \"gradientMode\": \"opacity\",\n \"stack\": \"off\",\n \"scaleDistribution\": {\n \"type\": \"linear\"\n }\n },\n \"overrides\": [\n {\n \"matcher\": {\n \"id\": \"byFrameRefID\"\n },\n \"properties\": {\n \"rightYAxisDisplay\": \"off\"\n }\n }\n ]\n },\n {\n \"type\": \"row\",\n \"id\": \"2b3a816e-94e2-4c9d-9bb8-770c458033db\",\n \"name\": \"基础指标\",\n \"collapsed\": true,\n \"layout\": {\n \"h\": 1,\n \"w\": 24,\n \"x\": 0,\n \"y\": 6,\n \"i\": \"2b3a816e-94e2-4c9d-9bb8-770c458033db\",\n \"isResizable\": false\n },\n \"panels\": []\n },\n {\n \"type\": \"timeseries\",\n \"id\": \"12d4a674-6d09-4b02-aa4f-d767531bd368\",\n \"layout\": {\n \"h\": 4,\n \"w\": 8,\n \"x\": 0,\n \"y\": 7,\n \"i\": \"baba4778-b950-4224-9dac-9ecda041f93b\",\n \"isResizable\": true\n },\n \"version\": \"3.0.0\",\n \"datasourceCate\": \"prometheus\",\n \"datasourceValue\": \"${datasource}\",\n \"targets\": [\n {\n \"expr\": \"AliyunRds_CpuUsage{instanceName=\\\"$instance\\\"}\",\n \"legend\": \"\",\n \"refId\": \"A\",\n \"maxDataPoints\": 240\n }\n ],\n \"transformations\": [\n {\n \"id\": \"organize\",\n \"options\": {}\n }\n ],\n \"name\": \"CPU使用率\",\n \"maxPerRow\": 4,\n \"options\": {\n \"tooltip\": {\n \"mode\": \"all\",\n \"sort\": \"none\"\n },\n \"legend\": {\n \"displayMode\": \"hidden\",\n \"behaviour\": \"showItem\"\n },\n \"standardOptions\": {\n \"util\": \"percent\"\n },\n \"thresholds\": {\n \"steps\": [\n {\n \"color\": \"#634CD9\",\n \"value\": null,\n \"type\": \"base\"\n }\n ]\n }\n },\n \"custom\": {\n \"drawStyle\": \"lines\",\n \"lineInterpolation\": \"smooth\",\n \"spanNulls\": false,\n \"lineWidth\": 2,\n \"fillOpacity\": 0.3,\n \"gradientMode\": \"opacity\",\n \"stack\": \"off\",\n \"scaleDistribution\": {\n \"type\": \"linear\"\n }\n },\n \"overrides\": [\n {\n \"matcher\": {\n \"id\": \"byFrameRefID\"\n },\n \"properties\": {\n \"rightYAxisDisplay\": \"off\"\n }\n }\n ]\n },\n {\n \"type\": \"timeseries\",\n \"id\": \"55b17951-a4ae-46a7-a2d7-57db1414f6ff\",\n \"layout\": {\n \"h\": 4,\n \"w\": 8,\n \"x\": 8,\n \"y\": 7,\n \"i\": \"c4c248bd-21fb-4485-8235-f50640116e65\",\n \"isResizable\": true\n },\n \"version\": \"3.0.0\",\n \"datasourceCate\": \"prometheus\",\n \"datasourceValue\": \"${datasource}\",\n \"targets\": [\n {\n \"expr\": \"AliyunRds_MemoryUsage{instanceName=\\\"$instance\\\"}\",\n \"legend\": \"\",\n \"refId\": \"A\",\n \"maxDataPoints\": 240\n }\n ],\n \"transformations\": [\n {\n \"id\": \"organize\",\n \"options\": {}\n }\n ],\n \"name\": \"内存使用率\",\n \"maxPerRow\": 4,\n \"options\": {\n \"tooltip\": {\n \"mode\": \"all\",\n \"sort\": \"none\"\n },\n \"legend\": {\n \"displayMode\": \"hidden\",\n \"behaviour\": \"showItem\"\n },\n \"standardOptions\": {\n \"util\": \"percent\"\n },\n \"thresholds\": {\n \"steps\": [\n {\n \"color\": \"#634CD9\",\n \"value\": null,\n \"type\": \"base\"\n }\n ]\n }\n },\n \"custom\": {\n \"drawStyle\": \"lines\",\n \"lineInterpolation\": \"smooth\",\n \"spanNulls\": false,\n \"lineWidth\": 2,\n \"fillOpacity\": 0.3,\n \"gradientMode\": \"opacity\",\n \"stack\": \"off\",\n \"scaleDistribution\": {\n \"type\": \"linear\"\n }\n },\n \"overrides\": [\n {\n \"matcher\": {\n \"id\": \"byFrameRefID\"\n },\n \"properties\": {\n \"rightYAxisDisplay\": \"off\"\n }\n }\n ]\n },\n {\n \"type\": \"timeseries\",\n \"id\": \"02c6af68-0e59-4f62-b0e8-80a9a9d0df82\",\n \"layout\": {\n \"h\": 4,\n \"w\": 8,\n \"x\": 16,\n \"y\": 7,\n \"i\": \"51cf9211-5e76-4176-b1ec-42929ccc6803\",\n \"isResizable\": true\n },\n \"version\": \"3.0.0\",\n \"datasourceCate\": \"prometheus\",\n \"datasourceValue\": \"${datasource}\",\n \"targets\": [\n {\n \"expr\": \"AliyunRds_DiskUsage{instanceName=\\\"$instance\\\"}\",\n \"legend\": \"\",\n \"refId\": \"A\",\n \"maxDataPoints\": 240\n }\n ],\n \"transformations\": [\n {\n \"id\": \"organize\",\n \"options\": {}\n }\n ],\n \"name\": \"磁盘使用率\",\n \"maxPerRow\": 4,\n \"options\": {\n \"tooltip\": {\n \"mode\": \"all\",\n \"sort\": \"none\"\n },\n \"legend\": {\n \"displayMode\": \"hidden\",\n \"behaviour\": \"showItem\"\n },\n \"standardOptions\": {\n \"util\": \"percent\"\n },\n \"thresholds\": {\n \"steps\": [\n {\n \"color\": \"#634CD9\",\n \"value\": null,\n \"type\": \"base\"\n }\n ]\n }\n },\n \"custom\": {\n \"drawStyle\": \"lines\",\n \"lineInterpolation\": \"smooth\",\n \"spanNulls\": false,\n \"lineWidth\": 2,\n \"fillOpacity\": 0.3,\n \"gradientMode\": \"opacity\",\n \"stack\": \"off\",\n \"scaleDistribution\": {\n \"type\": \"linear\"\n }\n },\n \"overrides\": [\n {\n \"matcher\": {\n \"id\": \"byFrameRefID\"\n },\n \"properties\": {\n \"rightYAxisDisplay\": \"off\"\n }\n }\n ]\n },\n {\n \"type\": \"timeseries\",\n \"id\": \"b72c5032-1ea0-4c87-9cfd-d21b374680f1\",\n \"layout\": {\n \"h\": 4,\n \"w\": 8,\n \"x\": 0,\n \"y\": 11,\n \"i\": \"b72c5032-1ea0-4c87-9cfd-d21b374680f1\",\n \"isResizable\": true\n },\n \"version\": \"3.0.0\",\n \"datasourceCate\": \"prometheus\",\n \"datasourceValue\": \"${datasource}\",\n \"targets\": [\n {\n \"expr\": \"AliyunRds_MySQL_ActiveSessions{instanceName=\\\"$instance\\\"}\",\n \"legend\": \"\",\n \"refId\": \"A\",\n \"maxDataPoints\": 240\n }\n ],\n \"transformations\": [\n {\n \"id\": \"organize\",\n \"options\": {}\n }\n ],\n \"name\": \"活跃连接数\",\n \"maxPerRow\": 4,\n \"options\": {\n \"tooltip\": {\n \"mode\": \"all\",\n \"sort\": \"none\"\n },\n \"legend\": {\n \"displayMode\": \"hidden\",\n \"behaviour\": \"showItem\"\n },\n \"standardOptions\": {},\n \"thresholds\": {\n \"steps\": [\n {\n \"color\": \"#634CD9\",\n \"value\": null,\n \"type\": \"base\"\n }\n ]\n }\n },\n \"custom\": {\n \"drawStyle\": \"lines\",\n \"lineInterpolation\": \"smooth\",\n \"spanNulls\": false,\n \"lineWidth\": 2,\n \"fillOpacity\": 0.3,\n \"gradientMode\": \"opacity\",\n \"stack\": \"off\",\n \"scaleDistribution\": {\n \"type\": \"linear\"\n }\n },\n \"overrides\": [\n {\n \"matcher\": {\n \"id\": \"byFrameRefID\"\n },\n \"properties\": {\n \"rightYAxisDisplay\": \"off\"\n }\n }\n ]\n },\n {\n \"type\": \"timeseries\",\n \"id\": \"b518c9c4-f0e8-4712-ab67-be4521eeff0c\",\n \"layout\": {\n \"h\": 4,\n \"w\": 8,\n \"x\": 8,\n \"y\": 11,\n \"i\": \"ff589719-6072-488d-819d-6e080a6f3c60\",\n \"isResizable\": true\n },\n \"version\": \"3.0.0\",\n \"datasourceCate\": \"prometheus\",\n \"datasourceValue\": \"${datasource}\",\n \"targets\": [\n {\n \"expr\": \"AliyunRds_ConnectionUsage{instanceName=\\\"$instance\\\"}\",\n \"legend\": \"\",\n \"refId\": \"A\",\n \"maxDataPoints\": 240\n }\n ],\n \"transformations\": [\n {\n \"id\": \"organize\",\n \"options\": {}\n }\n ],\n \"name\": \"连接数使用率\",\n \"maxPerRow\": 4,\n \"options\": {\n \"tooltip\": {\n \"mode\": \"all\",\n \"sort\": \"none\"\n },\n \"legend\": {\n \"displayMode\": \"hidden\",\n \"behaviour\": \"showItem\"\n },\n \"standardOptions\": {},\n \"thresholds\": {\n \"steps\": [\n {\n \"color\": \"#634CD9\",\n \"value\": null,\n \"type\": \"base\"\n }\n ]\n }\n },\n \"custom\": {\n \"drawStyle\": \"lines\",\n \"lineInterpolation\": \"smooth\",\n \"spanNulls\": false,\n \"lineWidth\": 2,\n \"fillOpacity\": 0.3,\n \"gradientMode\": \"opacity\",\n \"stack\": \"off\",\n \"scaleDistribution\": {\n \"type\": \"linear\"\n }\n },\n \"overrides\": [\n {\n \"matcher\": {\n \"id\": \"byFrameRefID\"\n },\n \"properties\": {\n \"rightYAxisDisplay\": \"off\"\n }\n }\n ]\n },\n {\n \"type\": \"timeseries\",\n \"id\": \"86c1f728-ac1e-402b-bea6-2e3979f472c3\",\n \"layout\": {\n \"h\": 4,\n \"w\": 8,\n \"x\": 16,\n \"y\": 11,\n \"i\": \"5d673c5d-1fbb-4df4-9ece-c991d053ca34\",\n \"isResizable\": true\n },\n \"version\": \"3.0.0\",\n \"datasourceCate\": \"prometheus\",\n \"datasourceValue\": \"${datasource}\",\n \"targets\": [\n {\n \"expr\": \"AliyunRds_IOPSUsage{instanceName=\\\"$instance\\\"} \",\n \"legend\": \"\",\n \"refId\": \"A\",\n \"maxDataPoints\": 240\n }\n ],\n \"transformations\": [\n {\n \"id\": \"organize\",\n \"options\": {}\n }\n ],\n \"name\": \"IOPS使用率\",\n \"maxPerRow\": 4,\n \"options\": {\n \"tooltip\": {\n \"mode\": \"all\",\n \"sort\": \"none\"\n },\n \"legend\": {\n \"displayMode\": \"hidden\",\n \"behaviour\": \"showItem\"\n },\n \"standardOptions\": {\n \"util\": \"percent\"\n },\n \"thresholds\": {\n \"steps\": [\n {\n \"color\": \"#634CD9\",\n \"value\": null,\n \"type\": \"base\"\n }\n ]\n }\n },\n \"custom\": {\n \"drawStyle\": \"lines\",\n \"lineInterpolation\": \"smooth\",\n \"spanNulls\": false,\n \"lineWidth\": 2,\n \"fillOpacity\": 0.3,\n \"gradientMode\": \"opacity\",\n \"stack\": \"off\",\n \"scaleDistribution\": {\n \"type\": \"linear\"\n }\n },\n \"overrides\": [\n {\n \"matcher\": {\n \"id\": \"byFrameRefID\"\n },\n \"properties\": {\n \"rightYAxisDisplay\": \"off\",\n \"standardOptions\": {\n \"util\": \"percent\"\n }\n }\n }\n ]\n },\n {\n \"type\": \"timeseries\",\n \"id\": \"dc874418-8d11-409c-96e8-e48fac2f6e20\",\n \"layout\": {\n \"h\": 4,\n \"w\": 8,\n \"x\": 0,\n \"y\": 15,\n \"i\": \"86915dd4-990c-41ba-b048-3da301d97327\",\n \"isResizable\": true\n },\n \"version\": \"3.0.0\",\n \"datasourceCate\": \"prometheus\",\n \"datasourceValue\": \"${datasource}\",\n \"targets\": [\n {\n \"expr\": \"AliyunRds_MySQL_NetworkInNew{instanceName=\\\"$instance\\\"}/ 8\",\n \"legend\": \"\",\n \"refId\": \"A\",\n \"maxDataPoints\": 240\n }\n ],\n \"transformations\": [\n {\n \"id\": \"organize\",\n \"options\": {}\n }\n ],\n \"name\": \"网络流入带宽\",\n \"maxPerRow\": 4,\n \"options\": {\n \"tooltip\": {\n \"mode\": \"all\",\n \"sort\": \"none\"\n },\n \"legend\": {\n \"displayMode\": \"hidden\",\n \"behaviour\": \"showItem\"\n },\n \"standardOptions\": {\n \"util\": \"bytesSecIEC\"\n },\n \"thresholds\": {\n \"steps\": [\n {\n \"color\": \"#634CD9\",\n \"value\": null,\n \"type\": \"base\"\n }\n ]\n }\n },\n \"custom\": {\n \"drawStyle\": \"lines\",\n \"lineInterpolation\": \"smooth\",\n \"spanNulls\": false,\n \"lineWidth\": 2,\n \"fillOpacity\": 0.3,\n \"gradientMode\": \"opacity\",\n \"stack\": \"off\",\n \"scaleDistribution\": {\n \"type\": \"linear\"\n }\n },\n \"overrides\": [\n {\n \"matcher\": {\n \"id\": \"byFrameRefID\"\n },\n \"properties\": {\n \"rightYAxisDisplay\": \"off\"\n }\n }\n ]\n },\n {\n \"type\": \"timeseries\",\n \"id\": \"b979878a-81a6-4c0d-960d-22a736d00655\",\n \"layout\": {\n \"h\": 4,\n \"w\": 8,\n \"x\": 8,\n \"y\": 15,\n \"i\": \"86f9e07f-85dc-44e0-8245-ca0a9b0dfa81\",\n \"isResizable\": true\n },\n \"version\": \"3.0.0\",\n \"datasourceCate\": \"prometheus\",\n \"datasourceValue\": \"${datasource}\",\n \"targets\": [\n {\n \"expr\": \"AliyunRds_MySQL_NetworkOutNew{instanceName=\\\"$instance\\\"}/ 8\",\n \"legend\": \"\",\n \"refId\": \"A\",\n \"maxDataPoints\": 240\n }\n ],\n \"transformations\": [\n {\n \"id\": \"organize\",\n \"options\": {}\n }\n ],\n \"name\": \"网络流出带宽\",\n \"maxPerRow\": 4,\n \"options\": {\n \"tooltip\": {\n \"mode\": \"all\",\n \"sort\": \"none\"\n },\n \"legend\": {\n \"displayMode\": \"hidden\",\n \"behaviour\": \"showItem\"\n },\n \"standardOptions\": {\n \"util\": \"bytesSecIEC\"\n },\n \"thresholds\": {\n \"steps\": [\n {\n \"color\": \"#634CD9\",\n \"value\": null,\n \"type\": \"base\"\n }\n ]\n }\n },\n \"custom\": {\n \"drawStyle\": \"lines\",\n \"lineInterpolation\": \"smooth\",\n \"spanNulls\": false,\n \"lineWidth\": 2,\n \"fillOpacity\": 0.3,\n \"gradientMode\": \"opacity\",\n \"stack\": \"off\",\n \"scaleDistribution\": {\n \"type\": \"linear\"\n }\n },\n \"overrides\": [\n {\n \"matcher\": {\n \"id\": \"byFrameRefID\"\n },\n \"properties\": {\n \"rightYAxisDisplay\": \"off\"\n }\n }\n ]\n },\n {\n \"type\": \"row\",\n \"id\": \"6d896a20-bf04-4dc7-94da-1394ef109848\",\n \"name\": \"性能指标\",\n \"collapsed\": true,\n \"layout\": {\n \"h\": 1,\n \"w\": 24,\n \"x\": 0,\n \"y\": 19,\n \"i\": \"6d896a20-bf04-4dc7-94da-1394ef109848\",\n \"isResizable\": false\n },\n \"panels\": []\n },\n {\n \"type\": \"timeseries\",\n \"id\": \"2e545b2b-130b-4829-a2d2-ee5305c302aa\",\n \"layout\": {\n \"h\": 4,\n \"w\": 8,\n \"x\": 0,\n \"y\": 20,\n \"i\": \"13dceb72-9e9d-483d-86d2-b192debdcece\",\n \"isResizable\": true\n },\n \"version\": \"3.0.0\",\n \"datasourceCate\": \"prometheus\",\n \"datasourceValue\": \"${datasource}\",\n \"targets\": [\n {\n \"expr\": \"AliyunRds_MySQL_QPS{instanceName=\\\"$instance\\\"}\",\n \"legend\": \"\",\n \"refId\": \"A\",\n \"maxDataPoints\": 240\n }\n ],\n \"transformations\": [\n {\n \"id\": \"organize\",\n \"options\": {}\n }\n ],\n \"name\": \"QPS\",\n \"maxPerRow\": 4,\n \"options\": {\n \"tooltip\": {\n \"mode\": \"all\",\n \"sort\": \"none\"\n },\n \"legend\": {\n \"displayMode\": \"hidden\",\n \"behaviour\": \"showItem\"\n },\n \"standardOptions\": {\n \"util\": \"reqps\"\n },\n \"thresholds\": {\n \"steps\": [\n {\n \"color\": \"#634CD9\",\n \"value\": null,\n \"type\": \"base\"\n }\n ]\n }\n },\n \"custom\": {\n \"drawStyle\": \"lines\",\n \"lineInterpolation\": \"smooth\",\n \"spanNulls\": false,\n \"lineWidth\": 2,\n \"fillOpacity\": 0.3,\n \"gradientMode\": \"opacity\",\n \"stack\": \"off\",\n \"scaleDistribution\": {\n \"type\": \"linear\"\n }\n },\n \"overrides\": [\n {\n \"matcher\": {\n \"id\": \"byFrameRefID\"\n },\n \"properties\": {\n \"rightYAxisDisplay\": \"off\"\n }\n }\n ]\n },\n {\n \"type\": \"timeseries\",\n \"id\": \"0299da4b-d779-4ed7-9cd5-096f43181b2e\",\n \"layout\": {\n \"h\": 4,\n \"w\": 8,\n \"x\": 8,\n \"y\": 20,\n \"i\": \"2b23c24e-b6f9-44f5-8151-2d5a7585c31a\",\n \"isResizable\": true\n },\n \"version\": \"3.0.0\",\n \"datasourceCate\": \"prometheus\",\n \"datasourceValue\": \"${datasource}\",\n \"targets\": [\n {\n \"expr\": \"AliyunRds_MySQL_TPS{instanceName=\\\"$instance\\\"}\",\n \"legend\": \"\",\n \"refId\": \"A\",\n \"maxDataPoints\": 240\n }\n ],\n \"transformations\": [\n {\n \"id\": \"organize\",\n \"options\": {}\n }\n ],\n \"name\": \"TPS\",\n \"maxPerRow\": 4,\n \"options\": {\n \"tooltip\": {\n \"mode\": \"all\",\n \"sort\": \"none\"\n },\n \"legend\": {\n \"displayMode\": \"hidden\",\n \"behaviour\": \"showItem\"\n },\n \"standardOptions\": {\n \"util\": \"reqps\"\n },\n \"thresholds\": {\n \"steps\": [\n {\n \"color\": \"#634CD9\",\n \"value\": null,\n \"type\": \"base\"\n }\n ]\n }\n },\n \"custom\": {\n \"drawStyle\": \"lines\",\n \"lineInterpolation\": \"smooth\",\n \"spanNulls\": false,\n \"lineWidth\": 2,\n \"fillOpacity\": 0.3,\n \"gradientMode\": \"opacity\",\n \"stack\": \"off\",\n \"scaleDistribution\": {\n \"type\": \"linear\"\n }\n },\n \"overrides\": [\n {\n \"matcher\": {\n \"id\": \"byFrameRefID\"\n },\n \"properties\": {\n \"rightYAxisDisplay\": \"off\"\n }\n }\n ]\n },\n {\n \"type\": \"timeseries\",\n \"id\": \"56a0e345-1d4d-4051-a3cf-738bea220f96\",\n \"layout\": {\n \"h\": 4,\n \"w\": 8,\n \"x\": 16,\n \"y\": 20,\n \"i\": \"d1752ed4-f4a1-4c4b-854f-1c2ef01b34a4\",\n \"isResizable\": true\n },\n \"version\": \"3.0.0\",\n \"datasourceCate\": \"prometheus\",\n \"datasourceValue\": \"${datasource}\",\n \"targets\": [\n {\n \"expr\": \"AliyunRds_MySQL_IbufUseRatio{instanceName=\\\"$instance\\\"}\",\n \"legend\": \"\",\n \"refId\": \"A\",\n \"maxDataPoints\": 240\n }\n ],\n \"transformations\": [\n {\n \"id\": \"organize\",\n \"options\": {}\n }\n ],\n \"name\": \"BP利用率\",\n \"maxPerRow\": 4,\n \"options\": {\n \"tooltip\": {\n \"mode\": \"all\",\n \"sort\": \"none\"\n },\n \"legend\": {\n \"displayMode\": \"hidden\",\n \"behaviour\": \"showItem\"\n },\n \"standardOptions\": {},\n \"thresholds\": {\n \"steps\": [\n {\n \"color\": \"#634CD9\",\n \"value\": null,\n \"type\": \"base\"\n }\n ]\n }\n },\n \"custom\": {\n \"drawStyle\": \"lines\",\n \"lineInterpolation\": \"smooth\",\n \"spanNulls\": false,\n \"lineWidth\": 2,\n \"fillOpacity\": 0.3,\n \"gradientMode\": \"opacity\",\n \"stack\": \"off\",\n \"scaleDistribution\": {\n \"type\": \"linear\"\n }\n },\n \"overrides\": [\n {\n \"matcher\": {\n \"id\": \"byFrameRefID\"\n },\n \"properties\": {\n \"rightYAxisDisplay\": \"off\"\n }\n }\n ]\n }\n ],\n \"var\": [\n {\n \"name\": \"datasource\",\n \"label\": \"datasource\",\n \"type\": \"datasource\",\n \"hide\": false,\n \"definition\": \"prometheus\"\n },\n {\n \"name\": \"instance\",\n \"label\": \"\",\n \"type\": \"query\",\n \"hide\": false,\n \"datasource\": {\n \"cate\": \"prometheus\",\n \"value\": \"${datasource}\"\n },\n \"definition\": \"label_values(AliyunRds_MySQL_SlowQueries, instanceName)\"\n }\n ],\n \"version\": \"3.0.0\"\n },\n \"uuid\": 1717556327098444000\n}\n"
},
{
"path": "integrations/AliYun/dashboards/nat.json",
"content": "{\n \"id\": 0,\n \"group_id\": 0,\n \"name\": \"阿里云NAT\",\n \"ident\": \"\",\n \"tags\": \"NAT\",\n \"create_at\": 0,\n \"create_by\": \"\",\n \"update_at\": 0,\n \"update_by\": \"\",\n \"configs\": {\n \"panels\": [\n {\n \"collapsed\": false,\n \"id\": \"446c0b21-14f5-4347-a2b6-41a7ffb48e0a\",\n \"layout\": {\n \"h\": 1,\n \"i\": \"446c0b21-14f5-4347-a2b6-41a7ffb48e0a\",\n \"isResizable\": false,\n \"w\": 24,\n \"x\": 0,\n \"y\": 0\n },\n \"name\": \"Snat Session统计\",\n \"type\": \"row\"\n },\n {\n \"custom\": {\n \"drawStyle\": \"lines\",\n \"fillOpacity\": 0.3,\n \"gradientMode\": \"opacity\",\n \"lineInterpolation\": \"smooth\",\n \"lineWidth\": 2,\n \"scaleDistribution\": {\n \"type\": \"linear\"\n },\n \"spanNulls\": false,\n \"stack\": \"off\"\n },\n \"datasourceCate\": \"prometheus\",\n \"datasourceValue\": \"${datasource}\",\n \"id\": \"ec8fcf96-1691-4e45-9a5f-2f183021b434\",\n \"layout\": {\n \"h\": 4,\n \"i\": \"ec8fcf96-1691-4e45-9a5f-2f183021b434\",\n \"isResizable\": true,\n \"w\": 6,\n \"x\": 0,\n \"y\": 1\n },\n \"maxPerRow\": 4,\n \"name\": \"并发连接数\",\n \"options\": {\n \"legend\": {\n \"displayMode\": \"hidden\"\n },\n \"standardOptions\": {},\n \"thresholds\": {\n \"steps\": [\n {\n \"color\": \"#634CD9\",\n \"type\": \"base\",\n \"value\": null\n }\n ]\n },\n \"tooltip\": {\n \"mode\": \"all\",\n \"sort\": \"none\"\n }\n },\n \"targets\": [\n {\n \"expr\": \"aliyun_acs_nat_gateway_session_active_connection_value{instance_id=\\\"$instance_id\\\"}\",\n \"legend\": \"\",\n \"refId\": \"A\"\n }\n ],\n \"transformations\": [\n {\n \"id\": \"organize\",\n \"options\": {}\n }\n ],\n \"type\": \"timeseries\",\n \"version\": \"3.0.0\"\n },\n {\n \"custom\": {\n \"drawStyle\": \"lines\",\n \"fillOpacity\": 0.3,\n \"gradientMode\": \"opacity\",\n \"lineInterpolation\": \"smooth\",\n \"lineWidth\": 2,\n \"scaleDistribution\": {\n \"type\": \"linear\"\n },\n \"spanNulls\": false,\n \"stack\": \"off\"\n },\n \"datasourceCate\": \"prometheus\",\n \"datasourceValue\": \"${datasource}\",\n \"id\": \"be560c38-4046-4f89-af05-bbef24cf21aa\",\n \"layout\": {\n \"h\": 4,\n \"i\": \"48f9d2e1-600c-401a-b351-8d6ee9e33600\",\n \"isResizable\": true,\n \"w\": 6,\n \"x\": 6,\n \"y\": 1\n },\n \"maxPerRow\": 4,\n \"name\": \"并发丢弃连接速率\",\n \"options\": {\n \"legend\": {\n \"displayMode\": \"hidden\"\n },\n \"standardOptions\": {},\n \"thresholds\": {\n \"steps\": [\n {\n \"color\": \"#634CD9\",\n \"type\": \"base\",\n \"value\": null\n }\n ]\n },\n \"tooltip\": {\n \"mode\": \"all\",\n \"sort\": \"none\"\n }\n },\n \"targets\": [\n {\n \"expr\": \"aliyun_acs_nat_gateway_session_limit_drop_connection_value{instance_id=\\\"$instance_id\\\"}\",\n \"legend\": \"\",\n \"refId\": \"A\"\n }\n ],\n \"transformations\": [\n {\n \"id\": \"organize\",\n \"options\": {}\n }\n ],\n \"type\": \"timeseries\",\n \"version\": \"3.0.0\"\n },\n {\n \"custom\": {\n \"drawStyle\": \"lines\",\n \"fillOpacity\": 0.3,\n \"gradientMode\": \"opacity\",\n \"lineInterpolation\": \"smooth\",\n \"lineWidth\": 2,\n \"scaleDistribution\": {\n \"type\": \"linear\"\n },\n \"spanNulls\": false,\n \"stack\": \"off\"\n },\n \"datasourceCate\": \"prometheus\",\n \"datasourceValue\": \"${datasource}\",\n \"id\": \"12563bff-298b-4b44-bd21-0c47df8f9636\",\n \"layout\": {\n \"h\": 4,\n \"i\": \"cad14ba1-6830-4873-9c5e-28f2d1c30f55\",\n \"isResizable\": true,\n \"w\": 6,\n \"x\": 12,\n \"y\": 1\n },\n \"maxPerRow\": 4,\n \"name\": \"新建连接速率\",\n \"options\": {\n \"legend\": {\n \"displayMode\": \"hidden\"\n },\n \"standardOptions\": {},\n \"thresholds\": {\n \"steps\": [\n {\n \"color\": \"#634CD9\",\n \"type\": \"base\",\n \"value\": null\n }\n ]\n },\n \"tooltip\": {\n \"mode\": \"all\",\n \"sort\": \"none\"\n }\n },\n \"targets\": [\n {\n \"expr\": \"aliyun_acs_nat_gateway_session_new_connection_value{instance_id=\\\"$instance_id\\\"}\",\n \"legend\": \"\",\n \"refId\": \"A\"\n }\n ],\n \"transformations\": [\n {\n \"id\": \"organize\",\n \"options\": {}\n }\n ],\n \"type\": \"timeseries\",\n \"version\": \"3.0.0\"\n },\n {\n \"custom\": {\n \"drawStyle\": \"lines\",\n \"fillOpacity\": 0.3,\n \"gradientMode\": \"opacity\",\n \"lineInterpolation\": \"smooth\",\n \"lineWidth\": 2,\n \"scaleDistribution\": {\n \"type\": \"linear\"\n },\n \"spanNulls\": false,\n \"stack\": \"off\"\n },\n \"datasourceCate\": \"prometheus\",\n \"datasourceValue\": \"${datasource}\",\n \"id\": \"0ba23c30-d378-4916-a833-fe46cdbc1a3f\",\n \"layout\": {\n \"h\": 4,\n \"i\": \"35188f14-d7ef-46bd-85cb-a510334ce3c1\",\n \"isResizable\": true,\n \"w\": 6,\n \"x\": 18,\n \"y\": 1\n },\n \"maxPerRow\": 4,\n \"name\": \"新建丢弃连接速率\",\n \"options\": {\n \"legend\": {\n \"displayMode\": \"hidden\"\n },\n \"standardOptions\": {},\n \"thresholds\": {\n \"steps\": [\n {\n \"color\": \"#634CD9\",\n \"type\": \"base\",\n \"value\": null\n }\n ]\n },\n \"tooltip\": {\n \"mode\": \"all\",\n \"sort\": \"none\"\n }\n },\n \"targets\": [\n {\n \"expr\": \"aliyun_acs_nat_gateway_session_new_limit_drop_connection_value{instance_id=\\\"$instance_id\\\"}\",\n \"legend\": \"\",\n \"refId\": \"A\"\n }\n ],\n \"transformations\": [\n {\n \"id\": \"organize\",\n \"options\": {}\n }\n ],\n \"type\": \"timeseries\",\n \"version\": \"3.0.0\"\n },\n {\n \"custom\": {\n \"drawStyle\": \"lines\",\n \"fillOpacity\": 0.3,\n \"gradientMode\": \"opacity\",\n \"lineInterpolation\": \"smooth\",\n \"lineWidth\": 2,\n \"scaleDistribution\": {\n \"type\": \"linear\"\n },\n \"spanNulls\": false,\n \"stack\": \"off\"\n },\n \"datasourceCate\": \"prometheus\",\n \"datasourceValue\": \"${datasource}\",\n \"id\": \"13931491-40cd-4a6a-b888-b81e3800a705\",\n \"layout\": {\n \"h\": 4,\n \"i\": \"345a4573-35a2-4654-9d4d-cdda3134bbac\",\n \"isResizable\": true,\n \"w\": 6,\n \"x\": 0,\n \"y\": 5\n },\n \"maxPerRow\": 4,\n \"name\": \"新建连接水位\",\n \"options\": {\n \"legend\": {\n \"displayMode\": \"hidden\"\n },\n \"standardOptions\": {\n \"util\": \"percent\"\n },\n \"thresholds\": {\n \"steps\": [\n {\n \"color\": \"#634CD9\",\n \"type\": \"base\",\n \"value\": null\n }\n ]\n },\n \"tooltip\": {\n \"mode\": \"all\",\n \"sort\": \"none\"\n }\n },\n \"targets\": [\n {\n \"expr\": \"aliyun_acs_nat_gateway_session_new_connection_water_lever_value{instance_id=\\\"$instance_id\\\"}\",\n \"legend\": \"\",\n \"refId\": \"A\"\n }\n ],\n \"transformations\": [\n {\n \"id\": \"organize\",\n \"options\": {}\n }\n ],\n \"type\": \"timeseries\",\n \"version\": \"3.0.0\"\n },\n {\n \"custom\": {\n \"drawStyle\": \"lines\",\n \"fillOpacity\": 0.3,\n \"gradientMode\": \"opacity\",\n \"lineInterpolation\": \"smooth\",\n \"lineWidth\": 2,\n \"scaleDistribution\": {\n \"type\": \"linear\"\n },\n \"spanNulls\": false,\n \"stack\": \"off\"\n },\n \"datasourceCate\": \"prometheus\",\n \"datasourceValue\": \"${datasource}\",\n \"id\": \"9ff84fb6-81bf-43d8-9abf-4b2f95ef1071\",\n \"layout\": {\n \"h\": 4,\n \"i\": \"5b5e4fc7-ed87-473a-9918-47e3707a639c\",\n \"isResizable\": true,\n \"w\": 6,\n \"x\": 6,\n \"y\": 5\n },\n \"maxPerRow\": 4,\n \"name\": \"并发连接水位\",\n \"options\": {\n \"legend\": {\n \"displayMode\": \"hidden\"\n },\n \"standardOptions\": {\n \"util\": \"percent\"\n },\n \"thresholds\": {\n \"steps\": [\n {\n \"color\": \"#634CD9\",\n \"type\": \"base\",\n \"value\": null\n }\n ]\n },\n \"tooltip\": {\n \"mode\": \"all\",\n \"sort\": \"none\"\n }\n },\n \"targets\": [\n {\n \"expr\": \"aliyun_acs_nat_gateway_session_active_connection_water_lever_value{instance_id=\\\"$instance_id\\\"}\",\n \"legend\": \"\",\n \"refId\": \"A\"\n }\n ],\n \"transformations\": [\n {\n \"id\": \"organize\",\n \"options\": {}\n }\n ],\n \"type\": \"timeseries\",\n \"version\": \"3.0.0\"\n },\n {\n \"custom\": {\n \"drawStyle\": \"lines\",\n \"fillOpacity\": 0.3,\n \"gradientMode\": \"opacity\",\n \"lineInterpolation\": \"smooth\",\n \"lineWidth\": 2,\n \"scaleDistribution\": {\n \"type\": \"linear\"\n },\n \"spanNulls\": false,\n \"stack\": \"off\"\n },\n \"datasourceCate\": \"prometheus\",\n \"datasourceValue\": \"${datasource}\",\n \"id\": \"be39a88e-8433-4cd1-ba3c-68a5bea890bc\",\n \"layout\": {\n \"h\": 4,\n \"i\": \"cbb88b7e-6c95-41f4-a5ea-e607bcf0a30e\",\n \"isResizable\": true,\n \"w\": 6,\n \"x\": 12,\n \"y\": 5\n },\n \"maxPerRow\": 4,\n \"name\": \"区间内port分配失败的个数\",\n \"options\": {\n \"legend\": {\n \"displayMode\": \"hidden\"\n },\n \"standardOptions\": {\n \"util\": \"none\"\n },\n \"thresholds\": {\n \"steps\": [\n {\n \"color\": \"#634CD9\",\n \"type\": \"base\",\n \"value\": null\n }\n ]\n },\n \"tooltip\": {\n \"mode\": \"all\",\n \"sort\": \"none\"\n }\n },\n \"targets\": [\n {\n \"expr\": \"aliyun_acs_nat_gateway_error_port_allocation_count_value{instance_id=\\\"$instance_id\\\"}\",\n \"legend\": \"\",\n \"refId\": \"A\"\n }\n ],\n \"transformations\": [\n {\n \"id\": \"organize\",\n \"options\": {}\n }\n ],\n \"type\": \"timeseries\",\n \"version\": \"3.0.0\"\n },\n {\n \"custom\": {\n \"drawStyle\": \"lines\",\n \"fillOpacity\": 0.3,\n \"gradientMode\": \"opacity\",\n \"lineInterpolation\": \"smooth\",\n \"lineWidth\": 2,\n \"scaleDistribution\": {\n \"type\": \"linear\"\n },\n \"spanNulls\": false,\n \"stack\": \"off\"\n },\n \"datasourceCate\": \"prometheus\",\n \"datasourceValue\": \"${datasource}\",\n \"id\": \"ed75b227-f4bd-4a72-8269-0d7a1b2dd2a7\",\n \"layout\": {\n \"h\": 4,\n \"i\": \"a25ee068-126f-4d7c-acde-574ecd1534ef\",\n \"isResizable\": true,\n \"w\": 6,\n \"x\": 18,\n \"y\": 5\n },\n \"maxPerRow\": 4,\n \"name\": \"区间内port分配失败的速率\",\n \"options\": {\n \"legend\": {\n \"displayMode\": \"hidden\"\n },\n \"standardOptions\": {\n \"util\": \"none\"\n },\n \"thresholds\": {\n \"steps\": [\n {\n \"color\": \"#634CD9\",\n \"type\": \"base\",\n \"value\": null\n }\n ]\n },\n \"tooltip\": {\n \"mode\": \"all\",\n \"sort\": \"none\"\n }\n },\n \"targets\": [\n {\n \"expr\": \"aliyun_acs_nat_gateway_error_port_allocation_rate_value{instance_id=\\\"$instance_id\\\"}\",\n \"legend\": \"\",\n \"refId\": \"A\"\n }\n ],\n \"transformations\": [\n {\n \"id\": \"organize\",\n \"options\": {}\n }\n ],\n \"type\": \"timeseries\",\n \"version\": \"3.0.0\"\n },\n {\n \"collapsed\": true,\n \"id\": \"a638124d-151f-4ad8-994d-a29385747ac8\",\n \"layout\": {\n \"h\": 1,\n \"i\": \"a638124d-151f-4ad8-994d-a29385747ac8\",\n \"isResizable\": false,\n \"w\": 24,\n \"x\": 0,\n \"y\": 9\n },\n \"name\": \"入方向统计\",\n \"type\": \"row\"\n },\n {\n \"custom\": {\n \"drawStyle\": \"lines\",\n \"fillOpacity\": 0.3,\n \"gradientMode\": \"opacity\",\n \"lineInterpolation\": \"smooth\",\n \"lineWidth\": 2,\n \"scaleDistribution\": {\n \"type\": \"linear\"\n },\n \"spanNulls\": false,\n \"stack\": \"off\"\n },\n \"datasourceCate\": \"prometheus\",\n \"datasourceValue\": \"${datasource}\",\n \"id\": \"fc7cda13-3ad0-4e05-8861-38989debd507\",\n \"layout\": {\n \"h\": 4,\n \"i\": \"bf83d311-1cdc-4013-92de-c412a900d2a8\",\n \"isResizable\": true,\n \"w\": 6,\n \"x\": 0,\n \"y\": 10\n },\n \"maxPerRow\": 4,\n \"name\": \"入方向流量速率(bps)\",\n \"options\": {\n \"legend\": {\n \"displayMode\": \"hidden\"\n },\n \"standardOptions\": {\n \"util\": \"bitsIEC\"\n },\n \"thresholds\": {\n \"steps\": [\n {\n \"color\": \"#634CD9\",\n \"type\": \"base\",\n \"value\": null\n }\n ]\n },\n \"tooltip\": {\n \"mode\": \"all\",\n \"sort\": \"none\"\n }\n },\n \"targets\": [\n {\n \"expr\": \"aliyun_acs_nat_gateway_bw_rate_in_from_inside_value{instance_id=\\\"$instance_id\\\"}\",\n \"legend\": \"from_inside\",\n \"refId\": \"A\"\n },\n {\n \"expr\": \"aliyun_acs_nat_gateway_bw_rate_in_from_outside_value{instance_id=\\\"$instance_id\\\"}\",\n \"legend\": \"from_outside\",\n \"refId\": \"B\"\n }\n ],\n \"transformations\": [\n {\n \"id\": \"organize\",\n \"options\": {}\n }\n ],\n \"type\": \"timeseries\",\n \"version\": \"3.0.0\"\n },\n {\n \"custom\": {\n \"drawStyle\": \"lines\",\n \"fillOpacity\": 0.3,\n \"gradientMode\": \"opacity\",\n \"lineInterpolation\": \"smooth\",\n \"lineWidth\": 2,\n \"scaleDistribution\": {\n \"type\": \"linear\"\n },\n \"spanNulls\": false,\n \"stack\": \"off\"\n },\n \"datasourceCate\": \"prometheus\",\n \"datasourceValue\": \"${datasource}\",\n \"id\": \"3b07e195-c481-463f-8de9-c5c7f6539175\",\n \"layout\": {\n \"h\": 4,\n \"i\": \"29363208-08f6-4bfd-a9b0-836062e2b88f\",\n \"isResizable\": true,\n \"w\": 6,\n \"x\": 6,\n \"y\": 10\n },\n \"maxPerRow\": 4,\n \"name\": \"入方向流量(bytes)\",\n \"options\": {\n \"legend\": {\n \"displayMode\": \"hidden\"\n },\n \"standardOptions\": {\n \"util\": \"bytesIEC\"\n },\n \"thresholds\": {\n \"steps\": [\n {\n \"color\": \"#634CD9\",\n \"type\": \"base\",\n \"value\": null\n }\n ]\n },\n \"tooltip\": {\n \"mode\": \"all\",\n \"sort\": \"none\"\n }\n },\n \"targets\": [\n {\n \"expr\": \"aliyun_acs_nat_gateway_bytes_in_from_inside_value{instance_id=\\\"$instance_id\\\"}\",\n \"legend\": \"from_inside\",\n \"refId\": \"A\"\n },\n {\n \"expr\": \"aliyun_acs_nat_gateway_bytes_in_from_outside_value{instance_id=\\\"$instance_id\\\"}\",\n \"legend\": \"from_outside\",\n \"refId\": \"B\"\n }\n ],\n \"transformations\": [\n {\n \"id\": \"organize\",\n \"options\": {}\n }\n ],\n \"type\": \"timeseries\",\n \"version\": \"3.0.0\"\n },\n {\n \"custom\": {\n \"drawStyle\": \"lines\",\n \"fillOpacity\": 0.3,\n \"gradientMode\": \"opacity\",\n \"lineInterpolation\": \"smooth\",\n \"lineWidth\": 2,\n \"scaleDistribution\": {\n \"type\": \"linear\"\n },\n \"spanNulls\": false,\n \"stack\": \"off\"\n },\n \"datasourceCate\": \"prometheus\",\n \"datasourceValue\": \"${datasource}\",\n \"id\": \"be3f5f15-d399-4fd9-84d5-d000d0da86e6\",\n \"layout\": {\n \"h\": 4,\n \"i\": \"0cbe7dd4-eba9-47e6-8c86-e11359a97bc2\",\n \"isResizable\": true,\n \"w\": 6,\n \"x\": 12,\n \"y\": 10\n },\n \"maxPerRow\": 4,\n \"name\": \"入方向包速率\",\n \"options\": {\n \"legend\": {\n \"displayMode\": \"hidden\"\n },\n \"standardOptions\": {\n \"util\": \"bytesIEC\"\n },\n \"thresholds\": {\n \"steps\": [\n {\n \"color\": \"#634CD9\",\n \"type\": \"base\",\n \"value\": null\n }\n ]\n },\n \"tooltip\": {\n \"mode\": \"all\",\n \"sort\": \"none\"\n }\n },\n \"targets\": [\n {\n \"expr\": \"aliyun_acs_nat_gateway_packets_in_from_inside_value{instance_id=\\\"$instance_id\\\"}\",\n \"legend\": \"from_inside\",\n \"refId\": \"A\"\n },\n {\n \"expr\": \"aliyun_acs_nat_gateway_packets_in_from_outside_value{instance_id=\\\"$instance_id\\\"}\",\n \"legend\": \"from_outside\",\n \"refId\": \"B\"\n }\n ],\n \"transformations\": [\n {\n \"id\": \"organize\",\n \"options\": {}\n }\n ],\n \"type\": \"timeseries\",\n \"version\": \"3.0.0\"\n },\n {\n \"custom\": {\n \"drawStyle\": \"lines\",\n \"fillOpacity\": 0.3,\n \"gradientMode\": \"opacity\",\n \"lineInterpolation\": \"smooth\",\n \"lineWidth\": 2,\n \"scaleDistribution\": {\n \"type\": \"linear\"\n },\n \"spanNulls\": false,\n \"stack\": \"off\"\n },\n \"datasourceCate\": \"prometheus\",\n \"datasourceValue\": \"${datasource}\",\n \"id\": \"ffa8eb49-3236-43ec-9fe6-00a2a398d64a\",\n \"layout\": {\n \"h\": 4,\n \"i\": \"339eb9d0-1613-4117-b59c-278b3727ba0a\",\n \"isResizable\": true,\n \"w\": 6,\n \"x\": 18,\n \"y\": 10\n },\n \"maxPerRow\": 4,\n \"name\": \"入方向包量\",\n \"options\": {\n \"legend\": {\n \"displayMode\": \"hidden\"\n },\n \"standardOptions\": {\n \"util\": \"bytesIEC\"\n },\n \"thresholds\": {\n \"steps\": [\n {\n \"color\": \"#634CD9\",\n \"type\": \"base\",\n \"value\": null\n }\n ]\n },\n \"tooltip\": {\n \"mode\": \"all\",\n \"sort\": \"none\"\n }\n },\n \"targets\": [\n {\n \"expr\": \"aliyun_acs_nat_gateway_pps_rate_in_from_inside_value{instance_id=\\\"$instance_id\\\"}\",\n \"legend\": \"from_inside\",\n \"refId\": \"A\"\n },\n {\n \"expr\": \"aliyun_acs_nat_gateway_pps_rate_in_from_outside_value{instance_id=\\\"$instance_id\\\"}\",\n \"legend\": \"from_outside\",\n \"refId\": \"B\"\n }\n ],\n \"transformations\": [\n {\n \"id\": \"organize\",\n \"options\": {}\n }\n ],\n \"type\": \"timeseries\",\n \"version\": \"3.0.0\"\n },\n {\n \"collapsed\": true,\n \"id\": \"b8e7b1b9-4e8d-4a26-b524-13a1cc141b6e\",\n \"layout\": {\n \"h\": 1,\n \"i\": \"b8e7b1b9-4e8d-4a26-b524-13a1cc141b6e\",\n \"isResizable\": false,\n \"w\": 24,\n \"x\": 0,\n \"y\": 14\n },\n \"name\": \"出方向统计\",\n \"type\": \"row\"\n },\n {\n \"custom\": {\n \"drawStyle\": \"lines\",\n \"fillOpacity\": 0.3,\n \"gradientMode\": \"opacity\",\n \"lineInterpolation\": \"smooth\",\n \"lineWidth\": 2,\n \"scaleDistribution\": {\n \"type\": \"linear\"\n },\n \"spanNulls\": false,\n \"stack\": \"off\"\n },\n \"datasourceCate\": \"prometheus\",\n \"datasourceValue\": \"${datasource}\",\n \"id\": \"e1d94e76-9e7f-4a7e-b207-e4bc63382e06\",\n \"layout\": {\n \"h\": 4,\n \"i\": \"8c17c2d6-aba3-4b40-8a85-71e57f53d71b\",\n \"isResizable\": true,\n \"w\": 6,\n \"x\": 0,\n \"y\": 15\n },\n \"maxPerRow\": 4,\n \"name\": \"出方向流量速率(bps)\",\n \"options\": {\n \"legend\": {\n \"displayMode\": \"hidden\"\n },\n \"standardOptions\": {\n \"util\": \"bitsIEC\"\n },\n \"thresholds\": {\n \"steps\": [\n {\n \"color\": \"#634CD9\",\n \"type\": \"base\",\n \"value\": null\n }\n ]\n },\n \"tooltip\": {\n \"mode\": \"all\",\n \"sort\": \"none\"\n }\n },\n \"targets\": [\n {\n \"expr\": \"aliyun_acs_nat_gateway_bw_rate_out_to_inside_value{instance_id=\\\"$instance_id\\\"}\",\n \"legend\": \"out_to_inside\",\n \"refId\": \"A\"\n },\n {\n \"expr\": \"aliyun_acs_nat_gateway_bw_rate_out_to_outside_value{instance_id=\\\"$instance_id\\\"}\",\n \"legend\": \"out_to_outside\",\n \"refId\": \"B\"\n }\n ],\n \"transformations\": [\n {\n \"id\": \"organize\",\n \"options\": {}\n }\n ],\n \"type\": \"timeseries\",\n \"version\": \"3.0.0\"\n },\n {\n \"custom\": {\n \"drawStyle\": \"lines\",\n \"fillOpacity\": 0.3,\n \"gradientMode\": \"opacity\",\n \"lineInterpolation\": \"smooth\",\n \"lineWidth\": 2,\n \"scaleDistribution\": {\n \"type\": \"linear\"\n },\n \"spanNulls\": false,\n \"stack\": \"off\"\n },\n \"datasourceCate\": \"prometheus\",\n \"datasourceValue\": \"${datasource}\",\n \"id\": \"d314b395-16d6-4fe9-a020-84ca656f0117\",\n \"layout\": {\n \"h\": 4,\n \"i\": \"65c4598a-1a95-4d55-b0ac-ae2446c7c98a\",\n \"isResizable\": true,\n \"w\": 6,\n \"x\": 6,\n \"y\": 15\n },\n \"maxPerRow\": 4,\n \"name\": \"出方向流量(bytes)\",\n \"options\": {\n \"legend\": {\n \"displayMode\": \"hidden\"\n },\n \"standardOptions\": {\n \"util\": \"bytesIEC\"\n },\n \"thresholds\": {\n \"steps\": [\n {\n \"color\": \"#634CD9\",\n \"type\": \"base\",\n \"value\": null\n }\n ]\n },\n \"tooltip\": {\n \"mode\": \"all\",\n \"sort\": \"none\"\n }\n },\n \"targets\": [\n {\n \"expr\": \"aliyun_acs_nat_gateway_bytes_out_to_inside_value{instance_id=\\\"$instance_id\\\"}\",\n \"legend\": \"out_to_inside\",\n \"refId\": \"A\"\n },\n {\n \"expr\": \"aliyun_acs_nat_gateway_bytes_out_to_outside_value{instance_id=\\\"$instance_id\\\"}\",\n \"legend\": \"out_to_outside\",\n \"refId\": \"B\"\n }\n ],\n \"transformations\": [\n {\n \"id\": \"organize\",\n \"options\": {}\n }\n ],\n \"type\": \"timeseries\",\n \"version\": \"3.0.0\"\n },\n {\n \"custom\": {\n \"drawStyle\": \"lines\",\n \"fillOpacity\": 0.3,\n \"gradientMode\": \"opacity\",\n \"lineInterpolation\": \"smooth\",\n \"lineWidth\": 2,\n \"scaleDistribution\": {\n \"type\": \"linear\"\n },\n \"spanNulls\": false,\n \"stack\": \"off\"\n },\n \"datasourceCate\": \"prometheus\",\n \"datasourceValue\": \"${datasource}\",\n \"id\": \"efd5b118-f530-4750-8ac8-c9e8ae4da600\",\n \"layout\": {\n \"h\": 4,\n \"i\": \"9c22e1d7-8d2c-47c9-83ce-37e9eccbc8a4\",\n \"isResizable\": true,\n \"w\": 6,\n \"x\": 12,\n \"y\": 15\n },\n \"maxPerRow\": 4,\n \"name\": \"出方向包速率\",\n \"options\": {\n \"legend\": {\n \"displayMode\": \"hidden\"\n },\n \"standardOptions\": {\n \"util\": \"bytesIEC\"\n },\n \"thresholds\": {\n \"steps\": [\n {\n \"color\": \"#634CD9\",\n \"type\": \"base\",\n \"value\": null\n }\n ]\n },\n \"tooltip\": {\n \"mode\": \"all\",\n \"sort\": \"none\"\n }\n },\n \"targets\": [\n {\n \"expr\": \"aliyun_acs_nat_gateway_packets_out_to_inside_value{instance_id=\\\"$instance_id\\\"}\",\n \"legend\": \"out_to_inside\",\n \"refId\": \"A\"\n },\n {\n \"expr\": \"aliyun_acs_nat_gateway_packets_out_to_outside_value{instance_id=\\\"$instance_id\\\"}\",\n \"legend\": \"out_to_outside\",\n \"refId\": \"B\"\n }\n ],\n \"transformations\": [\n {\n \"id\": \"organize\",\n \"options\": {}\n }\n ],\n \"type\": \"timeseries\",\n \"version\": \"3.0.0\"\n },\n {\n \"custom\": {\n \"drawStyle\": \"lines\",\n \"fillOpacity\": 0.3,\n \"gradientMode\": \"opacity\",\n \"lineInterpolation\": \"smooth\",\n \"lineWidth\": 2,\n \"scaleDistribution\": {\n \"type\": \"linear\"\n },\n \"spanNulls\": false,\n \"stack\": \"off\"\n },\n \"datasourceCate\": \"prometheus\",\n \"datasourceValue\": \"${datasource}\",\n \"id\": \"50d416eb-3518-4f37-a554-17bb9af79dd8\",\n \"layout\": {\n \"h\": 4,\n \"i\": \"3bd0c456-6d70-4479-b5aa-ed68705fda7e\",\n \"isResizable\": true,\n \"w\": 6,\n \"x\": 18,\n \"y\": 15\n },\n \"maxPerRow\": 4,\n \"name\": \"出方向包量\",\n \"options\": {\n \"legend\": {\n \"displayMode\": \"hidden\"\n },\n \"standardOptions\": {\n \"util\": \"bytesIEC\"\n },\n \"thresholds\": {\n \"steps\": [\n {\n \"color\": \"#634CD9\",\n \"type\": \"base\",\n \"value\": null\n }\n ]\n },\n \"tooltip\": {\n \"mode\": \"all\",\n \"sort\": \"none\"\n }\n },\n \"targets\": [\n {\n \"expr\": \"aliyun_acs_nat_gateway_pps_rate_out_to_inside_value{instance_id=\\\"$instance_id\\\"}\",\n \"legend\": \"out_to_inside\",\n \"refId\": \"A\"\n },\n {\n \"expr\": \"aliyun_acs_nat_gateway_pps_rate_out_to_outside_value{instance_id=\\\"$instance_id\\\"}\",\n \"legend\": \"out_to_outside\",\n \"refId\": \"B\"\n }\n ],\n \"transformations\": [\n {\n \"id\": \"organize\",\n \"options\": {}\n }\n ],\n \"type\": \"timeseries\",\n \"version\": \"3.0.0\"\n }\n ],\n \"var\": [\n {\n \"definition\": \"prometheus\",\n \"label\": \"datasource\",\n \"name\": \"datasource\",\n \"type\": \"datasource\"\n },\n {\n \"datasource\": {\n \"cate\": \"prometheus\",\n \"value\": \"${datasource}\"\n },\n \"definition\": \"label_values(aliyun_acs_nat_gateway_bw_rate_in_from_inside_value, instance_id)\",\n \"label\": \"instance_id\",\n \"name\": \"instance_id\",\n \"type\": \"query\"\n }\n ],\n \"version\": \"3.0.0\"\n },\n \"public\": 0,\n \"public_cate\": 0,\n \"bgids\": null,\n \"built_in\": 0,\n \"hide\": 0,\n \"uuid\": 1717556327113592000\n}"
},
{
"path": "integrations/AliYun/dashboards/oss.json",
"content": "{\n \"id\": 0,\n \"group_id\": 0,\n \"name\": \"阿里云OSS\",\n \"ident\": \"\",\n \"tags\": \"\",\n \"create_at\": 0,\n \"create_by\": \"\",\n \"update_at\": 0,\n \"update_by\": \"\",\n \"configs\": {\n \"panels\": [\n {\n \"collapsed\": true,\n \"id\": \"ae6ab52c-c38f-4697-aa93-1a4a7beed598\",\n \"layout\": {\n \"h\": 1,\n \"i\": \"ae6ab52c-c38f-4697-aa93-1a4a7beed598\",\n \"isResizable\": false,\n \"w\": 24,\n \"x\": 0,\n \"y\": 0\n },\n \"name\": \"整体情况\",\n \"panels\": [],\n \"type\": \"row\"\n },\n {\n \"custom\": {\n \"drawStyle\": \"lines\",\n \"fillOpacity\": 0.3,\n \"gradientMode\": \"opacity\",\n \"lineInterpolation\": \"smooth\",\n \"lineWidth\": 2,\n \"scaleDistribution\": {\n \"type\": \"linear\"\n },\n \"spanNulls\": false,\n \"stack\": \"off\"\n },\n \"datasourceCate\": \"prometheus\",\n \"datasourceValue\": \"${datasource}\",\n \"id\": \"aff2b3e8-e536-491e-98e4-e15639922ec5\",\n \"layout\": {\n \"h\": 4,\n \"i\": \"e440abe0-5b4d-4877-ac1e-1d5b37c3db6c\",\n \"isResizable\": true,\n \"w\": 12,\n \"x\": 0,\n \"y\": 1\n },\n \"maxPerRow\": 4,\n \"name\": \"可用性/有效请求率\",\n \"options\": {\n \"legend\": {\n \"displayMode\": \"hidden\"\n },\n \"standardOptions\": {},\n \"thresholds\": {\n \"steps\": [\n {\n \"color\": \"#634CD9\",\n \"type\": \"base\",\n \"value\": null\n }\n ]\n },\n \"tooltip\": {\n \"mode\": \"all\",\n \"sort\": \"none\"\n }\n },\n \"targets\": [\n {\n \"expr\": \"aliyun_acs_oss_dashboard_availability_value{user_id=\\\"$user_id\\\"}\",\n \"legend\": \"可用性\",\n \"refId\": \"A\"\n },\n {\n \"expr\": \"aliyun_acs_oss_dashboard_request_valid_rate_value{user_id=\\\"$user_id\\\"}\",\n \"legend\": \"有效请求率\",\n \"refId\": \"B\"\n }\n ],\n \"transformations\": [\n {\n \"id\": \"organize\",\n \"options\": {}\n }\n ],\n \"type\": \"timeseries\",\n \"version\": \"3.0.0\"\n },\n {\n \"custom\": {\n \"drawStyle\": \"lines\",\n \"fillOpacity\": 0.3,\n \"gradientMode\": \"opacity\",\n \"lineInterpolation\": \"smooth\",\n \"lineWidth\": 2,\n \"scaleDistribution\": {\n \"type\": \"linear\"\n },\n \"spanNulls\": false,\n \"stack\": \"off\"\n },\n \"datasourceCate\": \"prometheus\",\n \"datasourceValue\": \"${datasource}\",\n \"id\": \"db8f77c9-fd97-4f58-af82-b51992bd5495\",\n \"layout\": {\n \"h\": 4,\n \"i\": \"db8f77c9-fd97-4f58-af82-b51992bd5495\",\n \"isResizable\": true,\n \"w\": 12,\n \"x\": 12,\n \"y\": 1\n },\n \"maxPerRow\": 4,\n \"name\": \"总请求数/有效请求数\",\n \"options\": {\n \"legend\": {\n \"displayMode\": \"hidden\"\n },\n \"standardOptions\": {},\n \"thresholds\": {\n \"steps\": [\n {\n \"color\": \"#634CD9\",\n \"type\": \"base\",\n \"value\": null\n }\n ]\n },\n \"tooltip\": {\n \"mode\": \"all\",\n \"sort\": \"none\"\n }\n },\n \"targets\": [\n {\n \"expr\": \"aliyun_acs_oss_dashboard_total_request_count_value{user_id=\\\"$user_id\\\"}\",\n \"legend\": \"总请求数\",\n \"refId\": \"A\"\n },\n {\n \"expr\": \"aliyun_acs_oss_dashboard_valid_request_count_value{user_id=\\\"$user_id\\\"}\",\n \"legend\": \"效请求数\",\n \"refId\": \"B\"\n }\n ],\n \"transformations\": [\n {\n \"id\": \"organize\",\n \"options\": {}\n }\n ],\n \"type\": \"timeseries\",\n \"version\": \"3.0.0\"\n },\n {\n \"custom\": {\n \"drawStyle\": \"lines\",\n \"fillOpacity\": 0.3,\n \"gradientMode\": \"opacity\",\n \"lineInterpolation\": \"smooth\",\n \"lineWidth\": 2,\n \"scaleDistribution\": {\n \"type\": \"linear\"\n },\n \"spanNulls\": false,\n \"stack\": \"off\"\n },\n \"datasourceCate\": \"prometheus\",\n \"datasourceValue\": \"${datasource}\",\n \"id\": \"e28752b4-5f16-4358-a363-e76ddddb9c24\",\n \"layout\": {\n \"h\": 4,\n \"i\": \"facf2d97-6eba-4559-80c8-73c0164fa29c\",\n \"isResizable\": true,\n \"w\": 12,\n \"x\": 0,\n \"y\": 5\n },\n \"maxPerRow\": 4,\n \"name\": \"公网出流量/公网入流量\",\n \"options\": {\n \"legend\": {\n \"displayMode\": \"hidden\"\n },\n \"standardOptions\": {\n \"util\": \"bytesIEC\"\n },\n \"thresholds\": {\n \"steps\": [\n {\n \"color\": \"#634CD9\",\n \"type\": \"base\",\n \"value\": null\n }\n ]\n },\n \"tooltip\": {\n \"mode\": \"all\",\n \"sort\": \"none\"\n }\n },\n \"targets\": [\n {\n \"expr\": \"aliyun_acs_oss_dashboard_internet_send_value{user_id=\\\"$user_id\\\"}\",\n \"legend\": \"公网出流量\",\n \"refId\": \"A\"\n },\n {\n \"expr\": \"aliyun_acs_oss_dashboard_internet_recv_value{user_id=\\\"$user_id\\\"}\",\n \"legend\": \"公网入流量\",\n \"refId\": \"B\"\n }\n ],\n \"transformations\": [\n {\n \"id\": \"organize\",\n \"options\": {}\n }\n ],\n \"type\": \"timeseries\",\n \"version\": \"3.0.0\"\n },\n {\n \"collapsed\": true,\n \"id\": \"98d4c729-06c9-4e67-aa57-7864f2e46d98\",\n \"layout\": {\n \"h\": 1,\n \"i\": \"98d4c729-06c9-4e67-aa57-7864f2e46d98\",\n \"isResizable\": false,\n \"w\": 24,\n \"x\": 0,\n \"y\": 9\n },\n \"name\": \"请求状态详情\",\n \"type\": \"row\"\n },\n {\n \"custom\": {\n \"drawStyle\": \"lines\",\n \"fillOpacity\": 0.3,\n \"gradientMode\": \"opacity\",\n \"lineInterpolation\": \"smooth\",\n \"lineWidth\": 2,\n \"scaleDistribution\": {\n \"type\": \"linear\"\n },\n \"spanNulls\": false,\n \"stack\": \"off\"\n },\n \"datasourceCate\": \"prometheus\",\n \"datasourceValue\": \"${datasource}\",\n \"id\": \"b8217fcb-278e-4dfe-8449-56bc9ebcb1c3\",\n \"layout\": {\n \"h\": 4,\n \"i\": \"61ae3ba8-3a75-4297-b53f-f9de5c8476da\",\n \"isResizable\": true,\n \"w\": 6,\n \"x\": 0,\n \"y\": 10\n },\n \"maxPerRow\": 4,\n \"name\": \"服务端错误请求数\",\n \"options\": {\n \"legend\": {\n \"displayMode\": \"hidden\"\n },\n \"standardOptions\": {\n \"util\": \"none\"\n },\n \"thresholds\": {\n \"steps\": [\n {\n \"color\": \"#634CD9\",\n \"type\": \"base\",\n \"value\": null\n }\n ]\n },\n \"tooltip\": {\n \"mode\": \"all\",\n \"sort\": \"none\"\n }\n },\n \"targets\": [\n {\n \"expr\": \"aliyun_acs_oss_dashboard_server_error_count_value{user_id=\\\"$user_id\\\"}\",\n \"legend\": \"服务端错误请求数\",\n \"refId\": \"A\"\n }\n ],\n \"transformations\": [\n {\n \"id\": \"organize\",\n \"options\": {}\n }\n ],\n \"type\": \"timeseries\",\n \"version\": \"3.0.0\"\n },\n {\n \"custom\": {\n \"drawStyle\": \"lines\",\n \"fillOpacity\": 0.3,\n \"gradientMode\": \"opacity\",\n \"lineInterpolation\": \"smooth\",\n \"lineWidth\": 2,\n \"scaleDistribution\": {\n \"type\": \"linear\"\n },\n \"spanNulls\": false,\n \"stack\": \"off\"\n },\n \"datasourceCate\": \"prometheus\",\n \"datasourceValue\": \"${datasource}\",\n \"id\": \"1cb9ec59-73dc-4559-b7f0-ca90679bda79\",\n \"layout\": {\n \"h\": 4,\n \"i\": \"e6566470-8b07-4061-bdff-1cfb38daa963\",\n \"isResizable\": true,\n \"w\": 6,\n \"x\": 6,\n \"y\": 10\n },\n \"maxPerRow\": 4,\n \"name\": \"服务端错误请求占比\",\n \"options\": {\n \"legend\": {\n \"displayMode\": \"hidden\"\n },\n \"standardOptions\": {\n \"util\": \"none\"\n },\n \"thresholds\": {\n \"steps\": [\n {\n \"color\": \"#634CD9\",\n \"type\": \"base\",\n \"value\": null\n }\n ]\n },\n \"tooltip\": {\n \"mode\": \"all\",\n \"sort\": \"none\"\n }\n },\n \"targets\": [\n {\n \"expr\": \"aliyun_acs_oss_dashboard_server_error_rate_value{user_id=\\\"$user_id\\\"}\",\n \"legend\": \"服务端错误请求占比\",\n \"refId\": \"A\"\n }\n ],\n \"transformations\": [\n {\n \"id\": \"organize\",\n \"options\": {}\n }\n ],\n \"type\": \"timeseries\",\n \"version\": \"3.0.0\"\n },\n {\n \"custom\": {\n \"drawStyle\": \"lines\",\n \"fillOpacity\": 0.3,\n \"gradientMode\": \"opacity\",\n \"lineInterpolation\": \"smooth\",\n \"lineWidth\": 2,\n \"scaleDistribution\": {\n \"type\": \"linear\"\n },\n \"spanNulls\": false,\n \"stack\": \"off\"\n },\n \"datasourceCate\": \"prometheus\",\n \"datasourceValue\": \"${datasource}\",\n \"id\": \"5f48c124-d36b-423d-bc11-fa0b9fdca3f2\",\n \"layout\": {\n \"h\": 4,\n \"i\": \"104c6702-9114-421a-ad5e-7ad4b72d0c02\",\n \"isResizable\": true,\n \"w\": 6,\n \"x\": 12,\n \"y\": 10\n },\n \"maxPerRow\": 4,\n \"name\": \"网络错误请求数\",\n \"options\": {\n \"legend\": {\n \"displayMode\": \"hidden\"\n },\n \"standardOptions\": {\n \"util\": \"none\"\n },\n \"thresholds\": {\n \"steps\": [\n {\n \"color\": \"#634CD9\",\n \"type\": \"base\",\n \"value\": null\n }\n ]\n },\n \"tooltip\": {\n \"mode\": \"all\",\n \"sort\": \"none\"\n }\n },\n \"targets\": [\n {\n \"expr\": \"aliyun_acs_oss_dashboard_network_error_count_value{user_id=\\\"$user_id\\\"}\",\n \"legend\": \"网络错误请求数\",\n \"refId\": \"A\"\n }\n ],\n \"transformations\": [\n {\n \"id\": \"organize\",\n \"options\": {}\n }\n ],\n \"type\": \"timeseries\",\n \"version\": \"3.0.0\"\n },\n {\n \"custom\": {\n \"drawStyle\": \"lines\",\n \"fillOpacity\": 0.3,\n \"gradientMode\": \"opacity\",\n \"lineInterpolation\": \"smooth\",\n \"lineWidth\": 2,\n \"scaleDistribution\": {\n \"type\": \"linear\"\n },\n \"spanNulls\": false,\n \"stack\": \"off\"\n },\n \"datasourceCate\": \"prometheus\",\n \"datasourceValue\": \"${datasource}\",\n \"id\": \"755a1c23-48c5-4491-b009-5137882723b0\",\n \"layout\": {\n \"h\": 4,\n \"i\": \"082830cf-310a-4108-98e2-0c60d5c5bc35\",\n \"isResizable\": true,\n \"w\": 6,\n \"x\": 18,\n \"y\": 10\n },\n \"maxPerRow\": 4,\n \"name\": \"网络错误请求占比\",\n \"options\": {\n \"legend\": {\n \"displayMode\": \"hidden\"\n },\n \"standardOptions\": {\n \"util\": \"none\"\n },\n \"thresholds\": {\n \"steps\": [\n {\n \"color\": \"#634CD9\",\n \"type\": \"base\",\n \"value\": null\n }\n ]\n },\n \"tooltip\": {\n \"mode\": \"all\",\n \"sort\": \"none\"\n }\n },\n \"targets\": [\n {\n \"expr\": \"aliyun_acs_oss_dashboard_network_error_rate_value{user_id=\\\"$user_id\\\"}\",\n \"legend\": \"网络错误请求占比\",\n \"refId\": \"A\"\n }\n ],\n \"transformations\": [\n {\n \"id\": \"organize\",\n \"options\": {}\n }\n ],\n \"type\": \"timeseries\",\n \"version\": \"3.0.0\"\n },\n {\n \"custom\": {\n \"drawStyle\": \"lines\",\n \"fillOpacity\": 0.3,\n \"gradientMode\": \"opacity\",\n \"lineInterpolation\": \"smooth\",\n \"lineWidth\": 2,\n \"scaleDistribution\": {\n \"type\": \"linear\"\n },\n \"spanNulls\": false,\n \"stack\": \"off\"\n },\n \"datasourceCate\": \"prometheus\",\n \"datasourceValue\": \"${datasource}\",\n \"id\": \"f486359b-2733-4d92-adb9-1348f9565d65\",\n \"layout\": {\n \"h\": 4,\n \"i\": \"1cb945cc-4b3c-4f2c-ace4-8037ad0e8816\",\n \"isResizable\": true,\n \"w\": 6,\n \"x\": 0,\n \"y\": 14\n },\n \"maxPerRow\": 4,\n \"name\": \"客户端错误请求数\",\n \"options\": {\n \"legend\": {\n \"displayMode\": \"hidden\"\n },\n \"standardOptions\": {\n \"util\": \"none\"\n },\n \"thresholds\": {\n \"steps\": [\n {\n \"color\": \"#634CD9\",\n \"type\": \"base\",\n \"value\": null\n }\n ]\n },\n \"tooltip\": {\n \"mode\": \"all\",\n \"sort\": \"none\"\n }\n },\n \"targets\": [\n {\n \"expr\": \"aliyun_acs_oss_dashboard_client_other_error_count_value{user_id=\\\"$user_id\\\"}\",\n \"legend\": \"客户端其他错误请求数\",\n \"refId\": \"A\"\n },\n {\n \"expr\": \"aliyun_acs_oss_dashboard_client_timeout_error_count_value{user_id=\\\"$user_id\\\"}\",\n \"legend\": \"客户端超时错误请求数\",\n \"refId\": \"B\"\n },\n {\n \"expr\": \"aliyun_acs_oss_dashboard_resource_not_found_error_count_value{user_id=\\\"$user_id\\\"}\",\n \"legend\": \"客户端资源不存在错误请求数\",\n \"refId\": \"C\"\n },\n {\n \"expr\": \"aliyun_acs_oss_dashboard_authorization_error_count_value{user_id=\\\"$user_id\\\"}\",\n \"legend\": \"客户端授权错误请求数\",\n \"refId\": \"D\"\n }\n ],\n \"transformations\": [\n {\n \"id\": \"organize\",\n \"options\": {}\n }\n ],\n \"type\": \"timeseries\",\n \"version\": \"3.0.0\"\n },\n {\n \"custom\": {\n \"drawStyle\": \"lines\",\n \"fillOpacity\": 0.3,\n \"gradientMode\": \"opacity\",\n \"lineInterpolation\": \"smooth\",\n \"lineWidth\": 2,\n \"scaleDistribution\": {\n \"type\": \"linear\"\n },\n \"spanNulls\": false,\n \"stack\": \"off\"\n },\n \"datasourceCate\": \"prometheus\",\n \"datasourceValue\": \"${datasource}\",\n \"id\": \"d525f038-812e-4024-9a8c-d4a9cbcf9d87\",\n \"layout\": {\n \"h\": 4,\n \"i\": \"a237200b-1f05-4093-9aa6-d1e27770c38f\",\n \"isResizable\": true,\n \"w\": 6,\n \"x\": 6,\n \"y\": 14\n },\n \"maxPerRow\": 4,\n \"name\": \"客户端错误请求占比\",\n \"options\": {\n \"legend\": {\n \"displayMode\": \"hidden\"\n },\n \"standardOptions\": {\n \"util\": \"none\"\n },\n \"thresholds\": {\n \"steps\": [\n {\n \"color\": \"#634CD9\",\n \"type\": \"base\",\n \"value\": null\n }\n ]\n },\n \"tooltip\": {\n \"mode\": \"all\",\n \"sort\": \"none\"\n }\n },\n \"targets\": [\n {\n \"expr\": \"aliyun_acs_oss_dashboard_client_other_error_rate_value{user_id=\\\"$user_id\\\"}\",\n \"legend\": \"客户端其他错误请求占比\",\n \"refId\": \"A\"\n },\n {\n \"expr\": \"aliyun_acs_oss_dashboard_client_timeout_error_rate_value{user_id=\\\"$user_id\\\"}\",\n \"legend\": \"客户端超时错误请求占比\",\n \"refId\": \"B\"\n },\n {\n \"expr\": \"aliyun_acs_oss_dashboard_resource_not_found_error_rate_value{user_id=\\\"$user_id\\\"}\",\n \"legend\": \"客户端资源不存在错误请求占比\",\n \"refId\": \"C\"\n },\n {\n \"expr\": \"aliyun_acs_oss_dashboard_authorization_error_rate_value{user_id=\\\"$user_id\\\"}\",\n \"legend\": \"客户端授权错误请求占比\",\n \"refId\": \"D\"\n }\n ],\n \"transformations\": [\n {\n \"id\": \"organize\",\n \"options\": {}\n }\n ],\n \"type\": \"timeseries\",\n \"version\": \"3.0.0\"\n },\n {\n \"custom\": {\n \"drawStyle\": \"lines\",\n \"fillOpacity\": 0.3,\n \"gradientMode\": \"opacity\",\n \"lineInterpolation\": \"smooth\",\n \"lineWidth\": 2,\n \"scaleDistribution\": {\n \"type\": \"linear\"\n },\n \"spanNulls\": false,\n \"stack\": \"off\"\n },\n \"datasourceCate\": \"prometheus\",\n \"datasourceValue\": \"${datasource}\",\n \"id\": \"39c5dc8b-5e87-47c8-89ba-73a9985483e2\",\n \"layout\": {\n \"h\": 4,\n \"i\": \"74a86f62-668c-426c-b69d-4f9e5fd6fb2b\",\n \"isResizable\": true,\n \"w\": 6,\n \"x\": 12,\n \"y\": 14\n },\n \"maxPerRow\": 4,\n \"name\": \"有效请求数\",\n \"options\": {\n \"legend\": {\n \"displayMode\": \"hidden\"\n },\n \"standardOptions\": {\n \"util\": \"none\"\n },\n \"thresholds\": {\n \"steps\": [\n {\n \"color\": \"#634CD9\",\n \"type\": \"base\",\n \"value\": null\n }\n ]\n },\n \"tooltip\": {\n \"mode\": \"all\",\n \"sort\": \"none\"\n }\n },\n \"targets\": [\n {\n \"expr\": \"aliyun_acs_oss_dashboard_success_count_value{user_id=\\\"$user_id\\\"}\",\n \"legend\": \"成功请求数\",\n \"refId\": \"A\"\n },\n {\n \"expr\": \"aliyun_acs_oss_dashboard_redirect_count_value{user_id=\\\"$user_id\\\"}\",\n \"legend\": \"重定向请求数\",\n \"refId\": \"B\"\n }\n ],\n \"transformations\": [\n {\n \"id\": \"organize\",\n \"options\": {}\n }\n ],\n \"type\": \"timeseries\",\n \"version\": \"3.0.0\"\n },\n {\n \"custom\": {\n \"drawStyle\": \"lines\",\n \"fillOpacity\": 0.3,\n \"gradientMode\": \"opacity\",\n \"lineInterpolation\": \"smooth\",\n \"lineWidth\": 2,\n \"scaleDistribution\": {\n \"type\": \"linear\"\n },\n \"spanNulls\": false,\n \"stack\": \"off\"\n },\n \"datasourceCate\": \"prometheus\",\n \"datasourceValue\": \"${datasource}\",\n \"id\": \"5f10a135-c092-4905-9986-c51d28cb532f\",\n \"layout\": {\n \"h\": 4,\n \"i\": \"9d9a4a35-a3bf-41c0-a019-8d70d1a38eab\",\n \"isResizable\": true,\n \"w\": 6,\n \"x\": 18,\n \"y\": 14\n },\n \"maxPerRow\": 4,\n \"name\": \"有效请求占比\",\n \"options\": {\n \"legend\": {\n \"displayMode\": \"hidden\"\n },\n \"standardOptions\": {\n \"util\": \"none\"\n },\n \"thresholds\": {\n \"steps\": [\n {\n \"color\": \"#634CD9\",\n \"type\": \"base\",\n \"value\": null\n }\n ]\n },\n \"tooltip\": {\n \"mode\": \"all\",\n \"sort\": \"none\"\n }\n },\n \"targets\": [\n {\n \"expr\": \"aliyun_acs_oss_dashboard_success_rate_value{user_id=\\\"$user_id\\\"}\",\n \"legend\": \"成功请求占比\",\n \"refId\": \"A\"\n },\n {\n \"expr\": \"aliyun_acs_oss_dashboard_redirect_rate_value{user_id=\\\"$user_id\\\"}\",\n \"legend\": \"重定向请求占比\",\n \"refId\": \"B\"\n }\n ],\n \"transformations\": [\n {\n \"id\": \"organize\",\n \"options\": {}\n }\n ],\n \"type\": \"timeseries\",\n \"version\": \"3.0.0\"\n },\n {\n \"collapsed\": true,\n \"id\": \"eae6d0ff-c5a3-4d6e-8fd6-53c765562234\",\n \"layout\": {\n \"h\": 1,\n \"i\": \"eae6d0ff-c5a3-4d6e-8fd6-53c765562234\",\n \"isResizable\": false,\n \"w\": 24,\n \"x\": 0,\n \"y\": 18\n },\n \"name\": \"计量参考\",\n \"type\": \"row\"\n },\n {\n \"custom\": {\n \"drawStyle\": \"lines\",\n \"fillOpacity\": 0.3,\n \"gradientMode\": \"opacity\",\n \"lineInterpolation\": \"smooth\",\n \"lineWidth\": 2,\n \"scaleDistribution\": {\n \"type\": \"linear\"\n },\n \"spanNulls\": false,\n \"stack\": \"off\"\n },\n \"datasourceCate\": \"prometheus\",\n \"datasourceValue\": \"${datasource}\",\n \"id\": \"2722be43-b2aa-44d2-9066-8a2818aadfa2\",\n \"layout\": {\n \"h\": 4,\n \"i\": \"99bc9b5d-ac08-473a-8566-466777eb62e8\",\n \"isResizable\": true,\n \"w\": 6,\n \"x\": 0,\n \"y\": 19\n },\n \"maxPerRow\": 4,\n \"name\": \"存储大小\",\n \"options\": {\n \"legend\": {\n \"displayMode\": \"hidden\"\n },\n \"standardOptions\": {\n \"util\": \"bytesSI\"\n },\n \"thresholds\": {\n \"steps\": [\n {\n \"color\": \"#634CD9\",\n \"type\": \"base\",\n \"value\": null\n }\n ]\n },\n \"tooltip\": {\n \"mode\": \"all\",\n \"sort\": \"none\"\n }\n },\n \"targets\": [\n {\n \"expr\": \"aliyun_acs_oss_dashboard_metering_storage_utilization_value{user_id=\\\"$user_id\\\"}\",\n \"legend\": \"存储大小\",\n \"refId\": \"A\"\n }\n ],\n \"transformations\": [\n {\n \"id\": \"organize\",\n \"options\": {}\n }\n ],\n \"type\": \"timeseries\",\n \"version\": \"3.0.0\"\n },\n {\n \"custom\": {\n \"drawStyle\": \"lines\",\n \"fillOpacity\": 0.3,\n \"gradientMode\": \"opacity\",\n \"lineInterpolation\": \"smooth\",\n \"lineWidth\": 2,\n \"scaleDistribution\": {\n \"type\": \"linear\"\n },\n \"spanNulls\": false,\n \"stack\": \"off\"\n },\n \"datasourceCate\": \"prometheus\",\n \"datasourceValue\": \"${datasource}\",\n \"id\": \"af133902-12f9-4746-b028-e021391e4a67\",\n \"layout\": {\n \"h\": 4,\n \"i\": \"ecabf939-7f31-4fd5-a825-7d8ffd4033d7\",\n \"isResizable\": true,\n \"w\": 6,\n \"x\": 6,\n \"y\": 19\n },\n \"maxPerRow\": 4,\n \"name\": \"计费请求数\",\n \"options\": {\n \"legend\": {\n \"displayMode\": \"hidden\"\n },\n \"standardOptions\": {\n \"util\": \"bytesSI\"\n },\n \"thresholds\": {\n \"steps\": [\n {\n \"color\": \"#634CD9\",\n \"type\": \"base\",\n \"value\": null\n }\n ]\n },\n \"tooltip\": {\n \"mode\": \"all\",\n \"sort\": \"none\"\n }\n },\n \"targets\": [\n {\n \"expr\": \"aliyun_acs_oss_dashboard_metering_get_request_value{user_id=\\\"$user_id\\\"}\",\n \"legend\": \"客户端其他错误请求数\",\n \"refId\": \"A\"\n }\n ],\n \"transformations\": [\n {\n \"id\": \"organize\",\n \"options\": {}\n }\n ],\n \"type\": \"timeseries\",\n \"version\": \"3.0.0\"\n },\n {\n \"custom\": {\n \"drawStyle\": \"lines\",\n \"fillOpacity\": 0.3,\n \"gradientMode\": \"opacity\",\n \"lineInterpolation\": \"smooth\",\n \"lineWidth\": 2,\n \"scaleDistribution\": {\n \"type\": \"linear\"\n },\n \"spanNulls\": false,\n \"stack\": \"off\"\n },\n \"datasourceCate\": \"prometheus\",\n \"datasourceValue\": \"${datasource}\",\n \"id\": \"6bb61b7c-4b49-4d9b-a707-34913be40e6e\",\n \"layout\": {\n \"h\": 4,\n \"i\": \"616e7a61-6bc1-4499-8065-b944789953e0\",\n \"isResizable\": true,\n \"w\": 6,\n \"x\": 12,\n \"y\": 19\n },\n \"maxPerRow\": 4,\n \"name\": \"计量流量\",\n \"options\": {\n \"legend\": {\n \"displayMode\": \"hidden\"\n },\n \"standardOptions\": {\n \"util\": \"bytesSI\"\n },\n \"thresholds\": {\n \"steps\": [\n {\n \"color\": \"#634CD9\",\n \"type\": \"base\",\n \"value\": null\n }\n ]\n },\n \"tooltip\": {\n \"mode\": \"all\",\n \"sort\": \"none\"\n }\n },\n \"targets\": [\n {\n \"expr\": \"aliyun_acs_oss_dashboard_metering_internet_rx_value{user_id=\\\"$user_id\\\"}\",\n \"legend\": \"internet_rx\",\n \"refId\": \"A\"\n },\n {\n \"expr\": \"aliyun_acs_oss_dashboard_metering_internet_tx_value{user_id=\\\"$user_id\\\"}\",\n \"legend\": \"internet_tx\",\n \"refId\": \"B\"\n }\n ],\n \"transformations\": [\n {\n \"id\": \"organize\",\n \"options\": {}\n }\n ],\n \"type\": \"timeseries\",\n \"version\": \"3.0.0\"\n },\n {\n \"collapsed\": true,\n \"id\": \"d27c946f-33e2-4d35-ad84-87b68a0076f1\",\n \"layout\": {\n \"h\": 1,\n \"i\": \"d27c946f-33e2-4d35-ad84-87b68a0076f1\",\n \"isResizable\": false,\n \"w\": 24,\n \"x\": 0,\n \"y\": 23\n },\n \"name\": \"平均延时\",\n \"type\": \"row\"\n },\n {\n \"custom\": {\n \"drawStyle\": \"lines\",\n \"fillOpacity\": 0.3,\n \"gradientMode\": \"opacity\",\n \"lineInterpolation\": \"smooth\",\n \"lineWidth\": 2,\n \"scaleDistribution\": {\n \"type\": \"linear\"\n },\n \"spanNulls\": false,\n \"stack\": \"off\"\n },\n \"datasourceCate\": \"prometheus\",\n \"datasourceValue\": \"${datasource}\",\n \"id\": \"9c635833-ebb1-441a-b5ce-81a5bfabaa71\",\n \"layout\": {\n \"h\": 4,\n \"i\": \"38632126-ab8b-4c9c-b15f-6dbcdc0e8ced\",\n \"isResizable\": true,\n \"w\": 6,\n \"x\": 0,\n \"y\": 24\n },\n \"maxPerRow\": 4,\n \"name\": \"GetObject请求平均延时(Milliseconds)\",\n \"options\": {\n \"legend\": {\n \"displayMode\": \"hidden\"\n },\n \"standardOptions\": {\n \"util\": \"milliseconds\"\n },\n \"thresholds\": {\n \"steps\": [\n {\n \"color\": \"#634CD9\",\n \"type\": \"base\",\n \"value\": null\n }\n ]\n },\n \"tooltip\": {\n \"mode\": \"all\",\n \"sort\": \"none\"\n }\n },\n \"targets\": [\n {\n \"expr\": \"aliyun_acs_oss_dashboard_get_object_e2e_latency_value{user_id=\\\"$user_id\\\"}\",\n \"legend\": \"GetObject请求E2E平均延时\",\n \"refId\": \"A\"\n },\n {\n \"expr\": \"aliyun_acs_oss_dashboard_get_object_server_latency_value{user_id=\\\"$user_id\\\"}\",\n \"legend\": \"GetObject请求平均服务器延时\",\n \"refId\": \"B\"\n }\n ],\n \"transformations\": [\n {\n \"id\": \"organize\",\n \"options\": {}\n }\n ],\n \"type\": \"timeseries\",\n \"version\": \"3.0.0\"\n },\n {\n \"custom\": {\n \"drawStyle\": \"lines\",\n \"fillOpacity\": 0.3,\n \"gradientMode\": \"opacity\",\n \"lineInterpolation\": \"smooth\",\n \"lineWidth\": 2,\n \"scaleDistribution\": {\n \"type\": \"linear\"\n },\n \"spanNulls\": false,\n \"stack\": \"off\"\n },\n \"datasourceCate\": \"prometheus\",\n \"datasourceValue\": \"${datasource}\",\n \"id\": \"f1f08b1f-fda7-47a6-803d-fc68599cbbde\",\n \"layout\": {\n \"h\": 4,\n \"i\": \"a61ee3b0-4097-4ee7-9567-16fcd5cc50a0\",\n \"isResizable\": true,\n \"w\": 6,\n \"x\": 6,\n \"y\": 24\n },\n \"maxPerRow\": 4,\n \"name\": \"HeadObject请求平均延时(Milliseconds)\",\n \"options\": {\n \"legend\": {\n \"displayMode\": \"hidden\"\n },\n \"standardOptions\": {\n \"util\": \"milliseconds\"\n },\n \"thresholds\": {\n \"steps\": [\n {\n \"color\": \"#634CD9\",\n \"type\": \"base\",\n \"value\": null\n }\n ]\n },\n \"tooltip\": {\n \"mode\": \"all\",\n \"sort\": \"none\"\n }\n },\n \"targets\": [\n {\n \"expr\": \"aliyun_acs_oss_dashboard_head_object_e2e_latency_value{user_id=\\\"$user_id\\\"}\",\n \"legend\": \"HeadObject请求E2E平均延时\",\n \"refId\": \"A\"\n },\n {\n \"expr\": \"aliyun_acs_oss_dashboard_head_object_server_latency_value{user_id=\\\"$user_id\\\"}\",\n \"legend\": \"HeadObject请求平均服务器延时\",\n \"refId\": \"B\"\n }\n ],\n \"transformations\": [\n {\n \"id\": \"organize\",\n \"options\": {}\n }\n ],\n \"type\": \"timeseries\",\n \"version\": \"3.0.0\"\n },\n {\n \"custom\": {\n \"drawStyle\": \"lines\",\n \"fillOpacity\": 0.3,\n \"gradientMode\": \"opacity\",\n \"lineInterpolation\": \"smooth\",\n \"lineWidth\": 2,\n \"scaleDistribution\": {\n \"type\": \"linear\"\n },\n \"spanNulls\": false,\n \"stack\": \"off\"\n },\n \"datasourceCate\": \"prometheus\",\n \"datasourceValue\": \"${datasource}\",\n \"id\": \"7282be15-52e2-40a2-951f-6140daa7d595\",\n \"layout\": {\n \"h\": 4,\n \"i\": \"0d424100-822c-4c5f-a02d-883fe3642fab\",\n \"isResizable\": true,\n \"w\": 6,\n \"x\": 12,\n \"y\": 24\n },\n \"maxPerRow\": 4,\n \"name\": \"PutObject请求平均延时(Milliseconds)\",\n \"options\": {\n \"legend\": {\n \"displayMode\": \"hidden\"\n },\n \"standardOptions\": {\n \"util\": \"milliseconds\"\n },\n \"thresholds\": {\n \"steps\": [\n {\n \"color\": \"#634CD9\",\n \"type\": \"base\",\n \"value\": null\n }\n ]\n },\n \"tooltip\": {\n \"mode\": \"all\",\n \"sort\": \"none\"\n }\n },\n \"targets\": [\n {\n \"expr\": \"aliyun_acs_oss_dashboard_put_object_e2e_latency_value{user_id=\\\"$user_id\\\"}\",\n \"legend\": \"PutObject请求E2E平均延时\",\n \"refId\": \"A\"\n },\n {\n \"expr\": \"aliyun_acs_oss_dashboard_put_object_server_latency_value{user_id=\\\"$user_id\\\"}\",\n \"legend\": \"PutObject请求平均服务器延时\",\n \"refId\": \"B\"\n }\n ],\n \"transformations\": [\n {\n \"id\": \"organize\",\n \"options\": {}\n }\n ],\n \"type\": \"timeseries\",\n \"version\": \"3.0.0\"\n },\n {\n \"custom\": {\n \"drawStyle\": \"lines\",\n \"fillOpacity\": 0.3,\n \"gradientMode\": \"opacity\",\n \"lineInterpolation\": \"smooth\",\n \"lineWidth\": 2,\n \"scaleDistribution\": {\n \"type\": \"linear\"\n },\n \"spanNulls\": false,\n \"stack\": \"off\"\n },\n \"datasourceCate\": \"prometheus\",\n \"datasourceValue\": \"${datasource}\",\n \"id\": \"6f211349-a330-437a-bfab-29404739098d\",\n \"layout\": {\n \"h\": 4,\n \"i\": \"58a5a502-0d4d-4b73-a9dd-8b930fc11052\",\n \"isResizable\": true,\n \"w\": 6,\n \"x\": 18,\n \"y\": 24\n },\n \"maxPerRow\": 4,\n \"name\": \"PostObject请求平均延时(Milliseconds)\",\n \"options\": {\n \"legend\": {\n \"displayMode\": \"hidden\"\n },\n \"standardOptions\": {\n \"util\": \"milliseconds\"\n },\n \"thresholds\": {\n \"steps\": [\n {\n \"color\": \"#634CD9\",\n \"type\": \"base\",\n \"value\": null\n }\n ]\n },\n \"tooltip\": {\n \"mode\": \"all\",\n \"sort\": \"none\"\n }\n },\n \"targets\": [\n {\n \"expr\": \"aliyun_acs_oss_dashboard_post_object_e2e_latency_value{user_id=\\\"$user_id\\\"}\",\n \"legend\": \"PostObject请求E2E平均延时\",\n \"refId\": \"A\"\n },\n {\n \"expr\": \"aliyun_acs_oss_dashboard_post_object_server_latency_value{user_id=\\\"$user_id\\\"}\",\n \"legend\": \"PostObject请求平均服务器延时\",\n \"refId\": \"B\"\n }\n ],\n \"transformations\": [\n {\n \"id\": \"organize\",\n \"options\": {}\n }\n ],\n \"type\": \"timeseries\",\n \"version\": \"3.0.0\"\n },\n {\n \"custom\": {\n \"drawStyle\": \"lines\",\n \"fillOpacity\": 0.3,\n \"gradientMode\": \"opacity\",\n \"lineInterpolation\": \"smooth\",\n \"lineWidth\": 2,\n \"scaleDistribution\": {\n \"type\": \"linear\"\n },\n \"spanNulls\": false,\n \"stack\": \"off\"\n },\n \"datasourceCate\": \"prometheus\",\n \"datasourceValue\": \"${datasource}\",\n \"id\": \"6b392bdb-9677-42d4-b2fd-de53601fc858\",\n \"layout\": {\n \"h\": 4,\n \"i\": \"2205cc4b-dcd2-444d-8b37-0694deb9308d\",\n \"isResizable\": true,\n \"w\": 6,\n \"x\": 0,\n \"y\": 28\n },\n \"maxPerRow\": 4,\n \"name\": \"AppendObject请求平均延时(Milliseconds)\",\n \"options\": {\n \"legend\": {\n \"displayMode\": \"hidden\"\n },\n \"standardOptions\": {\n \"util\": \"milliseconds\"\n },\n \"thresholds\": {\n \"steps\": [\n {\n \"color\": \"#634CD9\",\n \"type\": \"base\",\n \"value\": null\n }\n ]\n },\n \"tooltip\": {\n \"mode\": \"all\",\n \"sort\": \"none\"\n }\n },\n \"targets\": [\n {\n \"expr\": \"aliyun_acs_oss_dashboard_append_object_e2e_latency_value{user_id=\\\"$user_id\\\"}\",\n \"legend\": \"AppendObject请求E2E平均延时\",\n \"refId\": \"A\"\n },\n {\n \"expr\": \"aliyun_acs_oss_dashboard_append_object_server_latency_value{user_id=\\\"$user_id\\\"}\",\n \"legend\": \"AppendObject请求平均服务器延时\",\n \"refId\": \"B\"\n }\n ],\n \"transformations\": [\n {\n \"id\": \"organize\",\n \"options\": {}\n }\n ],\n \"type\": \"timeseries\",\n \"version\": \"3.0.0\"\n },\n {\n \"custom\": {\n \"drawStyle\": \"lines\",\n \"fillOpacity\": 0.3,\n \"gradientMode\": \"opacity\",\n \"lineInterpolation\": \"smooth\",\n \"lineWidth\": 2,\n \"scaleDistribution\": {\n \"type\": \"linear\"\n },\n \"spanNulls\": false,\n \"stack\": \"off\"\n },\n \"datasourceCate\": \"prometheus\",\n \"datasourceValue\": \"${datasource}\",\n \"id\": \"1400ae72-eae2-4ffe-bcf5-2ebd8194d470\",\n \"layout\": {\n \"h\": 4,\n \"i\": \"f2015851-061f-4345-8b20-989103549937\",\n \"isResizable\": true,\n \"w\": 6,\n \"x\": 6,\n \"y\": 28\n },\n \"maxPerRow\": 4,\n \"name\": \"UploadPart请求平均延时(Milliseconds)\",\n \"options\": {\n \"legend\": {\n \"displayMode\": \"hidden\"\n },\n \"standardOptions\": {\n \"util\": \"milliseconds\"\n },\n \"thresholds\": {\n \"steps\": [\n {\n \"color\": \"#634CD9\",\n \"type\": \"base\",\n \"value\": null\n }\n ]\n },\n \"tooltip\": {\n \"mode\": \"all\",\n \"sort\": \"none\"\n }\n },\n \"targets\": [\n {\n \"expr\": \"aliyun_acs_oss_dashboard_upload_part_e2e_latency_value{user_id=\\\"$user_id\\\"}\",\n \"legend\": \"UploadPart请求E2E平均延时\",\n \"refId\": \"A\"\n },\n {\n \"expr\": \"aliyun_acs_oss_dashboard_upload_part_server_latency_value{user_id=\\\"$user_id\\\"}\",\n \"legend\": \"UploadPart请求平均服务器延时\",\n \"refId\": \"B\"\n }\n ],\n \"transformations\": [\n {\n \"id\": \"organize\",\n \"options\": {}\n }\n ],\n \"type\": \"timeseries\",\n \"version\": \"3.0.0\"\n },\n {\n \"custom\": {\n \"drawStyle\": \"lines\",\n \"fillOpacity\": 0.3,\n \"gradientMode\": \"opacity\",\n \"lineInterpolation\": \"smooth\",\n \"lineWidth\": 2,\n \"scaleDistribution\": {\n \"type\": \"linear\"\n },\n \"spanNulls\": false,\n \"stack\": \"off\"\n },\n \"datasourceCate\": \"prometheus\",\n \"datasourceValue\": \"${datasource}\",\n \"id\": \"060e67f9-4db5-4a5f-a24c-3c54efcbf297\",\n \"layout\": {\n \"h\": 4,\n \"i\": \"8bd12d33-05d8-484a-82b4-d161bf1681d0\",\n \"isResizable\": true,\n \"w\": 6,\n \"x\": 12,\n \"y\": 28\n },\n \"maxPerRow\": 4,\n \"name\": \"UploadPartCopy请求平均延时(Milliseconds)\",\n \"options\": {\n \"legend\": {\n \"displayMode\": \"hidden\"\n },\n \"standardOptions\": {\n \"util\": \"milliseconds\"\n },\n \"thresholds\": {\n \"steps\": [\n {\n \"color\": \"#634CD9\",\n \"type\": \"base\",\n \"value\": null\n }\n ]\n },\n \"tooltip\": {\n \"mode\": \"all\",\n \"sort\": \"none\"\n }\n },\n \"targets\": [\n {\n \"expr\": \"aliyun_acs_oss_dashboard_upload_part_copy_e2e_latency_value{user_id=\\\"$user_id\\\"}\",\n \"legend\": \"UploadPartCopy请求E2E平均延时\",\n \"refId\": \"A\"\n },\n {\n \"expr\": \"aliyun_acs_oss_dashboard_upload_part_copy_server_latency_value{user_id=\\\"$user_id\\\"}\",\n \"legend\": \"UploadPartCopy请求平均服务器延时\",\n \"refId\": \"B\"\n }\n ],\n \"transformations\": [\n {\n \"id\": \"organize\",\n \"options\": {}\n }\n ],\n \"type\": \"timeseries\",\n \"version\": \"3.0.0\"\n },\n {\n \"collapsed\": true,\n \"id\": \"40fb9cf4-c166-4ab8-b0b5-b510a63821a3\",\n \"layout\": {\n \"h\": 1,\n \"i\": \"40fb9cf4-c166-4ab8-b0b5-b510a63821a3\",\n \"isResizable\": false,\n \"w\": 24,\n \"x\": 0,\n \"y\": 32\n },\n \"name\": \"最大延时\",\n \"type\": \"row\"\n },\n {\n \"custom\": {\n \"drawStyle\": \"lines\",\n \"fillOpacity\": 0.3,\n \"gradientMode\": \"opacity\",\n \"lineInterpolation\": \"smooth\",\n \"lineWidth\": 2,\n \"scaleDistribution\": {\n \"type\": \"linear\"\n },\n \"spanNulls\": false,\n \"stack\": \"off\"\n },\n \"datasourceCate\": \"prometheus\",\n \"datasourceValue\": \"${datasource}\",\n \"id\": \"0997c38b-4776-476b-a859-109a6a5a3f74\",\n \"layout\": {\n \"h\": 4,\n \"i\": \"f72517cd-65b3-40d8-8886-ae0870f4c4ec\",\n \"isResizable\": true,\n \"w\": 6,\n \"x\": 0,\n \"y\": 33\n },\n \"maxPerRow\": 4,\n \"name\": \"GetObject请求最大延时(Milliseconds)\",\n \"options\": {\n \"legend\": {\n \"displayMode\": \"hidden\"\n },\n \"standardOptions\": {\n \"util\": \"milliseconds\"\n },\n \"thresholds\": {\n \"steps\": [\n {\n \"color\": \"#634CD9\",\n \"type\": \"base\",\n \"value\": null\n }\n ]\n },\n \"tooltip\": {\n \"mode\": \"all\",\n \"sort\": \"none\"\n }\n },\n \"targets\": [\n {\n \"expr\": \"aliyun_acs_oss_dashboard_max_get_object_e2e_latency_value{user_id=\\\"$user_id\\\"}\",\n \"legend\": \"GetObject请求E2E最大延时\",\n \"refId\": \"A\"\n },\n {\n \"expr\": \"aliyun_acs_oss_dashboard_max_get_object_server_latency_value{user_id=\\\"$user_id\\\"}\",\n \"legend\": \"GetObject请求最大服务器延时\",\n \"refId\": \"B\"\n }\n ],\n \"transformations\": [\n {\n \"id\": \"organize\",\n \"options\": {}\n }\n ],\n \"type\": \"timeseries\",\n \"version\": \"3.0.0\"\n },\n {\n \"custom\": {\n \"drawStyle\": \"lines\",\n \"fillOpacity\": 0.3,\n \"gradientMode\": \"opacity\",\n \"lineInterpolation\": \"smooth\",\n \"lineWidth\": 2,\n \"scaleDistribution\": {\n \"type\": \"linear\"\n },\n \"spanNulls\": false,\n \"stack\": \"off\"\n },\n \"datasourceCate\": \"prometheus\",\n \"datasourceValue\": \"${datasource}\",\n \"id\": \"51bd67db-3c51-43bf-a4ad-fdb9688968c3\",\n \"layout\": {\n \"h\": 4,\n \"i\": \"911f4590-e7f9-470a-a940-0fd78380200b\",\n \"isResizable\": true,\n \"w\": 6,\n \"x\": 6,\n \"y\": 33\n },\n \"maxPerRow\": 4,\n \"name\": \"HeadObject请求最大延时(Milliseconds)\",\n \"options\": {\n \"legend\": {\n \"displayMode\": \"hidden\"\n },\n \"standardOptions\": {\n \"util\": \"milliseconds\"\n },\n \"thresholds\": {\n \"steps\": [\n {\n \"color\": \"#634CD9\",\n \"type\": \"base\",\n \"value\": null\n }\n ]\n },\n \"tooltip\": {\n \"mode\": \"all\",\n \"sort\": \"none\"\n }\n },\n \"targets\": [\n {\n \"expr\": \"aliyun_acs_oss_dashboard_max_head_object_e2e_latency_value{user_id=\\\"$user_id\\\"}\",\n \"legend\": \"HeadObject请求E2E最大延时\",\n \"refId\": \"A\"\n },\n {\n \"expr\": \"aliyun_acs_oss_dashboard_max_head_object_server_latency_value{user_id=\\\"$user_id\\\"}\",\n \"legend\": \"HeadObject请求最大服务器延时\",\n \"refId\": \"B\"\n }\n ],\n \"transformations\": [\n {\n \"id\": \"organize\",\n \"options\": {}\n }\n ],\n \"type\": \"timeseries\",\n \"version\": \"3.0.0\"\n },\n {\n \"custom\": {\n \"drawStyle\": \"lines\",\n \"fillOpacity\": 0.3,\n \"gradientMode\": \"opacity\",\n \"lineInterpolation\": \"smooth\",\n \"lineWidth\": 2,\n \"scaleDistribution\": {\n \"type\": \"linear\"\n },\n \"spanNulls\": false,\n \"stack\": \"off\"\n },\n \"datasourceCate\": \"prometheus\",\n \"datasourceValue\": \"${datasource}\",\n \"id\": \"37e46a51-94cd-4bf5-ac8b-c2034d28f7b1\",\n \"layout\": {\n \"h\": 4,\n \"i\": \"c2081d5d-f5c7-4989-9613-68e1b4090cd4\",\n \"isResizable\": true,\n \"w\": 6,\n \"x\": 12,\n \"y\": 33\n },\n \"maxPerRow\": 4,\n \"name\": \"PutObject请求最大延时(Milliseconds)\",\n \"options\": {\n \"legend\": {\n \"displayMode\": \"hidden\"\n },\n \"standardOptions\": {\n \"util\": \"milliseconds\"\n },\n \"thresholds\": {\n \"steps\": [\n {\n \"color\": \"#634CD9\",\n \"type\": \"base\",\n \"value\": null\n }\n ]\n },\n \"tooltip\": {\n \"mode\": \"all\",\n \"sort\": \"none\"\n }\n },\n \"targets\": [\n {\n \"expr\": \"aliyun_acs_oss_dashboard_max_put_object_e2e_latency_value{user_id=\\\"$user_id\\\"}\",\n \"legend\": \"PutObject请求E2E最大延时\",\n \"refId\": \"A\"\n },\n {\n \"expr\": \"aliyun_acs_oss_dashboard_max_put_object_server_latency_value{user_id=\\\"$user_id\\\"}\",\n \"legend\": \"PutObject请求最大服务器延时\",\n \"refId\": \"B\"\n }\n ],\n \"transformations\": [\n {\n \"id\": \"organize\",\n \"options\": {}\n }\n ],\n \"type\": \"timeseries\",\n \"version\": \"3.0.0\"\n },\n {\n \"custom\": {\n \"drawStyle\": \"lines\",\n \"fillOpacity\": 0.3,\n \"gradientMode\": \"opacity\",\n \"lineInterpolation\": \"smooth\",\n \"lineWidth\": 2,\n \"scaleDistribution\": {\n \"type\": \"linear\"\n },\n \"spanNulls\": false,\n \"stack\": \"off\"\n },\n \"datasourceCate\": \"prometheus\",\n \"datasourceValue\": \"${datasource}\",\n \"id\": \"30782208-bd2e-4e13-b9ad-09b3aab748dc\",\n \"layout\": {\n \"h\": 4,\n \"i\": \"5fb8bde2-d319-411d-bfac-24a70b80fbc3\",\n \"isResizable\": true,\n \"w\": 6,\n \"x\": 18,\n \"y\": 33\n },\n \"maxPerRow\": 4,\n \"name\": \"PostObject请求最大延时(Milliseconds)\",\n \"options\": {\n \"legend\": {\n \"displayMode\": \"hidden\"\n },\n \"standardOptions\": {\n \"util\": \"milliseconds\"\n },\n \"thresholds\": {\n \"steps\": [\n {\n \"color\": \"#634CD9\",\n \"type\": \"base\",\n \"value\": null\n }\n ]\n },\n \"tooltip\": {\n \"mode\": \"all\",\n \"sort\": \"none\"\n }\n },\n \"targets\": [\n {\n \"expr\": \"aliyun_acs_oss_dashboard_max_post_object_e2e_latency_value{user_id=\\\"$user_id\\\"}\",\n \"legend\": \"PostObject请求E2E最大延时\",\n \"refId\": \"A\"\n },\n {\n \"expr\": \"aliyun_acs_oss_dashboard_max_post_object_server_latency_value{user_id=\\\"$user_id\\\"}\",\n \"legend\": \"PostObject请求最大服务器延时\",\n \"refId\": \"B\"\n }\n ],\n \"transformations\": [\n {\n \"id\": \"organize\",\n \"options\": {}\n }\n ],\n \"type\": \"timeseries\",\n \"version\": \"3.0.0\"\n },\n {\n \"custom\": {\n \"drawStyle\": \"lines\",\n \"fillOpacity\": 0.3,\n \"gradientMode\": \"opacity\",\n \"lineInterpolation\": \"smooth\",\n \"lineWidth\": 2,\n \"scaleDistribution\": {\n \"type\": \"linear\"\n },\n \"spanNulls\": false,\n \"stack\": \"off\"\n },\n \"datasourceCate\": \"prometheus\",\n \"datasourceValue\": \"${datasource}\",\n \"id\": \"613657f6-bea5-4efb-a124-c35f0391b719\",\n \"layout\": {\n \"h\": 4,\n \"i\": \"3cc0b72f-7691-4860-9076-816b4294b8a1\",\n \"isResizable\": true,\n \"w\": 6,\n \"x\": 0,\n \"y\": 37\n },\n \"maxPerRow\": 4,\n \"name\": \"AppendObject请求最大延时(Milliseconds)\",\n \"options\": {\n \"legend\": {\n \"displayMode\": \"hidden\"\n },\n \"standardOptions\": {\n \"util\": \"milliseconds\"\n },\n \"thresholds\": {\n \"steps\": [\n {\n \"color\": \"#634CD9\",\n \"type\": \"base\",\n \"value\": null\n }\n ]\n },\n \"tooltip\": {\n \"mode\": \"all\",\n \"sort\": \"none\"\n }\n },\n \"targets\": [\n {\n \"expr\": \"aliyun_acs_oss_dashboard_max_append_object_e2e_latency_value{user_id=\\\"$user_id\\\"}\",\n \"legend\": \"AppendObject请求E2E最大延时\",\n \"refId\": \"A\"\n },\n {\n \"expr\": \"aliyun_acs_oss_dashboard_max_append_object_server_latency_value{user_id=\\\"$user_id\\\"}\",\n \"legend\": \"AppendObject请求最大服务器延时\",\n \"refId\": \"B\"\n }\n ],\n \"transformations\": [\n {\n \"id\": \"organize\",\n \"options\": {}\n }\n ],\n \"type\": \"timeseries\",\n \"version\": \"3.0.0\"\n },\n {\n \"custom\": {\n \"drawStyle\": \"lines\",\n \"fillOpacity\": 0.3,\n \"gradientMode\": \"opacity\",\n \"lineInterpolation\": \"smooth\",\n \"lineWidth\": 2,\n \"scaleDistribution\": {\n \"type\": \"linear\"\n },\n \"spanNulls\": false,\n \"stack\": \"off\"\n },\n \"datasourceCate\": \"prometheus\",\n \"datasourceValue\": \"${datasource}\",\n \"id\": \"7217044b-7b5a-4484-9eb5-0ecbb28cd8f6\",\n \"layout\": {\n \"h\": 4,\n \"i\": \"e933e521-d5ba-4f72-81c8-553d4ff025a7\",\n \"isResizable\": true,\n \"w\": 6,\n \"x\": 6,\n \"y\": 37\n },\n \"maxPerRow\": 4,\n \"name\": \"UploadPart请求最大延时(Milliseconds)\",\n \"options\": {\n \"legend\": {\n \"displayMode\": \"hidden\"\n },\n \"standardOptions\": {\n \"util\": \"milliseconds\"\n },\n \"thresholds\": {\n \"steps\": [\n {\n \"color\": \"#634CD9\",\n \"type\": \"base\",\n \"value\": null\n }\n ]\n },\n \"tooltip\": {\n \"mode\": \"all\",\n \"sort\": \"none\"\n }\n },\n \"targets\": [\n {\n \"expr\": \"aliyun_acs_oss_dashboard_max_upload_part_e2e_latency_value{user_id=\\\"$user_id\\\"}\",\n \"legend\": \"UploadPart请求E2E最大延时\",\n \"refId\": \"A\"\n },\n {\n \"expr\": \"aliyun_acs_oss_dashboard_max_upload_part_server_latency_value{user_id=\\\"$user_id\\\"}\",\n \"legend\": \"UploadPart请求最大服务器延时\",\n \"refId\": \"B\"\n }\n ],\n \"transformations\": [\n {\n \"id\": \"organize\",\n \"options\": {}\n }\n ],\n \"type\": \"timeseries\",\n \"version\": \"3.0.0\"\n },\n {\n \"custom\": {\n \"drawStyle\": \"lines\",\n \"fillOpacity\": 0.3,\n \"gradientMode\": \"opacity\",\n \"lineInterpolation\": \"smooth\",\n \"lineWidth\": 2,\n \"scaleDistribution\": {\n \"type\": \"linear\"\n },\n \"spanNulls\": false,\n \"stack\": \"off\"\n },\n \"datasourceCate\": \"prometheus\",\n \"datasourceValue\": \"${datasource}\",\n \"id\": \"c1b2077d-024c-4ed1-955e-9f556346e28b\",\n \"layout\": {\n \"h\": 4,\n \"i\": \"30d3a018-ac07-4dda-a28c-63e34a724f98\",\n \"isResizable\": true,\n \"w\": 6,\n \"x\": 12,\n \"y\": 37\n },\n \"maxPerRow\": 4,\n \"name\": \"UploadPartCopy请求最大延时(Milliseconds)\",\n \"options\": {\n \"legend\": {\n \"displayMode\": \"hidden\"\n },\n \"standardOptions\": {\n \"util\": \"milliseconds\"\n },\n \"thresholds\": {\n \"steps\": [\n {\n \"color\": \"#634CD9\",\n \"type\": \"base\",\n \"value\": null\n }\n ]\n },\n \"tooltip\": {\n \"mode\": \"all\",\n \"sort\": \"none\"\n }\n },\n \"targets\": [\n {\n \"expr\": \"aliyun_acs_oss_dashboard_max_upload_part_copy_e2e_latency_value{user_id=\\\"$user_id\\\"}\",\n \"legend\": \"UploadPartCopy请求E2E最大延时\",\n \"refId\": \"A\"\n },\n {\n \"expr\": \"aliyun_acs_oss_dashboard_max_upload_part_copy_server_latency_value{user_id=\\\"$user_id\\\"}\",\n \"legend\": \"UploadPartCopy请求最大服务器延时\",\n \"refId\": \"B\"\n }\n ],\n \"transformations\": [\n {\n \"id\": \"organize\",\n \"options\": {}\n }\n ],\n \"type\": \"timeseries\",\n \"version\": \"3.0.0\"\n },\n {\n \"collapsed\": true,\n \"id\": \"aee6d2ba-1489-4a09-a9b5-97e22a9c25de\",\n \"layout\": {\n \"h\": 1,\n \"i\": \"aee6d2ba-1489-4a09-a9b5-97e22a9c25de\",\n \"isResizable\": false,\n \"w\": 24,\n \"x\": 0,\n \"y\": 41\n },\n \"name\": \"请求成功操作分类\",\n \"type\": \"row\"\n },\n {\n \"custom\": {\n \"drawStyle\": \"lines\",\n \"fillOpacity\": 0.3,\n \"gradientMode\": \"opacity\",\n \"lineInterpolation\": \"smooth\",\n \"lineWidth\": 2,\n \"scaleDistribution\": {\n \"type\": \"linear\"\n },\n \"spanNulls\": false,\n \"stack\": \"off\"\n },\n \"datasourceCate\": \"prometheus\",\n \"datasourceValue\": \"${datasource}\",\n \"id\": \"9776ff4c-ee48-4c34-b15f-f59d6957eff6\",\n \"layout\": {\n \"h\": 4,\n \"i\": \"5f3b1b12-57c7-4ed7-9d36-e54b7693c5ce\",\n \"isResizable\": true,\n \"w\": 6,\n \"x\": 0,\n \"y\": 42\n },\n \"maxPerRow\": 4,\n \"name\": \"GetObject成功请求\",\n \"options\": {\n \"legend\": {\n \"displayMode\": \"hidden\"\n },\n \"standardOptions\": {\n \"util\": \"none\"\n },\n \"thresholds\": {\n \"steps\": [\n {\n \"color\": \"#634CD9\",\n \"type\": \"base\",\n \"value\": null\n }\n ]\n },\n \"tooltip\": {\n \"mode\": \"all\",\n \"sort\": \"none\"\n }\n },\n \"targets\": [\n {\n \"expr\": \"aliyun_acs_oss_dashboard_get_object_count_value\",\n \"legend\": \"GetObject成功请求数\",\n \"refId\": \"A\"\n }\n ],\n \"transformations\": [\n {\n \"id\": \"organize\",\n \"options\": {}\n }\n ],\n \"type\": \"timeseries\",\n \"version\": \"3.0.0\"\n },\n {\n \"custom\": {\n \"drawStyle\": \"lines\",\n \"fillOpacity\": 0.3,\n \"gradientMode\": \"opacity\",\n \"lineInterpolation\": \"smooth\",\n \"lineWidth\": 2,\n \"scaleDistribution\": {\n \"type\": \"linear\"\n },\n \"spanNulls\": false,\n \"stack\": \"off\"\n },\n \"datasourceCate\": \"prometheus\",\n \"datasourceValue\": \"${datasource}\",\n \"id\": \"4d06cc49-1729-4239-bfe9-3d74c41dbaca\",\n \"layout\": {\n \"h\": 4,\n \"i\": \"d7b32954-4413-4ba2-a854-b5cc5df93e74\",\n \"isResizable\": true,\n \"w\": 6,\n \"x\": 6,\n \"y\": 42\n },\n \"maxPerRow\": 4,\n \"name\": \"HeadObject成功请求\",\n \"options\": {\n \"legend\": {\n \"displayMode\": \"hidden\"\n },\n \"standardOptions\": {\n \"util\": \"none\"\n },\n \"thresholds\": {\n \"steps\": [\n {\n \"color\": \"#634CD9\",\n \"type\": \"base\",\n \"value\": null\n }\n ]\n },\n \"tooltip\": {\n \"mode\": \"all\",\n \"sort\": \"none\"\n }\n },\n \"targets\": [\n {\n \"expr\": \"aliyun_acs_oss_dashboard_head_object_count_value\",\n \"legend\": \"HeadObject成功请求数\",\n \"refId\": \"A\"\n }\n ],\n \"transformations\": [\n {\n \"id\": \"organize\",\n \"options\": {}\n }\n ],\n \"type\": \"timeseries\",\n \"version\": \"3.0.0\"\n },\n {\n \"custom\": {\n \"drawStyle\": \"lines\",\n \"fillOpacity\": 0.3,\n \"gradientMode\": \"opacity\",\n \"lineInterpolation\": \"smooth\",\n \"lineWidth\": 2,\n \"scaleDistribution\": {\n \"type\": \"linear\"\n },\n \"spanNulls\": false,\n \"stack\": \"off\"\n },\n \"datasourceCate\": \"prometheus\",\n \"datasourceValue\": \"${datasource}\",\n \"id\": \"93f35c48-0d5a-4f0a-a12a-da7a9f259b6e\",\n \"layout\": {\n \"h\": 4,\n \"i\": \"f2fb1ebc-e309-465a-a13b-a2777639adc2\",\n \"isResizable\": true,\n \"w\": 6,\n \"x\": 12,\n \"y\": 42\n },\n \"maxPerRow\": 4,\n \"name\": \"PutObject成功请求\",\n \"options\": {\n \"legend\": {\n \"displayMode\": \"hidden\"\n },\n \"standardOptions\": {\n \"util\": \"none\"\n },\n \"thresholds\": {\n \"steps\": [\n {\n \"color\": \"#634CD9\",\n \"type\": \"base\",\n \"value\": null\n }\n ]\n },\n \"tooltip\": {\n \"mode\": \"all\",\n \"sort\": \"none\"\n }\n },\n \"targets\": [\n {\n \"expr\": \"aliyun_acs_oss_dashboard_put_object_count_value\",\n \"legend\": \"PutObject成功请求数\",\n \"refId\": \"A\"\n }\n ],\n \"transformations\": [\n {\n \"id\": \"organize\",\n \"options\": {}\n }\n ],\n \"type\": \"timeseries\",\n \"version\": \"3.0.0\"\n },\n {\n \"custom\": {\n \"drawStyle\": \"lines\",\n \"fillOpacity\": 0.3,\n \"gradientMode\": \"opacity\",\n \"lineInterpolation\": \"smooth\",\n \"lineWidth\": 2,\n \"scaleDistribution\": {\n \"type\": \"linear\"\n },\n \"spanNulls\": false,\n \"stack\": \"off\"\n },\n \"datasourceCate\": \"prometheus\",\n \"datasourceValue\": \"${datasource}\",\n \"id\": \"02427f33-29fe-4c9e-b636-4902409920ae\",\n \"layout\": {\n \"h\": 4,\n \"i\": \"8e5f7ed6-5721-4323-ac67-b4f1360bf9f5\",\n \"isResizable\": true,\n \"w\": 6,\n \"x\": 18,\n \"y\": 42\n },\n \"maxPerRow\": 4,\n \"name\": \"PostObject成功请求\",\n \"options\": {\n \"legend\": {\n \"displayMode\": \"hidden\"\n },\n \"standardOptions\": {\n \"util\": \"none\"\n },\n \"thresholds\": {\n \"steps\": [\n {\n \"color\": \"#634CD9\",\n \"type\": \"base\",\n \"value\": null\n }\n ]\n },\n \"tooltip\": {\n \"mode\": \"all\",\n \"sort\": \"none\"\n }\n },\n \"targets\": [\n {\n \"expr\": \"aliyun_acs_oss_dashboard_post_object_count_value\",\n \"legend\": \"PostObject成功请求数\",\n \"refId\": \"A\"\n }\n ],\n \"transformations\": [\n {\n \"id\": \"organize\",\n \"options\": {}\n }\n ],\n \"type\": \"timeseries\",\n \"version\": \"3.0.0\"\n },\n {\n \"custom\": {\n \"drawStyle\": \"lines\",\n \"fillOpacity\": 0.3,\n \"gradientMode\": \"opacity\",\n \"lineInterpolation\": \"smooth\",\n \"lineWidth\": 2,\n \"scaleDistribution\": {\n \"type\": \"linear\"\n },\n \"spanNulls\": false,\n \"stack\": \"off\"\n },\n \"datasourceCate\": \"prometheus\",\n \"datasourceValue\": \"${datasource}\",\n \"id\": \"5088ba65-9da3-4d6a-95bb-a64a75b7c687\",\n \"layout\": {\n \"h\": 4,\n \"i\": \"fba364b1-2ba3-48dc-8107-09a7594fb012\",\n \"isResizable\": true,\n \"w\": 6,\n \"x\": 0,\n \"y\": 46\n },\n \"maxPerRow\": 4,\n \"name\": \"AppendObject成功请求\",\n \"options\": {\n \"legend\": {\n \"displayMode\": \"hidden\"\n },\n \"standardOptions\": {\n \"util\": \"none\"\n },\n \"thresholds\": {\n \"steps\": [\n {\n \"color\": \"#634CD9\",\n \"type\": \"base\",\n \"value\": null\n }\n ]\n },\n \"tooltip\": {\n \"mode\": \"all\",\n \"sort\": \"none\"\n }\n },\n \"targets\": [\n {\n \"expr\": \"aliyun_acs_oss_dashboard_append_object_count_value\",\n \"legend\": \"AppendObject成功请求数\",\n \"refId\": \"A\"\n }\n ],\n \"transformations\": [\n {\n \"id\": \"organize\",\n \"options\": {}\n }\n ],\n \"type\": \"timeseries\",\n \"version\": \"3.0.0\"\n },\n {\n \"custom\": {\n \"drawStyle\": \"lines\",\n \"fillOpacity\": 0.3,\n \"gradientMode\": \"opacity\",\n \"lineInterpolation\": \"smooth\",\n \"lineWidth\": 2,\n \"scaleDistribution\": {\n \"type\": \"linear\"\n },\n \"spanNulls\": false,\n \"stack\": \"off\"\n },\n \"datasourceCate\": \"prometheus\",\n \"datasourceValue\": \"${datasource}\",\n \"id\": \"1c679bf2-3487-46fc-84bc-cd87a141cb56\",\n \"layout\": {\n \"h\": 4,\n \"i\": \"ac88ce75-7f09-45e8-8088-d74a75e417c5\",\n \"isResizable\": true,\n \"w\": 6,\n \"x\": 6,\n \"y\": 46\n },\n \"maxPerRow\": 4,\n \"name\": \"UploadPart成功请求\",\n \"options\": {\n \"legend\": {\n \"displayMode\": \"hidden\"\n },\n \"standardOptions\": {\n \"util\": \"none\"\n },\n \"thresholds\": {\n \"steps\": [\n {\n \"color\": \"#634CD9\",\n \"type\": \"base\",\n \"value\": null\n }\n ]\n },\n \"tooltip\": {\n \"mode\": \"all\",\n \"sort\": \"none\"\n }\n },\n \"targets\": [\n {\n \"expr\": \"aliyun_acs_oss_dashboard_upload_part_count_value\",\n \"legend\": \"UploadPart成功请求数\",\n \"refId\": \"A\"\n }\n ],\n \"transformations\": [\n {\n \"id\": \"organize\",\n \"options\": {}\n }\n ],\n \"type\": \"timeseries\",\n \"version\": \"3.0.0\"\n },\n {\n \"custom\": {\n \"drawStyle\": \"lines\",\n \"fillOpacity\": 0.3,\n \"gradientMode\": \"opacity\",\n \"lineInterpolation\": \"smooth\",\n \"lineWidth\": 2,\n \"scaleDistribution\": {\n \"type\": \"linear\"\n },\n \"spanNulls\": false,\n \"stack\": \"off\"\n },\n \"datasourceCate\": \"prometheus\",\n \"datasourceValue\": \"${datasource}\",\n \"id\": \"9fb546a9-f159-4187-b054-b6a63d193743\",\n \"layout\": {\n \"h\": 4,\n \"i\": \"f67a210d-6f21-4a7e-9987-6056d9e2b237\",\n \"isResizable\": true,\n \"w\": 6,\n \"x\": 12,\n \"y\": 46\n },\n \"maxPerRow\": 4,\n \"name\": \"UploadPartCopy成功请求\",\n \"options\": {\n \"legend\": {\n \"displayMode\": \"hidden\"\n },\n \"standardOptions\": {\n \"util\": \"none\"\n },\n \"thresholds\": {\n \"steps\": [\n {\n \"color\": \"#634CD9\",\n \"type\": \"base\",\n \"value\": null\n }\n ]\n },\n \"tooltip\": {\n \"mode\": \"all\",\n \"sort\": \"none\"\n }\n },\n \"targets\": [\n {\n \"expr\": \"aliyun_acs_oss_dashboard_upload_part_copy_count_value\",\n \"legend\": \"UploadPartCopy成功请求数\",\n \"refId\": \"A\"\n }\n ],\n \"transformations\": [\n {\n \"id\": \"organize\",\n \"options\": {}\n }\n ],\n \"type\": \"timeseries\",\n \"version\": \"3.0.0\"\n },\n {\n \"custom\": {\n \"drawStyle\": \"lines\",\n \"fillOpacity\": 0.3,\n \"gradientMode\": \"opacity\",\n \"lineInterpolation\": \"smooth\",\n \"lineWidth\": 2,\n \"scaleDistribution\": {\n \"type\": \"linear\"\n },\n \"spanNulls\": false,\n \"stack\": \"off\"\n },\n \"datasourceCate\": \"prometheus\",\n \"datasourceValue\": \"${datasource}\",\n \"id\": \"51834321-efc6-4fe8-af4d-de0aa0a8ac32\",\n \"layout\": {\n \"h\": 4,\n \"i\": \"601ac8db-e263-4465-9dea-136b0480e437\",\n \"isResizable\": true,\n \"w\": 6,\n \"x\": 18,\n \"y\": 46\n },\n \"maxPerRow\": 4,\n \"name\": \"DeleteObject成功请求\",\n \"options\": {\n \"legend\": {\n \"displayMode\": \"hidden\"\n },\n \"standardOptions\": {\n \"util\": \"none\"\n },\n \"thresholds\": {\n \"steps\": [\n {\n \"color\": \"#634CD9\",\n \"type\": \"base\",\n \"value\": null\n }\n ]\n },\n \"tooltip\": {\n \"mode\": \"all\",\n \"sort\": \"none\"\n }\n },\n \"targets\": [\n {\n \"expr\": \"aliyun_acs_oss_dashboard_delete_object_count_value\",\n \"legend\": \"DeleteObject成功请求数\",\n \"refId\": \"A\"\n }\n ],\n \"transformations\": [\n {\n \"id\": \"organize\",\n \"options\": {}\n }\n ],\n \"type\": \"timeseries\",\n \"version\": \"3.0.0\"\n },\n {\n \"custom\": {\n \"drawStyle\": \"lines\",\n \"fillOpacity\": 0.3,\n \"gradientMode\": \"opacity\",\n \"lineInterpolation\": \"smooth\",\n \"lineWidth\": 2,\n \"scaleDistribution\": {\n \"type\": \"linear\"\n },\n \"spanNulls\": false,\n \"stack\": \"off\"\n },\n \"datasourceCate\": \"prometheus\",\n \"datasourceValue\": \"${datasource}\",\n \"id\": \"c455124e-a519-43fb-b6eb-b617e80dcfcc\",\n \"layout\": {\n \"h\": 4,\n \"i\": \"ad8b49a7-f63e-4952-88b8-afcf44fb674c\",\n \"isResizable\": true,\n \"w\": 6,\n \"x\": 0,\n \"y\": 50\n },\n \"maxPerRow\": 4,\n \"name\": \"DeleteObjects成功请求\",\n \"options\": {\n \"legend\": {\n \"displayMode\": \"hidden\"\n },\n \"standardOptions\": {\n \"util\": \"none\"\n },\n \"thresholds\": {\n \"steps\": [\n {\n \"color\": \"#634CD9\",\n \"type\": \"base\",\n \"value\": null\n }\n ]\n },\n \"tooltip\": {\n \"mode\": \"all\",\n \"sort\": \"none\"\n }\n },\n \"targets\": [\n {\n \"expr\": \"aliyun_acs_oss_dashboard_delete_objects_count_value\",\n \"legend\": \"DeleteObjects成功请求数\",\n \"refId\": \"A\"\n }\n ],\n \"transformations\": [\n {\n \"id\": \"organize\",\n \"options\": {}\n }\n ],\n \"type\": \"timeseries\",\n \"version\": \"3.0.0\"\n }\n ],\n \"var\": [\n {\n \"definition\": \"prometheus\",\n \"name\": \"datasource\",\n \"type\": \"datasource\"\n },\n {\n \"allOption\": true,\n \"datasource\": {\n \"cate\": \"prometheus\",\n \"value\": \"${datasource}\"\n },\n \"definition\": \"label_values(aliyun_acs_oss_dashboard_get_object_count_value, user_id)\",\n \"multi\": true,\n \"name\": \"user_id\",\n \"type\": \"query\"\n }\n ],\n \"version\": \"3.0.0\"\n },\n \"public\": 0,\n \"public_cate\": 0,\n \"bgids\": null,\n \"built_in\": 0,\n \"hide\": 0,\n \"uuid\": 1717556327116137000\n}"
},
{
"path": "integrations/AliYun/dashboards/polardb_mysql.json",
"content": "{\n \"id\": 0,\n \"group_id\": 0,\n \"name\": \"阿里云POLARDB-MySQL\",\n \"ident\": \"\",\n \"tags\": \"polardb 阿里云\",\n \"create_at\": 0,\n \"create_by\": \"\",\n \"update_at\": 0,\n \"update_by\": \"\",\n \"configs\": {\n \"panels\": [\n {\n \"custom\": {\n \"drawStyle\": \"lines\",\n \"fillOpacity\": 0.3,\n \"gradientMode\": \"opacity\",\n \"lineInterpolation\": \"smooth\",\n \"lineWidth\": 2,\n \"scaleDistribution\": {\n \"type\": \"linear\"\n },\n \"spanNulls\": false,\n \"stack\": \"off\"\n },\n \"datasourceCate\": \"prometheus\",\n \"datasourceValue\": \"${datasource}\",\n \"id\": \"b72c5032-1ea0-4c87-9cfd-d21b374680f1\",\n \"layout\": {\n \"h\": 4,\n \"i\": \"b72c5032-1ea0-4c87-9cfd-d21b374680f1\",\n \"isResizable\": true,\n \"w\": 8,\n \"x\": 0,\n \"y\": 0\n },\n \"maxPerRow\": 4,\n \"name\": \"活跃连接数\",\n \"options\": {\n \"legend\": {\n \"displayMode\": \"hidden\"\n },\n \"standardOptions\": {},\n \"thresholds\": {\n \"steps\": [\n {\n \"color\": \"#634CD9\",\n \"type\": \"base\",\n \"value\": null\n }\n ]\n },\n \"tooltip\": {\n \"mode\": \"all\",\n \"sort\": \"none\"\n }\n },\n \"targets\": [\n {\n \"expr\": \"aliyun_acs_polardb_cluster_active_sessions_average{node_id=\\\"$node_id\\\"}\",\n \"legend\": \"\",\n \"refId\": \"A\"\n }\n ],\n \"transformations\": [\n {\n \"id\": \"organize\",\n \"options\": {}\n }\n ],\n \"type\": \"timeseries\",\n \"version\": \"3.0.0\"\n },\n {\n \"custom\": {\n \"drawStyle\": \"lines\",\n \"fillOpacity\": 0.3,\n \"gradientMode\": \"opacity\",\n \"lineInterpolation\": \"smooth\",\n \"lineWidth\": 2,\n \"scaleDistribution\": {\n \"type\": \"linear\"\n },\n \"spanNulls\": false,\n \"stack\": \"off\"\n },\n \"datasourceCate\": \"prometheus\",\n \"datasourceValue\": \"${datasource}\",\n \"id\": \"b518c9c4-f0e8-4712-ab67-be4521eeff0c\",\n \"layout\": {\n \"h\": 4,\n \"i\": \"ff589719-6072-488d-819d-6e080a6f3c60\",\n \"isResizable\": true,\n \"w\": 8,\n \"x\": 8,\n \"y\": 0\n },\n \"maxPerRow\": 4,\n \"name\": \"连接数使用率\",\n \"options\": {\n \"legend\": {\n \"displayMode\": \"hidden\"\n },\n \"standardOptions\": {},\n \"thresholds\": {\n \"steps\": [\n {\n \"color\": \"#634CD9\",\n \"type\": \"base\",\n \"value\": null\n }\n ]\n },\n \"tooltip\": {\n \"mode\": \"all\",\n \"sort\": \"none\"\n }\n },\n \"targets\": [\n {\n \"expr\": \"aliyun_acs_polardb_cluster_connection_utilization_average{node_id=\\\"$node_id\\\"}\",\n \"legend\": \"\",\n \"refId\": \"A\"\n }\n ],\n \"transformations\": [\n {\n \"id\": \"organize\",\n \"options\": {}\n }\n ],\n \"type\": \"timeseries\",\n \"version\": \"3.0.0\"\n },\n {\n \"custom\": {\n \"drawStyle\": \"lines\",\n \"fillOpacity\": 0.3,\n \"gradientMode\": \"opacity\",\n \"lineInterpolation\": \"smooth\",\n \"lineWidth\": 2,\n \"scaleDistribution\": {\n \"type\": \"linear\"\n },\n \"spanNulls\": false,\n \"stack\": \"off\"\n },\n \"datasourceCate\": \"prometheus\",\n \"datasourceValue\": \"${datasource}\",\n \"id\": \"12d4a674-6d09-4b02-aa4f-d767531bd368\",\n \"layout\": {\n \"h\": 4,\n \"i\": \"baba4778-b950-4224-9dac-9ecda041f93b\",\n \"isResizable\": true,\n \"w\": 8,\n \"x\": 16,\n \"y\": 0\n },\n \"maxPerRow\": 4,\n \"name\": \"CPU使用率\",\n \"options\": {\n \"legend\": {\n \"displayMode\": \"hidden\"\n },\n \"standardOptions\": {},\n \"thresholds\": {\n \"steps\": [\n {\n \"color\": \"#634CD9\",\n \"type\": \"base\",\n \"value\": null\n }\n ]\n },\n \"tooltip\": {\n \"mode\": \"all\",\n \"sort\": \"none\"\n }\n },\n \"targets\": [\n {\n \"expr\": \"aliyun_acs_polardb_cluster_cpu_utilization_average{node_id=\\\"$node_id\\\"}\",\n \"legend\": \"\",\n \"refId\": \"A\"\n }\n ],\n \"transformations\": [\n {\n \"id\": \"organize\",\n \"options\": {}\n }\n ],\n \"type\": \"timeseries\",\n \"version\": \"3.0.0\"\n },\n {\n \"custom\": {\n \"drawStyle\": \"lines\",\n \"fillOpacity\": 0.3,\n \"gradientMode\": \"opacity\",\n \"lineInterpolation\": \"smooth\",\n \"lineWidth\": 2,\n \"scaleDistribution\": {\n \"type\": \"linear\"\n },\n \"spanNulls\": false,\n \"stack\": \"off\"\n },\n \"datasourceCate\": \"prometheus\",\n \"datasourceValue\": \"${datasource}\",\n \"id\": \"86c1f728-ac1e-402b-bea6-2e3979f472c3\",\n \"layout\": {\n \"h\": 4,\n \"i\": \"5d673c5d-1fbb-4df4-9ece-c991d053ca34\",\n \"isResizable\": true,\n \"w\": 8,\n \"x\": 0,\n \"y\": 4\n },\n \"maxPerRow\": 4,\n \"name\": \"每秒存储引擎IO吞吐量(KB)\",\n \"options\": {\n \"legend\": {\n \"displayMode\": \"hidden\"\n },\n \"standardOptions\": {},\n \"thresholds\": {\n \"steps\": [\n {\n \"color\": \"#634CD9\",\n \"type\": \"base\",\n \"value\": null\n }\n ]\n },\n \"tooltip\": {\n \"mode\": \"all\",\n \"sort\": \"none\"\n }\n },\n \"targets\": [\n {\n \"expr\": \"aliyun_acs_polardb_cluster_data_io_average{node_id=\\\"$node_id\\\"}\",\n \"legend\": \"\",\n \"refId\": \"A\"\n }\n ],\n \"transformations\": [\n {\n \"id\": \"organize\",\n \"options\": {}\n }\n ],\n \"type\": \"timeseries\",\n \"version\": \"3.0.0\"\n },\n {\n \"custom\": {\n \"drawStyle\": \"lines\",\n \"fillOpacity\": 0.3,\n \"gradientMode\": \"opacity\",\n \"lineInterpolation\": \"smooth\",\n \"lineWidth\": 2,\n \"scaleDistribution\": {\n \"type\": \"linear\"\n },\n \"spanNulls\": false,\n \"stack\": \"off\"\n },\n \"datasourceCate\": \"prometheus\",\n \"datasourceValue\": \"${datasource}\",\n \"id\": \"e5a04daf-a6a1-4248-93ac-72dbd3d04f0b\",\n \"layout\": {\n \"h\": 4,\n \"i\": \"e4c12b45-5748-4568-a108-c7f3b640a24c\",\n \"isResizable\": true,\n \"w\": 8,\n \"x\": 8,\n \"y\": 4\n },\n \"maxPerRow\": 4,\n \"name\": \"每秒存储引擎IO次数(countSecond)\",\n \"options\": {\n \"legend\": {\n \"displayMode\": \"hidden\"\n },\n \"standardOptions\": {},\n \"thresholds\": {\n \"steps\": [\n {\n \"color\": \"#634CD9\",\n \"type\": \"base\",\n \"value\": null\n }\n ]\n },\n \"tooltip\": {\n \"mode\": \"all\",\n \"sort\": \"none\"\n }\n },\n \"targets\": [\n {\n \"expr\": \"aliyun_acs_polardb_cluster_data_iops_average{node_id=\\\"$node_id\\\"}\",\n \"legend\": \"\",\n \"refId\": \"A\"\n }\n ],\n \"transformations\": [\n {\n \"id\": \"organize\",\n \"options\": {}\n }\n ],\n \"type\": \"timeseries\",\n \"version\": \"3.0.0\"\n },\n {\n \"custom\": {\n \"drawStyle\": \"lines\",\n \"fillOpacity\": 0.3,\n \"gradientMode\": \"opacity\",\n \"lineInterpolation\": \"smooth\",\n \"lineWidth\": 2,\n \"scaleDistribution\": {\n \"type\": \"linear\"\n },\n \"spanNulls\": false,\n \"stack\": \"off\"\n },\n \"datasourceCate\": \"prometheus\",\n \"datasourceValue\": \"${datasource}\",\n \"id\": \"56a0e345-1d4d-4051-a3cf-738bea220f96\",\n \"layout\": {\n \"h\": 4,\n \"i\": \"d1752ed4-f4a1-4c4b-854f-1c2ef01b34a4\",\n \"isResizable\": true,\n \"w\": 8,\n \"x\": 16,\n \"y\": 4\n },\n \"maxPerRow\": 4,\n \"name\": \"每秒IO次数(countSecond)\",\n \"options\": {\n \"legend\": {\n \"displayMode\": \"hidden\"\n },\n \"standardOptions\": {},\n \"thresholds\": {\n \"steps\": [\n {\n \"color\": \"#634CD9\",\n \"type\": \"base\",\n \"value\": null\n }\n ]\n },\n \"tooltip\": {\n \"mode\": \"all\",\n \"sort\": \"none\"\n }\n },\n \"targets\": [\n {\n \"expr\": \"aliyun_acs_polardb_cluster_iops_usage_average{node_id=\\\"$node_id\\\"}\",\n \"legend\": \"\",\n \"refId\": \"A\"\n }\n ],\n \"transformations\": [\n {\n \"id\": \"organize\",\n \"options\": {}\n }\n ],\n \"type\": \"timeseries\",\n \"version\": \"3.0.0\"\n },\n {\n \"custom\": {\n \"drawStyle\": \"lines\",\n \"fillOpacity\": 0.3,\n \"gradientMode\": \"opacity\",\n \"lineInterpolation\": \"smooth\",\n \"lineWidth\": 2,\n \"scaleDistribution\": {\n \"type\": \"linear\"\n },\n \"spanNulls\": false,\n \"stack\": \"off\"\n },\n \"datasourceCate\": \"prometheus\",\n \"datasourceValue\": \"${datasource}\",\n \"id\": \"58799c95-0429-43eb-ba8e-33611d0795ab\",\n \"layout\": {\n \"h\": 4,\n \"i\": \"fe529101-422b-407c-ad77-b71b58b8848a\",\n \"isResizable\": true,\n \"w\": 8,\n \"x\": 0,\n \"y\": 8\n },\n \"maxPerRow\": 4,\n \"name\": \"内存命中率(%)\",\n \"options\": {\n \"legend\": {\n \"displayMode\": \"hidden\"\n },\n \"standardOptions\": {\n \"util\": \"percent\"\n },\n \"thresholds\": {\n \"steps\": [\n {\n \"color\": \"#634CD9\",\n \"type\": \"base\",\n \"value\": null\n }\n ]\n },\n \"tooltip\": {\n \"mode\": \"all\",\n \"sort\": \"none\"\n }\n },\n \"targets\": [\n {\n \"expr\": \"aliyun_acs_polardb_cluster_mem_hit_ratio_average{node_id=\\\"$node_id\\\"}\",\n \"legend\": \"\",\n \"refId\": \"A\"\n }\n ],\n \"transformations\": [\n {\n \"id\": \"organize\",\n \"options\": {}\n }\n ],\n \"type\": \"timeseries\",\n \"version\": \"3.0.0\"\n },\n {\n \"custom\": {\n \"drawStyle\": \"lines\",\n \"fillOpacity\": 0.3,\n \"gradientMode\": \"opacity\",\n \"lineInterpolation\": \"smooth\",\n \"lineWidth\": 2,\n \"scaleDistribution\": {\n \"type\": \"linear\"\n },\n \"spanNulls\": false,\n \"stack\": \"off\"\n },\n \"datasourceCate\": \"prometheus\",\n \"datasourceValue\": \"${datasource}\",\n \"id\": \"55b17951-a4ae-46a7-a2d7-57db1414f6ff\",\n \"layout\": {\n \"h\": 4,\n \"i\": \"c4c248bd-21fb-4485-8235-f50640116e65\",\n \"isResizable\": true,\n \"w\": 8,\n \"x\": 8,\n \"y\": 8\n },\n \"maxPerRow\": 4,\n \"name\": \"内存使用率(%)\",\n \"options\": {\n \"legend\": {\n \"displayMode\": \"hidden\"\n },\n \"standardOptions\": {\n \"util\": \"percent\"\n },\n \"thresholds\": {\n \"steps\": [\n {\n \"color\": \"#634CD9\",\n \"type\": \"base\",\n \"value\": null\n }\n ]\n },\n \"tooltip\": {\n \"mode\": \"all\",\n \"sort\": \"none\"\n }\n },\n \"targets\": [\n {\n \"expr\": \"aliyun_acs_polardb_cluster_memory_utilization_average{node_id=\\\"$node_id\\\"}\",\n \"legend\": \"\",\n \"refId\": \"A\"\n }\n ],\n \"transformations\": [\n {\n \"id\": \"organize\",\n \"options\": {}\n }\n ],\n \"type\": \"timeseries\",\n \"version\": \"3.0.0\"\n },\n {\n \"custom\": {\n \"drawStyle\": \"lines\",\n \"fillOpacity\": 0.3,\n \"gradientMode\": \"opacity\",\n \"lineInterpolation\": \"smooth\",\n \"lineWidth\": 2,\n \"scaleDistribution\": {\n \"type\": \"linear\"\n },\n \"spanNulls\": false,\n \"stack\": \"off\"\n },\n \"datasourceCate\": \"prometheus\",\n \"datasourceValue\": \"${datasource}\",\n \"id\": \"2e545b2b-130b-4829-a2d2-ee5305c302aa\",\n \"layout\": {\n \"h\": 4,\n \"i\": \"13dceb72-9e9d-483d-86d2-b192debdcece\",\n \"isResizable\": true,\n \"w\": 8,\n \"x\": 16,\n \"y\": 8\n },\n \"maxPerRow\": 4,\n \"name\": \"每秒查询数量(count)\",\n \"options\": {\n \"legend\": {\n \"displayMode\": \"hidden\"\n },\n \"standardOptions\": {},\n \"thresholds\": {\n \"steps\": [\n {\n \"color\": \"#634CD9\",\n \"type\": \"base\",\n \"value\": null\n }\n ]\n },\n \"tooltip\": {\n \"mode\": \"all\",\n \"sort\": \"none\"\n }\n },\n \"targets\": [\n {\n \"expr\": \"aliyun_acs_polardb_cluster_qps_average{node_id=\\\"$node_id\\\"}\",\n \"legend\": \"\",\n \"refId\": \"A\"\n }\n ],\n \"transformations\": [\n {\n \"id\": \"organize\",\n \"options\": {}\n }\n ],\n \"type\": \"timeseries\",\n \"version\": \"3.0.0\"\n },\n {\n \"custom\": {\n \"drawStyle\": \"lines\",\n \"fillOpacity\": 0.3,\n \"gradientMode\": \"opacity\",\n \"lineInterpolation\": \"smooth\",\n \"lineWidth\": 2,\n \"scaleDistribution\": {\n \"type\": \"linear\"\n },\n \"spanNulls\": false,\n \"stack\": \"off\"\n },\n \"datasourceCate\": \"prometheus\",\n \"datasourceValue\": \"${datasource}\",\n \"id\": \"70d33549-dd0d-4b68-90e7-f2759fa6bcd5\",\n \"layout\": {\n \"h\": 4,\n \"i\": \"496c32c6-49f3-4506-a491-772ac5159f89\",\n \"isResizable\": true,\n \"w\": 8,\n \"x\": 0,\n \"y\": 12\n },\n \"maxPerRow\": 4,\n \"name\": \"每秒慢查询数量(countS)\",\n \"options\": {\n \"legend\": {\n \"displayMode\": \"hidden\"\n },\n \"standardOptions\": {},\n \"thresholds\": {\n \"steps\": [\n {\n \"color\": \"#634CD9\",\n \"type\": \"base\",\n \"value\": null\n }\n ]\n },\n \"tooltip\": {\n \"mode\": \"all\",\n \"sort\": \"none\"\n }\n },\n \"targets\": [\n {\n \"expr\": \"aliyun_acs_polardb_cluster_slow_queries_ps_average{node_id=\\\"$node_id\\\"}\",\n \"legend\": \"\",\n \"refId\": \"A\"\n }\n ],\n \"transformations\": [\n {\n \"id\": \"organize\",\n \"options\": {}\n }\n ],\n \"type\": \"timeseries\",\n \"version\": \"3.0.0\"\n },\n {\n \"custom\": {\n \"drawStyle\": \"lines\",\n \"fillOpacity\": 0.3,\n \"gradientMode\": \"opacity\",\n \"lineInterpolation\": \"smooth\",\n \"lineWidth\": 2,\n \"scaleDistribution\": {\n \"type\": \"linear\"\n },\n \"spanNulls\": false,\n \"stack\": \"off\"\n },\n \"datasourceCate\": \"prometheus\",\n \"datasourceValue\": \"${datasource}\",\n \"id\": \"61443377-131b-4cf9-8b3b-8f1cf4794086\",\n \"layout\": {\n \"h\": 4,\n \"i\": \"dfcbc2d9-2714-4e8f-b5b6-290a7e9e35ce\",\n \"isResizable\": true,\n \"w\": 8,\n \"x\": 8,\n \"y\": 12\n },\n \"maxPerRow\": 4,\n \"name\": \"每秒事务数(countS)\",\n \"options\": {\n \"legend\": {\n \"displayMode\": \"hidden\"\n },\n \"standardOptions\": {},\n \"thresholds\": {\n \"steps\": [\n {\n \"color\": \"#634CD9\",\n \"type\": \"base\",\n \"value\": null\n }\n ]\n },\n \"tooltip\": {\n \"mode\": \"all\",\n \"sort\": \"none\"\n }\n },\n \"targets\": [\n {\n \"expr\": \"aliyun_acs_polardb_cluster_tps_average{node_id=\\\"$node_id\\\"}\",\n \"legend\": \"\",\n \"refId\": \"A\"\n }\n ],\n \"transformations\": [\n {\n \"id\": \"organize\",\n \"options\": {}\n }\n ],\n \"type\": \"timeseries\",\n \"version\": \"3.0.0\"\n }\n ],\n \"var\": [\n {\n \"definition\": \"prometheus\",\n \"label\": \"datasource\",\n \"name\": \"datasource\",\n \"type\": \"datasource\"\n },\n {\n \"datasource\": {\n \"cate\": \"prometheus\",\n \"value\": \"${datasource}\"\n },\n \"definition\": \"label_values(aliyun_acs_polardb_cluster_mps_average, name)\",\n \"label\": \"\",\n \"name\": \"name\",\n \"type\": \"query\"\n },\n {\n \"datasource\": {\n \"cate\": \"prometheus\",\n \"value\": \"${datasource}\"\n },\n \"definition\": \"label_values(aliyun_acs_polardb_cluster_mps_average{name=\\\"$name\\\"}, cluster_id)\",\n \"label\": \"cluster_id\",\n \"name\": \"cluster_id\",\n \"type\": \"query\"\n },\n {\n \"datasource\": {\n \"cate\": \"prometheus\",\n \"value\": \"${datasource}\"\n },\n \"definition\": \"label_values(aliyun_acs_polardb_cluster_active_sessions_average{cluster_id=\\\"$cluster_id\\\"}, node_id)\",\n \"label\": \"node_id\",\n \"name\": \"node_id\",\n \"type\": \"query\"\n }\n ],\n \"version\": \"3.0.0\"\n },\n \"public\": 0,\n \"public_cate\": 0,\n \"bgids\": null,\n \"built_in\": 0,\n \"hide\": 0,\n \"uuid\": 1717556327122536000\n}"
},
{
"path": "integrations/AliYun/dashboards/rds.json",
"content": "{\n \"id\": 0,\n \"group_id\": 0,\n \"name\": \"阿里云RDS\",\n \"ident\": \"\",\n \"tags\": \"\",\n \"create_at\": 0,\n \"create_by\": \"\",\n \"update_at\": 0,\n \"update_by\": \"\",\n \"configs\": {\n \"panels\": [\n {\n \"custom\": {\n \"drawStyle\": \"lines\",\n \"fillOpacity\": 0.3,\n \"gradientMode\": \"opacity\",\n \"lineInterpolation\": \"smooth\",\n \"lineWidth\": 2,\n \"scaleDistribution\": {\n \"type\": \"linear\"\n },\n \"spanNulls\": false,\n \"stack\": \"off\"\n },\n \"datasourceCate\": \"prometheus\",\n \"datasourceValue\": \"${datasource}\",\n \"id\": \"01f4d444-aa2d-466d-9615-c76baf60a40c\",\n \"layout\": {\n \"h\": 4,\n \"i\": \"01f4d444-aa2d-466d-9615-c76baf60a40c\",\n \"isResizable\": true,\n \"w\": 12,\n \"x\": 0,\n \"y\": 0\n },\n \"maxPerRow\": 4,\n \"name\": \"CPU平均使用率\",\n \"options\": {\n \"legend\": {\n \"displayMode\": \"hidden\"\n },\n \"standardOptions\": {},\n \"thresholds\": {\n \"steps\": [\n {\n \"color\": \"#634CD9\",\n \"type\": \"base\",\n \"value\": null\n }\n ]\n },\n \"tooltip\": {\n \"mode\": \"all\",\n \"sort\": \"none\"\n }\n },\n \"targets\": [\n {\n \"expr\": \"sum(aliyun_acs_rds_dashboard_cpu_usage_average{instance_id=\\\"$instance_id\\\"}) by (instance_id)\",\n \"legend\": \"\",\n \"refId\": \"A\"\n }\n ],\n \"type\": \"timeseries\",\n \"version\": \"2.0.0\"\n },\n {\n \"custom\": {\n \"drawStyle\": \"lines\",\n \"fillOpacity\": 0.3,\n \"gradientMode\": \"opacity\",\n \"lineInterpolation\": \"smooth\",\n \"lineWidth\": 2,\n \"scaleDistribution\": {\n \"type\": \"linear\"\n },\n \"spanNulls\": false,\n \"stack\": \"off\"\n },\n \"datasourceCate\": \"prometheus\",\n \"datasourceValue\": \"${datasource}\",\n \"id\": \"c43eb882-915f-4c38-a0b5-8f33c21ab44a\",\n \"layout\": {\n \"h\": 4,\n \"i\": \"09903231-6557-42be-9cf3-2873878e9bf2\",\n \"isResizable\": true,\n \"w\": 12,\n \"x\": 12,\n \"y\": 0\n },\n \"maxPerRow\": 4,\n \"name\": \"内存平均使用率\",\n \"options\": {\n \"legend\": {\n \"displayMode\": \"hidden\"\n },\n \"standardOptions\": {},\n \"thresholds\": {\n \"steps\": [\n {\n \"color\": \"#634CD9\",\n \"type\": \"base\",\n \"value\": null\n }\n ]\n },\n \"tooltip\": {\n \"mode\": \"all\",\n \"sort\": \"none\"\n }\n },\n \"targets\": [\n {\n \"expr\": \"sum(aliyun_acs_rds_dashboard_memory_usage_average{instance_id=\\\"$instance_id\\\"}) by (instance_id)\",\n \"legend\": \"\",\n \"refId\": \"A\"\n }\n ],\n \"type\": \"timeseries\",\n \"version\": \"2.0.0\"\n },\n {\n \"custom\": {\n \"drawStyle\": \"lines\",\n \"fillOpacity\": 0.3,\n \"gradientMode\": \"opacity\",\n \"lineInterpolation\": \"smooth\",\n \"lineWidth\": 2,\n \"scaleDistribution\": {\n \"type\": \"linear\"\n },\n \"spanNulls\": false,\n \"stack\": \"off\"\n },\n \"datasourceCate\": \"prometheus\",\n \"datasourceValue\": \"${datasource}\",\n \"id\": \"37447883-ad79-46bc-888a-1be2835c1c64\",\n \"layout\": {\n \"h\": 4,\n \"i\": \"378a5a26-c28e-4612-af09-f82ec2e11d80\",\n \"isResizable\": true,\n \"w\": 12,\n \"x\": 0,\n \"y\": 4\n },\n \"maxPerRow\": 4,\n \"name\": \"磁盘平均使用率\",\n \"options\": {\n \"legend\": {\n \"displayMode\": \"hidden\"\n },\n \"standardOptions\": {},\n \"thresholds\": {\n \"steps\": [\n {\n \"color\": \"#634CD9\",\n \"type\": \"base\",\n \"value\": null\n }\n ]\n },\n \"tooltip\": {\n \"mode\": \"all\",\n \"sort\": \"none\"\n }\n },\n \"targets\": [\n {\n \"expr\": \"sum(aliyun_acs_rds_dashboard_disk_usage_average{instance_id=\\\"$instance_id\\\"}) by (instance_id)\",\n \"legend\": \"\",\n \"refId\": \"A\"\n }\n ],\n \"type\": \"timeseries\",\n \"version\": \"2.0.0\"\n },\n {\n \"custom\": {\n \"drawStyle\": \"lines\",\n \"fillOpacity\": 0.3,\n \"gradientMode\": \"opacity\",\n \"lineInterpolation\": \"smooth\",\n \"lineWidth\": 2,\n \"scaleDistribution\": {\n \"type\": \"linear\"\n },\n \"spanNulls\": false,\n \"stack\": \"off\"\n },\n \"datasourceCate\": \"prometheus\",\n \"datasourceValue\": \"${datasource}\",\n \"id\": \"c9735607-3f24-44a7-bbf1-3ad39441c5c9\",\n \"layout\": {\n \"h\": 4,\n \"i\": \"93a4c8a6-ac23-4e26-8a38-781ec1668820\",\n \"isResizable\": true,\n \"w\": 12,\n \"x\": 12,\n \"y\": 4\n },\n \"maxPerRow\": 4,\n \"name\": \"IOPS平均使用率\",\n \"options\": {\n \"legend\": {\n \"displayMode\": \"hidden\"\n },\n \"standardOptions\": {},\n \"thresholds\": {\n \"steps\": [\n {\n \"color\": \"#634CD9\",\n \"type\": \"base\",\n \"value\": null\n }\n ]\n },\n \"tooltip\": {\n \"mode\": \"all\",\n \"sort\": \"none\"\n }\n },\n \"targets\": [\n {\n \"expr\": \"sum(aliyun_acs_rds_dashboard_iops_usage_average{instance_id=\\\"$instance_id\\\"}) by (instance_id)\",\n \"legend\": \"\",\n \"refId\": \"A\"\n }\n ],\n \"type\": \"timeseries\",\n \"version\": \"2.0.0\"\n },\n {\n \"custom\": {\n \"drawStyle\": \"lines\",\n \"fillOpacity\": 0.3,\n \"gradientMode\": \"opacity\",\n \"lineInterpolation\": \"smooth\",\n \"lineWidth\": 2,\n \"scaleDistribution\": {\n \"type\": \"linear\"\n },\n \"spanNulls\": false,\n \"stack\": \"off\"\n },\n \"datasourceCate\": \"prometheus\",\n \"datasourceValue\": \"${datasource}\",\n \"id\": \"b516e7dc-8022-409d-b907-18c4143df891\",\n \"layout\": {\n \"h\": 5,\n \"i\": \"b516e7dc-8022-409d-b907-18c4143df891\",\n \"isResizable\": true,\n \"w\": 24,\n \"x\": 0,\n \"y\": 8\n },\n \"maxPerRow\": 4,\n \"name\": \"SQL执行量\",\n \"options\": {\n \"legend\": {\n \"displayMode\": \"hidden\"\n },\n \"standardOptions\": {\n \"util\": \"percent\"\n },\n \"thresholds\": {\n \"steps\": [\n {\n \"color\": \"#634CD9\",\n \"type\": \"base\",\n \"value\": null\n }\n ]\n },\n \"tooltip\": {\n \"mode\": \"all\",\n \"sort\": \"none\"\n }\n },\n \"targets\": [\n {\n \"expr\": \"sum(aliyun_acs_rds_dashboard_my_sql_com_delete_average{instance_id=\\\"$instance_id\\\"}) by (instance_id)\",\n \"legend\": \"delete\",\n \"refId\": \"A\"\n },\n {\n \"expr\": \"sum(aliyun_acs_rds_dashboard_my_sql_com_insert_average{instance_id=\\\"$instance_id\\\"}) by (instance_id)\",\n \"legend\": \"insert\",\n \"refId\": \"B\"\n },\n {\n \"expr\": \"sum(aliyun_acs_rds_dashboard_my_sql_com_insert_select_average{instance_id=\\\"$instance_id\\\"}) by (instance_id)\",\n \"legend\": \"insert_select\",\n \"refId\": \"C\"\n },\n {\n \"expr\": \"sum(aliyun_acs_rds_dashboard_my_sql_com_update_average{instance_id=\\\"$instance_id\\\"}) by (instance_id)\",\n \"legend\": \"update\",\n \"refId\": \"D\"\n },\n {\n \"expr\": \"sum(aliyun_acs_rds_dashboard_my_sql_com_select_average{instance_id=\\\"$instance_id\\\"}) by (instance_id)\",\n \"legend\": \"select\",\n \"refId\": \"E\"\n }\n ],\n \"type\": \"timeseries\",\n \"version\": \"2.0.0\"\n }\n ],\n \"var\": [\n {\n \"definition\": \"prometheus\",\n \"name\": \"datasource\",\n \"type\": \"datasource\"\n },\n {\n \"datasource\": {\n \"cate\": \"prometheus\",\n \"value\": \"${datasource}\"\n },\n \"definition\": \"label_values(aliyun_acs_rds_dashboard_cpu_usage_average,name)\",\n \"multi\": false,\n \"name\": \"name\",\n \"type\": \"query\"\n },\n {\n \"datasource\": {\n \"cate\": \"prometheus\",\n \"value\": \"${datasource}\"\n },\n \"definition\": \"label_values(aliyun_acs_rds_dashboard_cpu_usage_average{name=\\\"$name\\\"},instance_id)\",\n \"multi\": false,\n \"name\": \"instance_id\",\n \"type\": \"query\"\n }\n ],\n \"version\": \"3.0.0\"\n },\n \"public\": 0,\n \"public_cate\": 0,\n \"bgids\": null,\n \"built_in\": 0,\n \"hide\": 0,\n \"uuid\": 1717556327125143000\n}"
},
{
"path": "integrations/AliYun/dashboards/rds_new.json",
"content": "{\n \"id\": 0,\n \"group_id\": 0,\n \"name\": \"阿里云RDS_N\",\n \"ident\": \"\",\n \"tags\": \"\",\n \"create_at\": 0,\n \"create_by\": \"\",\n \"update_at\": 0,\n \"update_by\": \"\",\n \"configs\": {\n \"panels\": [\n {\n \"custom\": {\n \"drawStyle\": \"lines\",\n \"fillOpacity\": 0.3,\n \"gradientMode\": \"opacity\",\n \"lineInterpolation\": \"smooth\",\n \"lineWidth\": 2,\n \"scaleDistribution\": {\n \"type\": \"linear\"\n },\n \"spanNulls\": false,\n \"stack\": \"off\"\n },\n \"datasourceCate\": \"prometheus\",\n \"datasourceValue\": \"${datasource}\",\n \"id\": \"37447883-ad79-46bc-888a-1be2835c1c64\",\n \"layout\": {\n \"h\": 4,\n \"i\": \"378a5a26-c28e-4612-af09-f82ec2e11d80\",\n \"isResizable\": true,\n \"w\": 8,\n \"x\": 0,\n \"y\": 0\n },\n \"maxPerRow\": 4,\n \"name\": \"硬盘使用(%)\",\n \"options\": {\n \"legend\": {\n \"displayMode\": \"hidden\"\n },\n \"standardOptions\": {\n \"util\": \"percent\"\n },\n \"thresholds\": {\n \"steps\": [\n {\n \"color\": \"#634CD9\",\n \"type\": \"base\",\n \"value\": null\n }\n ]\n },\n \"tooltip\": {\n \"mode\": \"all\",\n \"sort\": \"none\"\n }\n },\n \"targets\": [\n {\n \"expr\": \"aliyun_acs_rds_dashboard_disk_usage_average{instance_id=\\\"$instance_id\\\"}\",\n \"legend\": \"\",\n \"refId\": \"A\"\n }\n ],\n \"transformations\": [\n {\n \"id\": \"organize\",\n \"options\": {}\n }\n ],\n \"type\": \"timeseries\",\n \"version\": \"3.0.0\"\n },\n {\n \"custom\": {\n \"drawStyle\": \"lines\",\n \"fillOpacity\": 0.3,\n \"gradientMode\": \"opacity\",\n \"lineInterpolation\": \"smooth\",\n \"lineWidth\": 2,\n \"scaleDistribution\": {\n \"type\": \"linear\"\n },\n \"spanNulls\": false,\n \"stack\": \"off\"\n },\n \"datasourceCate\": \"prometheus\",\n \"datasourceValue\": \"${datasource}\",\n \"id\": \"c9735607-3f24-44a7-bbf1-3ad39441c5c9\",\n \"layout\": {\n \"h\": 4,\n \"i\": \"93a4c8a6-ac23-4e26-8a38-781ec1668820\",\n \"isResizable\": true,\n \"w\": 8,\n \"x\": 8,\n \"y\": 0\n },\n \"maxPerRow\": 4,\n \"name\": \"IOPS使用率(%)\",\n \"options\": {\n \"legend\": {\n \"displayMode\": \"hidden\"\n },\n \"standardOptions\": {\n \"util\": \"percent\"\n },\n \"thresholds\": {\n \"steps\": [\n {\n \"color\": \"#634CD9\",\n \"type\": \"base\",\n \"value\": null\n }\n ]\n },\n \"tooltip\": {\n \"mode\": \"all\",\n \"sort\": \"none\"\n }\n },\n \"targets\": [\n {\n \"expr\": \"aliyun_acs_rds_dashboard_iops_usage_average{instance_id=\\\"$instance_id\\\"}\",\n \"legend\": \"\",\n \"refId\": \"A\"\n }\n ],\n \"transformations\": [\n {\n \"id\": \"organize\",\n \"options\": {}\n }\n ],\n \"type\": \"timeseries\",\n \"version\": \"3.0.0\"\n },\n {\n \"custom\": {\n \"drawStyle\": \"lines\",\n \"fillOpacity\": 0.3,\n \"gradientMode\": \"opacity\",\n \"lineInterpolation\": \"smooth\",\n \"lineWidth\": 2,\n \"scaleDistribution\": {\n \"type\": \"linear\"\n },\n \"spanNulls\": false,\n \"stack\": \"off\"\n },\n \"datasourceCate\": \"prometheus\",\n \"datasourceValue\": \"${datasource}\",\n \"id\": \"9480ea17-27e7-49fa-ab87-3b10f2d4b6ed\",\n \"layout\": {\n \"h\": 4,\n \"i\": \"d428b946-aa8b-449e-a4b7-303e9423b787\",\n \"isResizable\": true,\n \"w\": 8,\n \"x\": 16,\n \"y\": 0\n },\n \"maxPerRow\": 4,\n \"name\": \"连接数使用率(%)\",\n \"options\": {\n \"legend\": {\n \"displayMode\": \"hidden\"\n },\n \"standardOptions\": {\n \"util\": \"percent\"\n },\n \"thresholds\": {\n \"steps\": [\n {\n \"color\": \"#634CD9\",\n \"type\": \"base\",\n \"value\": null\n }\n ]\n },\n \"tooltip\": {\n \"mode\": \"all\",\n \"sort\": \"none\"\n }\n },\n \"targets\": [\n {\n \"expr\": \"aliyun_acs_rds_dashboard_connection_usage_average{instance_id=\\\"$instance_id\\\"}\",\n \"legend\": \"\",\n \"refId\": \"A\"\n }\n ],\n \"transformations\": [\n {\n \"id\": \"organize\",\n \"options\": {}\n }\n ],\n \"type\": \"timeseries\",\n \"version\": \"3.0.0\"\n },\n {\n \"custom\": {\n \"drawStyle\": \"lines\",\n \"fillOpacity\": 0.3,\n \"gradientMode\": \"opacity\",\n \"lineInterpolation\": \"smooth\",\n \"lineWidth\": 2,\n \"scaleDistribution\": {\n \"type\": \"linear\"\n },\n \"spanNulls\": false,\n \"stack\": \"off\"\n },\n \"datasourceCate\": \"prometheus\",\n \"datasourceValue\": \"${datasource}\",\n \"id\": \"01f4d444-aa2d-466d-9615-c76baf60a40c\",\n \"layout\": {\n \"h\": 4,\n \"i\": \"01f4d444-aa2d-466d-9615-c76baf60a40c\",\n \"isResizable\": true,\n \"w\": 8,\n \"x\": 0,\n \"y\": 4\n },\n \"maxPerRow\": 4,\n \"name\": \"CPU使用率(%)\",\n \"options\": {\n \"legend\": {\n \"displayMode\": \"hidden\"\n },\n \"standardOptions\": {\n \"util\": \"percent\"\n },\n \"thresholds\": {\n \"steps\": [\n {\n \"color\": \"#634CD9\",\n \"type\": \"base\",\n \"value\": null\n }\n ]\n },\n \"tooltip\": {\n \"mode\": \"all\",\n \"sort\": \"none\"\n }\n },\n \"targets\": [\n {\n \"expr\": \"sum(aliyun_acs_rds_dashboard_cpu_usage_average{instance_id=\\\"$instance_id\\\"}) by (instance_id)\",\n \"legend\": \"\",\n \"refId\": \"A\"\n }\n ],\n \"transformations\": [\n {\n \"id\": \"organize\",\n \"options\": {}\n }\n ],\n \"type\": \"timeseries\",\n \"version\": \"3.0.0\"\n },\n {\n \"custom\": {\n \"drawStyle\": \"lines\",\n \"fillOpacity\": 0.3,\n \"gradientMode\": \"opacity\",\n \"lineInterpolation\": \"smooth\",\n \"lineWidth\": 2,\n \"scaleDistribution\": {\n \"type\": \"linear\"\n },\n \"spanNulls\": false,\n \"stack\": \"off\"\n },\n \"datasourceCate\": \"prometheus\",\n \"datasourceValue\": \"${datasource}\",\n \"id\": \"c43eb882-915f-4c38-a0b5-8f33c21ab44a\",\n \"layout\": {\n \"h\": 4,\n \"i\": \"09903231-6557-42be-9cf3-2873878e9bf2\",\n \"isResizable\": true,\n \"w\": 8,\n \"x\": 8,\n \"y\": 4\n },\n \"maxPerRow\": 4,\n \"name\": \"内存使用率(%)\",\n \"options\": {\n \"legend\": {\n \"displayMode\": \"hidden\"\n },\n \"standardOptions\": {\n \"util\": \"percent\"\n },\n \"thresholds\": {\n \"steps\": [\n {\n \"color\": \"#634CD9\",\n \"type\": \"base\",\n \"value\": null\n }\n ]\n },\n \"tooltip\": {\n \"mode\": \"all\",\n \"sort\": \"none\"\n }\n },\n \"targets\": [\n {\n \"expr\": \"aliyun_acs_rds_dashboard_memory_usage_average{instance_id=\\\"$instance_id\\\"}\",\n \"legend\": \"\",\n \"refId\": \"A\"\n }\n ],\n \"transformations\": [\n {\n \"id\": \"organize\",\n \"options\": {}\n }\n ],\n \"type\": \"timeseries\",\n \"version\": \"3.0.0\"\n },\n {\n \"custom\": {\n \"drawStyle\": \"lines\",\n \"fillOpacity\": 0.3,\n \"gradientMode\": \"opacity\",\n \"lineInterpolation\": \"smooth\",\n \"lineWidth\": 2,\n \"scaleDistribution\": {\n \"type\": \"linear\"\n },\n \"spanNulls\": false,\n \"stack\": \"off\"\n },\n \"datasourceCate\": \"prometheus\",\n \"datasourceValue\": \"${datasource}\",\n \"id\": \"6a03d4e9-f1f8-4989-bbe0-0ef428365d6e\",\n \"layout\": {\n \"h\": 4,\n \"i\": \"d42cd666-4060-43fc-b0bc-e9698f816c97\",\n \"isResizable\": true,\n \"w\": 8,\n \"x\": 16,\n \"y\": 4\n },\n \"maxPerRow\": 4,\n \"name\": \"MySQL网络入流量(bits/s)\",\n \"options\": {\n \"legend\": {\n \"displayMode\": \"hidden\"\n },\n \"standardOptions\": {\n \"util\": \"bitsSI\"\n },\n \"thresholds\": {\n \"steps\": [\n {\n \"color\": \"#634CD9\",\n \"type\": \"base\",\n \"value\": null\n }\n ]\n },\n \"tooltip\": {\n \"mode\": \"all\",\n \"sort\": \"none\"\n }\n },\n \"targets\": [\n {\n \"expr\": \"aliyun_acs_rds_dashboard_my_sql_network_in_new_average{instance_id=\\\"$instance_id\\\"}\",\n \"legend\": \"\",\n \"refId\": \"A\"\n }\n ],\n \"transformations\": [\n {\n \"id\": \"organize\",\n \"options\": {}\n }\n ],\n \"type\": \"timeseries\",\n \"version\": \"3.0.0\"\n },\n {\n \"custom\": {\n \"drawStyle\": \"lines\",\n \"fillOpacity\": 0.3,\n \"gradientMode\": \"opacity\",\n \"lineInterpolation\": \"smooth\",\n \"lineWidth\": 2,\n \"scaleDistribution\": {\n \"type\": \"linear\"\n },\n \"spanNulls\": false,\n \"stack\": \"off\"\n },\n \"datasourceCate\": \"prometheus\",\n \"datasourceValue\": \"${datasource}\",\n \"id\": \"b516e7dc-8022-409d-b907-18c4143df891\",\n \"layout\": {\n \"h\": 5,\n \"i\": \"b516e7dc-8022-409d-b907-18c4143df891\",\n \"isResizable\": true,\n \"w\": 24,\n \"x\": 0,\n \"y\": 8\n },\n \"maxPerRow\": 4,\n \"name\": \"SQL执行量\",\n \"options\": {\n \"legend\": {\n \"displayMode\": \"hidden\"\n },\n \"standardOptions\": {\n \"util\": \"percent\"\n },\n \"thresholds\": {\n \"steps\": [\n {\n \"color\": \"#634CD9\",\n \"type\": \"base\",\n \"value\": null\n }\n ]\n },\n \"tooltip\": {\n \"mode\": \"all\",\n \"sort\": \"none\"\n }\n },\n \"targets\": [\n {\n \"expr\": \"sum(aliyun_acs_rds_dashboard_my_sql_com_delete_average{instance_id=\\\"$instance_id\\\"}) by (instance_id)\",\n \"legend\": \"delete\",\n \"refId\": \"A\"\n },\n {\n \"expr\": \"sum(aliyun_acs_rds_dashboard_my_sql_com_insert_average{instance_id=\\\"$instance_id\\\"}) by (instance_id)\",\n \"legend\": \"insert\",\n \"refId\": \"B\"\n },\n {\n \"expr\": \"sum(aliyun_acs_rds_dashboard_my_sql_com_insert_select_average{instance_id=\\\"$instance_id\\\"}) by (instance_id)\",\n \"legend\": \"insert_select\",\n \"refId\": \"C\"\n },\n {\n \"expr\": \"sum(aliyun_acs_rds_dashboard_my_sql_com_update_average{instance_id=\\\"$instance_id\\\"}) by (instance_id)\",\n \"legend\": \"update\",\n \"refId\": \"D\"\n },\n {\n \"expr\": \"sum(aliyun_acs_rds_dashboard_my_sql_com_select_average{instance_id=\\\"$instance_id\\\"}) by (instance_id)\",\n \"legend\": \"select\",\n \"refId\": \"E\"\n }\n ],\n \"type\": \"timeseries\",\n \"version\": \"2.0.0\"\n },\n {\n \"custom\": {\n \"drawStyle\": \"lines\",\n \"fillOpacity\": 0.3,\n \"gradientMode\": \"opacity\",\n \"lineInterpolation\": \"smooth\",\n \"lineWidth\": 2,\n \"scaleDistribution\": {\n \"type\": \"linear\"\n },\n \"spanNulls\": false,\n \"stack\": \"off\"\n },\n \"datasourceCate\": \"prometheus\",\n \"datasourceValue\": \"${datasource}\",\n \"id\": \"7a3fbc77-1d6c-40cf-bec9-38b3b0f45dd9\",\n \"layout\": {\n \"h\": 5,\n \"i\": \"96d3ff16-9947-4ec6-95a4-bec2bdfd24d0\",\n \"isResizable\": true,\n \"w\": 24,\n \"x\": 0,\n \"y\": 13\n },\n \"maxPerRow\": 4,\n \"name\": \"SQL慢查询\",\n \"options\": {\n \"legend\": {\n \"displayMode\": \"hidden\"\n },\n \"standardOptions\": {\n \"util\": \"none\"\n },\n \"thresholds\": {\n \"steps\": [\n {\n \"color\": \"#634CD9\",\n \"type\": \"base\",\n \"value\": null\n }\n ]\n },\n \"tooltip\": {\n \"mode\": \"all\",\n \"sort\": \"none\"\n }\n },\n \"targets\": [\n {\n \"expr\": \"aliyun_acs_rds_dashboard_my_sql_slow_queries_average{instance_id=\\\"$instance_id\\\"}\",\n \"legend\": \"\",\n \"refId\": \"A\"\n }\n ],\n \"transformations\": [\n {\n \"id\": \"organize\",\n \"options\": {}\n }\n ],\n \"type\": \"timeseries\",\n \"version\": \"3.0.0\"\n }\n ],\n \"var\": [\n {\n \"definition\": \"prometheus\",\n \"name\": \"datasource\",\n \"type\": \"datasource\"\n },\n {\n \"datasource\": {\n \"cate\": \"prometheus\",\n \"value\": \"${datasource}\"\n },\n \"definition\": \"label_values(aliyun_acs_rds_dashboard_cpu_usage_average,name)\",\n \"multi\": false,\n \"name\": \"name\",\n \"type\": \"query\"\n },\n {\n \"datasource\": {\n \"cate\": \"prometheus\",\n \"value\": \"${datasource}\"\n },\n \"definition\": \"label_values(aliyun_acs_rds_dashboard_cpu_usage_average{name=\\\"$name\\\"},instance_id)\",\n \"multi\": false,\n \"name\": \"instance_id\",\n \"type\": \"query\"\n }\n ],\n \"version\": \"3.0.0\"\n },\n \"public\": 0,\n \"public_cate\": 0,\n \"bgids\": null,\n \"built_in\": 0,\n \"hide\": 0,\n \"uuid\": 1717556327127106000\n}"
},
{
"path": "integrations/AliYun/dashboards/redis.json",
"content": "{\n \"id\": 0,\n \"group_id\": 0,\n \"name\": \"阿里云REDIS\",\n \"ident\": \"\",\n \"tags\": \"\",\n \"create_at\": 0,\n \"create_by\": \"\",\n \"update_at\": 0,\n \"update_by\": \"\",\n \"configs\": {\n \"panels\": [\n {\n \"custom\": {\n \"drawStyle\": \"lines\",\n \"fillOpacity\": 0.3,\n \"gradientMode\": \"opacity\",\n \"lineInterpolation\": \"smooth\",\n \"lineWidth\": 2,\n \"scaleDistribution\": {\n \"type\": \"linear\"\n },\n \"spanNulls\": false,\n \"stack\": \"off\"\n },\n \"datasourceCate\": \"prometheus\",\n \"datasourceValue\": \"${datasource}\",\n \"id\": \"01f4d444-aa2d-466d-9615-c76baf60a40c\",\n \"layout\": {\n \"h\": 4,\n \"i\": \"01f4d444-aa2d-466d-9615-c76baf60a40c\",\n \"isResizable\": true,\n \"w\": 12,\n \"x\": 0,\n \"y\": 0\n },\n \"maxPerRow\": 4,\n \"name\": \"CPU平均使用率\",\n \"options\": {\n \"legend\": {\n \"displayMode\": \"hidden\"\n },\n \"standardOptions\": {},\n \"thresholds\": {\n \"steps\": [\n {\n \"color\": \"#634CD9\",\n \"type\": \"base\",\n \"value\": null\n }\n ]\n },\n \"tooltip\": {\n \"mode\": \"all\",\n \"sort\": \"none\"\n }\n },\n \"targets\": [\n {\n \"expr\": \"sum(aliyun_acs_kvstore_cpu_usage_average{instance_id=\\\"$instance_id\\\"}) by (instance_id)\",\n \"legend\": \"\",\n \"refId\": \"A\"\n }\n ],\n \"type\": \"timeseries\",\n \"version\": \"2.0.0\"\n },\n {\n \"custom\": {\n \"drawStyle\": \"lines\",\n \"fillOpacity\": 0.3,\n \"gradientMode\": \"opacity\",\n \"lineInterpolation\": \"smooth\",\n \"lineWidth\": 2,\n \"scaleDistribution\": {\n \"type\": \"linear\"\n },\n \"spanNulls\": false,\n \"stack\": \"off\"\n },\n \"datasourceCate\": \"prometheus\",\n \"datasourceValue\": \"${datasource}\",\n \"id\": \"c43eb882-915f-4c38-a0b5-8f33c21ab44a\",\n \"layout\": {\n \"h\": 4,\n \"i\": \"09903231-6557-42be-9cf3-2873878e9bf2\",\n \"isResizable\": true,\n \"w\": 12,\n \"x\": 12,\n \"y\": 0\n },\n \"maxPerRow\": 4,\n \"name\": \"内存平均使用率\",\n \"options\": {\n \"legend\": {\n \"displayMode\": \"hidden\"\n },\n \"standardOptions\": {},\n \"thresholds\": {\n \"steps\": [\n {\n \"color\": \"#634CD9\",\n \"type\": \"base\",\n \"value\": null\n }\n ]\n },\n \"tooltip\": {\n \"mode\": \"all\",\n \"sort\": \"none\"\n }\n },\n \"targets\": [\n {\n \"expr\": \"sum(aliyun_acs_kvstore_memory_usage_average{instance_id=\\\"$instance_id\\\"}) by (instance_id)\",\n \"legend\": \"\",\n \"refId\": \"A\"\n }\n ],\n \"type\": \"timeseries\",\n \"version\": \"2.0.0\"\n },\n {\n \"custom\": {\n \"drawStyle\": \"lines\",\n \"fillOpacity\": 0.3,\n \"gradientMode\": \"opacity\",\n \"lineInterpolation\": \"smooth\",\n \"lineWidth\": 2,\n \"scaleDistribution\": {\n \"type\": \"linear\"\n },\n \"spanNulls\": false,\n \"stack\": \"off\"\n },\n \"datasourceCate\": \"prometheus\",\n \"datasourceValue\": \"${datasource}\",\n \"id\": \"37447883-ad79-46bc-888a-1be2835c1c64\",\n \"layout\": {\n \"h\": 4,\n \"i\": \"378a5a26-c28e-4612-af09-f82ec2e11d80\",\n \"isResizable\": true,\n \"w\": 12,\n \"x\": 0,\n \"y\": 4\n },\n \"maxPerRow\": 4,\n \"name\": \"连接数平均使用率\",\n \"options\": {\n \"legend\": {\n \"displayMode\": \"hidden\"\n },\n \"standardOptions\": {},\n \"thresholds\": {\n \"steps\": [\n {\n \"color\": \"#634CD9\",\n \"type\": \"base\",\n \"value\": null\n }\n ]\n },\n \"tooltip\": {\n \"mode\": \"all\",\n \"sort\": \"none\"\n }\n },\n \"targets\": [\n {\n \"expr\": \"sum(aliyun_acs_kvstore_connection_usage_average{instance_id=\\\"$instance_id\\\"}) by (instance_id)\",\n \"legend\": \"\",\n \"refId\": \"A\"\n }\n ],\n \"type\": \"timeseries\",\n \"version\": \"2.0.0\"\n },\n {\n \"custom\": {\n \"drawStyle\": \"lines\",\n \"fillOpacity\": 0.3,\n \"gradientMode\": \"opacity\",\n \"lineInterpolation\": \"smooth\",\n \"lineWidth\": 2,\n \"scaleDistribution\": {\n \"type\": \"linear\"\n },\n \"spanNulls\": false,\n \"stack\": \"off\"\n },\n \"datasourceCate\": \"prometheus\",\n \"datasourceValue\": \"${datasource}\",\n \"id\": \"c9735607-3f24-44a7-bbf1-3ad39441c5c9\",\n \"layout\": {\n \"h\": 4,\n \"i\": \"93a4c8a6-ac23-4e26-8a38-781ec1668820\",\n \"isResizable\": true,\n \"w\": 12,\n \"x\": 12,\n \"y\": 4\n },\n \"maxPerRow\": 4,\n \"name\": \"失败统计平均使用率\",\n \"options\": {\n \"legend\": {\n \"displayMode\": \"hidden\"\n },\n \"standardOptions\": {},\n \"thresholds\": {\n \"steps\": [\n {\n \"color\": \"#634CD9\",\n \"type\": \"base\",\n \"value\": null\n }\n ]\n },\n \"tooltip\": {\n \"mode\": \"all\",\n \"sort\": \"none\"\n }\n },\n \"targets\": [\n {\n \"expr\": \"sum(aliyun_acs_kvstore_failed_count_average{instance_id=\\\"$instance_id\\\"}) by (instance_id)\",\n \"legend\": \"\",\n \"refId\": \"A\"\n }\n ],\n \"type\": \"timeseries\",\n \"version\": \"2.0.0\"\n },\n {\n \"custom\": {\n \"drawStyle\": \"lines\",\n \"fillOpacity\": 0.3,\n \"gradientMode\": \"opacity\",\n \"lineInterpolation\": \"smooth\",\n \"lineWidth\": 2,\n \"scaleDistribution\": {\n \"type\": \"linear\"\n },\n \"spanNulls\": false,\n \"stack\": \"off\"\n },\n \"datasourceCate\": \"prometheus\",\n \"datasourceValue\": \"${datasource}\",\n \"id\": \"b516e7dc-8022-409d-b907-18c4143df891\",\n \"layout\": {\n \"h\": 5,\n \"i\": \"b516e7dc-8022-409d-b907-18c4143df891\",\n \"isResizable\": true,\n \"w\": 24,\n \"x\": 0,\n \"y\": 8\n },\n \"maxPerRow\": 4,\n \"name\": \"网络流量\",\n \"options\": {\n \"legend\": {\n \"displayMode\": \"hidden\"\n },\n \"standardOptions\": {\n \"util\": \"bitsSI\"\n },\n \"thresholds\": {\n \"steps\": [\n {\n \"color\": \"#634CD9\",\n \"type\": \"base\",\n \"value\": null\n }\n ]\n },\n \"tooltip\": {\n \"mode\": \"all\",\n \"sort\": \"none\"\n }\n },\n \"targets\": [\n {\n \"expr\": \"sum(aliyun_acs_kvstore_intranet_in_average{instance_id=\\\"$instance_id\\\"}) by (instance_id)\",\n \"legend\": \"in\",\n \"refId\": \"A\"\n },\n {\n \"expr\": \"sum(aliyun_acs_kvstore_intranet_out_average{instance_id=\\\"$instance_id\\\"}) by (instance_id)\",\n \"legend\": \"out\",\n \"refId\": \"B\"\n }\n ],\n \"type\": \"timeseries\",\n \"version\": \"2.0.0\"\n }\n ],\n \"var\": [\n {\n \"definition\": \"prometheus\",\n \"name\": \"datasource\",\n \"type\": \"datasource\"\n },\n {\n \"datasource\": {\n \"cate\": \"prometheus\",\n \"value\": \"${datasource}\"\n },\n \"definition\": \"label_values(aliyun_acs_kvstore_cpu_usage_average,name)\",\n \"multi\": false,\n \"name\": \"name\",\n \"type\": \"query\"\n },\n {\n \"datasource\": {\n \"cate\": \"prometheus\",\n \"value\": \"${datasource}\"\n },\n \"definition\": \"label_values(aliyun_acs_kvstore_cpu_usage_average{name=\\\"$name\\\"},instance_id)\",\n \"multi\": false,\n \"name\": \"instance_id\",\n \"type\": \"query\"\n }\n ],\n \"version\": \"3.0.0\"\n },\n \"public\": 0,\n \"public_cate\": 0,\n \"bgids\": null,\n \"built_in\": 0,\n \"hide\": 0,\n \"uuid\": 1717556327128561000\n}"
},
{
"path": "integrations/AliYun/dashboards/redis_cluster.json",
"content": "{\n \"id\": 0,\n \"group_id\": 0,\n \"name\": \"阿里云REDIS 集群版\",\n \"ident\": \"\",\n \"tags\": \"\",\n \"create_at\": 0,\n \"create_by\": \"\",\n \"update_at\": 0,\n \"update_by\": \"\",\n \"configs\": {\n \"panels\": [\n {\n \"collapsed\": false,\n \"id\": \"2c38fd30-4c4c-40a9-ad4a-5c945db32947\",\n \"layout\": {\n \"h\": 1,\n \"i\": \"2c38fd30-4c4c-40a9-ad4a-5c945db32947\",\n \"isResizable\": false,\n \"w\": 24,\n \"x\": 0,\n \"y\": 0\n },\n \"name\": \"默认分组\",\n \"type\": \"row\"\n },\n {\n \"custom\": {\n \"drawStyle\": \"lines\",\n \"fillOpacity\": 0.3,\n \"gradientMode\": \"opacity\",\n \"lineInterpolation\": \"smooth\",\n \"lineWidth\": 2,\n \"scaleDistribution\": {\n \"type\": \"linear\"\n },\n \"spanNulls\": false,\n \"stack\": \"off\"\n },\n \"datasourceCate\": \"prometheus\",\n \"datasourceValue\": \"${datasource}\",\n \"id\": \"01f4d444-aa2d-466d-9615-c76baf60a40c\",\n \"layout\": {\n \"h\": 4,\n \"i\": \"01f4d444-aa2d-466d-9615-c76baf60a40c\",\n \"isResizable\": true,\n \"w\": 8,\n \"x\": 0,\n \"y\": 1\n },\n \"maxPerRow\": 4,\n \"name\": \"CPU 使用率(%)\",\n \"options\": {\n \"legend\": {\n \"displayMode\": \"hidden\"\n },\n \"standardOptions\": {\n \"util\": \"percent\"\n },\n \"thresholds\": {\n \"steps\": [\n {\n \"color\": \"#634CD9\",\n \"type\": \"base\",\n \"value\": null\n }\n ]\n },\n \"tooltip\": {\n \"mode\": \"all\",\n \"sort\": \"none\"\n }\n },\n \"targets\": [\n {\n \"expr\": \"aliyun_acs_kvstore_sharding_cpu_usage_average{instance_id=\\\"$instance_id\\\", node_id=\\\"$node_id\\\"}\",\n \"instant\": false,\n \"legend\": \"\",\n \"refId\": \"A\",\n \"step\": 120\n }\n ],\n \"transformations\": [\n {\n \"id\": \"organize\",\n \"options\": {}\n }\n ],\n \"type\": \"timeseries\",\n \"version\": \"3.0.0\"\n },\n {\n \"custom\": {\n \"drawStyle\": \"lines\",\n \"fillOpacity\": 0.3,\n \"gradientMode\": \"opacity\",\n \"lineInterpolation\": \"smooth\",\n \"lineWidth\": 2,\n \"scaleDistribution\": {\n \"type\": \"linear\"\n },\n \"spanNulls\": false,\n \"stack\": \"off\"\n },\n \"datasourceCate\": \"prometheus\",\n \"datasourceValue\": \"${datasource}\",\n \"id\": \"82fed14f-911c-4f2f-8b39-8630b5cc43dc\",\n \"layout\": {\n \"h\": 4,\n \"i\": \"def6d721-2816-40ef-b4fe-a111a8c035fe\",\n \"isResizable\": true,\n \"w\": 8,\n \"x\": 8,\n \"y\": 1\n },\n \"maxPerRow\": 4,\n \"name\": \"内存使用率(%)\",\n \"options\": {\n \"legend\": {\n \"displayMode\": \"hidden\"\n },\n \"standardOptions\": {\n \"util\": \"percent\"\n },\n \"thresholds\": {\n \"steps\": [\n {\n \"color\": \"#634CD9\",\n \"type\": \"base\",\n \"value\": null\n }\n ]\n },\n \"tooltip\": {\n \"mode\": \"all\",\n \"sort\": \"none\"\n }\n },\n \"targets\": [\n {\n \"expr\": \"aliyun_acs_kvstore_sharding_memory_usage_average{instance_id=\\\"$instance_id\\\", node_id=\\\"$node_id\\\"}\",\n \"instant\": false,\n \"legend\": \"\",\n \"refId\": \"A\",\n \"step\": 120\n }\n ],\n \"transformations\": [\n {\n \"id\": \"organize\",\n \"options\": {}\n }\n ],\n \"type\": \"timeseries\",\n \"version\": \"3.0.0\"\n },\n {\n \"custom\": {\n \"drawStyle\": \"lines\",\n \"fillOpacity\": 0.3,\n \"gradientMode\": \"opacity\",\n \"lineInterpolation\": \"smooth\",\n \"lineWidth\": 2,\n \"scaleDistribution\": {\n \"type\": \"linear\"\n },\n \"spanNulls\": false,\n \"stack\": \"off\"\n },\n \"datasourceCate\": \"prometheus\",\n \"datasourceValue\": \"${datasource}\",\n \"id\": \"200741b5-1d0c-4bb8-a6a6-d26783e13b31\",\n \"layout\": {\n \"h\": 4,\n \"i\": \"bef9407d-be17-457b-a824-3a1904c5a20c\",\n \"isResizable\": true,\n \"w\": 8,\n \"x\": 16,\n \"y\": 1\n },\n \"maxPerRow\": 4,\n \"name\": \"连接数使用率(%)\",\n \"options\": {\n \"legend\": {\n \"displayMode\": \"hidden\"\n },\n \"standardOptions\": {\n \"util\": \"percent\"\n },\n \"thresholds\": {\n \"steps\": [\n {\n \"color\": \"#634CD9\",\n \"type\": \"base\",\n \"value\": null\n }\n ]\n },\n \"tooltip\": {\n \"mode\": \"all\",\n \"sort\": \"none\"\n }\n },\n \"targets\": [\n {\n \"expr\": \"aliyun_acs_kvstore_sharding_connection_usage_average{instance_id=\\\"$instance_id\\\", node_id=\\\"$node_id\\\"}\",\n \"instant\": false,\n \"legend\": \"\",\n \"refId\": \"A\",\n \"step\": 120\n }\n ],\n \"transformations\": [\n {\n \"id\": \"organize\",\n \"options\": {}\n }\n ],\n \"type\": \"timeseries\",\n \"version\": \"3.0.0\"\n },\n {\n \"custom\": {\n \"drawStyle\": \"lines\",\n \"fillOpacity\": 0.3,\n \"gradientMode\": \"opacity\",\n \"lineInterpolation\": \"smooth\",\n \"lineWidth\": 2,\n \"scaleDistribution\": {\n \"type\": \"linear\"\n },\n \"spanNulls\": false,\n \"stack\": \"off\"\n },\n \"datasourceCate\": \"prometheus\",\n \"datasourceValue\": \"${datasource}\",\n \"id\": \"ef1e2ca6-268f-47bf-afd3-c9422443ac98\",\n \"layout\": {\n \"h\": 4,\n \"i\": \"47adc622-6018-4e72-8c01-d7d6c88677a4\",\n \"isResizable\": true,\n \"w\": 8,\n \"x\": 0,\n \"y\": 5\n },\n \"maxPerRow\": 4,\n \"name\": \"流入带宽使用率(%)\",\n \"options\": {\n \"legend\": {\n \"displayMode\": \"hidden\"\n },\n \"standardOptions\": {\n \"util\": \"percent\"\n },\n \"thresholds\": {\n \"steps\": [\n {\n \"color\": \"#634CD9\",\n \"type\": \"base\",\n \"value\": null\n }\n ]\n },\n \"tooltip\": {\n \"mode\": \"all\",\n \"sort\": \"none\"\n }\n },\n \"targets\": [\n {\n \"expr\": \"aliyun_acs_kvstore_sharding_intranet_in_ratio_average{instance_id=\\\"$instance_id\\\", node_id=\\\"$node_id\\\"}\",\n \"instant\": false,\n \"legend\": \"\",\n \"refId\": \"A\",\n \"step\": 120\n }\n ],\n \"transformations\": [\n {\n \"id\": \"organize\",\n \"options\": {}\n }\n ],\n \"type\": \"timeseries\",\n \"version\": \"3.0.0\"\n },\n {\n \"custom\": {\n \"drawStyle\": \"lines\",\n \"fillOpacity\": 0.3,\n \"gradientMode\": \"opacity\",\n \"lineInterpolation\": \"smooth\",\n \"lineWidth\": 2,\n \"scaleDistribution\": {\n \"type\": \"linear\"\n },\n \"spanNulls\": false,\n \"stack\": \"off\"\n },\n \"datasourceCate\": \"prometheus\",\n \"datasourceValue\": \"${datasource}\",\n \"id\": \"e33e2568-eea7-405e-9989-7b1bdf816f65\",\n \"layout\": {\n \"h\": 4,\n \"i\": \"a229c543-1139-43bf-be02-bbea39e4e6a8\",\n \"isResizable\": true,\n \"w\": 8,\n \"x\": 8,\n \"y\": 5\n },\n \"maxPerRow\": 4,\n \"name\": \"流出带宽使用率(%)\",\n \"options\": {\n \"legend\": {\n \"displayMode\": \"hidden\"\n },\n \"standardOptions\": {\n \"util\": \"percent\"\n },\n \"thresholds\": {\n \"steps\": [\n {\n \"color\": \"#634CD9\",\n \"type\": \"base\",\n \"value\": null\n }\n ]\n },\n \"tooltip\": {\n \"mode\": \"all\",\n \"sort\": \"none\"\n }\n },\n \"targets\": [\n {\n \"expr\": \"aliyun_acs_kvstore_sharding_intranet_out_ratio_average{instance_id=\\\"$instance_id\\\", node_id=\\\"$node_id\\\"}\",\n \"instant\": false,\n \"legend\": \"\",\n \"refId\": \"A\",\n \"step\": 120\n }\n ],\n \"transformations\": [\n {\n \"id\": \"organize\",\n \"options\": {}\n }\n ],\n \"type\": \"timeseries\",\n \"version\": \"3.0.0\"\n },\n {\n \"collapsed\": true,\n \"id\": \"e469ebd7-9249-41ea-b547-10d697738854\",\n \"layout\": {\n \"h\": 1,\n \"i\": \"e469ebd7-9249-41ea-b547-10d697738854\",\n \"isResizable\": false,\n \"w\": 24,\n \"x\": 0,\n \"y\": 9\n },\n \"name\": \"基础监控项\",\n \"type\": \"row\"\n },\n {\n \"custom\": {\n \"drawStyle\": \"lines\",\n \"fillOpacity\": 0.3,\n \"gradientMode\": \"opacity\",\n \"lineInterpolation\": \"smooth\",\n \"lineWidth\": 2,\n \"scaleDistribution\": {\n \"type\": \"linear\"\n },\n \"spanNulls\": false,\n \"stack\": \"off\"\n },\n \"datasourceCate\": \"prometheus\",\n \"datasourceValue\": \"${datasource}\",\n \"id\": \"1a088a52-fca7-4b55-a2ff-3893419c4bd4\",\n \"layout\": {\n \"h\": 4,\n \"i\": \"4f26e8c4-c8c7-48db-bfe0-ad1a069b9bd2\",\n \"isResizable\": true,\n \"w\": 8,\n \"x\": 0,\n \"y\": 10\n },\n \"maxPerRow\": 4,\n \"name\": \"DB连接数使用率(%)\",\n \"options\": {\n \"legend\": {\n \"displayMode\": \"hidden\"\n },\n \"standardOptions\": {\n \"util\": \"percent\"\n },\n \"thresholds\": {\n \"steps\": [\n {\n \"color\": \"#634CD9\",\n \"type\": \"base\",\n \"value\": null\n }\n ]\n },\n \"tooltip\": {\n \"mode\": \"all\",\n \"sort\": \"none\"\n }\n },\n \"targets\": [\n {\n \"expr\": \"aliyun_acs_kvstore_sharding_connection_usage_average{instance_id=\\\"$instance_id\\\", node_id=\\\"$node_id\\\"}\",\n \"instant\": false,\n \"legend\": \"\",\n \"refId\": \"A\",\n \"step\": 120\n }\n ],\n \"transformations\": [\n {\n \"id\": \"organize\",\n \"options\": {}\n }\n ],\n \"type\": \"timeseries\",\n \"version\": \"3.0.0\"\n },\n {\n \"custom\": {\n \"drawStyle\": \"lines\",\n \"fillOpacity\": 0.3,\n \"gradientMode\": \"opacity\",\n \"lineInterpolation\": \"smooth\",\n \"lineWidth\": 2,\n \"scaleDistribution\": {\n \"type\": \"linear\"\n },\n \"spanNulls\": false,\n \"stack\": \"off\"\n },\n \"datasourceCate\": \"prometheus\",\n \"datasourceValue\": \"${datasource}\",\n \"id\": \"be416c06-1b9e-4861-8c4f-3bfd8737d836\",\n \"layout\": {\n \"h\": 4,\n \"i\": \"66af6522-4be6-4ff4-87f9-ec56d8f181e7\",\n \"isResizable\": true,\n \"w\": 9,\n \"x\": 8,\n \"y\": 10\n },\n \"maxPerRow\": 4,\n \"name\": \"数据节点CPU 使用率(%)\",\n \"options\": {\n \"legend\": {\n \"displayMode\": \"hidden\"\n },\n \"standardOptions\": {\n \"util\": \"percent\"\n },\n \"thresholds\": {\n \"steps\": [\n {\n \"color\": \"#634CD9\",\n \"type\": \"base\",\n \"value\": null\n }\n ]\n },\n \"tooltip\": {\n \"mode\": \"all\",\n \"sort\": \"none\"\n }\n },\n \"targets\": [\n {\n \"expr\": \"aliyun_acs_kvstore_sharding_cpu_usage_average{instance_id=\\\"$instance_id\\\", node_id=\\\"$node_id\\\"}\",\n \"instant\": false,\n \"legend\": \"\",\n \"refId\": \"A\",\n \"step\": 120\n }\n ],\n \"transformations\": [\n {\n \"id\": \"organize\",\n \"options\": {}\n }\n ],\n \"type\": \"timeseries\",\n \"version\": \"3.0.0\"\n },\n {\n \"custom\": {\n \"drawStyle\": \"lines\",\n \"fillOpacity\": 0.3,\n \"gradientMode\": \"opacity\",\n \"lineInterpolation\": \"smooth\",\n \"lineWidth\": 2,\n \"scaleDistribution\": {\n \"type\": \"linear\"\n },\n \"spanNulls\": false,\n \"stack\": \"off\"\n },\n \"datasourceCate\": \"prometheus\",\n \"datasourceValue\": \"${datasource}\",\n \"id\": \"e6a480bb-7f56-4a8d-a3af-30c52e423852\",\n \"layout\": {\n \"h\": 4,\n \"i\": \"857bb7f2-38e4-4416-8d69-1082450b9fd0\",\n \"isResizable\": true,\n \"w\": 8,\n \"x\": 0,\n \"y\": 14\n },\n \"maxPerRow\": 4,\n \"name\": \"数据节点命中率(%)\",\n \"options\": {\n \"legend\": {\n \"displayMode\": \"hidden\"\n },\n \"standardOptions\": {\n \"util\": \"percent\"\n },\n \"thresholds\": {\n \"steps\": [\n {\n \"color\": \"#634CD9\",\n \"type\": \"base\",\n \"value\": null\n }\n ]\n },\n \"tooltip\": {\n \"mode\": \"all\",\n \"sort\": \"none\"\n }\n },\n \"targets\": [\n {\n \"expr\": \"aliyun_acs_kvstore_sharding_hit_rate_average{instance_id=\\\"$instance_id\\\", node_id=\\\"$node_id\\\"}\",\n \"instant\": false,\n \"legend\": \"\",\n \"refId\": \"A\",\n \"step\": 120\n }\n ],\n \"transformations\": [\n {\n \"id\": \"organize\",\n \"options\": {}\n }\n ],\n \"type\": \"timeseries\",\n \"version\": \"3.0.0\"\n },\n {\n \"custom\": {\n \"drawStyle\": \"lines\",\n \"fillOpacity\": 0.3,\n \"gradientMode\": \"opacity\",\n \"lineInterpolation\": \"smooth\",\n \"lineWidth\": 2,\n \"scaleDistribution\": {\n \"type\": \"linear\"\n },\n \"spanNulls\": false,\n \"stack\": \"off\"\n },\n \"datasourceCate\": \"prometheus\",\n \"datasourceValue\": \"${datasource}\",\n \"id\": \"aba1d918-5600-452a-b5a5-6f3795d0a220\",\n \"layout\": {\n \"h\": 4,\n \"i\": \"d0beaee6-2eee-4a66-82ba-30e441aed819\",\n \"isResizable\": true,\n \"w\": 8,\n \"x\": 8,\n \"y\": 14\n },\n \"maxPerRow\": 4,\n \"name\": \"数据节点流入带宽(KBytes/s)\",\n \"options\": {\n \"legend\": {\n \"displayMode\": \"hidden\"\n },\n \"standardOptions\": {},\n \"thresholds\": {\n \"steps\": [\n {\n \"color\": \"#634CD9\",\n \"type\": \"base\",\n \"value\": null\n }\n ]\n },\n \"tooltip\": {\n \"mode\": \"all\",\n \"sort\": \"none\"\n }\n },\n \"targets\": [\n {\n \"expr\": \"aliyun_acs_kvstore_sharding_intranet_in_average{instance_id=\\\"$instance_id\\\", node_id=\\\"$node_id\\\"}\",\n \"instant\": false,\n \"legend\": \"\",\n \"refId\": \"A\",\n \"step\": 120\n }\n ],\n \"transformations\": [\n {\n \"id\": \"organize\",\n \"options\": {}\n }\n ],\n \"type\": \"timeseries\",\n \"version\": \"3.0.0\"\n },\n {\n \"custom\": {\n \"drawStyle\": \"lines\",\n \"fillOpacity\": 0.3,\n \"gradientMode\": \"opacity\",\n \"lineInterpolation\": \"smooth\",\n \"lineWidth\": 2,\n \"scaleDistribution\": {\n \"type\": \"linear\"\n },\n \"spanNulls\": false,\n \"stack\": \"off\"\n },\n \"datasourceCate\": \"prometheus\",\n \"datasourceValue\": \"${datasource}\",\n \"id\": \"5af6d738-b37f-4b40-9b9f-2c774a02bb26\",\n \"layout\": {\n \"h\": 4,\n \"i\": \"8d4609c8-ce71-4e85-8a41-bc4328b817e5\",\n \"isResizable\": true,\n \"w\": 8,\n \"x\": 16,\n \"y\": 14\n },\n \"maxPerRow\": 4,\n \"name\": \"数据节点流入带宽使用率(%)\",\n \"options\": {\n \"legend\": {\n \"displayMode\": \"hidden\"\n },\n \"standardOptions\": {\n \"util\": \"percent\"\n },\n \"thresholds\": {\n \"steps\": [\n {\n \"color\": \"#634CD9\",\n \"type\": \"base\",\n \"value\": null\n }\n ]\n },\n \"tooltip\": {\n \"mode\": \"all\",\n \"sort\": \"none\"\n }\n },\n \"targets\": [\n {\n \"expr\": \"aliyun_acs_kvstore_sharding_intranet_in_ratio_average{instance_id=\\\"$instance_id\\\", node_id=\\\"$node_id\\\"}\",\n \"instant\": false,\n \"legend\": \"\",\n \"refId\": \"A\",\n \"step\": 120\n }\n ],\n \"transformations\": [\n {\n \"id\": \"organize\",\n \"options\": {}\n }\n ],\n \"type\": \"timeseries\",\n \"version\": \"3.0.0\"\n },\n {\n \"custom\": {\n \"drawStyle\": \"lines\",\n \"fillOpacity\": 0.3,\n \"gradientMode\": \"opacity\",\n \"lineInterpolation\": \"smooth\",\n \"lineWidth\": 2,\n \"scaleDistribution\": {\n \"type\": \"linear\"\n },\n \"spanNulls\": false,\n \"stack\": \"off\"\n },\n \"datasourceCate\": \"prometheus\",\n \"datasourceValue\": \"${datasource}\",\n \"id\": \"223b0eb7-b617-4897-8d4e-cc13db7c6846\",\n \"layout\": {\n \"h\": 4,\n \"i\": \"f7f3d139-28e0-4b70-9529-dc914e77df7b\",\n \"isResizable\": true,\n \"w\": 8,\n \"x\": 0,\n \"y\": 18\n },\n \"maxPerRow\": 4,\n \"name\": \"数据节点流出带宽(KBytes/s)\",\n \"options\": {\n \"legend\": {\n \"displayMode\": \"hidden\"\n },\n \"standardOptions\": {},\n \"thresholds\": {\n \"steps\": [\n {\n \"color\": \"#634CD9\",\n \"type\": \"base\",\n \"value\": null\n }\n ]\n },\n \"tooltip\": {\n \"mode\": \"all\",\n \"sort\": \"none\"\n }\n },\n \"targets\": [\n {\n \"expr\": \"aliyun_acs_kvstore_sharding_intranet_out_average{instance_id=\\\"$instance_id\\\", node_id=\\\"$node_id\\\"}\",\n \"instant\": false,\n \"legend\": \"\",\n \"refId\": \"A\",\n \"step\": 120\n }\n ],\n \"transformations\": [\n {\n \"id\": \"organize\",\n \"options\": {}\n }\n ],\n \"type\": \"timeseries\",\n \"version\": \"3.0.0\"\n },\n {\n \"custom\": {\n \"drawStyle\": \"lines\",\n \"fillOpacity\": 0.3,\n \"gradientMode\": \"opacity\",\n \"lineInterpolation\": \"smooth\",\n \"lineWidth\": 2,\n \"scaleDistribution\": {\n \"type\": \"linear\"\n },\n \"spanNulls\": false,\n \"stack\": \"off\"\n },\n \"datasourceCate\": \"prometheus\",\n \"datasourceValue\": \"${datasource}\",\n \"id\": \"8e5b9c6b-90ec-4efe-85f4-1e386e28495d\",\n \"layout\": {\n \"h\": 4,\n \"i\": \"22b8d485-016f-4320-93dd-ee7b41c3ef83\",\n \"isResizable\": true,\n \"w\": 8,\n \"x\": 8,\n \"y\": 18\n },\n \"maxPerRow\": 4,\n \"name\": \"数据节点流出带宽使用率(%)\",\n \"options\": {\n \"legend\": {\n \"displayMode\": \"hidden\"\n },\n \"standardOptions\": {\n \"util\": \"percent\"\n },\n \"thresholds\": {\n \"steps\": [\n {\n \"color\": \"#634CD9\",\n \"type\": \"base\",\n \"value\": null\n }\n ]\n },\n \"tooltip\": {\n \"mode\": \"all\",\n \"sort\": \"none\"\n }\n },\n \"targets\": [\n {\n \"expr\": \"aliyun_acs_kvstore_sharding_intranet_out_ratio_average{instance_id=\\\"$instance_id\\\", node_id=\\\"$node_id\\\"}\",\n \"instant\": false,\n \"legend\": \"\",\n \"refId\": \"A\",\n \"step\": 120\n }\n ],\n \"transformations\": [\n {\n \"id\": \"organize\",\n \"options\": {}\n }\n ],\n \"type\": \"timeseries\",\n \"version\": \"3.0.0\"\n },\n {\n \"custom\": {\n \"drawStyle\": \"lines\",\n \"fillOpacity\": 0.3,\n \"gradientMode\": \"opacity\",\n \"lineInterpolation\": \"smooth\",\n \"lineWidth\": 2,\n \"scaleDistribution\": {\n \"type\": \"linear\"\n },\n \"spanNulls\": false,\n \"stack\": \"off\"\n },\n \"datasourceCate\": \"prometheus\",\n \"datasourceValue\": \"${datasource}\",\n \"id\": \"51ac86b0-e108-4bf0-af19-80b0588e883b\",\n \"layout\": {\n \"h\": 4,\n \"i\": \"82a19a60-ada6-4639-8590-b363c92cd30d\",\n \"isResizable\": true,\n \"w\": 8,\n \"x\": 16,\n \"y\": 18\n },\n \"maxPerRow\": 4,\n \"name\": \"Key总数(个)\",\n \"options\": {\n \"legend\": {\n \"displayMode\": \"hidden\"\n },\n \"standardOptions\": {},\n \"thresholds\": {\n \"steps\": [\n {\n \"color\": \"#634CD9\",\n \"type\": \"base\",\n \"value\": null\n }\n ]\n },\n \"tooltip\": {\n \"mode\": \"all\",\n \"sort\": \"none\"\n }\n },\n \"targets\": [\n {\n \"expr\": \"aliyun_acs_kvstore_sharding_keys_average{instance_id=\\\"$instance_id\\\", node_id=\\\"$node_id\\\"}\",\n \"instant\": false,\n \"legend\": \"\",\n \"refId\": \"A\",\n \"step\": 120\n }\n ],\n \"transformations\": [\n {\n \"id\": \"organize\",\n \"options\": {}\n }\n ],\n \"type\": \"timeseries\",\n \"version\": \"3.0.0\"\n },\n {\n \"custom\": {\n \"drawStyle\": \"lines\",\n \"fillOpacity\": 0.3,\n \"gradientMode\": \"opacity\",\n \"lineInterpolation\": \"smooth\",\n \"lineWidth\": 2,\n \"scaleDistribution\": {\n \"type\": \"linear\"\n },\n \"spanNulls\": false,\n \"stack\": \"off\"\n },\n \"datasourceCate\": \"prometheus\",\n \"datasourceValue\": \"${datasource}\",\n \"id\": \"54fc0148-930b-47a5-bdf4-06e44c8e1d6a\",\n \"layout\": {\n \"h\": 4,\n \"i\": \"3d6e3c07-97b6-4930-ada9-21d1ffdfc9c6\",\n \"isResizable\": true,\n \"w\": 8,\n \"x\": 0,\n \"y\": 22\n },\n \"maxPerRow\": 4,\n \"name\": \"数据节点内存使用率(%)\",\n \"options\": {\n \"legend\": {\n \"displayMode\": \"hidden\"\n },\n \"standardOptions\": {\n \"util\": \"percent\"\n },\n \"thresholds\": {\n \"steps\": [\n {\n \"color\": \"#634CD9\",\n \"type\": \"base\",\n \"value\": null\n }\n ]\n },\n \"tooltip\": {\n \"mode\": \"all\",\n \"sort\": \"none\"\n }\n },\n \"targets\": [\n {\n \"expr\": \"aliyun_acs_kvstore_sharding_memory_usage_average{instance_id=\\\"$instance_id\\\", node_id=\\\"$node_id\\\"}\",\n \"instant\": false,\n \"legend\": \"\",\n \"refId\": \"A\",\n \"step\": 120\n }\n ],\n \"transformations\": [\n {\n \"id\": \"organize\",\n \"options\": {}\n }\n ],\n \"type\": \"timeseries\",\n \"version\": \"3.0.0\"\n },\n {\n \"custom\": {\n \"drawStyle\": \"lines\",\n \"fillOpacity\": 0.3,\n \"gradientMode\": \"opacity\",\n \"lineInterpolation\": \"smooth\",\n \"lineWidth\": 2,\n \"scaleDistribution\": {\n \"type\": \"linear\"\n },\n \"spanNulls\": false,\n \"stack\": \"off\"\n },\n \"datasourceCate\": \"prometheus\",\n \"datasourceValue\": \"${datasource}\",\n \"id\": \"8b7d5240-0c30-43c0-86d0-6620e5e122e0\",\n \"layout\": {\n \"h\": 4,\n \"i\": \"91975194-a995-4fe9-8788-7503abfe414a\",\n \"isResizable\": true,\n \"w\": 8,\n \"x\": 8,\n \"y\": 22\n },\n \"maxPerRow\": 4,\n \"name\": \"DB已用连接数(个)\",\n \"options\": {\n \"legend\": {\n \"displayMode\": \"hidden\"\n },\n \"standardOptions\": {},\n \"thresholds\": {\n \"steps\": [\n {\n \"color\": \"#634CD9\",\n \"type\": \"base\",\n \"value\": null\n }\n ]\n },\n \"tooltip\": {\n \"mode\": \"all\",\n \"sort\": \"none\"\n }\n },\n \"targets\": [\n {\n \"expr\": \"aliyun_acs_kvstore_sharding_used_connection_average{instance_id=\\\"$instance_id\\\", node_id=\\\"$node_id\\\"}\",\n \"instant\": false,\n \"legend\": \"\",\n \"refId\": \"A\",\n \"step\": 120\n }\n ],\n \"transformations\": [\n {\n \"id\": \"organize\",\n \"options\": {}\n }\n ],\n \"type\": \"timeseries\",\n \"version\": \"3.0.0\"\n },\n {\n \"custom\": {\n \"drawStyle\": \"lines\",\n \"fillOpacity\": 0.3,\n \"gradientMode\": \"opacity\",\n \"lineInterpolation\": \"smooth\",\n \"lineWidth\": 2,\n \"scaleDistribution\": {\n \"type\": \"linear\"\n },\n \"spanNulls\": false,\n \"stack\": \"off\"\n },\n \"datasourceCate\": \"prometheus\",\n \"datasourceValue\": \"${datasource}\",\n \"id\": \"3e4719d7-db36-47d7-b4ee-fa6bfd691817\",\n \"layout\": {\n \"h\": 4,\n \"i\": \"b70f9c9c-643c-44fa-89d2-2e99098ab508\",\n \"isResizable\": true,\n \"w\": 8,\n \"x\": 16,\n \"y\": 22\n },\n \"maxPerRow\": 4,\n \"name\": \"阻塞客户端连接数(个)\",\n \"options\": {\n \"legend\": {\n \"displayMode\": \"hidden\"\n },\n \"standardOptions\": {},\n \"thresholds\": {\n \"steps\": [\n {\n \"color\": \"#634CD9\",\n \"type\": \"base\",\n \"value\": null\n }\n ]\n },\n \"tooltip\": {\n \"mode\": \"all\",\n \"sort\": \"none\"\n }\n },\n \"targets\": [\n {\n \"expr\": \"aliyun_acs_kvstore_sharding_blocked_clients_average{instance_id=\\\"$instance_id\\\", node_id=\\\"$node_id\\\"}\",\n \"instant\": false,\n \"legend\": \"\",\n \"refId\": \"A\",\n \"step\": 120\n }\n ],\n \"transformations\": [\n {\n \"id\": \"organize\",\n \"options\": {}\n }\n ],\n \"type\": \"timeseries\",\n \"version\": \"3.0.0\"\n },\n {\n \"custom\": {\n \"drawStyle\": \"lines\",\n \"fillOpacity\": 0.3,\n \"gradientMode\": \"opacity\",\n \"lineInterpolation\": \"smooth\",\n \"lineWidth\": 2,\n \"scaleDistribution\": {\n \"type\": \"linear\"\n },\n \"spanNulls\": false,\n \"stack\": \"off\"\n },\n \"datasourceCate\": \"prometheus\",\n \"datasourceValue\": \"${datasource}\",\n \"id\": \"98ce0f92-5c53-44a6-bfcb-14de68a56a36\",\n \"layout\": {\n \"h\": 4,\n \"i\": \"9dd21107-4432-4648-a156-68a6f1c41684\",\n \"isResizable\": true,\n \"w\": 8,\n \"x\": 0,\n \"y\": 26\n },\n \"maxPerRow\": 4,\n \"name\": \"历史累计逐出Key总数(个)\",\n \"options\": {\n \"legend\": {\n \"displayMode\": \"hidden\"\n },\n \"standardOptions\": {},\n \"thresholds\": {\n \"steps\": [\n {\n \"color\": \"#634CD9\",\n \"type\": \"base\",\n \"value\": null\n }\n ]\n },\n \"tooltip\": {\n \"mode\": \"all\",\n \"sort\": \"none\"\n }\n },\n \"targets\": [\n {\n \"expr\": \"aliyun_acs_kvstore_sharding_evicted_keys_average{instance_id=\\\"$instance_id\\\", node_id=\\\"$node_id\\\"}\",\n \"instant\": false,\n \"legend\": \"\",\n \"refId\": \"A\",\n \"step\": 120\n }\n ],\n \"transformations\": [\n {\n \"id\": \"organize\",\n \"options\": {}\n }\n ],\n \"type\": \"timeseries\",\n \"version\": \"3.0.0\"\n },\n {\n \"custom\": {\n \"drawStyle\": \"lines\",\n \"fillOpacity\": 0.3,\n \"gradientMode\": \"opacity\",\n \"lineInterpolation\": \"smooth\",\n \"lineWidth\": 2,\n \"scaleDistribution\": {\n \"type\": \"linear\"\n },\n \"spanNulls\": false,\n \"stack\": \"off\"\n },\n \"datasourceCate\": \"prometheus\",\n \"datasourceValue\": \"${datasource}\",\n \"id\": \"4b9a4e17-35ad-4968-91b9-4d2eca5e2b06\",\n \"layout\": {\n \"h\": 4,\n \"i\": \"ec228b90-d782-4e0c-8301-6ef7a0a41556\",\n \"isResizable\": true,\n \"w\": 8,\n \"x\": 8,\n \"y\": 26\n },\n \"maxPerRow\": 4,\n \"name\": \"每秒逐出Key总数(Count/s)\",\n \"options\": {\n \"legend\": {\n \"displayMode\": \"hidden\"\n },\n \"standardOptions\": {},\n \"thresholds\": {\n \"steps\": [\n {\n \"color\": \"#634CD9\",\n \"type\": \"base\",\n \"value\": null\n }\n ]\n },\n \"tooltip\": {\n \"mode\": \"all\",\n \"sort\": \"none\"\n }\n },\n \"targets\": [\n {\n \"expr\": \"aliyun_acs_kvstore_sharding_evicted_keys_per_second_average{instance_id=\\\"$instance_id\\\", node_id=\\\"$node_id\\\"}\",\n \"instant\": false,\n \"legend\": \"\",\n \"refId\": \"A\",\n \"step\": 120\n }\n ],\n \"transformations\": [\n {\n \"id\": \"organize\",\n \"options\": {}\n }\n ],\n \"type\": \"timeseries\",\n \"version\": \"3.0.0\"\n },\n {\n \"custom\": {\n \"drawStyle\": \"lines\",\n \"fillOpacity\": 0.3,\n \"gradientMode\": \"opacity\",\n \"lineInterpolation\": \"smooth\",\n \"lineWidth\": 2,\n \"scaleDistribution\": {\n \"type\": \"linear\"\n },\n \"spanNulls\": false,\n \"stack\": \"off\"\n },\n \"datasourceCate\": \"prometheus\",\n \"datasourceValue\": \"${datasource}\",\n \"id\": \"cea77b74-9cfe-4fb6-a9cb-db9ae7f32958\",\n \"layout\": {\n \"h\": 4,\n \"i\": \"bd004cc1-4d0d-49fb-98fe-b3c12b51399d\",\n \"isResizable\": true,\n \"w\": 8,\n \"x\": 16,\n \"y\": 26\n },\n \"maxPerRow\": 4,\n \"name\": \"历史累计淘汰Key总数(个)\",\n \"options\": {\n \"legend\": {\n \"displayMode\": \"hidden\"\n },\n \"standardOptions\": {},\n \"thresholds\": {\n \"steps\": [\n {\n \"color\": \"#634CD9\",\n \"type\": \"base\",\n \"value\": null\n }\n ]\n },\n \"tooltip\": {\n \"mode\": \"all\",\n \"sort\": \"none\"\n }\n },\n \"targets\": [\n {\n \"expr\": \"aliyun_acs_kvstore_sharding_expired_keys_average{instance_id=\\\"$instance_id\\\", node_id=\\\"$node_id\\\"}\",\n \"instant\": false,\n \"legend\": \"\",\n \"refId\": \"A\",\n \"step\": 120\n }\n ],\n \"transformations\": [\n {\n \"id\": \"organize\",\n \"options\": {}\n }\n ],\n \"type\": \"timeseries\",\n \"version\": \"3.0.0\"\n },\n {\n \"custom\": {\n \"drawStyle\": \"lines\",\n \"fillOpacity\": 0.3,\n \"gradientMode\": \"opacity\",\n \"lineInterpolation\": \"smooth\",\n \"lineWidth\": 2,\n \"scaleDistribution\": {\n \"type\": \"linear\"\n },\n \"spanNulls\": false,\n \"stack\": \"off\"\n },\n \"datasourceCate\": \"prometheus\",\n \"datasourceValue\": \"${datasource}\",\n \"id\": \"24c3c854-6552-4107-86fc-52420ea03692\",\n \"layout\": {\n \"h\": 4,\n \"i\": \"3793c7dc-0da9-434f-a330-42ffba31b5b0\",\n \"isResizable\": true,\n \"w\": 8,\n \"x\": 0,\n \"y\": 30\n },\n \"maxPerRow\": 4,\n \"name\": \"每秒淘汰Key总数(Count/s)\",\n \"options\": {\n \"legend\": {\n \"displayMode\": \"hidden\"\n },\n \"standardOptions\": {},\n \"thresholds\": {\n \"steps\": [\n {\n \"color\": \"#634CD9\",\n \"type\": \"base\",\n \"value\": null\n }\n ]\n },\n \"tooltip\": {\n \"mode\": \"all\",\n \"sort\": \"none\"\n }\n },\n \"targets\": [\n {\n \"expr\": \"aliyun_acs_kvstore_sharding_expired_keys_per_second_average{instance_id=\\\"$instance_id\\\", node_id=\\\"$node_id\\\"}\",\n \"instant\": false,\n \"legend\": \"\",\n \"refId\": \"A\",\n \"step\": 120\n }\n ],\n \"transformations\": [\n {\n \"id\": \"organize\",\n \"options\": {}\n }\n ],\n \"type\": \"timeseries\",\n \"version\": \"3.0.0\"\n },\n {\n \"custom\": {\n \"drawStyle\": \"lines\",\n \"fillOpacity\": 0.3,\n \"gradientMode\": \"opacity\",\n \"lineInterpolation\": \"smooth\",\n \"lineWidth\": 2,\n \"scaleDistribution\": {\n \"type\": \"linear\"\n },\n \"spanNulls\": false,\n \"stack\": \"off\"\n },\n \"datasourceCate\": \"prometheus\",\n \"datasourceValue\": \"${datasource}\",\n \"id\": \"5af71ff4-8b40-40cd-b672-29b89921ace3\",\n \"layout\": {\n \"h\": 4,\n \"i\": \"1293634c-92dc-4137-91e8-903c8d08be8c\",\n \"isResizable\": true,\n \"w\": 8,\n \"x\": 8,\n \"y\": 30\n },\n \"maxPerRow\": 4,\n \"name\": \"已设置过期时间Key总数(个)\",\n \"options\": {\n \"legend\": {\n \"displayMode\": \"hidden\"\n },\n \"standardOptions\": {},\n \"thresholds\": {\n \"steps\": [\n {\n \"color\": \"#634CD9\",\n \"type\": \"base\",\n \"value\": null\n }\n ]\n },\n \"tooltip\": {\n \"mode\": \"all\",\n \"sort\": \"none\"\n }\n },\n \"targets\": [\n {\n \"expr\": \"aliyun_acs_kvstore_sharding_expires_average{instance_id=\\\"$instance_id\\\", node_id=\\\"$node_id\\\"}\",\n \"instant\": false,\n \"legend\": \"\",\n \"refId\": \"A\",\n \"step\": 120\n }\n ],\n \"transformations\": [\n {\n \"id\": \"organize\",\n \"options\": {}\n }\n ],\n \"type\": \"timeseries\",\n \"version\": \"3.0.0\"\n },\n {\n \"custom\": {\n \"drawStyle\": \"lines\",\n \"fillOpacity\": 0.3,\n \"gradientMode\": \"opacity\",\n \"lineInterpolation\": \"smooth\",\n \"lineWidth\": 2,\n \"scaleDistribution\": {\n \"type\": \"linear\"\n },\n \"spanNulls\": false,\n \"stack\": \"off\"\n },\n \"datasourceCate\": \"prometheus\",\n \"datasourceValue\": \"${datasource}\",\n \"id\": \"490e1a0e-ea61-445a-bc25-38d3abd265c9\",\n \"layout\": {\n \"h\": 4,\n \"i\": \"576e80a4-9fea-461f-b9c7-70a23da86b92\",\n \"isResizable\": true,\n \"w\": 8,\n \"x\": 16,\n \"y\": 30\n },\n \"maxPerRow\": 4,\n \"name\": \"读QPS(Count/s)\",\n \"options\": {\n \"legend\": {\n \"displayMode\": \"hidden\"\n },\n \"standardOptions\": {},\n \"thresholds\": {\n \"steps\": [\n {\n \"color\": \"#634CD9\",\n \"type\": \"base\",\n \"value\": null\n }\n ]\n },\n \"tooltip\": {\n \"mode\": \"all\",\n \"sort\": \"none\"\n }\n },\n \"targets\": [\n {\n \"expr\": \"aliyun_acs_kvstore_sharding_get_qps_average{instance_id=\\\"$instance_id\\\", node_id=\\\"$node_id\\\"}\",\n \"instant\": false,\n \"legend\": \"\",\n \"refId\": \"A\",\n \"step\": 120\n }\n ],\n \"transformations\": [\n {\n \"id\": \"organize\",\n \"options\": {}\n }\n ],\n \"type\": \"timeseries\",\n \"version\": \"3.0.0\"\n },\n {\n \"custom\": {\n \"drawStyle\": \"lines\",\n \"fillOpacity\": 0.3,\n \"gradientMode\": \"opacity\",\n \"lineInterpolation\": \"smooth\",\n \"lineWidth\": 2,\n \"scaleDistribution\": {\n \"type\": \"linear\"\n },\n \"spanNulls\": false,\n \"stack\": \"off\"\n },\n \"datasourceCate\": \"prometheus\",\n \"datasourceValue\": \"${datasource}\",\n \"id\": \"6457aad2-7774-4264-ba43-d784ab4fd936\",\n \"layout\": {\n \"h\": 4,\n \"i\": \"0a2ab22e-af09-46d0-bb98-b148a9760ee9\",\n \"isResizable\": true,\n \"w\": 8,\n \"x\": 0,\n \"y\": 34\n },\n \"maxPerRow\": 4,\n \"name\": \"每秒命中Key数量(个)\",\n \"options\": {\n \"legend\": {\n \"displayMode\": \"hidden\"\n },\n \"standardOptions\": {},\n \"thresholds\": {\n \"steps\": [\n {\n \"color\": \"#634CD9\",\n \"type\": \"base\",\n \"value\": null\n }\n ]\n },\n \"tooltip\": {\n \"mode\": \"all\",\n \"sort\": \"none\"\n }\n },\n \"targets\": [\n {\n \"expr\": \"aliyun_acs_kvstore_sharding_hits_average{instance_id=\\\"$instance_id\\\", node_id=\\\"$node_id\\\"}\",\n \"instant\": false,\n \"legend\": \"\",\n \"refId\": \"A\",\n \"step\": 120\n }\n ],\n \"transformations\": [\n {\n \"id\": \"organize\",\n \"options\": {}\n }\n ],\n \"type\": \"timeseries\",\n \"version\": \"3.0.0\"\n },\n {\n \"custom\": {\n \"drawStyle\": \"lines\",\n \"fillOpacity\": 0.3,\n \"gradientMode\": \"opacity\",\n \"lineInterpolation\": \"smooth\",\n \"lineWidth\": 2,\n \"scaleDistribution\": {\n \"type\": \"linear\"\n },\n \"spanNulls\": false,\n \"stack\": \"off\"\n },\n \"datasourceCate\": \"prometheus\",\n \"datasourceValue\": \"${datasource}\",\n \"id\": \"76dfed26-8798-4510-a420-0f8ad7ccb1e5\",\n \"layout\": {\n \"h\": 4,\n \"i\": \"b62577c7-cea6-4bcd-8807-c4eed591545a\",\n \"isResizable\": true,\n \"w\": 8,\n \"x\": 8,\n \"y\": 34\n },\n \"maxPerRow\": 4,\n \"name\": \"每秒未命中Key数量(个)\",\n \"options\": {\n \"legend\": {\n \"displayMode\": \"hidden\"\n },\n \"standardOptions\": {},\n \"thresholds\": {\n \"steps\": [\n {\n \"color\": \"#634CD9\",\n \"type\": \"base\",\n \"value\": null\n }\n ]\n },\n \"tooltip\": {\n \"mode\": \"all\",\n \"sort\": \"none\"\n }\n },\n \"targets\": [\n {\n \"expr\": \"aliyun_acs_kvstore_sharding_misses_average{instance_id=\\\"$instance_id\\\", node_id=\\\"$node_id\\\"}\",\n \"instant\": false,\n \"legend\": \"\",\n \"refId\": \"A\",\n \"step\": 120\n }\n ],\n \"transformations\": [\n {\n \"id\": \"organize\",\n \"options\": {}\n }\n ],\n \"type\": \"timeseries\",\n \"version\": \"3.0.0\"\n },\n {\n \"custom\": {\n \"drawStyle\": \"lines\",\n \"fillOpacity\": 0.3,\n \"gradientMode\": \"opacity\",\n \"lineInterpolation\": \"smooth\",\n \"lineWidth\": 2,\n \"scaleDistribution\": {\n \"type\": \"linear\"\n },\n \"spanNulls\": false,\n \"stack\": \"off\"\n },\n \"datasourceCate\": \"prometheus\",\n \"datasourceValue\": \"${datasource}\",\n \"id\": \"d7a87151-35e3-41b0-8fbc-577af8df2d95\",\n \"layout\": {\n \"h\": 4,\n \"i\": \"190bc267-e449-4d73-a734-50c4193b8f68\",\n \"isResizable\": true,\n \"w\": 8,\n \"x\": 16,\n \"y\": 34\n },\n \"maxPerRow\": 4,\n \"name\": \"其他QPS(个)\",\n \"options\": {\n \"legend\": {\n \"displayMode\": \"hidden\"\n },\n \"standardOptions\": {},\n \"thresholds\": {\n \"steps\": [\n {\n \"color\": \"#634CD9\",\n \"type\": \"base\",\n \"value\": null\n }\n ]\n },\n \"tooltip\": {\n \"mode\": \"all\",\n \"sort\": \"none\"\n }\n },\n \"targets\": [\n {\n \"expr\": \"aliyun_acs_kvstore_sharding_other_ops_average{instance_id=\\\"$instance_id\\\", node_id=\\\"$node_id\\\"}\",\n \"instant\": false,\n \"legend\": \"\",\n \"refId\": \"A\",\n \"step\": 120\n }\n ],\n \"transformations\": [\n {\n \"id\": \"organize\",\n \"options\": {}\n }\n ],\n \"type\": \"timeseries\",\n \"version\": \"3.0.0\"\n },\n {\n \"custom\": {\n \"drawStyle\": \"lines\",\n \"fillOpacity\": 0.3,\n \"gradientMode\": \"opacity\",\n \"lineInterpolation\": \"smooth\",\n \"lineWidth\": 2,\n \"scaleDistribution\": {\n \"type\": \"linear\"\n },\n \"spanNulls\": false,\n \"stack\": \"off\"\n },\n \"datasourceCate\": \"prometheus\",\n \"datasourceValue\": \"${datasource}\",\n \"id\": \"7a9282ea-fd7b-41d0-ac7a-44ce0612cfa0\",\n \"layout\": {\n \"h\": 4,\n \"i\": \"e1ef102d-981d-4c62-beae-5af73effe7bd\",\n \"isResizable\": true,\n \"w\": 8,\n \"x\": 0,\n \"y\": 38\n },\n \"maxPerRow\": 4,\n \"name\": \"写QPS(Count/s)\",\n \"options\": {\n \"legend\": {\n \"displayMode\": \"hidden\"\n },\n \"standardOptions\": {},\n \"thresholds\": {\n \"steps\": [\n {\n \"color\": \"#634CD9\",\n \"type\": \"base\",\n \"value\": null\n }\n ]\n },\n \"tooltip\": {\n \"mode\": \"all\",\n \"sort\": \"none\"\n }\n },\n \"targets\": [\n {\n \"expr\": \"aliyun_acs_kvstore_sharding_put_qps_average{instance_id=\\\"$instance_id\\\", node_id=\\\"$node_id\\\"}\",\n \"instant\": false,\n \"legend\": \"\",\n \"refId\": \"A\",\n \"step\": 120\n }\n ],\n \"transformations\": [\n {\n \"id\": \"organize\",\n \"options\": {}\n }\n ],\n \"type\": \"timeseries\",\n \"version\": \"3.0.0\"\n },\n {\n \"custom\": {\n \"drawStyle\": \"lines\",\n \"fillOpacity\": 0.3,\n \"gradientMode\": \"opacity\",\n \"lineInterpolation\": \"smooth\",\n \"lineWidth\": 2,\n \"scaleDistribution\": {\n \"type\": \"linear\"\n },\n \"spanNulls\": false,\n \"stack\": \"off\"\n },\n \"datasourceCate\": \"prometheus\",\n \"datasourceValue\": \"${datasource}\",\n \"id\": \"f8f71f38-82cd-413c-abed-5e03e2214adf\",\n \"layout\": {\n \"h\": 4,\n \"i\": \"d5b997c9-5bb3-441b-91c8-92b53ef73355\",\n \"isResizable\": true,\n \"w\": 8,\n \"x\": 8,\n \"y\": 38\n },\n \"maxPerRow\": 4,\n \"name\": \"Lua脚本使用内存量(Byte)\",\n \"options\": {\n \"legend\": {\n \"displayMode\": \"hidden\"\n },\n \"standardOptions\": {\n \"util\": \"bytesSI\"\n },\n \"thresholds\": {\n \"steps\": [\n {\n \"color\": \"#634CD9\",\n \"type\": \"base\",\n \"value\": null\n }\n ]\n },\n \"tooltip\": {\n \"mode\": \"all\",\n \"sort\": \"none\"\n }\n },\n \"targets\": [\n {\n \"expr\": \"aliyun_acs_kvstore_sharding_used_memory_lua_average{instance_id=\\\"$instance_id\\\", node_id=\\\"$node_id\\\"}\",\n \"instant\": false,\n \"legend\": \"\",\n \"refId\": \"A\",\n \"step\": 120\n }\n ],\n \"transformations\": [\n {\n \"id\": \"organize\",\n \"options\": {}\n }\n ],\n \"type\": \"timeseries\",\n \"version\": \"3.0.0\"\n },\n {\n \"collapsed\": true,\n \"id\": \"723f3cf7-5d92-46b0-a307-ef99f6f62cb2\",\n \"layout\": {\n \"h\": 1,\n \"i\": \"723f3cf7-5d92-46b0-a307-ef99f6f62cb2\",\n \"isResizable\": false,\n \"w\": 24,\n \"x\": 0,\n \"y\": 42\n },\n \"name\": \"延迟监控项\",\n \"type\": \"row\"\n },\n {\n \"custom\": {\n \"drawStyle\": \"lines\",\n \"fillOpacity\": 0.3,\n \"gradientMode\": \"opacity\",\n \"lineInterpolation\": \"smooth\",\n \"lineWidth\": 2,\n \"scaleDistribution\": {\n \"type\": \"linear\"\n },\n \"spanNulls\": false,\n \"stack\": \"off\"\n },\n \"datasourceCate\": \"prometheus\",\n \"datasourceValue\": \"${datasource}\",\n \"id\": \"92ff998a-db7d-41d9-b4d4-fa9d04252a4c\",\n \"layout\": {\n \"h\": 4,\n \"i\": \"26a238e5-ffd0-48b4-b7bd-1fdc9ba20776\",\n \"isResizable\": true,\n \"w\": 8,\n \"x\": 0,\n \"y\": 43\n },\n \"maxPerRow\": 4,\n \"name\": \"数据节点平均响应时间(us)\",\n \"options\": {\n \"legend\": {\n \"displayMode\": \"hidden\"\n },\n \"standardOptions\": {},\n \"thresholds\": {\n \"steps\": [\n {\n \"color\": \"#634CD9\",\n \"type\": \"base\",\n \"value\": null\n }\n ]\n },\n \"tooltip\": {\n \"mode\": \"all\",\n \"sort\": \"none\"\n }\n },\n \"targets\": [\n {\n \"expr\": \"aliyun_acs_kvstore_sharding_avg_rt_average{instance_id=\\\"$instance_id\\\", node_id=\\\"$node_id\\\"}\",\n \"instant\": false,\n \"legend\": \"\",\n \"refId\": \"A\",\n \"step\": 120\n }\n ],\n \"transformations\": [\n {\n \"id\": \"organize\",\n \"options\": {}\n }\n ],\n \"type\": \"timeseries\",\n \"version\": \"3.0.0\"\n },\n {\n \"collapsed\": true,\n \"id\": \"ce1da00c-8e8a-498a-a6da-3e164128cb21\",\n \"layout\": {\n \"h\": 1,\n \"i\": \"ce1da00c-8e8a-498a-a6da-3e164128cb21\",\n \"isResizable\": false,\n \"w\": 24,\n \"x\": 0,\n \"y\": 47\n },\n \"name\": \"Proxy监控项\",\n \"type\": \"row\"\n }\n ],\n \"var\": [\n {\n \"definition\": \"prometheus\",\n \"name\": \"datasource\",\n \"type\": \"datasource\"\n },\n {\n \"datasource\": {\n \"cate\": \"prometheus\",\n \"value\": \"${datasource}\"\n },\n \"definition\": \"label_values(aliyun_acs_kvstore_sharding_cpu_usage_average,name)\",\n \"multi\": false,\n \"name\": \"name\",\n \"type\": \"query\"\n },\n {\n \"datasource\": {\n \"cate\": \"prometheus\",\n \"value\": \"${datasource}\"\n },\n \"definition\": \"label_values(aliyun_acs_kvstore_sharding_cpu_usage_average{name=\\\"$name\\\"},instance_id)\",\n \"multi\": false,\n \"name\": \"instance_id\",\n \"type\": \"query\"\n },\n {\n \"datasource\": {\n \"cate\": \"prometheus\",\n \"value\": \"${datasource}\"\n },\n \"definition\": \"label_values(aliyun_acs_kvstore_sharding_cpu_usage_average{instance_id=\\\"$instance_id\\\"}, node_id)\",\n \"multi\": false,\n \"name\": \"node_id\",\n \"type\": \"query\"\n }\n ],\n \"version\": \"3.0.0\"\n },\n \"public\": 0,\n \"public_cate\": 0,\n \"bgids\": null,\n \"built_in\": 0,\n \"hide\": 0,\n \"uuid\": 1717556327130386000\n}"
},
{
"path": "integrations/AliYun/dashboards/redis_new.json",
"content": "{\n \"id\": 0,\n \"group_id\": 0,\n \"name\": \"阿里云REDIS_N\",\n \"ident\": \"\",\n \"tags\": \"\",\n \"create_at\": 0,\n \"create_by\": \"\",\n \"update_at\": 0,\n \"update_by\": \"\",\n \"configs\": {\n \"panels\": [\n {\n \"collapsed\": false,\n \"id\": \"2c38fd30-4c4c-40a9-ad4a-5c945db32947\",\n \"layout\": {\n \"h\": 1,\n \"i\": \"2c38fd30-4c4c-40a9-ad4a-5c945db32947\",\n \"isResizable\": false,\n \"w\": 24,\n \"x\": 0,\n \"y\": 0\n },\n \"name\": \"默认分组\",\n \"type\": \"row\"\n },\n {\n \"custom\": {\n \"drawStyle\": \"lines\",\n \"fillOpacity\": 0.3,\n \"gradientMode\": \"opacity\",\n \"lineInterpolation\": \"smooth\",\n \"lineWidth\": 2,\n \"scaleDistribution\": {\n \"type\": \"linear\"\n },\n \"spanNulls\": false,\n \"stack\": \"off\"\n },\n \"datasourceCate\": \"prometheus\",\n \"datasourceValue\": \"${datasource}\",\n \"id\": \"01f4d444-aa2d-466d-9615-c76baf60a40c\",\n \"layout\": {\n \"h\": 4,\n \"i\": \"01f4d444-aa2d-466d-9615-c76baf60a40c\",\n \"isResizable\": true,\n \"w\": 8,\n \"x\": 0,\n \"y\": 1\n },\n \"maxPerRow\": 4,\n \"name\": \"CPU 使用率(%)\",\n \"options\": {\n \"legend\": {\n \"displayMode\": \"hidden\"\n },\n \"standardOptions\": {\n \"util\": \"percent\"\n },\n \"thresholds\": {\n \"steps\": [\n {\n \"color\": \"#634CD9\",\n \"type\": \"base\",\n \"value\": null\n }\n ]\n },\n \"tooltip\": {\n \"mode\": \"all\",\n \"sort\": \"none\"\n }\n },\n \"targets\": [\n {\n \"expr\": \"aliyun_acs_kvstore_cpu_usage_average{instance_id=\\\"$instance_id\\\"}\",\n \"instant\": false,\n \"legend\": \"\",\n \"refId\": \"A\",\n \"step\": 120\n }\n ],\n \"transformations\": [\n {\n \"id\": \"organize\",\n \"options\": {}\n }\n ],\n \"type\": \"timeseries\",\n \"version\": \"3.0.0\"\n },\n {\n \"custom\": {\n \"drawStyle\": \"lines\",\n \"fillOpacity\": 0.3,\n \"gradientMode\": \"opacity\",\n \"lineInterpolation\": \"smooth\",\n \"lineWidth\": 2,\n \"scaleDistribution\": {\n \"type\": \"linear\"\n },\n \"spanNulls\": false,\n \"stack\": \"off\"\n },\n \"datasourceCate\": \"prometheus\",\n \"datasourceValue\": \"${datasource}\",\n \"id\": \"c43eb882-915f-4c38-a0b5-8f33c21ab44a\",\n \"layout\": {\n \"h\": 4,\n \"i\": \"09903231-6557-42be-9cf3-2873878e9bf2\",\n \"isResizable\": true,\n \"w\": 8,\n \"x\": 8,\n \"y\": 1\n },\n \"maxPerRow\": 4,\n \"name\": \"内存使用率(%)\",\n \"options\": {\n \"legend\": {\n \"displayMode\": \"hidden\"\n },\n \"standardOptions\": {\n \"util\": \"percent\"\n },\n \"thresholds\": {\n \"steps\": [\n {\n \"color\": \"#634CD9\",\n \"type\": \"base\",\n \"value\": null\n }\n ]\n },\n \"tooltip\": {\n \"mode\": \"all\",\n \"sort\": \"none\"\n }\n },\n \"targets\": [\n {\n \"expr\": \"aliyun_acs_kvstore_memory_usage_average{instance_id=\\\"$instance_id\\\"}\",\n \"legend\": \"\",\n \"refId\": \"A\",\n \"step\": 120\n }\n ],\n \"transformations\": [\n {\n \"id\": \"organize\",\n \"options\": {}\n }\n ],\n \"type\": \"timeseries\",\n \"version\": \"3.0.0\"\n },\n {\n \"custom\": {\n \"drawStyle\": \"lines\",\n \"fillOpacity\": 0.3,\n \"gradientMode\": \"opacity\",\n \"lineInterpolation\": \"smooth\",\n \"lineWidth\": 2,\n \"scaleDistribution\": {\n \"type\": \"linear\"\n },\n \"spanNulls\": false,\n \"stack\": \"off\"\n },\n \"datasourceCate\": \"prometheus\",\n \"datasourceValue\": \"${datasource}\",\n \"id\": \"37447883-ad79-46bc-888a-1be2835c1c64\",\n \"layout\": {\n \"h\": 4,\n \"i\": \"378a5a26-c28e-4612-af09-f82ec2e11d80\",\n \"isResizable\": true,\n \"w\": 8,\n \"x\": 16,\n \"y\": 1\n },\n \"maxPerRow\": 4,\n \"name\": \"连接数使用率(%)\",\n \"options\": {\n \"legend\": {\n \"displayMode\": \"hidden\"\n },\n \"standardOptions\": {\n \"util\": \"percent\"\n },\n \"thresholds\": {\n \"steps\": [\n {\n \"color\": \"#634CD9\",\n \"type\": \"base\",\n \"value\": null\n }\n ]\n },\n \"tooltip\": {\n \"mode\": \"all\",\n \"sort\": \"none\"\n }\n },\n \"targets\": [\n {\n \"expr\": \"aliyun_acs_kvstore_connection_usage_average{instance_id=\\\"$instance_id\\\"}\",\n \"legend\": \"\",\n \"refId\": \"A\",\n \"step\": 120\n }\n ],\n \"transformations\": [\n {\n \"id\": \"organize\",\n \"options\": {}\n }\n ],\n \"type\": \"timeseries\",\n \"version\": \"3.0.0\"\n },\n {\n \"custom\": {\n \"drawStyle\": \"lines\",\n \"fillOpacity\": 0.3,\n \"gradientMode\": \"opacity\",\n \"lineInterpolation\": \"smooth\",\n \"lineWidth\": 2,\n \"scaleDistribution\": {\n \"type\": \"linear\"\n },\n \"spanNulls\": false,\n \"stack\": \"off\"\n },\n \"datasourceCate\": \"prometheus\",\n \"datasourceValue\": \"${datasource}\",\n \"id\": \"2d1c8cdf-538e-48b5-8563-358f242825e5\",\n \"layout\": {\n \"h\": 4,\n \"i\": \"764e188d-d728-44a0-a79d-133d957df9a9\",\n \"isResizable\": true,\n \"w\": 8,\n \"x\": 0,\n \"y\": 5\n },\n \"maxPerRow\": 4,\n \"name\": \"流入带宽使用率(%)\",\n \"options\": {\n \"legend\": {\n \"displayMode\": \"hidden\"\n },\n \"standardOptions\": {\n \"util\": \"percent\"\n },\n \"thresholds\": {\n \"steps\": [\n {\n \"color\": \"#634CD9\",\n \"type\": \"base\",\n \"value\": null\n }\n ]\n },\n \"tooltip\": {\n \"mode\": \"all\",\n \"sort\": \"none\"\n }\n },\n \"targets\": [\n {\n \"expr\": \"aliyun_acs_kvstore_intranet_in_ratio_average{instance_id=\\\"$instance_id\\\"}\",\n \"instant\": false,\n \"legend\": \"\",\n \"refId\": \"A\",\n \"step\": 120\n }\n ],\n \"transformations\": [\n {\n \"id\": \"organize\",\n \"options\": {}\n }\n ],\n \"type\": \"timeseries\",\n \"version\": \"3.0.0\"\n },\n {\n \"custom\": {\n \"drawStyle\": \"lines\",\n \"fillOpacity\": 0.3,\n \"gradientMode\": \"opacity\",\n \"lineInterpolation\": \"smooth\",\n \"lineWidth\": 2,\n \"scaleDistribution\": {\n \"type\": \"linear\"\n },\n \"spanNulls\": false,\n \"stack\": \"off\"\n },\n \"datasourceCate\": \"prometheus\",\n \"datasourceValue\": \"${datasource}\",\n \"id\": \"0577dc0f-887a-4a54-9100-ef5e5e7443a0\",\n \"layout\": {\n \"h\": 4,\n \"i\": \"93955b6b-620c-4407-908c-01ba4f544fef\",\n \"isResizable\": true,\n \"w\": 8,\n \"x\": 8,\n \"y\": 5\n },\n \"maxPerRow\": 4,\n \"name\": \"流出带宽使用率(%)\",\n \"options\": {\n \"legend\": {\n \"displayMode\": \"hidden\"\n },\n \"standardOptions\": {\n \"util\": \"percent\"\n },\n \"thresholds\": {\n \"steps\": [\n {\n \"color\": \"#634CD9\",\n \"type\": \"base\",\n \"value\": null\n }\n ]\n },\n \"tooltip\": {\n \"mode\": \"all\",\n \"sort\": \"none\"\n }\n },\n \"targets\": [\n {\n \"expr\": \"aliyun_acs_kvstore_intranet_out_ratio_average{instance_id=\\\"$instance_id\\\"}\",\n \"instant\": false,\n \"legend\": \"\",\n \"refId\": \"A\",\n \"step\": 120\n }\n ],\n \"transformations\": [\n {\n \"id\": \"organize\",\n \"options\": {}\n }\n ],\n \"type\": \"timeseries\",\n \"version\": \"3.0.0\"\n },\n {\n \"custom\": {\n \"drawStyle\": \"lines\",\n \"fillOpacity\": 0.3,\n \"gradientMode\": \"opacity\",\n \"lineInterpolation\": \"smooth\",\n \"lineWidth\": 2,\n \"scaleDistribution\": {\n \"type\": \"linear\"\n },\n \"spanNulls\": false,\n \"stack\": \"off\"\n },\n \"datasourceCate\": \"prometheus\",\n \"datasourceValue\": \"${datasource}\",\n \"id\": \"a83bd550-3866-4225-9c09-08dd77e1b281\",\n \"layout\": {\n \"h\": 4,\n \"i\": \"7b4d509b-1a8d-4f6a-9df4-f14116c4b9eb\",\n \"isResizable\": true,\n \"w\": 8,\n \"x\": 16,\n \"y\": 5\n },\n \"maxPerRow\": 4,\n \"name\": \"连接数使用率(%)\",\n \"options\": {\n \"legend\": {\n \"displayMode\": \"hidden\"\n },\n \"standardOptions\": {},\n \"thresholds\": {\n \"steps\": [\n {\n \"color\": \"#634CD9\",\n \"type\": \"base\",\n \"value\": null\n }\n ]\n },\n \"tooltip\": {\n \"mode\": \"all\",\n \"sort\": \"none\"\n }\n },\n \"targets\": [\n {\n \"expr\": \"aliyun_acs_kvstore_connection_usage_average{instance_id=\\\"$instance_id\\\"}\",\n \"instant\": false,\n \"legend\": \"\",\n \"refId\": \"A\",\n \"step\": 120\n }\n ],\n \"transformations\": [\n {\n \"id\": \"organize\",\n \"options\": {}\n }\n ],\n \"type\": \"timeseries\",\n \"version\": \"3.0.0\"\n }\n ],\n \"var\": [\n {\n \"definition\": \"prometheus\",\n \"name\": \"datasource\",\n \"type\": \"datasource\"\n },\n {\n \"datasource\": {\n \"cate\": \"prometheus\",\n \"value\": \"${datasource}\"\n },\n \"definition\": \"label_values(aliyun_acs_kvstore_cpu_usage_average,name)\",\n \"multi\": false,\n \"name\": \"name\",\n \"type\": \"query\"\n },\n {\n \"datasource\": {\n \"cate\": \"prometheus\",\n \"value\": \"${datasource}\"\n },\n \"definition\": \"label_values(aliyun_acs_kvstore_cpu_usage_average,instance_id)\",\n \"multi\": false,\n \"name\": \"instance_id\",\n \"type\": \"query\"\n }\n ],\n \"version\": \"3.0.0\"\n },\n \"public\": 0,\n \"public_cate\": 0,\n \"bgids\": null,\n \"built_in\": 0,\n \"hide\": 0,\n \"uuid\": 1717556327133348000\n}"
},
{
"path": "integrations/AliYun/dashboards/redis_standard.json",
"content": "{\n \"id\": 0,\n \"group_id\": 0,\n \"name\": \"阿里云REDIS 标准版\",\n \"ident\": \"\",\n \"tags\": \"\",\n \"create_at\": 0,\n \"create_by\": \"\",\n \"update_at\": 0,\n \"update_by\": \"\",\n \"configs\": {\n \"panels\": [\n {\n \"collapsed\": true,\n \"id\": \"2c38fd30-4c4c-40a9-ad4a-5c945db32947\",\n \"layout\": {\n \"h\": 1,\n \"i\": \"2c38fd30-4c4c-40a9-ad4a-5c945db32947\",\n \"isResizable\": false,\n \"w\": 24,\n \"x\": 0,\n \"y\": 0\n },\n \"name\": \"默认分组\",\n \"panels\": [],\n \"type\": \"row\"\n },\n {\n \"custom\": {\n \"drawStyle\": \"lines\",\n \"fillOpacity\": 0.3,\n \"gradientMode\": \"opacity\",\n \"lineInterpolation\": \"smooth\",\n \"lineWidth\": 2,\n \"scaleDistribution\": {\n \"type\": \"linear\"\n },\n \"spanNulls\": false,\n \"stack\": \"off\"\n },\n \"datasourceCate\": \"prometheus\",\n \"datasourceValue\": \"${datasource}\",\n \"id\": \"01f4d444-aa2d-466d-9615-c76baf60a40c\",\n \"layout\": {\n \"h\": 4,\n \"i\": \"01f4d444-aa2d-466d-9615-c76baf60a40c\",\n \"isResizable\": true,\n \"w\": 8,\n \"x\": 0,\n \"y\": 1\n },\n \"maxPerRow\": 4,\n \"name\": \"CPU 使用率(%)\",\n \"options\": {\n \"legend\": {\n \"displayMode\": \"hidden\"\n },\n \"standardOptions\": {\n \"util\": \"percent\"\n },\n \"thresholds\": {\n \"steps\": [\n {\n \"color\": \"#634CD9\",\n \"type\": \"base\",\n \"value\": null\n }\n ]\n },\n \"tooltip\": {\n \"mode\": \"all\",\n \"sort\": \"none\"\n }\n },\n \"targets\": [\n {\n \"expr\": \"aliyun_acs_kvstore_standard_cpu_usage_average{instance_id=\\\"$instance_id\\\"}\",\n \"instant\": false,\n \"legend\": \"\",\n \"refId\": \"A\",\n \"step\": 120\n }\n ],\n \"transformations\": [\n {\n \"id\": \"organize\",\n \"options\": {}\n }\n ],\n \"type\": \"timeseries\",\n \"version\": \"3.0.0\"\n },\n {\n \"custom\": {\n \"drawStyle\": \"lines\",\n \"fillOpacity\": 0.3,\n \"gradientMode\": \"opacity\",\n \"lineInterpolation\": \"smooth\",\n \"lineWidth\": 2,\n \"scaleDistribution\": {\n \"type\": \"linear\"\n },\n \"spanNulls\": false,\n \"stack\": \"off\"\n },\n \"datasourceCate\": \"prometheus\",\n \"datasourceValue\": \"${datasource}\",\n \"id\": \"82fed14f-911c-4f2f-8b39-8630b5cc43dc\",\n \"layout\": {\n \"h\": 4,\n \"i\": \"def6d721-2816-40ef-b4fe-a111a8c035fe\",\n \"isResizable\": true,\n \"w\": 8,\n \"x\": 8,\n \"y\": 1\n },\n \"maxPerRow\": 4,\n \"name\": \"内存使用率(%)\",\n \"options\": {\n \"legend\": {\n \"displayMode\": \"hidden\"\n },\n \"standardOptions\": {\n \"util\": \"percent\"\n },\n \"thresholds\": {\n \"steps\": [\n {\n \"color\": \"#634CD9\",\n \"type\": \"base\",\n \"value\": null\n }\n ]\n },\n \"tooltip\": {\n \"mode\": \"all\",\n \"sort\": \"none\"\n }\n },\n \"targets\": [\n {\n \"expr\": \"aliyun_acs_kvstore_standard_memory_usage_average{instance_id=\\\"$instance_id\\\"}\",\n \"instant\": false,\n \"legend\": \"\",\n \"refId\": \"A\",\n \"step\": 120\n }\n ],\n \"transformations\": [\n {\n \"id\": \"organize\",\n \"options\": {}\n }\n ],\n \"type\": \"timeseries\",\n \"version\": \"3.0.0\"\n },\n {\n \"custom\": {\n \"drawStyle\": \"lines\",\n \"fillOpacity\": 0.3,\n \"gradientMode\": \"opacity\",\n \"lineInterpolation\": \"smooth\",\n \"lineWidth\": 2,\n \"scaleDistribution\": {\n \"type\": \"linear\"\n },\n \"spanNulls\": false,\n \"stack\": \"off\"\n },\n \"datasourceCate\": \"prometheus\",\n \"datasourceValue\": \"${datasource}\",\n \"id\": \"200741b5-1d0c-4bb8-a6a6-d26783e13b31\",\n \"layout\": {\n \"h\": 4,\n \"i\": \"bef9407d-be17-457b-a824-3a1904c5a20c\",\n \"isResizable\": true,\n \"w\": 8,\n \"x\": 16,\n \"y\": 1\n },\n \"maxPerRow\": 4,\n \"name\": \"连接数使用率(%)\",\n \"options\": {\n \"legend\": {\n \"displayMode\": \"hidden\"\n },\n \"standardOptions\": {\n \"util\": \"percent\"\n },\n \"thresholds\": {\n \"steps\": [\n {\n \"color\": \"#634CD9\",\n \"type\": \"base\",\n \"value\": null\n }\n ]\n },\n \"tooltip\": {\n \"mode\": \"all\",\n \"sort\": \"none\"\n }\n },\n \"targets\": [\n {\n \"expr\": \"aliyun_acs_kvstore_standard_connection_usage_average{instance_id=\\\"$instance_id\\\"}\",\n \"instant\": false,\n \"legend\": \"\",\n \"refId\": \"A\",\n \"step\": 120\n }\n ],\n \"transformations\": [\n {\n \"id\": \"organize\",\n \"options\": {}\n }\n ],\n \"type\": \"timeseries\",\n \"version\": \"3.0.0\"\n },\n {\n \"custom\": {\n \"drawStyle\": \"lines\",\n \"fillOpacity\": 0.3,\n \"gradientMode\": \"opacity\",\n \"lineInterpolation\": \"smooth\",\n \"lineWidth\": 2,\n \"scaleDistribution\": {\n \"type\": \"linear\"\n },\n \"spanNulls\": false,\n \"stack\": \"off\"\n },\n \"datasourceCate\": \"prometheus\",\n \"datasourceValue\": \"${datasource}\",\n \"id\": \"ef1e2ca6-268f-47bf-afd3-c9422443ac98\",\n \"layout\": {\n \"h\": 4,\n \"i\": \"47adc622-6018-4e72-8c01-d7d6c88677a4\",\n \"isResizable\": true,\n \"w\": 8,\n \"x\": 0,\n \"y\": 5\n },\n \"maxPerRow\": 4,\n \"name\": \"流入带宽使用率(%)\",\n \"options\": {\n \"legend\": {\n \"displayMode\": \"hidden\"\n },\n \"standardOptions\": {\n \"util\": \"percent\"\n },\n \"thresholds\": {\n \"steps\": [\n {\n \"color\": \"#634CD9\",\n \"type\": \"base\",\n \"value\": null\n }\n ]\n },\n \"tooltip\": {\n \"mode\": \"all\",\n \"sort\": \"none\"\n }\n },\n \"targets\": [\n {\n \"expr\": \"aliyun_acs_kvstore_standard_intranet_in_ratio_average{instance_id=\\\"$instance_id\\\"}\",\n \"instant\": false,\n \"legend\": \"\",\n \"refId\": \"A\",\n \"step\": 120\n }\n ],\n \"transformations\": [\n {\n \"id\": \"organize\",\n \"options\": {}\n }\n ],\n \"type\": \"timeseries\",\n \"version\": \"3.0.0\"\n },\n {\n \"custom\": {\n \"drawStyle\": \"lines\",\n \"fillOpacity\": 0.3,\n \"gradientMode\": \"opacity\",\n \"lineInterpolation\": \"smooth\",\n \"lineWidth\": 2,\n \"scaleDistribution\": {\n \"type\": \"linear\"\n },\n \"spanNulls\": false,\n \"stack\": \"off\"\n },\n \"datasourceCate\": \"prometheus\",\n \"datasourceValue\": \"${datasource}\",\n \"id\": \"e33e2568-eea7-405e-9989-7b1bdf816f65\",\n \"layout\": {\n \"h\": 4,\n \"i\": \"a229c543-1139-43bf-be02-bbea39e4e6a8\",\n \"isResizable\": true,\n \"w\": 8,\n \"x\": 8,\n \"y\": 5\n },\n \"maxPerRow\": 4,\n \"name\": \"流出带宽使用率(%)\",\n \"options\": {\n \"legend\": {\n \"displayMode\": \"hidden\"\n },\n \"standardOptions\": {\n \"util\": \"percent\"\n },\n \"thresholds\": {\n \"steps\": [\n {\n \"color\": \"#634CD9\",\n \"type\": \"base\",\n \"value\": null\n }\n ]\n },\n \"tooltip\": {\n \"mode\": \"all\",\n \"sort\": \"none\"\n }\n },\n \"targets\": [\n {\n \"expr\": \"aliyun_acs_kvstore_standard_intranet_out_ratio_average{instance_id=\\\"$instance_id\\\"}\",\n \"instant\": false,\n \"legend\": \"\",\n \"refId\": \"A\",\n \"step\": 120\n }\n ],\n \"transformations\": [\n {\n \"id\": \"organize\",\n \"options\": {}\n }\n ],\n \"type\": \"timeseries\",\n \"version\": \"3.0.0\"\n },\n {\n \"collapsed\": true,\n \"id\": \"e469ebd7-9249-41ea-b547-10d697738854\",\n \"layout\": {\n \"h\": 1,\n \"i\": \"e469ebd7-9249-41ea-b547-10d697738854\",\n \"isResizable\": false,\n \"w\": 24,\n \"x\": 0,\n \"y\": 9\n },\n \"name\": \"基础监控项\",\n \"type\": \"row\"\n },\n {\n \"custom\": {\n \"drawStyle\": \"lines\",\n \"fillOpacity\": 0.3,\n \"gradientMode\": \"opacity\",\n \"lineInterpolation\": \"smooth\",\n \"lineWidth\": 2,\n \"scaleDistribution\": {\n \"type\": \"linear\"\n },\n \"spanNulls\": false,\n \"stack\": \"off\"\n },\n \"datasourceCate\": \"prometheus\",\n \"datasourceValue\": \"${datasource}\",\n \"id\": \"1a088a52-fca7-4b55-a2ff-3893419c4bd4\",\n \"layout\": {\n \"h\": 4,\n \"i\": \"4f26e8c4-c8c7-48db-bfe0-ad1a069b9bd2\",\n \"isResizable\": true,\n \"w\": 8,\n \"x\": 0,\n \"y\": 10\n },\n \"maxPerRow\": 4,\n \"name\": \"DB连接数使用率(%)\",\n \"options\": {\n \"legend\": {\n \"displayMode\": \"hidden\"\n },\n \"standardOptions\": {\n \"util\": \"percent\"\n },\n \"thresholds\": {\n \"steps\": [\n {\n \"color\": \"#634CD9\",\n \"type\": \"base\",\n \"value\": null\n }\n ]\n },\n \"tooltip\": {\n \"mode\": \"all\",\n \"sort\": \"none\"\n }\n },\n \"targets\": [\n {\n \"expr\": \"aliyun_acs_kvstore_standard_connection_usage_average{instance_id=\\\"$instance_id\\\" }\",\n \"instant\": false,\n \"legend\": \"\",\n \"refId\": \"A\",\n \"step\": 120\n }\n ],\n \"transformations\": [\n {\n \"id\": \"organize\",\n \"options\": {}\n }\n ],\n \"type\": \"timeseries\",\n \"version\": \"3.0.0\"\n },\n {\n \"custom\": {\n \"drawStyle\": \"lines\",\n \"fillOpacity\": 0.3,\n \"gradientMode\": \"opacity\",\n \"lineInterpolation\": \"smooth\",\n \"lineWidth\": 2,\n \"scaleDistribution\": {\n \"type\": \"linear\"\n },\n \"spanNulls\": false,\n \"stack\": \"off\"\n },\n \"datasourceCate\": \"prometheus\",\n \"datasourceValue\": \"${datasource}\",\n \"id\": \"be416c06-1b9e-4861-8c4f-3bfd8737d836\",\n \"layout\": {\n \"h\": 4,\n \"i\": \"66af6522-4be6-4ff4-87f9-ec56d8f181e7\",\n \"isResizable\": true,\n \"w\": 9,\n \"x\": 8,\n \"y\": 10\n },\n \"maxPerRow\": 4,\n \"name\": \"数据节点CPU 使用率(%)\",\n \"options\": {\n \"legend\": {\n \"displayMode\": \"hidden\"\n },\n \"standardOptions\": {\n \"util\": \"percent\"\n },\n \"thresholds\": {\n \"steps\": [\n {\n \"color\": \"#634CD9\",\n \"type\": \"base\",\n \"value\": null\n }\n ]\n },\n \"tooltip\": {\n \"mode\": \"all\",\n \"sort\": \"none\"\n }\n },\n \"targets\": [\n {\n \"expr\": \"aliyun_acs_kvstore_standard_cpu_usage_average{instance_id=\\\"$instance_id\\\" }\",\n \"instant\": false,\n \"legend\": \"\",\n \"refId\": \"A\",\n \"step\": 120\n }\n ],\n \"transformations\": [\n {\n \"id\": \"organize\",\n \"options\": {}\n }\n ],\n \"type\": \"timeseries\",\n \"version\": \"3.0.0\"\n },\n {\n \"custom\": {\n \"drawStyle\": \"lines\",\n \"fillOpacity\": 0.3,\n \"gradientMode\": \"opacity\",\n \"lineInterpolation\": \"smooth\",\n \"lineWidth\": 2,\n \"scaleDistribution\": {\n \"type\": \"linear\"\n },\n \"spanNulls\": false,\n \"stack\": \"off\"\n },\n \"datasourceCate\": \"prometheus\",\n \"datasourceValue\": \"${datasource}\",\n \"id\": \"e6a480bb-7f56-4a8d-a3af-30c52e423852\",\n \"layout\": {\n \"h\": 4,\n \"i\": \"857bb7f2-38e4-4416-8d69-1082450b9fd0\",\n \"isResizable\": true,\n \"w\": 8,\n \"x\": 0,\n \"y\": 14\n },\n \"maxPerRow\": 4,\n \"name\": \"数据节点命中率(%)\",\n \"options\": {\n \"legend\": {\n \"displayMode\": \"hidden\"\n },\n \"standardOptions\": {\n \"util\": \"percent\"\n },\n \"thresholds\": {\n \"steps\": [\n {\n \"color\": \"#634CD9\",\n \"type\": \"base\",\n \"value\": null\n }\n ]\n },\n \"tooltip\": {\n \"mode\": \"all\",\n \"sort\": \"none\"\n }\n },\n \"targets\": [\n {\n \"expr\": \"aliyun_acs_kvstore_standard_hit_rate_average{instance_id=\\\"$instance_id\\\" }\",\n \"instant\": false,\n \"legend\": \"\",\n \"refId\": \"A\",\n \"step\": 120\n }\n ],\n \"transformations\": [\n {\n \"id\": \"organize\",\n \"options\": {}\n }\n ],\n \"type\": \"timeseries\",\n \"version\": \"3.0.0\"\n },\n {\n \"custom\": {\n \"drawStyle\": \"lines\",\n \"fillOpacity\": 0.3,\n \"gradientMode\": \"opacity\",\n \"lineInterpolation\": \"smooth\",\n \"lineWidth\": 2,\n \"scaleDistribution\": {\n \"type\": \"linear\"\n },\n \"spanNulls\": false,\n \"stack\": \"off\"\n },\n \"datasourceCate\": \"prometheus\",\n \"datasourceValue\": \"${datasource}\",\n \"id\": \"aba1d918-5600-452a-b5a5-6f3795d0a220\",\n \"layout\": {\n \"h\": 4,\n \"i\": \"d0beaee6-2eee-4a66-82ba-30e441aed819\",\n \"isResizable\": true,\n \"w\": 8,\n \"x\": 8,\n \"y\": 14\n },\n \"maxPerRow\": 4,\n \"name\": \"数据节点流入带宽(KBytes/s)\",\n \"options\": {\n \"legend\": {\n \"displayMode\": \"hidden\"\n },\n \"standardOptions\": {},\n \"thresholds\": {\n \"steps\": [\n {\n \"color\": \"#634CD9\",\n \"type\": \"base\",\n \"value\": null\n }\n ]\n },\n \"tooltip\": {\n \"mode\": \"all\",\n \"sort\": \"none\"\n }\n },\n \"targets\": [\n {\n \"expr\": \"aliyun_acs_kvstore_standard_intranet_in_average{instance_id=\\\"$instance_id\\\" }\",\n \"instant\": false,\n \"legend\": \"\",\n \"refId\": \"A\",\n \"step\": 120\n }\n ],\n \"transformations\": [\n {\n \"id\": \"organize\",\n \"options\": {}\n }\n ],\n \"type\": \"timeseries\",\n \"version\": \"3.0.0\"\n },\n {\n \"custom\": {\n \"drawStyle\": \"lines\",\n \"fillOpacity\": 0.3,\n \"gradientMode\": \"opacity\",\n \"lineInterpolation\": \"smooth\",\n \"lineWidth\": 2,\n \"scaleDistribution\": {\n \"type\": \"linear\"\n },\n \"spanNulls\": false,\n \"stack\": \"off\"\n },\n \"datasourceCate\": \"prometheus\",\n \"datasourceValue\": \"${datasource}\",\n \"id\": \"5af6d738-b37f-4b40-9b9f-2c774a02bb26\",\n \"layout\": {\n \"h\": 4,\n \"i\": \"8d4609c8-ce71-4e85-8a41-bc4328b817e5\",\n \"isResizable\": true,\n \"w\": 8,\n \"x\": 16,\n \"y\": 14\n },\n \"maxPerRow\": 4,\n \"name\": \"数据节点流入带宽使用率(%)\",\n \"options\": {\n \"legend\": {\n \"displayMode\": \"hidden\"\n },\n \"standardOptions\": {\n \"util\": \"percent\"\n },\n \"thresholds\": {\n \"steps\": [\n {\n \"color\": \"#634CD9\",\n \"type\": \"base\",\n \"value\": null\n }\n ]\n },\n \"tooltip\": {\n \"mode\": \"all\",\n \"sort\": \"none\"\n }\n },\n \"targets\": [\n {\n \"expr\": \"aliyun_acs_kvstore_standard_intranet_in_ratio_average{instance_id=\\\"$instance_id\\\" }\",\n \"instant\": false,\n \"legend\": \"\",\n \"refId\": \"A\",\n \"step\": 120\n }\n ],\n \"transformations\": [\n {\n \"id\": \"organize\",\n \"options\": {}\n }\n ],\n \"type\": \"timeseries\",\n \"version\": \"3.0.0\"\n },\n {\n \"custom\": {\n \"drawStyle\": \"lines\",\n \"fillOpacity\": 0.3,\n \"gradientMode\": \"opacity\",\n \"lineInterpolation\": \"smooth\",\n \"lineWidth\": 2,\n \"scaleDistribution\": {\n \"type\": \"linear\"\n },\n \"spanNulls\": false,\n \"stack\": \"off\"\n },\n \"datasourceCate\": \"prometheus\",\n \"datasourceValue\": \"${datasource}\",\n \"id\": \"223b0eb7-b617-4897-8d4e-cc13db7c6846\",\n \"layout\": {\n \"h\": 4,\n \"i\": \"f7f3d139-28e0-4b70-9529-dc914e77df7b\",\n \"isResizable\": true,\n \"w\": 8,\n \"x\": 0,\n \"y\": 18\n },\n \"maxPerRow\": 4,\n \"name\": \"数据节点流出带宽(KBytes/s)\",\n \"options\": {\n \"legend\": {\n \"displayMode\": \"hidden\"\n },\n \"standardOptions\": {},\n \"thresholds\": {\n \"steps\": [\n {\n \"color\": \"#634CD9\",\n \"type\": \"base\",\n \"value\": null\n }\n ]\n },\n \"tooltip\": {\n \"mode\": \"all\",\n \"sort\": \"none\"\n }\n },\n \"targets\": [\n {\n \"expr\": \"aliyun_acs_kvstore_standard_intranet_out_average{instance_id=\\\"$instance_id\\\" }\",\n \"instant\": false,\n \"legend\": \"\",\n \"refId\": \"A\",\n \"step\": 120\n }\n ],\n \"transformations\": [\n {\n \"id\": \"organize\",\n \"options\": {}\n }\n ],\n \"type\": \"timeseries\",\n \"version\": \"3.0.0\"\n },\n {\n \"custom\": {\n \"drawStyle\": \"lines\",\n \"fillOpacity\": 0.3,\n \"gradientMode\": \"opacity\",\n \"lineInterpolation\": \"smooth\",\n \"lineWidth\": 2,\n \"scaleDistribution\": {\n \"type\": \"linear\"\n },\n \"spanNulls\": false,\n \"stack\": \"off\"\n },\n \"datasourceCate\": \"prometheus\",\n \"datasourceValue\": \"${datasource}\",\n \"id\": \"8e5b9c6b-90ec-4efe-85f4-1e386e28495d\",\n \"layout\": {\n \"h\": 4,\n \"i\": \"22b8d485-016f-4320-93dd-ee7b41c3ef83\",\n \"isResizable\": true,\n \"w\": 8,\n \"x\": 8,\n \"y\": 18\n },\n \"maxPerRow\": 4,\n \"name\": \"数据节点流出带宽使用率(%)\",\n \"options\": {\n \"legend\": {\n \"displayMode\": \"hidden\"\n },\n \"standardOptions\": {\n \"util\": \"percent\"\n },\n \"thresholds\": {\n \"steps\": [\n {\n \"color\": \"#634CD9\",\n \"type\": \"base\",\n \"value\": null\n }\n ]\n },\n \"tooltip\": {\n \"mode\": \"all\",\n \"sort\": \"none\"\n }\n },\n \"targets\": [\n {\n \"expr\": \"aliyun_acs_kvstore_standard_intranet_out_ratio_average{instance_id=\\\"$instance_id\\\" }\",\n \"instant\": false,\n \"legend\": \"\",\n \"refId\": \"A\",\n \"step\": 120\n }\n ],\n \"transformations\": [\n {\n \"id\": \"organize\",\n \"options\": {}\n }\n ],\n \"type\": \"timeseries\",\n \"version\": \"3.0.0\"\n },\n {\n \"custom\": {\n \"drawStyle\": \"lines\",\n \"fillOpacity\": 0.3,\n \"gradientMode\": \"opacity\",\n \"lineInterpolation\": \"smooth\",\n \"lineWidth\": 2,\n \"scaleDistribution\": {\n \"type\": \"linear\"\n },\n \"spanNulls\": false,\n \"stack\": \"off\"\n },\n \"datasourceCate\": \"prometheus\",\n \"datasourceValue\": \"${datasource}\",\n \"id\": \"51ac86b0-e108-4bf0-af19-80b0588e883b\",\n \"layout\": {\n \"h\": 4,\n \"i\": \"82a19a60-ada6-4639-8590-b363c92cd30d\",\n \"isResizable\": true,\n \"w\": 8,\n \"x\": 16,\n \"y\": 18\n },\n \"maxPerRow\": 4,\n \"name\": \"Key总数(个)\",\n \"options\": {\n \"legend\": {\n \"displayMode\": \"hidden\"\n },\n \"standardOptions\": {},\n \"thresholds\": {\n \"steps\": [\n {\n \"color\": \"#634CD9\",\n \"type\": \"base\",\n \"value\": null\n }\n ]\n },\n \"tooltip\": {\n \"mode\": \"all\",\n \"sort\": \"none\"\n }\n },\n \"targets\": [\n {\n \"expr\": \"aliyun_acs_kvstore_standard_keys_average{instance_id=\\\"$instance_id\\\" }\",\n \"instant\": false,\n \"legend\": \"\",\n \"refId\": \"A\",\n \"step\": 120\n }\n ],\n \"transformations\": [\n {\n \"id\": \"organize\",\n \"options\": {}\n }\n ],\n \"type\": \"timeseries\",\n \"version\": \"3.0.0\"\n },\n {\n \"custom\": {\n \"drawStyle\": \"lines\",\n \"fillOpacity\": 0.3,\n \"gradientMode\": \"opacity\",\n \"lineInterpolation\": \"smooth\",\n \"lineWidth\": 2,\n \"scaleDistribution\": {\n \"type\": \"linear\"\n },\n \"spanNulls\": false,\n \"stack\": \"off\"\n },\n \"datasourceCate\": \"prometheus\",\n \"datasourceValue\": \"${datasource}\",\n \"id\": \"54fc0148-930b-47a5-bdf4-06e44c8e1d6a\",\n \"layout\": {\n \"h\": 4,\n \"i\": \"3d6e3c07-97b6-4930-ada9-21d1ffdfc9c6\",\n \"isResizable\": true,\n \"w\": 8,\n \"x\": 0,\n \"y\": 22\n },\n \"maxPerRow\": 4,\n \"name\": \"数据节点内存使用率(%)\",\n \"options\": {\n \"legend\": {\n \"displayMode\": \"hidden\"\n },\n \"standardOptions\": {\n \"util\": \"percent\"\n },\n \"thresholds\": {\n \"steps\": [\n {\n \"color\": \"#634CD9\",\n \"type\": \"base\",\n \"value\": null\n }\n ]\n },\n \"tooltip\": {\n \"mode\": \"all\",\n \"sort\": \"none\"\n }\n },\n \"targets\": [\n {\n \"expr\": \"aliyun_acs_kvstore_standard_memory_usage_average{instance_id=\\\"$instance_id\\\" }\",\n \"instant\": false,\n \"legend\": \"\",\n \"refId\": \"A\",\n \"step\": 120\n }\n ],\n \"transformations\": [\n {\n \"id\": \"organize\",\n \"options\": {}\n }\n ],\n \"type\": \"timeseries\",\n \"version\": \"3.0.0\"\n },\n {\n \"custom\": {\n \"drawStyle\": \"lines\",\n \"fillOpacity\": 0.3,\n \"gradientMode\": \"opacity\",\n \"lineInterpolation\": \"smooth\",\n \"lineWidth\": 2,\n \"scaleDistribution\": {\n \"type\": \"linear\"\n },\n \"spanNulls\": false,\n \"stack\": \"off\"\n },\n \"datasourceCate\": \"prometheus\",\n \"datasourceValue\": \"${datasource}\",\n \"id\": \"8b7d5240-0c30-43c0-86d0-6620e5e122e0\",\n \"layout\": {\n \"h\": 4,\n \"i\": \"91975194-a995-4fe9-8788-7503abfe414a\",\n \"isResizable\": true,\n \"w\": 8,\n \"x\": 8,\n \"y\": 22\n },\n \"maxPerRow\": 4,\n \"name\": \"DB已用连接数(个)\",\n \"options\": {\n \"legend\": {\n \"displayMode\": \"hidden\"\n },\n \"standardOptions\": {},\n \"thresholds\": {\n \"steps\": [\n {\n \"color\": \"#634CD9\",\n \"type\": \"base\",\n \"value\": null\n }\n ]\n },\n \"tooltip\": {\n \"mode\": \"all\",\n \"sort\": \"none\"\n }\n },\n \"targets\": [\n {\n \"expr\": \"aliyun_acs_kvstore_standard_used_connection_average{instance_id=\\\"$instance_id\\\" }\",\n \"instant\": false,\n \"legend\": \"\",\n \"refId\": \"A\",\n \"step\": 120\n }\n ],\n \"transformations\": [\n {\n \"id\": \"organize\",\n \"options\": {}\n }\n ],\n \"type\": \"timeseries\",\n \"version\": \"3.0.0\"\n },\n {\n \"custom\": {\n \"drawStyle\": \"lines\",\n \"fillOpacity\": 0.3,\n \"gradientMode\": \"opacity\",\n \"lineInterpolation\": \"smooth\",\n \"lineWidth\": 2,\n \"scaleDistribution\": {\n \"type\": \"linear\"\n },\n \"spanNulls\": false,\n \"stack\": \"off\"\n },\n \"datasourceCate\": \"prometheus\",\n \"datasourceValue\": \"${datasource}\",\n \"id\": \"3e4719d7-db36-47d7-b4ee-fa6bfd691817\",\n \"layout\": {\n \"h\": 4,\n \"i\": \"b70f9c9c-643c-44fa-89d2-2e99098ab508\",\n \"isResizable\": true,\n \"w\": 8,\n \"x\": 16,\n \"y\": 22\n },\n \"maxPerRow\": 4,\n \"name\": \"阻塞客户端连接数(个)\",\n \"options\": {\n \"legend\": {\n \"displayMode\": \"hidden\"\n },\n \"standardOptions\": {},\n \"thresholds\": {\n \"steps\": [\n {\n \"color\": \"#634CD9\",\n \"type\": \"base\",\n \"value\": null\n }\n ]\n },\n \"tooltip\": {\n \"mode\": \"all\",\n \"sort\": \"none\"\n }\n },\n \"targets\": [\n {\n \"expr\": \"aliyun_acs_kvstore_standard_blocked_clients_average{instance_id=\\\"$instance_id\\\" }\",\n \"instant\": false,\n \"legend\": \"\",\n \"refId\": \"A\",\n \"step\": 120\n }\n ],\n \"transformations\": [\n {\n \"id\": \"organize\",\n \"options\": {}\n }\n ],\n \"type\": \"timeseries\",\n \"version\": \"3.0.0\"\n },\n {\n \"custom\": {\n \"drawStyle\": \"lines\",\n \"fillOpacity\": 0.3,\n \"gradientMode\": \"opacity\",\n \"lineInterpolation\": \"smooth\",\n \"lineWidth\": 2,\n \"scaleDistribution\": {\n \"type\": \"linear\"\n },\n \"spanNulls\": false,\n \"stack\": \"off\"\n },\n \"datasourceCate\": \"prometheus\",\n \"datasourceValue\": \"${datasource}\",\n \"id\": \"98ce0f92-5c53-44a6-bfcb-14de68a56a36\",\n \"layout\": {\n \"h\": 4,\n \"i\": \"9dd21107-4432-4648-a156-68a6f1c41684\",\n \"isResizable\": true,\n \"w\": 8,\n \"x\": 0,\n \"y\": 26\n },\n \"maxPerRow\": 4,\n \"name\": \"历史累计逐出Key总数(个)\",\n \"options\": {\n \"legend\": {\n \"displayMode\": \"hidden\"\n },\n \"standardOptions\": {},\n \"thresholds\": {\n \"steps\": [\n {\n \"color\": \"#634CD9\",\n \"type\": \"base\",\n \"value\": null\n }\n ]\n },\n \"tooltip\": {\n \"mode\": \"all\",\n \"sort\": \"none\"\n }\n },\n \"targets\": [\n {\n \"expr\": \"aliyun_acs_kvstore_standard_evicted_keys_average{instance_id=\\\"$instance_id\\\" }\",\n \"instant\": false,\n \"legend\": \"\",\n \"refId\": \"A\",\n \"step\": 120\n }\n ],\n \"transformations\": [\n {\n \"id\": \"organize\",\n \"options\": {}\n }\n ],\n \"type\": \"timeseries\",\n \"version\": \"3.0.0\"\n },\n {\n \"custom\": {\n \"drawStyle\": \"lines\",\n \"fillOpacity\": 0.3,\n \"gradientMode\": \"opacity\",\n \"lineInterpolation\": \"smooth\",\n \"lineWidth\": 2,\n \"scaleDistribution\": {\n \"type\": \"linear\"\n },\n \"spanNulls\": false,\n \"stack\": \"off\"\n },\n \"datasourceCate\": \"prometheus\",\n \"datasourceValue\": \"${datasource}\",\n \"id\": \"4b9a4e17-35ad-4968-91b9-4d2eca5e2b06\",\n \"layout\": {\n \"h\": 4,\n \"i\": \"ec228b90-d782-4e0c-8301-6ef7a0a41556\",\n \"isResizable\": true,\n \"w\": 8,\n \"x\": 8,\n \"y\": 26\n },\n \"maxPerRow\": 4,\n \"name\": \"每秒逐出Key总数(Count/s)\",\n \"options\": {\n \"legend\": {\n \"displayMode\": \"hidden\"\n },\n \"standardOptions\": {},\n \"thresholds\": {\n \"steps\": [\n {\n \"color\": \"#634CD9\",\n \"type\": \"base\",\n \"value\": null\n }\n ]\n },\n \"tooltip\": {\n \"mode\": \"all\",\n \"sort\": \"none\"\n }\n },\n \"targets\": [\n {\n \"expr\": \"aliyun_acs_kvstore_standard_evicted_keys_per_second_average{instance_id=\\\"$instance_id\\\" }\",\n \"instant\": false,\n \"legend\": \"\",\n \"refId\": \"A\",\n \"step\": 120\n }\n ],\n \"transformations\": [\n {\n \"id\": \"organize\",\n \"options\": {}\n }\n ],\n \"type\": \"timeseries\",\n \"version\": \"3.0.0\"\n },\n {\n \"custom\": {\n \"drawStyle\": \"lines\",\n \"fillOpacity\": 0.3,\n \"gradientMode\": \"opacity\",\n \"lineInterpolation\": \"smooth\",\n \"lineWidth\": 2,\n \"scaleDistribution\": {\n \"type\": \"linear\"\n },\n \"spanNulls\": false,\n \"stack\": \"off\"\n },\n \"datasourceCate\": \"prometheus\",\n \"datasourceValue\": \"${datasource}\",\n \"id\": \"cea77b74-9cfe-4fb6-a9cb-db9ae7f32958\",\n \"layout\": {\n \"h\": 4,\n \"i\": \"bd004cc1-4d0d-49fb-98fe-b3c12b51399d\",\n \"isResizable\": true,\n \"w\": 8,\n \"x\": 16,\n \"y\": 26\n },\n \"maxPerRow\": 4,\n \"name\": \"历史累计淘汰Key总数(个)\",\n \"options\": {\n \"legend\": {\n \"displayMode\": \"hidden\"\n },\n \"standardOptions\": {},\n \"thresholds\": {\n \"steps\": [\n {\n \"color\": \"#634CD9\",\n \"type\": \"base\",\n \"value\": null\n }\n ]\n },\n \"tooltip\": {\n \"mode\": \"all\",\n \"sort\": \"none\"\n }\n },\n \"targets\": [\n {\n \"expr\": \"aliyun_acs_kvstore_standard_expired_keys_average{instance_id=\\\"$instance_id\\\" }\",\n \"instant\": false,\n \"legend\": \"\",\n \"refId\": \"A\",\n \"step\": 120\n }\n ],\n \"transformations\": [\n {\n \"id\": \"organize\",\n \"options\": {}\n }\n ],\n \"type\": \"timeseries\",\n \"version\": \"3.0.0\"\n },\n {\n \"custom\": {\n \"drawStyle\": \"lines\",\n \"fillOpacity\": 0.3,\n \"gradientMode\": \"opacity\",\n \"lineInterpolation\": \"smooth\",\n \"lineWidth\": 2,\n \"scaleDistribution\": {\n \"type\": \"linear\"\n },\n \"spanNulls\": false,\n \"stack\": \"off\"\n },\n \"datasourceCate\": \"prometheus\",\n \"datasourceValue\": \"${datasource}\",\n \"id\": \"24c3c854-6552-4107-86fc-52420ea03692\",\n \"layout\": {\n \"h\": 4,\n \"i\": \"3793c7dc-0da9-434f-a330-42ffba31b5b0\",\n \"isResizable\": true,\n \"w\": 8,\n \"x\": 0,\n \"y\": 30\n },\n \"maxPerRow\": 4,\n \"name\": \"每秒淘汰Key总数(Count/s)\",\n \"options\": {\n \"legend\": {\n \"displayMode\": \"hidden\"\n },\n \"standardOptions\": {},\n \"thresholds\": {\n \"steps\": [\n {\n \"color\": \"#634CD9\",\n \"type\": \"base\",\n \"value\": null\n }\n ]\n },\n \"tooltip\": {\n \"mode\": \"all\",\n \"sort\": \"none\"\n }\n },\n \"targets\": [\n {\n \"expr\": \"aliyun_acs_kvstore_standard_expired_keys_per_second_average{instance_id=\\\"$instance_id\\\" }\",\n \"instant\": false,\n \"legend\": \"\",\n \"refId\": \"A\",\n \"step\": 120\n }\n ],\n \"transformations\": [\n {\n \"id\": \"organize\",\n \"options\": {}\n }\n ],\n \"type\": \"timeseries\",\n \"version\": \"3.0.0\"\n },\n {\n \"custom\": {\n \"drawStyle\": \"lines\",\n \"fillOpacity\": 0.3,\n \"gradientMode\": \"opacity\",\n \"lineInterpolation\": \"smooth\",\n \"lineWidth\": 2,\n \"scaleDistribution\": {\n \"type\": \"linear\"\n },\n \"spanNulls\": false,\n \"stack\": \"off\"\n },\n \"datasourceCate\": \"prometheus\",\n \"datasourceValue\": \"${datasource}\",\n \"id\": \"5af71ff4-8b40-40cd-b672-29b89921ace3\",\n \"layout\": {\n \"h\": 4,\n \"i\": \"1293634c-92dc-4137-91e8-903c8d08be8c\",\n \"isResizable\": true,\n \"w\": 8,\n \"x\": 8,\n \"y\": 30\n },\n \"maxPerRow\": 4,\n \"name\": \"已设置过期时间Key总数(个)\",\n \"options\": {\n \"legend\": {\n \"displayMode\": \"hidden\"\n },\n \"standardOptions\": {},\n \"thresholds\": {\n \"steps\": [\n {\n \"color\": \"#634CD9\",\n \"type\": \"base\",\n \"value\": null\n }\n ]\n },\n \"tooltip\": {\n \"mode\": \"all\",\n \"sort\": \"none\"\n }\n },\n \"targets\": [\n {\n \"expr\": \"aliyun_acs_kvstore_standard_expires_average{instance_id=\\\"$instance_id\\\" }\",\n \"instant\": false,\n \"legend\": \"\",\n \"refId\": \"A\",\n \"step\": 120\n }\n ],\n \"transformations\": [\n {\n \"id\": \"organize\",\n \"options\": {}\n }\n ],\n \"type\": \"timeseries\",\n \"version\": \"3.0.0\"\n },\n {\n \"custom\": {\n \"drawStyle\": \"lines\",\n \"fillOpacity\": 0.3,\n \"gradientMode\": \"opacity\",\n \"lineInterpolation\": \"smooth\",\n \"lineWidth\": 2,\n \"scaleDistribution\": {\n \"type\": \"linear\"\n },\n \"spanNulls\": false,\n \"stack\": \"off\"\n },\n \"datasourceCate\": \"prometheus\",\n \"datasourceValue\": \"${datasource}\",\n \"id\": \"490e1a0e-ea61-445a-bc25-38d3abd265c9\",\n \"layout\": {\n \"h\": 4,\n \"i\": \"576e80a4-9fea-461f-b9c7-70a23da86b92\",\n \"isResizable\": true,\n \"w\": 8,\n \"x\": 16,\n \"y\": 30\n },\n \"maxPerRow\": 4,\n \"name\": \"读QPS(Count/s)\",\n \"options\": {\n \"legend\": {\n \"displayMode\": \"hidden\"\n },\n \"standardOptions\": {},\n \"thresholds\": {\n \"steps\": [\n {\n \"color\": \"#634CD9\",\n \"type\": \"base\",\n \"value\": null\n }\n ]\n },\n \"tooltip\": {\n \"mode\": \"all\",\n \"sort\": \"none\"\n }\n },\n \"targets\": [\n {\n \"expr\": \"aliyun_acs_kvstore_standard_get_qps_average{instance_id=\\\"$instance_id\\\" }\",\n \"instant\": false,\n \"legend\": \"\",\n \"refId\": \"A\",\n \"step\": 120\n }\n ],\n \"transformations\": [\n {\n \"id\": \"organize\",\n \"options\": {}\n }\n ],\n \"type\": \"timeseries\",\n \"version\": \"3.0.0\"\n },\n {\n \"custom\": {\n \"drawStyle\": \"lines\",\n \"fillOpacity\": 0.3,\n \"gradientMode\": \"opacity\",\n \"lineInterpolation\": \"smooth\",\n \"lineWidth\": 2,\n \"scaleDistribution\": {\n \"type\": \"linear\"\n },\n \"spanNulls\": false,\n \"stack\": \"off\"\n },\n \"datasourceCate\": \"prometheus\",\n \"datasourceValue\": \"${datasource}\",\n \"id\": \"6457aad2-7774-4264-ba43-d784ab4fd936\",\n \"layout\": {\n \"h\": 4,\n \"i\": \"0a2ab22e-af09-46d0-bb98-b148a9760ee9\",\n \"isResizable\": true,\n \"w\": 8,\n \"x\": 0,\n \"y\": 34\n },\n \"maxPerRow\": 4,\n \"name\": \"每秒命中Key数量(个)\",\n \"options\": {\n \"legend\": {\n \"displayMode\": \"hidden\"\n },\n \"standardOptions\": {},\n \"thresholds\": {\n \"steps\": [\n {\n \"color\": \"#634CD9\",\n \"type\": \"base\",\n \"value\": null\n }\n ]\n },\n \"tooltip\": {\n \"mode\": \"all\",\n \"sort\": \"none\"\n }\n },\n \"targets\": [\n {\n \"expr\": \"aliyun_acs_kvstore_standard_hits_average{instance_id=\\\"$instance_id\\\" }\",\n \"instant\": false,\n \"legend\": \"\",\n \"refId\": \"A\",\n \"step\": 120\n }\n ],\n \"transformations\": [\n {\n \"id\": \"organize\",\n \"options\": {}\n }\n ],\n \"type\": \"timeseries\",\n \"version\": \"3.0.0\"\n },\n {\n \"custom\": {\n \"drawStyle\": \"lines\",\n \"fillOpacity\": 0.3,\n \"gradientMode\": \"opacity\",\n \"lineInterpolation\": \"smooth\",\n \"lineWidth\": 2,\n \"scaleDistribution\": {\n \"type\": \"linear\"\n },\n \"spanNulls\": false,\n \"stack\": \"off\"\n },\n \"datasourceCate\": \"prometheus\",\n \"datasourceValue\": \"${datasource}\",\n \"id\": \"76dfed26-8798-4510-a420-0f8ad7ccb1e5\",\n \"layout\": {\n \"h\": 4,\n \"i\": \"b62577c7-cea6-4bcd-8807-c4eed591545a\",\n \"isResizable\": true,\n \"w\": 8,\n \"x\": 8,\n \"y\": 34\n },\n \"maxPerRow\": 4,\n \"name\": \"每秒未命中Key数量(个)\",\n \"options\": {\n \"legend\": {\n \"displayMode\": \"hidden\"\n },\n \"standardOptions\": {},\n \"thresholds\": {\n \"steps\": [\n {\n \"color\": \"#634CD9\",\n \"type\": \"base\",\n \"value\": null\n }\n ]\n },\n \"tooltip\": {\n \"mode\": \"all\",\n \"sort\": \"none\"\n }\n },\n \"targets\": [\n {\n \"expr\": \"aliyun_acs_kvstore_standard_misses_average{instance_id=\\\"$instance_id\\\" }\",\n \"instant\": false,\n \"legend\": \"\",\n \"refId\": \"A\",\n \"step\": 120\n }\n ],\n \"transformations\": [\n {\n \"id\": \"organize\",\n \"options\": {}\n }\n ],\n \"type\": \"timeseries\",\n \"version\": \"3.0.0\"\n },\n {\n \"custom\": {\n \"drawStyle\": \"lines\",\n \"fillOpacity\": 0.3,\n \"gradientMode\": \"opacity\",\n \"lineInterpolation\": \"smooth\",\n \"lineWidth\": 2,\n \"scaleDistribution\": {\n \"type\": \"linear\"\n },\n \"spanNulls\": false,\n \"stack\": \"off\"\n },\n \"datasourceCate\": \"prometheus\",\n \"datasourceValue\": \"${datasource}\",\n \"id\": \"d7a87151-35e3-41b0-8fbc-577af8df2d95\",\n \"layout\": {\n \"h\": 4,\n \"i\": \"190bc267-e449-4d73-a734-50c4193b8f68\",\n \"isResizable\": true,\n \"w\": 8,\n \"x\": 16,\n \"y\": 34\n },\n \"maxPerRow\": 4,\n \"name\": \"其他QPS(个)\",\n \"options\": {\n \"legend\": {\n \"displayMode\": \"hidden\"\n },\n \"standardOptions\": {},\n \"thresholds\": {\n \"steps\": [\n {\n \"color\": \"#634CD9\",\n \"type\": \"base\",\n \"value\": null\n }\n ]\n },\n \"tooltip\": {\n \"mode\": \"all\",\n \"sort\": \"none\"\n }\n },\n \"targets\": [\n {\n \"expr\": \"aliyun_acs_kvstore_standard_other_ops_average{instance_id=\\\"$instance_id\\\" }\",\n \"instant\": false,\n \"legend\": \"\",\n \"refId\": \"A\",\n \"step\": 120\n }\n ],\n \"transformations\": [\n {\n \"id\": \"organize\",\n \"options\": {}\n }\n ],\n \"type\": \"timeseries\",\n \"version\": \"3.0.0\"\n },\n {\n \"custom\": {\n \"drawStyle\": \"lines\",\n \"fillOpacity\": 0.3,\n \"gradientMode\": \"opacity\",\n \"lineInterpolation\": \"smooth\",\n \"lineWidth\": 2,\n \"scaleDistribution\": {\n \"type\": \"linear\"\n },\n \"spanNulls\": false,\n \"stack\": \"off\"\n },\n \"datasourceCate\": \"prometheus\",\n \"datasourceValue\": \"${datasource}\",\n \"id\": \"7a9282ea-fd7b-41d0-ac7a-44ce0612cfa0\",\n \"layout\": {\n \"h\": 4,\n \"i\": \"e1ef102d-981d-4c62-beae-5af73effe7bd\",\n \"isResizable\": true,\n \"w\": 8,\n \"x\": 0,\n \"y\": 38\n },\n \"maxPerRow\": 4,\n \"name\": \"写QPS(Count/s)\",\n \"options\": {\n \"legend\": {\n \"displayMode\": \"hidden\"\n },\n \"standardOptions\": {},\n \"thresholds\": {\n \"steps\": [\n {\n \"color\": \"#634CD9\",\n \"type\": \"base\",\n \"value\": null\n }\n ]\n },\n \"tooltip\": {\n \"mode\": \"all\",\n \"sort\": \"none\"\n }\n },\n \"targets\": [\n {\n \"expr\": \"aliyun_acs_kvstore_standard_put_qps_average{instance_id=\\\"$instance_id\\\" }\",\n \"instant\": false,\n \"legend\": \"\",\n \"refId\": \"A\",\n \"step\": 120\n }\n ],\n \"transformations\": [\n {\n \"id\": \"organize\",\n \"options\": {}\n }\n ],\n \"type\": \"timeseries\",\n \"version\": \"3.0.0\"\n },\n {\n \"custom\": {\n \"drawStyle\": \"lines\",\n \"fillOpacity\": 0.3,\n \"gradientMode\": \"opacity\",\n \"lineInterpolation\": \"smooth\",\n \"lineWidth\": 2,\n \"scaleDistribution\": {\n \"type\": \"linear\"\n },\n \"spanNulls\": false,\n \"stack\": \"off\"\n },\n \"datasourceCate\": \"prometheus\",\n \"datasourceValue\": \"${datasource}\",\n \"id\": \"f8f71f38-82cd-413c-abed-5e03e2214adf\",\n \"layout\": {\n \"h\": 4,\n \"i\": \"d5b997c9-5bb3-441b-91c8-92b53ef73355\",\n \"isResizable\": true,\n \"w\": 8,\n \"x\": 8,\n \"y\": 38\n },\n \"maxPerRow\": 4,\n \"name\": \"Lua脚本使用内存量(Byte)\",\n \"options\": {\n \"legend\": {\n \"displayMode\": \"hidden\"\n },\n \"standardOptions\": {\n \"util\": \"bytesSI\"\n },\n \"thresholds\": {\n \"steps\": [\n {\n \"color\": \"#634CD9\",\n \"type\": \"base\",\n \"value\": null\n }\n ]\n },\n \"tooltip\": {\n \"mode\": \"all\",\n \"sort\": \"none\"\n }\n },\n \"targets\": [\n {\n \"expr\": \"aliyun_acs_kvstore_standard_used_memory_lua_average{instance_id=\\\"$instance_id\\\" }\",\n \"instant\": false,\n \"legend\": \"\",\n \"refId\": \"A\",\n \"step\": 120\n }\n ],\n \"transformations\": [\n {\n \"id\": \"organize\",\n \"options\": {}\n }\n ],\n \"type\": \"timeseries\",\n \"version\": \"3.0.0\"\n },\n {\n \"collapsed\": true,\n \"id\": \"723f3cf7-5d92-46b0-a307-ef99f6f62cb2\",\n \"layout\": {\n \"h\": 1,\n \"i\": \"723f3cf7-5d92-46b0-a307-ef99f6f62cb2\",\n \"isResizable\": false,\n \"w\": 24,\n \"x\": 0,\n \"y\": 42\n },\n \"name\": \"延迟监控项\",\n \"type\": \"row\"\n },\n {\n \"custom\": {\n \"drawStyle\": \"lines\",\n \"fillOpacity\": 0.3,\n \"gradientMode\": \"opacity\",\n \"lineInterpolation\": \"smooth\",\n \"lineWidth\": 2,\n \"scaleDistribution\": {\n \"type\": \"linear\"\n },\n \"spanNulls\": false,\n \"stack\": \"off\"\n },\n \"datasourceCate\": \"prometheus\",\n \"datasourceValue\": \"${datasource}\",\n \"id\": \"92ff998a-db7d-41d9-b4d4-fa9d04252a4c\",\n \"layout\": {\n \"h\": 4,\n \"i\": \"26a238e5-ffd0-48b4-b7bd-1fdc9ba20776\",\n \"isResizable\": true,\n \"w\": 8,\n \"x\": 0,\n \"y\": 43\n },\n \"maxPerRow\": 4,\n \"name\": \"数据节点平均响应时间(us)\",\n \"options\": {\n \"legend\": {\n \"displayMode\": \"hidden\"\n },\n \"standardOptions\": {},\n \"thresholds\": {\n \"steps\": [\n {\n \"color\": \"#634CD9\",\n \"type\": \"base\",\n \"value\": null\n }\n ]\n },\n \"tooltip\": {\n \"mode\": \"all\",\n \"sort\": \"none\"\n }\n },\n \"targets\": [\n {\n \"expr\": \"aliyun_acs_kvstore_standard_avg_rt_average{instance_id=\\\"$instance_id\\\" }\",\n \"instant\": false,\n \"legend\": \"\",\n \"refId\": \"A\",\n \"step\": 120\n }\n ],\n \"transformations\": [\n {\n \"id\": \"organize\",\n \"options\": {}\n }\n ],\n \"type\": \"timeseries\",\n \"version\": \"3.0.0\"\n },\n {\n \"collapsed\": true,\n \"id\": \"ce1da00c-8e8a-498a-a6da-3e164128cb21\",\n \"layout\": {\n \"h\": 1,\n \"i\": \"ce1da00c-8e8a-498a-a6da-3e164128cb21\",\n \"isResizable\": false,\n \"w\": 24,\n \"x\": 0,\n \"y\": 47\n },\n \"name\": \"Proxy监控项\",\n \"type\": \"row\"\n }\n ],\n \"var\": [\n {\n \"definition\": \"prometheus\",\n \"name\": \"datasource\",\n \"type\": \"datasource\"\n },\n {\n \"datasource\": {\n \"cate\": \"prometheus\",\n \"value\": \"${datasource}\"\n },\n \"definition\": \"label_values(aliyun_acs_kvstore_standard_keys_average,name)\",\n \"multi\": false,\n \"name\": \"name\",\n \"type\": \"query\"\n },\n {\n \"datasource\": {\n \"cate\": \"prometheus\",\n \"value\": \"${datasource}\"\n },\n \"definition\": \"label_values(aliyun_acs_kvstore_standard_keys_average{name=\\\"$name\\\"},instance_id)\",\n \"multi\": false,\n \"name\": \"instance_id\",\n \"type\": \"query\"\n }\n ],\n \"version\": \"3.0.0\"\n },\n \"public\": 0,\n \"public_cate\": 0,\n \"bgids\": null,\n \"built_in\": 0,\n \"hide\": 0,\n \"uuid\": 1717556327135170000\n}"
},
{
"path": "integrations/AliYun/dashboards/slb.json",
"content": "{\n \"id\": 0,\n \"group_id\": 0,\n \"name\": \"阿里云SLB\",\n \"ident\": \"\",\n \"tags\": \"\",\n \"create_at\": 0,\n \"create_by\": \"\",\n \"update_at\": 0,\n \"update_by\": \"\",\n \"configs\": {\n \"panels\": [\n {\n \"custom\": {\n \"drawStyle\": \"lines\",\n \"fillOpacity\": 0.3,\n \"gradientMode\": \"opacity\",\n \"lineInterpolation\": \"smooth\",\n \"lineWidth\": 2,\n \"scaleDistribution\": {\n \"type\": \"linear\"\n },\n \"spanNulls\": false,\n \"stack\": \"off\"\n },\n \"datasourceCate\": \"prometheus\",\n \"datasourceName\": \"Default\",\n \"datasourceValue\": \"${datasource}\",\n \"id\": \"aa8b2623-1e14-43cd-a3c4-33944a61fcc5\",\n \"layout\": {\n \"h\": 4,\n \"i\": \"aa8b2623-1e14-43cd-a3c4-33944a61fcc5\",\n \"isResizable\": true,\n \"w\": 12,\n \"x\": 0,\n \"y\": 0\n },\n \"maxPerRow\": 4,\n \"name\": \"七层实例QPS使用率(%)\",\n \"options\": {\n \"legend\": {\n \"displayMode\": \"hidden\"\n },\n \"standardOptions\": {},\n \"thresholds\": {\n \"steps\": [\n {\n \"color\": \"#634CD9\",\n \"type\": \"base\",\n \"value\": null\n }\n ]\n },\n \"tooltip\": {\n \"mode\": \"all\",\n \"sort\": \"none\"\n }\n },\n \"targets\": [\n {\n \"expr\": \"sum(aliyun_acs_slb_dashboard_instance_qps_utilization_average{instance_id=~\\\"$instance_id\\\"}) by (instance_id)\",\n \"legend\": \"{{instance_id}} QPS使用率 \",\n \"refId\": \"A\"\n }\n ],\n \"type\": \"timeseries\",\n \"version\": \"2.0.0\"\n },\n {\n \"custom\": {\n \"drawStyle\": \"lines\",\n \"fillOpacity\": 0.3,\n \"gradientMode\": \"opacity\",\n \"lineInterpolation\": \"smooth\",\n \"lineWidth\": 2,\n \"scaleDistribution\": {\n \"type\": \"linear\"\n },\n \"spanNulls\": false,\n \"stack\": \"off\"\n },\n \"datasourceCate\": \"prometheus\",\n \"datasourceValue\": \"${datasource}\",\n \"id\": \"b2002c63-8f0b-436c-b765-5bb65191f3c2\",\n \"layout\": {\n \"h\": 4,\n \"i\": \"b2002c63-8f0b-436c-b765-5bb65191f3c2\",\n \"isResizable\": true,\n \"w\": 12,\n \"x\": 12,\n \"y\": 0\n },\n \"maxPerRow\": 4,\n \"name\": \"7层协议实例Upstream状态码分布\",\n \"options\": {\n \"legend\": {\n \"displayMode\": \"hidden\"\n },\n \"standardOptions\": {},\n \"thresholds\": {\n \"steps\": [\n {\n \"color\": \"#634CD9\",\n \"type\": \"base\",\n \"value\": null\n }\n ]\n },\n \"tooltip\": {\n \"mode\": \"all\",\n \"sort\": \"none\"\n }\n },\n \"targets\": [\n {\n \"expr\": \"sum(aliyun_acs_slb_dashboard_upstream_code4xx_average{instance_id=~\\\"$instance_id\\\"}) by (instance_id)\",\n \"legend\": \"{{instance_id}} 状态码 4xx \",\n \"refId\": \"A\"\n },\n {\n \"expr\": \"sum(aliyun_acs_slb_dashboard_upstream_code5xx_average{instance_id=~\\\"$instance_id\\\"}) by (instance_id)\",\n \"legend\": \"{{instance_id}} 状态码 5xx \",\n \"refId\": \"B\"\n }\n ],\n \"type\": \"timeseries\",\n \"version\": \"2.0.0\"\n },\n {\n \"custom\": {\n \"drawStyle\": \"lines\",\n \"fillOpacity\": 0.3,\n \"gradientMode\": \"opacity\",\n \"lineInterpolation\": \"smooth\",\n \"lineWidth\": 2,\n \"scaleDistribution\": {\n \"type\": \"linear\"\n },\n \"spanNulls\": false,\n \"stack\": \"off\"\n },\n \"datasourceCate\": \"prometheus\",\n \"datasourceValue\": \"${datasource}\",\n \"id\": \"71028d82-4804-468f-92f4-3444953b22cc\",\n \"layout\": {\n \"h\": 4,\n \"i\": \"71028d82-4804-468f-92f4-3444953b22cc\",\n \"isResizable\": true,\n \"w\": 12,\n \"x\": 0,\n \"y\": 4\n },\n \"maxPerRow\": 4,\n \"name\": \"新建连接数\",\n \"options\": {\n \"legend\": {\n \"displayMode\": \"hidden\"\n },\n \"standardOptions\": {},\n \"thresholds\": {\n \"steps\": [\n {\n \"color\": \"#634CD9\",\n \"type\": \"base\",\n \"value\": null\n }\n ]\n },\n \"tooltip\": {\n \"mode\": \"all\",\n \"sort\": \"none\"\n }\n },\n \"targets\": [\n {\n \"expr\": \"sum(aliyun_acs_slb_dashboard_instance_new_connection_average{instance_id=~\\\"$instance_id\\\"}) by (instance_id)\",\n \"legend\": \"{{instance_id}} 新建连接数\",\n \"refId\": \"A\"\n }\n ],\n \"type\": \"timeseries\",\n \"version\": \"2.0.0\"\n },\n {\n \"custom\": {\n \"drawStyle\": \"lines\",\n \"fillOpacity\": 0.3,\n \"gradientMode\": \"opacity\",\n \"lineInterpolation\": \"smooth\",\n \"lineWidth\": 2,\n \"scaleDistribution\": {\n \"type\": \"linear\"\n },\n \"spanNulls\": false,\n \"stack\": \"off\"\n },\n \"datasourceCate\": \"prometheus\",\n \"datasourceValue\": \"${datasource}\",\n \"id\": \"25f90635-ff68-4dc2-bfb0-c6634f0e6867\",\n \"layout\": {\n \"h\": 4,\n \"i\": \"25f90635-ff68-4dc2-bfb0-c6634f0e6867\",\n \"isResizable\": true,\n \"w\": 12,\n \"x\": 12,\n \"y\": 4\n },\n \"maxPerRow\": 4,\n \"name\": \"并发连接数\",\n \"options\": {\n \"legend\": {\n \"displayMode\": \"hidden\"\n },\n \"standardOptions\": {},\n \"thresholds\": {\n \"steps\": [\n {\n \"color\": \"#634CD9\",\n \"type\": \"base\",\n \"value\": null\n }\n ]\n },\n \"tooltip\": {\n \"mode\": \"all\",\n \"sort\": \"none\"\n }\n },\n \"targets\": [\n {\n \"expr\": \"sum(aliyun_acs_slb_dashboard_active_connection_average{instance_id=~\\\"$instance_id\\\"}) by (instance_id)\",\n \"legend\": \"{{instance_id}} 活跃连接数\",\n \"refId\": \"A\"\n },\n {\n \"expr\": \"sum(aliyun_acs_slb_dashboard_inactive_connection_average{instance_id=~\\\"$instance_id\\\"}) by (instance_id)\",\n \"legend\": \"{{instance_id}} 非活跃连接数\",\n \"refId\": \"B\"\n },\n {\n \"expr\": \"sum(aliyun_acs_slb_dashboard_max_connection_average{instance_id=~\\\"$instance_id\\\"}) by (instance_id)\",\n \"legend\": \"{{instance_id}} 最大活跃连接数\",\n \"refId\": \"C\"\n }\n ],\n \"type\": \"timeseries\",\n \"version\": \"2.0.0\"\n },\n {\n \"custom\": {\n \"drawStyle\": \"lines\",\n \"fillOpacity\": 0.3,\n \"gradientMode\": \"opacity\",\n \"lineInterpolation\": \"smooth\",\n \"lineWidth\": 2,\n \"scaleDistribution\": {\n \"type\": \"linear\"\n },\n \"spanNulls\": false,\n \"stack\": \"off\"\n },\n \"datasourceCate\": \"prometheus\",\n \"datasourceValue\": \"${datasource}\",\n \"id\": \"fde27e57-bdd6-4fd6-b3c0-75222f736d3b\",\n \"layout\": {\n \"h\": 4,\n \"i\": \"fde27e57-bdd6-4fd6-b3c0-75222f736d3b\",\n \"isResizable\": true,\n \"w\": 12,\n \"x\": 0,\n \"y\": 8\n },\n \"maxPerRow\": 4,\n \"name\": \"数据包数\",\n \"options\": {\n \"legend\": {\n \"displayMode\": \"hidden\"\n },\n \"standardOptions\": {\n \"util\": \"none\"\n },\n \"thresholds\": {\n \"steps\": [\n {\n \"color\": \"#634CD9\",\n \"type\": \"base\",\n \"value\": null\n }\n ]\n },\n \"tooltip\": {\n \"mode\": \"all\",\n \"sort\": \"none\"\n }\n },\n \"targets\": [\n {\n \"expr\": \"sum(aliyun_acs_slb_dashboard_packet_rx_average{instance_id=~\\\"$instance_id\\\"}) by (instance_id)\",\n \"legend\": \"{{instance_id}} 接受数据包数\",\n \"refId\": \"A\"\n },\n {\n \"expr\": \"sum(aliyun_acs_slb_dashboard_packet_tx_average{instance_id=~\\\"$instance_id\\\"}) by (instance_id)\",\n \"legend\": \"{{instance_id}} 发送数据包数\",\n \"refId\": \"B\"\n }\n ],\n \"type\": \"timeseries\",\n \"version\": \"2.0.0\"\n },\n {\n \"custom\": {\n \"drawStyle\": \"lines\",\n \"fillOpacity\": 0.3,\n \"gradientMode\": \"opacity\",\n \"lineInterpolation\": \"smooth\",\n \"lineWidth\": 2,\n \"scaleDistribution\": {\n \"type\": \"linear\"\n },\n \"spanNulls\": false,\n \"stack\": \"off\"\n },\n \"datasourceCate\": \"prometheus\",\n \"datasourceValue\": \"${datasource}\",\n \"id\": \"a0fd47db-0b49-4b71-ae16-b4108324e35a\",\n \"layout\": {\n \"h\": 4,\n \"i\": \"a0fd47db-0b49-4b71-ae16-b4108324e35a\",\n \"isResizable\": true,\n \"w\": 12,\n \"x\": 12,\n \"y\": 8\n },\n \"maxPerRow\": 4,\n \"name\": \"流量\",\n \"options\": {\n \"legend\": {\n \"displayMode\": \"hidden\"\n },\n \"standardOptions\": {\n \"util\": \"bitsSI\"\n },\n \"thresholds\": {\n \"steps\": [\n {\n \"color\": \"#634CD9\",\n \"type\": \"base\",\n \"value\": null\n }\n ]\n },\n \"tooltip\": {\n \"mode\": \"all\",\n \"sort\": \"none\"\n }\n },\n \"targets\": [\n {\n \"expr\": \"sum(aliyun_acs_slb_dashboard_instance_traffic_rx_average{instance_id=~\\\"$instance_id\\\"}) by (instance_id)\",\n \"legend\": \"{{instance_id}} 出流量\",\n \"refId\": \"A\"\n },\n {\n \"expr\": \"sum(aliyun_acs_slb_dashboard_instance_traffic_tx_average{instance_id=~\\\"$instance_id\\\"}) by (instance_id)\",\n \"legend\": \"{{instance_id}} 入流量\",\n \"refId\": \"B\"\n }\n ],\n \"type\": \"timeseries\",\n \"version\": \"2.0.0\"\n }\n ],\n \"var\": [\n {\n \"definition\": \"prometheus\",\n \"name\": \"datasource\",\n \"type\": \"datasource\"\n },\n {\n \"allOption\": true,\n \"datasource\": {\n \"cate\": \"prometheus\",\n \"value\": \"${datasource}\"\n },\n \"definition\": \"label_values(aliyun_acs_slb_dashboard_active_connection_average ,instance_id)\",\n \"multi\": true,\n \"name\": \"instance_id\",\n \"type\": \"query\"\n }\n ],\n \"version\": \"3.0.0\"\n },\n \"public\": 0,\n \"public_cate\": 0,\n \"bgids\": null,\n \"built_in\": 0,\n \"hide\": 0,\n \"uuid\": 1717556327138375000\n}"
},
{
"path": "integrations/AliYun/dashboards/slb_new.json",
"content": "{\n \"id\": 0,\n \"group_id\": 0,\n \"name\": \"阿里云-负载均衡\",\n \"ident\": \"\",\n \"tags\": \"\",\n \"create_at\": 0,\n \"create_by\": \"\",\n \"update_at\": 0,\n \"update_by\": \"\",\n \"configs\": {\n \"panels\": [\n {\n \"collapsed\": true,\n \"id\": \"ca8f4cf3-c45c-44ca-8685-b7563e6fba66\",\n \"layout\": {\n \"h\": 1,\n \"i\": \"ca8f4cf3-c45c-44ca-8685-b7563e6fba66\",\n \"isResizable\": false,\n \"w\": 24,\n \"x\": 0,\n \"y\": 0\n },\n \"name\": \"实例\",\n \"type\": \"row\"\n },\n {\n \"custom\": {\n \"drawStyle\": \"lines\",\n \"fillOpacity\": 0.3,\n \"gradientMode\": \"opacity\",\n \"lineInterpolation\": \"smooth\",\n \"lineWidth\": 2,\n \"scaleDistribution\": {\n \"type\": \"linear\"\n },\n \"spanNulls\": false,\n \"stack\": \"off\"\n },\n \"datasourceCate\": \"prometheus\",\n \"datasourceValue\": \"${datasource}\",\n \"id\": \"670fc7e8-0b40-4bc7-845b-6bbe8037b8f7\",\n \"layout\": {\n \"h\": 4,\n \"i\": \"670fc7e8-0b40-4bc7-845b-6bbe8037b8f7\",\n \"isResizable\": true,\n \"w\": 8,\n \"x\": 0,\n \"y\": 1\n },\n \"maxPerRow\": 4,\n \"name\": \"流量(bits/s)\",\n \"options\": {\n \"legend\": {\n \"displayMode\": \"hidden\"\n },\n \"standardOptions\": {\n \"util\": \"bitsSI\"\n },\n \"thresholds\": {\n \"steps\": [\n {\n \"color\": \"#634CD9\",\n \"type\": \"base\",\n \"value\": null\n }\n ]\n },\n \"tooltip\": {\n \"mode\": \"all\",\n \"sort\": \"none\"\n }\n },\n \"targets\": [\n {\n \"expr\": \"aliyun_acs_slb_dashboard_instance_traffic_rx_average{instance_id=\\\"$instance_id\\\"}\",\n \"legend\": \"rx\",\n \"refId\": \"A\"\n },\n {\n \"expr\": \"aliyun_acs_slb_dashboard_instance_traffic_tx_average{instance_id=\\\"$instance_id\\\"}\",\n \"legend\": \"tx\",\n \"refId\": \"B\"\n }\n ],\n \"transformations\": [\n {\n \"id\": \"organize\",\n \"options\": {}\n }\n ],\n \"type\": \"timeseries\",\n \"version\": \"3.0.0\"\n },\n {\n \"custom\": {\n \"drawStyle\": \"lines\",\n \"fillOpacity\": 0.3,\n \"gradientMode\": \"opacity\",\n \"lineInterpolation\": \"smooth\",\n \"lineWidth\": 2,\n \"scaleDistribution\": {\n \"type\": \"linear\"\n },\n \"spanNulls\": false,\n \"stack\": \"off\"\n },\n \"datasourceCate\": \"prometheus\",\n \"datasourceValue\": \"${datasource}\",\n \"id\": \"874e39c7-45e6-4146-8198-edd28949168a\",\n \"layout\": {\n \"h\": 4,\n \"i\": \"38c17f21-f807-4740-b851-a42f19bb962d\",\n \"isResizable\": true,\n \"w\": 8,\n \"x\": 8,\n \"y\": 1\n },\n \"maxPerRow\": 4,\n \"name\": \"数据包数(Count/s)\",\n \"options\": {\n \"legend\": {\n \"displayMode\": \"hidden\"\n },\n \"standardOptions\": {},\n \"thresholds\": {\n \"steps\": [\n {\n \"color\": \"#634CD9\",\n \"type\": \"base\",\n \"value\": null\n }\n ]\n },\n \"tooltip\": {\n \"mode\": \"all\",\n \"sort\": \"none\"\n }\n },\n \"targets\": [\n {\n \"expr\": \"aliyun_acs_slb_dashboard_instance_packet_rx_average{instance_id=\\\"$instance_id\\\"}\",\n \"legend\": \"rx\",\n \"refId\": \"A\"\n },\n {\n \"expr\": \"aliyun_acs_slb_dashboard_instance_packet_tx_average{instance_id=\\\"$instance_id\\\"}\",\n \"legend\": \"tx\",\n \"refId\": \"B\"\n }\n ],\n \"transformations\": [\n {\n \"id\": \"organize\",\n \"options\": {}\n }\n ],\n \"type\": \"timeseries\",\n \"version\": \"3.0.0\"\n },\n {\n \"custom\": {\n \"drawStyle\": \"lines\",\n \"fillOpacity\": 0.3,\n \"gradientMode\": \"opacity\",\n \"lineInterpolation\": \"smooth\",\n \"lineWidth\": 2,\n \"scaleDistribution\": {\n \"type\": \"linear\"\n },\n \"spanNulls\": false,\n \"stack\": \"off\"\n },\n \"datasourceCate\": \"prometheus\",\n \"datasourceValue\": \"${datasource}\",\n \"id\": \"92d4bf33-a96d-4e69-8c84-d02ad5ce3b5d\",\n \"layout\": {\n \"h\": 4,\n \"i\": \"11934f91-3570-4e8a-973b-2575abb8d877\",\n \"isResizable\": true,\n \"w\": 8,\n \"x\": 16,\n \"y\": 1\n },\n \"maxPerRow\": 4,\n \"name\": \"并发连接数(Count/s)\",\n \"options\": {\n \"legend\": {\n \"displayMode\": \"hidden\"\n },\n \"standardOptions\": {},\n \"thresholds\": {\n \"steps\": [\n {\n \"color\": \"#634CD9\",\n \"type\": \"base\",\n \"value\": null\n }\n ]\n },\n \"tooltip\": {\n \"mode\": \"all\",\n \"sort\": \"none\"\n }\n },\n \"targets\": [\n {\n \"expr\": \"aliyun_acs_slb_dashboard_instance_max_connection_average{instance_id=\\\"$instance_id\\\"}\",\n \"legend\": \"rx\",\n \"refId\": \"A\"\n }\n ],\n \"transformations\": [\n {\n \"id\": \"organize\",\n \"options\": {}\n }\n ],\n \"type\": \"timeseries\",\n \"version\": \"3.0.0\"\n },\n {\n \"custom\": {\n \"drawStyle\": \"lines\",\n \"fillOpacity\": 0.3,\n \"gradientMode\": \"opacity\",\n \"lineInterpolation\": \"smooth\",\n \"lineWidth\": 2,\n \"scaleDistribution\": {\n \"type\": \"linear\"\n },\n \"spanNulls\": false,\n \"stack\": \"off\"\n },\n \"datasourceCate\": \"prometheus\",\n \"datasourceValue\": \"${datasource}\",\n \"id\": \"9ff35053-b00e-421c-81e3-4d8b67a37248\",\n \"layout\": {\n \"h\": 4,\n \"i\": \"0b92d498-85ad-4329-b844-13f4ee56915f\",\n \"isResizable\": true,\n \"w\": 8,\n \"x\": 0,\n \"y\": 5\n },\n \"maxPerRow\": 4,\n \"name\": \"新建连接数(Count/s)\",\n \"options\": {\n \"legend\": {\n \"displayMode\": \"hidden\"\n },\n \"standardOptions\": {},\n \"thresholds\": {\n \"steps\": [\n {\n \"color\": \"#634CD9\",\n \"type\": \"base\",\n \"value\": null\n }\n ]\n },\n \"tooltip\": {\n \"mode\": \"all\",\n \"sort\": \"none\"\n }\n },\n \"targets\": [\n {\n \"expr\": \"aliyun_acs_slb_dashboard_instance_new_connection_average{instance_id=\\\"$instance_id\\\"}\",\n \"legend\": \"rx\",\n \"refId\": \"A\"\n },\n {\n \"expr\": \"aliyun_acs_slb_dashboard_instance_traffic_tx_average{instance_id=\\\"$instance_id\\\"}\",\n \"legend\": \"tx\",\n \"refId\": \"B\"\n }\n ],\n \"transformations\": [\n {\n \"id\": \"organize\",\n \"options\": {}\n }\n ],\n \"type\": \"timeseries\",\n \"version\": \"3.0.0\"\n },\n {\n \"custom\": {\n \"drawStyle\": \"lines\",\n \"fillOpacity\": 0.3,\n \"gradientMode\": \"opacity\",\n \"lineInterpolation\": \"smooth\",\n \"lineWidth\": 2,\n \"scaleDistribution\": {\n \"type\": \"linear\"\n },\n \"spanNulls\": false,\n \"stack\": \"off\"\n },\n \"datasourceCate\": \"prometheus\",\n \"datasourceValue\": \"${datasource}\",\n \"id\": \"6f583875-375e-4885-a471-592f8c01b889\",\n \"layout\": {\n \"h\": 4,\n \"i\": \"cbd6ed4c-65e1-4fe1-8653-e7c037cb5a4a\",\n \"isResizable\": true,\n \"w\": 8,\n \"x\": 8,\n \"y\": 5\n },\n \"maxPerRow\": 4,\n \"name\": \"丢弃流量(bits/s)\",\n \"options\": {\n \"legend\": {\n \"displayMode\": \"hidden\"\n },\n \"standardOptions\": {\n \"util\": \"bitsSI\"\n },\n \"thresholds\": {\n \"steps\": [\n {\n \"color\": \"#634CD9\",\n \"type\": \"base\",\n \"value\": null\n }\n ]\n },\n \"tooltip\": {\n \"mode\": \"all\",\n \"sort\": \"none\"\n }\n },\n \"targets\": [\n {\n \"expr\": \"aliyun_acs_slb_dashboard_instance_drop_traffic_rx_average{instance_id=\\\"$instance_id\\\"}\",\n \"legend\": \"rx\",\n \"refId\": \"A\"\n },\n {\n \"expr\": \"aliyun_acs_slb_dashboard_instance_drop_traffic_tx_average{instance_id=\\\"$instance_id\\\"}\",\n \"legend\": \"tx\",\n \"refId\": \"B\"\n }\n ],\n \"transformations\": [\n {\n \"id\": \"organize\",\n \"options\": {}\n }\n ],\n \"type\": \"timeseries\",\n \"version\": \"3.0.0\"\n },\n {\n \"custom\": {\n \"drawStyle\": \"lines\",\n \"fillOpacity\": 0.3,\n \"gradientMode\": \"opacity\",\n \"lineInterpolation\": \"smooth\",\n \"lineWidth\": 2,\n \"scaleDistribution\": {\n \"type\": \"linear\"\n },\n \"spanNulls\": false,\n \"stack\": \"off\"\n },\n \"datasourceCate\": \"prometheus\",\n \"datasourceValue\": \"${datasource}\",\n \"id\": \"16f91e54-cc25-4027-ad7f-f9a6bf2390e1\",\n \"layout\": {\n \"h\": 4,\n \"i\": \"e0183572-a2da-433a-bf1e-7ec5988528f7\",\n \"isResizable\": true,\n \"w\": 8,\n \"x\": 16,\n \"y\": 5\n },\n \"maxPerRow\": 4,\n \"name\": \"丢弃数据包数(Count/s)\",\n \"options\": {\n \"legend\": {\n \"displayMode\": \"hidden\"\n },\n \"standardOptions\": {\n \"util\": \"none\"\n },\n \"thresholds\": {\n \"steps\": [\n {\n \"color\": \"#634CD9\",\n \"type\": \"base\",\n \"value\": null\n }\n ]\n },\n \"tooltip\": {\n \"mode\": \"all\",\n \"sort\": \"none\"\n }\n },\n \"targets\": [\n {\n \"expr\": \"aliyun_acs_slb_dashboard_instance_drop_packet_rx_average{instance_id=\\\"$instance_id\\\"}\",\n \"legend\": \"rx\",\n \"refId\": \"A\"\n },\n {\n \"expr\": \"aliyun_acs_slb_dashboard_instance_drop_packet_tx_average{instance_id=\\\"$instance_id\\\"}\",\n \"legend\": \"tx\",\n \"refId\": \"B\"\n }\n ],\n \"transformations\": [\n {\n \"id\": \"organize\",\n \"options\": {}\n }\n ],\n \"type\": \"timeseries\",\n \"version\": \"3.0.0\"\n },\n {\n \"custom\": {\n \"drawStyle\": \"lines\",\n \"fillOpacity\": 0.3,\n \"gradientMode\": \"opacity\",\n \"lineInterpolation\": \"smooth\",\n \"lineWidth\": 2,\n \"scaleDistribution\": {\n \"type\": \"linear\"\n },\n \"spanNulls\": false,\n \"stack\": \"off\"\n },\n \"datasourceCate\": \"prometheus\",\n \"datasourceValue\": \"${datasource}\",\n \"id\": \"9692546e-31f0-4446-8b4c-6e82fa552aaa\",\n \"layout\": {\n \"h\": 4,\n \"i\": \"b680e559-3d8f-49bd-b3ea-bd39a9df9da3\",\n \"isResizable\": true,\n \"w\": 8,\n \"x\": 0,\n \"y\": 9\n },\n \"maxPerRow\": 4,\n \"name\": \"丢弃连接数(Count/s)\",\n \"options\": {\n \"legend\": {\n \"displayMode\": \"hidden\"\n },\n \"standardOptions\": {\n \"util\": \"none\"\n },\n \"thresholds\": {\n \"steps\": [\n {\n \"color\": \"#634CD9\",\n \"type\": \"base\",\n \"value\": null\n }\n ]\n },\n \"tooltip\": {\n \"mode\": \"all\",\n \"sort\": \"none\"\n }\n },\n \"targets\": [\n {\n \"expr\": \"aliyun_acs_slb_dashboard_instance_drop_connection_average{instance_id=\\\"$instance_id\\\"}\",\n \"legend\": \"\",\n \"refId\": \"A\"\n }\n ],\n \"transformations\": [\n {\n \"id\": \"organize\",\n \"options\": {}\n }\n ],\n \"type\": \"timeseries\",\n \"version\": \"3.0.0\"\n },\n {\n \"custom\": {\n \"drawStyle\": \"lines\",\n \"fillOpacity\": 0.3,\n \"gradientMode\": \"opacity\",\n \"lineInterpolation\": \"smooth\",\n \"lineWidth\": 2,\n \"scaleDistribution\": {\n \"type\": \"linear\"\n },\n \"spanNulls\": false,\n \"stack\": \"off\"\n },\n \"datasourceCate\": \"prometheus\",\n \"datasourceValue\": \"${datasource}\",\n \"id\": \"875a2ea6-a132-4238-9cbc-2d65dd1a4d21\",\n \"layout\": {\n \"h\": 4,\n \"i\": \"96bba171-a4ee-4433-8063-d22c19be9a27\",\n \"isResizable\": true,\n \"w\": 8,\n \"x\": 8,\n \"y\": 9\n },\n \"maxPerRow\": 4,\n \"name\": \"七层实例QPS(Count/s)\",\n \"options\": {\n \"legend\": {\n \"displayMode\": \"hidden\"\n },\n \"standardOptions\": {\n \"util\": \"none\"\n },\n \"thresholds\": {\n \"steps\": [\n {\n \"color\": \"#634CD9\",\n \"type\": \"base\",\n \"value\": null\n }\n ]\n },\n \"tooltip\": {\n \"mode\": \"all\",\n \"sort\": \"none\"\n }\n },\n \"targets\": [\n {\n \"expr\": \"aliyun_acs_slb_dashboard_instance_qps_average{instance_id=\\\"$instance_id\\\"}\",\n \"legend\": \"\",\n \"refId\": \"A\"\n }\n ],\n \"transformations\": [\n {\n \"id\": \"organize\",\n \"options\": {}\n }\n ],\n \"type\": \"timeseries\",\n \"version\": \"3.0.0\"\n },\n {\n \"custom\": {\n \"drawStyle\": \"lines\",\n \"fillOpacity\": 0.3,\n \"gradientMode\": \"opacity\",\n \"lineInterpolation\": \"smooth\",\n \"lineWidth\": 2,\n \"scaleDistribution\": {\n \"type\": \"linear\"\n },\n \"spanNulls\": false,\n \"stack\": \"off\"\n },\n \"datasourceCate\": \"prometheus\",\n \"datasourceValue\": \"${datasource}\",\n \"id\": \"d15301ff-7240-41ec-a98f-4d0c5b7d6489\",\n \"layout\": {\n \"h\": 4,\n \"i\": \"c38364ae-b8d6-4d9c-96a0-25be0df01c65\",\n \"isResizable\": true,\n \"w\": 8,\n \"x\": 16,\n \"y\": 9\n },\n \"maxPerRow\": 4,\n \"name\": \"七层实例QPS使用率(%)\",\n \"options\": {\n \"legend\": {\n \"displayMode\": \"hidden\"\n },\n \"standardOptions\": {\n \"util\": \"percent\"\n },\n \"thresholds\": {\n \"steps\": [\n {\n \"color\": \"#634CD9\",\n \"type\": \"base\",\n \"value\": null\n }\n ]\n },\n \"tooltip\": {\n \"mode\": \"all\",\n \"sort\": \"none\"\n }\n },\n \"targets\": [\n {\n \"expr\": \"aliyun_acs_slb_dashboard_instance_qps_utilization_average{instance_id=\\\"$instance_id\\\"}\",\n \"legend\": \"\",\n \"refId\": \"A\"\n }\n ],\n \"transformations\": [\n {\n \"id\": \"organize\",\n \"options\": {}\n }\n ],\n \"type\": \"timeseries\",\n \"version\": \"3.0.0\"\n },\n {\n \"custom\": {\n \"drawStyle\": \"lines\",\n \"fillOpacity\": 0.3,\n \"gradientMode\": \"opacity\",\n \"lineInterpolation\": \"smooth\",\n \"lineWidth\": 2,\n \"scaleDistribution\": {\n \"type\": \"linear\"\n },\n \"spanNulls\": false,\n \"stack\": \"off\"\n },\n \"datasourceCate\": \"prometheus\",\n \"datasourceValue\": \"${datasource}\",\n \"id\": \"323c5357-3ef6-49a3-8999-5f32138f58d6\",\n \"layout\": {\n \"h\": 4,\n \"i\": \"b624a147-a21e-4d43-b587-a0719d756be6\",\n \"isResizable\": true,\n \"w\": 8,\n \"x\": 0,\n \"y\": 13\n },\n \"maxPerRow\": 4,\n \"name\": \"实例新建连接数使用率(%)\",\n \"options\": {\n \"legend\": {\n \"displayMode\": \"hidden\"\n },\n \"standardOptions\": {\n \"util\": \"percent\"\n },\n \"thresholds\": {\n \"steps\": [\n {\n \"color\": \"#634CD9\",\n \"type\": \"base\",\n \"value\": null\n }\n ]\n },\n \"tooltip\": {\n \"mode\": \"all\",\n \"sort\": \"none\"\n }\n },\n \"targets\": [\n {\n \"expr\": \"aliyun_acs_slb_dashboard_instance_new_connection_utilization_average{instance_id=\\\"$instance_id\\\"}\",\n \"legend\": \"\",\n \"refId\": \"A\"\n }\n ],\n \"transformations\": [\n {\n \"id\": \"organize\",\n \"options\": {}\n }\n ],\n \"type\": \"timeseries\",\n \"version\": \"3.0.0\"\n },\n {\n \"custom\": {\n \"drawStyle\": \"lines\",\n \"fillOpacity\": 0.3,\n \"gradientMode\": \"opacity\",\n \"lineInterpolation\": \"smooth\",\n \"lineWidth\": 2,\n \"scaleDistribution\": {\n \"type\": \"linear\"\n },\n \"spanNulls\": false,\n \"stack\": \"off\"\n },\n \"datasourceCate\": \"prometheus\",\n \"datasourceValue\": \"${datasource}\",\n \"id\": \"cf66ca56-593c-49e5-b882-7cfc764a8bdd\",\n \"layout\": {\n \"h\": 4,\n \"i\": \"ea262a5c-cacf-46cf-8eb3-38c8dfe0c394\",\n \"isResizable\": true,\n \"w\": 8,\n \"x\": 8,\n \"y\": 13\n },\n \"maxPerRow\": 4,\n \"name\": \"实例最大连接数使用率(%)\",\n \"options\": {\n \"legend\": {\n \"displayMode\": \"hidden\"\n },\n \"standardOptions\": {\n \"util\": \"percent\"\n },\n \"thresholds\": {\n \"steps\": [\n {\n \"color\": \"#634CD9\",\n \"type\": \"base\",\n \"value\": null\n }\n ]\n },\n \"tooltip\": {\n \"mode\": \"all\",\n \"sort\": \"none\"\n }\n },\n \"targets\": [\n {\n \"expr\": \"aliyun_acs_slb_dashboard_instance_max_connection_utilization_average{instance_id=\\\"$instance_id\\\"}\",\n \"legend\": \"\",\n \"refId\": \"A\"\n }\n ],\n \"transformations\": [\n {\n \"id\": \"organize\",\n \"options\": {}\n }\n ],\n \"type\": \"timeseries\",\n \"version\": \"3.0.0\"\n },\n {\n \"custom\": {\n \"drawStyle\": \"lines\",\n \"fillOpacity\": 0.3,\n \"gradientMode\": \"opacity\",\n \"lineInterpolation\": \"smooth\",\n \"lineWidth\": 2,\n \"scaleDistribution\": {\n \"type\": \"linear\"\n },\n \"spanNulls\": false,\n \"stack\": \"off\"\n },\n \"datasourceCate\": \"prometheus\",\n \"datasourceValue\": \"${datasource}\",\n \"id\": \"50655f70-86f6-43bd-8482-27106c4ef241\",\n \"layout\": {\n \"h\": 4,\n \"i\": \"4ba3ee7b-f640-4390-a2fc-38acb8a1ccdd\",\n \"isResizable\": true,\n \"w\": 8,\n \"x\": 16,\n \"y\": 13\n },\n \"maxPerRow\": 4,\n \"name\": \"七层实例UpstreamRt(ms)\",\n \"options\": {\n \"legend\": {\n \"displayMode\": \"hidden\"\n },\n \"standardOptions\": {},\n \"thresholds\": {\n \"steps\": [\n {\n \"color\": \"#634CD9\",\n \"type\": \"base\",\n \"value\": null\n }\n ]\n },\n \"tooltip\": {\n \"mode\": \"all\",\n \"sort\": \"none\"\n }\n },\n \"targets\": [\n {\n \"expr\": \"aliyun_acs_slb_dashboard_instance_upstream_rt_average{instance_id=\\\"$instance_id\\\"}\",\n \"legend\": \"\",\n \"refId\": \"A\"\n }\n ],\n \"transformations\": [\n {\n \"id\": \"organize\",\n \"options\": {}\n }\n ],\n \"type\": \"timeseries\",\n \"version\": \"3.0.0\"\n },\n {\n \"custom\": {\n \"drawStyle\": \"lines\",\n \"fillOpacity\": 0.3,\n \"gradientMode\": \"opacity\",\n \"lineInterpolation\": \"smooth\",\n \"lineWidth\": 2,\n \"scaleDistribution\": {\n \"type\": \"linear\"\n },\n \"spanNulls\": false,\n \"stack\": \"off\"\n },\n \"datasourceCate\": \"prometheus\",\n \"datasourceValue\": \"${datasource}\",\n \"id\": \"adf69431-4342-41e2-8a41-ff45f32361a4\",\n \"layout\": {\n \"h\": 4,\n \"i\": \"316b1b16-217d-4c7b-bd6c-37efba237391\",\n \"isResizable\": true,\n \"w\": 8,\n \"x\": 0,\n \"y\": 17\n },\n \"maxPerRow\": 4,\n \"name\": \"7层协议实例Upstream状态码分布(Count/Second)\",\n \"options\": {\n \"legend\": {\n \"displayMode\": \"hidden\"\n },\n \"standardOptions\": {},\n \"thresholds\": {\n \"steps\": [\n {\n \"color\": \"#634CD9\",\n \"type\": \"base\",\n \"value\": null\n }\n ]\n },\n \"tooltip\": {\n \"mode\": \"all\",\n \"sort\": \"none\"\n }\n },\n \"targets\": [\n {\n \"expr\": \"aliyun_acs_slb_dashboard_instance_upstream_code4xx_average{instance_id=\\\"$instance_id\\\"}\",\n \"legend\": \"4xx\",\n \"refId\": \"A\"\n },\n {\n \"expr\": \"aliyun_acs_slb_dashboard_instance_upstream_code5xx_average{instance_id=\\\"$instance_id\\\"}\",\n \"legend\": \"5xx\",\n \"refId\": \"B\"\n }\n ],\n \"transformations\": [\n {\n \"id\": \"organize\",\n \"options\": {}\n }\n ],\n \"type\": \"timeseries\",\n \"version\": \"3.0.0\"\n },\n {\n \"custom\": {\n \"drawStyle\": \"lines\",\n \"fillOpacity\": 0.3,\n \"gradientMode\": \"opacity\",\n \"lineInterpolation\": \"smooth\",\n \"lineWidth\": 2,\n \"scaleDistribution\": {\n \"type\": \"linear\"\n },\n \"spanNulls\": false,\n \"stack\": \"off\"\n },\n \"datasourceCate\": \"prometheus\",\n \"datasourceValue\": \"${datasource}\",\n \"id\": \"46b8aab8-73ec-4010-a31b-69d1b03ccc96\",\n \"layout\": {\n \"h\": 4,\n \"i\": \"8b6e7b2c-f4d8-42e4-91cf-e5a830582bf6\",\n \"isResizable\": true,\n \"w\": 8,\n \"x\": 8,\n \"y\": 17\n },\n \"maxPerRow\": 4,\n \"name\": \"7层协议实例状态码分布(Count/Second)\",\n \"options\": {\n \"legend\": {\n \"displayMode\": \"hidden\"\n },\n \"standardOptions\": {},\n \"thresholds\": {\n \"steps\": [\n {\n \"color\": \"#634CD9\",\n \"type\": \"base\",\n \"value\": null\n }\n ]\n },\n \"tooltip\": {\n \"mode\": \"all\",\n \"sort\": \"none\"\n }\n },\n \"targets\": [\n {\n \"expr\": \"aliyun_acs_slb_dashboard_instance_status_code2xx_average{instance_id=\\\"$instance_id\\\"}\",\n \"legend\": \"2xx\",\n \"refId\": \"A\"\n },\n {\n \"expr\": \"aliyun_acs_slb_dashboard_instance_status_code3xx_average{instance_id=\\\"$instance_id\\\"}\",\n \"legend\": \"3xx\",\n \"refId\": \"B\"\n },\n {\n \"expr\": \"aliyun_acs_slb_dashboard_instance_status_code4xx_average{instance_id=\\\"$instance_id\\\"}\",\n \"legend\": \"4xx\",\n \"refId\": \"C\"\n },\n {\n \"expr\": \"aliyun_acs_slb_dashboard_instance_status_code5xx_average{instance_id=\\\"$instance_id\\\"}\",\n \"legend\": \"5xx\",\n \"refId\": \"D\"\n }\n ],\n \"transformations\": [\n {\n \"id\": \"organize\",\n \"options\": {}\n }\n ],\n \"type\": \"timeseries\",\n \"version\": \"3.0.0\"\n },\n {\n \"custom\": {\n \"drawStyle\": \"lines\",\n \"fillOpacity\": 0.3,\n \"gradientMode\": \"opacity\",\n \"lineInterpolation\": \"smooth\",\n \"lineWidth\": 2,\n \"scaleDistribution\": {\n \"type\": \"linear\"\n },\n \"spanNulls\": false,\n \"stack\": \"off\"\n },\n \"datasourceCate\": \"prometheus\",\n \"datasourceValue\": \"${datasource}\",\n \"id\": \"5345bb38-3349-4d28-90de-b86c12465ecd\",\n \"layout\": {\n \"h\": 4,\n \"i\": \"9fa233c3-d25f-4faf-b95a-e94f4b382dbc\",\n \"isResizable\": true,\n \"w\": 8,\n \"x\": 16,\n \"y\": 17\n },\n \"maxPerRow\": 4,\n \"name\": \"七层实例RT(ms)\",\n \"options\": {\n \"legend\": {\n \"displayMode\": \"hidden\"\n },\n \"standardOptions\": {},\n \"thresholds\": {\n \"steps\": [\n {\n \"color\": \"#634CD9\",\n \"type\": \"base\",\n \"value\": null\n }\n ]\n },\n \"tooltip\": {\n \"mode\": \"all\",\n \"sort\": \"none\"\n }\n },\n \"targets\": [\n {\n \"expr\": \"aliyun_acs_slb_dashboard_instance_rt_average{instance_id=\\\"$instance_id\\\"}\",\n \"legend\": \"\",\n \"refId\": \"A\"\n }\n ],\n \"transformations\": [\n {\n \"id\": \"organize\",\n \"options\": {}\n }\n ],\n \"type\": \"timeseries\",\n \"version\": \"3.0.0\"\n },\n {\n \"collapsed\": false,\n \"id\": \"e13cd648-4025-419e-a9cf-f5b714b4055e\",\n \"layout\": {\n \"h\": 1,\n \"i\": \"e13cd648-4025-419e-a9cf-f5b714b4055e\",\n \"isResizable\": false,\n \"w\": 24,\n \"x\": 0,\n \"y\": 21\n },\n \"name\": \"端口\",\n \"type\": \"row\"\n }\n ],\n \"var\": [\n {\n \"definition\": \"prometheus\",\n \"name\": \"datasource\",\n \"type\": \"datasource\"\n },\n {\n \"datasource\": {\n \"cate\": \"prometheus\",\n \"value\": \"${datasource}\"\n },\n \"definition\": \"label_values(aliyun_acs_slb_dashboard_rt_average, instance_id)\",\n \"name\": \"instance_id\",\n \"type\": \"query\"\n }\n ],\n \"version\": \"3.0.0\"\n },\n \"public\": 0,\n \"public_cate\": 0,\n \"bgids\": null,\n \"built_in\": 0,\n \"hide\": 0,\n \"uuid\": 1717556327140096000\n}"
},
{
"path": "integrations/AliYun/dashboards/waf.json",
"content": "{\n \"id\": 0,\n \"group_id\": 0,\n \"name\": \"阿里云WAF\",\n \"ident\": \"\",\n \"tags\": \"\",\n \"create_at\": 0,\n \"create_by\": \"\",\n \"update_at\": 0,\n \"update_by\": \"\",\n \"configs\": {\n \"panels\": [\n {\n \"custom\": {\n \"drawStyle\": \"lines\",\n \"fillOpacity\": 0.3,\n \"gradientMode\": \"opacity\",\n \"lineInterpolation\": \"smooth\",\n \"lineWidth\": 2,\n \"scaleDistribution\": {\n \"type\": \"linear\"\n },\n \"spanNulls\": false,\n \"stack\": \"off\"\n },\n \"datasourceCate\": \"prometheus\",\n \"datasourceValue\": \"${datasource}\",\n \"id\": \"ec46b990-faf5-4ed7-a791-bbac5df91636\",\n \"layout\": {\n \"h\": 4,\n \"i\": \"ec46b990-faf5-4ed7-a791-bbac5df91636\",\n \"isResizable\": true,\n \"w\": 12,\n \"x\": 0,\n \"y\": 0\n },\n \"maxPerRow\": 4,\n \"name\": \"4xx 环比率V3\",\n \"options\": {\n \"legend\": {\n \"displayMode\": \"hidden\"\n },\n \"standardOptions\": {},\n \"thresholds\": {\n \"steps\": [\n {\n \"color\": \"#634CD9\",\n \"type\": \"base\",\n \"value\": null\n }\n ]\n },\n \"tooltip\": {\n \"mode\": \"all\",\n \"sort\": \"none\"\n }\n },\n \"targets\": [\n {\n \"expr\": \"sum(aliyun_waf_4xx_ratio_wafv3_maximum{instance_id=~\\\"$instance_id\\\"}) by (instance_id)\",\n \"legend\": \"4xx 环比率V3\",\n \"refId\": \"A\"\n }\n ],\n \"type\": \"timeseries\",\n \"version\": \"2.0.0\"\n },\n {\n \"custom\": {\n \"drawStyle\": \"lines\",\n \"fillOpacity\": 0.3,\n \"gradientMode\": \"opacity\",\n \"lineInterpolation\": \"smooth\",\n \"lineWidth\": 2,\n \"scaleDistribution\": {\n \"type\": \"linear\"\n },\n \"spanNulls\": false,\n \"stack\": \"off\"\n },\n \"datasourceCate\": \"prometheus\",\n \"datasourceValue\": \"${datasource}\",\n \"id\": \"efc75e62-5e75-470d-b12b-a98ca44b268a\",\n \"layout\": {\n \"h\": 4,\n \"i\": \"584b5a3c-2b7a-4e11-bee5-c2ed8661933e\",\n \"isResizable\": true,\n \"w\": 12,\n \"x\": 12,\n \"y\": 0\n },\n \"maxPerRow\": 4,\n \"name\": \"5xx 环比率V3\",\n \"options\": {\n \"legend\": {\n \"displayMode\": \"hidden\"\n },\n \"standardOptions\": {},\n \"thresholds\": {\n \"steps\": [\n {\n \"color\": \"#634CD9\",\n \"type\": \"base\",\n \"value\": null\n }\n ]\n },\n \"tooltip\": {\n \"mode\": \"all\",\n \"sort\": \"none\"\n }\n },\n \"targets\": [\n {\n \"expr\": \"sum(aliyun_waf_5xx_ratio_wafv3_maximum{instance_id=~\\\"$instance_id\\\"}) by (instance_id)\",\n \"legend\": \"5xx 环比率V3\",\n \"refId\": \"A\"\n }\n ],\n \"type\": \"timeseries\",\n \"version\": \"2.0.0\"\n },\n {\n \"custom\": {\n \"drawStyle\": \"lines\",\n \"fillOpacity\": 0.3,\n \"gradientMode\": \"opacity\",\n \"lineInterpolation\": \"smooth\",\n \"lineWidth\": 2,\n \"scaleDistribution\": {\n \"type\": \"linear\"\n },\n \"spanNulls\": false,\n \"stack\": \"off\"\n },\n \"datasourceCate\": \"prometheus\",\n \"datasourceValue\": \"${datasource}\",\n \"id\": \"79aefa1b-5e50-4c0c-980d-e5523b859509\",\n \"layout\": {\n \"h\": 4,\n \"i\": \"fc875397-c1a4-4713-b564-09abf852bcf3\",\n \"isResizable\": true,\n \"w\": 12,\n \"x\": 0,\n \"y\": 4\n },\n \"maxPerRow\": 4,\n \"name\": \"4xx 环比率\",\n \"options\": {\n \"legend\": {\n \"displayMode\": \"hidden\"\n },\n \"standardOptions\": {},\n \"thresholds\": {\n \"steps\": [\n {\n \"color\": \"#634CD9\",\n \"type\": \"base\",\n \"value\": null\n }\n ]\n },\n \"tooltip\": {\n \"mode\": \"all\",\n \"sort\": \"none\"\n }\n },\n \"targets\": [\n {\n \"expr\": \"sum(aliyun_waf_4xx_ratio_maximum{instance_id=~\\\"$instance_id\\\"}) by (instance_id)\",\n \"legend\": \"4xx 环比率\",\n \"refId\": \"A\"\n }\n ],\n \"type\": \"timeseries\",\n \"version\": \"2.0.0\"\n },\n {\n \"custom\": {\n \"drawStyle\": \"lines\",\n \"fillOpacity\": 0.3,\n \"gradientMode\": \"opacity\",\n \"lineInterpolation\": \"smooth\",\n \"lineWidth\": 2,\n \"scaleDistribution\": {\n \"type\": \"linear\"\n },\n \"spanNulls\": false,\n \"stack\": \"off\"\n },\n \"datasourceCate\": \"prometheus\",\n \"datasourceValue\": \"${datasource}\",\n \"id\": \"60c211d4-d51a-4681-b23b-ec8cc5dce7fe\",\n \"layout\": {\n \"h\": 4,\n \"i\": \"946be0db-32a3-48ea-9473-88fdfa77201d\",\n \"isResizable\": true,\n \"w\": 12,\n \"x\": 12,\n \"y\": 4\n },\n \"maxPerRow\": 4,\n \"name\": \"5xx 环比率\",\n \"options\": {\n \"legend\": {\n \"displayMode\": \"hidden\"\n },\n \"standardOptions\": {},\n \"thresholds\": {\n \"steps\": [\n {\n \"color\": \"#634CD9\",\n \"type\": \"base\",\n \"value\": null\n }\n ]\n },\n \"tooltip\": {\n \"mode\": \"all\",\n \"sort\": \"none\"\n }\n },\n \"targets\": [\n {\n \"expr\": \"sum(aliyun_waf_5xx_ratio_maximum{instance_id=~\\\"$instance_id\\\"}) by (instance_id)\",\n \"legend\": \"5xx 环比率\",\n \"refId\": \"A\"\n }\n ],\n \"type\": \"timeseries\",\n \"version\": \"2.0.0\"\n },\n {\n \"custom\": {\n \"drawStyle\": \"lines\",\n \"fillOpacity\": 0.3,\n \"gradientMode\": \"opacity\",\n \"lineInterpolation\": \"smooth\",\n \"lineWidth\": 2,\n \"scaleDistribution\": {\n \"type\": \"linear\"\n },\n \"spanNulls\": false,\n \"stack\": \"off\"\n },\n \"datasourceCate\": \"prometheus\",\n \"datasourceValue\": \"${datasource}\",\n \"id\": \"0de9271c-7b19-4003-ae56-2e273b4b99c4\",\n \"layout\": {\n \"h\": 4,\n \"i\": \"0de9271c-7b19-4003-ae56-2e273b4b99c4\",\n \"isResizable\": true,\n \"w\": 12,\n \"x\": 0,\n \"y\": 8\n },\n \"maxPerRow\": 4,\n \"name\": \"QPS环比增长率\",\n \"options\": {\n \"legend\": {\n \"displayMode\": \"hidden\"\n },\n \"standardOptions\": {},\n \"thresholds\": {\n \"steps\": [\n {\n \"color\": \"#634CD9\",\n \"type\": \"base\",\n \"value\": null\n }\n ]\n },\n \"tooltip\": {\n \"mode\": \"all\",\n \"sort\": \"none\"\n }\n },\n \"targets\": [\n {\n \"expr\": \"sum(aliyun_waf_qps_ratio_maximum{instance_id=~\\\"$instance_id\\\"}) by (instance_id)\",\n \"legend\": \"{{instance_id}}QPS 环比增长率\",\n \"refId\": \"A\"\n }\n ],\n \"type\": \"timeseries\",\n \"version\": \"2.0.0\"\n },\n {\n \"custom\": {\n \"drawStyle\": \"lines\",\n \"fillOpacity\": 0.3,\n \"gradientMode\": \"opacity\",\n \"lineInterpolation\": \"smooth\",\n \"lineWidth\": 2,\n \"scaleDistribution\": {\n \"type\": \"linear\"\n },\n \"spanNulls\": false,\n \"stack\": \"off\"\n },\n \"datasourceCate\": \"prometheus\",\n \"datasourceValue\": \"${datasource}\",\n \"id\": \"ccf2ffc1-6f22-4a13-b795-68072c077e1f\",\n \"layout\": {\n \"h\": 4,\n \"i\": \"d0320716-f704-4b6e-8671-b58fb77a5d7c\",\n \"isResizable\": true,\n \"w\": 12,\n \"x\": 12,\n \"y\": 8\n },\n \"maxPerRow\": 4,\n \"name\": \"QPS环比下降率\",\n \"options\": {\n \"legend\": {\n \"displayMode\": \"hidden\"\n },\n \"standardOptions\": {},\n \"thresholds\": {\n \"steps\": [\n {\n \"color\": \"#634CD9\",\n \"type\": \"base\",\n \"value\": null\n }\n ]\n },\n \"tooltip\": {\n \"mode\": \"all\",\n \"sort\": \"none\"\n }\n },\n \"targets\": [\n {\n \"expr\": \"sum(aliyun_waf_qps_ratio_down_maximum{instance_id=~\\\"$instance_id\\\"}) by (instance_id)\",\n \"legend\": \"{{instance_id}}QPS 环比下降率\",\n \"refId\": \"A\"\n }\n ],\n \"type\": \"timeseries\",\n \"version\": \"2.0.0\"\n }\n ],\n \"var\": [\n {\n \"definition\": \"prometheus\",\n \"name\": \"datasource\",\n \"type\": \"datasource\"\n },\n {\n \"allOption\": true,\n \"datasource\": {\n \"cate\": \"prometheus\",\n \"value\": \"${datasource}\"\n },\n \"definition\": \"label_values(aliyun_waf_qps_ratio_maximum,instance_id)\",\n \"multi\": true,\n \"name\": \"instance_id\",\n \"type\": \"query\"\n }\n ],\n \"version\": \"3.0.0\"\n },\n \"public\": 0,\n \"public_cate\": 0,\n \"bgids\": null,\n \"built_in\": 0,\n \"hide\": 0,\n \"uuid\": 1717556327142143000\n}"
},
{
"path": "integrations/AliYun/markdown/README.md",
"content": "# aliyun plugin\n\n## 简介\n\n使用[categraf](https://github.com/flashcatcloud/categraf)中[aliyun](https://github.com/flashcatcloud/categraf/tree/main/inputs/aliyun)插件拉取阿里云云监控的数据(通过 OpenAPI)。\n\n## 授权\n\n获取凭证 [https://usercenter.console.aliyun.com/#/manage/ak](https://usercenter.console.aliyun.com/#/manage/ak)\nRAM 用户授权。RAM 用户调用云监控 API 前,需要所属的阿里云账号将权限策略授予对应的 RAM 用户,参见 [RAM 用户权限](https://help.aliyun.com/document_detail/43170.html?spm=a2c4g.11186623.0.0.30c841feqsoAAn)。\n可以在 [授权页面](https://ram.console.aliyun.com/permissions) 新增授权,选择对应的用户,授予云监控只读权限 `AliyunCloudMonitorReadOnlyAccess`, 并为授予权限的用户创建accessKey 即可。\n\n## Categraf中conf/input.aliyun/cloud.toml配置文件:\n\n```toml\n# # categraf采集周期,阿里云指标的粒度一般是60秒,建议设置不要少于60秒\ninterval = 120\n[[instances]]\n## 阿里云资源所处的region\n## endpoint region 参考 https://help.aliyun.com/document_detail/28616.html#section-72p-xhs-6qt\nregion=\"cn-beijing\"\nendpoint=\"metrics.cn-hangzhou.aliyuncs.com\"\n## 填入你的access_key_id\naccess_key_id=\"\"\n## 填入你的access_key_secret\naccess_key_secret=\"\"\n\n## 可能无法获取当前最新指标,这个指标是指监控指标的截止时间距离现在多久\ndelay=\"50m\"\n## 阿里云指标的最小粒度,60s 是推荐值,再小了部分指标不支持\nperiod=\"60s\"\n## 指标所属的namespace ,为空,则表示所有空间指标都要采集\n## namespace 参考 https://help.aliyun.com/document_detail/163515.htm?spm=a2c4g.11186623.0.0.44d65c58mhgNw3\nnamespaces=[\"acs_ecs_dashboard\"]\n## 过滤某个namespace下的一个或多个指标\n## metric name 参考 https://help.aliyun.com/document_detail/163515.htm?spm=a2c4g.11186623.0.0.401d15c73Z0dZh\n## 参考页面中的Metric Id 填入下面的metricName ,页面中包含中文的Metric Name对应接口中的Description\n[[instances.metric_filters]]\nnamespace=\"\"\nmetric_names=[\"cpu_cores\",\"vm.TcpCount\", \"cpu_idle\"]\n\n# 阿里云查询指标接口的QPS是50, 这里默认设置为一半\nratelimit=25\n# 查询指定namesapce指标后, namespace/metric_name等meta信息会缓存起来,catch_ttl 是指标的缓存时间\ncatch_ttl=\"1h\"\n# 每次请求阿里云endpoint的超时时间\ntimeout=\"5s\"\n```\n\n## 效果图\n\n### aliyun ecs\n\n\n\n### aliyun rds\n\n\n\n### aliyun redis\n\n\n\n### aliyun slb\n\n\n\n### aliyun waf\n\n\n"
},
{
"path": "integrations/AppDynamics/collect/appdynamics/app.toml",
"content": "#interval=15s\n\n[[instances]]\n#url_base = \"http://{{.ip}}:{{.port}}/a.json?metric-path={{.metric_path}}&time-range-type=BETWEEN_TIMES&start-time={{.start_time}}&end-time={{.end_time}}&output=JSON\"\n#url_vars = [\n# { ip=\"127.0.0.1\", port=\"8090\", application=\"cms\", metric_path=\"Application Infrastructure Performance|AdminServer|Individual Nodes|xxxxx|Agent|App|Availability\", start_time=\"$START_TIME\", end_time=\"$END_TIME\"},\n#]\n\n# # 指定url_vars中哪些key 作为最终的label附加\n# url_var_label_keys= []\n\n# #从url中提取变量\n# url_label_key=\"instance\"\n# url_label_value=\"{{.Host}}\"\n# #自定义 http header\n#headers = { Authorization=\"\", X-Forwarded-For=\"\", Host=\"\"}\n# #每次请求的超时时间\n#timeout=\"5s\"\n\n# # precision of start-time and end-time\n#precision=\"ms\"\n\n## basic auth\n#username=\"\"\n#password=\"\"\n\n# # endtime = now - delay\n#delay = \"1m\"\n# # starttime = now - delay - period = endtime - period\n#period = \"1m\"\n\n# # 想要添加的额外label\n#labels = {application=\"cms\"}\n# # 从返回中过滤哪些指标\nfilters = [\"current\", \"max\", \"min\", \"value\",\"sum\", \"count\"]\n\n# # 限制并发请求量, 最多同时有多少个请求\n# # 默认范围(0,100)\n#request_inflight= 10\n## 强制开启100以上的并发请求 (不推荐)\n# force_request_inflight = 1000\n\n# # 是否开启 tls\n# use_tls = true\n# # tls 最小版本\n## tls_min_version = \"1.2\"\n# # tls ca证书路径\n## tls_ca = \"/etc/categraf/ca.pem\"\n# # tls cert 路径\n## tls_cert = \"/etc/categraf/cert.pem\"\n# # tls key 路径\n## tls_key = \"/etc/categraf/key.pem\"\n# # 是否跳过证书验证\n## insecure_skip_verify = true\n"
},
{
"path": "integrations/AppDynamics/markdown/README.md",
"content": "## AppDynamics\n\nAppDynamics 采集插件, 采集 AppDynamics 数据\n\n## Configuration\n\n```toml\n#interval=15s\n\n[[instances]]\n#url_base = \"http://{{.ip}}:{{.port}}/a.json?metric-path={{.metric_path}}&time-range-type=BETWEEN_TIMES&start-time={{.start_time}}&end-time={{.end_time}}&output=JSON\"\n#url_vars = [\n# { ip=\"127.0.0.1\", port=\"8090\", application=\"cms\", metric_path=\"Application Infrastructure Performance|AdminServer|Individual Nodes|xxxxx|Agent|App|Availability\", start_time=\"$START_TIME\", end_time=\"$END_TIME\"},\n#]\n\n# # 指定url_vars中哪些key 作为最终的label附加\n# url_var_label_keys= []\n\n# #从url中提取变量\n# url_label_key=\"instance\"\n# url_label_value=\"{{.Host}}\"\n# #自定义 http header\n#headers = { Authorization=\"\", X-Forwarded-For=\"\", Host=\"\"}\n# #每次请求的超时时间\n#timeout=\"5s\"\n\n# # precision of start-time and end-time\n#precision=\"ms\"\n\n## basic auth\n#username=\"\"\n#password=\"\"\n\n# # endtime = now - delay\n#delay = \"1m\"\n# # starttime = now - delay - period = endtime - period\n#period = \"1m\"\n\n# # 想要添加的额外label\n#labels = {application=\"cms\"}\n# # 从返回中过滤哪些指标\nfilters = [\"current\", \"max\", \"min\", \"value\",\"sum\", \"count\"]\n\n# # 限制并发请求量, 最多同时有多少个请求\n# # 默认范围(0,100)\n#request_inflight= 10\n## 强制开启100以上的并发请求 (不推荐)\n# force_request_inflight = 1000\n\n# # 是否开启 tls\n# use_tls = true\n# # tls 最小版本\n## tls_min_version = \"1.2\"\n# # tls ca证书路径\n## tls_ca = \"/etc/categraf/ca.pem\"\n# # tls cert 路径\n## tls_cert = \"/etc/categraf/cert.pem\"\n# # tls key 路径\n## tls_key = \"/etc/categraf/key.pem\"\n# # 是否跳过证书验证\n## insecure_skip_verify = true\n\n```"
},
{
"path": "integrations/AutoMQ/alerts/常用告警规则.json",
"content": "[\n {\n \"id\": 0,\n \"group_id\": 0,\n \"cate\": \"prometheus\",\n \"datasource_ids\": [\n 0\n ],\n \"cluster\": \"\",\n \"name\": \"Kafka active controller 数目异常\",\n \"note\": \"\",\n \"prod\": \"metric\",\n \"algorithm\": \"\",\n \"algo_params\": null,\n \"delay\": 0,\n \"severity\": 0,\n \"severities\": [\n 2\n ],\n \"disabled\": 0,\n \"prom_for_duration\": 60,\n \"prom_ql\": \"\",\n \"rule_config\": {\n \"queries\": [\n {\n \"prom_ql\": \"sum(kafka_controller_active_count) by (job) != 1\",\n \"severity\": 2\n }\n ]\n },\n \"prom_eval_interval\": 30,\n \"enable_stime\": \"00:00\",\n \"enable_stimes\": [\n \"00:00\"\n ],\n \"enable_etime\": \"00:00\",\n \"enable_etimes\": [\n \"00:00\"\n ],\n \"enable_days_of_week\": [\n \"0\",\n \"1\",\n \"2\",\n \"3\",\n \"4\",\n \"5\",\n \"6\"\n ],\n \"enable_days_of_weeks\": [\n [\n \"0\",\n \"1\",\n \"2\",\n \"3\",\n \"4\",\n \"5\",\n \"6\"\n ]\n ],\n \"enable_in_bg\": 0,\n \"notify_recovered\": 1,\n \"notify_channels\": [\n \"email\"\n ],\n \"notify_groups_obj\": null,\n \"notify_groups\": null,\n \"notify_repeat_step\": 60,\n \"notify_max_number\": 0,\n \"recover_duration\": 0,\n \"callbacks\": [],\n \"runbook_url\": \"\",\n \"append_tags\": [],\n \"annotations\": {},\n \"extra_config\": null,\n \"create_at\": 0,\n \"create_by\": \"\",\n \"update_at\": 0,\n \"update_by\": \"\",\n \"uuid\": 1717556327150310000\n },\n {\n \"id\": 0,\n \"group_id\": 0,\n \"cate\": \"prometheus\",\n \"datasource_ids\": [\n 0\n ],\n \"cluster\": \"\",\n \"name\": \"Kafka Broker 连接数过多\",\n \"note\": \"\",\n \"prod\": \"metric\",\n \"algorithm\": \"\",\n \"algo_params\": null,\n \"delay\": 0,\n \"severity\": 0,\n \"severities\": [\n 2\n ],\n \"disabled\": 0,\n \"prom_for_duration\": 60,\n \"prom_ql\": \"\",\n \"rule_config\": {\n \"queries\": [\n {\n \"keys\": {\n \"labelKey\": \"\",\n \"valueKey\": \"\"\n },\n \"prom_ql\": \"sum(kafka_server_connection_count) by (job, instance) \\u003e 1000\",\n \"severity\": 2\n }\n ]\n },\n \"prom_eval_interval\": 30,\n \"enable_stime\": \"00:00\",\n \"enable_stimes\": [\n \"00:00\"\n ],\n \"enable_etime\": \"00:00\",\n \"enable_etimes\": [\n \"00:00\"\n ],\n \"enable_days_of_week\": [\n \"0\",\n \"1\",\n \"2\",\n \"3\",\n \"4\",\n \"5\",\n \"6\"\n ],\n \"enable_days_of_weeks\": [\n [\n \"0\",\n \"1\",\n \"2\",\n \"3\",\n \"4\",\n \"5\",\n \"6\"\n ]\n ],\n \"enable_in_bg\": 0,\n \"notify_recovered\": 1,\n \"notify_channels\": [\n \"email\"\n ],\n \"notify_groups_obj\": null,\n \"notify_groups\": null,\n \"notify_repeat_step\": 60,\n \"notify_max_number\": 0,\n \"recover_duration\": 0,\n \"callbacks\": [],\n \"runbook_url\": \"\",\n \"append_tags\": [],\n \"annotations\": {},\n \"extra_config\": null,\n \"create_at\": 0,\n \"create_by\": \"\",\n \"update_at\": 0,\n \"update_by\": \"\",\n \"uuid\": 1717556327151102000\n },\n {\n \"id\": 0,\n \"group_id\": 0,\n \"cate\": \"prometheus\",\n \"datasource_ids\": [\n 0\n ],\n \"cluster\": \"\",\n \"name\": \"Kafka Fetch 请求高延迟\",\n \"note\": \"\",\n \"prod\": \"metric\",\n \"algorithm\": \"\",\n \"algo_params\": null,\n \"delay\": 0,\n \"severity\": 0,\n \"severities\": [\n 2\n ],\n \"disabled\": 0,\n \"prom_for_duration\": 60,\n \"prom_ql\": \"\",\n \"rule_config\": {\n \"queries\": [\n {\n \"keys\": {\n \"labelKey\": \"\",\n \"valueKey\": \"\"\n },\n \"prom_ql\": \"kafka_request_time_99p_milliseconds{type=\\\"Fetch\\\"} \\u003e 1000\",\n \"severity\": 2\n }\n ]\n },\n \"prom_eval_interval\": 30,\n \"enable_stime\": \"00:00\",\n \"enable_stimes\": [\n \"00:00\"\n ],\n \"enable_etime\": \"00:00\",\n \"enable_etimes\": [\n \"00:00\"\n ],\n \"enable_days_of_week\": [\n \"0\",\n \"1\",\n \"2\",\n \"3\",\n \"4\",\n \"5\",\n \"6\"\n ],\n \"enable_days_of_weeks\": [\n [\n \"0\",\n \"1\",\n \"2\",\n \"3\",\n \"4\",\n \"5\",\n \"6\"\n ]\n ],\n \"enable_in_bg\": 0,\n \"notify_recovered\": 1,\n \"notify_channels\": [\n \"email\"\n ],\n \"notify_groups_obj\": null,\n \"notify_groups\": null,\n \"notify_repeat_step\": 60,\n \"notify_max_number\": 0,\n \"recover_duration\": 0,\n \"callbacks\": [],\n \"runbook_url\": \"\",\n \"append_tags\": [],\n \"annotations\": {},\n \"extra_config\": null,\n \"create_at\": 0,\n \"create_by\": \"\",\n \"update_at\": 0,\n \"update_by\": \"\",\n \"uuid\": 1717556327151678000\n },\n {\n \"id\": 0,\n \"group_id\": 0,\n \"cate\": \"prometheus\",\n \"datasource_ids\": [\n 0\n ],\n \"cluster\": \"\",\n \"name\": \"Kafka Partition 数量过多\",\n \"note\": \"\",\n \"prod\": \"metric\",\n \"algorithm\": \"\",\n \"algo_params\": null,\n \"delay\": 0,\n \"severity\": 0,\n \"severities\": [\n 1\n ],\n \"disabled\": 0,\n \"prom_for_duration\": 60,\n \"prom_ql\": \"\",\n \"rule_config\": {\n \"queries\": [\n {\n \"keys\": {\n \"labelKey\": \"\",\n \"valueKey\": \"\"\n },\n \"prom_ql\": \"kafka_partition_count \\u003e 5000\",\n \"severity\": 1\n }\n ]\n },\n \"prom_eval_interval\": 30,\n \"enable_stime\": \"00:00\",\n \"enable_stimes\": [\n \"00:00\"\n ],\n \"enable_etime\": \"00:00\",\n \"enable_etimes\": [\n \"00:00\"\n ],\n \"enable_days_of_week\": [\n \"0\",\n \"1\",\n \"2\",\n \"3\",\n \"4\",\n \"5\",\n \"6\"\n ],\n \"enable_days_of_weeks\": [\n [\n \"0\",\n \"1\",\n \"2\",\n \"3\",\n \"4\",\n \"5\",\n \"6\"\n ]\n ],\n \"enable_in_bg\": 0,\n \"notify_recovered\": 1,\n \"notify_channels\": [\n \"email\"\n ],\n \"notify_groups_obj\": null,\n \"notify_groups\": null,\n \"notify_repeat_step\": 60,\n \"notify_max_number\": 0,\n \"recover_duration\": 0,\n \"callbacks\": [],\n \"runbook_url\": \"\",\n \"append_tags\": [],\n \"annotations\": {},\n \"extra_config\": null,\n \"create_at\": 0,\n \"create_by\": \"\",\n \"update_at\": 0,\n \"update_by\": \"\",\n \"uuid\": 1717556327152312000\n },\n {\n \"id\": 0,\n \"group_id\": 0,\n \"cate\": \"prometheus\",\n \"datasource_ids\": [\n 0\n ],\n \"cluster\": \"\",\n \"name\": \"Kafka Produce 请求高延迟\",\n \"note\": \"\",\n \"prod\": \"metric\",\n \"algorithm\": \"\",\n \"algo_params\": null,\n \"delay\": 0,\n \"severity\": 0,\n \"severities\": [\n 2\n ],\n \"disabled\": 0,\n \"prom_for_duration\": 60,\n \"prom_ql\": \"\",\n \"rule_config\": {\n \"queries\": [\n {\n \"keys\": {\n \"labelKey\": \"\",\n \"valueKey\": \"\"\n },\n \"prom_ql\": \"kafka_request_time_99p_milliseconds{type=\\\"Produce\\\"} \\u003e 100\",\n \"severity\": 2\n }\n ]\n },\n \"prom_eval_interval\": 30,\n \"enable_stime\": \"00:00\",\n \"enable_stimes\": [\n \"00:00\"\n ],\n \"enable_etime\": \"00:00\",\n \"enable_etimes\": [\n \"00:00\"\n ],\n \"enable_days_of_week\": [\n \"0\",\n \"1\",\n \"2\",\n \"3\",\n \"4\",\n \"5\",\n \"6\"\n ],\n \"enable_days_of_weeks\": [\n [\n \"0\",\n \"1\",\n \"2\",\n \"3\",\n \"4\",\n \"5\",\n \"6\"\n ]\n ],\n \"enable_in_bg\": 0,\n \"notify_recovered\": 1,\n \"notify_channels\": [\n \"email\"\n ],\n \"notify_groups_obj\": null,\n \"notify_groups\": null,\n \"notify_repeat_step\": 60,\n \"notify_max_number\": 0,\n \"recover_duration\": 0,\n \"callbacks\": [],\n \"runbook_url\": \"\",\n \"append_tags\": [],\n \"annotations\": {},\n \"extra_config\": null,\n \"create_at\": 0,\n \"create_by\": \"\",\n \"update_at\": 0,\n \"update_by\": \"\",\n \"uuid\": 1717556327152981000\n },\n {\n \"id\": 0,\n \"group_id\": 0,\n \"cate\": \"prometheus\",\n \"datasource_ids\": [\n 0\n ],\n \"cluster\": \"\",\n \"name\": \"Kafka 每秒 Fetch 请求超过1000\",\n \"note\": \"\",\n \"prod\": \"metric\",\n \"algorithm\": \"\",\n \"algo_params\": null,\n \"delay\": 0,\n \"severity\": 0,\n \"severities\": [\n 2\n ],\n \"disabled\": 0,\n \"prom_for_duration\": 60,\n \"prom_ql\": \"\",\n \"rule_config\": {\n \"queries\": [\n {\n \"keys\": {\n \"labelKey\": \"\",\n \"valueKey\": \"\"\n },\n \"prom_ql\": \"sum(rate(kafka_request_count_total{type=\\\"Fetch\\\"}[1m])) by (job, instance) \\u003e 1000\",\n \"severity\": 2\n }\n ]\n },\n \"prom_eval_interval\": 30,\n \"enable_stime\": \"00:00\",\n \"enable_stimes\": [\n \"00:00\"\n ],\n \"enable_etime\": \"00:00\",\n \"enable_etimes\": [\n \"00:00\"\n ],\n \"enable_days_of_week\": [\n \"0\",\n \"1\",\n \"2\",\n \"3\",\n \"4\",\n \"5\",\n \"6\"\n ],\n \"enable_days_of_weeks\": [\n [\n \"0\",\n \"1\",\n \"2\",\n \"3\",\n \"4\",\n \"5\",\n \"6\"\n ]\n ],\n \"enable_in_bg\": 0,\n \"notify_recovered\": 1,\n \"notify_channels\": [\n \"email\"\n ],\n \"notify_groups_obj\": null,\n \"notify_groups\": null,\n \"notify_repeat_step\": 60,\n \"notify_max_number\": 0,\n \"recover_duration\": 0,\n \"callbacks\": [],\n \"runbook_url\": \"\",\n \"append_tags\": [],\n \"annotations\": {},\n \"extra_config\": null,\n \"create_at\": 0,\n \"create_by\": \"\",\n \"update_at\": 0,\n \"update_by\": \"\",\n \"uuid\": 1717556327153589000\n },\n {\n \"id\": 0,\n \"group_id\": 0,\n \"cate\": \"prometheus\",\n \"datasource_ids\": [\n 0\n ],\n \"cluster\": \"\",\n \"name\": \"Kafka 每秒 Produce 请求超过1000\",\n \"note\": \"\",\n \"prod\": \"metric\",\n \"algorithm\": \"\",\n \"algo_params\": null,\n \"delay\": 0,\n \"severity\": 0,\n \"severities\": [\n 2\n ],\n \"disabled\": 0,\n \"prom_for_duration\": 60,\n \"prom_ql\": \"\",\n \"rule_config\": {\n \"queries\": [\n {\n \"keys\": {\n \"labelKey\": \"\",\n \"valueKey\": \"\"\n },\n \"prom_ql\": \"sum(rate(kafka_request_count_total{type=\\\"Produce\\\"}[1m])) by (job, instance) \\u003e 1000\",\n \"severity\": 2\n }\n ]\n },\n \"prom_eval_interval\": 30,\n \"enable_stime\": \"00:00\",\n \"enable_stimes\": [\n \"00:00\"\n ],\n \"enable_etime\": \"00:00\",\n \"enable_etimes\": [\n \"00:00\"\n ],\n \"enable_days_of_week\": [\n \"0\",\n \"1\",\n \"2\",\n \"3\",\n \"4\",\n \"5\",\n \"6\"\n ],\n \"enable_days_of_weeks\": [\n [\n \"0\",\n \"1\",\n \"2\",\n \"3\",\n \"4\",\n \"5\",\n \"6\"\n ]\n ],\n \"enable_in_bg\": 0,\n \"notify_recovered\": 1,\n \"notify_channels\": [\n \"email\"\n ],\n \"notify_groups_obj\": null,\n \"notify_groups\": null,\n \"notify_repeat_step\": 60,\n \"notify_max_number\": 0,\n \"recover_duration\": 0,\n \"callbacks\": [],\n \"runbook_url\": \"\",\n \"append_tags\": [],\n \"annotations\": {},\n \"extra_config\": null,\n \"create_at\": 0,\n \"create_by\": \"\",\n \"update_at\": 0,\n \"update_by\": \"\",\n \"uuid\": 1717556327154308000\n },\n {\n \"id\": 0,\n \"group_id\": 0,\n \"cate\": \"prometheus\",\n \"datasource_ids\": [\n 0\n ],\n \"cluster\": \"\",\n \"name\": \"Kafka 消费延迟较高\",\n \"note\": \"\",\n \"prod\": \"metric\",\n \"algorithm\": \"\",\n \"algo_params\": null,\n \"delay\": 0,\n \"severity\": 0,\n \"severities\": [\n 2\n ],\n \"disabled\": 0,\n \"prom_for_duration\": 60,\n \"prom_ql\": \"\",\n \"rule_config\": {\n \"queries\": [\n {\n \"keys\": {\n \"labelKey\": \"\",\n \"valueKey\": \"\"\n },\n \"prom_ql\": \"sum(max(kafka_log_end_offset) by (job, topic, partition)) by (job, topic)\\n- on (topic) group_left (consumer_group)\\nsum(max(kafka_group_commit_offset) by (job, consumer_group, topic, partition)) by (job, consumer_group, topic) \\u003e 10000\",\n \"severity\": 2\n }\n ]\n },\n \"prom_eval_interval\": 30,\n \"enable_stime\": \"00:00\",\n \"enable_stimes\": [\n \"00:00\"\n ],\n \"enable_etime\": \"00:00\",\n \"enable_etimes\": [\n \"00:00\"\n ],\n \"enable_days_of_week\": [\n \"0\",\n \"1\",\n \"2\",\n \"3\",\n \"4\",\n \"5\",\n \"6\"\n ],\n \"enable_days_of_weeks\": [\n [\n \"0\",\n \"1\",\n \"2\",\n \"3\",\n \"4\",\n \"5\",\n \"6\"\n ]\n ],\n \"enable_in_bg\": 0,\n \"notify_recovered\": 1,\n \"notify_channels\": [\n \"email\"\n ],\n \"notify_groups_obj\": null,\n \"notify_groups\": null,\n \"notify_repeat_step\": 60,\n \"notify_max_number\": 0,\n \"recover_duration\": 0,\n \"callbacks\": [],\n \"runbook_url\": \"\",\n \"append_tags\": [],\n \"annotations\": {},\n \"extra_config\": null,\n \"create_at\": 0,\n \"create_by\": \"\",\n \"update_at\": 0,\n \"update_by\": \"\",\n \"uuid\": 1717556327154879000\n },\n {\n \"id\": 0,\n \"group_id\": 0,\n \"cate\": \"prometheus\",\n \"datasource_ids\": [\n 0\n ],\n \"cluster\": \"\",\n \"name\": \"Kafka 请求 S3 失败率较高\",\n \"note\": \"\",\n \"prod\": \"metric\",\n \"algorithm\": \"\",\n \"algo_params\": null,\n \"delay\": 0,\n \"severity\": 0,\n \"severities\": [\n 1\n ],\n \"disabled\": 0,\n \"prom_for_duration\": 60,\n \"prom_ql\": \"\",\n \"rule_config\": {\n \"queries\": [\n {\n \"keys\": {\n \"labelKey\": \"\",\n \"valueKey\": \"\"\n },\n \"prom_ql\": \"sum(rate(kafka_stream_operation_latency_count{operation_type=\\\"S3Request\\\", status=\\\"failed\\\"}[1m])) by (job, operation_name) \\u003e 0.1\",\n \"severity\": 1\n }\n ]\n },\n \"prom_eval_interval\": 30,\n \"enable_stime\": \"00:00\",\n \"enable_stimes\": [\n \"00:00\"\n ],\n \"enable_etime\": \"00:00\",\n \"enable_etimes\": [\n \"00:00\"\n ],\n \"enable_days_of_week\": [\n \"0\",\n \"1\",\n \"2\",\n \"3\",\n \"4\",\n \"5\",\n \"6\"\n ],\n \"enable_days_of_weeks\": [\n [\n \"0\",\n \"1\",\n \"2\",\n \"3\",\n \"4\",\n \"5\",\n \"6\"\n ]\n ],\n \"enable_in_bg\": 0,\n \"notify_recovered\": 1,\n \"notify_channels\": [\n \"email\"\n ],\n \"notify_groups_obj\": null,\n \"notify_groups\": null,\n \"notify_repeat_step\": 60,\n \"notify_max_number\": 0,\n \"recover_duration\": 0,\n \"callbacks\": [],\n \"runbook_url\": \"\",\n \"append_tags\": [],\n \"annotations\": {},\n \"extra_config\": null,\n \"create_at\": 0,\n \"create_by\": \"\",\n \"update_at\": 0,\n \"update_by\": \"\",\n \"uuid\": 1717556327155698000\n },\n {\n \"id\": 0,\n \"group_id\": 0,\n \"cate\": \"prometheus\",\n \"datasource_ids\": [\n 0\n ],\n \"cluster\": \"\",\n \"name\": \"Kafka 请求错误率过高\",\n \"note\": \"\",\n \"prod\": \"metric\",\n \"algorithm\": \"\",\n \"algo_params\": null,\n \"delay\": 0,\n \"severity\": 0,\n \"severities\": [\n 1\n ],\n \"disabled\": 0,\n \"prom_for_duration\": 60,\n \"prom_ql\": \"\",\n \"rule_config\": {\n \"queries\": [\n {\n \"keys\": {\n \"labelKey\": \"\",\n \"valueKey\": \"\"\n },\n \"prom_ql\": \"sum(rate(kafka_request_error_count_total{error!=\\\"NONE\\\"}[1m])) by (job, instance, error) \\u003e 0.1\",\n \"severity\": 1\n }\n ]\n },\n \"prom_eval_interval\": 30,\n \"enable_stime\": \"00:00\",\n \"enable_stimes\": [\n \"00:00\"\n ],\n \"enable_etime\": \"00:00\",\n \"enable_etimes\": [\n \"00:00\"\n ],\n \"enable_days_of_week\": [\n \"0\",\n \"1\",\n \"2\",\n \"3\",\n \"4\",\n \"5\",\n \"6\"\n ],\n \"enable_days_of_weeks\": [\n [\n \"0\",\n \"1\",\n \"2\",\n \"3\",\n \"4\",\n \"5\",\n \"6\"\n ]\n ],\n \"enable_in_bg\": 0,\n \"notify_recovered\": 1,\n \"notify_channels\": [\n \"email\"\n ],\n \"notify_groups_obj\": null,\n \"notify_groups\": null,\n \"notify_repeat_step\": 60,\n \"notify_max_number\": 0,\n \"recover_duration\": 0,\n \"callbacks\": [],\n \"runbook_url\": \"\",\n \"append_tags\": [],\n \"annotations\": {},\n \"extra_config\": null,\n \"create_at\": 0,\n \"create_by\": \"\",\n \"update_at\": 0,\n \"update_by\": \"\",\n \"uuid\": 1717556327156240000\n },\n {\n \"id\": 0,\n \"group_id\": 0,\n \"cate\": \"prometheus\",\n \"datasource_ids\": [\n 0\n ],\n \"cluster\": \"\",\n \"name\": \"Kafka 集群入向网络流量较高\",\n \"note\": \"\",\n \"prod\": \"metric\",\n \"algorithm\": \"\",\n \"algo_params\": null,\n \"delay\": 0,\n \"severity\": 0,\n \"severities\": [\n 2,\n 3\n ],\n \"disabled\": 0,\n \"prom_for_duration\": 60,\n \"prom_ql\": \"\",\n \"rule_config\": {\n \"inhibit\": true,\n \"queries\": [\n {\n \"keys\": {\n \"labelKey\": \"\",\n \"valueKey\": \"\"\n },\n \"prom_ql\": \"sum(rate(kafka_broker_network_io_bytes_total{direction=\\\"in\\\"}[1m])) by (job) \\u003e 50 * 1024 * 1024\",\n \"severity\": 2\n },\n {\n \"prom_ql\": \"sum(rate(kafka_broker_network_io_bytes_total{direction=\\\"in\\\"}[1m])) by (job) \\u003e 20 * 1024 * 1024\",\n \"severity\": 3\n }\n ]\n },\n \"prom_eval_interval\": 30,\n \"enable_stime\": \"00:00\",\n \"enable_stimes\": [\n \"00:00\"\n ],\n \"enable_etime\": \"00:00\",\n \"enable_etimes\": [\n \"00:00\"\n ],\n \"enable_days_of_week\": [\n \"0\",\n \"1\",\n \"2\",\n \"3\",\n \"4\",\n \"5\",\n \"6\"\n ],\n \"enable_days_of_weeks\": [\n [\n \"0\",\n \"1\",\n \"2\",\n \"3\",\n \"4\",\n \"5\",\n \"6\"\n ]\n ],\n \"enable_in_bg\": 0,\n \"notify_recovered\": 1,\n \"notify_channels\": [\n \"email\"\n ],\n \"notify_groups_obj\": null,\n \"notify_groups\": null,\n \"notify_repeat_step\": 60,\n \"notify_max_number\": 0,\n \"recover_duration\": 0,\n \"callbacks\": [],\n \"runbook_url\": \"\",\n \"append_tags\": [],\n \"annotations\": {},\n \"extra_config\": null,\n \"create_at\": 0,\n \"create_by\": \"\",\n \"update_at\": 0,\n \"update_by\": \"\",\n \"uuid\": 1717556327156954000\n },\n {\n \"id\": 0,\n \"group_id\": 0,\n \"cate\": \"prometheus\",\n \"datasource_ids\": [\n 0\n ],\n \"cluster\": \"\",\n \"name\": \"Kafka 集群出向网络流量较高\",\n \"note\": \"\",\n \"prod\": \"metric\",\n \"algorithm\": \"\",\n \"algo_params\": null,\n \"delay\": 0,\n \"severity\": 0,\n \"severities\": [\n 2,\n 3\n ],\n \"disabled\": 0,\n \"prom_for_duration\": 60,\n \"prom_ql\": \"\",\n \"rule_config\": {\n \"inhibit\": true,\n \"queries\": [\n {\n \"keys\": {\n \"labelKey\": \"\",\n \"valueKey\": \"\"\n },\n \"prom_ql\": \"sum(rate(kafka_broker_network_io_bytes_total{direction=\\\"out\\\"}[1m])) by (job) \\u003e 50 * 1024 * 1024\",\n \"severity\": 2\n },\n {\n \"prom_ql\": \"sum(rate(kafka_broker_network_io_bytes_total{direction=\\\"out\\\"}[1m])) by (job) \\u003e 20 * 1024 * 1024\",\n \"severity\": 3\n }\n ]\n },\n \"prom_eval_interval\": 30,\n \"enable_stime\": \"00:00\",\n \"enable_stimes\": [\n \"00:00\"\n ],\n \"enable_etime\": \"00:00\",\n \"enable_etimes\": [\n \"00:00\"\n ],\n \"enable_days_of_week\": [\n \"0\",\n \"1\",\n \"2\",\n \"3\",\n \"4\",\n \"5\",\n \"6\"\n ],\n \"enable_days_of_weeks\": [\n [\n \"0\",\n \"1\",\n \"2\",\n \"3\",\n \"4\",\n \"5\",\n \"6\"\n ]\n ],\n \"enable_in_bg\": 0,\n \"notify_recovered\": 1,\n \"notify_channels\": [\n \"email\"\n ],\n \"notify_groups_obj\": null,\n \"notify_groups\": null,\n \"notify_repeat_step\": 60,\n \"notify_max_number\": 0,\n \"recover_duration\": 0,\n \"callbacks\": [],\n \"runbook_url\": \"\",\n \"append_tags\": [],\n \"annotations\": {},\n \"extra_config\": null,\n \"create_at\": 0,\n \"create_by\": \"\",\n \"update_at\": 0,\n \"update_by\": \"\",\n \"uuid\": 1717556327157473000\n }\n]"
},
{
"path": "integrations/AutoMQ/collect/prometheus/采集OTEL-COLLECTOR的样例.toml",
"content": "interval = 15\n\n[[instances]]\nurls = [\n \"http://:/metrics\"\n]\n\nurl_label_key = \"otel_collector\"\nurl_label_value = \"{{.Host}}\""
},
{
"path": "integrations/AutoMQ/dashboards/broker_metrics.json",
"content": "{\n \"id\": 0,\n \"group_id\": 0,\n \"name\": \"Broker Metrics\",\n \"ident\": \"automq-broker-metrics\",\n \"tags\": \"\",\n \"create_at\": 0,\n \"create_by\": \"\",\n \"update_at\": 0,\n \"update_by\": \"\",\n \"configs\": {\n \"links\": [],\n \"panels\": [\n {\n \"custom\": {\n \"drawStyle\": \"lines\",\n \"fillOpacity\": 0,\n \"gradientMode\": \"none\",\n \"lineInterpolation\": \"linear\",\n \"lineWidth\": 1,\n \"scaleDistribution\": {\n \"type\": \"linear\"\n },\n \"spanNulls\": false,\n \"stack\": \"off\"\n },\n \"datasourceCate\": \"prometheus\",\n \"datasourceValue\": \"${DS_PROMETHEUS}\",\n \"id\": \"0915f8ee-4c36-487d-b7dc-26566a5297f0\",\n \"layout\": {\n \"h\": 4,\n \"i\": \"0915f8ee-4c36-487d-b7dc-26566a5297f0\",\n \"isResizable\": true,\n \"w\": 8,\n \"x\": 0,\n \"y\": 0\n },\n \"links\": [],\n \"maxPerRow\": 4,\n \"name\": \"Error Rate(req/s)\",\n \"options\": {\n \"legend\": {\n \"behaviour\": \"showItem\",\n \"displayMode\": \"hidden\",\n \"placement\": \"bottom\"\n },\n \"standardOptions\": {\n \"util\": \"none\"\n },\n \"thresholds\": {\n \"steps\": [\n {\n \"color\": \"#73BF69\",\n \"type\": \"base\",\n \"value\": null\n }\n ]\n },\n \"tooltip\": {\n \"mode\": \"all\",\n \"sort\": \"desc\"\n },\n \"valueMappings\": []\n },\n \"overrides\": [\n {\n \"matcher\": {\n \"id\": \"byFrameRefID\"\n },\n \"properties\": {\n \"rightYAxisDisplay\": \"off\"\n }\n }\n ],\n \"targets\": [\n {\n \"expr\": \"sum by(instance, error) (rate(kafka_request_error_count_total{job=\\\"$cluster_id\\\", instance=~\\\"$node_id\\\", error!=\\\"NONE\\\"}[$__rate_interval]))\",\n \"legend\": \"Node-{{instance}}#{{error}}\",\n \"maxDataPoints\": 240,\n \"refId\": \"A\"\n }\n ],\n \"transformations\": [\n {\n \"id\": \"organize\",\n \"options\": {}\n }\n ],\n \"type\": \"timeseries\",\n \"version\": \"3.0.0\"\n },\n {\n \"custom\": {\n \"drawStyle\": \"lines\",\n \"fillOpacity\": 0,\n \"gradientMode\": \"none\",\n \"lineInterpolation\": \"linear\",\n \"lineWidth\": 1,\n \"scaleDistribution\": {\n \"type\": \"linear\"\n },\n \"spanNulls\": false,\n \"stack\": \"off\"\n },\n \"datasourceCate\": \"prometheus\",\n \"datasourceValue\": \"${DS_PROMETHEUS}\",\n \"id\": \"e8f9e4d5-de65-4b2b-974e-a2b77eb84cad\",\n \"layout\": {\n \"h\": 4,\n \"i\": \"e8f9e4d5-de65-4b2b-974e-a2b77eb84cad\",\n \"isResizable\": true,\n \"w\": 8,\n \"x\": 8,\n \"y\": 0\n },\n \"links\": [],\n \"maxPerRow\": 4,\n \"name\": \"Connection Count\",\n \"options\": {\n \"legend\": {\n \"behaviour\": \"showItem\",\n \"displayMode\": \"hidden\",\n \"placement\": \"bottom\"\n },\n \"standardOptions\": {\n \"util\": \"none\"\n },\n \"thresholds\": {\n \"steps\": [\n {\n \"color\": \"#73BF69\",\n \"type\": \"base\",\n \"value\": null\n }\n ]\n },\n \"tooltip\": {\n \"mode\": \"all\",\n \"sort\": \"desc\"\n },\n \"valueMappings\": []\n },\n \"overrides\": [\n {\n \"matcher\": {\n \"id\": \"byFrameRefID\"\n },\n \"properties\": {\n \"rightYAxisDisplay\": \"off\"\n }\n }\n ],\n \"targets\": [\n {\n \"expr\": \"sum by(instance, listener) (kafka_server_connection_count{job=\\\"$cluster_id\\\", instance=~\\\"$node_id\\\"})\",\n \"legend\": \"Node-{{instance}}#{{listener}}\",\n \"maxDataPoints\": 240,\n \"refId\": \"A\"\n }\n ],\n \"transformations\": [\n {\n \"id\": \"organize\",\n \"options\": {}\n }\n ],\n \"type\": \"timeseries\",\n \"version\": \"3.0.0\"\n },\n {\n \"custom\": {\n \"drawStyle\": \"lines\",\n \"fillOpacity\": 0,\n \"gradientMode\": \"none\",\n \"lineInterpolation\": \"linear\",\n \"lineWidth\": 1,\n \"scaleDistribution\": {\n \"type\": \"linear\"\n },\n \"spanNulls\": false,\n \"stack\": \"off\"\n },\n \"datasourceCate\": \"prometheus\",\n \"datasourceValue\": \"${DS_PROMETHEUS}\",\n \"id\": \"ba9d84f6-3490-4d01-9733-f8c40e6a3694\",\n \"layout\": {\n \"h\": 4,\n \"i\": \"ba9d84f6-3490-4d01-9733-f8c40e6a3694\",\n \"isResizable\": true,\n \"w\": 8,\n \"x\": 16,\n \"y\": 0\n },\n \"links\": [],\n \"maxPerRow\": 4,\n \"name\": \"Partition Count\",\n \"options\": {\n \"legend\": {\n \"behaviour\": \"showItem\",\n \"displayMode\": \"hidden\",\n \"placement\": \"bottom\"\n },\n \"standardOptions\": {\n \"util\": \"none\"\n },\n \"thresholds\": {\n \"steps\": [\n {\n \"color\": \"#73BF69\",\n \"type\": \"base\",\n \"value\": null\n }\n ]\n },\n \"tooltip\": {\n \"mode\": \"all\",\n \"sort\": \"desc\"\n },\n \"valueMappings\": []\n },\n \"overrides\": [\n {\n \"matcher\": {\n \"id\": \"byFrameRefID\"\n },\n \"properties\": {\n \"rightYAxisDisplay\": \"off\"\n }\n }\n ],\n \"targets\": [\n {\n \"expr\": \"kafka_partition_count{job=\\\"$cluster_id\\\", instance=~\\\"$node_id\\\"}\",\n \"legend\": \"Node-{{instance}}\",\n \"maxDataPoints\": 240,\n \"refId\": \"A\"\n }\n ],\n \"transformations\": [\n {\n \"id\": \"organize\",\n \"options\": {}\n }\n ],\n \"type\": \"timeseries\",\n \"version\": \"3.0.0\"\n },\n {\n \"custom\": {\n \"drawStyle\": \"lines\",\n \"fillOpacity\": 0,\n \"gradientMode\": \"none\",\n \"lineInterpolation\": \"linear\",\n \"lineWidth\": 1,\n \"scaleDistribution\": {\n \"type\": \"linear\"\n },\n \"spanNulls\": false,\n \"stack\": \"off\"\n },\n \"datasourceCate\": \"prometheus\",\n \"datasourceValue\": \"${DS_PROMETHEUS}\",\n \"id\": \"2a5b54cf-1ce3-4a0c-ba17-f4ce13fd9d35\",\n \"layout\": {\n \"h\": 5,\n \"i\": \"2a5b54cf-1ce3-4a0c-ba17-f4ce13fd9d35\",\n \"isResizable\": true,\n \"w\": 8,\n \"x\": 0,\n \"y\": 4\n },\n \"links\": [],\n \"maxPerRow\": 4,\n \"name\": \"Messages In\",\n \"options\": {\n \"legend\": {\n \"behaviour\": \"showItem\",\n \"displayMode\": \"hidden\",\n \"placement\": \"bottom\"\n },\n \"standardOptions\": {\n \"util\": \"none\"\n },\n \"thresholds\": {\n \"steps\": [\n {\n \"color\": \"#73BF69\",\n \"type\": \"base\",\n \"value\": null\n }\n ]\n },\n \"tooltip\": {\n \"mode\": \"all\",\n \"sort\": \"desc\"\n },\n \"valueMappings\": []\n },\n \"overrides\": [\n {\n \"matcher\": {\n \"id\": \"byFrameRefID\"\n },\n \"properties\": {\n \"rightYAxisDisplay\": \"off\"\n }\n }\n ],\n \"targets\": [\n {\n \"expr\": \"sum by(instance) (rate(kafka_message_count_total{job=\\\"$cluster_id\\\", instance=~\\\"$node_id\\\"}[$__rate_interval]))\",\n \"legend\": \"Node-{{instance}}\",\n \"maxDataPoints\": 240,\n \"refId\": \"A\"\n }\n ],\n \"transformations\": [\n {\n \"id\": \"organize\",\n \"options\": {}\n }\n ],\n \"type\": \"timeseries\",\n \"version\": \"3.0.0\"\n },\n {\n \"custom\": {\n \"drawStyle\": \"lines\",\n \"fillOpacity\": 0.15,\n \"gradientMode\": \"none\",\n \"lineInterpolation\": \"linear\",\n \"lineWidth\": 1,\n \"scaleDistribution\": {\n \"type\": \"linear\"\n },\n \"spanNulls\": false,\n \"stack\": \"off\"\n },\n \"datasourceCate\": \"prometheus\",\n \"datasourceValue\": \"${DS_PROMETHEUS}\",\n \"id\": \"ab1ba353-92cb-4dbf-a288-d9c1a1442622\",\n \"layout\": {\n \"h\": 5,\n \"i\": \"ab1ba353-92cb-4dbf-a288-d9c1a1442622\",\n \"isResizable\": true,\n \"w\": 8,\n \"x\": 8,\n \"y\": 4\n },\n \"links\": [],\n \"maxPerRow\": 4,\n \"name\": \"Bytes In\",\n \"options\": {\n \"legend\": {\n \"behaviour\": \"showItem\",\n \"displayMode\": \"hidden\",\n \"placement\": \"bottom\"\n },\n \"standardOptions\": {\n \"util\": \"bytesSecIEC\"\n },\n \"thresholds\": {\n \"steps\": [\n {\n \"color\": \"#73BF69\",\n \"type\": \"base\",\n \"value\": null\n }\n ]\n },\n \"tooltip\": {\n \"mode\": \"all\",\n \"sort\": \"desc\"\n },\n \"valueMappings\": []\n },\n \"overrides\": [\n {\n \"matcher\": {\n \"id\": \"byFrameRefID\"\n },\n \"properties\": {\n \"rightYAxisDisplay\": \"off\"\n }\n }\n ],\n \"targets\": [\n {\n \"expr\": \"sum by(instance) (rate(kafka_network_io_bytes_total{job=\\\"$cluster_id\\\", direction=\\\"in\\\", instance=~\\\"$node_id\\\"}[$__rate_interval]))\",\n \"legend\": \"Node-{{instance}}\",\n \"maxDataPoints\": 240,\n \"refId\": \"A\"\n }\n ],\n \"transformations\": [\n {\n \"id\": \"organize\",\n \"options\": {}\n }\n ],\n \"type\": \"timeseries\",\n \"version\": \"3.0.0\"\n },\n {\n \"custom\": {\n \"drawStyle\": \"lines\",\n \"fillOpacity\": 0.15,\n \"gradientMode\": \"none\",\n \"lineInterpolation\": \"linear\",\n \"lineWidth\": 1,\n \"scaleDistribution\": {\n \"type\": \"linear\"\n },\n \"spanNulls\": false,\n \"stack\": \"off\"\n },\n \"datasourceCate\": \"prometheus\",\n \"datasourceValue\": \"${DS_PROMETHEUS}\",\n \"id\": \"d4802fc0-962c-44a0-b480-f4c12e9a8bbe\",\n \"layout\": {\n \"h\": 5,\n \"i\": \"d4802fc0-962c-44a0-b480-f4c12e9a8bbe\",\n \"isResizable\": true,\n \"w\": 8,\n \"x\": 16,\n \"y\": 4\n },\n \"links\": [],\n \"maxPerRow\": 4,\n \"name\": \"Bytes Out\",\n \"options\": {\n \"legend\": {\n \"behaviour\": \"showItem\",\n \"displayMode\": \"hidden\",\n \"placement\": \"bottom\"\n },\n \"standardOptions\": {\n \"util\": \"bytesSecIEC\"\n },\n \"thresholds\": {\n \"steps\": [\n {\n \"color\": \"#73BF69\",\n \"type\": \"base\",\n \"value\": null\n }\n ]\n },\n \"tooltip\": {\n \"mode\": \"all\",\n \"sort\": \"desc\"\n },\n \"valueMappings\": []\n },\n \"overrides\": [\n {\n \"matcher\": {\n \"id\": \"byFrameRefID\"\n },\n \"properties\": {\n \"rightYAxisDisplay\": \"off\"\n }\n }\n ],\n \"targets\": [\n {\n \"expr\": \"sum by(instance) (rate(kafka_network_io_bytes_total{job=\\\"$cluster_id\\\", direction=\\\"out\\\", instance=~\\\"$node_id\\\"}[$__rate_interval]))\",\n \"legend\": \"Node-{{instance}}\",\n \"maxDataPoints\": 240,\n \"refId\": \"A\"\n }\n ],\n \"transformations\": [\n {\n \"id\": \"organize\",\n \"options\": {}\n }\n ],\n \"type\": \"timeseries\",\n \"version\": \"3.0.0\"\n },\n {\n \"custom\": {\n \"drawStyle\": \"lines\",\n \"fillOpacity\": 0,\n \"gradientMode\": \"none\",\n \"lineInterpolation\": \"linear\",\n \"lineWidth\": 1,\n \"scaleDistribution\": {\n \"type\": \"linear\"\n },\n \"spanNulls\": false,\n \"stack\": \"off\"\n },\n \"datasourceCate\": \"prometheus\",\n \"datasourceValue\": \"${DS_PROMETHEUS}\",\n \"id\": \"fa0fa9d3-9715-439a-8a39-76fbeec93a71\",\n \"layout\": {\n \"h\": 5,\n \"i\": \"fa0fa9d3-9715-439a-8a39-76fbeec93a71\",\n \"isResizable\": true,\n \"w\": 8,\n \"x\": 0,\n \"y\": 9\n },\n \"links\": [],\n \"maxPerRow\": 4,\n \"name\": \"Messages In Per Topic\",\n \"options\": {\n \"legend\": {\n \"behaviour\": \"showItem\",\n \"displayMode\": \"hidden\",\n \"placement\": \"bottom\"\n },\n \"standardOptions\": {\n \"util\": \"none\"\n },\n \"thresholds\": {\n \"steps\": [\n {\n \"color\": \"#73BF69\",\n \"type\": \"base\",\n \"value\": null\n }\n ]\n },\n \"tooltip\": {\n \"mode\": \"all\",\n \"sort\": \"desc\"\n },\n \"valueMappings\": []\n },\n \"overrides\": [\n {\n \"matcher\": {\n \"id\": \"byFrameRefID\"\n },\n \"properties\": {\n \"rightYAxisDisplay\": \"off\"\n }\n }\n ],\n \"targets\": [\n {\n \"expr\": \"sum by(topic, instance) (rate(kafka_message_count_total{job=\\\"$cluster_id\\\", instance=~\\\"$node_id\\\"}[$__rate_interval]))\",\n \"legend\": \"Node-{{instance}}#{{topic}}\",\n \"maxDataPoints\": 240,\n \"refId\": \"A\"\n }\n ],\n \"transformations\": [\n {\n \"id\": \"organize\",\n \"options\": {}\n }\n ],\n \"type\": \"timeseries\",\n \"version\": \"3.0.0\"\n },\n {\n \"custom\": {\n \"drawStyle\": \"lines\",\n \"fillOpacity\": 0.15,\n \"gradientMode\": \"none\",\n \"lineInterpolation\": \"linear\",\n \"lineWidth\": 1,\n \"scaleDistribution\": {\n \"type\": \"linear\"\n },\n \"spanNulls\": false,\n \"stack\": \"off\"\n },\n \"datasourceCate\": \"prometheus\",\n \"datasourceValue\": \"${DS_PROMETHEUS}\",\n \"id\": \"3de2881d-d2db-46f2-9d83-f365371fd78b\",\n \"layout\": {\n \"h\": 5,\n \"i\": \"3de2881d-d2db-46f2-9d83-f365371fd78b\",\n \"isResizable\": true,\n \"w\": 8,\n \"x\": 8,\n \"y\": 9\n },\n \"links\": [],\n \"maxPerRow\": 4,\n \"name\": \"Bytes In Per Topic\",\n \"options\": {\n \"legend\": {\n \"behaviour\": \"showItem\",\n \"displayMode\": \"hidden\",\n \"placement\": \"bottom\"\n },\n \"standardOptions\": {\n \"util\": \"bytesSecIEC\"\n },\n \"thresholds\": {\n \"steps\": [\n {\n \"color\": \"#73BF69\",\n \"type\": \"base\",\n \"value\": null\n }\n ]\n },\n \"tooltip\": {\n \"mode\": \"all\",\n \"sort\": \"desc\"\n },\n \"valueMappings\": []\n },\n \"overrides\": [\n {\n \"matcher\": {\n \"id\": \"byFrameRefID\"\n },\n \"properties\": {\n \"rightYAxisDisplay\": \"off\"\n }\n }\n ],\n \"targets\": [\n {\n \"expr\": \"sum by(topic, instance) (rate(kafka_network_io_bytes_total{job=\\\"$cluster_id\\\", direction=\\\"in\\\", instance=~\\\"$node_id\\\"}[$__rate_interval]))\",\n \"legend\": \"Node-{{instance}}#{{topic}}\",\n \"maxDataPoints\": 240,\n \"refId\": \"A\"\n }\n ],\n \"transformations\": [\n {\n \"id\": \"organize\",\n \"options\": {}\n }\n ],\n \"type\": \"timeseries\",\n \"version\": \"3.0.0\"\n },\n {\n \"custom\": {\n \"drawStyle\": \"lines\",\n \"fillOpacity\": 0.15,\n \"gradientMode\": \"none\",\n \"lineInterpolation\": \"linear\",\n \"lineWidth\": 1,\n \"scaleDistribution\": {\n \"type\": \"linear\"\n },\n \"spanNulls\": false,\n \"stack\": \"off\"\n },\n \"datasourceCate\": \"prometheus\",\n \"datasourceValue\": \"${DS_PROMETHEUS}\",\n \"id\": \"3a26bc9b-886f-4ad7-a47f-8c29d7bf3b15\",\n \"layout\": {\n \"h\": 5,\n \"i\": \"3a26bc9b-886f-4ad7-a47f-8c29d7bf3b15\",\n \"isResizable\": true,\n \"w\": 8,\n \"x\": 16,\n \"y\": 9\n },\n \"links\": [],\n \"maxPerRow\": 4,\n \"name\": \"Bytes Out Per Topic\",\n \"options\": {\n \"legend\": {\n \"behaviour\": \"showItem\",\n \"displayMode\": \"hidden\",\n \"placement\": \"bottom\"\n },\n \"standardOptions\": {\n \"util\": \"bytesSecIEC\"\n },\n \"thresholds\": {\n \"steps\": [\n {\n \"color\": \"#73BF69\",\n \"type\": \"base\",\n \"value\": null\n }\n ]\n },\n \"tooltip\": {\n \"mode\": \"all\",\n \"sort\": \"desc\"\n },\n \"valueMappings\": []\n },\n \"overrides\": [\n {\n \"matcher\": {\n \"id\": \"byFrameRefID\"\n },\n \"properties\": {\n \"rightYAxisDisplay\": \"off\"\n }\n }\n ],\n \"targets\": [\n {\n \"expr\": \"sum by(topic, instance) (rate(kafka_network_io_bytes_total{job=\\\"$cluster_id\\\", direction=\\\"out\\\", instance=~\\\"$node_id\\\"}[$__rate_interval]))\",\n \"legend\": \"Node-{{instance}}#{{topic}}\",\n \"maxDataPoints\": 240,\n \"refId\": \"A\"\n }\n ],\n \"transformations\": [\n {\n \"id\": \"organize\",\n \"options\": {}\n }\n ],\n \"type\": \"timeseries\",\n \"version\": \"3.0.0\"\n },\n {\n \"custom\": {\n \"drawStyle\": \"lines\",\n \"fillOpacity\": 0.15,\n \"gradientMode\": \"none\",\n \"lineInterpolation\": \"linear\",\n \"lineWidth\": 1,\n \"scaleDistribution\": {\n \"type\": \"linear\"\n },\n \"spanNulls\": false,\n \"stack\": \"off\"\n },\n \"datasourceCate\": \"prometheus\",\n \"datasourceValue\": \"${DS_PROMETHEUS}\",\n \"id\": \"892bb035-44ad-4e93-bc64-8b70da74079a\",\n \"layout\": {\n \"h\": 5,\n \"i\": \"892bb035-44ad-4e93-bc64-8b70da74079a\",\n \"isResizable\": true,\n \"w\": 12,\n \"x\": 0,\n \"y\": 14\n },\n \"links\": [],\n \"maxPerRow\": 4,\n \"name\": \"Produce Throughput\",\n \"options\": {\n \"legend\": {\n \"behaviour\": \"showItem\",\n \"displayMode\": \"hidden\",\n \"placement\": \"bottom\"\n },\n \"standardOptions\": {\n \"util\": \"none\"\n },\n \"thresholds\": {\n \"steps\": [\n {\n \"color\": \"#73BF69\",\n \"type\": \"base\",\n \"value\": null\n }\n ]\n },\n \"tooltip\": {\n \"mode\": \"all\",\n \"sort\": \"desc\"\n },\n \"valueMappings\": []\n },\n \"overrides\": [\n {\n \"matcher\": {\n \"id\": \"byFrameRefID\"\n },\n \"properties\": {\n \"rightYAxisDisplay\": \"off\"\n }\n }\n ],\n \"targets\": [\n {\n \"expr\": \"sum by(instance, topic) (rate(kafka_request_count_total{job=\\\"$cluster_id\\\", instance=~\\\"$node_id\\\", type=\\\"Produce\\\"}[$__rate_interval]))\",\n \"legend\": \"Node-{{instance}}#{{topic}}\",\n \"maxDataPoints\": 240,\n \"refId\": \"A\"\n }\n ],\n \"transformations\": [\n {\n \"id\": \"organize\",\n \"options\": {}\n }\n ],\n \"type\": \"timeseries\",\n \"version\": \"3.0.0\"\n },\n {\n \"custom\": {\n \"drawStyle\": \"lines\",\n \"fillOpacity\": 0.15,\n \"gradientMode\": \"none\",\n \"lineInterpolation\": \"linear\",\n \"lineWidth\": 1,\n \"scaleDistribution\": {\n \"type\": \"linear\"\n },\n \"spanNulls\": false,\n \"stack\": \"off\"\n },\n \"datasourceCate\": \"prometheus\",\n \"datasourceValue\": \"${DS_PROMETHEUS}\",\n \"id\": \"db955862-42c0-484d-b972-0a99cd92190e\",\n \"layout\": {\n \"h\": 5,\n \"i\": \"db955862-42c0-484d-b972-0a99cd92190e\",\n \"isResizable\": true,\n \"w\": 12,\n \"x\": 12,\n \"y\": 14\n },\n \"links\": [],\n \"maxPerRow\": 4,\n \"name\": \"Fetch Throughput\",\n \"options\": {\n \"legend\": {\n \"behaviour\": \"showItem\",\n \"displayMode\": \"hidden\",\n \"placement\": \"bottom\"\n },\n \"standardOptions\": {\n \"util\": \"none\"\n },\n \"thresholds\": {\n \"steps\": [\n {\n \"color\": \"#73BF69\",\n \"type\": \"base\",\n \"value\": null\n }\n ]\n },\n \"tooltip\": {\n \"mode\": \"all\",\n \"sort\": \"desc\"\n },\n \"valueMappings\": []\n },\n \"overrides\": [\n {\n \"matcher\": {\n \"id\": \"byFrameRefID\"\n },\n \"properties\": {\n \"rightYAxisDisplay\": \"off\"\n }\n }\n ],\n \"targets\": [\n {\n \"expr\": \"sum by(instance, topic) (rate(kafka_request_count_total{job=\\\"$cluster_id\\\", instance=~\\\"$node_id\\\", type=\\\"Fetch\\\"}[$__rate_interval]))\",\n \"legend\": \"Node-{{instance}}#{{topic}}\",\n \"maxDataPoints\": 240,\n \"refId\": \"A\"\n }\n ],\n \"transformations\": [\n {\n \"id\": \"organize\",\n \"options\": {}\n }\n ],\n \"type\": \"timeseries\",\n \"version\": \"3.0.0\"\n },\n {\n \"custom\": {\n \"drawStyle\": \"lines\",\n \"fillOpacity\": 0,\n \"gradientMode\": \"none\",\n \"lineInterpolation\": \"linear\",\n \"lineWidth\": 1,\n \"scaleDistribution\": {\n \"type\": \"linear\"\n },\n \"spanNulls\": false,\n \"stack\": \"off\"\n },\n \"datasourceCate\": \"prometheus\",\n \"datasourceValue\": \"${DS_PROMETHEUS}\",\n \"id\": \"35895b86-045b-474d-8248-455cfef787ba\",\n \"layout\": {\n \"h\": 5,\n \"i\": \"35895b86-045b-474d-8248-455cfef787ba\",\n \"isResizable\": true,\n \"w\": 12,\n \"x\": 0,\n \"y\": 19\n },\n \"links\": [],\n \"maxPerRow\": 4,\n \"name\": \"Produce Latency\",\n \"options\": {\n \"legend\": {\n \"behaviour\": \"showItem\",\n \"displayMode\": \"hidden\",\n \"placement\": \"bottom\"\n },\n \"standardOptions\": {\n \"util\": \"milliseconds\"\n },\n \"thresholds\": {\n \"steps\": [\n {\n \"color\": \"#634CD9\",\n \"type\": \"base\",\n \"value\": null\n }\n ]\n },\n \"tooltip\": {\n \"mode\": \"all\",\n \"sort\": \"desc\"\n },\n \"valueMappings\": []\n },\n \"overrides\": [\n {\n \"matcher\": {\n \"id\": \"byFrameRefID\"\n },\n \"properties\": {\n \"rightYAxisDisplay\": \"off\"\n }\n }\n ],\n \"targets\": [\n {\n \"expr\": \"sum by(instance) (kafka_request_time_99p_milliseconds{job=\\\"$cluster_id\\\", instance=~\\\"$node_id\\\", type=\\\"Produce\\\"})\",\n \"legend\": \"Node-{{instance}}#P99\",\n \"maxDataPoints\": 240,\n \"refId\": \"A\"\n },\n {\n \"expr\": \"sum by(instance) (kafka_request_time_mean_milliseconds{job=\\\"$cluster_id\\\", instance=~\\\"$node_id\\\", type=\\\"Produce\\\"})\",\n \"legend\": \"Node-{{instance}}#Avg\",\n \"maxDataPoints\": 240,\n \"refId\": \"B\"\n },\n {\n \"expr\": \"sum by(instance) (kafka_request_time_50p_milliseconds{job=\\\"$cluster_id\\\", instance=~\\\"$node_id\\\", type=\\\"Produce\\\"})\",\n \"legend\": \"Node-{{instance}}#P50\",\n \"maxDataPoints\": 240,\n \"refId\": \"C\"\n }\n ],\n \"transformations\": [\n {\n \"id\": \"organize\",\n \"options\": {}\n }\n ],\n \"type\": \"timeseries\",\n \"version\": \"3.0.0\"\n },\n {\n \"custom\": {\n \"drawStyle\": \"lines\",\n \"fillOpacity\": 0,\n \"gradientMode\": \"none\",\n \"lineInterpolation\": \"linear\",\n \"lineWidth\": 1,\n \"scaleDistribution\": {\n \"type\": \"linear\"\n },\n \"spanNulls\": false,\n \"stack\": \"off\"\n },\n \"datasourceCate\": \"prometheus\",\n \"datasourceValue\": \"${DS_PROMETHEUS}\",\n \"id\": \"c323e0d1-9325-48e5-b446-723beb6944cc\",\n \"layout\": {\n \"h\": 5,\n \"i\": \"c323e0d1-9325-48e5-b446-723beb6944cc\",\n \"isResizable\": true,\n \"w\": 12,\n \"x\": 12,\n \"y\": 19\n },\n \"links\": [],\n \"maxPerRow\": 4,\n \"name\": \"Fetch Latency\",\n \"options\": {\n \"legend\": {\n \"behaviour\": \"showItem\",\n \"displayMode\": \"hidden\",\n \"placement\": \"bottom\"\n },\n \"standardOptions\": {\n \"util\": \"milliseconds\"\n },\n \"thresholds\": {\n \"steps\": [\n {\n \"color\": \"#73BF69\",\n \"type\": \"base\",\n \"value\": null\n }\n ]\n },\n \"tooltip\": {\n \"mode\": \"all\",\n \"sort\": \"desc\"\n },\n \"valueMappings\": []\n },\n \"overrides\": [\n {\n \"matcher\": {\n \"id\": \"byFrameRefID\"\n },\n \"properties\": {\n \"rightYAxisDisplay\": \"off\"\n }\n }\n ],\n \"targets\": [\n {\n \"expr\": \"sum by(instance) (kafka_request_time_99p_milliseconds{job=\\\"$cluster_id\\\", instance=~\\\"$node_id\\\", type=\\\"Fetch\\\"})\",\n \"legend\": \"Node-{{instance}}#P99\",\n \"maxDataPoints\": 240,\n \"refId\": \"A\"\n },\n {\n \"expr\": \"sum by(instance) (kafka_request_time_mean_milliseconds{job=\\\"$cluster_id\\\", instance=~\\\"$node_id\\\", type=\\\"Fetch\\\"})\",\n \"legend\": \"Node-{{instance}}#Avg\",\n \"maxDataPoints\": 240,\n \"refId\": \"B\"\n },\n {\n \"expr\": \"sum by(instance) (kafka_request_time_50p_milliseconds{job=\\\"$cluster_id\\\", instance=~\\\"$node_id\\\", type=\\\"Fetch\\\"})\",\n \"legend\": \"Node-{{instance}}#P50\",\n \"maxDataPoints\": 240,\n \"refId\": \"C\"\n }\n ],\n \"transformations\": [\n {\n \"id\": \"organize\",\n \"options\": {}\n }\n ],\n \"type\": \"timeseries\",\n \"version\": \"3.0.0\"\n }\n ],\n \"var\": [\n {\n \"definition\": \"prometheus\",\n \"name\": \"DS_PROMETHEUS\",\n \"type\": \"datasource\"\n },\n {\n \"allOption\": false,\n \"datasource\": {\n \"cate\": \"prometheus\",\n \"value\": \"${DS_PROMETHEUS}\"\n },\n \"definition\": \"label_values(process_runtime_jvm_cpu_utilization_ratio,job)\",\n \"hide\": false,\n \"multi\": false,\n \"name\": \"cluster_id\",\n \"reg\": \"\",\n \"type\": \"query\"\n },\n {\n \"allOption\": true,\n \"datasource\": {\n \"cate\": \"prometheus\",\n \"value\": \"${DS_PROMETHEUS}\"\n },\n \"definition\": \"label_values(process_runtime_jvm_cpu_utilization_ratio,instance)\",\n \"hide\": false,\n \"multi\": true,\n \"name\": \"node_id\",\n \"reg\": \"/(^[0-9]*$)/\",\n \"type\": \"query\"\n }\n ],\n \"version\": \"3.0.0\"\n },\n \"public\": 0,\n \"public_cate\": 0,\n \"bgids\": null,\n \"built_in\": 0,\n \"hide\": 0,\n \"uuid\": 1717556327159415000\n}"
},
{
"path": "integrations/AutoMQ/dashboards/cluster_overview.json",
"content": "{\n \"id\": 0,\n \"group_id\": 0,\n \"name\": \"Cluster Overview\",\n \"ident\": \"\",\n \"tags\": \"\",\n \"create_at\": 0,\n \"create_by\": \"\",\n \"update_at\": 0,\n \"update_by\": \"\",\n \"configs\": {\n \"links\": [],\n \"panels\": [\n {\n \"custom\": {\n \"calc\": \"lastNotNull\",\n \"colSpan\": 1,\n \"colorMode\": \"background\",\n \"graphMode\": \"none\",\n \"textMode\": \"valueAndName\",\n \"textSize\": {},\n \"valueField\": \"Value\"\n },\n \"datasourceCate\": \"prometheus\",\n \"datasourceValue\": \"${DS_PROMETHEUS}\",\n \"id\": \"970f949f-cdc8-4ec0-b2c8-c49d3bd14d8d\",\n \"layout\": {\n \"h\": 4,\n \"i\": \"970f949f-cdc8-4ec0-b2c8-c49d3bd14d8d\",\n \"isResizable\": true,\n \"w\": 3,\n \"x\": 0,\n \"y\": 0\n },\n \"links\": [],\n \"maxPerRow\": 4,\n \"options\": {\n \"standardOptions\": {\n \"util\": \"none\"\n },\n \"thresholds\": {\n \"steps\": [\n {\n \"color\": \"#F2495C\",\n \"type\": \"base\",\n \"value\": null\n },\n {\n \"color\": \"#73BF69\",\n \"value\": 0\n }\n ]\n },\n \"valueMappings\": []\n },\n \"targets\": [\n {\n \"expr\": \"sum by(job) (kafka_controller_active_count{job=\\\"$cluster_id\\\"})\",\n \"legend\": \"Active Controller\",\n \"maxDataPoints\": 240,\n \"refId\": \"A\"\n }\n ],\n \"transformations\": [\n {\n \"id\": \"organize\",\n \"options\": {}\n }\n ],\n \"type\": \"stat\",\n \"version\": \"3.0.0\"\n },\n {\n \"custom\": {\n \"calc\": \"lastNotNull\",\n \"colSpan\": 1,\n \"colorMode\": \"background\",\n \"graphMode\": \"none\",\n \"textMode\": \"valueAndName\",\n \"textSize\": {},\n \"valueField\": \"Value\"\n },\n \"datasourceCate\": \"prometheus\",\n \"datasourceValue\": \"${DS_PROMETHEUS}\",\n \"id\": \"bcf3c5d7-9dd1-4cb6-81a1-3198f4b049e2\",\n \"layout\": {\n \"h\": 4,\n \"i\": \"bcf3c5d7-9dd1-4cb6-81a1-3198f4b049e2\",\n \"isResizable\": true,\n \"w\": 3,\n \"x\": 3,\n \"y\": 0\n },\n \"links\": [],\n \"maxPerRow\": 4,\n \"options\": {\n \"standardOptions\": {\n \"util\": \"none\"\n },\n \"thresholds\": {\n \"steps\": [\n {\n \"color\": \"#73BF69\",\n \"type\": \"base\",\n \"value\": null\n },\n {\n \"color\": \"#F2495C\",\n \"value\": 1\n }\n ]\n },\n \"valueMappings\": []\n },\n \"targets\": [\n {\n \"expr\": \"kafka_broker_fenced_count{job=\\\"$cluster_id\\\", instance=\\\"$active_controller\\\"}\",\n \"legend\": \"Fenced Broker\",\n \"maxDataPoints\": 240,\n \"refId\": \"A\"\n }\n ],\n \"transformations\": [\n {\n \"id\": \"organize\",\n \"options\": {}\n }\n ],\n \"type\": \"stat\",\n \"version\": \"3.0.0\"\n },\n {\n \"custom\": {\n \"calc\": \"lastNotNull\",\n \"colSpan\": 1,\n \"colorMode\": \"background\",\n \"graphMode\": \"none\",\n \"textMode\": \"valueAndName\",\n \"textSize\": {},\n \"valueField\": \"Value\"\n },\n \"datasourceCate\": \"prometheus\",\n \"datasourceValue\": \"${DS_PROMETHEUS}\",\n \"id\": \"333648e6-4bef-4e2d-bb84-f1d720d383cc\",\n \"layout\": {\n \"h\": 4,\n \"i\": \"333648e6-4bef-4e2d-bb84-f1d720d383cc\",\n \"isResizable\": true,\n \"w\": 4,\n \"x\": 6,\n \"y\": 0\n },\n \"links\": [],\n \"maxPerRow\": 4,\n \"options\": {\n \"standardOptions\": {\n \"util\": \"none\"\n },\n \"thresholds\": {\n \"steps\": [\n {\n \"color\": \"#3274D9\",\n \"type\": \"base\",\n \"value\": null\n }\n ]\n },\n \"valueMappings\": []\n },\n \"targets\": [\n {\n \"expr\": \"kafka_topic_count{job=\\\"$cluster_id\\\", instance=\\\"$active_controller\\\"}\",\n \"legend\": \"Topics\",\n \"maxDataPoints\": 240,\n \"refId\": \"A\"\n }\n ],\n \"transformations\": [\n {\n \"id\": \"organize\",\n \"options\": {}\n }\n ],\n \"type\": \"stat\",\n \"version\": \"3.0.0\"\n },\n {\n \"custom\": {\n \"calc\": \"lastNotNull\",\n \"colSpan\": 1,\n \"colorMode\": \"background\",\n \"graphMode\": \"none\",\n \"textMode\": \"value\",\n \"textSize\": {},\n \"valueField\": \"Value\"\n },\n \"datasourceCate\": \"prometheus\",\n \"datasourceValue\": \"${DS_PROMETHEUS}\",\n \"id\": \"659a8d96-5276-49fb-a011-22d85dace435\",\n \"layout\": {\n \"h\": 4,\n \"i\": \"659a8d96-5276-49fb-a011-22d85dace435\",\n \"isResizable\": true,\n \"w\": 2,\n \"x\": 10,\n \"y\": 0\n },\n \"links\": [],\n \"maxPerRow\": 4,\n \"name\": \"Error Rate\",\n \"options\": {\n \"standardOptions\": {\n \"decimals\": 1,\n \"util\": \"none\"\n },\n \"thresholds\": {\n \"steps\": [\n {\n \"color\": \"#73BF69\",\n \"type\": \"base\",\n \"value\": null\n },\n {\n \"color\": \"#F2495C\",\n \"value\": 1\n }\n ]\n },\n \"valueMappings\": []\n },\n \"targets\": [\n {\n \"expr\": \"sum(rate(kafka_request_error_count_total{job=\\\"$cluster_id\\\", error!=\\\"NONE\\\"}[$__rate_interval]))\",\n \"legend\": \"__auto\",\n \"maxDataPoints\": 240,\n \"refId\": \"A\"\n }\n ],\n \"transformations\": [\n {\n \"id\": \"organize\",\n \"options\": {}\n }\n ],\n \"type\": \"stat\",\n \"version\": \"3.0.0\"\n },\n {\n \"custom\": {\n \"drawStyle\": \"lines\",\n \"fillOpacity\": 0.3,\n \"gradientMode\": \"none\",\n \"lineInterpolation\": \"linear\",\n \"lineWidth\": 1,\n \"scaleDistribution\": {\n \"type\": \"linear\"\n },\n \"spanNulls\": false,\n \"stack\": \"off\"\n },\n \"datasourceCate\": \"prometheus\",\n \"datasourceValue\": \"${DS_PROMETHEUS}\",\n \"id\": \"0650f241-385f-4386-8b76-7f23d53ef8fb\",\n \"layout\": {\n \"h\": 8,\n \"i\": \"0650f241-385f-4386-8b76-7f23d53ef8fb\",\n \"isResizable\": true,\n \"w\": 12,\n \"x\": 12,\n \"y\": 0\n },\n \"links\": [],\n \"maxPerRow\": 4,\n \"name\": \"Bytes In (+) / Out (-)\",\n \"options\": {\n \"legend\": {\n \"behaviour\": \"showItem\",\n \"displayMode\": \"hidden\",\n \"placement\": \"bottom\"\n },\n \"standardOptions\": {\n \"decimals\": 1,\n \"util\": \"bytesSecIEC\"\n },\n \"thresholds\": {\n \"steps\": [\n {\n \"color\": \"#73BF69\",\n \"type\": \"base\",\n \"value\": null\n }\n ]\n },\n \"tooltip\": {\n \"mode\": \"all\",\n \"sort\": \"desc\"\n },\n \"valueMappings\": []\n },\n \"overrides\": [\n {\n \"matcher\": {\n \"id\": \"byFrameRefID\"\n },\n \"properties\": {\n \"rightYAxisDisplay\": \"off\"\n }\n }\n ],\n \"targets\": [\n {\n \"expr\": \"sum(rate(kafka_broker_network_io_bytes_total{job=\\\"$cluster_id\\\", direction=\\\"in\\\"}[$__rate_interval]))\",\n \"legend\": \"In\",\n \"maxDataPoints\": 240,\n \"refId\": \"A\"\n },\n {\n \"expr\": \"sum(rate(kafka_broker_network_io_bytes_total{job=\\\"$cluster_id\\\", direction=\\\"out\\\"}[$__rate_interval])) * -1\",\n \"legend\": \"Out\",\n \"maxDataPoints\": 240,\n \"refId\": \"B\"\n }\n ],\n \"transformations\": [\n {\n \"id\": \"organize\",\n \"options\": {}\n }\n ],\n \"type\": \"timeseries\",\n \"version\": \"3.0.0\"\n },\n {\n \"custom\": {\n \"calc\": \"lastNotNull\",\n \"colSpan\": 1,\n \"colorMode\": \"background\",\n \"graphMode\": \"none\",\n \"textMode\": \"valueAndName\",\n \"textSize\": {},\n \"valueField\": \"Value\"\n },\n \"datasourceCate\": \"prometheus\",\n \"datasourceValue\": \"${DS_PROMETHEUS}\",\n \"id\": \"aac842e5-e997-4c0f-84e4-0b104dd303e3\",\n \"layout\": {\n \"h\": 4,\n \"i\": \"aac842e5-e997-4c0f-84e4-0b104dd303e3\",\n \"isResizable\": true,\n \"w\": 6,\n \"x\": 0,\n \"y\": 4\n },\n \"links\": [],\n \"maxPerRow\": 4,\n \"options\": {\n \"standardOptions\": {\n \"util\": \"none\"\n },\n \"thresholds\": {\n \"steps\": [\n {\n \"color\": \"#F2495C\",\n \"type\": \"base\",\n \"value\": null\n },\n {\n \"color\": \"#73BF69\",\n \"value\": 0\n }\n ]\n },\n \"valueMappings\": []\n },\n \"targets\": [\n {\n \"expr\": \"kafka_broker_active_count{job=\\\"$cluster_id\\\", instance=\\\"$active_controller\\\"}\",\n \"legend\": \"Active Broker\",\n \"maxDataPoints\": 240,\n \"refId\": \"A\"\n }\n ],\n \"transformations\": [\n {\n \"id\": \"organize\",\n \"options\": {}\n }\n ],\n \"type\": \"stat\",\n \"version\": \"3.0.0\"\n },\n {\n \"custom\": {\n \"calc\": \"lastNotNull\",\n \"colSpan\": 1,\n \"colorMode\": \"background\",\n \"graphMode\": \"none\",\n \"textMode\": \"valueAndName\",\n \"textSize\": {},\n \"valueField\": \"Value\"\n },\n \"datasourceCate\": \"prometheus\",\n \"datasourceValue\": \"${DS_PROMETHEUS}\",\n \"id\": \"fb4e88e4-9e6e-44d0-8bb8-1fe717c0b824\",\n \"layout\": {\n \"h\": 4,\n \"i\": \"fb4e88e4-9e6e-44d0-8bb8-1fe717c0b824\",\n \"isResizable\": true,\n \"w\": 4,\n \"x\": 6,\n \"y\": 4\n },\n \"links\": [],\n \"maxPerRow\": 4,\n \"options\": {\n \"standardOptions\": {\n \"util\": \"none\"\n },\n \"thresholds\": {\n \"steps\": [\n {\n \"color\": \"#3274D9\",\n \"type\": \"base\",\n \"value\": null\n }\n ]\n },\n \"valueMappings\": []\n },\n \"targets\": [\n {\n \"expr\": \"kafka_partition_total_count{job=\\\"$cluster_id\\\", instance=\\\"$active_controller\\\"}\",\n \"legend\": \"Partitions\",\n \"maxDataPoints\": 240,\n \"refId\": \"A\"\n }\n ],\n \"transformations\": [\n {\n \"id\": \"organize\",\n \"options\": {}\n }\n ],\n \"type\": \"stat\",\n \"version\": \"3.0.0\"\n },\n {\n \"custom\": {\n \"calc\": \"lastNotNull\",\n \"colSpan\": 1,\n \"colorMode\": \"background\",\n \"graphMode\": \"none\",\n \"textMode\": \"valueAndName\",\n \"textSize\": {},\n \"valueField\": \"Value\"\n },\n \"datasourceCate\": \"prometheus\",\n \"datasourceValue\": \"${DS_PROMETHEUS}\",\n \"id\": \"b752e09e-4bc4-4e12-935e-d24f1d422a9b\",\n \"layout\": {\n \"h\": 4,\n \"i\": \"b752e09e-4bc4-4e12-935e-d24f1d422a9b\",\n \"isResizable\": true,\n \"w\": 2,\n \"x\": 10,\n \"y\": 4\n },\n \"links\": [],\n \"maxPerRow\": 4,\n \"options\": {\n \"standardOptions\": {\n \"decimals\": 0,\n \"util\": \"bytesIEC\"\n },\n \"thresholds\": {\n \"steps\": [\n {\n \"color\": \"#56A64B\",\n \"type\": \"base\",\n \"value\": null\n }\n ]\n },\n \"valueMappings\": []\n },\n \"targets\": [\n {\n \"expr\": \"sum(kafka_log_size{job=\\\"$cluster_id\\\"})\",\n \"legend\": \"Size\",\n \"maxDataPoints\": 240,\n \"refId\": \"A\"\n }\n ],\n \"transformations\": [\n {\n \"id\": \"organize\",\n \"options\": {}\n }\n ],\n \"type\": \"stat\",\n \"version\": \"3.0.0\"\n },\n {\n \"custom\": {\n \"baseColor\": \"#9470FF\",\n \"calc\": \"lastNotNull\",\n \"serieWidth\": 70,\n \"sortOrder\": \"desc\"\n },\n \"datasourceCate\": \"prometheus\",\n \"datasourceValue\": \"${DS_PROMETHEUS}\",\n \"id\": \"7b8a904f-179f-4140-9ed4-d109271ec7af\",\n \"layout\": {\n \"h\": 5,\n \"i\": \"7b8a904f-179f-4140-9ed4-d109271ec7af\",\n \"isResizable\": true,\n \"w\": 5,\n \"x\": 0,\n \"y\": 8\n },\n \"links\": [],\n \"maxPerRow\": 4,\n \"name\": \"Group Count\",\n \"options\": {\n \"standardOptions\": {\n \"util\": \"none\"\n },\n \"valueMappings\": []\n },\n \"targets\": [\n {\n \"expr\": \"sum(kafka_group_count{job=\\\"$cluster_id\\\"})\",\n \"legend\": \"total\",\n \"maxDataPoints\": 240,\n \"refId\": \"A\"\n },\n {\n \"expr\": \"sum(kafka_group_stable_count{job=\\\"$cluster_id\\\"})\",\n \"legend\": \"stable\",\n \"maxDataPoints\": 240,\n \"refId\": \"D\"\n },\n {\n \"expr\": \"sum(kafka_group_dead_count{job=\\\"$cluster_id\\\"})\",\n \"legend\": \"dead\",\n \"maxDataPoints\": 240,\n \"refId\": \"B\"\n },\n {\n \"expr\": \"sum(kafka_group_empty_count{job=\\\"$cluster_id\\\"})\",\n \"legend\": \"empty\",\n \"maxDataPoints\": 240,\n \"refId\": \"C\"\n },\n {\n \"expr\": \"sum(kafka_group_preparing_rebalance_count{job=\\\"$cluster_id\\\"})\",\n \"legend\": \"prepare_rebalance\",\n \"maxDataPoints\": 240,\n \"refId\": \"E\"\n },\n {\n \"expr\": \"sum(kafka_group_completing_rebalance_count{job=\\\"$cluster_id\\\"})\",\n \"legend\": \"completing_rebalance\",\n \"maxDataPoints\": 240,\n \"refId\": \"F\"\n }\n ],\n \"transformations\": [\n {\n \"id\": \"organize\",\n \"options\": {}\n }\n ],\n \"type\": \"barGauge\",\n \"version\": \"3.0.0\"\n },\n {\n \"custom\": {\n \"calc\": \"lastNotNull\",\n \"colorMode\": \"value\",\n \"columns\": [],\n \"displayMode\": \"labelsOfSeriesToRows\",\n \"linkMode\": \"appendLinkColumn\",\n \"links\": [\n {\n \"title\": \"下钻\",\n \"url\": \"/built-in-components/dashboard/detail?__uuid__=1717556327172992000&TSDB=${DS_PROMETHEUS}\\u0026cluster_id=${cluster_id}\\u0026group_id=${__field.labels.consumer_group}\\u0026partition=all\\u0026topic=${__field.labels.topic}\"\n }\n ],\n \"showHeader\": true\n },\n \"datasourceCate\": \"prometheus\",\n \"datasourceValue\": \"${DS_PROMETHEUS}\",\n \"id\": \"b7cb494b-413f-4b12-ae1e-7da55b65d5ee\",\n \"layout\": {\n \"h\": 5,\n \"i\": \"b7cb494b-413f-4b12-ae1e-7da55b65d5ee\",\n \"isResizable\": true,\n \"w\": 19,\n \"x\": 5,\n \"y\": 8\n },\n \"links\": [],\n \"maxPerRow\": 4,\n \"name\": \"Consumer Lag\",\n \"options\": {\n \"standardOptions\": {},\n \"valueMappings\": [\n {\n \"match\": {\n \"special\": 0\n },\n \"result\": {\n \"color\": \"rgba(44, 157, 61, 1)\"\n },\n \"type\": \"special\"\n },\n {\n \"match\": {\n \"from\": 0\n },\n \"result\": {\n \"color\": \"rgba(228, 22, 22, 1)\"\n },\n \"type\": \"range\"\n }\n ]\n },\n \"overrides\": [\n {\n \"matcher\": {\n \"id\": \"byFrameRefID\"\n },\n \"properties\": {\n \"valueMappings\": []\n }\n }\n ],\n \"targets\": [\n {\n \"expr\": \"sum by(topic) (max by(topic, partition) (kafka_log_end_offset{job=\\\"$cluster_id\\\"}))\\n- on(topic) group_left(consumer_group)\\nsum by(consumer_group, topic) (max by(consumer_group, topic, partition) (kafka_group_commit_offset{job=\\\"$cluster_id\\\"}))\",\n \"legend\": \"\",\n \"maxDataPoints\": 240,\n \"refId\": \"A\"\n }\n ],\n \"transformations\": [\n {\n \"id\": \"organize\",\n \"options\": {\n \"renameByName\": {\n \"value\": \"lag\"\n }\n }\n }\n ],\n \"type\": \"table\",\n \"version\": \"3.0.0\"\n },\n {\n \"custom\": {\n \"aggrDimension\": [\n \"topic\"\n ],\n \"calc\": \"lastNotNull\",\n \"colorMode\": \"value\",\n \"displayMode\": \"labelValuesToRows\",\n \"linkMode\": \"appendLinkColumn\",\n \"links\": [\n {\n \"title\": \"下钻\",\n \"url\": \"/built-in-components/dashboard/detail?__uuid__=1717556327174664000&TSDB=${DS_PROMETHEUS}\\u0026cluster_id=${cluster_id}\\u0026topic=${__field.labels.topic}\"\n }\n ],\n \"showHeader\": true\n },\n \"datasourceCate\": \"prometheus\",\n \"datasourceValue\": \"${DS_PROMETHEUS}\",\n \"id\": \"90716481-5dd6-4c4e-8219-cbcb724a22d9\",\n \"layout\": {\n \"h\": 4,\n \"i\": \"90716481-5dd6-4c4e-8219-cbcb724a22d9\",\n \"isResizable\": true,\n \"w\": 24,\n \"x\": 0,\n \"y\": 13\n },\n \"links\": [],\n \"maxPerRow\": 4,\n \"name\": \"Topic Statistics\",\n \"options\": {\n \"standardOptions\": {\n \"decimals\": 2\n }\n },\n \"overrides\": [\n {\n \"matcher\": {\n \"id\": \"byFrameRefID\",\n \"value\": \"D\"\n },\n \"properties\": {\n \"standardOptions\": {\n \"decimals\": 2,\n \"util\": \"bytesIEC\"\n },\n \"valueMappings\": []\n }\n },\n {\n \"matcher\": {\n \"id\": \"byFrameRefID\",\n \"value\": \"A\"\n },\n \"properties\": {\n \"standardOptions\": {\n \"decimals\": 1,\n \"util\": \"bytesSecIEC\"\n }\n },\n \"type\": \"special\"\n },\n {\n \"matcher\": {\n \"id\": \"byFrameRefID\",\n \"value\": \"B\"\n },\n \"properties\": {\n \"standardOptions\": {\n \"decimals\": 1,\n \"util\": \"bytesSecIEC\"\n }\n },\n \"type\": \"special\"\n }\n ],\n \"targets\": [\n {\n \"expr\": \"sum by(topic) (rate(kafka_network_io_bytes_total{job=\\\"$cluster_id\\\", direction=\\\"in\\\"}[$__rate_interval]))\",\n \"legend\": \"Bytes in\",\n \"maxDataPoints\": 240,\n \"refId\": \"A\"\n },\n {\n \"expr\": \"sum by(topic) (rate(kafka_network_io_bytes_total{job=\\\"$cluster_id\\\", direction=\\\"out\\\"}[$__rate_interval]))\",\n \"legend\": \"Bytes out\",\n \"maxDataPoints\": 240,\n \"refId\": \"B\"\n },\n {\n \"expr\": \"sum by(topic) (rate(kafka_message_count_total{job=\\\"$cluster_id\\\", direction=\\\"in\\\"}[$__rate_interval]))\",\n \"legend\": \"Msgs in\",\n \"maxDataPoints\": 240,\n \"refId\": \"C\"\n },\n {\n \"expr\": \"sum by(topic) (kafka_log_size{job=\\\"$cluster_id\\\"})\",\n \"legend\": \"Size\",\n \"maxDataPoints\": 240,\n \"refId\": \"D\"\n }\n ],\n \"transformations\": [\n {\n \"id\": \"organize\",\n \"options\": {}\n }\n ],\n \"type\": \"table\",\n \"version\": \"3.0.0\"\n },\n {\n \"custom\": {\n \"aggrDimension\": [\n \"instance\"\n ],\n \"calc\": \"lastNotNull\",\n \"colorMode\": \"value\",\n \"displayMode\": \"labelValuesToRows\",\n \"linkMode\": \"appendLinkColumn\",\n \"links\": [\n {\n \"title\": \"下钻\",\n \"url\": \"/built-in-components/dashboard/detail?__uuid__=1717556327159415000&DS_PROMETHEUS=${DS_PROMETHEUS}\\u0026cluster_id=${cluster_id}\\u0026node_id=${__field.labels.instance}\"\n }\n ],\n \"showHeader\": true\n },\n \"datasourceCate\": \"prometheus\",\n \"datasourceValue\": \"${DS_PROMETHEUS}\",\n \"id\": \"a427c6d3-0fab-45c2-92e5-585e5435fcfe\",\n \"layout\": {\n \"h\": 6,\n \"i\": \"a427c6d3-0fab-45c2-92e5-585e5435fcfe\",\n \"isResizable\": true,\n \"w\": 24,\n \"x\": 0,\n \"y\": 17\n },\n \"links\": [],\n \"maxPerRow\": 4,\n \"name\": \"Broker Statistics\",\n \"options\": {\n \"standardOptions\": {}\n },\n \"overrides\": [\n {\n \"matcher\": {\n \"id\": \"byFrameRefID\",\n \"value\": \"C\"\n },\n \"properties\": {\n \"standardOptions\": {\n \"util\": \"bytesSecIEC\"\n }\n }\n },\n {\n \"matcher\": {\n \"id\": \"byFrameRefID\",\n \"value\": \"D\"\n },\n \"properties\": {\n \"standardOptions\": {\n \"util\": \"bytesSecIEC\"\n }\n },\n \"type\": \"special\"\n },\n {\n \"matcher\": {\n \"id\": \"byFrameRefID\",\n \"value\": \"H\"\n },\n \"properties\": {\n \"standardOptions\": {\n \"util\": \"milliseconds\"\n }\n },\n \"type\": \"special\"\n },\n {\n \"matcher\": {\n \"id\": \"byFrameRefID\",\n \"value\": \"I\"\n },\n \"properties\": {\n \"standardOptions\": {\n \"util\": \"milliseconds\"\n }\n },\n \"type\": \"special\"\n }\n ],\n \"targets\": [\n {\n \"expr\": \"sum by(instance) (kafka_partition_count{job=\\\"$cluster_id\\\"})\",\n \"legend\": \"Partitions\",\n \"maxDataPoints\": 240,\n \"refId\": \"A\"\n },\n {\n \"expr\": \"sum by(instance) (kafka_server_connection_count{job=\\\"$cluster_id\\\"})\",\n \"legend\": \"Connections\",\n \"maxDataPoints\": 240,\n \"refId\": \"B\"\n },\n {\n \"expr\": \"sum by(instance) (rate(kafka_network_io_bytes_total{job=\\\"$cluster_id\\\", direction=\\\"in\\\"}[$__rate_interval]))\",\n \"legend\": \"Bytes In\",\n \"maxDataPoints\": 240,\n \"refId\": \"C\"\n },\n {\n \"expr\": \"sum by(instance) (rate(kafka_network_io_bytes_total{job=\\\"$cluster_id\\\", direction=\\\"out\\\"}[$__rate_interval]))\",\n \"legend\": \"Bytes Out\",\n \"maxDataPoints\": 240,\n \"refId\": \"D\"\n },\n {\n \"expr\": \"sum by(instance) (rate(kafka_message_count_total{job=\\\"$cluster_id\\\", direction=\\\"in\\\"}[$__rate_interval]))\",\n \"legend\": \"Msgs In\",\n \"maxDataPoints\": 240,\n \"refId\": \"E\"\n },\n {\n \"expr\": \"sum by(instance) (rate(kafka_request_count_total{job=\\\"$cluster_id\\\", type=\\\"Produce\\\"}[$__rate_interval]))\",\n \"legend\": \"Produce\",\n \"maxDataPoints\": 240,\n \"refId\": \"F\"\n },\n {\n \"expr\": \"sum by(instance) (rate(kafka_request_count_total{job=\\\"$cluster_id\\\", type=\\\"Fetch\\\"}[$__rate_interval]))\",\n \"legend\": \"Fetch\",\n \"maxDataPoints\": 240,\n \"refId\": \"G\"\n },\n {\n \"expr\": \"sum by(instance) (kafka_request_time_99p_milliseconds{job=\\\"$cluster_id\\\", type=\\\"Produce\\\"})\",\n \"legend\": \"Produce P99\",\n \"maxDataPoints\": 240,\n \"refId\": \"H\"\n },\n {\n \"expr\": \"sum by(instance) (kafka_request_time_99p_milliseconds{job=\\\"$cluster_id\\\", type=\\\"Fetch\\\"})\",\n \"legend\": \"Fetch P99\",\n \"maxDataPoints\": 240,\n \"refId\": \"I\"\n },\n {\n \"expr\": \"sum by(instance) (rate(kafka_topic_request_failed_total{job=\\\"$cluster_id\\\", type=\\\"produce\\\"}[$__rate_interval]))\",\n \"legend\": \"Failed Produce\",\n \"maxDataPoints\": 240,\n \"refId\": \"J\"\n },\n {\n \"expr\": \"sum by(instance) (rate(kafka_topic_request_failed_total{job=\\\"$cluster_id\\\", type=\\\"fetch\\\"}[$__rate_interval]))\",\n \"legend\": \"Failed Fetch\",\n \"maxDataPoints\": 240,\n \"refId\": \"K\"\n },\n {\n \"expr\": \"sum by(instance) (rate(kafka_request_error_count_total{job=\\\"$cluster_id\\\", error!=\\\"NONE\\\"}[$__rate_interval]))\",\n \"legend\": \"Error Request\",\n \"maxDataPoints\": 240,\n \"refId\": \"L\"\n }\n ],\n \"transformations\": [\n {\n \"id\": \"organize\",\n \"options\": {\n \"renameByName\": {\n \"instance\": \"Node ID\"\n }\n }\n }\n ],\n \"type\": \"table\",\n \"version\": \"3.0.0\"\n }\n ],\n \"var\": [\n {\n \"definition\": \"prometheus\",\n \"name\": \"DS_PROMETHEUS\",\n \"type\": \"datasource\"\n },\n {\n \"allOption\": false,\n \"datasource\": {\n \"cate\": \"prometheus\",\n \"value\": \"${DS_PROMETHEUS}\"\n },\n \"definition\": \"label_values(process_runtime_jvm_cpu_utilization_ratio,job)\",\n \"hide\": false,\n \"multi\": false,\n \"name\": \"cluster_id\",\n \"reg\": \"\",\n \"type\": \"query\"\n },\n {\n \"datasource\": {\n \"cate\": \"prometheus\",\n \"value\": \"${DS_PROMETHEUS}\"\n },\n \"definition\": \"label_values(kafka_controller_active_count{job=\\\"$cluster_id\\\"} \\u003e 0, instance)\",\n \"hide\": false,\n \"multi\": false,\n \"name\": \"active_controller\",\n \"reg\": \"\",\n \"type\": \"query\"\n }\n ],\n \"version\": \"3.0.0\"\n },\n \"public\": 0,\n \"public_cate\": 0,\n \"bgids\": null,\n \"built_in\": 0,\n \"hide\": 0,\n \"uuid\": 1717556327162929000\n}"
},
{
"path": "integrations/AutoMQ/dashboards/detailed_metrics.json",
"content": "{\n \"id\": 0,\n \"group_id\": 0,\n \"name\": \"Detailed Metrics\",\n \"ident\": \"\",\n \"tags\": \"\",\n \"create_at\": 0,\n \"create_by\": \"\",\n \"update_at\": 0,\n \"update_by\": \"\",\n \"configs\": {\n \"links\": [],\n \"panels\": [\n {\n \"collapsed\": true,\n \"id\": \"d88272f7-f9f7-4a94-84f7-00a1b3674de9\",\n \"layout\": {\n \"h\": 1,\n \"i\": \"d88272f7-f9f7-4a94-84f7-00a1b3674de9\",\n \"isResizable\": false,\n \"w\": 24,\n \"x\": 0,\n \"y\": 0\n },\n \"name\": \"System Overview\",\n \"panels\": [],\n \"type\": \"row\",\n \"version\": \"3.0.0\"\n },\n {\n \"custom\": {\n \"drawStyle\": \"lines\",\n \"fillOpacity\": 0.1,\n \"gradientMode\": \"none\",\n \"lineInterpolation\": \"linear\",\n \"lineWidth\": 1,\n \"scaleDistribution\": {\n \"type\": \"linear\"\n },\n \"spanNulls\": false,\n \"stack\": \"off\"\n },\n \"datasourceCate\": \"prometheus\",\n \"datasourceValue\": \"${DS_PROMETHEUS}\",\n \"id\": \"299f918c-b627-44ab-bf3a-6291389acb72\",\n \"layout\": {\n \"h\": 5,\n \"i\": \"299f918c-b627-44ab-bf3a-6291389acb72\",\n \"isResizable\": true,\n \"w\": 12,\n \"x\": 0,\n \"y\": 1\n },\n \"links\": [],\n \"maxPerRow\": 4,\n \"name\": \"JVM CPU Utilization\",\n \"options\": {\n \"legend\": {\n \"behaviour\": \"showItem\",\n \"displayMode\": \"hidden\",\n \"placement\": \"bottom\"\n },\n \"standardOptions\": {\n \"util\": \"percentUnit\"\n },\n \"thresholds\": {\n \"steps\": [\n {\n \"color\": \"#73BF69\",\n \"type\": \"base\",\n \"value\": null\n }\n ]\n },\n \"tooltip\": {\n \"mode\": \"all\",\n \"sort\": \"desc\"\n },\n \"valueMappings\": []\n },\n \"overrides\": [\n {\n \"matcher\": {\n \"id\": \"byFrameRefID\"\n },\n \"properties\": {\n \"rightYAxisDisplay\": \"off\"\n }\n }\n ],\n \"targets\": [\n {\n \"expr\": \"process_runtime_jvm_cpu_utilization_ratio{job=\\\"$cluster_id\\\", instance=~\\\"$node_id\\\"}\",\n \"legend\": \"Node-{{instance}}\",\n \"maxDataPoints\": 240,\n \"refId\": \"A\"\n }\n ],\n \"transformations\": [\n {\n \"id\": \"organize\",\n \"options\": {}\n }\n ],\n \"type\": \"timeseries\",\n \"version\": \"3.0.0\"\n },\n {\n \"custom\": {\n \"drawStyle\": \"lines\",\n \"fillOpacity\": 0.1,\n \"gradientMode\": \"none\",\n \"lineInterpolation\": \"linear\",\n \"lineWidth\": 1,\n \"scaleDistribution\": {\n \"type\": \"linear\"\n },\n \"spanNulls\": false,\n \"stack\": \"off\"\n },\n \"datasourceCate\": \"prometheus\",\n \"datasourceValue\": \"${DS_PROMETHEUS}\",\n \"id\": \"c3f483df-3c9a-47d1-a02e-459bd61f832c\",\n \"layout\": {\n \"h\": 5,\n \"i\": \"bff120e4-a3d7-406e-acf8-0ccfbf5c9e0d\",\n \"isResizable\": true,\n \"w\": 12,\n \"x\": 12,\n \"y\": 1\n },\n \"links\": [],\n \"maxPerRow\": 4,\n \"name\": \"JVM Heap Memory Utilization\",\n \"options\": {\n \"legend\": {\n \"behaviour\": \"showItem\",\n \"displayMode\": \"hidden\",\n \"placement\": \"bottom\"\n },\n \"standardOptions\": {\n \"util\": \"percentUnit\"\n },\n \"thresholds\": {\n \"steps\": [\n {\n \"color\": \"#73BF69\",\n \"type\": \"base\",\n \"value\": null\n }\n ]\n },\n \"tooltip\": {\n \"mode\": \"all\",\n \"sort\": \"desc\"\n },\n \"valueMappings\": []\n },\n \"overrides\": [\n {\n \"matcher\": {\n \"id\": \"byFrameRefID\"\n },\n \"properties\": {\n \"rightYAxisDisplay\": \"off\"\n }\n }\n ],\n \"targets\": [\n {\n \"expr\": \"sum by(instance, type) (process_runtime_jvm_memory_usage_bytes{job=\\\"$cluster_id\\\", instance=~\\\"$node_id\\\", type=\\\"heap\\\"})\\n/\\nsum by(type, instance) (process_runtime_jvm_memory_limit_bytes{job=\\\"$cluster_id\\\", instance=~\\\"$node_id\\\", type=\\\"heap\\\"})\",\n \"legend\": \"Node-{{instance}}\",\n \"maxDataPoints\": 240,\n \"refId\": \"A\"\n }\n ],\n \"transformations\": [\n {\n \"id\": \"organize\",\n \"options\": {}\n }\n ],\n \"type\": \"timeseries\",\n \"version\": \"3.0.0\"\n },\n {\n \"custom\": {\n \"drawStyle\": \"lines\",\n \"fillOpacity\": 0,\n \"gradientMode\": \"none\",\n \"lineInterpolation\": \"linear\",\n \"lineWidth\": 1,\n \"scaleDistribution\": {\n \"type\": \"linear\"\n },\n \"spanNulls\": false,\n \"stack\": \"off\"\n },\n \"datasourceCate\": \"prometheus\",\n \"datasourceValue\": \"${DS_PROMETHEUS}\",\n \"id\": \"7fd86b25-a721-4e30-9495-93349d3dcc42\",\n \"layout\": {\n \"h\": 5,\n \"i\": \"4800354c-1360-49f1-859d-3fe54ecab27e\",\n \"isResizable\": true,\n \"w\": 8,\n \"x\": 0,\n \"y\": 6\n },\n \"links\": [],\n \"maxPerRow\": 4,\n \"name\": \"Memory Allocation\",\n \"options\": {\n \"legend\": {\n \"behaviour\": \"showItem\",\n \"displayMode\": \"list\",\n \"placement\": \"bottom\"\n },\n \"standardOptions\": {\n \"util\": \"percentUnit\"\n },\n \"thresholds\": {\n \"steps\": [\n {\n \"color\": \"#73BF69\",\n \"type\": \"base\",\n \"value\": null\n }\n ]\n },\n \"tooltip\": {\n \"mode\": \"all\",\n \"sort\": \"desc\"\n },\n \"valueMappings\": []\n },\n \"overrides\": [\n {\n \"matcher\": {\n \"id\": \"byFrameRefID\"\n },\n \"properties\": {\n \"rightYAxisDisplay\": \"off\"\n }\n }\n ],\n \"targets\": [\n {\n \"expr\": \"1 - sum by(job, instance) (kafka_stream_buffer_allocated_memory_size_bytes{job=\\\"$cluster_id\\\", instance=~\\\"$node_id\\\"}) / sum by(job, instance) (kafka_stream_buffer_used_memory_size_bytes{job=\\\"$cluster_id\\\", instance=~\\\"$node_id\\\"})\",\n \"legend\": \"\",\n \"maxDataPoints\": 240,\n \"refId\": \"A\"\n }\n ],\n \"transformations\": [\n {\n \"id\": \"organize\",\n \"options\": {}\n }\n ],\n \"type\": \"timeseries\",\n \"version\": \"3.0.0\"\n },\n {\n \"custom\": {\n \"drawStyle\": \"lines\",\n \"fillOpacity\": 0,\n \"gradientMode\": \"none\",\n \"lineInterpolation\": \"linear\",\n \"lineWidth\": 1,\n \"scaleDistribution\": {\n \"type\": \"linear\"\n },\n \"spanNulls\": false,\n \"stack\": \"off\"\n },\n \"datasourceCate\": \"prometheus\",\n \"datasourceValue\": \"${DS_PROMETHEUS}\",\n \"id\": \"aa626e9e-1a08-4d34-a5a9-2d6f6dc498ea\",\n \"layout\": {\n \"h\": 5,\n \"i\": \"aa626e9e-1a08-4d34-a5a9-2d6f6dc498ea\",\n \"isResizable\": true,\n \"w\": 8,\n \"x\": 8,\n \"y\": 6\n },\n \"links\": [],\n \"maxPerRow\": 4,\n \"name\": \"Memory Allocation Detailed\",\n \"options\": {\n \"legend\": {\n \"behaviour\": \"showItem\",\n \"displayMode\": \"list\",\n \"placement\": \"bottom\"\n },\n \"standardOptions\": {\n \"util\": \"bytesIEC\"\n },\n \"thresholds\": {\n \"steps\": [\n {\n \"color\": \"#73BF69\",\n \"type\": \"base\",\n \"value\": null\n }\n ]\n },\n \"tooltip\": {\n \"mode\": \"all\",\n \"sort\": \"desc\"\n },\n \"valueMappings\": []\n },\n \"overrides\": [\n {\n \"matcher\": {\n \"id\": \"byFrameRefID\"\n },\n \"properties\": {\n \"rightYAxisDisplay\": \"off\"\n }\n }\n ],\n \"targets\": [\n {\n \"expr\": \"sum by(job, instance, type) (kafka_stream_buffer_allocated_memory_size_bytes{job=\\\"$cluster_id\\\", instance=~\\\"$node_id\\\"})\",\n \"legend\": \"Node-{{instance}}#{{type}}\",\n \"maxDataPoints\": 240,\n \"refId\": \"A\"\n }\n ],\n \"transformations\": [\n {\n \"id\": \"organize\",\n \"options\": {}\n }\n ],\n \"type\": \"timeseries\",\n \"version\": \"3.0.0\"\n },\n {\n \"custom\": {\n \"drawStyle\": \"lines\",\n \"fillOpacity\": 0,\n \"gradientMode\": \"none\",\n \"lineInterpolation\": \"linear\",\n \"lineWidth\": 1,\n \"scaleDistribution\": {\n \"type\": \"linear\"\n },\n \"spanNulls\": false,\n \"stack\": \"off\"\n },\n \"datasourceCate\": \"prometheus\",\n \"datasourceValue\": \"${DS_PROMETHEUS}\",\n \"id\": \"77674110-158a-43cf-96e8-7b5566473c49\",\n \"layout\": {\n \"h\": 5,\n \"i\": \"77674110-158a-43cf-96e8-7b5566473c49\",\n \"isResizable\": true,\n \"w\": 8,\n \"x\": 16,\n \"y\": 6\n },\n \"links\": [],\n \"maxPerRow\": 4,\n \"name\": \"Cache Size\",\n \"options\": {\n \"legend\": {\n \"behaviour\": \"showItem\",\n \"displayMode\": \"list\",\n \"placement\": \"bottom\"\n },\n \"standardOptions\": {\n \"util\": \"bytesIEC\"\n },\n \"thresholds\": {\n \"steps\": [\n {\n \"color\": \"#73BF69\",\n \"type\": \"base\",\n \"value\": null\n }\n ]\n },\n \"tooltip\": {\n \"mode\": \"all\",\n \"sort\": \"desc\"\n },\n \"valueMappings\": []\n },\n \"overrides\": [\n {\n \"matcher\": {\n \"id\": \"byFrameRefID\"\n },\n \"properties\": {\n \"rightYAxisDisplay\": \"off\"\n }\n }\n ],\n \"targets\": [\n {\n \"expr\": \"sum by(job, instance) (kafka_stream_delta_wal_cache_size_bytes{job=\\\"$cluster_id\\\", instance=~\\\"$node_id\\\"})\",\n \"legend\": \"Node-{{instance}}#Delta_WAL_Cache\",\n \"maxDataPoints\": 240,\n \"refId\": \"A\"\n },\n {\n \"expr\": \"sum by(job, instance) (kafka_stream_block_cache_size_bytes{job=\\\"$cluster_id\\\", instance=~\\\"$node_id\\\"})\",\n \"legend\": \"Node-{{instance}}#Block_Cache\",\n \"maxDataPoints\": 240,\n \"refId\": \"B\"\n }\n ],\n \"transformations\": [\n {\n \"id\": \"organize\",\n \"options\": {}\n }\n ],\n \"type\": \"timeseries\",\n \"version\": \"3.0.0\"\n },\n {\n \"collapsed\": true,\n \"id\": \"11cbfa04-73ff-40e1-b577-ca4348c74993\",\n \"layout\": {\n \"h\": 1,\n \"i\": \"11cbfa04-73ff-40e1-b577-ca4348c74993\",\n \"isResizable\": false,\n \"w\": 24,\n \"x\": 0,\n \"y\": 11\n },\n \"name\": \"Kafka Requests\",\n \"panels\": [],\n \"type\": \"row\",\n \"version\": \"3.0.0\"\n },\n {\n \"custom\": {\n \"drawStyle\": \"lines\",\n \"fillOpacity\": 0.1,\n \"gradientMode\": \"none\",\n \"lineInterpolation\": \"linear\",\n \"lineWidth\": 1,\n \"scaleDistribution\": {\n \"type\": \"linear\"\n },\n \"spanNulls\": false,\n \"stack\": \"off\"\n },\n \"datasourceCate\": \"prometheus\",\n \"datasourceValue\": \"${DS_PROMETHEUS}\",\n \"id\": \"02ac7786-566c-4e24-bc84-213635a8b05f\",\n \"layout\": {\n \"h\": 7,\n \"i\": \"02ac7786-566c-4e24-bc84-213635a8b05f\",\n \"isResizable\": true,\n \"w\": 8,\n \"x\": 0,\n \"y\": 12\n },\n \"links\": [],\n \"maxPerRow\": 4,\n \"name\": \"Request Throughput\",\n \"options\": {\n \"legend\": {\n \"behaviour\": \"showItem\",\n \"displayMode\": \"list\",\n \"placement\": \"bottom\"\n },\n \"standardOptions\": {\n \"util\": \"none\"\n },\n \"thresholds\": {\n \"steps\": [\n {\n \"color\": \"#73BF69\",\n \"type\": \"base\",\n \"value\": null\n }\n ]\n },\n \"tooltip\": {\n \"mode\": \"all\",\n \"sort\": \"desc\"\n },\n \"valueMappings\": []\n },\n \"overrides\": [\n {\n \"matcher\": {\n \"id\": \"byFrameRefID\"\n },\n \"properties\": {\n \"rightYAxisDisplay\": \"off\"\n }\n }\n ],\n \"targets\": [\n {\n \"expr\": \"sum by(instance, job, type) (rate(kafka_request_count_total{job=\\\"$cluster_id\\\", instance=~\\\"$node_id\\\", type=~\\\"$request_type\\\"}[$__rate_interval]))\",\n \"legend\": \"Node-{{instance}}#{{type}}\",\n \"maxDataPoints\": 240,\n \"refId\": \"A\"\n }\n ],\n \"transformations\": [\n {\n \"id\": \"organize\",\n \"options\": {}\n }\n ],\n \"type\": \"timeseries\",\n \"version\": \"3.0.0\"\n },\n {\n \"custom\": {\n \"drawStyle\": \"lines\",\n \"fillOpacity\": 0.1,\n \"gradientMode\": \"none\",\n \"lineInterpolation\": \"linear\",\n \"lineWidth\": 1,\n \"scaleDistribution\": {\n \"type\": \"linear\"\n },\n \"spanNulls\": false,\n \"stack\": \"off\"\n },\n \"datasourceCate\": \"prometheus\",\n \"datasourceValue\": \"${DS_PROMETHEUS}\",\n \"id\": \"2e16284f-d7ae-4acc-98ee-05ee32c80d72\",\n \"layout\": {\n \"h\": 7,\n \"i\": \"2e16284f-d7ae-4acc-98ee-05ee32c80d72\",\n \"isResizable\": true,\n \"w\": 8,\n \"x\": 8,\n \"y\": 12\n },\n \"links\": [],\n \"maxPerRow\": 4,\n \"name\": \"Request Latency (Avg)\",\n \"options\": {\n \"legend\": {\n \"behaviour\": \"showItem\",\n \"displayMode\": \"list\",\n \"placement\": \"bottom\"\n },\n \"standardOptions\": {\n \"util\": \"milliseconds\"\n },\n \"thresholds\": {\n \"steps\": [\n {\n \"color\": \"#73BF69\",\n \"type\": \"base\",\n \"value\": null\n }\n ]\n },\n \"tooltip\": {\n \"mode\": \"all\",\n \"sort\": \"desc\"\n },\n \"valueMappings\": []\n },\n \"overrides\": [\n {\n \"matcher\": {\n \"id\": \"byFrameRefID\"\n },\n \"properties\": {\n \"rightYAxisDisplay\": \"off\"\n }\n }\n ],\n \"targets\": [\n {\n \"expr\": \"kafka_request_time_mean_milliseconds{job=\\\"$cluster_id\\\", instance=~\\\"$node_id\\\", type=~\\\"$request_type\\\"}\",\n \"legend\": \"Node-{{instance}}#{{type}}\",\n \"maxDataPoints\": 240,\n \"refId\": \"C\"\n }\n ],\n \"transformations\": [\n {\n \"id\": \"organize\",\n \"options\": {}\n }\n ],\n \"type\": \"timeseries\",\n \"version\": \"3.0.0\"\n },\n {\n \"custom\": {\n \"drawStyle\": \"lines\",\n \"fillOpacity\": 0.1,\n \"gradientMode\": \"none\",\n \"lineInterpolation\": \"linear\",\n \"lineWidth\": 1,\n \"scaleDistribution\": {\n \"type\": \"linear\"\n },\n \"spanNulls\": false,\n \"stack\": \"off\"\n },\n \"datasourceCate\": \"prometheus\",\n \"datasourceValue\": \"${DS_PROMETHEUS}\",\n \"id\": \"c1dfc44e-1ac9-4f28-b10e-c40077dd708a\",\n \"layout\": {\n \"h\": 7,\n \"i\": \"c1dfc44e-1ac9-4f28-b10e-c40077dd708a\",\n \"isResizable\": true,\n \"w\": 8,\n \"x\": 16,\n \"y\": 12\n },\n \"links\": [],\n \"maxPerRow\": 4,\n \"name\": \"Request Latency (P99)\",\n \"options\": {\n \"legend\": {\n \"behaviour\": \"showItem\",\n \"displayMode\": \"list\",\n \"placement\": \"bottom\"\n },\n \"standardOptions\": {\n \"util\": \"milliseconds\"\n },\n \"thresholds\": {\n \"steps\": [\n {\n \"color\": \"#73BF69\",\n \"type\": \"base\",\n \"value\": null\n }\n ]\n },\n \"tooltip\": {\n \"mode\": \"all\",\n \"sort\": \"desc\"\n },\n \"valueMappings\": []\n },\n \"overrides\": [\n {\n \"matcher\": {\n \"id\": \"byFrameRefID\"\n },\n \"properties\": {\n \"rightYAxisDisplay\": \"off\"\n }\n }\n ],\n \"targets\": [\n {\n \"expr\": \"kafka_request_time_99p_milliseconds{job=\\\"$cluster_id\\\", instance=~\\\"$node_id\\\", type=~\\\"$request_type\\\"}\",\n \"legend\": \"Node-{{instance}}#{{type}}\",\n \"maxDataPoints\": 240,\n \"refId\": \"C\"\n }\n ],\n \"transformations\": [\n {\n \"id\": \"organize\",\n \"options\": {}\n }\n ],\n \"type\": \"timeseries\",\n \"version\": \"3.0.0\"\n },\n {\n \"custom\": {\n \"drawStyle\": \"lines\",\n \"fillOpacity\": 0.1,\n \"gradientMode\": \"none\",\n \"lineInterpolation\": \"linear\",\n \"lineWidth\": 1,\n \"scaleDistribution\": {\n \"type\": \"linear\"\n },\n \"spanNulls\": false,\n \"stack\": \"off\"\n },\n \"datasourceCate\": \"prometheus\",\n \"datasourceValue\": \"${DS_PROMETHEUS}\",\n \"id\": \"e437d394-379d-41e7-9df3-9486b0380dde\",\n \"layout\": {\n \"h\": 6,\n \"i\": \"e437d394-379d-41e7-9df3-9486b0380dde\",\n \"isResizable\": true,\n \"w\": 12,\n \"x\": 0,\n \"y\": 19\n },\n \"links\": [],\n \"maxPerRow\": 4,\n \"name\": \"IO Thread Idle Ratio\",\n \"options\": {\n \"legend\": {\n \"behaviour\": \"showItem\",\n \"displayMode\": \"list\",\n \"placement\": \"bottom\"\n },\n \"standardOptions\": {\n \"util\": \"percentUnit\"\n },\n \"thresholds\": {\n \"steps\": [\n {\n \"color\": \"#73BF69\",\n \"type\": \"base\",\n \"value\": null\n }\n ]\n },\n \"tooltip\": {\n \"mode\": \"all\",\n \"sort\": \"desc\"\n },\n \"valueMappings\": []\n },\n \"overrides\": [\n {\n \"matcher\": {\n \"id\": \"byFrameRefID\"\n },\n \"properties\": {\n \"rightYAxisDisplay\": \"off\"\n }\n }\n ],\n \"targets\": [\n {\n \"expr\": \"kafka_io_threads_idle_rate_1m{job=\\\"$cluster_id\\\", instance=~\\\"$node_id\\\"}\",\n \"legend\": \"Node-{{instance}}\",\n \"maxDataPoints\": 240,\n \"refId\": \"B\"\n }\n ],\n \"transformations\": [\n {\n \"id\": \"organize\",\n \"options\": {}\n }\n ],\n \"type\": \"timeseries\",\n \"version\": \"3.0.0\"\n },\n {\n \"custom\": {\n \"drawStyle\": \"lines\",\n \"fillOpacity\": 0.1,\n \"gradientMode\": \"none\",\n \"lineInterpolation\": \"linear\",\n \"lineWidth\": 1,\n \"scaleDistribution\": {\n \"type\": \"linear\"\n },\n \"spanNulls\": false,\n \"stack\": \"off\"\n },\n \"datasourceCate\": \"prometheus\",\n \"datasourceValue\": \"${DS_PROMETHEUS}\",\n \"id\": \"1bb285b7-7d02-430e-9b66-7d985c87c32a\",\n \"layout\": {\n \"h\": 6,\n \"i\": \"1bb285b7-7d02-430e-9b66-7d985c87c32a\",\n \"isResizable\": true,\n \"w\": 12,\n \"x\": 12,\n \"y\": 19\n },\n \"links\": [],\n \"maxPerRow\": 4,\n \"name\": \"Network Thread Idle Ratio\",\n \"options\": {\n \"legend\": {\n \"behaviour\": \"showItem\",\n \"displayMode\": \"list\",\n \"placement\": \"bottom\"\n },\n \"standardOptions\": {\n \"util\": \"percentUnit\"\n },\n \"thresholds\": {\n \"steps\": [\n {\n \"color\": \"#73BF69\",\n \"type\": \"base\",\n \"value\": null\n }\n ]\n },\n \"tooltip\": {\n \"mode\": \"all\",\n \"sort\": \"desc\"\n },\n \"valueMappings\": []\n },\n \"overrides\": [\n {\n \"matcher\": {\n \"id\": \"byFrameRefID\"\n },\n \"properties\": {\n \"rightYAxisDisplay\": \"off\"\n }\n }\n ],\n \"targets\": [\n {\n \"expr\": \"kafka_network_threads_idle_rate{job=\\\"$cluster_id\\\", instance=~\\\"$node_id\\\"}\",\n \"legend\": \"Node-{{instance}}\",\n \"maxDataPoints\": 240,\n \"refId\": \"A\"\n }\n ],\n \"transformations\": [\n {\n \"id\": \"organize\",\n \"options\": {}\n }\n ],\n \"type\": \"timeseries\",\n \"version\": \"3.0.0\"\n },\n {\n \"collapsed\": true,\n \"id\": \"55b0d7fc-9ae3-4ae2-971a-593d49bb9650\",\n \"layout\": {\n \"h\": 1,\n \"i\": \"55b0d7fc-9ae3-4ae2-971a-593d49bb9650\",\n \"isResizable\": false,\n \"w\": 24,\n \"x\": 0,\n \"y\": 25\n },\n \"name\": \"S3Stream Request\",\n \"panels\": [],\n \"type\": \"row\",\n \"version\": \"3.0.0\"\n },\n {\n \"custom\": {\n \"drawStyle\": \"lines\",\n \"fillOpacity\": 0,\n \"gradientMode\": \"none\",\n \"lineInterpolation\": \"linear\",\n \"lineWidth\": 1,\n \"scaleDistribution\": {\n \"type\": \"linear\"\n },\n \"spanNulls\": false,\n \"stack\": \"off\"\n },\n \"datasourceCate\": \"prometheus\",\n \"datasourceValue\": \"${DS_PROMETHEUS}\",\n \"id\": \"fb96dfec-bbb8-4372-bc81-a57794a45e39\",\n \"layout\": {\n \"h\": 6,\n \"i\": \"fb96dfec-bbb8-4372-bc81-a57794a45e39\",\n \"isResizable\": true,\n \"w\": 8,\n \"x\": 0,\n \"y\": 26\n },\n \"links\": [],\n \"maxPerRow\": 4,\n \"name\": \"Request Throughput\",\n \"options\": {\n \"legend\": {\n \"behaviour\": \"showItem\",\n \"displayMode\": \"list\",\n \"placement\": \"bottom\"\n },\n \"standardOptions\": {\n \"util\": \"none\"\n },\n \"thresholds\": {\n \"steps\": [\n {\n \"color\": \"#73BF69\",\n \"type\": \"base\",\n \"value\": null\n }\n ]\n },\n \"tooltip\": {\n \"mode\": \"all\",\n \"sort\": \"desc\"\n },\n \"valueMappings\": []\n },\n \"overrides\": [\n {\n \"matcher\": {\n \"id\": \"byFrameRefID\"\n },\n \"properties\": {\n \"rightYAxisDisplay\": \"off\"\n }\n }\n ],\n \"targets\": [\n {\n \"expr\": \"sum by(job, instance, operation_name, operation_type) (rate(kafka_stream_operation_latency_count{job=\\\"$cluster_id\\\", instance=~\\\"$node_id\\\", operation_name=~\\\"$s3stream_request\\\", operation_type=\\\"S3Stream\\\"}[$__rate_interval]))\",\n \"legend\": \"Node-{{instance}}#{{operation_name}}\",\n \"maxDataPoints\": 240,\n \"refId\": \"A\"\n }\n ],\n \"transformations\": [\n {\n \"id\": \"organize\",\n \"options\": {}\n }\n ],\n \"type\": \"timeseries\",\n \"version\": \"3.0.0\"\n },\n {\n \"custom\": {\n \"drawStyle\": \"lines\",\n \"fillOpacity\": 0,\n \"gradientMode\": \"none\",\n \"lineInterpolation\": \"linear\",\n \"lineWidth\": 1,\n \"scaleDistribution\": {\n \"type\": \"linear\"\n },\n \"spanNulls\": false,\n \"stack\": \"off\"\n },\n \"datasourceCate\": \"prometheus\",\n \"datasourceValue\": \"${DS_PROMETHEUS}\",\n \"id\": \"700efda2-c816-4014-b7fd-e02262e23218\",\n \"layout\": {\n \"h\": 6,\n \"i\": \"700efda2-c816-4014-b7fd-e02262e23218\",\n \"isResizable\": true,\n \"w\": 8,\n \"x\": 8,\n \"y\": 26\n },\n \"links\": [],\n \"maxPerRow\": 4,\n \"name\": \"Request Latency (Avg)\",\n \"options\": {\n \"legend\": {\n \"behaviour\": \"showItem\",\n \"displayMode\": \"list\",\n \"placement\": \"bottom\"\n },\n \"standardOptions\": {\n \"util\": \"none\"\n },\n \"thresholds\": {\n \"steps\": [\n {\n \"color\": \"#73BF69\",\n \"type\": \"base\",\n \"value\": null\n }\n ]\n },\n \"tooltip\": {\n \"mode\": \"all\",\n \"sort\": \"desc\"\n },\n \"valueMappings\": []\n },\n \"overrides\": [\n {\n \"matcher\": {\n \"id\": \"byFrameRefID\"\n },\n \"properties\": {\n \"rightYAxisDisplay\": \"off\"\n }\n }\n ],\n \"targets\": [\n {\n \"expr\": \"kafka_stream_operation_latency_mean_nanoseconds{job=\\\"$cluster_id\\\", instance=~\\\"$node_id\\\", operation_name=~\\\"$s3stream_request\\\", operation_type=\\\"S3Stream\\\"}\",\n \"legend\": \"Node-{{instance}}#{{operation_name}}\",\n \"maxDataPoints\": 240,\n \"refId\": \"A\"\n }\n ],\n \"transformations\": [\n {\n \"id\": \"organize\",\n \"options\": {}\n }\n ],\n \"type\": \"timeseries\",\n \"version\": \"3.0.0\"\n },\n {\n \"custom\": {\n \"drawStyle\": \"lines\",\n \"fillOpacity\": 0,\n \"gradientMode\": \"none\",\n \"lineInterpolation\": \"linear\",\n \"lineWidth\": 1,\n \"scaleDistribution\": {\n \"type\": \"linear\"\n },\n \"spanNulls\": false,\n \"stack\": \"off\"\n },\n \"datasourceCate\": \"prometheus\",\n \"datasourceValue\": \"${DS_PROMETHEUS}\",\n \"id\": \"74596486-1c73-46ad-be71-4c84f8782a8f\",\n \"layout\": {\n \"h\": 6,\n \"i\": \"74596486-1c73-46ad-be71-4c84f8782a8f\",\n \"isResizable\": true,\n \"w\": 8,\n \"x\": 16,\n \"y\": 26\n },\n \"links\": [],\n \"maxPerRow\": 4,\n \"name\": \"Request Latency (P99)\",\n \"options\": {\n \"legend\": {\n \"behaviour\": \"showItem\",\n \"displayMode\": \"list\",\n \"placement\": \"bottom\"\n },\n \"standardOptions\": {\n \"util\": \"none\"\n },\n \"thresholds\": {\n \"steps\": [\n {\n \"color\": \"#73BF69\",\n \"type\": \"base\",\n \"value\": null\n }\n ]\n },\n \"tooltip\": {\n \"mode\": \"all\",\n \"sort\": \"desc\"\n },\n \"valueMappings\": []\n },\n \"overrides\": [\n {\n \"matcher\": {\n \"id\": \"byFrameRefID\"\n },\n \"properties\": {\n \"rightYAxisDisplay\": \"off\"\n }\n }\n ],\n \"targets\": [\n {\n \"expr\": \"kafka_stream_operation_latency_99p_nanoseconds{job=\\\"$cluster_id\\\", instance=~\\\"$node_id\\\", operation_name=~\\\"$s3stream_request\\\", operation_type=\\\"S3Stream\\\"}\",\n \"legend\": \"Node-{{instance}}#{{operation_name}}\",\n \"maxDataPoints\": 240,\n \"refId\": \"A\"\n }\n ],\n \"transformations\": [\n {\n \"id\": \"organize\",\n \"options\": {}\n }\n ],\n \"type\": \"timeseries\",\n \"version\": \"3.0.0\"\n },\n {\n \"collapsed\": true,\n \"id\": \"5cfbeac7-6507-4d22-8ad3-5ceb37b70c55\",\n \"layout\": {\n \"h\": 1,\n \"i\": \"5cfbeac7-6507-4d22-8ad3-5ceb37b70c55\",\n \"isResizable\": false,\n \"w\": 24,\n \"x\": 0,\n \"y\": 32\n },\n \"name\": \"S3 Request\",\n \"panels\": [],\n \"type\": \"row\",\n \"version\": \"3.0.0\"\n },\n {\n \"custom\": {\n \"drawStyle\": \"lines\",\n \"fillOpacity\": 0,\n \"lineInterpolation\": \"linear\",\n \"stack\": \"off\",\n \"version\": \"3.0.0\"\n },\n \"datasourceCate\": \"prometheus\",\n \"datasourceValue\": \"${DS_PROMETHEUS}\",\n \"id\": \"4f64e96e-bccf-43e0-b15b-4a3cf85c2555\",\n \"layout\": {\n \"h\": 6,\n \"i\": \"4f64e96e-bccf-43e0-b15b-4a3cf85c2555\",\n \"isResizable\": true,\n \"w\": 12,\n \"x\": 0,\n \"y\": 33\n },\n \"links\": [],\n \"maxPerRow\": 4,\n \"name\": \"Error Rate\",\n \"options\": {\n \"legend\": {\n \"displayMode\": \"list\",\n \"placement\": \"bottom\"\n },\n \"standardOptions\": {\n \"util\": \"none\"\n },\n \"thresholds\": {\n \"mode\": \"absolute\",\n \"steps\": [\n {\n \"color\": \"#73BF69\"\n },\n {\n \"color\": \"#F2495C\",\n \"value\": 0.1\n }\n ],\n \"style\": \"off\"\n },\n \"tooltip\": {\n \"mode\": \"all\",\n \"sort\": \"desc\"\n },\n \"valueMappings\": []\n },\n \"targets\": [\n {\n \"expr\": \"sum by(operation_name, instance) (rate(kafka_stream_operation_latency_count{job=\\\"$cluster_id\\\", instance=~\\\"$node_id\\\", operation_type=\\\"S3Request\\\", status=\\\"failed\\\"}[$__rate_interval]))\",\n \"legend\": \"Node-{{instance}}#{{operation_name}}\",\n \"refId\": \"A\"\n }\n ],\n \"type\": \"timeseries\",\n \"version\": \"3.0.0\"\n },\n {\n \"custom\": {\n \"drawStyle\": \"lines\",\n \"fillOpacity\": 0,\n \"gradientMode\": \"none\",\n \"lineInterpolation\": \"linear\",\n \"lineWidth\": 1,\n \"scaleDistribution\": {\n \"type\": \"linear\"\n },\n \"spanNulls\": false,\n \"stack\": \"off\"\n },\n \"datasourceCate\": \"prometheus\",\n \"datasourceValue\": \"${DS_PROMETHEUS}\",\n \"id\": \"ad31f321-fc64-4a40-8b63-cba3f82ee493\",\n \"layout\": {\n \"h\": 6,\n \"i\": \"ad31f321-fc64-4a40-8b63-cba3f82ee493\",\n \"isResizable\": true,\n \"w\": 12,\n \"x\": 12,\n \"y\": 33\n },\n \"links\": [],\n \"maxPerRow\": 4,\n \"name\": \"Request Throughput\",\n \"options\": {\n \"legend\": {\n \"behaviour\": \"showItem\",\n \"displayMode\": \"list\",\n \"placement\": \"bottom\"\n },\n \"standardOptions\": {\n \"util\": \"none\"\n },\n \"thresholds\": {\n \"steps\": [\n {\n \"color\": \"#73BF69\",\n \"type\": \"base\",\n \"value\": null\n }\n ]\n },\n \"tooltip\": {\n \"mode\": \"all\",\n \"sort\": \"desc\"\n },\n \"valueMappings\": []\n },\n \"overrides\": [\n {\n \"matcher\": {\n \"id\": \"byFrameRefID\"\n },\n \"properties\": {\n \"rightYAxisDisplay\": \"off\"\n }\n }\n ],\n \"targets\": [\n {\n \"expr\": \"sum by(job, instance, operation_name) (rate(kafka_stream_operation_latency_count{job=\\\"$cluster_id\\\", instance=~\\\"$node_id\\\", operation_name=~\\\"$s3request\\\", operation_type=\\\"S3Request\\\"}[$__rate_interval]))\",\n \"legend\": \"Node-{{instance}}#{{operation_name}}\",\n \"maxDataPoints\": 240,\n \"refId\": \"A\"\n }\n ],\n \"transformations\": [\n {\n \"id\": \"organize\",\n \"options\": {}\n }\n ],\n \"type\": \"timeseries\",\n \"version\": \"3.0.0\"\n },\n {\n \"custom\": {\n \"drawStyle\": \"lines\",\n \"fillOpacity\": 0,\n \"lineInterpolation\": \"linear\",\n \"stack\": \"off\",\n \"version\": \"3.0.0\"\n },\n \"datasourceCate\": \"prometheus\",\n \"datasourceValue\": \"${DS_PROMETHEUS}\",\n \"id\": \"91eb39ef-6c0c-4f97-a395-f2a282cf0f02\",\n \"layout\": {\n \"h\": 5,\n \"i\": \"91eb39ef-6c0c-4f97-a395-f2a282cf0f02\",\n \"isResizable\": true,\n \"w\": 12,\n \"x\": 0,\n \"y\": 39\n },\n \"links\": [],\n \"maxPerRow\": 4,\n \"name\": \"Request Latency (Avg)\",\n \"options\": {\n \"legend\": {\n \"displayMode\": \"list\",\n \"placement\": \"bottom\"\n },\n \"standardOptions\": {\n \"util\": \"none\"\n },\n \"thresholds\": {\n \"mode\": \"absolute\",\n \"steps\": [\n {\n \"color\": \"#73BF69\"\n },\n {\n \"color\": \"#F2495C\",\n \"value\": 80\n }\n ],\n \"style\": \"off\"\n },\n \"tooltip\": {\n \"mode\": \"all\",\n \"sort\": \"desc\"\n },\n \"valueMappings\": []\n },\n \"targets\": [\n {\n \"expr\": \"avg by(instance, operation_name) (kafka_stream_operation_latency_mean_nanoseconds{job=\\\"$cluster_id\\\", instance=~\\\"$node_id\\\", operation_name=~\\\"$s3request\\\", operation_type=\\\"S3Request\\\"})\",\n \"legend\": \"Node-{{instance}}#{{operation_name}}\",\n \"refId\": \"A\"\n }\n ],\n \"type\": \"timeseries\",\n \"version\": \"3.0.0\"\n },\n {\n \"custom\": {\n \"drawStyle\": \"lines\",\n \"fillOpacity\": 0,\n \"gradientMode\": \"none\",\n \"lineInterpolation\": \"linear\",\n \"lineWidth\": 1,\n \"scaleDistribution\": {\n \"type\": \"linear\"\n },\n \"spanNulls\": false,\n \"stack\": \"off\"\n },\n \"datasourceCate\": \"prometheus\",\n \"datasourceValue\": \"${DS_PROMETHEUS}\",\n \"id\": \"768b847a-214d-4fa0-bb25-465f12d53ef3\",\n \"layout\": {\n \"h\": 5,\n \"i\": \"768b847a-214d-4fa0-bb25-465f12d53ef3\",\n \"isResizable\": true,\n \"w\": 12,\n \"x\": 12,\n \"y\": 39\n },\n \"links\": [],\n \"maxPerRow\": 4,\n \"name\": \"Request Latency (P99)\",\n \"options\": {\n \"legend\": {\n \"behaviour\": \"showItem\",\n \"displayMode\": \"list\",\n \"placement\": \"bottom\"\n },\n \"standardOptions\": {\n \"util\": \"none\"\n },\n \"thresholds\": {\n \"steps\": [\n {\n \"color\": \"#73BF69\",\n \"type\": \"base\",\n \"value\": null\n }\n ]\n },\n \"tooltip\": {\n \"mode\": \"all\",\n \"sort\": \"desc\"\n },\n \"valueMappings\": []\n },\n \"overrides\": [\n {\n \"matcher\": {\n \"id\": \"byFrameRefID\"\n },\n \"properties\": {\n \"rightYAxisDisplay\": \"off\"\n }\n }\n ],\n \"targets\": [\n {\n \"expr\": \"avg by(instance, operation_name) (kafka_stream_operation_latency_99p_nanoseconds{job=\\\"$cluster_id\\\", instance=~\\\"$node_id\\\", operation_name=~\\\"$s3request\\\", operation_type=\\\"S3Request\\\"})\",\n \"legend\": \"Node-{{instance}}#{{operation_name}}\",\n \"maxDataPoints\": 240,\n \"refId\": \"A\"\n }\n ],\n \"transformations\": [\n {\n \"id\": \"organize\",\n \"options\": {}\n }\n ],\n \"type\": \"timeseries\",\n \"version\": \"3.0.0\"\n },\n {\n \"collapsed\": true,\n \"id\": \"0fc296de-7e62-4422-a2bf-193b11c3f66f\",\n \"layout\": {\n \"h\": 1,\n \"i\": \"0fc296de-7e62-4422-a2bf-193b11c3f66f\",\n \"isResizable\": false,\n \"w\": 24,\n \"x\": 0,\n \"y\": 44\n },\n \"name\": \"Delta WAL\",\n \"panels\": [],\n \"type\": \"row\",\n \"version\": \"3.0.0\"\n },\n {\n \"custom\": {\n \"drawStyle\": \"lines\",\n \"fillOpacity\": 0,\n \"gradientMode\": \"none\",\n \"lineInterpolation\": \"linear\",\n \"lineWidth\": 1,\n \"scaleDistribution\": {\n \"type\": \"linear\"\n },\n \"spanNulls\": false,\n \"stack\": \"off\"\n },\n \"datasourceCate\": \"prometheus\",\n \"datasourceValue\": \"${DS_PROMETHEUS}\",\n \"id\": \"f52eb9f4-198b-422b-b669-58c3684177a3\",\n \"layout\": {\n \"h\": 5,\n \"i\": \"f52eb9f4-198b-422b-b669-58c3684177a3\",\n \"isResizable\": true,\n \"w\": 12,\n \"x\": 0,\n \"y\": 45\n },\n \"links\": [],\n \"maxPerRow\": 4,\n \"name\": \"Request Throughput\",\n \"options\": {\n \"legend\": {\n \"behaviour\": \"showItem\",\n \"displayMode\": \"list\",\n \"placement\": \"bottom\"\n },\n \"standardOptions\": {\n \"util\": \"none\"\n },\n \"thresholds\": {\n \"steps\": [\n {\n \"color\": \"#73BF69\",\n \"type\": \"base\",\n \"value\": null\n }\n ]\n },\n \"tooltip\": {\n \"mode\": \"all\",\n \"sort\": \"desc\"\n },\n \"valueMappings\": []\n },\n \"overrides\": [\n {\n \"matcher\": {\n \"id\": \"byFrameRefID\"\n },\n \"properties\": {\n \"rightYAxisDisplay\": \"off\"\n }\n }\n ],\n \"targets\": [\n {\n \"expr\": \"sum by(instance, operation_name) (rate(kafka_stream_operation_latency_count{job=\\\"$cluster_id\\\", instance=~\\\"$node_id\\\", operation_name=~\\\"append_wal|append_wal_full\\\", operation_type=\\\"S3Storage\\\", stage=\\\"complete\\\"}[$__rate_interval]))\",\n \"legend\": \"Node-{{instance}}#{{operation_name}}\",\n \"maxDataPoints\": 240,\n \"refId\": \"A\"\n }\n ],\n \"transformations\": [\n {\n \"id\": \"organize\",\n \"options\": {}\n }\n ],\n \"type\": \"timeseries\",\n \"version\": \"3.0.0\"\n },\n {\n \"custom\": {\n \"drawStyle\": \"lines\",\n \"fillOpacity\": 0,\n \"gradientMode\": \"none\",\n \"lineInterpolation\": \"linear\",\n \"lineWidth\": 1,\n \"scaleDistribution\": {\n \"type\": \"linear\"\n },\n \"spanNulls\": false,\n \"stack\": \"off\"\n },\n \"datasourceCate\": \"prometheus\",\n \"datasourceValue\": \"${DS_PROMETHEUS}\",\n \"id\": \"bd378630-0756-4734-95ae-49b61d7ad45c\",\n \"layout\": {\n \"h\": 5,\n \"i\": \"bd378630-0756-4734-95ae-49b61d7ad45c\",\n \"isResizable\": true,\n \"w\": 12,\n \"x\": 12,\n \"y\": 45\n },\n \"links\": [],\n \"maxPerRow\": 4,\n \"name\": \"Request Latency\",\n \"options\": {\n \"legend\": {\n \"behaviour\": \"showItem\",\n \"displayMode\": \"list\",\n \"placement\": \"bottom\"\n },\n \"standardOptions\": {\n \"util\": \"none\"\n },\n \"thresholds\": {\n \"steps\": [\n {\n \"color\": \"#73BF69\",\n \"type\": \"base\",\n \"value\": null\n }\n ]\n },\n \"tooltip\": {\n \"mode\": \"all\",\n \"sort\": \"desc\"\n },\n \"valueMappings\": []\n },\n \"overrides\": [\n {\n \"matcher\": {\n \"id\": \"byFrameRefID\"\n },\n \"properties\": {\n \"rightYAxisDisplay\": \"off\"\n }\n }\n ],\n \"targets\": [\n {\n \"expr\": \"avg by(instance, operation_name, stage) (kafka_stream_operation_latency_mean_nanoseconds{job=\\\"$cluster_id\\\", instance=~\\\"$node_id\\\", operation_name=~\\\"append_wal\\\", operation_type=\\\"S3Storage\\\"})\",\n \"legend\": \"Node-{{instance}}#{{operation_name}}-{{stage}}_Avg\",\n \"maxDataPoints\": 240,\n \"refId\": \"A\"\n },\n {\n \"expr\": \"avg by(instance, operation_name, stage) (kafka_stream_operation_latency_99p_nanoseconds{job=\\\"$cluster_id\\\", instance=~\\\"$node_id\\\", operation_name=~\\\"append_wal\\\", operation_type=\\\"S3Storage\\\"})\",\n \"legend\": \"Node-{{instance}}#{{operation_name}}-{{stage}}_P99\",\n \"maxDataPoints\": 240,\n \"refId\": \"C\"\n }\n ],\n \"transformations\": [\n {\n \"id\": \"organize\",\n \"options\": {}\n }\n ],\n \"type\": \"timeseries\",\n \"version\": \"3.0.0\"\n },\n {\n \"collapsed\": true,\n \"id\": \"de311c0f-406e-45fb-b489-14fcb535332e\",\n \"layout\": {\n \"h\": 1,\n \"i\": \"de311c0f-406e-45fb-b489-14fcb535332e\",\n \"isResizable\": false,\n \"w\": 24,\n \"x\": 0,\n \"y\": 50\n },\n \"name\": \"Delta WAL Cache\",\n \"panels\": [],\n \"type\": \"row\",\n \"version\": \"3.0.0\"\n },\n {\n \"custom\": {\n \"drawStyle\": \"lines\",\n \"fillOpacity\": 0,\n \"gradientMode\": \"none\",\n \"lineInterpolation\": \"linear\",\n \"lineWidth\": 1,\n \"scaleDistribution\": {\n \"type\": \"linear\"\n },\n \"spanNulls\": false,\n \"stack\": \"off\"\n },\n \"datasourceCate\": \"prometheus\",\n \"datasourceValue\": \"${DS_PROMETHEUS}\",\n \"id\": \"94970a87-f173-4828-89ba-421c31b62252\",\n \"layout\": {\n \"h\": 5,\n \"i\": \"94970a87-f173-4828-89ba-421c31b62252\",\n \"isResizable\": true,\n \"w\": 8,\n \"x\": 0,\n \"y\": 51\n },\n \"links\": [],\n \"maxPerRow\": 4,\n \"name\": \"Request Throughput\",\n \"options\": {\n \"legend\": {\n \"behaviour\": \"showItem\",\n \"displayMode\": \"list\",\n \"placement\": \"bottom\"\n },\n \"standardOptions\": {\n \"util\": \"none\"\n },\n \"thresholds\": {\n \"steps\": [\n {\n \"color\": \"#73BF69\",\n \"type\": \"base\",\n \"value\": null\n }\n ]\n },\n \"tooltip\": {\n \"mode\": \"all\",\n \"sort\": \"desc\"\n },\n \"valueMappings\": []\n },\n \"overrides\": [\n {\n \"matcher\": {\n \"id\": \"byFrameRefID\"\n },\n \"properties\": {\n \"rightYAxisDisplay\": \"off\"\n }\n }\n ],\n \"targets\": [\n {\n \"expr\": \"sum by(job, instance, operation_name) (rate(kafka_stream_operation_latency_count{job=\\\"$cluster_id\\\", instance=~\\\"$node_id\\\", operation_name=~\\\"append_log_cache|append_log_cache_full\\\", operation_type=\\\"S3Storage\\\"}[$__rate_interval]))\",\n \"legend\": \"Node-{{instance}}#{{operation_name}}\",\n \"maxDataPoints\": 240,\n \"refId\": \"A\"\n },\n {\n \"expr\": \"sum by(job, instance, operation_name, status) (rate(kafka_stream_operation_latency_count{job=\\\"$cluster_id\\\", instance=~\\\"$node_id\\\", operation_type=\\\"S3Storage\\\", operation_name=\\\"read_log_cache\\\"}[$__rate_interval]))\",\n \"legend\": \"Node-{{instance}}#{{operation_name}}-{{status}}\",\n \"maxDataPoints\": 240,\n \"refId\": \"B\"\n }\n ],\n \"transformations\": [\n {\n \"id\": \"organize\",\n \"options\": {}\n }\n ],\n \"type\": \"timeseries\",\n \"version\": \"3.0.0\"\n },\n {\n \"custom\": {\n \"drawStyle\": \"lines\",\n \"fillOpacity\": 0,\n \"gradientMode\": \"none\",\n \"lineInterpolation\": \"linear\",\n \"lineWidth\": 1,\n \"scaleDistribution\": {\n \"type\": \"linear\"\n },\n \"spanNulls\": false,\n \"stack\": \"off\"\n },\n \"datasourceCate\": \"prometheus\",\n \"datasourceValue\": \"${DS_PROMETHEUS}\",\n \"id\": \"b3714360-1340-4088-80cd-587fdd847888\",\n \"layout\": {\n \"h\": 5,\n \"i\": \"b3714360-1340-4088-80cd-587fdd847888\",\n \"isResizable\": true,\n \"w\": 8,\n \"x\": 8,\n \"y\": 51\n },\n \"links\": [],\n \"maxPerRow\": 4,\n \"name\": \"Request Latency (Avg)\",\n \"options\": {\n \"legend\": {\n \"behaviour\": \"showItem\",\n \"displayMode\": \"list\",\n \"placement\": \"bottom\"\n },\n \"standardOptions\": {\n \"util\": \"none\"\n },\n \"thresholds\": {\n \"steps\": [\n {\n \"color\": \"#73BF69\",\n \"type\": \"base\",\n \"value\": null\n }\n ]\n },\n \"tooltip\": {\n \"mode\": \"all\",\n \"sort\": \"desc\"\n },\n \"valueMappings\": []\n },\n \"overrides\": [\n {\n \"matcher\": {\n \"id\": \"byFrameRefID\"\n },\n \"properties\": {\n \"rightYAxisDisplay\": \"off\"\n }\n }\n ],\n \"targets\": [\n {\n \"expr\": \"avg by(instance, operation_name) (kafka_stream_operation_latency_mean_nanoseconds{job=\\\"$cluster_id\\\", instance=~\\\"$node_id\\\", operation_name=~\\\"append_log_cache\\\", operation_type=\\\"S3Storage\\\"})\",\n \"legend\": \"Node-{{instance}}#{{operation_name}}\",\n \"maxDataPoints\": 240,\n \"refId\": \"A\"\n },\n {\n \"expr\": \"avg by(instance, operation_name, status) (kafka_stream_operation_latency_mean_nanoseconds{job=\\\"$cluster_id\\\", instance=~\\\"$node_id\\\", operation_name=\\\"read_log_cache\\\", operation_type=\\\"S3Storage\\\"})\",\n \"legend\": \"Node-{{instance}}#{{operation_name}}-{{status}}\",\n \"maxDataPoints\": 240,\n \"refId\": \"B\"\n }\n ],\n \"transformations\": [\n {\n \"id\": \"organize\",\n \"options\": {}\n }\n ],\n \"type\": \"timeseries\",\n \"version\": \"3.0.0\"\n },\n {\n \"custom\": {\n \"drawStyle\": \"lines\",\n \"fillOpacity\": 0,\n \"gradientMode\": \"none\",\n \"lineInterpolation\": \"linear\",\n \"lineWidth\": 1,\n \"scaleDistribution\": {\n \"type\": \"linear\"\n },\n \"spanNulls\": false,\n \"stack\": \"off\"\n },\n \"datasourceCate\": \"prometheus\",\n \"datasourceValue\": \"${DS_PROMETHEUS}\",\n \"id\": \"778750a6-c587-42d7-b7a2-9ab123ad2be8\",\n \"layout\": {\n \"h\": 5,\n \"i\": \"778750a6-c587-42d7-b7a2-9ab123ad2be8\",\n \"isResizable\": true,\n \"w\": 8,\n \"x\": 16,\n \"y\": 51\n },\n \"links\": [],\n \"maxPerRow\": 4,\n \"name\": \"Request Latency (P99)\",\n \"options\": {\n \"legend\": {\n \"behaviour\": \"showItem\",\n \"displayMode\": \"list\",\n \"placement\": \"bottom\"\n },\n \"standardOptions\": {\n \"util\": \"none\"\n },\n \"thresholds\": {\n \"steps\": [\n {\n \"color\": \"#73BF69\",\n \"type\": \"base\",\n \"value\": null\n }\n ]\n },\n \"tooltip\": {\n \"mode\": \"all\",\n \"sort\": \"desc\"\n },\n \"valueMappings\": []\n },\n \"overrides\": [\n {\n \"matcher\": {\n \"id\": \"byFrameRefID\"\n },\n \"properties\": {\n \"rightYAxisDisplay\": \"off\"\n }\n }\n ],\n \"targets\": [\n {\n \"expr\": \"avg by(instance, operation_name) (kafka_stream_operation_latency_99p_nanoseconds{job=\\\"$cluster_id\\\", instance=~\\\"$node_id\\\", operation_name=~\\\"append_log_cache\\\", operation_type=\\\"S3Storage\\\"})\",\n \"legend\": \"Node-{{instance}}#{{operation_name}}\",\n \"maxDataPoints\": 240,\n \"refId\": \"A\"\n },\n {\n \"expr\": \"avg by(instance, operation_name, status) (kafka_stream_operation_latency_99p_nanoseconds{job=\\\"$cluster_id\\\", instance=~\\\"$node_id\\\", operation_name=\\\"read_log_cache\\\", operation_type=\\\"S3Storage\\\"})\",\n \"legend\": \"Node-{{instance}}#{{operation_name}}-{{status}}\",\n \"maxDataPoints\": 240,\n \"refId\": \"B\"\n }\n ],\n \"transformations\": [\n {\n \"id\": \"organize\",\n \"options\": {}\n }\n ],\n \"type\": \"timeseries\",\n \"version\": \"3.0.0\"\n },\n {\n \"collapsed\": true,\n \"id\": \"7d25b5df-0130-4464-87eb-91939d141487\",\n \"layout\": {\n \"h\": 1,\n \"i\": \"7d25b5df-0130-4464-87eb-91939d141487\",\n \"isResizable\": false,\n \"w\": 24,\n \"x\": 0,\n \"y\": 56\n },\n \"name\": \"Upload WAL\",\n \"panels\": [],\n \"type\": \"row\",\n \"version\": \"3.0.0\"\n },\n {\n \"custom\": {\n \"drawStyle\": \"lines\",\n \"fillOpacity\": 0,\n \"gradientMode\": \"none\",\n \"lineInterpolation\": \"linear\",\n \"lineWidth\": 1,\n \"scaleDistribution\": {\n \"type\": \"linear\"\n },\n \"spanNulls\": false,\n \"stack\": \"off\"\n },\n \"datasourceCate\": \"prometheus\",\n \"datasourceValue\": \"${DS_PROMETHEUS}\",\n \"id\": \"c3cb53a0-80cf-43fa-b758-e41c5a354b33\",\n \"layout\": {\n \"h\": 6,\n \"i\": \"c3cb53a0-80cf-43fa-b758-e41c5a354b33\",\n \"isResizable\": true,\n \"w\": 12,\n \"x\": 0,\n \"y\": 57\n },\n \"links\": [],\n \"maxPerRow\": 4,\n \"name\": \"Upload WAL Throughput\",\n \"options\": {\n \"legend\": {\n \"behaviour\": \"showItem\",\n \"displayMode\": \"list\",\n \"placement\": \"bottom\"\n },\n \"standardOptions\": {\n \"util\": \"none\"\n },\n \"thresholds\": {\n \"steps\": [\n {\n \"color\": \"#73BF69\",\n \"type\": \"base\",\n \"value\": null\n }\n ]\n },\n \"tooltip\": {\n \"mode\": \"all\",\n \"sort\": \"desc\"\n },\n \"valueMappings\": []\n },\n \"overrides\": [\n {\n \"matcher\": {\n \"id\": \"byFrameRefID\"\n },\n \"properties\": {\n \"rightYAxisDisplay\": \"off\"\n }\n }\n ],\n \"targets\": [\n {\n \"expr\": \"sum by(job, instance, operation_name) (rate(kafka_stream_operation_latency_count{job=\\\"$cluster_id\\\", instance=~\\\"$node_id\\\", operation_name=~\\\"upload_wal|force_upload_wal\\\", operation_type=\\\"S3Storage\\\"}[$__rate_interval]))\",\n \"legend\": \"Node-{{instance}}#{{operation_name}}\",\n \"maxDataPoints\": 240,\n \"refId\": \"A\"\n }\n ],\n \"transformations\": [\n {\n \"id\": \"organize\",\n \"options\": {}\n }\n ],\n \"type\": \"timeseries\",\n \"version\": \"3.0.0\"\n },\n {\n \"custom\": {\n \"drawStyle\": \"lines\",\n \"fillOpacity\": 0,\n \"gradientMode\": \"none\",\n \"lineInterpolation\": \"linear\",\n \"lineWidth\": 1,\n \"scaleDistribution\": {\n \"type\": \"linear\"\n },\n \"spanNulls\": false,\n \"stack\": \"off\"\n },\n \"datasourceCate\": \"prometheus\",\n \"datasourceValue\": \"${DS_PROMETHEUS}\",\n \"id\": \"99715d27-cc5a-4625-aa37-f05594e7af58\",\n \"layout\": {\n \"h\": 6,\n \"i\": \"99715d27-cc5a-4625-aa37-f05594e7af58\",\n \"isResizable\": true,\n \"w\": 12,\n \"x\": 12,\n \"y\": 57\n },\n \"links\": [],\n \"maxPerRow\": 4,\n \"name\": \"Request Latency\",\n \"options\": {\n \"legend\": {\n \"behaviour\": \"showItem\",\n \"displayMode\": \"list\",\n \"placement\": \"bottom\"\n },\n \"standardOptions\": {\n \"util\": \"none\"\n },\n \"thresholds\": {\n \"steps\": [\n {\n \"color\": \"#73BF69\",\n \"type\": \"base\",\n \"value\": null\n }\n ]\n },\n \"tooltip\": {\n \"mode\": \"all\",\n \"sort\": \"desc\"\n },\n \"valueMappings\": []\n },\n \"overrides\": [\n {\n \"matcher\": {\n \"id\": \"byFrameRefID\"\n },\n \"properties\": {\n \"rightYAxisDisplay\": \"off\"\n }\n }\n ],\n \"targets\": [\n {\n \"expr\": \"avg by(instance, operation_name, stage) (kafka_stream_operation_latency_mean_nanoseconds{job=\\\"$cluster_id\\\", instance=~\\\"$node_id\\\", operation_name=~\\\"upload_wal|force_upload_wal\\\", operation_type=\\\"S3Storage\\\"})\",\n \"legend\": \"Node-{{instance}}#{{operation_name}}-{{stage}}_Avg\",\n \"maxDataPoints\": 240,\n \"refId\": \"A\"\n },\n {\n \"expr\": \"avg by(instance, operation_name, stage) (kafka_stream_operation_latency_99p_nanoseconds{job=\\\"$cluster_id\\\", instance=~\\\"$node_id\\\", operation_name=~\\\"upload_wal|force_upload_wal\\\", operation_type=\\\"S3Storage\\\"})\",\n \"legend\": \"Node-{{instance}}#{{operation_name}}-{{stage}}_P99\",\n \"maxDataPoints\": 240,\n \"refId\": \"C\"\n }\n ],\n \"transformations\": [\n {\n \"id\": \"organize\",\n \"options\": {}\n }\n ],\n \"type\": \"timeseries\",\n \"version\": \"3.0.0\"\n },\n {\n \"collapsed\": true,\n \"id\": \"debcdc1d-d36b-4992-a8d4-f9b02bf3299c\",\n \"layout\": {\n \"h\": 1,\n \"i\": \"debcdc1d-d36b-4992-a8d4-f9b02bf3299c\",\n \"isResizable\": false,\n \"w\": 24,\n \"x\": 0,\n \"y\": 63\n },\n \"name\": \"Block Cache\",\n \"panels\": [],\n \"type\": \"row\",\n \"version\": \"3.0.0\"\n },\n {\n \"custom\": {\n \"drawStyle\": \"lines\",\n \"fillOpacity\": 0,\n \"gradientMode\": \"none\",\n \"lineInterpolation\": \"linear\",\n \"lineWidth\": 1,\n \"scaleDistribution\": {\n \"type\": \"linear\"\n },\n \"spanNulls\": false,\n \"stack\": \"off\"\n },\n \"datasourceCate\": \"prometheus\",\n \"datasourceValue\": \"${DS_PROMETHEUS}\",\n \"id\": \"3afefad7-cd2d-4cb8-9071-6bebd067870d\",\n \"layout\": {\n \"h\": 5,\n \"i\": \"3afefad7-cd2d-4cb8-9071-6bebd067870d\",\n \"isResizable\": true,\n \"w\": 12,\n \"x\": 0,\n \"y\": 64\n },\n \"links\": [],\n \"maxPerRow\": 4,\n \"name\": \"Request Throughput\",\n \"options\": {\n \"legend\": {\n \"behaviour\": \"showItem\",\n \"displayMode\": \"list\",\n \"placement\": \"bottom\"\n },\n \"standardOptions\": {\n \"util\": \"none\"\n },\n \"thresholds\": {\n \"steps\": [\n {\n \"color\": \"#73BF69\",\n \"type\": \"base\",\n \"value\": null\n }\n ]\n },\n \"tooltip\": {\n \"mode\": \"all\",\n \"sort\": \"desc\"\n },\n \"valueMappings\": []\n },\n \"overrides\": [\n {\n \"matcher\": {\n \"id\": \"byFrameRefID\"\n },\n \"properties\": {\n \"rightYAxisDisplay\": \"off\"\n }\n }\n ],\n \"targets\": [\n {\n \"expr\": \"sum by(job, instance, operation_name, status) (rate(kafka_stream_operation_latency_count{job=\\\"$cluster_id\\\", instance=~\\\"$node_id\\\", operation_name=~\\\"read_block_cache\\\", operation_type=\\\"S3Storage\\\"}[$__rate_interval]))\",\n \"legend\": \"Node-{{instance}}#{{operation_name}}-{{status}}\",\n \"maxDataPoints\": 240,\n \"refId\": \"A\"\n }\n ],\n \"transformations\": [\n {\n \"id\": \"organize\",\n \"options\": {}\n }\n ],\n \"type\": \"timeseries\",\n \"version\": \"3.0.0\"\n },\n {\n \"custom\": {\n \"drawStyle\": \"lines\",\n \"fillOpacity\": 0,\n \"gradientMode\": \"none\",\n \"lineInterpolation\": \"linear\",\n \"lineWidth\": 1,\n \"scaleDistribution\": {\n \"type\": \"linear\"\n },\n \"spanNulls\": false,\n \"stack\": \"off\"\n },\n \"datasourceCate\": \"prometheus\",\n \"datasourceValue\": \"${DS_PROMETHEUS}\",\n \"id\": \"2aa45efb-e3d4-4a8c-996c-a23ecbedbfe7\",\n \"layout\": {\n \"h\": 5,\n \"i\": \"2aa45efb-e3d4-4a8c-996c-a23ecbedbfe7\",\n \"isResizable\": true,\n \"w\": 12,\n \"x\": 12,\n \"y\": 64\n },\n \"links\": [],\n \"maxPerRow\": 4,\n \"name\": \"Request Latency\",\n \"options\": {\n \"legend\": {\n \"behaviour\": \"showItem\",\n \"displayMode\": \"list\",\n \"placement\": \"bottom\"\n },\n \"standardOptions\": {\n \"util\": \"none\"\n },\n \"thresholds\": {\n \"steps\": [\n {\n \"color\": \"#73BF69\",\n \"type\": \"base\",\n \"value\": null\n }\n ]\n },\n \"tooltip\": {\n \"mode\": \"all\",\n \"sort\": \"desc\"\n },\n \"valueMappings\": []\n },\n \"overrides\": [\n {\n \"matcher\": {\n \"id\": \"byFrameRefID\"\n },\n \"properties\": {\n \"rightYAxisDisplay\": \"off\"\n }\n }\n ],\n \"targets\": [\n {\n \"expr\": \"avg by(instance, operation_name, status) (kafka_stream_operation_latency_mean_nanoseconds{job=\\\"$cluster_id\\\", instance=~\\\"$node_id\\\", operation_name=\\\"read_block_cache\\\", operation_type=\\\"S3Storage\\\"})\",\n \"legend\": \"Node-{{instance}}#{{operation_name}}-{{status}}_Avg\",\n \"maxDataPoints\": 240,\n \"refId\": \"A\"\n },\n {\n \"expr\": \"avg by(instance, operation_name, status) (kafka_stream_operation_latency_99p_nanoseconds{job=\\\"$cluster_id\\\", instance=~\\\"$node_id\\\", operation_name=\\\"read_block_cache\\\", operation_type=\\\"S3Storage\\\"})\",\n \"legend\": \"Node-{{instance}}#{{operation_name}}-{{status}}_P99\",\n \"maxDataPoints\": 240,\n \"refId\": \"C\"\n }\n ],\n \"transformations\": [\n {\n \"id\": \"organize\",\n \"options\": {}\n }\n ],\n \"type\": \"timeseries\",\n \"version\": \"3.0.0\"\n },\n {\n \"custom\": {\n \"drawStyle\": \"lines\",\n \"fillOpacity\": 0,\n \"gradientMode\": \"none\",\n \"lineInterpolation\": \"linear\",\n \"lineWidth\": 1,\n \"scaleDistribution\": {\n \"type\": \"linear\"\n },\n \"spanNulls\": false,\n \"stack\": \"off\"\n },\n \"datasourceCate\": \"prometheus\",\n \"datasourceValue\": \"${DS_PROMETHEUS}\",\n \"id\": \"46168b03-fae4-415c-b17e-28b40a436a1e\",\n \"layout\": {\n \"h\": 6,\n \"i\": \"46168b03-fae4-415c-b17e-28b40a436a1e\",\n \"isResizable\": true,\n \"w\": 8,\n \"x\": 0,\n \"y\": 69\n },\n \"links\": [],\n \"maxPerRow\": 4,\n \"name\": \"Read Ahead Request Throughput\",\n \"options\": {\n \"legend\": {\n \"behaviour\": \"showItem\",\n \"displayMode\": \"list\",\n \"placement\": \"bottom\"\n },\n \"standardOptions\": {\n \"util\": \"none\"\n },\n \"thresholds\": {\n \"steps\": [\n {\n \"color\": \"#73BF69\",\n \"type\": \"base\",\n \"value\": null\n }\n ]\n },\n \"tooltip\": {\n \"mode\": \"all\",\n \"sort\": \"desc\"\n },\n \"valueMappings\": []\n },\n \"overrides\": [\n {\n \"matcher\": {\n \"id\": \"byFrameRefID\"\n },\n \"properties\": {\n \"rightYAxisDisplay\": \"off\"\n }\n }\n ],\n \"targets\": [\n {\n \"expr\": \"sum by(job, instance, operation_name, status) (rate(kafka_stream_operation_latency_count{job=\\\"$cluster_id\\\", instance=~\\\"$node_id\\\", operation_name=\\\"read_ahead\\\", operation_type=\\\"S3Storage\\\"}[$__rate_interval]))\",\n \"legend\": \"Node-{{instance}}#{{operation_name}}-{{status}}\",\n \"maxDataPoints\": 240,\n \"refId\": \"A\"\n }\n ],\n \"transformations\": [\n {\n \"id\": \"organize\",\n \"options\": {}\n }\n ],\n \"type\": \"timeseries\",\n \"version\": \"3.0.0\"\n },\n {\n \"custom\": {\n \"drawStyle\": \"lines\",\n \"fillOpacity\": 0,\n \"gradientMode\": \"none\",\n \"lineInterpolation\": \"linear\",\n \"lineWidth\": 1,\n \"scaleDistribution\": {\n \"type\": \"linear\"\n },\n \"spanNulls\": false,\n \"stack\": \"off\"\n },\n \"datasourceCate\": \"prometheus\",\n \"datasourceValue\": \"${DS_PROMETHEUS}\",\n \"id\": \"1b7708a0-3e19-421a-8a22-155c78846797\",\n \"layout\": {\n \"h\": 6,\n \"i\": \"1b7708a0-3e19-421a-8a22-155c78846797\",\n \"isResizable\": true,\n \"w\": 8,\n \"x\": 8,\n \"y\": 69\n },\n \"links\": [],\n \"maxPerRow\": 4,\n \"name\": \"Read Ahead Throughput\",\n \"options\": {\n \"legend\": {\n \"behaviour\": \"showItem\",\n \"displayMode\": \"list\",\n \"placement\": \"bottom\"\n },\n \"standardOptions\": {\n \"util\": \"none\"\n },\n \"thresholds\": {\n \"steps\": [\n {\n \"color\": \"#73BF69\",\n \"type\": \"base\",\n \"value\": null\n }\n ]\n },\n \"tooltip\": {\n \"mode\": \"all\",\n \"sort\": \"desc\"\n },\n \"valueMappings\": []\n },\n \"overrides\": [\n {\n \"matcher\": {\n \"id\": \"byFrameRefID\"\n },\n \"properties\": {\n \"rightYAxisDisplay\": \"off\"\n }\n }\n ],\n \"targets\": [\n {\n \"expr\": \"sum by(job, instance) (rate(kafka_stream_read_ahead_size_sum_bytes{job=\\\"$cluster_id\\\", instance=~\\\"$node_id\\\"}[$__rate_interval]))\",\n \"legend\": \"Node-{{instance}}\",\n \"maxDataPoints\": 240,\n \"refId\": \"A\"\n }\n ],\n \"transformations\": [\n {\n \"id\": \"organize\",\n \"options\": {}\n }\n ],\n \"type\": \"timeseries\",\n \"version\": \"3.0.0\"\n },\n {\n \"custom\": {\n \"drawStyle\": \"lines\",\n \"fillOpacity\": 0,\n \"gradientMode\": \"none\",\n \"lineInterpolation\": \"linear\",\n \"lineWidth\": 1,\n \"scaleDistribution\": {\n \"type\": \"linear\"\n },\n \"spanNulls\": false,\n \"stack\": \"off\"\n },\n \"datasourceCate\": \"prometheus\",\n \"datasourceValue\": \"${DS_PROMETHEUS}\",\n \"id\": \"957402a2-77c2-46a7-8258-461b3c463345\",\n \"layout\": {\n \"h\": 6,\n \"i\": \"957402a2-77c2-46a7-8258-461b3c463345\",\n \"isResizable\": true,\n \"w\": 8,\n \"x\": 16,\n \"y\": 69\n },\n \"links\": [],\n \"maxPerRow\": 4,\n \"name\": \"Read Ahead Latency\",\n \"options\": {\n \"legend\": {\n \"behaviour\": \"showItem\",\n \"displayMode\": \"list\",\n \"placement\": \"bottom\"\n },\n \"standardOptions\": {\n \"util\": \"none\"\n },\n \"thresholds\": {\n \"steps\": [\n {\n \"color\": \"#73BF69\",\n \"type\": \"base\",\n \"value\": null\n }\n ]\n },\n \"tooltip\": {\n \"mode\": \"all\",\n \"sort\": \"desc\"\n },\n \"valueMappings\": []\n },\n \"overrides\": [\n {\n \"matcher\": {\n \"id\": \"byFrameRefID\"\n },\n \"properties\": {\n \"rightYAxisDisplay\": \"off\"\n }\n }\n ],\n \"targets\": [\n {\n \"expr\": \"avg by(instance, operation_name, status) (kafka_stream_operation_latency_mean_nanoseconds{job=\\\"$cluster_id\\\", instance=~\\\"$node_id\\\", operation_name=\\\"read_ahead\\\", operation_type=\\\"S3Storage\\\"})\",\n \"legend\": \"Node-{{instance}}#{{operation_name}}-{{status}}_Avg\",\n \"maxDataPoints\": 240,\n \"refId\": \"A\"\n },\n {\n \"expr\": \"avg by(instance, operation_name, status) (kafka_stream_operation_latency_99p_nanoseconds{job=\\\"$cluster_id\\\", instance=~\\\"$node_id\\\", operation_name=\\\"read_ahead\\\", operation_type=\\\"S3Storage\\\"})\",\n \"legend\": \"Node-{{instance}}#{{operation_name}}-{{status}}_P99\",\n \"maxDataPoints\": 240,\n \"refId\": \"C\"\n }\n ],\n \"transformations\": [\n {\n \"id\": \"organize\",\n \"options\": {}\n }\n ],\n \"type\": \"timeseries\",\n \"version\": \"3.0.0\"\n },\n {\n \"custom\": {\n \"drawStyle\": \"lines\",\n \"fillOpacity\": 0,\n \"gradientMode\": \"none\",\n \"lineInterpolation\": \"linear\",\n \"lineWidth\": 1,\n \"scaleDistribution\": {\n \"type\": \"linear\"\n },\n \"spanNulls\": false,\n \"stack\": \"off\"\n },\n \"datasourceCate\": \"prometheus\",\n \"datasourceValue\": \"${DS_PROMETHEUS}\",\n \"description\": \"\",\n \"id\": \"2f2fd063-d7d5-4bb9-9c8a-b0d5d41920a1\",\n \"layout\": {\n \"h\": 5,\n \"i\": \"2f2fd063-d7d5-4bb9-9c8a-b0d5d41920a1\",\n \"isResizable\": true,\n \"w\": 8,\n \"x\": 0,\n \"y\": 75\n },\n \"links\": [],\n \"maxPerRow\": 4,\n \"name\": \"Read Ahead Size Avg\",\n \"options\": {\n \"legend\": {\n \"behaviour\": \"showItem\",\n \"displayMode\": \"list\",\n \"placement\": \"bottom\"\n },\n \"standardOptions\": {\n \"util\": \"bytesIEC\"\n },\n \"thresholds\": {\n \"steps\": [\n {\n \"color\": \"#73BF69\",\n \"type\": \"base\",\n \"value\": null\n }\n ]\n },\n \"tooltip\": {\n \"mode\": \"all\",\n \"sort\": \"desc\"\n },\n \"valueMappings\": []\n },\n \"overrides\": [\n {\n \"matcher\": {\n \"id\": \"byFrameRefID\"\n },\n \"properties\": {\n \"rightYAxisDisplay\": \"off\"\n }\n }\n ],\n \"targets\": [\n {\n \"expr\": \"avg by(instance) (kafka_stream_read_ahead_size_mean_bytes{job=\\\"$cluster_id\\\", instance=~\\\"$node_id\\\"})\",\n \"legend\": \"Node-{{instance}}\",\n \"maxDataPoints\": 240,\n \"refId\": \"A\"\n }\n ],\n \"transformations\": [\n {\n \"id\": \"organize\",\n \"options\": {}\n }\n ],\n \"type\": \"timeseries\",\n \"version\": \"3.0.0\"\n },\n {\n \"custom\": {\n \"drawStyle\": \"lines\",\n \"fillOpacity\": 0,\n \"gradientMode\": \"none\",\n \"lineInterpolation\": \"linear\",\n \"lineWidth\": 1,\n \"scaleDistribution\": {\n \"type\": \"linear\"\n },\n \"spanNulls\": false,\n \"stack\": \"off\"\n },\n \"datasourceCate\": \"prometheus\",\n \"datasourceValue\": \"${DS_PROMETHEUS}\",\n \"id\": \"c2fa4768-45d7-4653-97ef-0c26d78ffe15\",\n \"layout\": {\n \"h\": 5,\n \"i\": \"c2fa4768-45d7-4653-97ef-0c26d78ffe15\",\n \"isResizable\": true,\n \"w\": 8,\n \"x\": 8,\n \"y\": 75\n },\n \"links\": [],\n \"maxPerRow\": 4,\n \"name\": \"Available Inflight Read Ahead Size\",\n \"options\": {\n \"legend\": {\n \"behaviour\": \"showItem\",\n \"displayMode\": \"list\",\n \"placement\": \"bottom\"\n },\n \"standardOptions\": {\n \"util\": \"bytesIEC\"\n },\n \"thresholds\": {\n \"steps\": [\n {\n \"color\": \"#73BF69\",\n \"type\": \"base\",\n \"value\": null\n }\n ]\n },\n \"tooltip\": {\n \"mode\": \"all\",\n \"sort\": \"desc\"\n },\n \"valueMappings\": []\n },\n \"overrides\": [\n {\n \"matcher\": {\n \"id\": \"byFrameRefID\"\n },\n \"properties\": {\n \"rightYAxisDisplay\": \"off\"\n }\n }\n ],\n \"targets\": [\n {\n \"expr\": \"sum by(job, instance) (kafka_stream_available_inflight_read_ahead_size_bytes{job=\\\"$cluster_id\\\", instance=~\\\"$node_id\\\"})\",\n \"legend\": \"Node-{{instance}}\",\n \"maxDataPoints\": 240,\n \"refId\": \"A\"\n }\n ],\n \"transformations\": [\n {\n \"id\": \"organize\",\n \"options\": {}\n }\n ],\n \"type\": \"timeseries\",\n \"version\": \"3.0.0\"\n },\n {\n \"custom\": {\n \"drawStyle\": \"lines\",\n \"fillOpacity\": 0,\n \"gradientMode\": \"none\",\n \"lineInterpolation\": \"linear\",\n \"lineWidth\": 1,\n \"scaleDistribution\": {\n \"type\": \"linear\"\n },\n \"spanNulls\": false,\n \"stack\": \"off\"\n },\n \"datasourceCate\": \"prometheus\",\n \"datasourceValue\": \"${DS_PROMETHEUS}\",\n \"description\": \"\",\n \"id\": \"3ecc36e8-5ad0-404b-a70e-b3a036ec3325\",\n \"layout\": {\n \"h\": 5,\n \"i\": \"3ecc36e8-5ad0-404b-a70e-b3a036ec3325\",\n \"isResizable\": true,\n \"w\": 8,\n \"x\": 16,\n \"y\": 75\n },\n \"links\": [],\n \"maxPerRow\": 4,\n \"name\": \"Read Ahead Throttle Time\",\n \"options\": {\n \"legend\": {\n \"behaviour\": \"showItem\",\n \"displayMode\": \"list\",\n \"placement\": \"bottom\"\n },\n \"standardOptions\": {\n \"util\": \"none\"\n },\n \"thresholds\": {\n \"steps\": [\n {\n \"color\": \"#73BF69\",\n \"type\": \"base\",\n \"value\": null\n }\n ]\n },\n \"tooltip\": {\n \"mode\": \"all\",\n \"sort\": \"desc\"\n },\n \"valueMappings\": []\n },\n \"overrides\": [\n {\n \"matcher\": {\n \"id\": \"byFrameRefID\"\n },\n \"properties\": {\n \"rightYAxisDisplay\": \"off\"\n }\n }\n ],\n \"targets\": [\n {\n \"expr\": \"avg by(instance) (kafka_stream_read_ahead_limiter_queue_time_mean_nanoseconds{job=\\\"$cluster_id\\\", instance=~\\\"$node_id\\\"})\",\n \"legend\": \"Node-{{instance}}_Avg\",\n \"maxDataPoints\": 240,\n \"refId\": \"A\"\n },\n {\n \"expr\": \"avg by(instance) (kafka_stream_read_ahead_limiter_queue_time_99p_nanoseconds{job=\\\"$cluster_id\\\", instance=~\\\"$node_id\\\"})\",\n \"legend\": \"Node-{{instance}}_P99\",\n \"maxDataPoints\": 240,\n \"refId\": \"B\"\n }\n ],\n \"transformations\": [\n {\n \"id\": \"organize\",\n \"options\": {}\n }\n ],\n \"type\": \"timeseries\",\n \"version\": \"3.0.0\"\n },\n {\n \"collapsed\": true,\n \"id\": \"8c0dcf14-6d8b-4525-a23e-07c7d4bcb116\",\n \"layout\": {\n \"h\": 1,\n \"i\": \"8c0dcf14-6d8b-4525-a23e-07c7d4bcb116\",\n \"isResizable\": false,\n \"w\": 24,\n \"x\": 0,\n \"y\": 80\n },\n \"name\": \"Networks\",\n \"panels\": [],\n \"type\": \"row\",\n \"version\": \"3.0.0\"\n },\n {\n \"custom\": {\n \"drawStyle\": \"lines\",\n \"fillOpacity\": 0.3,\n \"gradientMode\": \"none\",\n \"lineInterpolation\": \"linear\",\n \"lineWidth\": 1,\n \"scaleDistribution\": {\n \"type\": \"linear\"\n },\n \"spanNulls\": false,\n \"stack\": \"off\"\n },\n \"datasourceCate\": \"prometheus\",\n \"datasourceValue\": \"${DS_PROMETHEUS}\",\n \"id\": \"3c3878b8-665b-43ac-b59b-09457ea69114\",\n \"layout\": {\n \"h\": 6,\n \"i\": \"3c3878b8-665b-43ac-b59b-09457ea69114\",\n \"isResizable\": true,\n \"w\": 12,\n \"x\": 0,\n \"y\": 81\n },\n \"links\": [],\n \"maxPerRow\": 4,\n \"name\": \"Total Bytes In / Out\",\n \"options\": {\n \"legend\": {\n \"behaviour\": \"showItem\",\n \"displayMode\": \"list\",\n \"placement\": \"bottom\"\n },\n \"standardOptions\": {\n \"util\": \"none\"\n },\n \"thresholds\": {\n \"steps\": [\n {\n \"color\": \"#73BF69\",\n \"type\": \"base\",\n \"value\": null\n }\n ]\n },\n \"tooltip\": {\n \"mode\": \"all\",\n \"sort\": \"desc\"\n },\n \"valueMappings\": []\n },\n \"overrides\": [\n {\n \"matcher\": {\n \"id\": \"byFrameRefID\"\n },\n \"properties\": {\n \"rightYAxisDisplay\": \"off\"\n }\n }\n ],\n \"targets\": [\n {\n \"expr\": \"sum by(instance, job) (rate(kafka_stream_network_inbound_usage_bytes_total{job=\\\"$cluster_id\\\", instance=~\\\"$node_id\\\"}[$__rate_interval]))\",\n \"legend\": \"Node-{{instance}}#In\",\n \"maxDataPoints\": 240,\n \"refId\": \"A\"\n },\n {\n \"expr\": \"sum by(instance, job) (rate(kafka_stream_network_outbound_usage_bytes_total{job=\\\"$cluster_id\\\", instance=~\\\"$node_id\\\"}[$__rate_interval])) * -1\",\n \"legend\": \"Node-{{instance}}#Out\",\n \"maxDataPoints\": 240,\n \"refId\": \"B\"\n }\n ],\n \"transformations\": [\n {\n \"id\": \"organize\",\n \"options\": {}\n }\n ],\n \"type\": \"timeseries\",\n \"version\": \"3.0.0\"\n },\n {\n \"custom\": {\n \"drawStyle\": \"lines\",\n \"fillOpacity\": 0.3,\n \"gradientMode\": \"none\",\n \"lineInterpolation\": \"linear\",\n \"lineWidth\": 1,\n \"scaleDistribution\": {\n \"type\": \"linear\"\n },\n \"spanNulls\": false,\n \"stack\": \"off\"\n },\n \"datasourceCate\": \"prometheus\",\n \"datasourceValue\": \"${DS_PROMETHEUS}\",\n \"id\": \"a0f1b7de-5c7d-488e-8699-5839453ba1c1\",\n \"layout\": {\n \"h\": 6,\n \"i\": \"a0f1b7de-5c7d-488e-8699-5839453ba1c1\",\n \"isResizable\": true,\n \"w\": 12,\n \"x\": 12,\n \"y\": 81\n },\n \"links\": [],\n \"maxPerRow\": 4,\n \"name\": \"Bytes In / Out\",\n \"options\": {\n \"legend\": {\n \"behaviour\": \"showItem\",\n \"displayMode\": \"list\",\n \"placement\": \"bottom\"\n },\n \"standardOptions\": {\n \"util\": \"none\"\n },\n \"thresholds\": {\n \"steps\": [\n {\n \"color\": \"#73BF69\",\n \"type\": \"base\",\n \"value\": null\n }\n ]\n },\n \"tooltip\": {\n \"mode\": \"all\",\n \"sort\": \"desc\"\n },\n \"valueMappings\": []\n },\n \"overrides\": [\n {\n \"matcher\": {\n \"id\": \"byFrameRefID\"\n },\n \"properties\": {\n \"rightYAxisDisplay\": \"off\"\n }\n }\n ],\n \"targets\": [\n {\n \"expr\": \"sum by(instance, job) (rate(kafka_stream_download_size_bytes_total{job=\\\"$cluster_id\\\", instance=~\\\"$node_id\\\"}[$__rate_interval]))\",\n \"legend\": \"Node-{{instance}}#In_S3\",\n \"maxDataPoints\": 240,\n \"refId\": \"D\"\n },\n {\n \"expr\": \"sum by(instance, job) (rate(kafka_stream_upload_size_bytes_total{job=\\\"$cluster_id\\\", instance=~\\\"$node_id\\\"}[$__rate_interval])) * -1\",\n \"legend\": \"Node-{{instance}}#Out_S3\",\n \"maxDataPoints\": 240,\n \"refId\": \"C\"\n },\n {\n \"expr\": \"sum by(instance, job, direction) (rate(kafka_network_io_bytes_total{job=\\\"$cluster_id\\\", instance=~\\\"$node_id\\\", direction=\\\"in\\\"}[$__rate_interval]))\",\n \"legend\": \"Node-{{instance}}#In_Msg\",\n \"maxDataPoints\": 240,\n \"refId\": \"E\"\n },\n {\n \"expr\": \"sum by(instance, job, direction) (rate(kafka_network_io_bytes_total{job=\\\"$cluster_id\\\", instance=~\\\"$node_id\\\", direction=\\\"out\\\"}[$__rate_interval])) * -1\",\n \"legend\": \"Node-{{instance}}#Out_Msg\",\n \"maxDataPoints\": 240,\n \"refId\": \"F\"\n }\n ],\n \"transformations\": [\n {\n \"id\": \"organize\",\n \"options\": {}\n }\n ],\n \"type\": \"timeseries\",\n \"version\": \"3.0.0\"\n },\n {\n \"custom\": {\n \"drawStyle\": \"lines\",\n \"fillOpacity\": 0,\n \"gradientMode\": \"none\",\n \"lineInterpolation\": \"linear\",\n \"lineWidth\": 1,\n \"scaleDistribution\": {\n \"type\": \"linear\"\n },\n \"spanNulls\": false,\n \"stack\": \"off\"\n },\n \"datasourceCate\": \"prometheus\",\n \"datasourceValue\": \"${DS_PROMETHEUS}\",\n \"id\": \"40f8fcd4-8d2c-44b7-8697-abc455f3dbaf\",\n \"layout\": {\n \"h\": 6,\n \"i\": \"40f8fcd4-8d2c-44b7-8697-abc455f3dbaf\",\n \"isResizable\": true,\n \"w\": 12,\n \"x\": 0,\n \"y\": 87\n },\n \"links\": [],\n \"maxPerRow\": 4,\n \"name\": \"Available Bandwidth\",\n \"options\": {\n \"legend\": {\n \"behaviour\": \"showItem\",\n \"displayMode\": \"list\",\n \"placement\": \"bottom\"\n },\n \"standardOptions\": {\n \"util\": \"none\"\n },\n \"thresholds\": {\n \"steps\": [\n {\n \"color\": \"#73BF69\",\n \"type\": \"base\",\n \"value\": null\n }\n ]\n },\n \"tooltip\": {\n \"mode\": \"all\",\n \"sort\": \"desc\"\n },\n \"valueMappings\": []\n },\n \"overrides\": [\n {\n \"matcher\": {\n \"id\": \"byFrameRefID\"\n },\n \"properties\": {\n \"rightYAxisDisplay\": \"off\"\n }\n }\n ],\n \"targets\": [\n {\n \"expr\": \"sum by(instance, job) (kafka_stream_network_inbound_available_bandwidth_bytes{job=\\\"$cluster_id\\\", instance=~\\\"$node_id\\\"})\",\n \"legend\": \"Node-{{instance}}#In\",\n \"maxDataPoints\": 240,\n \"refId\": \"A\"\n },\n {\n \"expr\": \"sum by(instance, job) (kafka_stream_network_outbound_available_bandwidth_bytes{job=\\\"$cluster_id\\\", instance=~\\\"$node_id\\\"})\",\n \"legend\": \"Node-{{instance}}#Out\",\n \"maxDataPoints\": 240,\n \"refId\": \"B\"\n }\n ],\n \"transformations\": [\n {\n \"id\": \"organize\",\n \"options\": {}\n }\n ],\n \"type\": \"timeseries\",\n \"version\": \"3.0.0\"\n },\n {\n \"custom\": {\n \"drawStyle\": \"lines\",\n \"fillOpacity\": 0,\n \"gradientMode\": \"none\",\n \"lineInterpolation\": \"linear\",\n \"lineWidth\": 1,\n \"scaleDistribution\": {\n \"type\": \"linear\"\n },\n \"spanNulls\": false,\n \"stack\": \"off\"\n },\n \"datasourceCate\": \"prometheus\",\n \"datasourceValue\": \"${DS_PROMETHEUS}\",\n \"id\": \"2e1cc35b-aed8-498e-9ab2-1a06732921f8\",\n \"layout\": {\n \"h\": 6,\n \"i\": \"2e1cc35b-aed8-498e-9ab2-1a06732921f8\",\n \"isResizable\": true,\n \"w\": 12,\n \"x\": 12,\n \"y\": 87\n },\n \"links\": [],\n \"maxPerRow\": 4,\n \"name\": \"Network Limiter Queue Time\",\n \"options\": {\n \"legend\": {\n \"behaviour\": \"showItem\",\n \"displayMode\": \"list\",\n \"placement\": \"bottom\"\n },\n \"standardOptions\": {\n \"util\": \"none\"\n },\n \"thresholds\": {\n \"steps\": [\n {\n \"color\": \"#73BF69\",\n \"type\": \"base\",\n \"value\": null\n }\n ]\n },\n \"tooltip\": {\n \"mode\": \"all\",\n \"sort\": \"desc\"\n },\n \"valueMappings\": []\n },\n \"overrides\": [\n {\n \"matcher\": {\n \"id\": \"byFrameRefID\"\n },\n \"properties\": {\n \"rightYAxisDisplay\": \"off\"\n }\n }\n ],\n \"targets\": [\n {\n \"expr\": \"avg by(instance) (kafka_stream_network_inbound_limiter_queue_time_mean_nanoseconds{job=\\\"$cluster_id\\\", instance=~\\\"$node_id\\\"})\",\n \"legend\": \"Node-{{instance}}#In_Avg\",\n \"maxDataPoints\": 240,\n \"refId\": \"A\"\n },\n {\n \"expr\": \"avg by(instance) (kafka_stream_network_outbound_limiter_queue_time_mean_nanoseconds{job=\\\"$cluster_id\\\", instance=~\\\"$node_id\\\"})\",\n \"legend\": \"Node-{{instance}}#Out_Avg\",\n \"maxDataPoints\": 240,\n \"refId\": \"B\"\n },\n {\n \"expr\": \"avg by(instance) (kafka_stream_network_inbound_limiter_queue_time_99p_nanoseconds{job=\\\"$cluster_id\\\", instance=~\\\"$node_id\\\"})\",\n \"legend\": \"Node-{{instance}}#In_P99\",\n \"maxDataPoints\": 240,\n \"refId\": \"C\"\n },\n {\n \"expr\": \"avg by(instance) (kafka_stream_network_outbound_limiter_queue_time_99p_nanoseconds{job=\\\"$cluster_id\\\", instance=~\\\"$node_id\\\"})\",\n \"legend\": \"Node-{{instance}}#Out_P99\",\n \"maxDataPoints\": 240,\n \"refId\": \"D\"\n }\n ],\n \"transformations\": [\n {\n \"id\": \"organize\",\n \"options\": {}\n }\n ],\n \"type\": \"timeseries\",\n \"version\": \"3.0.0\"\n },\n {\n \"collapsed\": true,\n \"id\": \"3a5d1265-435f-4b55-a0ff-8d756abf2482\",\n \"layout\": {\n \"h\": 1,\n \"i\": \"3a5d1265-435f-4b55-a0ff-8d756abf2482\",\n \"isResizable\": false,\n \"w\": 24,\n \"x\": 0,\n \"y\": 93\n },\n \"name\": \"S3 Object\",\n \"panels\": [],\n \"type\": \"row\",\n \"version\": \"3.0.0\"\n },\n {\n \"custom\": {\n \"drawStyle\": \"lines\",\n \"fillOpacity\": 0,\n \"gradientMode\": \"none\",\n \"lineInterpolation\": \"linear\",\n \"lineWidth\": 1,\n \"scaleDistribution\": {\n \"type\": \"linear\"\n },\n \"spanNulls\": false,\n \"stack\": \"off\"\n },\n \"datasourceCate\": \"prometheus\",\n \"datasourceValue\": \"${DS_PROMETHEUS}\",\n \"id\": \"7890d4fb-abd0-4909-bf18-40aad3396865\",\n \"layout\": {\n \"h\": 5,\n \"i\": \"7890d4fb-abd0-4909-bf18-40aad3396865\",\n \"isResizable\": true,\n \"w\": 12,\n \"x\": 0,\n \"y\": 94\n },\n \"links\": [],\n \"maxPerRow\": 4,\n \"name\": \"S3 Object Count Total\",\n \"options\": {\n \"legend\": {\n \"behaviour\": \"showItem\",\n \"displayMode\": \"list\",\n \"placement\": \"bottom\"\n },\n \"standardOptions\": {\n \"util\": \"none\"\n },\n \"thresholds\": {\n \"steps\": [\n {\n \"color\": \"#73BF69\",\n \"type\": \"base\",\n \"value\": null\n }\n ]\n },\n \"tooltip\": {\n \"mode\": \"all\",\n \"sort\": \"desc\"\n },\n \"valueMappings\": []\n },\n \"overrides\": [\n {\n \"matcher\": {\n \"id\": \"byFrameRefID\"\n },\n \"properties\": {\n \"rightYAxisDisplay\": \"off\"\n }\n }\n ],\n \"targets\": [\n {\n \"expr\": \"sum by(state) (kafka_stream_s3_object_count{job=\\\"$cluster_id\\\"})\",\n \"legend\": \"__auto\",\n \"maxDataPoints\": 240,\n \"refId\": \"A\"\n }\n ],\n \"transformations\": [\n {\n \"id\": \"organize\",\n \"options\": {}\n }\n ],\n \"type\": \"timeseries\",\n \"version\": \"3.0.0\"\n },\n {\n \"custom\": {\n \"drawStyle\": \"lines\",\n \"fillOpacity\": 0,\n \"gradientMode\": \"none\",\n \"lineInterpolation\": \"linear\",\n \"lineWidth\": 1,\n \"scaleDistribution\": {\n \"type\": \"linear\"\n },\n \"spanNulls\": false,\n \"stack\": \"off\"\n },\n \"datasourceCate\": \"prometheus\",\n \"datasourceValue\": \"${DS_PROMETHEUS}\",\n \"id\": \"3cbffbbb-a527-4c70-88c3-a40e6da04a70\",\n \"layout\": {\n \"h\": 5,\n \"i\": \"3cbffbbb-a527-4c70-88c3-a40e6da04a70\",\n \"isResizable\": true,\n \"w\": 12,\n \"x\": 12,\n \"y\": 94\n },\n \"links\": [],\n \"maxPerRow\": 4,\n \"name\": \"S3 Object Size Total\",\n \"options\": {\n \"legend\": {\n \"behaviour\": \"showItem\",\n \"displayMode\": \"list\",\n \"placement\": \"bottom\"\n },\n \"standardOptions\": {\n \"util\": \"bytesIEC\"\n },\n \"thresholds\": {\n \"steps\": [\n {\n \"color\": \"#73BF69\",\n \"type\": \"base\",\n \"value\": null\n }\n ]\n },\n \"tooltip\": {\n \"mode\": \"all\",\n \"sort\": \"desc\"\n },\n \"valueMappings\": []\n },\n \"overrides\": [\n {\n \"matcher\": {\n \"id\": \"byFrameRefID\"\n },\n \"properties\": {\n \"rightYAxisDisplay\": \"off\"\n }\n }\n ],\n \"targets\": [\n {\n \"expr\": \"kafka_stream_s3_object_size_bytes{job=\\\"$cluster_id\\\"}\",\n \"legend\": \"Size\",\n \"maxDataPoints\": 240,\n \"refId\": \"A\"\n }\n ],\n \"transformations\": [\n {\n \"id\": \"organize\",\n \"options\": {}\n }\n ],\n \"type\": \"timeseries\",\n \"version\": \"3.0.0\"\n },\n {\n \"custom\": {\n \"drawStyle\": \"lines\",\n \"fillOpacity\": 0,\n \"gradientMode\": \"none\",\n \"lineInterpolation\": \"linear\",\n \"lineWidth\": 1,\n \"scaleDistribution\": {\n \"type\": \"linear\"\n },\n \"spanNulls\": false,\n \"stack\": \"off\"\n },\n \"datasourceCate\": \"prometheus\",\n \"datasourceValue\": \"${DS_PROMETHEUS}\",\n \"id\": \"86821c1e-4735-4a2a-8493-8e83bef54acb\",\n \"layout\": {\n \"h\": 5,\n \"i\": \"86821c1e-4735-4a2a-8493-8e83bef54acb\",\n \"isResizable\": true,\n \"w\": 12,\n \"x\": 0,\n \"y\": 99\n },\n \"links\": [],\n \"maxPerRow\": 4,\n \"name\": \"StreamSetObject Num\",\n \"options\": {\n \"legend\": {\n \"behaviour\": \"showItem\",\n \"displayMode\": \"list\",\n \"placement\": \"bottom\"\n },\n \"standardOptions\": {\n \"util\": \"none\"\n },\n \"thresholds\": {\n \"steps\": [\n {\n \"color\": \"#73BF69\",\n \"type\": \"base\",\n \"value\": null\n }\n ]\n },\n \"tooltip\": {\n \"mode\": \"all\",\n \"sort\": \"desc\"\n },\n \"valueMappings\": []\n },\n \"overrides\": [\n {\n \"matcher\": {\n \"id\": \"byFrameRefID\"\n },\n \"properties\": {\n \"rightYAxisDisplay\": \"off\"\n }\n }\n ],\n \"targets\": [\n {\n \"expr\": \"sum by(node_id) (kafka_stream_stream_set_object_num{job=\\\"$cluster_id\\\", node_id=~\\\"$node_id\\\"})\",\n \"legend\": \"Node-{{node_id}}\",\n \"maxDataPoints\": 240,\n \"refId\": \"A\"\n }\n ],\n \"transformations\": [\n {\n \"id\": \"organize\",\n \"options\": {}\n }\n ],\n \"type\": \"timeseries\",\n \"version\": \"3.0.0\"\n },\n {\n \"custom\": {\n \"drawStyle\": \"lines\",\n \"fillOpacity\": 0,\n \"gradientMode\": \"none\",\n \"lineInterpolation\": \"linear\",\n \"lineWidth\": 1,\n \"scaleDistribution\": {\n \"type\": \"linear\"\n },\n \"spanNulls\": false,\n \"stack\": \"off\"\n },\n \"datasourceCate\": \"prometheus\",\n \"datasourceValue\": \"${DS_PROMETHEUS}\",\n \"id\": \"d9608713-38c0-417a-a315-39e66177db50\",\n \"layout\": {\n \"h\": 5,\n \"i\": \"d9608713-38c0-417a-a315-39e66177db50\",\n \"isResizable\": true,\n \"w\": 12,\n \"x\": 12,\n \"y\": 99\n },\n \"links\": [],\n \"maxPerRow\": 4,\n \"name\": \"StreamObject Num\",\n \"options\": {\n \"legend\": {\n \"behaviour\": \"showItem\",\n \"displayMode\": \"list\",\n \"placement\": \"bottom\"\n },\n \"standardOptions\": {\n \"util\": \"none\"\n },\n \"thresholds\": {\n \"steps\": [\n {\n \"color\": \"#73BF69\",\n \"type\": \"base\",\n \"value\": null\n }\n ]\n },\n \"tooltip\": {\n \"mode\": \"all\",\n \"sort\": \"desc\"\n },\n \"valueMappings\": []\n },\n \"overrides\": [\n {\n \"matcher\": {\n \"id\": \"byFrameRefID\"\n },\n \"properties\": {\n \"rightYAxisDisplay\": \"off\"\n }\n }\n ],\n \"targets\": [\n {\n \"expr\": \"kafka_stream_stream_object_num{job=\\\"$cluster_id\\\"}\",\n \"legend\": \"Count\",\n \"maxDataPoints\": 240,\n \"refId\": \"A\"\n }\n ],\n \"transformations\": [\n {\n \"id\": \"organize\",\n \"options\": {}\n }\n ],\n \"type\": \"timeseries\",\n \"version\": \"3.0.0\"\n },\n {\n \"custom\": {\n \"drawStyle\": \"lines\",\n \"fillOpacity\": 0,\n \"gradientMode\": \"none\",\n \"lineInterpolation\": \"linear\",\n \"lineWidth\": 1,\n \"scaleDistribution\": {\n \"type\": \"linear\"\n },\n \"spanNulls\": false,\n \"stack\": \"off\"\n },\n \"datasourceCate\": \"prometheus\",\n \"datasourceValue\": \"${DS_PROMETHEUS}\",\n \"id\": \"f087fb68-3ef2-4dc0-a406-4ac554b630be\",\n \"layout\": {\n \"h\": 6,\n \"i\": \"f087fb68-3ef2-4dc0-a406-4ac554b630be\",\n \"isResizable\": true,\n \"w\": 8,\n \"x\": 0,\n \"y\": 104\n },\n \"links\": [],\n \"maxPerRow\": 4,\n \"name\": \"Get Object Throughput By Size\",\n \"options\": {\n \"legend\": {\n \"behaviour\": \"showItem\",\n \"displayMode\": \"list\",\n \"placement\": \"bottom\"\n },\n \"standardOptions\": {\n \"util\": \"none\"\n },\n \"thresholds\": {\n \"steps\": [\n {\n \"color\": \"#73BF69\",\n \"type\": \"base\",\n \"value\": null\n }\n ]\n },\n \"tooltip\": {\n \"mode\": \"all\",\n \"sort\": \"desc\"\n },\n \"valueMappings\": []\n },\n \"overrides\": [\n {\n \"matcher\": {\n \"id\": \"byFrameRefID\"\n },\n \"properties\": {\n \"rightYAxisDisplay\": \"off\"\n }\n }\n ],\n \"targets\": [\n {\n \"expr\": \"sum by(size, instance) (rate(kafka_stream_operation_latency_count{operation_type=\\\"S3Request\\\", operation_name=\\\"get_object\\\", job=\\\"$cluster_id\\\", instance=~\\\"$node_id\\\"}[$__rate_interval]))\",\n \"legend\": \"Node-{{instance}}#{{size}}\",\n \"maxDataPoints\": 240,\n \"refId\": \"A\"\n }\n ],\n \"transformations\": [\n {\n \"id\": \"organize\",\n \"options\": {}\n }\n ],\n \"type\": \"timeseries\",\n \"version\": \"3.0.0\"\n },\n {\n \"custom\": {\n \"drawStyle\": \"lines\",\n \"fillOpacity\": 0,\n \"gradientMode\": \"none\",\n \"lineInterpolation\": \"linear\",\n \"lineWidth\": 1,\n \"scaleDistribution\": {\n \"type\": \"linear\"\n },\n \"spanNulls\": false,\n \"stack\": \"off\"\n },\n \"datasourceCate\": \"prometheus\",\n \"datasourceValue\": \"${DS_PROMETHEUS}\",\n \"id\": \"434a445d-419a-4b59-a284-aee5faf7fe62\",\n \"layout\": {\n \"h\": 6,\n \"i\": \"434a445d-419a-4b59-a284-aee5faf7fe62\",\n \"isResizable\": true,\n \"w\": 8,\n \"x\": 8,\n \"y\": 104\n },\n \"links\": [],\n \"maxPerRow\": 4,\n \"name\": \"Get Object Request Latency Avg\",\n \"options\": {\n \"legend\": {\n \"behaviour\": \"showItem\",\n \"displayMode\": \"list\",\n \"placement\": \"bottom\"\n },\n \"standardOptions\": {\n \"util\": \"none\"\n },\n \"thresholds\": {\n \"steps\": [\n {\n \"color\": \"#73BF69\",\n \"type\": \"base\",\n \"value\": null\n }\n ]\n },\n \"tooltip\": {\n \"mode\": \"all\",\n \"sort\": \"desc\"\n },\n \"valueMappings\": []\n },\n \"overrides\": [\n {\n \"matcher\": {\n \"id\": \"byFrameRefID\"\n },\n \"properties\": {\n \"rightYAxisDisplay\": \"off\"\n }\n }\n ],\n \"targets\": [\n {\n \"expr\": \"avg by(instance, operation_name, size) (kafka_stream_operation_latency_mean_nanoseconds{job=\\\"$cluster_id\\\", instance=~\\\"$node_id\\\", operation_type=\\\"S3Request\\\", operation_name=\\\"get_object\\\"})\",\n \"legend\": \"Node-{{instance}}#{{operation_name}}-{{size}}\",\n \"maxDataPoints\": 240,\n \"refId\": \"A\"\n }\n ],\n \"transformations\": [\n {\n \"id\": \"organize\",\n \"options\": {}\n }\n ],\n \"type\": \"timeseries\",\n \"version\": \"3.0.0\"\n },\n {\n \"custom\": {\n \"drawStyle\": \"lines\",\n \"fillOpacity\": 0,\n \"gradientMode\": \"none\",\n \"lineInterpolation\": \"linear\",\n \"lineWidth\": 1,\n \"scaleDistribution\": {\n \"type\": \"linear\"\n },\n \"spanNulls\": false,\n \"stack\": \"off\"\n },\n \"datasourceCate\": \"prometheus\",\n \"datasourceValue\": \"${DS_PROMETHEUS}\",\n \"id\": \"90282958-1378-45e8-a535-6ac1d92a568d\",\n \"layout\": {\n \"h\": 6,\n \"i\": \"90282958-1378-45e8-a535-6ac1d92a568d\",\n \"isResizable\": true,\n \"w\": 8,\n \"x\": 16,\n \"y\": 104\n },\n \"links\": [],\n \"maxPerRow\": 4,\n \"name\": \"Get Object Request Latency P99\",\n \"options\": {\n \"legend\": {\n \"behaviour\": \"showItem\",\n \"displayMode\": \"list\",\n \"placement\": \"bottom\"\n },\n \"standardOptions\": {\n \"util\": \"none\"\n },\n \"thresholds\": {\n \"steps\": [\n {\n \"color\": \"#73BF69\",\n \"type\": \"base\",\n \"value\": null\n }\n ]\n },\n \"tooltip\": {\n \"mode\": \"all\",\n \"sort\": \"desc\"\n },\n \"valueMappings\": []\n },\n \"overrides\": [\n {\n \"matcher\": {\n \"id\": \"byFrameRefID\"\n },\n \"properties\": {\n \"rightYAxisDisplay\": \"off\"\n }\n }\n ],\n \"targets\": [\n {\n \"expr\": \"avg by(instance, operation_name, size) (kafka_stream_operation_latency_99p_nanoseconds{job=\\\"$cluster_id\\\", instance=~\\\"$node_id\\\", operation_type=\\\"S3Request\\\", operation_name=\\\"get_object\\\"})\",\n \"legend\": \"Node-{{instance}}#{{operation_name}}-{{size}}\",\n \"maxDataPoints\": 240,\n \"refId\": \"A\"\n }\n ],\n \"transformations\": [\n {\n \"id\": \"organize\",\n \"options\": {}\n }\n ],\n \"type\": \"timeseries\",\n \"version\": \"3.0.0\"\n },\n {\n \"custom\": {\n \"drawStyle\": \"lines\",\n \"fillOpacity\": 0,\n \"gradientMode\": \"none\",\n \"lineInterpolation\": \"linear\",\n \"lineWidth\": 1,\n \"scaleDistribution\": {\n \"type\": \"linear\"\n },\n \"spanNulls\": false,\n \"stack\": \"off\"\n },\n \"datasourceCate\": \"prometheus\",\n \"datasourceValue\": \"${DS_PROMETHEUS}\",\n \"id\": \"abff8180-66cf-48a0-a29a-ee17f8f01390\",\n \"layout\": {\n \"h\": 7,\n \"i\": \"abff8180-66cf-48a0-a29a-ee17f8f01390\",\n \"isResizable\": true,\n \"w\": 8,\n \"x\": 0,\n \"y\": 110\n },\n \"links\": [],\n \"maxPerRow\": 4,\n \"name\": \"Upload Object Throughput By Size\",\n \"options\": {\n \"legend\": {\n \"behaviour\": \"showItem\",\n \"displayMode\": \"list\",\n \"placement\": \"bottom\"\n },\n \"standardOptions\": {\n \"util\": \"none\"\n },\n \"thresholds\": {\n \"steps\": [\n {\n \"color\": \"#73BF69\",\n \"type\": \"base\",\n \"value\": null\n }\n ]\n },\n \"tooltip\": {\n \"mode\": \"all\",\n \"sort\": \"desc\"\n },\n \"valueMappings\": []\n },\n \"overrides\": [\n {\n \"matcher\": {\n \"id\": \"byFrameRefID\"\n },\n \"properties\": {\n \"rightYAxisDisplay\": \"off\"\n }\n }\n ],\n \"targets\": [\n {\n \"expr\": \"sum by(size, instance) (rate(kafka_stream_operation_latency_count{operation_type=\\\"S3Request\\\", operation_name=~\\\"put_object|upload_part\\\", job=\\\"$cluster_id\\\", instance=~\\\"$node_id\\\"}[$__rate_interval]))\",\n \"legend\": \"Node-{{instance}}#{{size}}\",\n \"maxDataPoints\": 240,\n \"refId\": \"A\"\n }\n ],\n \"transformations\": [\n {\n \"id\": \"organize\",\n \"options\": {}\n }\n ],\n \"type\": \"timeseries\",\n \"version\": \"3.0.0\"\n },\n {\n \"custom\": {\n \"drawStyle\": \"lines\",\n \"fillOpacity\": 0,\n \"gradientMode\": \"none\",\n \"lineInterpolation\": \"linear\",\n \"lineWidth\": 1,\n \"scaleDistribution\": {\n \"type\": \"linear\"\n },\n \"spanNulls\": false,\n \"stack\": \"off\"\n },\n \"datasourceCate\": \"prometheus\",\n \"datasourceValue\": \"${DS_PROMETHEUS}\",\n \"id\": \"4aff03b3-88f3-4ef0-99c9-9c97813ad474\",\n \"layout\": {\n \"h\": 7,\n \"i\": \"4aff03b3-88f3-4ef0-99c9-9c97813ad474\",\n \"isResizable\": true,\n \"w\": 8,\n \"x\": 8,\n \"y\": 110\n },\n \"links\": [],\n \"maxPerRow\": 4,\n \"name\": \"Put Object Request Latency Avg\",\n \"options\": {\n \"legend\": {\n \"behaviour\": \"showItem\",\n \"displayMode\": \"list\",\n \"placement\": \"bottom\"\n },\n \"standardOptions\": {\n \"util\": \"none\"\n },\n \"thresholds\": {\n \"steps\": [\n {\n \"color\": \"#73BF69\",\n \"type\": \"base\",\n \"value\": null\n }\n ]\n },\n \"tooltip\": {\n \"mode\": \"all\",\n \"sort\": \"desc\"\n },\n \"valueMappings\": []\n },\n \"overrides\": [\n {\n \"matcher\": {\n \"id\": \"byFrameRefID\"\n },\n \"properties\": {\n \"rightYAxisDisplay\": \"off\"\n }\n }\n ],\n \"targets\": [\n {\n \"expr\": \"avg by(instance, size) (kafka_stream_operation_latency_mean_nanoseconds{job=\\\"$cluster_id\\\", instance=~\\\"$node_id\\\", operation_type=\\\"S3Request\\\", operation_name=~\\\"put_object|upload_part\\\"})\",\n \"legend\": \"Node-{{instance}}#{{size}}\",\n \"maxDataPoints\": 240,\n \"refId\": \"A\"\n }\n ],\n \"transformations\": [\n {\n \"id\": \"organize\",\n \"options\": {}\n }\n ],\n \"type\": \"timeseries\",\n \"version\": \"3.0.0\"\n },\n {\n \"custom\": {\n \"drawStyle\": \"lines\",\n \"fillOpacity\": 0,\n \"gradientMode\": \"none\",\n \"lineInterpolation\": \"linear\",\n \"lineWidth\": 1,\n \"scaleDistribution\": {\n \"type\": \"linear\"\n },\n \"spanNulls\": false,\n \"stack\": \"off\"\n },\n \"datasourceCate\": \"prometheus\",\n \"datasourceValue\": \"${DS_PROMETHEUS}\",\n \"id\": \"bda7d930-ce56-4201-996c-a36ac54aaa8d\",\n \"layout\": {\n \"h\": 7,\n \"i\": \"bda7d930-ce56-4201-996c-a36ac54aaa8d\",\n \"isResizable\": true,\n \"w\": 8,\n \"x\": 16,\n \"y\": 110\n },\n \"links\": [],\n \"maxPerRow\": 4,\n \"name\": \"Put Object Request Latency P99\",\n \"options\": {\n \"legend\": {\n \"behaviour\": \"showItem\",\n \"displayMode\": \"list\",\n \"placement\": \"bottom\"\n },\n \"standardOptions\": {\n \"util\": \"none\"\n },\n \"thresholds\": {\n \"steps\": [\n {\n \"color\": \"#73BF69\",\n \"type\": \"base\",\n \"value\": null\n }\n ]\n },\n \"tooltip\": {\n \"mode\": \"all\",\n \"sort\": \"desc\"\n },\n \"valueMappings\": []\n },\n \"overrides\": [\n {\n \"matcher\": {\n \"id\": \"byFrameRefID\"\n },\n \"properties\": {\n \"rightYAxisDisplay\": \"off\"\n }\n }\n ],\n \"targets\": [\n {\n \"expr\": \"avg by(instance, size) (kafka_stream_operation_latency_99p_nanoseconds{job=\\\"$cluster_id\\\", instance=~\\\"$node_id\\\", operation_type=\\\"S3Request\\\", operation_name=~\\\"put_object|upload_part\\\"})\",\n \"legend\": \"Node-{{instance}}#{{size}}\",\n \"maxDataPoints\": 240,\n \"refId\": \"A\"\n }\n ],\n \"transformations\": [\n {\n \"id\": \"organize\",\n \"options\": {}\n }\n ],\n \"type\": \"timeseries\",\n \"version\": \"3.0.0\"\n },\n {\n \"collapsed\": true,\n \"id\": \"2bc4051b-eba3-4917-a30b-893d004069cf\",\n \"layout\": {\n \"h\": 1,\n \"i\": \"2bc4051b-eba3-4917-a30b-893d004069cf\",\n \"isResizable\": false,\n \"w\": 24,\n \"x\": 0,\n \"y\": 117\n },\n \"name\": \"Compaction\",\n \"panels\": [],\n \"type\": \"row\",\n \"version\": \"3.0.0\"\n },\n {\n \"custom\": {\n \"drawStyle\": \"lines\",\n \"fillOpacity\": 0.15,\n \"gradientMode\": \"none\",\n \"lineInterpolation\": \"linear\",\n \"lineWidth\": 1,\n \"scaleDistribution\": {\n \"type\": \"linear\"\n },\n \"spanNulls\": false,\n \"stack\": \"off\"\n },\n \"datasourceCate\": \"prometheus\",\n \"datasourceValue\": \"${DS_PROMETHEUS}\",\n \"id\": \"7c60cf60-593c-46f5-9e26-81851b3df023\",\n \"layout\": {\n \"h\": 6,\n \"i\": \"7c60cf60-593c-46f5-9e26-81851b3df023\",\n \"isResizable\": true,\n \"w\": 12,\n \"x\": 0,\n \"y\": 118\n },\n \"links\": [],\n \"maxPerRow\": 4,\n \"name\": \"Compaction Throughput\",\n \"options\": {\n \"legend\": {\n \"behaviour\": \"showItem\",\n \"displayMode\": \"list\",\n \"placement\": \"bottom\"\n },\n \"standardOptions\": {\n \"util\": \"none\"\n },\n \"thresholds\": {\n \"steps\": [\n {\n \"color\": \"#634CD9\",\n \"type\": \"base\",\n \"value\": null\n }\n ]\n },\n \"tooltip\": {\n \"mode\": \"all\",\n \"sort\": \"desc\"\n },\n \"valueMappings\": []\n },\n \"overrides\": [\n {\n \"matcher\": {\n \"id\": \"byFrameRefID\"\n },\n \"properties\": {\n \"rightYAxisDisplay\": \"off\"\n }\n }\n ],\n \"targets\": [\n {\n \"expr\": \"rate(kafka_stream_compaction_read_size_bytes_total{job=\\\"$cluster_id\\\", instance=~\\\"$node_id\\\"}[$__rate_interval])\",\n \"legend\": \"Node-{{instance}}#In\",\n \"maxDataPoints\": 240,\n \"refId\": \"A\"\n },\n {\n \"expr\": \"rate(kafka_stream_compaction_write_size_bytes_total{job=\\\"$cluster_id\\\", instance=~\\\"$node_id\\\"}[$__rate_interval]) * -1\",\n \"legend\": \"Node-{{instance}}#Out\",\n \"maxDataPoints\": 240,\n \"refId\": \"B\"\n }\n ],\n \"transformations\": [\n {\n \"id\": \"organize\",\n \"options\": {}\n }\n ],\n \"type\": \"timeseries\",\n \"version\": \"3.0.0\"\n },\n {\n \"collapsed\": true,\n \"id\": \"93d6e740-d0b6-42ac-8a4a-a7c513214916\",\n \"layout\": {\n \"h\": 1,\n \"i\": \"93d6e740-d0b6-42ac-8a4a-a7c513214916\",\n \"isResizable\": false,\n \"w\": 24,\n \"x\": 0,\n \"y\": 124\n },\n \"name\": \"Auto-Balancer\",\n \"panels\": [],\n \"type\": \"row\",\n \"version\": \"3.0.0\"\n },\n {\n \"custom\": {\n \"drawStyle\": \"lines\",\n \"fillOpacity\": 0,\n \"gradientMode\": \"none\",\n \"lineInterpolation\": \"linear\",\n \"lineWidth\": 1,\n \"scaleDistribution\": {\n \"type\": \"linear\"\n },\n \"spanNulls\": false,\n \"stack\": \"off\"\n },\n \"datasourceCate\": \"prometheus\",\n \"datasourceValue\": \"${DS_PROMETHEUS}\",\n \"id\": \"4f70ad3c-ca70-4dc4-bfde-ab09ddd4fcc4\",\n \"layout\": {\n \"h\": 6,\n \"i\": \"4f70ad3c-ca70-4dc4-bfde-ab09ddd4fcc4\",\n \"isResizable\": true,\n \"w\": 12,\n \"x\": 0,\n \"y\": 125\n },\n \"links\": [],\n \"maxPerRow\": 4,\n \"name\": \"Metrics Delay\",\n \"options\": {\n \"legend\": {\n \"behaviour\": \"showItem\",\n \"displayMode\": \"list\",\n \"placement\": \"bottom\"\n },\n \"standardOptions\": {\n \"util\": \"milliseconds\"\n },\n \"thresholds\": {\n \"steps\": [\n {\n \"color\": \"#73BF69\",\n \"type\": \"base\",\n \"value\": null\n }\n ]\n },\n \"tooltip\": {\n \"mode\": \"all\",\n \"sort\": \"desc\"\n },\n \"valueMappings\": []\n },\n \"overrides\": [\n {\n \"matcher\": {\n \"id\": \"byFrameRefID\"\n },\n \"properties\": {\n \"rightYAxisDisplay\": \"off\"\n }\n }\n ],\n \"targets\": [\n {\n \"expr\": \"kafka_stream_auto_balancer_metrics_time_delay_milliseconds{job=\\\"$cluster_id\\\", node_id=~\\\"$node_id\\\"}\",\n \"legend\": \"Node-{{node_id}}\",\n \"maxDataPoints\": 240,\n \"refId\": \"A\"\n }\n ],\n \"transformations\": [\n {\n \"id\": \"organize\",\n \"options\": {}\n }\n ],\n \"type\": \"timeseries\",\n \"version\": \"3.0.0\"\n }\n ],\n \"var\": [\n {\n \"definition\": \"prometheus\",\n \"name\": \"DS_PROMETHEUS\",\n \"type\": \"datasource\"\n },\n {\n \"allOption\": false,\n \"datasource\": {\n \"cate\": \"prometheus\",\n \"value\": \"${DS_PROMETHEUS}\"\n },\n \"definition\": \"label_values(process_runtime_jvm_cpu_utilization_ratio,job)\",\n \"hide\": false,\n \"multi\": false,\n \"name\": \"cluster_id\",\n \"reg\": \"\",\n \"type\": \"query\"\n },\n {\n \"allOption\": true,\n \"datasource\": {\n \"cate\": \"prometheus\",\n \"value\": \"${DS_PROMETHEUS}\"\n },\n \"definition\": \"label_values(process_runtime_jvm_cpu_utilization_ratio,instance)\",\n \"hide\": false,\n \"multi\": true,\n \"name\": \"node_id\",\n \"reg\": \"/(^[0-9]*$)/\",\n \"type\": \"query\"\n },\n {\n \"allOption\": true,\n \"datasource\": {\n \"cate\": \"prometheus\",\n \"value\": \"${DS_PROMETHEUS}\"\n },\n \"definition\": \"label_values(kafka_request_count_total,type)\",\n \"hide\": false,\n \"multi\": true,\n \"name\": \"request_type\",\n \"reg\": \"\",\n \"type\": \"query\"\n },\n {\n \"allOption\": true,\n \"datasource\": {\n \"cate\": \"prometheus\",\n \"value\": \"${DS_PROMETHEUS}\"\n },\n \"definition\": \"label_values(kafka_stream_operation_latency_count{operation_type=\\\"S3Stream\\\"},operation_name)\",\n \"hide\": false,\n \"multi\": true,\n \"name\": \"s3stream_request\",\n \"reg\": \"\",\n \"type\": \"query\"\n },\n {\n \"allOption\": true,\n \"datasource\": {\n \"cate\": \"prometheus\",\n \"value\": \"${DS_PROMETHEUS}\"\n },\n \"definition\": \"label_values(kafka_stream_operation_latency_count{operation_type=\\\"S3Request\\\"},operation_name)\",\n \"hide\": false,\n \"multi\": true,\n \"name\": \"s3request\",\n \"reg\": \"\",\n \"type\": \"query\"\n }\n ],\n \"version\": \"3.0.0\"\n },\n \"public\": 0,\n \"public_cate\": 0,\n \"bgids\": null,\n \"built_in\": 0,\n \"hide\": 0,\n \"uuid\": 1717556327167247000\n}"
},
{
"path": "integrations/AutoMQ/dashboards/group_metrics.json",
"content": "{\n \"id\": 0,\n \"group_id\": 0,\n \"name\": \"Group Metrics\",\n \"ident\": \"automq-group-metrics\",\n \"tags\": \"\",\n \"create_at\": 0,\n \"create_by\": \"\",\n \"update_at\": 0,\n \"update_by\": \"\",\n \"configs\": {\n \"links\": [],\n \"panels\": [\n {\n \"custom\": {\n \"drawStyle\": \"lines\",\n \"fillOpacity\": 0,\n \"gradientMode\": \"none\",\n \"lineInterpolation\": \"linear\",\n \"lineWidth\": 1,\n \"scaleDistribution\": {\n \"type\": \"linear\"\n },\n \"spanNulls\": false,\n \"stack\": \"off\"\n },\n \"datasourceCate\": \"prometheus\",\n \"datasourceValue\": \"${TSDB}\",\n \"id\": \"cac8a249-bb61-4c2d-bc90-91a7dac58f3b\",\n \"layout\": {\n \"h\": 5,\n \"i\": \"cac8a249-bb61-4c2d-bc90-91a7dac58f3b\",\n \"isResizable\": true,\n \"w\": 12,\n \"x\": 0,\n \"y\": 0\n },\n \"links\": [],\n \"maxPerRow\": 4,\n \"name\": \"Consumer Throughput\",\n \"options\": {\n \"legend\": {\n \"behaviour\": \"showItem\",\n \"displayMode\": \"hidden\",\n \"placement\": \"bottom\"\n },\n \"standardOptions\": {\n \"util\": \"none\"\n },\n \"thresholds\": {\n \"steps\": [\n {\n \"color\": \"#73BF69\",\n \"type\": \"base\",\n \"value\": null\n }\n ]\n },\n \"tooltip\": {\n \"mode\": \"all\",\n \"sort\": \"desc\"\n },\n \"valueMappings\": []\n },\n \"overrides\": [\n {\n \"matcher\": {\n \"id\": \"byFrameRefID\"\n },\n \"properties\": {\n \"rightYAxisDisplay\": \"off\"\n }\n }\n ],\n \"targets\": [\n {\n \"expr\": \"sum by(consumer_group, topic, partition) (rate(kafka_group_commit_offset{job=\\\"$cluster_id\\\", consumer_group=~\\\"$group_id\\\", topic=~\\\"$topic\\\", partition=~\\\"$partition\\\"}[$__rate_interval]))\",\n \"legend\": \"{{consumer_group}}#{{topic}}-{{partition}}\",\n \"maxDataPoints\": 240,\n \"refId\": \"A\"\n }\n ],\n \"transformations\": [\n {\n \"id\": \"organize\",\n \"options\": {}\n }\n ],\n \"type\": \"timeseries\",\n \"version\": \"3.0.0\"\n },\n {\n \"custom\": {\n \"drawStyle\": \"lines\",\n \"fillOpacity\": 0,\n \"gradientMode\": \"none\",\n \"lineInterpolation\": \"linear\",\n \"lineWidth\": 1,\n \"scaleDistribution\": {\n \"type\": \"linear\"\n },\n \"spanNulls\": false,\n \"stack\": \"off\"\n },\n \"datasourceCate\": \"prometheus\",\n \"datasourceValue\": \"${TSDB}\",\n \"id\": \"fc0afd7c-0161-4ee4-88de-81c74f432769\",\n \"layout\": {\n \"h\": 5,\n \"i\": \"12e7bb88-2851-44ea-a311-44ebcdb0e7b7\",\n \"isResizable\": true,\n \"w\": 12,\n \"x\": 12,\n \"y\": 0\n },\n \"links\": [],\n \"maxPerRow\": 4,\n \"name\": \"Consumer Lag\",\n \"options\": {\n \"legend\": {\n \"behaviour\": \"showItem\",\n \"displayMode\": \"hidden\",\n \"placement\": \"bottom\"\n },\n \"standardOptions\": {\n \"util\": \"none\"\n },\n \"thresholds\": {\n \"steps\": [\n {\n \"color\": \"#73BF69\",\n \"type\": \"base\",\n \"value\": null\n }\n ]\n },\n \"tooltip\": {\n \"mode\": \"all\",\n \"sort\": \"desc\"\n },\n \"valueMappings\": []\n },\n \"overrides\": [\n {\n \"matcher\": {\n \"id\": \"byFrameRefID\"\n },\n \"properties\": {\n \"rightYAxisDisplay\": \"off\"\n }\n }\n ],\n \"targets\": [\n {\n \"expr\": \"sum by(topic) (max by(topic, partition) (kafka_log_end_offset{job=\\\"$cluster_id\\\", topic=~\\\"$topic\\\", partition=~\\\"$partition\\\"}))\\n- on(topic) group_left(consumer_group)\\nsum by(consumer_group, topic) (max by(consumer_group, topic, partition) (kafka_group_commit_offset{job=\\\"$cluster_id\\\", consumer_group=~\\\"$group_id\\\", topic=~\\\"$topic\\\", partition=~\\\"$partition\\\"}))\",\n \"legend\": \"{{consumer_group}}#{{topic}}-{{partition}}\",\n \"maxDataPoints\": 240,\n \"refId\": \"A\"\n }\n ],\n \"transformations\": [\n {\n \"id\": \"organize\",\n \"options\": {}\n }\n ],\n \"type\": \"timeseries\",\n \"version\": \"3.0.0\"\n }\n ],\n \"var\": [\n {\n \"definition\": \"prometheus\",\n \"hide\": false,\n \"name\": \"TSDB\",\n \"type\": \"datasource\"\n },\n {\n \"datasource\": {\n \"cate\": \"prometheus\",\n \"value\": \"${TSDB}\"\n },\n \"definition\": \"label_values(process_runtime_jvm_cpu_utilization_ratio,job)\",\n \"hide\": false,\n \"multi\": false,\n \"name\": \"cluster_id\",\n \"reg\": \"\",\n \"type\": \"query\"\n },\n {\n \"allOption\": true,\n \"datasource\": {\n \"cate\": \"prometheus\",\n \"value\": \"${TSDB}\"\n },\n \"definition\": \"label_values(kafka_group_commit_offset,consumer_group)\",\n \"hide\": false,\n \"multi\": true,\n \"name\": \"group_id\",\n \"reg\": \"\",\n \"type\": \"query\"\n },\n {\n \"allOption\": true,\n \"datasource\": {\n \"cate\": \"prometheus\",\n \"value\": \"${TSDB}\"\n },\n \"definition\": \"label_values(kafka_group_commit_offset,topic)\",\n \"hide\": false,\n \"multi\": true,\n \"name\": \"topic\",\n \"reg\": \"\",\n \"type\": \"query\"\n },\n {\n \"allOption\": true,\n \"datasource\": {\n \"cate\": \"prometheus\",\n \"value\": \"${TSDB}\"\n },\n \"definition\": \"label_values(kafka_group_commit_offset,partition)\",\n \"hide\": false,\n \"multi\": true,\n \"name\": \"partition\",\n \"reg\": \"\",\n \"type\": \"query\"\n }\n ],\n \"version\": \"3.0.0\"\n },\n \"public\": 0,\n \"public_cate\": 0,\n \"bgids\": null,\n \"built_in\": 0,\n \"hide\": 0,\n \"uuid\": 1717556327172992000\n}"
},
{
"path": "integrations/AutoMQ/dashboards/topic_metrics.json",
"content": "{\n \"id\": 0,\n \"group_id\": 0,\n \"name\": \"Topic Metrics\",\n \"ident\": \"automq-topic-metrics\",\n \"tags\": \"\",\n \"create_at\": 0,\n \"create_by\": \"\",\n \"update_at\": 0,\n \"update_by\": \"\",\n \"configs\": {\n \"links\": [],\n \"panels\": [\n {\n \"custom\": {\n \"calc\": \"lastNotNull\",\n \"colSpan\": 1,\n \"colorMode\": \"background\",\n \"graphMode\": \"none\",\n \"textMode\": \"valueAndName\",\n \"textSize\": {},\n \"valueField\": \"Value\"\n },\n \"datasourceCate\": \"prometheus\",\n \"datasourceValue\": \"${TSDB}\",\n \"id\": \"d4df5a68-ae8b-40e9-8f88-cd2e3f88e783\",\n \"layout\": {\n \"h\": 3,\n \"i\": \"d4df5a68-ae8b-40e9-8f88-cd2e3f88e783\",\n \"isResizable\": true,\n \"w\": 5,\n \"x\": 0,\n \"y\": 0\n },\n \"links\": [],\n \"maxPerRow\": 4,\n \"options\": {\n \"standardOptions\": {\n \"util\": \"none\"\n },\n \"thresholds\": {\n \"steps\": [\n {\n \"color\": \"rgba(44, 157, 61, 1)\",\n \"type\": \"base\",\n \"value\": null\n }\n ]\n },\n \"valueMappings\": []\n },\n \"targets\": [\n {\n \"expr\": \"sum by(job) (rate(kafka_network_io_bytes_total{job=\\\"$cluster_id\\\", topic=~\\\"$topic\\\", partition=~\\\"$partition\\\", direction=\\\"in\\\"}[$__rate_interval]))\",\n \"legend\": \"Bytes In Total\",\n \"maxDataPoints\": 240,\n \"refId\": \"A\"\n }\n ],\n \"transformations\": [\n {\n \"id\": \"organize\",\n \"options\": {}\n }\n ],\n \"type\": \"stat\",\n \"version\": \"3.0.0\"\n },\n {\n \"custom\": {\n \"calc\": \"lastNotNull\",\n \"colSpan\": 1,\n \"colorMode\": \"background\",\n \"graphMode\": \"none\",\n \"textMode\": \"valueAndName\",\n \"textSize\": {},\n \"valueField\": \"Value\"\n },\n \"datasourceCate\": \"prometheus\",\n \"datasourceValue\": \"${TSDB}\",\n \"id\": \"52e25ff6-5ef8-4237-a49d-85473f9f90af\",\n \"layout\": {\n \"h\": 3,\n \"i\": \"52e25ff6-5ef8-4237-a49d-85473f9f90af\",\n \"isResizable\": true,\n \"w\": 3,\n \"x\": 5,\n \"y\": 0\n },\n \"links\": [],\n \"maxPerRow\": 4,\n \"options\": {\n \"standardOptions\": {\n \"decimals\": 2,\n \"util\": \"bytesIEC\"\n },\n \"thresholds\": {\n \"steps\": [\n {\n \"color\": \"rgba(148, 112, 255, 1)\",\n \"type\": \"base\",\n \"value\": null\n }\n ]\n },\n \"valueMappings\": []\n },\n \"targets\": [\n {\n \"expr\": \"sum by(topic) (kafka_log_size{job=\\\"$cluster_id\\\", topic=~\\\"$topic\\\"})\",\n \"legend\": \"Size\",\n \"maxDataPoints\": 240,\n \"refId\": \"A\"\n }\n ],\n \"transformations\": [\n {\n \"id\": \"organize\",\n \"options\": {}\n }\n ],\n \"type\": \"stat\",\n \"version\": \"3.0.0\"\n },\n {\n \"custom\": {\n \"drawStyle\": \"lines\",\n \"fillOpacity\": 0.15,\n \"gradientMode\": \"none\",\n \"lineInterpolation\": \"linear\",\n \"lineWidth\": 1,\n \"scaleDistribution\": {\n \"type\": \"linear\"\n },\n \"spanNulls\": false,\n \"stack\": \"off\"\n },\n \"datasourceCate\": \"prometheus\",\n \"datasourceValue\": \"${TSDB}\",\n \"id\": \"75a6d933-f8d8-46f8-8cf0-9ef9dcc4e86b\",\n \"layout\": {\n \"h\": 6,\n \"i\": \"75a6d933-f8d8-46f8-8cf0-9ef9dcc4e86b\",\n \"isResizable\": true,\n \"w\": 8,\n \"x\": 8,\n \"y\": 0\n },\n \"links\": [],\n \"maxPerRow\": 4,\n \"name\": \"Messages In\",\n \"options\": {\n \"legend\": {\n \"behaviour\": \"showItem\",\n \"displayMode\": \"hidden\",\n \"placement\": \"bottom\"\n },\n \"standardOptions\": {\n \"util\": \"none\"\n },\n \"thresholds\": {\n \"steps\": [\n {\n \"color\": \"#73BF69\",\n \"type\": \"base\",\n \"value\": null\n }\n ]\n },\n \"tooltip\": {\n \"mode\": \"single\"\n },\n \"valueMappings\": []\n },\n \"overrides\": [\n {\n \"matcher\": {\n \"id\": \"byFrameRefID\"\n },\n \"properties\": {\n \"rightYAxisDisplay\": \"off\"\n }\n }\n ],\n \"targets\": [\n {\n \"expr\": \"sum by(topic) (rate(kafka_message_count_total{job=\\\"$cluster_id\\\", topic=~\\\"$topic\\\", direction=\\\"in\\\"}[$__rate_interval]))\",\n \"legend\": \"{{topic}}\",\n \"maxDataPoints\": 240,\n \"refId\": \"A\"\n }\n ],\n \"transformations\": [\n {\n \"id\": \"organize\",\n \"options\": {}\n }\n ],\n \"type\": \"timeseries\",\n \"version\": \"3.0.0\"\n },\n {\n \"custom\": {\n \"drawStyle\": \"lines\",\n \"fillOpacity\": 0.15,\n \"gradientMode\": \"none\",\n \"lineInterpolation\": \"linear\",\n \"lineWidth\": 1,\n \"scaleDistribution\": {\n \"type\": \"linear\"\n },\n \"spanNulls\": false,\n \"stack\": \"off\"\n },\n \"datasourceCate\": \"prometheus\",\n \"datasourceValue\": \"${TSDB}\",\n \"id\": \"f1bbfda3-0fd8-4b85-b725-222f992fbbc9\",\n \"layout\": {\n \"h\": 6,\n \"i\": \"f1bbfda3-0fd8-4b85-b725-222f992fbbc9\",\n \"isResizable\": true,\n \"w\": 8,\n \"x\": 16,\n \"y\": 0\n },\n \"links\": [],\n \"maxPerRow\": 4,\n \"name\": \"Request Throughput\",\n \"options\": {\n \"legend\": {\n \"behaviour\": \"showItem\",\n \"displayMode\": \"hidden\",\n \"placement\": \"bottom\"\n },\n \"standardOptions\": {\n \"util\": \"none\"\n },\n \"thresholds\": {\n \"steps\": [\n {\n \"color\": \"#73BF69\",\n \"type\": \"base\",\n \"value\": null\n }\n ]\n },\n \"tooltip\": {\n \"mode\": \"single\"\n },\n \"valueMappings\": []\n },\n \"overrides\": [\n {\n \"matcher\": {\n \"id\": \"byFrameRefID\"\n },\n \"properties\": {\n \"rightYAxisDisplay\": \"off\"\n }\n }\n ],\n \"targets\": [\n {\n \"expr\": \"sum by(topic, type) (rate(kafka_topic_request_count_total{job=\\\"$cluster_id\\\", topic=~\\\"$topic\\\"}[$__rate_interval]))\",\n \"legend\": \"{{type}}\",\n \"maxDataPoints\": 240,\n \"refId\": \"A\"\n }\n ],\n \"transformations\": [\n {\n \"id\": \"organize\",\n \"options\": {}\n }\n ],\n \"type\": \"timeseries\",\n \"version\": \"3.0.0\"\n },\n {\n \"custom\": {\n \"calc\": \"lastNotNull\",\n \"colSpan\": 1,\n \"colorMode\": \"background\",\n \"graphMode\": \"none\",\n \"textMode\": \"valueAndName\",\n \"textSize\": {},\n \"valueField\": \"Value\"\n },\n \"datasourceCate\": \"prometheus\",\n \"datasourceValue\": \"${TSDB}\",\n \"id\": \"56a85016-ca99-4495-be6a-53de1366a396\",\n \"layout\": {\n \"h\": 3,\n \"i\": \"56a85016-ca99-4495-be6a-53de1366a396\",\n \"isResizable\": true,\n \"w\": 5,\n \"x\": 0,\n \"y\": 3\n },\n \"links\": [],\n \"maxPerRow\": 4,\n \"options\": {\n \"standardOptions\": {\n \"util\": \"none\"\n },\n \"thresholds\": {\n \"steps\": [\n {\n \"color\": \"rgba(44, 157, 61, 1)\",\n \"type\": \"base\",\n \"value\": null\n }\n ]\n },\n \"valueMappings\": []\n },\n \"targets\": [\n {\n \"expr\": \"sum by(job) (rate(kafka_network_io_bytes_total{job=\\\"$cluster_id\\\", topic=~\\\"$topic\\\", partition=~\\\"$partition\\\", direction=\\\"out\\\"}[$__rate_interval]))\",\n \"legend\": \"Bytes Out Total\",\n \"maxDataPoints\": 240,\n \"refId\": \"A\"\n }\n ],\n \"transformations\": [\n {\n \"id\": \"organize\",\n \"options\": {}\n }\n ],\n \"type\": \"stat\",\n \"version\": \"3.0.0\"\n },\n {\n \"custom\": {\n \"calc\": \"lastNotNull\",\n \"colSpan\": 1,\n \"colorMode\": \"background\",\n \"graphMode\": \"none\",\n \"textMode\": \"valueAndName\",\n \"textSize\": {},\n \"valueField\": \"Value\"\n },\n \"datasourceCate\": \"prometheus\",\n \"datasourceValue\": \"${TSDB}\",\n \"id\": \"6efe4439-00ab-41d8-a4f0-b2117ad13648\",\n \"layout\": {\n \"h\": 3,\n \"i\": \"6efe4439-00ab-41d8-a4f0-b2117ad13648\",\n \"isResizable\": true,\n \"w\": 3,\n \"x\": 5,\n \"y\": 3\n },\n \"links\": [],\n \"maxPerRow\": 4,\n \"options\": {\n \"standardOptions\": {\n \"util\": \"none\"\n },\n \"thresholds\": {\n \"steps\": [\n {\n \"color\": \"rgba(148, 112, 255, 1)\",\n \"type\": \"base\",\n \"value\": null\n }\n ]\n },\n \"valueMappings\": []\n },\n \"targets\": [\n {\n \"expr\": \"count by(topic) (kafka_log_size{job=\\\"$cluster_id\\\", topic=~\\\"$topic\\\"})\",\n \"legend\": \"Partition Count\",\n \"maxDataPoints\": 240,\n \"refId\": \"A\"\n }\n ],\n \"transformations\": [\n {\n \"id\": \"organize\",\n \"options\": {}\n }\n ],\n \"type\": \"stat\",\n \"version\": \"3.0.0\"\n },\n {\n \"custom\": {\n \"drawStyle\": \"lines\",\n \"fillOpacity\": 0,\n \"gradientMode\": \"none\",\n \"lineInterpolation\": \"linear\",\n \"lineWidth\": 1,\n \"scaleDistribution\": {\n \"type\": \"linear\"\n },\n \"spanNulls\": false,\n \"stack\": \"off\"\n },\n \"datasourceCate\": \"prometheus\",\n \"datasourceValue\": \"${TSDB}\",\n \"id\": \"f3da44a7-bcb6-4b92-a5f9-b7e6856ced1a\",\n \"layout\": {\n \"h\": 6,\n \"i\": \"f3da44a7-bcb6-4b92-a5f9-b7e6856ced1a\",\n \"isResizable\": true,\n \"w\": 8,\n \"x\": 0,\n \"y\": 6\n },\n \"links\": [],\n \"maxPerRow\": 4,\n \"name\": \"Size\",\n \"options\": {\n \"legend\": {\n \"behaviour\": \"showItem\",\n \"displayMode\": \"list\",\n \"placement\": \"bottom\"\n },\n \"standardOptions\": {\n \"decimals\": 1,\n \"util\": \"bytesIEC\"\n },\n \"thresholds\": {\n \"steps\": [\n {\n \"color\": \"#73BF69\",\n \"type\": \"base\",\n \"value\": null\n }\n ]\n },\n \"tooltip\": {\n \"mode\": \"single\"\n },\n \"valueMappings\": []\n },\n \"overrides\": [\n {\n \"matcher\": {\n \"id\": \"byFrameRefID\"\n },\n \"properties\": {\n \"rightYAxisDisplay\": \"off\"\n }\n }\n ],\n \"targets\": [\n {\n \"expr\": \"sum by(topic) (kafka_log_size{job=\\\"$cluster_id\\\", topic=~\\\"$topic\\\"})\",\n \"legend\": \"{{topic}}\",\n \"maxDataPoints\": 240,\n \"refId\": \"A\"\n }\n ],\n \"transformations\": [\n {\n \"id\": \"organize\",\n \"options\": {}\n }\n ],\n \"type\": \"timeseries\",\n \"version\": \"3.0.0\"\n },\n {\n \"custom\": {\n \"drawStyle\": \"lines\",\n \"fillOpacity\": 0.15,\n \"gradientMode\": \"none\",\n \"lineInterpolation\": \"linear\",\n \"lineWidth\": 1,\n \"scaleDistribution\": {\n \"type\": \"linear\"\n },\n \"spanNulls\": false,\n \"stack\": \"off\"\n },\n \"datasourceCate\": \"prometheus\",\n \"datasourceValue\": \"${TSDB}\",\n \"id\": \"1354e591-5030-42f0-a3c3-eeb1e7c0a537\",\n \"layout\": {\n \"h\": 6,\n \"i\": \"1354e591-5030-42f0-a3c3-eeb1e7c0a537\",\n \"isResizable\": true,\n \"w\": 8,\n \"x\": 8,\n \"y\": 6\n },\n \"links\": [],\n \"maxPerRow\": 4,\n \"name\": \"Bytes In\",\n \"options\": {\n \"legend\": {\n \"behaviour\": \"showItem\",\n \"displayMode\": \"list\",\n \"placement\": \"bottom\"\n },\n \"standardOptions\": {\n \"decimals\": 1,\n \"util\": \"bytesSecIEC\"\n },\n \"thresholds\": {\n \"steps\": [\n {\n \"color\": \"#73BF69\",\n \"type\": \"base\",\n \"value\": null\n }\n ]\n },\n \"tooltip\": {\n \"mode\": \"all\",\n \"sort\": \"desc\"\n },\n \"valueMappings\": []\n },\n \"overrides\": [\n {\n \"matcher\": {\n \"id\": \"byFrameRefID\"\n },\n \"properties\": {\n \"rightYAxisDisplay\": \"off\"\n }\n }\n ],\n \"targets\": [\n {\n \"expr\": \"sum by(topic, partition) (rate(kafka_network_io_bytes_total{job=\\\"$cluster_id\\\", topic=~\\\"$topic\\\", direction=\\\"in\\\", partition=~\\\"$partition\\\"}[$__rate_interval]))\",\n \"legend\": \"{{topic}}-{{partition}}\",\n \"maxDataPoints\": 240,\n \"refId\": \"A\"\n }\n ],\n \"transformations\": [\n {\n \"id\": \"organize\",\n \"options\": {}\n }\n ],\n \"type\": \"timeseries\",\n \"version\": \"3.0.0\"\n },\n {\n \"custom\": {\n \"drawStyle\": \"lines\",\n \"fillOpacity\": 0.15,\n \"gradientMode\": \"none\",\n \"lineInterpolation\": \"linear\",\n \"lineWidth\": 1,\n \"scaleDistribution\": {\n \"type\": \"linear\"\n },\n \"spanNulls\": false,\n \"stack\": \"off\"\n },\n \"datasourceCate\": \"prometheus\",\n \"datasourceValue\": \"${TSDB}\",\n \"id\": \"a91a656b-e5b1-4265-ba88-f1881b324137\",\n \"layout\": {\n \"h\": 6,\n \"i\": \"a91a656b-e5b1-4265-ba88-f1881b324137\",\n \"isResizable\": true,\n \"w\": 8,\n \"x\": 16,\n \"y\": 6\n },\n \"links\": [],\n \"maxPerRow\": 4,\n \"name\": \"Bytes Out\",\n \"options\": {\n \"legend\": {\n \"behaviour\": \"showItem\",\n \"displayMode\": \"list\",\n \"placement\": \"bottom\"\n },\n \"standardOptions\": {\n \"decimals\": 1,\n \"util\": \"bytesSecIEC\"\n },\n \"thresholds\": {\n \"steps\": [\n {\n \"color\": \"#73BF69\",\n \"type\": \"base\",\n \"value\": null\n }\n ]\n },\n \"tooltip\": {\n \"mode\": \"all\",\n \"sort\": \"desc\"\n },\n \"valueMappings\": []\n },\n \"overrides\": [\n {\n \"matcher\": {\n \"id\": \"byFrameRefID\"\n },\n \"properties\": {\n \"rightYAxisDisplay\": \"off\"\n }\n }\n ],\n \"targets\": [\n {\n \"expr\": \"sum by(topic, partition) (rate(kafka_network_io_bytes_total{job=\\\"$cluster_id\\\", topic=~\\\"$topic\\\", direction=\\\"out\\\", partition=~\\\"$partition\\\"}[$__rate_interval]))\",\n \"legend\": \"{{topic}}-{{partition}}\",\n \"maxDataPoints\": 240,\n \"refId\": \"A\"\n }\n ],\n \"transformations\": [\n {\n \"id\": \"organize\",\n \"options\": {}\n }\n ],\n \"type\": \"timeseries\",\n \"version\": \"3.0.0\"\n },\n {\n \"custom\": {\n \"calc\": \"lastNotNull\",\n \"colorMode\": \"value\",\n \"columns\": [],\n \"displayMode\": \"labelsOfSeriesToRows\",\n \"linkMode\": \"appendLinkColumn\",\n \"showHeader\": true\n },\n \"datasourceCate\": \"prometheus\",\n \"datasourceValue\": \"${TSDB}\",\n \"id\": \"5c3e188e-3d7c-4bc9-b8c7-c19c39a8d396\",\n \"layout\": {\n \"h\": 4,\n \"i\": \"5c3e188e-3d7c-4bc9-b8c7-c19c39a8d396\",\n \"isResizable\": true,\n \"w\": 24,\n \"x\": 0,\n \"y\": 12\n },\n \"maxPerRow\": 4,\n \"name\": \"Consume group lag\",\n \"options\": {\n \"standardOptions\": {}\n },\n \"overrides\": [\n {\n \"matcher\": {\n \"id\": \"byFrameRefID\"\n }\n }\n ],\n \"targets\": [\n {\n \"expr\": \"sum by(topic) (max by(topic, partition) (kafka_log_end_offset{job=\\\"$cluster_id\\\", topic=~\\\"$topic\\\", partition=~\\\"$partition\\\"}))\\n- on(topic) group_left(consumer_group)\\nsum by(consumer_group, topic) (max by(consumer_group, topic, partition) (kafka_group_commit_offset{job=\\\"$cluster_id\\\", topic=~\\\"$topic\\\", partition=~\\\"$partition\\\"}))\",\n \"maxDataPoints\": 240,\n \"refId\": \"A\"\n }\n ],\n \"transformations\": [\n {\n \"id\": \"organize\",\n \"options\": {}\n }\n ],\n \"type\": \"table\",\n \"version\": \"3.0.0\"\n }\n ],\n \"var\": [\n {\n \"definition\": \"prometheus\",\n \"hide\": false,\n \"name\": \"TSDB\",\n \"type\": \"datasource\"\n },\n {\n \"datasource\": {\n \"cate\": \"prometheus\",\n \"value\": \"${TSDB}\"\n },\n \"definition\": \"label_values(process_runtime_jvm_cpu_utilization_ratio,job)\",\n \"hide\": false,\n \"multi\": false,\n \"name\": \"cluster_id\",\n \"reg\": \"\",\n \"type\": \"query\"\n },\n {\n \"allOption\": true,\n \"datasource\": {\n \"cate\": \"prometheus\",\n \"value\": \"${TSDB}\"\n },\n \"definition\": \"label_values(kafka_log_size,topic)\",\n \"hide\": false,\n \"multi\": true,\n \"name\": \"topic\",\n \"reg\": \"\",\n \"type\": \"query\"\n },\n {\n \"allOption\": true,\n \"allValue\": \".*\",\n \"datasource\": {\n \"cate\": \"prometheus\",\n \"value\": \"${TSDB}\"\n },\n \"definition\": \"label_values(kafka_log_size{topic=\\\"$topic\\\"},partition)\",\n \"hide\": false,\n \"multi\": true,\n \"name\": \"partition\",\n \"reg\": \"\",\n \"type\": \"query\"\n }\n ],\n \"version\": \"3.0.0\"\n },\n \"public\": 0,\n \"public_cate\": 0,\n \"bgids\": null,\n \"built_in\": 0,\n \"hide\": 0,\n \"uuid\": 1717556327174664000\n}"
},
{
"path": "integrations/AutoMQ/markdown/overview.md",
"content": "## 前言\n\nAuthMQ 官方文档提供了指标吐出方式以及和监控系统的整合方式,具体可以参考[AutoMQ](https://docs.automq.com/zh/docs/automq-opensource/LkwkwdQlwizjqckhj0dcc2IdnDh)。\n\n## 推荐方式\n\n建议采用 AutoMQ 文档中的方案二:使用 Prometheus OTLP Receiver 的方式,把所有的指标都收集到 OTel Collector 中,然后使用 Prometheus 或者 Categraf 直接去拉取数据即可。假如使用 Categraf,就是使用 prometheus 插件去拉取数据,比如我们为 prometheus 插件提供一个单独的 automq.toml 的配置文件:`conf/input.prometheus/automq.toml` ,内容如下:\n\n```toml\n[[instances]]\nurls = [\n \"http://:/metrics\"\n]\n\nurl_label_key = \"otel_collector\"\nurl_label_value = \"{{.Host}}\"\n```\n\n注意,url_label_key 一般都是指定为 instance,但是这里故意指定为其他字符串,是因为 AutoMQ 原始的指标中包含了 instance 标签,为了避免冲突,所以指定为其他字符串。\n\n"
},
{
"path": "integrations/AutoMQ/metrics/exporter.json",
"content": "[\n {\n \"id\": 0,\n \"uuid\": 1717556327176351000,\n \"collector\": \"Exporter\",\n \"typ\": \"AutoMQ\",\n \"name\": \"Broker节点入站网络IO速率\",\n \"unit\": \"bytesSecSI\",\n \"note\": \"\",\n \"lang\": \"zh_CN\",\n \"expression\": \"sum by(job, instance) (rate(kafka_network_io_bytes_total{direction=\\\"in\\\"}[1m]))\",\n \"created_at\": 0,\n \"created_by\": \"\",\n \"updated_at\": 0,\n \"updated_by\": \"\",\n \"translation\": [\n {\n \"lang\": \"zh_CN\",\n \"name\": \"Broker节点入站网络IO速率\",\n \"note\": \"\"\n },\n {\n \"lang\": \"en_US\",\n \"name\": \"Broker node inbound network IO rate\",\n \"note\": \"\"\n }\n ]\n },\n {\n \"id\": 0,\n \"uuid\": 1717556327179998000,\n \"collector\": \"Exporter\",\n \"typ\": \"AutoMQ\",\n \"name\": \"Broker节点出站网络IO速率\",\n \"unit\": \"bytesSecSI\",\n \"note\": \"\",\n \"lang\": \"zh_CN\",\n \"expression\": \"sum by(job, instance) (rate(kafka_network_io_bytes_total{direction=\\\"out\\\"}[1m]))\",\n \"created_at\": 0,\n \"created_by\": \"\",\n \"updated_at\": 0,\n \"updated_by\": \"\",\n \"translation\": [\n {\n \"lang\": \"zh_CN\",\n \"name\": \"Broker节点出站网络IO速率\",\n \"note\": \"\"\n },\n {\n \"lang\": \"en_US\",\n \"name\": \"Broker node outbound network IO rate\",\n \"note\": \"\"\n }\n ]\n },\n {\n \"id\": 0,\n \"uuid\": 1717556327182502000,\n \"collector\": \"Exporter\",\n \"typ\": \"AutoMQ\",\n \"name\": \"Broker节点当前分配的分区数量\",\n \"unit\": \"sishort\",\n \"note\": \"\",\n \"lang\": \"zh_CN\",\n \"expression\": \"kafka_partition_count\",\n \"created_at\": 0,\n \"created_by\": \"\",\n \"updated_at\": 0,\n \"updated_by\": \"\",\n \"translation\": [\n {\n \"lang\": \"zh_CN\",\n \"name\": \"Broker节点当前分配的分区数量\",\n \"note\": \"\"\n },\n {\n \"lang\": \"en_US\",\n \"name\": \"The number of partitions currently allocated to the Broker node\",\n \"note\": \"\"\n }\n ]\n },\n {\n \"id\": 0,\n \"uuid\": 1717556327184905000,\n \"collector\": \"Exporter\",\n \"typ\": \"AutoMQ\",\n \"name\": \"Broker节点每秒消息吞吐量\",\n \"unit\": \"sishort\",\n \"note\": \"\",\n \"lang\": \"zh_CN\",\n \"expression\": \"sum by(job, instance) (rate(kafka_message_count_total[1m]))\",\n \"created_at\": 0,\n \"created_by\": \"\",\n \"updated_at\": 0,\n \"updated_by\": \"\",\n \"translation\": [\n {\n \"lang\": \"zh_CN\",\n \"name\": \"Broker节点每秒消息吞吐量\",\n \"note\": \"\"\n },\n {\n \"lang\": \"en_US\",\n \"name\": \"Broker node message throughput per second\",\n \"note\": \"\"\n }\n ]\n },\n {\n \"id\": 0,\n \"uuid\": 1717556327187098000,\n \"collector\": \"Exporter\",\n \"typ\": \"AutoMQ\",\n \"name\": \"Consumer Group提交偏移量总和\",\n \"unit\": \"none\",\n \"note\": \"\",\n \"lang\": \"zh_CN\",\n \"expression\": \"sum by(job, consumer_group, topic) (max by(job, consumer_group, topic, partition) (kafka_group_commit_offset))\",\n \"created_at\": 0,\n \"created_by\": \"\",\n \"updated_at\": 0,\n \"updated_by\": \"\",\n \"translation\": [\n {\n \"lang\": \"zh_CN\",\n \"name\": \"Consumer Group提交偏移量总和\",\n \"note\": \"\"\n },\n {\n \"lang\": \"en_US\",\n \"name\": \"Consumer Group Commit Offset Sum\",\n \"note\": \"\"\n }\n ]\n },\n {\n \"id\": 0,\n \"uuid\": 1717556327189255000,\n \"collector\": \"Exporter\",\n \"typ\": \"AutoMQ\",\n \"name\": \"Consumer Group提交偏移量速率(每个实例)\",\n \"unit\": \"none\",\n \"note\": \"\",\n \"lang\": \"zh_CN\",\n \"expression\": \"sum by(job, consumer_group, topic, partition) (rate(kafka_group_commit_offset[1m]))\",\n \"created_at\": 0,\n \"created_by\": \"\",\n \"updated_at\": 0,\n \"updated_by\": \"\",\n \"translation\": [\n {\n \"lang\": \"zh_CN\",\n \"name\": \"Consumer Group提交偏移量速率(每个实例)\",\n \"note\": \"\"\n },\n {\n \"lang\": \"en_US\",\n \"name\": \"Consumer Group commit offset rate (per instance)\",\n \"note\": \"\"\n }\n ]\n },\n {\n \"id\": 0,\n \"uuid\": 1717556327191388000,\n \"collector\": \"Exporter\",\n \"typ\": \"AutoMQ\",\n \"name\": \"Consumer Group数量总和\",\n \"unit\": \"sishort\",\n \"note\": \"\",\n \"lang\": \"zh_CN\",\n \"expression\": \"sum by (job) (kafka_group_count)\",\n \"created_at\": 0,\n \"created_by\": \"\",\n \"updated_at\": 0,\n \"updated_by\": \"\",\n \"translation\": [\n {\n \"lang\": \"zh_CN\",\n \"name\": \"Consumer Group数量总和\",\n \"note\": \"\"\n },\n {\n \"lang\": \"en_US\",\n \"name\": \"Consumer Group Quantity Sum\",\n \"note\": \"\"\n }\n ]\n },\n {\n \"id\": 0,\n \"uuid\": 1717556327193321000,\n \"collector\": \"Exporter\",\n \"typ\": \"AutoMQ\",\n \"name\": \"Consumer Group最大提交偏移量\",\n \"unit\": \"none\",\n \"note\": \"\",\n \"lang\": \"zh_CN\",\n \"expression\": \"max by(job, consumer_group, topic, partition) (kafka_group_commit_offset)\",\n \"created_at\": 0,\n \"created_by\": \"\",\n \"updated_at\": 0,\n \"updated_by\": \"\",\n \"translation\": [\n {\n \"lang\": \"zh_CN\",\n \"name\": \"Consumer Group最大提交偏移量\",\n \"note\": \"\"\n },\n {\n \"lang\": \"en_US\",\n \"name\": \"Consumer Group Maximum commit offset\",\n \"note\": \"\"\n }\n ]\n },\n {\n \"id\": 0,\n \"uuid\": 1717556327195219000,\n \"collector\": \"Exporter\",\n \"typ\": \"AutoMQ\",\n \"name\": \"Fetch请求处理时间的50分位数\",\n \"unit\": \"milliseconds\",\n \"note\": \"\",\n \"lang\": \"zh_CN\",\n \"expression\": \"kafka_request_time_50p_milliseconds\",\n \"created_at\": 0,\n \"created_by\": \"\",\n \"updated_at\": 0,\n \"updated_by\": \"\",\n \"translation\": [\n {\n \"lang\": \"zh_CN\",\n \"name\": \"Fetch请求处理时间的50分位数\",\n \"note\": \"\"\n },\n {\n \"lang\": \"en_US\",\n \"name\": \"50th quantile of Fetch request processing time\",\n \"note\": \"\"\n }\n ]\n },\n {\n \"id\": 0,\n \"uuid\": 1717556327197092000,\n \"collector\": \"Exporter\",\n \"typ\": \"AutoMQ\",\n \"name\": \"Fetch请求处理时间的99分位数\",\n \"unit\": \"milliseconds\",\n \"note\": \"\",\n \"lang\": \"zh_CN\",\n \"expression\": \"kafka_request_time_99p_milliseconds\",\n \"created_at\": 0,\n \"created_by\": \"\",\n \"updated_at\": 0,\n \"updated_by\": \"\",\n \"translation\": [\n {\n \"lang\": \"zh_CN\",\n \"name\": \"Fetch请求处理时间的99分位数\",\n \"note\": \"\"\n },\n {\n \"lang\": \"en_US\",\n \"name\": \"99th quantile of Fetch request processing time\",\n \"note\": \"\"\n }\n ]\n },\n {\n \"id\": 0,\n \"uuid\": 1717556327198909000,\n \"collector\": \"Exporter\",\n \"typ\": \"AutoMQ\",\n \"name\": \"Fetch请求处理时间的99分位数(每个实例)\",\n \"unit\": \"milliseconds\",\n \"note\": \"\",\n \"lang\": \"zh_CN\",\n \"expression\": \"avg by(job, instance) (kafka_request_time_99p_milliseconds)\",\n \"created_at\": 0,\n \"created_by\": \"\",\n \"updated_at\": 0,\n \"updated_by\": \"\",\n \"translation\": [\n {\n \"lang\": \"zh_CN\",\n \"name\": \"Fetch请求处理时间的99分位数(每个实例)\",\n \"note\": \"\"\n },\n {\n \"lang\": \"en_US\",\n \"name\": \"99th quantile of Fetch request processing time (per instance)\",\n \"note\": \"\"\n }\n ]\n },\n {\n \"id\": 0,\n \"uuid\": 1717556327201071000,\n \"collector\": \"Exporter\",\n \"typ\": \"AutoMQ\",\n \"name\": \"Fetch请求处理时间的平均值\",\n \"unit\": \"milliseconds\",\n \"note\": \"\",\n \"lang\": \"zh_CN\",\n \"expression\": \"kafka_request_time_mean_milliseconds\",\n \"created_at\": 0,\n \"created_by\": \"\",\n \"updated_at\": 0,\n \"updated_by\": \"\",\n \"translation\": [\n {\n \"lang\": \"zh_CN\",\n \"name\": \"Fetch请求处理时间的平均值\",\n \"note\": \"\"\n },\n {\n \"lang\": \"en_US\",\n \"name\": \"Average of Fetch request processing time\",\n \"note\": \"\"\n }\n ]\n },\n {\n \"id\": 0,\n \"uuid\": 1717556327202824000,\n \"collector\": \"Exporter\",\n \"typ\": \"AutoMQ\",\n \"name\": \"Fetch请求处理时间的最大值\",\n \"unit\": \"milliseconds\",\n \"note\": \"\",\n \"lang\": \"zh_CN\",\n \"expression\": \"kafka_request_time_max_milliseconds\",\n \"created_at\": 0,\n \"created_by\": \"\",\n \"updated_at\": 0,\n \"updated_by\": \"\",\n \"translation\": [\n {\n \"lang\": \"zh_CN\",\n \"name\": \"Fetch请求处理时间的最大值\",\n \"note\": \"\"\n },\n {\n \"lang\": \"en_US\",\n \"name\": \"Maximum Fetch request processing time\",\n \"note\": \"\"\n }\n ]\n },\n {\n \"id\": 0,\n \"uuid\": 1717556327204459000,\n \"collector\": \"Exporter\",\n \"typ\": \"AutoMQ\",\n \"name\": \"Fetch请求失败速率(每个实例)\",\n \"unit\": \"reqps\",\n \"note\": \"\",\n \"lang\": \"zh_CN\",\n \"expression\": \"sum by(job, instance) (rate(kafka_topic_request_failed_total[1m]))\",\n \"created_at\": 0,\n \"created_by\": \"\",\n \"updated_at\": 0,\n \"updated_by\": \"\",\n \"translation\": [\n {\n \"lang\": \"zh_CN\",\n \"name\": \"Fetch请求失败速率(每个实例)\",\n \"note\": \"\"\n },\n {\n \"lang\": \"en_US\",\n \"name\": \"Fetch request failure rate (per instance)\",\n \"note\": \"\"\n }\n ]\n },\n {\n \"id\": 0,\n \"uuid\": 1717556327206530000,\n \"collector\": \"Exporter\",\n \"typ\": \"AutoMQ\",\n \"name\": \"Kafka Controller活跃状态计数\",\n \"unit\": \"sishort\",\n \"note\": \"\",\n \"lang\": \"zh_CN\",\n \"expression\": \"sum by(job) (kafka_controller_active_count)\",\n \"created_at\": 0,\n \"created_by\": \"\",\n \"updated_at\": 0,\n \"updated_by\": \"\",\n \"translation\": [\n {\n \"lang\": \"zh_CN\",\n \"name\": \"Kafka Controller活跃状态计数\",\n \"note\": \"\"\n },\n {\n \"lang\": \"en_US\",\n \"name\": \"Kafka Controller active status count\",\n \"note\": \"\"\n }\n ]\n },\n {\n \"id\": 0,\n \"uuid\": 1717556327208370000,\n \"collector\": \"Exporter\",\n \"typ\": \"AutoMQ\",\n \"name\": \"Produce请求处理时间的50分位数\",\n \"unit\": \"milliseconds\",\n \"note\": \"\",\n \"lang\": \"zh_CN\",\n \"expression\": \"kafka_request_time_50p_milliseconds\",\n \"created_at\": 0,\n \"created_by\": \"\",\n \"updated_at\": 0,\n \"updated_by\": \"\",\n \"translation\": [\n {\n \"lang\": \"zh_CN\",\n \"name\": \"Produce请求处理时间的50分位数\",\n \"note\": \"\"\n },\n {\n \"lang\": \"en_US\",\n \"name\": \"50th Quantile of Processing Time for Produce requests\",\n \"note\": \"\"\n }\n ]\n },\n {\n \"id\": 0,\n \"uuid\": 1717556327210667000,\n \"collector\": \"Exporter\",\n \"typ\": \"AutoMQ\",\n \"name\": \"Produce请求处理时间的99分位数\",\n \"unit\": \"milliseconds\",\n \"note\": \"\",\n \"lang\": \"zh_CN\",\n \"expression\": \"kafka_request_time_99p_milliseconds\",\n \"created_at\": 0,\n \"created_by\": \"\",\n \"updated_at\": 0,\n \"updated_by\": \"\",\n \"translation\": [\n {\n \"lang\": \"zh_CN\",\n \"name\": \"Produce请求处理时间的99分位数\",\n \"note\": \"\"\n },\n {\n \"lang\": \"en_US\",\n \"name\": \"99th quantile of processing time for Produce requests\",\n \"note\": \"\"\n }\n ]\n },\n {\n \"id\": 0,\n \"uuid\": 1717556327212669000,\n \"collector\": \"Exporter\",\n \"typ\": \"AutoMQ\",\n \"name\": \"Produce请求处理时间的99分位数(每个实例)\",\n \"unit\": \"milliseconds\",\n \"note\": \"\",\n \"lang\": \"zh_CN\",\n \"expression\": \"avg by(job, instance) (kafka_request_time_99p_milliseconds)\",\n \"created_at\": 0,\n \"created_by\": \"\",\n \"updated_at\": 0,\n \"updated_by\": \"\",\n \"translation\": [\n {\n \"lang\": \"zh_CN\",\n \"name\": \"Produce请求处理时间的99分位数(每个实例)\",\n \"note\": \"\"\n },\n {\n \"lang\": \"en_US\",\n \"name\": \"99th quantile of Produce request processing time (per instance)\",\n \"note\": \"\"\n }\n ]\n },\n {\n \"id\": 0,\n \"uuid\": 1717556327214580000,\n \"collector\": \"Exporter\",\n \"typ\": \"AutoMQ\",\n \"name\": \"Produce请求处理时间的平均值\",\n \"unit\": \"milliseconds\",\n \"note\": \"\",\n \"lang\": \"zh_CN\",\n \"expression\": \"kafka_request_time_mean_milliseconds\",\n \"created_at\": 0,\n \"created_by\": \"\",\n \"updated_at\": 0,\n \"updated_by\": \"\",\n \"translation\": [\n {\n \"lang\": \"zh_CN\",\n \"name\": \"Produce请求处理时间的平均值\",\n \"note\": \"\"\n },\n {\n \"lang\": \"en_US\",\n \"name\": \"Average Produce request processing time\",\n \"note\": \"\"\n }\n ]\n },\n {\n \"id\": 0,\n \"uuid\": 1717556327217055000,\n \"collector\": \"Exporter\",\n \"typ\": \"AutoMQ\",\n \"name\": \"Produce请求处理时间的最大值\",\n \"unit\": \"milliseconds\",\n \"note\": \"\",\n \"lang\": \"zh_CN\",\n \"expression\": \"kafka_request_time_max_milliseconds\",\n \"created_at\": 0,\n \"created_by\": \"\",\n \"updated_at\": 0,\n \"updated_by\": \"\",\n \"translation\": [\n {\n \"lang\": \"zh_CN\",\n \"name\": \"Produce请求处理时间的最大值\",\n \"note\": \"\"\n },\n {\n \"lang\": \"en_US\",\n \"name\": \"The maximum processing time of the Produce request\",\n \"note\": \"\"\n }\n ]\n },\n {\n \"id\": 0,\n \"uuid\": 1717556327219060000,\n \"collector\": \"Exporter\",\n \"typ\": \"AutoMQ\",\n \"name\": \"Produce请求失败速率(每个实例)\",\n \"unit\": \"reqps\",\n \"note\": \"\",\n \"lang\": \"zh_CN\",\n \"expression\": \"sum by(job, instance) (rate(kafka_topic_request_failed_total[1m]))\",\n \"created_at\": 0,\n \"created_by\": \"\",\n \"updated_at\": 0,\n \"updated_by\": \"\",\n \"translation\": [\n {\n \"lang\": \"zh_CN\",\n \"name\": \"Produce请求失败速率(每个实例)\",\n \"note\": \"\"\n },\n {\n \"lang\": \"en_US\",\n \"name\": \"Produce request failure rate (per instance)\",\n \"note\": \"\"\n }\n ]\n },\n {\n \"id\": 0,\n \"uuid\": 1717556327221295000,\n \"collector\": \"Exporter\",\n \"typ\": \"AutoMQ\",\n \"name\": \"各个Consumer Group和Topic的最大提交偏移量\",\n \"unit\": \"none\",\n \"note\": \"\",\n \"lang\": \"zh_CN\",\n \"expression\": \"max by(job, consumer_group, topic, partition) (kafka_group_commit_offset)\",\n \"created_at\": 0,\n \"created_by\": \"\",\n \"updated_at\": 0,\n \"updated_by\": \"\",\n \"translation\": [\n {\n \"lang\": \"zh_CN\",\n \"name\": \"各个Consumer Group和Topic的最大提交偏移量\",\n \"note\": \"\"\n },\n {\n \"lang\": \"en_US\",\n \"name\": \"Maximum commit offsets for each Consumer Group and Topic\",\n \"note\": \"\"\n }\n ]\n },\n {\n \"id\": 0,\n \"uuid\": 1717556327223767000,\n \"collector\": \"Exporter\",\n \"typ\": \"AutoMQ\",\n \"name\": \"各个Topic分区的最大日志结束偏移量\",\n \"unit\": \"none\",\n \"note\": \"\",\n \"lang\": \"zh_CN\",\n \"expression\": \"max by(job, topic, partition) (kafka_log_end_offset)\",\n \"created_at\": 0,\n \"created_by\": \"\",\n \"updated_at\": 0,\n \"updated_by\": \"\",\n \"translation\": [\n {\n \"lang\": \"zh_CN\",\n \"name\": \"各个Topic分区的最大日志结束偏移量\",\n \"note\": \"\"\n },\n {\n \"lang\": \"en_US\",\n \"name\": \"Maximum end of log offset for each Topic partition\",\n \"note\": \"\"\n }\n ]\n },\n {\n \"id\": 0,\n \"uuid\": 1717556327225577000,\n \"collector\": \"Exporter\",\n \"typ\": \"AutoMQ\",\n \"name\": \"实例的Fetch请求速率\",\n \"unit\": \"reqps\",\n \"note\": \"\",\n \"lang\": \"zh_CN\",\n \"expression\": \"sum by(job, instance, topic) (rate(kafka_request_count_total[1m]))\",\n \"created_at\": 0,\n \"created_by\": \"\",\n \"updated_at\": 0,\n \"updated_by\": \"\",\n \"translation\": [\n {\n \"lang\": \"zh_CN\",\n \"name\": \"实例的Fetch请求速率\",\n \"note\": \"\"\n },\n {\n \"lang\": \"en_US\",\n \"name\": \"Fetch request rate of an instance\",\n \"note\": \"\"\n }\n ]\n },\n {\n \"id\": 0,\n \"uuid\": 1717556327227527000,\n \"collector\": \"Exporter\",\n \"typ\": \"AutoMQ\",\n \"name\": \"实例的Produce请求速率\",\n \"unit\": \"reqps\",\n \"note\": \"\",\n \"lang\": \"zh_CN\",\n \"expression\": \"sum by(job, instance, topic) (rate(kafka_request_count_total[1m]))\",\n \"created_at\": 0,\n \"created_by\": \"\",\n \"updated_at\": 0,\n \"updated_by\": \"\",\n \"translation\": [\n {\n \"lang\": \"zh_CN\",\n \"name\": \"实例的Produce请求速率\",\n \"note\": \"\"\n },\n {\n \"lang\": \"en_US\",\n \"name\": \"Instance's Produce request rate\",\n \"note\": \"\"\n }\n ]\n },\n {\n \"id\": 0,\n \"uuid\": 1717556327229750000,\n \"collector\": \"Exporter\",\n \"typ\": \"AutoMQ\",\n \"name\": \"已死亡的Consumer Group数量总和\",\n \"unit\": \"sishort\",\n \"note\": \"\",\n \"lang\": \"zh_CN\",\n \"expression\": \"sum by (job) (kafka_group_dead_count)\",\n \"created_at\": 0,\n \"created_by\": \"\",\n \"updated_at\": 0,\n \"updated_by\": \"\",\n \"translation\": [\n {\n \"lang\": \"zh_CN\",\n \"name\": \"已死亡的Consumer Group数量总和\",\n \"note\": \"\"\n },\n {\n \"lang\": \"en_US\",\n \"name\": \"Total number of dead Consumer Groups\",\n \"note\": \"\"\n }\n ]\n },\n {\n \"id\": 0,\n \"uuid\": 1717556327231514000,\n \"collector\": \"Exporter\",\n \"typ\": \"AutoMQ\",\n \"name\": \"日志大小总和\",\n \"unit\": \"bytesSI\",\n \"note\": \"\",\n \"lang\": \"zh_CN\",\n \"expression\": \"sum by (job) (max by(job, topic, partition) (kafka_log_size))\",\n \"created_at\": 0,\n \"created_by\": \"\",\n \"updated_at\": 0,\n \"updated_by\": \"\",\n \"translation\": [\n {\n \"lang\": \"zh_CN\",\n \"name\": \"日志大小总和\",\n \"note\": \"\"\n },\n {\n \"lang\": \"en_US\",\n \"name\": \"Sum of log sizes\",\n \"note\": \"\"\n }\n ]\n },\n {\n \"id\": 0,\n \"uuid\": 1717556327233243000,\n \"collector\": \"Exporter\",\n \"typ\": \"AutoMQ\",\n \"name\": \"日志消费延迟 lag\",\n \"unit\": \"none\",\n \"note\": \"\",\n \"lang\": \"zh_CN\",\n \"expression\": \"sum by(job, topic) (max by(job, topic, partition) (kafka_log_end_offset{}))\\n- on(job, topic) group_left(consumer_group)\\nsum by(job, consumer_group, topic) (max by(job, consumer_group, topic, partition) (kafka_group_commit_offset{}))\",\n \"created_at\": 0,\n \"created_by\": \"\",\n \"updated_at\": 0,\n \"updated_by\": \"\",\n \"translation\": [\n {\n \"lang\": \"zh_CN\",\n \"name\": \"日志消费延迟 lag\",\n \"note\": \"\"\n },\n {\n \"lang\": \"en_US\",\n \"name\": \"Log consumption delay lag\",\n \"note\": \"\"\n }\n ]\n },\n {\n \"id\": 0,\n \"uuid\": 1717556327236120000,\n \"collector\": \"Exporter\",\n \"typ\": \"AutoMQ\",\n \"name\": \"日志结束偏移量总和\",\n \"unit\": \"none\",\n \"note\": \"\",\n \"lang\": \"zh_CN\",\n \"expression\": \"sum by(job, topic) (max by(job, topic, partition) (kafka_log_end_offset))\",\n \"created_at\": 0,\n \"created_by\": \"\",\n \"updated_at\": 0,\n \"updated_by\": \"\",\n \"translation\": [\n {\n \"lang\": \"zh_CN\",\n \"name\": \"日志结束偏移量总和\",\n \"note\": \"\"\n },\n {\n \"lang\": \"en_US\",\n \"name\": \"End of log offset sum\",\n \"note\": \"\"\n }\n ]\n },\n {\n \"id\": 0,\n \"uuid\": 1717556327237878000,\n \"collector\": \"Exporter\",\n \"typ\": \"AutoMQ\",\n \"name\": \"日志结束最大偏移量\",\n \"unit\": \"none\",\n \"note\": \"\",\n \"lang\": \"zh_CN\",\n \"expression\": \"max by(job, topic, partition) (kafka_log_end_offset)\",\n \"created_at\": 0,\n \"created_by\": \"\",\n \"updated_at\": 0,\n \"updated_by\": \"\",\n \"translation\": [\n {\n \"lang\": \"zh_CN\",\n \"name\": \"日志结束最大偏移量\",\n \"note\": \"\"\n },\n {\n \"lang\": \"en_US\",\n \"name\": \"End of Log Max Offset\",\n \"note\": \"\"\n }\n ]\n },\n {\n \"id\": 0,\n \"uuid\": 1717556327240138000,\n \"collector\": \"Exporter\",\n \"typ\": \"AutoMQ\",\n \"name\": \"正在准备进行rebalance的Consumer Group数量总和\",\n \"unit\": \"sishort\",\n \"note\": \"\",\n \"lang\": \"zh_CN\",\n \"expression\": \"sum by (job) (kafka_group_preparing_rebalance_count)\",\n \"created_at\": 0,\n \"created_by\": \"\",\n \"updated_at\": 0,\n \"updated_by\": \"\",\n \"translation\": [\n {\n \"lang\": \"zh_CN\",\n \"name\": \"正在准备进行rebalance的Consumer Group数量总和\",\n \"note\": \"\"\n },\n {\n \"lang\": \"en_US\",\n \"name\": \"Sum number of Consumer Groups in preparation for rebalance\",\n \"note\": \"\"\n }\n ]\n },\n {\n \"id\": 0,\n \"uuid\": 1717556327241777000,\n \"collector\": \"Exporter\",\n \"typ\": \"AutoMQ\",\n \"name\": \"正在等待Leader进行状态分配的Consumer Group数量总和\",\n \"unit\": \"sishort\",\n \"note\": \"\",\n \"lang\": \"zh_CN\",\n \"expression\": \"sum by (job) (kafka_group_completing_rebalance_count)\",\n \"created_at\": 0,\n \"created_by\": \"\",\n \"updated_at\": 0,\n \"updated_by\": \"\",\n \"translation\": [\n {\n \"lang\": \"zh_CN\",\n \"name\": \"正在等待Leader进行状态分配的Consumer Group数量总和\",\n \"note\": \"\"\n },\n {\n \"lang\": \"en_US\",\n \"name\": \"Sum number of Consumer Groups waiting for status allocation by Leader\",\n \"note\": \"\"\n }\n ]\n },\n {\n \"id\": 0,\n \"uuid\": 1717556327243616000,\n \"collector\": \"Exporter\",\n \"typ\": \"AutoMQ\",\n \"name\": \"每个Topic的Broker节点入站网络IO速率sum by(topic)\",\n \"unit\": \"bytesSecSI\",\n \"note\": \"\",\n \"lang\": \"zh_CN\",\n \"expression\": \"sum by(job, topic) (rate(kafka_network_io_bytes_total{direction=\\\"in\\\"}[1m]))\",\n \"created_at\": 0,\n \"created_by\": \"\",\n \"updated_at\": 0,\n \"updated_by\": \"\",\n \"translation\": [\n {\n \"lang\": \"zh_CN\",\n \"name\": \"每个Topic的Broker节点入站网络IO速率sum by(topic)\",\n \"note\": \"\"\n },\n {\n \"lang\": \"en_US\",\n \"name\": \"Broker node inbound network IO rate per topic sum by (topic)\",\n \"note\": \"\"\n }\n ]\n },\n {\n \"id\": 0,\n \"uuid\": 1717556327245855000,\n \"collector\": \"Exporter\",\n \"typ\": \"AutoMQ\",\n \"name\": \"每个Topic的Broker节点入站网络IO速率sum by(topic, instance)\",\n \"unit\": \"bytesSecSI\",\n \"note\": \"\",\n \"lang\": \"zh_CN\",\n \"expression\": \"sum by(job, topic, instance) (rate(kafka_network_io_bytes_total{direction=\\\"in\\\"}[1m]))\",\n \"created_at\": 0,\n \"created_by\": \"\",\n \"updated_at\": 0,\n \"updated_by\": \"\",\n \"translation\": [\n {\n \"lang\": \"zh_CN\",\n \"name\": \"每个Topic的Broker节点入站网络IO速率sum by(topic, instance)\",\n \"note\": \"\"\n },\n {\n \"lang\": \"en_US\",\n \"name\": \"Broker node inbound network IO rate per topic sum by (topic, instance)\",\n \"note\": \"\"\n }\n ]\n },\n {\n \"id\": 0,\n \"uuid\": 1717556327247589000,\n \"collector\": \"Exporter\",\n \"typ\": \"AutoMQ\",\n \"name\": \"每个Topic的Broker节点出站网络IO速率sum by(topic)\",\n \"unit\": \"bytesSecSI\",\n \"note\": \"\",\n \"lang\": \"zh_CN\",\n \"expression\": \"sum by(job, topic) (rate(kafka_network_io_bytes_total{direction=\\\"out\\\"}[1m]))\",\n \"created_at\": 0,\n \"created_by\": \"\",\n \"updated_at\": 0,\n \"updated_by\": \"\",\n \"translation\": [\n {\n \"lang\": \"zh_CN\",\n \"name\": \"每个Topic的Broker节点出站网络IO速率sum by(topic)\",\n \"note\": \"\"\n },\n {\n \"lang\": \"en_US\",\n \"name\": \"Broker node outbound network IO rate per topic sum by (topic)\",\n \"note\": \"\"\n }\n ]\n },\n {\n \"id\": 0,\n \"uuid\": 1717556327249421000,\n \"collector\": \"Exporter\",\n \"typ\": \"AutoMQ\",\n \"name\": \"每个Topic的Broker节点出站网络IO速率sum by(topic, instance)\",\n \"unit\": \"bytesSecSI\",\n \"note\": \"\",\n \"lang\": \"zh_CN\",\n \"expression\": \"sum by(job, topic, instance) (rate(kafka_network_io_bytes_total{direction=\\\"out\\\"}[1m]))\",\n \"created_at\": 0,\n \"created_by\": \"\",\n \"updated_at\": 0,\n \"updated_by\": \"\",\n \"translation\": [\n {\n \"lang\": \"zh_CN\",\n \"name\": \"每个Topic的Broker节点出站网络IO速率sum by(topic, instance)\",\n \"note\": \"\"\n },\n {\n \"lang\": \"en_US\",\n \"name\": \"Broker node outbound network IO rate per topic sum by (topic, instance)\",\n \"note\": \"\"\n }\n ]\n },\n {\n \"id\": 0,\n \"uuid\": 1717556327251637000,\n \"collector\": \"Exporter\",\n \"typ\": \"AutoMQ\",\n \"name\": \"每个Topic的Broker节点出站网络IO速率sum by(topic, partition)\",\n \"unit\": \"bytesSecSI\",\n \"note\": \"\",\n \"lang\": \"zh_CN\",\n \"expression\": \"sum by(job, topic, partition) (rate(kafka_network_io_bytes_total{direction=\\\"out\\\"}[1m]))\",\n \"created_at\": 0,\n \"created_by\": \"\",\n \"updated_at\": 0,\n \"updated_by\": \"\",\n \"translation\": [\n {\n \"lang\": \"zh_CN\",\n \"name\": \"每个Topic的Broker节点出站网络IO速率sum by(topic, partition)\",\n \"note\": \"\"\n },\n {\n \"lang\": \"en_US\",\n \"name\": \"Broker node outbound network IO rate per topic sum by (topic, partition)\",\n \"note\": \"\"\n }\n ]\n },\n {\n \"id\": 0,\n \"uuid\": 1717556327253444000,\n \"collector\": \"Exporter\",\n \"typ\": \"AutoMQ\",\n \"name\": \"每个Topic的Broker节点消息吞吐量(入站)sum by(topic)\",\n \"unit\": \"mps\",\n \"note\": \"\",\n \"lang\": \"zh_CN\",\n \"expression\": \"sum by(job, topic) (rate(kafka_message_count_total{direction=\\\"in\\\"}[1m]))\",\n \"created_at\": 0,\n \"created_by\": \"\",\n \"updated_at\": 0,\n \"updated_by\": \"\",\n \"translation\": [\n {\n \"lang\": \"zh_CN\",\n \"name\": \"每个Topic的Broker节点消息吞吐量(入站)sum by(topic)\",\n \"note\": \"\"\n },\n {\n \"lang\": \"en_US\",\n \"name\": \"Broker node message throughput per topic (inbound) sum by (topic)\",\n \"note\": \"\"\n }\n ]\n },\n {\n \"id\": 0,\n \"uuid\": 1717556327255550000,\n \"collector\": \"Exporter\",\n \"typ\": \"AutoMQ\",\n \"name\": \"每个Topic的Broker节点消息吞吐量(入站)sum by(topic, instance)\",\n \"unit\": \"mps\",\n \"note\": \"\",\n \"lang\": \"zh_CN\",\n \"expression\": \"sum by(job, topic, instance) (rate(kafka_message_count_total{direction=\\\"in\\\"}[1m]))\",\n \"created_at\": 0,\n \"created_by\": \"\",\n \"updated_at\": 0,\n \"updated_by\": \"\",\n \"translation\": [\n {\n \"lang\": \"zh_CN\",\n \"name\": \"每个Topic的Broker节点消息吞吐量(入站)sum by(topic, instance)\",\n \"note\": \"\"\n },\n {\n \"lang\": \"en_US\",\n \"name\": \"Broker node message throughput per topic (inbound) sum by (topic, instance)\",\n \"note\": \"\"\n }\n ]\n },\n {\n \"id\": 0,\n \"uuid\": 1717556327257265000,\n \"collector\": \"Exporter\",\n \"typ\": \"AutoMQ\",\n \"name\": \"每个Topic的Broker节点网络IO速率(集群级别)\",\n \"unit\": \"bytesSecSI\",\n \"note\": \"\",\n \"lang\": \"zh_CN\",\n \"expression\": \"sum by(job) (rate(kafka_network_io_bytes_total[1m]))\",\n \"created_at\": 0,\n \"created_by\": \"\",\n \"updated_at\": 0,\n \"updated_by\": \"\",\n \"translation\": [\n {\n \"lang\": \"zh_CN\",\n \"name\": \"每个Topic的Broker节点网络IO速率(集群级别)\",\n \"note\": \"\"\n },\n {\n \"lang\": \"en_US\",\n \"name\": \"Broker node network IO rate per Topic (cluster level)\",\n \"note\": \"\"\n }\n ]\n },\n {\n \"id\": 0,\n \"uuid\": 1717556327259010000,\n \"collector\": \"Exporter\",\n \"typ\": \"AutoMQ\",\n \"name\": \"每个Topic的日志大小\",\n \"unit\": \"bytesSI\",\n \"note\": \"\",\n \"lang\": \"zh_CN\",\n \"expression\": \"sum by(job, topic) (kafka_log_size)\",\n \"created_at\": 0,\n \"created_by\": \"\",\n \"updated_at\": 0,\n \"updated_by\": \"\",\n \"translation\": [\n {\n \"lang\": \"zh_CN\",\n \"name\": \"每个Topic的日志大小\",\n \"note\": \"\"\n },\n {\n \"lang\": \"en_US\",\n \"name\": \"Log size per Topic\",\n \"note\": \"\"\n }\n ]\n },\n {\n \"id\": 0,\n \"uuid\": 1717556327260869000,\n \"collector\": \"Exporter\",\n \"typ\": \"AutoMQ\",\n \"name\": \"每个Topic的消息吞吐量sum by(topic, type)\",\n \"unit\": \"mps\",\n \"note\": \"\",\n \"lang\": \"zh_CN\",\n \"expression\": \"sum by(job, topic, type) (rate(kafka_message_count_total[1m]))\",\n \"created_at\": 0,\n \"created_by\": \"\",\n \"updated_at\": 0,\n \"updated_by\": \"\",\n \"translation\": [\n {\n \"lang\": \"zh_CN\",\n \"name\": \"每个Topic的消息吞吐量sum by(topic, type)\",\n \"note\": \"\"\n },\n {\n \"lang\": \"en_US\",\n \"name\": \"Message throughput per topic sum by (topic, type)\",\n \"note\": \"\"\n }\n ]\n },\n {\n \"id\": 0,\n \"uuid\": 1717556327262606000,\n \"collector\": \"Exporter\",\n \"typ\": \"AutoMQ\",\n \"name\": \"每个Topic的请求计数sum by(topic, type)\",\n \"unit\": \"reqps\",\n \"note\": \"\",\n \"lang\": \"zh_CN\",\n \"expression\": \"sum by(job, topic, type) (rate(kafka_topic_request_count_total[1m]))\",\n \"created_at\": 0,\n \"created_by\": \"\",\n \"updated_at\": 0,\n \"updated_by\": \"\",\n \"translation\": [\n {\n \"lang\": \"zh_CN\",\n \"name\": \"每个Topic的请求计数sum by(topic, type)\",\n \"note\": \"\"\n },\n {\n \"lang\": \"en_US\",\n \"name\": \"Request count per topic sum by (topic, type)\",\n \"note\": \"\"\n }\n ]\n },\n {\n \"id\": 0,\n \"uuid\": 1717556327264897000,\n \"collector\": \"Exporter\",\n \"typ\": \"AutoMQ\",\n \"name\": \"每个实例的Broker节点出站网络IO速率(实例级别)\",\n \"unit\": \"bytesSecSI\",\n \"note\": \"\",\n \"lang\": \"zh_CN\",\n \"expression\": \"sum by(job, instance) (rate(kafka_network_io_bytes_total{direction=\\\"out\\\"}[1m]))\",\n \"created_at\": 0,\n \"created_by\": \"\",\n \"updated_at\": 0,\n \"updated_by\": \"\",\n \"translation\": [\n {\n \"lang\": \"zh_CN\",\n \"name\": \"每个实例的Broker节点出站网络IO速率(实例级别)\",\n \"note\": \"\"\n },\n {\n \"lang\": \"en_US\",\n \"name\": \"Broker node outbound network IO rate per instance (instance level)\",\n \"note\": \"\"\n }\n ]\n },\n {\n \"id\": 0,\n \"uuid\": 1717556327267156000,\n \"collector\": \"Exporter\",\n \"typ\": \"AutoMQ\",\n \"name\": \"每个实例的Broker节点分区数量\",\n \"unit\": \"sishort\",\n \"note\": \"\",\n \"lang\": \"zh_CN\",\n \"expression\": \"sum by(job, instance) (kafka_partition_count)\",\n \"created_at\": 0,\n \"created_by\": \"\",\n \"updated_at\": 0,\n \"updated_by\": \"\",\n \"translation\": [\n {\n \"lang\": \"zh_CN\",\n \"name\": \"每个实例的Broker节点分区数量\",\n \"note\": \"\"\n },\n {\n \"lang\": \"en_US\",\n \"name\": \"Number of Broker node partitions per instance\",\n \"note\": \"\"\n }\n ]\n },\n {\n \"id\": 0,\n \"uuid\": 1717556327269529000,\n \"collector\": \"Exporter\",\n \"typ\": \"AutoMQ\",\n \"name\": \"每个实例的Broker节点消息吞吐量(入站)\",\n \"unit\": \"mps\",\n \"note\": \"\",\n \"lang\": \"zh_CN\",\n \"expression\": \"sum by(job, instance) (rate(kafka_message_count_total{direction=\\\"in\\\"}[1m]))\",\n \"created_at\": 0,\n \"created_by\": \"\",\n \"updated_at\": 0,\n \"updated_by\": \"\",\n \"translation\": [\n {\n \"lang\": \"zh_CN\",\n \"name\": \"每个实例的Broker节点消息吞吐量(入站)\",\n \"note\": \"\"\n },\n {\n \"lang\": \"en_US\",\n \"name\": \"Broker node message throughput per instance (inbound)\",\n \"note\": \"\"\n }\n ]\n },\n {\n \"id\": 0,\n \"uuid\": 1717556327271703000,\n \"collector\": \"Exporter\",\n \"typ\": \"AutoMQ\",\n \"name\": \"每个实例的Fetch请求速率\",\n \"unit\": \"reqps\",\n \"note\": \"\",\n \"lang\": \"zh_CN\",\n \"expression\": \"sum by(job, instance) (rate(kafka_request_count_total{type=\\\"Fetch\\\"}[1m]))\",\n \"created_at\": 0,\n \"created_by\": \"\",\n \"updated_at\": 0,\n \"updated_by\": \"\",\n \"translation\": [\n {\n \"lang\": \"zh_CN\",\n \"name\": \"每个实例的Fetch请求速率\",\n \"note\": \"\"\n },\n {\n \"lang\": \"en_US\",\n \"name\": \"Fetch request rate per instance\",\n \"note\": \"\"\n }\n ]\n },\n {\n \"id\": 0,\n \"uuid\": 1717556327273861000,\n \"collector\": \"Exporter\",\n \"typ\": \"AutoMQ\",\n \"name\": \"每个实例的Produce请求速率\",\n \"unit\": \"reqps\",\n \"note\": \"\",\n \"lang\": \"zh_CN\",\n \"expression\": \"sum by(job, instance) (rate(kafka_request_count_total{type=\\\"Produce\\\"}[1m]))\",\n \"created_at\": 0,\n \"created_by\": \"\",\n \"updated_at\": 0,\n \"updated_by\": \"\",\n \"translation\": [\n {\n \"lang\": \"zh_CN\",\n \"name\": \"每个实例的Produce请求速率\",\n \"note\": \"\"\n },\n {\n \"lang\": \"en_US\",\n \"name\": \"Produce request rate per instance\",\n \"note\": \"\"\n }\n ]\n },\n {\n \"id\": 0,\n \"uuid\": 1717556327276362000,\n \"collector\": \"Exporter\",\n \"typ\": \"AutoMQ\",\n \"name\": \"每个实例的节点当前建立的连接数\",\n \"unit\": \"sishort\",\n \"note\": \"\",\n \"lang\": \"zh_CN\",\n \"expression\": \"sum by(job, instance) (kafka_server_connection_count)\",\n \"created_at\": 0,\n \"created_by\": \"\",\n \"updated_at\": 0,\n \"updated_by\": \"\",\n \"translation\": [\n {\n \"lang\": \"zh_CN\",\n \"name\": \"每个实例的节点当前建立的连接数\",\n \"note\": \"\"\n },\n {\n \"lang\": \"en_US\",\n \"name\": \"Number of connections currently established by nodes per instance\",\n \"note\": \"\"\n }\n ]\n },\n {\n \"id\": 0,\n \"uuid\": 1717556327278608000,\n \"collector\": \"Exporter\",\n \"typ\": \"AutoMQ\",\n \"name\": \"活跃Broker数量\",\n \"unit\": \"sishort\",\n \"note\": \"\",\n \"lang\": \"zh_CN\",\n \"expression\": \"kafka_broker_active_count\",\n \"created_at\": 0,\n \"created_by\": \"\",\n \"updated_at\": 0,\n \"updated_by\": \"\",\n \"translation\": [\n {\n \"lang\": \"zh_CN\",\n \"name\": \"活跃Broker数量\",\n \"note\": \"\"\n },\n {\n \"lang\": \"en_US\",\n \"name\": \"Number of active brokers\",\n \"note\": \"\"\n }\n ]\n },\n {\n \"id\": 0,\n \"uuid\": 1717556327280516000,\n \"collector\": \"Exporter\",\n \"typ\": \"AutoMQ\",\n \"name\": \"稳定状态的Consumer Group数量总和\",\n \"unit\": \"sishort\",\n \"note\": \"\",\n \"lang\": \"zh_CN\",\n \"expression\": \"sum by (job) (kafka_group_stable_count)\",\n \"created_at\": 0,\n \"created_by\": \"\",\n \"updated_at\": 0,\n \"updated_by\": \"\",\n \"translation\": [\n {\n \"lang\": \"zh_CN\",\n \"name\": \"稳定状态的Consumer Group数量总和\",\n \"note\": \"\"\n },\n {\n \"lang\": \"en_US\",\n \"name\": \"Sum of the number of steady-state Consumer Groups\",\n \"note\": \"\"\n }\n ]\n },\n {\n \"id\": 0,\n \"uuid\": 1717556327282783000,\n \"collector\": \"Exporter\",\n \"typ\": \"AutoMQ\",\n \"name\": \"空的Consumer Group数量总和\",\n \"unit\": \"sishort\",\n \"note\": \"\",\n \"lang\": \"zh_CN\",\n \"expression\": \"sum by (job) (kafka_group_empty_count)\",\n \"created_at\": 0,\n \"created_by\": \"\",\n \"updated_at\": 0,\n \"updated_by\": \"\",\n \"translation\": [\n {\n \"lang\": \"zh_CN\",\n \"name\": \"空的Consumer Group数量总和\",\n \"note\": \"\"\n },\n {\n \"lang\": \"en_US\",\n \"name\": \"Sum number of empty Consumer Groups\",\n \"note\": \"\"\n }\n ]\n },\n {\n \"id\": 0,\n \"uuid\": 1717556327284934000,\n \"collector\": \"Exporter\",\n \"typ\": \"AutoMQ\",\n \"name\": \"节点当前建立的连接数\",\n \"unit\": \"sishort\",\n \"note\": \"\",\n \"lang\": \"zh_CN\",\n \"expression\": \"kafka_server_connection_count\",\n \"created_at\": 0,\n \"created_by\": \"\",\n \"updated_at\": 0,\n \"updated_by\": \"\",\n \"translation\": [\n {\n \"lang\": \"zh_CN\",\n \"name\": \"节点当前建立的连接数\",\n \"note\": \"\"\n },\n {\n \"lang\": \"en_US\",\n \"name\": \"Number of connections currently established by the node\",\n \"note\": \"\"\n }\n ]\n },\n {\n \"id\": 0,\n \"uuid\": 1717556327287401000,\n \"collector\": \"Exporter\",\n \"typ\": \"AutoMQ\",\n \"name\": \"被fence的Broker数量\",\n \"unit\": \"sishort\",\n \"note\": \"\",\n \"lang\": \"zh_CN\",\n \"expression\": \"kafka_broker_fenced_count\",\n \"created_at\": 0,\n \"created_by\": \"\",\n \"updated_at\": 0,\n \"updated_by\": \"\",\n \"translation\": [\n {\n \"lang\": \"zh_CN\",\n \"name\": \"被fence的Broker数量\",\n \"note\": \"\"\n },\n {\n \"lang\": \"en_US\",\n \"name\": \"Number of Brokers fenced\",\n \"note\": \"\"\n }\n ]\n },\n {\n \"id\": 0,\n \"uuid\": 1717556327291657000,\n \"collector\": \"Exporter\",\n \"typ\": \"AutoMQ\",\n \"name\": \"请求错误计数总和\",\n \"unit\": \"sishort\",\n \"note\": \"\",\n \"lang\": \"zh_CN\",\n \"expression\": \"sum by (job) (rate(kafka_request_error_count_total[1m]))\",\n \"created_at\": 0,\n \"created_by\": \"\",\n \"updated_at\": 0,\n \"updated_by\": \"\",\n \"translation\": [\n {\n \"lang\": \"zh_CN\",\n \"name\": \"请求错误计数总和\",\n \"note\": \"\"\n },\n {\n \"lang\": \"en_US\",\n \"name\": \"Request error count sum\",\n \"note\": \"\"\n }\n ]\n },\n {\n \"id\": 0,\n \"uuid\": 1717556327295172000,\n \"collector\": \"Exporter\",\n \"typ\": \"AutoMQ\",\n \"name\": \"请求错误计数率\",\n \"unit\": \"sishort\",\n \"note\": \"\",\n \"lang\": \"zh_CN\",\n \"expression\": \"rate(kafka_request_error_count_total[1m])\",\n \"created_at\": 0,\n \"created_by\": \"\",\n \"updated_at\": 0,\n \"updated_by\": \"\",\n \"translation\": [\n {\n \"lang\": \"zh_CN\",\n \"name\": \"请求错误计数率\",\n \"note\": \"\"\n },\n {\n \"lang\": \"en_US\",\n \"name\": \"Request error count rate\",\n \"note\": \"\"\n }\n ]\n },\n {\n \"id\": 0,\n \"uuid\": 1717556327297787000,\n \"collector\": \"Exporter\",\n \"typ\": \"AutoMQ\",\n \"name\": \"请求错误计数率(每个实例)\",\n \"unit\": \"reqps\",\n \"note\": \"\",\n \"lang\": \"zh_CN\",\n \"expression\": \"sum by(job, instance) (rate(kafka_request_error_count_total[1m]))\",\n \"created_at\": 0,\n \"created_by\": \"\",\n \"updated_at\": 0,\n \"updated_by\": \"\",\n \"translation\": [\n {\n \"lang\": \"zh_CN\",\n \"name\": \"请求错误计数率(每个实例)\",\n \"note\": \"\"\n },\n {\n \"lang\": \"en_US\",\n \"name\": \"Request error count rate (per instance)\",\n \"note\": \"\"\n }\n ]\n },\n {\n \"id\": 0,\n \"uuid\": 1717556327300342000,\n \"collector\": \"Exporter\",\n \"typ\": \"AutoMQ\",\n \"name\": \"集群Topic总数\",\n \"unit\": \"sishort\",\n \"note\": \"\",\n \"lang\": \"zh_CN\",\n \"expression\": \"kafka_topic_count\",\n \"created_at\": 0,\n \"created_by\": \"\",\n \"updated_at\": 0,\n \"updated_by\": \"\",\n \"translation\": [\n {\n \"lang\": \"zh_CN\",\n \"name\": \"集群Topic总数\",\n \"note\": \"\"\n },\n {\n \"lang\": \"en_US\",\n \"name\": \"Total number of cluster topics\",\n \"note\": \"\"\n }\n ]\n },\n {\n \"id\": 0,\n \"uuid\": 1717556327302857000,\n \"collector\": \"Exporter\",\n \"typ\": \"AutoMQ\",\n \"name\": \"集群分区总数\",\n \"unit\": \"sishort\",\n \"note\": \"\",\n \"lang\": \"zh_CN\",\n \"expression\": \"kafka_partition_total_count\",\n \"created_at\": 0,\n \"created_by\": \"\",\n \"updated_at\": 0,\n \"updated_by\": \"\",\n \"translation\": [\n {\n \"lang\": \"zh_CN\",\n \"name\": \"集群分区总数\",\n \"note\": \"\"\n },\n {\n \"lang\": \"en_US\",\n \"name\": \"Total number of cluster partitions\",\n \"note\": \"\"\n }\n ]\n }\n]"
},
{
"path": "integrations/Bind/collect/bind/bind.toml",
"content": "[[instances]]\nurls = [\n # \"http://localhost:8053/xml/v3\",\n]\ngather_memory_contexts = true\ngather_views = true\ntimeout = \"5s\"\n# labels={app=\"bind\"}"
},
{
"path": "integrations/Bind/markdown/README.md",
"content": "forked from [telegraf/bind](https://github.com/influxdata/telegraf/tree/master/plugins/inputs/bind)\n\n配置示例\n```\n[[instances]]\nurls = [\n #\"http://localhost:8053/xml/v3\",\n]\n\ntimeout = \"5s\"\ngather_memory_contexts = true\ngather_views = true\n```"
},
{
"path": "integrations/Canal/dashboards/canal_by_categraf.json",
"content": "{\n \"id\": 0,\n \"group_id\": 0,\n \"name\": \"Canal instances\",\n \"ident\": \"\",\n \"tags\": \"\",\n \"create_at\": 0,\n \"create_by\": \"\",\n \"update_at\": 0,\n \"update_by\": \"\",\n \"configs\": {\n \"links\": [],\n \"panels\": [\n {\n \"collapsed\": true,\n \"id\": \"c876d624-3357-4511-bed9-fd30fd82e2e8\",\n \"layout\": {\n \"h\": 1,\n \"i\": \"c876d624-3357-4511-bed9-fd30fd82e2e8\",\n \"w\": 24,\n \"x\": 0,\n \"y\": 0\n },\n \"name\": \"Instance status\",\n \"panels\": [],\n \"type\": \"row\",\n \"version\": \"3.0.0\"\n },\n {\n \"custom\": {\n \"drawStyle\": \"lines\",\n \"fillOpacity\": 0,\n \"lineInterpolation\": \"linear\",\n \"stack\": \"off\",\n \"version\": \"3.0.0\"\n },\n \"datasourceCate\": \"prometheus\",\n \"datasourceValue\": \"${datasource}\",\n \"description\": \"Canal instance 基本信息。\",\n \"id\": \"235ad194-ad14-4431-9633-543bd679e9dc\",\n \"layout\": {\n \"h\": 5,\n \"i\": \"235ad194-ad14-4431-9633-543bd679e9dc\",\n \"w\": 6,\n \"x\": 0,\n \"y\": 1\n },\n \"links\": [],\n \"maxPerRow\": 4,\n \"name\": \"Basic\",\n \"options\": {\n \"legend\": {\n \"displayMode\": \"hidden\"\n },\n \"thresholds\": {\n \"steps\": [\n {\n \"color\": \"#634CD9\",\n \"type\": \"base\",\n \"value\": null\n }\n ]\n },\n \"tooltip\": {\n \"mode\": \"all\",\n \"sort\": \"none\"\n }\n },\n \"repeat\": null,\n \"targets\": [\n {\n \"expr\": \"canal_instance{destination=~\\\"$destination\\\"}\",\n \"legend\": \"Destination: {{destination}}\",\n \"refId\": \"A\"\n },\n {\n \"expr\": \"canal_instance_parser_mode{destination=~\\\"$destination\\\"}\",\n \"legend\": \"Parallel parser: {{parallel}}\",\n \"refId\": \"B\"\n },\n {\n \"expr\": \"canal_instance_store{destination=~\\\"$destination\\\"}\",\n \"legend\": \"Batch mode: {{batchMode}}\",\n \"refId\": \"C\"\n },\n {\n \"expr\": \"canal_instance_store{destination=~\\\"$destination\\\"}\",\n \"legend\": \"Buffer size: {{size}}\",\n \"refId\": \"D\"\n }\n ],\n \"type\": \"timeseries\",\n \"version\": \"3.0.0\"\n },\n {\n \"custom\": {\n \"drawStyle\": \"lines\",\n \"fillOpacity\": 0,\n \"lineInterpolation\": \"linear\",\n \"stack\": \"off\",\n \"version\": \"3.0.0\"\n },\n \"datasourceCate\": \"prometheus\",\n \"datasourceValue\": \"${datasource}\",\n \"description\": \"Canal instance 网络带宽占用。\\ninbound: 读取MySQL binlog.\\noutbound: 对Client端传输格式化binlog.\",\n \"id\": \"13080d70-8fe9-4388-9d72-f587b3b480b9\",\n \"layout\": {\n \"h\": 5,\n \"i\": \"13080d70-8fe9-4388-9d72-f587b3b480b9\",\n \"w\": 6,\n \"x\": 6,\n \"y\": 1\n },\n \"links\": [],\n \"maxPerRow\": 4,\n \"name\": \"Network bandwidth\",\n \"options\": {\n \"legend\": {\n \"displayMode\": \"hidden\"\n },\n \"thresholds\": {\n \"steps\": [\n {\n \"color\": \"#634CD9\",\n \"type\": \"base\",\n \"value\": null\n }\n ]\n },\n \"tooltip\": {\n \"mode\": \"all\",\n \"sort\": \"none\"\n }\n },\n \"targets\": [\n {\n \"expr\": \"rate(canal_instance_received_binlog_bytes{destination=~\\\"$destination\\\", parser=\\\"0\\\"}[2m]) / 1024\",\n \"legend\": \"inbound\",\n \"refId\": \"A\"\n },\n {\n \"expr\": \"rate(canal_instance_client_bytes{destination=~\\\"$destination\\\"}[2m]) / 1024\",\n \"legend\": \"outbound\",\n \"refId\": \"B\"\n },\n {\n \"expr\": \"rate(canal_instance_received_binlog_bytes{destination=~\\\"$destination\\\", parser=\\\"1\\\"}[2m]) / 1024\",\n \"legend\": \"inbound-1\",\n \"refId\": \"C\"\n },\n {\n \"expr\": \"rate(canal_instance_received_binlog_bytes{destination=~\\\"$destination\\\", parser=\\\"2\\\"}[2m]) / 1024\",\n \"legend\": \"inbound-2\",\n \"refId\": \"D\"\n }\n ],\n \"type\": \"timeseries\",\n \"version\": \"3.0.0\"\n },\n {\n \"custom\": {\n \"drawStyle\": \"lines\",\n \"fillOpacity\": 0,\n \"lineInterpolation\": \"linear\",\n \"stack\": \"off\",\n \"version\": \"3.0.0\"\n },\n \"datasourceCate\": \"prometheus\",\n \"datasourceValue\": \"${datasource}\",\n \"description\": \"master: Canal server相对于MySQL master的延时。通过master heartbeat机制能刷新idle状态下的延时。\\nput: store put操作的时间点为基准。\\nget: client get操作的时间点为基准。\\nack: client ack操作的时间点为基准。\",\n \"id\": \"8f46e835-1c9a-4ec1-94d4-2416646061d6\",\n \"layout\": {\n \"h\": 5,\n \"i\": \"8f46e835-1c9a-4ec1-94d4-2416646061d6\",\n \"w\": 6,\n \"x\": 12,\n \"y\": 1\n },\n \"links\": [],\n \"maxPerRow\": 4,\n \"name\": \"Delay\",\n \"options\": {\n \"legend\": {\n \"displayMode\": \"hidden\"\n },\n \"thresholds\": {\n \"steps\": [\n {\n \"color\": \"#634CD9\",\n \"type\": \"base\",\n \"value\": null\n }\n ]\n },\n \"tooltip\": {\n \"mode\": \"all\",\n \"sort\": \"none\"\n }\n },\n \"targets\": [\n {\n \"expr\": \"canal_instance_traffic_delay{destination=~\\\"$destination\\\"} / 1000\",\n \"legend\": \"master\",\n \"refId\": \"D\"\n },\n {\n \"expr\": \"canal_instance_put_delay{destination=~\\\"$destination\\\"} / 1000\",\n \"legend\": \"put\",\n \"refId\": \"A\"\n },\n {\n \"expr\": \"canal_instance_get_delay{destination=~\\\"$destination\\\"} / 1000\",\n \"legend\": \"get\",\n \"refId\": \"B\"\n },\n {\n \"expr\": \"canal_instance_ack_delay{destination=~\\\"$destination\\\"} / 1000\",\n \"legend\": \"ack\",\n \"refId\": \"C\"\n }\n ],\n \"type\": \"timeseries\",\n \"version\": \"3.0.0\"\n },\n {\n \"custom\": {\n \"drawStyle\": \"lines\",\n \"fillOpacity\": 0,\n \"lineInterpolation\": \"linear\",\n \"stack\": \"off\",\n \"version\": \"3.0.0\"\n },\n \"datasourceCate\": \"prometheus\",\n \"datasourceValue\": \"${datasource}\",\n \"description\": \"sink线程blocking占比;dump线程blocking占比(仅parallel mode)。\",\n \"id\": \"986e87d8-37d3-4995-8f8d-7141d4b792af\",\n \"layout\": {\n \"h\": 5,\n \"i\": \"986e87d8-37d3-4995-8f8d-7141d4b792af\",\n \"w\": 6,\n \"x\": 18,\n \"y\": 1\n },\n \"links\": [],\n \"maxPerRow\": 4,\n \"name\": \"Blocking\",\n \"options\": {\n \"legend\": {\n \"displayMode\": \"hidden\"\n },\n \"thresholds\": {\n \"steps\": [\n {\n \"color\": \"#634CD9\",\n \"type\": \"base\",\n \"value\": null\n }\n ]\n },\n \"tooltip\": {\n \"mode\": \"all\",\n \"sort\": \"none\"\n }\n },\n \"targets\": [\n {\n \"expr\": \"clamp_max(rate(canal_instance_publish_blocking_time{destination=~\\\"$destination\\\", parser=\\\"0\\\"}[2m]), 1000) / 10\",\n \"legend\": \"dump\",\n \"refId\": \"B\"\n },\n {\n \"expr\": \"clamp_max(rate(canal_instance_sink_blocking_time{destination=~\\\"$destination\\\"}[2m]), 1000) / 10\",\n \"legend\": \"sink\",\n \"refId\": \"A\"\n },\n {\n \"expr\": \"clamp_max(rate(canal_instance_publish_blocking_time{destination=~\\\"$destination\\\", parser=\\\"1\\\"}[2m]), 1000) / 10\",\n \"legend\": \"dump-1\",\n \"refId\": \"C\"\n },\n {\n \"expr\": \"clamp_max(rate(canal_instance_publish_blocking_time{destination=~\\\"$destination\\\", parser=\\\"2\\\"}[2m]), 1000) / 10\",\n \"legend\": \"dump-2\",\n \"refId\": \"D\"\n }\n ],\n \"type\": \"timeseries\",\n \"version\": \"3.0.0\"\n },\n {\n \"collapsed\": true,\n \"id\": \"d51067ea-6e23-41c1-91d9-dd264c041add\",\n \"layout\": {\n \"h\": 1,\n \"i\": \"d51067ea-6e23-41c1-91d9-dd264c041add\",\n \"w\": 24,\n \"x\": 0,\n \"y\": 6\n },\n \"name\": \"Throughput\",\n \"panels\": [],\n \"type\": \"row\",\n \"version\": \"3.0.0\"\n },\n {\n \"custom\": {\n \"drawStyle\": \"lines\",\n \"fillOpacity\": 0,\n \"lineInterpolation\": \"linear\",\n \"stack\": \"off\",\n \"version\": \"3.0.0\"\n },\n \"datasourceCate\": \"prometheus\",\n \"datasourceValue\": \"${datasource}\",\n \"description\": \"Instance处理binlog的TPS(以master变更行数table rows为基准计算)。\\nput: put操作TPS。\\nget: get操作TPS。\\nack: ack操作TPS。\",\n \"id\": \"66a0392c-ffbe-42a5-b423-7e83007318b2\",\n \"layout\": {\n \"h\": 5,\n \"i\": \"66a0392c-ffbe-42a5-b423-7e83007318b2\",\n \"w\": 6,\n \"x\": 0,\n \"y\": 7\n },\n \"links\": [],\n \"maxPerRow\": 4,\n \"name\": \"TPS(table rows)\",\n \"options\": {\n \"legend\": {\n \"displayMode\": \"hidden\"\n },\n \"thresholds\": {\n \"steps\": [\n {\n \"color\": \"#634CD9\",\n \"type\": \"base\",\n \"value\": null\n }\n ]\n },\n \"tooltip\": {\n \"mode\": \"all\",\n \"sort\": \"none\"\n }\n },\n \"targets\": [\n {\n \"expr\": \"rate(canal_instance_put_rows{destination=~\\\"$destination\\\"}[2m])\",\n \"legend\": \"put\",\n \"refId\": \"A\"\n },\n {\n \"expr\": \"rate(canal_instance_get_rows{destination=~\\\"$destination\\\"}[2m])\",\n \"legend\": \"get\",\n \"refId\": \"B\"\n },\n {\n \"expr\": \"rate(canal_instance_ack_rows{destination=~\\\"$destination\\\"}[2m])\",\n \"legend\": \"ack\",\n \"refId\": \"C\"\n }\n ],\n \"type\": \"timeseries\",\n \"version\": \"3.0.0\"\n },\n {\n \"custom\": {\n \"drawStyle\": \"lines\",\n \"fillOpacity\": 0,\n \"lineInterpolation\": \"linear\",\n \"stack\": \"off\",\n \"version\": \"3.0.0\"\n },\n \"datasourceCate\": \"prometheus\",\n \"datasourceValue\": \"${datasource}\",\n \"description\": \"Canal instance 处理binlog的TPS,以MySQL transaction为单位计算。\",\n \"id\": \"daaa8cfd-3238-4ee2-ae30-4d5bd0c899d7\",\n \"layout\": {\n \"h\": 5,\n \"i\": \"daaa8cfd-3238-4ee2-ae30-4d5bd0c899d7\",\n \"w\": 6,\n \"x\": 6,\n \"y\": 7\n },\n \"links\": [],\n \"maxPerRow\": 4,\n \"name\": \"TPS(MySQL transaction)\",\n \"options\": {\n \"legend\": {\n \"displayMode\": \"hidden\"\n },\n \"thresholds\": {\n \"steps\": [\n {\n \"color\": \"#634CD9\",\n \"type\": \"base\",\n \"value\": null\n }\n ]\n },\n \"tooltip\": {\n \"mode\": \"all\",\n \"sort\": \"none\"\n }\n },\n \"targets\": [\n {\n \"expr\": \"rate(canal_instance_transactions{destination=~\\\"$destination\\\"}[2m])\",\n \"legend\": \"transactions\",\n \"refId\": \"A\"\n }\n ],\n \"type\": \"timeseries\",\n \"version\": \"3.0.0\"\n },\n {\n \"collapsed\": true,\n \"id\": \"72043279-0d2a-47d9-97f9-80cb4c595bc4\",\n \"layout\": {\n \"h\": 1,\n \"i\": \"72043279-0d2a-47d9-97f9-80cb4c595bc4\",\n \"w\": 24,\n \"x\": 0,\n \"y\": 12\n },\n \"name\": \"Client\",\n \"panels\": [],\n \"type\": \"row\",\n \"version\": \"3.0.0\"\n },\n {\n \"custom\": {\n \"drawStyle\": \"lines\",\n \"fillOpacity\": 0,\n \"lineInterpolation\": \"linear\",\n \"stack\": \"off\",\n \"version\": \"3.0.0\"\n },\n \"datasourceCate\": \"prometheus\",\n \"datasourceValue\": \"${datasource}\",\n \"description\": \"Canal instance接收到的请求统计,结果按packet type分类。\",\n \"id\": \"bae11c21-18ad-4964-90a5-09ba9b083fb9\",\n \"layout\": {\n \"h\": 5,\n \"i\": \"bae11c21-18ad-4964-90a5-09ba9b083fb9\",\n \"w\": 6,\n \"x\": 0,\n \"y\": 13\n },\n \"links\": [],\n \"maxPerRow\": 4,\n \"name\": \"Client requests\",\n \"options\": {\n \"legend\": {\n \"displayMode\": \"hidden\"\n },\n \"thresholds\": {\n \"steps\": [\n {\n \"color\": \"#634CD9\",\n \"type\": \"base\",\n \"value\": null\n }\n ]\n },\n \"tooltip\": {\n \"mode\": \"all\",\n \"sort\": \"none\"\n }\n },\n \"targets\": [\n {\n \"expr\": \"canal_instance_client_packets{destination=~\\\"$destination\\\"}\",\n \"legend\": \"{{packetType}}\",\n \"refId\": \"A\"\n }\n ],\n \"type\": \"timeseries\",\n \"version\": \"3.0.0\"\n },\n {\n \"custom\": {\n \"drawStyle\": \"lines\",\n \"fillOpacity\": 0,\n \"lineInterpolation\": \"linear\",\n \"stack\": \"off\",\n \"version\": \"3.0.0\"\n },\n \"datasourceCate\": \"prometheus\",\n \"datasourceValue\": \"${datasource}\",\n \"description\": \"client 请求的GET与ACK包的QPS。\",\n \"id\": \"9e94fdcd-fc2a-4dc1-8f64-9242409a7345\",\n \"layout\": {\n \"h\": 5,\n \"i\": \"9e94fdcd-fc2a-4dc1-8f64-9242409a7345\",\n \"w\": 6,\n \"x\": 6,\n \"y\": 13\n },\n \"links\": [],\n \"maxPerRow\": 4,\n \"name\": \"Client QPS\",\n \"options\": {\n \"legend\": {\n \"displayMode\": \"hidden\"\n },\n \"thresholds\": {\n \"steps\": [\n {\n \"color\": \"#634CD9\",\n \"type\": \"base\",\n \"value\": null\n }\n ]\n },\n \"tooltip\": {\n \"mode\": \"all\",\n \"sort\": \"none\"\n }\n },\n \"targets\": [\n {\n \"expr\": \"rate(canal_instance_client_packets{destination=~\\\"$destination\\\",packetType=\\\"GET\\\"}[2m])\",\n \"legend\": \"GET\",\n \"refId\": \"A\"\n },\n {\n \"expr\": \"rate(canal_instance_client_packets{destination=~\\\"$destination\\\",packetType=\\\"CLIENTACK\\\"}[2m])\",\n \"legend\": \"ACK\",\n \"refId\": \"B\"\n }\n ],\n \"type\": \"timeseries\",\n \"version\": \"3.0.0\"\n },\n {\n \"custom\": {\n \"drawStyle\": \"lines\",\n \"fillOpacity\": 0,\n \"lineInterpolation\": \"linear\",\n \"stack\": \"off\",\n \"version\": \"3.0.0\"\n },\n \"datasourceCate\": \"prometheus\",\n \"datasourceValue\": \"${datasource}\",\n \"description\": \"server响应GET请求,但返回空包的占比。\",\n \"id\": \"7fc92a43-77c1-469f-b1b4-dc2b5c45a81d\",\n \"layout\": {\n \"h\": 5,\n \"i\": \"7fc92a43-77c1-469f-b1b4-dc2b5c45a81d\",\n \"w\": 6,\n \"x\": 12,\n \"y\": 13\n },\n \"links\": [],\n \"maxPerRow\": 4,\n \"name\": \"Empty packets\",\n \"options\": {\n \"legend\": {\n \"displayMode\": \"hidden\"\n },\n \"thresholds\": {\n \"steps\": [\n {\n \"color\": \"#634CD9\",\n \"type\": \"base\",\n \"value\": null\n }\n ]\n },\n \"tooltip\": {\n \"mode\": \"all\",\n \"sort\": \"none\"\n }\n },\n \"targets\": [\n {\n \"expr\": \"rate(canal_instance_client_empty_batches{destination=~\\\"$destination\\\"}[2m])\",\n \"legend\": \"empty\",\n \"refId\": \"A\"\n },\n {\n \"expr\": \"rate(canal_instance_client_packets{destination=~\\\"$destination\\\", packetType=\\\"GET\\\"}[2m])\",\n \"legend\": \"nonempty\",\n \"refId\": \"B\"\n }\n ],\n \"type\": \"timeseries\",\n \"version\": \"3.0.0\"\n },\n {\n \"custom\": {\n \"drawStyle\": \"lines\",\n \"fillOpacity\": 0,\n \"lineInterpolation\": \"linear\",\n \"stack\": \"off\",\n \"version\": \"3.0.0\"\n },\n \"datasourceCate\": \"prometheus\",\n \"datasourceValue\": \"${datasource}\",\n \"description\": \"Canal client 请求响应时间的概况。\",\n \"id\": \"99623fe5-652c-4091-81d9-942e94b4ac4c\",\n \"layout\": {\n \"h\": 5,\n \"i\": \"99623fe5-652c-4091-81d9-942e94b4ac4c\",\n \"w\": 6,\n \"x\": 18,\n \"y\": 13\n },\n \"links\": [],\n \"maxPerRow\": 4,\n \"name\": \"Response time\",\n \"options\": {\n \"legend\": {\n \"displayMode\": \"hidden\"\n },\n \"thresholds\": {\n \"steps\": [\n {\n \"color\": \"#634CD9\",\n \"type\": \"base\",\n \"value\": null\n }\n ]\n },\n \"tooltip\": {\n \"mode\": \"all\",\n \"sort\": \"none\"\n }\n },\n \"targets\": [\n {\n \"expr\": \"rate(canal_instance_client_request_latency_bucket{destination=~\\\"$destination\\\"}[2m])\",\n \"legend\": \"{{le}}ms\",\n \"refId\": \"A\"\n }\n ],\n \"type\": \"timeseries\",\n \"version\": \"3.0.0\"\n },\n {\n \"collapsed\": true,\n \"id\": \"24ce3843-8303-4a17-ac74-36f3ddc50af5\",\n \"layout\": {\n \"h\": 1,\n \"i\": \"24ce3843-8303-4a17-ac74-36f3ddc50af5\",\n \"w\": 24,\n \"x\": 0,\n \"y\": 18\n },\n \"name\": \"Store\",\n \"panels\": [],\n \"type\": \"row\",\n \"version\": \"3.0.0\"\n },\n {\n \"custom\": {\n \"drawStyle\": \"lines\",\n \"fillOpacity\": 0,\n \"lineInterpolation\": \"linear\",\n \"stack\": \"off\",\n \"version\": \"3.0.0\"\n },\n \"datasourceCate\": \"prometheus\",\n \"datasourceValue\": \"${datasource}\",\n \"description\": \"Canal instance ringbuffer内未释放的events数量。\",\n \"id\": \"326dcd0e-dc9c-42b9-83a7-ea59648092cc\",\n \"layout\": {\n \"h\": 5,\n \"i\": \"326dcd0e-dc9c-42b9-83a7-ea59648092cc\",\n \"w\": 6,\n \"x\": 0,\n \"y\": 19\n },\n \"links\": [],\n \"maxPerRow\": 4,\n \"name\": \"Store remain events\",\n \"options\": {\n \"legend\": {\n \"displayMode\": \"hidden\"\n },\n \"thresholds\": {\n \"steps\": [\n {\n \"color\": \"#634CD9\",\n \"type\": \"base\",\n \"value\": null\n }\n ]\n },\n \"tooltip\": {\n \"mode\": \"all\",\n \"sort\": \"none\"\n }\n },\n \"targets\": [\n {\n \"expr\": \"canal_instance_store_produce_seq{destination=~\\\"$destination\\\"} - canal_instance_store_consume_seq{destination=~\\\"$destination\\\"}\",\n \"legend\": \"events\",\n \"refId\": \"A\"\n }\n ],\n \"type\": \"timeseries\",\n \"version\": \"3.0.0\"\n },\n {\n \"custom\": {\n \"drawStyle\": \"lines\",\n \"fillOpacity\": 0,\n \"lineInterpolation\": \"linear\",\n \"stack\": \"off\",\n \"version\": \"3.0.0\"\n },\n \"datasourceCate\": \"prometheus\",\n \"datasourceValue\": \"${datasource}\",\n \"description\": \"Canal instance ringbuffer 内未释放events占用内存。\",\n \"id\": \"c328535d-9864-4681-865c-8551115dac07\",\n \"layout\": {\n \"h\": 5,\n \"i\": \"c328535d-9864-4681-865c-8551115dac07\",\n \"w\": 6,\n \"x\": 6,\n \"y\": 19\n },\n \"links\": [],\n \"maxPerRow\": 4,\n \"name\": \"Store remain mem\",\n \"options\": {\n \"legend\": {\n \"displayMode\": \"hidden\"\n },\n \"thresholds\": {\n \"steps\": [\n {\n \"color\": \"#634CD9\",\n \"type\": \"base\",\n \"value\": null\n }\n ]\n },\n \"tooltip\": {\n \"mode\": \"all\",\n \"sort\": \"none\"\n }\n },\n \"targets\": [\n {\n \"expr\": \"(canal_instance_store_produce_mem{destination=~\\\"$destination\\\"} - canal_instance_store_consume_mem{destination=~\\\"$destination\\\"}) / 1024\",\n \"legend\": \"memsize\",\n \"refId\": \"A\"\n }\n ],\n \"type\": \"timeseries\",\n \"version\": \"3.0.0\"\n }\n ],\n \"var\": [\n {\n \"definition\": \"prometheus\",\n \"hide\": false,\n \"name\": \"datasource\",\n \"type\": \"datasource\"\n },\n {\n \"allOption\": false,\n \"allValue\": null,\n \"datasource\": {\n \"cate\": \"prometheus\",\n \"value\": \"${datasource}\"\n },\n \"definition\": \"label_values(canal_instance, destination)\",\n \"hide\": false,\n \"multi\": false,\n \"name\": \"destination\",\n \"reg\": \"\",\n \"type\": \"query\"\n }\n ],\n \"version\": \"3.0.0\"\n },\n \"public\": 0,\n \"public_cate\": 0,\n \"bgids\": null,\n \"built_in\": 0,\n \"hide\": 0,\n \"uuid\": 1717556327308578000\n}"
},
{
"path": "integrations/Canal/markdown/README.md",
"content": "## canal\n\ncanal 默认提供了 prometheus 格式指标的接口 [Prometheus-QuickStart](https://github.com/alibaba/canal/wiki/Prometheus-QuickStart) ,所以可以直接通过[ prometheus 插件](https://flashcat.cloud/docs/content/flashcat-monitor/categraf/plugin/prometheus)采集。"
},
{
"path": "integrations/Ceph/alerts/ceph_by_categraf.json",
"content": "[\n {\n \"id\": 0,\n \"group_id\": 0,\n \"cate\": \"prometheus\",\n \"datasource_ids\": [\n 0\n ],\n \"cluster\": \"\",\n \"name\": \"CephErrorState\",\n \"note\": \"Ceph is in Error state longer than 5m, please check status of pools and OSDs\",\n \"prod\": \"metric\",\n \"algorithm\": \"\",\n \"algo_params\": null,\n \"delay\": 0,\n \"severity\": 1,\n \"severities\": [\n 1\n ],\n \"disabled\": 1,\n \"prom_for_duration\": 300,\n \"prom_ql\": \"ceph_health_status \\u003e 1\",\n \"rule_config\": {\n \"algo_params\": null,\n \"inhibit\": false,\n \"prom_ql\": \"\",\n \"queries\": [\n {\n \"prom_ql\": \"ceph_health_status \\u003e 1\",\n \"severity\": 1\n }\n ],\n \"severity\": 0\n },\n \"prom_eval_interval\": 15,\n \"enable_stime\": \"00:00\",\n \"enable_stimes\": [\n \"00:00\"\n ],\n \"enable_etime\": \"23:59\",\n \"enable_etimes\": [\n \"23:59\"\n ],\n \"enable_days_of_week\": [\n \"1\",\n \"2\",\n \"3\",\n \"4\",\n \"5\",\n \"6\",\n \"0\"\n ],\n \"enable_days_of_weeks\": [\n [\n \"1\",\n \"2\",\n \"3\",\n \"4\",\n \"5\",\n \"6\",\n \"0\"\n ]\n ],\n \"enable_in_bg\": 0,\n \"notify_recovered\": 1,\n \"notify_channels\": [],\n \"notify_groups_obj\": null,\n \"notify_groups\": null,\n \"notify_repeat_step\": 60,\n \"notify_max_number\": 0,\n \"recover_duration\": 0,\n \"callbacks\": [],\n \"runbook_url\": \"\",\n \"append_tags\": [],\n \"annotations\": null,\n \"extra_config\": null,\n \"create_at\": 0,\n \"create_by\": \"\",\n \"update_at\": 0,\n \"update_by\": \"\",\n \"uuid\": 1717556327313004000\n },\n {\n \"id\": 0,\n \"group_id\": 0,\n \"cate\": \"prometheus\",\n \"datasource_ids\": [\n 0\n ],\n \"cluster\": \"\",\n \"name\": \"CephOsdReweighted\",\n \"note\": \"OSD {{ $labels.ceph_daemon}} on cluster {{ $labels.cluster}} was reweighted for too long. Please either create silent or fix that issue\",\n \"prod\": \"metric\",\n \"algorithm\": \"\",\n \"algo_params\": null,\n \"delay\": 0,\n \"severity\": 2,\n \"severities\": [\n 2\n ],\n \"disabled\": 1,\n \"prom_for_duration\": 3600,\n \"prom_ql\": \"ceph_osd_weight \\u003c 1\",\n \"rule_config\": {\n \"algo_params\": null,\n \"inhibit\": false,\n \"prom_ql\": \"\",\n \"queries\": [\n {\n \"prom_ql\": \"ceph_osd_weight \\u003c 1\",\n \"severity\": 2\n }\n ],\n \"severity\": 0\n },\n \"prom_eval_interval\": 15,\n \"enable_stime\": \"00:00\",\n \"enable_stimes\": [\n \"00:00\"\n ],\n \"enable_etime\": \"23:59\",\n \"enable_etimes\": [\n \"23:59\"\n ],\n \"enable_days_of_week\": [\n \"1\",\n \"2\",\n \"3\",\n \"4\",\n \"5\",\n \"6\",\n \"0\"\n ],\n \"enable_days_of_weeks\": [\n [\n \"1\",\n \"2\",\n \"3\",\n \"4\",\n \"5\",\n \"6\",\n \"0\"\n ]\n ],\n \"enable_in_bg\": 0,\n \"notify_recovered\": 1,\n \"notify_channels\": [],\n \"notify_groups_obj\": null,\n \"notify_groups\": null,\n \"notify_repeat_step\": 60,\n \"notify_max_number\": 0,\n \"recover_duration\": 0,\n \"callbacks\": [],\n \"runbook_url\": \"\",\n \"append_tags\": [],\n \"annotations\": null,\n \"extra_config\": null,\n \"create_at\": 0,\n \"create_by\": \"\",\n \"update_at\": 0,\n \"update_by\": \"\",\n \"uuid\": 1717556327313504000\n },\n {\n \"id\": 0,\n \"group_id\": 0,\n \"cate\": \"prometheus\",\n \"datasource_ids\": [\n 0\n ],\n \"cluster\": \"\",\n \"name\": \"CephOSDUtilizatoin\",\n \"note\": \"Osd free space for {{ $labels.osd }} is higher tan 90%. Please validate why its so big, reweight or add storage\",\n \"prod\": \"metric\",\n \"algorithm\": \"\",\n \"algo_params\": null,\n \"delay\": 0,\n \"severity\": 1,\n \"severities\": [\n 1\n ],\n \"disabled\": 1,\n \"prom_for_duration\": 60,\n \"prom_ql\": \"ceph_osd_utilization \\u003e 90\",\n \"rule_config\": {\n \"algo_params\": null,\n \"inhibit\": false,\n \"prom_ql\": \"\",\n \"queries\": [\n {\n \"prom_ql\": \"ceph_osd_utilization \\u003e 90\",\n \"severity\": 1\n }\n ],\n \"severity\": 0\n },\n \"prom_eval_interval\": 15,\n \"enable_stime\": \"00:00\",\n \"enable_stimes\": [\n \"00:00\"\n ],\n \"enable_etime\": \"23:59\",\n \"enable_etimes\": [\n \"23:59\"\n ],\n \"enable_days_of_week\": [\n \"1\",\n \"2\",\n \"3\",\n \"4\",\n \"5\",\n \"6\",\n \"0\"\n ],\n \"enable_days_of_weeks\": [\n [\n \"1\",\n \"2\",\n \"3\",\n \"4\",\n \"5\",\n \"6\",\n \"0\"\n ]\n ],\n \"enable_in_bg\": 0,\n \"notify_recovered\": 1,\n \"notify_channels\": [],\n \"notify_groups_obj\": null,\n \"notify_groups\": null,\n \"notify_repeat_step\": 60,\n \"notify_max_number\": 0,\n \"recover_duration\": 0,\n \"callbacks\": [],\n \"runbook_url\": \"\",\n \"append_tags\": [],\n \"annotations\": null,\n \"extra_config\": null,\n \"create_at\": 0,\n \"create_by\": \"\",\n \"update_at\": 0,\n \"update_by\": \"\",\n \"uuid\": 1717556327314160000\n },\n {\n \"id\": 0,\n \"group_id\": 0,\n \"cate\": \"prometheus\",\n \"datasource_ids\": [\n 0\n ],\n \"cluster\": \"\",\n \"name\": \"CephPgActivating\",\n \"note\": \"Some groups are activating for too long on {{ $labels.cluster }}. Those PGs are unavailable for too long!\",\n \"prod\": \"metric\",\n \"algorithm\": \"\",\n \"algo_params\": null,\n \"delay\": 0,\n \"severity\": 1,\n \"severities\": [\n 1\n ],\n \"disabled\": 1,\n \"prom_for_duration\": 300,\n \"prom_ql\": \"ceph_pg_activating \\u003e 0\",\n \"rule_config\": {\n \"algo_params\": null,\n \"inhibit\": false,\n \"prom_ql\": \"\",\n \"queries\": [\n {\n \"prom_ql\": \"ceph_pg_activating \\u003e 0\",\n \"severity\": 1\n }\n ],\n \"severity\": 0\n },\n \"prom_eval_interval\": 15,\n \"enable_stime\": \"00:00\",\n \"enable_stimes\": [\n \"00:00\"\n ],\n \"enable_etime\": \"23:59\",\n \"enable_etimes\": [\n \"23:59\"\n ],\n \"enable_days_of_week\": [\n \"1\",\n \"2\",\n \"3\",\n \"4\",\n \"5\",\n \"6\",\n \"0\"\n ],\n \"enable_days_of_weeks\": [\n [\n \"1\",\n \"2\",\n \"3\",\n \"4\",\n \"5\",\n \"6\",\n \"0\"\n ]\n ],\n \"enable_in_bg\": 0,\n \"notify_recovered\": 1,\n \"notify_channels\": [],\n \"notify_groups_obj\": null,\n \"notify_groups\": null,\n \"notify_repeat_step\": 60,\n \"notify_max_number\": 0,\n \"recover_duration\": 0,\n \"callbacks\": [],\n \"runbook_url\": \"\",\n \"append_tags\": [],\n \"annotations\": null,\n \"extra_config\": null,\n \"create_at\": 0,\n \"create_by\": \"\",\n \"update_at\": 0,\n \"update_by\": \"\",\n \"uuid\": 1717556327314779000\n },\n {\n \"id\": 0,\n \"group_id\": 0,\n \"cate\": \"prometheus\",\n \"datasource_ids\": [\n 0\n ],\n \"cluster\": \"\",\n \"name\": \"CephPgBackfillTooFull\",\n \"note\": \"Some groups are located on full OSD on cluster {{ $labels.cluster }}. Those PGs can be unavailable shortly. Please check OSDs, change weight or reconfigure CRUSH rules.\",\n \"prod\": \"metric\",\n \"algorithm\": \"\",\n \"algo_params\": null,\n \"delay\": 0,\n \"severity\": 2,\n \"severities\": [\n 2\n ],\n \"disabled\": 1,\n \"prom_for_duration\": 300,\n \"prom_ql\": \"ceph_pg_backfill_toofull \\u003e 0\",\n \"rule_config\": {\n \"algo_params\": null,\n \"inhibit\": false,\n \"prom_ql\": \"\",\n \"queries\": [\n {\n \"prom_ql\": \"ceph_pg_backfill_toofull \\u003e 0\",\n \"severity\": 2\n }\n ],\n \"severity\": 0\n },\n \"prom_eval_interval\": 15,\n \"enable_stime\": \"00:00\",\n \"enable_stimes\": [\n \"00:00\"\n ],\n \"enable_etime\": \"23:59\",\n \"enable_etimes\": [\n \"23:59\"\n ],\n \"enable_days_of_week\": [\n \"1\",\n \"2\",\n \"3\",\n \"4\",\n \"5\",\n \"6\",\n \"0\"\n ],\n \"enable_days_of_weeks\": [\n [\n \"1\",\n \"2\",\n \"3\",\n \"4\",\n \"5\",\n \"6\",\n \"0\"\n ]\n ],\n \"enable_in_bg\": 0,\n \"notify_recovered\": 1,\n \"notify_channels\": [],\n \"notify_groups_obj\": null,\n \"notify_groups\": null,\n \"notify_repeat_step\": 60,\n \"notify_max_number\": 0,\n \"recover_duration\": 0,\n \"callbacks\": [],\n \"runbook_url\": \"\",\n \"append_tags\": [],\n \"annotations\": null,\n \"extra_config\": null,\n \"create_at\": 0,\n \"create_by\": \"\",\n \"update_at\": 0,\n \"update_by\": \"\",\n \"uuid\": 1717556327315319000\n },\n {\n \"id\": 0,\n \"group_id\": 0,\n \"cate\": \"prometheus\",\n \"datasource_ids\": [\n 0\n ],\n \"cluster\": \"\",\n \"name\": \"CephPgDown\",\n \"note\": \"Some groups are down (unavailable) for too long on {{ $labels.cluster }}. Please ensure that all the data are available\",\n \"prod\": \"metric\",\n \"algorithm\": \"\",\n \"algo_params\": null,\n \"delay\": 0,\n \"severity\": 1,\n \"severities\": [\n 1\n ],\n \"disabled\": 1,\n \"prom_for_duration\": 180,\n \"prom_ql\": \"ceph_pg_down \\u003e 0\",\n \"rule_config\": {\n \"algo_params\": null,\n \"inhibit\": false,\n \"prom_ql\": \"\",\n \"queries\": [\n {\n \"prom_ql\": \"ceph_pg_down \\u003e 0\",\n \"severity\": 1\n }\n ],\n \"severity\": 0\n },\n \"prom_eval_interval\": 15,\n \"enable_stime\": \"00:00\",\n \"enable_stimes\": [\n \"00:00\"\n ],\n \"enable_etime\": \"23:59\",\n \"enable_etimes\": [\n \"23:59\"\n ],\n \"enable_days_of_week\": [\n \"1\",\n \"2\",\n \"3\",\n \"4\",\n \"5\",\n \"6\",\n \"0\"\n ],\n \"enable_days_of_weeks\": [\n [\n \"1\",\n \"2\",\n \"3\",\n \"4\",\n \"5\",\n \"6\",\n \"0\"\n ]\n ],\n \"enable_in_bg\": 0,\n \"notify_recovered\": 1,\n \"notify_channels\": [],\n \"notify_groups_obj\": null,\n \"notify_groups\": null,\n \"notify_repeat_step\": 60,\n \"notify_max_number\": 0,\n \"recover_duration\": 0,\n \"callbacks\": [],\n \"runbook_url\": \"\",\n \"append_tags\": [],\n \"annotations\": null,\n \"extra_config\": null,\n \"create_at\": 0,\n \"create_by\": \"\",\n \"update_at\": 0,\n \"update_by\": \"\",\n \"uuid\": 1717556327315892000\n },\n {\n \"id\": 0,\n \"group_id\": 0,\n \"cate\": \"prometheus\",\n \"datasource_ids\": [\n 0\n ],\n \"cluster\": \"\",\n \"name\": \"CephPgIncomplete\",\n \"note\": \"Some groups are incomplete (unavailable) for too long on {{ $labels.cluster }}. Please ensure that all the data are available\",\n \"prod\": \"metric\",\n \"algorithm\": \"\",\n \"algo_params\": null,\n \"delay\": 0,\n \"severity\": 1,\n \"severities\": [\n 1\n ],\n \"disabled\": 1,\n \"prom_for_duration\": 120,\n \"prom_ql\": \"ceph_pg_incomplete \\u003e 0\",\n \"rule_config\": {\n \"algo_params\": null,\n \"inhibit\": false,\n \"prom_ql\": \"\",\n \"queries\": [\n {\n \"prom_ql\": \"ceph_pg_incomplete \\u003e 0\",\n \"severity\": 1\n }\n ],\n \"severity\": 0\n },\n \"prom_eval_interval\": 15,\n \"enable_stime\": \"00:00\",\n \"enable_stimes\": [\n \"00:00\"\n ],\n \"enable_etime\": \"23:59\",\n \"enable_etimes\": [\n \"23:59\"\n ],\n \"enable_days_of_week\": [\n \"1\",\n \"2\",\n \"3\",\n \"4\",\n \"5\",\n \"6\",\n \"0\"\n ],\n \"enable_days_of_weeks\": [\n [\n \"1\",\n \"2\",\n \"3\",\n \"4\",\n \"5\",\n \"6\",\n \"0\"\n ]\n ],\n \"enable_in_bg\": 0,\n \"notify_recovered\": 1,\n \"notify_channels\": [],\n \"notify_groups_obj\": null,\n \"notify_groups\": null,\n \"notify_repeat_step\": 60,\n \"notify_max_number\": 0,\n \"recover_duration\": 0,\n \"callbacks\": [],\n \"runbook_url\": \"\",\n \"append_tags\": [],\n \"annotations\": null,\n \"extra_config\": null,\n \"create_at\": 0,\n \"create_by\": \"\",\n \"update_at\": 0,\n \"update_by\": \"\",\n \"uuid\": 1717556327316390000\n },\n {\n \"id\": 0,\n \"group_id\": 0,\n \"cate\": \"prometheus\",\n \"datasource_ids\": [\n 0\n ],\n \"cluster\": \"\",\n \"name\": \"CephPgInconsistent\",\n \"note\": \"Some groups are inconsistent for too long on {{ $labels.cluster }}. Data is available but inconsistent across nodes\",\n \"prod\": \"metric\",\n \"algorithm\": \"\",\n \"algo_params\": null,\n \"delay\": 0,\n \"severity\": 2,\n \"severities\": [\n 2\n ],\n \"disabled\": 1,\n \"prom_for_duration\": 60,\n \"prom_ql\": \"ceph_pg_inconsistent \\u003e 0\",\n \"rule_config\": {\n \"algo_params\": null,\n \"inhibit\": false,\n \"prom_ql\": \"\",\n \"queries\": [\n {\n \"prom_ql\": \"ceph_pg_inconsistent \\u003e 0\",\n \"severity\": 2\n }\n ],\n \"severity\": 0\n },\n \"prom_eval_interval\": 15,\n \"enable_stime\": \"00:00\",\n \"enable_stimes\": [\n \"00:00\"\n ],\n \"enable_etime\": \"23:59\",\n \"enable_etimes\": [\n \"23:59\"\n ],\n \"enable_days_of_week\": [\n \"1\",\n \"2\",\n \"3\",\n \"4\",\n \"5\",\n \"6\",\n \"0\"\n ],\n \"enable_days_of_weeks\": [\n [\n \"1\",\n \"2\",\n \"3\",\n \"4\",\n \"5\",\n \"6\",\n \"0\"\n ]\n ],\n \"enable_in_bg\": 0,\n \"notify_recovered\": 1,\n \"notify_channels\": [],\n \"notify_groups_obj\": null,\n \"notify_groups\": null,\n \"notify_repeat_step\": 60,\n \"notify_max_number\": 0,\n \"recover_duration\": 0,\n \"callbacks\": [],\n \"runbook_url\": \"\",\n \"append_tags\": [],\n \"annotations\": null,\n \"extra_config\": null,\n \"create_at\": 0,\n \"create_by\": \"\",\n \"update_at\": 0,\n \"update_by\": \"\",\n \"uuid\": 1717556327316911000\n },\n {\n \"id\": 0,\n \"group_id\": 0,\n \"cate\": \"prometheus\",\n \"datasource_ids\": [\n 0\n ],\n \"cluster\": \"\",\n \"name\": \"CephPgUnavailable\",\n \"note\": \"Some groups are unavailable on {{ $labels.cluster }}. Please check their detailed status and current configuration.\",\n \"prod\": \"metric\",\n \"algorithm\": \"\",\n \"algo_params\": null,\n \"delay\": 0,\n \"severity\": 1,\n \"severities\": [\n 1\n ],\n \"disabled\": 1,\n \"prom_for_duration\": 300,\n \"prom_ql\": \"ceph_pg_total - ceph_pg_active \\u003e 0\",\n \"rule_config\": {\n \"algo_params\": null,\n \"inhibit\": false,\n \"prom_ql\": \"\",\n \"queries\": [\n {\n \"prom_ql\": \"ceph_pg_total - ceph_pg_active \\u003e 0\",\n \"severity\": 1\n }\n ],\n \"severity\": 0\n },\n \"prom_eval_interval\": 15,\n \"enable_stime\": \"00:00\",\n \"enable_stimes\": [\n \"00:00\"\n ],\n \"enable_etime\": \"23:59\",\n \"enable_etimes\": [\n \"23:59\"\n ],\n \"enable_days_of_week\": [\n \"1\",\n \"2\",\n \"3\",\n \"4\",\n \"5\",\n \"6\",\n \"0\"\n ],\n \"enable_days_of_weeks\": [\n [\n \"1\",\n \"2\",\n \"3\",\n \"4\",\n \"5\",\n \"6\",\n \"0\"\n ]\n ],\n \"enable_in_bg\": 0,\n \"notify_recovered\": 1,\n \"notify_channels\": [],\n \"notify_groups_obj\": null,\n \"notify_groups\": null,\n \"notify_repeat_step\": 60,\n \"notify_max_number\": 0,\n \"recover_duration\": 0,\n \"callbacks\": [],\n \"runbook_url\": \"\",\n \"append_tags\": [],\n \"annotations\": null,\n \"extra_config\": null,\n \"create_at\": 0,\n \"create_by\": \"\",\n \"update_at\": 0,\n \"update_by\": \"\",\n \"uuid\": 1717556327317557000\n },\n {\n \"id\": 0,\n \"group_id\": 0,\n \"cate\": \"prometheus\",\n \"datasource_ids\": [\n 0\n ],\n \"cluster\": \"\",\n \"name\": \"CephTargetDown\",\n \"note\": \"CEPH target down for more than 2m, please check - it could be a either exporter crash or a whole cluster crash\",\n \"prod\": \"metric\",\n \"algorithm\": \"\",\n \"algo_params\": null,\n \"delay\": 0,\n \"severity\": 1,\n \"severities\": [\n 1\n ],\n \"disabled\": 1,\n \"prom_for_duration\": 600,\n \"prom_ql\": \"up{job=\\\"ceph\\\"} == 0\",\n \"rule_config\": {\n \"algo_params\": null,\n \"inhibit\": false,\n \"prom_ql\": \"\",\n \"queries\": [\n {\n \"prom_ql\": \"up{job=\\\"ceph\\\"} == 0\",\n \"severity\": 1\n }\n ],\n \"severity\": 0\n },\n \"prom_eval_interval\": 15,\n \"enable_stime\": \"00:00\",\n \"enable_stimes\": [\n \"00:00\"\n ],\n \"enable_etime\": \"23:59\",\n \"enable_etimes\": [\n \"23:59\"\n ],\n \"enable_days_of_week\": [\n \"1\",\n \"2\",\n \"3\",\n \"4\",\n \"5\",\n \"6\",\n \"0\"\n ],\n \"enable_days_of_weeks\": [\n [\n \"1\",\n \"2\",\n \"3\",\n \"4\",\n \"5\",\n \"6\",\n \"0\"\n ]\n ],\n \"enable_in_bg\": 0,\n \"notify_recovered\": 1,\n \"notify_channels\": [],\n \"notify_groups_obj\": null,\n \"notify_groups\": null,\n \"notify_repeat_step\": 60,\n \"notify_max_number\": 0,\n \"recover_duration\": 0,\n \"callbacks\": [],\n \"runbook_url\": \"\",\n \"append_tags\": [],\n \"annotations\": null,\n \"extra_config\": null,\n \"create_at\": 0,\n \"create_by\": \"\",\n \"update_at\": 0,\n \"update_by\": \"\",\n \"uuid\": 1717556327318071000\n },\n {\n \"id\": 0,\n \"group_id\": 0,\n \"cate\": \"prometheus\",\n \"datasource_ids\": [\n 0\n ],\n \"cluster\": \"\",\n \"name\": \"CephWarnState\",\n \"note\": \"Ceph is in Warn state longer than 30m, please check status of pools and OSDs\",\n \"prod\": \"metric\",\n \"algorithm\": \"\",\n \"algo_params\": null,\n \"delay\": 0,\n \"severity\": 2,\n \"severities\": [\n 2\n ],\n \"disabled\": 1,\n \"prom_for_duration\": 1800,\n \"prom_ql\": \"ceph_health_status == 1\",\n \"rule_config\": {\n \"algo_params\": null,\n \"inhibit\": false,\n \"prom_ql\": \"\",\n \"queries\": [\n {\n \"prom_ql\": \"ceph_health_status == 1\",\n \"severity\": 2\n }\n ],\n \"severity\": 0\n },\n \"prom_eval_interval\": 15,\n \"enable_stime\": \"00:00\",\n \"enable_stimes\": [\n \"00:00\"\n ],\n \"enable_etime\": \"23:59\",\n \"enable_etimes\": [\n \"23:59\"\n ],\n \"enable_days_of_week\": [\n \"1\",\n \"2\",\n \"3\",\n \"4\",\n \"5\",\n \"6\",\n \"0\"\n ],\n \"enable_days_of_weeks\": [\n [\n \"1\",\n \"2\",\n \"3\",\n \"4\",\n \"5\",\n \"6\",\n \"0\"\n ]\n ],\n \"enable_in_bg\": 0,\n \"notify_recovered\": 1,\n \"notify_channels\": [],\n \"notify_groups_obj\": null,\n \"notify_groups\": null,\n \"notify_repeat_step\": 60,\n \"notify_max_number\": 0,\n \"recover_duration\": 0,\n \"callbacks\": [],\n \"runbook_url\": \"\",\n \"append_tags\": [],\n \"annotations\": null,\n \"extra_config\": null,\n \"create_at\": 0,\n \"create_by\": \"\",\n \"update_at\": 0,\n \"update_by\": \"\",\n \"uuid\": 1717556327318544000\n },\n {\n \"id\": 0,\n \"group_id\": 0,\n \"cate\": \"prometheus\",\n \"datasource_ids\": [\n 0\n ],\n \"cluster\": \"\",\n \"name\": \"MonitorAvailableStorage\",\n \"note\": \"Monitor storage for {{ $labels.monitor }} less than 30% - please check why its too high\",\n \"prod\": \"metric\",\n \"algorithm\": \"\",\n \"algo_params\": null,\n \"delay\": 0,\n \"severity\": 2,\n \"severities\": [\n 2\n ],\n \"disabled\": 1,\n \"prom_for_duration\": 60,\n \"prom_ql\": \"ceph_monitor_avail_percent \\u003c 30\",\n \"rule_config\": {\n \"algo_params\": null,\n \"inhibit\": false,\n \"prom_ql\": \"\",\n \"queries\": [\n {\n \"prom_ql\": \"ceph_monitor_avail_percent \\u003c 30\",\n \"severity\": 2\n }\n ],\n \"severity\": 0\n },\n \"prom_eval_interval\": 15,\n \"enable_stime\": \"00:00\",\n \"enable_stimes\": [\n \"00:00\"\n ],\n \"enable_etime\": \"23:59\",\n \"enable_etimes\": [\n \"23:59\"\n ],\n \"enable_days_of_week\": [\n \"1\",\n \"2\",\n \"3\",\n \"4\",\n \"5\",\n \"6\",\n \"0\"\n ],\n \"enable_days_of_weeks\": [\n [\n \"1\",\n \"2\",\n \"3\",\n \"4\",\n \"5\",\n \"6\",\n \"0\"\n ]\n ],\n \"enable_in_bg\": 0,\n \"notify_recovered\": 1,\n \"notify_channels\": [],\n \"notify_groups_obj\": null,\n \"notify_groups\": null,\n \"notify_repeat_step\": 60,\n \"notify_max_number\": 0,\n \"recover_duration\": 0,\n \"callbacks\": [],\n \"runbook_url\": \"\",\n \"append_tags\": [],\n \"annotations\": null,\n \"extra_config\": null,\n \"create_at\": 0,\n \"create_by\": \"\",\n \"update_at\": 0,\n \"update_by\": \"\",\n \"uuid\": 1717556327319044000\n },\n {\n \"id\": 0,\n \"group_id\": 0,\n \"cate\": \"prometheus\",\n \"datasource_ids\": [\n 0\n ],\n \"cluster\": \"\",\n \"name\": \"MonitorClockSkewTooHigh\",\n \"note\": \"Monitor clock skew detected on {{ $labels.monitor }} - please check ntp and hardware clock settings\",\n \"prod\": \"metric\",\n \"algorithm\": \"\",\n \"algo_params\": null,\n \"delay\": 0,\n \"severity\": 2,\n \"severities\": [\n 2\n ],\n \"disabled\": 1,\n \"prom_for_duration\": 60,\n \"prom_ql\": \"abs(ceph_monitor_clock_skew_seconds) \\u003e 0.1\",\n \"rule_config\": {\n \"algo_params\": null,\n \"inhibit\": false,\n \"prom_ql\": \"\",\n \"queries\": [\n {\n \"prom_ql\": \"abs(ceph_monitor_clock_skew_seconds) \\u003e 0.1\",\n \"severity\": 2\n }\n ],\n \"severity\": 0\n },\n \"prom_eval_interval\": 15,\n \"enable_stime\": \"00:00\",\n \"enable_stimes\": [\n \"00:00\"\n ],\n \"enable_etime\": \"23:59\",\n \"enable_etimes\": [\n \"23:59\"\n ],\n \"enable_days_of_week\": [\n \"1\",\n \"2\",\n \"3\",\n \"4\",\n \"5\",\n \"6\",\n \"0\"\n ],\n \"enable_days_of_weeks\": [\n [\n \"1\",\n \"2\",\n \"3\",\n \"4\",\n \"5\",\n \"6\",\n \"0\"\n ]\n ],\n \"enable_in_bg\": 0,\n \"notify_recovered\": 1,\n \"notify_channels\": [],\n \"notify_groups_obj\": null,\n \"notify_groups\": null,\n \"notify_repeat_step\": 60,\n \"notify_max_number\": 0,\n \"recover_duration\": 0,\n \"callbacks\": [],\n \"runbook_url\": \"\",\n \"append_tags\": [],\n \"annotations\": null,\n \"extra_config\": null,\n \"create_at\": 0,\n \"create_by\": \"\",\n \"update_at\": 0,\n \"update_by\": \"\",\n \"uuid\": 1717556327319491000\n },\n {\n \"id\": 0,\n \"group_id\": 0,\n \"cate\": \"prometheus\",\n \"datasource_ids\": [\n 0\n ],\n \"cluster\": \"\",\n \"name\": \"OsdApplyLatencyTooHigh\",\n \"note\": \"OSD latency for {{ $labels.osd }} is too high. Please check if it doesn't stuck in weird state\",\n \"prod\": \"metric\",\n \"algorithm\": \"\",\n \"algo_params\": null,\n \"delay\": 0,\n \"severity\": 2,\n \"severities\": [\n 2\n ],\n \"disabled\": 1,\n \"prom_for_duration\": 90,\n \"prom_ql\": \"ceph_osd_perf_apply_latency_seconds \\u003e 10\",\n \"rule_config\": {\n \"algo_params\": null,\n \"inhibit\": false,\n \"prom_ql\": \"\",\n \"queries\": [\n {\n \"prom_ql\": \"ceph_osd_perf_apply_latency_seconds \\u003e 10\",\n \"severity\": 2\n }\n ],\n \"severity\": 0\n },\n \"prom_eval_interval\": 15,\n \"enable_stime\": \"00:00\",\n \"enable_stimes\": [\n \"00:00\"\n ],\n \"enable_etime\": \"23:59\",\n \"enable_etimes\": [\n \"23:59\"\n ],\n \"enable_days_of_week\": [\n \"1\",\n \"2\",\n \"3\",\n \"4\",\n \"5\",\n \"6\",\n \"0\"\n ],\n \"enable_days_of_weeks\": [\n [\n \"1\",\n \"2\",\n \"3\",\n \"4\",\n \"5\",\n \"6\",\n \"0\"\n ]\n ],\n \"enable_in_bg\": 0,\n \"notify_recovered\": 1,\n \"notify_channels\": [],\n \"notify_groups_obj\": null,\n \"notify_groups\": null,\n \"notify_repeat_step\": 60,\n \"notify_max_number\": 0,\n \"recover_duration\": 0,\n \"callbacks\": [],\n \"runbook_url\": \"\",\n \"append_tags\": [],\n \"annotations\": null,\n \"extra_config\": null,\n \"create_at\": 0,\n \"create_by\": \"\",\n \"update_at\": 0,\n \"update_by\": \"\",\n \"uuid\": 1717556327320012000\n },\n {\n \"id\": 0,\n \"group_id\": 0,\n \"cate\": \"prometheus\",\n \"datasource_ids\": [\n 0\n ],\n \"cluster\": \"\",\n \"name\": \"OsdDown\",\n \"note\": \"OSD is down longer than 30 min, please check what's the status\",\n \"prod\": \"metric\",\n \"algorithm\": \"\",\n \"algo_params\": null,\n \"delay\": 0,\n \"severity\": 2,\n \"severities\": [\n 2\n ],\n \"disabled\": 1,\n \"prom_for_duration\": 1800,\n \"prom_ql\": \"ceph_osd_up == 0\",\n \"rule_config\": {\n \"algo_params\": null,\n \"inhibit\": false,\n \"prom_ql\": \"\",\n \"queries\": [\n {\n \"prom_ql\": \"ceph_osd_up == 0\",\n \"severity\": 2\n }\n ],\n \"severity\": 0\n },\n \"prom_eval_interval\": 15,\n \"enable_stime\": \"00:00\",\n \"enable_stimes\": [\n \"00:00\"\n ],\n \"enable_etime\": \"23:59\",\n \"enable_etimes\": [\n \"23:59\"\n ],\n \"enable_days_of_week\": [\n \"1\",\n \"2\",\n \"3\",\n \"4\",\n \"5\",\n \"6\",\n \"0\"\n ],\n \"enable_days_of_weeks\": [\n [\n \"1\",\n \"2\",\n \"3\",\n \"4\",\n \"5\",\n \"6\",\n \"0\"\n ]\n ],\n \"enable_in_bg\": 0,\n \"notify_recovered\": 1,\n \"notify_channels\": [],\n \"notify_groups_obj\": null,\n \"notify_groups\": null,\n \"notify_repeat_step\": 60,\n \"notify_max_number\": 0,\n \"recover_duration\": 0,\n \"callbacks\": [],\n \"runbook_url\": \"\",\n \"append_tags\": [],\n \"annotations\": null,\n \"extra_config\": null,\n \"create_at\": 0,\n \"create_by\": \"\",\n \"update_at\": 0,\n \"update_by\": \"\",\n \"uuid\": 1717556327320476000\n }\n]"
},
{
"path": "integrations/Ceph/dashboards/ceph_by_categraf.json",
"content": "{\n \"id\": 0,\n \"group_id\": 0,\n \"name\": \"Ceph - Cluster By Categraf\",\n \"ident\": \"\",\n \"tags\": \"Categraf\",\n \"create_at\": 0,\n \"create_by\": \"\",\n \"update_at\": 0,\n \"update_by\": \"\",\n \"configs\": {\n \"links\": [],\n \"panels\": [\n {\n \"collapsed\": true,\n \"id\": \"40d15965-877f-4cb9-8e8f-b6d43eaf477b\",\n \"layout\": {\n \"h\": 1,\n \"i\": \"40d15965-877f-4cb9-8e8f-b6d43eaf477b\",\n \"isResizable\": false,\n \"w\": 24,\n \"x\": 0,\n \"y\": 0\n },\n \"name\": \"CLUSTER STATE\",\n \"panels\": [],\n \"type\": \"row\",\n \"version\": \"3.0.0\"\n },\n {\n \"custom\": {\n \"calc\": \"lastNotNull\",\n \"colSpan\": 1,\n \"colorMode\": \"value\",\n \"graphMode\": \"none\",\n \"textMode\": \"value\",\n \"textSize\": {},\n \"valueField\": \"Value\"\n },\n \"datasourceCate\": \"prometheus\",\n \"datasourceValue\": \"${DATASOURCE}\",\n \"id\": \"d30b94a5-5875-4c55-85d3-352d6bc4d419\",\n \"layout\": {\n \"h\": 3,\n \"i\": \"d30b94a5-5875-4c55-85d3-352d6bc4d419\",\n \"isResizable\": true,\n \"w\": 3,\n \"x\": 0,\n \"y\": 1\n },\n \"links\": [],\n \"maxPerRow\": 4,\n \"name\": \"\",\n \"options\": {\n \"standardOptions\": {},\n \"thresholds\": {\n \"steps\": [\n {\n \"color\": \"#634CD9\",\n \"type\": \"base\",\n \"value\": null\n }\n ]\n }\n },\n \"targets\": [\n {\n \"expr\": \"ceph_health_status{cluster=\\\"$cluster\\\"}\",\n \"refId\": \"A\"\n }\n ],\n \"transformations\": [\n {\n \"id\": \"organize\",\n \"options\": {}\n }\n ],\n \"type\": \"stat\",\n \"version\": \"3.0.0\"\n },\n {\n \"custom\": {\n \"calc\": \"lastNotNull\",\n \"colSpan\": 1,\n \"colorMode\": \"value\",\n \"graphMode\": \"none\",\n \"textMode\": \"value\",\n \"textSize\": {},\n \"valueField\": \"Value\"\n },\n \"datasourceCate\": \"prometheus\",\n \"datasourceValue\": \"${DATASOURCE}\",\n \"id\": \"f22cc692-4e4e-44e6-ae1e-f4750e6ced36\",\n \"layout\": {\n \"h\": 3,\n \"i\": \"f22cc692-4e4e-44e6-ae1e-f4750e6ced36\",\n \"isResizable\": true,\n \"w\": 3,\n \"x\": 3,\n \"y\": 1\n },\n \"links\": [],\n \"maxPerRow\": 4,\n \"name\": \"Write Throughput\",\n \"options\": {\n \"standardOptions\": {},\n \"thresholds\": {\n \"steps\": [\n {\n \"color\": \"#634CD9\",\n \"type\": \"base\",\n \"value\": null\n }\n ]\n }\n },\n \"targets\": [\n {\n \"expr\": \"sum(irate(ceph_osd_op_w_in_bytes{cluster=\\\"$cluster\\\"}[5m]))\",\n \"refId\": \"A\"\n }\n ],\n \"transformations\": [\n {\n \"id\": \"organize\",\n \"options\": {}\n }\n ],\n \"type\": \"stat\",\n \"version\": \"3.0.0\"\n },\n {\n \"custom\": {\n \"calc\": \"lastNotNull\",\n \"colSpan\": 1,\n \"colorMode\": \"value\",\n \"graphMode\": \"none\",\n \"textMode\": \"value\",\n \"textSize\": {},\n \"valueField\": \"Value\"\n },\n \"datasourceCate\": \"prometheus\",\n \"datasourceValue\": \"${DATASOURCE}\",\n \"id\": \"aaf30364-54b0-47b1-9e99-351f4f65a780\",\n \"layout\": {\n \"h\": 3,\n \"i\": \"aaf30364-54b0-47b1-9e99-351f4f65a780\",\n \"isResizable\": true,\n \"w\": 3,\n \"x\": 6,\n \"y\": 1\n },\n \"links\": [],\n \"maxPerRow\": 4,\n \"name\": \"Read Throughput\",\n \"options\": {\n \"standardOptions\": {},\n \"thresholds\": {\n \"steps\": [\n {\n \"color\": \"#634CD9\",\n \"type\": \"base\",\n \"value\": null\n }\n ]\n }\n },\n \"targets\": [\n {\n \"expr\": \"sum(irate(ceph_osd_op_r_out_bytes{cluster=\\\"$cluster\\\"}[5m]))\",\n \"refId\": \"A\"\n }\n ],\n \"transformations\": [\n {\n \"id\": \"organize\",\n \"options\": {}\n }\n ],\n \"type\": \"stat\",\n \"version\": \"3.0.0\"\n },\n {\n \"custom\": {\n \"calc\": \"lastNotNull\",\n \"colSpan\": 1,\n \"colorMode\": \"value\",\n \"graphMode\": \"none\",\n \"textMode\": \"value\",\n \"textSize\": {},\n \"valueField\": \"Value\"\n },\n \"datasourceCate\": \"prometheus\",\n \"datasourceValue\": \"${DATASOURCE}\",\n \"id\": \"ce61e127-e379-4fd9-bcd4-37a3bbca1ace\",\n \"layout\": {\n \"h\": 3,\n \"i\": \"ce61e127-e379-4fd9-bcd4-37a3bbca1ace\",\n \"isResizable\": true,\n \"w\": 3,\n \"x\": 9,\n \"y\": 1\n },\n \"links\": [],\n \"maxPerRow\": 4,\n \"name\": \"Cluster Capacity\",\n \"options\": {\n \"standardOptions\": {},\n \"thresholds\": {\n \"steps\": [\n {\n \"color\": \"#634CD9\",\n \"type\": \"base\",\n \"value\": null\n }\n ]\n }\n },\n \"targets\": [\n {\n \"expr\": \"ceph_cluster_total_bytes{cluster=\\\"$cluster\\\"}\",\n \"legend\": \"\",\n \"refId\": \"A\"\n }\n ],\n \"transformations\": [\n {\n \"id\": \"organize\",\n \"options\": {}\n }\n ],\n \"type\": \"stat\",\n \"version\": \"3.0.0\"\n },\n {\n \"custom\": {\n \"calc\": \"lastNotNull\",\n \"colSpan\": 1,\n \"colorMode\": \"value\",\n \"graphMode\": \"none\",\n \"textMode\": \"value\",\n \"textSize\": {},\n \"valueField\": \"Value\"\n },\n \"datasourceCate\": \"prometheus\",\n \"datasourceValue\": \"${DATASOURCE}\",\n \"id\": \"ddf70b0b-f207-489d-95b0-fc3a457993a6\",\n \"layout\": {\n \"h\": 6,\n \"i\": \"ddf70b0b-f207-489d-95b0-fc3a457993a6\",\n \"isResizable\": true,\n \"w\": 3,\n \"x\": 12,\n \"y\": 1\n },\n \"links\": [],\n \"maxPerRow\": 4,\n \"name\": \"Available Capacity\",\n \"options\": {\n \"standardOptions\": {},\n \"thresholds\": {\n \"steps\": [\n {\n \"color\": \"#634CD9\",\n \"type\": \"base\",\n \"value\": null\n }\n ]\n }\n },\n \"targets\": [\n {\n \"expr\": \"(ceph_cluster_total_bytes{cluster=\\\"$cluster\\\"}-ceph_cluster_total_used_bytes{cluster=\\\"$cluster\\\"})/ceph_cluster_total_bytes{cluster=\\\"$cluster\\\"}\",\n \"legend\": \"\",\n \"refId\": \"A\"\n }\n ],\n \"transformations\": [\n {\n \"id\": \"organize\",\n \"options\": {}\n }\n ],\n \"type\": \"stat\",\n \"version\": \"3.0.0\"\n },\n {\n \"custom\": {\n \"calc\": \"lastNotNull\",\n \"colSpan\": 1,\n \"colorMode\": \"value\",\n \"graphMode\": \"none\",\n \"textMode\": \"value\",\n \"textSize\": {},\n \"valueField\": \"Value\"\n },\n \"datasourceCate\": \"prometheus\",\n \"datasourceValue\": \"${DATASOURCE}\",\n \"id\": \"6114e5c7-73a8-4c35-8b49-85ed0fe5ca75\",\n \"layout\": {\n \"h\": 3,\n \"i\": \"6114e5c7-73a8-4c35-8b49-85ed0fe5ca75\",\n \"isResizable\": true,\n \"w\": 3,\n \"x\": 15,\n \"y\": 1\n },\n \"links\": [],\n \"maxPerRow\": 4,\n \"name\": \"Number of Objects\",\n \"options\": {\n \"standardOptions\": {},\n \"thresholds\": {\n \"steps\": [\n {\n \"color\": \"#634CD9\",\n \"type\": \"base\",\n \"value\": null\n }\n ]\n }\n },\n \"targets\": [\n {\n \"expr\": \"ceph_cluster_total_objects{cluster=\\\"$cluster\\\"}\",\n \"refId\": \"A\"\n }\n ],\n \"transformations\": [\n {\n \"id\": \"organize\",\n \"options\": {}\n }\n ],\n \"type\": \"stat\",\n \"version\": \"3.0.0\"\n },\n {\n \"custom\": {\n \"calc\": \"lastNotNull\",\n \"colSpan\": 1,\n \"colorMode\": \"value\",\n \"graphMode\": \"none\",\n \"textMode\": \"value\",\n \"textSize\": {},\n \"valueField\": \"Value\"\n },\n \"datasourceCate\": \"prometheus\",\n \"datasourceValue\": \"${DATASOURCE}\",\n \"id\": \"45150843-0f61-4e6c-9dc2-484c693afd4e\",\n \"layout\": {\n \"h\": 3,\n \"i\": \"45150843-0f61-4e6c-9dc2-484c693afd4e\",\n \"isResizable\": true,\n \"w\": 3,\n \"x\": 18,\n \"y\": 1\n },\n \"links\": [],\n \"maxPerRow\": 4,\n \"name\": \"Bytes Written\",\n \"options\": {\n \"standardOptions\": {},\n \"thresholds\": {\n \"steps\": [\n {\n \"color\": \"#634CD9\",\n \"type\": \"base\",\n \"value\": null\n }\n ]\n }\n },\n \"targets\": [\n {\n \"expr\": \"sum(ceph_osd_op_w_in_bytes{cluster=\\\"$cluster\\\"})\",\n \"refId\": \"A\"\n }\n ],\n \"transformations\": [\n {\n \"id\": \"organize\",\n \"options\": {}\n }\n ],\n \"type\": \"stat\",\n \"version\": \"3.0.0\"\n },\n {\n \"custom\": {\n \"calc\": \"lastNotNull\",\n \"colSpan\": 1,\n \"colorMode\": \"value\",\n \"graphMode\": \"none\",\n \"textMode\": \"value\",\n \"textSize\": {},\n \"valueField\": \"Value\"\n },\n \"datasourceCate\": \"prometheus\",\n \"datasourceValue\": \"${DATASOURCE}\",\n \"id\": \"9eb35dad-3e2f-4020-97b7-2a4567bc4e9c\",\n \"layout\": {\n \"h\": 3,\n \"i\": \"9eb35dad-3e2f-4020-97b7-2a4567bc4e9c\",\n \"isResizable\": true,\n \"w\": 3,\n \"x\": 21,\n \"y\": 1\n },\n \"links\": [],\n \"maxPerRow\": 4,\n \"name\": \"Bytes Read\",\n \"options\": {\n \"standardOptions\": {},\n \"thresholds\": {\n \"steps\": [\n {\n \"color\": \"#634CD9\",\n \"type\": \"base\",\n \"value\": null\n }\n ]\n }\n },\n \"targets\": [\n {\n \"expr\": \"sum(ceph_osd_op_r_out_bytes{cluster=\\\"$cluster\\\"})\",\n \"refId\": \"A\"\n }\n ],\n \"transformations\": [\n {\n \"id\": \"organize\",\n \"options\": {}\n }\n ],\n \"type\": \"stat\",\n \"version\": \"3.0.0\"\n },\n {\n \"custom\": {\n \"calc\": \"lastNotNull\",\n \"colSpan\": 1,\n \"colorMode\": \"value\",\n \"graphMode\": \"none\",\n \"textMode\": \"value\",\n \"textSize\": {},\n \"valueField\": \"Value\"\n },\n \"datasourceCate\": \"prometheus\",\n \"datasourceValue\": \"${DATASOURCE}\",\n \"id\": \"c08d5553-c189-424d-be0c-15fdced7a402\",\n \"layout\": {\n \"h\": 3,\n \"i\": \"c08d5553-c189-424d-be0c-15fdced7a402\",\n \"isResizable\": true,\n \"w\": 3,\n \"x\": 0,\n \"y\": 4\n },\n \"links\": [],\n \"maxPerRow\": 4,\n \"name\": \"Alerts\",\n \"options\": {\n \"standardOptions\": {},\n \"thresholds\": {\n \"steps\": [\n {\n \"color\": \"#634CD9\",\n \"type\": \"base\",\n \"value\": null\n }\n ]\n }\n },\n \"targets\": [\n {\n \"expr\": \"count(ALERTS{cluster='$cluster', alertstate='firing'}) OR vector(0)\",\n \"refId\": \"A\"\n }\n ],\n \"transformations\": [\n {\n \"id\": \"organize\",\n \"options\": {}\n }\n ],\n \"type\": \"stat\",\n \"version\": \"3.0.0\"\n },\n {\n \"custom\": {\n \"calc\": \"lastNotNull\",\n \"colSpan\": 1,\n \"colorMode\": \"value\",\n \"graphMode\": \"none\",\n \"textMode\": \"value\",\n \"textSize\": {},\n \"valueField\": \"Value\"\n },\n \"datasourceCate\": \"prometheus\",\n \"datasourceValue\": \"${DATASOURCE}\",\n \"id\": \"92dc4651-a023-4c7a-b998-88a6ba844d7f\",\n \"layout\": {\n \"h\": 3,\n \"i\": \"92dc4651-a023-4c7a-b998-88a6ba844d7f\",\n \"isResizable\": true,\n \"w\": 3,\n \"x\": 3,\n \"y\": 4\n },\n \"links\": [],\n \"maxPerRow\": 4,\n \"name\": \"Write IOPS\",\n \"options\": {\n \"standardOptions\": {},\n \"thresholds\": {\n \"steps\": [\n {\n \"color\": \"#634CD9\",\n \"type\": \"base\",\n \"value\": null\n }\n ]\n }\n },\n \"targets\": [\n {\n \"expr\": \"sum(irate(ceph_osd_op_w{cluster=\\\"$cluster\\\"}[5m]))\",\n \"refId\": \"A\"\n }\n ],\n \"transformations\": [\n {\n \"id\": \"organize\",\n \"options\": {}\n }\n ],\n \"type\": \"stat\",\n \"version\": \"3.0.0\"\n },\n {\n \"custom\": {\n \"calc\": \"lastNotNull\",\n \"colSpan\": 1,\n \"colorMode\": \"value\",\n \"graphMode\": \"none\",\n \"textMode\": \"value\",\n \"textSize\": {},\n \"valueField\": \"Value\"\n },\n \"datasourceCate\": \"prometheus\",\n \"datasourceValue\": \"${DATASOURCE}\",\n \"id\": \"72056479-6031-4014-8d72-5cf06e50099c\",\n \"layout\": {\n \"h\": 3,\n \"i\": \"72056479-6031-4014-8d72-5cf06e50099c\",\n \"isResizable\": true,\n \"w\": 3,\n \"x\": 6,\n \"y\": 4\n },\n \"links\": [],\n \"maxPerRow\": 4,\n \"name\": \"Read IOPS\",\n \"options\": {\n \"standardOptions\": {},\n \"thresholds\": {\n \"steps\": [\n {\n \"color\": \"#634CD9\",\n \"type\": \"base\",\n \"value\": null\n }\n ]\n }\n },\n \"targets\": [\n {\n \"expr\": \"sum(irate(ceph_osd_op_r{cluster=\\\"$cluster\\\"}[5m]))\",\n \"refId\": \"A\"\n }\n ],\n \"transformations\": [\n {\n \"id\": \"organize\",\n \"options\": {}\n }\n ],\n \"type\": \"stat\",\n \"version\": \"3.0.0\"\n },\n {\n \"custom\": {\n \"calc\": \"lastNotNull\",\n \"colSpan\": 1,\n \"colorMode\": \"value\",\n \"graphMode\": \"none\",\n \"textMode\": \"value\",\n \"textSize\": {},\n \"valueField\": \"Value\"\n },\n \"datasourceCate\": \"prometheus\",\n \"datasourceValue\": \"${DATASOURCE}\",\n \"id\": \"c750f49f-05e1-4a22-8efe-eb0e42b87950\",\n \"layout\": {\n \"h\": 3,\n \"i\": \"c750f49f-05e1-4a22-8efe-eb0e42b87950\",\n \"isResizable\": true,\n \"w\": 3,\n \"x\": 9,\n \"y\": 4\n },\n \"links\": [],\n \"maxPerRow\": 4,\n \"name\": \"Used Capacity\",\n \"options\": {\n \"standardOptions\": {},\n \"thresholds\": {\n \"steps\": [\n {\n \"color\": \"#634CD9\",\n \"type\": \"base\",\n \"value\": null\n }\n ]\n }\n },\n \"targets\": [\n {\n \"expr\": \"ceph_cluster_total_used_bytes{cluster=\\\"$cluster\\\"}\",\n \"legend\": \"\",\n \"refId\": \"A\"\n }\n ],\n \"transformations\": [\n {\n \"id\": \"organize\",\n \"options\": {}\n }\n ],\n \"type\": \"stat\",\n \"version\": \"3.0.0\"\n },\n {\n \"custom\": {\n \"calc\": \"lastNotNull\",\n \"colSpan\": 1,\n \"colorMode\": \"value\",\n \"graphMode\": \"none\",\n \"textMode\": \"value\",\n \"textSize\": {},\n \"valueField\": \"Value\"\n },\n \"datasourceCate\": \"prometheus\",\n \"datasourceValue\": \"${DATASOURCE}\",\n \"id\": \"d20d66ff-ce39-47d6-800c-8ab99941bf6a\",\n \"layout\": {\n \"h\": 3,\n \"i\": \"d20d66ff-ce39-47d6-800c-8ab99941bf6a\",\n \"isResizable\": true,\n \"w\": 3,\n \"x\": 15,\n \"y\": 4\n },\n \"links\": [],\n \"maxPerRow\": 4,\n \"name\": \"Difference\",\n \"options\": {\n \"standardOptions\": {},\n \"thresholds\": {\n \"steps\": [\n {\n \"color\": \"#634CD9\",\n \"type\": \"base\",\n \"value\": null\n }\n ]\n }\n },\n \"targets\": [\n {\n \"expr\": \"ceph_cluster_total_objects{cluster=\\\"$cluster\\\"}\",\n \"refId\": \"A\"\n }\n ],\n \"transformations\": [\n {\n \"id\": \"organize\",\n \"options\": {}\n }\n ],\n \"type\": \"stat\",\n \"version\": \"3.0.0\"\n },\n {\n \"custom\": {\n \"calc\": \"lastNotNull\",\n \"colSpan\": 1,\n \"colorMode\": \"value\",\n \"graphMode\": \"none\",\n \"textMode\": \"value\",\n \"textSize\": {},\n \"valueField\": \"Value\"\n },\n \"datasourceCate\": \"prometheus\",\n \"datasourceValue\": \"${DATASOURCE}\",\n \"id\": \"a36e7fb7-c450-4dcf-9cac-3dd20092cdef\",\n \"layout\": {\n \"h\": 3,\n \"i\": \"a36e7fb7-c450-4dcf-9cac-3dd20092cdef\",\n \"isResizable\": true,\n \"w\": 3,\n \"x\": 18,\n \"y\": 4\n },\n \"links\": [],\n \"maxPerRow\": 4,\n \"name\": \"Mon Session Num\",\n \"options\": {\n \"standardOptions\": {},\n \"thresholds\": {\n \"steps\": [\n {\n \"color\": \"#634CD9\",\n \"type\": \"base\",\n \"value\": null\n }\n ]\n }\n },\n \"targets\": [\n {\n \"expr\": \"sum(ceph_mon_num_sessions{cluster='$cluster'})\",\n \"refId\": \"A\"\n }\n ],\n \"transformations\": [\n {\n \"id\": \"organize\",\n \"options\": {}\n }\n ],\n \"type\": \"stat\",\n \"version\": \"3.0.0\"\n },\n {\n \"custom\": {\n \"calc\": \"lastNotNull\",\n \"colSpan\": 1,\n \"colorMode\": \"value\",\n \"graphMode\": \"none\",\n \"textMode\": \"value\",\n \"textSize\": {},\n \"valueField\": \"Value\"\n },\n \"datasourceCate\": \"prometheus\",\n \"datasourceValue\": \"${DATASOURCE}\",\n \"id\": \"065cb6bd-fca7-46b0-a9d0-7f4866a583fb\",\n \"layout\": {\n \"h\": 3,\n \"i\": \"065cb6bd-fca7-46b0-a9d0-7f4866a583fb\",\n \"isResizable\": true,\n \"w\": 3,\n \"x\": 21,\n \"y\": 4\n },\n \"links\": [],\n \"maxPerRow\": 4,\n \"name\": \"Monitors In Quorum\",\n \"options\": {\n \"standardOptions\": {},\n \"thresholds\": {\n \"steps\": [\n {\n \"color\": \"#634CD9\",\n \"type\": \"base\",\n \"value\": null\n }\n ]\n }\n },\n \"targets\": [\n {\n \"expr\": \"count(ceph_mon_quorum_status{cluster=\\\"$cluster\\\"})\",\n \"legend\": \"\",\n \"refId\": \"A\"\n }\n ],\n \"transformations\": [\n {\n \"id\": \"organize\",\n \"options\": {}\n }\n ],\n \"type\": \"stat\",\n \"version\": \"3.0.0\"\n },\n {\n \"collapsed\": true,\n \"id\": \"4ea9d78b-193e-41a9-8ed5-b52487f6b460\",\n \"layout\": {\n \"h\": 1,\n \"i\": \"4ea9d78b-193e-41a9-8ed5-b52487f6b460\",\n \"isResizable\": false,\n \"w\": 24,\n \"x\": 0,\n \"y\": 7\n },\n \"name\": \"OSD STATE\",\n \"panels\": [],\n \"type\": \"row\",\n \"version\": \"3.0.0\"\n },\n {\n \"custom\": {\n \"calc\": \"lastNotNull\",\n \"colSpan\": 1,\n \"colorMode\": \"value\",\n \"graphMode\": \"none\",\n \"textMode\": \"value\",\n \"textSize\": {},\n \"valueField\": \"Value\"\n },\n \"datasourceCate\": \"prometheus\",\n \"datasourceValue\": \"${DATASOURCE}\",\n \"id\": \"2e9efb16-1239-4f9a-b105-1cbcdc2e9a25\",\n \"layout\": {\n \"h\": 3,\n \"i\": \"2e9efb16-1239-4f9a-b105-1cbcdc2e9a25\",\n \"isResizable\": true,\n \"w\": 2,\n \"x\": 0,\n \"y\": 8\n },\n \"links\": [],\n \"maxPerRow\": 4,\n \"name\": \"OSDs OUT\",\n \"options\": {\n \"standardOptions\": {},\n \"thresholds\": {\n \"steps\": [\n {\n \"color\": \"#634CD9\",\n \"type\": \"base\",\n \"value\": null\n }\n ]\n }\n },\n \"targets\": [\n {\n \"expr\": \"count(ceph_osd_up{cluster=\\\"$cluster\\\"}) - count(ceph_osd_in{cluster=\\\"$cluster\\\"})\",\n \"legend\": \"\",\n \"refId\": \"A\"\n }\n ],\n \"transformations\": [\n {\n \"id\": \"organize\",\n \"options\": {}\n }\n ],\n \"type\": \"stat\",\n \"version\": \"3.0.0\"\n },\n {\n \"custom\": {\n \"calc\": \"lastNotNull\",\n \"colSpan\": 1,\n \"colorMode\": \"value\",\n \"graphMode\": \"none\",\n \"textMode\": \"value\",\n \"textSize\": {},\n \"valueField\": \"Value\"\n },\n \"datasourceCate\": \"prometheus\",\n \"datasourceValue\": \"${DATASOURCE}\",\n \"id\": \"323101fb-f562-4c6d-89d7-39899549ba5b\",\n \"layout\": {\n \"h\": 3,\n \"i\": \"323101fb-f562-4c6d-89d7-39899549ba5b\",\n \"isResizable\": true,\n \"w\": 2,\n \"x\": 2,\n \"y\": 8\n },\n \"links\": [],\n \"maxPerRow\": 4,\n \"name\": \"OSDs DOWN\",\n \"options\": {\n \"standardOptions\": {},\n \"thresholds\": {\n \"steps\": [\n {\n \"color\": \"#634CD9\",\n \"type\": \"base\",\n \"value\": null\n }\n ]\n }\n },\n \"targets\": [\n {\n \"expr\": \"count(ceph_osd_up{cluster=\\\"$cluster\\\"} == 0.0) OR vector(0)\",\n \"legend\": \"\",\n \"refId\": \"A\"\n }\n ],\n \"transformations\": [\n {\n \"id\": \"organize\",\n \"options\": {}\n }\n ],\n \"type\": \"stat\",\n \"version\": \"3.0.0\"\n },\n {\n \"custom\": {\n \"calc\": \"lastNotNull\",\n \"colSpan\": 1,\n \"colorMode\": \"value\",\n \"graphMode\": \"none\",\n \"textMode\": \"value\",\n \"textSize\": {},\n \"valueField\": \"Value\"\n },\n \"datasourceCate\": \"prometheus\",\n \"datasourceValue\": \"${DATASOURCE}\",\n \"id\": \"5add038b-eb04-40dd-9bcc-8e620e72549b\",\n \"layout\": {\n \"h\": 3,\n \"i\": \"5add038b-eb04-40dd-9bcc-8e620e72549b\",\n \"isResizable\": true,\n \"w\": 2,\n \"x\": 4,\n \"y\": 8\n },\n \"links\": [],\n \"maxPerRow\": 4,\n \"name\": \"OSDs UP\",\n \"options\": {\n \"standardOptions\": {},\n \"thresholds\": {\n \"steps\": [\n {\n \"color\": \"#634CD9\",\n \"type\": \"base\",\n \"value\": null\n }\n ]\n }\n },\n \"targets\": [\n {\n \"expr\": \"sum(ceph_osd_up{cluster=\\\"$cluster\\\"})\",\n \"legend\": \"\",\n \"refId\": \"A\"\n }\n ],\n \"transformations\": [\n {\n \"id\": \"organize\",\n \"options\": {}\n }\n ],\n \"type\": \"stat\",\n \"version\": \"3.0.0\"\n },\n {\n \"custom\": {\n \"calc\": \"lastNotNull\",\n \"colSpan\": 1,\n \"colorMode\": \"value\",\n \"graphMode\": \"none\",\n \"textMode\": \"value\",\n \"textSize\": {},\n \"valueField\": \"Value\"\n },\n \"datasourceCate\": \"prometheus\",\n \"datasourceValue\": \"${DATASOURCE}\",\n \"id\": \"5295e4fa-4027-408d-acef-ee1e6b662c3b\",\n \"layout\": {\n \"h\": 3,\n \"i\": \"5295e4fa-4027-408d-acef-ee1e6b662c3b\",\n \"isResizable\": true,\n \"w\": 2,\n \"x\": 6,\n \"y\": 8\n },\n \"links\": [],\n \"maxPerRow\": 4,\n \"name\": \"OSDs IN\",\n \"options\": {\n \"standardOptions\": {},\n \"thresholds\": {\n \"steps\": [\n {\n \"color\": \"#634CD9\",\n \"type\": \"base\",\n \"value\": null\n }\n ]\n }\n },\n \"targets\": [\n {\n \"expr\": \"sum(ceph_osd_in{cluster=\\\"$cluster\\\"})\",\n \"legend\": \"\",\n \"refId\": \"A\"\n }\n ],\n \"transformations\": [\n {\n \"id\": \"organize\",\n \"options\": {}\n }\n ],\n \"type\": \"stat\",\n \"version\": \"3.0.0\"\n },\n {\n \"custom\": {\n \"calc\": \"lastNotNull\",\n \"colSpan\": 1,\n \"colorMode\": \"value\",\n \"graphMode\": \"none\",\n \"textMode\": \"value\",\n \"textSize\": {},\n \"valueField\": \"Value\"\n },\n \"datasourceCate\": \"prometheus\",\n \"datasourceValue\": \"${DATASOURCE}\",\n \"id\": \"6ef3f924-1ada-4d7e-9a34-2b00bf607e0e\",\n \"layout\": {\n \"h\": 3,\n \"i\": \"6ef3f924-1ada-4d7e-9a34-2b00bf607e0e\",\n \"isResizable\": true,\n \"w\": 2,\n \"x\": 8,\n \"y\": 8\n },\n \"links\": [],\n \"maxPerRow\": 4,\n \"name\": \"Avg PGs\",\n \"options\": {\n \"standardOptions\": {},\n \"thresholds\": {\n \"steps\": [\n {\n \"color\": \"#634CD9\",\n \"type\": \"base\",\n \"value\": null\n }\n ]\n }\n },\n \"targets\": [\n {\n \"expr\": \"avg(ceph_osd_numpg{cluster=\\\"$cluster\\\"})\",\n \"legend\": \"\",\n \"refId\": \"A\"\n }\n ],\n \"transformations\": [\n {\n \"id\": \"organize\",\n \"options\": {}\n }\n ],\n \"type\": \"stat\",\n \"version\": \"3.0.0\"\n },\n {\n \"custom\": {\n \"calc\": \"lastNotNull\",\n \"colSpan\": 1,\n \"colorMode\": \"value\",\n \"graphMode\": \"none\",\n \"textMode\": \"value\",\n \"textSize\": {},\n \"valueField\": \"Value\"\n },\n \"datasourceCate\": \"prometheus\",\n \"datasourceValue\": \"${DATASOURCE}\",\n \"id\": \"b6109c27-3022-45bc-8d69-46db095335b4\",\n \"layout\": {\n \"h\": 3,\n \"i\": \"b6109c27-3022-45bc-8d69-46db095335b4\",\n \"isResizable\": true,\n \"w\": 3,\n \"x\": 10,\n \"y\": 8\n },\n \"links\": [],\n \"maxPerRow\": 4,\n \"name\": \"Avg Apply Latency\",\n \"options\": {\n \"standardOptions\": {},\n \"thresholds\": {\n \"steps\": [\n {\n \"color\": \"#634CD9\",\n \"type\": \"base\",\n \"value\": null\n }\n ]\n }\n },\n \"targets\": [\n {\n \"expr\": \"avg(ceph_osd_apply_latency_ms{cluster=\\\"$cluster\\\"})\",\n \"legend\": \"\",\n \"refId\": \"A\"\n }\n ],\n \"transformations\": [\n {\n \"id\": \"organize\",\n \"options\": {}\n }\n ],\n \"type\": \"stat\",\n \"version\": \"3.0.0\"\n },\n {\n \"custom\": {\n \"calc\": \"lastNotNull\",\n \"colSpan\": 1,\n \"colorMode\": \"value\",\n \"graphMode\": \"none\",\n \"textMode\": \"value\",\n \"textSize\": {},\n \"valueField\": \"Value\"\n },\n \"datasourceCate\": \"prometheus\",\n \"datasourceValue\": \"${DATASOURCE}\",\n \"id\": \"ba070ba7-8fb3-44af-9bcf-5f34eeb96919\",\n \"layout\": {\n \"h\": 3,\n \"i\": \"ba070ba7-8fb3-44af-9bcf-5f34eeb96919\",\n \"isResizable\": true,\n \"w\": 3,\n \"x\": 13,\n \"y\": 8\n },\n \"links\": [],\n \"maxPerRow\": 4,\n \"name\": \"Avg Commit Latency\",\n \"options\": {\n \"standardOptions\": {},\n \"thresholds\": {\n \"steps\": [\n {\n \"color\": \"#634CD9\",\n \"type\": \"base\",\n \"value\": null\n }\n ]\n }\n },\n \"targets\": [\n {\n \"expr\": \"avg(ceph_osd_commit_latency_ms{cluster=\\\"$cluster\\\"})\",\n \"legend\": \"\",\n \"refId\": \"A\"\n }\n ],\n \"transformations\": [\n {\n \"id\": \"organize\",\n \"options\": {}\n }\n ],\n \"type\": \"stat\",\n \"version\": \"3.0.0\"\n },\n {\n \"custom\": {\n \"calc\": \"lastNotNull\",\n \"colSpan\": 1,\n \"colorMode\": \"value\",\n \"graphMode\": \"none\",\n \"textMode\": \"value\",\n \"textSize\": {},\n \"valueField\": \"Value\"\n },\n \"datasourceCate\": \"prometheus\",\n \"datasourceValue\": \"${DATASOURCE}\",\n \"id\": \"fe6884f3-8cb6-4688-a189-3d733090f041\",\n \"layout\": {\n \"h\": 3,\n \"i\": \"fe6884f3-8cb6-4688-a189-3d733090f041\",\n \"isResizable\": true,\n \"w\": 4,\n \"x\": 16,\n \"y\": 8\n },\n \"links\": [],\n \"maxPerRow\": 4,\n \"name\": \"Avg Op Write Latency\",\n \"options\": {\n \"standardOptions\": {},\n \"thresholds\": {\n \"steps\": [\n {\n \"color\": \"#634CD9\",\n \"type\": \"base\",\n \"value\": null\n }\n ]\n }\n },\n \"targets\": [\n {\n \"expr\": \"avg(rate(ceph_osd_op_w_latency_sum{cluster=\\\"$cluster\\\"}[5m]) / rate(ceph_osd_op_w_latency_count{cluster=\\\"$cluster\\\"}[5m]) \\u003e= 0)\",\n \"refId\": \"A\"\n }\n ],\n \"transformations\": [\n {\n \"id\": \"organize\",\n \"options\": {}\n }\n ],\n \"type\": \"stat\",\n \"version\": \"3.0.0\"\n },\n {\n \"custom\": {\n \"calc\": \"lastNotNull\",\n \"colSpan\": 1,\n \"colorMode\": \"value\",\n \"graphMode\": \"none\",\n \"textMode\": \"value\",\n \"textSize\": {},\n \"valueField\": \"Value\"\n },\n \"datasourceCate\": \"prometheus\",\n \"datasourceValue\": \"${DATASOURCE}\",\n \"id\": \"7d2d0613-206b-487b-8c58-56f36ba4f145\",\n \"layout\": {\n \"h\": 3,\n \"i\": \"7d2d0613-206b-487b-8c58-56f36ba4f145\",\n \"isResizable\": true,\n \"w\": 4,\n \"x\": 20,\n \"y\": 8\n },\n \"links\": [],\n \"maxPerRow\": 4,\n \"name\": \"Avg Op Read Latency\",\n \"options\": {\n \"standardOptions\": {},\n \"thresholds\": {\n \"steps\": [\n {\n \"color\": \"#634CD9\",\n \"type\": \"base\",\n \"value\": null\n }\n ]\n }\n },\n \"targets\": [\n {\n \"expr\": \"avg(rate(ceph_osd_op_r_latency_sum{cluster=\\\"$cluster\\\"}[5m])/rate(ceph_osd_op_r_latency_count{cluster=\\\"$cluster\\\"}[5m]) \\u003e= 0)\",\n \"refId\": \"A\"\n }\n ],\n \"transformations\": [\n {\n \"id\": \"organize\",\n \"options\": {}\n }\n ],\n \"type\": \"stat\",\n \"version\": \"3.0.0\"\n },\n {\n \"collapsed\": true,\n \"id\": \"8b5713db-43e7-470e-8758-108e51543bcc\",\n \"layout\": {\n \"h\": 1,\n \"i\": \"8b5713db-43e7-470e-8758-108e51543bcc\",\n \"isResizable\": false,\n \"w\": 24,\n \"x\": 0,\n \"y\": 11\n },\n \"name\": \"CLUSTER\",\n \"panels\": [],\n \"type\": \"row\",\n \"version\": \"3.0.0\"\n },\n {\n \"custom\": {\n \"drawStyle\": \"lines\",\n \"fillOpacity\": 0.3,\n \"gradientMode\": \"opacity\",\n \"lineInterpolation\": \"linear\",\n \"lineWidth\": 2,\n \"scaleDistribution\": {\n \"type\": \"linear\"\n },\n \"spanNulls\": false,\n \"stack\": \"off\"\n },\n \"datasourceCate\": \"prometheus\",\n \"datasourceValue\": \"${DATASOURCE}\",\n \"id\": \"d756bbce-10d0-4301-994d-4e381be883ee\",\n \"layout\": {\n \"h\": 8,\n \"i\": \"d756bbce-10d0-4301-994d-4e381be883ee\",\n \"isResizable\": true,\n \"w\": 8,\n \"x\": 0,\n \"y\": 12\n },\n \"links\": [],\n \"maxPerRow\": 4,\n \"name\": \"Capacity\",\n \"options\": {\n \"legend\": {\n \"displayMode\": \"hidden\"\n },\n \"standardOptions\": {},\n \"thresholds\": {\n \"steps\": [\n {\n \"color\": \"#634CD9\",\n \"type\": \"base\",\n \"value\": null\n }\n ]\n },\n \"tooltip\": {\n \"mode\": \"all\",\n \"sort\": \"none\"\n }\n },\n \"targets\": [\n {\n \"expr\": \"ceph_cluster_total_bytes{cluster=\\\"$cluster\\\"}\",\n \"legend\": \"Total Capacity\",\n \"refId\": \"C\"\n },\n {\n \"expr\": \"ceph_cluster_total_bytes{cluster=\\\"$cluster\\\"}-ceph_cluster_total_used_bytes{cluster=\\\"$cluster\\\"}\",\n \"legend\": \"Available\",\n \"refId\": \"A\"\n },\n {\n \"expr\": \"ceph_cluster_total_used_bytes{cluster=\\\"$cluster\\\"}\",\n \"legend\": \"Used\",\n \"refId\": \"B\"\n }\n ],\n \"transformations\": [\n {\n \"id\": \"organize\",\n \"options\": {}\n }\n ],\n \"type\": \"timeseries\",\n \"version\": \"3.0.0\"\n },\n {\n \"custom\": {\n \"drawStyle\": \"lines\",\n \"fillOpacity\": 0.3,\n \"gradientMode\": \"opacity\",\n \"lineInterpolation\": \"linear\",\n \"lineWidth\": 2,\n \"scaleDistribution\": {\n \"type\": \"linear\"\n },\n \"spanNulls\": false,\n \"stack\": \"off\"\n },\n \"datasourceCate\": \"prometheus\",\n \"datasourceValue\": \"${DATASOURCE}\",\n \"id\": \"496e43b1-cb84-42cf-b0db-d4c5fb651d45\",\n \"layout\": {\n \"h\": 8,\n \"i\": \"496e43b1-cb84-42cf-b0db-d4c5fb651d45\",\n \"isResizable\": true,\n \"w\": 8,\n \"x\": 8,\n \"y\": 12\n },\n \"links\": [],\n \"maxPerRow\": 4,\n \"name\": \"IOPS\",\n \"options\": {\n \"legend\": {\n \"displayMode\": \"hidden\"\n },\n \"standardOptions\": {},\n \"thresholds\": {\n \"steps\": [\n {\n \"color\": \"#634CD9\",\n \"type\": \"base\",\n \"value\": null\n }\n ]\n },\n \"tooltip\": {\n \"mode\": \"all\",\n \"sort\": \"none\"\n }\n },\n \"targets\": [\n {\n \"expr\": \"sum(irate(ceph_osd_op_w{cluster=\\\"$cluster\\\"}[5m]))\",\n \"legend\": \"Write\",\n \"refId\": \"A\"\n },\n {\n \"expr\": \"sum(irate(ceph_osd_op_r{cluster=\\\"$cluster\\\"}[5m]))\",\n \"legend\": \"Read\",\n \"refId\": \"B\"\n }\n ],\n \"transformations\": [\n {\n \"id\": \"organize\",\n \"options\": {}\n }\n ],\n \"type\": \"timeseries\",\n \"version\": \"3.0.0\"\n },\n {\n \"custom\": {\n \"drawStyle\": \"lines\",\n \"fillOpacity\": 0.3,\n \"gradientMode\": \"opacity\",\n \"lineInterpolation\": \"linear\",\n \"lineWidth\": 2,\n \"scaleDistribution\": {\n \"type\": \"linear\"\n },\n \"spanNulls\": false,\n \"stack\": \"off\"\n },\n \"datasourceCate\": \"prometheus\",\n \"datasourceValue\": \"${DATASOURCE}\",\n \"id\": \"22fc4713-e9f9-4b47-aa65-d7c2067452c1\",\n \"layout\": {\n \"h\": 8,\n \"i\": \"22fc4713-e9f9-4b47-aa65-d7c2067452c1\",\n \"isResizable\": true,\n \"w\": 8,\n \"x\": 16,\n \"y\": 12\n },\n \"links\": [],\n \"maxPerRow\": 4,\n \"name\": \"Throughput\",\n \"options\": {\n \"legend\": {\n \"displayMode\": \"hidden\"\n },\n \"standardOptions\": {},\n \"thresholds\": {\n \"steps\": [\n {\n \"color\": \"#634CD9\",\n \"type\": \"base\",\n \"value\": null\n }\n ]\n },\n \"tooltip\": {\n \"mode\": \"all\",\n \"sort\": \"none\"\n }\n },\n \"targets\": [\n {\n \"expr\": \"sum(irate(ceph_osd_op_w_in_bytes{cluster=\\\"$cluster\\\"}[5m]))\",\n \"legend\": \"Write\",\n \"refId\": \"A\"\n },\n {\n \"expr\": \"sum(irate(ceph_osd_op_r_out_bytes{cluster=\\\"$cluster\\\"}[5m]))\",\n \"legend\": \"Read\",\n \"refId\": \"B\"\n }\n ],\n \"transformations\": [\n {\n \"id\": \"organize\",\n \"options\": {}\n }\n ],\n \"type\": \"timeseries\",\n \"version\": \"3.0.0\"\n },\n {\n \"custom\": {\n \"drawStyle\": \"lines\",\n \"fillOpacity\": 0.3,\n \"gradientMode\": \"opacity\",\n \"lineInterpolation\": \"linear\",\n \"lineWidth\": 2,\n \"scaleDistribution\": {\n \"type\": \"linear\"\n },\n \"spanNulls\": false,\n \"stack\": \"off\"\n },\n \"datasourceCate\": \"prometheus\",\n \"datasourceValue\": \"${DATASOURCE}\",\n \"id\": \"a5c43a7c-b6cf-4bc5-acef-c7ef845c4620\",\n \"layout\": {\n \"h\": 8,\n \"i\": \"a5c43a7c-b6cf-4bc5-acef-c7ef845c4620\",\n \"isResizable\": true,\n \"w\": 8,\n \"x\": 0,\n \"y\": 20\n },\n \"links\": [],\n \"maxPerRow\": 4,\n \"name\": \"Pool Used Bytes\",\n \"options\": {\n \"legend\": {\n \"displayMode\": \"hidden\"\n },\n \"standardOptions\": {},\n \"thresholds\": {\n \"steps\": [\n {\n \"color\": \"#634CD9\",\n \"type\": \"base\",\n \"value\": null\n }\n ]\n },\n \"tooltip\": {\n \"mode\": \"all\",\n \"sort\": \"none\"\n }\n },\n \"targets\": [\n {\n \"expr\": \"(ceph_pool_bytes_used{cluster='$cluster'}) *on (pool_id) group_left(name)(ceph_pool_metadata{cluster='$cluster'})\",\n \"legend\": \"{{name}}\",\n \"refId\": \"A\"\n }\n ],\n \"transformations\": [\n {\n \"id\": \"organize\",\n \"options\": {}\n }\n ],\n \"type\": \"timeseries\",\n \"version\": \"3.0.0\"\n },\n {\n \"custom\": {\n \"drawStyle\": \"lines\",\n \"fillOpacity\": 0.3,\n \"gradientMode\": \"opacity\",\n \"lineInterpolation\": \"linear\",\n \"lineWidth\": 2,\n \"stack\": \"off\",\n \"version\": \"3.0.0\"\n },\n \"id\": \"729139a3-0097-45a5-86ee-63608734baef\",\n \"layout\": {\n \"h\": 8,\n \"i\": \"729139a3-0097-45a5-86ee-63608734baef\",\n \"isResizable\": true,\n \"w\": 8,\n \"x\": 8,\n \"y\": 20\n },\n \"links\": [],\n \"maxPerRow\": 4,\n \"name\": \"Pool RAW Used Bytes\",\n \"options\": {\n \"legend\": {\n \"displayMode\": \"hidden\"\n },\n \"thresholds\": {\n \"steps\": [\n {\n \"color\": \"#634CD9\",\n \"type\": \"base\",\n \"value\": null\n }\n ]\n },\n \"tooltip\": {\n \"mode\": \"all\",\n \"sort\": \"none\"\n }\n },\n \"targets\": [\n {\n \"expr\": \"(ceph_pool_raw_bytes_used{cluster='$cluster'}) *on (pool_id) group_left(name)(ceph_pool_metadata{cluster='$cluster'})\",\n \"legend\": \"{{name}}\",\n \"refId\": \"A\"\n }\n ],\n \"type\": \"timeseries\",\n \"version\": \"3.0.0\"\n },\n {\n \"custom\": {\n \"drawStyle\": \"lines\",\n \"fillOpacity\": 0.3,\n \"gradientMode\": \"opacity\",\n \"lineInterpolation\": \"linear\",\n \"lineWidth\": 2,\n \"scaleDistribution\": {\n \"type\": \"linear\"\n },\n \"spanNulls\": false,\n \"stack\": \"off\"\n },\n \"datasourceCate\": \"prometheus\",\n \"datasourceValue\": \"${DATASOURCE}\",\n \"id\": \"c97c4581-6163-4b3c-bd18-b710244f607b\",\n \"layout\": {\n \"h\": 8,\n \"i\": \"c97c4581-6163-4b3c-bd18-b710244f607b\",\n \"isResizable\": true,\n \"w\": 8,\n \"x\": 16,\n \"y\": 20\n },\n \"links\": [],\n \"maxPerRow\": 4,\n \"name\": \"Objects Per Pool\",\n \"options\": {\n \"legend\": {\n \"displayMode\": \"hidden\"\n },\n \"standardOptions\": {},\n \"thresholds\": {\n \"steps\": [\n {\n \"color\": \"#634CD9\",\n \"type\": \"base\",\n \"value\": null\n }\n ]\n },\n \"tooltip\": {\n \"mode\": \"all\",\n \"sort\": \"none\"\n }\n },\n \"targets\": [\n {\n \"expr\": \"(ceph_pool_objects{cluster='$cluster'}) *on (pool_id) group_left(name)(ceph_pool_metadata{cluster='$cluster'})\",\n \"legend\": \"{{name}}\",\n \"refId\": \"A\"\n }\n ],\n \"transformations\": [\n {\n \"id\": \"organize\",\n \"options\": {}\n }\n ],\n \"type\": \"timeseries\",\n \"version\": \"3.0.0\"\n },\n {\n \"custom\": {\n \"drawStyle\": \"lines\",\n \"fillOpacity\": 0.3,\n \"gradientMode\": \"opacity\",\n \"lineInterpolation\": \"linear\",\n \"lineWidth\": 2,\n \"stack\": \"off\",\n \"version\": \"3.0.0\"\n },\n \"id\": \"e04d410c-280a-4f4a-90c0-f19779d30753\",\n \"layout\": {\n \"h\": 7,\n \"i\": \"e04d410c-280a-4f4a-90c0-f19779d30753\",\n \"isResizable\": true,\n \"w\": 8,\n \"x\": 0,\n \"y\": 28\n },\n \"links\": [],\n \"maxPerRow\": 4,\n \"name\": \"Pool Quota Bytes\",\n \"options\": {\n \"legend\": {\n \"displayMode\": \"hidden\"\n },\n \"thresholds\": {\n \"steps\": [\n {\n \"color\": \"#634CD9\",\n \"type\": \"base\",\n \"value\": null\n }\n ]\n },\n \"tooltip\": {\n \"mode\": \"all\",\n \"sort\": \"none\"\n }\n },\n \"targets\": [\n {\n \"expr\": \"(ceph_pool_quota_bytes{cluster='$cluster'}) *on (pool_id) group_left(name)(ceph_pool_metadata{cluster='$cluster'})\",\n \"legend\": \"{{name}}\",\n \"refId\": \"A\"\n }\n ],\n \"type\": \"timeseries\",\n \"version\": \"3.0.0\"\n },\n {\n \"custom\": {\n \"drawStyle\": \"lines\",\n \"fillOpacity\": 0.3,\n \"gradientMode\": \"opacity\",\n \"lineInterpolation\": \"linear\",\n \"lineWidth\": 2,\n \"stack\": \"off\",\n \"version\": \"3.0.0\"\n },\n \"id\": \"94f01b89-eeef-4b73-922f-e24539683f85\",\n \"layout\": {\n \"h\": 7,\n \"i\": \"94f01b89-eeef-4b73-922f-e24539683f85\",\n \"isResizable\": true,\n \"w\": 8,\n \"x\": 8,\n \"y\": 28\n },\n \"links\": [],\n \"maxPerRow\": 4,\n \"name\": \"Pool Objects Quota\",\n \"options\": {\n \"legend\": {\n \"displayMode\": \"hidden\"\n },\n \"thresholds\": {\n \"steps\": [\n {\n \"color\": \"#634CD9\",\n \"type\": \"base\",\n \"value\": null\n }\n ]\n },\n \"tooltip\": {\n \"mode\": \"all\",\n \"sort\": \"none\"\n }\n },\n \"targets\": [\n {\n \"expr\": \"(ceph_pool_quota_objects{cluster='$cluster'}) *on (pool_id) group_left(name)(ceph_pool_metadata{cluster='$cluster'})\",\n \"legend\": \"{{name}}\",\n \"refId\": \"A\"\n }\n ],\n \"type\": \"timeseries\",\n \"version\": \"3.0.0\"\n },\n {\n \"custom\": {\n \"drawStyle\": \"lines\",\n \"fillOpacity\": 0.3,\n \"gradientMode\": \"opacity\",\n \"lineInterpolation\": \"linear\",\n \"lineWidth\": 2,\n \"stack\": \"off\",\n \"version\": \"3.0.0\"\n },\n \"id\": \"6fce7e94-658a-43f0-b71d-6d4884b0729f\",\n \"layout\": {\n \"h\": 7,\n \"i\": \"6fce7e94-658a-43f0-b71d-6d4884b0729f\",\n \"isResizable\": true,\n \"w\": 8,\n \"x\": 16,\n \"y\": 28\n },\n \"links\": [],\n \"maxPerRow\": 4,\n \"name\": \"OSD Type Count\",\n \"options\": {\n \"legend\": {\n \"displayMode\": \"hidden\"\n },\n \"thresholds\": {\n \"steps\": [\n {\n \"color\": \"#634CD9\",\n \"type\": \"base\",\n \"value\": null\n }\n ]\n },\n \"tooltip\": {\n \"mode\": \"all\",\n \"sort\": \"none\"\n }\n },\n \"targets\": [\n {\n \"expr\": \"count(ceph_bluestore_commit_lat_count{cluster='$cluster'})\",\n \"legend\": \"BlueStore\",\n \"refId\": \"A\"\n },\n {\n \"expr\": \"count(ceph_filestore_journal_latency_count{cluster='$cluster'})\",\n \"legend\": \"FileStore\",\n \"refId\": \"B\"\n }\n ],\n \"type\": \"timeseries\",\n \"version\": \"3.0.0\"\n },\n {\n \"collapsed\": true,\n \"id\": \"8d15424c-09e2-4277-b03c-9f387794c246\",\n \"layout\": {\n \"h\": 1,\n \"i\": \"8d15424c-09e2-4277-b03c-9f387794c246\",\n \"isResizable\": false,\n \"w\": 24,\n \"x\": 0,\n \"y\": 35\n },\n \"name\": \"Alerts\",\n \"panels\": [],\n \"type\": \"row\",\n \"version\": \"3.0.0\"\n },\n {\n \"datasourceCate\": \"prometheus\",\n \"datasourceValue\": \"${DATASOURCE}\",\n \"id\": \"39fe8468-9d6a-4ea0-86cb-82629123b5b2\",\n \"layout\": {\n \"h\": 6,\n \"i\": \"39fe8468-9d6a-4ea0-86cb-82629123b5b2\",\n \"isResizable\": true,\n \"w\": 8,\n \"x\": 0,\n \"y\": 36\n },\n \"links\": [],\n \"maxPerRow\": 4,\n \"name\": \"Alerts from CephThanos\",\n \"targets\": [\n {\n \"expr\": \"ALERTS{cluster='$cluster', alertstate='firing'}\",\n \"legend\": \"\",\n \"refId\": \"A\"\n }\n ],\n \"transformations\": [\n {\n \"id\": \"organize\",\n \"options\": {}\n }\n ],\n \"type\": \"unknown\",\n \"version\": \"3.0.0\"\n },\n {\n \"custom\": {\n \"calc\": \"lastNotNull\",\n \"colorMode\": \"value\",\n \"displayMode\": \"seriesToRows\",\n \"showHeader\": true\n },\n \"datasourceCate\": \"prometheus\",\n \"datasourceValue\": \"${DATASOURCE}\",\n \"id\": \"00669ac0-4fac-4771-ba40-390bc2bd3131\",\n \"layout\": {\n \"h\": 6,\n \"i\": \"00669ac0-4fac-4771-ba40-390bc2bd3131\",\n \"isResizable\": true,\n \"w\": 8,\n \"x\": 8,\n \"y\": 36\n },\n \"links\": [],\n \"maxPerRow\": 4,\n \"name\": \"Top Sluggish OSD's\",\n \"options\": {\n \"standardOptions\": {}\n },\n \"overrides\": [\n {}\n ],\n \"targets\": [\n {\n \"expr\": \"topk(5,sort_desc(ceph_osd_apply_latency_ms{cluster='$cluster'} + ceph_osd_commit_latency_ms{cluster='$cluster'}))\",\n \"refId\": \"A\"\n }\n ],\n \"transformations\": [\n {\n \"id\": \"organize\",\n \"options\": {}\n }\n ],\n \"type\": \"table\",\n \"version\": \"3.0.0\"\n },\n {\n \"datasourceCate\": \"prometheus\",\n \"datasourceValue\": \"${DATASOURCE}\",\n \"id\": \"021f7151-84f5-465c-85be-2f4d80d3087a\",\n \"layout\": {\n \"h\": 6,\n \"i\": \"021f7151-84f5-465c-85be-2f4d80d3087a\",\n \"isResizable\": true,\n \"w\": 8,\n \"x\": 16,\n \"y\": 36\n },\n \"links\": [],\n \"maxPerRow\": 4,\n \"name\": \"Down OSD's\",\n \"targets\": [\n {\n \"expr\": \"ceph_osd_up{cluster=\\\"$cluster\\\"} == 0\",\n \"legend\": \"\",\n \"refId\": \"A\"\n }\n ],\n \"transformations\": [\n {\n \"id\": \"organize\",\n \"options\": {}\n }\n ],\n \"type\": \"unknown\",\n \"version\": \"3.0.0\"\n },\n {\n \"collapsed\": false,\n \"id\": \"4276718f-312d-469a-a079-36696fef7926\",\n \"layout\": {\n \"h\": 1,\n \"i\": \"4276718f-312d-469a-a079-36696fef7926\",\n \"isResizable\": false,\n \"w\": 24,\n \"x\": 0,\n \"y\": 42\n },\n \"name\": \"Ceph Versions\",\n \"panels\": [],\n \"type\": \"row\",\n \"version\": \"3.0.0\"\n },\n {\n \"custom\": {\n \"drawStyle\": \"lines\",\n \"fillOpacity\": 0.3,\n \"gradientMode\": \"opacity\",\n \"lineInterpolation\": \"linear\",\n \"lineWidth\": 2,\n \"scaleDistribution\": {\n \"type\": \"linear\"\n },\n \"spanNulls\": false,\n \"stack\": \"off\"\n },\n \"datasourceCate\": \"prometheus\",\n \"datasourceValue\": \"${DATASOURCE}\",\n \"id\": \"b5196610-3a49-4c6a-99fb-49173346db75\",\n \"layout\": {\n \"h\": 9,\n \"i\": \"b5196610-3a49-4c6a-99fb-49173346db75\",\n \"isResizable\": true,\n \"w\": 6,\n \"x\": 0,\n \"y\": 43\n },\n \"links\": [],\n \"maxPerRow\": 4,\n \"name\": \"Ceph OSD Versions\",\n \"options\": {\n \"legend\": {\n \"displayMode\": \"hidden\"\n },\n \"standardOptions\": {},\n \"thresholds\": {\n \"steps\": [\n {\n \"color\": \"#634CD9\",\n \"type\": \"base\",\n \"value\": null\n }\n ]\n },\n \"tooltip\": {\n \"mode\": \"all\",\n \"sort\": \"none\"\n }\n },\n \"targets\": [\n {\n \"expr\": \"count by (ceph_version)(ceph_osd_metadata{cluster='$cluster'})\",\n \"refId\": \"A\"\n }\n ],\n \"transformations\": [\n {\n \"id\": \"organize\",\n \"options\": {}\n }\n ],\n \"type\": \"timeseries\",\n \"version\": \"3.0.0\"\n },\n {\n \"custom\": {\n \"drawStyle\": \"lines\",\n \"fillOpacity\": 0.3,\n \"gradientMode\": \"opacity\",\n \"lineInterpolation\": \"linear\",\n \"lineWidth\": 2,\n \"scaleDistribution\": {\n \"type\": \"linear\"\n },\n \"spanNulls\": false,\n \"stack\": \"off\"\n },\n \"datasourceCate\": \"prometheus\",\n \"datasourceValue\": \"${DATASOURCE}\",\n \"id\": \"3ceb91fe-65a0-408b-96ca-1bdd3b003890\",\n \"layout\": {\n \"h\": 9,\n \"i\": \"3ceb91fe-65a0-408b-96ca-1bdd3b003890\",\n \"isResizable\": true,\n \"w\": 6,\n \"x\": 6,\n \"y\": 43\n },\n \"links\": [],\n \"maxPerRow\": 4,\n \"name\": \"Ceph Mon Versions\",\n \"options\": {\n \"legend\": {\n \"displayMode\": \"hidden\"\n },\n \"standardOptions\": {},\n \"thresholds\": {\n \"steps\": [\n {\n \"color\": \"#634CD9\",\n \"type\": \"base\",\n \"value\": null\n }\n ]\n },\n \"tooltip\": {\n \"mode\": \"all\",\n \"sort\": \"none\"\n }\n },\n \"targets\": [\n {\n \"expr\": \"count by (ceph_version)(ceph_mon_metadata{cluster='$cluster'})\",\n \"refId\": \"A\"\n }\n ],\n \"transformations\": [\n {\n \"id\": \"organize\",\n \"options\": {}\n }\n ],\n \"type\": \"timeseries\",\n \"version\": \"3.0.0\"\n },\n {\n \"custom\": {\n \"drawStyle\": \"lines\",\n \"fillOpacity\": 0.3,\n \"gradientMode\": \"opacity\",\n \"lineInterpolation\": \"linear\",\n \"lineWidth\": 2,\n \"scaleDistribution\": {\n \"type\": \"linear\"\n },\n \"spanNulls\": false,\n \"stack\": \"off\"\n },\n \"datasourceCate\": \"prometheus\",\n \"datasourceValue\": \"${DATASOURCE}\",\n \"id\": \"72476720-2416-49d3-af67-8ed7da951d4f\",\n \"layout\": {\n \"h\": 9,\n \"i\": \"72476720-2416-49d3-af67-8ed7da951d4f\",\n \"isResizable\": true,\n \"w\": 6,\n \"x\": 12,\n \"y\": 43\n },\n \"links\": [],\n \"maxPerRow\": 4,\n \"name\": \"Ceph MDS Versions\",\n \"options\": {\n \"legend\": {\n \"displayMode\": \"hidden\"\n },\n \"standardOptions\": {},\n \"thresholds\": {\n \"steps\": [\n {\n \"color\": \"#634CD9\",\n \"type\": \"base\",\n \"value\": null\n }\n ]\n },\n \"tooltip\": {\n \"mode\": \"all\",\n \"sort\": \"none\"\n }\n },\n \"targets\": [\n {\n \"expr\": \"count by (ceph_version)(ceph_mds_metadata{cluster='$cluster'})\",\n \"refId\": \"A\"\n }\n ],\n \"transformations\": [\n {\n \"id\": \"organize\",\n \"options\": {}\n }\n ],\n \"type\": \"timeseries\",\n \"version\": \"3.0.0\"\n },\n {\n \"custom\": {\n \"drawStyle\": \"lines\",\n \"fillOpacity\": 0.3,\n \"gradientMode\": \"opacity\",\n \"lineInterpolation\": \"linear\",\n \"lineWidth\": 2,\n \"scaleDistribution\": {\n \"type\": \"linear\"\n },\n \"spanNulls\": false,\n \"stack\": \"off\"\n },\n \"datasourceCate\": \"prometheus\",\n \"datasourceValue\": \"${DATASOURCE}\",\n \"id\": \"9fe26b14-d9ce-41b6-af0b-f0e353789959\",\n \"layout\": {\n \"h\": 9,\n \"i\": \"9fe26b14-d9ce-41b6-af0b-f0e353789959\",\n \"isResizable\": true,\n \"w\": 6,\n \"x\": 18,\n \"y\": 43\n },\n \"links\": [],\n \"maxPerRow\": 4,\n \"name\": \"Ceph RGW Versions\",\n \"options\": {\n \"legend\": {\n \"displayMode\": \"hidden\"\n },\n \"standardOptions\": {},\n \"thresholds\": {\n \"steps\": [\n {\n \"color\": \"#634CD9\",\n \"type\": \"base\",\n \"value\": null\n }\n ]\n },\n \"tooltip\": {\n \"mode\": \"all\",\n \"sort\": \"none\"\n }\n },\n \"targets\": [\n {\n \"expr\": \"count by (ceph_version)(ceph_rgw_metadata{cluster='$cluster'})\",\n \"refId\": \"A\"\n }\n ],\n \"transformations\": [\n {\n \"id\": \"organize\",\n \"options\": {}\n }\n ],\n \"type\": \"timeseries\",\n \"version\": \"3.0.0\"\n },\n {\n \"collapsed\": true,\n \"id\": \"55fde6b5-f588-4a82-b6df-7faeb819a6ed\",\n \"layout\": {\n \"h\": 1,\n \"i\": \"55fde6b5-f588-4a82-b6df-7faeb819a6ed\",\n \"isResizable\": false,\n \"w\": 24,\n \"x\": 0,\n \"y\": 52\n },\n \"name\": \"OBJECTS\",\n \"panels\": [],\n \"type\": \"row\",\n \"version\": \"3.0.0\"\n },\n {\n \"custom\": {\n \"drawStyle\": \"lines\",\n \"fillOpacity\": 0.3,\n \"gradientMode\": \"opacity\",\n \"lineInterpolation\": \"linear\",\n \"lineWidth\": 2,\n \"stack\": \"off\",\n \"version\": \"3.0.0\"\n },\n \"id\": \"cfd5482c-be7c-4072-8404-3f1c34095825\",\n \"layout\": {\n \"h\": 12,\n \"i\": \"cfd5482c-be7c-4072-8404-3f1c34095825\",\n \"isResizable\": true,\n \"w\": 6,\n \"x\": 0,\n \"y\": 53\n },\n \"links\": [],\n \"maxPerRow\": 4,\n \"name\": \"Objects in the Cluster\",\n \"options\": {\n \"legend\": {\n \"displayMode\": \"hidden\"\n },\n \"thresholds\": {\n \"steps\": [\n {\n \"color\": \"#634CD9\",\n \"type\": \"base\",\n \"value\": null\n }\n ]\n },\n \"tooltip\": {\n \"mode\": \"all\",\n \"sort\": \"none\"\n }\n },\n \"targets\": [\n {\n \"expr\": \"ceph_cluster_total_objects{cluster=\\\"$cluster\\\"}\",\n \"legend\": \"Total\",\n \"refId\": \"A\"\n }\n ],\n \"type\": \"timeseries\",\n \"version\": \"3.0.0\"\n },\n {\n \"custom\": {\n \"drawStyle\": \"lines\",\n \"fillOpacity\": 0.3,\n \"gradientMode\": \"opacity\",\n \"lineInterpolation\": \"linear\",\n \"lineWidth\": 2,\n \"scaleDistribution\": {\n \"type\": \"linear\"\n },\n \"spanNulls\": false,\n \"stack\": \"off\"\n },\n \"datasourceCate\": \"prometheus\",\n \"datasourceValue\": \"${DATASOURCE}\",\n \"id\": \"7b173926-a111-48c6-b31c-e153ce874b92\",\n \"layout\": {\n \"h\": 12,\n \"i\": \"7b173926-a111-48c6-b31c-e153ce874b92\",\n \"isResizable\": true,\n \"w\": 8,\n \"x\": 6,\n \"y\": 53\n },\n \"links\": [],\n \"maxPerRow\": 4,\n \"name\": \"PGs State\",\n \"options\": {\n \"legend\": {\n \"displayMode\": \"hidden\"\n },\n \"standardOptions\": {},\n \"thresholds\": {\n \"steps\": [\n {\n \"color\": \"#634CD9\",\n \"type\": \"base\",\n \"value\": null\n }\n ]\n },\n \"tooltip\": {\n \"mode\": \"all\",\n \"sort\": \"none\"\n }\n },\n \"targets\": [\n {\n \"expr\": \"ceph_pg_active{cluster=\\\"$cluster\\\"}\",\n \"legend\": \"Active\",\n \"refId\": \"M\"\n },\n {\n \"expr\": \"ceph_pg_clean{cluster=\\\"$cluster\\\"}\",\n \"legend\": \"Clean\",\n \"refId\": \"U\"\n },\n {\n \"expr\": \"ceph_pg_peering{cluster=\\\"$cluster\\\"}\",\n \"legend\": \"Peering\",\n \"refId\": \"I\"\n },\n {\n \"expr\": \"ceph_pg_degraded{cluster=\\\"$cluster\\\"}\",\n \"legend\": \"Degraded\",\n \"refId\": \"B\"\n },\n {\n \"expr\": \"ceph_pg_stale{cluster=\\\"$cluster\\\"}\",\n \"legend\": \"Stale\",\n \"refId\": \"C\"\n },\n {\n \"expr\": \"ceph_unclean_pgs{cluster=\\\"$cluster\\\"}\",\n \"legend\": \"Unclean\",\n \"refId\": \"D\"\n },\n {\n \"expr\": \"ceph_pg_undersized{cluster=\\\"$cluster\\\"}\",\n \"legend\": \"Undersized\",\n \"refId\": \"E\"\n },\n {\n \"expr\": \"ceph_pg_incomplete{cluster=\\\"$cluster\\\"}\",\n \"legend\": \"Incomplete\",\n \"refId\": \"G\"\n },\n {\n \"expr\": \"ceph_pg_forced_backfill{cluster=\\\"$cluster\\\"}\",\n \"legend\": \"Forced Backfill\",\n \"refId\": \"H\"\n },\n {\n \"expr\": \"ceph_pg_inconsistent{cluster=\\\"$cluster\\\"}\",\n \"legend\": \"Inconsistent\",\n \"refId\": \"F\"\n },\n {\n \"expr\": \"ceph_pg_forced_recovery{cluster=\\\"$cluster\\\"}\",\n \"legend\": \"Forced Recovery\",\n \"refId\": \"J\"\n },\n {\n \"expr\": \"ceph_pg_creating{cluster=\\\"$cluster\\\"}\",\n \"legend\": \"Creating\",\n \"refId\": \"K\"\n },\n {\n \"expr\": \"ceph_pg_wait_backfill{cluster=\\\"$cluster\\\"}\",\n \"legend\": \"Wait Backfill\",\n \"refId\": \"L\"\n },\n {\n \"expr\": \"ceph_pg_deep{cluster=\\\"$cluster\\\"}\",\n \"legend\": \"Deep\",\n \"refId\": \"N\"\n },\n {\n \"expr\": \"ceph_pg_scrubbing{cluster=\\\"$cluster\\\"}\",\n \"legend\": \"Scrubbing\",\n \"refId\": \"O\"\n },\n {\n \"expr\": \"ceph_pg_recovering{cluster=\\\"$cluster\\\"}\",\n \"legend\": \"Recovering\",\n \"refId\": \"P\"\n },\n {\n \"expr\": \"ceph_pg_repair{cluster=\\\"$cluster\\\"}\",\n \"legend\": \"Repair\",\n \"refId\": \"Q\"\n },\n {\n \"expr\": \"ceph_pg_down{cluster=\\\"$cluster\\\"}\",\n \"legend\": \"Down\",\n \"refId\": \"R\"\n },\n {\n \"expr\": \"ceph_pg_peered{cluster=\\\"$cluster\\\"}\",\n \"legend\": \"Peered\",\n \"refId\": \"S\"\n },\n {\n \"expr\": \"ceph_pg_backfill{cluster=\\\"$cluster\\\"}\",\n \"legend\": \"Backfill\",\n \"refId\": \"T\"\n },\n {\n \"expr\": \"ceph_pg_remapped{cluster=\\\"$cluster\\\"}\",\n \"legend\": \"Remapped\",\n \"refId\": \"V\"\n },\n {\n \"expr\": \"ceph_pg_backfill_toofull{cluster=\\\"$cluster\\\"}\",\n \"legend\": \"Backfill Toofull\",\n \"refId\": \"W\"\n }\n ],\n \"transformations\": [\n {\n \"id\": \"organize\",\n \"options\": {}\n }\n ],\n \"type\": \"timeseries\",\n \"version\": \"3.0.0\"\n },\n {\n \"custom\": {\n \"drawStyle\": \"lines\",\n \"fillOpacity\": 0.3,\n \"gradientMode\": \"opacity\",\n \"lineInterpolation\": \"linear\",\n \"lineWidth\": 2,\n \"scaleDistribution\": {\n \"type\": \"linear\"\n },\n \"spanNulls\": false,\n \"stack\": \"off\"\n },\n \"datasourceCate\": \"prometheus\",\n \"datasourceValue\": \"${DATASOURCE}\",\n \"id\": \"3fb23975-8958-45ec-a963-610fd376ec7a\",\n \"layout\": {\n \"h\": 6,\n \"i\": \"3fb23975-8958-45ec-a963-610fd376ec7a\",\n \"isResizable\": true,\n \"w\": 10,\n \"x\": 14,\n \"y\": 53\n },\n \"links\": [],\n \"maxPerRow\": 4,\n \"name\": \"Stuck PGs\",\n \"options\": {\n \"legend\": {\n \"displayMode\": \"hidden\"\n },\n \"standardOptions\": {},\n \"thresholds\": {\n \"steps\": [\n {\n \"color\": \"#634CD9\",\n \"type\": \"base\",\n \"value\": null\n }\n ]\n },\n \"tooltip\": {\n \"mode\": \"all\",\n \"sort\": \"none\"\n }\n },\n \"targets\": [\n {\n \"expr\": \"ceph_pg_degraded{cluster=\\\"$cluster\\\"}\",\n \"legend\": \"Degraded\",\n \"refId\": \"F\"\n },\n {\n \"expr\": \"ceph_pg_stale{cluster=\\\"$cluster\\\"}\",\n \"legend\": \"Stale\",\n \"refId\": \"A\"\n },\n {\n \"expr\": \"ceph_pg_undersized{cluster=\\\"$cluster\\\"}\",\n \"legend\": \"Undersized\",\n \"refId\": \"B\"\n }\n ],\n \"transformations\": [\n {\n \"id\": \"organize\",\n \"options\": {}\n }\n ],\n \"type\": \"timeseries\",\n \"version\": \"3.0.0\"\n },\n {\n \"custom\": {\n \"drawStyle\": \"lines\",\n \"fillOpacity\": 0.3,\n \"gradientMode\": \"opacity\",\n \"lineInterpolation\": \"linear\",\n \"lineWidth\": 2,\n \"scaleDistribution\": {\n \"type\": \"linear\"\n },\n \"spanNulls\": false,\n \"stack\": \"off\"\n },\n \"datasourceCate\": \"prometheus\",\n \"datasourceValue\": \"${DATASOURCE}\",\n \"id\": \"2fb7f0a1-4f10-4435-bff7-a5cdbb68ad79\",\n \"layout\": {\n \"h\": 6,\n \"i\": \"2fb7f0a1-4f10-4435-bff7-a5cdbb68ad79\",\n \"isResizable\": true,\n \"w\": 10,\n \"x\": 14,\n \"y\": 59\n },\n \"links\": [],\n \"maxPerRow\": 4,\n \"name\": \"Recovery Operations\",\n \"options\": {\n \"legend\": {\n \"displayMode\": \"hidden\"\n },\n \"standardOptions\": {},\n \"thresholds\": {\n \"steps\": [\n {\n \"color\": \"#634CD9\",\n \"type\": \"base\",\n \"value\": null\n }\n ]\n },\n \"tooltip\": {\n \"mode\": \"all\",\n \"sort\": \"none\"\n }\n },\n \"targets\": [\n {\n \"expr\": \"sum(irate(ceph_osd_recovery_ops{cluster=\\\"$cluster\\\"}[$interval]))\",\n \"legend\": \"OPS\",\n \"refId\": \"A\"\n }\n ],\n \"transformations\": [\n {\n \"id\": \"organize\",\n \"options\": {}\n }\n ],\n \"type\": \"timeseries\",\n \"version\": \"3.0.0\"\n },\n {\n \"collapsed\": true,\n \"id\": \"4ae16220-033e-4b18-ab00-190388f95783\",\n \"layout\": {\n \"h\": 1,\n \"i\": \"4ae16220-033e-4b18-ab00-190388f95783\",\n \"isResizable\": false,\n \"w\": 24,\n \"x\": 0,\n \"y\": 65\n },\n \"name\": \"LATENCY\",\n \"panels\": [],\n \"type\": \"row\",\n \"version\": \"3.0.0\"\n },\n {\n \"custom\": {\n \"calc\": \"lastNotNull\",\n \"colorMode\": \"value\",\n \"displayMode\": \"seriesToRows\",\n \"showHeader\": true\n },\n \"datasourceCate\": \"prometheus\",\n \"datasourceValue\": \"${DATASOURCE}\",\n \"id\": \"de0f7837-69c6-4a10-a362-814893d10a3f\",\n \"layout\": {\n \"h\": 8,\n \"i\": \"de0f7837-69c6-4a10-a362-814893d10a3f\",\n \"isResizable\": true,\n \"w\": 12,\n \"x\": 0,\n \"y\": 66\n },\n \"links\": [],\n \"maxPerRow\": 4,\n \"name\": \"OSD Apply Latency Distribution\",\n \"options\": {\n \"standardOptions\": {}\n },\n \"overrides\": [\n {}\n ],\n \"targets\": [\n {\n \"expr\": \"ceph_osd_apply_latency_ms{cluster='$cluster'}\",\n \"refId\": \"A\"\n }\n ],\n \"transformations\": [\n {\n \"id\": \"organize\",\n \"options\": {}\n }\n ],\n \"type\": \"table\",\n \"version\": \"3.0.0\"\n },\n {\n \"custom\": {\n \"calc\": \"lastNotNull\",\n \"colorMode\": \"value\",\n \"displayMode\": \"seriesToRows\",\n \"showHeader\": true\n },\n \"datasourceCate\": \"prometheus\",\n \"datasourceValue\": \"${DATASOURCE}\",\n \"id\": \"43fb926a-064f-4107-be33-b0b16af9924f\",\n \"layout\": {\n \"h\": 8,\n \"i\": \"43fb926a-064f-4107-be33-b0b16af9924f\",\n \"isResizable\": true,\n \"w\": 12,\n \"x\": 12,\n \"y\": 66\n },\n \"links\": [],\n \"maxPerRow\": 4,\n \"name\": \"OSD Commit Latency Distribution\",\n \"options\": {\n \"standardOptions\": {}\n },\n \"overrides\": [\n {}\n ],\n \"targets\": [\n {\n \"expr\": \"ceph_osd_commit_latency_ms{cluster='$cluster'}\",\n \"refId\": \"A\"\n }\n ],\n \"transformations\": [\n {\n \"id\": \"organize\",\n \"options\": {}\n }\n ],\n \"type\": \"table\",\n \"version\": \"3.0.0\"\n },\n {\n \"datasourceCate\": \"prometheus\",\n \"datasourceValue\": \"${DATASOURCE}\",\n \"id\": \"b65f0eef-cd72-4a22-9143-3937626a3762\",\n \"layout\": {\n \"h\": 8,\n \"i\": \"b65f0eef-cd72-4a22-9143-3937626a3762\",\n \"isResizable\": true,\n \"w\": 12,\n \"x\": 0,\n \"y\": 74\n },\n \"links\": [],\n \"maxPerRow\": 4,\n \"name\": \"OSD Read Op Latency Distribution\",\n \"targets\": [\n {\n \"expr\": \"rate(ceph_osd_op_r_latency_sum{cluster=\\\"$cluster\\\"}[5m]) / rate(ceph_osd_op_r_latency_count{cluster=\\\"$cluster\\\"}[5m]) \\u003e= 0\",\n \"refId\": \"A\"\n }\n ],\n \"transformations\": [\n {\n \"id\": \"organize\",\n \"options\": {}\n }\n ],\n \"type\": \"unknown\",\n \"version\": \"3.0.0\"\n },\n {\n \"datasourceCate\": \"prometheus\",\n \"datasourceValue\": \"${DATASOURCE}\",\n \"id\": \"7ebe8e1e-7b43-4371-b6d2-b934d8f189b6\",\n \"layout\": {\n \"h\": 8,\n \"i\": \"7ebe8e1e-7b43-4371-b6d2-b934d8f189b6\",\n \"isResizable\": true,\n \"w\": 12,\n \"x\": 12,\n \"y\": 74\n },\n \"links\": [],\n \"maxPerRow\": 4,\n \"name\": \"OSD Write Op Latency Distribution\",\n \"targets\": [\n {\n \"expr\": \"rate(ceph_osd_op_w_latency_sum{cluster=\\\"$cluster\\\"}[5m]) / rate(ceph_osd_op_w_latency_count{cluster=\\\"$cluster\\\"}[5m]) \\u003e= 0\",\n \"refId\": \"A\"\n }\n ],\n \"transformations\": [\n {\n \"id\": \"organize\",\n \"options\": {}\n }\n ],\n \"type\": \"unknown\",\n \"version\": \"3.0.0\"\n },\n {\n \"custom\": {\n \"drawStyle\": \"lines\",\n \"fillOpacity\": 0.3,\n \"gradientMode\": \"opacity\",\n \"lineInterpolation\": \"linear\",\n \"lineWidth\": 2,\n \"scaleDistribution\": {\n \"type\": \"linear\"\n },\n \"spanNulls\": false,\n \"stack\": \"off\"\n },\n \"datasourceCate\": \"prometheus\",\n \"datasourceValue\": \"${DATASOURCE}\",\n \"id\": \"83ce1df6-4421-4692-be4c-85cf3b24bfa9\",\n \"layout\": {\n \"h\": 7,\n \"i\": \"83ce1df6-4421-4692-be4c-85cf3b24bfa9\",\n \"isResizable\": true,\n \"w\": 12,\n \"x\": 0,\n \"y\": 82\n },\n \"links\": [],\n \"maxPerRow\": 4,\n \"name\": \"Avg OSD Op Latency\",\n \"options\": {\n \"legend\": {\n \"displayMode\": \"hidden\"\n },\n \"standardOptions\": {},\n \"thresholds\": {\n \"steps\": [\n {\n \"color\": \"#634CD9\",\n \"type\": \"base\",\n \"value\": null\n }\n ]\n },\n \"tooltip\": {\n \"mode\": \"all\",\n \"sort\": \"none\"\n }\n },\n \"targets\": [\n {\n \"expr\": \"avg(rate(ceph_osd_op_r_latency_sum{cluster=\\\"$cluster\\\"}[5m]) / rate(ceph_osd_op_r_latency_count{cluster=\\\"$cluster\\\"}[5m]) \\u003e= 0)\",\n \"legend\": \"read\",\n \"refId\": \"A\"\n },\n {\n \"expr\": \"avg(rate(ceph_osd_op_w_latency_sum{cluster=\\\"$cluster\\\"}[5m]) / rate(ceph_osd_op_w_latency_count{cluster=\\\"$cluster\\\"}[5m]) \\u003e= 0)\",\n \"legend\": \"write\",\n \"refId\": \"B\"\n }\n ],\n \"transformations\": [\n {\n \"id\": \"organize\",\n \"options\": {}\n }\n ],\n \"type\": \"timeseries\",\n \"version\": \"3.0.0\"\n },\n {\n \"custom\": {\n \"drawStyle\": \"lines\",\n \"fillOpacity\": 0.3,\n \"gradientMode\": \"opacity\",\n \"lineInterpolation\": \"linear\",\n \"lineWidth\": 2,\n \"scaleDistribution\": {\n \"type\": \"linear\"\n },\n \"spanNulls\": false,\n \"stack\": \"off\"\n },\n \"datasourceCate\": \"prometheus\",\n \"datasourceValue\": \"${DATASOURCE}\",\n \"id\": \"4e31065f-fc5e-4e3c-ac34-a7ec9141ece8\",\n \"layout\": {\n \"h\": 7,\n \"i\": \"4e31065f-fc5e-4e3c-ac34-a7ec9141ece8\",\n \"isResizable\": true,\n \"w\": 12,\n \"x\": 12,\n \"y\": 82\n },\n \"links\": [],\n \"maxPerRow\": 4,\n \"name\": \"AVG OSD Apply + Commit Latency\",\n \"options\": {\n \"legend\": {\n \"displayMode\": \"hidden\"\n },\n \"standardOptions\": {},\n \"thresholds\": {\n \"steps\": [\n {\n \"color\": \"#634CD9\",\n \"type\": \"base\",\n \"value\": null\n }\n ]\n },\n \"tooltip\": {\n \"mode\": \"all\",\n \"sort\": \"none\"\n }\n },\n \"targets\": [\n {\n \"expr\": \"avg(ceph_osd_apply_latency_ms{cluster=\\\"$cluster\\\"})\",\n \"legend\": \"apply\",\n \"refId\": \"A\"\n },\n {\n \"expr\": \"avg(ceph_osd_commit_latency_ms{cluster=\\\"$cluster\\\"})\",\n \"legend\": \"commit\",\n \"refId\": \"B\"\n }\n ],\n \"transformations\": [\n {\n \"id\": \"organize\",\n \"options\": {}\n }\n ],\n \"type\": \"timeseries\",\n \"version\": \"3.0.0\"\n }\n ],\n \"var\": [\n {\n \"definition\": \"prometheus\",\n \"name\": \"DATASOURCE\",\n \"type\": \"datasource\"\n },\n {\n \"datasource\": {\n \"cate\": \"prometheus\",\n \"value\": \"${DATASOURCE}\"\n },\n \"definition\": \"label_values(ceph_health_status,cluster)\",\n \"multi\": false,\n \"name\": \"cluster\",\n \"reg\": \"\",\n \"type\": \"query\"\n }\n ],\n \"version\": \"3.0.0\"\n },\n \"public\": 0,\n \"public_cate\": 0,\n \"bgids\": null,\n \"built_in\": 0,\n \"hide\": 0,\n \"uuid\": 1717556327323021000\n}"
},
{
"path": "integrations/Ceph/markdown/README.md",
"content": "# ceph plugin\n\n开启 ceph prometheus 支持\n\n```bash\nceph mgr module enable prometheus\n```\n\n## 采集配置\n\n既然 ceph 可以暴露 prometheus 协议的 metrics 数据,则直接使用 prometheus 插件抓取即可。\n\ncategraf 配置文件:`conf/input.prometheus/prometheus.toml`\n\n```yaml\n[[instances]]\nurls = [\n \"http://192.168.11.181:9283/metrics\"\n]\nlabels = {service=\"ceph\",cluster=\"ceph-cluster-001\"}\n```\n\n\n## 仪表盘效果\n\n夜莺内置仪表盘中已经内置了 ceph 的仪表盘,导入即可使用。\n\n\n\n## 告警规则\n\n夜莺内置告警规则中已经内置了 ceph 的告警规则,导入即可使用。\n\n"
},
{
"path": "integrations/ClickHouse/alerts/clickhouse_by_categraf.json",
"content": "[\n {\n \"id\": 0,\n \"group_id\": 0,\n \"cate\": \"prometheus\",\n \"datasource_ids\": [\n 0\n ],\n \"cluster\": \"\",\n \"name\": \"ClickHouse Categraf ZooKeeper故障\",\n \"note\": \"\",\n \"prod\": \"metric\",\n \"algorithm\": \"\",\n \"algo_params\": null,\n \"delay\": 0,\n \"severity\": 0,\n \"severities\": [\n 2\n ],\n \"disabled\": 1,\n \"prom_for_duration\": 60,\n \"prom_ql\": \"\",\n \"rule_config\": {\n \"queries\": [\n {\n \"keys\": {\n \"labelKey\": \"\",\n \"valueKey\": \"\"\n },\n \"prom_ql\": \"avg(clickhouse_metrics_zoo_keeper_session ) != 1\",\n \"severity\": 2\n }\n ]\n },\n \"prom_eval_interval\": 30,\n \"enable_stime\": \"00:00\",\n \"enable_stimes\": [\n \"00:00\"\n ],\n \"enable_etime\": \"00:00\",\n \"enable_etimes\": [\n \"00:00\"\n ],\n \"enable_days_of_week\": [\n \"0\",\n \"1\",\n \"2\",\n \"3\",\n \"4\",\n \"5\",\n \"6\"\n ],\n \"enable_days_of_weeks\": [\n [\n \"0\",\n \"1\",\n \"2\",\n \"3\",\n \"4\",\n \"5\",\n \"6\"\n ]\n ],\n \"enable_in_bg\": 0,\n \"notify_recovered\": 1,\n \"notify_channels\": [],\n \"notify_groups_obj\": null,\n \"notify_groups\": null,\n \"notify_repeat_step\": 60,\n \"notify_max_number\": 0,\n \"recover_duration\": 0,\n \"callbacks\": [],\n \"runbook_url\": \"\",\n \"append_tags\": [],\n \"annotations\": {},\n \"extra_config\": null,\n \"create_at\": 0,\n \"create_by\": \"\",\n \"update_at\": 0,\n \"update_by\": \"\",\n \"uuid\": 1719305153856411000\n },\n {\n \"id\": 0,\n \"group_id\": 0,\n \"cate\": \"prometheus\",\n \"datasource_ids\": [\n 0\n ],\n \"cluster\": \"\",\n \"name\": \"ClickHouse Categraf 内存使用\",\n \"note\": \"内存使用报警\",\n \"prod\": \"metric\",\n \"algorithm\": \"\",\n \"algo_params\": null,\n \"delay\": 0,\n \"severity\": 0,\n \"severities\": [\n 1,\n 2\n ],\n \"disabled\": 1,\n \"prom_for_duration\": 60,\n \"prom_ql\": \"\",\n \"rule_config\": {\n \"queries\": [\n {\n \"keys\": {\n \"labelKey\": \"\",\n \"valueKey\": \"\"\n },\n \"prom_ql\": \"clickhouse_metrics_memory_tracking / clickhouse_asynchronous_metrics_os_memory_total * 100 \\u003e 90\",\n \"severity\": 1\n },\n {\n \"keys\": {\n \"labelKey\": \"\",\n \"valueKey\": \"\"\n },\n \"prom_ql\": \"clickhouse_metrics_memory_tracking/ clickhouse_asynchronous_metrics_os_memory_total * 100 \\u003e 80\",\n \"severity\": 2\n }\n ]\n },\n \"prom_eval_interval\": 30,\n \"enable_stime\": \"00:00\",\n \"enable_stimes\": [\n \"00:00\"\n ],\n \"enable_etime\": \"00:00\",\n \"enable_etimes\": [\n \"00:00\"\n ],\n \"enable_days_of_week\": [\n \"0\",\n \"1\",\n \"2\",\n \"3\",\n \"4\",\n \"5\",\n \"6\"\n ],\n \"enable_days_of_weeks\": [\n [\n \"0\",\n \"1\",\n \"2\",\n \"3\",\n \"4\",\n \"5\",\n \"6\"\n ]\n ],\n \"enable_in_bg\": 0,\n \"notify_recovered\": 1,\n \"notify_channels\": [],\n \"notify_groups_obj\": null,\n \"notify_groups\": null,\n \"notify_repeat_step\": 60,\n \"notify_max_number\": 0,\n \"recover_duration\": 0,\n \"callbacks\": [],\n \"runbook_url\": \"\",\n \"append_tags\": [],\n \"annotations\": {},\n \"extra_config\": null,\n \"create_at\": 0,\n \"create_by\": \"\",\n \"update_at\": 0,\n \"update_by\": \"\",\n \"uuid\": 1719305153858877000\n },\n {\n \"id\": 0,\n \"group_id\": 0,\n \"cate\": \"prometheus\",\n \"datasource_ids\": [\n 0\n ],\n \"cluster\": \"\",\n \"name\": \"ClickHouse Categraf 磁盘使用\",\n \"note\": \"磁盘使用报警\",\n \"prod\": \"metric\",\n \"algorithm\": \"\",\n \"algo_params\": null,\n \"delay\": 0,\n \"severity\": 0,\n \"severities\": [\n 1,\n 2\n ],\n \"disabled\": 1,\n \"prom_for_duration\": 60,\n \"prom_ql\": \"\",\n \"rule_config\": {\n \"queries\": [\n {\n \"keys\": {\n \"labelKey\": \"\",\n \"valueKey\": \"\"\n },\n \"prom_ql\": \"clickhouse_asynchronous_metrics_disk_available_default / (clickhouse_asynchronous_metrics_disk_available_default + clickhouse_asynchronous_metrics_disk_used_default) * 100 \\u003c 10\",\n \"severity\": 1\n },\n {\n \"keys\": {\n \"labelKey\": \"\",\n \"valueKey\": \"\"\n },\n \"prom_ql\": \"clickhouse_asynchronous_metrics_disk_available_default / (clickhouse_asynchronous_metrics_disk_available_default + clickhouse_asynchronous_metrics_disk_used_default) * 100 \\u003c 20\",\n \"severity\": 2\n }\n ]\n },\n \"prom_eval_interval\": 30,\n \"enable_stime\": \"00:00\",\n \"enable_stimes\": [\n \"00:00\"\n ],\n \"enable_etime\": \"00:00\",\n \"enable_etimes\": [\n \"00:00\"\n ],\n \"enable_days_of_week\": [\n \"0\",\n \"1\",\n \"2\",\n \"3\",\n \"4\",\n \"5\",\n \"6\"\n ],\n \"enable_days_of_weeks\": [\n [\n \"0\",\n \"1\",\n \"2\",\n \"3\",\n \"4\",\n \"5\",\n \"6\"\n ]\n ],\n \"enable_in_bg\": 0,\n \"notify_recovered\": 1,\n \"notify_channels\": [],\n \"notify_groups_obj\": null,\n \"notify_groups\": null,\n \"notify_repeat_step\": 60,\n \"notify_max_number\": 0,\n \"recover_duration\": 0,\n \"callbacks\": [],\n \"runbook_url\": \"\",\n \"append_tags\": [],\n \"annotations\": {},\n \"extra_config\": null,\n \"create_at\": 0,\n \"create_by\": \"\",\n \"update_at\": 0,\n \"update_by\": \"\",\n \"uuid\": 1719305153860224000\n },\n {\n \"id\": 0,\n \"group_id\": 0,\n \"cate\": \"prometheus\",\n \"datasource_ids\": [\n 0\n ],\n \"cluster\": \"\",\n \"name\": \"ClickHouse Categraf 网络故障\",\n \"note\": \"\",\n \"prod\": \"metric\",\n \"algorithm\": \"\",\n \"algo_params\": null,\n \"delay\": 0,\n \"severity\": 0,\n \"severities\": [\n 3,\n 2\n ],\n \"disabled\": 1,\n \"prom_for_duration\": 60,\n \"prom_ql\": \"\",\n \"rule_config\": {\n \"queries\": [\n {\n \"keys\": {\n \"labelKey\": \"\",\n \"valueKey\": \"\"\n },\n \"prom_ql\": \"clickhouse_metrics_network_send \\u003e 250 or clickhouse_metrics_network_receive \\u003e 250\",\n \"severity\": 2\n },\n {\n \"keys\": {\n \"labelKey\": \"\",\n \"valueKey\": \"\"\n },\n \"prom_ql\": \"clickhouse_metrics_network_send \\u003e 250 or clickhouse_metrics_network_receive \\u003e 250\",\n \"severity\": 3\n },\n {\n \"keys\": {\n \"labelKey\": \"\",\n \"valueKey\": \"\"\n },\n \"prom_ql\": \"increase(clickhouse_metrics_interserver_connection[5m]) \\u003e 0\",\n \"severity\": 3\n }\n ]\n },\n \"prom_eval_interval\": 30,\n \"enable_stime\": \"00:00\",\n \"enable_stimes\": [\n \"00:00\"\n ],\n \"enable_etime\": \"00:00\",\n \"enable_etimes\": [\n \"00:00\"\n ],\n \"enable_days_of_week\": [\n \"0\",\n \"1\",\n \"2\",\n \"3\",\n \"4\",\n \"5\",\n \"6\"\n ],\n \"enable_days_of_weeks\": [\n [\n \"0\",\n \"1\",\n \"2\",\n \"3\",\n \"4\",\n \"5\",\n \"6\"\n ]\n ],\n \"enable_in_bg\": 0,\n \"notify_recovered\": 1,\n \"notify_channels\": [],\n \"notify_groups_obj\": null,\n \"notify_groups\": null,\n \"notify_repeat_step\": 60,\n \"notify_max_number\": 0,\n \"recover_duration\": 0,\n \"callbacks\": [],\n \"runbook_url\": \"\",\n \"append_tags\": [],\n \"annotations\": {},\n \"extra_config\": null,\n \"create_at\": 0,\n \"create_by\": \"\",\n \"update_at\": 0,\n \"update_by\": \"\",\n \"uuid\": 1719305153861525000\n }\n]"
},
{
"path": "integrations/ClickHouse/alerts/clickhouse_by_exporter.json",
"content": "[\n {\n \"id\": 0,\n \"group_id\": 0,\n \"cate\": \"prometheus\",\n \"datasource_ids\": [\n 0\n ],\n \"cluster\": \"\",\n \"name\": \"ClickHouse Exporter 认证错误\",\n \"note\": \"\",\n \"prod\": \"metric\",\n \"algorithm\": \"\",\n \"algo_params\": null,\n \"delay\": 0,\n \"severity\": 0,\n \"severities\": [\n 2,\n 3\n ],\n \"disabled\": 1,\n \"prom_for_duration\": 60,\n \"prom_ql\": \"\",\n \"rule_config\": {\n \"queries\": [\n {\n \"keys\": {\n \"labelKey\": \"\",\n \"valueKey\": \"\"\n },\n \"prom_ql\": \"increase(ClickHouseErrorMetric_AUTHENTICATION_FAILED[5m]) \\u003e 0\",\n \"severity\": 2\n },\n {\n \"prom_ql\": \"increase(ClickHouseErrorMetric_RESOURCE_ACCESS_DENIED[5m]) \\u003e 0\",\n \"severity\": 3\n }\n ]\n },\n \"prom_eval_interval\": 30,\n \"enable_stime\": \"00:00\",\n \"enable_stimes\": [\n \"00:00\"\n ],\n \"enable_etime\": \"00:00\",\n \"enable_etimes\": [\n \"00:00\"\n ],\n \"enable_days_of_week\": [\n \"0\",\n \"1\",\n \"2\",\n \"3\",\n \"4\",\n \"5\",\n \"6\"\n ],\n \"enable_days_of_weeks\": [\n [\n \"0\",\n \"1\",\n \"2\",\n \"3\",\n \"4\",\n \"5\",\n \"6\"\n ]\n ],\n \"enable_in_bg\": 0,\n \"notify_recovered\": 1,\n \"notify_channels\": [],\n \"notify_groups_obj\": null,\n \"notify_groups\": null,\n \"notify_repeat_step\": 60,\n \"notify_max_number\": 0,\n \"recover_duration\": 0,\n \"callbacks\": [],\n \"runbook_url\": \"\",\n \"append_tags\": [],\n \"annotations\": {},\n \"extra_config\": null,\n \"create_at\": 0,\n \"create_by\": \"\",\n \"update_at\": 0,\n \"update_by\": \"\",\n \"uuid\": 1719305153863782000\n },\n {\n \"id\": 0,\n \"group_id\": 0,\n \"cate\": \"prometheus\",\n \"datasource_ids\": [\n 0\n ],\n \"cluster\": \"\",\n \"name\": \"ClickHouse Exporter ZooKeeper故障\",\n \"note\": \"\",\n \"prod\": \"metric\",\n \"algorithm\": \"\",\n \"algo_params\": null,\n \"delay\": 0,\n \"severity\": 0,\n \"severities\": [\n 2\n ],\n \"disabled\": 1,\n \"prom_for_duration\": 60,\n \"prom_ql\": \"\",\n \"rule_config\": {\n \"queries\": [\n {\n \"prom_ql\": \"avg(ClickHouseMetrics_ZooKeeperSession) != 1\",\n \"severity\": 2\n }\n ]\n },\n \"prom_eval_interval\": 30,\n \"enable_stime\": \"00:00\",\n \"enable_stimes\": [\n \"00:00\"\n ],\n \"enable_etime\": \"00:00\",\n \"enable_etimes\": [\n \"00:00\"\n ],\n \"enable_days_of_week\": [\n \"0\",\n \"1\",\n \"2\",\n \"3\",\n \"4\",\n \"5\",\n \"6\"\n ],\n \"enable_days_of_weeks\": [\n [\n \"0\",\n \"1\",\n \"2\",\n \"3\",\n \"4\",\n \"5\",\n \"6\"\n ]\n ],\n \"enable_in_bg\": 0,\n \"notify_recovered\": 1,\n \"notify_channels\": [],\n \"notify_groups_obj\": null,\n \"notify_groups\": null,\n \"notify_repeat_step\": 60,\n \"notify_max_number\": 0,\n \"recover_duration\": 0,\n \"callbacks\": [],\n \"runbook_url\": \"\",\n \"append_tags\": [],\n \"annotations\": {},\n \"extra_config\": null,\n \"create_at\": 0,\n \"create_by\": \"\",\n \"update_at\": 0,\n \"update_by\": \"\",\n \"uuid\": 1719305153865298000\n },\n {\n \"id\": 0,\n \"group_id\": 0,\n \"cate\": \"prometheus\",\n \"datasource_ids\": [\n 0\n ],\n \"cluster\": \"\",\n \"name\": \"ClickHouse Exporter 内存使用\",\n \"note\": \"内存使用报警\",\n \"prod\": \"metric\",\n \"algorithm\": \"\",\n \"algo_params\": null,\n \"delay\": 0,\n \"severity\": 0,\n \"severities\": [\n 1,\n 2\n ],\n \"disabled\": 1,\n \"prom_for_duration\": 60,\n \"prom_ql\": \"\",\n \"rule_config\": {\n \"queries\": [\n {\n \"keys\": {\n \"labelKey\": \"\",\n \"valueKey\": \"\"\n },\n \"prom_ql\": \"ClickHouseMetrics_MemoryTracking / ClickHouseAsyncMetrics_OSMemoryTotal * 100 \\u003e 90\",\n \"severity\": 1\n },\n {\n \"keys\": {\n \"labelKey\": \"\",\n \"valueKey\": \"\"\n },\n \"prom_ql\": \"ClickHouseMetrics_MemoryTracking / ClickHouseAsyncMetrics_OSMemoryTotal * 100 \\u003e 80\",\n \"severity\": 2\n }\n ]\n },\n \"prom_eval_interval\": 30,\n \"enable_stime\": \"00:00\",\n \"enable_stimes\": [\n \"00:00\"\n ],\n \"enable_etime\": \"00:00\",\n \"enable_etimes\": [\n \"00:00\"\n ],\n \"enable_days_of_week\": [\n \"0\",\n \"1\",\n \"2\",\n \"3\",\n \"4\",\n \"5\",\n \"6\"\n ],\n \"enable_days_of_weeks\": [\n [\n \"0\",\n \"1\",\n \"2\",\n \"3\",\n \"4\",\n \"5\",\n \"6\"\n ]\n ],\n \"enable_in_bg\": 0,\n \"notify_recovered\": 1,\n \"notify_channels\": [],\n \"notify_groups_obj\": null,\n \"notify_groups\": null,\n \"notify_repeat_step\": 60,\n \"notify_max_number\": 0,\n \"recover_duration\": 0,\n \"callbacks\": [],\n \"runbook_url\": \"\",\n \"append_tags\": [],\n \"annotations\": {},\n \"extra_config\": null,\n \"create_at\": 0,\n \"create_by\": \"\",\n \"update_at\": 0,\n \"update_by\": \"\",\n \"uuid\": 1719305153866296000\n },\n {\n \"id\": 0,\n \"group_id\": 0,\n \"cate\": \"prometheus\",\n \"datasource_ids\": [\n 0\n ],\n \"cluster\": \"\",\n \"name\": \"ClickHouse Exporter 副本错误\",\n \"note\": \"\",\n \"prod\": \"metric\",\n \"algorithm\": \"\",\n \"algo_params\": null,\n \"delay\": 0,\n \"severity\": 0,\n \"severities\": [\n 1,\n 3\n ],\n \"disabled\": 1,\n \"prom_for_duration\": 60,\n \"prom_ql\": \"\",\n \"rule_config\": {\n \"queries\": [\n {\n \"prom_ql\": \"ClickHouseErrorMetric_ALL_REPLICAS_ARE_STALE == 1 or ClickHouseErrorMetric_ALL_REPLICAS_LOST == 1\",\n \"severity\": 1\n },\n {\n \"prom_ql\": \" ClickHouseErrorMetric_NO_AVAILABLE_REPLICA == 1\",\n \"severity\": 1\n },\n {\n \"prom_ql\": \" ClickHouseErrorMetric_TOO_FEW_LIVE_REPLICAS == 1\",\n \"severity\": 3\n }\n ]\n },\n \"prom_eval_interval\": 30,\n \"enable_stime\": \"00:00\",\n \"enable_stimes\": [\n \"00:00\"\n ],\n \"enable_etime\": \"00:00\",\n \"enable_etimes\": [\n \"00:00\"\n ],\n \"enable_days_of_week\": [\n \"0\",\n \"1\",\n \"2\",\n \"3\",\n \"4\",\n \"5\",\n \"6\"\n ],\n \"enable_days_of_weeks\": [\n [\n \"0\",\n \"1\",\n \"2\",\n \"3\",\n \"4\",\n \"5\",\n \"6\"\n ]\n ],\n \"enable_in_bg\": 0,\n \"notify_recovered\": 1,\n \"notify_channels\": [],\n \"notify_groups_obj\": null,\n \"notify_groups\": null,\n \"notify_repeat_step\": 60,\n \"notify_max_number\": 0,\n \"recover_duration\": 0,\n \"callbacks\": [],\n \"runbook_url\": \"\",\n \"append_tags\": [],\n \"annotations\": {},\n \"extra_config\": null,\n \"create_at\": 0,\n \"create_by\": \"\",\n \"update_at\": 0,\n \"update_by\": \"\",\n \"uuid\": 1719305153867268000\n },\n {\n \"id\": 0,\n \"group_id\": 0,\n \"cate\": \"prometheus\",\n \"datasource_ids\": [\n 0\n ],\n \"cluster\": \"\",\n \"name\": \"ClickHouse Exporter 磁盘使用\",\n \"note\": \"磁盘使用报警\",\n \"prod\": \"metric\",\n \"algorithm\": \"\",\n \"algo_params\": null,\n \"delay\": 0,\n \"severity\": 0,\n \"severities\": [\n 1,\n 2\n ],\n \"disabled\": 1,\n \"prom_for_duration\": 60,\n \"prom_ql\": \"\",\n \"rule_config\": {\n \"queries\": [\n {\n \"keys\": {\n \"labelKey\": \"\",\n \"valueKey\": \"\"\n },\n \"prom_ql\": \"ClickHouseAsyncMetrics_DiskAvailable_default / (ClickHouseAsyncMetrics_DiskAvailable_default + ClickHouseAsyncMetrics_DiskUsed_default) * 100 \\u003c 10\",\n \"severity\": 1\n },\n {\n \"keys\": {\n \"labelKey\": \"\",\n \"valueKey\": \"\"\n },\n \"prom_ql\": \"ClickHouseAsyncMetrics_DiskAvailable_default / (ClickHouseAsyncMetrics_DiskAvailable_default + ClickHouseAsyncMetrics_DiskUsed_default) * 100 \\u003c 20\",\n \"severity\": 2\n },\n {\n \"prom_ql\": \"ClickHouseAsyncMetrics_DiskAvailable_backups / (ClickHouseAsyncMetrics_DiskAvailable_backups + ClickHouseAsyncMetrics_DiskUsed_backups) * 100 \\u003c 20\",\n \"severity\": 2\n }\n ]\n },\n \"prom_eval_interval\": 30,\n \"enable_stime\": \"00:00\",\n \"enable_stimes\": [\n \"00:00\"\n ],\n \"enable_etime\": \"00:00\",\n \"enable_etimes\": [\n \"00:00\"\n ],\n \"enable_days_of_week\": [\n \"0\",\n \"1\",\n \"2\",\n \"3\",\n \"4\",\n \"5\",\n \"6\"\n ],\n \"enable_days_of_weeks\": [\n [\n \"0\",\n \"1\",\n \"2\",\n \"3\",\n \"4\",\n \"5\",\n \"6\"\n ]\n ],\n \"enable_in_bg\": 0,\n \"notify_recovered\": 1,\n \"notify_channels\": [],\n \"notify_groups_obj\": null,\n \"notify_groups\": null,\n \"notify_repeat_step\": 60,\n \"notify_max_number\": 0,\n \"recover_duration\": 0,\n \"callbacks\": [],\n \"runbook_url\": \"\",\n \"append_tags\": [],\n \"annotations\": {},\n \"extra_config\": null,\n \"create_at\": 0,\n \"create_by\": \"\",\n \"update_at\": 0,\n \"update_by\": \"\",\n \"uuid\": 1719305153868363000\n },\n {\n \"id\": 0,\n \"group_id\": 0,\n \"cate\": \"prometheus\",\n \"datasource_ids\": [\n 0\n ],\n \"cluster\": \"\",\n \"name\": \"ClickHouse Exporter 网络故障\",\n \"note\": \"\",\n \"prod\": \"metric\",\n \"algorithm\": \"\",\n \"algo_params\": null,\n \"delay\": 0,\n \"severity\": 0,\n \"severities\": [\n 2,\n 3\n ],\n \"disabled\": 1,\n \"prom_for_duration\": 60,\n \"prom_ql\": \"\",\n \"rule_config\": {\n \"queries\": [\n {\n \"prom_ql\": \"ClickHouseMetrics_NetworkSend \\u003e 250 or ClickHouseMetrics_NetworkReceive \\u003e 250\",\n \"severity\": 2\n },\n {\n \"prom_ql\": \"ClickHouseMetrics_NetworkSend \\u003e 250 or ClickHouseMetrics_NetworkReceive \\u003e 250\",\n \"severity\": 3\n },\n {\n \"prom_ql\": \"increase(ClickHouseMetrics_InterserverConnection[5m]) \\u003e 0\",\n \"severity\": 3\n }\n ]\n },\n \"prom_eval_interval\": 30,\n \"enable_stime\": \"00:00\",\n \"enable_stimes\": [\n \"00:00\"\n ],\n \"enable_etime\": \"00:00\",\n \"enable_etimes\": [\n \"00:00\"\n ],\n \"enable_days_of_week\": [\n \"0\",\n \"1\",\n \"2\",\n \"3\",\n \"4\",\n \"5\",\n \"6\"\n ],\n \"enable_days_of_weeks\": [\n [\n \"0\",\n \"1\",\n \"2\",\n \"3\",\n \"4\",\n \"5\",\n \"6\"\n ]\n ],\n \"enable_in_bg\": 0,\n \"notify_recovered\": 1,\n \"notify_channels\": [],\n \"notify_groups_obj\": null,\n \"notify_groups\": null,\n \"notify_repeat_step\": 60,\n \"notify_max_number\": 0,\n \"recover_duration\": 0,\n \"callbacks\": [],\n \"runbook_url\": \"\",\n \"append_tags\": [],\n \"annotations\": {},\n \"extra_config\": null,\n \"create_at\": 0,\n \"create_by\": \"\",\n \"update_at\": 0,\n \"update_by\": \"\",\n \"uuid\": 1719305153869486000\n }\n]"
},
{
"path": "integrations/ClickHouse/collect/clickhouse/clickhouse.toml",
"content": "# # collect interval\n# interval = 15\n\n# Read metrics from one or many ClickHouse servers\n[[instances]]\n ## Username for authorization on ClickHouse server\n username = \"default\"\n\n ## Password for authorization on ClickHouse server\n # password = \"\"\n\n ## HTTP(s) timeout while getting metrics values\n ## The timeout includes connection time, any redirects, and reading the\n ## response body.\n # timeout = 5\n\n ## List of servers for metrics scraping\n ## metrics scrape via HTTP(s) clickhouse interface\n ## https://clickhouse.tech/docs/en/interfaces/http/\n # servers = [\"http://127.0.0.1:8123\"]\n\n ## If \"auto_discovery\"\" is \"true\" plugin tries to connect to all servers\n ## available in the cluster with using same \"user:password\" described in\n ## \"user\" and \"password\" parameters and get this server hostname list from\n ## \"system.clusters\" table. See\n ## - https://clickhouse.tech/docs/en/operations/system_tables/#system-clusters\n ## - https://clickhouse.tech/docs/en/operations/server_settings/settings/#server_settings_remote_servers\n ## - https://clickhouse.tech/docs/en/operations/table_engines/distributed/\n ## - https://clickhouse.tech/docs/en/operations/table_engines/replication/#creating-replicated-tables\n # auto_discovery = true\n\n ## Filter cluster names in \"system.clusters\" when \"auto_discovery\" is \"true\"\n ## when this filter present then \"WHERE cluster IN (...)\" filter will apply\n ## please use only full cluster names here, regexp and glob filters is not\n ## allowed for \"/etc/clickhouse-server/config.d/remote.xml\"\n ## \n ## \n ## \n ## \n ## clickhouse-ru-1.local 9000 clickhouse-ru-2.local 9000 \n ## \n ## clickhouse-eu-1.local 9000 clickhouse-eu-2.local 9000 \n ## \n ## \n ##\n ## \n ##\n ## example: cluster_include = [\"my-own-cluster\"]\n # cluster_include = []\n\n ## Filter cluster names in \"system.clusters\" when \"auto_discovery\" is\n ## \"true\" when this filter present then \"WHERE cluster NOT IN (...)\"\n ## filter will apply\n ## example: cluster_exclude = [\"my-internal-not-discovered-cluster\"]\n # cluster_exclude = []\n\n ## Optional TLS Config\n # tls_ca = \"/etc/telegraf/ca.pem\"\n # tls_cert = \"/etc/telegraf/cert.pem\"\n # tls_key = \"/etc/telegraf/key.pem\"\n ## Use TLS but skip chain & host verification\n # insecure_skip_verify = false\n\n # [[instances.metrics]]\n # measurement = \"sessions\"\n # label_fields = [ \"status\", \"type\" ]\n # metric_fields = [ \"value\" ]\n # timeout = \"3s\"\n # request = '''\n # SELECT status, type, COUNT(*) as value FROM v$session GROUP BY status, type\n # '''\n"
},
{
"path": "integrations/ClickHouse/dashboards/clickhouse_by_categraf.json",
"content": "{\n \"id\": 0,\n \"group_id\": 0,\n \"name\": \"ClickHouse_Categraf\",\n \"ident\": \"\",\n \"tags\": \"\",\n \"create_at\": 0,\n \"create_by\": \"\",\n \"update_at\": 0,\n \"update_by\": \"\",\n \"configs\": {\n \"graphTooltip\": \"default\",\n \"graphZoom\": \"default\",\n \"panels\": [\n {\n \"collapsed\": false,\n \"id\": \"be21493f-8eb4-4947-9e34-0109fcda9a51\",\n \"layout\": {\n \"h\": 1,\n \"i\": \"be21493f-8eb4-4947-9e34-0109fcda9a51\",\n \"isResizable\": false,\n \"w\": 24,\n \"x\": 0,\n \"y\": 0\n },\n \"name\": \"General\",\n \"panels\": [\n {\n \"custom\": {\n \"drawStyle\": \"lines\",\n \"fillOpacity\": 0,\n \"gradientMode\": \"none\",\n \"lineInterpolation\": \"smooth\",\n \"lineWidth\": 1,\n \"scaleDistribution\": {\n \"type\": \"linear\"\n },\n \"spanNulls\": false,\n \"stack\": \"off\"\n },\n \"datasourceCate\": \"prometheus\",\n \"datasourceValue\": 1,\n \"description\": \"内存占用\",\n \"id\": \"8687b3a6-c7f2-4af6-8509-29c99969a55d\",\n \"layout\": {\n \"h\": 7,\n \"i\": \"8687b3a6-c7f2-4af6-8509-29c99969a55d\",\n \"isResizable\": true,\n \"w\": 12,\n \"x\": 0,\n \"y\": 1\n },\n \"maxPerRow\": 4,\n \"name\": \"Memory\",\n \"options\": {\n \"legend\": {\n \"behaviour\": \"showItem\",\n \"displayMode\": \"hidden\"\n },\n \"standardOptions\": {},\n \"thresholds\": {\n \"steps\": [\n {\n \"color\": \"#634CD9\",\n \"type\": \"base\",\n \"value\": null\n }\n ]\n },\n \"tooltip\": {\n \"mode\": \"all\",\n \"sort\": \"none\"\n }\n },\n \"overrides\": [\n {\n \"matcher\": {\n \"id\": \"byFrameRefID\"\n },\n \"properties\": {\n \"rightYAxisDisplay\": \"off\"\n }\n }\n ],\n \"targets\": [\n {\n \"__mode__\": \"__query__\",\n \"expr\": \"clickhouse_metrics_memory_tracking\",\n \"legend\": \"分配的内存总量\",\n \"maxDataPoints\": 240,\n \"refId\": \"B\"\n }\n ],\n \"transformations\": [\n {\n \"id\": \"organize\",\n \"options\": {}\n }\n ],\n \"type\": \"timeseries\",\n \"version\": \"3.0.0\"\n },\n {\n \"custom\": {\n \"drawStyle\": \"lines\",\n \"fillOpacity\": 0,\n \"gradientMode\": \"none\",\n \"lineInterpolation\": \"smooth\",\n \"lineWidth\": 1,\n \"scaleDistribution\": {\n \"type\": \"linear\"\n },\n \"spanNulls\": false,\n \"stack\": \"off\"\n },\n \"datasourceCate\": \"prometheus\",\n \"datasourceValue\": 1,\n \"description\": \"tcp连接数\",\n \"id\": \"af8f29d3-8992-450e-8caa-749518669da1\",\n \"layout\": {\n \"h\": 7,\n \"i\": \"af8f29d3-8992-450e-8caa-749518669da1\",\n \"isResizable\": true,\n \"w\": 12,\n \"x\": 12,\n \"y\": 1\n },\n \"maxPerRow\": 4,\n \"name\": \"Connections\",\n \"options\": {\n \"legend\": {\n \"behaviour\": \"showItem\",\n \"displayMode\": \"hidden\"\n },\n \"standardOptions\": {},\n \"thresholds\": {\n \"steps\": [\n {\n \"color\": \"#634CD9\",\n \"type\": \"base\",\n \"value\": null\n }\n ]\n },\n \"tooltip\": {\n \"mode\": \"all\",\n \"sort\": \"none\"\n }\n },\n \"overrides\": [\n {\n \"matcher\": {\n \"id\": \"byFrameRefID\"\n },\n \"properties\": {\n \"rightYAxisDisplay\": \"off\"\n }\n }\n ],\n \"targets\": [\n {\n \"__mode__\": \"__query__\",\n \"expr\": \"clickhouse_metrics_tcp_connection\",\n \"legend\": \"与 TCP 服务器(带本地接口的客户端)的连接数,也包括服务器-服务器连接\",\n \"maxDataPoints\": 240,\n \"refId\": \"B\"\n }\n ],\n \"transformations\": [\n {\n \"id\": \"organize\",\n \"options\": {}\n }\n ],\n \"type\": \"timeseries\",\n \"version\": \"3.0.0\"\n }\n ],\n \"type\": \"row\"\n },\n {\n \"collapsed\": false,\n \"id\": \"cd6bd256-20d0-4892-9c99-7b9976fd9013\",\n \"layout\": {\n \"h\": 1,\n \"i\": \"cd6bd256-20d0-4892-9c99-7b9976fd9013\",\n \"isResizable\": false,\n \"w\": 24,\n \"x\": 0,\n \"y\": 15\n },\n \"name\": \"Queries\",\n \"panels\": [\n {\n \"custom\": {\n \"drawStyle\": \"lines\",\n \"fillOpacity\": 0,\n \"gradientMode\": \"none\",\n \"lineInterpolation\": \"smooth\",\n \"lineWidth\": 1,\n \"scaleDistribution\": {\n \"type\": \"linear\"\n },\n \"spanNulls\": false,\n \"stack\": \"off\"\n },\n \"datasourceCate\": \"prometheus\",\n \"datasourceValue\": 1,\n \"description\": \"需要解释和可能执行的查询数量,不包括失败的查询\",\n \"id\": \"0524900d-99fd-42b8-a647-d4da462fc309\",\n \"layout\": {\n \"h\": 8,\n \"i\": \"0524900d-99fd-42b8-a647-d4da462fc309\",\n \"isResizable\": true,\n \"w\": 11,\n \"x\": 0,\n \"y\": 16\n },\n \"maxPerRow\": 4,\n \"name\": \"查询总数\",\n \"options\": {\n \"legend\": {\n \"behaviour\": \"showItem\",\n \"displayMode\": \"hidden\"\n },\n \"standardOptions\": {},\n \"thresholds\": {\n \"steps\": [\n {\n \"color\": \"#634CD9\",\n \"type\": \"base\",\n \"value\": null\n }\n ]\n },\n \"tooltip\": {\n \"mode\": \"all\",\n \"sort\": \"none\"\n }\n },\n \"overrides\": [\n {\n \"matcher\": {\n \"id\": \"byFrameRefID\"\n },\n \"properties\": {\n \"rightYAxisDisplay\": \"off\"\n }\n }\n ],\n \"targets\": [\n {\n \"expr\": \"max_over_time(irate(clickhouse_events_query[2m]) [1h:1m]) * $peeks\",\n \"legend\": \"peaks - {{instance}}\",\n \"maxDataPoints\": 240,\n \"refId\": \"A\"\n },\n {\n \"__mode__\": \"__query__\",\n \"expr\": \"rate(clickhouse_events_query[2m]) * $trends\",\n \"legend\": \"trend - {{instance}}\",\n \"maxDataPoints\": 240,\n \"refId\": \"B\"\n }\n ],\n \"transformations\": [\n {\n \"id\": \"organize\",\n \"options\": {}\n }\n ],\n \"type\": \"timeseries\",\n \"version\": \"3.0.0\"\n },\n {\n \"custom\": {\n \"drawStyle\": \"lines\",\n \"fillOpacity\": 0,\n \"gradientMode\": \"none\",\n \"lineInterpolation\": \"smooth\",\n \"lineWidth\": 1,\n \"scaleDistribution\": {\n \"type\": \"linear\"\n },\n \"spanNulls\": false,\n \"stack\": \"off\"\n },\n \"datasourceCate\": \"prometheus\",\n \"datasourceValue\": 1,\n \"description\": \"SELECT查询的数量\",\n \"id\": \"9e288fcd-4513-46bb-bcb5-b2f4e0b4edde\",\n \"layout\": {\n \"h\": 8,\n \"i\": \"d5701b8e-6926-4349-934d-0999de4666a5\",\n \"isResizable\": true,\n \"w\": 12,\n \"x\": 11,\n \"y\": 16\n },\n \"maxPerRow\": 4,\n \"name\": \"SELECT 查询数\",\n \"options\": {\n \"legend\": {\n \"behaviour\": \"showItem\",\n \"displayMode\": \"hidden\"\n },\n \"standardOptions\": {},\n \"thresholds\": {\n \"steps\": [\n {\n \"color\": \"#634CD9\",\n \"type\": \"base\",\n \"value\": null\n }\n ]\n },\n \"tooltip\": {\n \"mode\": \"all\",\n \"sort\": \"none\"\n }\n },\n \"overrides\": [\n {\n \"matcher\": {\n \"id\": \"byFrameRefID\"\n },\n \"properties\": {\n \"rightYAxisDisplay\": \"off\"\n }\n }\n ],\n \"targets\": [\n {\n \"expr\": \"max_over_time(irate(clickhouse_events_select_query[2m]) [1h:1m]) * $peeks\",\n \"legend\": \"peaks - {{instance}}\",\n \"maxDataPoints\": 240,\n \"refId\": \"A\"\n },\n {\n \"__mode__\": \"__query__\",\n \"expr\": \"rate(clickhouse_events_select_query[2m]) * $trends\",\n \"legend\": \"trend - {{instance}}\",\n \"maxDataPoints\": 240,\n \"refId\": \"B\"\n }\n ],\n \"transformations\": [\n {\n \"id\": \"organize\",\n \"options\": {}\n }\n ],\n \"type\": \"timeseries\",\n \"version\": \"3.0.0\"\n },\n {\n \"custom\": {\n \"drawStyle\": \"lines\",\n \"fillOpacity\": 0,\n \"gradientMode\": \"none\",\n \"lineInterpolation\": \"smooth\",\n \"lineWidth\": 1,\n \"scaleDistribution\": {\n \"type\": \"linear\"\n },\n \"spanNulls\": false,\n \"stack\": \"off\"\n },\n \"datasourceCate\": \"prometheus\",\n \"datasourceValue\": 1,\n \"description\": \"\",\n \"id\": \"6a95c841-5ac7-4cd9-9597-21b0f41441e4\",\n \"layout\": {\n \"h\": 9,\n \"i\": \"c14878d8-c197-45ab-802e-f328b84deeff\",\n \"isResizable\": true,\n \"w\": 11,\n \"x\": 0,\n \"y\": 24\n },\n \"maxPerRow\": 4,\n \"name\": \"查询平均延迟\",\n \"options\": {\n \"legend\": {\n \"behaviour\": \"showItem\",\n \"displayMode\": \"hidden\"\n },\n \"standardOptions\": {},\n \"thresholds\": {\n \"steps\": [\n {\n \"color\": \"#634CD9\",\n \"type\": \"base\",\n \"value\": null\n }\n ]\n },\n \"tooltip\": {\n \"mode\": \"all\",\n \"sort\": \"none\"\n }\n },\n \"overrides\": [\n {\n \"matcher\": {\n \"id\": \"byFrameRefID\"\n },\n \"properties\": {\n \"rightYAxisDisplay\": \"off\"\n }\n }\n ],\n \"targets\": [\n {\n \"expr\": \"increase(clickhouse_events_query_time_microseconds[1m]) / (increase(clickhouse_events_query_time_microseconds[1m]) + 0.001)\",\n \"legend\": \"{{instance}}\",\n \"maxDataPoints\": 240,\n \"refId\": \"A\"\n }\n ],\n \"transformations\": [\n {\n \"id\": \"organize\",\n \"options\": {}\n }\n ],\n \"type\": \"timeseries\",\n \"version\": \"3.0.0\"\n },\n {\n \"custom\": {\n \"drawStyle\": \"lines\",\n \"fillOpacity\": 0,\n \"gradientMode\": \"none\",\n \"lineInterpolation\": \"smooth\",\n \"lineWidth\": 1,\n \"scaleDistribution\": {\n \"type\": \"linear\"\n },\n \"spanNulls\": false,\n \"stack\": \"off\"\n },\n \"datasourceCate\": \"prometheus\",\n \"datasourceValue\": 1,\n \"description\": \"\",\n \"id\": \"4584d584-054b-4d42-b2f9-215a71fca118\",\n \"layout\": {\n \"h\": 9,\n \"i\": \"050414c6-8e31-49d1-8ddd-1916bf2101f5\",\n \"isResizable\": true,\n \"w\": 12,\n \"x\": 11,\n \"y\": 24\n },\n \"maxPerRow\": 4,\n \"name\": \"SELECT查询平均延迟\",\n \"options\": {\n \"legend\": {\n \"behaviour\": \"showItem\",\n \"displayMode\": \"hidden\"\n },\n \"standardOptions\": {},\n \"thresholds\": {\n \"steps\": [\n {\n \"color\": \"#634CD9\",\n \"type\": \"base\",\n \"value\": null\n }\n ]\n },\n \"tooltip\": {\n \"mode\": \"all\",\n \"sort\": \"none\"\n }\n },\n \"overrides\": [\n {\n \"matcher\": {\n \"id\": \"byFrameRefID\"\n },\n \"properties\": {\n \"rightYAxisDisplay\": \"off\"\n }\n }\n ],\n \"targets\": [\n {\n \"expr\": \"increase(clickhouse_events_select_query_time_microseconds[1m] )/ (increase(clickhouse_events_select_query_time_microseconds[1m]) + 0.001)\",\n \"legend\": \"peaks - {{instance}}\",\n \"maxDataPoints\": 240,\n \"refId\": \"A\"\n }\n ],\n \"transformations\": [\n {\n \"id\": \"organize\",\n \"options\": {}\n }\n ],\n \"type\": \"timeseries\",\n \"version\": \"3.0.0\"\n }\n ],\n \"type\": \"row\"\n },\n {\n \"collapsed\": false,\n \"id\": \"9da4b0b9-6843-4225-b3ba-dec31b2ca7c0\",\n \"layout\": {\n \"h\": 1,\n \"i\": \"9da4b0b9-6843-4225-b3ba-dec31b2ca7c0\",\n \"isResizable\": false,\n \"w\": 24,\n \"x\": 0,\n \"y\": 50\n },\n \"name\": \"Insert\",\n \"panels\": [\n {\n \"custom\": {\n \"drawStyle\": \"lines\",\n \"fillOpacity\": 0,\n \"gradientMode\": \"none\",\n \"lineInterpolation\": \"smooth\",\n \"lineWidth\": 1,\n \"scaleDistribution\": {\n \"type\": \"linear\"\n },\n \"spanNulls\": false,\n \"stack\": \"off\"\n },\n \"datasourceCate\": \"prometheus\",\n \"datasourceValue\": 1,\n \"description\": \"所有表INSERT的行数\",\n \"id\": \"6ea9312d-2334-4912-864c-4cea25bf65f9\",\n \"layout\": {\n \"h\": 8,\n \"i\": \"6ea9312d-2334-4912-864c-4cea25bf65f9\",\n \"isResizable\": true,\n \"w\": 12,\n \"x\": 0,\n \"y\": 51\n },\n \"maxPerRow\": 4,\n \"name\": \"Inserted 插入行数\",\n \"options\": {\n \"legend\": {\n \"behaviour\": \"showItem\",\n \"displayMode\": \"hidden\"\n },\n \"standardOptions\": {},\n \"thresholds\": {\n \"steps\": [\n {\n \"color\": \"#634CD9\",\n \"type\": \"base\",\n \"value\": null\n }\n ]\n },\n \"tooltip\": {\n \"mode\": \"all\",\n \"sort\": \"none\"\n }\n },\n \"overrides\": [\n {\n \"matcher\": {\n \"id\": \"byFrameRefID\"\n },\n \"properties\": {\n \"rightYAxisDisplay\": \"off\"\n }\n }\n ],\n \"targets\": [\n {\n \"expr\": \"max_over_time(irate(clickhouse_events_inserted_rows[2m]) [1h:1m]) * $peeks\",\n \"legend\": \"peaks - {{instance}}\",\n \"maxDataPoints\": 240,\n \"refId\": \"A\"\n },\n {\n \"__mode__\": \"__query__\",\n \"expr\": \"rate(clickhouse_events_inserted_rows[1m]) * $trends\",\n \"legend\": \"trend - {{instance}}\",\n \"maxDataPoints\": 240,\n \"refId\": \"B\"\n }\n ],\n \"transformations\": [\n {\n \"id\": \"organize\",\n \"options\": {}\n }\n ],\n \"type\": \"timeseries\",\n \"version\": \"3.0.0\"\n },\n {\n \"custom\": {\n \"drawStyle\": \"lines\",\n \"fillOpacity\": 0,\n \"gradientMode\": \"none\",\n \"lineInterpolation\": \"smooth\",\n \"lineWidth\": 1,\n \"scaleDistribution\": {\n \"type\": \"linear\"\n },\n \"spanNulls\": false,\n \"stack\": \"off\"\n },\n \"datasourceCate\": \"prometheus\",\n \"datasourceValue\": 1,\n \"description\": \"所有表INSERT的字节数(未压缩列以它们在内存中存储的形式)\",\n \"id\": \"8a4987ad-c10f-419c-b2e9-107502e4bc20\",\n \"layout\": {\n \"h\": 8,\n \"i\": \"993c68cb-fabe-4742-b1a3-b9bd317d9725\",\n \"isResizable\": true,\n \"w\": 11,\n \"x\": 12,\n \"y\": 51\n },\n \"maxPerRow\": 4,\n \"name\": \"Inserted 插入字节数\",\n \"options\": {\n \"legend\": {\n \"behaviour\": \"showItem\",\n \"displayMode\": \"hidden\"\n },\n \"standardOptions\": {},\n \"thresholds\": {\n \"steps\": [\n {\n \"color\": \"#634CD9\",\n \"type\": \"base\",\n \"value\": null\n }\n ]\n },\n \"tooltip\": {\n \"mode\": \"all\",\n \"sort\": \"none\"\n }\n },\n \"overrides\": [\n {\n \"matcher\": {\n \"id\": \"byFrameRefID\"\n },\n \"properties\": {\n \"rightYAxisDisplay\": \"off\"\n }\n }\n ],\n \"targets\": [\n {\n \"expr\": \"max_over_time(irate(clickhouse_events_inserted_bytes[2m]) [1h:1m]) * $peeks\",\n \"legend\": \"peaks - {{instance}}\",\n \"maxDataPoints\": 240,\n \"refId\": \"A\"\n },\n {\n \"__mode__\": \"__query__\",\n \"expr\": \"rate(clickhouse_events_inserted_bytes[1m]) * $trends\",\n \"legend\": \"trend - {{instance}}\",\n \"maxDataPoints\": 240,\n \"refId\": \"B\"\n }\n ],\n \"transformations\": [\n {\n \"id\": \"organize\",\n \"options\": {}\n }\n ],\n \"type\": \"timeseries\",\n \"version\": \"3.0.0\"\n },\n {\n \"custom\": {\n \"drawStyle\": \"lines\",\n \"fillOpacity\": 0,\n \"gradientMode\": \"none\",\n \"lineInterpolation\": \"smooth\",\n \"lineWidth\": 1,\n \"scaleDistribution\": {\n \"type\": \"linear\"\n },\n \"spanNulls\": false,\n \"stack\": \"off\"\n },\n \"datasourceCate\": \"prometheus\",\n \"datasourceValue\": 1,\n \"description\": \"由于分区的活动数据部分数量过多,INSERT到MergeTree表的块被限制的次数\",\n \"id\": \"dd6d8098-1cab-483d-9462-3436678cbbb8\",\n \"layout\": {\n \"h\": 8,\n \"i\": \"ecfdbaee-44bb-47ad-a871-e1448a7eac25\",\n \"isResizable\": true,\n \"w\": 12,\n \"x\": 0,\n \"y\": 59\n },\n \"maxPerRow\": 4,\n \"name\": \"延迟插入次数\",\n \"options\": {\n \"legend\": {\n \"behaviour\": \"showItem\",\n \"displayMode\": \"hidden\"\n },\n \"standardOptions\": {},\n \"thresholds\": {\n \"steps\": [\n {\n \"color\": \"#634CD9\",\n \"type\": \"base\",\n \"value\": null\n }\n ]\n },\n \"tooltip\": {\n \"mode\": \"all\",\n \"sort\": \"none\"\n }\n },\n \"overrides\": [\n {\n \"matcher\": {\n \"id\": \"byFrameRefID\"\n },\n \"properties\": {\n \"rightYAxisDisplay\": \"off\"\n }\n }\n ],\n \"targets\": [\n {\n \"expr\": \"max_over_time(irate(clickhouse_metrics_delayed_inserts[2m]) [1h:1m]) * $peeks\",\n \"legend\": \"peaks - {{instance}}\",\n \"maxDataPoints\": 240,\n \"refId\": \"A\"\n },\n {\n \"__mode__\": \"__query__\",\n \"expr\": \"rate(clickhouse_metrics_delayed_inserts[1m]) * $trends\",\n \"legend\": \"trend - {{instance}}\",\n \"maxDataPoints\": 240,\n \"refId\": \"B\"\n }\n ],\n \"transformations\": [\n {\n \"id\": \"organize\",\n \"options\": {}\n }\n ],\n \"type\": \"timeseries\",\n \"version\": \"3.0.0\"\n }\n ],\n \"type\": \"row\"\n },\n {\n \"collapsed\": false,\n \"id\": \"681645ab-ef95-4875-9f97-2bf3d0981bf9\",\n \"layout\": {\n \"h\": 1,\n \"i\": \"681645ab-ef95-4875-9f97-2bf3d0981bf9\",\n \"isResizable\": false,\n \"w\": 24,\n \"x\": 0,\n \"y\": 83\n },\n \"name\": \"Select\",\n \"panels\": [\n {\n \"custom\": {\n \"drawStyle\": \"lines\",\n \"fillOpacity\": 0,\n \"gradientMode\": \"none\",\n \"lineInterpolation\": \"smooth\",\n \"lineWidth\": 1,\n \"scaleDistribution\": {\n \"type\": \"linear\"\n },\n \"spanNulls\": false,\n \"stack\": \"off\"\n },\n \"datasourceCate\": \"prometheus\",\n \"datasourceValue\": 1,\n \"description\": \"从所有表SELECT的字节数(未压缩列以它们在内存中存储的形式)\",\n \"id\": \"244865f5-c78a-4b21-8068-462612b8730c\",\n \"layout\": {\n \"h\": 10,\n \"i\": \"628a3845-fc7d-400c-b16c-6181faddd7b9\",\n \"isResizable\": true,\n \"w\": 11,\n \"x\": 0,\n \"y\": 84\n },\n \"maxPerRow\": 4,\n \"name\": \"SELECT查询的字节数\",\n \"options\": {\n \"legend\": {\n \"behaviour\": \"showItem\",\n \"displayMode\": \"hidden\"\n },\n \"standardOptions\": {},\n \"thresholds\": {\n \"steps\": [\n {\n \"color\": \"#634CD9\",\n \"type\": \"base\",\n \"value\": null\n }\n ]\n },\n \"tooltip\": {\n \"mode\": \"all\",\n \"sort\": \"none\"\n }\n },\n \"overrides\": [\n {\n \"matcher\": {\n \"id\": \"byFrameRefID\"\n },\n \"properties\": {\n \"rightYAxisDisplay\": \"off\"\n }\n }\n ],\n \"targets\": [\n {\n \"expr\": \"max_over_time(irate(clickhouse_events_selected_bytes[2m]) [1h:1m]) * $peeks\\n\\n\",\n \"legend\": \"peaks - {{instance}}\",\n \"maxDataPoints\": 240,\n \"refId\": \"A\"\n },\n {\n \"__mode__\": \"__query__\",\n \"expr\": \"rate(clickhouse_events_selected_bytes[1m]) * $trends\",\n \"legend\": \"trend - {{instance}}\",\n \"maxDataPoints\": 240,\n \"refId\": \"B\"\n }\n ],\n \"transformations\": [\n {\n \"id\": \"organize\",\n \"options\": {}\n }\n ],\n \"type\": \"timeseries\",\n \"version\": \"3.0.0\"\n },\n {\n \"custom\": {\n \"drawStyle\": \"lines\",\n \"fillOpacity\": 0,\n \"gradientMode\": \"none\",\n \"lineInterpolation\": \"smooth\",\n \"lineWidth\": 1,\n \"scaleDistribution\": {\n \"type\": \"linear\"\n },\n \"spanNulls\": false,\n \"stack\": \"off\"\n },\n \"datasourceCate\": \"prometheus\",\n \"datasourceValue\": 1,\n \"description\": \"从所有表SELECT的行数\",\n \"id\": \"a7e4857b-cf88-4ed7-8cf6-adadeb521e78\",\n \"layout\": {\n \"h\": 10,\n \"i\": \"2b63803d-ef02-49bc-aba9-41ac7e85bb9d\",\n \"isResizable\": true,\n \"w\": 11,\n \"x\": 11,\n \"y\": 84\n },\n \"maxPerRow\": 4,\n \"name\": \"SELECT查询的行数\",\n \"options\": {\n \"legend\": {\n \"behaviour\": \"showItem\",\n \"displayMode\": \"hidden\"\n },\n \"standardOptions\": {},\n \"thresholds\": {\n \"steps\": [\n {\n \"color\": \"#634CD9\",\n \"type\": \"base\",\n \"value\": null\n }\n ]\n },\n \"tooltip\": {\n \"mode\": \"all\",\n \"sort\": \"none\"\n }\n },\n \"overrides\": [\n {\n \"matcher\": {\n \"id\": \"byFrameRefID\"\n },\n \"properties\": {\n \"rightYAxisDisplay\": \"off\"\n }\n }\n ],\n \"targets\": [\n {\n \"expr\": \"max_over_time(irate(clickhouse_events_selected_rows[2m]) [1h:1m]) * $peeks\",\n \"legend\": \"peaks - {{instance}}\",\n \"maxDataPoints\": 240,\n \"refId\": \"A\"\n },\n {\n \"__mode__\": \"__query__\",\n \"expr\": \"rate(clickhouse_events_selected_rows[1m]) * $trends\",\n \"legend\": \"trend - {{instance}}\",\n \"maxDataPoints\": 240,\n \"refId\": \"B\"\n }\n ],\n \"transformations\": [\n {\n \"id\": \"organize\",\n \"options\": {}\n }\n ],\n \"type\": \"timeseries\",\n \"version\": \"3.0.0\"\n }\n ],\n \"type\": \"row\"\n },\n {\n \"collapsed\": false,\n \"id\": \"1d95c7da-85e1-4a6b-a6a9-68eb19ca821e\",\n \"layout\": {\n \"h\": 1,\n \"i\": \"1d95c7da-85e1-4a6b-a6a9-68eb19ca821e\",\n \"isResizable\": false,\n \"w\": 24,\n \"x\": 0,\n \"y\": 104\n },\n \"name\": \"IO\",\n \"panels\": [\n {\n \"custom\": {\n \"drawStyle\": \"lines\",\n \"fillOpacity\": 0,\n \"gradientMode\": \"none\",\n \"lineInterpolation\": \"smooth\",\n \"lineWidth\": 1,\n \"scaleDistribution\": {\n \"type\": \"linear\"\n },\n \"spanNulls\": false,\n \"stack\": \"off\"\n },\n \"datasourceCate\": \"prometheus\",\n \"datasourceValue\": 1,\n \"description\": \"\",\n \"id\": \"6be5bfc5-8d91-414f-9781-e4b390307961\",\n \"layout\": {\n \"h\": 8,\n \"i\": \"6be5bfc5-8d91-414f-9781-e4b390307961\",\n \"isResizable\": true,\n \"w\": 11,\n \"x\": 0,\n \"y\": 5\n },\n \"maxPerRow\": 4,\n \"name\": \"iseek函数调用次数\",\n \"options\": {\n \"legend\": {\n \"behaviour\": \"showItem\",\n \"displayMode\": \"hidden\"\n },\n \"standardOptions\": {},\n \"thresholds\": {\n \"steps\": [\n {\n \"color\": \"#634CD9\",\n \"type\": \"base\",\n \"value\": null\n }\n ]\n },\n \"tooltip\": {\n \"mode\": \"all\",\n \"sort\": \"none\"\n }\n },\n \"overrides\": [\n {\n \"matcher\": {\n \"id\": \"byFrameRefID\"\n },\n \"properties\": {\n \"rightYAxisDisplay\": \"off\"\n }\n }\n ],\n \"targets\": [\n {\n \"expr\": \"max_over_time(irate(clickhouse_events_seek[2m]) [1h:1m]) * $peeks\",\n \"legend\": \"peaks - {{instance}}\",\n \"maxDataPoints\": 240,\n \"refId\": \"A\"\n },\n {\n \"__mode__\": \"__query__\",\n \"expr\": \"rate(clickhouse_events_seek[1m]) * $trends\",\n \"legend\": \"trend - {{instance}}\",\n \"maxDataPoints\": 240,\n \"refId\": \"B\"\n }\n ],\n \"transformations\": [\n {\n \"id\": \"organize\",\n \"options\": {}\n }\n ],\n \"type\": \"timeseries\",\n \"version\": \"3.0.0\"\n },\n {\n \"custom\": {\n \"drawStyle\": \"lines\",\n \"fillOpacity\": 0,\n \"gradientMode\": \"none\",\n \"lineInterpolation\": \"smooth\",\n \"lineWidth\": 1,\n \"scaleDistribution\": {\n \"type\": \"linear\"\n },\n \"spanNulls\": false,\n \"stack\": \"off\"\n },\n \"datasourceCate\": \"prometheus\",\n \"datasourceValue\": 1,\n \"description\": \"\",\n \"id\": \"df47ce32-e3b6-4d5b-8bc9-4a640ec9c75c\",\n \"layout\": {\n \"h\": 8,\n \"i\": \"4b6a7bf4-e91a-41fb-b2a1-61d79805f2c5\",\n \"isResizable\": true,\n \"w\": 11,\n \"x\": 11,\n \"y\": 5\n },\n \"maxPerRow\": 4,\n \"name\": \"打开的文件数\",\n \"options\": {\n \"legend\": {\n \"behaviour\": \"showItem\",\n \"displayMode\": \"hidden\"\n },\n \"standardOptions\": {},\n \"thresholds\": {\n \"steps\": [\n {\n \"color\": \"#634CD9\",\n \"type\": \"base\",\n \"value\": null\n }\n ]\n },\n \"tooltip\": {\n \"mode\": \"all\",\n \"sort\": \"none\"\n }\n },\n \"overrides\": [\n {\n \"matcher\": {\n \"id\": \"byFrameRefID\"\n },\n \"properties\": {\n \"rightYAxisDisplay\": \"off\"\n }\n }\n ],\n \"targets\": [\n {\n \"expr\": \"max_over_time(irate(clickhouse_events_file_open[2m]) [1h:1m]) * $peeks\",\n \"legend\": \"peaks - {{instance}}\",\n \"maxDataPoints\": 240,\n \"refId\": \"A\"\n },\n {\n \"__mode__\": \"__query__\",\n \"expr\": \"rate(clickhouse_events_file_open[1m]) * $trends\",\n \"legend\": \"trend - {{instance}}\",\n \"maxDataPoints\": 240,\n \"refId\": \"B\"\n }\n ],\n \"transformations\": [\n {\n \"id\": \"organize\",\n \"options\": {}\n }\n ],\n \"type\": \"timeseries\",\n \"version\": \"3.0.0\"\n },\n {\n \"custom\": {\n \"drawStyle\": \"lines\",\n \"fillOpacity\": 0,\n \"gradientMode\": \"none\",\n \"lineInterpolation\": \"smooth\",\n \"lineWidth\": 1,\n \"scaleDistribution\": {\n \"type\": \"linear\"\n },\n \"spanNulls\": false,\n \"stack\": \"off\"\n },\n \"datasourceCate\": \"prometheus\",\n \"datasourceValue\": 1,\n \"description\": \"从文件描述符进行读取(read/pread)的次数,不包括套接字\",\n \"id\": \"26318204-5e2c-43dd-93b1-2d0ff34c3c9b\",\n \"layout\": {\n \"h\": 8,\n \"i\": \"e4f66145-d9c6-48df-a9f5-a98ec26cf1e2\",\n \"isResizable\": true,\n \"w\": 11,\n \"x\": 0,\n \"y\": 13\n },\n \"maxPerRow\": 4,\n \"name\": \"从FD文件描述符读取次数\",\n \"options\": {\n \"legend\": {\n \"behaviour\": \"showItem\",\n \"displayMode\": \"hidden\"\n },\n \"standardOptions\": {},\n \"thresholds\": {\n \"steps\": [\n {\n \"color\": \"#634CD9\",\n \"type\": \"base\",\n \"value\": null\n }\n ]\n },\n \"tooltip\": {\n \"mode\": \"all\",\n \"sort\": \"none\"\n }\n },\n \"overrides\": [\n {\n \"matcher\": {\n \"id\": \"byFrameRefID\"\n },\n \"properties\": {\n \"rightYAxisDisplay\": \"off\"\n }\n }\n ],\n \"targets\": [\n {\n \"expr\": \"max_over_time(irate(clickhouse_events_read_buffer_from_file_descriptor_read[2m]) [1h:1m]) * $peeks\",\n \"legend\": \"peaks - {{instance}}\",\n \"maxDataPoints\": 240,\n \"refId\": \"A\"\n },\n {\n \"__mode__\": \"__query__\",\n \"expr\": \"rate(clickhouse_events_read_buffer_from_file_descriptor_read[1m]) * $trends\",\n \"legend\": \"trend - {{instance}}\",\n \"maxDataPoints\": 240,\n \"refId\": \"B\"\n }\n ],\n \"transformations\": [\n {\n \"id\": \"organize\",\n \"options\": {}\n }\n ],\n \"type\": \"timeseries\",\n \"version\": \"3.0.0\"\n },\n {\n \"custom\": {\n \"drawStyle\": \"lines\",\n \"fillOpacity\": 0,\n \"gradientMode\": \"none\",\n \"lineInterpolation\": \"smooth\",\n \"lineWidth\": 1,\n \"scaleDistribution\": {\n \"type\": \"linear\"\n },\n \"spanNulls\": false,\n \"stack\": \"off\"\n },\n \"datasourceCate\": \"prometheus\",\n \"datasourceValue\": 1,\n \"description\": \"向FD写入的次数,不包括套接字\",\n \"id\": \"222a5968-672b-4f4f-ba1a-c823c4be1116\",\n \"layout\": {\n \"h\": 8,\n \"i\": \"3a378a00-6b9f-4098-8a2d-ed32628cc182\",\n \"isResizable\": true,\n \"w\": 11,\n \"x\": 11,\n \"y\": 13\n },\n \"maxPerRow\": 4,\n \"name\": \"向FD写入的次数\",\n \"options\": {\n \"legend\": {\n \"behaviour\": \"showItem\",\n \"displayMode\": \"hidden\"\n },\n \"standardOptions\": {},\n \"thresholds\": {\n \"steps\": [\n {\n \"color\": \"#634CD9\",\n \"type\": \"base\",\n \"value\": null\n }\n ]\n },\n \"tooltip\": {\n \"mode\": \"all\",\n \"sort\": \"none\"\n }\n },\n \"overrides\": [\n {\n \"matcher\": {\n \"id\": \"byFrameRefID\"\n },\n \"properties\": {\n \"rightYAxisDisplay\": \"off\"\n }\n }\n ],\n \"targets\": [\n {\n \"expr\": \"max_over_time(irate(clickhouse_events_write_buffer_from_file_descriptor_write[2m]) [1h:1m]) * $peeks\",\n \"legend\": \"peaks - {{instance}}\",\n \"maxDataPoints\": 240,\n \"refId\": \"A\"\n },\n {\n \"__mode__\": \"__query__\",\n \"expr\": \"rate(clickhouse_events_write_buffer_from_file_descriptor_write[1m]) * $trends\",\n \"legend\": \"trend - {{instance}}\",\n \"maxDataPoints\": 240,\n \"refId\": \"B\"\n }\n ],\n \"transformations\": [\n {\n \"id\": \"organize\",\n \"options\": {}\n }\n ],\n \"type\": \"timeseries\",\n \"version\": \"3.0.0\"\n },\n {\n \"custom\": {\n \"drawStyle\": \"lines\",\n \"fillOpacity\": 0,\n \"gradientMode\": \"none\",\n \"lineInterpolation\": \"smooth\",\n \"lineWidth\": 1,\n \"scaleDistribution\": {\n \"type\": \"linear\"\n },\n \"spanNulls\": false,\n \"stack\": \"off\"\n },\n \"datasourceCate\": \"prometheus\",\n \"datasourceValue\": 1,\n \"description\": \"\",\n \"id\": \"fc2a63e9-aec2-4755-b4a2-8b0f54868bc6\",\n \"layout\": {\n \"h\": 8,\n \"i\": \"7b9965c5-b341-4713-88f1-e5a48183ef94\",\n \"isResizable\": true,\n \"w\": 11,\n \"x\": 0,\n \"y\": 21\n },\n \"maxPerRow\": 4,\n \"name\": \"向FD写入的字节数\",\n \"options\": {\n \"legend\": {\n \"behaviour\": \"showItem\",\n \"displayMode\": \"hidden\"\n },\n \"standardOptions\": {},\n \"thresholds\": {\n \"steps\": [\n {\n \"color\": \"#634CD9\",\n \"type\": \"base\",\n \"value\": null\n }\n ]\n },\n \"tooltip\": {\n \"mode\": \"all\",\n \"sort\": \"none\"\n }\n },\n \"overrides\": [\n {\n \"matcher\": {\n \"id\": \"byFrameRefID\"\n },\n \"properties\": {\n \"rightYAxisDisplay\": \"off\"\n }\n }\n ],\n \"targets\": [\n {\n \"expr\": \"max_over_time(irate(clickhouse_events_write_buffer_from_file_descriptor_write_bytes[2m]) [1h:1m]) * $peeks\\n\\n\",\n \"legend\": \"peaks - {{instance}}\",\n \"maxDataPoints\": 240,\n \"refId\": \"A\"\n },\n {\n \"__mode__\": \"__query__\",\n \"expr\": \"rate(clickhouse_events_write_buffer_from_file_descriptor_write_bytes[2m]) * $trends\",\n \"legend\": \"trend - {{instance}}\",\n \"maxDataPoints\": 240,\n \"refId\": \"B\"\n }\n ],\n \"transformations\": [\n {\n \"id\": \"organize\",\n \"options\": {}\n }\n ],\n \"type\": \"timeseries\",\n \"version\": \"3.0.0\"\n },\n {\n \"custom\": {\n \"drawStyle\": \"lines\",\n \"fillOpacity\": 0,\n \"gradientMode\": \"none\",\n \"lineInterpolation\": \"smooth\",\n \"lineWidth\": 1,\n \"scaleDistribution\": {\n \"type\": \"linear\"\n },\n \"spanNulls\": false,\n \"stack\": \"off\"\n },\n \"datasourceCate\": \"prometheus\",\n \"datasourceValue\": 1,\n \"description\": \"从文件描述符读取的字节数。如果文件是压缩的,这将显示压缩后的数据大小\",\n \"id\": \"b5546ead-ef3d-406c-acfc-33759f9d5ad9\",\n \"layout\": {\n \"h\": 8,\n \"i\": \"7e16e52b-7c39-409b-b2f0-1e9f1feaa451\",\n \"isResizable\": true,\n \"w\": 11,\n \"x\": 11,\n \"y\": 21\n },\n \"maxPerRow\": 4,\n \"name\": \"从FD读取的字节数\",\n \"options\": {\n \"legend\": {\n \"behaviour\": \"showItem\",\n \"displayMode\": \"hidden\"\n },\n \"standardOptions\": {},\n \"thresholds\": {\n \"steps\": [\n {\n \"color\": \"#634CD9\",\n \"type\": \"base\",\n \"value\": null\n }\n ]\n },\n \"tooltip\": {\n \"mode\": \"all\",\n \"sort\": \"none\"\n }\n },\n \"overrides\": [\n {\n \"matcher\": {\n \"id\": \"byFrameRefID\"\n },\n \"properties\": {\n \"rightYAxisDisplay\": \"off\"\n }\n }\n ],\n \"targets\": [\n {\n \"expr\": \"irate(clickhouse_events_read_buffer_from_file_descriptor_read_bytes[2m]) * $trends\",\n \"legend\": \"peaks - {{instance}}\",\n \"maxDataPoints\": 240,\n \"refId\": \"A\"\n },\n {\n \"__mode__\": \"__query__\",\n \"expr\": \"rate(clickhouse_events_read_buffer_from_file_descriptor_read_bytes[2m]) * $trends\",\n \"legend\": \"trend - {{instance}}\",\n \"maxDataPoints\": 240,\n \"refId\": \"B\"\n }\n ],\n \"transformations\": [\n {\n \"id\": \"organize\",\n \"options\": {}\n }\n ],\n \"type\": \"timeseries\",\n \"version\": \"3.0.0\"\n },\n {\n \"custom\": {\n \"drawStyle\": \"lines\",\n \"fillOpacity\": 0,\n \"gradientMode\": \"none\",\n \"lineInterpolation\": \"smooth\",\n \"lineWidth\": 1,\n \"scaleDistribution\": {\n \"type\": \"linear\"\n },\n \"spanNulls\": false,\n \"stack\": \"off\"\n },\n \"datasourceCate\": \"prometheus\",\n \"datasourceValue\": 1,\n \"description\": \"从压缩源(文件,网络)读取的压缩块数(独立压缩的数据块)\",\n \"id\": \"dc75e7de-7728-4f12-91fc-789cdc2610dd\",\n \"layout\": {\n \"h\": 9,\n \"i\": \"ccfe64c6-a0b2-4179-abce-49a772d43a94\",\n \"isResizable\": true,\n \"w\": 11,\n \"x\": 0,\n \"y\": 29\n },\n \"maxPerRow\": 4,\n \"name\": \"读取的压缩块数\",\n \"options\": {\n \"legend\": {\n \"behaviour\": \"showItem\",\n \"displayMode\": \"hidden\"\n },\n \"standardOptions\": {},\n \"thresholds\": {\n \"steps\": [\n {\n \"color\": \"#634CD9\",\n \"type\": \"base\",\n \"value\": null\n }\n ]\n },\n \"tooltip\": {\n \"mode\": \"all\",\n \"sort\": \"none\"\n }\n },\n \"overrides\": [\n {\n \"matcher\": {\n \"id\": \"byFrameRefID\"\n },\n \"properties\": {\n \"rightYAxisDisplay\": \"off\"\n }\n }\n ],\n \"targets\": [\n {\n \"expr\": \"max_over_time(irate(clickhouse_events_compressed_read_buffer_blocks[2m]) [1h:1m]) * $peeks\\n\\n\",\n \"legend\": \"peaks - {{instance}}\",\n \"maxDataPoints\": 240,\n \"refId\": \"A\"\n },\n {\n \"__mode__\": \"__query__\",\n \"expr\": \"rate(clickhouse_events_compressed_read_buffer_blocks[2m]) * $trends\",\n \"legend\": \"trend - {{instance}}\",\n \"maxDataPoints\": 240,\n \"refId\": \"B\"\n },\n {\n \"__mode__\": \"__query__\",\n \"expr\": \"clickhouse_events_compressed_read_buffer_blocks\",\n \"maxDataPoints\": 240,\n \"refId\": \"C\"\n }\n ],\n \"transformations\": [\n {\n \"id\": \"organize\",\n \"options\": {}\n }\n ],\n \"type\": \"timeseries\",\n \"version\": \"3.0.0\"\n },\n {\n \"custom\": {\n \"drawStyle\": \"lines\",\n \"fillOpacity\": 0,\n \"gradientMode\": \"none\",\n \"lineInterpolation\": \"smooth\",\n \"lineWidth\": 1,\n \"scaleDistribution\": {\n \"type\": \"linear\"\n },\n \"spanNulls\": false,\n \"stack\": \"off\"\n },\n \"datasourceCate\": \"prometheus\",\n \"datasourceValue\": 1,\n \"description\": \"从压缩源(文件,网络)读取的未压缩字节数(解压后的字节数)\",\n \"id\": \"44c6e097-4114-4ef5-89d3-96da2c11ccf3\",\n \"layout\": {\n \"h\": 9,\n \"i\": \"f3dfd2fc-a656-4ef0-a326-1977908ffd90\",\n \"isResizable\": true,\n \"w\": 11,\n \"x\": 11,\n \"y\": 29\n },\n \"maxPerRow\": 4,\n \"name\": \"读取的未压缩字节数\",\n \"options\": {\n \"legend\": {\n \"behaviour\": \"showItem\",\n \"displayMode\": \"hidden\"\n },\n \"standardOptions\": {},\n \"thresholds\": {\n \"steps\": [\n {\n \"color\": \"#634CD9\",\n \"type\": \"base\",\n \"value\": null\n }\n ]\n },\n \"tooltip\": {\n \"mode\": \"all\",\n \"sort\": \"none\"\n }\n },\n \"overrides\": [\n {\n \"matcher\": {\n \"id\": \"byFrameRefID\"\n },\n \"properties\": {\n \"rightYAxisDisplay\": \"off\"\n }\n }\n ],\n \"targets\": [\n {\n \"expr\": \"max_over_time(irate(clickhouse_events_compressed_read_buffer_bytes[2m]) [1h:1m]) * $peeks\",\n \"legend\": \"peaks - {{instance}}\",\n \"maxDataPoints\": 240,\n \"refId\": \"A\"\n },\n {\n \"__mode__\": \"__query__\",\n \"expr\": \"rate(clickhouse_events_compressed_read_buffer_bytes[2m]) * $trends\",\n \"legend\": \"trend - {{instance}}\",\n \"maxDataPoints\": 240,\n \"refId\": \"B\"\n }\n ],\n \"transformations\": [\n {\n \"id\": \"organize\",\n \"options\": {}\n }\n ],\n \"type\": \"timeseries\",\n \"version\": \"3.0.0\"\n }\n ],\n \"type\": \"row\"\n },\n {\n \"collapsed\": false,\n \"id\": \"f358d0ce-ab09-4f5d-8477-c6c47341f185\",\n \"layout\": {\n \"h\": 1,\n \"i\": \"f358d0ce-ab09-4f5d-8477-c6c47341f185\",\n \"isResizable\": false,\n \"w\": 24,\n \"x\": 0,\n \"y\": 138\n },\n \"name\": \"Replicas\\n\",\n \"panels\": [\n {\n \"custom\": {\n \"drawStyle\": \"lines\",\n \"fillOpacity\": 0,\n \"gradientMode\": \"none\",\n \"lineInterpolation\": \"smooth\",\n \"lineWidth\": 1,\n \"scaleDistribution\": {\n \"type\": \"linear\"\n },\n \"spanNulls\": false,\n \"stack\": \"off\"\n },\n \"datasourceCate\": \"prometheus\",\n \"datasourceValue\": 1,\n \"description\": \"在ClickHouse集群中,由于特定情况而暂时处于只读状态的复制表数量。这种情况通常发生在以下两种情形下:\\n\\nZooKeeper会话丢失后重新初始化:ClickHouse使用ZooKeeper来维护集群间的协调和一致性。如果与ZooKeeper的会话丢失,为了防止数据不一致,相关的复制表可能会被自动设置为只读模式,直到与ZooKeeper的连接恢复并且数据同步完成为止。\\n\\n未配置ZooKeeper启动:如果ClickHouse实例在没有正确配置ZooKeeper的情况下启动,它可能无法确定其在复制集群中的准确状态,从而为了安全起见,将涉及复制的表设置为只读,以避免潜在的数据冲突或不一致性问题。\",\n \"id\": \"24f224bb-3f8c-4dae-9485-d2015e238ba4\",\n \"layout\": {\n \"h\": 10,\n \"i\": \"24f224bb-3f8c-4dae-9485-d2015e238ba4\",\n \"isResizable\": true,\n \"w\": 15,\n \"x\": 0,\n \"y\": 6\n },\n \"maxPerRow\": 4,\n \"name\": \"只读状态的复制表数量\",\n \"options\": {\n \"legend\": {\n \"behaviour\": \"showItem\",\n \"displayMode\": \"hidden\"\n },\n \"standardOptions\": {},\n \"thresholds\": {\n \"steps\": [\n {\n \"color\": \"#634CD9\",\n \"type\": \"base\",\n \"value\": null\n }\n ]\n },\n \"tooltip\": {\n \"mode\": \"all\",\n \"sort\": \"none\"\n }\n },\n \"overrides\": [\n {\n \"matcher\": {\n \"id\": \"byFrameRefID\"\n },\n \"properties\": {\n \"rightYAxisDisplay\": \"off\"\n }\n }\n ],\n \"targets\": [\n {\n \"expr\": \"clickhouse_metrics_readonly_replica\",\n \"legend\": \"{{instance}}\",\n \"maxDataPoints\": 240,\n \"refId\": \"A\"\n }\n ],\n \"transformations\": [\n {\n \"id\": \"organize\",\n \"options\": {}\n }\n ],\n \"type\": \"timeseries\",\n \"version\": \"3.0.0\"\n }\n ],\n \"type\": \"row\"\n },\n {\n \"collapsed\": false,\n \"id\": \"9bdb151e-adfb-4985-ad38-50f83a4b13e1\",\n \"layout\": {\n \"h\": 1,\n \"i\": \"9bdb151e-adfb-4985-ad38-50f83a4b13e1\",\n \"isResizable\": false,\n \"w\": 24,\n \"x\": 0,\n \"y\": 149\n },\n \"name\": \"Merge\",\n \"panels\": [\n {\n \"custom\": {\n \"drawStyle\": \"lines\",\n \"fillOpacity\": 0,\n \"gradientMode\": \"none\",\n \"lineInterpolation\": \"smooth\",\n \"lineWidth\": 1,\n \"scaleDistribution\": {\n \"type\": \"linear\"\n },\n \"spanNulls\": false,\n \"stack\": \"off\"\n },\n \"datasourceCate\": \"prometheus\",\n \"datasourceValue\": 1,\n \"description\": \"启动的后台合并次数\",\n \"id\": \"505ab54d-1897-45d6-a087-db2c2570f8f7\",\n \"layout\": {\n \"h\": 8,\n \"i\": \"505ab54d-1897-45d6-a087-db2c2570f8f7\",\n \"isResizable\": true,\n \"w\": 12,\n \"x\": 0,\n \"y\": 150\n },\n \"maxPerRow\": 4,\n \"name\": \"后台合并次数\",\n \"options\": {\n \"legend\": {\n \"behaviour\": \"showItem\",\n \"displayMode\": \"hidden\"\n },\n \"standardOptions\": {},\n \"thresholds\": {\n \"steps\": [\n {\n \"color\": \"#634CD9\",\n \"type\": \"base\",\n \"value\": null\n }\n ]\n },\n \"tooltip\": {\n \"mode\": \"all\",\n \"sort\": \"none\"\n }\n },\n \"overrides\": [\n {\n \"matcher\": {\n \"id\": \"byFrameRefID\"\n },\n \"properties\": {\n \"rightYAxisDisplay\": \"off\"\n }\n }\n ],\n \"targets\": [\n {\n \"expr\": \"max_over_time(irate(clickhouse_events_merge[2m]) [1h:1m]) * $peeks\\n\\n\",\n \"legend\": \"peaks - {{instance}}\",\n \"maxDataPoints\": 240,\n \"refId\": \"A\"\n },\n {\n \"__mode__\": \"__query__\",\n \"expr\": \"rate(clickhouse_events_merge[2m]) * $trends\",\n \"legend\": \"trend - {{instance}}\",\n \"maxDataPoints\": 240,\n \"refId\": \"B\"\n }\n ],\n \"transformations\": [\n {\n \"id\": \"organize\",\n \"options\": {}\n }\n ],\n \"type\": \"timeseries\",\n \"version\": \"3.0.0\"\n },\n {\n \"custom\": {\n \"drawStyle\": \"lines\",\n \"fillOpacity\": 0,\n \"gradientMode\": \"none\",\n \"lineInterpolation\": \"smooth\",\n \"lineWidth\": 1,\n \"scaleDistribution\": {\n \"type\": \"linear\"\n },\n \"spanNulls\": false,\n \"stack\": \"off\"\n },\n \"datasourceCate\": \"prometheus\",\n \"datasourceValue\": 1,\n \"description\": \"后台合并读取的行数。这是合并前的行数\",\n \"id\": \"cf1cbd45-4762-4b57-b674-91520ee63ff4\",\n \"layout\": {\n \"h\": 8,\n \"i\": \"019fba59-0df6-45d8-a7d0-3adbf32b44f5\",\n \"isResizable\": true,\n \"w\": 11,\n \"x\": 12,\n \"y\": 150\n },\n \"maxPerRow\": 4,\n \"name\": \"合并读取的行数\",\n \"options\": {\n \"legend\": {\n \"behaviour\": \"showItem\",\n \"displayMode\": \"hidden\"\n },\n \"standardOptions\": {},\n \"thresholds\": {\n \"steps\": [\n {\n \"color\": \"#634CD9\",\n \"type\": \"base\",\n \"value\": null\n }\n ]\n },\n \"tooltip\": {\n \"mode\": \"all\",\n \"sort\": \"none\"\n }\n },\n \"overrides\": [\n {\n \"matcher\": {\n \"id\": \"byFrameRefID\"\n },\n \"properties\": {\n \"rightYAxisDisplay\": \"off\"\n }\n }\n ],\n \"targets\": [\n {\n \"expr\": \"max_over_time(irate(clickhouse_events_merged_rows[2m]) [1h:1m]) * $peeks\\n\\n\",\n \"legend\": \"peaks - {{instance}}\",\n \"maxDataPoints\": 240,\n \"refId\": \"A\"\n },\n {\n \"__mode__\": \"__query__\",\n \"expr\": \"rate(clickhouse_events_merged_rows[2m]) * $trends\",\n \"legend\": \"trend - {{instance}}\",\n \"maxDataPoints\": 240,\n \"refId\": \"B\"\n }\n ],\n \"transformations\": [\n {\n \"id\": \"organize\",\n \"options\": {}\n }\n ],\n \"type\": \"timeseries\",\n \"version\": \"3.0.0\"\n },\n {\n \"custom\": {\n \"drawStyle\": \"lines\",\n \"fillOpacity\": 0,\n \"gradientMode\": \"none\",\n \"lineInterpolation\": \"smooth\",\n \"lineWidth\": 1,\n \"scaleDistribution\": {\n \"type\": \"linear\"\n },\n \"spanNulls\": false,\n \"stack\": \"off\"\n },\n \"datasourceCate\": \"prometheus\",\n \"datasourceValue\": 1,\n \"description\": \"后台合并读取的未压缩字节数(列以它们在内存中存储的形式)。这是合并前的字节数\",\n \"id\": \"bee87dc6-ace1-47c2-8676-3a7a4c33d2bd\",\n \"layout\": {\n \"h\": 9,\n \"i\": \"2a43db17-8490-4f9c-a165-a547b112c31b\",\n \"isResizable\": true,\n \"w\": 12,\n \"x\": 0,\n \"y\": 158\n },\n \"maxPerRow\": 4,\n \"name\": \"合并读取的未压缩字节数\",\n \"options\": {\n \"legend\": {\n \"behaviour\": \"showItem\",\n \"displayMode\": \"hidden\"\n },\n \"standardOptions\": {},\n \"thresholds\": {\n \"steps\": [\n {\n \"color\": \"#634CD9\",\n \"type\": \"base\",\n \"value\": null\n }\n ]\n },\n \"tooltip\": {\n \"mode\": \"all\",\n \"sort\": \"none\"\n }\n },\n \"overrides\": [\n {\n \"matcher\": {\n \"id\": \"byFrameRefID\"\n },\n \"properties\": {\n \"rightYAxisDisplay\": \"off\"\n }\n }\n ],\n \"targets\": [\n {\n \"expr\": \"max_over_time(irate(clickhouse_events_merged_uncompressed_bytes[2m]) [1h:1m]) * $peeks\\n\\n\",\n \"legend\": \"peaks - {{instance}}\",\n \"maxDataPoints\": 240,\n \"refId\": \"A\"\n },\n {\n \"__mode__\": \"__query__\",\n \"expr\": \"rate(clickhouse_events_merged_uncompressed_bytes[2m]) * $trends\",\n \"legend\": \"trend - {{instance}}\",\n \"maxDataPoints\": 240,\n \"refId\": \"B\"\n }\n ],\n \"transformations\": [\n {\n \"id\": \"organize\",\n \"options\": {}\n }\n ],\n \"type\": \"timeseries\",\n \"version\": \"3.0.0\"\n },\n {\n \"custom\": {\n \"drawStyle\": \"lines\",\n \"fillOpacity\": 0,\n \"gradientMode\": \"none\",\n \"lineInterpolation\": \"smooth\",\n \"lineWidth\": 1,\n \"scaleDistribution\": {\n \"type\": \"linear\"\n },\n \"spanNulls\": false,\n \"stack\": \"off\"\n },\n \"datasourceCate\": \"prometheus\",\n \"datasourceValue\": 1,\n \"description\": \"\",\n \"id\": \"63c16da6-f138-4f8f-9a36-a0f71454ba5d\",\n \"layout\": {\n \"h\": 9,\n \"i\": \"972b412f-af69-4709-858d-cdae2a1ab35f\",\n \"isResizable\": true,\n \"w\": 11,\n \"x\": 12,\n \"y\": 158\n },\n \"maxPerRow\": 4,\n \"name\": \"合并平均持续时间\",\n \"options\": {\n \"legend\": {\n \"behaviour\": \"showItem\",\n \"displayMode\": \"hidden\"\n },\n \"standardOptions\": {},\n \"thresholds\": {\n \"steps\": [\n {\n \"color\": \"#634CD9\",\n \"type\": \"base\",\n \"value\": null\n }\n ]\n },\n \"tooltip\": {\n \"mode\": \"all\",\n \"sort\": \"none\"\n }\n },\n \"overrides\": [\n {\n \"matcher\": {\n \"id\": \"byFrameRefID\"\n },\n \"properties\": {\n \"rightYAxisDisplay\": \"off\"\n }\n }\n ],\n \"targets\": [\n {\n \"expr\": \"increase(clickhouse_events_merges_time_milliseconds[2m]) / (increase(clickhouse_events_merges_time_milliseconds[2m]) + 0.001)\",\n \"legend\": \"{{instance}}\",\n \"maxDataPoints\": 240,\n \"refId\": \"A\"\n }\n ],\n \"transformations\": [\n {\n \"id\": \"organize\",\n \"options\": {}\n }\n ],\n \"type\": \"timeseries\",\n \"version\": \"3.0.0\"\n },\n {\n \"custom\": {\n \"drawStyle\": \"lines\",\n \"fillOpacity\": 0,\n \"gradientMode\": \"none\",\n \"lineInterpolation\": \"smooth\",\n \"lineWidth\": 1,\n \"scaleDistribution\": {\n \"type\": \"linear\"\n },\n \"spanNulls\": false,\n \"stack\": \"off\"\n },\n \"datasourceCate\": \"prometheus\",\n \"datasourceValue\": 1,\n \"description\": \"\",\n \"id\": \"a01d3de2-a79d-49d9-b238-e5db403d8259\",\n \"layout\": {\n \"h\": 8,\n \"i\": \"8b2138af-31bb-4c88-b983-08eead1da3ba\",\n \"isResizable\": true,\n \"w\": 12,\n \"x\": 0,\n \"y\": 167\n },\n \"maxPerRow\": 4,\n \"name\": \"MergeTree表插入的行数\",\n \"options\": {\n \"legend\": {\n \"behaviour\": \"showItem\",\n \"displayMode\": \"hidden\"\n },\n \"standardOptions\": {},\n \"thresholds\": {\n \"steps\": [\n {\n \"color\": \"#634CD9\",\n \"type\": \"base\",\n \"value\": null\n }\n ]\n },\n \"tooltip\": {\n \"mode\": \"all\",\n \"sort\": \"none\"\n }\n },\n \"overrides\": [\n {\n \"matcher\": {\n \"id\": \"byFrameRefID\"\n },\n \"properties\": {\n \"rightYAxisDisplay\": \"off\"\n }\n }\n ],\n \"targets\": [\n {\n \"expr\": \"max_over_time(irate(clickhouse_events_merge_tree_data_writer_rows[2m]) [1h:1m]) * $peeks\",\n \"legend\": \"peaks - {{instance}}\",\n \"maxDataPoints\": 240,\n \"refId\": \"A\"\n },\n {\n \"__mode__\": \"__query__\",\n \"expr\": \"rate(clickhouse_events_merge_tree_data_writer_rows[2m]) * $trends\",\n \"legend\": \"trend - {{instance}}\",\n \"maxDataPoints\": 240,\n \"refId\": \"B\"\n }\n ],\n \"transformations\": [\n {\n \"id\": \"organize\",\n \"options\": {}\n }\n ],\n \"type\": \"timeseries\",\n \"version\": \"3.0.0\"\n },\n {\n \"custom\": {\n \"drawStyle\": \"lines\",\n \"fillOpacity\": 0,\n \"gradientMode\": \"none\",\n \"lineInterpolation\": \"smooth\",\n \"lineWidth\": 1,\n \"scaleDistribution\": {\n \"type\": \"linear\"\n },\n \"spanNulls\": false,\n \"stack\": \"off\"\n },\n \"datasourceCate\": \"prometheus\",\n \"datasourceValue\": 1,\n \"description\": \"向MergeTree系列表(包括ReplicatedMergeTree等变种)中插入数据时所用的数据块数量\",\n \"id\": \"87a118d2-305d-4eb9-921a-39bbf11b56b5\",\n \"layout\": {\n \"h\": 8,\n \"i\": \"ea833f12-d5fa-419f-9825-5fd105a709df\",\n \"isResizable\": true,\n \"w\": 11,\n \"x\": 12,\n \"y\": 167\n },\n \"maxPerRow\": 4,\n \"name\": \"MergeTree插入块数\",\n \"options\": {\n \"legend\": {\n \"behaviour\": \"showItem\",\n \"displayMode\": \"hidden\"\n },\n \"standardOptions\": {},\n \"thresholds\": {\n \"steps\": [\n {\n \"color\": \"#634CD9\",\n \"type\": \"base\",\n \"value\": null\n }\n ]\n },\n \"tooltip\": {\n \"mode\": \"all\",\n \"sort\": \"none\"\n }\n },\n \"overrides\": [\n {\n \"matcher\": {\n \"id\": \"byFrameRefID\"\n },\n \"properties\": {\n \"rightYAxisDisplay\": \"off\"\n }\n }\n ],\n \"targets\": [\n {\n \"expr\": \"max_over_time(irate(clickhouse_events_merge_tree_data_writer_blocks[2m]) [1h:1m]) * $peeks\",\n \"legend\": \"peaks - {{instance}}\",\n \"maxDataPoints\": 240,\n \"refId\": \"A\"\n },\n {\n \"__mode__\": \"__query__\",\n \"expr\": \"rate(clickhouse_events_merge_tree_data_writer_blocks[2m]) * $trends\",\n \"legend\": \"trend - {{instance}}\",\n \"maxDataPoints\": 240,\n \"refId\": \"B\"\n }\n ],\n \"transformations\": [\n {\n \"id\": \"organize\",\n \"options\": {}\n }\n ],\n \"type\": \"timeseries\",\n \"version\": \"3.0.0\"\n },\n {\n \"custom\": {\n \"drawStyle\": \"lines\",\n \"fillOpacity\": 0,\n \"gradientMode\": \"none\",\n \"lineInterpolation\": \"smooth\",\n \"lineWidth\": 1,\n \"scaleDistribution\": {\n \"type\": \"linear\"\n },\n \"spanNulls\": false,\n \"stack\": \"off\"\n },\n \"datasourceCate\": \"prometheus\",\n \"datasourceValue\": 1,\n \"description\": \"插入到MergeTree表的未压缩字节数(列以它们在内存中存储的形式)\",\n \"id\": \"3dca4a05-b0cc-4e63-ae32-ee5261b6b7b3\",\n \"layout\": {\n \"h\": 8,\n \"i\": \"84893385-fa2f-4016-b820-df600797b4a9\",\n \"isResizable\": true,\n \"w\": 12,\n \"x\": 0,\n \"y\": 175\n },\n \"maxPerRow\": 4,\n \"name\": \"MergeTree 表插入的未压缩字节数\",\n \"options\": {\n \"legend\": {\n \"behaviour\": \"showItem\",\n \"displayMode\": \"hidden\"\n },\n \"standardOptions\": {},\n \"thresholds\": {\n \"steps\": [\n {\n \"color\": \"#634CD9\",\n \"type\": \"base\",\n \"value\": null\n }\n ]\n },\n \"tooltip\": {\n \"mode\": \"all\",\n \"sort\": \"none\"\n }\n },\n \"overrides\": [\n {\n \"matcher\": {\n \"id\": \"byFrameRefID\"\n },\n \"properties\": {\n \"rightYAxisDisplay\": \"off\"\n }\n }\n ],\n \"targets\": [\n {\n \"expr\": \"max_over_time(irate(clickhouse_events_merge_tree_data_writer_uncompressed_bytes[2m]) [1h:1m]) * $peeks\\n\\n\",\n \"legend\": \"peaks - {{instance}}\",\n \"maxDataPoints\": 240,\n \"refId\": \"A\"\n },\n {\n \"__mode__\": \"__query__\",\n \"expr\": \"rate(clickhouse_events_merge_tree_data_writer_uncompressed_bytes[2m]) * $trends\",\n \"legend\": \"trend - {{instance}}\",\n \"maxDataPoints\": 240,\n \"refId\": \"B\"\n }\n ],\n \"transformations\": [\n {\n \"id\": \"organize\",\n \"options\": {}\n }\n ],\n \"type\": \"timeseries\",\n \"version\": \"3.0.0\"\n },\n {\n \"custom\": {\n \"drawStyle\": \"lines\",\n \"fillOpacity\": 0,\n \"gradientMode\": \"none\",\n \"lineInterpolation\": \"smooth\",\n \"lineWidth\": 1,\n \"scaleDistribution\": {\n \"type\": \"linear\"\n },\n \"spanNulls\": false,\n \"stack\": \"off\"\n },\n \"datasourceCate\": \"prometheus\",\n \"datasourceValue\": 1,\n \"description\": \"插入到MergeTree表的数据写入到文件系统的字节数\",\n \"id\": \"6777102c-5efe-4082-9a86-d58f76d751ba\",\n \"layout\": {\n \"h\": 8,\n \"i\": \"96a43967-afda-4c33-80f2-ce1237afeb35\",\n \"isResizable\": true,\n \"w\": 11,\n \"x\": 12,\n \"y\": 175\n },\n \"maxPerRow\": 4,\n \"name\": \"MergeTree 表写入的压缩字节数\",\n \"options\": {\n \"legend\": {\n \"behaviour\": \"showItem\",\n \"displayMode\": \"hidden\"\n },\n \"standardOptions\": {},\n \"thresholds\": {\n \"steps\": [\n {\n \"color\": \"#634CD9\",\n \"type\": \"base\",\n \"value\": null\n }\n ]\n },\n \"tooltip\": {\n \"mode\": \"all\",\n \"sort\": \"none\"\n }\n },\n \"overrides\": [\n {\n \"matcher\": {\n \"id\": \"byFrameRefID\"\n },\n \"properties\": {\n \"rightYAxisDisplay\": \"off\"\n }\n }\n ],\n \"targets\": [\n {\n \"expr\": \"max_over_time(irate(clickhouse_events_merge_tree_data_writer_compressed_bytes[2m]) [1h:1m]) * $peeks\\n\\n\",\n \"legend\": \"peaks - {{instance}}\",\n \"maxDataPoints\": 240,\n \"refId\": \"A\"\n },\n {\n \"__mode__\": \"__query__\",\n \"expr\": \"rate(clickhouse_events_merge_tree_data_writer_compressed_bytes[2m]) * $trends\",\n \"legend\": \"trend - {{instance}}\",\n \"maxDataPoints\": 240,\n \"refId\": \"B\"\n }\n ],\n \"transformations\": [\n {\n \"id\": \"organize\",\n \"options\": {}\n }\n ],\n \"type\": \"timeseries\",\n \"version\": \"3.0.0\"\n },\n {\n \"custom\": {\n \"drawStyle\": \"lines\",\n \"fillOpacity\": 0,\n \"gradientMode\": \"none\",\n \"lineInterpolation\": \"smooth\",\n \"lineWidth\": 1,\n \"scaleDistribution\": {\n \"type\": \"linear\"\n },\n \"spanNulls\": false,\n \"stack\": \"off\"\n },\n \"datasourceCate\": \"prometheus\",\n \"datasourceValue\": 1,\n \"description\": \"为当前运行的后台合并保留的磁盘空间。它略大于当前合并部分的总大小\",\n \"id\": \"2b70d3a1-f9e2-4b35-b181-809091fe0aa0\",\n \"layout\": {\n \"h\": 8,\n \"i\": \"8612a9c6-bdbd-4eea-837e-84bf93205446\",\n \"isResizable\": true,\n \"w\": 12,\n \"x\": 0,\n \"y\": 183\n },\n \"maxPerRow\": 4,\n \"name\": \"保留空间\",\n \"options\": {\n \"legend\": {\n \"behaviour\": \"showItem\",\n \"displayMode\": \"hidden\"\n },\n \"standardOptions\": {},\n \"thresholds\": {\n \"steps\": [\n {\n \"color\": \"#634CD9\",\n \"type\": \"base\",\n \"value\": null\n }\n ]\n },\n \"tooltip\": {\n \"mode\": \"all\",\n \"sort\": \"none\"\n }\n },\n \"overrides\": [\n {\n \"matcher\": {\n \"id\": \"byFrameRefID\"\n },\n \"properties\": {\n \"rightYAxisDisplay\": \"off\"\n }\n }\n ],\n \"targets\": [\n {\n \"expr\": \"clickhouse_metrics_disk_space_reserved_for_merge\",\n \"legend\": \"{{instance}}\",\n \"maxDataPoints\": 240,\n \"refId\": \"A\"\n }\n ],\n \"transformations\": [\n {\n \"id\": \"organize\",\n \"options\": {}\n }\n ],\n \"type\": \"timeseries\",\n \"version\": \"3.0.0\"\n }\n ],\n \"type\": \"row\"\n },\n {\n \"collapsed\": false,\n \"id\": \"13a904ce-b661-4abb-bce6-d3f91cd09a05\",\n \"layout\": {\n \"h\": 1,\n \"i\": \"13a904ce-b661-4abb-bce6-d3f91cd09a05\",\n \"isResizable\": false,\n \"w\": 24,\n \"x\": 0,\n \"y\": 232\n },\n \"name\": \"Cache\",\n \"panels\": [\n {\n \"custom\": {\n \"drawStyle\": \"lines\",\n \"fillOpacity\": 0,\n \"gradientMode\": \"none\",\n \"lineInterpolation\": \"smooth\",\n \"lineWidth\": 1,\n \"scaleDistribution\": {\n \"type\": \"linear\"\n },\n \"spanNulls\": false,\n \"stack\": \"off\"\n },\n \"datasourceCate\": \"prometheus\",\n \"datasourceValue\": 1,\n \"description\": \"从文件缓存中打开文件时没有命中缓存的次数\",\n \"id\": \"6423431d-916e-4a79-9db1-d0146e0c83fd\",\n \"layout\": {\n \"h\": 11,\n \"i\": \"443329a2-56bf-4632-8491-ca581b88b93b\",\n \"isResizable\": true,\n \"w\": 12,\n \"x\": 0,\n \"y\": 233\n },\n \"maxPerRow\": 4,\n \"name\": \"文件缓存未命中次数\",\n \"options\": {\n \"legend\": {\n \"behaviour\": \"showItem\",\n \"displayMode\": \"hidden\"\n },\n \"standardOptions\": {},\n \"thresholds\": {\n \"steps\": [\n {\n \"color\": \"#634CD9\",\n \"type\": \"base\",\n \"value\": null\n }\n ]\n },\n \"tooltip\": {\n \"mode\": \"all\",\n \"sort\": \"none\"\n }\n },\n \"overrides\": [\n {\n \"matcher\": {\n \"id\": \"byFrameRefID\"\n },\n \"properties\": {\n \"rightYAxisDisplay\": \"off\"\n }\n }\n ],\n \"targets\": [\n {\n \"expr\": \"rate(clickhouse_events_opened_file_cache_misses[2m]) * $trends\",\n \"legend\": \"peaks - {{instance}}\",\n \"maxDataPoints\": 240,\n \"refId\": \"A\"\n },\n {\n \"__mode__\": \"__query__\",\n \"expr\": \"rate(clickhouse_events_opened_file_cache_misses[2m]) * $trends\",\n \"legend\": \"trend - {{instance}}\",\n \"maxDataPoints\": 240,\n \"refId\": \"B\"\n }\n ],\n \"transformations\": [\n {\n \"id\": \"organize\",\n \"options\": {}\n }\n ],\n \"type\": \"timeseries\",\n \"version\": \"3.0.0\"\n }\n ],\n \"type\": \"row\"\n },\n {\n \"collapsed\": false,\n \"id\": \"b408fca8-4054-4ea6-a131-c3c76439d036\",\n \"layout\": {\n \"h\": 1,\n \"i\": \"b408fca8-4054-4ea6-a131-c3c76439d036\",\n \"isResizable\": false,\n \"w\": 24,\n \"x\": 0,\n \"y\": 255\n },\n \"name\": \"Parts\",\n \"panels\": [\n {\n \"custom\": {\n \"drawStyle\": \"lines\",\n \"fillOpacity\": 0,\n \"gradientMode\": \"none\",\n \"lineInterpolation\": \"smooth\",\n \"lineWidth\": 1,\n \"scaleDistribution\": {\n \"type\": \"linear\"\n },\n \"spanNulls\": false,\n \"stack\": \"off\"\n },\n \"datasourceCate\": \"prometheus\",\n \"datasourceValue\": 1,\n \"description\": \"目前正在生成的部分,不在数据部分列表中\",\n \"id\": \"3a06dade-4969-40bf-aab1-1a5f3950a75f\",\n \"layout\": {\n \"h\": 8,\n \"i\": \"3a06dade-4969-40bf-aab1-1a5f3950a75f\",\n \"isResizable\": true,\n \"w\": 12,\n \"x\": 0,\n \"y\": 256\n },\n \"maxPerRow\": 4,\n \"name\": \"临时部分数\",\n \"options\": {\n \"legend\": {\n \"behaviour\": \"showItem\",\n \"displayMode\": \"hidden\"\n },\n \"standardOptions\": {},\n \"thresholds\": {\n \"steps\": [\n {\n \"color\": \"#634CD9\",\n \"type\": \"base\",\n \"value\": null\n }\n ]\n },\n \"tooltip\": {\n \"mode\": \"all\",\n \"sort\": \"none\"\n }\n },\n \"overrides\": [\n {\n \"matcher\": {\n \"id\": \"byFrameRefID\"\n },\n \"properties\": {\n \"rightYAxisDisplay\": \"off\"\n }\n }\n ],\n \"targets\": [\n {\n \"__mode__\": \"__query__\",\n \"expr\": \"clickhouse_metrics_parts_temporary\",\n \"maxDataPoints\": 240,\n \"refId\": \"B\"\n }\n ],\n \"transformations\": [\n {\n \"id\": \"organize\",\n \"options\": {}\n }\n ],\n \"type\": \"timeseries\",\n \"version\": \"3.0.0\"\n },\n {\n \"custom\": {\n \"drawStyle\": \"lines\",\n \"fillOpacity\": 0,\n \"gradientMode\": \"none\",\n \"lineInterpolation\": \"smooth\",\n \"lineWidth\": 1,\n \"scaleDistribution\": {\n \"type\": \"linear\"\n },\n \"spanNulls\": false,\n \"stack\": \"off\"\n },\n \"datasourceCate\": \"prometheus\",\n \"datasourceValue\": 1,\n \"description\": \"在数据部分中,但不用于SELECT查询的部分\\t\\n\",\n \"id\": \"fd497233-3f93-4f73-9dc7-4045d1454eef\",\n \"layout\": {\n \"h\": 8,\n \"i\": \"cd29ec5b-f032-4464-a1b5-ed987e7d5cd3\",\n \"isResizable\": true,\n \"w\": 12,\n \"x\": 12,\n \"y\": 256\n },\n \"maxPerRow\": 4,\n \"name\": \"预提交部分数\",\n \"options\": {\n \"legend\": {\n \"behaviour\": \"showItem\",\n \"displayMode\": \"hidden\"\n },\n \"standardOptions\": {},\n \"thresholds\": {\n \"steps\": [\n {\n \"color\": \"#634CD9\",\n \"type\": \"base\",\n \"value\": null\n }\n ]\n },\n \"tooltip\": {\n \"mode\": \"all\",\n \"sort\": \"none\"\n }\n },\n \"overrides\": [\n {\n \"matcher\": {\n \"id\": \"byFrameRefID\"\n },\n \"properties\": {\n \"rightYAxisDisplay\": \"off\"\n }\n }\n ],\n \"targets\": [\n {\n \"__mode__\": \"__query__\",\n \"expr\": \"clickhouse_metrics_parts_pre_committed\",\n \"maxDataPoints\": 240,\n \"refId\": \"B\"\n }\n ],\n \"transformations\": [\n {\n \"id\": \"organize\",\n \"options\": {}\n }\n ],\n \"type\": \"timeseries\",\n \"version\": \"3.0.0\"\n },\n {\n \"custom\": {\n \"drawStyle\": \"lines\",\n \"fillOpacity\": 0,\n \"gradientMode\": \"none\",\n \"lineInterpolation\": \"smooth\",\n \"lineWidth\": 1,\n \"scaleDistribution\": {\n \"type\": \"linear\"\n },\n \"spanNulls\": false,\n \"stack\": \"off\"\n },\n \"datasourceCate\": \"prometheus\",\n \"datasourceValue\": 1,\n \"description\": \"已经提交的数据部分的数量\",\n \"id\": \"b688234f-b66a-440f-8a95-20e2a45df833\",\n \"layout\": {\n \"h\": 7,\n \"i\": \"d12a6546-3f67-4c25-90ed-16ec3d13ec94\",\n \"isResizable\": true,\n \"w\": 12,\n \"x\": 0,\n \"y\": 264\n },\n \"maxPerRow\": 4,\n \"name\": \"提交部分数\",\n \"options\": {\n \"legend\": {\n \"behaviour\": \"showItem\",\n \"displayMode\": \"hidden\"\n },\n \"standardOptions\": {},\n \"thresholds\": {\n \"steps\": [\n {\n \"color\": \"#634CD9\",\n \"type\": \"base\",\n \"value\": null\n }\n ]\n },\n \"tooltip\": {\n \"mode\": \"all\",\n \"sort\": \"none\"\n }\n },\n \"overrides\": [\n {\n \"matcher\": {\n \"id\": \"byFrameRefID\"\n },\n \"properties\": {\n \"rightYAxisDisplay\": \"off\"\n }\n }\n ],\n \"targets\": [\n {\n \"__mode__\": \"__query__\",\n \"expr\": \"clickhouse_metrics_parts_committed\",\n \"maxDataPoints\": 240,\n \"refId\": \"B\"\n }\n ],\n \"transformations\": [\n {\n \"id\": \"organize\",\n \"options\": {}\n }\n ],\n \"type\": \"timeseries\",\n \"version\": \"3.0.0\"\n },\n {\n \"custom\": {\n \"drawStyle\": \"lines\",\n \"fillOpacity\": 0,\n \"gradientMode\": \"none\",\n \"lineInterpolation\": \"smooth\",\n \"lineWidth\": 1,\n \"scaleDistribution\": {\n \"type\": \"linear\"\n },\n \"spanNulls\": false,\n \"stack\": \"off\"\n },\n \"datasourceCate\": \"prometheus\",\n \"datasourceValue\": 1,\n \"description\": \"暂时保留、等待相关查询结束即可清理的数据分区的数量。\",\n \"id\": \"85faac0b-b923-4f38-b10a-9a38b98f89ee\",\n \"layout\": {\n \"h\": 7,\n \"i\": \"ee8c8080-9a96-445e-a45a-164b735ae0fa\",\n \"isResizable\": true,\n \"w\": 12,\n \"x\": 12,\n \"y\": 264\n },\n \"maxPerRow\": 4,\n \"name\": \"过时分区\",\n \"options\": {\n \"legend\": {\n \"behaviour\": \"showItem\",\n \"displayMode\": \"hidden\"\n },\n \"standardOptions\": {},\n \"thresholds\": {\n \"steps\": [\n {\n \"color\": \"#634CD9\",\n \"type\": \"base\",\n \"value\": null\n }\n ]\n },\n \"tooltip\": {\n \"mode\": \"all\",\n \"sort\": \"none\"\n }\n },\n \"overrides\": [\n {\n \"matcher\": {\n \"id\": \"byFrameRefID\"\n },\n \"properties\": {\n \"rightYAxisDisplay\": \"off\"\n }\n }\n ],\n \"targets\": [\n {\n \"__mode__\": \"__query__\",\n \"expr\": \"clickhouse_metrics_parts_outdated\",\n \"maxDataPoints\": 240,\n \"refId\": \"B\"\n }\n ],\n \"transformations\": [\n {\n \"id\": \"organize\",\n \"options\": {}\n }\n ],\n \"type\": \"timeseries\",\n \"version\": \"3.0.0\"\n },\n {\n \"custom\": {\n \"drawStyle\": \"lines\",\n \"fillOpacity\": 0,\n \"gradientMode\": \"none\",\n \"lineInterpolation\": \"smooth\",\n \"lineWidth\": 1,\n \"scaleDistribution\": {\n \"type\": \"linear\"\n },\n \"spanNulls\": false,\n \"stack\": \"off\"\n },\n \"datasourceCate\": \"prometheus\",\n \"datasourceValue\": 1,\n \"description\": \"\",\n \"id\": \"1e45da14-63a6-4adb-be34-a83f9469af84\",\n \"layout\": {\n \"h\": 7,\n \"i\": \"fca8edbe-2eb2-45a0-8886-ba554aa98100\",\n \"isResizable\": true,\n \"w\": 12,\n \"x\": 0,\n \"y\": 271\n },\n \"maxPerRow\": 4,\n \"name\": \"正删除数据\",\n \"options\": {\n \"legend\": {\n \"behaviour\": \"showItem\",\n \"displayMode\": \"hidden\"\n },\n \"standardOptions\": {},\n \"thresholds\": {\n \"steps\": [\n {\n \"color\": \"#634CD9\",\n \"type\": \"base\",\n \"value\": null\n }\n ]\n },\n \"tooltip\": {\n \"mode\": \"all\",\n \"sort\": \"none\"\n }\n },\n \"overrides\": [\n {\n \"matcher\": {\n \"id\": \"byFrameRefID\"\n },\n \"properties\": {\n \"rightYAxisDisplay\": \"off\"\n }\n }\n ],\n \"targets\": [\n {\n \"__mode__\": \"__query__\",\n \"expr\": \"clickhouse_metrics_parts_deleting\",\n \"maxDataPoints\": 240,\n \"refId\": \"B\"\n }\n ],\n \"transformations\": [\n {\n \"id\": \"organize\",\n \"options\": {}\n }\n ],\n \"type\": \"timeseries\",\n \"version\": \"3.0.0\"\n },\n {\n \"custom\": {\n \"drawStyle\": \"lines\",\n \"fillOpacity\": 0,\n \"gradientMode\": \"none\",\n \"lineInterpolation\": \"smooth\",\n \"lineWidth\": 1,\n \"scaleDistribution\": {\n \"type\": \"linear\"\n },\n \"spanNulls\": false,\n \"stack\": \"off\"\n },\n \"datasourceCate\": \"prometheus\",\n \"datasourceValue\": 1,\n \"description\": \"记录了当前有多少个数据分区正处于这样一种待删除的状态——即这些分区已经被逻辑上标记为“待清理”,并且它们的物理删除操作将在资源被正式释放时由系统自动执行。\",\n \"id\": \"0fb33f4e-2392-4fb7-bbdb-486c8520e957\",\n \"layout\": {\n \"h\": 7,\n \"i\": \"c09e1b70-3d5c-4d1d-9bac-9c7d0957ff22\",\n \"isResizable\": true,\n \"w\": 12,\n \"x\": 12,\n \"y\": 271\n },\n \"maxPerRow\": 4,\n \"name\": \"待清理\",\n \"options\": {\n \"legend\": {\n \"behaviour\": \"showItem\",\n \"displayMode\": \"hidden\"\n },\n \"standardOptions\": {},\n \"thresholds\": {\n \"steps\": [\n {\n \"color\": \"#634CD9\",\n \"type\": \"base\",\n \"value\": null\n }\n ]\n },\n \"tooltip\": {\n \"mode\": \"all\",\n \"sort\": \"none\"\n }\n },\n \"overrides\": [\n {\n \"matcher\": {\n \"id\": \"byFrameRefID\"\n },\n \"properties\": {\n \"rightYAxisDisplay\": \"off\"\n }\n }\n ],\n \"targets\": [\n {\n \"__mode__\": \"__query__\",\n \"expr\": \"clickhouse_metrics_parts_delete_on_destroy\",\n \"maxDataPoints\": 240,\n \"refId\": \"B\"\n }\n ],\n \"transformations\": [\n {\n \"id\": \"organize\",\n \"options\": {}\n }\n ],\n \"type\": \"timeseries\",\n \"version\": \"3.0.0\"\n },\n {\n \"custom\": {\n \"drawStyle\": \"lines\",\n \"fillOpacity\": 0,\n \"gradientMode\": \"none\",\n \"lineInterpolation\": \"smooth\",\n \"lineWidth\": 1,\n \"scaleDistribution\": {\n \"type\": \"linear\"\n },\n \"spanNulls\": false,\n \"stack\": \"off\"\n },\n \"datasourceCate\": \"prometheus\",\n \"datasourceValue\": 1,\n \"description\": \"包含了大量列或者说是字段广泛的数据。一个宽数据分区意味着单个数据块或行包含很多列,这可能会影响到数据处理和查询的效率,尤其是在涉及大量列的选择或聚合操作时。\",\n \"id\": \"75a6156e-66c8-4b05-a7f3-303d6babe521\",\n \"layout\": {\n \"h\": 7,\n \"i\": \"cd3637a2-e1af-4c1d-ab12-b5e85caf6835\",\n \"isResizable\": true,\n \"w\": 12,\n \"x\": 0,\n \"y\": 278\n },\n \"maxPerRow\": 4,\n \"name\": \"宽数据分区\",\n \"options\": {\n \"legend\": {\n \"behaviour\": \"showItem\",\n \"displayMode\": \"hidden\"\n },\n \"standardOptions\": {},\n \"thresholds\": {\n \"steps\": [\n {\n \"color\": \"#634CD9\",\n \"type\": \"base\",\n \"value\": null\n }\n ]\n },\n \"tooltip\": {\n \"mode\": \"all\",\n \"sort\": \"none\"\n }\n },\n \"overrides\": [\n {\n \"matcher\": {\n \"id\": \"byFrameRefID\"\n },\n \"properties\": {\n \"rightYAxisDisplay\": \"off\"\n }\n }\n ],\n \"targets\": [\n {\n \"__mode__\": \"__query__\",\n \"expr\": \"clickhouse_metrics_parts_wide\",\n \"maxDataPoints\": 240,\n \"refId\": \"B\"\n }\n ],\n \"transformations\": [\n {\n \"id\": \"organize\",\n \"options\": {}\n }\n ],\n \"type\": \"timeseries\",\n \"version\": \"3.0.0\"\n },\n {\n \"custom\": {\n \"drawStyle\": \"lines\",\n \"fillOpacity\": 0,\n \"gradientMode\": \"none\",\n \"lineInterpolation\": \"smooth\",\n \"lineWidth\": 1,\n \"scaleDistribution\": {\n \"type\": \"linear\"\n },\n \"spanNulls\": false,\n \"stack\": \"off\"\n },\n \"datasourceCate\": \"prometheus\",\n \"datasourceValue\": 1,\n \"description\": \"当前数据库中经过压缩处理的数据分区的数量。这些分区通过算法减少了数据占用的空间,同时保持了数据的完整性和查询的可行性。\",\n \"id\": \"bb287913-7ef7-408f-9feb-d875b3683157\",\n \"layout\": {\n \"h\": 7,\n \"i\": \"a40b9909-1cc3-47bd-b28e-aca03bd777bd\",\n \"isResizable\": true,\n \"w\": 12,\n \"x\": 12,\n \"y\": 278\n },\n \"maxPerRow\": 4,\n \"name\": \"压缩数据分区 \",\n \"options\": {\n \"legend\": {\n \"behaviour\": \"showItem\",\n \"displayMode\": \"hidden\"\n },\n \"standardOptions\": {},\n \"thresholds\": {\n \"steps\": [\n {\n \"color\": \"#634CD9\",\n \"type\": \"base\",\n \"value\": null\n }\n ]\n },\n \"tooltip\": {\n \"mode\": \"all\",\n \"sort\": \"none\"\n }\n },\n \"overrides\": [\n {\n \"matcher\": {\n \"id\": \"byFrameRefID\"\n },\n \"properties\": {\n \"rightYAxisDisplay\": \"off\"\n }\n }\n ],\n \"targets\": [\n {\n \"__mode__\": \"__query__\",\n \"expr\": \"clickhouse_metrics_parts_compact\",\n \"maxDataPoints\": 240,\n \"refId\": \"B\"\n }\n ],\n \"transformations\": [\n {\n \"id\": \"organize\",\n \"options\": {}\n }\n ],\n \"type\": \"timeseries\",\n \"version\": \"3.0.0\"\n }\n ],\n \"type\": \"row\"\n },\n {\n \"collapsed\": false,\n \"id\": \"5aa89429-c4b8-4733-a7b9-2abfc45fb836\",\n \"layout\": {\n \"h\": 1,\n \"i\": \"5aa89429-c4b8-4733-a7b9-2abfc45fb836\",\n \"isResizable\": false,\n \"w\": 24,\n \"x\": 0,\n \"y\": 314\n },\n \"name\": \"Distributed\",\n \"panels\": [\n {\n \"custom\": {\n \"drawStyle\": \"lines\",\n \"fillOpacity\": 0,\n \"gradientMode\": \"none\",\n \"lineInterpolation\": \"smooth\",\n \"lineWidth\": 1,\n \"scaleDistribution\": {\n \"type\": \"linear\"\n },\n \"spanNulls\": false,\n \"stack\": \"off\"\n },\n \"datasourceCate\": \"prometheus\",\n \"datasourceValue\": 1,\n \"description\": \"衡量的是向远程服务器发送数据的连接数量,这些数据最初是插入到 Distributed 表中的。Distributed 表是 ClickHouse 中用于分布式存储和处理数据的一种特殊表类型,它实际上不存储数据,而是将数据操作(如 INSERT 查询)转发到表所定义的远程节点上。通过监控这个指标,您可以了解到数据分布的活跃程度,即 ClickHouse 集群内部数据流动的频繁程度,以及分布式查询或数据加载操作的负载情况。高数值可能意味着大量的数据正在被分布式地处理或存储,这可能是系统繁忙或数据管道高效运行的迹象。然而,如果发现该指标异常高且伴随性能问题,可能需要进一步调查网络状况、远程服务器的处理能力或分布式表的配置,以优化数据传输效率和系统整体性能。\",\n \"id\": \"b9dde172-3e02-4e71-891f-5fb97c9c0571\",\n \"layout\": {\n \"h\": 11,\n \"i\": \"b9dde172-3e02-4e71-891f-5fb97c9c0571\",\n \"isResizable\": true,\n \"w\": 11,\n \"x\": 0,\n \"y\": 315\n },\n \"maxPerRow\": 4,\n \"name\": \"向远程服务器发送数据的连接数量\",\n \"options\": {\n \"legend\": {\n \"behaviour\": \"showItem\",\n \"displayMode\": \"hidden\"\n },\n \"standardOptions\": {},\n \"thresholds\": {\n \"steps\": [\n {\n \"color\": \"#634CD9\",\n \"type\": \"base\",\n \"value\": null\n }\n ]\n },\n \"tooltip\": {\n \"mode\": \"all\",\n \"sort\": \"none\"\n }\n },\n \"overrides\": [\n {\n \"matcher\": {\n \"id\": \"byFrameRefID\"\n },\n \"properties\": {\n \"rightYAxisDisplay\": \"off\"\n }\n }\n ],\n \"targets\": [\n {\n \"__mode__\": \"__query__\",\n \"expr\": \"clickhouse_metrics_distributed_send\",\n \"maxDataPoints\": 240,\n \"refId\": \"B\"\n }\n ],\n \"transformations\": [\n {\n \"id\": \"organize\",\n \"options\": {}\n }\n ],\n \"type\": \"timeseries\",\n \"version\": \"3.0.0\"\n },\n {\n \"custom\": {\n \"drawStyle\": \"lines\",\n \"fillOpacity\": 0,\n \"gradientMode\": \"none\",\n \"lineInterpolation\": \"smooth\",\n \"lineWidth\": 1,\n \"scaleDistribution\": {\n \"type\": \"linear\"\n },\n \"spanNulls\": false,\n \"stack\": \"off\"\n },\n \"datasourceCate\": \"prometheus\",\n \"datasourceValue\": 1,\n \"description\": \"等待异步插入到 Distributed 表中的文件数量\\n这个指标对于监控数据导入或异步处理流程的效率至关重要。如果数值较大,可能意味着有大量数据正在排队等待写入 Distributed 表,这可能会影响数据的实时性或处理速度。高数值还可能指示了数据导入作业的积压、网络瓶颈、远程节点处理能力不足或其他与分布式系统相关的性能问题。\\n\\n监控 ClickHouseMetrics_DistributedFilesToInsert 可以帮助识别和诊断数据流中的瓶颈,进而采取相应的优化措施,比如调整插入作业的并发度、优化网络配置、增加目标表的处理能力或调整分布式表的配置参数,以确保数据能够高效、及时地被分布式存储和处理。\",\n \"id\": \"4f1782d0-5572-4a75-ba90-c74914246557\",\n \"layout\": {\n \"h\": 11,\n \"i\": \"dd975296-d2cd-42fe-b23b-bb8c8dfa1c17\",\n \"isResizable\": true,\n \"w\": 11,\n \"x\": 11,\n \"y\": 315\n },\n \"maxPerRow\": 4,\n \"name\": \"插入文件数\",\n \"options\": {\n \"legend\": {\n \"behaviour\": \"showItem\",\n \"displayMode\": \"hidden\"\n },\n \"standardOptions\": {},\n \"thresholds\": {\n \"steps\": [\n {\n \"color\": \"#634CD9\",\n \"type\": \"base\",\n \"value\": null\n }\n ]\n },\n \"tooltip\": {\n \"mode\": \"all\",\n \"sort\": \"none\"\n }\n },\n \"overrides\": [\n {\n \"matcher\": {\n \"id\": \"byFrameRefID\"\n },\n \"properties\": {\n \"rightYAxisDisplay\": \"off\"\n }\n }\n ],\n \"targets\": [\n {\n \"__mode__\": \"__query__\",\n \"expr\": \"clickhouse_metrics_distributed_files_to_insert\",\n \"maxDataPoints\": 240,\n \"refId\": \"B\"\n }\n ],\n \"transformations\": [\n {\n \"id\": \"organize\",\n \"options\": {}\n }\n ],\n \"type\": \"timeseries\",\n \"version\": \"3.0.0\"\n }\n ],\n \"type\": \"row\"\n },\n {\n \"collapsed\": false,\n \"id\": \"2ab85aaf-f0af-41b1-9760-34b9177ae600\",\n \"layout\": {\n \"h\": 1,\n \"i\": \"2ab85aaf-f0af-41b1-9760-34b9177ae600\",\n \"isResizable\": false,\n \"w\": 24,\n \"x\": 0,\n \"y\": 348\n },\n \"name\": \"Background pool\",\n \"panels\": [\n {\n \"custom\": {\n \"drawStyle\": \"lines\",\n \"fillOpacity\": 0,\n \"gradientMode\": \"none\",\n \"lineInterpolation\": \"smooth\",\n \"lineWidth\": 1,\n \"scaleDistribution\": {\n \"type\": \"linear\"\n },\n \"spanNulls\": false,\n \"stack\": \"off\"\n },\n \"datasourceCate\": \"prometheus\",\n \"datasourceValue\": 1,\n \"description\": \"后台任务池中的活跃任务数\",\n \"id\": \"f329dc5d-6276-4652-855f-b26153d9155a\",\n \"layout\": {\n \"h\": 9,\n \"i\": \"f329dc5d-6276-4652-855f-b26153d9155a\",\n \"isResizable\": true,\n \"w\": 12,\n \"x\": 0,\n \"y\": 22\n },\n \"maxPerRow\": 4,\n \"name\": \"后台任务池任务数\",\n \"options\": {\n \"legend\": {\n \"behaviour\": \"showItem\",\n \"displayMode\": \"hidden\"\n },\n \"standardOptions\": {},\n \"thresholds\": {\n \"steps\": [\n {\n \"color\": \"#634CD9\",\n \"type\": \"base\",\n \"value\": null\n }\n ]\n },\n \"tooltip\": {\n \"mode\": \"all\",\n \"sort\": \"none\"\n }\n },\n \"overrides\": [\n {\n \"matcher\": {\n \"id\": \"byFrameRefID\"\n },\n \"properties\": {\n \"rightYAxisDisplay\": \"off\"\n }\n }\n ],\n \"targets\": [\n {\n \"__mode__\": \"__query__\",\n \"expr\": \"clickhouse_metrics_background_common_pool_task\",\n \"maxDataPoints\": 240,\n \"refId\": \"B\"\n }\n ],\n \"transformations\": [\n {\n \"id\": \"organize\",\n \"options\": {}\n }\n ],\n \"type\": \"timeseries\",\n \"version\": \"3.0.0\"\n },\n {\n \"custom\": {\n \"drawStyle\": \"lines\",\n \"fillOpacity\": 0,\n \"gradientMode\": \"none\",\n \"lineInterpolation\": \"smooth\",\n \"lineWidth\": 1,\n \"scaleDistribution\": {\n \"type\": \"linear\"\n },\n \"spanNulls\": false,\n \"stack\": \"off\"\n },\n \"datasourceCate\": \"prometheus\",\n \"datasourceValue\": 1,\n \"description\": \"ClickHouse 中后台获取任务池(BackgroundFetchesPool)当前活跃任务的数量。\",\n \"id\": \"71ba46cc-be89-400f-ab7a-27189c309e25\",\n \"layout\": {\n \"h\": 9,\n \"i\": \"ebdfc65c-3b5e-4fa9-8165-6dd47ebab38d\",\n \"isResizable\": true,\n \"w\": 11,\n \"x\": 12,\n \"y\": 22\n },\n \"maxPerRow\": 4,\n \"name\": \" 后台获取任务池任务数\",\n \"options\": {\n \"legend\": {\n \"behaviour\": \"showItem\",\n \"displayMode\": \"hidden\"\n },\n \"standardOptions\": {},\n \"thresholds\": {\n \"steps\": [\n {\n \"color\": \"#634CD9\",\n \"type\": \"base\",\n \"value\": null\n }\n ]\n },\n \"tooltip\": {\n \"mode\": \"all\",\n \"sort\": \"none\"\n }\n },\n \"overrides\": [\n {\n \"matcher\": {\n \"id\": \"byFrameRefID\"\n },\n \"properties\": {\n \"rightYAxisDisplay\": \"off\"\n }\n }\n ],\n \"targets\": [\n {\n \"__mode__\": \"__query__\",\n \"expr\": \"clickhouse_metrics_background_fetches_pool_task\",\n \"maxDataPoints\": 240,\n \"refId\": \"B\"\n }\n ],\n \"transformations\": [\n {\n \"id\": \"organize\",\n \"options\": {}\n }\n ],\n \"type\": \"timeseries\",\n \"version\": \"3.0.0\"\n },\n {\n \"custom\": {\n \"drawStyle\": \"lines\",\n \"fillOpacity\": 0,\n \"gradientMode\": \"none\",\n \"lineInterpolation\": \"smooth\",\n \"lineWidth\": 1,\n \"scaleDistribution\": {\n \"type\": \"linear\"\n },\n \"spanNulls\": false,\n \"stack\": \"off\"\n },\n \"datasourceCate\": \"prometheus\",\n \"datasourceValue\": 1,\n \"description\": \"ClickHouse中后台移动任务池(BackgroundMovePool)当前激活的任务数量\",\n \"id\": \"47096333-948c-4010-bb0e-ced6581ea2c5\",\n \"layout\": {\n \"h\": 8,\n \"i\": \"b942ad7d-9119-4eaf-9971-c8453257b1b8\",\n \"isResizable\": true,\n \"w\": 12,\n \"x\": 0,\n \"y\": 31\n },\n \"maxPerRow\": 4,\n \"name\": \"后台移动任务池任务数\",\n \"options\": {\n \"legend\": {\n \"behaviour\": \"showItem\",\n \"displayMode\": \"hidden\"\n },\n \"standardOptions\": {},\n \"thresholds\": {\n \"steps\": [\n {\n \"color\": \"#634CD9\",\n \"type\": \"base\",\n \"value\": null\n }\n ]\n },\n \"tooltip\": {\n \"mode\": \"all\",\n \"sort\": \"none\"\n }\n },\n \"overrides\": [\n {\n \"matcher\": {\n \"id\": \"byFrameRefID\"\n },\n \"properties\": {\n \"rightYAxisDisplay\": \"off\"\n }\n }\n ],\n \"targets\": [\n {\n \"__mode__\": \"__query__\",\n \"expr\": \"clickhouse_metrics_background_move_pool_task\",\n \"maxDataPoints\": 240,\n \"refId\": \"B\"\n }\n ],\n \"transformations\": [\n {\n \"id\": \"organize\",\n \"options\": {}\n }\n ],\n \"type\": \"timeseries\",\n \"version\": \"3.0.0\"\n },\n {\n \"custom\": {\n \"drawStyle\": \"lines\",\n \"fillOpacity\": 0,\n \"gradientMode\": \"none\",\n \"lineInterpolation\": \"smooth\",\n \"lineWidth\": 1,\n \"scaleDistribution\": {\n \"type\": \"linear\"\n },\n \"spanNulls\": false,\n \"stack\": \"off\"\n },\n \"datasourceCate\": \"prometheus\",\n \"datasourceValue\": 1,\n \"description\": \"ClickHouse 中后台调度任务池(BackgroundSchedulePool)当前激活的任务数量\",\n \"id\": \"d8d3c10b-236d-408f-b20c-012d7444b71e\",\n \"layout\": {\n \"h\": 8,\n \"i\": \"9d862255-175f-4e4a-89d1-ebac3ca82e8f\",\n \"isResizable\": true,\n \"w\": 11,\n \"x\": 12,\n \"y\": 31\n },\n \"maxPerRow\": 4,\n \"name\": \"后台调度任务池任务数\",\n \"options\": {\n \"legend\": {\n \"behaviour\": \"showItem\",\n \"displayMode\": \"hidden\"\n },\n \"standardOptions\": {},\n \"thresholds\": {\n \"steps\": [\n {\n \"color\": \"#634CD9\",\n \"type\": \"base\",\n \"value\": null\n }\n ]\n },\n \"tooltip\": {\n \"mode\": \"all\",\n \"sort\": \"none\"\n }\n },\n \"overrides\": [\n {\n \"matcher\": {\n \"id\": \"byFrameRefID\"\n },\n \"properties\": {\n \"rightYAxisDisplay\": \"off\"\n }\n }\n ],\n \"targets\": [\n {\n \"__mode__\": \"__query__\",\n \"expr\": \"clickhouse_metrics_background_schedule_pool_task\",\n \"maxDataPoints\": 240,\n \"refId\": \"B\"\n }\n ],\n \"transformations\": [\n {\n \"id\": \"organize\",\n \"options\": {}\n }\n ],\n \"type\": \"timeseries\",\n \"version\": \"3.0.0\"\n },\n {\n \"custom\": {\n \"drawStyle\": \"lines\",\n \"fillOpacity\": 0,\n \"gradientMode\": \"none\",\n \"lineInterpolation\": \"smooth\",\n \"lineWidth\": 1,\n \"scaleDistribution\": {\n \"type\": \"linear\"\n },\n \"spanNulls\": false,\n \"stack\": \"off\"\n },\n \"datasourceCate\": \"prometheus\",\n \"datasourceValue\": 1,\n \"description\": \"ClickHouse 中后台缓冲区刷新调度任务池(BackgroundBufferFlushSchedulePool)当前激活的任务数量。这个任务池专注于处理与缓冲区数据定期刷新相关的后台任务\",\n \"id\": \"b16eff73-78d4-4554-946c-8e36dcee3678\",\n \"layout\": {\n \"h\": 8,\n \"i\": \"76625404-ebc4-492b-800c-fa8756154ada\",\n \"isResizable\": true,\n \"w\": 12,\n \"x\": 0,\n \"y\": 39\n },\n \"maxPerRow\": 4,\n \"name\": \"后台缓冲区刷新调度任务池任务数\",\n \"options\": {\n \"legend\": {\n \"behaviour\": \"showItem\",\n \"displayMode\": \"hidden\"\n },\n \"standardOptions\": {},\n \"thresholds\": {\n \"steps\": [\n {\n \"color\": \"#634CD9\",\n \"type\": \"base\",\n \"value\": null\n }\n ]\n },\n \"tooltip\": {\n \"mode\": \"all\",\n \"sort\": \"none\"\n }\n },\n \"overrides\": [\n {\n \"matcher\": {\n \"id\": \"byFrameRefID\"\n },\n \"properties\": {\n \"rightYAxisDisplay\": \"off\"\n }\n }\n ],\n \"targets\": [\n {\n \"__mode__\": \"__query__\",\n \"expr\": \"clickhouse_metrics_background_buffer_flush_schedule_pool_task\",\n \"maxDataPoints\": 240,\n \"refId\": \"B\"\n }\n ],\n \"transformations\": [\n {\n \"id\": \"organize\",\n \"options\": {}\n }\n ],\n \"type\": \"timeseries\",\n \"version\": \"3.0.0\"\n },\n {\n \"custom\": {\n \"drawStyle\": \"lines\",\n \"fillOpacity\": 0,\n \"gradientMode\": \"none\",\n \"lineInterpolation\": \"smooth\",\n \"lineWidth\": 1,\n \"scaleDistribution\": {\n \"type\": \"linear\"\n },\n \"spanNulls\": false,\n \"stack\": \"off\"\n },\n \"datasourceCate\": \"prometheus\",\n \"datasourceValue\": 1,\n \"description\": \" ClickHouse 中后台分布式调度任务池(BackgroundDistributedSchedulePool)当前激活的任务数量。这个任务池专门负责处理异步执行的分布式数据发送任务\",\n \"id\": \"9d3dece1-0765-4e25-a21e-e71f6ac57848\",\n \"layout\": {\n \"h\": 8,\n \"i\": \"b7d2e412-b86a-4b15-9fb8-6a50e676e5e1\",\n \"isResizable\": true,\n \"w\": 11,\n \"x\": 12,\n \"y\": 39\n },\n \"maxPerRow\": 4,\n \"name\": \"后台分布式调度任务池任务数\",\n \"options\": {\n \"legend\": {\n \"behaviour\": \"showItem\",\n \"displayMode\": \"hidden\"\n },\n \"standardOptions\": {},\n \"thresholds\": {\n \"steps\": [\n {\n \"color\": \"#634CD9\",\n \"type\": \"base\",\n \"value\": null\n }\n ]\n },\n \"tooltip\": {\n \"mode\": \"all\",\n \"sort\": \"none\"\n }\n },\n \"overrides\": [\n {\n \"matcher\": {\n \"id\": \"byFrameRefID\"\n },\n \"properties\": {\n \"rightYAxisDisplay\": \"off\"\n }\n }\n ],\n \"targets\": [\n {\n \"__mode__\": \"__query__\",\n \"expr\": \"clickhouse_metrics_background_distributed_schedule_pool_task\",\n \"maxDataPoints\": 240,\n \"refId\": \"B\"\n }\n ],\n \"transformations\": [\n {\n \"id\": \"organize\",\n \"options\": {}\n }\n ],\n \"type\": \"timeseries\",\n \"version\": \"3.0.0\"\n },\n {\n \"custom\": {\n \"drawStyle\": \"lines\",\n \"fillOpacity\": 0,\n \"gradientMode\": \"none\",\n \"lineInterpolation\": \"smooth\",\n \"lineWidth\": 1,\n \"scaleDistribution\": {\n \"type\": \"linear\"\n },\n \"spanNulls\": false,\n \"stack\": \"off\"\n },\n \"datasourceCate\": \"prometheus\",\n \"datasourceValue\": 1,\n \"description\": \"ClickHouse 中后台处理池(针对消息流处理的部分)当前激活的任务数量,专注于消息代理相关的后台任务\",\n \"id\": \"4f590117-7281-443a-8713-5ea9696bd3c1\",\n \"layout\": {\n \"h\": 9,\n \"i\": \"45ffe751-fb27-45e7-8d22-39820c539149\",\n \"isResizable\": true,\n \"w\": 12,\n \"x\": 0,\n \"y\": 47\n },\n \"maxPerRow\": 4,\n \"name\": \"后台消息代理调度任务池任务数\",\n \"options\": {\n \"legend\": {\n \"behaviour\": \"showItem\",\n \"displayMode\": \"hidden\"\n },\n \"standardOptions\": {},\n \"thresholds\": {\n \"steps\": [\n {\n \"color\": \"#634CD9\",\n \"type\": \"base\",\n \"value\": null\n }\n ]\n },\n \"tooltip\": {\n \"mode\": \"all\",\n \"sort\": \"none\"\n }\n },\n \"overrides\": [\n {\n \"matcher\": {\n \"id\": \"byFrameRefID\"\n },\n \"properties\": {\n \"rightYAxisDisplay\": \"off\"\n }\n }\n ],\n \"targets\": [\n {\n \"expr\": \"ClickHouseMetrics_BackgroundMessageBrokerSchedulePoolTask\",\n \"maxDataPoints\": 240,\n \"refId\": \"A\"\n },\n {\n \"__mode__\": \"__query__\",\n \"expr\": \"clickhouse_metrics_background_message_broker_schedule_pool_task\",\n \"maxDataPoints\": 240,\n \"refId\": \"B\"\n }\n ],\n \"transformations\": [\n {\n \"id\": \"organize\",\n \"options\": {}\n }\n ],\n \"type\": \"timeseries\",\n \"version\": \"3.0.0\"\n }\n ],\n \"type\": \"row\"\n }\n ],\n \"var\": [\n {\n \"datasource\": {\n \"cate\": \"prometheus\",\n \"value\": 1\n },\n \"definition\": \"label_values(ClickHouseMetrics_Move,instance)\",\n \"hide\": false,\n \"name\": \"instance\",\n \"type\": \"query\"\n },\n {\n \"definition\": \"1,null\",\n \"hide\": false,\n \"label\": \"\",\n \"multi\": false,\n \"name\": \"peeks\",\n \"type\": \"custom\"\n },\n {\n \"definition\": \"1,null\",\n \"hide\": false,\n \"name\": \"trends\",\n \"type\": \"custom\"\n }\n ],\n \"version\": \"3.0.0\"\n },\n \"public\": 0,\n \"public_cate\": 0,\n \"bgids\": null,\n \"built_in\": 0,\n \"hide\": 0,\n \"uuid\": 1719305153872258000\n}"
},
{
"path": "integrations/ClickHouse/dashboards/clickhouse_by_exporter.json",
"content": "{\n \"id\": 0,\n \"group_id\": 0,\n \"name\": \"ClickHouse_Exporter\",\n \"ident\": \"\",\n \"tags\": \"\",\n \"create_at\": 0,\n \"create_by\": \"\",\n \"update_at\": 0,\n \"update_by\": \"\",\n \"configs\": {\n \"graphTooltip\": \"default\",\n \"graphZoom\": \"default\",\n \"panels\": [\n {\n \"collapsed\": true,\n \"id\": \"be21493f-8eb4-4947-9e34-0109fcda9a51\",\n \"layout\": {\n \"h\": 1,\n \"i\": \"be21493f-8eb4-4947-9e34-0109fcda9a51\",\n \"isResizable\": false,\n \"w\": 24,\n \"x\": 0,\n \"y\": 0\n },\n \"name\": \"General\",\n \"panels\": [],\n \"type\": \"row\"\n },\n {\n \"custom\": {\n \"drawStyle\": \"lines\",\n \"fillOpacity\": 0,\n \"gradientMode\": \"none\",\n \"lineInterpolation\": \"smooth\",\n \"lineWidth\": 1,\n \"scaleDistribution\": {\n \"type\": \"linear\"\n },\n \"spanNulls\": false,\n \"stack\": \"off\"\n },\n \"datasourceCate\": \"prometheus\",\n \"datasourceValue\": 1,\n \"description\": \"内存占用\",\n \"id\": \"8687b3a6-c7f2-4af6-8509-29c99969a55d\",\n \"layout\": {\n \"h\": 7,\n \"i\": \"8687b3a6-c7f2-4af6-8509-29c99969a55d\",\n \"isResizable\": true,\n \"w\": 12,\n \"x\": 0,\n \"y\": 1\n },\n \"maxPerRow\": 4,\n \"name\": \"Memory\",\n \"options\": {\n \"legend\": {\n \"behaviour\": \"showItem\",\n \"displayMode\": \"hidden\"\n },\n \"standardOptions\": {},\n \"thresholds\": {\n \"steps\": [\n {\n \"color\": \"#634CD9\",\n \"type\": \"base\",\n \"value\": null\n }\n ]\n },\n \"tooltip\": {\n \"mode\": \"all\",\n \"sort\": \"none\"\n }\n },\n \"overrides\": [\n {\n \"matcher\": {\n \"id\": \"byFrameRefID\"\n },\n \"properties\": {\n \"rightYAxisDisplay\": \"off\"\n }\n }\n ],\n \"targets\": [\n {\n \"expr\": \"ClickHouseMetrics_MemoryTracking\",\n \"legend\": \"分配的内存总量\",\n \"maxDataPoints\": 240,\n \"refId\": \"A\"\n }\n ],\n \"transformations\": [\n {\n \"id\": \"organize\",\n \"options\": {}\n }\n ],\n \"type\": \"timeseries\",\n \"version\": \"3.0.0\"\n },\n {\n \"custom\": {\n \"drawStyle\": \"lines\",\n \"fillOpacity\": 0,\n \"gradientMode\": \"none\",\n \"lineInterpolation\": \"smooth\",\n \"lineWidth\": 1,\n \"scaleDistribution\": {\n \"type\": \"linear\"\n },\n \"spanNulls\": false,\n \"stack\": \"off\"\n },\n \"datasourceCate\": \"prometheus\",\n \"datasourceValue\": 1,\n \"description\": \"tcp连接数\",\n \"id\": \"af8f29d3-8992-450e-8caa-749518669da1\",\n \"layout\": {\n \"h\": 7,\n \"i\": \"af8f29d3-8992-450e-8caa-749518669da1\",\n \"isResizable\": true,\n \"w\": 12,\n \"x\": 12,\n \"y\": 1\n },\n \"maxPerRow\": 4,\n \"name\": \"Connections\",\n \"options\": {\n \"legend\": {\n \"behaviour\": \"showItem\",\n \"displayMode\": \"hidden\"\n },\n \"standardOptions\": {},\n \"thresholds\": {\n \"steps\": [\n {\n \"color\": \"#634CD9\",\n \"type\": \"base\",\n \"value\": null\n }\n ]\n },\n \"tooltip\": {\n \"mode\": \"all\",\n \"sort\": \"none\"\n }\n },\n \"overrides\": [\n {\n \"matcher\": {\n \"id\": \"byFrameRefID\"\n },\n \"properties\": {\n \"rightYAxisDisplay\": \"off\"\n }\n }\n ],\n \"targets\": [\n {\n \"expr\": \"ClickHouseMetrics_TCPConnection\",\n \"legend\": \"与 TCP 服务器(带本地接口的客户端)的连接数,也包括服务器-服务器连接\",\n \"maxDataPoints\": 240,\n \"refId\": \"A\"\n }\n ],\n \"transformations\": [\n {\n \"id\": \"organize\",\n \"options\": {}\n }\n ],\n \"type\": \"timeseries\",\n \"version\": \"3.0.0\"\n },\n {\n \"custom\": {\n \"drawStyle\": \"lines\",\n \"fillOpacity\": 0,\n \"gradientMode\": \"none\",\n \"lineInterpolation\": \"smooth\",\n \"lineWidth\": 1,\n \"scaleDistribution\": {\n \"type\": \"linear\"\n },\n \"spanNulls\": false,\n \"stack\": \"off\"\n },\n \"datasourceCate\": \"prometheus\",\n \"datasourceValue\": 1,\n \"description\": \"由于慢查询读取,降低查询处理线程数的次数\\n\\npeek\\n先计算每2分钟的瞬时速率,再在1小时(1h)的总时间跨度里,以每1分钟(1m)为一个时间片,寻找每个时间片内所有计算出的瞬时速率的最大值。这意味着它返回的是过去1小时内,每1分钟时间片内的最大瞬时读取回退事件速率。\",\n \"id\": \"15c72e83-be8d-4f2c-b87e-a30e74d8aefd\",\n \"layout\": {\n \"h\": 7,\n \"i\": \"15c72e83-be8d-4f2c-b87e-a30e74d8aefd\",\n \"isResizable\": true,\n \"w\": 12,\n \"x\": 0,\n \"y\": 8\n },\n \"maxPerRow\": 4,\n \"name\": \"查询处理线程降低次数\",\n \"options\": {\n \"legend\": {\n \"behaviour\": \"showItem\",\n \"displayMode\": \"hidden\"\n },\n \"standardOptions\": {},\n \"thresholds\": {\n \"steps\": [\n {\n \"color\": \"#634CD9\",\n \"type\": \"base\",\n \"value\": null\n }\n ]\n },\n \"tooltip\": {\n \"mode\": \"all\",\n \"sort\": \"none\"\n },\n \"valueMappings\": [\n {\n \"match\": {},\n \"result\": {},\n \"type\": \"textValue\"\n }\n ]\n },\n \"overrides\": [\n {\n \"matcher\": {\n \"id\": \"byFrameRefID\"\n },\n \"properties\": {\n \"rightYAxisDisplay\": \"off\"\n }\n }\n ],\n \"targets\": [\n {\n \"expr\": \"max_over_time(irate(ClickHouseProfileEvents_ReadBackoff{instance=\\\"$instance\\\"}[2m]) [1h:1m]) * $peeks\",\n \"instant\": false,\n \"legend\": \"peaks - {{instance}}\",\n \"maxDataPoints\": 240,\n \"refId\": \"A\"\n },\n {\n \"__mode__\": \"__query__\",\n \"expr\": \"irate(ClickHouseProfileEvents_ReadBackoff{instance=~\\\"$instance\\\"}[2m]) * $trends\",\n \"legend\": \"trend - {{instance}}\",\n \"maxDataPoints\": 240,\n \"refId\": \"B\"\n }\n ],\n \"transformations\": [\n {\n \"id\": \"organize\",\n \"options\": {}\n }\n ],\n \"type\": \"timeseries\",\n \"version\": \"3.0.0\"\n },\n {\n \"custom\": {\n \"drawStyle\": \"lines\",\n \"fillOpacity\": 0,\n \"gradientMode\": \"none\",\n \"lineInterpolation\": \"smooth\",\n \"lineWidth\": 1,\n \"scaleDistribution\": {\n \"type\": \"linear\"\n },\n \"spanNulls\": false,\n \"stack\": \"off\"\n },\n \"datasourceCate\": \"prometheus\",\n \"datasourceValue\": 1,\n \"description\": \"从文件中进行慢查询读取的次数,这表明系统过载\\n\\ntrends\\n计算过去2分钟内,匹配$instance条件的所有ClickHouse实例上慢速读取事件的平均每秒增长数量\",\n \"id\": \"1855230f-78e9-4eda-8e76-1921e780b222\",\n \"layout\": {\n \"h\": 7,\n \"i\": \"1855230f-78e9-4eda-8e76-1921e780b222\",\n \"isResizable\": true,\n \"w\": 12,\n \"x\": 12,\n \"y\": 8\n },\n \"maxPerRow\": 4,\n \"name\": \"慢查询次数\",\n \"options\": {\n \"legend\": {\n \"behaviour\": \"showItem\",\n \"displayMode\": \"hidden\"\n },\n \"standardOptions\": {},\n \"thresholds\": {\n \"steps\": [\n {\n \"color\": \"#634CD9\",\n \"type\": \"base\",\n \"value\": null\n }\n ]\n },\n \"tooltip\": {\n \"mode\": \"all\",\n \"sort\": \"none\"\n }\n },\n \"overrides\": [\n {\n \"matcher\": {\n \"id\": \"byFrameRefID\"\n },\n \"properties\": {\n \"rightYAxisDisplay\": \"off\"\n }\n }\n ],\n \"targets\": [\n {\n \"expr\": \"max_over_time(irate(ClickHouseProfileEvents_SlowRead{instance=\\\"$instance\\\"}[2m]) [1h:1m]) * $peeks\",\n \"legend\": \"peaks - {{instance}}\",\n \"maxDataPoints\": 240,\n \"refId\": \"A\"\n },\n {\n \"__mode__\": \"__query__\",\n \"expr\": \"rate(ClickHouseProfileEvents_SlowRead{instance=~\\\"$instance\\\"}[2m]) * $trends\",\n \"legend\": \"trend - {{instance}}\",\n \"maxDataPoints\": 240,\n \"refId\": \"B\"\n }\n ],\n \"transformations\": [\n {\n \"id\": \"organize\",\n \"options\": {}\n }\n ],\n \"type\": \"timeseries\",\n \"version\": \"3.0.0\"\n },\n {\n \"collapsed\": false,\n \"id\": \"cd6bd256-20d0-4892-9c99-7b9976fd9013\",\n \"layout\": {\n \"h\": 1,\n \"i\": \"cd6bd256-20d0-4892-9c99-7b9976fd9013\",\n \"isResizable\": false,\n \"w\": 24,\n \"x\": 0,\n \"y\": 29\n },\n \"name\": \"Queries\",\n \"panels\": [\n {\n \"custom\": {\n \"drawStyle\": \"lines\",\n \"fillOpacity\": 0,\n \"gradientMode\": \"none\",\n \"lineInterpolation\": \"smooth\",\n \"lineWidth\": 1,\n \"scaleDistribution\": {\n \"type\": \"linear\"\n },\n \"spanNulls\": false,\n \"stack\": \"off\"\n },\n \"datasourceCate\": \"prometheus\",\n \"datasourceValue\": 1,\n \"description\": \"需要解释和可能执行的查询数量,不包括失败的查询\",\n \"id\": \"0524900d-99fd-42b8-a647-d4da462fc309\",\n \"layout\": {\n \"h\": 7,\n \"i\": \"0524900d-99fd-42b8-a647-d4da462fc309\",\n \"isResizable\": true,\n \"w\": 12,\n \"x\": 0,\n \"y\": 44\n },\n \"maxPerRow\": 4,\n \"name\": \"查询总数\",\n \"options\": {\n \"legend\": {\n \"behaviour\": \"showItem\",\n \"displayMode\": \"hidden\"\n },\n \"standardOptions\": {},\n \"thresholds\": {\n \"steps\": [\n {\n \"color\": \"#634CD9\",\n \"type\": \"base\",\n \"value\": null\n }\n ]\n },\n \"tooltip\": {\n \"mode\": \"all\",\n \"sort\": \"none\"\n }\n },\n \"overrides\": [\n {\n \"matcher\": {\n \"id\": \"byFrameRefID\"\n },\n \"properties\": {\n \"rightYAxisDisplay\": \"off\"\n }\n }\n ],\n \"targets\": [\n {\n \"expr\": \"max_over_time(irate(ClickHouseProfileEvents_Query{instance=\\\"$instance\\\"}[2m]) [1h:1m]) * $peeks\",\n \"legend\": \"peaks - {{instance}}\",\n \"maxDataPoints\": 240,\n \"refId\": \"A\"\n },\n {\n \"__mode__\": \"__query__\",\n \"expr\": \"rate(ClickHouseProfileEvents_Query{instance=~\\\"$instance\\\"}[2m]) * $trends\",\n \"legend\": \"trend - {{instance}}\",\n \"maxDataPoints\": 240,\n \"refId\": \"B\"\n }\n ],\n \"transformations\": [\n {\n \"id\": \"organize\",\n \"options\": {}\n }\n ],\n \"type\": \"timeseries\",\n \"version\": \"3.0.0\"\n },\n {\n \"custom\": {\n \"drawStyle\": \"lines\",\n \"fillOpacity\": 0,\n \"gradientMode\": \"none\",\n \"lineInterpolation\": \"smooth\",\n \"lineWidth\": 1,\n \"scaleDistribution\": {\n \"type\": \"linear\"\n },\n \"spanNulls\": false,\n \"stack\": \"off\"\n },\n \"datasourceCate\": \"prometheus\",\n \"datasourceValue\": 1,\n \"description\": \"SELECT查询的数量\",\n \"id\": \"9e288fcd-4513-46bb-bcb5-b2f4e0b4edde\",\n \"layout\": {\n \"h\": 7,\n \"i\": \"d5701b8e-6926-4349-934d-0999de4666a5\",\n \"isResizable\": true,\n \"w\": 11,\n \"x\": 12,\n \"y\": 44\n },\n \"maxPerRow\": 4,\n \"name\": \"SELECT 查询数\",\n \"options\": {\n \"legend\": {\n \"behaviour\": \"showItem\",\n \"displayMode\": \"hidden\"\n },\n \"standardOptions\": {},\n \"thresholds\": {\n \"steps\": [\n {\n \"color\": \"#634CD9\",\n \"type\": \"base\",\n \"value\": null\n }\n ]\n },\n \"tooltip\": {\n \"mode\": \"all\",\n \"sort\": \"none\"\n }\n },\n \"overrides\": [\n {\n \"matcher\": {\n \"id\": \"byFrameRefID\"\n },\n \"properties\": {\n \"rightYAxisDisplay\": \"off\"\n }\n }\n ],\n \"targets\": [\n {\n \"expr\": \"max_over_time(irate(ClickHouseProfileEvents_SelectQuery{instance=\\\"$instance\\\"}[2m]) [1h:1m]) * $peeks\",\n \"legend\": \"peaks - {{instance}}\",\n \"maxDataPoints\": 240,\n \"refId\": \"A\"\n },\n {\n \"__mode__\": \"__query__\",\n \"expr\": \"rate(ClickHouseProfileEvents_SelectQuery{instance=~\\\"$instance\\\"}[2m]) * $trends\",\n \"legend\": \"trend - {{instance}}\",\n \"maxDataPoints\": 240,\n \"refId\": \"B\"\n }\n ],\n \"transformations\": [\n {\n \"id\": \"organize\",\n \"options\": {}\n }\n ],\n \"type\": \"timeseries\",\n \"version\": \"3.0.0\"\n },\n {\n \"custom\": {\n \"drawStyle\": \"lines\",\n \"fillOpacity\": 0,\n \"gradientMode\": \"none\",\n \"lineInterpolation\": \"smooth\",\n \"lineWidth\": 1,\n \"scaleDistribution\": {\n \"type\": \"linear\"\n },\n \"spanNulls\": false,\n \"stack\": \"off\"\n },\n \"datasourceCate\": \"prometheus\",\n \"datasourceValue\": 1,\n \"description\": \"与查询数相同,但仅限于INSERT查询\",\n \"id\": \"75f49b49-a926-48fa-8147-7e5c9414f029\",\n \"layout\": {\n \"h\": 7,\n \"i\": \"cc2806a9-e121-4763-adfc-adb0b08477fa\",\n \"isResizable\": true,\n \"w\": 12,\n \"x\": 0,\n \"y\": 51\n },\n \"maxPerRow\": 4,\n \"name\": \"INSERT 查询数\",\n \"options\": {\n \"legend\": {\n \"behaviour\": \"showItem\",\n \"displayMode\": \"hidden\"\n },\n \"standardOptions\": {},\n \"thresholds\": {\n \"steps\": [\n {\n \"color\": \"#634CD9\",\n \"type\": \"base\",\n \"value\": null\n }\n ]\n },\n \"tooltip\": {\n \"mode\": \"all\",\n \"sort\": \"none\"\n }\n },\n \"overrides\": [\n {\n \"matcher\": {\n \"id\": \"byFrameRefID\"\n },\n \"properties\": {\n \"rightYAxisDisplay\": \"off\"\n }\n }\n ],\n \"targets\": [\n {\n \"expr\": \"max_over_time(irate(ClickHouseProfileEvents_InsertQuery{instance=\\\"$instance\\\"}[2m]) [1h:1m]) * $peeks\",\n \"legend\": \"peaks - {{instance}}\",\n \"maxDataPoints\": 240,\n \"refId\": \"A\"\n },\n {\n \"__mode__\": \"__query__\",\n \"expr\": \"rate(ClickHouseProfileEvents_InsertQuery{instance=~\\\"$instance\\\"}[1m]) * $trends\",\n \"legend\": \"trend - {{instance}}\",\n \"maxDataPoints\": 240,\n \"refId\": \"B\"\n }\n ],\n \"transformations\": [\n {\n \"id\": \"organize\",\n \"options\": {}\n }\n ],\n \"type\": \"timeseries\",\n \"version\": \"3.0.0\"\n },\n {\n \"custom\": {\n \"drawStyle\": \"lines\",\n \"fillOpacity\": 0,\n \"gradientMode\": \"none\",\n \"lineInterpolation\": \"smooth\",\n \"lineWidth\": 1,\n \"scaleDistribution\": {\n \"type\": \"linear\"\n },\n \"spanNulls\": false,\n \"stack\": \"off\"\n },\n \"datasourceCate\": \"prometheus\",\n \"datasourceValue\": 1,\n \"description\": \"与失败的查询相同,但仅限于SELECT查询\",\n \"id\": \"9545befd-9040-4d54-88b0-bee01b8cd7f2\",\n \"layout\": {\n \"h\": 7,\n \"i\": \"4daaaa6e-9df7-4f3d-8abc-e8281cc6145f\",\n \"isResizable\": true,\n \"w\": 11,\n \"x\": 12,\n \"y\": 51\n },\n \"maxPerRow\": 4,\n \"name\": \"失败的SELECT查询数\",\n \"options\": {\n \"legend\": {\n \"behaviour\": \"showItem\",\n \"displayMode\": \"hidden\"\n },\n \"standardOptions\": {},\n \"thresholds\": {\n \"steps\": [\n {\n \"color\": \"#634CD9\",\n \"type\": \"base\",\n \"value\": null\n }\n ]\n },\n \"tooltip\": {\n \"mode\": \"all\",\n \"sort\": \"none\"\n }\n },\n \"overrides\": [\n {\n \"matcher\": {\n \"id\": \"byFrameRefID\"\n },\n \"properties\": {\n \"rightYAxisDisplay\": \"off\"\n }\n }\n ],\n \"targets\": [\n {\n \"expr\": \"max_over_time(irate(ClickHouseProfileEvents_FailedSelectQuery{instance=\\\"$instance\\\"}[2m]) [1h:1m]) * $peeks\",\n \"legend\": \"peaks - {{instance}}\",\n \"maxDataPoints\": 240,\n \"refId\": \"A\"\n },\n {\n \"__mode__\": \"__query__\",\n \"expr\": \"rate(ClickHouseProfileEvents_FailedSelectQuery{instance=~\\\"$instance\\\"}[1m]) * $trends\",\n \"legend\": \"trend - {{instance}}\",\n \"maxDataPoints\": 240,\n \"refId\": \"B\"\n }\n ],\n \"transformations\": [\n {\n \"id\": \"organize\",\n \"options\": {}\n }\n ],\n \"type\": \"timeseries\",\n \"version\": \"3.0.0\"\n },\n {\n \"custom\": {\n \"drawStyle\": \"lines\",\n \"fillOpacity\": 0,\n \"gradientMode\": \"none\",\n \"lineInterpolation\": \"smooth\",\n \"lineWidth\": 1,\n \"scaleDistribution\": {\n \"type\": \"linear\"\n },\n \"spanNulls\": false,\n \"stack\": \"off\"\n },\n \"datasourceCate\": \"prometheus\",\n \"datasourceValue\": 1,\n \"description\": \"失败的查询数量\",\n \"id\": \"ee8e2bcd-2312-41cc-b2b8-89bae9861797\",\n \"layout\": {\n \"h\": 8,\n \"i\": \"e947240d-8086-4d90-9b4b-3d976387f40c\",\n \"isResizable\": true,\n \"w\": 12,\n \"x\": 0,\n \"y\": 58\n },\n \"maxPerRow\": 4,\n \"name\": \"失败的查询数\",\n \"options\": {\n \"legend\": {\n \"behaviour\": \"showItem\",\n \"displayMode\": \"hidden\"\n },\n \"standardOptions\": {},\n \"thresholds\": {\n \"steps\": [\n {\n \"color\": \"#634CD9\",\n \"type\": \"base\",\n \"value\": null\n }\n ]\n },\n \"tooltip\": {\n \"mode\": \"all\",\n \"sort\": \"none\"\n }\n },\n \"overrides\": [\n {\n \"matcher\": {\n \"id\": \"byFrameRefID\"\n },\n \"properties\": {\n \"rightYAxisDisplay\": \"off\"\n }\n }\n ],\n \"targets\": [\n {\n \"expr\": \"max_over_time(irate(ClickHouseProfileEvents_FailedQuery{instance=\\\"$instance\\\"}[2m]) [1h:1m]) * $peeks\",\n \"legend\": \"peaks - {{instance}}\",\n \"maxDataPoints\": 240,\n \"refId\": \"A\"\n },\n {\n \"__mode__\": \"__query__\",\n \"expr\": \"rate(ClickHouseProfileEvents_FailedQuery{instance=~\\\"$instance\\\"}[1m]) * $trends\",\n \"legend\": \"trend - {{instance}}\",\n \"maxDataPoints\": 240,\n \"refId\": \"B\"\n }\n ],\n \"transformations\": [\n {\n \"id\": \"organize\",\n \"options\": {}\n }\n ],\n \"type\": \"timeseries\",\n \"version\": \"3.0.0\"\n },\n {\n \"custom\": {\n \"drawStyle\": \"lines\",\n \"fillOpacity\": 0,\n \"gradientMode\": \"none\",\n \"lineInterpolation\": \"smooth\",\n \"lineWidth\": 1,\n \"scaleDistribution\": {\n \"type\": \"linear\"\n },\n \"spanNulls\": false,\n \"stack\": \"off\"\n },\n \"datasourceCate\": \"prometheus\",\n \"datasourceValue\": 1,\n \"description\": \"\",\n \"id\": \"05749cc9-2c52-4662-b9b0-de66c3ebd45a\",\n \"layout\": {\n \"h\": 8,\n \"i\": \"cc19fb12-ba06-447e-b2de-f28a2c946903\",\n \"isResizable\": true,\n \"w\": 11,\n \"x\": 12,\n \"y\": 58\n },\n \"maxPerRow\": 4,\n \"name\": \"查询内存限制超标次数\",\n \"options\": {\n \"legend\": {\n \"behaviour\": \"showItem\",\n \"displayMode\": \"hidden\"\n },\n \"standardOptions\": {},\n \"thresholds\": {\n \"steps\": [\n {\n \"color\": \"#634CD9\",\n \"type\": \"base\",\n \"value\": null\n }\n ]\n },\n \"tooltip\": {\n \"mode\": \"all\",\n \"sort\": \"none\"\n }\n },\n \"overrides\": [\n {\n \"matcher\": {\n \"id\": \"byFrameRefID\"\n },\n \"properties\": {\n \"rightYAxisDisplay\": \"off\"\n }\n }\n ],\n \"targets\": [\n {\n \"expr\": \"max_over_time(irate(ClickHouseProfileEvents_QueryMemoryLimitExceeded{instance=\\\"$instance\\\"}[2m]) [1h:1m]) * $peeks\",\n \"legend\": \"peaks - {{instance}}\",\n \"maxDataPoints\": 240,\n \"refId\": \"A\"\n },\n {\n \"__mode__\": \"__query__\",\n \"expr\": \"rate(ClickHouseProfileEvents_QueryMemoryLimitExceeded{instance=~\\\"$instance\\\"}[1m]) * $trends\",\n \"legend\": \"trend - {{instance}}\",\n \"maxDataPoints\": 240,\n \"refId\": \"B\"\n }\n ],\n \"transformations\": [\n {\n \"id\": \"organize\",\n \"options\": {}\n }\n ],\n \"type\": \"timeseries\",\n \"version\": \"3.0.0\"\n },\n {\n \"custom\": {\n \"drawStyle\": \"lines\",\n \"fillOpacity\": 0,\n \"gradientMode\": \"none\",\n \"lineInterpolation\": \"smooth\",\n \"lineWidth\": 1,\n \"scaleDistribution\": {\n \"type\": \"linear\"\n },\n \"spanNulls\": false,\n \"stack\": \"off\"\n },\n \"datasourceCate\": \"prometheus\",\n \"datasourceValue\": 1,\n \"description\": \"\",\n \"id\": \"6a95c841-5ac7-4cd9-9597-21b0f41441e4\",\n \"layout\": {\n \"h\": 9,\n \"i\": \"c14878d8-c197-45ab-802e-f328b84deeff\",\n \"isResizable\": true,\n \"w\": 12,\n \"x\": 0,\n \"y\": 66\n },\n \"maxPerRow\": 4,\n \"name\": \"查询平均延迟\",\n \"options\": {\n \"legend\": {\n \"behaviour\": \"showItem\",\n \"displayMode\": \"hidden\"\n },\n \"standardOptions\": {},\n \"thresholds\": {\n \"steps\": [\n {\n \"color\": \"#634CD9\",\n \"type\": \"base\",\n \"value\": null\n }\n ]\n },\n \"tooltip\": {\n \"mode\": \"all\",\n \"sort\": \"none\"\n }\n },\n \"overrides\": [\n {\n \"matcher\": {\n \"id\": \"byFrameRefID\"\n },\n \"properties\": {\n \"rightYAxisDisplay\": \"off\"\n }\n }\n ],\n \"targets\": [\n {\n \"expr\": \"increase(ClickHouseProfileEvents_QueryTimeMicroseconds{instance=~\\\"$instance\\\"}[1m]) / (increase(ClickHouseProfileEvents_Query{instance=~\\\"$instance\\\"}[1m]) + 0.001)\",\n \"legend\": \"{{instance}}\",\n \"maxDataPoints\": 240,\n \"refId\": \"A\"\n }\n ],\n \"transformations\": [\n {\n \"id\": \"organize\",\n \"options\": {}\n }\n ],\n \"type\": \"timeseries\",\n \"version\": \"3.0.0\"\n },\n {\n \"custom\": {\n \"drawStyle\": \"lines\",\n \"fillOpacity\": 0,\n \"gradientMode\": \"none\",\n \"lineInterpolation\": \"smooth\",\n \"lineWidth\": 1,\n \"scaleDistribution\": {\n \"type\": \"linear\"\n },\n \"spanNulls\": false,\n \"stack\": \"off\"\n },\n \"datasourceCate\": \"prometheus\",\n \"datasourceValue\": 1,\n \"description\": \"与失败的查询相同,但仅限于INSERT查询\",\n \"id\": \"1c8f70b9-ec42-4d31-9fc1-892e742db86f\",\n \"layout\": {\n \"h\": 9,\n \"i\": \"8087f7f0-3130-4c61-95a3-9ae36d97990b\",\n \"isResizable\": true,\n \"w\": 11,\n \"x\": 12,\n \"y\": 66\n },\n \"maxPerRow\": 4,\n \"name\": \"失败的INSERT查询数\",\n \"options\": {\n \"legend\": {\n \"behaviour\": \"showItem\",\n \"displayMode\": \"hidden\"\n },\n \"standardOptions\": {},\n \"thresholds\": {\n \"steps\": [\n {\n \"color\": \"#634CD9\",\n \"type\": \"base\",\n \"value\": null\n }\n ]\n },\n \"tooltip\": {\n \"mode\": \"all\",\n \"sort\": \"none\"\n }\n },\n \"overrides\": [\n {\n \"matcher\": {\n \"id\": \"byFrameRefID\"\n },\n \"properties\": {\n \"rightYAxisDisplay\": \"off\"\n }\n }\n ],\n \"targets\": [\n {\n \"expr\": \"max_over_time(irate(ClickHouseProfileEvents_FailedInsertQuery{instance=\\\"$instance\\\"}[2m]) [1h:1m]) * $peeks\",\n \"legend\": \"peaks - {{instance}}\",\n \"maxDataPoints\": 240,\n \"refId\": \"A\"\n },\n {\n \"__mode__\": \"__query__\",\n \"expr\": \"rate(ClickHouseProfileEvents_FailedInsertQuery{instance=~\\\"$instance\\\"}[1m]) * $trends\",\n \"legend\": \"trend - {{instance}}\",\n \"maxDataPoints\": 240,\n \"refId\": \"B\"\n }\n ],\n \"transformations\": [\n {\n \"id\": \"organize\",\n \"options\": {}\n }\n ],\n \"type\": \"timeseries\",\n \"version\": \"3.0.0\"\n },\n {\n \"custom\": {\n \"drawStyle\": \"lines\",\n \"fillOpacity\": 0,\n \"gradientMode\": \"none\",\n \"lineInterpolation\": \"smooth\",\n \"lineWidth\": 1,\n \"scaleDistribution\": {\n \"type\": \"linear\"\n },\n \"spanNulls\": false,\n \"stack\": \"off\"\n },\n \"datasourceCate\": \"prometheus\",\n \"datasourceValue\": 1,\n \"description\": \"\",\n \"id\": \"4584d584-054b-4d42-b2f9-215a71fca118\",\n \"layout\": {\n \"h\": 8,\n \"i\": \"050414c6-8e31-49d1-8ddd-1916bf2101f5\",\n \"isResizable\": true,\n \"w\": 12,\n \"x\": 0,\n \"y\": 75\n },\n \"maxPerRow\": 4,\n \"name\": \"SELECT查询平均延迟\",\n \"options\": {\n \"legend\": {\n \"behaviour\": \"showItem\",\n \"displayMode\": \"hidden\"\n },\n \"standardOptions\": {},\n \"thresholds\": {\n \"steps\": [\n {\n \"color\": \"#634CD9\",\n \"type\": \"base\",\n \"value\": null\n }\n ]\n },\n \"tooltip\": {\n \"mode\": \"all\",\n \"sort\": \"none\"\n }\n },\n \"overrides\": [\n {\n \"matcher\": {\n \"id\": \"byFrameRefID\"\n },\n \"properties\": {\n \"rightYAxisDisplay\": \"off\"\n }\n }\n ],\n \"targets\": [\n {\n \"expr\": \"increase(ClickHouseProfileEvents_SelectQueryTimeMicroseconds{instance=~\\\"$instance\\\"}[1m] )/ (increase(ClickHouseProfileEvents_SelectQuery{instance=~\\\"$instance\\\"}[1m]) + 0.001)\",\n \"legend\": \"peaks - {{instance}}\",\n \"maxDataPoints\": 240,\n \"refId\": \"A\"\n }\n ],\n \"transformations\": [\n {\n \"id\": \"organize\",\n \"options\": {}\n }\n ],\n \"type\": \"timeseries\",\n \"version\": \"3.0.0\"\n },\n {\n \"custom\": {\n \"drawStyle\": \"lines\",\n \"fillOpacity\": 0,\n \"gradientMode\": \"none\",\n \"lineInterpolation\": \"smooth\",\n \"lineWidth\": 1,\n \"scaleDistribution\": {\n \"type\": \"linear\"\n },\n \"spanNulls\": false,\n \"stack\": \"off\"\n },\n \"datasourceCate\": \"prometheus\",\n \"datasourceValue\": 1,\n \"description\": \"\",\n \"id\": \"47083dd6-3164-479c-8d62-f32ee9f988ad\",\n \"layout\": {\n \"h\": 8,\n \"i\": \"8f07dca0-24cf-4a86-8099-5b27ba271d8c\",\n \"isResizable\": true,\n \"w\": 11,\n \"x\": 12,\n \"y\": 75\n },\n \"maxPerRow\": 4,\n \"name\": \"INSERT查询平均延迟\",\n \"options\": {\n \"legend\": {\n \"behaviour\": \"showItem\",\n \"displayMode\": \"hidden\"\n },\n \"standardOptions\": {},\n \"thresholds\": {\n \"steps\": [\n {\n \"color\": \"#634CD9\",\n \"type\": \"base\",\n \"value\": null\n }\n ]\n },\n \"tooltip\": {\n \"mode\": \"all\",\n \"sort\": \"none\"\n }\n },\n \"overrides\": [\n {\n \"matcher\": {\n \"id\": \"byFrameRefID\"\n },\n \"properties\": {\n \"rightYAxisDisplay\": \"off\"\n }\n }\n ],\n \"targets\": [\n {\n \"expr\": \"increase(ClickHouseProfileEvents_InsertQueryTimeMicroseconds{instance=~\\\"$instance\\\"}[1m]) / (increase(ClickHouseProfileEvents_InsertQuery{instance=~\\\"$instance\\\"}[1m]) + 0.001)\",\n \"legend\": \"peaks - {{instance}}\",\n \"maxDataPoints\": 240,\n \"refId\": \"A\"\n }\n ],\n \"transformations\": [\n {\n \"id\": \"organize\",\n \"options\": {}\n }\n ],\n \"type\": \"timeseries\",\n \"version\": \"3.0.0\"\n }\n ],\n \"type\": \"row\"\n },\n {\n \"collapsed\": false,\n \"id\": \"9da4b0b9-6843-4225-b3ba-dec31b2ca7c0\",\n \"layout\": {\n \"h\": 1,\n \"i\": \"9da4b0b9-6843-4225-b3ba-dec31b2ca7c0\",\n \"isResizable\": false,\n \"w\": 24,\n \"x\": 0,\n \"y\": 30\n },\n \"name\": \"Insert\",\n \"panels\": [\n {\n \"custom\": {\n \"drawStyle\": \"lines\",\n \"fillOpacity\": 0,\n \"gradientMode\": \"none\",\n \"lineInterpolation\": \"smooth\",\n \"lineWidth\": 1,\n \"scaleDistribution\": {\n \"type\": \"linear\"\n },\n \"spanNulls\": false,\n \"stack\": \"off\"\n },\n \"datasourceCate\": \"prometheus\",\n \"datasourceValue\": 1,\n \"description\": \"所有表INSERT的行数\",\n \"id\": \"6ea9312d-2334-4912-864c-4cea25bf65f9\",\n \"layout\": {\n \"h\": 8,\n \"i\": \"6ea9312d-2334-4912-864c-4cea25bf65f9\",\n \"isResizable\": true,\n \"w\": 12,\n \"x\": 0,\n \"y\": 123\n },\n \"maxPerRow\": 4,\n \"name\": \"Inserted 插入行数\",\n \"options\": {\n \"legend\": {\n \"behaviour\": \"showItem\",\n \"displayMode\": \"hidden\"\n },\n \"standardOptions\": {},\n \"thresholds\": {\n \"steps\": [\n {\n \"color\": \"#634CD9\",\n \"type\": \"base\",\n \"value\": null\n }\n ]\n },\n \"tooltip\": {\n \"mode\": \"all\",\n \"sort\": \"none\"\n }\n },\n \"overrides\": [\n {\n \"matcher\": {\n \"id\": \"byFrameRefID\"\n },\n \"properties\": {\n \"rightYAxisDisplay\": \"off\"\n }\n }\n ],\n \"targets\": [\n {\n \"expr\": \"max_over_time(irate(ClickHouseProfileEvents_InsertedRows{instance=\\\"$instance\\\"}[2m]) [1h:1m]) * $peeks\",\n \"legend\": \"peaks - {{instance}}\",\n \"maxDataPoints\": 240,\n \"refId\": \"A\"\n },\n {\n \"__mode__\": \"__query__\",\n \"expr\": \"rate(ClickHouseProfileEvents_InsertedRows{instance=~\\\"$instance\\\"}[1m]) * $trends\",\n \"legend\": \"trend - {{instance}}\",\n \"maxDataPoints\": 240,\n \"refId\": \"B\"\n }\n ],\n \"transformations\": [\n {\n \"id\": \"organize\",\n \"options\": {}\n }\n ],\n \"type\": \"timeseries\",\n \"version\": \"3.0.0\"\n },\n {\n \"custom\": {\n \"drawStyle\": \"lines\",\n \"fillOpacity\": 0,\n \"gradientMode\": \"none\",\n \"lineInterpolation\": \"smooth\",\n \"lineWidth\": 1,\n \"scaleDistribution\": {\n \"type\": \"linear\"\n },\n \"spanNulls\": false,\n \"stack\": \"off\"\n },\n \"datasourceCate\": \"prometheus\",\n \"datasourceValue\": 1,\n \"description\": \"所有表INSERT的字节数(未压缩列以它们在内存中存储的形式)\",\n \"id\": \"8a4987ad-c10f-419c-b2e9-107502e4bc20\",\n \"layout\": {\n \"h\": 8,\n \"i\": \"993c68cb-fabe-4742-b1a3-b9bd317d9725\",\n \"isResizable\": true,\n \"w\": 11,\n \"x\": 12,\n \"y\": 123\n },\n \"maxPerRow\": 4,\n \"name\": \"Inserted 插入字节数\",\n \"options\": {\n \"legend\": {\n \"behaviour\": \"showItem\",\n \"displayMode\": \"hidden\"\n },\n \"standardOptions\": {},\n \"thresholds\": {\n \"steps\": [\n {\n \"color\": \"#634CD9\",\n \"type\": \"base\",\n \"value\": null\n }\n ]\n },\n \"tooltip\": {\n \"mode\": \"all\",\n \"sort\": \"none\"\n }\n },\n \"overrides\": [\n {\n \"matcher\": {\n \"id\": \"byFrameRefID\"\n },\n \"properties\": {\n \"rightYAxisDisplay\": \"off\"\n }\n }\n ],\n \"targets\": [\n {\n \"expr\": \"max_over_time(irate(ClickHouseProfileEvents_InsertedBytes{instance=\\\"$instance\\\"}[2m]) [1h:1m]) * $peeks\",\n \"legend\": \"peaks - {{instance}}\",\n \"maxDataPoints\": 240,\n \"refId\": \"A\"\n },\n {\n \"__mode__\": \"__query__\",\n \"expr\": \"rate(ClickHouseProfileEvents_InsertedRows{instance=~\\\"$instance\\\"}[1m]) * $trends\",\n \"legend\": \"trend - {{instance}}\",\n \"maxDataPoints\": 240,\n \"refId\": \"B\"\n }\n ],\n \"transformations\": [\n {\n \"id\": \"organize\",\n \"options\": {}\n }\n ],\n \"type\": \"timeseries\",\n \"version\": \"3.0.0\"\n },\n {\n \"custom\": {\n \"drawStyle\": \"lines\",\n \"fillOpacity\": 0,\n \"gradientMode\": \"none\",\n \"lineInterpolation\": \"smooth\",\n \"lineWidth\": 1,\n \"scaleDistribution\": {\n \"type\": \"linear\"\n },\n \"spanNulls\": false,\n \"stack\": \"off\"\n },\n \"datasourceCate\": \"prometheus\",\n \"datasourceValue\": 1,\n \"description\": \"由于分区的活动数据部分数量过多,INSERT到MergeTree表的块被限制的次数\",\n \"id\": \"dd6d8098-1cab-483d-9462-3436678cbbb8\",\n \"layout\": {\n \"h\": 8,\n \"i\": \"ecfdbaee-44bb-47ad-a871-e1448a7eac25\",\n \"isResizable\": true,\n \"w\": 12,\n \"x\": 0,\n \"y\": 131\n },\n \"maxPerRow\": 4,\n \"name\": \"延迟插入次数\",\n \"options\": {\n \"legend\": {\n \"behaviour\": \"showItem\",\n \"displayMode\": \"hidden\"\n },\n \"standardOptions\": {},\n \"thresholds\": {\n \"steps\": [\n {\n \"color\": \"#634CD9\",\n \"type\": \"base\",\n \"value\": null\n }\n ]\n },\n \"tooltip\": {\n \"mode\": \"all\",\n \"sort\": \"none\"\n }\n },\n \"overrides\": [\n {\n \"matcher\": {\n \"id\": \"byFrameRefID\"\n },\n \"properties\": {\n \"rightYAxisDisplay\": \"off\"\n }\n }\n ],\n \"targets\": [\n {\n \"expr\": \"max_over_time(irate(ClickHouseProfileEvents_DelayedInserts{instance=\\\"$instance\\\"}[2m]) [1h:1m]) * $peeks\",\n \"legend\": \"peaks - {{instance}}\",\n \"maxDataPoints\": 240,\n \"refId\": \"A\"\n },\n {\n \"__mode__\": \"__query__\",\n \"expr\": \"rate(ClickHouseProfileEvents_DelayedInserts{instance=~\\\"$instance\\\"}[1m]) * $trends\",\n \"legend\": \"trend - {{instance}}\",\n \"maxDataPoints\": 240,\n \"refId\": \"B\"\n }\n ],\n \"transformations\": [\n {\n \"id\": \"organize\",\n \"options\": {}\n }\n ],\n \"type\": \"timeseries\",\n \"version\": \"3.0.0\"\n },\n {\n \"custom\": {\n \"drawStyle\": \"lines\",\n \"fillOpacity\": 0,\n \"gradientMode\": \"none\",\n \"lineInterpolation\": \"smooth\",\n \"lineWidth\": 1,\n \"scaleDistribution\": {\n \"type\": \"linear\"\n },\n \"spanNulls\": false,\n \"stack\": \"off\"\n },\n \"datasourceCate\": \"prometheus\",\n \"datasourceValue\": 1,\n \"description\": \"由于分区的活动数据部分数量过多,INSERT到MergeTree表的块被拒绝的次数\",\n \"id\": \"c03aa1f6-e382-4230-abf0-246ef2464438\",\n \"layout\": {\n \"h\": 8,\n \"i\": \"c3aab493-a207-44f1-8931-4232bb2f7ecc\",\n \"isResizable\": true,\n \"w\": 11,\n \"x\": 12,\n \"y\": 131\n },\n \"maxPerRow\": 4,\n \"name\": \"拒绝插入次数\",\n \"options\": {\n \"legend\": {\n \"behaviour\": \"showItem\",\n \"displayMode\": \"hidden\"\n },\n \"standardOptions\": {},\n \"thresholds\": {\n \"steps\": [\n {\n \"color\": \"#634CD9\",\n \"type\": \"base\",\n \"value\": null\n }\n ]\n },\n \"tooltip\": {\n \"mode\": \"all\",\n \"sort\": \"none\"\n }\n },\n \"overrides\": [\n {\n \"matcher\": {\n \"id\": \"byFrameRefID\"\n },\n \"properties\": {\n \"rightYAxisDisplay\": \"off\"\n }\n }\n ],\n \"targets\": [\n {\n \"expr\": \"max_over_time(irate(ClickHouseProfileEvents_RejectedInserts{instance=\\\"$instance\\\"}[2m]) [1h:1m]) * $peeks\",\n \"legend\": \"peaks - {{instance}}\",\n \"maxDataPoints\": 240,\n \"refId\": \"A\"\n },\n {\n \"__mode__\": \"__query__\",\n \"expr\": \"rate(ClickHouseProfileEvents_RejectedInserts{instance=~\\\"$instance\\\"}[1m]) * $trends\",\n \"legend\": \"trend - {{instance}}\",\n \"maxDataPoints\": 240,\n \"refId\": \"B\"\n }\n ],\n \"transformations\": [\n {\n \"id\": \"organize\",\n \"options\": {}\n }\n ],\n \"type\": \"timeseries\",\n \"version\": \"3.0.0\"\n },\n {\n \"custom\": {\n \"drawStyle\": \"lines\",\n \"fillOpacity\": 0,\n \"gradientMode\": \"none\",\n \"lineInterpolation\": \"smooth\",\n \"lineWidth\": 1,\n \"scaleDistribution\": {\n \"type\": \"linear\"\n },\n \"spanNulls\": false,\n \"stack\": \"off\"\n },\n \"datasourceCate\": \"prometheus\",\n \"datasourceValue\": 1,\n \"description\": \"由于分区的活动数据部分数量过多,INSERT到MergeTree表的块被限制时的总等待时间(毫秒)\",\n \"id\": \"edbe905e-81f8-4b14-8758-aa934d11f60c\",\n \"layout\": {\n \"h\": 8,\n \"i\": \"27591842-66d4-47b6-b7e7-1d4897f1793b\",\n \"isResizable\": true,\n \"w\": 12,\n \"x\": 0,\n \"y\": 139\n },\n \"maxPerRow\": 4,\n \"name\": \"延迟插入阻塞的平均等待时间\",\n \"options\": {\n \"legend\": {\n \"behaviour\": \"showItem\",\n \"displayMode\": \"hidden\"\n },\n \"standardOptions\": {},\n \"thresholds\": {\n \"steps\": [\n {\n \"color\": \"#634CD9\",\n \"type\": \"base\",\n \"value\": null\n }\n ]\n },\n \"tooltip\": {\n \"mode\": \"all\",\n \"sort\": \"none\"\n }\n },\n \"overrides\": [\n {\n \"matcher\": {\n \"id\": \"byFrameRefID\"\n },\n \"properties\": {\n \"rightYAxisDisplay\": \"off\"\n }\n }\n ],\n \"targets\": [\n {\n \"expr\": \"increase(ClickHouseProfileEvents_DelayedInsertsMilliseconds{instance=~\\\"$instance\\\"}[1m])/(increase(ClickHouseProfileEvents_DelayedInserts{instance=~\\\"$instance\\\"}[1m])+0.01)\",\n \"legend\": \" {{instance}}\",\n \"maxDataPoints\": 240,\n \"refId\": \"A\"\n }\n ],\n \"transformations\": [\n {\n \"id\": \"organize\",\n \"options\": {}\n }\n ],\n \"type\": \"timeseries\",\n \"version\": \"3.0.0\"\n }\n ],\n \"type\": \"row\"\n },\n {\n \"collapsed\": false,\n \"id\": \"681645ab-ef95-4875-9f97-2bf3d0981bf9\",\n \"layout\": {\n \"h\": 1,\n \"i\": \"681645ab-ef95-4875-9f97-2bf3d0981bf9\",\n \"isResizable\": false,\n \"w\": 24,\n \"x\": 0,\n \"y\": 31\n },\n \"name\": \"Select\",\n \"panels\": [\n {\n \"custom\": {\n \"drawStyle\": \"lines\",\n \"fillOpacity\": 0,\n \"gradientMode\": \"none\",\n \"lineInterpolation\": \"smooth\",\n \"lineWidth\": 1,\n \"scaleDistribution\": {\n \"type\": \"linear\"\n },\n \"spanNulls\": false,\n \"stack\": \"off\"\n },\n \"datasourceCate\": \"prometheus\",\n \"datasourceValue\": 1,\n \"description\": \"从MergeTree表读取的数据部分数\",\n \"id\": \"45448ee2-bff9-451b-ad37-dbc34554e57b\",\n \"layout\": {\n \"h\": 8,\n \"i\": \"45448ee2-bff9-451b-ad37-dbc34554e57b\",\n \"isResizable\": true,\n \"w\": 12,\n \"x\": 0,\n \"y\": 186\n },\n \"maxPerRow\": 4,\n \"name\": \"读取的数据部分数\",\n \"options\": {\n \"legend\": {\n \"behaviour\": \"showItem\",\n \"displayMode\": \"hidden\"\n },\n \"standardOptions\": {},\n \"thresholds\": {\n \"steps\": [\n {\n \"color\": \"#634CD9\",\n \"type\": \"base\",\n \"value\": null\n }\n ]\n },\n \"tooltip\": {\n \"mode\": \"all\",\n \"sort\": \"none\"\n }\n },\n \"overrides\": [\n {\n \"matcher\": {\n \"id\": \"byFrameRefID\"\n },\n \"properties\": {\n \"rightYAxisDisplay\": \"off\"\n }\n }\n ],\n \"targets\": [\n {\n \"expr\": \"max_over_time(irate(ClickHouseProfileEvents_SelectedParts{instance=\\\"$instance\\\"}[2m]) [1h:1m]) * $peeks\",\n \"legend\": \"peaks - {{instance}}\",\n \"maxDataPoints\": 240,\n \"refId\": \"A\"\n },\n {\n \"__mode__\": \"__query__\",\n \"expr\": \"rate(ClickHouseProfileEvents_SelectedParts{instance=~\\\"$instance\\\"}[1m]) * $trends\",\n \"legend\": \"trend - {{instance}}\",\n \"maxDataPoints\": 240,\n \"refId\": \"B\"\n }\n ],\n \"transformations\": [\n {\n \"id\": \"organize\",\n \"options\": {}\n }\n ],\n \"type\": \"timeseries\",\n \"version\": \"3.0.0\"\n },\n {\n \"custom\": {\n \"drawStyle\": \"lines\",\n \"fillOpacity\": 0,\n \"gradientMode\": \"none\",\n \"lineInterpolation\": \"smooth\",\n \"lineWidth\": 1,\n \"scaleDistribution\": {\n \"type\": \"linear\"\n },\n \"spanNulls\": false,\n \"stack\": \"off\"\n },\n \"datasourceCate\": \"prometheus\",\n \"datasourceValue\": 1,\n \"description\": \"从MergeTree表读取的所有数据部分中(非相邻)的范围数\",\n \"id\": \"baff20c6-7cc9-47e3-8546-b3c49fc8426f\",\n \"layout\": {\n \"h\": 8,\n \"i\": \"083f8612-e154-40fa-8061-64c29e0bf354\",\n \"isResizable\": true,\n \"w\": 11,\n \"x\": 12,\n \"y\": 186\n },\n \"maxPerRow\": 4,\n \"name\": \"读取的范围数\",\n \"options\": {\n \"legend\": {\n \"behaviour\": \"showItem\",\n \"displayMode\": \"hidden\"\n },\n \"standardOptions\": {},\n \"thresholds\": {\n \"steps\": [\n {\n \"color\": \"#634CD9\",\n \"type\": \"base\",\n \"value\": null\n }\n ]\n },\n \"tooltip\": {\n \"mode\": \"all\",\n \"sort\": \"none\"\n }\n },\n \"overrides\": [\n {\n \"matcher\": {\n \"id\": \"byFrameRefID\"\n },\n \"properties\": {\n \"rightYAxisDisplay\": \"off\"\n }\n }\n ],\n \"targets\": [\n {\n \"expr\": \"max_over_time(irate(ClickHouseProfileEvents_SelectedRanges{instance=\\\"$instance\\\"}[2m]) [1h:1m]) * $peeks\",\n \"legend\": \"peaks - {{instance}}\",\n \"maxDataPoints\": 240,\n \"refId\": \"A\"\n },\n {\n \"__mode__\": \"__query__\",\n \"expr\": \"rate(ClickHouseProfileEvents_SelectedRanges{instance=~\\\"$instance\\\"}[1m]) * $trends\",\n \"legend\": \"trend - {{instance}}\",\n \"maxDataPoints\": 240,\n \"refId\": \"B\"\n }\n ],\n \"transformations\": [\n {\n \"id\": \"organize\",\n \"options\": {}\n }\n ],\n \"type\": \"timeseries\",\n \"version\": \"3.0.0\"\n },\n {\n \"custom\": {\n \"drawStyle\": \"lines\",\n \"fillOpacity\": 0,\n \"gradientMode\": \"none\",\n \"lineInterpolation\": \"smooth\",\n \"lineWidth\": 1,\n \"scaleDistribution\": {\n \"type\": \"linear\"\n },\n \"spanNulls\": false,\n \"stack\": \"off\"\n },\n \"datasourceCate\": \"prometheus\",\n \"datasourceValue\": 1,\n \"description\": \"从MergeTree表读取的标记数(索引粒度)\",\n \"id\": \"efd49ff5-cb50-4df9-8fd0-e6af921dffec\",\n \"layout\": {\n \"h\": 7,\n \"i\": \"7fc603a7-0a32-4b23-b359-b368ddae749e\",\n \"isResizable\": true,\n \"w\": 12,\n \"x\": 0,\n \"y\": 194\n },\n \"maxPerRow\": 4,\n \"name\": \"读取的标记数\",\n \"options\": {\n \"legend\": {\n \"behaviour\": \"showItem\",\n \"displayMode\": \"hidden\"\n },\n \"standardOptions\": {},\n \"thresholds\": {\n \"steps\": [\n {\n \"color\": \"#634CD9\",\n \"type\": \"base\",\n \"value\": null\n }\n ]\n },\n \"tooltip\": {\n \"mode\": \"all\",\n \"sort\": \"none\"\n }\n },\n \"overrides\": [\n {\n \"matcher\": {\n \"id\": \"byFrameRefID\"\n },\n \"properties\": {\n \"rightYAxisDisplay\": \"off\"\n }\n }\n ],\n \"targets\": [\n {\n \"expr\": \"max_over_time(irate(ClickHouseProfileEvents_SelectedMarks{instance=~\\\"$instance\\\"}[2m])[1h:1m]) * $trends\",\n \"legend\": \"peaks - {{instance}}\",\n \"maxDataPoints\": 240,\n \"refId\": \"A\"\n },\n {\n \"__mode__\": \"__query__\",\n \"expr\": \"rate(ClickHouseProfileEvents_SelectedMarks{instance=~\\\"$instance\\\"}[1m]) * $trends\",\n \"legend\": \"trend - {{instance}}\",\n \"maxDataPoints\": 240,\n \"refId\": \"B\"\n }\n ],\n \"transformations\": [\n {\n \"id\": \"organize\",\n \"options\": {}\n }\n ],\n \"type\": \"timeseries\",\n \"version\": \"3.0.0\"\n },\n {\n \"custom\": {\n \"drawStyle\": \"lines\",\n \"fillOpacity\": 0,\n \"gradientMode\": \"none\",\n \"lineInterpolation\": \"smooth\",\n \"lineWidth\": 1,\n \"scaleDistribution\": {\n \"type\": \"linear\"\n },\n \"spanNulls\": false,\n \"stack\": \"off\"\n },\n \"datasourceCate\": \"prometheus\",\n \"datasourceValue\": 1,\n \"description\": \"从所有表SELECT的行数\",\n \"id\": \"a7e4857b-cf88-4ed7-8cf6-adadeb521e78\",\n \"layout\": {\n \"h\": 7,\n \"i\": \"2b63803d-ef02-49bc-aba9-41ac7e85bb9d\",\n \"isResizable\": true,\n \"w\": 11,\n \"x\": 12,\n \"y\": 194\n },\n \"maxPerRow\": 4,\n \"name\": \"SELECT查询的行数\",\n \"options\": {\n \"legend\": {\n \"behaviour\": \"showItem\",\n \"displayMode\": \"hidden\"\n },\n \"standardOptions\": {},\n \"thresholds\": {\n \"steps\": [\n {\n \"color\": \"#634CD9\",\n \"type\": \"base\",\n \"value\": null\n }\n ]\n },\n \"tooltip\": {\n \"mode\": \"all\",\n \"sort\": \"none\"\n }\n },\n \"overrides\": [\n {\n \"matcher\": {\n \"id\": \"byFrameRefID\"\n },\n \"properties\": {\n \"rightYAxisDisplay\": \"off\"\n }\n }\n ],\n \"targets\": [\n {\n \"expr\": \"max_over_time(irate(ClickHouseProfileEvents_SelectedRows{instance=\\\"$instance\\\"}[2m]) [1h:1m]) * $peeks\",\n \"legend\": \"peaks - {{instance}}\",\n \"maxDataPoints\": 240,\n \"refId\": \"A\"\n },\n {\n \"__mode__\": \"__query__\",\n \"expr\": \"rate(ClickHouseProfileEvents_SelectedRows{instance=~\\\"$instance\\\"}[1m]) * $trends\",\n \"legend\": \"trend - {{instance}}\",\n \"maxDataPoints\": 240,\n \"refId\": \"B\"\n }\n ],\n \"transformations\": [\n {\n \"id\": \"organize\",\n \"options\": {}\n }\n ],\n \"type\": \"timeseries\",\n \"version\": \"3.0.0\"\n },\n {\n \"custom\": {\n \"drawStyle\": \"lines\",\n \"fillOpacity\": 0,\n \"gradientMode\": \"none\",\n \"lineInterpolation\": \"smooth\",\n \"lineWidth\": 1,\n \"scaleDistribution\": {\n \"type\": \"linear\"\n },\n \"spanNulls\": false,\n \"stack\": \"off\"\n },\n \"datasourceCate\": \"prometheus\",\n \"datasourceValue\": 1,\n \"description\": \"从所有表SELECT的字节数(未压缩列以它们在内存中存储的形式)\",\n \"id\": \"244865f5-c78a-4b21-8068-462612b8730c\",\n \"layout\": {\n \"h\": 7,\n \"i\": \"628a3845-fc7d-400c-b16c-6181faddd7b9\",\n \"isResizable\": true,\n \"w\": 12,\n \"x\": 0,\n \"y\": 201\n },\n \"maxPerRow\": 4,\n \"name\": \"SELECT查询的字节数\",\n \"options\": {\n \"legend\": {\n \"behaviour\": \"showItem\",\n \"displayMode\": \"hidden\"\n },\n \"standardOptions\": {},\n \"thresholds\": {\n \"steps\": [\n {\n \"color\": \"#634CD9\",\n \"type\": \"base\",\n \"value\": null\n }\n ]\n },\n \"tooltip\": {\n \"mode\": \"all\",\n \"sort\": \"none\"\n }\n },\n \"overrides\": [\n {\n \"matcher\": {\n \"id\": \"byFrameRefID\"\n },\n \"properties\": {\n \"rightYAxisDisplay\": \"off\"\n }\n }\n ],\n \"targets\": [\n {\n \"expr\": \"max_over_time(irate(ClickHouseProfileEvents_SelectedBytes{instance=\\\"$instance\\\"}[2m]) [1h:1m]) * $peeks\\n\\n\",\n \"legend\": \"peaks - {{instance}}\",\n \"maxDataPoints\": 240,\n \"refId\": \"A\"\n },\n {\n \"__mode__\": \"__query__\",\n \"expr\": \"rate(ClickHouseProfileEvents_SelectedBytes{instance=~\\\"$instance\\\"}[1m]) * $trends\",\n \"legend\": \"trend - {{instance}}\",\n \"maxDataPoints\": 240,\n \"refId\": \"B\"\n }\n ],\n \"transformations\": [\n {\n \"id\": \"organize\",\n \"options\": {}\n }\n ],\n \"type\": \"timeseries\",\n \"version\": \"3.0.0\"\n }\n ],\n \"type\": \"row\"\n },\n {\n \"collapsed\": false,\n \"id\": \"1d95c7da-85e1-4a6b-a6a9-68eb19ca821e\",\n \"layout\": {\n \"h\": 1,\n \"i\": \"1d95c7da-85e1-4a6b-a6a9-68eb19ca821e\",\n \"isResizable\": false,\n \"w\": 24,\n \"x\": 0,\n \"y\": 32\n },\n \"name\": \"IO\",\n \"panels\": [\n {\n \"custom\": {\n \"drawStyle\": \"lines\",\n \"fillOpacity\": 0,\n \"gradientMode\": \"none\",\n \"lineInterpolation\": \"smooth\",\n \"lineWidth\": 1,\n \"scaleDistribution\": {\n \"type\": \"linear\"\n },\n \"spanNulls\": false,\n \"stack\": \"off\"\n },\n \"datasourceCate\": \"prometheus\",\n \"datasourceValue\": 1,\n \"description\": \"\",\n \"id\": \"6be5bfc5-8d91-414f-9781-e4b390307961\",\n \"layout\": {\n \"h\": 8,\n \"i\": \"6be5bfc5-8d91-414f-9781-e4b390307961\",\n \"isResizable\": true,\n \"w\": 12,\n \"x\": 0,\n \"y\": 5\n },\n \"maxPerRow\": 4,\n \"name\": \"iseek函数调用次数\",\n \"options\": {\n \"legend\": {\n \"behaviour\": \"showItem\",\n \"displayMode\": \"hidden\"\n },\n \"standardOptions\": {},\n \"thresholds\": {\n \"steps\": [\n {\n \"color\": \"#634CD9\",\n \"type\": \"base\",\n \"value\": null\n }\n ]\n },\n \"tooltip\": {\n \"mode\": \"all\",\n \"sort\": \"none\"\n }\n },\n \"overrides\": [\n {\n \"matcher\": {\n \"id\": \"byFrameRefID\"\n },\n \"properties\": {\n \"rightYAxisDisplay\": \"off\"\n }\n }\n ],\n \"targets\": [\n {\n \"expr\": \"max_over_time(irate(ClickHouseProfileEvents_Seek{instance=\\\"$instance\\\"}[2m]) [1h:1m]) * $peeks\",\n \"legend\": \"peaks - {{instance}}\",\n \"maxDataPoints\": 240,\n \"refId\": \"A\"\n },\n {\n \"__mode__\": \"__query__\",\n \"expr\": \"rate(ClickHouseProfileEvents_Seek{instance=~\\\"$instance\\\"}[1m]) * $trends\",\n \"legend\": \"trend - {{instance}}\",\n \"maxDataPoints\": 240,\n \"refId\": \"B\"\n }\n ],\n \"transformations\": [\n {\n \"id\": \"organize\",\n \"options\": {}\n }\n ],\n \"type\": \"timeseries\",\n \"version\": \"3.0.0\"\n },\n {\n \"custom\": {\n \"drawStyle\": \"lines\",\n \"fillOpacity\": 0,\n \"gradientMode\": \"none\",\n \"lineInterpolation\": \"smooth\",\n \"lineWidth\": 1,\n \"scaleDistribution\": {\n \"type\": \"linear\"\n },\n \"spanNulls\": false,\n \"stack\": \"off\"\n },\n \"datasourceCate\": \"prometheus\",\n \"datasourceValue\": 1,\n \"description\": \"\",\n \"id\": \"df47ce32-e3b6-4d5b-8bc9-4a640ec9c75c\",\n \"layout\": {\n \"h\": 8,\n \"i\": \"4b6a7bf4-e91a-41fb-b2a1-61d79805f2c5\",\n \"isResizable\": true,\n \"w\": 11,\n \"x\": 12,\n \"y\": 5\n },\n \"maxPerRow\": 4,\n \"name\": \"打开的文件数\",\n \"options\": {\n \"legend\": {\n \"behaviour\": \"showItem\",\n \"displayMode\": \"hidden\"\n },\n \"standardOptions\": {},\n \"thresholds\": {\n \"steps\": [\n {\n \"color\": \"#634CD9\",\n \"type\": \"base\",\n \"value\": null\n }\n ]\n },\n \"tooltip\": {\n \"mode\": \"all\",\n \"sort\": \"none\"\n }\n },\n \"overrides\": [\n {\n \"matcher\": {\n \"id\": \"byFrameRefID\"\n },\n \"properties\": {\n \"rightYAxisDisplay\": \"off\"\n }\n }\n ],\n \"targets\": [\n {\n \"expr\": \"max_over_time(irate(ClickHouseProfileEvents_FileOpen{instance=\\\"$instance\\\"}[2m]) [1h:1m]) * $peeks\",\n \"legend\": \"peaks - {{instance}}\",\n \"maxDataPoints\": 240,\n \"refId\": \"A\"\n },\n {\n \"__mode__\": \"__query__\",\n \"expr\": \"rate(ClickHouseProfileEvents_FileOpen{instance=~\\\"$instance\\\"}[1m]) * $trends\",\n \"legend\": \"trend - {{instance}}\",\n \"maxDataPoints\": 240,\n \"refId\": \"B\"\n }\n ],\n \"transformations\": [\n {\n \"id\": \"organize\",\n \"options\": {}\n }\n ],\n \"type\": \"timeseries\",\n \"version\": \"3.0.0\"\n },\n {\n \"custom\": {\n \"drawStyle\": \"lines\",\n \"fillOpacity\": 0,\n \"gradientMode\": \"none\",\n \"lineInterpolation\": \"smooth\",\n \"lineWidth\": 1,\n \"scaleDistribution\": {\n \"type\": \"linear\"\n },\n \"spanNulls\": false,\n \"stack\": \"off\"\n },\n \"datasourceCate\": \"prometheus\",\n \"datasourceValue\": 1,\n \"description\": \"从文件描述符进行读取(read/pread)的次数,不包括套接字\",\n \"id\": \"26318204-5e2c-43dd-93b1-2d0ff34c3c9b\",\n \"layout\": {\n \"h\": 8,\n \"i\": \"e4f66145-d9c6-48df-a9f5-a98ec26cf1e2\",\n \"isResizable\": true,\n \"w\": 12,\n \"x\": 0,\n \"y\": 13\n },\n \"maxPerRow\": 4,\n \"name\": \"从FD文件描述符读取次数\",\n \"options\": {\n \"legend\": {\n \"behaviour\": \"showItem\",\n \"displayMode\": \"hidden\"\n },\n \"standardOptions\": {},\n \"thresholds\": {\n \"steps\": [\n {\n \"color\": \"#634CD9\",\n \"type\": \"base\",\n \"value\": null\n }\n ]\n },\n \"tooltip\": {\n \"mode\": \"all\",\n \"sort\": \"none\"\n }\n },\n \"overrides\": [\n {\n \"matcher\": {\n \"id\": \"byFrameRefID\"\n },\n \"properties\": {\n \"rightYAxisDisplay\": \"off\"\n }\n }\n ],\n \"targets\": [\n {\n \"expr\": \"max_over_time(irate(ClickHouseProfileEvents_ReadBufferFromFileDescriptorRead{instance=\\\"$instance\\\"}[2m]) [1h:1m]) * $peeks\",\n \"legend\": \"peaks - {{instance}}\",\n \"maxDataPoints\": 240,\n \"refId\": \"A\"\n },\n {\n \"__mode__\": \"__query__\",\n \"expr\": \"rate(ClickHouseProfileEvents_ReadBufferFromFileDescriptorRead{instance=~\\\"$instance\\\"}[1m]) * $trends\",\n \"legend\": \"trend - {{instance}}\",\n \"maxDataPoints\": 240,\n \"refId\": \"B\"\n }\n ],\n \"transformations\": [\n {\n \"id\": \"organize\",\n \"options\": {}\n }\n ],\n \"type\": \"timeseries\",\n \"version\": \"3.0.0\"\n },\n {\n \"custom\": {\n \"drawStyle\": \"lines\",\n \"fillOpacity\": 0,\n \"gradientMode\": \"none\",\n \"lineInterpolation\": \"smooth\",\n \"lineWidth\": 1,\n \"scaleDistribution\": {\n \"type\": \"linear\"\n },\n \"spanNulls\": false,\n \"stack\": \"off\"\n },\n \"datasourceCate\": \"prometheus\",\n \"datasourceValue\": 1,\n \"description\": \"向FD写入的次数,不包括套接字\",\n \"id\": \"222a5968-672b-4f4f-ba1a-c823c4be1116\",\n \"layout\": {\n \"h\": 8,\n \"i\": \"3a378a00-6b9f-4098-8a2d-ed32628cc182\",\n \"isResizable\": true,\n \"w\": 11,\n \"x\": 12,\n \"y\": 13\n },\n \"maxPerRow\": 4,\n \"name\": \"向FD写入的次数\",\n \"options\": {\n \"legend\": {\n \"behaviour\": \"showItem\",\n \"displayMode\": \"hidden\"\n },\n \"standardOptions\": {},\n \"thresholds\": {\n \"steps\": [\n {\n \"color\": \"#634CD9\",\n \"type\": \"base\",\n \"value\": null\n }\n ]\n },\n \"tooltip\": {\n \"mode\": \"all\",\n \"sort\": \"none\"\n }\n },\n \"overrides\": [\n {\n \"matcher\": {\n \"id\": \"byFrameRefID\"\n },\n \"properties\": {\n \"rightYAxisDisplay\": \"off\"\n }\n }\n ],\n \"targets\": [\n {\n \"expr\": \"max_over_time(irate(ClickHouseProfileEvents_WriteBufferFromFileDescriptorWrite{instance=\\\"$instance\\\"}[2m]) [1h:1m]) * $peeks\",\n \"legend\": \"peaks - {{instance}}\",\n \"maxDataPoints\": 240,\n \"refId\": \"A\"\n },\n {\n \"__mode__\": \"__query__\",\n \"expr\": \"rate(ClickHouseProfileEvents_WriteBufferFromFileDescriptorWrite{instance=~\\\"$instance\\\"}[1m]) * $trends\",\n \"legend\": \"trend - {{instance}}\",\n \"maxDataPoints\": 240,\n \"refId\": \"B\"\n }\n ],\n \"transformations\": [\n {\n \"id\": \"organize\",\n \"options\": {}\n }\n ],\n \"type\": \"timeseries\",\n \"version\": \"3.0.0\"\n },\n {\n \"custom\": {\n \"drawStyle\": \"lines\",\n \"fillOpacity\": 0,\n \"gradientMode\": \"none\",\n \"lineInterpolation\": \"smooth\",\n \"lineWidth\": 1,\n \"scaleDistribution\": {\n \"type\": \"linear\"\n },\n \"spanNulls\": false,\n \"stack\": \"off\"\n },\n \"datasourceCate\": \"prometheus\",\n \"datasourceValue\": 1,\n \"description\": \"从文件描述符读取(read/pread)失败的次数\",\n \"id\": \"8de4adc5-c3c7-416c-b579-65436ca2504c\",\n \"layout\": {\n \"h\": 7,\n \"i\": \"94330666-c48d-4479-83d9-44e2cb6134d6\",\n \"isResizable\": true,\n \"w\": 12,\n \"x\": 0,\n \"y\": 21\n },\n \"maxPerRow\": 4,\n \"name\": \"从FD读取失败次数\",\n \"options\": {\n \"legend\": {\n \"behaviour\": \"showItem\",\n \"displayMode\": \"hidden\"\n },\n \"standardOptions\": {},\n \"thresholds\": {\n \"steps\": [\n {\n \"color\": \"#634CD9\",\n \"type\": \"base\",\n \"value\": null\n }\n ]\n },\n \"tooltip\": {\n \"mode\": \"all\",\n \"sort\": \"none\"\n }\n },\n \"overrides\": [\n {\n \"matcher\": {\n \"id\": \"byFrameRefID\"\n },\n \"properties\": {\n \"rightYAxisDisplay\": \"off\"\n }\n }\n ],\n \"targets\": [\n {\n \"expr\": \"max_over_time(irate(ClickHouseProfileEvents_ReadBufferFromFileDescriptorReadFailed{instance=\\\"$instance\\\"}[2m]) [1h:1m]) * $peeks\",\n \"legend\": \"peaks - {{instance}}\",\n \"maxDataPoints\": 240,\n \"refId\": \"A\"\n },\n {\n \"__mode__\": \"__query__\",\n \"expr\": \"rate(ClickHouseProfileEvents_ReadBufferFromFileDescriptorReadFailed{instance=~\\\"$instance\\\"}[1m]) * $trends\",\n \"legend\": \"trend - {{instance}}\",\n \"maxDataPoints\": 240,\n \"refId\": \"B\"\n }\n ],\n \"transformations\": [\n {\n \"id\": \"organize\",\n \"options\": {}\n }\n ],\n \"type\": \"timeseries\",\n \"version\": \"3.0.0\"\n },\n {\n \"custom\": {\n \"drawStyle\": \"lines\",\n \"fillOpacity\": 0,\n \"gradientMode\": \"none\",\n \"lineInterpolation\": \"smooth\",\n \"lineWidth\": 1,\n \"scaleDistribution\": {\n \"type\": \"linear\"\n },\n \"spanNulls\": false,\n \"stack\": \"off\"\n },\n \"datasourceCate\": \"prometheus\",\n \"datasourceValue\": 1,\n \"description\": \"从文件描述符读取的字节数。如果文件是压缩的,这将显示压缩后的数据大小\",\n \"id\": \"b5546ead-ef3d-406c-acfc-33759f9d5ad9\",\n \"layout\": {\n \"h\": 7,\n \"i\": \"7e16e52b-7c39-409b-b2f0-1e9f1feaa451\",\n \"isResizable\": true,\n \"w\": 11,\n \"x\": 12,\n \"y\": 21\n },\n \"maxPerRow\": 4,\n \"name\": \"从FD读取的字节数\",\n \"options\": {\n \"legend\": {\n \"behaviour\": \"showItem\",\n \"displayMode\": \"hidden\"\n },\n \"standardOptions\": {},\n \"thresholds\": {\n \"steps\": [\n {\n \"color\": \"#634CD9\",\n \"type\": \"base\",\n \"value\": null\n }\n ]\n },\n \"tooltip\": {\n \"mode\": \"all\",\n \"sort\": \"none\"\n }\n },\n \"overrides\": [\n {\n \"matcher\": {\n \"id\": \"byFrameRefID\"\n },\n \"properties\": {\n \"rightYAxisDisplay\": \"off\"\n }\n }\n ],\n \"targets\": [\n {\n \"expr\": \"irate(ClickHouseProfileEvents_ReadBufferFromFileDescriptorReadBytes{instance=~\\\"$instance\\\"}[2m]) * $trends\",\n \"legend\": \"peaks - {{instance}}\",\n \"maxDataPoints\": 240,\n \"refId\": \"A\"\n },\n {\n \"__mode__\": \"__query__\",\n \"expr\": \"rate(ClickHouseProfileEvents_ReadBufferFromFileDescriptorReadBytes{instance=~\\\"$instance\\\"}[2m]) * $trends\",\n \"legend\": \"trend - {{instance}}\",\n \"maxDataPoints\": 240,\n \"refId\": \"B\"\n }\n ],\n \"transformations\": [\n {\n \"id\": \"organize\",\n \"options\": {}\n }\n ],\n \"type\": \"timeseries\",\n \"version\": \"3.0.0\"\n },\n {\n \"custom\": {\n \"drawStyle\": \"lines\",\n \"fillOpacity\": 0,\n \"gradientMode\": \"none\",\n \"lineInterpolation\": \"smooth\",\n \"lineWidth\": 1,\n \"scaleDistribution\": {\n \"type\": \"linear\"\n },\n \"spanNulls\": false,\n \"stack\": \"off\"\n },\n \"datasourceCate\": \"prometheus\",\n \"datasourceValue\": 1,\n \"description\": \"\",\n \"id\": \"fc2a63e9-aec2-4755-b4a2-8b0f54868bc6\",\n \"layout\": {\n \"h\": 8,\n \"i\": \"7b9965c5-b341-4713-88f1-e5a48183ef94\",\n \"isResizable\": true,\n \"w\": 12,\n \"x\": 0,\n \"y\": 28\n },\n \"maxPerRow\": 4,\n \"name\": \"向FD写入的字节数\",\n \"options\": {\n \"legend\": {\n \"behaviour\": \"showItem\",\n \"displayMode\": \"hidden\"\n },\n \"standardOptions\": {},\n \"thresholds\": {\n \"steps\": [\n {\n \"color\": \"#634CD9\",\n \"type\": \"base\",\n \"value\": null\n }\n ]\n },\n \"tooltip\": {\n \"mode\": \"all\",\n \"sort\": \"none\"\n }\n },\n \"overrides\": [\n {\n \"matcher\": {\n \"id\": \"byFrameRefID\"\n },\n \"properties\": {\n \"rightYAxisDisplay\": \"off\"\n }\n }\n ],\n \"targets\": [\n {\n \"expr\": \"max_over_time(irate(ClickHouseProfileEvents_WriteBufferFromFileDescriptorWriteBytes{instance=\\\"$instance\\\"}[2m]) [1h:1m]) * $peeks\\n\\n\",\n \"legend\": \"peaks - {{instance}}\",\n \"maxDataPoints\": 240,\n \"refId\": \"A\"\n },\n {\n \"__mode__\": \"__query__\",\n \"expr\": \"rate(ClickHouseProfileEvents_WriteBufferFromFileDescriptorWriteBytes{instance=~\\\"$instance\\\"}[2m]) * $trends\",\n \"legend\": \"trend - {{instance}}\",\n \"maxDataPoints\": 240,\n \"refId\": \"B\"\n }\n ],\n \"transformations\": [\n {\n \"id\": \"organize\",\n \"options\": {}\n }\n ],\n \"type\": \"timeseries\",\n \"version\": \"3.0.0\"\n },\n {\n \"custom\": {\n \"drawStyle\": \"lines\",\n \"fillOpacity\": 0,\n \"gradientMode\": \"none\",\n \"lineInterpolation\": \"smooth\",\n \"lineWidth\": 1,\n \"scaleDistribution\": {\n \"type\": \"linear\"\n },\n \"spanNulls\": false,\n \"stack\": \"off\"\n },\n \"datasourceCate\": \"prometheus\",\n \"datasourceValue\": 1,\n \"description\": \"从压缩源(文件,网络)读取的未压缩字节数(解压后的字节数)\",\n \"id\": \"44c6e097-4114-4ef5-89d3-96da2c11ccf3\",\n \"layout\": {\n \"h\": 8,\n \"i\": \"f3dfd2fc-a656-4ef0-a326-1977908ffd90\",\n \"isResizable\": true,\n \"w\": 11,\n \"x\": 12,\n \"y\": 28\n },\n \"maxPerRow\": 4,\n \"name\": \"读取的未压缩字节数\",\n \"options\": {\n \"legend\": {\n \"behaviour\": \"showItem\",\n \"displayMode\": \"hidden\"\n },\n \"standardOptions\": {},\n \"thresholds\": {\n \"steps\": [\n {\n \"color\": \"#634CD9\",\n \"type\": \"base\",\n \"value\": null\n }\n ]\n },\n \"tooltip\": {\n \"mode\": \"all\",\n \"sort\": \"none\"\n }\n },\n \"overrides\": [\n {\n \"matcher\": {\n \"id\": \"byFrameRefID\"\n },\n \"properties\": {\n \"rightYAxisDisplay\": \"off\"\n }\n }\n ],\n \"targets\": [\n {\n \"expr\": \"max_over_time(irate(ClickHouseProfileEvents_CompressedReadBufferBytes{instance=\\\"$instance\\\"}[2m]) [1h:1m]) * $peeks\",\n \"legend\": \"peaks - {{instance}}\",\n \"maxDataPoints\": 240,\n \"refId\": \"A\"\n },\n {\n \"__mode__\": \"__query__\",\n \"expr\": \"rate(ClickHouseProfileEvents_CompressedReadBufferBytes{instance=~\\\"$instance\\\"}[2m]) * $trends\",\n \"legend\": \"trend - {{instance}}\",\n \"maxDataPoints\": 240,\n \"refId\": \"B\"\n }\n ],\n \"transformations\": [\n {\n \"id\": \"organize\",\n \"options\": {}\n }\n ],\n \"type\": \"timeseries\",\n \"version\": \"3.0.0\"\n },\n {\n \"custom\": {\n \"drawStyle\": \"lines\",\n \"fillOpacity\": 0,\n \"gradientMode\": \"none\",\n \"lineInterpolation\": \"smooth\",\n \"lineWidth\": 1,\n \"scaleDistribution\": {\n \"type\": \"linear\"\n },\n \"spanNulls\": false,\n \"stack\": \"off\"\n },\n \"datasourceCate\": \"prometheus\",\n \"datasourceValue\": 1,\n \"description\": \"从压缩源(文件,网络)读取的压缩块数(独立压缩的数据块)\",\n \"id\": \"dc75e7de-7728-4f12-91fc-789cdc2610dd\",\n \"layout\": {\n \"h\": 8,\n \"i\": \"ccfe64c6-a0b2-4179-abce-49a772d43a94\",\n \"isResizable\": true,\n \"w\": 12,\n \"x\": 0,\n \"y\": 36\n },\n \"maxPerRow\": 4,\n \"name\": \"读取的压缩块数\",\n \"options\": {\n \"legend\": {\n \"behaviour\": \"showItem\",\n \"displayMode\": \"hidden\"\n },\n \"standardOptions\": {},\n \"thresholds\": {\n \"steps\": [\n {\n \"color\": \"#634CD9\",\n \"type\": \"base\",\n \"value\": null\n }\n ]\n },\n \"tooltip\": {\n \"mode\": \"all\",\n \"sort\": \"none\"\n }\n },\n \"overrides\": [\n {\n \"matcher\": {\n \"id\": \"byFrameRefID\"\n },\n \"properties\": {\n \"rightYAxisDisplay\": \"off\"\n }\n }\n ],\n \"targets\": [\n {\n \"expr\": \"max_over_time(irate(ClickHouseProfileEvents_CompressedReadBufferBlocks{instance=\\\"$instance\\\"}[2m]) [1h:1m]) * $peeks\\n\\n\",\n \"legend\": \"peaks - {{instance}}\",\n \"maxDataPoints\": 240,\n \"refId\": \"A\"\n },\n {\n \"__mode__\": \"__query__\",\n \"expr\": \"rate(ClickHouseProfileEvents_CompressedReadBufferBlocks{instance=~\\\"$instance\\\"}[2m]) * $trends\",\n \"legend\": \"trend - {{instance}}\",\n \"maxDataPoints\": 240,\n \"refId\": \"B\"\n }\n ],\n \"transformations\": [\n {\n \"id\": \"organize\",\n \"options\": {}\n }\n ],\n \"type\": \"timeseries\",\n \"version\": \"3.0.0\"\n }\n ],\n \"type\": \"row\"\n },\n {\n \"collapsed\": false,\n \"id\": \"f358d0ce-ab09-4f5d-8477-c6c47341f185\",\n \"layout\": {\n \"h\": 1,\n \"i\": \"f358d0ce-ab09-4f5d-8477-c6c47341f185\",\n \"isResizable\": false,\n \"w\": 24,\n \"x\": 0,\n \"y\": 33\n },\n \"name\": \"Replicas\\n\",\n \"panels\": [\n {\n \"custom\": {\n \"drawStyle\": \"lines\",\n \"fillOpacity\": 0,\n \"gradientMode\": \"none\",\n \"lineInterpolation\": \"smooth\",\n \"lineWidth\": 1,\n \"scaleDistribution\": {\n \"type\": \"linear\"\n },\n \"spanNulls\": false,\n \"stack\": \"off\"\n },\n \"datasourceCate\": \"prometheus\",\n \"datasourceValue\": 1,\n \"description\": \"在ClickHouse集群中,由于特定情况而暂时处于只读状态的复制表数量。这种情况通常发生在以下两种情形下:\\n\\nZooKeeper会话丢失后重新初始化:ClickHouse使用ZooKeeper来维护集群间的协调和一致性。如果与ZooKeeper的会话丢失,为了防止数据不一致,相关的复制表可能会被自动设置为只读模式,直到与ZooKeeper的连接恢复并且数据同步完成为止。\\n\\n未配置ZooKeeper启动:如果ClickHouse实例在没有正确配置ZooKeeper的情况下启动,它可能无法确定其在复制集群中的准确状态,从而为了安全起见,将涉及复制的表设置为只读,以避免潜在的数据冲突或不一致性问题。\",\n \"id\": \"24f224bb-3f8c-4dae-9485-d2015e238ba4\",\n \"layout\": {\n \"h\": 8,\n \"i\": \"24f224bb-3f8c-4dae-9485-d2015e238ba4\",\n \"isResizable\": true,\n \"w\": 12,\n \"x\": 0,\n \"y\": 210\n },\n \"maxPerRow\": 4,\n \"name\": \"只读状态的复制表数量\",\n \"options\": {\n \"legend\": {\n \"behaviour\": \"showItem\",\n \"displayMode\": \"hidden\"\n },\n \"standardOptions\": {},\n \"thresholds\": {\n \"steps\": [\n {\n \"color\": \"#634CD9\",\n \"type\": \"base\",\n \"value\": null\n }\n ]\n },\n \"tooltip\": {\n \"mode\": \"all\",\n \"sort\": \"none\"\n }\n },\n \"overrides\": [\n {\n \"matcher\": {\n \"id\": \"byFrameRefID\"\n },\n \"properties\": {\n \"rightYAxisDisplay\": \"off\"\n }\n }\n ],\n \"targets\": [\n {\n \"expr\": \"ClickHouseMetrics_ReadonlyReplica\",\n \"legend\": \"{{instance}}\",\n \"maxDataPoints\": 240,\n \"refId\": \"A\"\n }\n ],\n \"transformations\": [\n {\n \"id\": \"organize\",\n \"options\": {}\n }\n ],\n \"type\": \"timeseries\",\n \"version\": \"3.0.0\"\n },\n {\n \"custom\": {\n \"drawStyle\": \"lines\",\n \"fillOpacity\": 0,\n \"gradientMode\": \"none\",\n \"lineInterpolation\": \"smooth\",\n \"lineWidth\": 1,\n \"scaleDistribution\": {\n \"type\": \"linear\"\n },\n \"spanNulls\": false,\n \"stack\": \"off\"\n },\n \"datasourceCate\": \"prometheus\",\n \"datasourceValue\": 1,\n \"description\": \"从ReplicatedMergeTree表的复制数据合并失败次数\",\n \"id\": \"f71717f8-f96e-4805-968f-c98680a4a264\",\n \"layout\": {\n \"h\": 8,\n \"i\": \"e998108e-a208-4ff6-a046-42d9ff5ba736\",\n \"isResizable\": true,\n \"w\": 11,\n \"x\": 12,\n \"y\": 210\n },\n \"maxPerRow\": 4,\n \"name\": \"复制部分合并失败次数\",\n \"options\": {\n \"legend\": {\n \"behaviour\": \"showItem\",\n \"displayMode\": \"hidden\"\n },\n \"standardOptions\": {},\n \"thresholds\": {\n \"steps\": [\n {\n \"color\": \"#634CD9\",\n \"type\": \"base\",\n \"value\": null\n }\n ]\n },\n \"tooltip\": {\n \"mode\": \"all\",\n \"sort\": \"none\"\n }\n },\n \"overrides\": [\n {\n \"matcher\": {\n \"id\": \"byFrameRefID\"\n },\n \"properties\": {\n \"rightYAxisDisplay\": \"off\"\n }\n }\n ],\n \"targets\": [\n {\n \"expr\": \"max_over_time(irate(ClickHouseProfileEvents_ReplicatedPartFailedFetches{instance=\\\"$instance\\\"}[2m]) [1h:1m]) * $peeks\",\n \"legend\": \"peaks - {{instance}}\",\n \"maxDataPoints\": 240,\n \"refId\": \"A\"\n },\n {\n \"__mode__\": \"__query__\",\n \"expr\": \"rate(ClickHouseProfileEvents_ReplicatedPartFailedFetches{instance=~\\\"$instance\\\"}[2m]) * $trends\",\n \"legend\": \"trend - {{instance}}\",\n \"maxDataPoints\": 240,\n \"refId\": \"B\"\n }\n ],\n \"transformations\": [\n {\n \"id\": \"organize\",\n \"options\": {}\n }\n ],\n \"type\": \"timeseries\",\n \"version\": \"3.0.0\"\n },\n {\n \"custom\": {\n \"drawStyle\": \"lines\",\n \"fillOpacity\": 0,\n \"gradientMode\": \"none\",\n \"lineInterpolation\": \"smooth\",\n \"lineWidth\": 1,\n \"scaleDistribution\": {\n \"type\": \"linear\"\n },\n \"spanNulls\": false,\n \"stack\": \"off\"\n },\n \"datasourceCate\": \"prometheus\",\n \"datasourceValue\": 1,\n \"description\": \"ReplicatedMergeTree表的数据部分成功合并的次数\",\n \"id\": \"f38eeb1b-6682-4e2a-82c4-ddecf95c4029\",\n \"layout\": {\n \"h\": 9,\n \"i\": \"d31de4a5-434f-4985-a077-5a58d0645340\",\n \"isResizable\": true,\n \"w\": 12,\n \"x\": 0,\n \"y\": 218\n },\n \"maxPerRow\": 4,\n \"name\": \"复制部分合并次数\",\n \"options\": {\n \"legend\": {\n \"behaviour\": \"showItem\",\n \"displayMode\": \"hidden\"\n },\n \"standardOptions\": {},\n \"thresholds\": {\n \"steps\": [\n {\n \"color\": \"#634CD9\",\n \"type\": \"base\",\n \"value\": null\n }\n ]\n },\n \"tooltip\": {\n \"mode\": \"all\",\n \"sort\": \"none\"\n }\n },\n \"overrides\": [\n {\n \"matcher\": {\n \"id\": \"byFrameRefID\"\n },\n \"properties\": {\n \"rightYAxisDisplay\": \"off\"\n }\n }\n ],\n \"targets\": [\n {\n \"expr\": \"max_over_time(irate(ClickHouseProfileEvents_ReplicatedPartFetches{instance=\\\"$instance\\\"}[2m]) [1h:1m]) * $peeks\\n\\n\",\n \"legend\": \"peaks - {{instance}}\",\n \"maxDataPoints\": 240,\n \"refId\": \"A\"\n },\n {\n \"__mode__\": \"__query__\",\n \"expr\": \"rate(ClickHouseProfileEvents_ReplicatedPartFetches{instance=~\\\"$instance\\\"}[2m]) * $trends\",\n \"legend\": \"trend - {{instance}}\",\n \"maxDataPoints\": 240,\n \"refId\": \"B\"\n }\n ],\n \"transformations\": [\n {\n \"id\": \"organize\",\n \"options\": {}\n }\n ],\n \"type\": \"timeseries\",\n \"version\": \"3.0.0\"\n },\n {\n \"custom\": {\n \"drawStyle\": \"lines\",\n \"fillOpacity\": 0,\n \"gradientMode\": \"none\",\n \"lineInterpolation\": \"smooth\",\n \"lineWidth\": 1,\n \"scaleDistribution\": {\n \"type\": \"linear\"\n },\n \"spanNulls\": false,\n \"stack\": \"off\"\n },\n \"datasourceCate\": \"prometheus\",\n \"datasourceValue\": 1,\n \"description\": \"在处理ReplicatedMergeTree表时,我们选择从副本中直接下载已经合并过的数据分区的次数,而不是自己进行合并操作。通常情况下,为了节省网络流量,ClickHouse更倾向于自己执行合并操作。但是,在两种特殊情况下会发生这种从副本直接下载已合并分区的情况:\\n\\n缺少合并所需源分区:当本地缺少执行某次合并操作所需的全部原始数据分区时,ClickHouse可能会选择从其他副本那里直接获取已经完成合并的数据分区,以避免因数据不完整导致的合并失败。\\n\\n数据分区过于陈旧:如果某个数据分区已经非常旧,意味着它可能已经被其他副本提前合并并且不再直接可得,这时ClickHouse也可能选择直接从其他副本下载已合并的结果,以减少复杂性和潜在的延迟。\\n\\n这个指标反映了在维持数据一致性和优化资源使用(如减少网络流量与提高合并效率)之间的权衡情况。通过监控此指标,可以了解系统在实际运行中如何平衡这些因素,并据此调整策略或优化配置以达到更好的性能和资源利用率。\",\n \"id\": \"eebb688f-f08d-4802-a4bb-22c69dd59dba\",\n \"layout\": {\n \"h\": 9,\n \"i\": \"031520ac-4699-4c5e-bd44-c0237dabaea1\",\n \"isResizable\": true,\n \"w\": 11,\n \"x\": 12,\n \"y\": 218\n },\n \"maxPerRow\": 4,\n \"name\": \"复制部分获取或合并次数\",\n \"options\": {\n \"legend\": {\n \"behaviour\": \"showItem\",\n \"displayMode\": \"hidden\"\n },\n \"standardOptions\": {},\n \"thresholds\": {\n \"steps\": [\n {\n \"color\": \"#634CD9\",\n \"type\": \"base\",\n \"value\": null\n }\n ]\n },\n \"tooltip\": {\n \"mode\": \"all\",\n \"sort\": \"none\"\n }\n },\n \"overrides\": [\n {\n \"matcher\": {\n \"id\": \"byFrameRefID\"\n },\n \"properties\": {\n \"rightYAxisDisplay\": \"off\"\n }\n }\n ],\n \"targets\": [\n {\n \"expr\": \"max_over_time(irate(ClickHouseProfileEvents_ReplicatedPartFetchesOfMerged{instance=\\\"$instance\\\"}[2m]) [1h:1m]) * $peeks\\n\\n\\n\\n\",\n \"legend\": \"peaks - {{instance}}\",\n \"maxDataPoints\": 240,\n \"refId\": \"A\"\n },\n {\n \"__mode__\": \"__query__\",\n \"expr\": \"rate(ClickHouseProfileEvents_ReplicatedPartFetchesOfMerged{instance=~\\\"$instance\\\"}[2m]) * $trends\",\n \"legend\": \"trend - {{instance}}\",\n \"maxDataPoints\": 240,\n \"refId\": \"B\"\n }\n ],\n \"transformations\": [\n {\n \"id\": \"organize\",\n \"options\": {}\n }\n ],\n \"type\": \"timeseries\",\n \"version\": \"3.0.0\"\n },\n {\n \"custom\": {\n \"drawStyle\": \"lines\",\n \"fillOpacity\": 0,\n \"gradientMode\": \"none\",\n \"lineInterpolation\": \"smooth\",\n \"lineWidth\": 1,\n \"scaleDistribution\": {\n \"type\": \"linear\"\n },\n \"spanNulls\": false,\n \"stack\": \"off\"\n },\n \"datasourceCate\": \"prometheus\",\n \"datasourceValue\": 1,\n \"description\": \"ReplicatedMergeTree表的数据分区成功进行合并的次数\",\n \"id\": \"e80ea72d-67b4-46ac-9573-3805b4587f24\",\n \"layout\": {\n \"h\": 9,\n \"i\": \"1b550063-b9bc-4672-825f-fe64a5dc26c2\",\n \"isResizable\": true,\n \"w\": 12,\n \"x\": 0,\n \"y\": 227\n },\n \"maxPerRow\": 4,\n \"name\": \"复制分区合并次数\",\n \"options\": {\n \"legend\": {\n \"behaviour\": \"showItem\",\n \"displayMode\": \"hidden\"\n },\n \"standardOptions\": {},\n \"thresholds\": {\n \"steps\": [\n {\n \"color\": \"#634CD9\",\n \"type\": \"base\",\n \"value\": null\n }\n ]\n },\n \"tooltip\": {\n \"mode\": \"all\",\n \"sort\": \"none\"\n }\n },\n \"overrides\": [\n {\n \"matcher\": {\n \"id\": \"byFrameRefID\"\n },\n \"properties\": {\n \"rightYAxisDisplay\": \"off\"\n }\n }\n ],\n \"targets\": [\n {\n \"expr\": \"max_over_time(irate(ClickHouseProfileEvents_ReplicatedPartMerges{instance=\\\"$instance\\\"}[2m]) [1h:1m]) * $peeks\\n\\n\",\n \"legend\": \"peaks - {{instance}}\",\n \"maxDataPoints\": 240,\n \"refId\": \"A\"\n },\n {\n \"__mode__\": \"__query__\",\n \"expr\": \"rate(ClickHouseProfileEvents_ReplicatedPartMerges{instance=~\\\"$instance\\\"}[2m]) * $trends\",\n \"legend\": \"trend - {{instance}}\",\n \"maxDataPoints\": 240,\n \"refId\": \"B\"\n }\n ],\n \"transformations\": [\n {\n \"id\": \"organize\",\n \"options\": {}\n }\n ],\n \"type\": \"timeseries\",\n \"version\": \"3.0.0\"\n },\n {\n \"custom\": {\n \"drawStyle\": \"lines\",\n \"fillOpacity\": 0,\n \"gradientMode\": \"none\",\n \"lineInterpolation\": \"smooth\",\n \"lineWidth\": 1,\n \"scaleDistribution\": {\n \"type\": \"linear\"\n },\n \"spanNulls\": false,\n \"stack\": \"off\"\n },\n \"datasourceCate\": \"prometheus\",\n \"datasourceValue\": 1,\n \"description\": \"数据部分在任何副本上都不存在的次数(即使是现在离线的副本)。这些数据部分肯定丢失了。由于异步复制(如果未启用配额插入),当写入数据部分的副本失败并且在故障后重新联机时不包含该数据部分,这是正常现象\",\n \"id\": \"e3e0c41e-01b6-42a0-be74-ca8f94d7afb3\",\n \"layout\": {\n \"h\": 9,\n \"i\": \"630f24d4-9fba-47cd-92b3-a3eb909f0053\",\n \"isResizable\": true,\n \"w\": 11,\n \"x\": 12,\n \"y\": 227\n },\n \"maxPerRow\": 4,\n \"name\": \"复制部分数据丢失次数\",\n \"options\": {\n \"legend\": {\n \"behaviour\": \"showItem\",\n \"displayMode\": \"hidden\"\n },\n \"standardOptions\": {},\n \"thresholds\": {\n \"steps\": [\n {\n \"color\": \"#634CD9\",\n \"type\": \"base\",\n \"value\": null\n }\n ]\n },\n \"tooltip\": {\n \"mode\": \"all\",\n \"sort\": \"none\"\n }\n },\n \"overrides\": [\n {\n \"matcher\": {\n \"id\": \"byFrameRefID\"\n },\n \"properties\": {\n \"rightYAxisDisplay\": \"off\"\n }\n }\n ],\n \"targets\": [\n {\n \"expr\": \"max_over_time(irate(ClickHouseProfileEvents_ReplicatedDataLoss{instance=\\\"$instance\\\"}[2m]) [1h:1m]) * $peeks\\n\\n\",\n \"legend\": \"peaks - {{instance}}\",\n \"maxDataPoints\": 240,\n \"refId\": \"A\"\n },\n {\n \"__mode__\": \"__query__\",\n \"expr\": \"rate(ClickHouseProfileEvents_ReplicatedDataLoss{instance=~\\\"$instance\\\"}[2m]) * $trends\",\n \"legend\": \"trend - {{instance}}\",\n \"maxDataPoints\": 240,\n \"refId\": \"B\"\n }\n ],\n \"transformations\": [\n {\n \"id\": \"organize\",\n \"options\": {}\n }\n ],\n \"type\": \"timeseries\",\n \"version\": \"3.0.0\"\n }\n ],\n \"type\": \"row\"\n },\n {\n \"collapsed\": false,\n \"id\": \"9bdb151e-adfb-4985-ad38-50f83a4b13e1\",\n \"layout\": {\n \"h\": 1,\n \"i\": \"9bdb151e-adfb-4985-ad38-50f83a4b13e1\",\n \"isResizable\": false,\n \"w\": 24,\n \"x\": 0,\n \"y\": 34\n },\n \"name\": \"Merge\",\n \"panels\": [\n {\n \"custom\": {\n \"drawStyle\": \"lines\",\n \"fillOpacity\": 0,\n \"gradientMode\": \"none\",\n \"lineInterpolation\": \"smooth\",\n \"lineWidth\": 1,\n \"scaleDistribution\": {\n \"type\": \"linear\"\n },\n \"spanNulls\": false,\n \"stack\": \"off\"\n },\n \"datasourceCate\": \"prometheus\",\n \"datasourceValue\": 1,\n \"description\": \"启动的后台合并次数\",\n \"id\": \"505ab54d-1897-45d6-a087-db2c2570f8f7\",\n \"layout\": {\n \"h\": 8,\n \"i\": \"505ab54d-1897-45d6-a087-db2c2570f8f7\",\n \"isResizable\": true,\n \"w\": 12,\n \"x\": 0,\n \"y\": 7\n },\n \"maxPerRow\": 4,\n \"name\": \"后台合并次数\",\n \"options\": {\n \"legend\": {\n \"behaviour\": \"showItem\",\n \"displayMode\": \"hidden\"\n },\n \"standardOptions\": {},\n \"thresholds\": {\n \"steps\": [\n {\n \"color\": \"#634CD9\",\n \"type\": \"base\",\n \"value\": null\n }\n ]\n },\n \"tooltip\": {\n \"mode\": \"all\",\n \"sort\": \"none\"\n }\n },\n \"overrides\": [\n {\n \"matcher\": {\n \"id\": \"byFrameRefID\"\n },\n \"properties\": {\n \"rightYAxisDisplay\": \"off\"\n }\n }\n ],\n \"targets\": [\n {\n \"expr\": \"max_over_time(irate(ClickHouseProfileEvents_Merge{instance=\\\"$instance\\\"}[2m]) [1h:1m]) * $peeks\\n\\n\",\n \"legend\": \"peaks - {{instance}}\",\n \"maxDataPoints\": 240,\n \"refId\": \"A\"\n },\n {\n \"__mode__\": \"__query__\",\n \"expr\": \"rate(ClickHouseProfileEvents_Merge{instance=~\\\"$instance\\\"}[2m]) * $trends\",\n \"legend\": \"trend - {{instance}}\",\n \"maxDataPoints\": 240,\n \"refId\": \"B\"\n }\n ],\n \"transformations\": [\n {\n \"id\": \"organize\",\n \"options\": {}\n }\n ],\n \"type\": \"timeseries\",\n \"version\": \"3.0.0\"\n },\n {\n \"custom\": {\n \"drawStyle\": \"lines\",\n \"fillOpacity\": 0,\n \"gradientMode\": \"none\",\n \"lineInterpolation\": \"smooth\",\n \"lineWidth\": 1,\n \"scaleDistribution\": {\n \"type\": \"linear\"\n },\n \"spanNulls\": false,\n \"stack\": \"off\"\n },\n \"datasourceCate\": \"prometheus\",\n \"datasourceValue\": 1,\n \"description\": \"后台合并读取的行数。这是合并前的行数\",\n \"id\": \"cf1cbd45-4762-4b57-b674-91520ee63ff4\",\n \"layout\": {\n \"h\": 8,\n \"i\": \"019fba59-0df6-45d8-a7d0-3adbf32b44f5\",\n \"isResizable\": true,\n \"w\": 11,\n \"x\": 12,\n \"y\": 7\n },\n \"maxPerRow\": 4,\n \"name\": \"合并读取的行数\",\n \"options\": {\n \"legend\": {\n \"behaviour\": \"showItem\",\n \"displayMode\": \"hidden\"\n },\n \"standardOptions\": {},\n \"thresholds\": {\n \"steps\": [\n {\n \"color\": \"#634CD9\",\n \"type\": \"base\",\n \"value\": null\n }\n ]\n },\n \"tooltip\": {\n \"mode\": \"all\",\n \"sort\": \"none\"\n }\n },\n \"overrides\": [\n {\n \"matcher\": {\n \"id\": \"byFrameRefID\"\n },\n \"properties\": {\n \"rightYAxisDisplay\": \"off\"\n }\n }\n ],\n \"targets\": [\n {\n \"expr\": \"max_over_time(irate(ClickHouseProfileEvents_MergedRows{instance=\\\"$instance\\\"}[2m]) [1h:1m]) * $peeks\\n\\n\",\n \"legend\": \"peaks - {{instance}}\",\n \"maxDataPoints\": 240,\n \"refId\": \"A\"\n },\n {\n \"__mode__\": \"__query__\",\n \"expr\": \"rate(ClickHouseProfileEvents_MergedRows{instance=~\\\"$instance\\\"}[2m]) * $trends\",\n \"legend\": \"trend - {{instance}}\",\n \"maxDataPoints\": 240,\n \"refId\": \"B\"\n }\n ],\n \"transformations\": [\n {\n \"id\": \"organize\",\n \"options\": {}\n }\n ],\n \"type\": \"timeseries\",\n \"version\": \"3.0.0\"\n },\n {\n \"custom\": {\n \"drawStyle\": \"lines\",\n \"fillOpacity\": 0,\n \"gradientMode\": \"none\",\n \"lineInterpolation\": \"smooth\",\n \"lineWidth\": 1,\n \"scaleDistribution\": {\n \"type\": \"linear\"\n },\n \"spanNulls\": false,\n \"stack\": \"off\"\n },\n \"datasourceCate\": \"prometheus\",\n \"datasourceValue\": 1,\n \"description\": \"后台合并读取的未压缩字节数(列以它们在内存中存储的形式)。这是合并前的字节数\",\n \"id\": \"bee87dc6-ace1-47c2-8676-3a7a4c33d2bd\",\n \"layout\": {\n \"h\": 9,\n \"i\": \"2a43db17-8490-4f9c-a165-a547b112c31b\",\n \"isResizable\": true,\n \"w\": 12,\n \"x\": 0,\n \"y\": 15\n },\n \"maxPerRow\": 4,\n \"name\": \"合并读取的未压缩字节数\",\n \"options\": {\n \"legend\": {\n \"behaviour\": \"showItem\",\n \"displayMode\": \"hidden\"\n },\n \"standardOptions\": {},\n \"thresholds\": {\n \"steps\": [\n {\n \"color\": \"#634CD9\",\n \"type\": \"base\",\n \"value\": null\n }\n ]\n },\n \"tooltip\": {\n \"mode\": \"all\",\n \"sort\": \"none\"\n }\n },\n \"overrides\": [\n {\n \"matcher\": {\n \"id\": \"byFrameRefID\"\n },\n \"properties\": {\n \"rightYAxisDisplay\": \"off\"\n }\n }\n ],\n \"targets\": [\n {\n \"expr\": \"max_over_time(irate(ClickHouseProfileEvents_MergedUncompressedBytes{instance=\\\"$instance\\\"}[2m]) [1h:1m]) * $peeks\\n\\n\",\n \"legend\": \"peaks - {{instance}}\",\n \"maxDataPoints\": 240,\n \"refId\": \"A\"\n },\n {\n \"__mode__\": \"__query__\",\n \"expr\": \"rate(ClickHouseProfileEvents_MergedUncompressedBytes{instance=~\\\"$instance\\\"}[2m]) * $trends\",\n \"legend\": \"trend - {{instance}}\",\n \"maxDataPoints\": 240,\n \"refId\": \"B\"\n }\n ],\n \"transformations\": [\n {\n \"id\": \"organize\",\n \"options\": {}\n }\n ],\n \"type\": \"timeseries\",\n \"version\": \"3.0.0\"\n },\n {\n \"custom\": {\n \"drawStyle\": \"lines\",\n \"fillOpacity\": 0,\n \"gradientMode\": \"none\",\n \"lineInterpolation\": \"smooth\",\n \"lineWidth\": 1,\n \"scaleDistribution\": {\n \"type\": \"linear\"\n },\n \"spanNulls\": false,\n \"stack\": \"off\"\n },\n \"datasourceCate\": \"prometheus\",\n \"datasourceValue\": 1,\n \"description\": \"\",\n \"id\": \"63c16da6-f138-4f8f-9a36-a0f71454ba5d\",\n \"layout\": {\n \"h\": 9,\n \"i\": \"972b412f-af69-4709-858d-cdae2a1ab35f\",\n \"isResizable\": true,\n \"w\": 11,\n \"x\": 12,\n \"y\": 15\n },\n \"maxPerRow\": 4,\n \"name\": \"合并平均持续时间\",\n \"options\": {\n \"legend\": {\n \"behaviour\": \"showItem\",\n \"displayMode\": \"hidden\"\n },\n \"standardOptions\": {},\n \"thresholds\": {\n \"steps\": [\n {\n \"color\": \"#634CD9\",\n \"type\": \"base\",\n \"value\": null\n }\n ]\n },\n \"tooltip\": {\n \"mode\": \"all\",\n \"sort\": \"none\"\n }\n },\n \"overrides\": [\n {\n \"matcher\": {\n \"id\": \"byFrameRefID\"\n },\n \"properties\": {\n \"rightYAxisDisplay\": \"off\"\n }\n }\n ],\n \"targets\": [\n {\n \"expr\": \"increase(ClickHouseProfileEvents_MergesTimeMilliseconds{instance=~\\\"$instance\\\"}[2m]) / increase(ClickHouseProfileEvents_Merge{instance=~\\\"$instance\\\"}[2m])\",\n \"legend\": \"{{instance}}\",\n \"maxDataPoints\": 240,\n \"refId\": \"A\"\n }\n ],\n \"transformations\": [\n {\n \"id\": \"organize\",\n \"options\": {}\n }\n ],\n \"type\": \"timeseries\",\n \"version\": \"3.0.0\"\n },\n {\n \"custom\": {\n \"drawStyle\": \"lines\",\n \"fillOpacity\": 0,\n \"gradientMode\": \"none\",\n \"lineInterpolation\": \"smooth\",\n \"lineWidth\": 1,\n \"scaleDistribution\": {\n \"type\": \"linear\"\n },\n \"spanNulls\": false,\n \"stack\": \"off\"\n },\n \"datasourceCate\": \"prometheus\",\n \"datasourceValue\": 1,\n \"description\": \"\",\n \"id\": \"a01d3de2-a79d-49d9-b238-e5db403d8259\",\n \"layout\": {\n \"h\": 8,\n \"i\": \"8b2138af-31bb-4c88-b983-08eead1da3ba\",\n \"isResizable\": true,\n \"w\": 12,\n \"x\": 0,\n \"y\": 24\n },\n \"maxPerRow\": 4,\n \"name\": \"MergeTree表插入的行数\",\n \"options\": {\n \"legend\": {\n \"behaviour\": \"showItem\",\n \"displayMode\": \"hidden\"\n },\n \"standardOptions\": {},\n \"thresholds\": {\n \"steps\": [\n {\n \"color\": \"#634CD9\",\n \"type\": \"base\",\n \"value\": null\n }\n ]\n },\n \"tooltip\": {\n \"mode\": \"all\",\n \"sort\": \"none\"\n }\n },\n \"overrides\": [\n {\n \"matcher\": {\n \"id\": \"byFrameRefID\"\n },\n \"properties\": {\n \"rightYAxisDisplay\": \"off\"\n }\n }\n ],\n \"targets\": [\n {\n \"expr\": \"max_over_time(irate(ClickHouseProfileEvents_MergeTreeDataWriterRows{instance=\\\"$instance\\\"}[2m]) [1h:1m]) * $peeks\",\n \"legend\": \"peaks - {{instance}}\",\n \"maxDataPoints\": 240,\n \"refId\": \"A\"\n },\n {\n \"__mode__\": \"__query__\",\n \"expr\": \"rate(ClickHouseProfileEvents_MergeTreeDataWriterRows{instance=~\\\"$instance\\\"}[2m]) * $trends\",\n \"legend\": \"trend - {{instance}}\",\n \"maxDataPoints\": 240,\n \"refId\": \"B\"\n }\n ],\n \"transformations\": [\n {\n \"id\": \"organize\",\n \"options\": {}\n }\n ],\n \"type\": \"timeseries\",\n \"version\": \"3.0.0\"\n },\n {\n \"custom\": {\n \"drawStyle\": \"lines\",\n \"fillOpacity\": 0,\n \"gradientMode\": \"none\",\n \"lineInterpolation\": \"smooth\",\n \"lineWidth\": 1,\n \"scaleDistribution\": {\n \"type\": \"linear\"\n },\n \"spanNulls\": false,\n \"stack\": \"off\"\n },\n \"datasourceCate\": \"prometheus\",\n \"datasourceValue\": 1,\n \"description\": \"向MergeTree系列表(包括ReplicatedMergeTree等变种)中插入数据时所用的数据块数量\",\n \"id\": \"87a118d2-305d-4eb9-921a-39bbf11b56b5\",\n \"layout\": {\n \"h\": 8,\n \"i\": \"ea833f12-d5fa-419f-9825-5fd105a709df\",\n \"isResizable\": true,\n \"w\": 11,\n \"x\": 12,\n \"y\": 24\n },\n \"maxPerRow\": 4,\n \"name\": \"MergeTree插入块数\",\n \"options\": {\n \"legend\": {\n \"behaviour\": \"showItem\",\n \"displayMode\": \"hidden\"\n },\n \"standardOptions\": {},\n \"thresholds\": {\n \"steps\": [\n {\n \"color\": \"#634CD9\",\n \"type\": \"base\",\n \"value\": null\n }\n ]\n },\n \"tooltip\": {\n \"mode\": \"all\",\n \"sort\": \"none\"\n }\n },\n \"overrides\": [\n {\n \"matcher\": {\n \"id\": \"byFrameRefID\"\n },\n \"properties\": {\n \"rightYAxisDisplay\": \"off\"\n }\n }\n ],\n \"targets\": [\n {\n \"expr\": \"max_over_time(irate(ClickHouseProfileEvents_MergeTreeDataWriterBlocks{instance=\\\"$instance\\\"}[2m]) [1h:1m]) * $peeks\",\n \"legend\": \"peaks - {{instance}}\",\n \"maxDataPoints\": 240,\n \"refId\": \"A\"\n },\n {\n \"__mode__\": \"__query__\",\n \"expr\": \"rate(ClickHouseProfileEvents_MergeTreeDataWriterBlocks{instance=~\\\"$instance\\\"}[2m]) * $trends\",\n \"legend\": \"trend - {{instance}}\",\n \"maxDataPoints\": 240,\n \"refId\": \"B\"\n }\n ],\n \"transformations\": [\n {\n \"id\": \"organize\",\n \"options\": {}\n }\n ],\n \"type\": \"timeseries\",\n \"version\": \"3.0.0\"\n },\n {\n \"custom\": {\n \"drawStyle\": \"lines\",\n \"fillOpacity\": 0,\n \"gradientMode\": \"none\",\n \"lineInterpolation\": \"smooth\",\n \"lineWidth\": 1,\n \"scaleDistribution\": {\n \"type\": \"linear\"\n },\n \"spanNulls\": false,\n \"stack\": \"off\"\n },\n \"datasourceCate\": \"prometheus\",\n \"datasourceValue\": 1,\n \"description\": \"插入到MergeTree表的未压缩字节数(列以它们在内存中存储的形式)\",\n \"id\": \"3dca4a05-b0cc-4e63-ae32-ee5261b6b7b3\",\n \"layout\": {\n \"h\": 8,\n \"i\": \"84893385-fa2f-4016-b820-df600797b4a9\",\n \"isResizable\": true,\n \"w\": 12,\n \"x\": 0,\n \"y\": 32\n },\n \"maxPerRow\": 4,\n \"name\": \"MergeTree 表插入的未压缩字节数\",\n \"options\": {\n \"legend\": {\n \"behaviour\": \"showItem\",\n \"displayMode\": \"hidden\"\n },\n \"standardOptions\": {},\n \"thresholds\": {\n \"steps\": [\n {\n \"color\": \"#634CD9\",\n \"type\": \"base\",\n \"value\": null\n }\n ]\n },\n \"tooltip\": {\n \"mode\": \"all\",\n \"sort\": \"none\"\n }\n },\n \"overrides\": [\n {\n \"matcher\": {\n \"id\": \"byFrameRefID\"\n },\n \"properties\": {\n \"rightYAxisDisplay\": \"off\"\n }\n }\n ],\n \"targets\": [\n {\n \"expr\": \"max_over_time(irate(ClickHouseProfileEvents_MergeTreeDataWriterUncompressedBytes{instance=\\\"$instance\\\"}[2m]) [1h:1m]) * $peeks\\n\\n\",\n \"legend\": \"peaks - {{instance}}\",\n \"maxDataPoints\": 240,\n \"refId\": \"A\"\n },\n {\n \"__mode__\": \"__query__\",\n \"expr\": \"rate(ClickHouseProfileEvents_MergeTreeDataWriterUncompressedBytes{instance=~\\\"$instance\\\"}[2m]) * $trends\",\n \"legend\": \"trend - {{instance}}\",\n \"maxDataPoints\": 240,\n \"refId\": \"B\"\n }\n ],\n \"transformations\": [\n {\n \"id\": \"organize\",\n \"options\": {}\n }\n ],\n \"type\": \"timeseries\",\n \"version\": \"3.0.0\"\n },\n {\n \"custom\": {\n \"drawStyle\": \"lines\",\n \"fillOpacity\": 0,\n \"gradientMode\": \"none\",\n \"lineInterpolation\": \"smooth\",\n \"lineWidth\": 1,\n \"scaleDistribution\": {\n \"type\": \"linear\"\n },\n \"spanNulls\": false,\n \"stack\": \"off\"\n },\n \"datasourceCate\": \"prometheus\",\n \"datasourceValue\": 1,\n \"description\": \"插入到MergeTree表的数据写入到文件系统的字节数\",\n \"id\": \"6777102c-5efe-4082-9a86-d58f76d751ba\",\n \"layout\": {\n \"h\": 8,\n \"i\": \"96a43967-afda-4c33-80f2-ce1237afeb35\",\n \"isResizable\": true,\n \"w\": 11,\n \"x\": 12,\n \"y\": 32\n },\n \"maxPerRow\": 4,\n \"name\": \"MergeTree 表写入的压缩字节数\",\n \"options\": {\n \"legend\": {\n \"behaviour\": \"showItem\",\n \"displayMode\": \"hidden\"\n },\n \"standardOptions\": {},\n \"thresholds\": {\n \"steps\": [\n {\n \"color\": \"#634CD9\",\n \"type\": \"base\",\n \"value\": null\n }\n ]\n },\n \"tooltip\": {\n \"mode\": \"all\",\n \"sort\": \"none\"\n }\n },\n \"overrides\": [\n {\n \"matcher\": {\n \"id\": \"byFrameRefID\"\n },\n \"properties\": {\n \"rightYAxisDisplay\": \"off\"\n }\n }\n ],\n \"targets\": [\n {\n \"expr\": \"max_over_time(irate(ClickHouseProfileEvents_MergeTreeDataWriterCompressedBytes{instance=\\\"$instance\\\"}[2m]) [1h:1m]) * $peeks\\n\\n\",\n \"legend\": \"peaks - {{instance}}\",\n \"maxDataPoints\": 240,\n \"refId\": \"A\"\n },\n {\n \"__mode__\": \"__query__\",\n \"expr\": \"rate(ClickHouseProfileEvents_MergeTreeDataWriterCompressedBytes{instance=~\\\"$instance\\\"}[2m]) * $trends\",\n \"legend\": \"trend - {{instance}}\",\n \"maxDataPoints\": 240,\n \"refId\": \"B\"\n }\n ],\n \"transformations\": [\n {\n \"id\": \"organize\",\n \"options\": {}\n }\n ],\n \"type\": \"timeseries\",\n \"version\": \"3.0.0\"\n },\n {\n \"custom\": {\n \"drawStyle\": \"lines\",\n \"fillOpacity\": 0,\n \"gradientMode\": \"none\",\n \"lineInterpolation\": \"smooth\",\n \"lineWidth\": 1,\n \"scaleDistribution\": {\n \"type\": \"linear\"\n },\n \"spanNulls\": false,\n \"stack\": \"off\"\n },\n \"datasourceCate\": \"prometheus\",\n \"datasourceValue\": 1,\n \"description\": \"为当前运行的后台合并保留的磁盘空间。它略大于当前合并部分的总大小\",\n \"id\": \"2b70d3a1-f9e2-4b35-b181-809091fe0aa0\",\n \"layout\": {\n \"h\": 8,\n \"i\": \"8612a9c6-bdbd-4eea-837e-84bf93205446\",\n \"isResizable\": true,\n \"w\": 12,\n \"x\": 0,\n \"y\": 40\n },\n \"maxPerRow\": 4,\n \"name\": \"保留空间\",\n \"options\": {\n \"legend\": {\n \"behaviour\": \"showItem\",\n \"displayMode\": \"hidden\"\n },\n \"standardOptions\": {},\n \"thresholds\": {\n \"steps\": [\n {\n \"color\": \"#634CD9\",\n \"type\": \"base\",\n \"value\": null\n }\n ]\n },\n \"tooltip\": {\n \"mode\": \"all\",\n \"sort\": \"none\"\n }\n },\n \"overrides\": [\n {\n \"matcher\": {\n \"id\": \"byFrameRefID\"\n },\n \"properties\": {\n \"rightYAxisDisplay\": \"off\"\n }\n }\n ],\n \"targets\": [\n {\n \"expr\": \"ClickHouseMetrics_DiskSpaceReservedForMerge\",\n \"legend\": \"{{instance}}\",\n \"maxDataPoints\": 240,\n \"refId\": \"A\"\n }\n ],\n \"transformations\": [\n {\n \"id\": \"organize\",\n \"options\": {}\n }\n ],\n \"type\": \"timeseries\",\n \"version\": \"3.0.0\"\n }\n ],\n \"type\": \"row\"\n },\n {\n \"collapsed\": false,\n \"id\": \"13a904ce-b661-4abb-bce6-d3f91cd09a05\",\n \"layout\": {\n \"h\": 1,\n \"i\": \"13a904ce-b661-4abb-bce6-d3f91cd09a05\",\n \"isResizable\": false,\n \"w\": 24,\n \"x\": 0,\n \"y\": 76\n },\n \"name\": \"Cache\",\n \"panels\": [\n {\n \"custom\": {\n \"drawStyle\": \"lines\",\n \"fillOpacity\": 0,\n \"gradientMode\": \"none\",\n \"lineInterpolation\": \"smooth\",\n \"lineWidth\": 1,\n \"scaleDistribution\": {\n \"type\": \"linear\"\n },\n \"spanNulls\": false,\n \"stack\": \"off\"\n },\n \"datasourceCate\": \"prometheus\",\n \"datasourceValue\": 1,\n \"id\": \"b19b7613-4e09-4412-a256-fd1900db5b8f\",\n \"layout\": {\n \"h\": 8,\n \"i\": \"b19b7613-4e09-4412-a256-fd1900db5b8f\",\n \"isResizable\": true,\n \"w\": 12,\n \"x\": 0,\n \"y\": 49\n },\n \"maxPerRow\": 4,\n \"name\": \"未压缩缓存命中次数\",\n \"options\": {\n \"legend\": {\n \"behaviour\": \"showItem\",\n \"displayMode\": \"hidden\"\n },\n \"standardOptions\": {},\n \"thresholds\": {\n \"steps\": [\n {\n \"color\": \"#634CD9\",\n \"type\": \"base\",\n \"value\": null\n }\n ]\n },\n \"tooltip\": {\n \"mode\": \"all\",\n \"sort\": \"none\"\n }\n },\n \"overrides\": [\n {\n \"matcher\": {\n \"id\": \"byFrameRefID\"\n },\n \"properties\": {\n \"rightYAxisDisplay\": \"off\"\n }\n }\n ],\n \"targets\": [\n {\n \"expr\": \"max_over_time(irate(ClickHouseProfileEvents_UncompressedCacheHits{instance=\\\"$instance\\\"}[2m]) [1h:1m]) * $peeks\\n\\n\",\n \"legend\": \"peaks - {{instance}}\",\n \"maxDataPoints\": 240,\n \"refId\": \"A\"\n },\n {\n \"__mode__\": \"__query__\",\n \"expr\": \"rate(ClickHouseProfileEvents_UncompressedCacheHits{instance=~\\\"$instance\\\"}[2m]) * $trends\",\n \"legend\": \"trend - {{instance}}\",\n \"maxDataPoints\": 240,\n \"refId\": \"B\"\n }\n ],\n \"transformations\": [\n {\n \"id\": \"organize\",\n \"options\": {}\n }\n ],\n \"type\": \"timeseries\",\n \"version\": \"3.0.0\"\n },\n {\n \"custom\": {\n \"drawStyle\": \"lines\",\n \"fillOpacity\": 0,\n \"gradientMode\": \"none\",\n \"lineInterpolation\": \"smooth\",\n \"lineWidth\": 1,\n \"scaleDistribution\": {\n \"type\": \"linear\"\n },\n \"spanNulls\": false,\n \"stack\": \"off\"\n },\n \"datasourceCate\": \"prometheus\",\n \"datasourceValue\": 1,\n \"id\": \"cad9b78d-c186-4232-9fc4-dfa52d7225d9\",\n \"layout\": {\n \"h\": 8,\n \"i\": \"2f8aec48-ccea-4793-b390-e560e57465f8\",\n \"isResizable\": true,\n \"w\": 11,\n \"x\": 12,\n \"y\": 49\n },\n \"maxPerRow\": 4,\n \"name\": \"未压缩缓存未命中次数\",\n \"options\": {\n \"legend\": {\n \"behaviour\": \"showItem\",\n \"displayMode\": \"hidden\"\n },\n \"standardOptions\": {},\n \"thresholds\": {\n \"steps\": [\n {\n \"color\": \"#634CD9\",\n \"type\": \"base\",\n \"value\": null\n }\n ]\n },\n \"tooltip\": {\n \"mode\": \"all\",\n \"sort\": \"none\"\n }\n },\n \"overrides\": [\n {\n \"matcher\": {\n \"id\": \"byFrameRefID\"\n },\n \"properties\": {\n \"rightYAxisDisplay\": \"off\"\n }\n }\n ],\n \"targets\": [\n {\n \"expr\": \"max_over_time(irate(ClickHouseProfileEvents_UncompressedCacheMisses{instance=\\\"$instance\\\"}[2m]) [1h:1m]) * $peeks\",\n \"legend\": \"peaks - {{instance}}\",\n \"maxDataPoints\": 240,\n \"refId\": \"A\"\n },\n {\n \"__mode__\": \"__query__\",\n \"expr\": \"rate(ClickHouseProfileEvents_UncompressedCacheMisses{instance=~\\\"$instance\\\"}[2m]) * $trends\",\n \"legend\": \"trend - {{instance}}\",\n \"maxDataPoints\": 240,\n \"refId\": \"B\"\n }\n ],\n \"transformations\": [\n {\n \"id\": \"organize\",\n \"options\": {}\n }\n ],\n \"type\": \"timeseries\",\n \"version\": \"3.0.0\"\n },\n {\n \"custom\": {\n \"drawStyle\": \"lines\",\n \"fillOpacity\": 0,\n \"gradientMode\": \"none\",\n \"lineInterpolation\": \"smooth\",\n \"lineWidth\": 1,\n \"scaleDistribution\": {\n \"type\": \"linear\"\n },\n \"spanNulls\": false,\n \"stack\": \"off\"\n },\n \"datasourceCate\": \"prometheus\",\n \"datasourceValue\": 1,\n \"id\": \"2011555e-68d4-47b5-8a36-cc0055b51fc9\",\n \"layout\": {\n \"h\": 8,\n \"i\": \"9760b76c-c63c-4a73-b6a4-6ad709bb6e87\",\n \"isResizable\": true,\n \"w\": 12,\n \"x\": 0,\n \"y\": 57\n },\n \"maxPerRow\": 4,\n \"name\": \"标记缓存命中次数\",\n \"options\": {\n \"legend\": {\n \"behaviour\": \"showItem\",\n \"displayMode\": \"hidden\"\n },\n \"standardOptions\": {},\n \"thresholds\": {\n \"steps\": [\n {\n \"color\": \"#634CD9\",\n \"type\": \"base\",\n \"value\": null\n }\n ]\n },\n \"tooltip\": {\n \"mode\": \"all\",\n \"sort\": \"none\"\n }\n },\n \"overrides\": [\n {\n \"matcher\": {\n \"id\": \"byFrameRefID\"\n },\n \"properties\": {\n \"rightYAxisDisplay\": \"off\"\n }\n }\n ],\n \"targets\": [\n {\n \"expr\": \"max_over_time(irate(ClickHouseProfileEvents_MarkCacheHits{instance=\\\"$instance\\\"}[2m]) [1h:1m]) * $peeks\",\n \"legend\": \"peaks - {{instance}}\",\n \"maxDataPoints\": 240,\n \"refId\": \"A\"\n },\n {\n \"__mode__\": \"__query__\",\n \"expr\": \"rate(ClickHouseProfileEvents_MarkCacheHits{instance=~\\\"$instance\\\"}[2m]) * $trends\",\n \"legend\": \"trend - {{instance}}\",\n \"maxDataPoints\": 240,\n \"refId\": \"B\"\n }\n ],\n \"transformations\": [\n {\n \"id\": \"organize\",\n \"options\": {}\n }\n ],\n \"type\": \"timeseries\",\n \"version\": \"3.0.0\"\n },\n {\n \"custom\": {\n \"drawStyle\": \"lines\",\n \"fillOpacity\": 0,\n \"gradientMode\": \"none\",\n \"lineInterpolation\": \"smooth\",\n \"lineWidth\": 1,\n \"scaleDistribution\": {\n \"type\": \"linear\"\n },\n \"spanNulls\": false,\n \"stack\": \"off\"\n },\n \"datasourceCate\": \"prometheus\",\n \"datasourceValue\": 1,\n \"id\": \"6423431d-916e-4a79-9db1-d0146e0c83fd\",\n \"layout\": {\n \"h\": 8,\n \"i\": \"443329a2-56bf-4632-8491-ca581b88b93b\",\n \"isResizable\": true,\n \"w\": 11,\n \"x\": 12,\n \"y\": 57\n },\n \"maxPerRow\": 4,\n \"name\": \"标记缓存未命中次数\",\n \"options\": {\n \"legend\": {\n \"behaviour\": \"showItem\",\n \"displayMode\": \"hidden\"\n },\n \"standardOptions\": {},\n \"thresholds\": {\n \"steps\": [\n {\n \"color\": \"#634CD9\",\n \"type\": \"base\",\n \"value\": null\n }\n ]\n },\n \"tooltip\": {\n \"mode\": \"all\",\n \"sort\": \"none\"\n }\n },\n \"overrides\": [\n {\n \"matcher\": {\n \"id\": \"byFrameRefID\"\n },\n \"properties\": {\n \"rightYAxisDisplay\": \"off\"\n }\n }\n ],\n \"targets\": [\n {\n \"expr\": \"rate(ClickHouseProfileEvents_MarkCacheMisses{instance=~\\\"$instance\\\"}[2m]) * $trends\",\n \"legend\": \"peaks - {{instance}}\",\n \"maxDataPoints\": 240,\n \"refId\": \"A\"\n },\n {\n \"__mode__\": \"__query__\",\n \"expr\": \"rate(ClickHouseProfileEvents_MarkCacheMisses{instance=~\\\"$instance\\\"}[2m]) * $trends\",\n \"legend\": \"trend - {{instance}}\",\n \"maxDataPoints\": 240,\n \"refId\": \"B\"\n }\n ],\n \"transformations\": [\n {\n \"id\": \"organize\",\n \"options\": {}\n }\n ],\n \"type\": \"timeseries\",\n \"version\": \"3.0.0\"\n }\n ],\n \"type\": \"row\"\n },\n {\n \"collapsed\": false,\n \"id\": \"b408fca8-4054-4ea6-a131-c3c76439d036\",\n \"layout\": {\n \"h\": 1,\n \"i\": \"b408fca8-4054-4ea6-a131-c3c76439d036\",\n \"isResizable\": false,\n \"w\": 24,\n \"x\": 0,\n \"y\": 93\n },\n \"name\": \"Parts\",\n \"panels\": [\n {\n \"custom\": {\n \"drawStyle\": \"lines\",\n \"fillOpacity\": 0,\n \"gradientMode\": \"none\",\n \"lineInterpolation\": \"smooth\",\n \"lineWidth\": 1,\n \"scaleDistribution\": {\n \"type\": \"linear\"\n },\n \"spanNulls\": false,\n \"stack\": \"off\"\n },\n \"datasourceCate\": \"prometheus\",\n \"datasourceValue\": 1,\n \"description\": \"目前正在生成的部分,不在数据部分列表中\",\n \"id\": \"3a06dade-4969-40bf-aab1-1a5f3950a75f\",\n \"layout\": {\n \"h\": 8,\n \"i\": \"3a06dade-4969-40bf-aab1-1a5f3950a75f\",\n \"isResizable\": true,\n \"w\": 12,\n \"x\": 0,\n \"y\": 9\n },\n \"maxPerRow\": 4,\n \"name\": \"临时部分数\",\n \"options\": {\n \"legend\": {\n \"behaviour\": \"showItem\",\n \"displayMode\": \"hidden\"\n },\n \"standardOptions\": {},\n \"thresholds\": {\n \"steps\": [\n {\n \"color\": \"#634CD9\",\n \"type\": \"base\",\n \"value\": null\n }\n ]\n },\n \"tooltip\": {\n \"mode\": \"all\",\n \"sort\": \"none\"\n }\n },\n \"overrides\": [\n {\n \"matcher\": {\n \"id\": \"byFrameRefID\"\n },\n \"properties\": {\n \"rightYAxisDisplay\": \"off\"\n }\n }\n ],\n \"targets\": [\n {\n \"expr\": \"ClickHouseMetrics_PartsTemporary\",\n \"maxDataPoints\": 240,\n \"refId\": \"A\"\n }\n ],\n \"transformations\": [\n {\n \"id\": \"organize\",\n \"options\": {}\n }\n ],\n \"type\": \"timeseries\",\n \"version\": \"3.0.0\"\n },\n {\n \"custom\": {\n \"drawStyle\": \"lines\",\n \"fillOpacity\": 0,\n \"gradientMode\": \"none\",\n \"lineInterpolation\": \"smooth\",\n \"lineWidth\": 1,\n \"scaleDistribution\": {\n \"type\": \"linear\"\n },\n \"spanNulls\": false,\n \"stack\": \"off\"\n },\n \"datasourceCate\": \"prometheus\",\n \"datasourceValue\": 1,\n \"description\": \"在数据部分中,但不用于SELECT查询的部分\\t\\n\",\n \"id\": \"fd497233-3f93-4f73-9dc7-4045d1454eef\",\n \"layout\": {\n \"h\": 8,\n \"i\": \"cd29ec5b-f032-4464-a1b5-ed987e7d5cd3\",\n \"isResizable\": true,\n \"w\": 12,\n \"x\": 12,\n \"y\": 9\n },\n \"maxPerRow\": 4,\n \"name\": \"预提交部分数\",\n \"options\": {\n \"legend\": {\n \"behaviour\": \"showItem\",\n \"displayMode\": \"hidden\"\n },\n \"standardOptions\": {},\n \"thresholds\": {\n \"steps\": [\n {\n \"color\": \"#634CD9\",\n \"type\": \"base\",\n \"value\": null\n }\n ]\n },\n \"tooltip\": {\n \"mode\": \"all\",\n \"sort\": \"none\"\n }\n },\n \"overrides\": [\n {\n \"matcher\": {\n \"id\": \"byFrameRefID\"\n },\n \"properties\": {\n \"rightYAxisDisplay\": \"off\"\n }\n }\n ],\n \"targets\": [\n {\n \"expr\": \"ClickHouseMetrics_PartsPreCommitted\",\n \"maxDataPoints\": 240,\n \"refId\": \"A\"\n }\n ],\n \"transformations\": [\n {\n \"id\": \"organize\",\n \"options\": {}\n }\n ],\n \"type\": \"timeseries\",\n \"version\": \"3.0.0\"\n },\n {\n \"custom\": {\n \"drawStyle\": \"lines\",\n \"fillOpacity\": 0,\n \"gradientMode\": \"none\",\n \"lineInterpolation\": \"smooth\",\n \"lineWidth\": 1,\n \"scaleDistribution\": {\n \"type\": \"linear\"\n },\n \"spanNulls\": false,\n \"stack\": \"off\"\n },\n \"datasourceCate\": \"prometheus\",\n \"datasourceValue\": 1,\n \"description\": \"已经提交的数据部分的数量\",\n \"id\": \"b688234f-b66a-440f-8a95-20e2a45df833\",\n \"layout\": {\n \"h\": 7,\n \"i\": \"d12a6546-3f67-4c25-90ed-16ec3d13ec94\",\n \"isResizable\": true,\n \"w\": 12,\n \"x\": 0,\n \"y\": 17\n },\n \"maxPerRow\": 4,\n \"name\": \"提交部分数\",\n \"options\": {\n \"legend\": {\n \"behaviour\": \"showItem\",\n \"displayMode\": \"hidden\"\n },\n \"standardOptions\": {},\n \"thresholds\": {\n \"steps\": [\n {\n \"color\": \"#634CD9\",\n \"type\": \"base\",\n \"value\": null\n }\n ]\n },\n \"tooltip\": {\n \"mode\": \"all\",\n \"sort\": \"none\"\n }\n },\n \"overrides\": [\n {\n \"matcher\": {\n \"id\": \"byFrameRefID\"\n },\n \"properties\": {\n \"rightYAxisDisplay\": \"off\"\n }\n }\n ],\n \"targets\": [\n {\n \"expr\": \"ClickHouseMetrics_PartsCommitted\",\n \"maxDataPoints\": 240,\n \"refId\": \"A\"\n }\n ],\n \"transformations\": [\n {\n \"id\": \"organize\",\n \"options\": {}\n }\n ],\n \"type\": \"timeseries\",\n \"version\": \"3.0.0\"\n },\n {\n \"custom\": {\n \"drawStyle\": \"lines\",\n \"fillOpacity\": 0,\n \"gradientMode\": \"none\",\n \"lineInterpolation\": \"smooth\",\n \"lineWidth\": 1,\n \"scaleDistribution\": {\n \"type\": \"linear\"\n },\n \"spanNulls\": false,\n \"stack\": \"off\"\n },\n \"datasourceCate\": \"prometheus\",\n \"datasourceValue\": 1,\n \"description\": \"暂时保留、等待相关查询结束即可清理的数据分区的数量。\",\n \"id\": \"85faac0b-b923-4f38-b10a-9a38b98f89ee\",\n \"layout\": {\n \"h\": 7,\n \"i\": \"ee8c8080-9a96-445e-a45a-164b735ae0fa\",\n \"isResizable\": true,\n \"w\": 12,\n \"x\": 12,\n \"y\": 17\n },\n \"maxPerRow\": 4,\n \"name\": \"过时分区\",\n \"options\": {\n \"legend\": {\n \"behaviour\": \"showItem\",\n \"displayMode\": \"hidden\"\n },\n \"standardOptions\": {},\n \"thresholds\": {\n \"steps\": [\n {\n \"color\": \"#634CD9\",\n \"type\": \"base\",\n \"value\": null\n }\n ]\n },\n \"tooltip\": {\n \"mode\": \"all\",\n \"sort\": \"none\"\n }\n },\n \"overrides\": [\n {\n \"matcher\": {\n \"id\": \"byFrameRefID\"\n },\n \"properties\": {\n \"rightYAxisDisplay\": \"off\"\n }\n }\n ],\n \"targets\": [\n {\n \"expr\": \"ClickHouseMetrics_PartsOutdated\",\n \"maxDataPoints\": 240,\n \"refId\": \"A\"\n }\n ],\n \"transformations\": [\n {\n \"id\": \"organize\",\n \"options\": {}\n }\n ],\n \"type\": \"timeseries\",\n \"version\": \"3.0.0\"\n },\n {\n \"custom\": {\n \"drawStyle\": \"lines\",\n \"fillOpacity\": 0,\n \"gradientMode\": \"none\",\n \"lineInterpolation\": \"smooth\",\n \"lineWidth\": 1,\n \"scaleDistribution\": {\n \"type\": \"linear\"\n },\n \"spanNulls\": false,\n \"stack\": \"off\"\n },\n \"datasourceCate\": \"prometheus\",\n \"datasourceValue\": 1,\n \"description\": \"\",\n \"id\": \"1e45da14-63a6-4adb-be34-a83f9469af84\",\n \"layout\": {\n \"h\": 7,\n \"i\": \"fca8edbe-2eb2-45a0-8886-ba554aa98100\",\n \"isResizable\": true,\n \"w\": 12,\n \"x\": 0,\n \"y\": 24\n },\n \"maxPerRow\": 4,\n \"name\": \"正删除数据\",\n \"options\": {\n \"legend\": {\n \"behaviour\": \"showItem\",\n \"displayMode\": \"hidden\"\n },\n \"standardOptions\": {},\n \"thresholds\": {\n \"steps\": [\n {\n \"color\": \"#634CD9\",\n \"type\": \"base\",\n \"value\": null\n }\n ]\n },\n \"tooltip\": {\n \"mode\": \"all\",\n \"sort\": \"none\"\n }\n },\n \"overrides\": [\n {\n \"matcher\": {\n \"id\": \"byFrameRefID\"\n },\n \"properties\": {\n \"rightYAxisDisplay\": \"off\"\n }\n }\n ],\n \"targets\": [\n {\n \"expr\": \"ClickHouseMetrics_PartsDeleting\",\n \"maxDataPoints\": 240,\n \"refId\": \"A\"\n }\n ],\n \"transformations\": [\n {\n \"id\": \"organize\",\n \"options\": {}\n }\n ],\n \"type\": \"timeseries\",\n \"version\": \"3.0.0\"\n },\n {\n \"custom\": {\n \"drawStyle\": \"lines\",\n \"fillOpacity\": 0,\n \"gradientMode\": \"none\",\n \"lineInterpolation\": \"smooth\",\n \"lineWidth\": 1,\n \"scaleDistribution\": {\n \"type\": \"linear\"\n },\n \"spanNulls\": false,\n \"stack\": \"off\"\n },\n \"datasourceCate\": \"prometheus\",\n \"datasourceValue\": 1,\n \"description\": \"记录了当前有多少个数据分区正处于这样一种待删除的状态——即这些分区已经被逻辑上标记为“待清理”,并且它们的物理删除操作将在资源被正式释放时由系统自动执行。\",\n \"id\": \"0fb33f4e-2392-4fb7-bbdb-486c8520e957\",\n \"layout\": {\n \"h\": 7,\n \"i\": \"c09e1b70-3d5c-4d1d-9bac-9c7d0957ff22\",\n \"isResizable\": true,\n \"w\": 12,\n \"x\": 12,\n \"y\": 24\n },\n \"maxPerRow\": 4,\n \"name\": \"待清理\",\n \"options\": {\n \"legend\": {\n \"behaviour\": \"showItem\",\n \"displayMode\": \"hidden\"\n },\n \"standardOptions\": {},\n \"thresholds\": {\n \"steps\": [\n {\n \"color\": \"#634CD9\",\n \"type\": \"base\",\n \"value\": null\n }\n ]\n },\n \"tooltip\": {\n \"mode\": \"all\",\n \"sort\": \"none\"\n }\n },\n \"overrides\": [\n {\n \"matcher\": {\n \"id\": \"byFrameRefID\"\n },\n \"properties\": {\n \"rightYAxisDisplay\": \"off\"\n }\n }\n ],\n \"targets\": [\n {\n \"expr\": \"ClickHouseMetrics_PartsDeleteOnDestroy\",\n \"maxDataPoints\": 240,\n \"refId\": \"A\"\n }\n ],\n \"transformations\": [\n {\n \"id\": \"organize\",\n \"options\": {}\n }\n ],\n \"type\": \"timeseries\",\n \"version\": \"3.0.0\"\n },\n {\n \"custom\": {\n \"drawStyle\": \"lines\",\n \"fillOpacity\": 0,\n \"gradientMode\": \"none\",\n \"lineInterpolation\": \"smooth\",\n \"lineWidth\": 1,\n \"scaleDistribution\": {\n \"type\": \"linear\"\n },\n \"spanNulls\": false,\n \"stack\": \"off\"\n },\n \"datasourceCate\": \"prometheus\",\n \"datasourceValue\": 1,\n \"description\": \"包含了大量列或者说是字段广泛的数据。一个宽数据分区意味着单个数据块或行包含很多列,这可能会影响到数据处理和查询的效率,尤其是在涉及大量列的选择或聚合操作时。\",\n \"id\": \"75a6156e-66c8-4b05-a7f3-303d6babe521\",\n \"layout\": {\n \"h\": 7,\n \"i\": \"cd3637a2-e1af-4c1d-ab12-b5e85caf6835\",\n \"isResizable\": true,\n \"w\": 12,\n \"x\": 0,\n \"y\": 31\n },\n \"maxPerRow\": 4,\n \"name\": \"宽数据分区\",\n \"options\": {\n \"legend\": {\n \"behaviour\": \"showItem\",\n \"displayMode\": \"hidden\"\n },\n \"standardOptions\": {},\n \"thresholds\": {\n \"steps\": [\n {\n \"color\": \"#634CD9\",\n \"type\": \"base\",\n \"value\": null\n }\n ]\n },\n \"tooltip\": {\n \"mode\": \"all\",\n \"sort\": \"none\"\n }\n },\n \"overrides\": [\n {\n \"matcher\": {\n \"id\": \"byFrameRefID\"\n },\n \"properties\": {\n \"rightYAxisDisplay\": \"off\"\n }\n }\n ],\n \"targets\": [\n {\n \"expr\": \"ClickHouseMetrics_PartsWide\",\n \"maxDataPoints\": 240,\n \"refId\": \"A\"\n }\n ],\n \"transformations\": [\n {\n \"id\": \"organize\",\n \"options\": {}\n }\n ],\n \"type\": \"timeseries\",\n \"version\": \"3.0.0\"\n },\n {\n \"custom\": {\n \"drawStyle\": \"lines\",\n \"fillOpacity\": 0,\n \"gradientMode\": \"none\",\n \"lineInterpolation\": \"smooth\",\n \"lineWidth\": 1,\n \"scaleDistribution\": {\n \"type\": \"linear\"\n },\n \"spanNulls\": false,\n \"stack\": \"off\"\n },\n \"datasourceCate\": \"prometheus\",\n \"datasourceValue\": 1,\n \"description\": \"当前数据库中经过压缩处理的数据分区的数量。这些分区通过算法减少了数据占用的空间,同时保持了数据的完整性和查询的可行性。\",\n \"id\": \"bb287913-7ef7-408f-9feb-d875b3683157\",\n \"layout\": {\n \"h\": 7,\n \"i\": \"a40b9909-1cc3-47bd-b28e-aca03bd777bd\",\n \"isResizable\": true,\n \"w\": 12,\n \"x\": 12,\n \"y\": 31\n },\n \"maxPerRow\": 4,\n \"name\": \"压缩数据分区 \",\n \"options\": {\n \"legend\": {\n \"behaviour\": \"showItem\",\n \"displayMode\": \"hidden\"\n },\n \"standardOptions\": {},\n \"thresholds\": {\n \"steps\": [\n {\n \"color\": \"#634CD9\",\n \"type\": \"base\",\n \"value\": null\n }\n ]\n },\n \"tooltip\": {\n \"mode\": \"all\",\n \"sort\": \"none\"\n }\n },\n \"overrides\": [\n {\n \"matcher\": {\n \"id\": \"byFrameRefID\"\n },\n \"properties\": {\n \"rightYAxisDisplay\": \"off\"\n }\n }\n ],\n \"targets\": [\n {\n \"expr\": \"ClickHouseMetrics_PartsCompact\",\n \"maxDataPoints\": 240,\n \"refId\": \"A\"\n }\n ],\n \"transformations\": [\n {\n \"id\": \"organize\",\n \"options\": {}\n }\n ],\n \"type\": \"timeseries\",\n \"version\": \"3.0.0\"\n }\n ],\n \"type\": \"row\"\n },\n {\n \"collapsed\": false,\n \"id\": \"5aa89429-c4b8-4733-a7b9-2abfc45fb836\",\n \"layout\": {\n \"h\": 1,\n \"i\": \"5aa89429-c4b8-4733-a7b9-2abfc45fb836\",\n \"isResizable\": false,\n \"w\": 24,\n \"x\": 0,\n \"y\": 94\n },\n \"name\": \"Distributed\",\n \"panels\": [\n {\n \"custom\": {\n \"drawStyle\": \"lines\",\n \"fillOpacity\": 0,\n \"gradientMode\": \"none\",\n \"lineInterpolation\": \"smooth\",\n \"lineWidth\": 1,\n \"scaleDistribution\": {\n \"type\": \"linear\"\n },\n \"spanNulls\": false,\n \"stack\": \"off\"\n },\n \"datasourceCate\": \"prometheus\",\n \"datasourceValue\": 1,\n \"description\": \"衡量的是向远程服务器发送数据的连接数量,这些数据最初是插入到 Distributed 表中的。Distributed 表是 ClickHouse 中用于分布式存储和处理数据的一种特殊表类型,它实际上不存储数据,而是将数据操作(如 INSERT 查询)转发到表所定义的远程节点上。通过监控这个指标,您可以了解到数据分布的活跃程度,即 ClickHouse 集群内部数据流动的频繁程度,以及分布式查询或数据加载操作的负载情况。高数值可能意味着大量的数据正在被分布式地处理或存储,这可能是系统繁忙或数据管道高效运行的迹象。然而,如果发现该指标异常高且伴随性能问题,可能需要进一步调查网络状况、远程服务器的处理能力或分布式表的配置,以优化数据传输效率和系统整体性能。\",\n \"id\": \"b9dde172-3e02-4e71-891f-5fb97c9c0571\",\n \"layout\": {\n \"h\": 9,\n \"i\": \"b9dde172-3e02-4e71-891f-5fb97c9c0571\",\n \"isResizable\": true,\n \"w\": 12,\n \"x\": 0,\n \"y\": 67\n },\n \"maxPerRow\": 4,\n \"name\": \"向远程服务器发送数据的连接数量\",\n \"options\": {\n \"legend\": {\n \"behaviour\": \"showItem\",\n \"displayMode\": \"hidden\"\n },\n \"standardOptions\": {},\n \"thresholds\": {\n \"steps\": [\n {\n \"color\": \"#634CD9\",\n \"type\": \"base\",\n \"value\": null\n }\n ]\n },\n \"tooltip\": {\n \"mode\": \"all\",\n \"sort\": \"none\"\n }\n },\n \"overrides\": [\n {\n \"matcher\": {\n \"id\": \"byFrameRefID\"\n },\n \"properties\": {\n \"rightYAxisDisplay\": \"off\"\n }\n }\n ],\n \"targets\": [\n {\n \"expr\": \"ClickHouseMetrics_DistributedSend\",\n \"maxDataPoints\": 240,\n \"refId\": \"A\"\n }\n ],\n \"transformations\": [\n {\n \"id\": \"organize\",\n \"options\": {}\n }\n ],\n \"type\": \"timeseries\",\n \"version\": \"3.0.0\"\n },\n {\n \"custom\": {\n \"drawStyle\": \"lines\",\n \"fillOpacity\": 0,\n \"gradientMode\": \"none\",\n \"lineInterpolation\": \"smooth\",\n \"lineWidth\": 1,\n \"scaleDistribution\": {\n \"type\": \"linear\"\n },\n \"spanNulls\": false,\n \"stack\": \"off\"\n },\n \"datasourceCate\": \"prometheus\",\n \"datasourceValue\": 1,\n \"description\": \"等待异步插入到 Distributed 表中的文件数量\\n这个指标对于监控数据导入或异步处理流程的效率至关重要。如果数值较大,可能意味着有大量数据正在排队等待写入 Distributed 表,这可能会影响数据的实时性或处理速度。高数值还可能指示了数据导入作业的积压、网络瓶颈、远程节点处理能力不足或其他与分布式系统相关的性能问题。\\n\\n监控 ClickHouseMetrics_DistributedFilesToInsert 可以帮助识别和诊断数据流中的瓶颈,进而采取相应的优化措施,比如调整插入作业的并发度、优化网络配置、增加目标表的处理能力或调整分布式表的配置参数,以确保数据能够高效、及时地被分布式存储和处理。\",\n \"id\": \"4f1782d0-5572-4a75-ba90-c74914246557\",\n \"layout\": {\n \"h\": 9,\n \"i\": \"dd975296-d2cd-42fe-b23b-bb8c8dfa1c17\",\n \"isResizable\": true,\n \"w\": 11,\n \"x\": 12,\n \"y\": 67\n },\n \"maxPerRow\": 4,\n \"name\": \"插入文件数\",\n \"options\": {\n \"legend\": {\n \"behaviour\": \"showItem\",\n \"displayMode\": \"hidden\"\n },\n \"standardOptions\": {},\n \"thresholds\": {\n \"steps\": [\n {\n \"color\": \"#634CD9\",\n \"type\": \"base\",\n \"value\": null\n }\n ]\n },\n \"tooltip\": {\n \"mode\": \"all\",\n \"sort\": \"none\"\n }\n },\n \"overrides\": [\n {\n \"matcher\": {\n \"id\": \"byFrameRefID\"\n },\n \"properties\": {\n \"rightYAxisDisplay\": \"off\"\n }\n }\n ],\n \"targets\": [\n {\n \"expr\": \"ClickHouseMetrics_DistributedFilesToInsert\",\n \"maxDataPoints\": 240,\n \"refId\": \"A\"\n }\n ],\n \"transformations\": [\n {\n \"id\": \"organize\",\n \"options\": {}\n }\n ],\n \"type\": \"timeseries\",\n \"version\": \"3.0.0\"\n },\n {\n \"custom\": {\n \"drawStyle\": \"lines\",\n \"fillOpacity\": 0,\n \"gradientMode\": \"none\",\n \"lineInterpolation\": \"smooth\",\n \"lineWidth\": 1,\n \"scaleDistribution\": {\n \"type\": \"linear\"\n },\n \"spanNulls\": false,\n \"stack\": \"off\"\n },\n \"datasourceCate\": \"prometheus\",\n \"datasourceValue\": 1,\n \"description\": \"向 Distributed 表插入数据块的操作因为待处理字节数量过高而被限制或延迟的次数。在 ClickHouse 中,为了防止瞬间大量数据涌入导致的网络拥塞或远程节点处理压力过大,系统会实施一定的流量控制策略。当待处理的数据量(以字节为单位)超过某一阈值时,新的插入请求不会立即执行,而是被暂时搁置或排队,直至系统资源得到释放或负载减轻\",\n \"id\": \"c4d506ae-7b4b-48e4-bb9a-9ba769bf5b5d\",\n \"layout\": {\n \"h\": 8,\n \"i\": \"cd092198-32df-46c9-80e5-cf5cb961c699\",\n \"isResizable\": true,\n \"w\": 12,\n \"x\": 0,\n \"y\": 76\n },\n \"maxPerRow\": 4,\n \"name\": \"分布式延迟插入\",\n \"options\": {\n \"legend\": {\n \"behaviour\": \"showItem\",\n \"displayMode\": \"hidden\"\n },\n \"standardOptions\": {},\n \"thresholds\": {\n \"steps\": [\n {\n \"color\": \"#634CD9\",\n \"type\": \"base\",\n \"value\": null\n }\n ]\n },\n \"tooltip\": {\n \"mode\": \"all\",\n \"sort\": \"none\"\n }\n },\n \"overrides\": [\n {\n \"matcher\": {\n \"id\": \"byFrameRefID\"\n },\n \"properties\": {\n \"rightYAxisDisplay\": \"off\"\n }\n }\n ],\n \"targets\": [\n {\n \"expr\": \"max_over_time(irate(ClickHouseProfileEvents_DistributedDelayedInserts{instance=\\\"$instance\\\"}[2m]) [1h:1m]) * $peeks\",\n \"legend\": \"peaks - {{instance}}\",\n \"maxDataPoints\": 240,\n \"refId\": \"A\"\n },\n {\n \"__mode__\": \"__query__\",\n \"expr\": \"rate(ClickHouseProfileEvents_DistributedDelayedInserts{instance=~\\\"$instance\\\"}[2m]) * $trends\",\n \"legend\": \"trend - {{instance}}\",\n \"maxDataPoints\": 240,\n \"refId\": \"B\"\n }\n ],\n \"transformations\": [\n {\n \"id\": \"organize\",\n \"options\": {}\n }\n ],\n \"type\": \"timeseries\",\n \"version\": \"3.0.0\"\n },\n {\n \"custom\": {\n \"drawStyle\": \"lines\",\n \"fillOpacity\": 0,\n \"gradientMode\": \"none\",\n \"lineInterpolation\": \"smooth\",\n \"lineWidth\": 1,\n \"scaleDistribution\": {\n \"type\": \"linear\"\n },\n \"spanNulls\": false,\n \"stack\": \"off\"\n },\n \"datasourceCate\": \"prometheus\",\n \"datasourceValue\": 1,\n \"description\": \"向 Distributed 表插入数据块的操作因待处理字节数量过多而被拒绝的次数,具体原因是触发了 \\\"Too many bytes\\\"(字节过多)异常\",\n \"id\": \"26bb38f5-075c-4589-9bd0-6bcfcc2e0cfe\",\n \"layout\": {\n \"h\": 8,\n \"i\": \"8b14f559-5849-46c3-a897-685d7912f274\",\n \"isResizable\": true,\n \"w\": 11,\n \"x\": 12,\n \"y\": 76\n },\n \"maxPerRow\": 4,\n \"name\": \" 分布式拒绝插入\",\n \"options\": {\n \"legend\": {\n \"behaviour\": \"showItem\",\n \"displayMode\": \"hidden\"\n },\n \"standardOptions\": {},\n \"thresholds\": {\n \"steps\": [\n {\n \"color\": \"#634CD9\",\n \"type\": \"base\",\n \"value\": null\n }\n ]\n },\n \"tooltip\": {\n \"mode\": \"all\",\n \"sort\": \"none\"\n }\n },\n \"overrides\": [\n {\n \"matcher\": {\n \"id\": \"byFrameRefID\"\n },\n \"properties\": {\n \"rightYAxisDisplay\": \"off\"\n }\n }\n ],\n \"targets\": [\n {\n \"expr\": \"max_over_time(irate(ClickHouseProfileEvents_DistributedRejectedInserts{instance=\\\"$instance\\\"}[2m]) [1h:1m]) * $peeks\",\n \"legend\": \"peaks - {{instance}}\",\n \"maxDataPoints\": 240,\n \"refId\": \"A\"\n },\n {\n \"__mode__\": \"__query__\",\n \"expr\": \"rate(ClickHouseProfileEvents_DistributedRejectedInserts{instance=~\\\"$instance\\\"}[2m]) * $trends\",\n \"legend\": \"trend - {{instance}}\",\n \"maxDataPoints\": 240,\n \"refId\": \"B\"\n }\n ],\n \"transformations\": [\n {\n \"id\": \"organize\",\n \"options\": {}\n }\n ],\n \"type\": \"timeseries\",\n \"version\": \"3.0.0\"\n },\n {\n \"custom\": {\n \"drawStyle\": \"lines\",\n \"fillOpacity\": 0,\n \"gradientMode\": \"none\",\n \"lineInterpolation\": \"smooth\",\n \"lineWidth\": 1,\n \"scaleDistribution\": {\n \"type\": \"linear\"\n },\n \"spanNulls\": false,\n \"stack\": \"off\"\n },\n \"datasourceCate\": \"prometheus\",\n \"datasourceValue\": 1,\n \"description\": \"在因待处理字节数量过多而导致向 Distributed 表插入数据块的操作被限制期间,所有延迟插入操作总共花费的毫秒数的平均值。这个指标反映的是插入延迟的具体时间成本,帮助理解数据写入过程中因流量控制而累积的等待时间。\",\n \"id\": \"0c15cda6-0281-4274-878b-909eee7f7442\",\n \"layout\": {\n \"h\": 8,\n \"i\": \"3aa55c66-2947-4f05-82fd-0607c6262c6a\",\n \"isResizable\": true,\n \"w\": 12,\n \"x\": 0,\n \"y\": 84\n },\n \"maxPerRow\": 4,\n \"name\": \" 平均延迟插入耗时\",\n \"options\": {\n \"legend\": {\n \"behaviour\": \"showItem\",\n \"displayMode\": \"hidden\"\n },\n \"standardOptions\": {},\n \"thresholds\": {\n \"steps\": [\n {\n \"color\": \"#634CD9\",\n \"type\": \"base\",\n \"value\": null\n }\n ]\n },\n \"tooltip\": {\n \"mode\": \"all\",\n \"sort\": \"none\"\n }\n },\n \"overrides\": [\n {\n \"matcher\": {\n \"id\": \"byFrameRefID\"\n },\n \"properties\": {\n \"rightYAxisDisplay\": \"off\"\n }\n }\n ],\n \"targets\": [\n {\n \"expr\": \"increase(ClickHouseProfileEvents_DistributedDelayedInsertsMilliseconds{instance=~\\\"$instance\\\"}[2m]) / increase(ClickHouseProfileEvents_DistributedDelayedInserts{instance=~\\\"$instance\\\"}[2m])\",\n \"legend\": \"{{instance}}\",\n \"maxDataPoints\": 240,\n \"refId\": \"A\"\n }\n ],\n \"transformations\": [\n {\n \"id\": \"organize\",\n \"options\": {}\n }\n ],\n \"type\": \"timeseries\",\n \"version\": \"3.0.0\"\n },\n {\n \"custom\": {\n \"drawStyle\": \"lines\",\n \"fillOpacity\": 0,\n \"gradientMode\": \"none\",\n \"lineInterpolation\": \"smooth\",\n \"lineWidth\": 1,\n \"scaleDistribution\": {\n \"type\": \"linear\"\n },\n \"spanNulls\": false,\n \"stack\": \"off\"\n },\n \"datasourceCate\": \"prometheus\",\n \"datasourceValue\": 1,\n \"description\": \"ClickHouse尝试与分布式表中的远程节点建立连接时失败并进行重试的总次数。这意味着在执行分布式查询或数据插入操作时,ClickHouse遇到网络问题、远程节点不可达或其他连接错误,导致初次连接尝试失败,随后系统按照配置进行了重试\",\n \"id\": \"3fb44129-7577-4f12-a7b4-03a850685bab\",\n \"layout\": {\n \"h\": 8,\n \"i\": \"b4725cd2-0e9b-4f38-b9ac-838681e511ea\",\n \"isResizable\": true,\n \"w\": 11,\n \"x\": 12,\n \"y\": 84\n },\n \"maxPerRow\": 4,\n \"name\": \"分布式连接失败尝试次数\",\n \"options\": {\n \"legend\": {\n \"behaviour\": \"showItem\",\n \"displayMode\": \"hidden\"\n },\n \"standardOptions\": {},\n \"thresholds\": {\n \"steps\": [\n {\n \"color\": \"#634CD9\",\n \"type\": \"base\",\n \"value\": null\n }\n ]\n },\n \"tooltip\": {\n \"mode\": \"all\",\n \"sort\": \"none\"\n }\n },\n \"overrides\": [\n {\n \"matcher\": {\n \"id\": \"byFrameRefID\"\n },\n \"properties\": {\n \"rightYAxisDisplay\": \"off\"\n }\n }\n ],\n \"targets\": [\n {\n \"expr\": \"rate(ClickHouseProfileEvents_DistributedConnectionFailTry{instance=~\\\"$instance\\\"}[2m]) * $trends\",\n \"legend\": \"peaks - {{instance}}\",\n \"maxDataPoints\": 240,\n \"refId\": \"A\"\n },\n {\n \"__mode__\": \"__query__\",\n \"expr\": \"rate(ClickHouseProfileEvents_DistributedConnectionFailTry{instance=~\\\"$instance\\\"}[2m]) * $trends\",\n \"legend\": \"trend - {{instance}}\",\n \"maxDataPoints\": 240,\n \"refId\": \"B\"\n }\n ],\n \"transformations\": [\n {\n \"id\": \"organize\",\n \"options\": {}\n }\n ],\n \"type\": \"timeseries\",\n \"version\": \"3.0.0\"\n },\n {\n \"custom\": {\n \"drawStyle\": \"lines\",\n \"fillOpacity\": 0,\n \"gradientMode\": \"none\",\n \"lineInterpolation\": \"smooth\",\n \"lineWidth\": 1,\n \"scaleDistribution\": {\n \"type\": \"linear\"\n },\n \"spanNulls\": false,\n \"stack\": \"off\"\n },\n \"datasourceCate\": \"prometheus\",\n \"datasourceValue\": 1,\n \"description\": \"在ClickHouse进行所有重试尝试之后仍然未能成功建立到分布式表中远程节点的连接的累计次数。这意味着在尝试与分布式集群中的某个节点通信时,尽管系统已经按照配置进行了多次重试,但最终还是未能成功建立连接。\",\n \"id\": \"154c703c-0bef-43f1-8bbe-d9145f5edda2\",\n \"layout\": {\n \"h\": 8,\n \"i\": \"7622fae5-074a-4072-bd02-010f7c5adbd1\",\n \"isResizable\": true,\n \"w\": 12,\n \"x\": 0,\n \"y\": 92\n },\n \"maxPerRow\": 4,\n \"name\": \"所有重试后分布式连接失败总数\",\n \"options\": {\n \"legend\": {\n \"behaviour\": \"showItem\",\n \"displayMode\": \"hidden\"\n },\n \"standardOptions\": {},\n \"thresholds\": {\n \"steps\": [\n {\n \"color\": \"#634CD9\",\n \"type\": \"base\",\n \"value\": null\n }\n ]\n },\n \"tooltip\": {\n \"mode\": \"all\",\n \"sort\": \"none\"\n }\n },\n \"overrides\": [\n {\n \"matcher\": {\n \"id\": \"byFrameRefID\"\n },\n \"properties\": {\n \"rightYAxisDisplay\": \"off\"\n }\n }\n ],\n \"targets\": [\n {\n \"expr\": \"rate(ClickHouseProfileEvents_DistributedConnectionFailAtAll{instance=~\\\"$instance\\\"}[2m]) * $trends\",\n \"legend\": \"peaks - {{instance}}\",\n \"maxDataPoints\": 240,\n \"refId\": \"A\"\n },\n {\n \"__mode__\": \"__query__\",\n \"expr\": \"rate(ClickHouseProfileEvents_DistributedConnectionFailAtAll{instance=~\\\"$instance\\\"}[2m]) * $trends\",\n \"legend\": \"trend - {{instance}}\",\n \"maxDataPoints\": 240,\n \"refId\": \"B\"\n }\n ],\n \"transformations\": [\n {\n \"id\": \"organize\",\n \"options\": {}\n }\n ],\n \"type\": \"timeseries\",\n \"version\": \"3.0.0\"\n },\n {\n \"custom\": {\n \"drawStyle\": \"lines\",\n \"fillOpacity\": 0,\n \"gradientMode\": \"none\",\n \"lineInterpolation\": \"smooth\",\n \"lineWidth\": 1,\n \"scaleDistribution\": {\n \"type\": \"linear\"\n },\n \"spanNulls\": false,\n \"stack\": \"off\"\n },\n \"datasourceCate\": \"prometheus\",\n \"datasourceValue\": 1,\n \"description\": \"因超时而未能成功完成的同步插入Distributed表的操作\",\n \"id\": \"34b8272c-ef89-4f0c-a2a5-d7a4706c008d\",\n \"layout\": {\n \"h\": 8,\n \"i\": \"5622086d-6ca8-4d9e-85e8-a966f5ae7ff6\",\n \"isResizable\": true,\n \"w\": 11,\n \"x\": 12,\n \"y\": 92\n },\n \"maxPerRow\": 4,\n \"name\": \" 同步插入到 Distributed 表时超时\",\n \"options\": {\n \"legend\": {\n \"behaviour\": \"showItem\",\n \"displayMode\": \"hidden\"\n },\n \"standardOptions\": {},\n \"thresholds\": {\n \"steps\": [\n {\n \"color\": \"#634CD9\",\n \"type\": \"base\",\n \"value\": null\n }\n ]\n },\n \"tooltip\": {\n \"mode\": \"all\",\n \"sort\": \"none\"\n }\n },\n \"overrides\": [\n {\n \"matcher\": {\n \"id\": \"byFrameRefID\"\n },\n \"properties\": {\n \"rightYAxisDisplay\": \"off\"\n }\n }\n ],\n \"targets\": [\n {\n \"expr\": \"max_over_time(irate(ClickHouseProfileEvents_DistributedSyncInsertionTimeoutExceeded{instance=\\\"$instance\\\"}[2m]) [1h:1m]) * $peeks\",\n \"legend\": \"peaks - {{instance}}\",\n \"maxDataPoints\": 240,\n \"refId\": \"A\"\n },\n {\n \"__mode__\": \"__query__\",\n \"expr\": \"rate(ClickHouseProfileEvents_DistributedSyncInsertionTimeoutExceeded{instance=~\\\"$instance\\\"}[2m]) * $trends\",\n \"legend\": \"trend - {{instance}}\",\n \"maxDataPoints\": 240,\n \"refId\": \"B\"\n }\n ],\n \"transformations\": [\n {\n \"id\": \"organize\",\n \"options\": {}\n }\n ],\n \"type\": \"timeseries\",\n \"version\": \"3.0.0\"\n }\n ],\n \"type\": \"row\"\n },\n {\n \"collapsed\": false,\n \"id\": \"2ab85aaf-f0af-41b1-9760-34b9177ae600\",\n \"layout\": {\n \"h\": 1,\n \"i\": \"2ab85aaf-f0af-41b1-9760-34b9177ae600\",\n \"isResizable\": false,\n \"w\": 24,\n \"x\": 0,\n \"y\": 128\n },\n \"name\": \"Background pool\",\n \"panels\": [\n {\n \"custom\": {\n \"drawStyle\": \"lines\",\n \"fillOpacity\": 0,\n \"gradientMode\": \"none\",\n \"lineInterpolation\": \"smooth\",\n \"lineWidth\": 1,\n \"scaleDistribution\": {\n \"type\": \"linear\"\n },\n \"spanNulls\": false,\n \"stack\": \"off\"\n },\n \"datasourceCate\": \"prometheus\",\n \"datasourceValue\": 1,\n \"description\": \"后台任务池中的活跃任务数\",\n \"id\": \"f329dc5d-6276-4652-855f-b26153d9155a\",\n \"layout\": {\n \"h\": 9,\n \"i\": \"f329dc5d-6276-4652-855f-b26153d9155a\",\n \"isResizable\": true,\n \"w\": 12,\n \"x\": 0,\n \"y\": 101\n },\n \"maxPerRow\": 4,\n \"name\": \"后台任务池任务数\",\n \"options\": {\n \"legend\": {\n \"behaviour\": \"showItem\",\n \"displayMode\": \"hidden\"\n },\n \"standardOptions\": {},\n \"thresholds\": {\n \"steps\": [\n {\n \"color\": \"#634CD9\",\n \"type\": \"base\",\n \"value\": null\n }\n ]\n },\n \"tooltip\": {\n \"mode\": \"all\",\n \"sort\": \"none\"\n }\n },\n \"overrides\": [\n {\n \"matcher\": {\n \"id\": \"byFrameRefID\"\n },\n \"properties\": {\n \"rightYAxisDisplay\": \"off\"\n }\n }\n ],\n \"targets\": [\n {\n \"expr\": \"ClickHouseMetrics_BackgroundCommonPoolTask\",\n \"maxDataPoints\": 240,\n \"refId\": \"A\"\n }\n ],\n \"transformations\": [\n {\n \"id\": \"organize\",\n \"options\": {}\n }\n ],\n \"type\": \"timeseries\",\n \"version\": \"3.0.0\"\n },\n {\n \"custom\": {\n \"drawStyle\": \"lines\",\n \"fillOpacity\": 0,\n \"gradientMode\": \"none\",\n \"lineInterpolation\": \"smooth\",\n \"lineWidth\": 1,\n \"scaleDistribution\": {\n \"type\": \"linear\"\n },\n \"spanNulls\": false,\n \"stack\": \"off\"\n },\n \"datasourceCate\": \"prometheus\",\n \"datasourceValue\": 1,\n \"description\": \"ClickHouse 中后台获取任务池(BackgroundFetchesPool)当前活跃任务的数量。\",\n \"id\": \"71ba46cc-be89-400f-ab7a-27189c309e25\",\n \"layout\": {\n \"h\": 9,\n \"i\": \"ebdfc65c-3b5e-4fa9-8165-6dd47ebab38d\",\n \"isResizable\": true,\n \"w\": 11,\n \"x\": 12,\n \"y\": 101\n },\n \"maxPerRow\": 4,\n \"name\": \" 后台获取任务池任务数\",\n \"options\": {\n \"legend\": {\n \"behaviour\": \"showItem\",\n \"displayMode\": \"hidden\"\n },\n \"standardOptions\": {},\n \"thresholds\": {\n \"steps\": [\n {\n \"color\": \"#634CD9\",\n \"type\": \"base\",\n \"value\": null\n }\n ]\n },\n \"tooltip\": {\n \"mode\": \"all\",\n \"sort\": \"none\"\n }\n },\n \"overrides\": [\n {\n \"matcher\": {\n \"id\": \"byFrameRefID\"\n },\n \"properties\": {\n \"rightYAxisDisplay\": \"off\"\n }\n }\n ],\n \"targets\": [\n {\n \"expr\": \" ClickHouseMetrics_BackgroundFetchesPoolTask\",\n \"maxDataPoints\": 240,\n \"refId\": \"A\"\n }\n ],\n \"transformations\": [\n {\n \"id\": \"organize\",\n \"options\": {}\n }\n ],\n \"type\": \"timeseries\",\n \"version\": \"3.0.0\"\n },\n {\n \"custom\": {\n \"drawStyle\": \"lines\",\n \"fillOpacity\": 0,\n \"gradientMode\": \"none\",\n \"lineInterpolation\": \"smooth\",\n \"lineWidth\": 1,\n \"scaleDistribution\": {\n \"type\": \"linear\"\n },\n \"spanNulls\": false,\n \"stack\": \"off\"\n },\n \"datasourceCate\": \"prometheus\",\n \"datasourceValue\": 1,\n \"description\": \"ClickHouse中后台移动任务池(BackgroundMovePool)当前激活的任务数量\",\n \"id\": \"47096333-948c-4010-bb0e-ced6581ea2c5\",\n \"layout\": {\n \"h\": 8,\n \"i\": \"b942ad7d-9119-4eaf-9971-c8453257b1b8\",\n \"isResizable\": true,\n \"w\": 12,\n \"x\": 0,\n \"y\": 110\n },\n \"maxPerRow\": 4,\n \"name\": \"后台移动任务池任务数\",\n \"options\": {\n \"legend\": {\n \"behaviour\": \"showItem\",\n \"displayMode\": \"hidden\"\n },\n \"standardOptions\": {},\n \"thresholds\": {\n \"steps\": [\n {\n \"color\": \"#634CD9\",\n \"type\": \"base\",\n \"value\": null\n }\n ]\n },\n \"tooltip\": {\n \"mode\": \"all\",\n \"sort\": \"none\"\n }\n },\n \"overrides\": [\n {\n \"matcher\": {\n \"id\": \"byFrameRefID\"\n },\n \"properties\": {\n \"rightYAxisDisplay\": \"off\"\n }\n }\n ],\n \"targets\": [\n {\n \"expr\": \"ClickHouseMetrics_BackgroundMovePoolTask\",\n \"maxDataPoints\": 240,\n \"refId\": \"A\"\n }\n ],\n \"transformations\": [\n {\n \"id\": \"organize\",\n \"options\": {}\n }\n ],\n \"type\": \"timeseries\",\n \"version\": \"3.0.0\"\n },\n {\n \"custom\": {\n \"drawStyle\": \"lines\",\n \"fillOpacity\": 0,\n \"gradientMode\": \"none\",\n \"lineInterpolation\": \"smooth\",\n \"lineWidth\": 1,\n \"scaleDistribution\": {\n \"type\": \"linear\"\n },\n \"spanNulls\": false,\n \"stack\": \"off\"\n },\n \"datasourceCate\": \"prometheus\",\n \"datasourceValue\": 1,\n \"description\": \"ClickHouse 中后台调度任务池(BackgroundSchedulePool)当前激活的任务数量\",\n \"id\": \"d8d3c10b-236d-408f-b20c-012d7444b71e\",\n \"layout\": {\n \"h\": 8,\n \"i\": \"9d862255-175f-4e4a-89d1-ebac3ca82e8f\",\n \"isResizable\": true,\n \"w\": 11,\n \"x\": 12,\n \"y\": 110\n },\n \"maxPerRow\": 4,\n \"name\": \"后台调度任务池任务数\",\n \"options\": {\n \"legend\": {\n \"behaviour\": \"showItem\",\n \"displayMode\": \"hidden\"\n },\n \"standardOptions\": {},\n \"thresholds\": {\n \"steps\": [\n {\n \"color\": \"#634CD9\",\n \"type\": \"base\",\n \"value\": null\n }\n ]\n },\n \"tooltip\": {\n \"mode\": \"all\",\n \"sort\": \"none\"\n }\n },\n \"overrides\": [\n {\n \"matcher\": {\n \"id\": \"byFrameRefID\"\n },\n \"properties\": {\n \"rightYAxisDisplay\": \"off\"\n }\n }\n ],\n \"targets\": [\n {\n \"expr\": \"ClickHouseMetrics_BackgroundSchedulePoolTask\",\n \"maxDataPoints\": 240,\n \"refId\": \"A\"\n }\n ],\n \"transformations\": [\n {\n \"id\": \"organize\",\n \"options\": {}\n }\n ],\n \"type\": \"timeseries\",\n \"version\": \"3.0.0\"\n },\n {\n \"custom\": {\n \"drawStyle\": \"lines\",\n \"fillOpacity\": 0,\n \"gradientMode\": \"none\",\n \"lineInterpolation\": \"smooth\",\n \"lineWidth\": 1,\n \"scaleDistribution\": {\n \"type\": \"linear\"\n },\n \"spanNulls\": false,\n \"stack\": \"off\"\n },\n \"datasourceCate\": \"prometheus\",\n \"datasourceValue\": 1,\n \"description\": \"ClickHouse 中后台缓冲区刷新调度任务池(BackgroundBufferFlushSchedulePool)当前激活的任务数量。这个任务池专注于处理与缓冲区数据定期刷新相关的后台任务\",\n \"id\": \"b16eff73-78d4-4554-946c-8e36dcee3678\",\n \"layout\": {\n \"h\": 8,\n \"i\": \"76625404-ebc4-492b-800c-fa8756154ada\",\n \"isResizable\": true,\n \"w\": 12,\n \"x\": 0,\n \"y\": 118\n },\n \"maxPerRow\": 4,\n \"name\": \"后台缓冲区刷新调度任务池任务数\",\n \"options\": {\n \"legend\": {\n \"behaviour\": \"showItem\",\n \"displayMode\": \"hidden\"\n },\n \"standardOptions\": {},\n \"thresholds\": {\n \"steps\": [\n {\n \"color\": \"#634CD9\",\n \"type\": \"base\",\n \"value\": null\n }\n ]\n },\n \"tooltip\": {\n \"mode\": \"all\",\n \"sort\": \"none\"\n }\n },\n \"overrides\": [\n {\n \"matcher\": {\n \"id\": \"byFrameRefID\"\n },\n \"properties\": {\n \"rightYAxisDisplay\": \"off\"\n }\n }\n ],\n \"targets\": [\n {\n \"expr\": \"ClickHouseMetrics_BackgroundBufferFlushSchedulePoolTask\",\n \"maxDataPoints\": 240,\n \"refId\": \"A\"\n }\n ],\n \"transformations\": [\n {\n \"id\": \"organize\",\n \"options\": {}\n }\n ],\n \"type\": \"timeseries\",\n \"version\": \"3.0.0\"\n },\n {\n \"custom\": {\n \"drawStyle\": \"lines\",\n \"fillOpacity\": 0,\n \"gradientMode\": \"none\",\n \"lineInterpolation\": \"smooth\",\n \"lineWidth\": 1,\n \"scaleDistribution\": {\n \"type\": \"linear\"\n },\n \"spanNulls\": false,\n \"stack\": \"off\"\n },\n \"datasourceCate\": \"prometheus\",\n \"datasourceValue\": 1,\n \"description\": \" ClickHouse 中后台分布式调度任务池(BackgroundDistributedSchedulePool)当前激活的任务数量。这个任务池专门负责处理异步执行的分布式数据发送任务\",\n \"id\": \"9d3dece1-0765-4e25-a21e-e71f6ac57848\",\n \"layout\": {\n \"h\": 8,\n \"i\": \"b7d2e412-b86a-4b15-9fb8-6a50e676e5e1\",\n \"isResizable\": true,\n \"w\": 11,\n \"x\": 12,\n \"y\": 118\n },\n \"maxPerRow\": 4,\n \"name\": \"后台分布式调度任务池任务数\",\n \"options\": {\n \"legend\": {\n \"behaviour\": \"showItem\",\n \"displayMode\": \"hidden\"\n },\n \"standardOptions\": {},\n \"thresholds\": {\n \"steps\": [\n {\n \"color\": \"#634CD9\",\n \"type\": \"base\",\n \"value\": null\n }\n ]\n },\n \"tooltip\": {\n \"mode\": \"all\",\n \"sort\": \"none\"\n }\n },\n \"overrides\": [\n {\n \"matcher\": {\n \"id\": \"byFrameRefID\"\n },\n \"properties\": {\n \"rightYAxisDisplay\": \"off\"\n }\n }\n ],\n \"targets\": [\n {\n \"expr\": \"ClickHouseMetrics_BackgroundDistributedSchedulePoolTask\",\n \"maxDataPoints\": 240,\n \"refId\": \"A\"\n }\n ],\n \"transformations\": [\n {\n \"id\": \"organize\",\n \"options\": {}\n }\n ],\n \"type\": \"timeseries\",\n \"version\": \"3.0.0\"\n },\n {\n \"custom\": {\n \"drawStyle\": \"lines\",\n \"fillOpacity\": 0,\n \"gradientMode\": \"none\",\n \"lineInterpolation\": \"smooth\",\n \"lineWidth\": 1,\n \"scaleDistribution\": {\n \"type\": \"linear\"\n },\n \"spanNulls\": false,\n \"stack\": \"off\"\n },\n \"datasourceCate\": \"prometheus\",\n \"datasourceValue\": 1,\n \"description\": \"ClickHouse 中后台处理池(针对消息流处理的部分)当前激活的任务数量,专注于消息代理相关的后台任务\",\n \"id\": \"4f590117-7281-443a-8713-5ea9696bd3c1\",\n \"layout\": {\n \"h\": 9,\n \"i\": \"45ffe751-fb27-45e7-8d22-39820c539149\",\n \"isResizable\": true,\n \"w\": 12,\n \"x\": 0,\n \"y\": 126\n },\n \"maxPerRow\": 4,\n \"name\": \"后台消息代理调度任务池任务数\",\n \"options\": {\n \"legend\": {\n \"behaviour\": \"showItem\",\n \"displayMode\": \"hidden\"\n },\n \"standardOptions\": {},\n \"thresholds\": {\n \"steps\": [\n {\n \"color\": \"#634CD9\",\n \"type\": \"base\",\n \"value\": null\n }\n ]\n },\n \"tooltip\": {\n \"mode\": \"all\",\n \"sort\": \"none\"\n }\n },\n \"overrides\": [\n {\n \"matcher\": {\n \"id\": \"byFrameRefID\"\n },\n \"properties\": {\n \"rightYAxisDisplay\": \"off\"\n }\n }\n ],\n \"targets\": [\n {\n \"expr\": \"ClickHouseMetrics_BackgroundMessageBrokerSchedulePoolTask\",\n \"maxDataPoints\": 240,\n \"refId\": \"A\"\n }\n ],\n \"transformations\": [\n {\n \"id\": \"organize\",\n \"options\": {}\n }\n ],\n \"type\": \"timeseries\",\n \"version\": \"3.0.0\"\n }\n ],\n \"type\": \"row\"\n }\n ],\n \"var\": [\n {\n \"datasource\": {\n \"cate\": \"prometheus\",\n \"value\": 1\n },\n \"definition\": \"label_values(ClickHouseMetrics_Move,instance)\",\n \"hide\": false,\n \"name\": \"instance\",\n \"type\": \"query\"\n },\n {\n \"definition\": \"1,null\",\n \"hide\": false,\n \"label\": \"\",\n \"multi\": false,\n \"name\": \"peeks\",\n \"type\": \"custom\"\n },\n {\n \"definition\": \"1,null\",\n \"hide\": false,\n \"name\": \"trends\",\n \"type\": \"custom\"\n }\n ],\n \"version\": \"3.0.0\"\n },\n \"public\": 0,\n \"public_cate\": 0,\n \"bgids\": null,\n \"built_in\": 0,\n \"hide\": 0,\n \"uuid\": 1719305153880302000\n}"
},
{
"path": "integrations/ClickHouse/markdown/README.md",
"content": "# ClickHouse Input Plugin\n\nThis plugin gathers the statistic data from\n[ClickHouse](https://github.com/ClickHouse/ClickHouse) server.\n\n## Global configuration options\n\nIn addition to the plugin-specific configuration settings, plugins support\nadditional global and plugin configuration settings. These settings are used to\nmodify metrics, tags, and field or create aliases and configure ordering, etc.\nSee the [CONFIGURATION.md][CONFIGURATION.md] for more details.\n\n## Configuration\n\n```toml\n# # collect interval\n# interval = 15\n\n# Read metrics from one or many ClickHouse servers\n[[instances]]\n ## Username for authorization on ClickHouse server\n username = \"default\"\n\n ## Password for authorization on ClickHouse server\n # password = \"\"\n\n ## HTTP(s) timeout while getting metrics values\n ## The timeout includes connection time, any redirects, and reading the\n ## response body.\n # timeout = 5\n\n ## List of servers for metrics scraping\n ## metrics scrape via HTTP(s) clickhouse interface\n ## https://clickhouse.tech/docs/en/interfaces/http/\n servers = [\"http://127.0.0.1:8123\"]\n\n ## If \"auto_discovery\"\" is \"true\" plugin tries to connect to all servers\n ## available in the cluster with using same \"user:password\" described in\n ## \"user\" and \"password\" parameters and get this server hostname list from\n ## \"system.clusters\" table. See\n ## - https://clickhouse.tech/docs/en/operations/system_tables/#system-clusters\n ## - https://clickhouse.tech/docs/en/operations/server_settings/settings/#server_settings_remote_servers\n ## - https://clickhouse.tech/docs/en/operations/table_engines/distributed/\n ## - https://clickhouse.tech/docs/en/operations/table_engines/replication/#creating-replicated-tables\n # auto_discovery = true\n\n ## Filter cluster names in \"system.clusters\" when \"auto_discovery\" is \"true\"\n ## when this filter present then \"WHERE cluster IN (...)\" filter will apply\n ## please use only full cluster names here, regexp and glob filters is not\n ## allowed for \"/etc/clickhouse-server/config.d/remote.xml\"\n ## \n ## \n ## \n ## \n ## clickhouse-ru-1.local 9000 clickhouse-ru-2.local 9000 \n ## \n ## clickhouse-eu-1.local 9000 clickhouse-eu-2.local 9000 \n ## \n ## \n ##\n ## \n ##\n ## example: cluster_include = [\"my-own-cluster\"]\n # cluster_include = []\n\n ## Filter cluster names in \"system.clusters\" when \"auto_discovery\" is\n ## \"true\" when this filter present then \"WHERE cluster NOT IN (...)\"\n ## filter will apply\n ## example: cluster_exclude = [\"my-internal-not-discovered-cluster\"]\n # cluster_exclude = []\n\n ## Optional TLS Config\n # tls_ca = \"/etc/telegraf/ca.pem\"\n # tls_cert = \"/etc/telegraf/cert.pem\"\n # tls_key = \"/etc/telegraf/key.pem\"\n ## Use TLS but skip chain & host verification\n # insecure_skip_verify = false\n\n```\n\n## Metrics\n\n- clickhouse_events (see [system.events][system.events] for details)\n\n - tags:\n - source (ClickHouse server hostname)\n - cluster (Name of the cluster [optional])\n - shard_num (Shard number in the cluster [optional])\n - fields:\n - all rows from [system.events][system.events]\n- clickhouse_metrics (see [system.metrics][system.metrics] for details)\n\n - tags:\n - source (ClickHouse server hostname)\n - cluster (Name of the cluster [optional])\n - shard_num (Shard number in the cluster [optional])\n - fields:\n - all rows from [system.metrics][system.metrics]\n- clickhouse_asynchronous_metrics (see [system.asynchronous_metrics][system.asynchronous_metrics]\n for details)\n\n - tags:\n - source (ClickHouse server hostname)\n - cluster (Name of the cluster [optional])\n - shard_num (Shard number in the cluster [optional])\n - fields:\n - all rows from [system.asynchronous_metrics][system.asynchronous_metrics]\n- clickhouse_tables\n\n - tags:\n - source (ClickHouse server hostname)\n - table\n - database\n - cluster (Name of the cluster [optional])\n - shard_num (Shard number in the cluster [optional])\n - fields:\n - bytes\n - parts\n - rows\n- clickhouse_zookeeper (see [system.zookeeper][system.zookeeper] for details)\n\n - tags:\n - source (ClickHouse server hostname)\n - cluster (Name of the cluster [optional])\n - shard_num (Shard number in the cluster [optional])\n - fields:\n - root_nodes (count of node where path=/)\n- clickhouse_replication_queue (see [system.replication_queue][system.replication_queue] for details)\n\n - tags:\n - source (ClickHouse server hostname)\n - cluster (Name of the cluster [optional])\n - shard_num (Shard number in the cluster [optional])\n - fields:\n - too_many_tries_replicas (count of replicas which have `num_tries > 1`)\n- clickhouse_detached_parts (see [system.detached_parts][system.detached_parts] for details)\n\n - tags:\n - source (ClickHouse server hostname)\n - cluster (Name of the cluster [optional])\n - shard_num (Shard number in the cluster [optional])\n - fields:\n - detached_parts (total detached parts for all tables and databases\n from [system.detached_parts][system.detached_parts])\n- clickhouse_dictionaries (see [system.dictionaries][system.dictionaries] for details)\n\n - tags:\n - source (ClickHouse server hostname)\n - cluster (Name of the cluster [optional])\n - shard_num (Shard number in the cluster [optional])\n - dict_origin (xml Filename when dictionary created from *_dictionary.xml,\n database.table when dictionary created from DDL)\n - fields:\n - is_loaded (0 - when dictionary data not successful load, 1 - when\n dictionary data loading fail\n - bytes_allocated (bytes allocated in RAM after a dictionary loaded)\n- clickhouse_mutations (see [system.mutations][system.mutations] for details)\n\n - tags:\n - source (ClickHouse server hostname)\n - cluster (Name of the cluster [optional])\n - shard_num (Shard number in the cluster [optional])\n - fields:\n - running - gauge which show how much mutation doesn't complete now\n - failed - counter which show total failed mutations from first\n clickhouse-server run\n - completed - counter which show total successful finished mutations\n from first clickhouse-server run\n- clickhouse_disks (see [system.disks][system.disks] for details)\n\n - tags:\n - source (ClickHouse server hostname)\n - cluster (Name of the cluster [optional])\n - shard_num (Shard number in the cluster [optional])\n - name (disk name in storage configuration)\n - path (path to disk)\n - fields:\n - free_space_percent - 0-100, gauge which show current percent of\n free disk space bytes relative to total disk space bytes\n - keep_free_space_percent - 0-100, gauge which show current percent\n of required keep free disk bytes relative to total disk space bytes\n- clickhouse_processes (see [system.processes][system.processes] for details)\n\n - tags:\n - source (ClickHouse server hostname)\n - cluster (Name of the cluster [optional])\n - shard_num (Shard number in the cluster [optional])\n - fields:\n - percentile_50 - float gauge which show 50% percentile (quantile 0.5) for\n `elapsed` field of running processes\n - percentile_90 - float gauge which show 90% percentile (quantile 0.9) for\n `elapsed` field of running processes\n - longest_running - float gauge which show maximum value for `elapsed`\n field of running processes\n- clickhouse_text_log (see [system.text_log][system.text_log] for details)\n\n - tags:\n - source (ClickHouse server hostname)\n - cluster (Name of the cluster [optional])\n - shard_num (Shard number in the cluster [optional])\n - level (message level, only messages with level less or equal Notice are\n collected)\n - fields:\n - messages_last_10_min - gauge which show how many messages collected\n\n## Example Output\n\n```text\nclickhouse_events,cluster=test_cluster_two_shards_localhost,host=kshvakov,source=localhost,shard_num=1 read_compressed_bytes=212i,arena_alloc_chunks=35i,function_execute=85i,merge_tree_data_writer_rows=3i,rw_lock_acquired_read_locks=421i,file_open=46i,io_buffer_alloc_bytes=86451985i,inserted_bytes=196i,regexp_created=3i,real_time_microseconds=116832i,query=23i,network_receive_elapsed_microseconds=268i,merge_tree_data_writer_compressed_bytes=1080i,arena_alloc_bytes=212992i,disk_write_elapsed_microseconds=556i,inserted_rows=3i,compressed_read_buffer_bytes=81i,read_buffer_from_file_descriptor_read_bytes=148i,write_buffer_from_file_descriptor_write=47i,merge_tree_data_writer_blocks=3i,soft_page_faults=896i,hard_page_faults=7i,select_query=21i,merge_tree_data_writer_uncompressed_bytes=196i,merge_tree_data_writer_blocks_already_sorted=3i,user_time_microseconds=40196i,compressed_read_buffer_blocks=5i,write_buffer_from_file_descriptor_write_bytes=3246i,io_buffer_allocs=296i,created_write_buffer_ordinary=12i,disk_read_elapsed_microseconds=59347044i,network_send_elapsed_microseconds=1538i,context_lock=1040i,insert_query=1i,system_time_microseconds=14582i,read_buffer_from_file_descriptor_read=3i 1569421000000000000\nclickhouse_asynchronous_metrics,cluster=test_cluster_two_shards_localhost,host=kshvakov,source=localhost,shard_num=1 jemalloc.metadata_thp=0i,replicas_max_relative_delay=0i,jemalloc.mapped=1803177984i,jemalloc.allocated=1724839256i,jemalloc.background_thread.run_interval=0i,jemalloc.background_thread.num_threads=0i,uncompressed_cache_cells=0i,replicas_max_absolute_delay=0i,mark_cache_bytes=0i,compiled_expression_cache_count=0i,replicas_sum_queue_size=0i,number_of_tables=35i,replicas_max_merges_in_queue=0i,replicas_max_inserts_in_queue=0i,replicas_sum_merges_in_queue=0i,replicas_max_queue_size=0i,mark_cache_files=0i,jemalloc.background_thread.num_runs=0i,jemalloc.active=1726210048i,uptime=158i,jemalloc.retained=380481536i,replicas_sum_inserts_in_queue=0i,uncompressed_cache_bytes=0i,number_of_databases=2i,jemalloc.metadata=9207704i,max_part_count_for_partition=1i,jemalloc.resident=1742442496i 1569421000000000000\nclickhouse_metrics,cluster=test_cluster_two_shards_localhost,host=kshvakov,source=localhost,shard_num=1 replicated_send=0i,write=0i,ephemeral_node=0i,zoo_keeper_request=0i,distributed_files_to_insert=0i,replicated_fetch=0i,background_schedule_pool_task=0i,interserver_connection=0i,leader_replica=0i,delayed_inserts=0i,global_thread_active=41i,merge=0i,readonly_replica=0i,memory_tracking_in_background_schedule_pool=0i,memory_tracking_for_merges=0i,zoo_keeper_session=0i,context_lock_wait=0i,storage_buffer_bytes=0i,background_pool_task=0i,send_external_tables=0i,zoo_keeper_watch=0i,part_mutation=0i,disk_space_reserved_for_merge=0i,distributed_send=0i,version_integer=19014003i,local_thread=0i,replicated_checks=0i,memory_tracking=0i,memory_tracking_in_background_processing_pool=0i,leader_election=0i,revision=54425i,open_file_for_read=0i,open_file_for_write=0i,storage_buffer_rows=0i,rw_lock_waiting_readers=0i,rw_lock_waiting_writers=0i,rw_lock_active_writers=0i,local_thread_active=0i,query_preempted=0i,tcp_connection=1i,http_connection=1i,read=2i,query_thread=0i,dict_cache_requests=0i,rw_lock_active_readers=1i,global_thread=43i,query=1i 1569421000000000000\nclickhouse_tables,cluster=test_cluster_two_shards_localhost,database=system,host=kshvakov,source=localhost,shard_num=1,table=trace_log bytes=754i,parts=1i,rows=1i 1569421000000000000\nclickhouse_tables,cluster=test_cluster_two_shards_localhost,database=default,host=kshvakov,source=localhost,shard_num=1,table=example bytes=326i,parts=2i,rows=2i 1569421000000000000\n```\n\n[CONFIGURATION.md]: ../../../docs/CONFIGURATION.md#plugins\n[system.asynchronous_metrics]: https://clickhouse.tech/docs/en/operations/system-tables/asynchronous_metrics/\n[system.detached_parts]: https://clickhouse.tech/docs/en/operations/system-tables/detached_parts/\n[system.dictionaries]: https://clickhouse.tech/docs/en/operations/system-tables/dictionaries/\n[system.disks]: https://clickhouse.tech/docs/en/operations/system-tables/disks/\n[system.events]: https://clickhouse.tech/docs/en/operations/system-tables/events/\n[system.metrics]: https://clickhouse.tech/docs/en/operations/system-tables/metrics/\n[system.mutations]: https://clickhouse.tech/docs/en/operations/system-tables/mutations/\n[system.processes]: https://clickhouse.tech/docs/en/operations/system-tables/processes/\n[system.replication_queue]: https://clickhouse.com/docs/en/operations/system-tables/replication_queue/\n[system.text_log]: https://clickhouse.tech/docs/en/operations/system-tables/text_log/\n[system.zookeeper]: https://clickhouse.tech/docs/en/operations/system-tables/zookeeper/\n"
},
{
"path": "integrations/ClickHouse/metrics/clickhouse_by_categraf.json",
"content": "[\n {\n \"id\": 0,\n \"uuid\": 1719305153888541000,\n \"collector\": \"Categraf\",\n \"typ\": \"ClickHouse\",\n \"name\": \"ClickHouse HTTP 连接数\",\n \"unit\": \"sishort\",\n \"note\": \"通过HTTP协议连接到ClickHouse服务器的客户端数量。\",\n \"lang\": \"zh_CN\",\n \"expression\": \"clickhouse_metrics_http_connection\",\n \"created_at\": 0,\n \"created_by\": \"\",\n \"updated_at\": 0,\n \"updated_by\": \"\",\n \"translation\": [\n {\n \"lang\": \"zh_CN\",\n \"name\": \"ClickHouse HTTP 连接数\",\n \"note\": \"通过HTTP协议连接到ClickHouse服务器的客户端数量。\"\n },\n {\n \"lang\": \"en_US\",\n \"name\": \"ClickHouse HTTP Connections\",\n \"note\": \"The number of clients connected to the ClickHouse server via the HTTP protocol.\"\n }\n ]\n },\n {\n \"id\": 0,\n \"uuid\": 1719305153889950000,\n \"collector\": \"Categraf\",\n \"typ\": \"ClickHouse\",\n \"name\": \"ClickHouse INSERT查询平均时间\",\n \"unit\": \"sishort\",\n \"note\": \"插入查询执行的平均时间(微秒)。\",\n \"lang\": \"zh_CN\",\n \"expression\": \"clickhouse_events_insert_query_time_microseconds_microseconds\",\n \"created_at\": 0,\n \"created_by\": \"\",\n \"updated_at\": 0,\n \"updated_by\": \"\",\n \"translation\": [\n {\n \"lang\": \"zh_CN\",\n \"name\": \"ClickHouse INSERT查询平均时间\",\n \"note\": \"插入查询执行的平均时间(微秒)。\"\n },\n {\n \"lang\": \"en_US\",\n \"name\": \"ClickHouse INSERT query average time\",\n \"note\": \"The average time in microseconds for the insertion query to execute.\"\n }\n ]\n },\n {\n \"id\": 0,\n \"uuid\": 1719305153890963000,\n \"collector\": \"Categraf\",\n \"typ\": \"ClickHouse\",\n \"name\": \"ClickHouse SELECT 查询数\",\n \"unit\": \"none\",\n \"note\": \"执行的选择(SELECT)查询的数量\",\n \"lang\": \"zh_CN\",\n \"expression\": \"clickhouse_events_select_query\",\n \"created_at\": 0,\n \"created_by\": \"\",\n \"updated_at\": 0,\n \"updated_by\": \"\",\n \"translation\": [\n {\n \"lang\": \"zh_CN\",\n \"name\": \"ClickHouse SELECT 查询数\",\n \"note\": \"执行的选择(SELECT)查询的数量\"\n },\n {\n \"lang\": \"en_US\",\n \"name\": \"ClickHouse SELECT Query Number\",\n \"note\": \"Number of SELECT queries executed\"\n }\n ]\n },\n {\n \"id\": 0,\n \"uuid\": 1719305153892134000,\n \"collector\": \"Categraf\",\n \"typ\": \"ClickHouse\",\n \"name\": \"ClickHouse SELECT查询平均时间\",\n \"unit\": \"sishort\",\n \"note\": \"选择查询执行的平均时间(微秒)。\",\n \"lang\": \"zh_CN\",\n \"expression\": \"clickhouse_events_select_query_time_microseconds_microseconds\",\n \"created_at\": 0,\n \"created_by\": \"\",\n \"updated_at\": 0,\n \"updated_by\": \"\",\n \"translation\": [\n {\n \"lang\": \"zh_CN\",\n \"name\": \"ClickHouse SELECT查询平均时间\",\n \"note\": \"选择查询执行的平均时间(微秒)。\"\n },\n {\n \"lang\": \"en_US\",\n \"name\": \"ClickHouse SELECT query average time\",\n \"note\": \"Select the average time (microseconds) for query execution.\"\n }\n ]\n },\n {\n \"id\": 0,\n \"uuid\": 1719305153893317000,\n \"collector\": \"Categraf\",\n \"typ\": \"ClickHouse\",\n \"name\": \"ClickHouse TCP 连接数\",\n \"unit\": \"sishort\",\n \"note\": \"通过TCP协议连接到ClickHouse服务器的客户端数量。\",\n \"lang\": \"zh_CN\",\n \"expression\": \"clickhouse_metrics_tcp_connection\",\n \"created_at\": 0,\n \"created_by\": \"\",\n \"updated_at\": 0,\n \"updated_by\": \"\",\n \"translation\": [\n {\n \"lang\": \"zh_CN\",\n \"name\": \"ClickHouse TCP 连接数\",\n \"note\": \"通过TCP协议连接到ClickHouse服务器的客户端数量。\"\n },\n {\n \"lang\": \"en_US\",\n \"name\": \"ClickHouse TCP Connections\",\n \"note\": \"The number of clients connected to the ClickHouse server via the TCP protocol.\"\n }\n ]\n },\n {\n \"id\": 0,\n \"uuid\": 1719305153894646000,\n \"collector\": \"Categraf\",\n \"typ\": \"ClickHouse\",\n \"name\": \"ClickHouse 临时数据量\",\n \"unit\": \"sishort\",\n \"note\": \"临时数据部分的数量,这些部分当前正在生成。\",\n \"lang\": \"zh_CN\",\n \"expression\": \"clickhouse_metrics_parts_temporary\",\n \"created_at\": 0,\n \"created_by\": \"\",\n \"updated_at\": 0,\n \"updated_by\": \"\",\n \"translation\": [\n {\n \"lang\": \"zh_CN\",\n \"name\": \"ClickHouse 临时数据量\",\n \"note\": \"临时数据部分的数量,这些部分当前正在生成。\"\n },\n {\n \"lang\": \"en_US\",\n \"name\": \"ClickHouse Temporary Data Volume\",\n \"note\": \"The number of temporary data sections that are currently being generated.\"\n }\n ]\n },\n {\n \"id\": 0,\n \"uuid\": 1719305153896151000,\n \"collector\": \"Categraf\",\n \"typ\": \"ClickHouse\",\n \"name\": \"ClickHouse 分布式表连接数\",\n \"unit\": \"sishort\",\n \"note\": \"发送到分布式表的远程服务器的数据连接数。\",\n \"lang\": \"zh_CN\",\n \"expression\": \"clickhouse_metrics_distributed_send\",\n \"created_at\": 0,\n \"created_by\": \"\",\n \"updated_at\": 0,\n \"updated_by\": \"\",\n \"translation\": [\n {\n \"lang\": \"zh_CN\",\n \"name\": \"ClickHouse 分布式表连接数\",\n \"note\": \"发送到分布式表的远程服务器的数据连接数。\"\n },\n {\n \"lang\": \"en_US\",\n \"name\": \"ClickHouse Distributed Table Joins\",\n \"note\": \"The number of data connections sent to the remote server of the distributed table.\"\n }\n ]\n },\n {\n \"id\": 0,\n \"uuid\": 1719305153897491000,\n \"collector\": \"Categraf\",\n \"typ\": \"ClickHouse\",\n \"name\": \"ClickHouse 宽数据量\",\n \"unit\": \"sishort\",\n \"note\": \"宽数据部分的数量。\",\n \"lang\": \"zh_CN\",\n \"expression\": \"clickhouse_metrics_parts_wide\",\n \"created_at\": 0,\n \"created_by\": \"\",\n \"updated_at\": 0,\n \"updated_by\": \"\",\n \"translation\": [\n {\n \"lang\": \"zh_CN\",\n \"name\": \"ClickHouse 宽数据量\",\n \"note\": \"宽数据部分的数量。\"\n },\n {\n \"lang\": \"en_US\",\n \"name\": \"ClickHouse wide data volume\",\n \"note\": \"Number of wide data sections.\"\n }\n ]\n },\n {\n \"id\": 0,\n \"uuid\": 1719305153899026000,\n \"collector\": \"Categraf\",\n \"typ\": \"ClickHouse\",\n \"name\": \"ClickHouse 待插入分布式表文件数\",\n \"unit\": \"sishort\",\n \"note\": \"等待异步插入到分布式表的文件数量。\",\n \"lang\": \"zh_CN\",\n \"expression\": \"clickhouse_metrics_distributed_files_to_insert\",\n \"created_at\": 0,\n \"created_by\": \"\",\n \"updated_at\": 0,\n \"updated_by\": \"\",\n \"translation\": [\n {\n \"lang\": \"zh_CN\",\n \"name\": \"ClickHouse 待插入分布式表文件数\",\n \"note\": \"等待异步插入到分布式表的文件数量。\"\n },\n {\n \"lang\": \"en_US\",\n \"name\": \"ClickHouse Number of distributed table files to be inserted\",\n \"note\": \"The number of files waiting to be inserted asynchronously into the distributed table.\"\n }\n ]\n },\n {\n \"id\": 0,\n \"uuid\": 1719305153900278000,\n \"collector\": \"Categraf\",\n \"typ\": \"ClickHouse\",\n \"name\": \"ClickHouse 提交前数据量\",\n \"unit\": \"sishort\",\n \"note\": \"提交前的数据部分数量,这些部分在data_parts列表中,但不用于SELECT查询。\",\n \"lang\": \"zh_CN\",\n \"expression\": \"clickhouse_metrics_parts_pre_committed\",\n \"created_at\": 0,\n \"created_by\": \"\",\n \"updated_at\": 0,\n \"updated_by\": \"\",\n \"translation\": [\n {\n \"lang\": \"zh_CN\",\n \"name\": \"ClickHouse 提交前数据量\",\n \"note\": \"提交前的数据部分数量,这些部分在data_parts列表中,但不用于SELECT查询。\"\n },\n {\n \"lang\": \"en_US\",\n \"name\": \"Data volume before ClickHouse submission\",\n \"note\": \"The number of data parts before submission, which are in the data _ parts list, but are not used for SELECT queries.\"\n }\n ]\n },\n {\n \"id\": 0,\n \"uuid\": 1719305153901527000,\n \"collector\": \"Categraf\",\n \"typ\": \"ClickHouse\",\n \"name\": \"ClickHouse 提交后数据量\",\n \"unit\": \"sishort\",\n \"note\": \"提交后的数据部分数量,这些部分在data_parts列表中,并且用于SELECT查询。\",\n \"lang\": \"zh_CN\",\n \"expression\": \"clickhouse_metrics_parts_committed\",\n \"created_at\": 0,\n \"created_by\": \"\",\n \"updated_at\": 0,\n \"updated_by\": \"\",\n \"translation\": [\n {\n \"lang\": \"zh_CN\",\n \"name\": \"ClickHouse 提交后数据量\",\n \"note\": \"提交后的数据部分数量,这些部分在data_parts列表中,并且用于SELECT查询。\"\n },\n {\n \"lang\": \"en_US\",\n \"name\": \"Data volume after ClickHouse submission\",\n \"note\": \"The number of submitted data parts, which are in the data _ parts list and used for SELECT queries.\"\n }\n ]\n },\n {\n \"id\": 0,\n \"uuid\": 1719305153902727000,\n \"collector\": \"Categraf\",\n \"typ\": \"ClickHouse\",\n \"name\": \"ClickHouse 插入未压缩\",\n \"unit\": \"sishort\",\n \"note\": \" 插入操作写入的未压缩字节数。\",\n \"lang\": \"zh_CN\",\n \"expression\": \"clickhouse_events_inserted_bytes\",\n \"created_at\": 0,\n \"created_by\": \"\",\n \"updated_at\": 0,\n \"updated_by\": \"\",\n \"translation\": [\n {\n \"lang\": \"zh_CN\",\n \"name\": \"ClickHouse 插入未压缩\",\n \"note\": \" 插入操作写入的未压缩字节数。\"\n },\n {\n \"lang\": \"en_US\",\n \"name\": \"ClickHouse Insert Uncompressed\",\n \"note\": \"The number of uncompressed bytes written by the insert operation.\"\n }\n ]\n },\n {\n \"id\": 0,\n \"uuid\": 1719305153904402000,\n \"collector\": \"Categraf\",\n \"typ\": \"ClickHouse\",\n \"name\": \"ClickHouse 插入行数\",\n \"unit\": \"none\",\n \"note\": \"\",\n \"lang\": \"zh_CN\",\n \"expression\": \"clickhouse_events_inserted_rows\",\n \"created_at\": 0,\n \"created_by\": \"\",\n \"updated_at\": 0,\n \"updated_by\": \"\",\n \"translation\": [\n {\n \"lang\": \"zh_CN\",\n \"name\": \"ClickHouse 插入行数\",\n \"note\": \"\"\n },\n {\n \"lang\": \"en_US\",\n \"name\": \"Number of ClickHouse inserted rows\",\n \"note\": \"\"\n }\n ]\n },\n {\n \"id\": 0,\n \"uuid\": 1719305153905722000,\n \"collector\": \"Categraf\",\n \"typ\": \"ClickHouse\",\n \"name\": \"ClickHouse 查询优先级\",\n \"unit\": \"sishort\",\n \"note\": \"由于优先级设置,被停止并等待的查询数量。\\n\",\n \"lang\": \"zh_CN\",\n \"expression\": \"clickhouse_metrics_query_preempted\",\n \"created_at\": 0,\n \"created_by\": \"\",\n \"updated_at\": 0,\n \"updated_by\": \"\",\n \"translation\": [\n {\n \"lang\": \"zh_CN\",\n \"name\": \"ClickHouse 查询优先级\",\n \"note\": \"由于优先级设置,被停止并等待的查询数量。\\n\"\n },\n {\n \"lang\": \"en_US\",\n \"name\": \"ClickHouse Query Priority\",\n \"note\": \"The number of queries that were stopped and waiting due to the priority setting. \\n\"\n }\n ]\n },\n {\n \"id\": 0,\n \"uuid\": 1719305153906824000,\n \"collector\": \"Categraf\",\n \"typ\": \"ClickHouse\",\n \"name\": \"ClickHouse 查询总数\",\n \"unit\": \"none\",\n \"note\": \"ClickHouse执行的查询总数。\",\n \"lang\": \"zh_CN\",\n \"expression\": \"clickhouse_events_query\",\n \"created_at\": 0,\n \"created_by\": \"\",\n \"updated_at\": 0,\n \"updated_by\": \"\",\n \"translation\": [\n {\n \"lang\": \"zh_CN\",\n \"name\": \"ClickHouse 查询总数\",\n \"note\": \"ClickHouse执行的查询总数。\"\n },\n {\n \"lang\": \"en_US\",\n \"name\": \"Total ClickHouse Queries\",\n \"note\": \"The total number of queries executed by ClickHouse.\"\n }\n ]\n },\n {\n \"id\": 0,\n \"uuid\": 1719305153907953000,\n \"collector\": \"Categraf\",\n \"typ\": \"ClickHouse\",\n \"name\": \"ClickHouse 查询总时间\",\n \"unit\": \"milliseconds\",\n \"note\": \"查询执行的总时间(微秒)。\",\n \"lang\": \"zh_CN\",\n \"expression\": \"clickhouse_events_query_time_microseconds\",\n \"created_at\": 0,\n \"created_by\": \"\",\n \"updated_at\": 0,\n \"updated_by\": \"\",\n \"translation\": [\n {\n \"lang\": \"zh_CN\",\n \"name\": \"ClickHouse 查询总时间\",\n \"note\": \"查询执行的总时间(微秒)。\"\n },\n {\n \"lang\": \"en_US\",\n \"name\": \"Total ClickHouse query time\",\n \"note\": \"The total time in microseconds for the query to execute.\"\n }\n ]\n },\n {\n \"id\": 0,\n \"uuid\": 1719305153909480000,\n \"collector\": \"Categraf\",\n \"typ\": \"ClickHouse\",\n \"name\": \"ClickHouse 正被删除数据量\",\n \"unit\": \"sishort\",\n \"note\": \"正在被删除的数据部分数量。\",\n \"lang\": \"zh_CN\",\n \"expression\": \"clickhouse_metrics_parts_deleting\",\n \"created_at\": 0,\n \"created_by\": \"\",\n \"updated_at\": 0,\n \"updated_by\": \"\",\n \"translation\": [\n {\n \"lang\": \"zh_CN\",\n \"name\": \"ClickHouse 正被删除数据量\",\n \"note\": \"正在被删除的数据部分数量。\"\n },\n {\n \"lang\": \"en_US\",\n \"name\": \"ClickHouse Amount of Data being Deleted\",\n \"note\": \"The number of data parts being deleted.\"\n }\n ]\n },\n {\n \"id\": 0,\n \"uuid\": 1719305153911177000,\n \"collector\": \"Categraf\",\n \"typ\": \"ClickHouse\",\n \"name\": \"ClickHouse 移动池活动任务数\",\n \"unit\": \"sishort\",\n \"note\": \"后台移动池中的活动任务数,用于处理数据移动。\",\n \"lang\": \"zh_CN\",\n \"expression\": \"clickhouse_metrics_background_move_pool_task\",\n \"created_at\": 0,\n \"created_by\": \"\",\n \"updated_at\": 0,\n \"updated_by\": \"\",\n \"translation\": [\n {\n \"lang\": \"zh_CN\",\n \"name\": \"ClickHouse 移动池活动任务数\",\n \"note\": \"后台移动池中的活动任务数,用于处理数据移动。\"\n },\n {\n \"lang\": \"en_US\",\n \"name\": \"Number of active tasks in ClickHouse mobile pool\",\n \"note\": \"The number of active tasks in the background move pool, used to handle data moves.\"\n }\n ]\n },\n {\n \"id\": 0,\n \"uuid\": 1719305153912274000,\n \"collector\": \"Categraf\",\n \"typ\": \"ClickHouse\",\n \"name\": \"ClickHouse 紧凑数据量\",\n \"unit\": \"sishort\",\n \"note\": \"紧凑数据部分的数量。\",\n \"lang\": \"zh_CN\",\n \"expression\": \"clickhouse_metrics_parts_compact\",\n \"created_at\": 0,\n \"created_by\": \"\",\n \"updated_at\": 0,\n \"updated_by\": \"\",\n \"translation\": [\n {\n \"lang\": \"zh_CN\",\n \"name\": \"ClickHouse 紧凑数据量\",\n \"note\": \"紧凑数据部分的数量。\"\n },\n {\n \"lang\": \"en_US\",\n \"name\": \"ClickHouse Compact Data Volume\",\n \"note\": \"Number of compact data sections.\"\n }\n ]\n },\n {\n \"id\": 0,\n \"uuid\": 1719305153913312000,\n \"collector\": \"Categraf\",\n \"typ\": \"ClickHouse\",\n \"name\": \"ClickHouse 缓冲区活动任务数\",\n \"unit\": \"sishort\",\n \"note\": \"后台缓冲区冲洗调度池中的活动任务数,用于定期缓冲区冲洗。\",\n \"lang\": \"zh_CN\",\n \"expression\": \"clickhouse_metrics_background_buffer_flush_schedule_pool_task\",\n \"created_at\": 0,\n \"created_by\": \"\",\n \"updated_at\": 0,\n \"updated_by\": \"\",\n \"translation\": [\n {\n \"lang\": \"zh_CN\",\n \"name\": \"ClickHouse 缓冲区活动任务数\",\n \"note\": \"后台缓冲区冲洗调度池中的活动任务数,用于定期缓冲区冲洗。\"\n },\n {\n \"lang\": \"en_US\",\n \"name\": \"Number of active tasks in ClickHouse buffer\",\n \"note\": \"The number of active tasks in the background buffer flushing scheduling pool for periodic buffer flushing.\"\n }\n ]\n },\n {\n \"id\": 0,\n \"uuid\": 1719305153914788000,\n \"collector\": \"Categraf\",\n \"typ\": \"ClickHouse\",\n \"name\": \"ClickHouse 跨磁盘量\",\n \"unit\": \"sishort\",\n \"note\": \"移动到另一个磁盘并应在析构函数中删除的数据部分数量。\",\n \"lang\": \"zh_CN\",\n \"expression\": \"clickhouse_metrics_parts_delete_on_destroy\",\n \"created_at\": 0,\n \"created_by\": \"\",\n \"updated_at\": 0,\n \"updated_by\": \"\",\n \"translation\": [\n {\n \"lang\": \"zh_CN\",\n \"name\": \"ClickHouse 跨磁盘量\",\n \"note\": \"移动到另一个磁盘并应在析构函数中删除的数据部分数量。\"\n },\n {\n \"lang\": \"en_US\",\n \"name\": \"ClickHouse cross-disk volume\",\n \"note\": \"The number of portions of data that are moved to another disk and should be deleted in the destructor.\"\n }\n ]\n },\n {\n \"id\": 0,\n \"uuid\": 1719305153916159000,\n \"collector\": \"Categraf\",\n \"typ\": \"ClickHouse\",\n \"name\": \"ClickHouse 过时数据量\",\n \"unit\": \"sishort\",\n \"note\": \" 过时的数据部分数量,这些部分不是活动数据部分,但当前SELECT查询可能使用它们。\",\n \"lang\": \"zh_CN\",\n \"expression\": \"clickhouse_metrics_parts_outdated\",\n \"created_at\": 0,\n \"created_by\": \"\",\n \"updated_at\": 0,\n \"updated_by\": \"\",\n \"translation\": [\n {\n \"lang\": \"zh_CN\",\n \"name\": \"ClickHouse 过时数据量\",\n \"note\": \" 过时的数据部分数量,这些部分不是活动数据部分,但当前SELECT查询可能使用它们。\"\n },\n {\n \"lang\": \"en_US\",\n \"name\": \"ClickHouse Obsolete Data Volume\",\n \"note\": \"The number of obsolete data parts that are not active data parts, but may be used by the current SELECT query.\"\n }\n ]\n },\n {\n \"id\": 0,\n \"uuid\": 1719305153917507000,\n \"collector\": \"Categraf\",\n \"typ\": \"ClickHouse\",\n \"name\": \"ClickHouse中内存使用情况\",\n \"unit\": \"sishort\",\n \"note\": \"ClickHouse服务器使用的总内存量。\",\n \"lang\": \"zh_CN\",\n \"expression\": \"clickhouse_metrics_memory_tracking\",\n \"created_at\": 0,\n \"created_by\": \"\",\n \"updated_at\": 0,\n \"updated_by\": \"\",\n \"translation\": [\n {\n \"lang\": \"zh_CN\",\n \"name\": \"ClickHouse中内存使用情况\",\n \"note\": \"ClickHouse服务器使用的总内存量。\"\n },\n {\n \"lang\": \"en_US\",\n \"name\": \"Memory usage in ClickHouse\",\n \"note\": \"The total amount of memory used by the ClickHouse server.\"\n }\n ]\n },\n {\n \"id\": 0,\n \"uuid\": 1719305153918455000,\n \"collector\": \"Categraf\",\n \"typ\": \"ClickHouse\",\n \"name\": \"ClickHouse中数据库数量\",\n \"unit\": \"none\",\n \"note\": \"ClickHouse数据库数量\",\n \"lang\": \"zh_CN\",\n \"expression\": \"clickhouse_asynchronous_metrics_number_of_databases\",\n \"created_at\": 0,\n \"created_by\": \"\",\n \"updated_at\": 0,\n \"updated_by\": \"\",\n \"translation\": [\n {\n \"lang\": \"zh_CN\",\n \"name\": \"ClickHouse中数据库数量\",\n \"note\": \"ClickHouse数据库数量\"\n },\n {\n \"lang\": \"en_US\",\n \"name\": \"Number of databases in ClickHouse\",\n \"note\": \"Number of ClickHouse databases\"\n }\n ]\n },\n {\n \"id\": 0,\n \"uuid\": 1719305153919709000,\n \"collector\": \"Categraf\",\n \"typ\": \"ClickHouse\",\n \"name\": \"ClickHouse中表的数量\",\n \"unit\": \"none\",\n \"note\": \"ClickHouse表数量\",\n \"lang\": \"zh_CN\",\n \"expression\": \"clickhouse_asynchronous_metrics_number_of_tables\",\n \"created_at\": 0,\n \"created_by\": \"\",\n \"updated_at\": 0,\n \"updated_by\": \"\",\n \"translation\": [\n {\n \"lang\": \"zh_CN\",\n \"name\": \"ClickHouse中表的数量\",\n \"note\": \"ClickHouse表数量\"\n },\n {\n \"lang\": \"en_US\",\n \"name\": \"Number of tables in ClickHouse\",\n \"note\": \"Number of ClickHouse tables\"\n }\n ]\n },\n {\n \"id\": 0,\n \"uuid\": 1719305153920898000,\n \"collector\": \"Categraf\",\n \"typ\": \"ClickHouse\",\n \"name\": \"ClickHouse修订\",\n \"unit\": \"none\",\n \"note\": \"ClickHouse服务器的修订号,通常是一个用于标识特定构建的数字。\",\n \"lang\": \"zh_CN\",\n \"expression\": \"clickhouse_metrics_revision\",\n \"created_at\": 0,\n \"created_by\": \"\",\n \"updated_at\": 0,\n \"updated_by\": \"\",\n \"translation\": [\n {\n \"lang\": \"zh_CN\",\n \"name\": \"ClickHouse修订\",\n \"note\": \"ClickHouse服务器的修订号,通常是一个用于标识特定构建的数字。\"\n },\n {\n \"lang\": \"en_US\",\n \"name\": \"ClickHouse Revision\",\n \"note\": \"The revision number of the ClickHouse server, usually a number used to identify a specific build.\"\n }\n ]\n },\n {\n \"id\": 0,\n \"uuid\": 1719305153921934000,\n \"collector\": \"Categraf\",\n \"typ\": \"ClickHouse\",\n \"name\": \"ClickHouse服务器运行时间\",\n \"unit\": \"sishort\",\n \"note\": \"ClickHouse服务器自启动以来的运行时间。\",\n \"lang\": \"zh_CN\",\n \"expression\": \"clickhouse_asynchronous_metrics_uptime\",\n \"created_at\": 0,\n \"created_by\": \"\",\n \"updated_at\": 0,\n \"updated_by\": \"\",\n \"translation\": [\n {\n \"lang\": \"zh_CN\",\n \"name\": \"ClickHouse服务器运行时间\",\n \"note\": \"ClickHouse服务器自启动以来的运行时间。\"\n },\n {\n \"lang\": \"en_US\",\n \"name\": \"ClickHouse server runtime\",\n \"note\": \"The running time of the ClickHouse server since it started.\"\n }\n ]\n },\n {\n \"id\": 0,\n \"uuid\": 1719305153923130000,\n \"collector\": \"Categraf\",\n \"typ\": \"ClickHouse\",\n \"name\": \"ClickHouse版本号\",\n \"unit\": \"none\",\n \"note\": \"ClickHouse服务器的版本号,以整数形式表示。\",\n \"lang\": \"zh_CN\",\n \"expression\": \"clickhouse_metrics_version_integer\",\n \"created_at\": 0,\n \"created_by\": \"\",\n \"updated_at\": 0,\n \"updated_by\": \"\",\n \"translation\": [\n {\n \"lang\": \"zh_CN\",\n \"name\": \"ClickHouse版本号\",\n \"note\": \"ClickHouse服务器的版本号,以整数形式表示。\"\n },\n {\n \"lang\": \"en_US\",\n \"name\": \"ClickHouse version number\",\n \"note\": \"Version number of the ClickHouse server, expressed as an integer.\"\n }\n ]\n }\n]"
},
{
"path": "integrations/ClickHouse/metrics/clickhouse_by_exporter.json",
"content": "[\n {\n \"id\": 0,\n \"uuid\": 1719305153924793000,\n \"collector\": \"Exporter\",\n \"typ\": \"ClickHouse\",\n \"name\": \"ClickHouse Tcp 连接数\",\n \"unit\": \"none\",\n \"note\": \"tcp连接数\",\n \"lang\": \"zh_CN\",\n \"expression\": \"ClickHouseMetrics_TCPConnection\",\n \"created_at\": 0,\n \"created_by\": \"\",\n \"updated_at\": 0,\n \"updated_by\": \"\",\n \"translation\": [\n {\n \"lang\": \"zh_CN\",\n \"name\": \"ClickHouse Tcp 连接数\",\n \"note\": \"tcp连接数\"\n },\n {\n \"lang\": \"en_US\",\n \"name\": \"Number of ClickHouse Tcp connections\",\n \"note\": \"tcp connections\"\n }\n ]\n },\n {\n \"id\": 0,\n \"uuid\": 1719305153926074000,\n \"collector\": \"Exporter\",\n \"typ\": \"ClickHouse\",\n \"name\": \"ClickHouse 内存\",\n \"unit\": \"bitsIEC\",\n \"note\": \"分配的内存总量\",\n \"lang\": \"zh_CN\",\n \"expression\": \"ClickHouseMetrics_MemoryTracking\",\n \"created_at\": 0,\n \"created_by\": \"\",\n \"updated_at\": 0,\n \"updated_by\": \"\",\n \"translation\": [\n {\n \"lang\": \"zh_CN\",\n \"name\": \"ClickHouse 内存\",\n \"note\": \"分配的内存总量\"\n },\n {\n \"lang\": \"en_US\",\n \"name\": \"ClickHouse Memory\",\n \"note\": \"Total memory allocated\"\n }\n ]\n },\n {\n \"id\": 0,\n \"uuid\": 1719305153927130000,\n \"collector\": \"Exporter\",\n \"typ\": \"ClickHouse\",\n \"name\": \"INSERT查询平均延迟\",\n \"unit\": \"microseconds\",\n \"note\": \"INSERT查询平均延迟\",\n \"lang\": \"zh_CN\",\n \"expression\": \"increase(ClickHouseProfileEvents_InsertQueryTimeMicroseconds[1m]) / (increase(ClickHouseProfileEvents_InsertQuery[1m]) + 0.001)\",\n \"created_at\": 0,\n \"created_by\": \"\",\n \"updated_at\": 0,\n \"updated_by\": \"\",\n \"translation\": [\n {\n \"lang\": \"zh_CN\",\n \"name\": \"INSERT查询平均延迟\",\n \"note\": \"INSERT查询平均延迟\"\n },\n {\n \"lang\": \"en_US\",\n \"name\": \"INSERT query average latency\",\n \"note\": \"INSERT query average latency\"\n }\n ]\n },\n {\n \"id\": 0,\n \"uuid\": 1719305153928310000,\n \"collector\": \"Exporter\",\n \"typ\": \"ClickHouse\",\n \"name\": \"INSERT查询数\",\n \"unit\": \"queries\",\n \"note\": \"与查询数相同,但仅限于INSERT查询\",\n \"lang\": \"zh_CN\",\n \"expression\": \"max_over_time(irate(ClickHouseProfileEvents_InsertQuery[2m]) [1h:1m])\",\n \"created_at\": 0,\n \"created_by\": \"\",\n \"updated_at\": 0,\n \"updated_by\": \"\",\n \"translation\": [\n {\n \"lang\": \"zh_CN\",\n \"name\": \"INSERT查询数\",\n \"note\": \"与查询数相同,但仅限于INSERT查询\"\n },\n {\n \"lang\": \"en_US\",\n \"name\": \"INSERT queries\",\n \"note\": \"Same number as queries, but only INSERT queries\"\n }\n ]\n },\n {\n \"id\": 0,\n \"uuid\": 1719305153929755000,\n \"collector\": \"Exporter\",\n \"typ\": \"ClickHouse\",\n \"name\": \"lseek函数调用次数\",\n \"unit\": \"times\",\n \"note\": \"'lseek'函数被调用的次数\",\n \"lang\": \"zh_CN\",\n \"expression\": \"max_over_time(irate(ClickHouseProfileEvents_Seek[2m]) [1h:1m])\",\n \"created_at\": 0,\n \"created_by\": \"\",\n \"updated_at\": 0,\n \"updated_by\": \"\",\n \"translation\": [\n {\n \"lang\": \"zh_CN\",\n \"name\": \"lseek函数调用次数\",\n \"note\": \"'lseek'函数被调用的次数\"\n },\n {\n \"lang\": \"en_US\",\n \"name\": \"Number of lseek function calls\",\n \"note\": \"Number of times the'lseek 'function was called\"\n }\n ]\n },\n {\n \"id\": 0,\n \"uuid\": 1719305153931299000,\n \"collector\": \"Exporter\",\n \"typ\": \"ClickHouse\",\n \"name\": \"MergeTree表写入的压缩字节数\",\n \"unit\": \"bytes\",\n \"note\": \"\",\n \"lang\": \"zh_CN\",\n \"expression\": \"max_over_time(irate(ClickHouseProfileEvents_MergeTreeDataWriterCompressedBytes[2m]) [1h:1m])\",\n \"created_at\": 0,\n \"created_by\": \"\",\n \"updated_at\": 0,\n \"updated_by\": \"\",\n \"translation\": [\n {\n \"lang\": \"zh_CN\",\n \"name\": \"MergeTree表写入的压缩字节数\",\n \"note\": \"\"\n },\n {\n \"lang\": \"en_US\",\n \"name\": \"Compressed bytes written to the MergeTree table\",\n \"note\": \"\"\n }\n ]\n },\n {\n \"id\": 0,\n \"uuid\": 1719305153932255000,\n \"collector\": \"Exporter\",\n \"typ\": \"ClickHouse\",\n \"name\": \"MergeTree表插入的数据块数\",\n \"unit\": \"blocks\",\n \"note\": \"插入到MergeTree表的数据块数。每个块形成一个数据部分\",\n \"lang\": \"zh_CN\",\n \"expression\": \"max_over_time(irate(ClickHouseProfileEvents_MergeTreeDataWriterBlocks[2m]) [1h:1m])\",\n \"created_at\": 0,\n \"created_by\": \"\",\n \"updated_at\": 0,\n \"updated_by\": \"\",\n \"translation\": [\n {\n \"lang\": \"zh_CN\",\n \"name\": \"MergeTree表插入的数据块数\",\n \"note\": \"插入到MergeTree表的数据块数。每个块形成一个数据部分\"\n },\n {\n \"lang\": \"en_US\",\n \"name\": \"Number of data blocks inserted into the MergeTree table\",\n \"note\": \"The number of data blocks inserted into the MergeTree table. Each block forms a data portion\"\n }\n ]\n },\n {\n \"id\": 0,\n \"uuid\": 1719305153933664000,\n \"collector\": \"Exporter\",\n \"typ\": \"ClickHouse\",\n \"name\": \"MergeTree表插入的未压缩字节数\",\n \"unit\": \"bytes\",\n \"note\": \"插入到MergeTree表的未压缩字节数(列以它们在内存中存储的形式)\\n\\n在ClickHouse数据库中,当数据被插入到MergeTree系列表(包括ReplicatedMergeTree等)时,在数据实际被写入磁盘并经过压缩处理之前,在内存中以原始格式暂存时所占用的字节数量。这里的“未压缩”意味着数据还未经过ClickHouse为了节省存储空间而在存储阶段执行的列式存储压缩算法处理\",\n \"lang\": \"zh_CN\",\n \"expression\": \"max_over_time(irate(ClickHouseProfileEvents_MergeTreeDataWriterUncompressedBytes[2m]) [1h:1m])\",\n \"created_at\": 0,\n \"created_by\": \"\",\n \"updated_at\": 0,\n \"updated_by\": \"\",\n \"translation\": [\n {\n \"lang\": \"zh_CN\",\n \"name\": \"MergeTree表插入的未压缩字节数\",\n \"note\": \"插入到MergeTree表的未压缩字节数(列以它们在内存中存储的形式)\\n\\n在ClickHouse数据库中,当数据被插入到MergeTree系列表(包括ReplicatedMergeTree等)时,在数据实际被写入磁盘并经过压缩处理之前,在内存中以原始格式暂存时所占用的字节数量。这里的“未压缩”意味着数据还未经过ClickHouse为了节省存储空间而在存储阶段执行的列式存储压缩算法处理\"\n },\n {\n \"lang\": \"en_US\",\n \"name\": \"Number of uncompressed bytes inserted by the MergeTree table\",\n \"note\": \"Number of uncompressed bytes inserted into the MergeTree table (columns in the form they are stored in memory) \\n \\nIn a ClickHouse database, when data is inserted into a MergeTree series table (including ReplicatedMergeTree, etc.), the number of bytes occupied when it is temporarily stored in the original format in memory before the data is actually written to disk and compressed. \\\"Uncompressed\\\" here means that the data has not been processed by the columnar storage compression algorithm that ClickHouse executes during the storage phase to save storage space\"\n }\n ]\n },\n {\n \"id\": 0,\n \"uuid\": 1719305153934869000,\n \"collector\": \"Exporter\",\n \"typ\": \"ClickHouse\",\n \"name\": \"MergeTree表插入的行数\",\n \"unit\": \"rows\",\n \"note\": \"插入到MergeTree表的行数\",\n \"lang\": \"zh_CN\",\n \"expression\": \"max_over_time(irate(ClickHouseProfileEvents_MergeTreeDataWriterRows[2m]) [1h:1m])\",\n \"created_at\": 0,\n \"created_by\": \"\",\n \"updated_at\": 0,\n \"updated_by\": \"\",\n \"translation\": [\n {\n \"lang\": \"zh_CN\",\n \"name\": \"MergeTree表插入的行数\",\n \"note\": \"插入到MergeTree表的行数\"\n },\n {\n \"lang\": \"en_US\",\n \"name\": \"Number of rows inserted by the MergeTree table\",\n \"note\": \"Number of rows inserted into the MergeTree table\"\n }\n ]\n },\n {\n \"id\": 0,\n \"uuid\": 1719305153935835000,\n \"collector\": \"Exporter\",\n \"typ\": \"ClickHouse\",\n \"name\": \"SELECT查询平均延迟\",\n \"unit\": \"microseconds\",\n \"note\": \"SELECT查询平均延迟\",\n \"lang\": \"zh_CN\",\n \"expression\": \"increase(ClickHouseProfileEvents_SelectQueryTimeMicroseconds[1m]) / (increase(ClickHouseProfileEvents_SelectQuery[1m]) + 0.001)\",\n \"created_at\": 0,\n \"created_by\": \"\",\n \"updated_at\": 0,\n \"updated_by\": \"\",\n \"translation\": [\n {\n \"lang\": \"zh_CN\",\n \"name\": \"SELECT查询平均延迟\",\n \"note\": \"SELECT查询平均延迟\"\n },\n {\n \"lang\": \"en_US\",\n \"name\": \"SELECT query average latency\",\n \"note\": \"SELECT query average latency\"\n }\n ]\n },\n {\n \"id\": 0,\n \"uuid\": 1719305153937045000,\n \"collector\": \"Exporter\",\n \"typ\": \"ClickHouse\",\n \"name\": \"SELECT查询数\",\n \"unit\": \"queries\",\n \"note\": \"SELECT查询的数量\",\n \"lang\": \"zh_CN\",\n \"expression\": \"max_over_time(irate(ClickHouseProfileEvents_SelectQuery[2m]) [1h:1m])\",\n \"created_at\": 0,\n \"created_by\": \"\",\n \"updated_at\": 0,\n \"updated_by\": \"\",\n \"translation\": [\n {\n \"lang\": \"zh_CN\",\n \"name\": \"SELECT查询数\",\n \"note\": \"SELECT查询的数量\"\n },\n {\n \"lang\": \"en_US\",\n \"name\": \"SELECT Query Number\",\n \"note\": \"Number of SELECT queries\"\n }\n ]\n },\n {\n \"id\": 0,\n \"uuid\": 1719305153938270000,\n \"collector\": \"Exporter\",\n \"typ\": \"ClickHouse\",\n \"name\": \"SELECT查询的字节数\",\n \"unit\": \"bytes\",\n \"note\": \"从所有表SELECT的字节数(未压缩列以它们在内存中存储的形式)\",\n \"lang\": \"zh_CN\",\n \"expression\": \"max_over_time(irate(ClickHouseProfileEvents_SelectedBytes[2m]) [1h:1m])\",\n \"created_at\": 0,\n \"created_by\": \"\",\n \"updated_at\": 0,\n \"updated_by\": \"\",\n \"translation\": [\n {\n \"lang\": \"zh_CN\",\n \"name\": \"SELECT查询的字节数\",\n \"note\": \"从所有表SELECT的字节数(未压缩列以它们在内存中存储的形式)\"\n },\n {\n \"lang\": \"en_US\",\n \"name\": \"Number of bytes of SELECT query\",\n \"note\": \"Number of bytes SELECT from all tables (uncompressed columns in the form they are stored in memory)\"\n }\n ]\n },\n {\n \"id\": 0,\n \"uuid\": 1719305153939642000,\n \"collector\": \"Exporter\",\n \"typ\": \"ClickHouse\",\n \"name\": \"SELECT查询的行数\",\n \"unit\": \"rows\",\n \"note\": \"从所有表SELECT的行数\",\n \"lang\": \"zh_CN\",\n \"expression\": \"max_over_time(irate(ClickHouseProfileEvents_SelectedRows[2m]) [1h:1m])\",\n \"created_at\": 0,\n \"created_by\": \"\",\n \"updated_at\": 0,\n \"updated_by\": \"\",\n \"translation\": [\n {\n \"lang\": \"zh_CN\",\n \"name\": \"SELECT查询的行数\",\n \"note\": \"从所有表SELECT的行数\"\n },\n {\n \"lang\": \"en_US\",\n \"name\": \"Number of rows of the SELECT query\",\n \"note\": \"The number of rows SELECT from all tables\"\n }\n ]\n },\n {\n \"id\": 0,\n \"uuid\": 1719305153940852000,\n \"collector\": \"Exporter\",\n \"typ\": \"ClickHouse\",\n \"name\": \"TCP连接数\",\n \"unit\": \"connections\",\n \"note\": \"与 TCP 服务器(带本地接口的客户端)的连接数,也包括服务器-服务器连接\",\n \"lang\": \"zh_CN\",\n \"expression\": \"ClickHouseMetrics_TCPConnection\",\n \"created_at\": 0,\n \"created_by\": \"\",\n \"updated_at\": 0,\n \"updated_by\": \"\",\n \"translation\": [\n {\n \"lang\": \"zh_CN\",\n \"name\": \"TCP连接数\",\n \"note\": \"与 TCP 服务器(带本地接口的客户端)的连接数,也包括服务器-服务器连接\"\n },\n {\n \"lang\": \"en_US\",\n \"name\": \"TCP Connections\",\n \"note\": \"Number of connections to TCP servers (clients with local interfaces), including server-server connections\"\n }\n ]\n },\n {\n \"id\": 0,\n \"uuid\": 1719305153941862000,\n \"collector\": \"Exporter\",\n \"typ\": \"ClickHouse\",\n \"name\": \"临时部分数\",\n \"unit\": \"parts\",\n \"note\": \"目前正在生成的部分,不在数据部分列表中\",\n \"lang\": \"zh_CN\",\n \"expression\": \"ClickHouseMetrics_PartsTemporary\",\n \"created_at\": 0,\n \"created_by\": \"\",\n \"updated_at\": 0,\n \"updated_by\": \"\",\n \"translation\": [\n {\n \"lang\": \"zh_CN\",\n \"name\": \"临时部分数\",\n \"note\": \"目前正在生成的部分,不在数据部分列表中\"\n },\n {\n \"lang\": \"en_US\",\n \"name\": \"Number of temporary parts\",\n \"note\": \"Section currently being generated, not in the data section list\"\n }\n ]\n },\n {\n \"id\": 0,\n \"uuid\": 1719305153942864000,\n \"collector\": \"Exporter\",\n \"typ\": \"ClickHouse\",\n \"name\": \"从文件描述符读取失败次数\",\n \"unit\": \"times\",\n \"note\": \"从文件描述符读取(read/pread)失败的次数\",\n \"lang\": \"zh_CN\",\n \"expression\": \"max_over_time(irate(ClickHouseProfileEvents_ReadBufferFromFileDescriptorReadFailed[2m]) [1h:1m])\",\n \"created_at\": 0,\n \"created_by\": \"\",\n \"updated_at\": 0,\n \"updated_by\": \"\",\n \"translation\": [\n {\n \"lang\": \"zh_CN\",\n \"name\": \"从文件描述符读取失败次数\",\n \"note\": \"从文件描述符读取(read/pread)失败的次数\"\n },\n {\n \"lang\": \"en_US\",\n \"name\": \"Number of read failures from file descriptor\",\n \"note\": \"Number of failed reads (read/pread) from file descriptors\"\n }\n ]\n },\n {\n \"id\": 0,\n \"uuid\": 1719305153943822000,\n \"collector\": \"Exporter\",\n \"typ\": \"ClickHouse\",\n \"name\": \"从文件描述符读取次数\",\n \"unit\": \"reads\",\n \"note\": \"从文件描述符进行读取(read/pread)的次数,不包括套接字\",\n \"lang\": \"zh_CN\",\n \"expression\": \"max_over_time(irate(ClickHouseProfileEvents_ReadBufferFromFileDescriptorRead[2m]) [1h:1m])\",\n \"created_at\": 0,\n \"created_by\": \"\",\n \"updated_at\": 0,\n \"updated_by\": \"\",\n \"translation\": [\n {\n \"lang\": \"zh_CN\",\n \"name\": \"从文件描述符读取次数\",\n \"note\": \"从文件描述符进行读取(read/pread)的次数,不包括套接字\"\n },\n {\n \"lang\": \"en_US\",\n \"name\": \"Read times from file descriptor\",\n \"note\": \"Number of reads (read/pread) made from file descriptors, excluding sockets\"\n }\n ]\n },\n {\n \"id\": 0,\n \"uuid\": 1719305153944918000,\n \"collector\": \"Exporter\",\n \"typ\": \"ClickHouse\",\n \"name\": \"从文件描述符读取的字节数\",\n \"unit\": \"bytes\",\n \"note\": \"从文件描述符读取的字节数。如果文件是压缩的,这将显示压缩后的数据大小\",\n \"lang\": \"zh_CN\",\n \"expression\": \"irate(ClickHouseProfileEvents_ReadBufferFromFileDescriptorReadBytes[2m])\",\n \"created_at\": 0,\n \"created_by\": \"\",\n \"updated_at\": 0,\n \"updated_by\": \"\",\n \"translation\": [\n {\n \"lang\": \"zh_CN\",\n \"name\": \"从文件描述符读取的字节数\",\n \"note\": \"从文件描述符读取的字节数。如果文件是压缩的,这将显示压缩后的数据大小\"\n },\n {\n \"lang\": \"en_US\",\n \"name\": \"Number of bytes read from file descriptor\",\n \"note\": \"The number of bytes read from the file descriptor. If the file is compressed, this will show the size of the compressed data\"\n }\n ]\n },\n {\n \"id\": 0,\n \"uuid\": 1719305153946307000,\n \"collector\": \"Exporter\",\n \"typ\": \"ClickHouse\",\n \"name\": \"保留空间\",\n \"unit\": \"bytes\",\n \"note\": \"为当前运行的后台合并保留的磁盘空间。它略大于当前合并部分的总大小\",\n \"lang\": \"zh_CN\",\n \"expression\": \"ClickHouseMetrics_DiskSpaceReservedForMerge\",\n \"created_at\": 0,\n \"created_by\": \"\",\n \"updated_at\": 0,\n \"updated_by\": \"\",\n \"translation\": [\n {\n \"lang\": \"zh_CN\",\n \"name\": \"保留空间\",\n \"note\": \"为当前运行的后台合并保留的磁盘空间。它略大于当前合并部分的总大小\"\n },\n {\n \"lang\": \"en_US\",\n \"name\": \"Reserve space\",\n \"note\": \"Disk space reserved for the currently running background merge. It is slightly larger than the total size of the current merged portion\"\n }\n ]\n },\n {\n \"id\": 0,\n \"uuid\": 1719305153947296000,\n \"collector\": \"Exporter\",\n \"typ\": \"ClickHouse\",\n \"name\": \"内存占用\",\n \"unit\": \"bytes\",\n \"note\": \"分配的内存总量\",\n \"lang\": \"zh_CN\",\n \"expression\": \"ClickHouseMetrics_MemoryTracking\",\n \"created_at\": 0,\n \"created_by\": \"\",\n \"updated_at\": 0,\n \"updated_by\": \"\",\n \"translation\": [\n {\n \"lang\": \"zh_CN\",\n \"name\": \"内存占用\",\n \"note\": \"分配的内存总量\"\n },\n {\n \"lang\": \"en_US\",\n \"name\": \"Memory footprint\",\n \"note\": \"Total memory allocated\"\n }\n ]\n },\n {\n \"id\": 0,\n \"uuid\": 1719305153948199000,\n \"collector\": \"Exporter\",\n \"typ\": \"ClickHouse\",\n \"name\": \"写入文件描述符次数\",\n \"unit\": \"writes\",\n \"note\": \"写入文件描述符(write/pwrite)的次数,不包括套接字\",\n \"lang\": \"zh_CN\",\n \"expression\": \"max_over_time(irate(ClickHouseProfileEvents_WriteBufferFromFileDescriptorWrite[2m]) [1h:1m])\",\n \"created_at\": 0,\n \"created_by\": \"\",\n \"updated_at\": 0,\n \"updated_by\": \"\",\n \"translation\": [\n {\n \"lang\": \"zh_CN\",\n \"name\": \"写入文件描述符次数\",\n \"note\": \"写入文件描述符(write/pwrite)的次数,不包括套接字\"\n },\n {\n \"lang\": \"en_US\",\n \"name\": \"Number of writes to file descriptor\",\n \"note\": \"Number of writes to file descriptors (write/pwrite), excluding sockets\"\n }\n ]\n },\n {\n \"id\": 0,\n \"uuid\": 1719305153949391000,\n \"collector\": \"Exporter\",\n \"typ\": \"ClickHouse\",\n \"name\": \"写入文件描述符的字节数\",\n \"unit\": \"bytes\",\n \"note\": \"写入文件描述符的字节数。如果文件是压缩的,这将显示压缩后的数据大小\",\n \"lang\": \"zh_CN\",\n \"expression\": \"max_over_time(irate(ClickHouseProfileEvents_WriteBufferFromFileDescriptorWriteBytes[2m]) [1h:1m])\",\n \"created_at\": 0,\n \"created_by\": \"\",\n \"updated_at\": 0,\n \"updated_by\": \"\",\n \"translation\": [\n {\n \"lang\": \"zh_CN\",\n \"name\": \"写入文件描述符的字节数\",\n \"note\": \"写入文件描述符的字节数。如果文件是压缩的,这将显示压缩后的数据大小\"\n },\n {\n \"lang\": \"en_US\",\n \"name\": \"Number of bytes written to file descriptor\",\n \"note\": \"The number of bytes written to the file descriptor. If the file is compressed, this will show the size of the compressed data\"\n }\n ]\n },\n {\n \"id\": 0,\n \"uuid\": 1719305153950577000,\n \"collector\": \"Exporter\",\n \"typ\": \"ClickHouse\",\n \"name\": \"合并平均持续时间\",\n \"unit\": \"milliseconds\",\n \"note\": \"合并的平均持续时间\",\n \"lang\": \"zh_CN\",\n \"expression\": \"increase(ClickHouseProfileEvents_MergesTimeMilliseconds[1m]) / increase(ClickHouseProfileEvents_Merge[1m])\",\n \"created_at\": 0,\n \"created_by\": \"\",\n \"updated_at\": 0,\n \"updated_by\": \"\",\n \"translation\": [\n {\n \"lang\": \"zh_CN\",\n \"name\": \"合并平均持续时间\",\n \"note\": \"合并的平均持续时间\"\n },\n {\n \"lang\": \"en_US\",\n \"name\": \"Pooled Average Duration\",\n \"note\": \"Average duration of merger\"\n }\n ]\n },\n {\n \"id\": 0,\n \"uuid\": 1719305153953146000,\n \"collector\": \"Exporter\",\n \"typ\": \"ClickHouse\",\n \"name\": \"合并读取的未压缩字节数\",\n \"unit\": \"bytes\",\n \"note\": \"后台合并读取的未压缩字节数(列以它们在内存中存储的形式)。这是合并前的字节数\",\n \"lang\": \"zh_CN\",\n \"expression\": \"max_over_time(irate(ClickHouseProfileEvents_MergedUncompressedBytes[2m]) [1h:1m])\",\n \"created_at\": 0,\n \"created_by\": \"\",\n \"updated_at\": 0,\n \"updated_by\": \"\",\n \"translation\": [\n {\n \"lang\": \"zh_CN\",\n \"name\": \"合并读取的未压缩字节数\",\n \"note\": \"后台合并读取的未压缩字节数(列以它们在内存中存储的形式)。这是合并前的字节数\"\n },\n {\n \"lang\": \"en_US\",\n \"name\": \"Uncompressed bytes read by merging\",\n \"note\": \"Number of uncompressed bytes read by background merge (columns in the form they are stored in memory). This is the number of bytes before merging\"\n }\n ]\n },\n {\n \"id\": 0,\n \"uuid\": 1719305153954853000,\n \"collector\": \"Exporter\",\n \"typ\": \"ClickHouse\",\n \"name\": \"合并读取的行数\",\n \"unit\": \"rows\",\n \"note\": \"后台合并读取的行数。这是合并前的行数\",\n \"lang\": \"zh_CN\",\n \"expression\": \"max_over_time(irate(ClickHouseProfileEvents_MergedRows[2m]) [1h:1m])\",\n \"created_at\": 0,\n \"created_by\": \"\",\n \"updated_at\": 0,\n \"updated_by\": \"\",\n \"translation\": [\n {\n \"lang\": \"zh_CN\",\n \"name\": \"合并读取的行数\",\n \"note\": \"后台合并读取的行数。这是合并前的行数\"\n },\n {\n \"lang\": \"en_US\",\n \"name\": \"Merge number of rows read\",\n \"note\": \"Number of rows read by background merge. This is the number of rows before merging\"\n }\n ]\n },\n {\n \"id\": 0,\n \"uuid\": 1719305153956608000,\n \"collector\": \"Exporter\",\n \"typ\": \"ClickHouse\",\n \"name\": \"后台合并次数\",\n \"unit\": \"times\",\n \"note\": \"启动的后台合并次数\",\n \"lang\": \"zh_CN\",\n \"expression\": \"max_over_time(irate(ClickHouseProfileEvents_Merge[2m]) [1h:1m])\",\n \"created_at\": 0,\n \"created_by\": \"\",\n \"updated_at\": 0,\n \"updated_by\": \"\",\n \"translation\": [\n {\n \"lang\": \"zh_CN\",\n \"name\": \"后台合并次数\",\n \"note\": \"启动的后台合并次数\"\n },\n {\n \"lang\": \"en_US\",\n \"name\": \"Number of background merges\",\n \"note\": \"Number of background merges initiated\"\n }\n ]\n },\n {\n \"id\": 0,\n \"uuid\": 1719305153957668000,\n \"collector\": \"Exporter\",\n \"typ\": \"ClickHouse\",\n \"name\": \"复制部分合并次数\",\n \"unit\": \"times\",\n \"note\": \"ReplicatedMergeTree表的数据部分成功合并的次数\",\n \"lang\": \"zh_CN\",\n \"expression\": \"max_over_time(irate(ClickHouseProfileEvents_ReplicatedPartMerges[2m]) [1h:1m])\",\n \"created_at\": 0,\n \"created_by\": \"\",\n \"updated_at\": 0,\n \"updated_by\": \"\",\n \"translation\": [\n {\n \"lang\": \"zh_CN\",\n \"name\": \"复制部分合并次数\",\n \"note\": \"ReplicatedMergeTree表的数据部分成功合并的次数\"\n },\n {\n \"lang\": \"en_US\",\n \"name\": \"Number of copy partial merges\",\n \"note\": \"Number of successful merges of the data portion of the ReplicatedMergeTree table\"\n }\n ]\n },\n {\n \"id\": 0,\n \"uuid\": 1719305153958797000,\n \"collector\": \"Exporter\",\n \"typ\": \"ClickHouse\",\n \"name\": \"复制部分数据丢失次数\",\n \"unit\": \"times\",\n \"note\": \"数据在任何副本上都不存在的次数(即使是现在离线的副本)。这些数据部分肯定丢失了。由于异步复制(如果未启用配额插入),当写入数据部分的副本失败并且在故障后重新联机时不包含该数据部分,这是正常现象\",\n \"lang\": \"zh_CN\",\n \"expression\": \"max_over_time(irate(ClickHouseProfileEvents_ReplicatedDataLoss[2m]) [1h:1m])\",\n \"created_at\": 0,\n \"created_by\": \"\",\n \"updated_at\": 0,\n \"updated_by\": \"\",\n \"translation\": [\n {\n \"lang\": \"zh_CN\",\n \"name\": \"复制部分数据丢失次数\",\n \"note\": \"数据在任何副本上都不存在的次数(即使是现在离线的副本)。这些数据部分肯定丢失了。由于异步复制(如果未启用配额插入),当写入数据部分的副本失败并且在故障后重新联机时不包含该数据部分,这是正常现象\"\n },\n {\n \"lang\": \"en_US\",\n \"name\": \"Number of data losses in the replication part\",\n \"note\": \"The number of times the data does not exist on any copy (even the copy that is now offline). These data parts must have been lost. Due to asynchronous replication (if quota insertion is not enabled), it is normal that the data part is not included when a copy of the data part fails to be written and comes back online after the failure\"\n }\n ]\n },\n {\n \"id\": 0,\n \"uuid\": 1719305153959861000,\n \"collector\": \"Exporter\",\n \"typ\": \"ClickHouse\",\n \"name\": \"失败的INSERT查询数\",\n \"unit\": \"times\",\n \"note\": \"与失败的查询相同,但仅限于INSERT查询\",\n \"lang\": \"zh_CN\",\n \"expression\": \"max_over_time(irate(ClickHouseProfileEvents_FailedInsertQuery[2m]) [1h:1m])\",\n \"created_at\": 0,\n \"created_by\": \"\",\n \"updated_at\": 0,\n \"updated_by\": \"\",\n \"translation\": [\n {\n \"lang\": \"zh_CN\",\n \"name\": \"失败的INSERT查询数\",\n \"note\": \"与失败的查询相同,但仅限于INSERT查询\"\n },\n {\n \"lang\": \"en_US\",\n \"name\": \"Number of failed INSERT queries\",\n \"note\": \"Same as the failed query but only for the INSERT query\"\n }\n ]\n },\n {\n \"id\": 0,\n \"uuid\": 1719305153961190000,\n \"collector\": \"Exporter\",\n \"typ\": \"ClickHouse\",\n \"name\": \"失败的SELECT查询数\",\n \"unit\": \"queries\",\n \"note\": \"与失败的查询相同,但仅限于SELECT查询\",\n \"lang\": \"zh_CN\",\n \"expression\": \"max_over_time(irate(ClickHouseProfileEvents_FailedSelectQuery[2m]) [1h:1m])\",\n \"created_at\": 0,\n \"created_by\": \"\",\n \"updated_at\": 0,\n \"updated_by\": \"\",\n \"translation\": [\n {\n \"lang\": \"zh_CN\",\n \"name\": \"失败的SELECT查询数\",\n \"note\": \"与失败的查询相同,但仅限于SELECT查询\"\n },\n {\n \"lang\": \"en_US\",\n \"name\": \"Number of failed SELECT queries\",\n \"note\": \"Same as the failed query but only for the SELECT query\"\n }\n ]\n },\n {\n \"id\": 0,\n \"uuid\": 1719305153962249000,\n \"collector\": \"Exporter\",\n \"typ\": \"ClickHouse\",\n \"name\": \"失败的查询数\",\n \"unit\": \"queries\",\n \"note\": \"失败的查询数量\",\n \"lang\": \"zh_CN\",\n \"expression\": \"max_over_time(irate(ClickHouseProfileEvents_FailedQuery[2m]) [1h:1m])\",\n \"created_at\": 0,\n \"created_by\": \"\",\n \"updated_at\": 0,\n \"updated_by\": \"\",\n \"translation\": [\n {\n \"lang\": \"zh_CN\",\n \"name\": \"失败的查询数\",\n \"note\": \"失败的查询数量\"\n },\n {\n \"lang\": \"en_US\",\n \"name\": \"Number of failed queries\",\n \"note\": \"Number of failed queries\"\n }\n ]\n },\n {\n \"id\": 0,\n \"uuid\": 1719305153963287000,\n \"collector\": \"Exporter\",\n \"typ\": \"ClickHouse\",\n \"name\": \"延迟插入次数\",\n \"unit\": \"times\",\n \"note\": \"由于分区的活动数据部分数量过多,INSERT到MergeTree表的块被限制的次数\",\n \"lang\": \"zh_CN\",\n \"expression\": \"max_over_time(irate(ClickHouseProfileEvents_DelayedInserts[2m]) [1h:1m])\",\n \"created_at\": 0,\n \"created_by\": \"\",\n \"updated_at\": 0,\n \"updated_by\": \"\",\n \"translation\": [\n {\n \"lang\": \"zh_CN\",\n \"name\": \"延迟插入次数\",\n \"note\": \"由于分区的活动数据部分数量过多,INSERT到MergeTree表的块被限制的次数\"\n },\n {\n \"lang\": \"en_US\",\n \"name\": \"Delayed Insertion Number\",\n \"note\": \"The number of times the block of INSERT to MergeTree table is restricted due to the number of active data parts of the partition\"\n }\n ]\n },\n {\n \"id\": 0,\n \"uuid\": 1719305153964822000,\n \"collector\": \"Exporter\",\n \"typ\": \"ClickHouse\",\n \"name\": \"延迟插入阻塞的平均等待时间\",\n \"unit\": \"milliseconds\",\n \"note\": \"由于分区的活动数据部分数量过多,INSERT到MergeTree表的块被限制时的总等待时间(毫秒)\",\n \"lang\": \"zh_CN\",\n \"expression\": \"increase(ClickHouseProfileEvents_DelayedInsertsMilliseconds[1m]) / (increase(ClickHouseProfileEvents_DelayedInserts[1m]) + 0.01)\",\n \"created_at\": 0,\n \"created_by\": \"\",\n \"updated_at\": 0,\n \"updated_by\": \"\",\n \"translation\": [\n {\n \"lang\": \"zh_CN\",\n \"name\": \"延迟插入阻塞的平均等待时间\",\n \"note\": \"由于分区的活动数据部分数量过多,INSERT到MergeTree表的块被限制时的总等待时间(毫秒)\"\n },\n {\n \"lang\": \"en_US\",\n \"name\": \"Average latency of delayed insertion blocking\",\n \"note\": \"Total waiting time (milliseconds) when the block of INSERT to MergeTree table is restricted due to the number of active data parts of the partition\"\n }\n ]\n },\n {\n \"id\": 0,\n \"uuid\": 1719305153966130000,\n \"collector\": \"Exporter\",\n \"typ\": \"ClickHouse\",\n \"name\": \"慢查询次数\",\n \"unit\": \"times\",\n \"note\": \"从文件中进行慢查询读取的次数,这表明系统过载\",\n \"lang\": \"zh_CN\",\n \"expression\": \"max_over_time(irate(ClickHouseProfileEvents_SlowRead[2m]) [1h:1m])\",\n \"created_at\": 0,\n \"created_by\": \"\",\n \"updated_at\": 0,\n \"updated_by\": \"\",\n \"translation\": [\n {\n \"lang\": \"zh_CN\",\n \"name\": \"慢查询次数\",\n \"note\": \"从文件中进行慢查询读取的次数,这表明系统过载\"\n },\n {\n \"lang\": \"en_US\",\n \"name\": \"Slow query times\",\n \"note\": \"Number of slow query reads from a file, indicating system overload\"\n }\n ]\n },\n {\n \"id\": 0,\n \"uuid\": 1719305153967132000,\n \"collector\": \"Exporter\",\n \"typ\": \"ClickHouse\",\n \"name\": \"打开的文件数\",\n \"unit\": \"files\",\n \"note\": \"打开的文件数量\",\n \"lang\": \"zh_CN\",\n \"expression\": \"max_over_time(irate(ClickHouseProfileEvents_FileOpen[2m]) [1h:1m])\",\n \"created_at\": 0,\n \"created_by\": \"\",\n \"updated_at\": 0,\n \"updated_by\": \"\",\n \"translation\": [\n {\n \"lang\": \"zh_CN\",\n \"name\": \"打开的文件数\",\n \"note\": \"打开的文件数量\"\n },\n {\n \"lang\": \"en_US\",\n \"name\": \"Number of open files\",\n \"note\": \"Number of open files\"\n }\n ]\n },\n {\n \"id\": 0,\n \"uuid\": 1719305153968376000,\n \"collector\": \"Exporter\",\n \"typ\": \"ClickHouse\",\n \"name\": \"拒绝插入次数\",\n \"unit\": \"times\",\n \"note\": \"由于分区的活动数据部分数量过多,INSERT到MergeTree表的块被拒绝的次数\",\n \"lang\": \"zh_CN\",\n \"expression\": \"max_over_time(irate(ClickHouseProfileEvents_RejectedInserts[2m]) [1h:1m])\",\n \"created_at\": 0,\n \"created_by\": \"\",\n \"updated_at\": 0,\n \"updated_by\": \"\",\n \"translation\": [\n {\n \"lang\": \"zh_CN\",\n \"name\": \"拒绝插入次数\",\n \"note\": \"由于分区的活动数据部分数量过多,INSERT到MergeTree表的块被拒绝的次数\"\n },\n {\n \"lang\": \"en_US\",\n \"name\": \"Number of rejected insertions\",\n \"note\": \"Number of times a block of INSERT to MergeTree table was rejected due to an excessive number of active data parts of the partition\"\n }\n ]\n },\n {\n \"id\": 0,\n \"uuid\": 1719305153969972000,\n \"collector\": \"Exporter\",\n \"typ\": \"ClickHouse\",\n \"name\": \"提交部分数\",\n \"unit\": \"parts\",\n \"note\": \"已经提交的数据部分的数量\",\n \"lang\": \"zh_CN\",\n \"expression\": \"ClickHouseMetrics_PartsCommitted\",\n \"created_at\": 0,\n \"created_by\": \"\",\n \"updated_at\": 0,\n \"updated_by\": \"\",\n \"translation\": [\n {\n \"lang\": \"zh_CN\",\n \"name\": \"提交部分数\",\n \"note\": \"已经提交的数据部分的数量\"\n },\n {\n \"lang\": \"en_US\",\n \"name\": \"Number of submitted parts\",\n \"note\": \"Number of data sections that have been submitted\"\n }\n ]\n },\n {\n \"id\": 0,\n \"uuid\": 1719305153971113000,\n \"collector\": \"Exporter\",\n \"typ\": \"ClickHouse\",\n \"name\": \"插入字节数\",\n \"unit\": \"bytes\",\n \"note\": \"所有表INSERT的字节数(未压缩列以它们在内存中存储的形式)\",\n \"lang\": \"zh_CN\",\n \"expression\": \"max_over_time(irate(ClickHouseProfileEvents_InsertedBytes[2m]) [1h:1m])\",\n \"created_at\": 0,\n \"created_by\": \"\",\n \"updated_at\": 0,\n \"updated_by\": \"\",\n \"translation\": [\n {\n \"lang\": \"zh_CN\",\n \"name\": \"插入字节数\",\n \"note\": \"所有表INSERT的字节数(未压缩列以它们在内存中存储的形式)\"\n },\n {\n \"lang\": \"en_US\",\n \"name\": \"Insert bytes\",\n \"note\": \"Number of bytes of all tables INSERT (uncompressed columns in the form they are stored in memory)\"\n }\n ]\n },\n {\n \"id\": 0,\n \"uuid\": 1719305153972182000,\n \"collector\": \"Exporter\",\n \"typ\": \"ClickHouse\",\n \"name\": \"插入行数\",\n \"unit\": \"rows\",\n \"note\": \"所有表INSERT的行数\",\n \"lang\": \"zh_CN\",\n \"expression\": \"max_over_time(irate(ClickHouseProfileEvents_InsertedRows[2m]) [1h:1m])\",\n \"created_at\": 0,\n \"created_by\": \"\",\n \"updated_at\": 0,\n \"updated_by\": \"\",\n \"translation\": [\n {\n \"lang\": \"zh_CN\",\n \"name\": \"插入行数\",\n \"note\": \"所有表INSERT的行数\"\n },\n {\n \"lang\": \"en_US\",\n \"name\": \"Number of rows inserted\",\n \"note\": \"Number of rows for all tables INSERT\"\n }\n ]\n },\n {\n \"id\": 0,\n \"uuid\": 1719305153973527000,\n \"collector\": \"Exporter\",\n \"typ\": \"ClickHouse\",\n \"name\": \"未压缩缓存命中次数\",\n \"unit\": \"times\",\n \"note\": \"未压缩缓存命中的次数\",\n \"lang\": \"zh_CN\",\n \"expression\": \"max_over_time(irate(ClickHouseProfileEvents_UncompressedCacheHits[2m]) [1h:1m])\",\n \"created_at\": 0,\n \"created_by\": \"\",\n \"updated_at\": 0,\n \"updated_by\": \"\",\n \"translation\": [\n {\n \"lang\": \"zh_CN\",\n \"name\": \"未压缩缓存命中次数\",\n \"note\": \"未压缩缓存命中的次数\"\n },\n {\n \"lang\": \"en_US\",\n \"name\": \"Number of uncompressed cache hits\",\n \"note\": \"Number of uncompressed cache hits\"\n }\n ]\n },\n {\n \"id\": 0,\n \"uuid\": 1719305153974747000,\n \"collector\": \"Exporter\",\n \"typ\": \"ClickHouse\",\n \"name\": \"未压缩缓存未命中次数\",\n \"unit\": \"times\",\n \"note\": \"未压缩缓存未命中的次数\",\n \"lang\": \"zh_CN\",\n \"expression\": \"max_over_time(irate(ClickHouseProfileEvents_UncompressedCacheMisses[2m]) [1h:1m])\",\n \"created_at\": 0,\n \"created_by\": \"\",\n \"updated_at\": 0,\n \"updated_by\": \"\",\n \"translation\": [\n {\n \"lang\": \"zh_CN\",\n \"name\": \"未压缩缓存未命中次数\",\n \"note\": \"未压缩缓存未命中的次数\"\n },\n {\n \"lang\": \"en_US\",\n \"name\": \"Number of uncompressed cache misses\",\n \"note\": \"Number of uncompressed cache misses\"\n }\n ]\n },\n {\n \"id\": 0,\n \"uuid\": 1719305153976184000,\n \"collector\": \"Exporter\",\n \"typ\": \"ClickHouse\",\n \"name\": \"查询内存限制超标次数\",\n \"unit\": \"times\",\n \"note\": \"查询内存限制超标的次数\",\n \"lang\": \"zh_CN\",\n \"expression\": \"max_over_time(irate(ClickHouseProfileEvents_QueryMemoryLimitExceeded[2m]) [1h:1m])\",\n \"created_at\": 0,\n \"created_by\": \"\",\n \"updated_at\": 0,\n \"updated_by\": \"\",\n \"translation\": [\n {\n \"lang\": \"zh_CN\",\n \"name\": \"查询内存限制超标次数\",\n \"note\": \"查询内存限制超标的次数\"\n },\n {\n \"lang\": \"en_US\",\n \"name\": \"Number of times the query memory limit exceeds the standard\",\n \"note\": \"The number of times the query memory limit exceeds the standard\"\n }\n ]\n },\n {\n \"id\": 0,\n \"uuid\": 1719305153977623000,\n \"collector\": \"Exporter\",\n \"typ\": \"ClickHouse\",\n \"name\": \"查询处理线程降低次数\",\n \"unit\": \"times\",\n \"note\": \"由于慢查询读取,降低查询处理线程数的次数\",\n \"lang\": \"zh_CN\",\n \"expression\": \"max_over_time(irate(ClickHouseProfileEvents_ReadBackoff[2m]) [1h:1m])\",\n \"created_at\": 0,\n \"created_by\": \"\",\n \"updated_at\": 0,\n \"updated_by\": \"\",\n \"translation\": [\n {\n \"lang\": \"zh_CN\",\n \"name\": \"查询处理线程降低次数\",\n \"note\": \"由于慢查询读取,降低查询处理线程数的次数\"\n },\n {\n \"lang\": \"en_US\",\n \"name\": \"Query processing thread reduction times\",\n \"note\": \"Reduced number of query processing threads due to slow query reads\"\n }\n ]\n },\n {\n \"id\": 0,\n \"uuid\": 1719305153978786000,\n \"collector\": \"Exporter\",\n \"typ\": \"ClickHouse\",\n \"name\": \"查询平均延迟\",\n \"unit\": \"microseconds\",\n \"note\": \"查询平均延迟\",\n \"lang\": \"zh_CN\",\n \"expression\": \"increase(ClickHouseProfileEvents_QueryTimeMicroseconds[1m]) / (increase(ClickHouseProfileEvents_Query[1m]) + 0.001)\",\n \"created_at\": 0,\n \"created_by\": \"\",\n \"updated_at\": 0,\n \"updated_by\": \"\",\n \"translation\": [\n {\n \"lang\": \"zh_CN\",\n \"name\": \"查询平均延迟\",\n \"note\": \"查询平均延迟\"\n },\n {\n \"lang\": \"en_US\",\n \"name\": \"Average query latency\",\n \"note\": \"Average query latency\"\n }\n ]\n },\n {\n \"id\": 0,\n \"uuid\": 1719305153980379000,\n \"collector\": \"Exporter\",\n \"typ\": \"ClickHouse\",\n \"name\": \"查询总数\",\n \"unit\": \"queries\",\n \"note\": \"需要解释和可能执行的查询数量,不包括失败的查询\",\n \"lang\": \"zh_CN\",\n \"expression\": \"max_over_time(irate(ClickHouseProfileEvents_Query[2m]) [1h:1m])\",\n \"created_at\": 0,\n \"created_by\": \"\",\n \"updated_at\": 0,\n \"updated_by\": \"\",\n \"translation\": [\n {\n \"lang\": \"zh_CN\",\n \"name\": \"查询总数\",\n \"note\": \"需要解释和可能执行的查询数量,不包括失败的查询\"\n },\n {\n \"lang\": \"en_US\",\n \"name\": \"Total queries\",\n \"note\": \"Number of queries to be interpreted and possibly executed, excluding failed queries\"\n }\n ]\n },\n {\n \"id\": 0,\n \"uuid\": 1719305153981570000,\n \"collector\": \"Exporter\",\n \"typ\": \"ClickHouse\",\n \"name\": \"标记缓存命中次数\",\n \"unit\": \"times\",\n \"note\": \"标记缓存命中的次数\",\n \"lang\": \"zh_CN\",\n \"expression\": \"max_over_time(irate(ClickHouseProfileEvents_MarkCacheHits[2m]) [1h:1m])\",\n \"created_at\": 0,\n \"created_by\": \"\",\n \"updated_at\": 0,\n \"updated_by\": \"\",\n \"translation\": [\n {\n \"lang\": \"zh_CN\",\n \"name\": \"标记缓存命中次数\",\n \"note\": \"标记缓存命中的次数\"\n },\n {\n \"lang\": \"en_US\",\n \"name\": \"Tag cache hits\",\n \"note\": \"Mark the number of cache hits\"\n }\n ]\n },\n {\n \"id\": 0,\n \"uuid\": 1719305153983200000,\n \"collector\": \"Exporter\",\n \"typ\": \"ClickHouse\",\n \"name\": \"标记缓存未命中次数\",\n \"unit\": \"times\",\n \"note\": \"标记缓存未命中的次数\",\n \"lang\": \"zh_CN\",\n \"expression\": \"rate(ClickHouseProfileEvents_MarkCacheMisses[2m])\",\n \"created_at\": 0,\n \"created_by\": \"\",\n \"updated_at\": 0,\n \"updated_by\": \"\",\n \"translation\": [\n {\n \"lang\": \"zh_CN\",\n \"name\": \"标记缓存未命中次数\",\n \"note\": \"标记缓存未命中的次数\"\n },\n {\n \"lang\": \"en_US\",\n \"name\": \"Tag cache misses\",\n \"note\": \"Mark the number of cache misses\"\n }\n ]\n },\n {\n \"id\": 0,\n \"uuid\": 1719305153984657000,\n \"collector\": \"Exporter\",\n \"typ\": \"ClickHouse\",\n \"name\": \"读取的压缩块数\",\n \"unit\": \"blocks\",\n \"note\": \"从压缩源(文件,网络)读取的压缩块数(独立压缩的数据块)\",\n \"lang\": \"zh_CN\",\n \"expression\": \"max_over_time(irate(ClickHouseProfileEvents_CompressedReadBufferBlocks[2m]) [1h:1m])\",\n \"created_at\": 0,\n \"created_by\": \"\",\n \"updated_at\": 0,\n \"updated_by\": \"\",\n \"translation\": [\n {\n \"lang\": \"zh_CN\",\n \"name\": \"读取的压缩块数\",\n \"note\": \"从压缩源(文件,网络)读取的压缩块数(独立压缩的数据块)\"\n },\n {\n \"lang\": \"en_US\",\n \"name\": \"Number of compressed blocks read\",\n \"note\": \"Number of compressed blocks read from compression source (file, network) (independently compressed data blocks)\"\n }\n ]\n },\n {\n \"id\": 0,\n \"uuid\": 1719305153985923000,\n \"collector\": \"Exporter\",\n \"typ\": \"ClickHouse\",\n \"name\": \"读取的数据部分数\",\n \"unit\": \"parts\",\n \"note\": \"从MergeTree表读取的数据部分数\",\n \"lang\": \"zh_CN\",\n \"expression\": \"max_over_time(irate(ClickHouseProfileEvents_SelectedParts[2m]) [1h:1m])\",\n \"created_at\": 0,\n \"created_by\": \"\",\n \"updated_at\": 0,\n \"updated_by\": \"\",\n \"translation\": [\n {\n \"lang\": \"zh_CN\",\n \"name\": \"读取的数据部分数\",\n \"note\": \"从MergeTree表读取的数据部分数\"\n },\n {\n \"lang\": \"en_US\",\n \"name\": \"Number of data parts read\",\n \"note\": \"Number of data parts read from the MergeTree table\"\n }\n ]\n },\n {\n \"id\": 0,\n \"uuid\": 1719305153987437000,\n \"collector\": \"Exporter\",\n \"typ\": \"ClickHouse\",\n \"name\": \"读取的未压缩字节数\",\n \"unit\": \"bytes\",\n \"note\": \"从压缩源(文件,网络)读取的未压缩字节数(解压后的字节数)\",\n \"lang\": \"zh_CN\",\n \"expression\": \"max_over_time(irate(ClickHouseProfileEvents_CompressedReadBufferBytes[2m]) [1h:1m])\",\n \"created_at\": 0,\n \"created_by\": \"\",\n \"updated_at\": 0,\n \"updated_by\": \"\",\n \"translation\": [\n {\n \"lang\": \"zh_CN\",\n \"name\": \"读取的未压缩字节数\",\n \"note\": \"从压缩源(文件,网络)读取的未压缩字节数(解压后的字节数)\"\n },\n {\n \"lang\": \"en_US\",\n \"name\": \"Number of uncompressed bytes read\",\n \"note\": \"Number of uncompressed bytes read from compressed source (file, network) (number of decompressed bytes)\"\n }\n ]\n },\n {\n \"id\": 0,\n \"uuid\": 1719305153988925000,\n \"collector\": \"Exporter\",\n \"typ\": \"ClickHouse\",\n \"name\": \"读取的标记数\",\n \"unit\": \"marks\",\n \"note\": \"从MergeTree表读取的标记数(索引粒度)\",\n \"lang\": \"zh_CN\",\n \"expression\": \"irate(ClickHouseProfileEvents_SelectedMarks[2m])\",\n \"created_at\": 0,\n \"created_by\": \"\",\n \"updated_at\": 0,\n \"updated_by\": \"\",\n \"translation\": [\n {\n \"lang\": \"zh_CN\",\n \"name\": \"读取的标记数\",\n \"note\": \"从MergeTree表读取的标记数(索引粒度)\"\n },\n {\n \"lang\": \"en_US\",\n \"name\": \"Number of marks read\",\n \"note\": \"Number of tokens read from MergeTree table (index granularity)\"\n }\n ]\n },\n {\n \"id\": 0,\n \"uuid\": 1719305153990107000,\n \"collector\": \"Exporter\",\n \"typ\": \"ClickHouse\",\n \"name\": \"读取的范围数\",\n \"unit\": \"ranges\",\n \"note\": \"从MergeTree表读取的所有数据部分中(非相邻)的范围数\",\n \"lang\": \"zh_CN\",\n \"expression\": \"max_over_time(irate(ClickHouseProfileEvents_SelectedRanges[2m]) [1h:1m])\",\n \"created_at\": 0,\n \"created_by\": \"\",\n \"updated_at\": 0,\n \"updated_by\": \"\",\n \"translation\": [\n {\n \"lang\": \"zh_CN\",\n \"name\": \"读取的范围数\",\n \"note\": \"从MergeTree表读取的所有数据部分中(非相邻)的范围数\"\n },\n {\n \"lang\": \"en_US\",\n \"name\": \"Number of ranges read\",\n \"note\": \"Number of ranges (non-adjacent) in all data parts read from the MergeTree table\"\n }\n ]\n },\n {\n \"id\": 0,\n \"uuid\": 1719305153991749000,\n \"collector\": \"Exporter\",\n \"typ\": \"ClickHouse\",\n \"name\": \"预提交部分数\",\n \"unit\": \"parts\",\n \"note\": \"在数据部分中,但不用于SELECT查询的部分\",\n \"lang\": \"zh_CN\",\n \"expression\": \"ClickHouseMetrics_PartsPreCommitted\",\n \"created_at\": 0,\n \"created_by\": \"\",\n \"updated_at\": 0,\n \"updated_by\": \"\",\n \"translation\": [\n {\n \"lang\": \"zh_CN\",\n \"name\": \"预提交部分数\",\n \"note\": \"在数据部分中,但不用于SELECT查询的部分\"\n },\n {\n \"lang\": \"en_US\",\n \"name\": \"Number of pre-commit parts\",\n \"note\": \"In the DATA section, but not the section used for the SELECT query\"\n }\n ]\n }\n]"
},
{
"path": "integrations/CloudWatch/collect/cloudwatch/cloud.toml",
"content": "interval=\"5m\"\n[[instances]]\n ## Amazon Region\n # list of region and endpoint, see https://docs.aws.amazon.com/general/latest/gr/cw_region.html\n region = \"us-east-1\"\n\n ## Amazon Credentials\n ## Credentials are loaded in the following order\n ## 1) Web identity provider credentials via STS if role_arn and\n ## web_identity_token_file are specified\n ## 2) Assumed credentials via STS if role_arn is specified\n ## 3) explicit credentials from 'access_key' and 'secret_key'\n ## 4) shared profile from 'profile'\n ## 5) environment variables\n ## 6) shared credentials file\n ## 7) EC2 Instance Profile\n # access_key = \"\"\n # secret_key = \"\"\n # token = \"\"\n # role_arn = \"\"\n # web_identity_token_file = \"\"\n # role_session_name = \"\"\n # profile = \"\"\n # shared_credential_file = \"\"\n\n ## Endpoint to make request against, the correct endpoint is automatically\n ## determined and this option should only be set if you wish to override the\n ## default.\n ## ex: endpoint_url = \"http://localhost:8000\"\n endpoint_url = \"https://monitoring.ap-southeast-1.amazonaws.com\"\n\n ## Set http_proxy\n # use_system_proxy = false\n # http_proxy_url = \"http://localhost:8888\"\n\n ## The minimum period for CloudWatch metrics is 1 minute (60s). However not\n ## all metrics are made available to the 1 minute period. Some are collected\n ## at 3 minute, 5 minute, or larger intervals.\n ## See https://aws.amazon.com/cloudwatch/faqs/#monitoring.\n ## Note that if a period is configured that is smaller than the minimum for a\n ## particular metric, that metric will not be returned by the CloudWatch API\n ## and will not be collected by Telegraf.\n #\n ## Collection Delay (required)\n ## Must account for metrics availability via CloudWatch API\n delay = \"5m\"\n\n ## Requested CloudWatch aggregation Period (required)\n ## Must be a multiple of 60s.\n period = \"5m\"\n\n ## Recommended if \"delay\" and \"period\" are both within 3 hours of request\n ## time. Invalid values will be ignored. Recently Active feature will only\n ## poll for CloudWatch ListMetrics values that occurred within the last 3h.\n ## If enabled, it will reduce total API usage of the CloudWatch ListMetrics\n ## API and require less memory to retain.\n ## Do not enable if \"period\" or \"delay\" is longer than 3 hours, as it will\n ## not return data more than 3 hours old.\n ## See https://docs.aws.amazon.com/AmazonCloudWatch/latest/APIReference/API_ListMetrics.html\n #recently_active = \"PT3H\"\n\n ## Configure the TTL for the internal cache of metrics.\n # cache_ttl = \"1h\"\n\n ## Metric Statistic Namespaces (required)\n # namespaces = [\"AWS/EC2\"]\n\n ## Maximum requests per second. Note that the global default AWS rate limit\n ## is 50 reqs/sec, so if you define multiple namespaces, these should add up\n ## to a maximum of 50.\n ## See http://docs.aws.amazon.com/AmazonCloudWatch/latest/monitoring/cloudwatch_limits.html\n # ratelimit = 25\n\n ## Timeout for http requests made by the cloudwatch client.\n # timeout = \"5s\"\n\n ## Batch Size\n ## The size of each batch to send requests to CloudWatch. 500 is the\n ## suggested largest size. If a request gets to large (413 errors), consider\n ## reducing this amount.\n # batch_size = 500\n\n ## Namespace-wide statistic filters. These allow fewer queries to be made to\n ## cloudwatch.\n # statistic_include = [\"average\", \"sum\", \"minimum\", \"maximum\", sample_count\"]\n # statistic_exclude = []\n\n ## Metrics to Pull\n ## Defaults to all Metrics in Namespace if nothing is provided\n ## Refreshes Namespace available metrics every 1h\n #[[instances.metrics]]\n # names = [\"Latency\", \"RequestCount\"]\n #\n # ## Statistic filters for Metric. These allow for retrieving specific\n # ## statistics for an individual metric.\n # # statistic_include = [\"average\", \"sum\", \"minimum\", \"maximum\", sample_count\"]\n # # statistic_exclude = []\n #\n # ## Dimension filters for Metric.\n # ## All dimensions defined for the metric names must be specified in order\n # ## to retrieve the metric statistics.\n # ## 'value' has wildcard / 'glob' matching support such as 'p-*'.\n # [[instances.metrics.dimensions]]\n # name = \"LoadBalancerName\"\n # value = \"p-example\"\n"
},
{
"path": "integrations/CloudWatch/dashboards/dashboard-by-aws-rds.json",
"content": "{\n \"id\": 0,\n \"group_id\": 0,\n \"name\": \"AWS RDS Telegraf\",\n \"ident\": \"\",\n \"tags\": \"AWS Cloudwatch Telegraf\",\n \"create_at\": 0,\n \"create_by\": \"\",\n \"update_at\": 0,\n \"update_by\": \"\",\n \"configs\": {\n \"panels\": [\n {\n \"collapsed\": true,\n \"id\": \"2ceac4da-53d8-432d-ad43-51a25cf63b21\",\n \"layout\": {\n \"h\": 1,\n \"i\": \"2ceac4da-53d8-432d-ad43-51a25cf63b21\",\n \"isResizable\": false,\n \"w\": 24,\n \"x\": 0,\n \"y\": 0\n },\n \"name\": \"Common metrics\",\n \"panels\": [],\n \"type\": \"row\"\n },\n {\n \"custom\": {\n \"drawStyle\": \"lines\",\n \"fillOpacity\": 0,\n \"lineInterpolation\": \"smooth\",\n \"stack\": \"off\"\n },\n \"datasourceCate\": \"prometheus\",\n \"datasourceValue\": \"${datasource}\",\n \"description\": \"* Telegraf Gather AWS Cloudwatch RDS\\n* cloudwatch aws rds cpu 利用率平均值\",\n \"id\": \"2002c9f5-6177-4239-a0c6-2981edacae5a\",\n \"layout\": {\n \"h\": 6,\n \"i\": \"2002c9f5-6177-4239-a0c6-2981edacae5a\",\n \"isResizable\": true,\n \"w\": 12,\n \"x\": 0,\n \"y\": 1\n },\n \"name\": \"RDS CPU利用率(百分比)\",\n \"options\": {\n \"legend\": {\n \"displayMode\": \"hidden\"\n },\n \"standardOptions\": {},\n \"thresholds\": {\n \"steps\": [\n {\n \"color\": \"#d0021b\",\n \"value\": 80\n }\n ]\n },\n \"tooltip\": {\n \"mode\": \"all\",\n \"sort\": \"desc\"\n }\n },\n \"targets\": [\n {\n \"expr\": \"cloudwatch_aws_rds_cpu_utilization_average{region=\\\"$region\\\",db_instance_identifier=\\\"$instance\\\"}\",\n \"legend\": \"{{db_instance_identifier}}\",\n \"refId\": \"A\"\n }\n ],\n \"type\": \"timeseries\",\n \"version\": \"2.0.0\"\n },\n {\n \"custom\": {\n \"drawStyle\": \"lines\",\n \"fillOpacity\": 0,\n \"lineInterpolation\": \"smooth\",\n \"stack\": \"off\"\n },\n \"datasourceCate\": \"prometheus\",\n \"datasourceValue\": \"${datasource}\",\n \"description\": \"* Telegraf Gather AWS Cloudwatch RDS\\n* cloudwatch aws rds 数据库连接平均值\",\n \"id\": \"c54b9dca-88ce-425a-bf75-6d8b363f6ebb\",\n \"layout\": {\n \"h\": 6,\n \"i\": \"05ddf798-e5f8-4b34-96f1-aaa2a45d1207\",\n \"isResizable\": true,\n \"w\": 12,\n \"x\": 12,\n \"y\": 1\n },\n \"name\": \"RDS 数据库连接数\",\n \"options\": {\n \"legend\": {\n \"displayMode\": \"hidden\"\n },\n \"standardOptions\": {},\n \"thresholds\": {\n \"steps\": [\n {\n \"color\": \"#d0021b\",\n \"value\": 100\n }\n ]\n },\n \"tooltip\": {\n \"mode\": \"all\",\n \"sort\": \"desc\"\n }\n },\n \"targets\": [\n {\n \"expr\": \"cloudwatch_aws_rds_database_connections_average{region=\\\"$region\\\",db_instance_identifier=\\\"$instance\\\"}\",\n \"legend\": \"{{db_instance_identifier}}\",\n \"refId\": \"A\"\n }\n ],\n \"type\": \"timeseries\",\n \"version\": \"2.0.0\"\n },\n {\n \"custom\": {\n \"drawStyle\": \"lines\",\n \"fillOpacity\": 0,\n \"lineInterpolation\": \"smooth\",\n \"stack\": \"off\"\n },\n \"datasourceCate\": \"prometheus\",\n \"datasourceValue\": \"${datasource}\",\n \"description\": \"* Telegraf Gather AWS Cloudwatch RDS\\n* cloudwatch aws rds 可用存储空间平均值\",\n \"id\": \"997a6214-2ac0-46c6-a0b9-046810b2b8cf\",\n \"layout\": {\n \"h\": 6,\n \"i\": \"2d42ff70-a867-4f02-9980-5f20c017a21e\",\n \"isResizable\": true,\n \"w\": 12,\n \"x\": 0,\n \"y\": 7\n },\n \"name\": \"RDS 可用存储空间(MB/秒)\",\n \"options\": {\n \"legend\": {\n \"displayMode\": \"hidden\"\n },\n \"standardOptions\": {},\n \"thresholds\": {\n \"steps\": [\n {\n \"color\": \"#d0021b\",\n \"value\": 10000000000\n }\n ]\n },\n \"tooltip\": {\n \"mode\": \"all\",\n \"sort\": \"desc\"\n }\n },\n \"targets\": [\n {\n \"expr\": \"cloudwatch_aws_rds_free_storage_space_average{region=\\\"$region\\\",db_instance_identifier=\\\"$instance\\\"}\",\n \"legend\": \"{{db_instance_identifier}}\",\n \"refId\": \"A\"\n }\n ],\n \"type\": \"timeseries\",\n \"version\": \"2.0.0\"\n },\n {\n \"custom\": {\n \"drawStyle\": \"lines\",\n \"fillOpacity\": 0,\n \"lineInterpolation\": \"smooth\",\n \"stack\": \"off\"\n },\n \"datasourceCate\": \"prometheus\",\n \"datasourceValue\": \"${datasource}\",\n \"description\": \"* Telegraf Gather AWS Cloudwatch RDS\\n* cloudwatch aws rds 可用内存平均值\",\n \"id\": \"6c00311c-e931-487f-b088-3a3bfafc84ef\",\n \"layout\": {\n \"h\": 6,\n \"i\": \"89bbb148-7fb3-4492-a5d6-abd0bb5df667\",\n \"isResizable\": true,\n \"w\": 12,\n \"x\": 12,\n \"y\": 7\n },\n \"name\": \"RDS 可用内存(MB)\",\n \"options\": {\n \"legend\": {\n \"displayMode\": \"hidden\"\n },\n \"standardOptions\": {},\n \"thresholds\": {\n \"steps\": [\n {\n \"color\": \"#d0021b\",\n \"value\": 2000000000\n }\n ]\n },\n \"tooltip\": {\n \"mode\": \"all\",\n \"sort\": \"desc\"\n }\n },\n \"targets\": [\n {\n \"expr\": \"cloudwatch_aws_rds_freeable_memory_average{region=\\\"$region\\\",db_instance_identifier=\\\"$instance\\\"}\",\n \"legend\": \"{{db_instance_identifier}}\",\n \"refId\": \"A\"\n }\n ],\n \"type\": \"timeseries\",\n \"version\": \"2.0.0\"\n },\n {\n \"custom\": {\n \"drawStyle\": \"lines\",\n \"fillOpacity\": 0,\n \"lineInterpolation\": \"smooth\",\n \"stack\": \"off\"\n },\n \"datasourceCate\": \"prometheus\",\n \"datasourceValue\": \"${datasource}\",\n \"description\": \"* Telegraf Gather AWS Cloudwatch RDS\\n* cloudwatch aws rds lvm 写入 iops 平均值\",\n \"id\": \"990ab5a1-4aa5-47c3-b7b7-a65f63459119\",\n \"layout\": {\n \"h\": 6,\n \"i\": \"18640a88-13c0-4ce7-8456-60b20f8c7422\",\n \"isResizable\": true,\n \"w\": 12,\n \"x\": 0,\n \"y\": 13\n },\n \"name\": \"RDS 写入IOPS(次数/秒)\",\n \"options\": {\n \"legend\": {\n \"displayMode\": \"hidden\"\n },\n \"standardOptions\": {},\n \"thresholds\": {\n \"steps\": []\n },\n \"tooltip\": {\n \"mode\": \"all\",\n \"sort\": \"desc\"\n }\n },\n \"targets\": [\n {\n \"expr\": \"cloudwatch_aws_rds_lvm_write_iops_average{region=\\\"$region\\\",db_instance_identifier=\\\"$instance\\\"}\",\n \"legend\": \"{{db_instance_identifier}}\",\n \"refId\": \"A\"\n }\n ],\n \"type\": \"timeseries\",\n \"version\": \"2.0.0\"\n },\n {\n \"custom\": {\n \"drawStyle\": \"lines\",\n \"fillOpacity\": 0,\n \"lineInterpolation\": \"smooth\",\n \"stack\": \"off\"\n },\n \"datasourceCate\": \"prometheus\",\n \"datasourceValue\": \"${datasource}\",\n \"description\": \"* Telegraf Gather AWS Cloudwatch RDS\\n* cloudwatch aws rds 读取 iops 平均值\",\n \"id\": \"a61a80da-7d0a-45a5-a868-bd442b3aa4cf\",\n \"layout\": {\n \"h\": 6,\n \"i\": \"010a63f8-2a08-4d56-9131-0f9e50a7e2f4\",\n \"isResizable\": true,\n \"w\": 12,\n \"x\": 12,\n \"y\": 13\n },\n \"name\": \"RDS 读取IOPS(次数/秒)\",\n \"options\": {\n \"legend\": {\n \"displayMode\": \"hidden\"\n },\n \"standardOptions\": {},\n \"thresholds\": {\n \"steps\": []\n },\n \"tooltip\": {\n \"mode\": \"all\",\n \"sort\": \"desc\"\n }\n },\n \"targets\": [\n {\n \"expr\": \"cloudwatch_aws_rds_read_iops_average{region=\\\"$region\\\",db_instance_identifier=\\\"$instance\\\"}\",\n \"legend\": \"{{db_instance_identifier}}\",\n \"refId\": \"A\"\n }\n ],\n \"type\": \"timeseries\",\n \"version\": \"2.0.0\"\n },\n {\n \"custom\": {\n \"drawStyle\": \"lines\",\n \"fillOpacity\": 0,\n \"lineInterpolation\": \"smooth\",\n \"stack\": \"off\"\n },\n \"datasourceCate\": \"prometheus\",\n \"datasourceValue\": \"${datasource}\",\n \"description\": \"* Telegraf Gather AWS Cloudwatch RDS\\n* cloudwatch aws rds 写入吞吐量平均值\",\n \"id\": \"2e605342-3413-4004-9fcf-3dbbfa7e7be3\",\n \"layout\": {\n \"h\": 6,\n \"i\": \"58987f8f-09d3-445f-b22f-5f872f5b9dde\",\n \"isResizable\": true,\n \"w\": 12,\n \"x\": 0,\n \"y\": 19\n },\n \"name\": \"RDS 写入吞吐量(MB/秒)\",\n \"options\": {\n \"legend\": {\n \"displayMode\": \"hidden\"\n },\n \"standardOptions\": {},\n \"thresholds\": {\n \"steps\": []\n },\n \"tooltip\": {\n \"mode\": \"all\",\n \"sort\": \"desc\"\n }\n },\n \"targets\": [\n {\n \"expr\": \"cloudwatch_aws_rds_write_throughput_average{region=\\\"$region\\\",db_instance_identifier=\\\"$instance\\\"}\",\n \"legend\": \"{{db_instance_identifier}}\",\n \"refId\": \"A\"\n }\n ],\n \"type\": \"timeseries\",\n \"version\": \"2.0.0\"\n },\n {\n \"custom\": {\n \"drawStyle\": \"lines\",\n \"fillOpacity\": 0,\n \"lineInterpolation\": \"smooth\",\n \"stack\": \"off\"\n },\n \"datasourceCate\": \"prometheus\",\n \"datasourceValue\": \"${datasource}\",\n \"description\": \"* Telegraf Gather AWS Cloudwatch RDS\\n* cloudwatch aws rds 读取吞吐量平均值\",\n \"id\": \"1ef3f98d-1b54-408a-8cc2-4570c327d705\",\n \"layout\": {\n \"h\": 6,\n \"i\": \"23e7b924-d638-4293-9840-78fb129d5410\",\n \"isResizable\": true,\n \"w\": 12,\n \"x\": 12,\n \"y\": 19\n },\n \"name\": \"RDS 读取吞吐量(MB/秒)\",\n \"options\": {\n \"legend\": {\n \"displayMode\": \"hidden\"\n },\n \"standardOptions\": {},\n \"thresholds\": {\n \"steps\": []\n },\n \"tooltip\": {\n \"mode\": \"all\",\n \"sort\": \"desc\"\n }\n },\n \"targets\": [\n {\n \"expr\": \"cloudwatch_aws_rds_read_throughput_average{region=\\\"$region\\\",db_instance_identifier=\\\"$instance\\\"}\",\n \"legend\": \"{{db_instance_identifier}}\",\n \"refId\": \"A\"\n }\n ],\n \"type\": \"timeseries\",\n \"version\": \"2.0.0\"\n },\n {\n \"collapsed\": true,\n \"id\": \"07e3cd80-1984-4ebe-a037-526e6a186ebb\",\n \"layout\": {\n \"h\": 1,\n \"i\": \"07e3cd80-1984-4ebe-a037-526e6a186ebb\",\n \"isResizable\": false,\n \"w\": 24,\n \"x\": 0,\n \"y\": 25\n },\n \"name\": \"NetWork metrics\",\n \"panels\": [],\n \"type\": \"row\"\n },\n {\n \"custom\": {\n \"drawStyle\": \"lines\",\n \"fillOpacity\": 0,\n \"lineInterpolation\": \"smooth\",\n \"stack\": \"off\"\n },\n \"datasourceCate\": \"prometheus\",\n \"datasourceValue\": \"${datasource}\",\n \"description\": \"* Telegraf Gather AWS Cloudwatch RDS\\n* cloudwatch aws rds 网络接收吞吐量平均\",\n \"id\": \"4ba500c9-e87e-41e4-bbc1-82fec507da9d\",\n \"layout\": {\n \"h\": 6,\n \"i\": \"e1573095-990a-468d-bf2f-7bbf5a6dcb42\",\n \"isResizable\": true,\n \"w\": 12,\n \"x\": 0,\n \"y\": 26\n },\n \"name\": \"RDS 网络接收吞吐量(MB/秒)\",\n \"options\": {\n \"legend\": {\n \"displayMode\": \"hidden\"\n },\n \"standardOptions\": {},\n \"thresholds\": {\n \"steps\": []\n },\n \"tooltip\": {\n \"mode\": \"all\",\n \"sort\": \"desc\"\n }\n },\n \"targets\": [\n {\n \"expr\": \"cloudwatch_aws_rds_network_receive_throughput_average{region=\\\"$region\\\",db_instance_identifier=\\\"$instance\\\"}\",\n \"legend\": \"{{db_instance_identifier}}\",\n \"refId\": \"A\"\n }\n ],\n \"type\": \"timeseries\",\n \"version\": \"2.0.0\"\n },\n {\n \"custom\": {\n \"drawStyle\": \"lines\",\n \"fillOpacity\": 0,\n \"lineInterpolation\": \"smooth\",\n \"stack\": \"off\"\n },\n \"datasourceCate\": \"prometheus\",\n \"datasourceValue\": \"${datasource}\",\n \"description\": \"* Telegraf Gather AWS Cloudwatch RDS\\n* cloudwatch aws rds 网络传输吞吐量平均值\",\n \"id\": \"edee8285-1274-4ddc-b166-fb773c764c2b\",\n \"layout\": {\n \"h\": 6,\n \"i\": \"0493a01d-d066-482a-b677-2d9ae1d9a30b\",\n \"isResizable\": true,\n \"w\": 12,\n \"x\": 12,\n \"y\": 26\n },\n \"name\": \"RDS 网络传输吞吐量(MB/秒)\",\n \"options\": {\n \"legend\": {\n \"displayMode\": \"hidden\"\n },\n \"standardOptions\": {},\n \"thresholds\": {\n \"steps\": []\n },\n \"tooltip\": {\n \"mode\": \"all\",\n \"sort\": \"desc\"\n }\n },\n \"targets\": [\n {\n \"expr\": \"cloudwatch_aws_rds_network_transmit_throughput_average{region=\\\"$region\\\",db_instance_identifier=\\\"$instance\\\"}\",\n \"legend\": \"{{db_instance_identifier}}\",\n \"refId\": \"A\"\n }\n ],\n \"type\": \"timeseries\",\n \"version\": \"2.0.0\"\n },\n {\n \"custom\": {\n \"drawStyle\": \"lines\",\n \"fillOpacity\": 0,\n \"lineInterpolation\": \"smooth\",\n \"stack\": \"off\"\n },\n \"datasourceCate\": \"prometheus\",\n \"datasourceValue\": \"${datasource}\",\n \"description\": \"* Telegraf Gather AWS Cloudwatch RDS\\n* cloudwatch aws rds 写入延迟平均值\",\n \"id\": \"ecb9b8a5-b168-4a65-b7f6-7912ab6c6b22\",\n \"layout\": {\n \"h\": 6,\n \"i\": \"fb7ee87d-7bec-4123-ab16-7ef2b6838d8c\",\n \"isResizable\": true,\n \"w\": 12,\n \"x\": 0,\n \"y\": 32\n },\n \"name\": \"RDS 写入延迟(毫秒)\",\n \"options\": {\n \"legend\": {\n \"displayMode\": \"hidden\"\n },\n \"standardOptions\": {},\n \"thresholds\": {\n \"steps\": []\n },\n \"tooltip\": {\n \"mode\": \"all\",\n \"sort\": \"desc\"\n }\n },\n \"targets\": [\n {\n \"expr\": \"cloudwatch_aws_rds_write_latency_average{region=\\\"$region\\\",db_instance_identifier=\\\"$instance\\\"} * 1000\",\n \"legend\": \"{{db_instance_identifier}}\",\n \"refId\": \"A\"\n }\n ],\n \"type\": \"timeseries\",\n \"version\": \"2.0.0\"\n },\n {\n \"custom\": {\n \"drawStyle\": \"lines\",\n \"fillOpacity\": 0,\n \"lineInterpolation\": \"smooth\",\n \"stack\": \"off\"\n },\n \"datasourceCate\": \"prometheus\",\n \"datasourceValue\": \"${datasource}\",\n \"description\": \"* Telegraf Gather AWS Cloudwatch RDS\\n* cloudwatch aws rds 读取延迟平均值\",\n \"id\": \"60d009fa-e547-45be-a862-9b156c15b675\",\n \"layout\": {\n \"h\": 6,\n \"i\": \"d652843b-4005-4448-8342-b3761f58677b\",\n \"isResizable\": true,\n \"w\": 12,\n \"x\": 12,\n \"y\": 32\n },\n \"name\": \"RDS 读取延迟(毫秒)\",\n \"options\": {\n \"legend\": {\n \"displayMode\": \"hidden\"\n },\n \"standardOptions\": {},\n \"thresholds\": {\n \"steps\": []\n },\n \"tooltip\": {\n \"mode\": \"all\",\n \"sort\": \"desc\"\n }\n },\n \"targets\": [\n {\n \"expr\": \"cloudwatch_aws_rds_read_latency_average{region=\\\"$region\\\",db_instance_identifier=\\\"$instance\\\"} * 1000\",\n \"legend\": \"{{db_instance_identifier}}\",\n \"refId\": \"A\"\n }\n ],\n \"type\": \"timeseries\",\n \"version\": \"2.0.0\"\n },\n {\n \"collapsed\": true,\n \"id\": \"3fafd89f-e6dc-4666-96b7-9f2dc216f496\",\n \"layout\": {\n \"h\": 1,\n \"i\": \"3fafd89f-e6dc-4666-96b7-9f2dc216f496\",\n \"isResizable\": false,\n \"w\": 24,\n \"x\": 0,\n \"y\": 38\n },\n \"name\": \"Additional metrics\",\n \"panels\": [],\n \"type\": \"row\"\n },\n {\n \"custom\": {\n \"drawStyle\": \"lines\",\n \"fillOpacity\": 0,\n \"lineInterpolation\": \"smooth\",\n \"stack\": \"off\"\n },\n \"datasourceCate\": \"prometheus\",\n \"datasourceValue\": \"${datasource}\",\n \"description\": \"* Telegraf Gather AWS Cloudwatch RDS\\n* cloudwatch aws rds 磁盘队列深度平均值\",\n \"id\": \"7edcf2a8-16f3-49ef-9026-e53dc5e72c69\",\n \"layout\": {\n \"h\": 6,\n \"i\": \"b36508a8-057d-44fe-9899-74862407fd03\",\n \"isResizable\": true,\n \"w\": 12,\n \"x\": 0,\n \"y\": 39\n },\n \"name\": \"RDS 队列深度(数量)\",\n \"options\": {\n \"legend\": {\n \"displayMode\": \"hidden\"\n },\n \"standardOptions\": {},\n \"thresholds\": {\n \"steps\": []\n },\n \"tooltip\": {\n \"mode\": \"all\",\n \"sort\": \"desc\"\n }\n },\n \"targets\": [\n {\n \"expr\": \"cloudwatch_aws_rds_disk_queue_depth_average{region=\\\"$region\\\",db_instance_identifier=\\\"$instance\\\"}\",\n \"legend\": \"{{db_instance_identifier}}\",\n \"refId\": \"A\"\n }\n ],\n \"type\": \"timeseries\",\n \"version\": \"2.0.0\"\n },\n {\n \"custom\": {\n \"drawStyle\": \"lines\",\n \"fillOpacity\": 0,\n \"lineInterpolation\": \"smooth\",\n \"stack\": \"off\"\n },\n \"datasourceCate\": \"prometheus\",\n \"datasourceValue\": \"${datasource}\",\n \"description\": \"* Telegraf Gather AWS Cloudwatch RDS\\n* cloudwatch aws rds 二进制日志磁盘使用情况 (MB)\",\n \"id\": \"42143731-22a9-45b4-bb1e-ddb8f2c11a70\",\n \"layout\": {\n \"h\": 6,\n \"i\": \"ca09fee2-6496-444a-937d-3fc2d7483630\",\n \"isResizable\": true,\n \"w\": 12,\n \"x\": 12,\n \"y\": 39\n },\n \"name\": \"RDS 二进制日志磁盘使用情况 (MB)\",\n \"options\": {\n \"legend\": {\n \"displayMode\": \"hidden\"\n },\n \"standardOptions\": {},\n \"thresholds\": {\n \"steps\": []\n },\n \"tooltip\": {\n \"mode\": \"all\",\n \"sort\": \"desc\"\n }\n },\n \"targets\": [\n {\n \"expr\": \"cloudwatch_aws_rds_bin_log_disk_usage_average{region=\\\"$region\\\",db_instance_identifier=\\\"$instance\\\"}\",\n \"legend\": \"{{db_instance_identifier}}\",\n \"refId\": \"A\"\n }\n ],\n \"type\": \"timeseries\",\n \"version\": \"2.0.0\"\n },\n {\n \"custom\": {\n \"drawStyle\": \"lines\",\n \"fillOpacity\": 0,\n \"lineInterpolation\": \"smooth\",\n \"stack\": \"off\"\n },\n \"datasourceCate\": \"prometheus\",\n \"datasourceValue\": \"${datasource}\",\n \"description\": \"* Telegraf Gather AWS Cloudwatch RDS\\n* cloudwatch aws rds 交换分区使用平均值\",\n \"id\": \"51c6f9d9-30db-4514-a54d-712e1a570b23\",\n \"layout\": {\n \"h\": 6,\n \"i\": \"1252f5b7-278b-4cd9-9f36-8fb5ccf6ee51\",\n \"isResizable\": true,\n \"w\": 12,\n \"x\": 0,\n \"y\": 45\n },\n \"name\": \"RDS 交换分区使用情况(MB)\",\n \"options\": {\n \"legend\": {\n \"displayMode\": \"hidden\"\n },\n \"standardOptions\": {},\n \"thresholds\": {\n \"steps\": []\n },\n \"tooltip\": {\n \"mode\": \"all\",\n \"sort\": \"desc\"\n }\n },\n \"targets\": [\n {\n \"expr\": \"cloudwatch_aws_rds_swap_usage_average{region=\\\"$region\\\",db_instance_identifier=\\\"$instance\\\"}\",\n \"legend\": \"{{db_instance_identifier}}\",\n \"refId\": \"A\"\n }\n ],\n \"type\": \"timeseries\",\n \"version\": \"2.0.0\"\n },\n {\n \"custom\": {\n \"drawStyle\": \"lines\",\n \"fillOpacity\": 0,\n \"lineInterpolation\": \"smooth\",\n \"stack\": \"off\"\n },\n \"datasourceCate\": \"prometheus\",\n \"datasourceValue\": \"${datasource}\",\n \"description\": \"* Telegraf Gather AWS Cloudwatch RDS\\n* cloudwatch aws rds 突发余额平均值\",\n \"id\": \"767bcc71-3f71-443a-9713-03f587ccc350\",\n \"layout\": {\n \"h\": 6,\n \"i\": \"05473d8c-ea01-40c7-b4d4-47378a42aa3e\",\n \"isResizable\": true,\n \"w\": 12,\n \"x\": 12,\n \"y\": 45\n },\n \"name\": \"RDS 突发信用余额平均值(百分比)\",\n \"options\": {\n \"legend\": {\n \"displayMode\": \"hidden\"\n },\n \"standardOptions\": {\n \"max\": 110\n },\n \"thresholds\": {\n \"steps\": []\n },\n \"tooltip\": {\n \"mode\": \"all\",\n \"sort\": \"desc\"\n }\n },\n \"targets\": [\n {\n \"expr\": \"cloudwatch_aws_rds_burst_balance_average{region=\\\"$region\\\",db_instance_identifier=\\\"$instance\\\"}\",\n \"legend\": \"{{db_instance_identifier}}\",\n \"refId\": \"A\"\n }\n ],\n \"type\": \"timeseries\",\n \"version\": \"2.0.0\"\n }\n ],\n \"var\": [\n {\n \"definition\": \"prometheus\",\n \"name\": \"datasource\",\n \"type\": \"datasource\"\n },\n {\n \"datasource\": {\n \"cate\": \"prometheus\",\n \"value\": \"${datasource}\"\n },\n \"definition\": \"label_values(cloudwatch_aws_rds_cpu_utilization_average, region)\",\n \"multi\": false,\n \"name\": \"region\",\n \"type\": \"query\"\n },\n {\n \"datasource\": {\n \"cate\": \"prometheus\",\n \"value\": \"${datasource}\"\n },\n \"definition\": \"label_values(cloudwatch_aws_rds_cpu_utilization_average{region=\\\"$region\\\"}, db_instance_identifier)\",\n \"name\": \"instance\",\n \"type\": \"query\"\n }\n ],\n \"version\": \"3.0.0\"\n },\n \"public\": 0,\n \"public_cate\": 0,\n \"bgids\": null,\n \"built_in\": 0,\n \"hide\": 0,\n \"uuid\": 1717556327336057000\n}"
},
{
"path": "integrations/CloudWatch/markdown/README.md",
"content": "Forked from [telegraf/cloudwatch](https://github.com/influxdata/telegraf/tree/master/plugins/inputs/cloudwatch)\n____\n\n# Amazon CloudWatch Statistics Input Plugin\n\nThis plugin will pull Metric Statistics from Amazon CloudWatch.\n\n## Amazon Authentication\n\nThis plugin uses a credential chain for Authentication with the CloudWatch\nAPI endpoint. In the following order the plugin will attempt to authenticate.\n\n1. Assumed credentials via STS if `role_arn` attribute is specified\n (source credentials are evaluated from subsequent rules)\n2. Explicit credentials from `access_key`, `secret_key`, and `token` attributes\n3. Shared profile from `profile` attribute\n4. [Environment Variables][env]\n5. [Shared Credentials][credentials]\n6. [EC2 Instance Profile][iam-roles]\n\n## Global configuration options \n\nIn addition to the plugin-specific configuration settings, plugins support\nadditional global and plugin configuration settings. These settings are used to\nmodify metrics, tags, and field or create aliases and configure ordering, etc.\nSee the [CONFIGURATION.md][CONFIGURATION.md] for more details.\n\n[CONFIGURATION.md]: ../../../docs/CONFIGURATION.md#plugins\n\n## Configuration\n\n```toml @sample.conf\n# Pull Metric Statistics from Amazon CloudWatch\n[[instances]]\n ## Amazon Region\n region = \"us-east-1\"\n\n ## Amazon Credentials\n ## Credentials are loaded in the following order\n ## 1) Web identity provider credentials via STS if role_arn and\n ## web_identity_token_file are specified\n ## 2) Assumed credentials via STS if role_arn is specified\n ## 3) explicit credentials from 'access_key' and 'secret_key'\n ## 4) shared profile from 'profile'\n ## 5) environment variables\n ## 6) shared credentials file\n ## 7) EC2 Instance Profile\n # access_key = \"\"\n # secret_key = \"\"\n # token = \"\"\n # role_arn = \"\"\n # web_identity_token_file = \"\"\n # role_session_name = \"\"\n # profile = \"\"\n # shared_credential_file = \"\"\n\n ## Endpoint to make request against, the correct endpoint is automatically\n ## determined and this option should only be set if you wish to override the\n ## default.\n ## ex: endpoint_url = \"http://localhost:8000\"\n # endpoint_url = \"\"\n\n ## Set http_proxy\n # use_system_proxy = false\n # http_proxy_url = \"http://localhost:8888\"\n\n ## The minimum period for CloudWatch metrics is 1 minute (60s). However not\n ## all metrics are made available to the 1 minute period. Some are collected\n ## at 3 minute, 5 minute, or larger intervals.\n ## See https://aws.amazon.com/cloudwatch/faqs/#monitoring.\n ## Note that if a period is configured that is smaller than the minimum for a\n ## particular metric, that metric will not be returned by the CloudWatch API\n ## and will not be collected by Categraf.\n \n ## Collection Delay (required)\n ## Must account for metrics availability via CloudWatch API\n delay = \"5m\"\n\n ## Requested CloudWatch aggregation Period (required)\n ## Must be a multiple of 60s.\n period = \"5m\"\n\n ## Recommended if \"delay\" and \"period\" are both within 3 hours of request\n ## time. Invalid values will be ignored. Recently Active feature will only\n ## poll for CloudWatch ListMetrics values that occurred within the last 3h.\n ## If enabled, it will reduce total API usage of the CloudWatch ListMetrics\n ## API and require less memory to retain.\n ## Do not enable if \"period\" or \"delay\" is longer than 3 hours, as it will\n ## not return data more than 3 hours old.\n ## See https://docs.aws.amazon.com/AmazonCloudWatch/latest/APIReference/API_ListMetrics.html\n #recently_active = \"PT3H\"\n\n ## Configure the TTL for the internal cache of metrics.\n # cache_ttl = \"1h\"\n\n ## Metric Statistic Namespaces (required)\n namespaces = [\"AWS/ELB\"]\n\n ## Maximum requests per second. Note that the global default AWS rate limit\n ## is 50 reqs/sec, so if you define multiple namespaces, these should add up\n ## to a maximum of 50.\n ## See http://docs.aws.amazon.com/AmazonCloudWatch/latest/monitoring/cloudwatch_limits.html\n # ratelimit = 25\n\n ## Timeout for http requests made by the cloudwatch client.\n # timeout = \"5s\"\n\n ## Batch Size\n ## The size of each batch to send requests to CloudWatch. 500 is the\n ## suggested largest size. If a request gets to large (413 errors), consider\n ## reducing this amount.\n # batch_size = 500\n\n ## Namespace-wide statistic filters. These allow fewer queries to be made to\n ## cloudwatch.\n # statistic_include = [\"average\", \"sum\", \"minimum\", \"maximum\", sample_count\"]\n # statistic_exclude = []\n\n ## Metrics to Pull\n ## Defaults to all Metrics in Namespace if nothing is provided\n ## Refreshes Namespace available metrics every 1h\n # [[instances.metrics]]\n # names = [\"Latency\", \"RequestCount\"]\n #\n # ## Statistic filters for Metric. These allow for retrieving specific\n # ## statistics for an individual metric.\n # # statistic_include = [\"average\", \"sum\", \"minimum\", \"maximum\", sample_count\"]\n # # statistic_exclude = []\n #\n # ## Dimension filters for Metric.\n # ## All dimensions defined for the metric names must be specified in order\n # ## to retrieve the metric statistics.\n # ## 'value' has wildcard / 'glob' matching support such as 'p-*'.\n # [[instances.metrics.dimensions]]\n # name = \"LoadBalancerName\"\n # value = \"p-example\"\n```\n\nPlease note, the `namespace` option is deprecated in favor of the `namespaces`\nlist option.\n\n## Requirements and Terminology\n\nPlugin Configuration utilizes [CloudWatch concepts][concept] and access\npattern to allow monitoring of any CloudWatch Metric.\n\n- `region` must be a valid AWS [region][] value\n- `period` must be a valid CloudWatch [period][] value\n- `namespaces` must be a list of valid CloudWatch [namespace][] value(s)\n- `names` must be valid CloudWatch [metric][] names\n- `dimensions` must be valid CloudWatch [dimension][] name/value pairs\n\nOmitting or specifying a value of `'*'` for a dimension value configures all\navailable metrics that contain a dimension with the specified name to be\nretrieved. If specifying >1 dimension, then the metric must contain *all* the\nconfigured dimensions where the value of the wildcard dimension is ignored.\n\nExample:\n\n```toml\n[[instances]]\n period = \"1m\"\n interval = \"5m\"\n\n [[instances.metrics]]\n names = [\"Latency\"]\n\n ## Dimension filters for Metric (optional)\n [[instances.metrics.dimensions]]\n name = \"LoadBalancerName\"\n value = \"p-example\"\n\n [[instances.metrics.dimensions]]\n name = \"AvailabilityZone\"\n value = \"*\"\n```\n\nIf the following ELBs are available:\n\n- name: `p-example`, availabilityZone: `us-east-1a`\n- name: `p-example`, availabilityZone: `us-east-1b`\n- name: `q-example`, availabilityZone: `us-east-1a`\n- name: `q-example`, availabilityZone: `us-east-1b`\n\nThen 2 metrics will be output:\n\n- name: `p-example`, availabilityZone: `us-east-1a`\n- name: `p-example`, availabilityZone: `us-east-1b`\n\nIf the `AvailabilityZone` wildcard dimension was omitted, then a single metric\n(name: `p-example`) would be exported containing the aggregate values of the ELB\nacross availability zones.\n\nTo maximize efficiency and savings, consider making fewer requests by increasing\n`interval` but keeping `period` at the duration you would like metrics to be\nreported. The above example will request metrics from Cloudwatch every 5 minutes\nbut will output five metrics timestamped one minute apart.\n\n## Restrictions and Limitations\n\n- CloudWatch metrics are not available instantly via the CloudWatch API.\n You should adjust your collection `delay` to account for this lag in metrics\n availability based on your [monitoring subscription level][using]\n- CloudWatch API usage incurs cost - see [GetMetricData Pricing][pricing]\n\n## Metrics\n\nEach CloudWatch Namespace monitored records a measurement with fields for each\navailable Metric Statistic. Namespace and Metrics are represented in [snake\ncase](https://en.wikipedia.org/wiki/Snake_case)\n\n- cloudwatch_{namespace}\n - {metric}_sum (metric Sum value)\n - {metric}_average (metric Average value)\n - {metric}_minimum (metric Minimum value)\n - {metric}_maximum (metric Maximum value)\n - {metric}_sample_count (metric SampleCount value)\n\n### Tags\n\nEach measurement is tagged with the following identifiers to uniquely identify\nthe associated metric Tag Dimension names are represented in [snake\ncase](https://en.wikipedia.org/wiki/Snake_case)\n\n- All measurements have the following tags:\n - region (CloudWatch Region)\n - {dimension-name} (Cloudwatch Dimension value - one per metric dimension)\n\n## Troubleshooting\n\nYou can use the aws cli to get a list of available metrics and dimensions:\n\n```shell\naws cloudwatch list-metrics --namespace AWS/EC2 --region us-east-1\naws cloudwatch list-metrics --namespace AWS/EC2 --region us-east-1 --metric-name CPUCreditBalance\n```\n\nIf the expected metrics are not returned, you can try getting them manually\nfor a short period of time:\n\n```shell\naws cloudwatch get-metric-data \\\n --start-time 2018-07-01T00:00:00Z \\\n --end-time 2018-07-01T00:15:00Z \\\n --metric-data-queries '[\n {\n \"Id\": \"avgCPUCreditBalance\",\n \"MetricStat\": {\n \"Metric\": {\n \"Namespace\": \"AWS/EC2\",\n \"MetricName\": \"CPUCreditBalance\",\n \"Dimensions\": [\n {\n \"Name\": \"InstanceId\",\n \"Value\": \"i-deadbeef\"\n }\n ]\n },\n \"Period\": 300,\n \"Stat\": \"Average\"\n },\n \"Label\": \"avgCPUCreditBalance\"\n }\n]'\n```\n\n## Example Output\n\n```shell\n$ ./categraf --inputs cloudwatch --test\n> cloudwatch_aws_elb,load_balancer_name=p-example,region=us-east-1 latency_average=0.004810798017284538,latency_maximum=0.1100282669067383,latency_minimum=0.0006084442138671875,latency_sample_count=4029,latency_sum=19.382705211639404 1459542420000000000\n```\n\n[concept]: http://docs.aws.amazon.com/AmazonCloudWatch/latest/DeveloperGuide/cloudwatch_concepts.html\n[credentials]: https://docs.aws.amazon.com/sdk-for-go/v1/developer-guide/configuring-sdk.html#shared-credentials-file\n[dimension]: http://docs.aws.amazon.com/AmazonCloudWatch/latest/DeveloperGuide/cloudwatch_concepts.html#Dimension\n[env]: https://docs.aws.amazon.com/sdk-for-go/v1/developer-guide/configuring-sdk.html#environment-variables\n[iam-roles]: http://docs.aws.amazon.com/AWSEC2/latest/UserGuide/iam-roles-for-amazon-ec2.html\n[metric]: http://docs.aws.amazon.com/AmazonCloudWatch/latest/DeveloperGuide/cloudwatch_concepts.html#Metric\n[namespace]: http://docs.aws.amazon.com/AmazonCloudWatch/latest/DeveloperGuide/cloudwatch_concepts.html#Namespace\n[period]: http://docs.aws.amazon.com/AmazonCloudWatch/latest/DeveloperGuide/cloudwatch_concepts.html#CloudWatchPeriods\n[pricing]: https://aws.amazon.com/cloudwatch/pricing/\n[region]: http://docs.aws.amazon.com/AmazonCloudWatch/latest/DeveloperGuide/cloudwatch_concepts.html#CloudWatchRegions\n[using]: http://docs.aws.amazon.com/AWSEC2/latest/UserGuide/using-cloudwatch-new.html\n"
},
{
"path": "integrations/Consul/collect/consul/consul.toml",
"content": "# # collect interval\n# interval = 15\n\n[[instances]]\n ## Consul server address\n # address = \"localhost:8500\"\n\n ## URI scheme for the Consul server, one of \"http\", \"https\"\n # scheme = \"http\"\n\n ## ACL token used in every request\n # token = \"\"\n\n ## HTTP Basic Authentication username and password.\n # username = \"\"\n # password = \"\"\n\n ## Data center to query the health checks from\n # datacenter = \"\"\n\n ## Allows any Consul server (non-leader) to service a read.\n ## Default is true\n # allow_stale = true\n\n ## Forces the read to be fully consistent.\n ## Default is false\n # require_consistent = false\n\n ## Prefix from which to expose key/value pairs.\n # kv_prefix = \"\"\n\n ## Regex that determines which keys to expose.\n ## Default is \".*\"\n # kv_filter = \".*\"\n\n ## Optional TLS Config\n # tls_ca = \"/etc/telegraf/ca.pem\"\n # tls_cert = \"/etc/telegraf/cert.pem\"\n # tls_key = \"/etc/telegraf/key.pem\"\n ## Use TLS but skip chain & host verification\n # insecure_skip_verify = true\n"
},
{
"path": "integrations/Consul/markdown/README.md",
"content": "# Consul Input Plugin\n\nThis plugin will collect statistics about all health checks registered in the\nConsul. It uses [Consul API][1] to query the data. It will not report the\n[telemetry][2] but Consul can report those stats already using StatsD protocol\nif needed.\n\n[1]: https://www.consul.io/docs/agent/http/health.html#health_state\n\n[2]: https://www.consul.io/docs/agent/telemetry.html\n\n\n## Configuration\n\n```toml\n# Gather health check statuses from services registered in Consul\n[[instances]]\n ## Consul server address\n # address = \"localhost:8500\"\n\n ## URI scheme for the Consul server, one of \"http\", \"https\"\n # scheme = \"http\"\n\n ## ACL token used in every request\n # token = \"\"\n\n ## HTTP Basic Authentication username and password.\n # username = \"\"\n # password = \"\"\n\n ## Data center to query the health checks from\n # datacenter = \"\"\n\n ## Optional TLS Config\n # tls_ca = \"/etc/categraf/ca.pem\"\n # tls_cert = \"/etc/categraf/cert.pem\"\n # tls_key = \"/etc/categraf/key.pem\"\n ## Use TLS but skip chain & host verification\n # insecure_skip_verify = true\n```\n\n## Metrics\n\n| name | help |\n| ----------------------------- | ----------------------------------------------------------------------------------------------------- |\n| consul_up | Was the last query of Consul successful. |\n| consul_scrape_use_seconds | scrape use seconds. |\n| consul_raft_peers | How many peers (servers) are in the Raft cluster. |\n| consul_raft_leader | Does Raft cluster have a leader (according to this node). |\n| consul_serf_lan_members | How many members are in the cluster. |\n| consul_serf_lan_member_status | Status of member in the cluster. 1=Alive, 2=Leaving, 3=Left, 4=Failed. |\n| consul_serf_wan_member_status | Status of member in the wan cluster. 1=Alive, 2=Leaving, 3=Left, 4=Failed. |\n| consul_catalog_services | How many services are in the cluster. |\n| consul_service_tag | Tags of a service. |\n| consul_health_node_status | Status of health checks associated with a node. |\n| consul_health_service_status | Status of health checks associated with a service. |\n| consul_service_checks | Link the service id and check name if available. |\n| consul_catalog_kv | The values for selected keys in Consul's key/value catalog. Keys with non-numeric values are omitted. |\nAnd some metrics with uncertain names, See the [Agent Metrics][Agent Metrics] for more details\n\n[Agent Metrics]: https://developer.hashicorp.com/consul/api-docs/agent#view-metrics\n\n## Example Output\n\n```text\nconsul_up address=localhost:8500 agent_hostname=hostname 1\n\nconsul_scrape_use_seconds address=localhost:8500 agent_hostname=hostname 0.015674053\n\nconsul_raft_peers address=localhost:8500 agent_hostname=hostname 1\n\nconsul_raft_leader address=localhost:8500 agent_hostname=hostname 1\n\nconsul_serf_lan_members address=localhost:8500 agent_hostname=hostname 1\n\nconsul_serf_lan_member_status address=localhost:8500 agent_hostname=hostname member=localhost.localdomain 1\n\nconsul_serf_wan_member_status address=localhost:8500 agent_hostname=hostname dc=dc1 member=localhost.localdomain.dc1 1\n\nconsul_catalog_services address=localhost:8500 agent_hostname=hostname 1\n\nconsul_health_node_status address=localhost:8500 agent_hostname=hostname check_id=service:demo check_name=Service 'demo' check node=localhost.localdomain status=passing 1\nconsul_health_node_status address=localhost:8500 agent_hostname=hostname check_id=service:demo check_name=Service 'demo' check node=localhost.localdomain status=warning 0\nconsul_health_node_status address=localhost:8500 agent_hostname=hostname check_id=service:demo check_name=Service 'demo' check node=localhost.localdomain status=critical 0\nconsul_health_node_status address=localhost:8500 agent_hostname=hostname check_id=service:demo check_name=Service 'demo' check node=localhost.localdomain status=maintenance 0\n\nconsul_health_service_status address=localhost:8500 agent_hostname=hostname check_id=service:demo check_name=Service 'demo' check node=localhost.localdomain service_id=demo service_name=demo status=passing 1\nconsul_health_service_status address=localhost:8500 agent_hostname=hostname check_id=service:demo check_name=Service 'demo' check node=localhost.localdomain service_id=demo service_name=demo status=warning 0\nconsul_health_service_status address=localhost:8500 agent_hostname=hostname check_id=service:demo check_name=Service 'demo' check node=localhost.localdomain service_id=demo service_name=demo status=critical 0\nconsul_health_service_status address=localhost:8500 agent_hostname=hostname check_id=service:demo check_name=Service 'demo' check node=localhost.localdomain service_id=demo service_name=demo status=maintenance 0\n\nconsul_service_checks address=localhost:8500 agent_hostname=hostname check_id=service:demo check_name=Service 'demo' check node=localhost.localdomain service_id=demo service_name=demo status=critical 1\n\nconsul_service_tag address=localhost:8500 agent_hostname=hostname check_id=service:demo check_name=Service 'demo' check node=localhost.localdomain service_id=demo service_name=demo tag=tag1 1\nconsul_service_tag address=localhost:8500 agent_hostname=hostname check_id=service:demo check_name=Service 'demo' check node=localhost.localdomain service_id=demo service_name=demo tag=tag2 1\n\n```\n"
},
{
"path": "integrations/Dns_Query/collect/dns_query/dns_query.toml",
"content": "# # collect interval\n# interval = 15\n\n[[instances]]\n# # append some labels for series\n# labels = { region=\"cloud\", product=\"n9e\" }\n\n# # interval = global.interval * interval_times\n# interval_times = 1\n\n# # \nauto_detect_local_dns_server = false\n\n## servers to query\n# servers = [\"8.8.8.8\"]\nservers = []\n\n## Network is the network protocol name.\n# network = \"udp\"\n\n## Domains or subdomains to query.\n# domains = [\".\"]\n\n## Query record type.\n## Possible values: A, AAAA, CNAME, MX, NS, PTR, TXT, SOA, SPF, SRV.\n# record_type = \"A\"\n\n## Dns server port.\n# port = 53\n\n## Query timeout in seconds.\n# timeout = 2"
},
{
"path": "integrations/Dns_Query/markdown/README.md",
"content": "# 应用场景\n一般用于对DNS服务器的响应监测,帮助运维快速定位网络问题。\n\n# 部署场景\n不需要每台虚拟机都启用此插件,建议是独立或复合的某一台虚拟机启用此插件。\n\n# 配置场景\n```\n本配置启用或数据定义如下功能:\n使用本机DNS查询域名解析质量。\n使用外部DNS查询域名解析质量。\n使用不同记录类型进行DNS查询。\n每种查询都设置超时时间5秒。\n增加自定义标签,可通过自定义标签筛选数据及更加精确的告警推送。\n在domains字段处增加自己想要被DNS查询的域名,一般填写公司业务系统的域名或第三方依赖的业务系统。\n```\n\n# 修改dns_query.toml文件配置\n\n``` 以下文件内容配置作为参考\n[root@aliyun input.dns_query]# cat dns_query.toml\n# # collect interval\n# interval = 15\n\n[[instances]]\n# # append some labels for series\nlabels = { cloud=\"huaweicloud\", region=\"huabei-beijing-4\",azone=\"az1\", product=\"n9e\" }\n\n# # interval = global.interval * interval_times\n# interval_times = 1\n\n# #\nauto_detect_local_dns_server = true\n\n### A record\n\n## servers to query\nservers = [\"223.5.5.5\",\"114.114.114.114\",\"119.29.29.29\"]\n\n## Network is the network protocol name.\n# network = \"udp\"\n\n## Domains or subdomains to query.\ndomains = [\"www.huaweicloud.com\", \"www.baidu.com\", \"www.tapd.cn\"]\n\n## Query record type.\n## Possible values: A, AAAA, CNAME, MX, NS, PTR, TXT, SOA, SPF, SRV.\nrecord_type = \"A\"\n\n## Dns server port.\n# port = 53\n\n## Query timeout in seconds.\ntimeout = 5\n\n\n### CNAME record\n\n[[instances]]\n# # append some labels for series\nlabels = { cloud=\"huaweicloud\", region=\"huabei-beijing-4\",azone=\"az1\", product=\"n9e\" }\n\n# # interval = global.interval * interval_times\n# interval_times = 1\n\n# #\nauto_detect_local_dns_server = false\n\n## servers to query\nservers = [\"223.5.5.5\",\"114.114.114.114\",\"119.29.29.29\"]\n\n## Network is the network protocol name.\n# network = \"udp\"\n\n## Domains or subdomains to query.\ndomains = [\"www.huaweicloud.com\", \"www.baidu.com\", \"www.tapd.cn\"]\n\n## Query record type.\n## Possible values: A, AAAA, CNAME, MX, NS, PTR, TXT, SOA, SPF, SRV.\nrecord_type = \"CNAME\"\n\n## Dns server port.\n# port = 53\n\n## Query timeout in seconds.\ntimeout = 5\n\n\n### NS record\n\n[[instances]]\n# # append some labels for series\nlabels = { cloud=\"huaweicloud\", region=\"huabei-beijing-4\",azone=\"az1\", product=\"n9e\" }\n\n# # interval = global.interval * interval_times\n# interval_times = 1\n\n# #\nauto_detect_local_dns_server = false\n\n## servers to query\nservers = [\"223.5.5.5\",\"114.114.114.114\",\"119.29.29.29\"]\n\n## Network is the network protocol name.\n# network = \"udp\"\n\n## Domains or subdomains to query.\ndomains = [\"www.huaweicloud.com\", \"www.baidu.com\", \"www.tapd.cn\"]\n\n## Query record type.\n## Possible values: A, AAAA, CNAME, MX, NS, PTR, TXT, SOA, SPF, SRV.\nrecord_type = \"NS\"\n\n## Dns server port.\n# port = 53\n\n## Query timeout in seconds.\ntimeout = 5\n```\n\n# 测试配置\n```\n./categraf --test --inputs dns_query\n....... A记录同理就省略\n20:51:34 dns_query_rcode_value agent_hostname=aliyun.tjf.n9e.001 azone=az1 cloud=huaweicloud domain=www.tapd.cn product=n9e record_type=CNAME region=huabei-beijing-4 server=119.29.29.29 0\n20:51:34 dns_query_result_code agent_hostname=aliyun.tjf.n9e.001 azone=az1 cloud=huaweicloud domain=www.tapd.cn product=n9e record_type=CNAME region=huabei-beijing-4 server=119.29.29.29 0\n20:51:34 dns_query_query_time_ms agent_hostname=aliyun.tjf.n9e.001 azone=az1 cloud=huaweicloud domain=www.tapd.cn product=n9e record_type=CNAME region=huabei-beijing-4 server=119.29.29.29 33.500371\n\n20:51:34 dns_query_rcode_value agent_hostname=aliyun.tjf.n9e.001 azone=az1 cloud=huaweicloud domain=www.baidu.com product=n9e record_type=CNAME region=huabei-beijing-4 server=119.29.29.29 0\n20:51:34 dns_query_result_code agent_hostname=aliyun.tjf.n9e.001 azone=az1 cloud=huaweicloud domain=www.baidu.com product=n9e record_type=CNAME region=huabei-beijing-4 server=119.29.29.29 0\n20:51:34 dns_query_query_time_ms agent_hostname=aliyun.tjf.n9e.001 azone=az1 cloud=huaweicloud domain=www.baidu.com product=n9e record_type=CNAME region=huabei-beijing-4 server=119.29.29.29 34.328242\n\n20:51:34 dns_query_rcode_value agent_hostname=aliyun.tjf.n9e.001 azone=az1 cloud=huaweicloud domain=www.huaweicloud.com product=n9e record_type=CNAME region=huabei-beijing-4 server=119.29.29.29 0\n20:51:34 dns_query_result_code agent_hostname=aliyun.tjf.n9e.001 azone=az1 cloud=huaweicloud domain=www.huaweicloud.com product=n9e record_type=CNAME region=huabei-beijing-4 server=119.29.29.29 0\n20:51:34 dns_query_query_time_ms agent_hostname=aliyun.tjf.n9e.001 azone=az1 cloud=huaweicloud domain=www.huaweicloud.com product=n9e record_type=CNAME region=huabei-beijing-4 server=119.29.29.29\n.....\n\n```\n# 重启服务\n```\n重启categraf服务生效\nsystemctl daemon-reload && systemctl restart categraf && systemctl status categraf\n\n查看启动日志是否有错误\njournalctl -f -n 500 -u categraf | grep \"E\\!\" | grep \"W\\!\"\n```\n\n# 检查数据呈现\n等待1-2分钟后数据就会在图表中展示出来,如图:\n\n\n# 监控告警规则配置\n```\n个人经验仅供参考,一般DNS解析延迟时间:\n超过2000毫秒,为P2级别,启用企业微信应用推送告警,3分钟内恢复发出恢复告警。\n超过5000毫秒,为P1级别,启用电话语音告警&企业微信应用告警,3分钟内恢复发出恢复告警。\n\n为什么会这么考量设计?\n在用到DNS监控时,一般公司业务是遍布全国的,然而全国各个地区在解析DNS存在各种场景因素导致的DNS问题(如DNS被劫持、片区DNS服务器故障等),所以需要以高级别对待。\n从收到告警到恢复告警设置3分钟的意图是防止期间是短暂时间有问题,同时也给SLA(99.99%)给足处理时长。\n```\n\n"
},
{
"path": "integrations/Docker/collect/docker/docker.toml",
"content": "# # collect interval\n# interval = 15\n\n[[instances]]\n# # append some labels for series\n# labels = { region=\"cloud\", product=\"n9e\" }\n\n# # interval = global.interval * interval_times\n# interval_times = 1\n\n## Docker Endpoint\n## To use TCP, set endpoint = \"tcp://[ip]:[port]\"\n## To use environment variables (ie, docker-machine), set endpoint = \"ENV\"\n# endpoint = \"unix:///var/run/docker.sock\"\nendpoint = \"\"\n\n## Set to true to collect Swarm metrics(desired_replicas, running_replicas)\ngather_services = false\ngather_extend_memstats = false\n\ncontainer_id_label_enable = true\ncontainer_id_label_short_style = false\n\n## Containers to include and exclude. Globs accepted.\n## Note that an empty array for both will include all containers\ncontainer_name_include = []\ncontainer_name_exclude = []\n\n## Container states to include and exclude. Globs accepted.\n## When empty only containers in the \"running\" state will be captured.\n## example: container_state_include = [\"created\", \"restarting\", \"running\", \"removing\", \"paused\", \"exited\", \"dead\"]\n## example: container_state_exclude = [\"created\", \"restarting\", \"running\", \"removing\", \"paused\", \"exited\", \"dead\"]\n# container_state_include = []\n# container_state_exclude = []\n\n## Timeout for docker list, info, and stats commands\ntimeout = \"5s\"\n\n## Specifies for which classes a per-device metric should be issued\n## Possible values are 'cpu' (cpu0, cpu1, ...), 'blkio' (8:0, 8:1, ...) and 'network' (eth0, eth1, ...)\n## Please note that this setting has no effect if 'perdevice' is set to 'true'\nperdevice_include = []\n\n## Specifies for which classes a total metric should be issued. Total is an aggregated of the 'perdevice' values.\n## Possible values are 'cpu', 'blkio' and 'network'\n## Total 'cpu' is reported directly by Docker daemon, and 'network' and 'blkio' totals are aggregated by this plugin.\n## Please note that this setting has no effect if 'total' is set to 'false'\ntotal_include = [\"cpu\", \"blkio\", \"network\"]\n\n## Which environment variables should we use as a tag\n##tag_env = [\"JAVA_HOME\", \"HEAP_SIZE\"]\n\n## docker labels to include and exclude as tags. Globs accepted.\n## Note that an empty array for both will include all labels as tags\ndocker_label_include = []\ndocker_label_exclude = [\"annotation*\", \"io.kubernetes*\", \"*description*\", \"*maintainer*\", \"*hash\", \"*author*\", \"*org_*\", \"*date*\", \"*url*\", \"*docker_compose*\"]\n\n## Optional TLS Config\n# use_tls = false\n# tls_ca = \"/etc/telegraf/ca.pem\"\n# tls_cert = \"/etc/telegraf/cert.pem\"\n# tls_key = \"/etc/telegraf/key.pem\"\n## Use TLS but skip chain & host verification\n# insecure_skip_verify = false\n"
},
{
"path": "integrations/Docker/markdown/README.md",
"content": "# docker\n\nforked from telegraf/inputs.docker。容器监控更推荐采用 cAdvisor 采集数据,然后用 input.prometheus 来采集 cAdvisor 的数据。Docker 插件基本可以忽略了。\n\n## change\n\n1. Using `container_id` as label not field\n1. Some metrics have been deleted\n\n## 容器ID标签\n\n通过下面两个配置来控制 container_id 这个标签:\n\n```ini\ncontainer_id_label_enable = true\ncontainer_id_label_short_style = false\n```\n\n默认 container_id_label_enable 设置为 true,表示启用,即会把容器ID放到标签里,container_id_label_short_style 是短格式,容器ID很长,如果把 short_style 设置为 true,就会只截取前面12位\n\n## 权限问题\n\nCategraf 最好是用 root 账号来运行,否则,请求 docker.sock 可能会遇到权限问题,需要把 Categraf 的运行账号,加到 docker group 中,假设 Categraf 使用 categraf 账号运行:\n\n```\nsudo usermod -aG docker categraf\n```\n\n## 运行在容器里\n\n如果 Categraf 运行在容器中,docker 的 unix socket 就需要挂到 Categraf 的容器里,比如通过 `-v /var/run/docker.sock:/var/run/docker.sock` 这样的参数来启动 Categraf 的容器。如果是在 compose 环境下,也可以在 docker compose 配置中加上 volume 的配置:\n\n```yaml\nvolumes:\n - /var/run/docker.sock:/var/run/docker.sock\n```\n\n## 停用该插件\n\n- 方法一:把 `input.docker` 目录改个别的名字,不用 `input.` 打头\n- 方法二:docker.toml 中的 endpoint 配置留空"
},
{
"path": "integrations/Doris/alerts/doris_by_categraf.json",
"content": "[\n {\n \"id\": 0,\n \"group_id\": 0,\n \"cate\": \"prometheus\",\n \"datasource_ids\": [\n 0\n ],\n \"cluster\": \"\",\n \"name\": \"Doris JVM 线程数\",\n \"note\": \"\",\n \"prod\": \"metric\",\n \"algorithm\": \"\",\n \"algo_params\": null,\n \"delay\": 0,\n \"severity\": 0,\n \"severities\": [\n 2\n ],\n \"disabled\": 1,\n \"prom_for_duration\": 60,\n \"prom_ql\": \"\",\n \"rule_config\": {\n \"queries\": [\n {\n \"keys\": {\n \"labelKey\": \"\",\n \"metricKey\": \"\",\n \"valueKey\": \"\"\n },\n \"prom_ql\": \"jvm_thread\",\n \"severity\": 2\n }\n ],\n \"version\": \"v1\"\n },\n \"event_relabel_config\": null,\n \"prom_eval_interval\": 30,\n \"enable_stime\": \"00:00\",\n \"enable_stimes\": [\n \"00:00\"\n ],\n \"enable_etime\": \"00:00\",\n \"enable_etimes\": [\n \"00:00\"\n ],\n \"enable_days_of_week\": [\n \"0\",\n \"1\",\n \"2\",\n \"3\",\n \"4\",\n \"5\",\n \"6\"\n ],\n \"enable_days_of_weeks\": [\n [\n \"0\",\n \"1\",\n \"2\",\n \"3\",\n \"4\",\n \"5\",\n \"6\"\n ]\n ],\n \"enable_in_bg\": 0,\n \"notify_recovered\": 1,\n \"notify_channels\": [],\n \"notify_groups_obj\": null,\n \"notify_groups\": null,\n \"notify_repeat_step\": 60,\n \"notify_max_number\": 0,\n \"recover_duration\": 0,\n \"callbacks\": [],\n \"runbook_url\": \"\",\n \"append_tags\": [],\n \"annotations\": {},\n \"extra_config\": {\n \"escalation\": {\n \"for_duration\": 60,\n \"new_severity\": 2,\n \"notify_max_number\": 0,\n \"notify_repeat_step\": 60\n },\n \"network_device_config\": {},\n \"notify_aggregation\": {\n \"wait\": 1\n }\n },\n \"create_at\": 0,\n \"create_by\": \"\",\n \"update_at\": 0,\n \"update_by\": \"\",\n \"uuid\": 1730292784164489700,\n \"cur_event_count\": 0,\n \"update_by_nickname\": \"管理员\"\n },\n {\n \"id\": 0,\n \"group_id\": 0,\n \"cate\": \"prometheus\",\n \"datasource_ids\": [\n 0\n ],\n \"cluster\": \"\",\n \"name\": \"Doris JVM内存使用率\",\n \"note\": \"\",\n \"prod\": \"metric\",\n \"algorithm\": \"\",\n \"algo_params\": null,\n \"delay\": 0,\n \"severity\": 0,\n \"severities\": [\n 2\n ],\n \"disabled\": 1,\n \"prom_for_duration\": 60,\n \"prom_ql\": \"\",\n \"rule_config\": {\n \"queries\": [\n {\n \"keys\": {\n \"labelKey\": \"\",\n \"metricKey\": \"\",\n \"valueKey\": \"\"\n },\n \"prom_ql\": \"sum(jvm_heap_size_bytes{type=\\\"used\\\"})by(ident)/sum(jvm_heap_size_bytes{type=\\\"committed\\\"})by(ident)\",\n \"severity\": 2\n }\n ],\n \"version\": \"v1\"\n },\n \"event_relabel_config\": null,\n \"prom_eval_interval\": 30,\n \"enable_stime\": \"00:00\",\n \"enable_stimes\": [\n \"00:00\"\n ],\n \"enable_etime\": \"00:00\",\n \"enable_etimes\": [\n \"00:00\"\n ],\n \"enable_days_of_week\": [\n \"0\",\n \"1\",\n \"2\",\n \"3\",\n \"4\",\n \"5\",\n \"6\"\n ],\n \"enable_days_of_weeks\": [\n [\n \"0\",\n \"1\",\n \"2\",\n \"3\",\n \"4\",\n \"5\",\n \"6\"\n ]\n ],\n \"enable_in_bg\": 0,\n \"notify_recovered\": 1,\n \"notify_channels\": [],\n \"notify_groups_obj\": null,\n \"notify_groups\": null,\n \"notify_repeat_step\": 60,\n \"notify_max_number\": 0,\n \"recover_duration\": 0,\n \"callbacks\": [],\n \"runbook_url\": \"\",\n \"append_tags\": [],\n \"annotations\": {},\n \"extra_config\": {\n \"escalation\": {\n \"for_duration\": 60,\n \"new_severity\": 2,\n \"notify_max_number\": 0,\n \"notify_repeat_step\": 60\n },\n \"network_device_config\": {},\n \"notify_aggregation\": {\n \"wait\": 1\n }\n },\n \"create_at\": 0,\n \"create_by\": \"\",\n \"update_at\": 0,\n \"update_by\": \"\",\n \"uuid\": 1730292784169880800,\n \"cur_event_count\": 0,\n \"update_by_nickname\": \"管理员\"\n },\n {\n \"id\": 0,\n \"group_id\": 0,\n \"cate\": \"prometheus\",\n \"datasource_ids\": [\n 0\n ],\n \"cluster\": \"\",\n \"name\": \"Doris_BE 1 分钟 Load Avg\",\n \"note\": \"\",\n \"prod\": \"metric\",\n \"algorithm\": \"\",\n \"algo_params\": null,\n \"delay\": 0,\n \"severity\": 0,\n \"severities\": [\n 2\n ],\n \"disabled\": 1,\n \"prom_for_duration\": 60,\n \"prom_ql\": \"\",\n \"rule_config\": {\n \"queries\": [\n {\n \"keys\": {\n \"labelKey\": \"\",\n \"metricKey\": \"\",\n \"valueKey\": \"\"\n },\n \"prom_ql\": \"doris_be_load_average{mode=\\\"1_minutes\\\"}\",\n \"severity\": 2\n }\n ],\n \"version\": \"v1\"\n },\n \"event_relabel_config\": null,\n \"prom_eval_interval\": 30,\n \"enable_stime\": \"00:00\",\n \"enable_stimes\": [\n \"00:00\"\n ],\n \"enable_etime\": \"00:00\",\n \"enable_etimes\": [\n \"00:00\"\n ],\n \"enable_days_of_week\": [\n \"0\",\n \"1\",\n \"2\",\n \"3\",\n \"4\",\n \"5\",\n \"6\"\n ],\n \"enable_days_of_weeks\": [\n [\n \"0\",\n \"1\",\n \"2\",\n \"3\",\n \"4\",\n \"5\",\n \"6\"\n ]\n ],\n \"enable_in_bg\": 0,\n \"notify_recovered\": 1,\n \"notify_channels\": [],\n \"notify_groups_obj\": null,\n \"notify_groups\": null,\n \"notify_repeat_step\": 60,\n \"notify_max_number\": 0,\n \"recover_duration\": 0,\n \"callbacks\": [],\n \"runbook_url\": \"\",\n \"append_tags\": [],\n \"annotations\": {},\n \"extra_config\": {\n \"escalation\": {\n \"for_duration\": 60,\n \"new_severity\": 2,\n \"notify_max_number\": 0,\n \"notify_repeat_step\": 60\n },\n \"network_device_config\": {},\n \"notify_aggregation\": {\n \"wait\": 1\n }\n },\n \"create_at\": 0,\n \"create_by\": \"\",\n \"update_at\": 0,\n \"update_by\": \"\",\n \"uuid\": 1730292784171517400,\n \"cur_event_count\": 0,\n \"update_by_nickname\": \"管理员\"\n },\n {\n \"id\": 0,\n \"group_id\": 0,\n \"cate\": \"prometheus\",\n \"datasource_ids\": [\n 0\n ],\n \"cluster\": \"\",\n \"name\": \"Doris_BE 1 分钟新增tcp包接收错误的次数\",\n \"note\": \"\",\n \"prod\": \"metric\",\n \"algorithm\": \"\",\n \"algo_params\": null,\n \"delay\": 0,\n \"severity\": 0,\n \"severities\": [\n 2\n ],\n \"disabled\": 1,\n \"prom_for_duration\": 60,\n \"prom_ql\": \"\",\n \"rule_config\": {\n \"queries\": [\n {\n \"keys\": {\n \"labelKey\": \"\",\n \"metricKey\": \"\",\n \"valueKey\": \"\"\n },\n \"prom_ql\": \"increase(doris_be_snmp_tcp_in_errs[1m])\",\n \"severity\": 2\n }\n ],\n \"version\": \"v1\"\n },\n \"event_relabel_config\": null,\n \"prom_eval_interval\": 30,\n \"enable_stime\": \"00:00\",\n \"enable_stimes\": [\n \"00:00\"\n ],\n \"enable_etime\": \"00:00\",\n \"enable_etimes\": [\n \"00:00\"\n ],\n \"enable_days_of_week\": [\n \"0\",\n \"1\",\n \"2\",\n \"3\",\n \"4\",\n \"5\",\n \"6\"\n ],\n \"enable_days_of_weeks\": [\n [\n \"0\",\n \"1\",\n \"2\",\n \"3\",\n \"4\",\n \"5\",\n \"6\"\n ]\n ],\n \"enable_in_bg\": 0,\n \"notify_recovered\": 1,\n \"notify_channels\": [],\n \"notify_groups_obj\": null,\n \"notify_groups\": null,\n \"notify_repeat_step\": 60,\n \"notify_max_number\": 0,\n \"recover_duration\": 0,\n \"callbacks\": [],\n \"runbook_url\": \"\",\n \"append_tags\": [],\n \"annotations\": {},\n \"extra_config\": {\n \"escalation\": {\n \"for_duration\": 60,\n \"new_severity\": 2,\n \"notify_max_number\": 0,\n \"notify_repeat_step\": 60\n },\n \"network_device_config\": {},\n \"notify_aggregation\": {\n \"wait\": 1\n }\n },\n \"create_at\": 0,\n \"create_by\": \"\",\n \"update_at\": 0,\n \"update_by\": \"\",\n \"uuid\": 1730292784172854000,\n \"cur_event_count\": 0,\n \"update_by_nickname\": \"管理员\"\n },\n {\n \"id\": 0,\n \"group_id\": 0,\n \"cate\": \"prometheus\",\n \"datasource_ids\": [\n 0\n ],\n \"cluster\": \"\",\n \"name\": \"Doris_BE 15 分钟 Load Avg\",\n \"note\": \"\",\n \"prod\": \"metric\",\n \"algorithm\": \"\",\n \"algo_params\": null,\n \"delay\": 0,\n \"severity\": 0,\n \"severities\": [\n 2\n ],\n \"disabled\": 1,\n \"prom_for_duration\": 60,\n \"prom_ql\": \"\",\n \"rule_config\": {\n \"queries\": [\n {\n \"keys\": {\n \"labelKey\": \"\",\n \"metricKey\": \"\",\n \"valueKey\": \"\"\n },\n \"prom_ql\": \"doris_be_load_average{mode=\\\"15_minutes\\\"}\",\n \"severity\": 2\n }\n ],\n \"version\": \"v1\"\n },\n \"event_relabel_config\": null,\n \"prom_eval_interval\": 30,\n \"enable_stime\": \"00:00\",\n \"enable_stimes\": [\n \"00:00\"\n ],\n \"enable_etime\": \"00:00\",\n \"enable_etimes\": [\n \"00:00\"\n ],\n \"enable_days_of_week\": [\n \"0\",\n \"1\",\n \"2\",\n \"3\",\n \"4\",\n \"5\",\n \"6\"\n ],\n \"enable_days_of_weeks\": [\n [\n \"0\",\n \"1\",\n \"2\",\n \"3\",\n \"4\",\n \"5\",\n \"6\"\n ]\n ],\n \"enable_in_bg\": 0,\n \"notify_recovered\": 1,\n \"notify_channels\": [],\n \"notify_groups_obj\": null,\n \"notify_groups\": null,\n \"notify_repeat_step\": 60,\n \"notify_max_number\": 0,\n \"recover_duration\": 0,\n \"callbacks\": [],\n \"runbook_url\": \"\",\n \"append_tags\": [],\n \"annotations\": {},\n \"extra_config\": {\n \"escalation\": {\n \"for_duration\": 60,\n \"new_severity\": 2,\n \"notify_max_number\": 0,\n \"notify_repeat_step\": 60\n },\n \"network_device_config\": {},\n \"notify_aggregation\": {\n \"wait\": 1\n }\n },\n \"create_at\": 0,\n \"create_by\": \"\",\n \"update_at\": 0,\n \"update_by\": \"\",\n \"uuid\": 1730292784174515000,\n \"cur_event_count\": 0,\n \"update_by_nickname\": \"管理员\"\n },\n {\n \"id\": 0,\n \"group_id\": 0,\n \"cate\": \"prometheus\",\n \"datasource_ids\": [\n 0\n ],\n \"cluster\": \"\",\n \"name\": \"Doris_BE 5 分钟 Load Avg\",\n \"note\": \"\",\n \"prod\": \"metric\",\n \"algorithm\": \"\",\n \"algo_params\": null,\n \"delay\": 0,\n \"severity\": 0,\n \"severities\": [\n 2\n ],\n \"disabled\": 1,\n \"prom_for_duration\": 60,\n \"prom_ql\": \"\",\n \"rule_config\": {\n \"queries\": [\n {\n \"keys\": {\n \"labelKey\": \"\",\n \"metricKey\": \"\",\n \"valueKey\": \"\"\n },\n \"prom_ql\": \"doris_be_load_average{mode=\\\"5_minutes\\\"}\",\n \"severity\": 2\n }\n ],\n \"version\": \"v1\"\n },\n \"event_relabel_config\": null,\n \"prom_eval_interval\": 30,\n \"enable_stime\": \"00:00\",\n \"enable_stimes\": [\n \"00:00\"\n ],\n \"enable_etime\": \"00:00\",\n \"enable_etimes\": [\n \"00:00\"\n ],\n \"enable_days_of_week\": [\n \"0\",\n \"1\",\n \"2\",\n \"3\",\n \"4\",\n \"5\",\n \"6\"\n ],\n \"enable_days_of_weeks\": [\n [\n \"0\",\n \"1\",\n \"2\",\n \"3\",\n \"4\",\n \"5\",\n \"6\"\n ]\n ],\n \"enable_in_bg\": 0,\n \"notify_recovered\": 1,\n \"notify_channels\": [],\n \"notify_groups_obj\": null,\n \"notify_groups\": null,\n \"notify_repeat_step\": 60,\n \"notify_max_number\": 0,\n \"recover_duration\": 0,\n \"callbacks\": [],\n \"runbook_url\": \"\",\n \"append_tags\": [],\n \"annotations\": {},\n \"extra_config\": {\n \"escalation\": {\n \"for_duration\": 60,\n \"new_severity\": 2,\n \"notify_max_number\": 0,\n \"notify_repeat_step\": 60\n },\n \"network_device_config\": {},\n \"notify_aggregation\": {\n \"wait\": 1\n }\n },\n \"create_at\": 0,\n \"create_by\": \"\",\n \"update_at\": 0,\n \"update_by\": \"\",\n \"uuid\": 1730292784175691000,\n \"cur_event_count\": 0,\n \"update_by_nickname\": \"管理员\"\n },\n {\n \"id\": 0,\n \"group_id\": 0,\n \"cate\": \"prometheus\",\n \"datasource_ids\": [\n 0\n ],\n \"cluster\": \"\",\n \"name\": \"Doris_BE batch 的线程池队列积压\",\n \"note\": \"\",\n \"prod\": \"metric\",\n \"algorithm\": \"\",\n \"algo_params\": null,\n \"delay\": 0,\n \"severity\": 0,\n \"severities\": [\n 2\n ],\n \"disabled\": 1,\n \"prom_for_duration\": 60,\n \"prom_ql\": \"\",\n \"rule_config\": {\n \"queries\": [\n {\n \"keys\": {\n \"labelKey\": \"\",\n \"metricKey\": \"\",\n \"valueKey\": \"\"\n },\n \"prom_ql\": \"doris_be_add_batch_task_queue_size > 20\",\n \"severity\": 2\n }\n ],\n \"version\": \"v1\"\n },\n \"event_relabel_config\": null,\n \"prom_eval_interval\": 30,\n \"enable_stime\": \"00:00\",\n \"enable_stimes\": [\n \"00:00\"\n ],\n \"enable_etime\": \"00:00\",\n \"enable_etimes\": [\n \"00:00\"\n ],\n \"enable_days_of_week\": [\n \"0\",\n \"1\",\n \"2\",\n \"3\",\n \"4\",\n \"5\",\n \"6\"\n ],\n \"enable_days_of_weeks\": [\n [\n \"0\",\n \"1\",\n \"2\",\n \"3\",\n \"4\",\n \"5\",\n \"6\"\n ]\n ],\n \"enable_in_bg\": 0,\n \"notify_recovered\": 1,\n \"notify_channels\": [],\n \"notify_groups_obj\": null,\n \"notify_groups\": null,\n \"notify_repeat_step\": 60,\n \"notify_max_number\": 0,\n \"recover_duration\": 0,\n \"callbacks\": [],\n \"runbook_url\": \"\",\n \"append_tags\": [],\n \"annotations\": {},\n \"extra_config\": {\n \"escalation\": {\n \"for_duration\": 60,\n \"new_severity\": 2,\n \"notify_max_number\": 0,\n \"notify_repeat_step\": 60\n },\n \"network_device_config\": {},\n \"notify_aggregation\": {\n \"wait\": 1\n }\n },\n \"create_at\": 0,\n \"create_by\": \"\",\n \"update_at\": 0,\n \"update_by\": \"\",\n \"uuid\": 1730292784177409800,\n \"cur_event_count\": 0,\n \"update_by_nickname\": \"管理员\"\n },\n {\n \"id\": 0,\n \"group_id\": 0,\n \"cate\": \"prometheus\",\n \"datasource_ids\": [\n 0\n ],\n \"cluster\": \"\",\n \"name\": \"Doris_BE CPU 使用率\",\n \"note\": \"\",\n \"prod\": \"metric\",\n \"algorithm\": \"\",\n \"algo_params\": null,\n \"delay\": 0,\n \"severity\": 0,\n \"severities\": [\n 2\n ],\n \"disabled\": 1,\n \"prom_for_duration\": 60,\n \"prom_ql\": \"\",\n \"rule_config\": {\n \"queries\": [\n {\n \"keys\": {\n \"labelKey\": \"\",\n \"metricKey\": \"\",\n \"valueKey\": \"\"\n },\n \"prom_ql\": \"(sum(doris_be_cpu)by(instance)-sum(doris_be_cpu{mode=~\\\"idle|iowait\\\"})by(instance))/sum(doris_be_cpu)by(instance)*100 > 70\",\n \"severity\": 2\n }\n ],\n \"version\": \"v1\"\n },\n \"event_relabel_config\": null,\n \"prom_eval_interval\": 30,\n \"enable_stime\": \"00:00\",\n \"enable_stimes\": [\n \"00:00\"\n ],\n \"enable_etime\": \"00:00\",\n \"enable_etimes\": [\n \"00:00\"\n ],\n \"enable_days_of_week\": [\n \"0\",\n \"1\",\n \"2\",\n \"3\",\n \"4\",\n \"5\",\n \"6\"\n ],\n \"enable_days_of_weeks\": [\n [\n \"0\",\n \"1\",\n \"2\",\n \"3\",\n \"4\",\n \"5\",\n \"6\"\n ]\n ],\n \"enable_in_bg\": 0,\n \"notify_recovered\": 1,\n \"notify_channels\": [],\n \"notify_groups_obj\": null,\n \"notify_groups\": null,\n \"notify_repeat_step\": 60,\n \"notify_max_number\": 0,\n \"recover_duration\": 0,\n \"callbacks\": [],\n \"runbook_url\": \"\",\n \"append_tags\": [],\n \"annotations\": {},\n \"extra_config\": {\n \"escalation\": {\n \"for_duration\": 60,\n \"new_severity\": 2,\n \"notify_max_number\": 0,\n \"notify_repeat_step\": 60\n },\n \"network_device_config\": {},\n \"notify_aggregation\": {\n \"wait\": 1\n }\n },\n \"create_at\": 0,\n \"create_by\": \"\",\n \"update_at\": 0,\n \"update_by\": \"\",\n \"uuid\": 1730292784179069200,\n \"cur_event_count\": 0,\n \"update_by_nickname\": \"管理员\"\n },\n {\n \"id\": 0,\n \"group_id\": 0,\n \"cate\": \"prometheus\",\n \"datasource_ids\": [\n 0\n ],\n \"cluster\": \"\",\n \"name\": \"Doris_BE OlapScanner 线程池积压\",\n \"note\": \"\",\n \"prod\": \"metric\",\n \"algorithm\": \"\",\n \"algo_params\": null,\n \"delay\": 0,\n \"severity\": 0,\n \"severities\": [\n 2\n ],\n \"disabled\": 1,\n \"prom_for_duration\": 60,\n \"prom_ql\": \"\",\n \"rule_config\": {\n \"queries\": [\n {\n \"keys\": {\n \"labelKey\": \"\",\n \"metricKey\": \"\",\n \"valueKey\": \"\"\n },\n \"prom_ql\": \"doris_be_scanner_thread_pool_queue_size > 0\",\n \"severity\": 2\n }\n ],\n \"version\": \"v1\"\n },\n \"event_relabel_config\": null,\n \"prom_eval_interval\": 30,\n \"enable_stime\": \"00:00\",\n \"enable_stimes\": [\n \"00:00\"\n ],\n \"enable_etime\": \"00:00\",\n \"enable_etimes\": [\n \"00:00\"\n ],\n \"enable_days_of_week\": [\n \"0\",\n \"1\",\n \"2\",\n \"3\",\n \"4\",\n \"5\",\n \"6\"\n ],\n \"enable_days_of_weeks\": [\n [\n \"0\",\n \"1\",\n \"2\",\n \"3\",\n \"4\",\n \"5\",\n \"6\"\n ]\n ],\n \"enable_in_bg\": 0,\n \"notify_recovered\": 1,\n \"notify_channels\": [],\n \"notify_groups_obj\": null,\n \"notify_groups\": null,\n \"notify_repeat_step\": 60,\n \"notify_max_number\": 0,\n \"recover_duration\": 0,\n \"callbacks\": [],\n \"runbook_url\": \"\",\n \"append_tags\": [],\n \"annotations\": {},\n \"extra_config\": {\n \"escalation\": {\n \"for_duration\": 60,\n \"new_severity\": 2,\n \"notify_max_number\": 0,\n \"notify_repeat_step\": 60\n },\n \"network_device_config\": {},\n \"notify_aggregation\": {\n \"wait\": 1\n }\n },\n \"create_at\": 0,\n \"create_by\": \"\",\n \"update_at\": 0,\n \"update_by\": \"\",\n \"uuid\": 1730292784180644600,\n \"cur_event_count\": 0,\n \"update_by_nickname\": \"管理员\"\n },\n {\n \"id\": 0,\n \"group_id\": 0,\n \"cate\": \"prometheus\",\n \"datasource_ids\": [\n 0\n ],\n \"cluster\": \"\",\n \"name\": \"Doris_BE 发送数据包的线程池出现积压\",\n \"note\": \"\",\n \"prod\": \"metric\",\n \"algorithm\": \"\",\n \"algo_params\": null,\n \"delay\": 0,\n \"severity\": 0,\n \"severities\": [\n 2\n ],\n \"disabled\": 1,\n \"prom_for_duration\": 60,\n \"prom_ql\": \"\",\n \"rule_config\": {\n \"queries\": [\n {\n \"keys\": {\n \"labelKey\": \"\",\n \"metricKey\": \"\",\n \"valueKey\": \"\"\n },\n \"prom_ql\": \"doris_be_send_batch_thread_pool_queue_size > 0\",\n \"severity\": 2\n }\n ],\n \"version\": \"v1\"\n },\n \"event_relabel_config\": null,\n \"prom_eval_interval\": 30,\n \"enable_stime\": \"00:00\",\n \"enable_stimes\": [\n \"00:00\"\n ],\n \"enable_etime\": \"00:00\",\n \"enable_etimes\": [\n \"00:00\"\n ],\n \"enable_days_of_week\": [\n \"0\",\n \"1\",\n \"2\",\n \"3\",\n \"4\",\n \"5\",\n \"6\"\n ],\n \"enable_days_of_weeks\": [\n [\n \"0\",\n \"1\",\n \"2\",\n \"3\",\n \"4\",\n \"5\",\n \"6\"\n ]\n ],\n \"enable_in_bg\": 0,\n \"notify_recovered\": 1,\n \"notify_channels\": [],\n \"notify_groups_obj\": null,\n \"notify_groups\": null,\n \"notify_repeat_step\": 60,\n \"notify_max_number\": 0,\n \"recover_duration\": 0,\n \"callbacks\": [],\n \"runbook_url\": \"\",\n \"append_tags\": [],\n \"annotations\": {},\n \"extra_config\": {\n \"escalation\": {\n \"for_duration\": 60,\n \"new_severity\": 2,\n \"notify_max_number\": 0,\n \"notify_repeat_step\": 60\n },\n \"network_device_config\": {},\n \"notify_aggregation\": {\n \"wait\": 1\n }\n },\n \"create_at\": 0,\n \"create_by\": \"\",\n \"update_at\": 0,\n \"update_by\": \"\",\n \"uuid\": 1730292784181912800,\n \"cur_event_count\": 0,\n \"update_by_nickname\": \"管理员\"\n },\n {\n \"id\": 0,\n \"group_id\": 0,\n \"cate\": \"prometheus\",\n \"datasource_ids\": [\n 0\n ],\n \"cluster\": \"\",\n \"name\": \"Doris_FE 95百分位查询延迟\",\n \"note\": \"\",\n \"prod\": \"metric\",\n \"algorithm\": \"\",\n \"algo_params\": null,\n \"delay\": 0,\n \"severity\": 0,\n \"severities\": [\n 2\n ],\n \"disabled\": 1,\n \"prom_for_duration\": 60,\n \"prom_ql\": \"\",\n \"rule_config\": {\n \"queries\": [\n {\n \"keys\": {\n \"labelKey\": \"\",\n \"metricKey\": \"\",\n \"valueKey\": \"\"\n },\n \"prom_ql\": \"doris_fe_query_latency_ms{quantile=\\\"0.95\\\"}\",\n \"severity\": 2\n }\n ],\n \"version\": \"v1\"\n },\n \"event_relabel_config\": null,\n \"prom_eval_interval\": 30,\n \"enable_stime\": \"00:00\",\n \"enable_stimes\": [\n \"00:00\"\n ],\n \"enable_etime\": \"00:00\",\n \"enable_etimes\": [\n \"00:00\"\n ],\n \"enable_days_of_week\": [\n \"0\",\n \"1\",\n \"2\",\n \"3\",\n \"4\",\n \"5\",\n \"6\"\n ],\n \"enable_days_of_weeks\": [\n [\n \"0\",\n \"1\",\n \"2\",\n \"3\",\n \"4\",\n \"5\",\n \"6\"\n ]\n ],\n \"enable_in_bg\": 0,\n \"notify_recovered\": 1,\n \"notify_channels\": [],\n \"notify_groups_obj\": null,\n \"notify_groups\": null,\n \"notify_repeat_step\": 60,\n \"notify_max_number\": 0,\n \"recover_duration\": 0,\n \"callbacks\": [],\n \"runbook_url\": \"\",\n \"append_tags\": [],\n \"annotations\": {},\n \"extra_config\": {\n \"escalation\": {\n \"for_duration\": 60,\n \"new_severity\": 2,\n \"notify_max_number\": 0,\n \"notify_repeat_step\": 60\n },\n \"network_device_config\": {},\n \"notify_aggregation\": {\n \"wait\": 1\n }\n },\n \"create_at\": 0,\n \"create_by\": \"\",\n \"update_at\": 0,\n \"update_by\": \"\",\n \"uuid\": 1730292784184238600,\n \"cur_event_count\": 0,\n \"update_by_nickname\": \"管理员\"\n },\n {\n \"id\": 0,\n \"group_id\": 0,\n \"cate\": \"prometheus\",\n \"datasource_ids\": [\n 0\n ],\n \"cluster\": \"\",\n \"name\": \"Doris_FE 99百分位查询延迟\",\n \"note\": \"\",\n \"prod\": \"metric\",\n \"algorithm\": \"\",\n \"algo_params\": null,\n \"delay\": 0,\n \"severity\": 0,\n \"severities\": [\n 2\n ],\n \"disabled\": 1,\n \"prom_for_duration\": 60,\n \"prom_ql\": \"\",\n \"rule_config\": {\n \"queries\": [\n {\n \"keys\": {\n \"labelKey\": \"\",\n \"metricKey\": \"\",\n \"valueKey\": \"\"\n },\n \"prom_ql\": \"doris_fe_query_latency_ms{quantile=\\\"0.99\\\"}\",\n \"severity\": 2\n }\n ],\n \"version\": \"v1\"\n },\n \"event_relabel_config\": null,\n \"prom_eval_interval\": 30,\n \"enable_stime\": \"00:00\",\n \"enable_stimes\": [\n \"00:00\"\n ],\n \"enable_etime\": \"00:00\",\n \"enable_etimes\": [\n \"00:00\"\n ],\n \"enable_days_of_week\": [\n \"0\",\n \"1\",\n \"2\",\n \"3\",\n \"4\",\n \"5\",\n \"6\"\n ],\n \"enable_days_of_weeks\": [\n [\n \"0\",\n \"1\",\n \"2\",\n \"3\",\n \"4\",\n \"5\",\n \"6\"\n ]\n ],\n \"enable_in_bg\": 0,\n \"notify_recovered\": 1,\n \"notify_channels\": [],\n \"notify_groups_obj\": null,\n \"notify_groups\": null,\n \"notify_repeat_step\": 60,\n \"notify_max_number\": 0,\n \"recover_duration\": 0,\n \"callbacks\": [],\n \"runbook_url\": \"\",\n \"append_tags\": [],\n \"annotations\": {},\n \"extra_config\": {\n \"escalation\": {\n \"for_duration\": 60,\n \"new_severity\": 2,\n \"notify_max_number\": 0,\n \"notify_repeat_step\": 60\n },\n \"network_device_config\": {},\n \"notify_aggregation\": {\n \"wait\": 1\n }\n },\n \"create_at\": 0,\n \"create_by\": \"\",\n \"update_at\": 0,\n \"update_by\": \"\",\n \"uuid\": 1730292784185714400,\n \"cur_event_count\": 0,\n \"update_by_nickname\": \"管理员\"\n },\n {\n \"id\": 0,\n \"group_id\": 0,\n \"cate\": \"prometheus\",\n \"datasource_ids\": [\n 0\n ],\n \"cluster\": \"\",\n \"name\": \"Doris_FE 事务 publish 耗时95分位\",\n \"note\": \"\",\n \"prod\": \"metric\",\n \"algorithm\": \"\",\n \"algo_params\": null,\n \"delay\": 0,\n \"severity\": 0,\n \"severities\": [\n 2\n ],\n \"disabled\": 1,\n \"prom_for_duration\": 60,\n \"prom_ql\": \"\",\n \"rule_config\": {\n \"queries\": [\n {\n \"keys\": {\n \"labelKey\": \"\",\n \"metricKey\": \"\",\n \"valueKey\": \"\"\n },\n \"prom_ql\": \"doris_fe_txn_publish_latency_ms{quantile=\\\"0.95\\\"}\",\n \"severity\": 2\n }\n ],\n \"version\": \"v1\"\n },\n \"event_relabel_config\": null,\n \"prom_eval_interval\": 30,\n \"enable_stime\": \"00:00\",\n \"enable_stimes\": [\n \"00:00\"\n ],\n \"enable_etime\": \"00:00\",\n \"enable_etimes\": [\n \"00:00\"\n ],\n \"enable_days_of_week\": [\n \"0\",\n \"1\",\n \"2\",\n \"3\",\n \"4\",\n \"5\",\n \"6\"\n ],\n \"enable_days_of_weeks\": [\n [\n \"0\",\n \"1\",\n \"2\",\n \"3\",\n \"4\",\n \"5\",\n \"6\"\n ]\n ],\n \"enable_in_bg\": 0,\n \"notify_recovered\": 1,\n \"notify_channels\": [],\n \"notify_groups_obj\": null,\n \"notify_groups\": null,\n \"notify_repeat_step\": 60,\n \"notify_max_number\": 0,\n \"recover_duration\": 0,\n \"callbacks\": [],\n \"runbook_url\": \"\",\n \"append_tags\": [],\n \"annotations\": {},\n \"extra_config\": {\n \"escalation\": {\n \"for_duration\": 60,\n \"new_severity\": 2,\n \"notify_max_number\": 0,\n \"notify_repeat_step\": 60\n },\n \"network_device_config\": {},\n \"notify_aggregation\": {\n \"wait\": 1\n }\n },\n \"create_at\": 0,\n \"create_by\": \"\",\n \"update_at\": 0,\n \"update_by\": \"\",\n \"uuid\": 1730292784187173400,\n \"cur_event_count\": 0,\n \"update_by_nickname\": \"管理员\"\n },\n {\n \"id\": 0,\n \"group_id\": 0,\n \"cate\": \"prometheus\",\n \"datasource_ids\": [\n 0\n ],\n \"cluster\": \"\",\n \"name\": \"Doris_FE 事务 publish 耗时99分位\",\n \"note\": \"\",\n \"prod\": \"metric\",\n \"algorithm\": \"\",\n \"algo_params\": null,\n \"delay\": 0,\n \"severity\": 0,\n \"severities\": [\n 2\n ],\n \"disabled\": 1,\n \"prom_for_duration\": 60,\n \"prom_ql\": \"\",\n \"rule_config\": {\n \"queries\": [\n {\n \"keys\": {\n \"labelKey\": \"\",\n \"metricKey\": \"\",\n \"valueKey\": \"\"\n },\n \"prom_ql\": \"doris_fe_txn_publish_latency_ms{quantile=\\\"0.99\\\"}\",\n \"severity\": 2\n }\n ],\n \"version\": \"v1\"\n },\n \"event_relabel_config\": null,\n \"prom_eval_interval\": 30,\n \"enable_stime\": \"00:00\",\n \"enable_stimes\": [\n \"00:00\"\n ],\n \"enable_etime\": \"00:00\",\n \"enable_etimes\": [\n \"00:00\"\n ],\n \"enable_days_of_week\": [\n \"0\",\n \"1\",\n \"2\",\n \"3\",\n \"4\",\n \"5\",\n \"6\"\n ],\n \"enable_days_of_weeks\": [\n [\n \"0\",\n \"1\",\n \"2\",\n \"3\",\n \"4\",\n \"5\",\n \"6\"\n ]\n ],\n \"enable_in_bg\": 0,\n \"notify_recovered\": 1,\n \"notify_channels\": [],\n \"notify_groups_obj\": null,\n \"notify_groups\": null,\n \"notify_repeat_step\": 60,\n \"notify_max_number\": 0,\n \"recover_duration\": 0,\n \"callbacks\": [],\n \"runbook_url\": \"\",\n \"append_tags\": [],\n \"annotations\": {},\n \"extra_config\": {\n \"escalation\": {\n \"for_duration\": 60,\n \"new_severity\": 2,\n \"notify_max_number\": 0,\n \"notify_repeat_step\": 60\n },\n \"network_device_config\": {},\n \"notify_aggregation\": {\n \"wait\": 1\n }\n },\n \"create_at\": 0,\n \"create_by\": \"\",\n \"update_at\": 0,\n \"update_by\": \"\",\n \"uuid\": 1730292784188659500,\n \"cur_event_count\": 0,\n \"update_by_nickname\": \"管理员\"\n },\n {\n \"id\": 0,\n \"group_id\": 0,\n \"cate\": \"prometheus\",\n \"datasource_ids\": [\n 0\n ],\n \"cluster\": \"\",\n \"name\": \"Doris_FE 事务执行耗时95分位\",\n \"note\": \"\",\n \"prod\": \"metric\",\n \"algorithm\": \"\",\n \"algo_params\": null,\n \"delay\": 0,\n \"severity\": 0,\n \"severities\": [\n 2\n ],\n \"disabled\": 1,\n \"prom_for_duration\": 60,\n \"prom_ql\": \"\",\n \"rule_config\": {\n \"queries\": [\n {\n \"keys\": {\n \"labelKey\": \"\",\n \"metricKey\": \"\",\n \"valueKey\": \"\"\n },\n \"prom_ql\": \"doris_fe_txn_exec_latency_ms{quantile=\\\"0.95\\\"}\",\n \"severity\": 2\n }\n ],\n \"version\": \"v1\"\n },\n \"event_relabel_config\": null,\n \"prom_eval_interval\": 30,\n \"enable_stime\": \"00:00\",\n \"enable_stimes\": [\n \"00:00\"\n ],\n \"enable_etime\": \"00:00\",\n \"enable_etimes\": [\n \"00:00\"\n ],\n \"enable_days_of_week\": [\n \"0\",\n \"1\",\n \"2\",\n \"3\",\n \"4\",\n \"5\",\n \"6\"\n ],\n \"enable_days_of_weeks\": [\n [\n \"0\",\n \"1\",\n \"2\",\n \"3\",\n \"4\",\n \"5\",\n \"6\"\n ]\n ],\n \"enable_in_bg\": 0,\n \"notify_recovered\": 1,\n \"notify_channels\": [],\n \"notify_groups_obj\": null,\n \"notify_groups\": null,\n \"notify_repeat_step\": 60,\n \"notify_max_number\": 0,\n \"recover_duration\": 0,\n \"callbacks\": [],\n \"runbook_url\": \"\",\n \"append_tags\": [],\n \"annotations\": {},\n \"extra_config\": {\n \"escalation\": {\n \"for_duration\": 60,\n \"new_severity\": 2,\n \"notify_max_number\": 0,\n \"notify_repeat_step\": 60\n },\n \"network_device_config\": {},\n \"notify_aggregation\": {\n \"wait\": 1\n }\n },\n \"create_at\": 0,\n \"create_by\": \"\",\n \"update_at\": 0,\n \"update_by\": \"\",\n \"uuid\": 1730292784190024000,\n \"cur_event_count\": 0,\n \"update_by_nickname\": \"管理员\"\n },\n {\n \"id\": 0,\n \"group_id\": 0,\n \"cate\": \"prometheus\",\n \"datasource_ids\": [\n 0\n ],\n \"cluster\": \"\",\n \"name\": \"Doris_FE 事务执行耗时99分位\",\n \"note\": \"\",\n \"prod\": \"metric\",\n \"algorithm\": \"\",\n \"algo_params\": null,\n \"delay\": 0,\n \"severity\": 0,\n \"severities\": [\n 2\n ],\n \"disabled\": 1,\n \"prom_for_duration\": 60,\n \"prom_ql\": \"\",\n \"rule_config\": {\n \"queries\": [\n {\n \"keys\": {\n \"labelKey\": \"\",\n \"metricKey\": \"\",\n \"valueKey\": \"\"\n },\n \"prom_ql\": \"doris_fe_txn_exec_latency_ms{quantile=\\\"0.99\\\"}\",\n \"severity\": 2\n }\n ],\n \"version\": \"v1\"\n },\n \"event_relabel_config\": null,\n \"prom_eval_interval\": 30,\n \"enable_stime\": \"00:00\",\n \"enable_stimes\": [\n \"00:00\"\n ],\n \"enable_etime\": \"00:00\",\n \"enable_etimes\": [\n \"00:00\"\n ],\n \"enable_days_of_week\": [\n \"0\",\n \"1\",\n \"2\",\n \"3\",\n \"4\",\n \"5\",\n \"6\"\n ],\n \"enable_days_of_weeks\": [\n [\n \"0\",\n \"1\",\n \"2\",\n \"3\",\n \"4\",\n \"5\",\n \"6\"\n ]\n ],\n \"enable_in_bg\": 0,\n \"notify_recovered\": 1,\n \"notify_channels\": [],\n \"notify_groups_obj\": null,\n \"notify_groups\": null,\n \"notify_repeat_step\": 60,\n \"notify_max_number\": 0,\n \"recover_duration\": 0,\n \"callbacks\": [],\n \"runbook_url\": \"\",\n \"append_tags\": [],\n \"annotations\": {},\n \"extra_config\": {\n \"escalation\": {\n \"for_duration\": 60,\n \"new_severity\": 2,\n \"notify_max_number\": 0,\n \"notify_repeat_step\": 60\n },\n \"network_device_config\": {},\n \"notify_aggregation\": {\n \"wait\": 1\n }\n },\n \"create_at\": 0,\n \"create_by\": \"\",\n \"update_at\": 0,\n \"update_by\": \"\",\n \"uuid\": 1730292784191466000,\n \"cur_event_count\": 0,\n \"update_by_nickname\": \"管理员\"\n },\n {\n \"id\": 0,\n \"group_id\": 0,\n \"cate\": \"prometheus\",\n \"datasource_ids\": [\n 0\n ],\n \"cluster\": \"\",\n \"name\": \"Doris_FE 失败的事务数量\",\n \"note\": \"\",\n \"prod\": \"metric\",\n \"algorithm\": \"\",\n \"algo_params\": null,\n \"delay\": 0,\n \"severity\": 0,\n \"severities\": [\n 2\n ],\n \"disabled\": 1,\n \"prom_for_duration\": 60,\n \"prom_ql\": \"\",\n \"rule_config\": {\n \"queries\": [\n {\n \"keys\": {\n \"labelKey\": \"\",\n \"metricKey\": \"\",\n \"valueKey\": \"\"\n },\n \"prom_ql\": \"doris_fe_txn_counter{type=\\\"failed\\\"}\",\n \"severity\": 2\n }\n ],\n \"version\": \"v1\"\n },\n \"event_relabel_config\": null,\n \"prom_eval_interval\": 30,\n \"enable_stime\": \"00:00\",\n \"enable_stimes\": [\n \"00:00\"\n ],\n \"enable_etime\": \"00:00\",\n \"enable_etimes\": [\n \"00:00\"\n ],\n \"enable_days_of_week\": [\n \"0\",\n \"1\",\n \"2\",\n \"3\",\n \"4\",\n \"5\",\n \"6\"\n ],\n \"enable_days_of_weeks\": [\n [\n \"0\",\n \"1\",\n \"2\",\n \"3\",\n \"4\",\n \"5\",\n \"6\"\n ]\n ],\n \"enable_in_bg\": 0,\n \"notify_recovered\": 1,\n \"notify_channels\": [],\n \"notify_groups_obj\": null,\n \"notify_groups\": null,\n \"notify_repeat_step\": 60,\n \"notify_max_number\": 0,\n \"recover_duration\": 0,\n \"callbacks\": [],\n \"runbook_url\": \"\",\n \"append_tags\": [],\n \"annotations\": {},\n \"extra_config\": {\n \"escalation\": {\n \"for_duration\": 60,\n \"new_severity\": 2,\n \"notify_max_number\": 0,\n \"notify_repeat_step\": 60\n },\n \"network_device_config\": {},\n \"notify_aggregation\": {\n \"wait\": 1\n }\n },\n \"create_at\": 0,\n \"create_by\": \"\",\n \"update_at\": 0,\n \"update_by\": \"\",\n \"uuid\": 1730292784192987100,\n \"cur_event_count\": 0,\n \"update_by_nickname\": \"管理员\"\n },\n {\n \"id\": 0,\n \"group_id\": 0,\n \"cate\": \"prometheus\",\n \"datasource_ids\": [\n 0\n ],\n \"cluster\": \"\",\n \"name\": \"Doris_FE 异常事务的数量\",\n \"note\": \"\",\n \"prod\": \"metric\",\n \"algorithm\": \"\",\n \"algo_params\": null,\n \"delay\": 0,\n \"severity\": 0,\n \"severities\": [\n 2\n ],\n \"disabled\": 1,\n \"prom_for_duration\": 60,\n \"prom_ql\": \"\",\n \"rule_config\": {\n \"queries\": [\n {\n \"keys\": {\n \"labelKey\": \"\",\n \"metricKey\": \"\",\n \"valueKey\": \"\"\n },\n \"prom_ql\": \"sum(doris_fe_txn_status{type=~\\\"aborted|unknown\\\"})by(type)\",\n \"severity\": 2\n }\n ],\n \"version\": \"v1\"\n },\n \"event_relabel_config\": null,\n \"prom_eval_interval\": 30,\n \"enable_stime\": \"00:00\",\n \"enable_stimes\": [\n \"00:00\"\n ],\n \"enable_etime\": \"00:00\",\n \"enable_etimes\": [\n \"00:00\"\n ],\n \"enable_days_of_week\": [\n \"0\",\n \"1\",\n \"2\",\n \"3\",\n \"4\",\n \"5\",\n \"6\"\n ],\n \"enable_days_of_weeks\": [\n [\n \"0\",\n \"1\",\n \"2\",\n \"3\",\n \"4\",\n \"5\",\n \"6\"\n ]\n ],\n \"enable_in_bg\": 0,\n \"notify_recovered\": 1,\n \"notify_channels\": [],\n \"notify_groups_obj\": null,\n \"notify_groups\": null,\n \"notify_repeat_step\": 60,\n \"notify_max_number\": 0,\n \"recover_duration\": 0,\n \"callbacks\": [],\n \"runbook_url\": \"\",\n \"append_tags\": [],\n \"annotations\": {},\n \"extra_config\": {\n \"escalation\": {\n \"for_duration\": 60,\n \"new_severity\": 2,\n \"notify_max_number\": 0,\n \"notify_repeat_step\": 60\n },\n \"network_device_config\": {},\n \"notify_aggregation\": {\n \"wait\": 1\n }\n },\n \"create_at\": 0,\n \"create_by\": \"\",\n \"update_at\": 0,\n \"update_by\": \"\",\n \"uuid\": 1730292784194383000,\n \"cur_event_count\": 0,\n \"update_by_nickname\": \"管理员\"\n },\n {\n \"id\": 0,\n \"group_id\": 0,\n \"cate\": \"prometheus\",\n \"datasource_ids\": [\n 0\n ],\n \"cluster\": \"\",\n \"name\": \"Doris_FE 日志写入延迟95分位\",\n \"note\": \"\",\n \"prod\": \"metric\",\n \"algorithm\": \"\",\n \"algo_params\": null,\n \"delay\": 0,\n \"severity\": 0,\n \"severities\": [\n 2\n ],\n \"disabled\": 1,\n \"prom_for_duration\": 60,\n \"prom_ql\": \"\",\n \"rule_config\": {\n \"queries\": [\n {\n \"keys\": {\n \"labelKey\": \"\",\n \"metricKey\": \"\",\n \"valueKey\": \"\"\n },\n \"prom_ql\": \"doris_fe_editlog_write_latency_ms{quantile=\\\"0.95\\\"}\",\n \"severity\": 2\n }\n ],\n \"version\": \"v1\"\n },\n \"event_relabel_config\": null,\n \"prom_eval_interval\": 30,\n \"enable_stime\": \"00:00\",\n \"enable_stimes\": [\n \"00:00\"\n ],\n \"enable_etime\": \"00:00\",\n \"enable_etimes\": [\n \"00:00\"\n ],\n \"enable_days_of_week\": [\n \"0\",\n \"1\",\n \"2\",\n \"3\",\n \"4\",\n \"5\",\n \"6\"\n ],\n \"enable_days_of_weeks\": [\n [\n \"0\",\n \"1\",\n \"2\",\n \"3\",\n \"4\",\n \"5\",\n \"6\"\n ]\n ],\n \"enable_in_bg\": 0,\n \"notify_recovered\": 1,\n \"notify_channels\": [],\n \"notify_groups_obj\": null,\n \"notify_groups\": null,\n \"notify_repeat_step\": 60,\n \"notify_max_number\": 0,\n \"recover_duration\": 0,\n \"callbacks\": [],\n \"runbook_url\": \"\",\n \"append_tags\": [],\n \"annotations\": {},\n \"extra_config\": {\n \"escalation\": {\n \"for_duration\": 60,\n \"new_severity\": 2,\n \"notify_max_number\": 0,\n \"notify_repeat_step\": 60\n },\n \"network_device_config\": {},\n \"notify_aggregation\": {\n \"wait\": 1\n }\n },\n \"create_at\": 0,\n \"create_by\": \"\",\n \"update_at\": 0,\n \"update_by\": \"\",\n \"uuid\": 1730292784195737900,\n \"cur_event_count\": 0,\n \"update_by_nickname\": \"管理员\"\n },\n {\n \"id\": 0,\n \"group_id\": 0,\n \"cate\": \"prometheus\",\n \"datasource_ids\": [\n 0\n ],\n \"cluster\": \"\",\n \"name\": \"Doris_FE 日志写入延迟99分位\",\n \"note\": \"\",\n \"prod\": \"metric\",\n \"algorithm\": \"\",\n \"algo_params\": null,\n \"delay\": 0,\n \"severity\": 0,\n \"severities\": [\n 2\n ],\n \"disabled\": 1,\n \"prom_for_duration\": 60,\n \"prom_ql\": \"\",\n \"rule_config\": {\n \"queries\": [\n {\n \"keys\": {\n \"labelKey\": \"\",\n \"metricKey\": \"\",\n \"valueKey\": \"\"\n },\n \"prom_ql\": \"doris_fe_editlog_write_latency_ms{quantile=\\\"0.99\\\"}\",\n \"severity\": 2\n }\n ],\n \"version\": \"v1\"\n },\n \"event_relabel_config\": null,\n \"prom_eval_interval\": 30,\n \"enable_stime\": \"00:00\",\n \"enable_stimes\": [\n \"00:00\"\n ],\n \"enable_etime\": \"00:00\",\n \"enable_etimes\": [\n \"00:00\"\n ],\n \"enable_days_of_week\": [\n \"0\",\n \"1\",\n \"2\",\n \"3\",\n \"4\",\n \"5\",\n \"6\"\n ],\n \"enable_days_of_weeks\": [\n [\n \"0\",\n \"1\",\n \"2\",\n \"3\",\n \"4\",\n \"5\",\n \"6\"\n ]\n ],\n \"enable_in_bg\": 0,\n \"notify_recovered\": 1,\n \"notify_channels\": [],\n \"notify_groups_obj\": null,\n \"notify_groups\": null,\n \"notify_repeat_step\": 60,\n \"notify_max_number\": 0,\n \"recover_duration\": 0,\n \"callbacks\": [],\n \"runbook_url\": \"\",\n \"append_tags\": [],\n \"annotations\": {},\n \"extra_config\": {\n \"escalation\": {\n \"for_duration\": 60,\n \"new_severity\": 2,\n \"notify_max_number\": 0,\n \"notify_repeat_step\": 60\n },\n \"network_device_config\": {},\n \"notify_aggregation\": {\n \"wait\": 1\n }\n },\n \"create_at\": 0,\n \"create_by\": \"\",\n \"update_at\": 0,\n \"update_by\": \"\",\n \"uuid\": 1730292784197151700,\n \"cur_event_count\": 0,\n \"update_by_nickname\": \"管理员\"\n },\n {\n \"id\": 0,\n \"group_id\": 0,\n \"cate\": \"prometheus\",\n \"datasource_ids\": [\n 0\n ],\n \"cluster\": \"\",\n \"name\": \"Doris_FE 每秒查询数量\",\n \"note\": \"\",\n \"prod\": \"metric\",\n \"algorithm\": \"\",\n \"algo_params\": null,\n \"delay\": 0,\n \"severity\": 0,\n \"severities\": [\n 2\n ],\n \"disabled\": 1,\n \"prom_for_duration\": 60,\n \"prom_ql\": \"\",\n \"rule_config\": {\n \"queries\": [\n {\n \"keys\": {\n \"labelKey\": \"\",\n \"metricKey\": \"\",\n \"valueKey\": \"\"\n },\n \"prom_ql\": \"doris_fe_qps\",\n \"severity\": 2\n }\n ],\n \"version\": \"v1\"\n },\n \"event_relabel_config\": null,\n \"prom_eval_interval\": 30,\n \"enable_stime\": \"00:00\",\n \"enable_stimes\": [\n \"00:00\"\n ],\n \"enable_etime\": \"00:00\",\n \"enable_etimes\": [\n \"00:00\"\n ],\n \"enable_days_of_week\": [\n \"0\",\n \"1\",\n \"2\",\n \"3\",\n \"4\",\n \"5\",\n \"6\"\n ],\n \"enable_days_of_weeks\": [\n [\n \"0\",\n \"1\",\n \"2\",\n \"3\",\n \"4\",\n \"5\",\n \"6\"\n ]\n ],\n \"enable_in_bg\": 0,\n \"notify_recovered\": 1,\n \"notify_channels\": [],\n \"notify_groups_obj\": null,\n \"notify_groups\": null,\n \"notify_repeat_step\": 60,\n \"notify_max_number\": 0,\n \"recover_duration\": 0,\n \"callbacks\": [],\n \"runbook_url\": \"\",\n \"append_tags\": [],\n \"annotations\": {},\n \"extra_config\": {\n \"escalation\": {\n \"for_duration\": 60,\n \"new_severity\": 2,\n \"notify_max_number\": 0,\n \"notify_repeat_step\": 60\n },\n \"network_device_config\": {},\n \"notify_aggregation\": {\n \"wait\": 1\n }\n },\n \"create_at\": 0,\n \"create_by\": \"\",\n \"update_at\": 0,\n \"update_by\": \"\",\n \"uuid\": 1730292784198568000,\n \"cur_event_count\": 0,\n \"update_by_nickname\": \"管理员\"\n },\n {\n \"id\": 0,\n \"group_id\": 0,\n \"cate\": \"prometheus\",\n \"datasource_ids\": [\n 0\n ],\n \"cluster\": \"\",\n \"name\": \"Doris_FE 每秒错误查询数\",\n \"note\": \"\",\n \"prod\": \"metric\",\n \"algorithm\": \"\",\n \"algo_params\": null,\n \"delay\": 0,\n \"severity\": 0,\n \"severities\": [\n 2\n ],\n \"disabled\": 1,\n \"prom_for_duration\": 60,\n \"prom_ql\": \"\",\n \"rule_config\": {\n \"queries\": [\n {\n \"keys\": {\n \"labelKey\": \"\",\n \"metricKey\": \"\",\n \"valueKey\": \"\"\n },\n \"prom_ql\": \"doris_fe_query_err_rate\",\n \"severity\": 2\n }\n ],\n \"version\": \"v1\"\n },\n \"event_relabel_config\": null,\n \"prom_eval_interval\": 30,\n \"enable_stime\": \"00:00\",\n \"enable_stimes\": [\n \"00:00\"\n ],\n \"enable_etime\": \"00:00\",\n \"enable_etimes\": [\n \"00:00\"\n ],\n \"enable_days_of_week\": [\n \"0\",\n \"1\",\n \"2\",\n \"3\",\n \"4\",\n \"5\",\n \"6\"\n ],\n \"enable_days_of_weeks\": [\n [\n \"0\",\n \"1\",\n \"2\",\n \"3\",\n \"4\",\n \"5\",\n \"6\"\n ]\n ],\n \"enable_in_bg\": 0,\n \"notify_recovered\": 1,\n \"notify_channels\": [],\n \"notify_groups_obj\": null,\n \"notify_groups\": null,\n \"notify_repeat_step\": 60,\n \"notify_max_number\": 0,\n \"recover_duration\": 0,\n \"callbacks\": [],\n \"runbook_url\": \"\",\n \"append_tags\": [],\n \"annotations\": {},\n \"extra_config\": {\n \"escalation\": {\n \"for_duration\": 60,\n \"new_severity\": 2,\n \"notify_max_number\": 0,\n \"notify_repeat_step\": 60\n },\n \"network_device_config\": {},\n \"notify_aggregation\": {\n \"wait\": 1\n }\n },\n \"create_at\": 0,\n \"create_by\": \"\",\n \"update_at\": 0,\n \"update_by\": \"\",\n \"uuid\": 1730292784199959300,\n \"cur_event_count\": 0,\n \"update_by_nickname\": \"管理员\"\n },\n {\n \"id\": 0,\n \"group_id\": 0,\n \"cate\": \"prometheus\",\n \"datasource_ids\": [\n 0\n ],\n \"cluster\": \"\",\n \"name\": \"Doris_FE 清理元数据文件失败的次数\",\n \"note\": \"\",\n \"prod\": \"metric\",\n \"algorithm\": \"\",\n \"algo_params\": null,\n \"delay\": 0,\n \"severity\": 0,\n \"severities\": [\n 2\n ],\n \"disabled\": 1,\n \"prom_for_duration\": 60,\n \"prom_ql\": \"\",\n \"rule_config\": {\n \"queries\": [\n {\n \"keys\": {\n \"labelKey\": \"\",\n \"metricKey\": \"\",\n \"valueKey\": \"\"\n },\n \"prom_ql\": \"increase(doris_fe_image_clean[1m]) > 0\",\n \"severity\": 2\n }\n ],\n \"version\": \"v1\"\n },\n \"event_relabel_config\": null,\n \"prom_eval_interval\": 30,\n \"enable_stime\": \"00:00\",\n \"enable_stimes\": [\n \"00:00\"\n ],\n \"enable_etime\": \"00:00\",\n \"enable_etimes\": [\n \"00:00\"\n ],\n \"enable_days_of_week\": [\n \"0\",\n \"1\",\n \"2\",\n \"3\",\n \"4\",\n \"5\",\n \"6\"\n ],\n \"enable_days_of_weeks\": [\n [\n \"0\",\n \"1\",\n \"2\",\n \"3\",\n \"4\",\n \"5\",\n \"6\"\n ]\n ],\n \"enable_in_bg\": 0,\n \"notify_recovered\": 1,\n \"notify_channels\": [],\n \"notify_groups_obj\": null,\n \"notify_groups\": null,\n \"notify_repeat_step\": 60,\n \"notify_max_number\": 0,\n \"recover_duration\": 0,\n \"callbacks\": [],\n \"runbook_url\": \"\",\n \"append_tags\": [],\n \"annotations\": {},\n \"extra_config\": {\n \"escalation\": {\n \"for_duration\": 60,\n \"new_severity\": 2,\n \"notify_max_number\": 0,\n \"notify_repeat_step\": 60\n },\n \"network_device_config\": {},\n \"notify_aggregation\": {\n \"wait\": 1\n }\n },\n \"create_at\": 0,\n \"create_by\": \"\",\n \"update_at\": 0,\n \"update_by\": \"\",\n \"uuid\": 1730292784201470700,\n \"cur_event_count\": 0,\n \"update_by_nickname\": \"管理员\"\n },\n {\n \"id\": 0,\n \"group_id\": 0,\n \"cate\": \"prometheus\",\n \"datasource_ids\": [\n 0\n ],\n \"cluster\": \"\",\n \"name\": \"Doris_FE 清理元数据日志失败的次数\",\n \"note\": \"\",\n \"prod\": \"metric\",\n \"algorithm\": \"\",\n \"algo_params\": null,\n \"delay\": 0,\n \"severity\": 0,\n \"severities\": [\n 2\n ],\n \"disabled\": 1,\n \"prom_for_duration\": 60,\n \"prom_ql\": \"\",\n \"rule_config\": {\n \"queries\": [\n {\n \"keys\": {\n \"labelKey\": \"\",\n \"metricKey\": \"\",\n \"valueKey\": \"\"\n },\n \"prom_ql\": \"increase(doris_fe_edit_log_clean[1m]) > 0\",\n \"severity\": 2\n }\n ],\n \"version\": \"v1\"\n },\n \"event_relabel_config\": null,\n \"prom_eval_interval\": 30,\n \"enable_stime\": \"00:00\",\n \"enable_stimes\": [\n \"00:00\"\n ],\n \"enable_etime\": \"00:00\",\n \"enable_etimes\": [\n \"00:00\"\n ],\n \"enable_days_of_week\": [\n \"0\",\n \"1\",\n \"2\",\n \"3\",\n \"4\",\n \"5\",\n \"6\"\n ],\n \"enable_days_of_weeks\": [\n [\n \"0\",\n \"1\",\n \"2\",\n \"3\",\n \"4\",\n \"5\",\n \"6\"\n ]\n ],\n \"enable_in_bg\": 0,\n \"notify_recovered\": 1,\n \"notify_channels\": [],\n \"notify_groups_obj\": null,\n \"notify_groups\": null,\n \"notify_repeat_step\": 60,\n \"notify_max_number\": 0,\n \"recover_duration\": 0,\n \"callbacks\": [],\n \"runbook_url\": \"\",\n \"append_tags\": [],\n \"annotations\": {},\n \"extra_config\": {\n \"escalation\": {\n \"for_duration\": 60,\n \"new_severity\": 2,\n \"notify_max_number\": 0,\n \"notify_repeat_step\": 60\n },\n \"network_device_config\": {},\n \"notify_aggregation\": {\n \"wait\": 1\n }\n },\n \"create_at\": 0,\n \"create_by\": \"\",\n \"update_at\": 0,\n \"update_by\": \"\",\n \"uuid\": 1730292784202892800,\n \"cur_event_count\": 0,\n \"update_by_nickname\": \"管理员\"\n },\n {\n \"id\": 0,\n \"group_id\": 0,\n \"cate\": \"prometheus\",\n \"datasource_ids\": [\n 0\n ],\n \"cluster\": \"\",\n \"name\": \"Doris_FE 生成元数据镜像文件失败的次数\",\n \"note\": \"\",\n \"prod\": \"metric\",\n \"algorithm\": \"\",\n \"algo_params\": null,\n \"delay\": 0,\n \"severity\": 0,\n \"severities\": [\n 2\n ],\n \"disabled\": 1,\n \"prom_for_duration\": 60,\n \"prom_ql\": \"\",\n \"rule_config\": {\n \"queries\": [\n {\n \"keys\": {\n \"labelKey\": \"\",\n \"metricKey\": \"\",\n \"valueKey\": \"\"\n },\n \"prom_ql\": \"increase(doris_fe_image_write[1m]) > 0\",\n \"severity\": 2\n }\n ],\n \"version\": \"v1\"\n },\n \"event_relabel_config\": null,\n \"prom_eval_interval\": 30,\n \"enable_stime\": \"00:00\",\n \"enable_stimes\": [\n \"00:00\"\n ],\n \"enable_etime\": \"00:00\",\n \"enable_etimes\": [\n \"00:00\"\n ],\n \"enable_days_of_week\": [\n \"0\",\n \"1\",\n \"2\",\n \"3\",\n \"4\",\n \"5\",\n \"6\"\n ],\n \"enable_days_of_weeks\": [\n [\n \"0\",\n \"1\",\n \"2\",\n \"3\",\n \"4\",\n \"5\",\n \"6\"\n ]\n ],\n \"enable_in_bg\": 0,\n \"notify_recovered\": 1,\n \"notify_channels\": [],\n \"notify_groups_obj\": null,\n \"notify_groups\": null,\n \"notify_repeat_step\": 60,\n \"notify_max_number\": 0,\n \"recover_duration\": 0,\n \"callbacks\": [],\n \"runbook_url\": \"\",\n \"append_tags\": [],\n \"annotations\": {},\n \"extra_config\": {\n \"escalation\": {\n \"for_duration\": 60,\n \"new_severity\": 2,\n \"notify_max_number\": 0,\n \"notify_repeat_step\": 60\n },\n \"network_device_config\": {},\n \"notify_aggregation\": {\n \"wait\": 1\n }\n },\n \"create_at\": 0,\n \"create_by\": \"\",\n \"update_at\": 0,\n \"update_by\": \"\",\n \"uuid\": 1730292784204482600,\n \"cur_event_count\": 0,\n \"update_by_nickname\": \"管理员\"\n },\n {\n \"id\": 0,\n \"group_id\": 0,\n \"cate\": \"prometheus\",\n \"datasource_ids\": [\n 0\n ],\n \"cluster\": \"\",\n \"name\": \"Doris_FE 被拒绝的事务数量\",\n \"note\": \"\",\n \"prod\": \"metric\",\n \"algorithm\": \"\",\n \"algo_params\": null,\n \"delay\": 0,\n \"severity\": 0,\n \"severities\": [\n 2\n ],\n \"disabled\": 1,\n \"prom_for_duration\": 60,\n \"prom_ql\": \"\",\n \"rule_config\": {\n \"queries\": [\n {\n \"keys\": {\n \"labelKey\": \"\",\n \"metricKey\": \"\",\n \"valueKey\": \"\"\n },\n \"prom_ql\": \"doris_fe_txn_counter{type=\\\"reject\\\"}\",\n \"severity\": 2\n }\n ],\n \"version\": \"v1\"\n },\n \"event_relabel_config\": null,\n \"prom_eval_interval\": 30,\n \"enable_stime\": \"00:00\",\n \"enable_stimes\": [\n \"00:00\"\n ],\n \"enable_etime\": \"00:00\",\n \"enable_etimes\": [\n \"00:00\"\n ],\n \"enable_days_of_week\": [\n \"0\",\n \"1\",\n \"2\",\n \"3\",\n \"4\",\n \"5\",\n \"6\"\n ],\n \"enable_days_of_weeks\": [\n [\n \"0\",\n \"1\",\n \"2\",\n \"3\",\n \"4\",\n \"5\",\n \"6\"\n ]\n ],\n \"enable_in_bg\": 0,\n \"notify_recovered\": 1,\n \"notify_channels\": [],\n \"notify_groups_obj\": null,\n \"notify_groups\": null,\n \"notify_repeat_step\": 60,\n \"notify_max_number\": 0,\n \"recover_duration\": 0,\n \"callbacks\": [],\n \"runbook_url\": \"\",\n \"append_tags\": [],\n \"annotations\": {},\n \"extra_config\": {\n \"escalation\": {\n \"for_duration\": 60,\n \"new_severity\": 2,\n \"notify_max_number\": 0,\n \"notify_repeat_step\": 60\n },\n \"network_device_config\": {},\n \"notify_aggregation\": {\n \"wait\": 1\n }\n },\n \"create_at\": 0,\n \"create_by\": \"\",\n \"update_at\": 0,\n \"update_by\": \"\",\n \"uuid\": 1730292784205710300,\n \"cur_event_count\": 0,\n \"update_by_nickname\": \"管理员\"\n }\n]"
},
{
"path": "integrations/Doris/collect/prometheus/collect_doris_examples.toml",
"content": "# doris_fe\n[[instances]]\n# 配置 fe metrics 服务地址\nurls = [\n \"http://127.0.0.1:8030/metrics\"\n]\n\nurl_label_key = \"instance\"\nurl_label_value = \"{{.Host}}\"\n# 指定 fe 服务 group 和 job 标签,这里是仪表盘变量调用,可根据实际需求修改。\nlabels = { group = \"fe\",job = \"doris_cluster01\"}\n\n# doris_be\n[[instances]]\n# 配置 be metrics 服务地址\nurls = [\n \"http://127.0.0.1:8040/metrics\"\n]\nurl_label_key = \"instance\"\nurl_label_value = \"{{.Host}}\"\n# 指定 be 服务 group 和 job 标签,这里是仪表盘变量调用,可根据实际需求修改。\nlabels = { group = \"be\",job = \"doris_cluster01\"}"
},
{
"path": "integrations/Doris/dashboards/Doris_Overview.json",
"content": "{\n \"name\": \"Doris Overview\",\n \"tags\": \"\",\n \"configs\": {\n \"links\": [],\n \"panels\": [\n {\n \"collapsed\": true,\n \"id\": \"5d9daaa1-b1de-476d-a924-c2a3abe4778f\",\n \"layout\": {\n \"h\": 1,\n \"i\": \"5d9daaa1-b1de-476d-a924-c2a3abe4778f\",\n \"isResizable\": false,\n \"w\": 24,\n \"x\": 0,\n \"y\": 0\n },\n \"name\": \"Overview\",\n \"panels\": [],\n \"type\": \"row\",\n \"version\": \"3.0.0\"\n },\n {\n \"custom\": {\n \"calc\": \"avg\",\n \"colorMode\": \"value\",\n \"textMode\": \"value\",\n \"version\": \"3.0.0\"\n },\n \"datasourceCate\": \"prometheus\",\n \"datasourceValue\": \"${DS_DORIS}\",\n \"description\": \"Num of Doris Clusters\",\n \"id\": \"2696e097-5c15-4c1a-81f5-58d5b923cfc6\",\n \"layout\": {\n \"h\": 7,\n \"i\": \"2696e097-5c15-4c1a-81f5-58d5b923cfc6\",\n \"isResizable\": true,\n \"w\": 4,\n \"x\": 0,\n \"y\": 1\n },\n \"links\": [],\n \"maxPerRow\": 4,\n \"name\": \"Cluster Number\",\n \"options\": {\n \"legend\": {\n \"displayMode\": \"list\"\n },\n \"standardOptions\": {\n \"util\": \"none\"\n },\n \"thresholds\": {\n \"mode\": \"absolute\",\n \"steps\": [\n {\n \"color\": \"#73BF69\",\n \"type\": \"base\",\n \"value\": null\n },\n {\n \"color\": \"#F2495C\",\n \"value\": 80\n }\n ],\n \"style\": \"line\"\n },\n \"tooltip\": {\n \"mode\": \"all\",\n \"sort\": \"none\"\n },\n \"valueMappings\": [\n {\n \"options\": {\n \"match\": \"null\",\n \"result\": {\n \"text\": \"N/A\"\n }\n },\n \"type\": \"special\"\n }\n ]\n },\n \"targets\": [\n {\n \"expr\": \"count(node_info{type=\\\"is_master\\\"})\",\n \"refId\": \"A\"\n }\n ],\n \"type\": \"stat\",\n \"version\": \"3.0.0\"\n },\n {\n \"custom\": {\n \"drawStyle\": \"lines\",\n \"fillOpacity\": 0,\n \"lineInterpolation\": \"linear\",\n \"stack\": \"off\",\n \"version\": \"3.0.0\"\n },\n \"datasourceCate\": \"prometheus\",\n \"datasourceValue\": \"${DS_DORIS}\",\n \"description\": \"Dead Frontends will be shown as Colored points.\\nIf all Frontends are alive, all points should be Green.\",\n \"id\": \"80bdedc3-e2e4-4198-b1ce-a94c8aa417f1\",\n \"layout\": {\n \"h\": 7,\n \"i\": \"80bdedc3-e2e4-4198-b1ce-a94c8aa417f1\",\n \"isResizable\": true,\n \"w\": 10,\n \"x\": 4,\n \"y\": 1\n },\n \"links\": [],\n \"maxPerRow\": 4,\n \"name\": \"Frontends Status\",\n \"options\": {\n \"legend\": {\n \"displayMode\": \"hidden\"\n },\n \"thresholds\": {\n \"steps\": [\n {\n \"color\": \"#6C53B1\",\n \"type\": \"base\",\n \"value\": null\n }\n ]\n },\n \"tooltip\": {\n \"mode\": \"all\",\n \"sort\": \"none\"\n }\n },\n \"targets\": [\n {\n \"expr\": \"(up{group=\\\"fe\\\"} == 0) +0\",\n \"legend\": \"{{job}}-{{instance}}: DEAD\",\n \"refId\": \"B\"\n },\n {\n \"expr\": \"(up{group=\\\"fe\\\"} == 1) +0\",\n \"legend\": \"{{job}}-{{instance}}: ALIVE\",\n \"refId\": \"A\"\n }\n ],\n \"type\": \"timeseries\",\n \"version\": \"3.0.0\"\n },\n {\n \"custom\": {\n \"drawStyle\": \"lines\",\n \"fillOpacity\": 0,\n \"lineInterpolation\": \"linear\",\n \"stack\": \"off\",\n \"version\": \"3.0.0\"\n },\n \"datasourceCate\": \"prometheus\",\n \"datasourceValue\": \"${DS_DORIS}\",\n \"description\": \"Dead Backends will be shown as Colored points.\\nIf all Backends are alive, all points should be Green.\",\n \"id\": \"757fca81-5e3f-48de-ab61-ad8150422d50\",\n \"layout\": {\n \"h\": 7,\n \"i\": \"757fca81-5e3f-48de-ab61-ad8150422d50\",\n \"isResizable\": true,\n \"w\": 10,\n \"x\": 14,\n \"y\": 1\n },\n \"links\": [],\n \"maxPerRow\": 4,\n \"name\": \"Backends status\",\n \"options\": {\n \"legend\": {\n \"displayMode\": \"hidden\"\n },\n \"thresholds\": {\n \"steps\": [\n {\n \"color\": \"#6C53B1\",\n \"type\": \"base\",\n \"value\": null\n }\n ]\n },\n \"tooltip\": {\n \"mode\": \"all\",\n \"sort\": \"none\"\n }\n },\n \"targets\": [\n {\n \"expr\": \"(up{group=\\\"be\\\"} == 0) +0\",\n \"legend\": \"{{job}}-{{instance}}: DEAD\",\n \"refId\": \"B\"\n },\n {\n \"expr\": \"(up{group=\\\"be\\\"} == 1) +0\",\n \"legend\": \"{{job}}-{{instance}}: ALIVE\",\n \"refId\": \"A\"\n }\n ],\n \"type\": \"timeseries\",\n \"version\": \"3.0.0\"\n },\n {\n \"custom\": {\n \"drawStyle\": \"lines\",\n \"fillOpacity\": 0,\n \"lineInterpolation\": \"linear\",\n \"stack\": \"off\",\n \"version\": \"3.0.0\"\n },\n \"datasourceCate\": \"prometheus\",\n \"datasourceValue\": \"${DS_DORIS}\",\n \"description\": \"The JVM heap usage percent of each Frontend of each Doris cluster.\",\n \"id\": \"27d22825-5a24-4d53-87d1-2639f3e13a70\",\n \"layout\": {\n \"h\": 7,\n \"i\": \"27d22825-5a24-4d53-87d1-2639f3e13a70\",\n \"isResizable\": true,\n \"w\": 8,\n \"x\": 0,\n \"y\": 8\n },\n \"links\": [],\n \"maxPerRow\": 4,\n \"name\": \"Cluster FE JVM Heap Stat\",\n \"options\": {\n \"legend\": {\n \"displayMode\": \"hidden\"\n },\n \"thresholds\": {\n \"steps\": [\n {\n \"color\": \"#6C53B1\",\n \"type\": \"base\",\n \"value\": null\n }\n ]\n },\n \"tooltip\": {\n \"mode\": \"all\",\n \"sort\": \"none\"\n }\n },\n \"targets\": [\n {\n \"expr\": \"sum(jvm_heap_size_bytes{group=\\\"fe\\\", type=\\\"used\\\"} * 100) by (instance, job) / sum(jvm_heap_size_bytes{group=\\\"fe\\\", type=\\\"max\\\"}) by (instance, job)\",\n \"legend\": \"{{job}}-{{instance}}\",\n \"refId\": \"C\"\n }\n ],\n \"type\": \"timeseries\",\n \"version\": \"3.0.0\"\n },\n {\n \"custom\": {\n \"drawStyle\": \"lines\",\n \"fillOpacity\": 0,\n \"lineInterpolation\": \"linear\",\n \"stack\": \"off\",\n \"version\": \"3.0.0\"\n },\n \"datasourceCate\": \"prometheus\",\n \"datasourceValue\": \"${DS_DORIS}\",\n \"description\": \"The Backend CPU idle overview of each Doris cluster.\\nThe detail Backend CPU idle info can be seen in 'BE' section.\",\n \"id\": \"df750dad-1be8-4b67-976d-91e751724193\",\n \"layout\": {\n \"h\": 7,\n \"i\": \"df750dad-1be8-4b67-976d-91e751724193\",\n \"isResizable\": true,\n \"w\": 8,\n \"x\": 8,\n \"y\": 8\n },\n \"links\": [],\n \"maxPerRow\": 4,\n \"name\": \"Cluster BE CPU Idle\",\n \"options\": {\n \"legend\": {\n \"displayMode\": \"hidden\"\n },\n \"thresholds\": {\n \"steps\": [\n {\n \"color\": \"#6C53B1\",\n \"type\": \"base\",\n \"value\": null\n }\n ]\n },\n \"tooltip\": {\n \"mode\": \"all\",\n \"sort\": \"none\"\n }\n },\n \"targets\": [\n {\n \"expr\": \"(sum(rate(doris_be_cpu{mode=\\\"idle\\\"}[$interval])) by (job)) / (sum(rate(doris_be_cpu[$interval])) by (job))\",\n \"legend\": \"{{job}}\",\n \"refId\": \"B\"\n }\n ],\n \"type\": \"timeseries\",\n \"version\": \"3.0.0\"\n },\n {\n \"custom\": {\n \"drawStyle\": \"lines\",\n \"fillOpacity\": 0,\n \"lineInterpolation\": \"linear\",\n \"stack\": \"off\",\n \"version\": \"3.0.0\"\n },\n \"datasourceCate\": \"prometheus\",\n \"datasourceValue\": \"${DS_DORIS}\",\n \"description\": \"The Backend memory usage overview of each Doris cluster.\\nThe detail backend memory usage can be seen in 'BE' section.\",\n \"id\": \"dd16ac62-5af4-40e0-a449-b0a95f32b33b\",\n \"layout\": {\n \"h\": 7,\n \"i\": \"dd16ac62-5af4-40e0-a449-b0a95f32b33b\",\n \"isResizable\": true,\n \"w\": 8,\n \"x\": 16,\n \"y\": 8\n },\n \"links\": [],\n \"maxPerRow\": 4,\n \"name\": \"Cluster BE Mem Stat\",\n \"options\": {\n \"legend\": {\n \"displayMode\": \"hidden\"\n },\n \"thresholds\": {\n \"steps\": [\n {\n \"color\": \"#6C53B1\",\n \"type\": \"base\",\n \"value\": null\n }\n ]\n },\n \"tooltip\": {\n \"mode\": \"all\",\n \"sort\": \"none\"\n }\n },\n \"targets\": [\n {\n \"expr\": \"avg(doris_be_memory_allocated_bytes) by (job)\",\n \"legend\": \"{{job}}\",\n \"refId\": \"A\"\n }\n ],\n \"type\": \"timeseries\",\n \"version\": \"3.0.0\"\n },\n {\n \"custom\": {\n \"drawStyle\": \"lines\",\n \"fillOpacity\": 0,\n \"lineInterpolation\": \"linear\",\n \"stack\": \"off\",\n \"version\": \"3.0.0\"\n },\n \"datasourceCate\": \"prometheus\",\n \"datasourceValue\": \"${DS_DORIS}\",\n \"description\": \"QPS statistic group by cluster.\\nThe QPS of each cluster is the sum of all queries processed on all Frontends.\",\n \"id\": \"df810a3f-79ae-4a56-868e-abd9dee23ecc\",\n \"layout\": {\n \"h\": 7,\n \"i\": \"df810a3f-79ae-4a56-868e-abd9dee23ecc\",\n \"isResizable\": true,\n \"w\": 8,\n \"x\": 0,\n \"y\": 15\n },\n \"links\": [],\n \"maxPerRow\": 4,\n \"name\": \"Cluster QPS Stat\",\n \"options\": {\n \"legend\": {\n \"displayMode\": \"hidden\"\n },\n \"thresholds\": {\n \"steps\": [\n {\n \"color\": \"#6C53B1\",\n \"type\": \"base\",\n \"value\": null\n }\n ]\n },\n \"tooltip\": {\n \"mode\": \"all\",\n \"sort\": \"none\"\n }\n },\n \"targets\": [\n {\n \"expr\": \"sum by (job)(rate(doris_fe_query_total{group=\\\"fe\\\"}[$interval]))\",\n \"legend\": \"{{job}}\",\n \"refId\": \"A\"\n }\n ],\n \"type\": \"timeseries\",\n \"version\": \"3.0.0\"\n },\n {\n \"custom\": {\n \"drawStyle\": \"lines\",\n \"fillOpacity\": 0,\n \"lineInterpolation\": \"linear\",\n \"stack\": \"off\",\n \"version\": \"3.0.0\"\n },\n \"datasourceCate\": \"prometheus\",\n \"datasourceValue\": \"${DS_DORIS}\",\n \"description\": \"The Disk state. GREEN point means this disk is ONLINE. RED point means this disk is OFFLINE\",\n \"id\": \"dbb3fd31-5577-4d89-9c5d-801469286c35\",\n \"layout\": {\n \"h\": 7,\n \"i\": \"dbb3fd31-5577-4d89-9c5d-801469286c35\",\n \"isResizable\": true,\n \"w\": 8,\n \"x\": 8,\n \"y\": 15\n },\n \"links\": [],\n \"maxPerRow\": 4,\n \"name\": \"[$cluster_name] Disk State\",\n \"options\": {\n \"legend\": {\n \"displayMode\": \"hidden\"\n },\n \"thresholds\": {\n \"steps\": [\n {\n \"color\": \"#6C53B1\",\n \"type\": \"base\",\n \"value\": null\n }\n ]\n },\n \"tooltip\": {\n \"mode\": \"all\",\n \"sort\": \"none\"\n }\n },\n \"targets\": [\n {\n \"expr\": \"(doris_be_disks_state{job=\\\"$cluster_name\\\"} == 0)+0\",\n \"legend\": \"{{instance}}: {{path}} OFFLINE\",\n \"refId\": \"A\"\n },\n {\n \"expr\": \"(doris_be_disks_state{job=\\\"$cluster_name\\\"} == 1)+0\",\n \"legend\": \"{{instance}}: {{path}} ONLINE\",\n \"refId\": \"B\"\n }\n ],\n \"type\": \"timeseries\",\n \"version\": \"3.0.0\"\n },\n {\n \"collapsed\": true,\n \"id\": \"4934c795-bb60-412d-8a5e-0aeb9db6905e\",\n \"layout\": {\n \"h\": 1,\n \"i\": \"4934c795-bb60-412d-8a5e-0aeb9db6905e\",\n \"isResizable\": false,\n \"w\": 24,\n \"x\": 0,\n \"y\": 22\n },\n \"name\": \"Cluster Overview\",\n \"panels\": [],\n \"type\": \"row\",\n \"version\": \"3.0.0\"\n },\n {\n \"custom\": {\n \"calc\": \"avg\",\n \"colorMode\": \"value\",\n \"textMode\": \"value\",\n \"version\": \"3.0.0\"\n },\n \"datasourceCate\": \"prometheus\",\n \"datasourceValue\": \"${DS_DORIS}\",\n \"description\": \"Total Frontends node number\",\n \"id\": \"81e85606-4059-4728-8624-a1c3adaf4356\",\n \"layout\": {\n \"h\": 6,\n \"i\": \"81e85606-4059-4728-8624-a1c3adaf4356\",\n \"isResizable\": true,\n \"w\": 4,\n \"x\": 0,\n \"y\": 23\n },\n \"links\": [],\n \"maxPerRow\": 4,\n \"name\": \"[$cluster_name] FE Node\",\n \"options\": {\n \"legend\": {\n \"displayMode\": \"list\"\n },\n \"standardOptions\": {\n \"util\": \"none\"\n },\n \"thresholds\": {\n \"mode\": \"absolute\",\n \"steps\": [\n {\n \"color\": \"#73BF69\"\n },\n {\n \"color\": \"#F2495C\",\n \"value\": 80\n }\n ],\n \"style\": \"line\"\n },\n \"tooltip\": {\n \"mode\": \"all\",\n \"sort\": \"none\"\n },\n \"valueMappings\": [\n {\n \"options\": {\n \"match\": \"null\",\n \"result\": {\n \"text\": \"N/A\"\n }\n },\n \"type\": \"special\"\n }\n ]\n },\n \"targets\": [\n {\n \"expr\": \"count(up{group=\\\"fe\\\", job=\\\"$cluster_name\\\"})\",\n \"refId\": \"A\"\n }\n ],\n \"type\": \"stat\",\n \"version\": \"3.0.0\"\n },\n {\n \"custom\": {\n \"calc\": \"avg\",\n \"colorMode\": \"value\",\n \"textMode\": \"value\",\n \"version\": \"3.0.0\"\n },\n \"datasourceCate\": \"prometheus\",\n \"datasourceValue\": \"${DS_DORIS}\",\n \"description\": \"Total alive number of Frontends. Normally, it should be equal to the Total number of Frontends\",\n \"id\": \"e469b68d-9351-4083-b4bc-1fb3f410efd9\",\n \"layout\": {\n \"h\": 6,\n \"i\": \"e469b68d-9351-4083-b4bc-1fb3f410efd9\",\n \"isResizable\": true,\n \"w\": 4,\n \"x\": 4,\n \"y\": 23\n },\n \"links\": [],\n \"maxPerRow\": 4,\n \"name\": \"[$cluster_name] FE Alive\",\n \"options\": {\n \"legend\": {\n \"displayMode\": \"list\"\n },\n \"standardOptions\": {\n \"util\": \"none\"\n },\n \"thresholds\": {\n \"mode\": \"absolute\",\n \"steps\": [\n {\n \"color\": \"#73BF69\"\n },\n {\n \"color\": \"#F2495C\",\n \"value\": 80\n }\n ],\n \"style\": \"line\"\n },\n \"tooltip\": {\n \"mode\": \"all\",\n \"sort\": \"none\"\n },\n \"valueMappings\": [\n {\n \"options\": {\n \"match\": \"null\",\n \"result\": {\n \"text\": \"N/A\"\n }\n },\n \"type\": \"special\"\n }\n ]\n },\n \"targets\": [\n {\n \"expr\": \"count(up{group=\\\"fe\\\", job=\\\"$cluster_name\\\"}==1)\",\n \"refId\": \"A\"\n }\n ],\n \"type\": \"stat\",\n \"version\": \"3.0.0\"\n },\n {\n \"custom\": {\n \"calc\": \"avg\",\n \"colorMode\": \"value\",\n \"textMode\": \"value\",\n \"version\": \"3.0.0\"\n },\n \"datasourceCate\": \"prometheus\",\n \"datasourceValue\": \"${DS_DORIS}\",\n \"description\": \"Total Backends node number\",\n \"id\": \"332a4eca-3ca3-4f73-b800-4a88dffc8c1e\",\n \"layout\": {\n \"h\": 6,\n \"i\": \"332a4eca-3ca3-4f73-b800-4a88dffc8c1e\",\n \"isResizable\": true,\n \"w\": 4,\n \"x\": 8,\n \"y\": 23\n },\n \"links\": [],\n \"maxPerRow\": 4,\n \"name\": \"[$cluster_name] BE Node\",\n \"options\": {\n \"legend\": {\n \"displayMode\": \"list\"\n },\n \"standardOptions\": {\n \"util\": \"none\"\n },\n \"thresholds\": {\n \"mode\": \"absolute\",\n \"steps\": [\n {\n \"color\": \"#73BF69\"\n },\n {\n \"color\": \"#F2495C\",\n \"value\": 80\n }\n ],\n \"style\": \"line\"\n },\n \"tooltip\": {\n \"mode\": \"all\",\n \"sort\": \"none\"\n },\n \"valueMappings\": [\n {\n \"options\": {\n \"match\": \"null\",\n \"result\": {\n \"text\": \"N/A\"\n }\n },\n \"type\": \"special\"\n }\n ]\n },\n \"targets\": [\n {\n \"expr\": \"count(up{group=\\\"be\\\", job=\\\"$cluster_name\\\"})\",\n \"refId\": \"A\"\n }\n ],\n \"type\": \"stat\",\n \"version\": \"3.0.0\"\n },\n {\n \"custom\": {\n \"calc\": \"avg\",\n \"colorMode\": \"value\",\n \"textMode\": \"value\",\n \"version\": \"3.0.0\"\n },\n \"datasourceCate\": \"prometheus\",\n \"datasourceValue\": \"${DS_DORIS}\",\n \"description\": \"Total alive number of Backends. Normally, it should be equal to the Total number of Backends.\",\n \"id\": \"2303b720-98e1-421c-918d-e6b613b3036d\",\n \"layout\": {\n \"h\": 6,\n \"i\": \"2303b720-98e1-421c-918d-e6b613b3036d\",\n \"isResizable\": true,\n \"w\": 4,\n \"x\": 12,\n \"y\": 23\n },\n \"links\": [],\n \"maxPerRow\": 4,\n \"name\": \"[$cluster_name] BE Alive\",\n \"options\": {\n \"legend\": {\n \"displayMode\": \"list\"\n },\n \"standardOptions\": {\n \"util\": \"none\"\n },\n \"thresholds\": {\n \"mode\": \"absolute\",\n \"steps\": [\n {\n \"color\": \"#73BF69\"\n },\n {\n \"color\": \"#F2495C\",\n \"value\": 80\n }\n ],\n \"style\": \"line\"\n },\n \"tooltip\": {\n \"mode\": \"all\",\n \"sort\": \"none\"\n },\n \"valueMappings\": [\n {\n \"options\": {\n \"match\": \"null\",\n \"result\": {\n \"text\": \"N/A\"\n }\n },\n \"type\": \"special\"\n }\n ]\n },\n \"targets\": [\n {\n \"expr\": \"count(up{group=\\\"be\\\", job=\\\"$cluster_name\\\"}==1)\",\n \"refId\": \"A\"\n }\n ],\n \"type\": \"stat\",\n \"version\": \"3.0.0\"\n },\n {\n \"custom\": {\n \"calc\": \"lastNotNull\",\n \"colorMode\": \"value\",\n \"textMode\": \"value\",\n \"version\": \"3.0.0\"\n },\n \"datasourceCate\": \"prometheus\",\n \"datasourceValue\": \"${DS_DORIS}\",\n \"description\": \"Total used disk capacity of all Backends.\",\n \"id\": \"8ff1a193-dd17-40c8-a25d-39985edef8ee\",\n \"layout\": {\n \"h\": 6,\n \"i\": \"8ff1a193-dd17-40c8-a25d-39985edef8ee\",\n \"isResizable\": true,\n \"w\": 4,\n \"x\": 16,\n \"y\": 23\n },\n \"links\": [],\n \"maxPerRow\": 4,\n \"name\": \"[$cluster_name] Used Capacity\",\n \"options\": {\n \"legend\": {\n \"displayMode\": \"list\"\n },\n \"standardOptions\": {\n \"util\": \"bytesSI\"\n },\n \"thresholds\": {\n \"mode\": \"absolute\",\n \"steps\": [\n {\n \"color\": \"#73BF69\"\n },\n {\n \"color\": \"#F2495C\",\n \"value\": 80\n }\n ],\n \"style\": \"line\"\n },\n \"tooltip\": {\n \"mode\": \"all\",\n \"sort\": \"none\"\n },\n \"valueMappings\": [\n {\n \"options\": {\n \"match\": \"null\",\n \"result\": {\n \"text\": \"N/A\"\n }\n },\n \"type\": \"special\"\n }\n ]\n },\n \"targets\": [\n {\n \"expr\": \"SUM(doris_be_disks_local_used_capacity{job=\\\"$cluster_name\\\"})\",\n \"refId\": \"B\"\n }\n ],\n \"type\": \"stat\",\n \"version\": \"3.0.0\"\n },\n {\n \"custom\": {\n \"calc\": \"lastNotNull\",\n \"colorMode\": \"value\",\n \"textMode\": \"value\",\n \"version\": \"3.0.0\"\n },\n \"datasourceCate\": \"prometheus\",\n \"datasourceValue\": \"${DS_DORIS}\",\n \"description\": \"Total disk capacity of all Backends\",\n \"id\": \"d3762969-ca1b-4794-b710-ceeee5820008\",\n \"layout\": {\n \"h\": 6,\n \"i\": \"d3762969-ca1b-4794-b710-ceeee5820008\",\n \"isResizable\": true,\n \"w\": 4,\n \"x\": 20,\n \"y\": 23\n },\n \"links\": [],\n \"maxPerRow\": 4,\n \"name\": \"[$cluster_name] Total Capacity\",\n \"options\": {\n \"legend\": {\n \"displayMode\": \"list\"\n },\n \"standardOptions\": {\n \"util\": \"bytesSI\"\n },\n \"thresholds\": {\n \"mode\": \"absolute\",\n \"steps\": [\n {\n \"color\": \"#73BF69\"\n },\n {\n \"color\": \"#F2495C\",\n \"value\": 80\n }\n ],\n \"style\": \"line\"\n },\n \"tooltip\": {\n \"mode\": \"all\",\n \"sort\": \"none\"\n },\n \"valueMappings\": [\n {\n \"options\": {\n \"match\": \"null\",\n \"result\": {\n \"text\": \"N/A\"\n }\n },\n \"type\": \"special\"\n }\n ]\n },\n \"targets\": [\n {\n \"expr\": \"SUM(doris_be_disks_total_capacity{job=\\\"$cluster_name\\\"})\",\n \"refId\": \"A\"\n }\n ],\n \"type\": \"stat\",\n \"version\": \"3.0.0\"\n },\n {\n \"custom\": {\n \"drawStyle\": \"lines\",\n \"fillOpacity\": 0,\n \"lineInterpolation\": \"linear\",\n \"stack\": \"off\",\n \"version\": \"3.0.0\"\n },\n \"datasourceCate\": \"prometheus\",\n \"datasourceValue\": \"${DS_DORIS}\",\n \"description\": \"The max replayed meta data journal id on Frontends.\\nNormally, all Frontends should be same on this metrics, or just slightly different for a short period.\",\n \"id\": \"9c5fb54f-2428-4ece-8057-b75cf4cbbef9\",\n \"layout\": {\n \"h\": 6,\n \"i\": \"9c5fb54f-2428-4ece-8057-b75cf4cbbef9\",\n \"isResizable\": true,\n \"w\": 6,\n \"x\": 0,\n \"y\": 29\n },\n \"links\": [],\n \"maxPerRow\": 4,\n \"name\": \"[$cluster_name] Max Replayed journal id\",\n \"options\": {\n \"legend\": {\n \"displayMode\": \"hidden\"\n },\n \"thresholds\": {\n \"steps\": [\n {\n \"color\": \"#6C53B1\",\n \"type\": \"base\",\n \"value\": null\n }\n ]\n },\n \"tooltip\": {\n \"mode\": \"all\",\n \"sort\": \"none\"\n }\n },\n \"targets\": [\n {\n \"expr\": \"doris_fe_max_journal_id{job=\\\"$cluster_name\\\"}\",\n \"legend\": \"{{instance}}\",\n \"refId\": \"A\"\n }\n ],\n \"type\": \"timeseries\",\n \"version\": \"3.0.0\"\n },\n {\n \"custom\": {\n \"drawStyle\": \"lines\",\n \"fillOpacity\": 0,\n \"lineInterpolation\": \"linear\",\n \"stack\": \"off\",\n \"version\": \"3.0.0\"\n },\n \"datasourceCate\": \"prometheus\",\n \"datasourceValue\": \"${DS_DORIS}\",\n \"description\": \"The counter of meta data image generation on Master Frontend. And the counter of image successfully pushing to other Non-master Frontends.\\nThese metrics is expected to increase at reasonable intervals. And normally, they should be equal.\",\n \"id\": \"40779789-0758-4a7b-916e-d66f54c4d096\",\n \"layout\": {\n \"h\": 6,\n \"i\": \"40779789-0758-4a7b-916e-d66f54c4d096\",\n \"isResizable\": true,\n \"w\": 6,\n \"x\": 6,\n \"y\": 29\n },\n \"links\": [],\n \"maxPerRow\": 4,\n \"name\": \"[$cluster_name] Image counter\",\n \"options\": {\n \"legend\": {\n \"displayMode\": \"hidden\"\n },\n \"thresholds\": {\n \"steps\": [\n {\n \"color\": \"#6C53B1\",\n \"type\": \"base\",\n \"value\": null\n }\n ]\n },\n \"tooltip\": {\n \"mode\": \"all\",\n \"sort\": \"none\"\n }\n },\n \"targets\": [\n {\n \"expr\": \"doris_fe_image_write{job=\\\"$cluster_name\\\", instance=\\\"$fe_master\\\"}\",\n \"legend\": \"{{instance}}-write\",\n \"refId\": \"A\"\n },\n {\n \"expr\": \"doris_fe_image_push{job=\\\"$cluster_name\\\", instance=\\\"$fe_master\\\"}\",\n \"legend\": \"{{instance}}-push\",\n \"refId\": \"B\"\n }\n ],\n \"type\": \"timeseries\",\n \"version\": \"3.0.0\"\n },\n {\n \"custom\": {\n \"drawStyle\": \"lines\",\n \"fillOpacity\": 0,\n \"lineInterpolation\": \"linear\",\n \"stack\": \"off\",\n \"version\": \"3.0.0\"\n },\n \"datasourceCate\": \"prometheus\",\n \"datasourceValue\": \"${DS_DORIS}\",\n \"description\": \"The left Y axes shows write latency of 99th. The right Y axes shows the write per seconds of journal.\",\n \"id\": \"1c1d3ebe-182b-4182-ae0a-4e7339b1eb42\",\n \"layout\": {\n \"h\": 6,\n \"i\": \"1c1d3ebe-182b-4182-ae0a-4e7339b1eb42\",\n \"isResizable\": true,\n \"w\": 6,\n \"x\": 12,\n \"y\": 29\n },\n \"links\": [],\n \"maxPerRow\": 4,\n \"name\": \"[$cluster_name] BDBJE Write\",\n \"options\": {\n \"legend\": {\n \"displayMode\": \"hidden\"\n },\n \"thresholds\": {\n \"steps\": [\n {\n \"color\": \"#6C53B1\",\n \"type\": \"base\",\n \"value\": null\n }\n ]\n },\n \"tooltip\": {\n \"mode\": \"all\",\n \"sort\": \"none\"\n }\n },\n \"targets\": [\n {\n \"expr\": \"doris_fe_editlog_write_latency_ms{job=\\\"$cluster_name\\\", instance=\\\"$fe_master\\\",quantile=\\\"0.99\\\"}\",\n \"legend\": \"{{instance}}-99th\",\n \"refId\": \"A\"\n },\n {\n \"expr\": \"rate(doris_fe_edit_log{job=\\\"$cluster_name\\\", type=\\\"write\\\"}[$interval])\",\n \"legend\": \"{{instance}}-write-rate\",\n \"refId\": \"B\"\n }\n ],\n \"type\": \"timeseries\",\n \"version\": \"3.0.0\"\n },\n {\n \"custom\": {\n \"drawStyle\": \"lines\",\n \"fillOpacity\": 0,\n \"lineInterpolation\": \"linear\",\n \"stack\": \"off\",\n \"version\": \"3.0.0\"\n },\n \"datasourceCate\": \"prometheus\",\n \"datasourceValue\": \"${DS_DORIS}\",\n \"description\": \"The left Y axes shows the read per seconds of journal.\",\n \"id\": \"a4aee7a4-3acc-4259-827f-4e28a669ea18\",\n \"layout\": {\n \"h\": 6,\n \"i\": \"a4aee7a4-3acc-4259-827f-4e28a669ea18\",\n \"isResizable\": true,\n \"w\": 6,\n \"x\": 18,\n \"y\": 29\n },\n \"links\": [],\n \"maxPerRow\": 4,\n \"name\": \"[$cluster_name] BDBJE Read\",\n \"options\": {\n \"legend\": {\n \"displayMode\": \"hidden\"\n },\n \"thresholds\": {\n \"steps\": [\n {\n \"color\": \"#6C53B1\",\n \"type\": \"base\",\n \"value\": null\n }\n ]\n },\n \"tooltip\": {\n \"mode\": \"all\",\n \"sort\": \"none\"\n }\n },\n \"targets\": [\n {\n \"expr\": \"rate(doris_fe_edit_log{job=\\\"$cluster_name\\\", type=\\\"read\\\"}[$interval])\",\n \"legend\": \"{{instance}}-read-rate\",\n \"refId\": \"A\"\n }\n ],\n \"type\": \"timeseries\",\n \"version\": \"3.0.0\"\n },\n {\n \"custom\": {\n \"drawStyle\": \"lines\",\n \"fillOpacity\": 0,\n \"lineInterpolation\": \"linear\",\n \"stack\": \"off\",\n \"version\": \"3.0.0\"\n },\n \"datasourceCate\": \"prometheus\",\n \"datasourceValue\": \"${DS_DORIS}\",\n \"description\": \"The edit log size for each FE\",\n \"id\": \"2137be68-6db0-4ee3-a6b1-127b3d00c146\",\n \"layout\": {\n \"h\": 6,\n \"i\": \"2137be68-6db0-4ee3-a6b1-127b3d00c146\",\n \"isResizable\": true,\n \"w\": 6,\n \"x\": 0,\n \"y\": 35\n },\n \"links\": [],\n \"maxPerRow\": 4,\n \"name\": \"[$cluster_name] Edit Log Size\",\n \"options\": {\n \"legend\": {\n \"displayMode\": \"hidden\"\n },\n \"thresholds\": {\n \"steps\": [\n {\n \"color\": \"#6C53B1\",\n \"type\": \"base\",\n \"value\": null\n }\n ]\n },\n \"tooltip\": {\n \"mode\": \"all\",\n \"sort\": \"none\"\n }\n },\n \"targets\": [\n {\n \"expr\": \"doris_fe_edit_log{job=\\\"$cluster_name\\\", type=\\\"bytes\\\"}\",\n \"legend\": \"{{instance}}\",\n \"refId\": \"A\"\n }\n ],\n \"type\": \"timeseries\",\n \"version\": \"3.0.0\"\n },\n {\n \"custom\": {\n \"drawStyle\": \"lines\",\n \"fillOpacity\": 0,\n \"lineInterpolation\": \"linear\",\n \"stack\": \"off\",\n \"version\": \"3.0.0\"\n },\n \"datasourceCate\": \"prometheus\",\n \"datasourceValue\": \"${DS_DORIS}\",\n \"description\": \"The edit log clean of each FE\",\n \"id\": \"fff6178f-056a-4354-b714-71e00eb35b7e\",\n \"layout\": {\n \"h\": 6,\n \"i\": \"fff6178f-056a-4354-b714-71e00eb35b7e\",\n \"isResizable\": true,\n \"w\": 6,\n \"x\": 6,\n \"y\": 35\n },\n \"links\": [],\n \"maxPerRow\": 4,\n \"name\": \"[$cluster_name] Edit Log Clean\",\n \"options\": {\n \"legend\": {\n \"displayMode\": \"hidden\"\n },\n \"thresholds\": {\n \"steps\": [\n {\n \"color\": \"#6C53B1\",\n \"type\": \"base\",\n \"value\": null\n }\n ]\n },\n \"tooltip\": {\n \"mode\": \"all\",\n \"sort\": \"none\"\n }\n },\n \"targets\": [\n {\n \"expr\": \"doris_fe_edit_log_clean{job=\\\"$cluster_name\\\", type=\\\"success\\\"}\",\n \"legend\": \"{{instance}}_success\",\n \"refId\": \"A\"\n },\n {\n \"expr\": \"doris_fe_edit_log_clean{job=\\\"$cluster_name\\\", type=\\\"failed\\\"}\",\n \"legend\": \"{{instance}}_failed\",\n \"refId\": \"B\"\n }\n ],\n \"type\": \"timeseries\",\n \"version\": \"3.0.0\"\n },\n {\n \"custom\": {\n \"drawStyle\": \"lines\",\n \"fillOpacity\": 0,\n \"lineInterpolation\": \"linear\",\n \"stack\": \"off\",\n \"version\": \"3.0.0\"\n },\n \"datasourceCate\": \"prometheus\",\n \"datasourceValue\": \"${DS_DORIS}\",\n \"description\": \"The FE collect compaction score of each BE\",\n \"id\": \"0e7a3912-ef46-442a-96a9-ca98f1b3ec1f\",\n \"layout\": {\n \"h\": 6,\n \"i\": \"0e7a3912-ef46-442a-96a9-ca98f1b3ec1f\",\n \"isResizable\": true,\n \"w\": 6,\n \"x\": 12,\n \"y\": 35\n },\n \"links\": [],\n \"maxPerRow\": 4,\n \"name\": \"[$cluster_name] FE Collect Compaction Score\",\n \"options\": {\n \"legend\": {\n \"displayMode\": \"hidden\"\n },\n \"thresholds\": {\n \"steps\": [\n {\n \"color\": \"#6C53B1\",\n \"type\": \"base\",\n \"value\": null\n }\n ]\n },\n \"tooltip\": {\n \"mode\": \"all\",\n \"sort\": \"none\"\n }\n },\n \"targets\": [\n {\n \"expr\": \"doris_fe_max_tablet_compaction_score{job=\\\"$cluster_name\\\"}\",\n \"legend\": \"{{instance}}\",\n \"refId\": \"A\"\n }\n ],\n \"type\": \"timeseries\",\n \"version\": \"3.0.0\"\n },\n {\n \"custom\": {\n \"drawStyle\": \"lines\",\n \"fillOpacity\": 0,\n \"lineInterpolation\": \"linear\",\n \"stack\": \"off\",\n \"version\": \"3.0.0\"\n },\n \"datasourceCate\": \"prometheus\",\n \"datasourceValue\": \"${DS_DORIS}\",\n \"description\": \"The compaction score of each BE\",\n \"id\": \"96c4f66c-f8e5-4020-b13a-ad5f39b4c7bf\",\n \"layout\": {\n \"h\": 6,\n \"i\": \"96c4f66c-f8e5-4020-b13a-ad5f39b4c7bf\",\n \"isResizable\": true,\n \"w\": 6,\n \"x\": 18,\n \"y\": 35\n },\n \"links\": [],\n \"maxPerRow\": 4,\n \"name\": \"[$cluster_name] BE Compaction Score\",\n \"options\": {\n \"legend\": {\n \"displayMode\": \"hidden\"\n },\n \"thresholds\": {\n \"steps\": [\n {\n \"color\": \"#6C53B1\",\n \"type\": \"base\",\n \"value\": null\n }\n ]\n },\n \"tooltip\": {\n \"mode\": \"all\",\n \"sort\": \"none\"\n }\n },\n \"targets\": [\n {\n \"expr\": \"doris_fe_tablet_max_compaction_score{job=\\\"$cluster_name\\\", instance=\\\"$fe_master\\\"}\",\n \"legend\": \"{{backend}}\",\n \"refId\": \"A\"\n }\n ],\n \"type\": \"timeseries\",\n \"version\": \"3.0.0\"\n },\n {\n \"custom\": {\n \"drawStyle\": \"lines\",\n \"fillOpacity\": 0,\n \"lineInterpolation\": \"linear\",\n \"stack\": \"off\",\n \"version\": \"3.0.0\"\n },\n \"datasourceCate\": \"prometheus\",\n \"datasourceValue\": \"${DS_DORIS}\",\n \"description\": \"The image Write of each FE\",\n \"id\": \"09b36550-35e9-4a57-8384-e49b159d4bb6\",\n \"layout\": {\n \"h\": 6,\n \"i\": \"09b36550-35e9-4a57-8384-e49b159d4bb6\",\n \"isResizable\": true,\n \"w\": 6,\n \"x\": 0,\n \"y\": 41\n },\n \"links\": [],\n \"maxPerRow\": 4,\n \"name\": \"[$cluster_name] Image Write\",\n \"options\": {\n \"legend\": {\n \"displayMode\": \"hidden\"\n },\n \"thresholds\": {\n \"steps\": [\n {\n \"color\": \"#6C53B1\",\n \"type\": \"base\",\n \"value\": null\n }\n ]\n },\n \"tooltip\": {\n \"mode\": \"all\",\n \"sort\": \"none\"\n }\n },\n \"targets\": [\n {\n \"expr\": \"doris_fe_image_write{job=\\\"$cluster_name\\\", type=\\\"success\\\"}\",\n \"legend\": \"{{instance}}_success\",\n \"refId\": \"A\"\n },\n {\n \"expr\": \"doris_fe_image_write{job=\\\"$cluster_name\\\", type=\\\"failed\\\"}\",\n \"legend\": \"{{instance}}_failed\",\n \"refId\": \"B\"\n }\n ],\n \"type\": \"timeseries\",\n \"version\": \"3.0.0\"\n },\n {\n \"custom\": {\n \"drawStyle\": \"lines\",\n \"fillOpacity\": 0,\n \"lineInterpolation\": \"linear\",\n \"stack\": \"off\",\n \"version\": \"3.0.0\"\n },\n \"datasourceCate\": \"prometheus\",\n \"datasourceValue\": \"${DS_DORIS}\",\n \"description\": \"The image push of each FE\",\n \"id\": \"490f2533-e2eb-4a49-9b51-878281a79b1a\",\n \"layout\": {\n \"h\": 6,\n \"i\": \"490f2533-e2eb-4a49-9b51-878281a79b1a\",\n \"isResizable\": true,\n \"w\": 6,\n \"x\": 6,\n \"y\": 41\n },\n \"links\": [],\n \"maxPerRow\": 4,\n \"name\": \"[$cluster_name] Image Push\",\n \"options\": {\n \"legend\": {\n \"displayMode\": \"hidden\"\n },\n \"thresholds\": {\n \"steps\": [\n {\n \"color\": \"#6C53B1\",\n \"type\": \"base\",\n \"value\": null\n }\n ]\n },\n \"tooltip\": {\n \"mode\": \"all\",\n \"sort\": \"none\"\n }\n },\n \"targets\": [\n {\n \"expr\": \"doris_fe_image_push{job=\\\"$cluster_name\\\", type=\\\"success\\\"}\",\n \"legend\": \"{{instance}}_success\",\n \"refId\": \"A\"\n },\n {\n \"expr\": \"doris_fe_image_push{job=\\\"$cluster_name\\\", type=\\\"failed\\\"}\",\n \"legend\": \"{{instance}}_failed\",\n \"refId\": \"B\"\n }\n ],\n \"type\": \"timeseries\",\n \"version\": \"3.0.0\"\n },\n {\n \"custom\": {\n \"drawStyle\": \"lines\",\n \"fillOpacity\": 0,\n \"lineInterpolation\": \"linear\",\n \"stack\": \"off\",\n \"version\": \"3.0.0\"\n },\n \"datasourceCate\": \"prometheus\",\n \"datasourceValue\": \"${DS_DORIS}\",\n \"description\": \"The image clean of each FE\",\n \"id\": \"cffa363d-b514-42ed-be6b-67c93325d9e1\",\n \"layout\": {\n \"h\": 6,\n \"i\": \"cffa363d-b514-42ed-be6b-67c93325d9e1\",\n \"isResizable\": true,\n \"w\": 6,\n \"x\": 12,\n \"y\": 41\n },\n \"links\": [],\n \"maxPerRow\": 4,\n \"name\": \"[$cluster_name] Image Clean\",\n \"options\": {\n \"legend\": {\n \"displayMode\": \"hidden\"\n },\n \"thresholds\": {\n \"steps\": [\n {\n \"color\": \"#6C53B1\",\n \"type\": \"base\",\n \"value\": null\n }\n ]\n },\n \"tooltip\": {\n \"mode\": \"all\",\n \"sort\": \"none\"\n }\n },\n \"targets\": [\n {\n \"expr\": \"doris_fe_image_clean{job=\\\"$cluster_name\\\", type=\\\"success\\\"}\",\n \"legend\": \"{{instance}}_success\",\n \"refId\": \"A\"\n },\n {\n \"expr\": \"doris_fe_image_clean{job=\\\"$cluster_name\\\", type=\\\"failed\\\"}\",\n \"legend\": \"{{instance}}_failed\",\n \"refId\": \"B\"\n }\n ],\n \"type\": \"timeseries\",\n \"version\": \"3.0.0\"\n },\n {\n \"custom\": {\n \"drawStyle\": \"lines\",\n \"fillOpacity\": 0,\n \"lineInterpolation\": \"linear\",\n \"stack\": \"off\",\n \"version\": \"3.0.0\"\n },\n \"datasourceCate\": \"prometheus\",\n \"datasourceValue\": \"${DS_DORIS}\",\n \"description\": \"Number of tablets begin scheduled. These tablet may be in recovery process or balance process\",\n \"id\": \"1cab833b-22db-494c-bd44-fe7e22b91321\",\n \"layout\": {\n \"h\": 6,\n \"i\": \"1cab833b-22db-494c-bd44-fe7e22b91321\",\n \"isResizable\": true,\n \"w\": 6,\n \"x\": 18,\n \"y\": 41\n },\n \"links\": [],\n \"maxPerRow\": 4,\n \"name\": \"[$cluster_name] Scheduling Tablets\",\n \"options\": {\n \"legend\": {\n \"displayMode\": \"hidden\"\n },\n \"thresholds\": {\n \"steps\": [\n {\n \"color\": \"#6C53B1\",\n \"type\": \"base\",\n \"value\": null\n }\n ]\n },\n \"tooltip\": {\n \"mode\": \"all\",\n \"sort\": \"none\"\n }\n },\n \"targets\": [\n {\n \"expr\": \"doris_fe_scheduled_tablet_num{job=\\\"$cluster_name\\\", instance=\\\"$fe_master\\\"}\",\n \"legend\": \"Scheduling tablet number\",\n \"refId\": \"A\"\n }\n ],\n \"type\": \"timeseries\",\n \"version\": \"3.0.0\"\n },\n {\n \"custom\": {\n \"drawStyle\": \"lines\",\n \"fillOpacity\": 0,\n \"lineInterpolation\": \"linear\",\n \"stack\": \"off\",\n \"version\": \"3.0.0\"\n },\n \"datasourceCate\": \"prometheus\",\n \"datasourceValue\": \"${DS_DORIS}\",\n \"description\": \"The max IO util of each Backend\",\n \"id\": \"854f7bb3-cf8e-48a3-81aa-50f83d89d6c0\",\n \"layout\": {\n \"h\": 6,\n \"i\": \"854f7bb3-cf8e-48a3-81aa-50f83d89d6c0\",\n \"isResizable\": true,\n \"w\": 6,\n \"x\": 0,\n \"y\": 47\n },\n \"links\": [],\n \"maxPerRow\": 4,\n \"name\": \"[$cluster_name] BE IO Util\",\n \"options\": {\n \"legend\": {\n \"displayMode\": \"hidden\"\n },\n \"thresholds\": {\n \"steps\": [\n {\n \"color\": \"#6C53B1\",\n \"type\": \"base\",\n \"value\": null\n }\n ]\n },\n \"tooltip\": {\n \"mode\": \"all\",\n \"sort\": \"none\"\n }\n },\n \"targets\": [\n {\n \"expr\": \"doris_be_max_disk_io_util_percent{job=\\\"$cluster_name\\\"}\",\n \"legend\": \"{{instance}}\",\n \"refId\": \"A\"\n }\n ],\n \"type\": \"timeseries\",\n \"version\": \"3.0.0\"\n },\n {\n \"collapsed\": true,\n \"id\": \"016e25d8-b7ca-4492-95f2-9caaaeb9897a\",\n \"layout\": {\n \"h\": 1,\n \"i\": \"016e25d8-b7ca-4492-95f2-9caaaeb9897a\",\n \"isResizable\": false,\n \"w\": 24,\n \"x\": 0,\n \"y\": 53\n },\n \"name\": \"Query Statistic\",\n \"panels\": [],\n \"type\": \"row\",\n \"version\": \"3.0.0\"\n },\n {\n \"custom\": {\n \"drawStyle\": \"lines\",\n \"fillOpacity\": 0,\n \"lineInterpolation\": \"linear\",\n \"stack\": \"off\",\n \"version\": \"3.0.0\"\n },\n \"datasourceCate\": \"prometheus\",\n \"datasourceValue\": \"${DS_DORIS}\",\n \"description\": \"Requests per seconds on each Frontends.\\nRequests include all requests sending to the Frontends.\",\n \"id\": \"1d0ea05c-654a-4e55-a56a-f8cf29b3e109\",\n \"layout\": {\n \"h\": 9,\n \"i\": \"1d0ea05c-654a-4e55-a56a-f8cf29b3e109\",\n \"isResizable\": true,\n \"w\": 8,\n \"x\": 0,\n \"y\": 54\n },\n \"links\": [],\n \"maxPerRow\": 4,\n \"name\": \"[$cluster_name] RPS\",\n \"options\": {\n \"legend\": {\n \"displayMode\": \"hidden\"\n },\n \"thresholds\": {\n \"steps\": [\n {\n \"color\": \"#6C53B1\",\n \"type\": \"base\",\n \"value\": null\n }\n ]\n },\n \"tooltip\": {\n \"mode\": \"all\",\n \"sort\": \"none\"\n }\n },\n \"targets\": [\n {\n \"expr\": \"rate(doris_fe_request_total{job=\\\"$cluster_name\\\", group=\\\"fe\\\"}[$interval])\",\n \"legend\": \"{{instance}}\",\n \"refId\": \"B\"\n }\n ],\n \"type\": \"timeseries\",\n \"version\": \"3.0.0\"\n },\n {\n \"custom\": {\n \"drawStyle\": \"lines\",\n \"fillOpacity\": 0,\n \"lineInterpolation\": \"linear\",\n \"stack\": \"off\",\n \"version\": \"3.0.0\"\n },\n \"datasourceCate\": \"prometheus\",\n \"datasourceValue\": \"${DS_DORIS}\",\n \"description\": \"Queries per seconds on each Frontends.\\nQueries only include Select requests.\",\n \"id\": \"8147ab91-ab8a-47c9-9049-08fbb77f9412\",\n \"layout\": {\n \"h\": 9,\n \"i\": \"8147ab91-ab8a-47c9-9049-08fbb77f9412\",\n \"isResizable\": true,\n \"w\": 8,\n \"x\": 8,\n \"y\": 54\n },\n \"links\": [],\n \"maxPerRow\": 4,\n \"name\": \"[$cluster_name] QPS\",\n \"options\": {\n \"legend\": {\n \"displayMode\": \"hidden\"\n },\n \"thresholds\": {\n \"steps\": [\n {\n \"color\": \"#6C53B1\",\n \"type\": \"base\",\n \"value\": null\n }\n ]\n },\n \"tooltip\": {\n \"mode\": \"all\",\n \"sort\": \"none\"\n }\n },\n \"targets\": [\n {\n \"expr\": \"rate(doris_fe_query_total{job=\\\"$cluster_name\\\", group=\\\"fe\\\"}[$interval])\",\n \"legend\": \"{{instance}}\",\n \"refId\": \"B\"\n }\n ],\n \"type\": \"timeseries\",\n \"version\": \"3.0.0\"\n },\n {\n \"custom\": {\n \"drawStyle\": \"lines\",\n \"fillOpacity\": 0,\n \"lineInterpolation\": \"linear\",\n \"stack\": \"off\",\n \"version\": \"3.0.0\"\n },\n \"datasourceCate\": \"prometheus\",\n \"datasourceValue\": \"${DS_DORIS}\",\n \"description\": \"99 quantiles of query latency on each Frontends.\",\n \"id\": \"8de6fab5-27b8-4f40-8209-8a702ec9f665\",\n \"layout\": {\n \"h\": 9,\n \"i\": \"8de6fab5-27b8-4f40-8209-8a702ec9f665\",\n \"isResizable\": true,\n \"w\": 8,\n \"x\": 16,\n \"y\": 54\n },\n \"links\": [],\n \"maxPerRow\": 4,\n \"name\": \"[$cluster_name] 99th Latency\",\n \"options\": {\n \"legend\": {\n \"displayMode\": \"hidden\"\n },\n \"thresholds\": {\n \"steps\": [\n {\n \"color\": \"#6C53B1\",\n \"type\": \"base\",\n \"value\": null\n }\n ]\n },\n \"tooltip\": {\n \"mode\": \"all\",\n \"sort\": \"none\"\n }\n },\n \"targets\": [\n {\n \"expr\": \"sum(doris_fe_query_latency_ms{job=\\\"$cluster_name\\\", quantile=\\\"0.99\\\"}) by (instance)\",\n \"legend\": \"{{instance}}\",\n \"refId\": \"B\"\n }\n ],\n \"type\": \"timeseries\",\n \"version\": \"3.0.0\"\n },\n {\n \"custom\": {\n \"drawStyle\": \"lines\",\n \"fillOpacity\": 0,\n \"lineInterpolation\": \"linear\",\n \"stack\": \"off\",\n \"version\": \"3.0.0\"\n },\n \"datasourceCate\": \"prometheus\",\n \"datasourceValue\": \"${DS_DORIS}\",\n \"description\": \"Left Y axes indicates 95 to 99 quantiles of query latency on each Frontends.\\nRight Y axes indicates the query rate per 1 min.\",\n \"id\": \"6d6c3311-86dd-443f-97bf-2e9874b61650\",\n \"layout\": {\n \"h\": 6,\n \"i\": \"6d6c3311-86dd-443f-97bf-2e9874b61650\",\n \"isResizable\": true,\n \"w\": 8,\n \"x\": 0,\n \"y\": 63\n },\n \"links\": [],\n \"maxPerRow\": 4,\n \"name\": \"[$cluster_name] [$fe_instance] Query Percentile\",\n \"options\": {\n \"legend\": {\n \"displayMode\": \"hidden\"\n },\n \"thresholds\": {\n \"steps\": [\n {\n \"color\": \"#6C53B1\",\n \"type\": \"base\",\n \"value\": null\n }\n ]\n },\n \"tooltip\": {\n \"mode\": \"all\",\n \"sort\": \"none\"\n }\n },\n \"targets\": [\n {\n \"expr\": \"doris_fe_query_latency_ms{job=\\\"$cluster_name\\\", instance=\\\"$fe_instance\\\"}\",\n \"legend\": \"{{quantile}}\",\n \"refId\": \"A\"\n },\n {\n \"expr\": \"rate(doris_fe_query_latency_ms_count{job=\\\"$cluster_name\\\", instance=\\\"$fe_instance\\\"}[1m])\",\n \"legend\": \"query rate\",\n \"refId\": \"C\"\n }\n ],\n \"type\": \"timeseries\",\n \"version\": \"3.0.0\"\n },\n {\n \"custom\": {\n \"drawStyle\": \"lines\",\n \"fillOpacity\": 0,\n \"lineInterpolation\": \"linear\",\n \"stack\": \"off\",\n \"version\": \"3.0.0\"\n },\n \"datasourceCate\": \"prometheus\",\n \"datasourceValue\": \"${DS_DORIS}\",\n \"description\": \"Left Y axes indicates the accumulated error queries number.\\nRight Y axes indicates the error query rate per 1 min.\\nNormally, the error query rate should be 0.\",\n \"id\": \"dec70a12-df04-4763-8f51-30a5b1d4c2c5\",\n \"layout\": {\n \"h\": 6,\n \"i\": \"dec70a12-df04-4763-8f51-30a5b1d4c2c5\",\n \"isResizable\": true,\n \"w\": 8,\n \"x\": 8,\n \"y\": 63\n },\n \"links\": [],\n \"maxPerRow\": 4,\n \"name\": \"[$cluster_name] Query Error [1m]\",\n \"options\": {\n \"legend\": {\n \"displayMode\": \"hidden\"\n },\n \"thresholds\": {\n \"steps\": [\n {\n \"color\": \"#6C53B1\",\n \"type\": \"base\",\n \"value\": null\n }\n ]\n },\n \"tooltip\": {\n \"mode\": \"all\",\n \"sort\": \"none\"\n }\n },\n \"targets\": [\n {\n \"expr\": \"doris_fe_query_err{job=\\\"$cluster_name\\\"}\",\n \"legend\": \"Err Counter-{{instance}}\",\n \"refId\": \"B\"\n },\n {\n \"expr\": \"rate(doris_fe_query_err{job=\\\"$cluster_name\\\"}[$interval])\",\n \"legend\": \"Err Rate-{{instance}}\",\n \"refId\": \"C\"\n }\n ],\n \"type\": \"timeseries\",\n \"version\": \"3.0.0\"\n },\n {\n \"custom\": {\n \"drawStyle\": \"lines\",\n \"fillOpacity\": 0,\n \"lineInterpolation\": \"linear\",\n \"stack\": \"off\",\n \"version\": \"3.0.0\"\n },\n \"datasourceCate\": \"prometheus\",\n \"datasourceValue\": \"${DS_DORIS}\",\n \"description\": \"The connections' number to each Frontends.\",\n \"id\": \"5297af7c-771c-467f-a8c0-4d7311151492\",\n \"layout\": {\n \"h\": 6,\n \"i\": \"5297af7c-771c-467f-a8c0-4d7311151492\",\n \"isResizable\": true,\n \"w\": 8,\n \"x\": 16,\n \"y\": 63\n },\n \"links\": [],\n \"maxPerRow\": 4,\n \"name\": \"[$cluster_name] Connections\",\n \"options\": {\n \"legend\": {\n \"displayMode\": \"hidden\"\n },\n \"thresholds\": {\n \"steps\": [\n {\n \"color\": \"#6C53B1\",\n \"type\": \"base\",\n \"value\": null\n }\n ]\n },\n \"tooltip\": {\n \"mode\": \"all\",\n \"sort\": \"none\"\n }\n },\n \"targets\": [\n {\n \"expr\": \"doris_fe_connection_total{job=\\\"$cluster_name\\\"}\",\n \"legend\": \"{{instance}}\",\n \"refId\": \"A\"\n }\n ],\n \"type\": \"timeseries\",\n \"version\": \"3.0.0\"\n },\n {\n \"collapsed\": true,\n \"id\": \"3f88e434-af57-4b10-a36a-6af0c40b8fcd\",\n \"layout\": {\n \"h\": 1,\n \"i\": \"3f88e434-af57-4b10-a36a-6af0c40b8fcd\",\n \"isResizable\": false,\n \"w\": 24,\n \"x\": 0,\n \"y\": 69\n },\n \"name\": \"Jobs\",\n \"panels\": [],\n \"type\": \"row\",\n \"version\": \"3.0.0\"\n },\n {\n \"custom\": {},\n \"datasourceCate\": \"prometheus\",\n \"datasourceValue\": \"${DS_DORIS}\",\n \"description\": \"Statistic of Broker load jobs's num in each Load State.\",\n \"id\": \"36b2c233-f929-4d0a-af5a-1b4c433b8ba6\",\n \"layout\": {\n \"h\": 6,\n \"i\": \"36b2c233-f929-4d0a-af5a-1b4c433b8ba6\",\n \"isResizable\": true,\n \"w\": 6,\n \"x\": 0,\n \"y\": 70\n },\n \"links\": [],\n \"maxPerRow\": 4,\n \"name\": \"[$cluster_name] Broker Load Job\",\n \"options\": {},\n \"targets\": [\n {\n \"expr\": \"doris_fe_job{job=\\\"$cluster_name\\\", exported_job=\\\"load\\\", type=\\\"BROKER\\\", instance=\\\"$fe_master\\\"}\",\n \"refId\": \"A\"\n }\n ],\n \"type\": \"unknown\",\n \"version\": \"3.0.0\"\n },\n {\n \"custom\": {},\n \"datasourceCate\": \"prometheus\",\n \"datasourceValue\": \"${DS_DORIS}\",\n \"description\": \"Statistic of load jobs's num in each Load State which is generated by Insert Stmt.\",\n \"id\": \"e4518ad0-a300-4e22-9114-7bcc2a770baa\",\n \"layout\": {\n \"h\": 6,\n \"i\": \"e4518ad0-a300-4e22-9114-7bcc2a770baa\",\n \"isResizable\": true,\n \"w\": 6,\n \"x\": 6,\n \"y\": 70\n },\n \"links\": [],\n \"maxPerRow\": 4,\n \"name\": \"[$cluster_name] Insert Load Job\",\n \"options\": {},\n \"targets\": [\n {\n \"expr\": \"doris_fe_job{job=\\\"$cluster_name\\\", exported_job=\\\"load\\\", type=\\\"INSERT\\\", instance=\\\"$fe_master\\\"}\",\n \"refId\": \"A\"\n }\n ],\n \"type\": \"unknown\",\n \"version\": \"3.0.0\"\n },\n {\n \"custom\": {},\n \"datasourceCate\": \"prometheus\",\n \"datasourceValue\": \"${DS_DORIS}\",\n \"description\": \"Statistic of Routine load jobs's num in each Load State.\",\n \"id\": \"90ad8b66-2b7d-4efc-9dc9-bc9fee72492c\",\n \"layout\": {\n \"h\": 6,\n \"i\": \"90ad8b66-2b7d-4efc-9dc9-bc9fee72492c\",\n \"isResizable\": true,\n \"w\": 6,\n \"x\": 12,\n \"y\": 70\n },\n \"links\": [],\n \"maxPerRow\": 4,\n \"name\": \"[$cluster_name] Routine Load Job\",\n \"options\": {},\n \"targets\": [\n {\n \"expr\": \"doris_fe_job{job=\\\"$cluster_name\\\", exported_job=\\\"load\\\", type=\\\"ROUTINE_LOAD\\\", instance=\\\"$fe_master\\\"}\",\n \"refId\": \"A\"\n }\n ],\n \"type\": \"unknown\",\n \"version\": \"3.0.0\"\n },\n {\n \"custom\": {},\n \"datasourceCate\": \"prometheus\",\n \"datasourceValue\": \"${DS_DORIS}\",\n \"description\": \"Statistic of Spark load jobs's num in each Load State.\",\n \"id\": \"8e431597-7fef-4a81-9c60-caafc9150e75\",\n \"layout\": {\n \"h\": 6,\n \"i\": \"8e431597-7fef-4a81-9c60-caafc9150e75\",\n \"isResizable\": true,\n \"w\": 6,\n \"x\": 18,\n \"y\": 70\n },\n \"links\": [],\n \"maxPerRow\": 4,\n \"name\": \"[$cluster_name] Spark Load Job\",\n \"options\": {},\n \"targets\": [\n {\n \"expr\": \"doris_fe_job{job=\\\"$cluster_name\\\", exported_job=\\\"load\\\", type=\\\"SPARK\\\", instance=\\\"$fe_master\\\"}\",\n \"refId\": \"A\"\n }\n ],\n \"type\": \"unknown\",\n \"version\": \"3.0.0\"\n },\n {\n \"custom\": {\n \"drawStyle\": \"lines\",\n \"fillOpacity\": 0,\n \"lineInterpolation\": \"linear\",\n \"stack\": \"off\",\n \"version\": \"3.0.0\"\n },\n \"datasourceCate\": \"prometheus\",\n \"datasourceValue\": \"${DS_DORIS}\",\n \"description\": \"The trend report of broker load job\",\n \"id\": \"6398fd57-672a-4104-bbf9-5b6a08a31d02\",\n \"layout\": {\n \"h\": 6,\n \"i\": \"6398fd57-672a-4104-bbf9-5b6a08a31d02\",\n \"isResizable\": true,\n \"w\": 6,\n \"x\": 0,\n \"y\": 76\n },\n \"links\": [],\n \"maxPerRow\": 4,\n \"name\": \"[$cluster_name] Broker load tendency\",\n \"options\": {\n \"legend\": {\n \"displayMode\": \"hidden\"\n },\n \"thresholds\": {\n \"steps\": [\n {\n \"color\": \"#6C53B1\",\n \"type\": \"base\",\n \"value\": null\n }\n ]\n },\n \"tooltip\": {\n \"mode\": \"all\",\n \"sort\": \"none\"\n }\n },\n \"targets\": [\n {\n \"expr\": \"doris_fe_job{job=\\\"$cluster_name\\\", exported_job=\\\"load\\\", type=\\\"BROKER\\\", instance=\\\"$fe_master\\\", state=\\\"PENDING\\\"}\",\n \"legend\": \"PENDING\",\n \"refId\": \"A\"\n },\n {\n \"expr\": \"doris_fe_job{job=\\\"$cluster_name\\\", exported_job=\\\"load\\\", type=\\\"BROKER\\\", instance=\\\"$fe_master\\\", state=\\\"ETL\\\"}\",\n \"legend\": \"ETL\",\n \"refId\": \"B\"\n },\n {\n \"expr\": \"doris_fe_job{job=\\\"$cluster_name\\\", exported_job=\\\"load\\\", type=\\\"BROKER\\\", instance=\\\"$fe_master\\\", state=\\\"LOADING\\\"}\",\n \"legend\": \"LOADING\",\n \"refId\": \"C\"\n }\n ],\n \"type\": \"timeseries\",\n \"version\": \"3.0.0\"\n },\n {\n \"custom\": {\n \"drawStyle\": \"lines\",\n \"fillOpacity\": 0,\n \"lineInterpolation\": \"linear\",\n \"stack\": \"off\",\n \"version\": \"3.0.0\"\n },\n \"datasourceCate\": \"prometheus\",\n \"datasourceValue\": \"${DS_DORIS}\",\n \"description\": \"The trend report of insert load job\",\n \"id\": \"2cf4e7c5-0edc-411d-bc33-863d6fda4107\",\n \"layout\": {\n \"h\": 6,\n \"i\": \"2cf4e7c5-0edc-411d-bc33-863d6fda4107\",\n \"isResizable\": true,\n \"w\": 6,\n \"x\": 6,\n \"y\": 76\n },\n \"links\": [],\n \"maxPerRow\": 4,\n \"name\": \"[$cluster_name] Insert load tendency\",\n \"options\": {\n \"legend\": {\n \"displayMode\": \"hidden\"\n },\n \"thresholds\": {\n \"steps\": [\n {\n \"color\": \"#6C53B1\",\n \"type\": \"base\",\n \"value\": null\n }\n ]\n },\n \"tooltip\": {\n \"mode\": \"all\",\n \"sort\": \"none\"\n }\n },\n \"targets\": [\n {\n \"expr\": \"doris_fe_job{job=\\\"$cluster_name\\\", exported_job=\\\"load\\\", type=\\\"INSERT\\\", instance=\\\"$fe_master\\\", state=\\\"PENDING\\\"}\",\n \"legend\": \"PENDING\",\n \"refId\": \"A\"\n },\n {\n \"expr\": \"doris_fe_job{job=\\\"$cluster_name\\\", exported_job=\\\"load\\\", type=\\\"INSERT\\\", instance=\\\"$fe_master\\\", state=\\\"ETL\\\"}\",\n \"legend\": \"ETL\",\n \"refId\": \"B\"\n },\n {\n \"expr\": \"doris_fe_job{job=\\\"$cluster_name\\\", exported_job=\\\"load\\\", type=\\\"INSERT\\\", instance=\\\"$fe_master\\\", state=\\\"LOADING\\\"}\",\n \"legend\": \"LOADING\",\n \"refId\": \"C\"\n }\n ],\n \"type\": \"timeseries\",\n \"version\": \"3.0.0\"\n },\n {\n \"custom\": {\n \"drawStyle\": \"lines\",\n \"fillOpacity\": 0,\n \"lineInterpolation\": \"linear\",\n \"stack\": \"off\",\n \"version\": \"3.0.0\"\n },\n \"datasourceCate\": \"prometheus\",\n \"datasourceValue\": \"${DS_DORIS}\",\n \"description\": \"The trend report of routine load job\",\n \"id\": \"0899fb9a-dcc6-4eb8-a8dc-96d3f2124b10\",\n \"layout\": {\n \"h\": 6,\n \"i\": \"0899fb9a-dcc6-4eb8-a8dc-96d3f2124b10\",\n \"isResizable\": true,\n \"w\": 6,\n \"x\": 12,\n \"y\": 76\n },\n \"links\": [],\n \"maxPerRow\": 4,\n \"name\": \"[$cluster_name] Routine load tendency\",\n \"options\": {\n \"legend\": {\n \"displayMode\": \"hidden\"\n },\n \"thresholds\": {\n \"steps\": [\n {\n \"color\": \"#6C53B1\",\n \"type\": \"base\",\n \"value\": null\n }\n ]\n },\n \"tooltip\": {\n \"mode\": \"all\",\n \"sort\": \"none\"\n }\n },\n \"targets\": [\n {\n \"expr\": \"doris_fe_job{job=\\\"$cluster_name\\\", exported_job=\\\"load\\\", type=\\\"ROUTINE_LOAD\\\", instance=\\\"$fe_master\\\", state=\\\"NEED_SCHEDULE\\\"}\",\n \"legend\": \"NEED_SCHEDULE\",\n \"refId\": \"A\"\n },\n {\n \"expr\": \"doris_fe_job{job=\\\"$cluster_name\\\", exported_job=\\\"load\\\", type=\\\"ROUTINE_LOAD\\\", instance=\\\"$fe_master\\\", state=\\\"RUNNING\\\"}\",\n \"legend\": \"RUNNING\",\n \"refId\": \"B\"\n },\n {\n \"expr\": \"doris_fe_job{job=\\\"$cluster_name\\\", exported_job=\\\"load\\\", type=\\\"ROUTINE_LOAD\\\", instance=\\\"$fe_master\\\", state=\\\"PAUSED\\\"}\",\n \"legend\": \"PAUSED\",\n \"refId\": \"C\"\n }\n ],\n \"type\": \"timeseries\",\n \"version\": \"3.0.0\"\n },\n {\n \"custom\": {\n \"drawStyle\": \"lines\",\n \"fillOpacity\": 0,\n \"lineInterpolation\": \"linear\",\n \"stack\": \"off\",\n \"version\": \"3.0.0\"\n },\n \"datasourceCate\": \"prometheus\",\n \"datasourceValue\": \"${DS_DORIS}\",\n \"description\": \"The trend report of spark load job\",\n \"id\": \"ea340542-58e0-4ced-a758-a0563d3346bd\",\n \"layout\": {\n \"h\": 6,\n \"i\": \"ea340542-58e0-4ced-a758-a0563d3346bd\",\n \"isResizable\": true,\n \"w\": 6,\n \"x\": 18,\n \"y\": 76\n },\n \"links\": [],\n \"maxPerRow\": 4,\n \"name\": \"[$cluster_name] Spark load tendency\",\n \"options\": {\n \"legend\": {\n \"displayMode\": \"hidden\"\n },\n \"thresholds\": {\n \"steps\": [\n {\n \"color\": \"#6C53B1\",\n \"type\": \"base\",\n \"value\": null\n }\n ]\n },\n \"tooltip\": {\n \"mode\": \"all\",\n \"sort\": \"none\"\n }\n },\n \"targets\": [\n {\n \"expr\": \"doris_fe_job{job=\\\"$cluster_name\\\", exported_job=\\\"load\\\", type=\\\"SPARK\\\", instance=\\\"$fe_master\\\", state=\\\"PENDING\\\"}\",\n \"legend\": \"PENDING\",\n \"refId\": \"A\"\n },\n {\n \"expr\": \"doris_fe_job{job=\\\"$cluster_name\\\", exported_job=\\\"load\\\", type=\\\"SPARK\\\", instance=\\\"$fe_master\\\", state=\\\"ETL\\\"}\",\n \"legend\": \"ETL\",\n \"refId\": \"B\"\n },\n {\n \"expr\": \"doris_fe_job{job=\\\"$cluster_name\\\", exported_job=\\\"load\\\", type=\\\"SPARK\\\", instance=\\\"$fe_master\\\", state=\\\"LOADING\\\"}\",\n \"legend\": \"LOADING\",\n \"refId\": \"C\"\n }\n ],\n \"type\": \"timeseries\",\n \"version\": \"3.0.0\"\n },\n {\n \"custom\": {},\n \"datasourceCate\": \"prometheus\",\n \"datasourceValue\": \"${DS_DORIS}\",\n \"description\": \"Number of running schema change jobs.\",\n \"id\": \"f0df6aae-52a4-4a92-a4a9-b6a0679be656\",\n \"layout\": {\n \"h\": 3,\n \"i\": \"f0df6aae-52a4-4a92-a4a9-b6a0679be656\",\n \"isResizable\": true,\n \"w\": 6,\n \"x\": 0,\n \"y\": 82\n },\n \"links\": [],\n \"maxPerRow\": 4,\n \"name\": \"[$cluster_name] SC Job\",\n \"options\": {},\n \"targets\": [\n {\n \"expr\": \"doris_fe_job{job=\\\"$cluster_name\\\", instance=\\\"$fe_master\\\", type=\\\"SCHEMA_CHANGE\\\"}\",\n \"legend\": \"asds\",\n \"refId\": \"A\"\n }\n ],\n \"type\": \"unknown\",\n \"version\": \"3.0.0\"\n },\n {\n \"custom\": {\n \"drawStyle\": \"lines\",\n \"fillOpacity\": 0,\n \"lineInterpolation\": \"linear\",\n \"stack\": \"off\",\n \"version\": \"3.0.0\"\n },\n \"datasourceCate\": \"prometheus\",\n \"datasourceValue\": \"${DS_DORIS}\",\n \"description\": \"Queue size of report in Master FE.\",\n \"id\": \"33d04fa7-1c77-4d0c-a43b-4b36539fc5e6\",\n \"layout\": {\n \"h\": 6,\n \"i\": \"33d04fa7-1c77-4d0c-a43b-4b36539fc5e6\",\n \"isResizable\": true,\n \"w\": 6,\n \"x\": 6,\n \"y\": 82\n },\n \"links\": [],\n \"maxPerRow\": 4,\n \"name\": \"[$cluster_name] Report queue size\",\n \"options\": {\n \"legend\": {\n \"displayMode\": \"hidden\"\n },\n \"thresholds\": {\n \"steps\": [\n {\n \"color\": \"#6C53B1\",\n \"type\": \"base\",\n \"value\": null\n }\n ]\n },\n \"tooltip\": {\n \"mode\": \"all\",\n \"sort\": \"none\"\n }\n },\n \"targets\": [\n {\n \"expr\": \"doris_fe_report_queue_size{job=\\\"$cluster_name\\\", instance=\\\"$fe_master\\\"}\",\n \"legend\": \"Report queue size\",\n \"refId\": \"A\"\n }\n ],\n \"type\": \"timeseries\",\n \"version\": \"3.0.0\"\n },\n {\n \"custom\": {},\n \"datasourceCate\": \"prometheus\",\n \"datasourceValue\": \"${DS_DORIS}\",\n \"description\": \"Number of running rollup jobs.\",\n \"id\": \"aa2551f4-361d-498b-a7ff-ed9485346db2\",\n \"layout\": {\n \"h\": 3,\n \"i\": \"aa2551f4-361d-498b-a7ff-ed9485346db2\",\n \"isResizable\": true,\n \"w\": 6,\n \"x\": 0,\n \"y\": 85\n },\n \"links\": [],\n \"maxPerRow\": 4,\n \"name\": \"[$cluster_name] Rollup Job\",\n \"options\": {},\n \"targets\": [\n {\n \"expr\": \"doris_fe_job{job=\\\"$cluster_name\\\", instance=\\\"$fe_master\\\", type=\\\"ROLLUP\\\"}\",\n \"refId\": \"A\"\n }\n ],\n \"type\": \"unknown\",\n \"version\": \"3.0.0\"\n },\n {\n \"collapsed\": true,\n \"id\": \"b6ec71fc-8801-49d9-b418-80a56527637e\",\n \"layout\": {\n \"h\": 1,\n \"i\": \"b6ec71fc-8801-49d9-b418-80a56527637e\",\n \"isResizable\": false,\n \"w\": 24,\n \"x\": 0,\n \"y\": 88\n },\n \"name\": \"Transaction\",\n \"panels\": [],\n \"type\": \"row\",\n \"version\": \"3.0.0\"\n },\n {\n \"custom\": {\n \"drawStyle\": \"lines\",\n \"fillOpacity\": 0,\n \"lineInterpolation\": \"linear\",\n \"stack\": \"off\",\n \"version\": \"3.0.0\"\n },\n \"datasourceCate\": \"prometheus\",\n \"datasourceValue\": \"${DS_DORIS}\",\n \"description\": \"Show the number and rate of txn begin and success\",\n \"id\": \"03f0fe6c-9794-4bde-af91-d19caecd6166\",\n \"layout\": {\n \"h\": 6,\n \"i\": \"03f0fe6c-9794-4bde-af91-d19caecd6166\",\n \"isResizable\": true,\n \"w\": 4,\n \"x\": 0,\n \"y\": 89\n },\n \"links\": [],\n \"maxPerRow\": 4,\n \"name\": \"[$cluster_name] Txn Begin/Success on FE\",\n \"options\": {\n \"legend\": {\n \"displayMode\": \"hidden\"\n },\n \"thresholds\": {\n \"steps\": [\n {\n \"color\": \"#6C53B1\",\n \"type\": \"base\",\n \"value\": null\n }\n ]\n },\n \"tooltip\": {\n \"mode\": \"all\",\n \"sort\": \"none\"\n }\n },\n \"targets\": [\n {\n \"expr\": \"doris_fe_txn_counter{type=\\\"begin\\\"}\",\n \"legend\": \"txn begin\",\n \"refId\": \"A\"\n },\n {\n \"expr\": \"doris_fe_txn_counter{type=\\\"begin\\\"}\",\n \"legend\": \"txn success\",\n \"refId\": \"D\"\n },\n {\n \"expr\": \"irate(doris_fe_txn_counter{type=\\\"begin\\\"}[$interval])\",\n \"legend\": \"txn begin rate\",\n \"refId\": \"B\"\n },\n {\n \"expr\": \"irate(doris_fe_txn_counter{type=\\\"begin\\\"}[$interval])\",\n \"legend\": \"txn success rate\",\n \"refId\": \"C\"\n }\n ],\n \"type\": \"timeseries\",\n \"version\": \"3.0.0\"\n },\n {\n \"custom\": {\n \"drawStyle\": \"lines\",\n \"fillOpacity\": 0,\n \"lineInterpolation\": \"linear\",\n \"stack\": \"off\",\n \"version\": \"3.0.0\"\n },\n \"datasourceCate\": \"prometheus\",\n \"datasourceValue\": \"${DS_DORIS}\",\n \"description\": \"Show the failed txn request. Including rejected request and failed txn\",\n \"id\": \"fb50e00a-30c4-4ad4-9cbd-49defebfd090\",\n \"layout\": {\n \"h\": 6,\n \"i\": \"fb50e00a-30c4-4ad4-9cbd-49defebfd090\",\n \"isResizable\": true,\n \"w\": 5,\n \"x\": 4,\n \"y\": 89\n },\n \"links\": [],\n \"maxPerRow\": 4,\n \"name\": \"[$cluster_name] Txn Failed/Reject on FE\",\n \"options\": {\n \"legend\": {\n \"displayMode\": \"hidden\"\n },\n \"thresholds\": {\n \"steps\": [\n {\n \"color\": \"#6C53B1\",\n \"type\": \"base\",\n \"value\": null\n }\n ]\n },\n \"tooltip\": {\n \"mode\": \"all\",\n \"sort\": \"none\"\n }\n },\n \"targets\": [\n {\n \"expr\": \"rate(doris_fe_txn_counter{type=\\\"reject\\\"}[$interval])\",\n \"legend\": \"txn reject rate\",\n \"refId\": \"C\"\n },\n {\n \"expr\": \"rate(doris_fe_txn_counter{type=\\\"failed\\\"}[$interval])\",\n \"legend\": \"txn failed rate\",\n \"refId\": \"D\"\n }\n ],\n \"type\": \"timeseries\",\n \"version\": \"3.0.0\"\n },\n {\n \"custom\": {\n \"drawStyle\": \"lines\",\n \"fillOpacity\": 0,\n \"lineInterpolation\": \"linear\",\n \"stack\": \"off\",\n \"version\": \"3.0.0\"\n },\n \"datasourceCate\": \"prometheus\",\n \"datasourceValue\": \"${DS_DORIS}\",\n \"description\": \"The number of total publish task request and error rate.\",\n \"id\": \"cfc68c22-6619-478b-9e12-0a15314662f1\",\n \"layout\": {\n \"h\": 6,\n \"i\": \"cfc68c22-6619-478b-9e12-0a15314662f1\",\n \"isResizable\": true,\n \"w\": 5,\n \"x\": 9,\n \"y\": 89\n },\n \"links\": [],\n \"maxPerRow\": 4,\n \"name\": \"[$cluster_name] Publish Task on BE\",\n \"options\": {\n \"legend\": {\n \"displayMode\": \"hidden\"\n },\n \"thresholds\": {\n \"steps\": [\n {\n \"color\": \"#6C53B1\",\n \"type\": \"base\",\n \"value\": null\n }\n ]\n },\n \"tooltip\": {\n \"mode\": \"all\",\n \"sort\": \"none\"\n }\n },\n \"targets\": [\n {\n \"expr\": \"sum(doris_be_engine_requests_total{job=\\\"$cluster_name\\\", type=\\\"publish\\\", status=\\\"total\\\"})\",\n \"legend\": \"Total\",\n \"refId\": \"A\"\n },\n {\n \"expr\": \"irate(doris_be_engine_requests_total{job=\\\"$cluster_name\\\", type=\\\"publish\\\", status=\\\"failed\\\"}[$interval])\",\n \"legend\": \"{{instance}}\",\n \"refId\": \"B\"\n }\n ],\n \"type\": \"timeseries\",\n \"version\": \"3.0.0\"\n },\n {\n \"custom\": {\n \"drawStyle\": \"lines\",\n \"fillOpacity\": 0,\n \"lineInterpolation\": \"linear\",\n \"stack\": \"off\",\n \"version\": \"3.0.0\"\n },\n \"datasourceCate\": \"prometheus\",\n \"datasourceValue\": \"${DS_DORIS}\",\n \"description\": \"Show the txn rstatus on FE\",\n \"id\": \"0a89693c-6530-46dd-a01a-0f00cee1fc75\",\n \"layout\": {\n \"h\": 6,\n \"i\": \"0a89693c-6530-46dd-a01a-0f00cee1fc75\",\n \"isResizable\": true,\n \"w\": 5,\n \"x\": 14,\n \"y\": 89\n },\n \"links\": [],\n \"maxPerRow\": 4,\n \"name\": \"[$cluster_name] fe_txn_status\",\n \"options\": {\n \"legend\": {\n \"displayMode\": \"hidden\"\n },\n \"thresholds\": {\n \"steps\": [\n {\n \"color\": \"#6C53B1\",\n \"type\": \"base\",\n \"value\": null\n }\n ]\n },\n \"tooltip\": {\n \"mode\": \"all\",\n \"sort\": \"none\"\n }\n },\n \"targets\": [\n {\n \"expr\": \"doris_fe_txn_status{group=\\\"fe\\\", job=\\\"$cluster_name\\\", type=\\\"prepare\\\"}\",\n \"legend\": \"prepare\",\n \"refId\": \"A\"\n },\n {\n \"expr\": \"doris_fe_txn_status{group=\\\"fe\\\", job=\\\"$cluster_name\\\", type=\\\"precommitted\\\"}\",\n \"legend\": \"precommitted\",\n \"refId\": \"B\"\n },\n {\n \"expr\": \"doris_fe_txn_status{group=\\\"fe\\\", job=\\\"$cluster_name\\\", type=\\\"committed\\\"}\",\n \"legend\": \"committed\",\n \"refId\": \"C\"\n },\n {\n \"expr\": \"doris_fe_txn_status{group=\\\"fe\\\", job=\\\"$cluster_name\\\", type=\\\"aborted\\\"}\",\n \"legend\": \"aborted\",\n \"refId\": \"D\"\n },\n {\n \"expr\": \"doris_fe_txn_status{group=\\\"fe\\\", job=\\\"$cluster_name\\\", type=\\\"visible\\\"}\",\n \"legend\": \"visible\",\n \"refId\": \"E\"\n },\n {\n \"expr\": \"doris_fe_txn_status{group=\\\"fe\\\", job=\\\"$cluster_name\\\", type=\\\"unknown\\\"}\",\n \"legend\": \"unknown\",\n \"refId\": \"F\"\n }\n ],\n \"type\": \"timeseries\",\n \"version\": \"3.0.0\"\n },\n {\n \"custom\": {\n \"drawStyle\": \"lines\",\n \"fillOpacity\": 0,\n \"lineInterpolation\": \"linear\",\n \"stack\": \"off\",\n \"version\": \"3.0.0\"\n },\n \"datasourceCate\": \"prometheus\",\n \"datasourceValue\": \"${DS_DORIS}\",\n \"description\": \"Left Y axes indicates the total received bytes rate of txn. Right Y axes indicates the loaded rows rate of txn.\",\n \"id\": \"a965e2f4-1210-4a9c-a60c-142e3ef20857\",\n \"layout\": {\n \"h\": 6,\n \"i\": \"a965e2f4-1210-4a9c-a60c-142e3ef20857\",\n \"isResizable\": true,\n \"w\": 5,\n \"x\": 19,\n \"y\": 89\n },\n \"links\": [],\n \"maxPerRow\": 4,\n \"name\": \"[$cluster_name] Txn Load Bytes/Rows rate\",\n \"options\": {\n \"legend\": {\n \"displayMode\": \"hidden\"\n },\n \"thresholds\": {\n \"steps\": [\n {\n \"color\": \"#6C53B1\",\n \"type\": \"base\",\n \"value\": null\n }\n ]\n },\n \"tooltip\": {\n \"mode\": \"all\",\n \"sort\": \"none\"\n }\n },\n \"targets\": [\n {\n \"expr\": \"sum(rate(doris_be_stream_load{group=\\\"be\\\", job=\\\"$cluster_name\\\", type=\\\"receive_bytes\\\"}[$interval]))\",\n \"legend\": \"bytes\",\n \"refId\": \"A\"\n },\n {\n \"expr\": \"sum(rate(doris_be_stream_load{group=\\\"be\\\", job=\\\"$cluster_name\\\", type=\\\"load_rows\\\"}[$interval]))\",\n \"legend\": \"rows\",\n \"refId\": \"B\"\n }\n ],\n \"type\": \"timeseries\",\n \"version\": \"3.0.0\"\n },\n {\n \"collapsed\": true,\n \"id\": \"d5660739-4863-45ab-8989-321806539fa2\",\n \"layout\": {\n \"h\": 1,\n \"i\": \"d5660739-4863-45ab-8989-321806539fa2\",\n \"isResizable\": false,\n \"w\": 24,\n \"x\": 0,\n \"y\": 95\n },\n \"name\": \"FE JVM\",\n \"panels\": [],\n \"type\": \"row\",\n \"version\": \"3.0.0\"\n },\n {\n \"custom\": {\n \"drawStyle\": \"lines\",\n \"fillOpacity\": 0,\n \"lineInterpolation\": \"linear\",\n \"stack\": \"off\",\n \"version\": \"3.0.0\"\n },\n \"datasourceCate\": \"prometheus\",\n \"datasourceValue\": \"${DS_DORIS}\",\n \"description\": \"JVM Heap usage of specified Frontend.\\nLeft Y Axes shows the used/max heap size.\\nRight Y Axes shows the used percentage.\",\n \"id\": \"4a802abe-2eb9-43b2-80ef-83edc18d69b1\",\n \"layout\": {\n \"h\": 6,\n \"i\": \"4a802abe-2eb9-43b2-80ef-83edc18d69b1\",\n \"isResizable\": true,\n \"w\": 6,\n \"x\": 0,\n \"y\": 96\n },\n \"links\": [],\n \"maxPerRow\": 4,\n \"name\": \"[$cluster_name] [$fe_instance] JVM Heap\",\n \"options\": {\n \"legend\": {\n \"displayMode\": \"hidden\"\n },\n \"thresholds\": {\n \"steps\": [\n {\n \"color\": \"#6C53B1\",\n \"type\": \"base\",\n \"value\": null\n }\n ]\n },\n \"tooltip\": {\n \"mode\": \"all\",\n \"sort\": \"none\"\n }\n },\n \"targets\": [\n {\n \"expr\": \"jvm_heap_size_bytes{instance=\\\"$fe_instance\\\", job=\\\"$cluster_name\\\", type=\\\"used\\\"}\",\n \"legend\": \"used\",\n \"refId\": \"A\"\n },\n {\n \"expr\": \"jvm_heap_size_bytes{instance=\\\"$fe_instance\\\", job=\\\"$cluster_name\\\", type=\\\"max\\\"}\",\n \"legend\": \"max\",\n \"refId\": \"B\"\n },\n {\n \"expr\": \"sum(jvm_heap_size_bytes{instance=\\\"$fe_instance\\\", job=\\\"$cluster_name\\\", type=\\\"used\\\"}) * 100 / sum(jvm_heap_size_bytes{instance=\\\"$fe_instance\\\", job=\\\"$cluster_name\\\", type=\\\"max\\\"})\",\n \"legend\": \"percentage\",\n \"refId\": \"C\"\n }\n ],\n \"type\": \"timeseries\",\n \"version\": \"3.0.0\"\n },\n {\n \"custom\": {\n \"drawStyle\": \"lines\",\n \"fillOpacity\": 0,\n \"lineInterpolation\": \"linear\",\n \"stack\": \"off\",\n \"version\": \"3.0.0\"\n },\n \"datasourceCate\": \"prometheus\",\n \"datasourceValue\": \"${DS_DORIS}\",\n \"description\": \"JVM Non Heap usage of specified Frontend.\\nLeft Y Axes shows the used/committed non heap size.\",\n \"id\": \"d9854424-b151-4c38-853a-4526cd31edb9\",\n \"layout\": {\n \"h\": 6,\n \"i\": \"d9854424-b151-4c38-853a-4526cd31edb9\",\n \"isResizable\": true,\n \"w\": 6,\n \"x\": 6,\n \"y\": 96\n },\n \"links\": [],\n \"maxPerRow\": 4,\n \"name\": \"[$cluster_name] [$fe_instance] JVM Non Heap\",\n \"options\": {\n \"legend\": {\n \"displayMode\": \"hidden\"\n },\n \"thresholds\": {\n \"steps\": [\n {\n \"color\": \"#6C53B1\",\n \"type\": \"base\",\n \"value\": null\n }\n ]\n },\n \"tooltip\": {\n \"mode\": \"all\",\n \"sort\": \"none\"\n }\n },\n \"targets\": [\n {\n \"expr\": \"jvm_non_heap_size_bytes{instance=\\\"$fe_instance\\\", job=\\\"$cluster_name\\\", type=\\\"used\\\"}\",\n \"legend\": \"used\",\n \"refId\": \"A\"\n },\n {\n \"expr\": \"jvm_non_heap_size_bytes{instance=\\\"$fe_instance\\\", job=\\\"$cluster_name\\\", type=\\\"committed\\\"}\",\n \"legend\": \"committed\",\n \"refId\": \"B\"\n }\n ],\n \"type\": \"timeseries\",\n \"version\": \"3.0.0\"\n },\n {\n \"custom\": {\n \"drawStyle\": \"lines\",\n \"fillOpacity\": 0,\n \"lineInterpolation\": \"linear\",\n \"stack\": \"off\",\n \"version\": \"3.0.0\"\n },\n \"datasourceCate\": \"prometheus\",\n \"datasourceValue\": \"${DS_DORIS}\",\n \"description\": \"JVM old generation usage of specified Frontend. Left Y Axes shows the used/max old generation size. Right Y Axes shows the used percentage.\\nNormally, the usage percentage should be less than 80%.\",\n \"id\": \"c30e8716-0e03-4b28-a9a7-4c3ea862f458\",\n \"layout\": {\n \"h\": 6,\n \"i\": \"c30e8716-0e03-4b28-a9a7-4c3ea862f458\",\n \"isResizable\": true,\n \"w\": 6,\n \"x\": 12,\n \"y\": 96\n },\n \"links\": [],\n \"maxPerRow\": 4,\n \"name\": \"[$cluster_name] [$fe_instance] JVM Old\",\n \"options\": {\n \"legend\": {\n \"displayMode\": \"hidden\"\n },\n \"thresholds\": {\n \"steps\": [\n {\n \"color\": \"#6C53B1\",\n \"type\": \"base\",\n \"value\": null\n }\n ]\n },\n \"tooltip\": {\n \"mode\": \"all\",\n \"sort\": \"none\"\n }\n },\n \"targets\": [\n {\n \"expr\": \"jvm_old_size_bytes{job=\\\"$cluster_name\\\", instance=\\\"$fe_instance\\\", type=\\\"used\\\"}\",\n \"legend\": \"used\",\n \"refId\": \"A\"\n },\n {\n \"expr\": \"jvm_old_size_bytes{job=\\\"$cluster_name\\\", instance=\\\"$fe_instance\\\", type=\\\"max\\\"}\",\n \"legend\": \"max\",\n \"refId\": \"B\"\n },\n {\n \"expr\": \"sum(jvm_old_size_bytes{job=\\\"$cluster_name\\\", instance=\\\"$fe_instance\\\", type=\\\"used\\\"}) * 100 / sum(jvm_old_size_bytes{job=\\\"$cluster_name\\\", instance=\\\"$fe_instance\\\", type=\\\"max\\\"})\",\n \"legend\": \"percentage\",\n \"refId\": \"C\"\n }\n ],\n \"type\": \"timeseries\",\n \"version\": \"3.0.0\"\n },\n {\n \"custom\": {\n \"drawStyle\": \"lines\",\n \"fillOpacity\": 0,\n \"lineInterpolation\": \"linear\",\n \"stack\": \"off\",\n \"version\": \"3.0.0\"\n },\n \"datasourceCate\": \"prometheus\",\n \"datasourceValue\": \"${DS_DORIS}\",\n \"description\": \"JVM full gc stat of specified Frontend. \\nLeft Y Axes shows times of full gc.\\nRight Y Axes shows the time cost of each full gc.\",\n \"id\": \"1ae86a38-9421-4472-b23a-1f41828a24e4\",\n \"layout\": {\n \"h\": 6,\n \"i\": \"1ae86a38-9421-4472-b23a-1f41828a24e4\",\n \"isResizable\": true,\n \"w\": 6,\n \"x\": 18,\n \"y\": 96\n },\n \"links\": [],\n \"maxPerRow\": 4,\n \"name\": \"[$cluster_name] [$fe_instance] JVM Old GC\",\n \"options\": {\n \"legend\": {\n \"displayMode\": \"hidden\"\n },\n \"thresholds\": {\n \"steps\": [\n {\n \"color\": \"#6C53B1\",\n \"type\": \"base\",\n \"value\": null\n }\n ]\n },\n \"tooltip\": {\n \"mode\": \"all\",\n \"sort\": \"none\"\n }\n },\n \"targets\": [\n {\n \"expr\": \"jvm_old_gc{job=\\\"$cluster_name\\\", instance=\\\"$fe_instance\\\", type=\\\"count\\\"}\",\n \"legend\": \"count\",\n \"refId\": \"A\"\n },\n {\n \"expr\": \"sum(jvm_old_gc{job=\\\"$cluster_name\\\", instance=\\\"$fe_instance\\\", type=\\\"time\\\"}) / sum(jvm_old_gc{job=\\\"$cluster_name\\\", instance=\\\"$fe_instance\\\", type=\\\"count\\\"})\",\n \"legend\": \"avg time\",\n \"refId\": \"B\"\n }\n ],\n \"type\": \"timeseries\",\n \"version\": \"3.0.0\"\n },\n {\n \"custom\": {\n \"drawStyle\": \"lines\",\n \"fillOpacity\": 0,\n \"lineInterpolation\": \"linear\",\n \"stack\": \"off\",\n \"version\": \"3.0.0\"\n },\n \"datasourceCate\": \"prometheus\",\n \"datasourceValue\": \"${DS_DORIS}\",\n \"description\": \"JVM young generation usage of specified Frontend.\\nLeft Y Axes shows the used/max young generation size.\\nRight Y Axes shows the used percentage.\",\n \"id\": \"d6d6155c-470d-4fb6-a4db-fded915c5cef\",\n \"layout\": {\n \"h\": 6,\n \"i\": \"d6d6155c-470d-4fb6-a4db-fded915c5cef\",\n \"isResizable\": true,\n \"w\": 6,\n \"x\": 0,\n \"y\": 102\n },\n \"links\": [],\n \"maxPerRow\": 4,\n \"name\": \"[$cluster_name] [$fe_instance] JVM Young\",\n \"options\": {\n \"legend\": {\n \"displayMode\": \"hidden\"\n },\n \"thresholds\": {\n \"steps\": [\n {\n \"color\": \"#6C53B1\",\n \"type\": \"base\",\n \"value\": null\n }\n ]\n },\n \"tooltip\": {\n \"mode\": \"all\",\n \"sort\": \"none\"\n }\n },\n \"targets\": [\n {\n \"expr\": \"jvm_young_size_bytes{job=\\\"$cluster_name\\\", instance=\\\"$fe_instance\\\", type=\\\"used\\\"}\",\n \"legend\": \"used\",\n \"refId\": \"A\"\n },\n {\n \"expr\": \"jvm_young_size_bytes{job=\\\"$cluster_name\\\", instance=\\\"$fe_instance\\\", type=\\\"max\\\"}\",\n \"legend\": \"max\",\n \"refId\": \"B\"\n },\n {\n \"expr\": \"sum(jvm_young_size_bytes{job=\\\"$cluster_name\\\", instance=\\\"$fe_instance\\\", type=\\\"used\\\"}) * 100 / sum(jvm_young_size_bytes{job=\\\"$cluster_name\\\", instance=\\\"$fe_instance\\\", type=\\\"max\\\"})\",\n \"legend\": \"percentage\",\n \"refId\": \"C\"\n }\n ],\n \"type\": \"timeseries\",\n \"version\": \"3.0.0\"\n },\n {\n \"custom\": {\n \"drawStyle\": \"lines\",\n \"fillOpacity\": 0,\n \"lineInterpolation\": \"linear\",\n \"stack\": \"off\",\n \"version\": \"3.0.0\"\n },\n \"datasourceCate\": \"prometheus\",\n \"datasourceValue\": \"${DS_DORIS}\",\n \"description\": \"JVM young gc stat of specified Frontend. \\nLeft Y Axes shows times of young gc.\\nRight Y Axes shows the time cost of each young gc.\",\n \"id\": \"1e9c7d1d-f69d-4c95-bfa7-d46014151f21\",\n \"layout\": {\n \"h\": 6,\n \"i\": \"1e9c7d1d-f69d-4c95-bfa7-d46014151f21\",\n \"isResizable\": true,\n \"w\": 6,\n \"x\": 6,\n \"y\": 102\n },\n \"links\": [],\n \"maxPerRow\": 4,\n \"name\": \"[$cluster_name] [$fe_instance] JVM Young GC\",\n \"options\": {\n \"legend\": {\n \"displayMode\": \"hidden\"\n },\n \"thresholds\": {\n \"steps\": [\n {\n \"color\": \"#6C53B1\",\n \"type\": \"base\",\n \"value\": null\n }\n ]\n },\n \"tooltip\": {\n \"mode\": \"all\",\n \"sort\": \"none\"\n }\n },\n \"targets\": [\n {\n \"expr\": \"jvm_young_gc{job=\\\"$cluster_name\\\", instance=\\\"$fe_instance\\\", type=\\\"count\\\"}\",\n \"legend\": \"count\",\n \"refId\": \"A\"\n },\n {\n \"expr\": \"sum(jvm_young_gc{job=\\\"$cluster_name\\\", instance=\\\"$fe_instance\\\", type=\\\"time\\\"}) / sum(jvm_young_gc{job=\\\"$cluster_name\\\", instance=\\\"$fe_instance\\\", type=\\\"count\\\"})\",\n \"legend\": \"avg time\",\n \"refId\": \"B\"\n }\n ],\n \"type\": \"timeseries\",\n \"version\": \"3.0.0\"\n },\n {\n \"custom\": {\n \"drawStyle\": \"lines\",\n \"fillOpacity\": 0,\n \"lineInterpolation\": \"linear\",\n \"stack\": \"off\",\n \"version\": \"3.0.0\"\n },\n \"datasourceCate\": \"prometheus\",\n \"datasourceValue\": \"${DS_DORIS}\",\n \"description\": \"Num of threads of FE JVM\",\n \"id\": \"dd35a648-f3f2-4ce5-8f3c-315ccc3ad655\",\n \"layout\": {\n \"h\": 6,\n \"i\": \"dd35a648-f3f2-4ce5-8f3c-315ccc3ad655\",\n \"isResizable\": true,\n \"w\": 6,\n \"x\": 12,\n \"y\": 102\n },\n \"links\": [],\n \"maxPerRow\": 4,\n \"name\": \"[$cluster_name] JVM Threads\",\n \"options\": {\n \"legend\": {\n \"displayMode\": \"hidden\"\n },\n \"thresholds\": {\n \"steps\": [\n {\n \"color\": \"#6C53B1\",\n \"type\": \"base\",\n \"value\": null\n }\n ]\n },\n \"tooltip\": {\n \"mode\": \"all\",\n \"sort\": \"none\"\n }\n },\n \"targets\": [\n {\n \"expr\": \"jvm_thread{job=\\\"$cluster_name\\\", group=\\\"fe\\\", type=\\\"count\\\"}\",\n \"legend\": \"{{instance}}\",\n \"refId\": \"A\"\n }\n ],\n \"type\": \"timeseries\",\n \"version\": \"3.0.0\"\n },\n {\n \"collapsed\": true,\n \"id\": \"e9f5be81-e476-4056-bb0f-065a9082b26c\",\n \"layout\": {\n \"h\": 1,\n \"i\": \"e9f5be81-e476-4056-bb0f-065a9082b26c\",\n \"isResizable\": false,\n \"w\": 24,\n \"x\": 0,\n \"y\": 108\n },\n \"name\": \"BE\",\n \"panels\": [],\n \"type\": \"row\",\n \"version\": \"3.0.0\"\n },\n {\n \"custom\": {\n \"drawStyle\": \"lines\",\n \"fillOpacity\": 0,\n \"lineInterpolation\": \"linear\",\n \"stack\": \"off\",\n \"version\": \"3.0.0\"\n },\n \"datasourceCate\": \"prometheus\",\n \"datasourceValue\": \"${DS_DORIS}\",\n \"description\": \"CPU idle stat of Backends.\\nLow means CPU is busy.\",\n \"id\": \"d174d1e4-3f66-45c6-b2c8-e0ad12662bd3\",\n \"layout\": {\n \"h\": 9,\n \"i\": \"d174d1e4-3f66-45c6-b2c8-e0ad12662bd3\",\n \"isResizable\": true,\n \"w\": 12,\n \"x\": 0,\n \"y\": 109\n },\n \"links\": [],\n \"maxPerRow\": 4,\n \"name\": \"[$cluster_name] BE CPU Idle\",\n \"options\": {\n \"legend\": {\n \"displayMode\": \"hidden\"\n },\n \"thresholds\": {\n \"steps\": [\n {\n \"color\": \"#6C53B1\",\n \"type\": \"base\",\n \"value\": null\n }\n ]\n },\n \"tooltip\": {\n \"mode\": \"all\",\n \"sort\": \"none\"\n }\n },\n \"targets\": [\n {\n \"expr\": \"(sum(rate(doris_be_cpu{mode=\\\"idle\\\", job=\\\"$cluster_name\\\"}[$interval])) by (job, instance)) / (sum(rate(doris_be_cpu{job=\\\"$cluster_name\\\"}[$interval])) by (job, instance)) * 100\",\n \"legend\": \"{{instance}}\",\n \"refId\": \"A\"\n }\n ],\n \"type\": \"timeseries\",\n \"version\": \"3.0.0\"\n },\n {\n \"custom\": {\n \"drawStyle\": \"lines\",\n \"fillOpacity\": 0,\n \"lineInterpolation\": \"linear\",\n \"stack\": \"off\",\n \"version\": \"3.0.0\"\n },\n \"datasourceCate\": \"prometheus\",\n \"datasourceValue\": \"${DS_DORIS}\",\n \"description\": \"Memory usage of Backends.\",\n \"id\": \"6d71521c-9ef9-4204-aba6-cf2a7659b5cd\",\n \"layout\": {\n \"h\": 9,\n \"i\": \"6d71521c-9ef9-4204-aba6-cf2a7659b5cd\",\n \"isResizable\": true,\n \"w\": 12,\n \"x\": 12,\n \"y\": 109\n },\n \"links\": [],\n \"maxPerRow\": 4,\n \"name\": \"[$cluster_name] BE Mem\",\n \"options\": {\n \"legend\": {\n \"displayMode\": \"hidden\"\n },\n \"thresholds\": {\n \"steps\": [\n {\n \"color\": \"#6C53B1\",\n \"type\": \"base\",\n \"value\": null\n }\n ]\n },\n \"tooltip\": {\n \"mode\": \"all\",\n \"sort\": \"none\"\n }\n },\n \"targets\": [\n {\n \"expr\": \"doris_be_memory_allocated_bytes{job=\\\"$cluster_name\\\"}\",\n \"legend\": \"{{instance}}\",\n \"refId\": \"A\"\n }\n ],\n \"type\": \"timeseries\",\n \"version\": \"3.0.0\"\n },\n {\n \"custom\": {\n \"drawStyle\": \"lines\",\n \"fillOpacity\": 0,\n \"lineInterpolation\": \"linear\",\n \"stack\": \"off\",\n \"version\": \"3.0.0\"\n },\n \"datasourceCate\": \"prometheus\",\n \"datasourceValue\": \"${DS_DORIS}\",\n \"description\": \"Network send(Left Y)/receive(Right Y) bytes rate of all device except 'lo'\",\n \"id\": \"48850636-2977-43c0-bac3-2860f6e95eb1\",\n \"layout\": {\n \"h\": 7,\n \"i\": \"48850636-2977-43c0-bac3-2860f6e95eb1\",\n \"isResizable\": true,\n \"w\": 8,\n \"x\": 0,\n \"y\": 118\n },\n \"links\": [],\n \"maxPerRow\": 4,\n \"name\": \"[$cluster_name] Net send/receive bytes\",\n \"options\": {\n \"legend\": {\n \"displayMode\": \"hidden\"\n },\n \"thresholds\": {\n \"steps\": [\n {\n \"color\": \"#6C53B1\",\n \"type\": \"base\",\n \"value\": null\n }\n ]\n },\n \"tooltip\": {\n \"mode\": \"all\",\n \"sort\": \"none\"\n }\n },\n \"targets\": [\n {\n \"expr\": \"irate(doris_be_network_send_bytes{job=\\\"$cluster_name\\\", group=\\\"be\\\", device!=\\\"lo\\\"}[$interval])\",\n \"legend\": \"{{instance}}-{{device}}-send\",\n \"refId\": \"A\"\n },\n {\n \"expr\": \"irate(doris_be_network_receive_bytes{job=\\\"$cluster_name\\\", group=\\\"be\\\", device!=\\\"lo\\\"}[$interval])\",\n \"legend\": \"{{instance}}-{{device}}-receive\",\n \"refId\": \"B\"\n }\n ],\n \"type\": \"timeseries\",\n \"version\": \"3.0.0\"\n },\n {\n \"custom\": {\n \"drawStyle\": \"lines\",\n \"fillOpacity\": 0,\n \"lineInterpolation\": \"linear\",\n \"stack\": \"off\",\n \"version\": \"3.0.0\"\n },\n \"datasourceCate\": \"prometheus\",\n \"datasourceValue\": \"${DS_DORIS}\",\n \"description\": \"Disk capacity usage of Backends\",\n \"id\": \"3e344063-09e3-44e2-a544-80879a68bb67\",\n \"layout\": {\n \"h\": 7,\n \"i\": \"3e344063-09e3-44e2-a544-80879a68bb67\",\n \"isResizable\": true,\n \"w\": 8,\n \"x\": 8,\n \"y\": 118\n },\n \"links\": [],\n \"maxPerRow\": 4,\n \"name\": \"[$cluster_name] Disk Usage\",\n \"options\": {\n \"legend\": {\n \"displayMode\": \"hidden\"\n },\n \"thresholds\": {\n \"steps\": [\n {\n \"color\": \"#6C53B1\",\n \"type\": \"base\",\n \"value\": null\n }\n ]\n },\n \"tooltip\": {\n \"mode\": \"all\",\n \"sort\": \"none\"\n }\n },\n \"targets\": [\n {\n \"expr\": \"(SUM(doris_be_disks_total_capacity{job=\\\"$cluster_name\\\"}) by (instance, path) - SUM(doris_be_disks_avail_capacity{job=\\\"$cluster_name\\\"}) by (instance, path)) / SUM(doris_be_disks_total_capacity{job=\\\"$cluster_name\\\"}) by (instance, path)\",\n \"legend\": \"{{instance}}:{{path}}\",\n \"refId\": \"C\"\n }\n ],\n \"type\": \"timeseries\",\n \"version\": \"3.0.0\"\n },\n {\n \"custom\": {\n \"drawStyle\": \"lines\",\n \"fillOpacity\": 0,\n \"lineInterpolation\": \"linear\",\n \"stack\": \"off\",\n \"version\": \"3.0.0\"\n },\n \"datasourceCate\": \"prometheus\",\n \"datasourceValue\": \"${DS_DORIS}\",\n \"description\": \"Number of tablets of each Backends\",\n \"id\": \"10bc7e4d-44f0-4ec7-b16a-72eae631fb50\",\n \"layout\": {\n \"h\": 7,\n \"i\": \"10bc7e4d-44f0-4ec7-b16a-72eae631fb50\",\n \"isResizable\": true,\n \"w\": 8,\n \"x\": 16,\n \"y\": 118\n },\n \"links\": [],\n \"maxPerRow\": 4,\n \"name\": \"[$cluster_name] Tablet Distribution\",\n \"options\": {\n \"legend\": {\n \"displayMode\": \"hidden\"\n },\n \"thresholds\": {\n \"steps\": [\n {\n \"color\": \"#6C53B1\",\n \"type\": \"base\",\n \"value\": null\n }\n ]\n },\n \"tooltip\": {\n \"mode\": \"all\",\n \"sort\": \"none\"\n }\n },\n \"targets\": [\n {\n \"expr\": \"doris_fe_tablet_num{job=\\\"$cluster_name\\\", instance=\\\"$fe_master\\\"}\",\n \"legend\": \"{{backend}}\",\n \"refId\": \"A\"\n }\n ],\n \"type\": \"timeseries\",\n \"version\": \"3.0.0\"\n },\n {\n \"custom\": {\n \"drawStyle\": \"lines\",\n \"fillOpacity\": 0,\n \"lineInterpolation\": \"linear\",\n \"stack\": \"off\",\n \"version\": \"3.0.0\"\n },\n \"datasourceCate\": \"prometheus\",\n \"datasourceValue\": \"${DS_DORIS}\",\n \"description\": \"The file descriptor usage of Backends. Left Y axes shows the used fd num. Right Y axes shows the soft limit open file number.\",\n \"id\": \"06bfa07c-aacd-44b6-8059-1d859999457d\",\n \"layout\": {\n \"h\": 7,\n \"i\": \"06bfa07c-aacd-44b6-8059-1d859999457d\",\n \"isResizable\": true,\n \"w\": 8,\n \"x\": 0,\n \"y\": 125\n },\n \"links\": [],\n \"maxPerRow\": 4,\n \"name\": \"[$cluster_name] BE FD count\",\n \"options\": {\n \"legend\": {\n \"displayMode\": \"hidden\"\n },\n \"thresholds\": {\n \"steps\": [\n {\n \"color\": \"#6C53B1\",\n \"type\": \"base\",\n \"value\": null\n }\n ]\n },\n \"tooltip\": {\n \"mode\": \"all\",\n \"sort\": \"none\"\n }\n },\n \"targets\": [\n {\n \"expr\": \"doris_be_process_fd_num_used{job=\\\"$cluster_name\\\", group=\\\"be\\\"}\",\n \"legend\": \"{{instance}}-used\",\n \"refId\": \"A\"\n },\n {\n \"expr\": \"doris_be_process_fd_num_limit_soft{job=\\\"$cluster_name\\\", group=\\\"be\\\"}\",\n \"legend\": \"{{instance}}-soft limit\",\n \"refId\": \"B\"\n }\n ],\n \"type\": \"timeseries\",\n \"version\": \"3.0.0\"\n },\n {\n \"custom\": {\n \"drawStyle\": \"lines\",\n \"fillOpacity\": 0,\n \"lineInterpolation\": \"linear\",\n \"stack\": \"off\",\n \"version\": \"3.0.0\"\n },\n \"datasourceCate\": \"prometheus\",\n \"datasourceValue\": \"${DS_DORIS}\",\n \"description\": \"The thread number of Backends\",\n \"id\": \"d22e80d3-b055-4520-a667-aeee7b754d42\",\n \"layout\": {\n \"h\": 7,\n \"i\": \"d22e80d3-b055-4520-a667-aeee7b754d42\",\n \"isResizable\": true,\n \"w\": 8,\n \"x\": 8,\n \"y\": 125\n },\n \"links\": [],\n \"maxPerRow\": 4,\n \"name\": \"[$cluster_name] BE thread num\",\n \"options\": {\n \"legend\": {\n \"displayMode\": \"hidden\"\n },\n \"thresholds\": {\n \"steps\": [\n {\n \"color\": \"#6C53B1\",\n \"type\": \"base\",\n \"value\": null\n }\n ]\n },\n \"tooltip\": {\n \"mode\": \"all\",\n \"sort\": \"none\"\n }\n },\n \"targets\": [\n {\n \"expr\": \"doris_be_process_thread_num{job=\\\"$cluster_name\\\", group=\\\"be\\\"}\",\n \"legend\": \"{{instance}}\",\n \"refId\": \"A\"\n }\n ],\n \"type\": \"timeseries\",\n \"version\": \"3.0.0\"\n },\n {\n \"custom\": {\n \"drawStyle\": \"lines\",\n \"fillOpacity\": 0,\n \"lineInterpolation\": \"linear\",\n \"stack\": \"off\",\n \"version\": \"3.0.0\"\n },\n \"datasourceCate\": \"prometheus\",\n \"datasourceValue\": \"${DS_DORIS}\",\n \"description\": \"IO util of Backends.\\nHigh means I/O is busy.\",\n \"id\": \"621fec2e-c115-4c11-9420-f96720c0d348\",\n \"layout\": {\n \"h\": 7,\n \"i\": \"621fec2e-c115-4c11-9420-f96720c0d348\",\n \"isResizable\": true,\n \"w\": 8,\n \"x\": 16,\n \"y\": 125\n },\n \"links\": [],\n \"maxPerRow\": 4,\n \"name\": \"[$cluster_name] Disk IO util\",\n \"options\": {\n \"legend\": {\n \"displayMode\": \"hidden\"\n },\n \"thresholds\": {\n \"steps\": [\n {\n \"color\": \"#6C53B1\",\n \"type\": \"base\",\n \"value\": null\n }\n ]\n },\n \"tooltip\": {\n \"mode\": \"all\",\n \"sort\": \"none\"\n }\n },\n \"targets\": [\n {\n \"expr\": \"doris_be_max_disk_io_util_percent\",\n \"legend\": \"{{instance}}\",\n \"refId\": \"B\"\n }\n ],\n \"type\": \"timeseries\",\n \"version\": \"3.0.0\"\n },\n {\n \"custom\": {\n \"drawStyle\": \"lines\",\n \"fillOpacity\": 0,\n \"lineInterpolation\": \"linear\",\n \"stack\": \"off\",\n \"version\": \"3.0.0\"\n },\n \"datasourceCate\": \"prometheus\",\n \"datasourceValue\": \"${DS_DORIS}\",\n \"description\": \"Base compaction rate of Backends.\\nNormally, base compaction only runs between 20:00 to 4:00 and it is configurable.\\nRight Y axes indicates the total base compaction bytes.\",\n \"id\": \"5cf950b7-0b3d-4eab-8f23-b5623cb0c590\",\n \"layout\": {\n \"h\": 5,\n \"i\": \"5cf950b7-0b3d-4eab-8f23-b5623cb0c590\",\n \"isResizable\": true,\n \"w\": 12,\n \"x\": 0,\n \"y\": 132\n },\n \"links\": [],\n \"maxPerRow\": 4,\n \"name\": \"[$cluster_name] BE Compaction Base\",\n \"options\": {\n \"legend\": {\n \"displayMode\": \"hidden\"\n },\n \"thresholds\": {\n \"steps\": [\n {\n \"color\": \"#6C53B1\",\n \"type\": \"base\",\n \"value\": null\n }\n ]\n },\n \"tooltip\": {\n \"mode\": \"all\",\n \"sort\": \"none\"\n }\n },\n \"targets\": [\n {\n \"expr\": \"rate(doris_be_compaction_bytes_total{type=\\\"base\\\", job=\\\"$cluster_name\\\"}[$interval])\",\n \"legend\": \"{{instance}}\",\n \"refId\": \"A\"\n },\n {\n \"expr\": \"sum(doris_be_compaction_bytes_total{type=\\\"base\\\", job=\\\"$cluster_name\\\"})\",\n \"legend\": \"Total\",\n \"refId\": \"B\"\n }\n ],\n \"type\": \"timeseries\",\n \"version\": \"3.0.0\"\n },\n {\n \"custom\": {\n \"drawStyle\": \"lines\",\n \"fillOpacity\": 0,\n \"lineInterpolation\": \"linear\",\n \"stack\": \"off\",\n \"version\": \"3.0.0\"\n },\n \"datasourceCate\": \"prometheus\",\n \"datasourceValue\": \"${DS_DORIS}\",\n \"description\": \"Cumulative compaction rate of Backends.\\nRight Y axes indicates the total cumulative compaction bytes.\",\n \"id\": \"111d1ab7-f1ad-4de3-be45-9015d0ca1967\",\n \"layout\": {\n \"h\": 5,\n \"i\": \"111d1ab7-f1ad-4de3-be45-9015d0ca1967\",\n \"isResizable\": true,\n \"w\": 12,\n \"x\": 12,\n \"y\": 132\n },\n \"links\": [],\n \"maxPerRow\": 4,\n \"name\": \"[$cluster_name] BE Compaction Cumulate\",\n \"options\": {\n \"legend\": {\n \"displayMode\": \"hidden\"\n },\n \"thresholds\": {\n \"steps\": [\n {\n \"color\": \"#6C53B1\",\n \"type\": \"base\",\n \"value\": null\n }\n ]\n },\n \"tooltip\": {\n \"mode\": \"all\",\n \"sort\": \"none\"\n }\n },\n \"targets\": [\n {\n \"expr\": \"rate(doris_be_compaction_bytes_total{type=\\\"cumulative\\\", job=\\\"$cluster_name\\\"}[$interval])\",\n \"legend\": \"{{instance}}\",\n \"refId\": \"A\"\n },\n {\n \"expr\": \"SUM(doris_be_compaction_bytes_total{type=\\\"cumulative\\\", job=\\\"$cluster_name\\\"})\",\n \"legend\": \"Total\",\n \"refId\": \"B\"\n }\n ],\n \"type\": \"timeseries\",\n \"version\": \"3.0.0\"\n },\n {\n \"custom\": {\n \"drawStyle\": \"lines\",\n \"fillOpacity\": 0,\n \"lineInterpolation\": \"linear\",\n \"stack\": \"off\",\n \"version\": \"3.0.0\"\n },\n \"datasourceCate\": \"prometheus\",\n \"datasourceValue\": \"${DS_DORIS}\",\n \"description\": \"Loading rate of Backends.\\nThis indicates the rate of file downloading in LOADING state of load job(MINI and BROKER load).\\nRight Y axes indicates the total rate of file downloading.\",\n \"id\": \"5ee12bf7-aaab-4f49-baa7-406c3782239d\",\n \"layout\": {\n \"h\": 5,\n \"i\": \"5ee12bf7-aaab-4f49-baa7-406c3782239d\",\n \"isResizable\": true,\n \"w\": 12,\n \"x\": 0,\n \"y\": 137\n },\n \"links\": [],\n \"maxPerRow\": 4,\n \"name\": \"[$cluster_name] BE Push Bytes\",\n \"options\": {\n \"legend\": {\n \"displayMode\": \"hidden\"\n },\n \"thresholds\": {\n \"steps\": [\n {\n \"color\": \"#6C53B1\",\n \"type\": \"base\",\n \"value\": null\n }\n ]\n },\n \"tooltip\": {\n \"mode\": \"all\",\n \"sort\": \"none\"\n }\n },\n \"targets\": [\n {\n \"expr\": \"rate(doris_be_push_request_write_bytes{job=\\\"$cluster_name\\\"}[$interval])\",\n \"legend\": \"{{instance}}\",\n \"refId\": \"A\"\n },\n {\n \"expr\": \"sum(rate(doris_be_push_request_write_bytes{job=\\\"$cluster_name\\\"}[$interval]))\",\n \"legend\": \"Total rate\",\n \"refId\": \"B\"\n }\n ],\n \"type\": \"timeseries\",\n \"version\": \"3.0.0\"\n },\n {\n \"custom\": {\n \"drawStyle\": \"lines\",\n \"fillOpacity\": 0,\n \"lineInterpolation\": \"linear\",\n \"stack\": \"off\",\n \"version\": \"3.0.0\"\n },\n \"datasourceCate\": \"prometheus\",\n \"datasourceValue\": \"${DS_DORIS}\",\n \"description\": \"Loading rows rate of Backends.\\nThis indicates the rate of rows loaded in LOADING state of load job. Right Y axes shows the total push rate of cluster.\",\n \"id\": \"ba09e247-7df0-42f5-9f08-2352e54a0644\",\n \"layout\": {\n \"h\": 5,\n \"i\": \"ba09e247-7df0-42f5-9f08-2352e54a0644\",\n \"isResizable\": true,\n \"w\": 12,\n \"x\": 12,\n \"y\": 137\n },\n \"links\": [],\n \"maxPerRow\": 4,\n \"name\": \"[$cluster_name] BE Push Rows\",\n \"options\": {\n \"legend\": {\n \"displayMode\": \"hidden\"\n },\n \"thresholds\": {\n \"steps\": [\n {\n \"color\": \"#6C53B1\",\n \"type\": \"base\",\n \"value\": null\n }\n ]\n },\n \"tooltip\": {\n \"mode\": \"all\",\n \"sort\": \"none\"\n }\n },\n \"targets\": [\n {\n \"expr\": \"rate(doris_be_push_request_write_rows{job=\\\"$cluster_name\\\"}[$interval])\",\n \"legend\": \"{{instance}}\",\n \"refId\": \"A\"\n },\n {\n \"expr\": \"sum(rate(doris_be_push_request_write_rows{job=\\\"$cluster_name\\\"}[$interval]))\",\n \"legend\": \"Total\",\n \"refId\": \"B\"\n }\n ],\n \"type\": \"timeseries\",\n \"version\": \"3.0.0\"\n },\n {\n \"custom\": {\n \"drawStyle\": \"lines\",\n \"fillOpacity\": 0,\n \"lineInterpolation\": \"linear\",\n \"stack\": \"off\",\n \"version\": \"3.0.0\"\n },\n \"datasourceCate\": \"prometheus\",\n \"datasourceValue\": \"${DS_DORIS}\",\n \"description\": \"Left Y axes shows the write rate of tablet header saved in rocksdb. Right Y axes shows the duration of each write operation.\",\n \"id\": \"579dbc8d-11a0-4eda-b5f0-3e8f89d26268\",\n \"layout\": {\n \"h\": 10,\n \"i\": \"579dbc8d-11a0-4eda-b5f0-3e8f89d26268\",\n \"isResizable\": true,\n \"w\": 12,\n \"x\": 0,\n \"y\": 142\n },\n \"links\": [],\n \"maxPerRow\": 4,\n \"name\": \"[$cluster_name] Tablet Meta Write\",\n \"options\": {\n \"legend\": {\n \"displayMode\": \"hidden\"\n },\n \"thresholds\": {\n \"steps\": [\n {\n \"color\": \"#6C53B1\",\n \"type\": \"base\",\n \"value\": null\n }\n ]\n },\n \"tooltip\": {\n \"mode\": \"all\",\n \"sort\": \"none\"\n }\n },\n \"targets\": [\n {\n \"expr\": \"irate(doris_be_meta_request_total{job=\\\"$cluster_name\\\", type=\\\"write\\\"}[$interval])\",\n \"legend\": \"{{instance}}-rate\",\n \"refId\": \"B\"\n },\n {\n \"expr\": \"doris_be_meta_request_duration{job=\\\"$cluster_name\\\", type=\\\"write\\\"} / doris_be_meta_request_total{job=\\\"$cluster_name\\\", type=\\\"write\\\"}\",\n \"legend\": \"{{instance}}-latency\",\n \"refId\": \"A\"\n }\n ],\n \"type\": \"timeseries\",\n \"version\": \"3.0.0\"\n },\n {\n \"custom\": {\n \"drawStyle\": \"lines\",\n \"fillOpacity\": 0,\n \"lineInterpolation\": \"linear\",\n \"stack\": \"off\",\n \"version\": \"3.0.0\"\n },\n \"datasourceCate\": \"prometheus\",\n \"datasourceValue\": \"${DS_DORIS}\",\n \"description\": \"Scan rows rate of Backends.\\nThis indicates the read rows rate when processing queries.\",\n \"id\": \"24202a67-6d39-42b1-afb8-b1058ab6da0c\",\n \"layout\": {\n \"h\": 5,\n \"i\": \"24202a67-6d39-42b1-afb8-b1058ab6da0c\",\n \"isResizable\": true,\n \"w\": 12,\n \"x\": 12,\n \"y\": 142\n },\n \"links\": [],\n \"maxPerRow\": 4,\n \"name\": \"[$cluster_name] BE Scan Rows\",\n \"options\": {\n \"legend\": {\n \"displayMode\": \"hidden\"\n },\n \"thresholds\": {\n \"steps\": [\n {\n \"color\": \"#6C53B1\",\n \"type\": \"base\",\n \"value\": null\n }\n ]\n },\n \"tooltip\": {\n \"mode\": \"all\",\n \"sort\": \"none\"\n }\n },\n \"targets\": [\n {\n \"expr\": \"rate(doris_be_query_scan_rows{job=\\\"$cluster_name\\\"}[$interval])\",\n \"legend\": \"{{instance}}\",\n \"refId\": \"A\"\n }\n ],\n \"type\": \"timeseries\",\n \"version\": \"3.0.0\"\n },\n {\n \"custom\": {\n \"drawStyle\": \"lines\",\n \"fillOpacity\": 0,\n \"lineInterpolation\": \"linear\",\n \"stack\": \"off\",\n \"version\": \"3.0.0\"\n },\n \"datasourceCate\": \"prometheus\",\n \"datasourceValue\": \"${DS_DORIS}\",\n \"description\": \"Left Y axes shows the read rate of tablet header saved in rocksdb. Right Y axes shows the duration of each read operation.\",\n \"id\": \"d00679d1-d426-4848-ad94-c51ddae6e46f\",\n \"layout\": {\n \"h\": 5,\n \"i\": \"d00679d1-d426-4848-ad94-c51ddae6e46f\",\n \"isResizable\": true,\n \"w\": 12,\n \"x\": 12,\n \"y\": 147\n },\n \"links\": [],\n \"maxPerRow\": 4,\n \"name\": \"[$cluster_name] Tablet Meta Read\",\n \"options\": {\n \"legend\": {\n \"displayMode\": \"hidden\"\n },\n \"thresholds\": {\n \"steps\": [\n {\n \"color\": \"#6C53B1\",\n \"type\": \"base\",\n \"value\": null\n }\n ]\n },\n \"tooltip\": {\n \"mode\": \"all\",\n \"sort\": \"none\"\n }\n },\n \"targets\": [\n {\n \"expr\": \"irate(doris_be_meta_request_total{job=\\\"$cluster_name\\\", type=\\\"read\\\"}[$interval])\",\n \"legend\": \"{{instance}}-rate\",\n \"refId\": \"B\"\n },\n {\n \"expr\": \"doris_be_meta_request_duration{job=\\\"$cluster_name\\\", type=\\\"read\\\"} / doris_be_meta_request_total{job=\\\"$cluster_name\\\", type=\\\"read\\\"}\",\n \"legend\": \"{{instance}}-latency\",\n \"refId\": \"A\"\n }\n ],\n \"type\": \"timeseries\",\n \"version\": \"3.0.0\"\n },\n {\n \"collapsed\": true,\n \"id\": \"c0a6e025-7ed2-4a81-9459-ce37715aede9\",\n \"layout\": {\n \"h\": 1,\n \"i\": \"c0a6e025-7ed2-4a81-9459-ce37715aede9\",\n \"isResizable\": false,\n \"w\": 24,\n \"x\": 0,\n \"y\": 152\n },\n \"name\": \"BE tasks\",\n \"panels\": [],\n \"type\": \"row\",\n \"version\": \"3.0.0\"\n },\n {\n \"custom\": {\n \"drawStyle\": \"lines\",\n \"fillOpacity\": 0,\n \"lineInterpolation\": \"linear\",\n \"stack\": \"off\",\n \"version\": \"3.0.0\"\n },\n \"datasourceCate\": \"prometheus\",\n \"datasourceValue\": \"${DS_DORIS}\",\n \"description\": \"Left Y axes indicates the failure rate of specified tasks. Normally, it should be 0.\\nRight Y axes indicates the total number of specified tasks in all Backends.\",\n \"id\": \"100bce80-d34a-4244-8b85-627499710294\",\n \"layout\": {\n \"h\": 6,\n \"i\": \"100bce80-d34a-4244-8b85-627499710294\",\n \"isResizable\": true,\n \"w\": 8,\n \"x\": 0,\n \"y\": 153\n },\n \"links\": [],\n \"maxPerRow\": 4,\n \"name\": \"[$cluster_name] Tablets Report\",\n \"options\": {\n \"legend\": {\n \"displayMode\": \"hidden\"\n },\n \"thresholds\": {\n \"steps\": [\n {\n \"color\": \"#6C53B1\",\n \"type\": \"base\",\n \"value\": null\n }\n ]\n },\n \"tooltip\": {\n \"mode\": \"all\",\n \"sort\": \"none\"\n }\n },\n \"targets\": [\n {\n \"expr\": \"SUM(doris_be_engine_requests_total{job=\\\"$cluster_name\\\", type=\\\"report_all_tablets\\\", status=\\\"total\\\"})\",\n \"legend\": \"Total\",\n \"refId\": \"A\"\n },\n {\n \"expr\": \"irate(doris_be_engine_requests_total{job=\\\"$cluster_name\\\", type=\\\"report_all_tablets\\\", status=\\\"failed\\\"}[$interval])\",\n \"legend\": \"{{instance}}\",\n \"refId\": \"B\"\n }\n ],\n \"type\": \"timeseries\",\n \"version\": \"3.0.0\"\n },\n {\n \"custom\": {\n \"drawStyle\": \"lines\",\n \"fillOpacity\": 0,\n \"lineInterpolation\": \"linear\",\n \"stack\": \"off\",\n \"version\": \"3.0.0\"\n },\n \"datasourceCate\": \"prometheus\",\n \"datasourceValue\": \"${DS_DORIS}\",\n \"description\": \"Left Y axes indicates the failure rate of specified tasks. Normally, it should be 0.\\nRight Y axes indicates the total number of specified tasks in all Backends.\",\n \"id\": \"62b0082f-e377-43f5-a0e5-98049379d152\",\n \"layout\": {\n \"h\": 6,\n \"i\": \"62b0082f-e377-43f5-a0e5-98049379d152\",\n \"isResizable\": true,\n \"w\": 8,\n \"x\": 8,\n \"y\": 153\n },\n \"links\": [],\n \"maxPerRow\": 4,\n \"name\": \"[$cluster_name] Single Tablet Report\",\n \"options\": {\n \"legend\": {\n \"displayMode\": \"hidden\"\n },\n \"thresholds\": {\n \"steps\": [\n {\n \"color\": \"#6C53B1\",\n \"type\": \"base\",\n \"value\": null\n }\n ]\n },\n \"tooltip\": {\n \"mode\": \"all\",\n \"sort\": \"none\"\n }\n },\n \"targets\": [\n {\n \"expr\": \"SUM(doris_be_engine_requests_total{job=\\\"$cluster_name\\\", type=\\\"report_tablet\\\", status=\\\"total\\\"})\",\n \"legend\": \"Total\",\n \"refId\": \"A\"\n },\n {\n \"expr\": \"irate(doris_be_engine_requests_total{job=\\\"$cluster_name\\\", type=\\\"report_tablet\\\", status=\\\"failed\\\"}[$interval])\",\n \"legend\": \"{{instance}}\",\n \"refId\": \"B\"\n }\n ],\n \"type\": \"timeseries\",\n \"version\": \"3.0.0\"\n },\n {\n \"custom\": {\n \"drawStyle\": \"lines\",\n \"fillOpacity\": 0,\n \"lineInterpolation\": \"linear\",\n \"stack\": \"off\",\n \"version\": \"3.0.0\"\n },\n \"datasourceCate\": \"prometheus\",\n \"datasourceValue\": \"${DS_DORIS}\",\n \"description\": \"Left Y axes indicates the failure rate of specified tasks. Normally, it should be 0.\\nRight Y axes indicates the total number of specified tasks in all Backends.\",\n \"id\": \"bd866f1a-7bfb-44d0-a4b4-4f4f2b2cd267\",\n \"layout\": {\n \"h\": 6,\n \"i\": \"bd866f1a-7bfb-44d0-a4b4-4f4f2b2cd267\",\n \"isResizable\": true,\n \"w\": 8,\n \"x\": 16,\n \"y\": 153\n },\n \"links\": [],\n \"maxPerRow\": 4,\n \"name\": \"[$cluster_name] Finish task report\",\n \"options\": {\n \"legend\": {\n \"displayMode\": \"hidden\"\n },\n \"thresholds\": {\n \"steps\": [\n {\n \"color\": \"#6C53B1\",\n \"type\": \"base\",\n \"value\": null\n }\n ]\n },\n \"tooltip\": {\n \"mode\": \"all\",\n \"sort\": \"none\"\n }\n },\n \"targets\": [\n {\n \"expr\": \"SUM(doris_be_engine_requests_total{job=\\\"$cluster_name\\\", type=\\\"finish_task\\\", status=\\\"total\\\"})\",\n \"legend\": \"Total\",\n \"refId\": \"A\"\n },\n {\n \"expr\": \"irate(doris_be_engine_requests_total{job=\\\"$cluster_name\\\", type=\\\"finish_task\\\", status=\\\"failed\\\"}[$interval])\",\n \"legend\": \"{{instance}}\",\n \"refId\": \"B\"\n }\n ],\n \"type\": \"timeseries\",\n \"version\": \"3.0.0\"\n },\n {\n \"custom\": {\n \"drawStyle\": \"lines\",\n \"fillOpacity\": 0,\n \"lineInterpolation\": \"linear\",\n \"stack\": \"off\",\n \"version\": \"3.0.0\"\n },\n \"datasourceCate\": \"prometheus\",\n \"datasourceValue\": \"${DS_DORIS}\",\n \"description\": \"Left Y axes indicates the failure rate of specified tasks. Normally, it should be 0.\\nRight Y axes indicates the total number of specified tasks in all Backends.\",\n \"id\": \"b22c2e79-a7fa-4675-a256-6e032ecd9b74\",\n \"layout\": {\n \"h\": 6,\n \"i\": \"b22c2e79-a7fa-4675-a256-6e032ecd9b74\",\n \"isResizable\": true,\n \"w\": 8,\n \"x\": 0,\n \"y\": 159\n },\n \"links\": [],\n \"maxPerRow\": 4,\n \"name\": \"[$cluster_name] Push Task\",\n \"options\": {\n \"legend\": {\n \"displayMode\": \"hidden\"\n },\n \"thresholds\": {\n \"steps\": [\n {\n \"color\": \"#6C53B1\",\n \"type\": \"base\",\n \"value\": null\n }\n ]\n },\n \"tooltip\": {\n \"mode\": \"all\",\n \"sort\": \"none\"\n }\n },\n \"targets\": [\n {\n \"expr\": \"sum(doris_be_push_requests_total{job=\\\"$cluster_name\\\", status=\\\"SUCCESS\\\"})\",\n \"legend\": \"Total\",\n \"refId\": \"A\"\n },\n {\n \"expr\": \"irate(doris_be_push_requests_total{job=\\\"$cluster_name\\\", status=\\\"FAIL\\\"}[$interval])\",\n \"legend\": \"{{instance}}-failed\",\n \"refId\": \"B\"\n }\n ],\n \"type\": \"timeseries\",\n \"version\": \"3.0.0\"\n },\n {\n \"custom\": {\n \"drawStyle\": \"lines\",\n \"fillOpacity\": 0,\n \"lineInterpolation\": \"linear\",\n \"stack\": \"off\",\n \"version\": \"3.0.0\"\n },\n \"datasourceCate\": \"prometheus\",\n \"datasourceValue\": \"${DS_DORIS}\",\n \"description\": \"The average cost time of push tasks on each Backend.\",\n \"id\": \"94ca89bb-8c46-4f30-8ac3-14981b09208d\",\n \"layout\": {\n \"h\": 6,\n \"i\": \"94ca89bb-8c46-4f30-8ac3-14981b09208d\",\n \"isResizable\": true,\n \"w\": 8,\n \"x\": 8,\n \"y\": 159\n },\n \"links\": [],\n \"maxPerRow\": 4,\n \"name\": \"[$cluster_name] Push Task Cost Time\",\n \"options\": {\n \"legend\": {\n \"displayMode\": \"hidden\"\n },\n \"thresholds\": {\n \"steps\": [\n {\n \"color\": \"#6C53B1\",\n \"type\": \"base\",\n \"value\": null\n }\n ]\n },\n \"tooltip\": {\n \"mode\": \"all\",\n \"sort\": \"none\"\n }\n },\n \"targets\": [\n {\n \"expr\": \"irate(doris_be_push_request_duration_us{job=\\\"$cluster_name\\\"}[$interval])\",\n \"legend\": \"{{instance}}\",\n \"refId\": \"A\"\n }\n ],\n \"type\": \"timeseries\",\n \"version\": \"3.0.0\"\n },\n {\n \"custom\": {\n \"drawStyle\": \"lines\",\n \"fillOpacity\": 0,\n \"lineInterpolation\": \"linear\",\n \"stack\": \"off\",\n \"version\": \"3.0.0\"\n },\n \"datasourceCate\": \"prometheus\",\n \"datasourceValue\": \"${DS_DORIS}\",\n \"description\": \"Left Y axes indicates the failure rate of specified tasks. Normally, it should be 0.\\nRight Y axes indicates the total number of specified tasks in all Backends.\",\n \"id\": \"d2df89c0-808c-4032-8f69-473e02645208\",\n \"layout\": {\n \"h\": 6,\n \"i\": \"d2df89c0-808c-4032-8f69-473e02645208\",\n \"isResizable\": true,\n \"w\": 8,\n \"x\": 16,\n \"y\": 159\n },\n \"links\": [],\n \"maxPerRow\": 4,\n \"name\": \"[$cluster_name] Delete\",\n \"options\": {\n \"legend\": {\n \"displayMode\": \"hidden\"\n },\n \"thresholds\": {\n \"steps\": [\n {\n \"color\": \"#6C53B1\",\n \"type\": \"base\",\n \"value\": null\n }\n ]\n },\n \"tooltip\": {\n \"mode\": \"all\",\n \"sort\": \"none\"\n }\n },\n \"targets\": [\n {\n \"expr\": \"SUM(doris_be_engine_requests_total{job=\\\"$cluster_name\\\", type=\\\"delete\\\", status=\\\"total\\\"})\",\n \"legend\": \"Total\",\n \"refId\": \"A\"\n },\n {\n \"expr\": \"irate(doris_be_engine_requests_total{job=\\\"$cluster_name\\\", type=\\\"delete\\\", status=\\\"failed\\\"}[$interval])\",\n \"legend\": \"{{instance}}\",\n \"refId\": \"B\"\n }\n ],\n \"type\": \"timeseries\",\n \"version\": \"3.0.0\"\n },\n {\n \"custom\": {\n \"drawStyle\": \"lines\",\n \"fillOpacity\": 0,\n \"lineInterpolation\": \"linear\",\n \"stack\": \"off\",\n \"version\": \"3.0.0\"\n },\n \"datasourceCate\": \"prometheus\",\n \"datasourceValue\": \"${DS_DORIS}\",\n \"description\": \"Left Y axes indicates the failure rate of specified tasks. Normally, it should be 0.\\nRight Y axes indicates the total number of specified tasks in all Backends.\",\n \"id\": \"360dd4ef-b945-4948-8c3c-73311392380d\",\n \"layout\": {\n \"h\": 6,\n \"i\": \"360dd4ef-b945-4948-8c3c-73311392380d\",\n \"isResizable\": true,\n \"w\": 8,\n \"x\": 0,\n \"y\": 165\n },\n \"links\": [],\n \"maxPerRow\": 4,\n \"name\": \"[$cluster_name] Base Compaction\",\n \"options\": {\n \"legend\": {\n \"displayMode\": \"hidden\"\n },\n \"thresholds\": {\n \"steps\": [\n {\n \"color\": \"#6C53B1\",\n \"type\": \"base\",\n \"value\": null\n }\n ]\n },\n \"tooltip\": {\n \"mode\": \"all\",\n \"sort\": \"none\"\n }\n },\n \"targets\": [\n {\n \"expr\": \"SUM(doris_be_engine_requests_total{job=\\\"$cluster_name\\\", type=\\\"base_compaction\\\", status=\\\"total\\\"})\",\n \"legend\": \"Total\",\n \"refId\": \"A\"\n },\n {\n \"expr\": \"irate(doris_be_engine_requests_total{job=\\\"$cluster_name\\\", type=\\\"base_compaction\\\", status=\\\"failed\\\"}[$interval])\",\n \"legend\": \"{{instance}}\",\n \"refId\": \"B\"\n }\n ],\n \"type\": \"timeseries\",\n \"version\": \"3.0.0\"\n },\n {\n \"custom\": {\n \"drawStyle\": \"lines\",\n \"fillOpacity\": 0,\n \"lineInterpolation\": \"linear\",\n \"stack\": \"off\",\n \"version\": \"3.0.0\"\n },\n \"datasourceCate\": \"prometheus\",\n \"datasourceValue\": \"${DS_DORIS}\",\n \"description\": \"Left Y axes indicates the failure rate of specified tasks. Normally, it should be 0.\\nRight Y axes indicates the total number of specified tasks in all Backends.\",\n \"id\": \"f532a20d-6207-4287-a656-a86347f84e69\",\n \"layout\": {\n \"h\": 6,\n \"i\": \"f532a20d-6207-4287-a656-a86347f84e69\",\n \"isResizable\": true,\n \"w\": 8,\n \"x\": 8,\n \"y\": 165\n },\n \"links\": [],\n \"maxPerRow\": 4,\n \"name\": \"[$cluster_name] Cumulative Compaction\",\n \"options\": {\n \"legend\": {\n \"displayMode\": \"hidden\"\n },\n \"thresholds\": {\n \"steps\": [\n {\n \"color\": \"#6C53B1\",\n \"type\": \"base\",\n \"value\": null\n }\n ]\n },\n \"tooltip\": {\n \"mode\": \"all\",\n \"sort\": \"none\"\n }\n },\n \"targets\": [\n {\n \"expr\": \"SUM(doris_be_engine_requests_total{job=\\\"$cluster_name\\\", type=\\\"cumulative_compaction\\\", status=\\\"total\\\"})\",\n \"legend\": \"Total\",\n \"refId\": \"A\"\n },\n {\n \"expr\": \"irate(doris_be_engine_requests_total{job=\\\"$cluster_name\\\", type=\\\"cumulative_compaction\\\", status=\\\"failed\\\"}[$interval])\",\n \"legend\": \"{{instance}}\",\n \"refId\": \"B\"\n }\n ],\n \"type\": \"timeseries\",\n \"version\": \"3.0.0\"\n },\n {\n \"custom\": {\n \"drawStyle\": \"lines\",\n \"fillOpacity\": 0,\n \"lineInterpolation\": \"linear\",\n \"stack\": \"off\",\n \"version\": \"3.0.0\"\n },\n \"datasourceCate\": \"prometheus\",\n \"datasourceValue\": \"${DS_DORIS}\",\n \"description\": \"Left Y axes indicates the failure rate of specified tasks. Normally, it should be 0.\\nRight Y axes indicates the total number of specified tasks in all Backends.\",\n \"id\": \"e38c661a-ebd5-461d-8821-e2a29fc5fffb\",\n \"layout\": {\n \"h\": 6,\n \"i\": \"e38c661a-ebd5-461d-8821-e2a29fc5fffb\",\n \"isResizable\": true,\n \"w\": 8,\n \"x\": 16,\n \"y\": 165\n },\n \"links\": [],\n \"maxPerRow\": 4,\n \"name\": \"[$cluster_name] Clone\",\n \"options\": {\n \"legend\": {\n \"displayMode\": \"hidden\"\n },\n \"thresholds\": {\n \"steps\": [\n {\n \"color\": \"#6C53B1\",\n \"type\": \"base\",\n \"value\": null\n }\n ]\n },\n \"tooltip\": {\n \"mode\": \"all\",\n \"sort\": \"none\"\n }\n },\n \"targets\": [\n {\n \"expr\": \"SUM(doris_be_engine_requests_total{job=\\\"$cluster_name\\\", type=\\\"clone\\\", status=\\\"total\\\"})\",\n \"legend\": \"Total\",\n \"refId\": \"A\"\n },\n {\n \"expr\": \"irate(doris_be_engine_requests_total{job=\\\"$cluster_name\\\", type=\\\"clone\\\", status=\\\"failed\\\"}[$interval])\",\n \"legend\": \"{{instance}}\",\n \"refId\": \"B\"\n }\n ],\n \"type\": \"timeseries\",\n \"version\": \"3.0.0\"\n },\n {\n \"custom\": {\n \"drawStyle\": \"lines\",\n \"fillOpacity\": 0,\n \"lineInterpolation\": \"linear\",\n \"stack\": \"off\",\n \"version\": \"3.0.0\"\n },\n \"datasourceCate\": \"prometheus\",\n \"datasourceValue\": \"${DS_DORIS}\",\n \"description\": \"Left Y axes indicates the failure rate of specified tasks. Normally, it should be 0.\\nRight Y axes indicates the total number of specified tasks in all Backends.\",\n \"id\": \"6f07f466-a195-4232-ba97-4694e4d74f4c\",\n \"layout\": {\n \"h\": 6,\n \"i\": \"6f07f466-a195-4232-ba97-4694e4d74f4c\",\n \"isResizable\": true,\n \"w\": 8,\n \"x\": 0,\n \"y\": 171\n },\n \"links\": [],\n \"maxPerRow\": 4,\n \"name\": \"[$cluster_name] Create rollup\",\n \"options\": {\n \"legend\": {\n \"displayMode\": \"hidden\"\n },\n \"thresholds\": {\n \"steps\": [\n {\n \"color\": \"#6C53B1\",\n \"type\": \"base\",\n \"value\": null\n }\n ]\n },\n \"tooltip\": {\n \"mode\": \"all\",\n \"sort\": \"none\"\n }\n },\n \"targets\": [\n {\n \"expr\": \"SUM(doris_be_engine_requests_total{job=\\\"$cluster_name\\\", type=\\\"create_rollup\\\", status=\\\"total\\\"})\",\n \"legend\": \"Total\",\n \"refId\": \"A\"\n },\n {\n \"expr\": \"irate(doris_be_engine_requests_total{job=\\\"$cluster_name\\\", type=\\\"create_rollup\\\", status=\\\"failed\\\"}[$interval])\",\n \"legend\": \"{{instance}}\",\n \"refId\": \"B\"\n }\n ],\n \"type\": \"timeseries\",\n \"version\": \"3.0.0\"\n },\n {\n \"custom\": {\n \"drawStyle\": \"lines\",\n \"fillOpacity\": 0,\n \"lineInterpolation\": \"linear\",\n \"stack\": \"off\",\n \"version\": \"3.0.0\"\n },\n \"datasourceCate\": \"prometheus\",\n \"datasourceValue\": \"${DS_DORIS}\",\n \"description\": \"Left Y axes indicates the failure rate of specified tasks. Normally, it should be 0.\\nRight Y axes indicates the total number of specified tasks in all Backends.\",\n \"id\": \"f79f8151-34dc-4f8c-a08c-1c0af04cd0b7\",\n \"layout\": {\n \"h\": 6,\n \"i\": \"f79f8151-34dc-4f8c-a08c-1c0af04cd0b7\",\n \"isResizable\": true,\n \"w\": 8,\n \"x\": 8,\n \"y\": 171\n },\n \"links\": [],\n \"maxPerRow\": 4,\n \"name\": \"[$cluster_name] Schema change\",\n \"options\": {\n \"legend\": {\n \"displayMode\": \"hidden\"\n },\n \"thresholds\": {\n \"steps\": [\n {\n \"color\": \"#6C53B1\",\n \"type\": \"base\",\n \"value\": null\n }\n ]\n },\n \"tooltip\": {\n \"mode\": \"all\",\n \"sort\": \"none\"\n }\n },\n \"targets\": [\n {\n \"expr\": \"SUM(doris_be_engine_requests_total{job=\\\"$cluster_name\\\", type=\\\"schema_change\\\", status=\\\"total\\\"})\",\n \"legend\": \"Total\",\n \"refId\": \"A\"\n },\n {\n \"expr\": \"irate(doris_be_engine_requests_total{job=\\\"$cluster_name\\\", type=\\\"schema_change\\\", status=\\\"failed\\\"}[$interval])\",\n \"legend\": \"{{instance}}\",\n \"refId\": \"B\"\n }\n ],\n \"type\": \"timeseries\",\n \"version\": \"3.0.0\"\n },\n {\n \"custom\": {\n \"drawStyle\": \"lines\",\n \"fillOpacity\": 0,\n \"lineInterpolation\": \"linear\",\n \"stack\": \"off\",\n \"version\": \"3.0.0\"\n },\n \"datasourceCate\": \"prometheus\",\n \"datasourceValue\": \"${DS_DORIS}\",\n \"description\": \"Left Y axes indicates the failure rate of specified tasks. Normally, it should be 0.\\nRight Y axes indicates the total number of specified tasks in all Backends.\",\n \"id\": \"fe07e069-210e-410c-9781-d71bf4086803\",\n \"layout\": {\n \"h\": 6,\n \"i\": \"fe07e069-210e-410c-9781-d71bf4086803\",\n \"isResizable\": true,\n \"w\": 8,\n \"x\": 16,\n \"y\": 171\n },\n \"links\": [],\n \"maxPerRow\": 4,\n \"name\": \"[$cluster_name] Create tablet\",\n \"options\": {\n \"legend\": {\n \"displayMode\": \"hidden\"\n },\n \"thresholds\": {\n \"steps\": [\n {\n \"color\": \"#6C53B1\",\n \"type\": \"base\",\n \"value\": null\n }\n ]\n },\n \"tooltip\": {\n \"mode\": \"all\",\n \"sort\": \"none\"\n }\n },\n \"targets\": [\n {\n \"expr\": \"SUM(doris_be_engine_requests_total{job=\\\"$cluster_name\\\", type=\\\"create_tablet\\\", status=\\\"total\\\"})\",\n \"legend\": \"Total\",\n \"refId\": \"A\"\n },\n {\n \"expr\": \"irate(doris_be_engine_requests_total{job=\\\"$cluster_name\\\", type=\\\"create_tablet\\\", status=\\\"failed\\\"}[$interval])\",\n \"legend\": \"{{instance}}\",\n \"refId\": \"B\"\n }\n ],\n \"type\": \"timeseries\",\n \"version\": \"3.0.0\"\n }\n ],\n \"var\": [\n {\n \"definition\": \"prometheus\",\n \"name\": \"DS_DORIS\",\n \"type\": \"datasource\"\n },\n {\n \"allOption\": false,\n \"datasource\": {\n \"cate\": \"prometheus\",\n \"value\": \"${DS_DORIS}\"\n },\n \"definition\": \"label_values(up, job)\",\n \"hide\": false,\n \"multi\": false,\n \"name\": \"cluster_name\",\n \"reg\": \"\",\n \"type\": \"query\"\n },\n {\n \"allOption\": false,\n \"datasource\": {\n \"cate\": \"prometheus\",\n \"value\": \"${DS_DORIS}\"\n },\n \"definition\": \"query_result(node_info{group=\\\"fe\\\", job=\\\"$cluster_name\\\", type=\\\"is_master\\\"})\",\n \"hide\": false,\n \"multi\": false,\n \"name\": \"fe_master\",\n \"reg\": \"/instance=\\\"(.+:\\\\d+)\\\"/\",\n \"type\": \"query\"\n },\n {\n \"allOption\": false,\n \"datasource\": {\n \"cate\": \"prometheus\",\n \"value\": \"${DS_DORIS}\"\n },\n \"definition\": \"up{group=\\\"fe\\\", job=\\\"$cluster_name\\\"}\",\n \"hide\": false,\n \"multi\": false,\n \"name\": \"fe_instance\",\n \"reg\": \"/instance=\\\"(.+:\\\\d+)/\",\n \"type\": \"query\"\n },\n {\n \"allOption\": false,\n \"datasource\": {\n \"cate\": \"prometheus\",\n \"value\": \"${DS_DORIS}\"\n },\n \"definition\": \"up{group=\\\"be\\\", job=\\\"$cluster_name\\\"}\",\n \"hide\": false,\n \"multi\": false,\n \"name\": \"be_instance\",\n \"reg\": \"/instance=\\\"(.+:\\\\d+)/\",\n \"type\": \"query\"\n },\n {\n \"definition\": \"1s,5s,1m,5m,1h,6h,1d\",\n \"hide\": false,\n \"name\": \"interval\",\n \"type\": \"custom\"\n }\n ],\n \"version\": \"3.0.0\"\n },\n \"uuid\": 1731586085431795000\n}"
},
{
"path": "integrations/Doris/markdown/README.md",
"content": "# Doris\n\nDoris 的进程都会暴露 `/metrics` 接口,通过这个接口暴露 Prometheus 协议的监控数据。\n\n## 采集配置\n\ncategraf 的 `conf/input.prometheus/prometheus.toml`。因为 Doris 是暴露的 Prometheus 协议的监控数据,所以使用 categraf 的 prometheus 插件即可采集。\n\n```toml\n# doris_fe\n[[instances]]\nurls = [\n \"http://127.0.0.1:8030/metrics\"\n]\n\nurl_label_key = \"instance\"\nurl_label_value = \"{{.Host}}\"\n\nlabels = { group = \"fe\",job = \"doris_cluster01\"}\n\n# doris_be\n[[instances]]\nurls = [\n \"http://127.0.0.1:8040/metrics\"\n]\nurl_label_key = \"instance\"\nurl_label_value = \"{{.Host}}\"\nlabels = { group = \"be\",job = \"doris_cluster01\"}\n```\n\n"
},
{
"path": "integrations/Elasticsearch/alerts/elasticsearch_by_categraf.json",
"content": "[\n {\n \"id\": 0,\n \"group_id\": 0,\n \"cate\": \"prometheus\",\n \"datasource_ids\": [\n 52\n ],\n \"cluster\": \"\",\n \"name\": \"Elastic Cluster Red status\",\n \"note\": \"\",\n \"prod\": \"metric\",\n \"algorithm\": \"\",\n \"algo_params\": null,\n \"delay\": 0,\n \"severity\": 1,\n \"severities\": [\n 1\n ],\n \"disabled\": 1,\n \"prom_for_duration\": 0,\n \"prom_ql\": \"\",\n \"rule_config\": {\n \"algo_params\": null,\n \"inhibit\": false,\n \"prom_ql\": \"\",\n \"queries\": [\n {\n \"prom_ql\": \" elasticsearch_cluster_health_status{color=\\\"red\\\"} == 1\",\n \"severity\": 1\n }\n ],\n \"severity\": 0\n },\n \"prom_eval_interval\": 15,\n \"enable_stime\": \"00:00\",\n \"enable_stimes\": [\n \"00:00\"\n ],\n \"enable_etime\": \"23:59\",\n \"enable_etimes\": [\n \"23:59\"\n ],\n \"enable_days_of_week\": [\n \"1\",\n \"2\",\n \"3\",\n \"4\",\n \"5\",\n \"6\",\n \"0\"\n ],\n \"enable_days_of_weeks\": [\n [\n \"1\",\n \"2\",\n \"3\",\n \"4\",\n \"5\",\n \"6\",\n \"0\"\n ]\n ],\n \"enable_in_bg\": 0,\n \"notify_recovered\": 1,\n \"notify_channels\": [],\n \"notify_groups_obj\": null,\n \"notify_groups\": null,\n \"notify_repeat_step\": 60,\n \"notify_max_number\": 0,\n \"recover_duration\": 0,\n \"callbacks\": [],\n \"runbook_url\": \"\",\n \"append_tags\": [\n \"alertname=ElasticsearchClusterRed\"\n ],\n \"annotations\": null,\n \"extra_config\": null,\n \"create_at\": 0,\n \"create_by\": \"\",\n \"update_at\": 0,\n \"update_by\": \"\",\n \"uuid\": 1717556327354100000\n },\n {\n \"id\": 0,\n \"group_id\": 0,\n \"cate\": \"prometheus\",\n \"datasource_ids\": [\n 52\n ],\n \"cluster\": \"\",\n \"name\": \"Elastic Cluster Yellow status\",\n \"note\": \"\",\n \"prod\": \"metric\",\n \"algorithm\": \"\",\n \"algo_params\": null,\n \"delay\": 0,\n \"severity\": 2,\n \"severities\": [\n 2\n ],\n \"disabled\": 1,\n \"prom_for_duration\": 0,\n \"prom_ql\": \"\",\n \"rule_config\": {\n \"algo_params\": null,\n \"inhibit\": false,\n \"prom_ql\": \"\",\n \"queries\": [\n {\n \"prom_ql\": \"elasticsearch_cluster_health_status{color=\\\"yellow\\\"} == 1\",\n \"severity\": 2\n }\n ],\n \"severity\": 0\n },\n \"prom_eval_interval\": 15,\n \"enable_stime\": \"00:00\",\n \"enable_stimes\": [\n \"00:00\"\n ],\n \"enable_etime\": \"23:59\",\n \"enable_etimes\": [\n \"23:59\"\n ],\n \"enable_days_of_week\": [\n \"1\",\n \"2\",\n \"3\",\n \"4\",\n \"5\",\n \"6\",\n \"0\"\n ],\n \"enable_days_of_weeks\": [\n [\n \"1\",\n \"2\",\n \"3\",\n \"4\",\n \"5\",\n \"6\",\n \"0\"\n ]\n ],\n \"enable_in_bg\": 0,\n \"notify_recovered\": 1,\n \"notify_channels\": [],\n \"notify_groups_obj\": null,\n \"notify_groups\": null,\n \"notify_repeat_step\": 60,\n \"notify_max_number\": 0,\n \"recover_duration\": 0,\n \"callbacks\": [],\n \"runbook_url\": \"\",\n \"append_tags\": [\n \"alertname=ElasticsearchClusterYellow\"\n ],\n \"annotations\": null,\n \"extra_config\": null,\n \"create_at\": 0,\n \"create_by\": \"\",\n \"update_at\": 0,\n \"update_by\": \"\",\n \"uuid\": 1717556327354616000\n },\n {\n \"id\": 0,\n \"group_id\": 0,\n \"cate\": \"prometheus\",\n \"datasource_ids\": [\n 52\n ],\n \"cluster\": \"\",\n \"name\": \"Elasticsearch disk out of space of the instance\",\n \"note\": \"\",\n \"prod\": \"metric\",\n \"algorithm\": \"\",\n \"algo_params\": null,\n \"delay\": 0,\n \"severity\": 1,\n \"severities\": [\n 1\n ],\n \"disabled\": 1,\n \"prom_for_duration\": 120,\n \"prom_ql\": \"\",\n \"rule_config\": {\n \"algo_params\": null,\n \"inhibit\": false,\n \"prom_ql\": \"\",\n \"queries\": [\n {\n \"prom_ql\": \"elasticsearch_filesystem_data_available_bytes / elasticsearch_filesystem_data_size_in_bytes * 100 \\u003c 10\",\n \"severity\": 1\n }\n ],\n \"severity\": 0\n },\n \"prom_eval_interval\": 15,\n \"enable_stime\": \"00:00\",\n \"enable_stimes\": [\n \"00:00\"\n ],\n \"enable_etime\": \"23:59\",\n \"enable_etimes\": [\n \"23:59\"\n ],\n \"enable_days_of_week\": [\n \"1\",\n \"2\",\n \"3\",\n \"4\",\n \"5\",\n \"6\",\n \"0\"\n ],\n \"enable_days_of_weeks\": [\n [\n \"1\",\n \"2\",\n \"3\",\n \"4\",\n \"5\",\n \"6\",\n \"0\"\n ]\n ],\n \"enable_in_bg\": 0,\n \"notify_recovered\": 1,\n \"notify_channels\": [],\n \"notify_groups_obj\": null,\n \"notify_groups\": null,\n \"notify_repeat_step\": 60,\n \"notify_max_number\": 0,\n \"recover_duration\": 0,\n \"callbacks\": [],\n \"runbook_url\": \"\",\n \"append_tags\": [\n \"alertname=ElasticsearchDiskOutOfSpace\"\n ],\n \"annotations\": null,\n \"extra_config\": null,\n \"create_at\": 0,\n \"create_by\": \"\",\n \"update_at\": 0,\n \"update_by\": \"\",\n \"uuid\": 1717556327355180000\n },\n {\n \"id\": 0,\n \"group_id\": 0,\n \"cate\": \"prometheus\",\n \"datasource_ids\": [\n 52\n ],\n \"cluster\": \"\",\n \"name\": \"Elasticsearch disk space low of the instance\",\n \"note\": \"\",\n \"prod\": \"metric\",\n \"algorithm\": \"\",\n \"algo_params\": null,\n \"delay\": 0,\n \"severity\": 2,\n \"severities\": [\n 2\n ],\n \"disabled\": 1,\n \"prom_for_duration\": 120,\n \"prom_ql\": \"\",\n \"rule_config\": {\n \"algo_params\": null,\n \"inhibit\": false,\n \"prom_ql\": \"\",\n \"queries\": [\n {\n \"prom_ql\": \"elasticsearch_filesystem_data_available_bytes / elasticsearch_filesystem_data_size_in_bytes * 100 \\u003c 20\",\n \"severity\": 2\n }\n ],\n \"severity\": 0\n },\n \"prom_eval_interval\": 15,\n \"enable_stime\": \"00:00\",\n \"enable_stimes\": [\n \"00:00\"\n ],\n \"enable_etime\": \"23:59\",\n \"enable_etimes\": [\n \"23:59\"\n ],\n \"enable_days_of_week\": [\n \"1\",\n \"2\",\n \"3\",\n \"4\",\n \"5\",\n \"6\",\n \"0\"\n ],\n \"enable_days_of_weeks\": [\n [\n \"1\",\n \"2\",\n \"3\",\n \"4\",\n \"5\",\n \"6\",\n \"0\"\n ]\n ],\n \"enable_in_bg\": 0,\n \"notify_recovered\": 1,\n \"notify_channels\": [],\n \"notify_groups_obj\": null,\n \"notify_groups\": null,\n \"notify_repeat_step\": 60,\n \"notify_max_number\": 0,\n \"recover_duration\": 0,\n \"callbacks\": [],\n \"runbook_url\": \"\",\n \"append_tags\": [\n \"alertname=ElasticsearchDiskSpaceLow\"\n ],\n \"annotations\": null,\n \"extra_config\": null,\n \"create_at\": 0,\n \"create_by\": \"\",\n \"update_at\": 0,\n \"update_by\": \"\",\n \"uuid\": 1717556327355686000\n },\n {\n \"id\": 0,\n \"group_id\": 0,\n \"cate\": \"prometheus\",\n \"datasource_ids\": [\n 52\n ],\n \"cluster\": \"\",\n \"name\": \"Elasticsearch Heap Usage Too High of the instance\",\n \"note\": \"\",\n \"prod\": \"metric\",\n \"algorithm\": \"\",\n \"algo_params\": null,\n \"delay\": 0,\n \"severity\": 1,\n \"severities\": [\n 1\n ],\n \"disabled\": 1,\n \"prom_for_duration\": 120,\n \"prom_ql\": \"\",\n \"rule_config\": {\n \"algo_params\": null,\n \"inhibit\": false,\n \"prom_ql\": \"\",\n \"queries\": [\n {\n \"prom_ql\": \"(elasticsearch_jvm_memory_used_bytes{area=\\\"heap\\\"} / elasticsearch_jvm_memory_max_bytes{area=\\\"heap\\\"}) * 100 \\u003e 90\",\n \"severity\": 1\n }\n ],\n \"severity\": 0\n },\n \"prom_eval_interval\": 15,\n \"enable_stime\": \"00:00\",\n \"enable_stimes\": [\n \"00:00\"\n ],\n \"enable_etime\": \"23:59\",\n \"enable_etimes\": [\n \"23:59\"\n ],\n \"enable_days_of_week\": [\n \"1\",\n \"2\",\n \"3\",\n \"4\",\n \"5\",\n \"6\",\n \"0\"\n ],\n \"enable_days_of_weeks\": [\n [\n \"1\",\n \"2\",\n \"3\",\n \"4\",\n \"5\",\n \"6\",\n \"0\"\n ]\n ],\n \"enable_in_bg\": 0,\n \"notify_recovered\": 1,\n \"notify_channels\": [],\n \"notify_groups_obj\": null,\n \"notify_groups\": null,\n \"notify_repeat_step\": 60,\n \"notify_max_number\": 0,\n \"recover_duration\": 0,\n \"callbacks\": [],\n \"runbook_url\": \"\",\n \"append_tags\": [\n \"alertname=ElasticsearchHeapUsageTooHigh\"\n ],\n \"annotations\": null,\n \"extra_config\": null,\n \"create_at\": 0,\n \"create_by\": \"\",\n \"update_at\": 0,\n \"update_by\": \"\",\n \"uuid\": 1717556327356156000\n },\n {\n \"id\": 0,\n \"group_id\": 0,\n \"cate\": \"prometheus\",\n \"datasource_ids\": [\n 52\n ],\n \"cluster\": \"\",\n \"name\": \"Elasticsearch Heap Usage warning of the instance\",\n \"note\": \"\",\n \"prod\": \"metric\",\n \"algorithm\": \"\",\n \"algo_params\": null,\n \"delay\": 0,\n \"severity\": 2,\n \"severities\": [\n 2\n ],\n \"disabled\": 1,\n \"prom_for_duration\": 120,\n \"prom_ql\": \"\",\n \"rule_config\": {\n \"algo_params\": null,\n \"inhibit\": false,\n \"prom_ql\": \"\",\n \"queries\": [\n {\n \"prom_ql\": \"(elasticsearch_jvm_memory_used_bytes{area=\\\"heap\\\"} / elasticsearch_jvm_memory_max_bytes{area=\\\"heap\\\"}) * 100 \\u003e 80\",\n \"severity\": 2\n }\n ],\n \"severity\": 0\n },\n \"prom_eval_interval\": 15,\n \"enable_stime\": \"00:00\",\n \"enable_stimes\": [\n \"00:00\"\n ],\n \"enable_etime\": \"23:59\",\n \"enable_etimes\": [\n \"23:59\"\n ],\n \"enable_days_of_week\": [\n \"1\",\n \"2\",\n \"3\",\n \"4\",\n \"5\",\n \"6\",\n \"0\"\n ],\n \"enable_days_of_weeks\": [\n [\n \"1\",\n \"2\",\n \"3\",\n \"4\",\n \"5\",\n \"6\",\n \"0\"\n ]\n ],\n \"enable_in_bg\": 0,\n \"notify_recovered\": 1,\n \"notify_channels\": [],\n \"notify_groups_obj\": null,\n \"notify_groups\": null,\n \"notify_repeat_step\": 60,\n \"notify_max_number\": 0,\n \"recover_duration\": 0,\n \"callbacks\": [],\n \"runbook_url\": \"\",\n \"append_tags\": [\n \"alertname=ElasticsearchHeapUsageWarning\"\n ],\n \"annotations\": null,\n \"extra_config\": null,\n \"create_at\": 0,\n \"create_by\": \"\",\n \"update_at\": 0,\n \"update_by\": \"\",\n \"uuid\": 1717556327356669000\n },\n {\n \"id\": 0,\n \"group_id\": 0,\n \"cate\": \"prometheus\",\n \"datasource_ids\": [\n 52\n ],\n \"cluster\": \"\",\n \"name\": \"Elasticsearch initializing shards of the instance\",\n \"note\": \"\",\n \"prod\": \"metric\",\n \"algorithm\": \"\",\n \"algo_params\": null,\n \"delay\": 0,\n \"severity\": 2,\n \"severities\": [\n 2\n ],\n \"disabled\": 1,\n \"prom_for_duration\": 900,\n \"prom_ql\": \"\",\n \"rule_config\": {\n \"algo_params\": null,\n \"inhibit\": false,\n \"prom_ql\": \"\",\n \"queries\": [\n {\n \"prom_ql\": \"elasticsearch_cluster_health_initializing_shards \\u003e 0\",\n \"severity\": 2\n }\n ],\n \"severity\": 0\n },\n \"prom_eval_interval\": 15,\n \"enable_stime\": \"00:00\",\n \"enable_stimes\": [\n \"00:00\"\n ],\n \"enable_etime\": \"23:59\",\n \"enable_etimes\": [\n \"23:59\"\n ],\n \"enable_days_of_week\": [\n \"1\",\n \"2\",\n \"3\",\n \"4\",\n \"5\",\n \"6\",\n \"0\"\n ],\n \"enable_days_of_weeks\": [\n [\n \"1\",\n \"2\",\n \"3\",\n \"4\",\n \"5\",\n \"6\",\n \"0\"\n ]\n ],\n \"enable_in_bg\": 0,\n \"notify_recovered\": 1,\n \"notify_channels\": [],\n \"notify_groups_obj\": null,\n \"notify_groups\": null,\n \"notify_repeat_step\": 60,\n \"notify_max_number\": 0,\n \"recover_duration\": 0,\n \"callbacks\": [],\n \"runbook_url\": \"\",\n \"append_tags\": [\n \"alertname=ElasticsearchInitializingShards\"\n ],\n \"annotations\": null,\n \"extra_config\": null,\n \"create_at\": 0,\n \"create_by\": \"\",\n \"update_at\": 0,\n \"update_by\": \"\",\n \"uuid\": 1717556327357308000\n },\n {\n \"id\": 0,\n \"group_id\": 0,\n \"cate\": \"prometheus\",\n \"datasource_ids\": [\n 52\n ],\n \"cluster\": \"\",\n \"name\": \"Elasticsearch no new documents of the instance\",\n \"note\": \"\",\n \"prod\": \"metric\",\n \"algorithm\": \"\",\n \"algo_params\": null,\n \"delay\": 0,\n \"severity\": 2,\n \"severities\": [\n 2\n ],\n \"disabled\": 1,\n \"prom_for_duration\": 300,\n \"prom_ql\": \"\",\n \"rule_config\": {\n \"algo_params\": null,\n \"inhibit\": false,\n \"prom_ql\": \"\",\n \"queries\": [\n {\n \"prom_ql\": \"rate(elasticsearch_indices_docs{es_data_node=\\\"true\\\"}[5m]) == 0\",\n \"severity\": 2\n }\n ],\n \"severity\": 0\n },\n \"prom_eval_interval\": 15,\n \"enable_stime\": \"00:00\",\n \"enable_stimes\": [\n \"00:00\"\n ],\n \"enable_etime\": \"23:59\",\n \"enable_etimes\": [\n \"23:59\"\n ],\n \"enable_days_of_week\": [\n \"1\",\n \"2\",\n \"3\",\n \"4\",\n \"5\",\n \"6\",\n \"0\"\n ],\n \"enable_days_of_weeks\": [\n [\n \"1\",\n \"2\",\n \"3\",\n \"4\",\n \"5\",\n \"6\",\n \"0\"\n ]\n ],\n \"enable_in_bg\": 0,\n \"notify_recovered\": 1,\n \"notify_channels\": [],\n \"notify_groups_obj\": null,\n \"notify_groups\": null,\n \"notify_repeat_step\": 60,\n \"notify_max_number\": 0,\n \"recover_duration\": 0,\n \"callbacks\": [],\n \"runbook_url\": \"\",\n \"append_tags\": [\n \"alertname=ElasticsearchNoNewDocuments\"\n ],\n \"annotations\": null,\n \"extra_config\": null,\n \"create_at\": 0,\n \"create_by\": \"\",\n \"update_at\": 0,\n \"update_by\": \"\",\n \"uuid\": 1717556327357752000\n },\n {\n \"id\": 0,\n \"group_id\": 0,\n \"cate\": \"prometheus\",\n \"datasource_ids\": [\n 52\n ],\n \"cluster\": \"\",\n \"name\": \"Elasticsearch pending tasks of the instance\",\n \"note\": \"\",\n \"prod\": \"metric\",\n \"algorithm\": \"\",\n \"algo_params\": null,\n \"delay\": 0,\n \"severity\": 2,\n \"severities\": [\n 2\n ],\n \"disabled\": 1,\n \"prom_for_duration\": 900,\n \"prom_ql\": \"\",\n \"rule_config\": {\n \"algo_params\": null,\n \"inhibit\": false,\n \"prom_ql\": \"\",\n \"queries\": [\n {\n \"prom_ql\": \"elasticsearch_cluster_health_number_of_pending_tasks \\u003e 0\",\n \"severity\": 2\n }\n ],\n \"severity\": 0\n },\n \"prom_eval_interval\": 15,\n \"enable_stime\": \"00:00\",\n \"enable_stimes\": [\n \"00:00\"\n ],\n \"enable_etime\": \"23:59\",\n \"enable_etimes\": [\n \"23:59\"\n ],\n \"enable_days_of_week\": [\n \"1\",\n \"2\",\n \"3\",\n \"4\",\n \"5\",\n \"6\",\n \"0\"\n ],\n \"enable_days_of_weeks\": [\n [\n \"1\",\n \"2\",\n \"3\",\n \"4\",\n \"5\",\n \"6\",\n \"0\"\n ]\n ],\n \"enable_in_bg\": 0,\n \"notify_recovered\": 1,\n \"notify_channels\": [],\n \"notify_groups_obj\": null,\n \"notify_groups\": null,\n \"notify_repeat_step\": 60,\n \"notify_max_number\": 0,\n \"recover_duration\": 0,\n \"callbacks\": [],\n \"runbook_url\": \"\",\n \"append_tags\": [\n \"alertname=ElasticsearchPendingTasks\"\n ],\n \"annotations\": null,\n \"extra_config\": null,\n \"create_at\": 0,\n \"create_by\": \"\",\n \"update_at\": 0,\n \"update_by\": \"\",\n \"uuid\": 1717556327358275000\n },\n {\n \"id\": 0,\n \"group_id\": 0,\n \"cate\": \"prometheus\",\n \"datasource_ids\": [\n 52\n ],\n \"cluster\": \"\",\n \"name\": \"Elasticsearch relocation shards of the instance\",\n \"note\": \"\",\n \"prod\": \"metric\",\n \"algorithm\": \"\",\n \"algo_params\": null,\n \"delay\": 0,\n \"severity\": 1,\n \"severities\": [\n 1\n ],\n \"disabled\": 1,\n \"prom_for_duration\": 900,\n \"prom_ql\": \"\",\n \"rule_config\": {\n \"algo_params\": null,\n \"inhibit\": false,\n \"prom_ql\": \"\",\n \"queries\": [\n {\n \"prom_ql\": \"elasticsearch_cluster_health_relocating_shards \\u003e 0\",\n \"severity\": 1\n }\n ],\n \"severity\": 0\n },\n \"prom_eval_interval\": 15,\n \"enable_stime\": \"00:00\",\n \"enable_stimes\": [\n \"00:00\"\n ],\n \"enable_etime\": \"23:59\",\n \"enable_etimes\": [\n \"23:59\"\n ],\n \"enable_days_of_week\": [\n \"1\",\n \"2\",\n \"3\",\n \"4\",\n \"5\",\n \"6\",\n \"0\"\n ],\n \"enable_days_of_weeks\": [\n [\n \"1\",\n \"2\",\n \"3\",\n \"4\",\n \"5\",\n \"6\",\n \"0\"\n ]\n ],\n \"enable_in_bg\": 0,\n \"notify_recovered\": 1,\n \"notify_channels\": [],\n \"notify_groups_obj\": null,\n \"notify_groups\": null,\n \"notify_repeat_step\": 60,\n \"notify_max_number\": 0,\n \"recover_duration\": 0,\n \"callbacks\": [],\n \"runbook_url\": \"\",\n \"append_tags\": [\n \"alertname=ElasticsearchRelocationShards\"\n ],\n \"annotations\": null,\n \"extra_config\": null,\n \"create_at\": 0,\n \"create_by\": \"\",\n \"update_at\": 0,\n \"update_by\": \"\",\n \"uuid\": 1717556327358785000\n },\n {\n \"id\": 0,\n \"group_id\": 0,\n \"cate\": \"prometheus\",\n \"datasource_ids\": [\n 52\n ],\n \"cluster\": \"\",\n \"name\": \"Elasticsearch unassigned shards of the instance\",\n \"note\": \"\",\n \"prod\": \"metric\",\n \"algorithm\": \"\",\n \"algo_params\": null,\n \"delay\": 0,\n \"severity\": 1,\n \"severities\": [\n 1\n ],\n \"disabled\": 1,\n \"prom_for_duration\": 0,\n \"prom_ql\": \"\",\n \"rule_config\": {\n \"algo_params\": null,\n \"inhibit\": false,\n \"prom_ql\": \"\",\n \"queries\": [\n {\n \"prom_ql\": \"elasticsearch_cluster_health_unassigned_shards \\u003e 0\",\n \"severity\": 1\n }\n ],\n \"severity\": 0\n },\n \"prom_eval_interval\": 15,\n \"enable_stime\": \"00:00\",\n \"enable_stimes\": [\n \"00:00\"\n ],\n \"enable_etime\": \"23:59\",\n \"enable_etimes\": [\n \"23:59\"\n ],\n \"enable_days_of_week\": [\n \"1\",\n \"2\",\n \"3\",\n \"4\",\n \"5\",\n \"6\",\n \"0\"\n ],\n \"enable_days_of_weeks\": [\n [\n \"1\",\n \"2\",\n \"3\",\n \"4\",\n \"5\",\n \"6\",\n \"0\"\n ]\n ],\n \"enable_in_bg\": 0,\n \"notify_recovered\": 1,\n \"notify_channels\": [],\n \"notify_groups_obj\": null,\n \"notify_groups\": null,\n \"notify_repeat_step\": 60,\n \"notify_max_number\": 0,\n \"recover_duration\": 0,\n \"callbacks\": [],\n \"runbook_url\": \"\",\n \"append_tags\": [\n \"alertname=ElasticsearchUnassignedShards\"\n ],\n \"annotations\": null,\n \"extra_config\": null,\n \"create_at\": 0,\n \"create_by\": \"\",\n \"update_at\": 0,\n \"update_by\": \"\",\n \"uuid\": 1717556327359272000\n },\n {\n \"id\": 0,\n \"group_id\": 0,\n \"cate\": \"prometheus\",\n \"datasource_ids\": [\n 52\n ],\n \"cluster\": \"\",\n \"name\": \"Elasticsearch Unhealthy Data Nodes\",\n \"note\": \"\",\n \"prod\": \"metric\",\n \"algorithm\": \"\",\n \"algo_params\": null,\n \"delay\": 0,\n \"severity\": 1,\n \"severities\": [\n 1\n ],\n \"disabled\": 1,\n \"prom_for_duration\": 0,\n \"prom_ql\": \"\",\n \"rule_config\": {\n \"algo_params\": null,\n \"inhibit\": false,\n \"prom_ql\": \"\",\n \"queries\": [\n {\n \"prom_ql\": \"elasticsearch_cluster_health_number_of_data_nodes \\u003c number_of_data_nodes\",\n \"severity\": 1\n }\n ],\n \"severity\": 0\n },\n \"prom_eval_interval\": 15,\n \"enable_stime\": \"00:00\",\n \"enable_stimes\": [\n \"00:00\"\n ],\n \"enable_etime\": \"23:59\",\n \"enable_etimes\": [\n \"23:59\"\n ],\n \"enable_days_of_week\": [\n \"1\",\n \"2\",\n \"3\",\n \"4\",\n \"5\",\n \"6\",\n \"0\"\n ],\n \"enable_days_of_weeks\": [\n [\n \"1\",\n \"2\",\n \"3\",\n \"4\",\n \"5\",\n \"6\",\n \"0\"\n ]\n ],\n \"enable_in_bg\": 0,\n \"notify_recovered\": 1,\n \"notify_channels\": [],\n \"notify_groups_obj\": null,\n \"notify_groups\": null,\n \"notify_repeat_step\": 60,\n \"notify_max_number\": 0,\n \"recover_duration\": 0,\n \"callbacks\": [],\n \"runbook_url\": \"\",\n \"append_tags\": [\n \"alertname=ElasticsearchHealthyDataNodes\"\n ],\n \"annotations\": null,\n \"extra_config\": null,\n \"create_at\": 0,\n \"create_by\": \"\",\n \"update_at\": 0,\n \"update_by\": \"\",\n \"uuid\": 1717556327359819000\n },\n {\n \"id\": 0,\n \"group_id\": 0,\n \"cate\": \"prometheus\",\n \"datasource_ids\": [\n 52\n ],\n \"cluster\": \"\",\n \"name\": \"Elasticsearch Unhealthy Nodes\",\n \"note\": \"\",\n \"prod\": \"metric\",\n \"algorithm\": \"\",\n \"algo_params\": null,\n \"delay\": 0,\n \"severity\": 1,\n \"severities\": [\n 1\n ],\n \"disabled\": 1,\n \"prom_for_duration\": 0,\n \"prom_ql\": \"\",\n \"rule_config\": {\n \"algo_params\": null,\n \"inhibit\": false,\n \"prom_ql\": \"\",\n \"queries\": [\n {\n \"prom_ql\": \" elasticsearch_cluster_health_number_of_nodes \\u003c number_of_nodes\",\n \"severity\": 1\n }\n ],\n \"severity\": 0\n },\n \"prom_eval_interval\": 15,\n \"enable_stime\": \"00:00\",\n \"enable_stimes\": [\n \"00:00\"\n ],\n \"enable_etime\": \"23:59\",\n \"enable_etimes\": [\n \"23:59\"\n ],\n \"enable_days_of_week\": [\n \"1\",\n \"2\",\n \"3\",\n \"4\",\n \"5\",\n \"6\",\n \"0\"\n ],\n \"enable_days_of_weeks\": [\n [\n \"1\",\n \"2\",\n \"3\",\n \"4\",\n \"5\",\n \"6\",\n \"0\"\n ]\n ],\n \"enable_in_bg\": 0,\n \"notify_recovered\": 1,\n \"notify_channels\": [],\n \"notify_groups_obj\": null,\n \"notify_groups\": null,\n \"notify_repeat_step\": 60,\n \"notify_max_number\": 0,\n \"recover_duration\": 0,\n \"callbacks\": [],\n \"runbook_url\": \"\",\n \"append_tags\": [\n \"alertname=ElasticsearchHealthyNodes\"\n ],\n \"annotations\": null,\n \"extra_config\": null,\n \"create_at\": 0,\n \"create_by\": \"\",\n \"update_at\": 0,\n \"update_by\": \"\",\n \"uuid\": 1717556327360313000\n }\n]\n"
},
{
"path": "integrations/Elasticsearch/alerts/elasticsearch_by_exporter.json",
"content": "[\n {\n \"id\": 0,\n \"group_id\": 0,\n \"cate\": \"prometheus\",\n \"datasource_ids\": [\n 52\n ],\n \"cluster\": \"\",\n \"name\": \"Elastic Cluster Red status\",\n \"note\": \"\",\n \"prod\": \"metric\",\n \"algorithm\": \"\",\n \"algo_params\": null,\n \"delay\": 0,\n \"severity\": 1,\n \"severities\": [\n 1\n ],\n \"disabled\": 1,\n \"prom_for_duration\": 0,\n \"prom_ql\": \"\",\n \"rule_config\": {\n \"algo_params\": null,\n \"inhibit\": false,\n \"prom_ql\": \"\",\n \"queries\": [\n {\n \"prom_ql\": \" elasticsearch_cluster_health_status{color=\\\"red\\\"} == 1\",\n \"severity\": 1\n }\n ],\n \"severity\": 0\n },\n \"prom_eval_interval\": 15,\n \"enable_stime\": \"00:00\",\n \"enable_stimes\": [\n \"00:00\"\n ],\n \"enable_etime\": \"23:59\",\n \"enable_etimes\": [\n \"23:59\"\n ],\n \"enable_days_of_week\": [\n \"1\",\n \"2\",\n \"3\",\n \"4\",\n \"5\",\n \"6\",\n \"0\"\n ],\n \"enable_days_of_weeks\": [\n [\n \"1\",\n \"2\",\n \"3\",\n \"4\",\n \"5\",\n \"6\",\n \"0\"\n ]\n ],\n \"enable_in_bg\": 0,\n \"notify_recovered\": 1,\n \"notify_channels\": [],\n \"notify_groups_obj\": null,\n \"notify_groups\": null,\n \"notify_repeat_step\": 60,\n \"notify_max_number\": 0,\n \"recover_duration\": 0,\n \"callbacks\": [],\n \"runbook_url\": \"\",\n \"append_tags\": [\n \"alertname=ElasticsearchClusterRed\"\n ],\n \"annotations\": null,\n \"extra_config\": null,\n \"create_at\": 0,\n \"create_by\": \"\",\n \"update_at\": 0,\n \"update_by\": \"\",\n \"uuid\": 1717556327361785000\n },\n {\n \"id\": 0,\n \"group_id\": 0,\n \"cate\": \"prometheus\",\n \"datasource_ids\": [\n 52\n ],\n \"cluster\": \"\",\n \"name\": \"Elastic Cluster Yellow status\",\n \"note\": \"\",\n \"prod\": \"metric\",\n \"algorithm\": \"\",\n \"algo_params\": null,\n \"delay\": 0,\n \"severity\": 2,\n \"severities\": [\n 2\n ],\n \"disabled\": 1,\n \"prom_for_duration\": 0,\n \"prom_ql\": \"\",\n \"rule_config\": {\n \"algo_params\": null,\n \"inhibit\": false,\n \"prom_ql\": \"\",\n \"queries\": [\n {\n \"prom_ql\": \"elasticsearch_cluster_health_status{color=\\\"yellow\\\"} == 1\",\n \"severity\": 2\n }\n ],\n \"severity\": 0\n },\n \"prom_eval_interval\": 15,\n \"enable_stime\": \"00:00\",\n \"enable_stimes\": [\n \"00:00\"\n ],\n \"enable_etime\": \"23:59\",\n \"enable_etimes\": [\n \"23:59\"\n ],\n \"enable_days_of_week\": [\n \"1\",\n \"2\",\n \"3\",\n \"4\",\n \"5\",\n \"6\",\n \"0\"\n ],\n \"enable_days_of_weeks\": [\n [\n \"1\",\n \"2\",\n \"3\",\n \"4\",\n \"5\",\n \"6\",\n \"0\"\n ]\n ],\n \"enable_in_bg\": 0,\n \"notify_recovered\": 1,\n \"notify_channels\": [],\n \"notify_groups_obj\": null,\n \"notify_groups\": null,\n \"notify_repeat_step\": 60,\n \"notify_max_number\": 0,\n \"recover_duration\": 0,\n \"callbacks\": [],\n \"runbook_url\": \"\",\n \"append_tags\": [\n \"alertname=ElasticsearchClusterYellow\"\n ],\n \"annotations\": null,\n \"extra_config\": null,\n \"create_at\": 0,\n \"create_by\": \"\",\n \"update_at\": 0,\n \"update_by\": \"\",\n \"uuid\": 1717556327362329000\n },\n {\n \"id\": 0,\n \"group_id\": 0,\n \"cate\": \"prometheus\",\n \"datasource_ids\": [\n 52\n ],\n \"cluster\": \"\",\n \"name\": \"Elasticsearch disk out of space of the instance\",\n \"note\": \"\",\n \"prod\": \"metric\",\n \"algorithm\": \"\",\n \"algo_params\": null,\n \"delay\": 0,\n \"severity\": 1,\n \"severities\": [\n 1\n ],\n \"disabled\": 1,\n \"prom_for_duration\": 120,\n \"prom_ql\": \"\",\n \"rule_config\": {\n \"algo_params\": null,\n \"inhibit\": false,\n \"prom_ql\": \"\",\n \"queries\": [\n {\n \"prom_ql\": \"elasticsearch_filesystem_data_available_bytes / elasticsearch_filesystem_data_size_bytes * 100 \\u003c 10\",\n \"severity\": 1\n }\n ],\n \"severity\": 0\n },\n \"prom_eval_interval\": 15,\n \"enable_stime\": \"00:00\",\n \"enable_stimes\": [\n \"00:00\"\n ],\n \"enable_etime\": \"23:59\",\n \"enable_etimes\": [\n \"23:59\"\n ],\n \"enable_days_of_week\": [\n \"1\",\n \"2\",\n \"3\",\n \"4\",\n \"5\",\n \"6\",\n \"0\"\n ],\n \"enable_days_of_weeks\": [\n [\n \"1\",\n \"2\",\n \"3\",\n \"4\",\n \"5\",\n \"6\",\n \"0\"\n ]\n ],\n \"enable_in_bg\": 0,\n \"notify_recovered\": 1,\n \"notify_channels\": [],\n \"notify_groups_obj\": null,\n \"notify_groups\": null,\n \"notify_repeat_step\": 60,\n \"notify_max_number\": 0,\n \"recover_duration\": 0,\n \"callbacks\": [],\n \"runbook_url\": \"\",\n \"append_tags\": [\n \"alertname=ElasticsearchDiskOutOfSpace\"\n ],\n \"annotations\": null,\n \"extra_config\": null,\n \"create_at\": 0,\n \"create_by\": \"\",\n \"update_at\": 0,\n \"update_by\": \"\",\n \"uuid\": 1717556327362792000\n },\n {\n \"id\": 0,\n \"group_id\": 0,\n \"cate\": \"prometheus\",\n \"datasource_ids\": [\n 52\n ],\n \"cluster\": \"\",\n \"name\": \"Elasticsearch disk space low of the instance\",\n \"note\": \"\",\n \"prod\": \"metric\",\n \"algorithm\": \"\",\n \"algo_params\": null,\n \"delay\": 0,\n \"severity\": 2,\n \"severities\": [\n 2\n ],\n \"disabled\": 1,\n \"prom_for_duration\": 120,\n \"prom_ql\": \"\",\n \"rule_config\": {\n \"algo_params\": null,\n \"inhibit\": false,\n \"prom_ql\": \"\",\n \"queries\": [\n {\n \"prom_ql\": \"elasticsearch_filesystem_data_available_bytes / elasticsearch_filesystem_data_size_bytes * 100 \\u003c 20\",\n \"severity\": 2\n }\n ],\n \"severity\": 0\n },\n \"prom_eval_interval\": 15,\n \"enable_stime\": \"00:00\",\n \"enable_stimes\": [\n \"00:00\"\n ],\n \"enable_etime\": \"23:59\",\n \"enable_etimes\": [\n \"23:59\"\n ],\n \"enable_days_of_week\": [\n \"1\",\n \"2\",\n \"3\",\n \"4\",\n \"5\",\n \"6\",\n \"0\"\n ],\n \"enable_days_of_weeks\": [\n [\n \"1\",\n \"2\",\n \"3\",\n \"4\",\n \"5\",\n \"6\",\n \"0\"\n ]\n ],\n \"enable_in_bg\": 0,\n \"notify_recovered\": 1,\n \"notify_channels\": [],\n \"notify_groups_obj\": null,\n \"notify_groups\": null,\n \"notify_repeat_step\": 60,\n \"notify_max_number\": 0,\n \"recover_duration\": 0,\n \"callbacks\": [],\n \"runbook_url\": \"\",\n \"append_tags\": [\n \"alertname=ElasticsearchDiskSpaceLow\"\n ],\n \"annotations\": null,\n \"extra_config\": null,\n \"create_at\": 0,\n \"create_by\": \"\",\n \"update_at\": 0,\n \"update_by\": \"\",\n \"uuid\": 1717556327363280000\n },\n {\n \"id\": 0,\n \"group_id\": 0,\n \"cate\": \"prometheus\",\n \"datasource_ids\": [\n 52\n ],\n \"cluster\": \"\",\n \"name\": \"Elasticsearch Heap Usage Too High of the instance\",\n \"note\": \"\",\n \"prod\": \"metric\",\n \"algorithm\": \"\",\n \"algo_params\": null,\n \"delay\": 0,\n \"severity\": 1,\n \"severities\": [\n 1\n ],\n \"disabled\": 1,\n \"prom_for_duration\": 120,\n \"prom_ql\": \"\",\n \"rule_config\": {\n \"algo_params\": null,\n \"inhibit\": false,\n \"prom_ql\": \"\",\n \"queries\": [\n {\n \"prom_ql\": \"(elasticsearch_jvm_memory_used_bytes{area=\\\"heap\\\"} / elasticsearch_jvm_memory_max_bytes{area=\\\"heap\\\"}) * 100 \\u003e 90\",\n \"severity\": 1\n }\n ],\n \"severity\": 0\n },\n \"prom_eval_interval\": 15,\n \"enable_stime\": \"00:00\",\n \"enable_stimes\": [\n \"00:00\"\n ],\n \"enable_etime\": \"23:59\",\n \"enable_etimes\": [\n \"23:59\"\n ],\n \"enable_days_of_week\": [\n \"1\",\n \"2\",\n \"3\",\n \"4\",\n \"5\",\n \"6\",\n \"0\"\n ],\n \"enable_days_of_weeks\": [\n [\n \"1\",\n \"2\",\n \"3\",\n \"4\",\n \"5\",\n \"6\",\n \"0\"\n ]\n ],\n \"enable_in_bg\": 0,\n \"notify_recovered\": 1,\n \"notify_channels\": [],\n \"notify_groups_obj\": null,\n \"notify_groups\": null,\n \"notify_repeat_step\": 60,\n \"notify_max_number\": 0,\n \"recover_duration\": 0,\n \"callbacks\": [],\n \"runbook_url\": \"\",\n \"append_tags\": [\n \"alertname=ElasticsearchHeapUsageTooHigh\"\n ],\n \"annotations\": null,\n \"extra_config\": null,\n \"create_at\": 0,\n \"create_by\": \"\",\n \"update_at\": 0,\n \"update_by\": \"\",\n \"uuid\": 1717556327363865000\n },\n {\n \"id\": 0,\n \"group_id\": 0,\n \"cate\": \"prometheus\",\n \"datasource_ids\": [\n 52\n ],\n \"cluster\": \"\",\n \"name\": \"Elasticsearch Heap Usage warning of the instance\",\n \"note\": \"\",\n \"prod\": \"metric\",\n \"algorithm\": \"\",\n \"algo_params\": null,\n \"delay\": 0,\n \"severity\": 2,\n \"severities\": [\n 2\n ],\n \"disabled\": 1,\n \"prom_for_duration\": 120,\n \"prom_ql\": \"\",\n \"rule_config\": {\n \"algo_params\": null,\n \"inhibit\": false,\n \"prom_ql\": \"\",\n \"queries\": [\n {\n \"prom_ql\": \"(elasticsearch_jvm_memory_used_bytes{area=\\\"heap\\\"} / elasticsearch_jvm_memory_max_bytes{area=\\\"heap\\\"}) * 100 \\u003e 80\",\n \"severity\": 2\n }\n ],\n \"severity\": 0\n },\n \"prom_eval_interval\": 15,\n \"enable_stime\": \"00:00\",\n \"enable_stimes\": [\n \"00:00\"\n ],\n \"enable_etime\": \"23:59\",\n \"enable_etimes\": [\n \"23:59\"\n ],\n \"enable_days_of_week\": [\n \"1\",\n \"2\",\n \"3\",\n \"4\",\n \"5\",\n \"6\",\n \"0\"\n ],\n \"enable_days_of_weeks\": [\n [\n \"1\",\n \"2\",\n \"3\",\n \"4\",\n \"5\",\n \"6\",\n \"0\"\n ]\n ],\n \"enable_in_bg\": 0,\n \"notify_recovered\": 1,\n \"notify_channels\": [],\n \"notify_groups_obj\": null,\n \"notify_groups\": null,\n \"notify_repeat_step\": 60,\n \"notify_max_number\": 0,\n \"recover_duration\": 0,\n \"callbacks\": [],\n \"runbook_url\": \"\",\n \"append_tags\": [\n \"alertname=ElasticsearchHeapUsageWarning\"\n ],\n \"annotations\": null,\n \"extra_config\": null,\n \"create_at\": 0,\n \"create_by\": \"\",\n \"update_at\": 0,\n \"update_by\": \"\",\n \"uuid\": 1717556327364319000\n },\n {\n \"id\": 0,\n \"group_id\": 0,\n \"cate\": \"prometheus\",\n \"datasource_ids\": [\n 52\n ],\n \"cluster\": \"\",\n \"name\": \"Elasticsearch initializing shards of the instance\",\n \"note\": \"\",\n \"prod\": \"metric\",\n \"algorithm\": \"\",\n \"algo_params\": null,\n \"delay\": 0,\n \"severity\": 2,\n \"severities\": [\n 2\n ],\n \"disabled\": 1,\n \"prom_for_duration\": 900,\n \"prom_ql\": \"\",\n \"rule_config\": {\n \"algo_params\": null,\n \"inhibit\": false,\n \"prom_ql\": \"\",\n \"queries\": [\n {\n \"prom_ql\": \"elasticsearch_cluster_health_initializing_shards \\u003e 0\",\n \"severity\": 2\n }\n ],\n \"severity\": 0\n },\n \"prom_eval_interval\": 15,\n \"enable_stime\": \"00:00\",\n \"enable_stimes\": [\n \"00:00\"\n ],\n \"enable_etime\": \"23:59\",\n \"enable_etimes\": [\n \"23:59\"\n ],\n \"enable_days_of_week\": [\n \"1\",\n \"2\",\n \"3\",\n \"4\",\n \"5\",\n \"6\",\n \"0\"\n ],\n \"enable_days_of_weeks\": [\n [\n \"1\",\n \"2\",\n \"3\",\n \"4\",\n \"5\",\n \"6\",\n \"0\"\n ]\n ],\n \"enable_in_bg\": 0,\n \"notify_recovered\": 1,\n \"notify_channels\": [],\n \"notify_groups_obj\": null,\n \"notify_groups\": null,\n \"notify_repeat_step\": 60,\n \"notify_max_number\": 0,\n \"recover_duration\": 0,\n \"callbacks\": [],\n \"runbook_url\": \"\",\n \"append_tags\": [\n \"alertname=ElasticsearchInitializingShards\"\n ],\n \"annotations\": null,\n \"extra_config\": null,\n \"create_at\": 0,\n \"create_by\": \"\",\n \"update_at\": 0,\n \"update_by\": \"\",\n \"uuid\": 1717556327364769000\n },\n {\n \"id\": 0,\n \"group_id\": 0,\n \"cate\": \"prometheus\",\n \"datasource_ids\": [\n 52\n ],\n \"cluster\": \"\",\n \"name\": \"Elasticsearch no new documents of the instance\",\n \"note\": \"\",\n \"prod\": \"metric\",\n \"algorithm\": \"\",\n \"algo_params\": null,\n \"delay\": 0,\n \"severity\": 2,\n \"severities\": [\n 2\n ],\n \"disabled\": 1,\n \"prom_for_duration\": 300,\n \"prom_ql\": \"\",\n \"rule_config\": {\n \"algo_params\": null,\n \"inhibit\": false,\n \"prom_ql\": \"\",\n \"queries\": [\n {\n \"prom_ql\": \"rate(elasticsearch_indices_docs{es_data_node=\\\"true\\\"}[5m]) == 0\",\n \"severity\": 2\n }\n ],\n \"severity\": 0\n },\n \"prom_eval_interval\": 15,\n \"enable_stime\": \"00:00\",\n \"enable_stimes\": [\n \"00:00\"\n ],\n \"enable_etime\": \"23:59\",\n \"enable_etimes\": [\n \"23:59\"\n ],\n \"enable_days_of_week\": [\n \"1\",\n \"2\",\n \"3\",\n \"4\",\n \"5\",\n \"6\",\n \"0\"\n ],\n \"enable_days_of_weeks\": [\n [\n \"1\",\n \"2\",\n \"3\",\n \"4\",\n \"5\",\n \"6\",\n \"0\"\n ]\n ],\n \"enable_in_bg\": 0,\n \"notify_recovered\": 1,\n \"notify_channels\": [],\n \"notify_groups_obj\": null,\n \"notify_groups\": null,\n \"notify_repeat_step\": 60,\n \"notify_max_number\": 0,\n \"recover_duration\": 0,\n \"callbacks\": [],\n \"runbook_url\": \"\",\n \"append_tags\": [\n \"alertname=ElasticsearchNoNewDocuments\"\n ],\n \"annotations\": null,\n \"extra_config\": null,\n \"create_at\": 0,\n \"create_by\": \"\",\n \"update_at\": 0,\n \"update_by\": \"\",\n \"uuid\": 1717556327365271000\n },\n {\n \"id\": 0,\n \"group_id\": 0,\n \"cate\": \"prometheus\",\n \"datasource_ids\": [\n 52\n ],\n \"cluster\": \"\",\n \"name\": \"Elasticsearch pending tasks of the instance\",\n \"note\": \"\",\n \"prod\": \"metric\",\n \"algorithm\": \"\",\n \"algo_params\": null,\n \"delay\": 0,\n \"severity\": 2,\n \"severities\": [\n 2\n ],\n \"disabled\": 1,\n \"prom_for_duration\": 900,\n \"prom_ql\": \"\",\n \"rule_config\": {\n \"algo_params\": null,\n \"inhibit\": false,\n \"prom_ql\": \"\",\n \"queries\": [\n {\n \"prom_ql\": \"elasticsearch_cluster_health_number_of_pending_tasks \\u003e 0\",\n \"severity\": 2\n }\n ],\n \"severity\": 0\n },\n \"prom_eval_interval\": 15,\n \"enable_stime\": \"00:00\",\n \"enable_stimes\": [\n \"00:00\"\n ],\n \"enable_etime\": \"23:59\",\n \"enable_etimes\": [\n \"23:59\"\n ],\n \"enable_days_of_week\": [\n \"1\",\n \"2\",\n \"3\",\n \"4\",\n \"5\",\n \"6\",\n \"0\"\n ],\n \"enable_days_of_weeks\": [\n [\n \"1\",\n \"2\",\n \"3\",\n \"4\",\n \"5\",\n \"6\",\n \"0\"\n ]\n ],\n \"enable_in_bg\": 0,\n \"notify_recovered\": 1,\n \"notify_channels\": [],\n \"notify_groups_obj\": null,\n \"notify_groups\": null,\n \"notify_repeat_step\": 60,\n \"notify_max_number\": 0,\n \"recover_duration\": 0,\n \"callbacks\": [],\n \"runbook_url\": \"\",\n \"append_tags\": [\n \"alertname=ElasticsearchPendingTasks\"\n ],\n \"annotations\": null,\n \"extra_config\": null,\n \"create_at\": 0,\n \"create_by\": \"\",\n \"update_at\": 0,\n \"update_by\": \"\",\n \"uuid\": 1717556327365726000\n },\n {\n \"id\": 0,\n \"group_id\": 0,\n \"cate\": \"prometheus\",\n \"datasource_ids\": [\n 52\n ],\n \"cluster\": \"\",\n \"name\": \"Elasticsearch relocation shards of the instance\",\n \"note\": \"\",\n \"prod\": \"metric\",\n \"algorithm\": \"\",\n \"algo_params\": null,\n \"delay\": 0,\n \"severity\": 1,\n \"severities\": [\n 1\n ],\n \"disabled\": 1,\n \"prom_for_duration\": 900,\n \"prom_ql\": \"\",\n \"rule_config\": {\n \"algo_params\": null,\n \"inhibit\": false,\n \"prom_ql\": \"\",\n \"queries\": [\n {\n \"prom_ql\": \"elasticsearch_cluster_health_relocating_shards \\u003e 0\",\n \"severity\": 1\n }\n ],\n \"severity\": 0\n },\n \"prom_eval_interval\": 15,\n \"enable_stime\": \"00:00\",\n \"enable_stimes\": [\n \"00:00\"\n ],\n \"enable_etime\": \"23:59\",\n \"enable_etimes\": [\n \"23:59\"\n ],\n \"enable_days_of_week\": [\n \"1\",\n \"2\",\n \"3\",\n \"4\",\n \"5\",\n \"6\",\n \"0\"\n ],\n \"enable_days_of_weeks\": [\n [\n \"1\",\n \"2\",\n \"3\",\n \"4\",\n \"5\",\n \"6\",\n \"0\"\n ]\n ],\n \"enable_in_bg\": 0,\n \"notify_recovered\": 1,\n \"notify_channels\": [],\n \"notify_groups_obj\": null,\n \"notify_groups\": null,\n \"notify_repeat_step\": 60,\n \"notify_max_number\": 0,\n \"recover_duration\": 0,\n \"callbacks\": [],\n \"runbook_url\": \"\",\n \"append_tags\": [\n \"alertname=ElasticsearchRelocationShards\"\n ],\n \"annotations\": null,\n \"extra_config\": null,\n \"create_at\": 0,\n \"create_by\": \"\",\n \"update_at\": 0,\n \"update_by\": \"\",\n \"uuid\": 1717556327366204000\n },\n {\n \"id\": 0,\n \"group_id\": 0,\n \"cate\": \"prometheus\",\n \"datasource_ids\": [\n 52\n ],\n \"cluster\": \"\",\n \"name\": \"Elasticsearch unassigned shards of the instance\",\n \"note\": \"\",\n \"prod\": \"metric\",\n \"algorithm\": \"\",\n \"algo_params\": null,\n \"delay\": 0,\n \"severity\": 1,\n \"severities\": [\n 1\n ],\n \"disabled\": 1,\n \"prom_for_duration\": 0,\n \"prom_ql\": \"\",\n \"rule_config\": {\n \"algo_params\": null,\n \"inhibit\": false,\n \"prom_ql\": \"\",\n \"queries\": [\n {\n \"prom_ql\": \"elasticsearch_cluster_health_unassigned_shards \\u003e 0\",\n \"severity\": 1\n }\n ],\n \"severity\": 0\n },\n \"prom_eval_interval\": 15,\n \"enable_stime\": \"00:00\",\n \"enable_stimes\": [\n \"00:00\"\n ],\n \"enable_etime\": \"23:59\",\n \"enable_etimes\": [\n \"23:59\"\n ],\n \"enable_days_of_week\": [\n \"1\",\n \"2\",\n \"3\",\n \"4\",\n \"5\",\n \"6\",\n \"0\"\n ],\n \"enable_days_of_weeks\": [\n [\n \"1\",\n \"2\",\n \"3\",\n \"4\",\n \"5\",\n \"6\",\n \"0\"\n ]\n ],\n \"enable_in_bg\": 0,\n \"notify_recovered\": 1,\n \"notify_channels\": [],\n \"notify_groups_obj\": null,\n \"notify_groups\": null,\n \"notify_repeat_step\": 60,\n \"notify_max_number\": 0,\n \"recover_duration\": 0,\n \"callbacks\": [],\n \"runbook_url\": \"\",\n \"append_tags\": [\n \"alertname=ElasticsearchUnassignedShards\"\n ],\n \"annotations\": null,\n \"extra_config\": null,\n \"create_at\": 0,\n \"create_by\": \"\",\n \"update_at\": 0,\n \"update_by\": \"\",\n \"uuid\": 1717556327366970000\n },\n {\n \"id\": 0,\n \"group_id\": 0,\n \"cate\": \"prometheus\",\n \"datasource_ids\": [\n 52\n ],\n \"cluster\": \"\",\n \"name\": \"Elasticsearch Unhealthy Data Nodes\",\n \"note\": \"\",\n \"prod\": \"metric\",\n \"algorithm\": \"\",\n \"algo_params\": null,\n \"delay\": 0,\n \"severity\": 1,\n \"severities\": [\n 1\n ],\n \"disabled\": 1,\n \"prom_for_duration\": 0,\n \"prom_ql\": \"\",\n \"rule_config\": {\n \"algo_params\": null,\n \"inhibit\": false,\n \"prom_ql\": \"\",\n \"queries\": [\n {\n \"prom_ql\": \"elasticsearch_cluster_health_number_of_data_nodes \\u003c number_of_data_nodes\",\n \"severity\": 1\n }\n ],\n \"severity\": 0\n },\n \"prom_eval_interval\": 15,\n \"enable_stime\": \"00:00\",\n \"enable_stimes\": [\n \"00:00\"\n ],\n \"enable_etime\": \"23:59\",\n \"enable_etimes\": [\n \"23:59\"\n ],\n \"enable_days_of_week\": [\n \"1\",\n \"2\",\n \"3\",\n \"4\",\n \"5\",\n \"6\",\n \"0\"\n ],\n \"enable_days_of_weeks\": [\n [\n \"1\",\n \"2\",\n \"3\",\n \"4\",\n \"5\",\n \"6\",\n \"0\"\n ]\n ],\n \"enable_in_bg\": 0,\n \"notify_recovered\": 1,\n \"notify_channels\": [],\n \"notify_groups_obj\": null,\n \"notify_groups\": null,\n \"notify_repeat_step\": 60,\n \"notify_max_number\": 0,\n \"recover_duration\": 0,\n \"callbacks\": [],\n \"runbook_url\": \"\",\n \"append_tags\": [\n \"alertname=ElasticsearchHealthyDataNodes\"\n ],\n \"annotations\": null,\n \"extra_config\": null,\n \"create_at\": 0,\n \"create_by\": \"\",\n \"update_at\": 0,\n \"update_by\": \"\",\n \"uuid\": 1717556327367398000\n },\n {\n \"id\": 0,\n \"group_id\": 0,\n \"cate\": \"prometheus\",\n \"datasource_ids\": [\n 52\n ],\n \"cluster\": \"\",\n \"name\": \"Elasticsearch Unhealthy Nodes\",\n \"note\": \"\",\n \"prod\": \"metric\",\n \"algorithm\": \"\",\n \"algo_params\": null,\n \"delay\": 0,\n \"severity\": 1,\n \"severities\": [\n 1\n ],\n \"disabled\": 1,\n \"prom_for_duration\": 0,\n \"prom_ql\": \"\",\n \"rule_config\": {\n \"algo_params\": null,\n \"inhibit\": false,\n \"prom_ql\": \"\",\n \"queries\": [\n {\n \"prom_ql\": \" elasticsearch_cluster_health_number_of_nodes \\u003c number_of_nodes\",\n \"severity\": 1\n }\n ],\n \"severity\": 0\n },\n \"prom_eval_interval\": 15,\n \"enable_stime\": \"00:00\",\n \"enable_stimes\": [\n \"00:00\"\n ],\n \"enable_etime\": \"23:59\",\n \"enable_etimes\": [\n \"23:59\"\n ],\n \"enable_days_of_week\": [\n \"1\",\n \"2\",\n \"3\",\n \"4\",\n \"5\",\n \"6\",\n \"0\"\n ],\n \"enable_days_of_weeks\": [\n [\n \"1\",\n \"2\",\n \"3\",\n \"4\",\n \"5\",\n \"6\",\n \"0\"\n ]\n ],\n \"enable_in_bg\": 0,\n \"notify_recovered\": 1,\n \"notify_channels\": [],\n \"notify_groups_obj\": null,\n \"notify_groups\": null,\n \"notify_repeat_step\": 60,\n \"notify_max_number\": 0,\n \"recover_duration\": 0,\n \"callbacks\": [],\n \"runbook_url\": \"\",\n \"append_tags\": [\n \"alertname=ElasticsearchHealthyNodes\"\n ],\n \"annotations\": null,\n \"extra_config\": null,\n \"create_at\": 0,\n \"create_by\": \"\",\n \"update_at\": 0,\n \"update_by\": \"\",\n \"uuid\": 1717556327367874000\n }\n]"
},
{
"path": "integrations/Elasticsearch/collect/elasticsearch/elasticsearch.toml",
"content": "# # collect interval\n# interval = 15\n\n############################################################################\n# !!! uncomment [[instances]] to enable this plugin\n[[instances]]\n# # interval = global.interval * interval_times\n# interval_times = 1\n\n# append some labels to metrics\n# labels = { cluster=\"cloud-n9e-es\" }\n\n## specify a list of one or more Elasticsearch servers\n# servers = [\"http://localhost:9200\"]\nservers = []\n\n## Timeout for HTTP requests to the elastic search server(s)\nhttp_timeout = \"10s\"\n\n# either /_nodes/stats or /_nodes/_local/stats depending on this setting\nlocal = false\n\n## Set cluster_health to true when you want to obtain cluster health stats\ncluster_health = true\n\n## Adjust cluster_health_level when you want to obtain detailed health stats\n## The options are\n## - indices (default)\n## - cluster\ncluster_health_level = \"cluster\"\n\n## Set cluster_stats to true when you want to obtain cluster stats.\ncluster_stats = true\n\n## Indices to collect; can be one or more indices names or _all\n## Use of wildcards is allowed. Use a wildcard at the end to retrieve index names that end with a changing value, like a date.\n# indices_include = [\"zipkin*\"]\n\n## use \"shards\" or blank string for indices level\nindices_level = \"\"\n\n## node_stats is a list of sub-stats that you want to have gathered. Valid options\n## are \"indices\", \"os\", \"process\", \"jvm\", \"thread_pool\", \"fs\", \"transport\", \"http\",\n## \"breaker\". Per default, all stats are gathered.\nnode_stats = [\"jvm\", \"breaker\", \"process\", \"os\", \"fs\", \"indices\", \"thread_pool\", \"transport\"]\n\n## HTTP Basic Authentication username and password.\nusername = \"elastic\"\npassword = \"password\"\n\n## Optional TLS Config\n# use_tls = false\n# tls_ca = \"/etc/categraf/ca.pem\"\n# tls_cert = \"/etc/categraf/cert.pem\"\n# tls_key = \"/etc/categraf/key.pem\"\n## Use TLS but skip chain & host verification\n# insecure_skip_verify = true\n\n## Sets the number of most recent indices to return for indices that are configured with a date-stamped suffix.\n## Each 'indices_include' entry ending with a wildcard (*) or glob matching pattern will group together all indices that match it, and \n## sort them by the date or number after the wildcard. Metrics then are gathered for only the 'num_most_recent_indices' amount of most \n## recent indices.\nnum_most_recent_indices = 1"
},
{
"path": "integrations/Elasticsearch/dashboards/elasticsearch_by_categraf.json",
"content": "{\n \"id\": 0,\n \"group_id\": 0,\n \"name\": \"ElasticSearch\",\n \"ident\": \"\",\n \"tags\": \"ElasticSearch Prometheus\",\n \"create_at\": 0,\n \"create_by\": \"\",\n \"update_at\": 0,\n \"update_by\": \"\",\n \"configs\": {\n \"panels\": [\n {\n \"custom\": {\n \"calc\": \"lastNotNull\",\n \"colSpan\": 1,\n \"colorMode\": \"background\",\n \"textMode\": \"valueAndName\",\n \"textSize\": {},\n \"valueField\": \"Value\"\n },\n \"datasourceCate\": \"prometheus\",\n \"datasourceValue\": \"${datasource}\",\n \"id\": \"f70f4198-dec2-40c0-97d9-6986c7001e73\",\n \"layout\": {\n \"h\": 3,\n \"i\": \"f70f4198-dec2-40c0-97d9-6986c7001e73\",\n \"isResizable\": true,\n \"w\": 4,\n \"x\": 0,\n \"y\": 0\n },\n \"name\": \"\",\n \"options\": {\n \"standardOptions\": {},\n \"thresholds\": {\n \"steps\": [\n {\n \"color\": \"#634CD9\",\n \"type\": \"base\",\n \"value\": null\n }\n ]\n },\n \"valueMappings\": [\n {\n \"match\": {\n \"special\": 0\n },\n \"result\": {\n \"text\": \"N/A\"\n },\n \"type\": \"special\"\n },\n {\n \"match\": {\n \"special\": 1\n },\n \"result\": {\n \"color\": \"#417505\",\n \"text\": \"Green\"\n },\n \"type\": \"special\"\n },\n {\n \"match\": {\n \"special\": 2\n },\n \"result\": {\n \"color\": \"#f5a623\",\n \"text\": \"Yellow\"\n },\n \"type\": \"special\"\n },\n {\n \"match\": {\n \"special\": 3\n },\n \"result\": {\n \"color\": \"#d0021b\",\n \"text\": \"Red\"\n },\n \"type\": \"special\"\n }\n ]\n },\n \"targets\": [\n {\n \"expr\": \"min(elasticsearch_cluster_health_status_code{service =\\\"$service\\\"})\",\n \"refId\": \"A\"\n }\n ],\n \"type\": \"stat\",\n \"version\": \"2.0.0\"\n },\n {\n \"custom\": {\n \"calc\": \"lastNotNull\",\n \"colSpan\": 1,\n \"colorMode\": \"value\",\n \"textMode\": \"valueAndName\",\n \"textSize\": {}\n },\n \"datasourceCate\": \"prometheus\",\n \"datasourceValue\": \"${datasource}\",\n \"id\": \"7dafe232-ee30-479b-a2f1-e1064572c154\",\n \"layout\": {\n \"h\": 3,\n \"i\": \"7dafe232-ee30-479b-a2f1-e1064572c154\",\n \"isResizable\": true,\n \"w\": 4,\n \"x\": 4,\n \"y\": 0\n },\n \"name\": \"Nodes\",\n \"options\": {\n \"standardOptions\": {}\n },\n \"targets\": [\n {\n \"expr\": \"min(elasticsearch_cluster_health_number_of_nodes{service =\\\"$service\\\"})\",\n \"refId\": \"A\"\n }\n ],\n \"type\": \"stat\",\n \"version\": \"2.0.0\"\n },\n {\n \"custom\": {\n \"calc\": \"lastNotNull\",\n \"colSpan\": 1,\n \"colorMode\": \"value\",\n \"textMode\": \"valueAndName\",\n \"textSize\": {}\n },\n \"datasourceCate\": \"prometheus\",\n \"datasourceValue\": \"${datasource}\",\n \"id\": \"447fb784-a7e4-41cf-820f-6086837590e6\",\n \"layout\": {\n \"h\": 3,\n \"i\": \"c6953ef5-3e29-44dc-bf9e-74905934e9df\",\n \"isResizable\": true,\n \"w\": 4,\n \"x\": 8,\n \"y\": 0\n },\n \"name\": \"Data Nodes\",\n \"options\": {\n \"standardOptions\": {}\n },\n \"targets\": [\n {\n \"expr\": \"min(elasticsearch_cluster_health_number_of_data_nodes{service =\\\"$service\\\"})\",\n \"refId\": \"A\"\n }\n ],\n \"type\": \"stat\",\n \"version\": \"2.0.0\"\n },\n {\n \"custom\": {\n \"calc\": \"lastNotNull\",\n \"colSpan\": 1,\n \"colorMode\": \"value\",\n \"textMode\": \"valueAndName\",\n \"textSize\": {}\n },\n \"datasourceCate\": \"prometheus\",\n \"datasourceValue\": \"${datasource}\",\n \"id\": \"f0375f72-4ca1-474f-81e9-ce6b64f22204\",\n \"layout\": {\n \"h\": 3,\n \"i\": \"e6cf29e7-bb5d-4c8f-8aa6-67a63fc325c7\",\n \"isResizable\": true,\n \"w\": 4,\n \"x\": 12,\n \"y\": 0\n },\n \"name\": \"CPU Util Percent\",\n \"options\": {\n \"standardOptions\": {\n \"util\": \"percent\"\n },\n \"valueMappings\": [\n {\n \"match\": {\n \"to\": 50\n },\n \"result\": {\n \"color\": \"#417505\"\n },\n \"type\": \"range\"\n },\n {\n \"match\": {\n \"from\": 50,\n \"to\": 80\n },\n \"result\": {\n \"color\": \"#f5a623\"\n },\n \"type\": \"range\"\n },\n {\n \"match\": {\n \"from\": 80\n },\n \"result\": {\n \"color\": \"#d0021b\"\n },\n \"type\": \"range\"\n }\n ]\n },\n \"targets\": [\n {\n \"expr\": \"max(elasticsearch_process_cpu_percent{service =\\\"$service\\\", node_host=~\\\"$node_host\\\"})\",\n \"refId\": \"A\"\n }\n ],\n \"type\": \"stat\",\n \"version\": \"2.0.0\"\n },\n {\n \"custom\": {\n \"calc\": \"lastNotNull\",\n \"colSpan\": 1,\n \"colorMode\": \"value\",\n \"textMode\": \"valueAndName\",\n \"textSize\": {}\n },\n \"datasourceCate\": \"prometheus\",\n \"datasourceValue\": \"${datasource}\",\n \"id\": \"288ee5f1-b484-43f5-86bf-5b81c01b3c2c\",\n \"layout\": {\n \"h\": 3,\n \"i\": \"34ae1975-6acb-48a7-adce-1d67b7c581ec\",\n \"isResizable\": true,\n \"w\": 4,\n \"x\": 16,\n \"y\": 0\n },\n \"name\": \"JVM Heap Util Percent\",\n \"options\": {\n \"standardOptions\": {\n \"util\": \"percent\"\n },\n \"valueMappings\": [\n {\n \"match\": {\n \"to\": 50\n },\n \"result\": {\n \"color\": \"#417505\"\n },\n \"type\": \"range\"\n },\n {\n \"match\": {\n \"from\": 50,\n \"to\": 80\n },\n \"result\": {\n \"color\": \"#f5a623\"\n },\n \"type\": \"range\"\n },\n {\n \"match\": {\n \"from\": 80\n },\n \"result\": {\n \"color\": \"#d0021b\"\n },\n \"type\": \"range\"\n }\n ]\n },\n \"targets\": [\n {\n \"expr\": \"max(elasticsearch_jvm_mem_heap_used_percent{service =\\\"$service\\\", node_host=~\\\"$node_host\\\"})\",\n \"refId\": \"A\"\n }\n ],\n \"type\": \"stat\",\n \"version\": \"2.0.0\"\n },\n {\n \"custom\": {\n \"calc\": \"lastNotNull\",\n \"colSpan\": 1,\n \"colorMode\": \"value\",\n \"textMode\": \"valueAndName\",\n \"textSize\": {}\n },\n \"datasourceCate\": \"prometheus\",\n \"datasourceValue\": \"${datasource}\",\n \"id\": \"4dd345c1-2bc1-474e-83b1-153be10a5b5b\",\n \"layout\": {\n \"h\": 3,\n \"i\": \"01c403f3-c3b0-4910-84df-a50d4968bcd6\",\n \"isResizable\": true,\n \"w\": 4,\n \"x\": 20,\n \"y\": 0\n },\n \"name\": \"Pending Tasks\",\n \"options\": {\n \"standardOptions\": {},\n \"valueMappings\": [\n {\n \"match\": {\n \"to\": 1\n },\n \"result\": {\n \"color\": \"#417505\"\n },\n \"type\": \"range\"\n },\n {\n \"match\": {\n \"from\": 1\n },\n \"result\": {\n \"color\": \"#d0021b\"\n },\n \"type\": \"range\"\n }\n ]\n },\n \"targets\": [\n {\n \"expr\": \"max(elasticsearch_cluster_health_number_of_pending_tasks{service =\\\"$service\\\"})\",\n \"refId\": \"A\"\n }\n ],\n \"type\": \"stat\",\n \"version\": \"2.0.0\"\n },\n {\n \"collapsed\": true,\n \"id\": \"b398d46e-7345-4cc9-90b4-918cbd1e8d1f\",\n \"layout\": {\n \"h\": 1,\n \"i\": \"b398d46e-7345-4cc9-90b4-918cbd1e8d1f\",\n \"isResizable\": false,\n \"w\": 24,\n \"x\": 0,\n \"y\": 3\n },\n \"name\": \"Breakers\",\n \"panels\": [],\n \"type\": \"row\"\n },\n {\n \"custom\": {\n \"drawStyle\": \"lines\",\n \"fillOpacity\": 0.04,\n \"lineInterpolation\": \"smooth\",\n \"stack\": \"off\"\n },\n \"datasourceCate\": \"prometheus\",\n \"datasourceValue\": \"${datasource}\",\n \"id\": \"15882e6f-0585-4035-bfb6-71cb9caaa0a8\",\n \"layout\": {\n \"h\": 4,\n \"i\": \"15882e6f-0585-4035-bfb6-71cb9caaa0a8\",\n \"isResizable\": true,\n \"w\": 12,\n \"x\": 0,\n \"y\": 4\n },\n \"name\": \"Tripped for breakers\",\n \"options\": {\n \"legend\": {\n \"displayMode\": \"hidden\"\n },\n \"standardOptions\": {},\n \"thresholds\": {},\n \"tooltip\": {\n \"mode\": \"all\",\n \"sort\": \"none\"\n }\n },\n \"targets\": [\n {\n \"expr\": \"sum({__name__=~\\\"elasticsearch_breakers_.+_tripped\\\", service =\\\"$service\\\", node_host=~\\\"$node_host\\\"}) by (node_host)\",\n \"legend\": \"\",\n \"refId\": \"A\"\n }\n ],\n \"type\": \"timeseries\",\n \"version\": \"2.0.0\"\n },\n {\n \"custom\": {\n \"drawStyle\": \"lines\",\n \"fillOpacity\": 0.04,\n \"gradientMode\": \"none\",\n \"lineInterpolation\": \"smooth\",\n \"lineWidth\": 1,\n \"scaleDistribution\": {\n \"type\": \"linear\"\n },\n \"spanNulls\": false,\n \"stack\": \"off\"\n },\n \"datasourceCate\": \"prometheus\",\n \"datasourceValue\": \"${datasource}\",\n \"id\": \"8adbc8e4-f630-4a25-98e3-ee03dec92011\",\n \"layout\": {\n \"h\": 4,\n \"i\": \"d05d16d0-022d-49f8-9b55-2388c4cbb2b1\",\n \"isResizable\": true,\n \"w\": 12,\n \"x\": 12,\n \"y\": 4\n },\n \"name\": \"Estimated size in bytes of breaker\",\n \"options\": {\n \"legend\": {\n \"displayMode\": \"hidden\"\n },\n \"standardOptions\": {},\n \"thresholds\": {\n \"steps\": [\n {\n \"color\": \"#634CD9\",\n \"type\": \"base\",\n \"value\": null\n }\n ]\n },\n \"tooltip\": {\n \"mode\": \"all\",\n \"sort\": \"desc\"\n }\n },\n \"targets\": [\n {\n \"expr\": \"{__name__=~\\\"elasticsearch_breakers_.+_size_in_bytes\\\", service =\\\"$service\\\", node_host=~\\\"$node_host\\\"}\",\n \"legend\": \"{{__name__}} {{node_host}}\",\n \"refId\": \"A\"\n }\n ],\n \"type\": \"timeseries\",\n \"version\": \"2.0.0\"\n },\n {\n \"collapsed\": true,\n \"id\": \"2aadd697-3bed-4f70-bc74-4bc801ef7d1d\",\n \"layout\": {\n \"h\": 1,\n \"i\": \"2aadd697-3bed-4f70-bc74-4bc801ef7d1d\",\n \"isResizable\": false,\n \"w\": 24,\n \"x\": 0,\n \"y\": 8\n },\n \"name\": \"Shards\",\n \"panels\": [],\n \"type\": \"row\"\n },\n {\n \"custom\": {\n \"calc\": \"lastNotNull\",\n \"colSpan\": 1,\n \"colorMode\": \"value\",\n \"textMode\": \"valueAndName\",\n \"textSize\": {}\n },\n \"datasourceCate\": \"prometheus\",\n \"datasourceValue\": \"${datasource}\",\n \"id\": \"7aec074e-1672-4dbb-8529-28292f9a4221\",\n \"layout\": {\n \"h\": 3,\n \"i\": \"7aec074e-1672-4dbb-8529-28292f9a4221\",\n \"isResizable\": true,\n \"w\": 4,\n \"x\": 0,\n \"y\": 9\n },\n \"name\": \"Active shards\",\n \"options\": {\n \"standardOptions\": {}\n },\n \"targets\": [\n {\n \"expr\": \"max(elasticsearch_cluster_health_active_shards{service =\\\"$service\\\"})\",\n \"refId\": \"A\"\n }\n ],\n \"type\": \"stat\",\n \"version\": \"2.0.0\"\n },\n {\n \"custom\": {\n \"calc\": \"lastNotNull\",\n \"colSpan\": 1,\n \"colorMode\": \"value\",\n \"textMode\": \"valueAndName\",\n \"textSize\": {}\n },\n \"datasourceCate\": \"prometheus\",\n \"datasourceValue\": \"${datasource}\",\n \"id\": \"f138daa7-b98f-4575-89e3-42363a8102c9\",\n \"layout\": {\n \"h\": 3,\n \"i\": \"fe82bb33-7b8d-4909-adda-64a4121f29fd\",\n \"isResizable\": true,\n \"w\": 4,\n \"x\": 4,\n \"y\": 9\n },\n \"name\": \"Active primary shards\",\n \"options\": {\n \"standardOptions\": {}\n },\n \"targets\": [\n {\n \"expr\": \"max(elasticsearch_cluster_health_active_primary_shards{service =\\\"$service\\\"})\",\n \"refId\": \"A\"\n }\n ],\n \"type\": \"stat\",\n \"version\": \"2.0.0\"\n },\n {\n \"custom\": {\n \"calc\": \"lastNotNull\",\n \"colSpan\": 1,\n \"colorMode\": \"value\",\n \"textMode\": \"valueAndName\",\n \"textSize\": {}\n },\n \"datasourceCate\": \"prometheus\",\n \"datasourceValue\": \"${datasource}\",\n \"id\": \"7412543a-dba5-4624-96ff-11e30b7e8ff4\",\n \"layout\": {\n \"h\": 3,\n \"i\": \"de2c46fd-dcfd-43a3-847b-9fd1320dfaa7\",\n \"isResizable\": true,\n \"w\": 4,\n \"x\": 8,\n \"y\": 9\n },\n \"name\": \"Initializing shards\",\n \"options\": {\n \"standardOptions\": {}\n },\n \"targets\": [\n {\n \"expr\": \"max(elasticsearch_cluster_health_initializing_shards{service =\\\"$service\\\"})\",\n \"refId\": \"A\"\n }\n ],\n \"type\": \"stat\",\n \"version\": \"2.0.0\"\n },\n {\n \"custom\": {\n \"calc\": \"lastNotNull\",\n \"colSpan\": 1,\n \"colorMode\": \"value\",\n \"textMode\": \"valueAndName\",\n \"textSize\": {}\n },\n \"datasourceCate\": \"prometheus\",\n \"datasourceValue\": \"${datasource}\",\n \"id\": \"2f26f24f-2a79-4552-b79d-60b41fa3aee6\",\n \"layout\": {\n \"h\": 3,\n \"i\": \"4403206d-a491-4564-9f61-db25a6beb356\",\n \"isResizable\": true,\n \"w\": 4,\n \"x\": 12,\n \"y\": 9\n },\n \"name\": \"Relocating shards\",\n \"options\": {\n \"standardOptions\": {}\n },\n \"targets\": [\n {\n \"expr\": \"max(elasticsearch_cluster_health_relocating_shards{service =\\\"$service\\\"})\",\n \"refId\": \"A\"\n }\n ],\n \"type\": \"stat\",\n \"version\": \"2.0.0\"\n },\n {\n \"custom\": {\n \"calc\": \"lastNotNull\",\n \"colSpan\": 1,\n \"colorMode\": \"value\",\n \"textMode\": \"valueAndName\",\n \"textSize\": {}\n },\n \"datasourceCate\": \"prometheus\",\n \"datasourceValue\": \"${datasource}\",\n \"id\": \"394a83cc-f4e1-467e-83fa-b77d2c2be907\",\n \"layout\": {\n \"h\": 3,\n \"i\": \"e24c847a-5704-4b7c-861e-75dd4e4b59d8\",\n \"isResizable\": true,\n \"w\": 4,\n \"x\": 16,\n \"y\": 9\n },\n \"name\": \"Delayed Unassigned shards\",\n \"options\": {\n \"standardOptions\": {}\n },\n \"targets\": [\n {\n \"expr\": \"max(elasticsearch_cluster_health_delayed_unassigned_shards{service =\\\"$service\\\"})\",\n \"refId\": \"A\"\n }\n ],\n \"type\": \"stat\",\n \"version\": \"2.0.0\"\n },\n {\n \"custom\": {\n \"calc\": \"lastNotNull\",\n \"colSpan\": 1,\n \"colorMode\": \"value\",\n \"textMode\": \"valueAndName\",\n \"textSize\": {}\n },\n \"datasourceCate\": \"prometheus\",\n \"datasourceValue\": \"${datasource}\",\n \"id\": \"720b9719-5c37-44d9-bce8-539308afa6ae\",\n \"layout\": {\n \"h\": 3,\n \"i\": \"d82314d5-028c-41fb-a79f-34699d56d17a\",\n \"isResizable\": true,\n \"w\": 4,\n \"x\": 20,\n \"y\": 9\n },\n \"name\": \"Unassigned shards\",\n \"options\": {\n \"standardOptions\": {}\n },\n \"targets\": [\n {\n \"expr\": \"max(elasticsearch_cluster_health_unassigned_shards{service =\\\"$service\\\"})\",\n \"refId\": \"A\"\n }\n ],\n \"type\": \"stat\",\n \"version\": \"2.0.0\"\n },\n {\n \"collapsed\": true,\n \"id\": \"a1bc2be7-723b-4fe4-b217-bfdd8248559e\",\n \"layout\": {\n \"h\": 1,\n \"i\": \"a1bc2be7-723b-4fe4-b217-bfdd8248559e\",\n \"isResizable\": false,\n \"w\": 24,\n \"x\": 0,\n \"y\": 12\n },\n \"name\": \"JVM\",\n \"panels\": [],\n \"type\": \"row\"\n },\n {\n \"custom\": {\n \"drawStyle\": \"lines\",\n \"fillOpacity\": 0.3,\n \"gradientMode\": \"opacity\",\n \"lineInterpolation\": \"smooth\",\n \"lineWidth\": 2,\n \"stack\": \"off\"\n },\n \"datasourceCate\": \"prometheus\",\n \"datasourceValue\": \"${datasource}\",\n \"id\": \"ee0c56e0-8f8e-4cbe-ac41-de2afad7b75a\",\n \"layout\": {\n \"h\": 4,\n \"i\": \"ee0c56e0-8f8e-4cbe-ac41-de2afad7b75a\",\n \"isResizable\": true,\n \"w\": 12,\n \"x\": 0,\n \"y\": 13\n },\n \"name\": \"GC counts / second\",\n \"options\": {\n \"legend\": {\n \"displayMode\": \"hidden\"\n },\n \"standardOptions\": {},\n \"thresholds\": {},\n \"tooltip\": {\n \"mode\": \"all\",\n \"sort\": \"none\"\n }\n },\n \"targets\": [\n {\n \"expr\": \"irate(elasticsearch_jvm_gc_collectors_old_collection_count{service =\\\"$service\\\", node_host=~\\\"$node_host\\\"}[5m])\",\n \"legend\": \"old gc {{node_host}}\",\n \"refId\": \"A\"\n },\n {\n \"expr\": \"irate(elasticsearch_jvm_gc_collectors_young_collection_count{service =\\\"$service\\\", node_host=~\\\"$node_host\\\"}[5m])\",\n \"legend\": \"young gc {{node_host}}\",\n \"refId\": \"B\"\n }\n ],\n \"type\": \"timeseries\",\n \"version\": \"2.0.0\"\n },\n {\n \"custom\": {\n \"drawStyle\": \"lines\",\n \"fillOpacity\": 0.3,\n \"gradientMode\": \"opacity\",\n \"lineInterpolation\": \"smooth\",\n \"lineWidth\": 2,\n \"stack\": \"off\"\n },\n \"datasourceCate\": \"prometheus\",\n \"datasourceValue\": \"${datasource}\",\n \"id\": \"5c361278-8a94-4b16-afdd-e6def804b9ff\",\n \"layout\": {\n \"h\": 4,\n \"i\": \"4f21ebfc-b51c-469b-b149-479966750920\",\n \"isResizable\": true,\n \"w\": 12,\n \"x\": 12,\n \"y\": 13\n },\n \"name\": \"GC time in millis\",\n \"options\": {\n \"legend\": {\n \"displayMode\": \"hidden\"\n },\n \"standardOptions\": {},\n \"thresholds\": {},\n \"tooltip\": {\n \"mode\": \"all\",\n \"sort\": \"none\"\n }\n },\n \"targets\": [\n {\n \"expr\": \"irate(elasticsearch_jvm_gc_collectors_old_collection_time_in_millis{service =\\\"$service\\\", node_host=~\\\"$node_host\\\"}[5m])\",\n \"legend\": \"old gc {{node_host}}\",\n \"refId\": \"A\"\n },\n {\n \"expr\": \"irate(elasticsearch_jvm_gc_collectors_young_collection_time_in_millis{service =\\\"$service\\\", node_host=~\\\"$node_host\\\"}[5m])\",\n \"legend\": \"young gc {{node_host}}\",\n \"refId\": \"B\"\n }\n ],\n \"type\": \"timeseries\",\n \"version\": \"2.0.0\"\n },\n {\n \"custom\": {\n \"drawStyle\": \"lines\",\n \"fillOpacity\": 0.3,\n \"gradientMode\": \"opacity\",\n \"lineInterpolation\": \"smooth\",\n \"lineWidth\": 2,\n \"scaleDistribution\": {\n \"type\": \"linear\"\n },\n \"spanNulls\": false,\n \"stack\": \"off\"\n },\n \"datasourceCate\": \"prometheus\",\n \"datasourceValue\": \"${datasource}\",\n \"id\": \"ff81d109-79e5-4909-8765-857a75cebf17\",\n \"layout\": {\n \"h\": 4,\n \"i\": \"5105f1dc-26cb-4818-a04d-90f2e5803da2\",\n \"isResizable\": true,\n \"w\": 6,\n \"x\": 0,\n \"y\": 17\n },\n \"name\": \"Yong Used(Bytes)\",\n \"options\": {\n \"legend\": {\n \"displayMode\": \"hidden\"\n },\n \"standardOptions\": {\n \"decimals\": 1,\n \"util\": \"bytesIEC\"\n },\n \"thresholds\": {\n \"steps\": [\n {\n \"color\": \"#634CD9\",\n \"type\": \"base\",\n \"value\": null\n }\n ]\n },\n \"tooltip\": {\n \"mode\": \"all\",\n \"sort\": \"desc\"\n }\n },\n \"targets\": [\n {\n \"expr\": \"{__name__=~\\\"elasticsearch_jvm_mem_pools_young_used_in_bytes\\\", service =\\\"$service\\\", node_host=~\\\"$node_host\\\"}\",\n \"legend\": \"{{__name__}} {{node_name}}\",\n \"refId\": \"A\"\n }\n ],\n \"type\": \"timeseries\",\n \"version\": \"2.0.0\"\n },\n {\n \"custom\": {\n \"drawStyle\": \"lines\",\n \"fillOpacity\": 0.3,\n \"gradientMode\": \"opacity\",\n \"lineInterpolation\": \"smooth\",\n \"lineWidth\": 2,\n \"scaleDistribution\": {\n \"type\": \"linear\"\n },\n \"spanNulls\": false,\n \"stack\": \"off\"\n },\n \"datasourceCate\": \"prometheus\",\n \"datasourceValue\": \"${datasource}\",\n \"id\": \"d7c76456-8f34-4e1b-843b-9d174bbdfcee\",\n \"layout\": {\n \"h\": 4,\n \"i\": \"86841663-2a17-4858-a9e1-13c296b3bb76\",\n \"isResizable\": true,\n \"w\": 6,\n \"x\": 6,\n \"y\": 17\n },\n \"name\": \"Old Used(Bytes)\",\n \"options\": {\n \"legend\": {\n \"displayMode\": \"hidden\"\n },\n \"standardOptions\": {\n \"decimals\": 1,\n \"util\": \"bytesIEC\"\n },\n \"thresholds\": {\n \"steps\": [\n {\n \"color\": \"#634CD9\",\n \"type\": \"base\",\n \"value\": null\n }\n ]\n },\n \"tooltip\": {\n \"mode\": \"all\",\n \"sort\": \"desc\"\n }\n },\n \"targets\": [\n {\n \"expr\": \"{__name__=~\\\"elasticsearch_jvm_mem_pools_old_used_in_bytes\\\", service =\\\"$service\\\", node_host=~\\\"$node_host\\\"}\",\n \"legend\": \"{{__name__}} {{node_name}}\",\n \"refId\": \"A\"\n }\n ],\n \"type\": \"timeseries\",\n \"version\": \"2.0.0\"\n },\n {\n \"custom\": {\n \"drawStyle\": \"lines\",\n \"fillOpacity\": 0.3,\n \"gradientMode\": \"opacity\",\n \"lineInterpolation\": \"smooth\",\n \"lineWidth\": 2,\n \"stack\": \"off\"\n },\n \"datasourceCate\": \"prometheus\",\n \"datasourceValue\": \"${datasource}\",\n \"id\": \"a0096936-3790-40a1-b2ad-d7805945b948\",\n \"layout\": {\n \"h\": 4,\n \"i\": \"14f655ac-9c1c-40fa-bfef-158cc8601ead\",\n \"isResizable\": true,\n \"w\": 12,\n \"x\": 12,\n \"y\": 17\n },\n \"name\": \"Committed Bytes\",\n \"options\": {\n \"legend\": {\n \"displayMode\": \"hidden\"\n },\n \"standardOptions\": {\n \"decimals\": 1,\n \"util\": \"bytesIEC\"\n },\n \"thresholds\": {},\n \"tooltip\": {\n \"mode\": \"all\",\n \"sort\": \"desc\"\n }\n },\n \"targets\": [\n {\n \"expr\": \"{__name__=~\\\"elasticsearch_jvm_mem_.+_committed_in_bytes\\\", service =\\\"$service\\\", node_host=~\\\"$node_host\\\"}\",\n \"legend\": \"{{__name__}} {{node_name}}\",\n \"refId\": \"A\"\n }\n ],\n \"type\": \"timeseries\",\n \"version\": \"2.0.0\"\n },\n {\n \"collapsed\": true,\n \"id\": \"e1d04a8c-81ee-4949-87de-3b70bc637584\",\n \"layout\": {\n \"h\": 1,\n \"i\": \"e1d04a8c-81ee-4949-87de-3b70bc637584\",\n \"isResizable\": false,\n \"w\": 24,\n \"x\": 0,\n \"y\": 21\n },\n \"name\": \"Translog\",\n \"panels\": [],\n \"type\": \"row\"\n },\n {\n \"custom\": {\n \"drawStyle\": \"lines\",\n \"fillOpacity\": 0.3,\n \"gradientMode\": \"opacity\",\n \"lineInterpolation\": \"smooth\",\n \"lineWidth\": 2,\n \"stack\": \"off\"\n },\n \"datasourceCate\": \"prometheus\",\n \"datasourceValue\": \"${datasource}\",\n \"id\": \"45aafb11-c694-4686-89ab-685068f91560\",\n \"layout\": {\n \"h\": 4,\n \"i\": \"45aafb11-c694-4686-89ab-685068f91560\",\n \"isResizable\": true,\n \"w\": 12,\n \"x\": 0,\n \"y\": 22\n },\n \"name\": \"Total translog operations\",\n \"options\": {\n \"legend\": {\n \"displayMode\": \"hidden\"\n },\n \"standardOptions\": {},\n \"thresholds\": {},\n \"tooltip\": {\n \"mode\": \"all\",\n \"sort\": \"none\"\n }\n },\n \"targets\": [\n {\n \"expr\": \"irate(elasticsearch_indices_translog_operations{service =\\\"$service\\\", node_host=~\\\"$node_host\\\"}[5m])\",\n \"legend\": \"{{node_host}}\",\n \"refId\": \"A\"\n }\n ],\n \"type\": \"timeseries\",\n \"version\": \"2.0.0\"\n },\n {\n \"custom\": {\n \"drawStyle\": \"lines\",\n \"fillOpacity\": 0.3,\n \"gradientMode\": \"opacity\",\n \"lineInterpolation\": \"smooth\",\n \"lineWidth\": 2,\n \"stack\": \"off\"\n },\n \"datasourceCate\": \"prometheus\",\n \"datasourceValue\": \"${datasource}\",\n \"id\": \"09ca6329-8eec-4a61-b19e-9bbeea2b9712\",\n \"layout\": {\n \"h\": 4,\n \"i\": \"56806f8a-525a-4ab4-a9d3-c83559ae4828\",\n \"isResizable\": true,\n \"w\": 12,\n \"x\": 12,\n \"y\": 22\n },\n \"name\": \"Total translog size in bytes\",\n \"options\": {\n \"legend\": {\n \"displayMode\": \"hidden\"\n },\n \"standardOptions\": {\n \"decimals\": 1,\n \"util\": \"bytesIEC\"\n },\n \"thresholds\": {},\n \"tooltip\": {\n \"mode\": \"all\",\n \"sort\": \"none\"\n }\n },\n \"targets\": [\n {\n \"expr\": \"irate(elasticsearch_indices_translog_size_in_bytes{service =\\\"$service\\\", node_host=~\\\"$node_host\\\"}[5m])\",\n \"legend\": \"{{node_host}}\",\n \"refId\": \"A\"\n }\n ],\n \"type\": \"timeseries\",\n \"version\": \"2.0.0\"\n },\n {\n \"collapsed\": true,\n \"id\": \"d9694c3f-9a14-4bde-9427-88531b0ea3a6\",\n \"layout\": {\n \"h\": 1,\n \"i\": \"d9694c3f-9a14-4bde-9427-88531b0ea3a6\",\n \"isResizable\": false,\n \"w\": 24,\n \"x\": 0,\n \"y\": 26\n },\n \"name\": \"Disk and Network\",\n \"panels\": [],\n \"type\": \"row\"\n },\n {\n \"custom\": {\n \"drawStyle\": \"lines\",\n \"fillOpacity\": 0.3,\n \"gradientMode\": \"opacity\",\n \"lineInterpolation\": \"smooth\",\n \"lineWidth\": 2,\n \"stack\": \"off\"\n },\n \"datasourceCate\": \"prometheus\",\n \"datasourceValue\": \"${datasource}\",\n \"id\": \"6c0d9b3c-dda5-4da9-825e-33f650dbb008\",\n \"layout\": {\n \"h\": 4,\n \"i\": \"6c0d9b3c-dda5-4da9-825e-33f650dbb008\",\n \"isResizable\": true,\n \"w\": 12,\n \"x\": 0,\n \"y\": 27\n },\n \"name\": \"Disk usage %\",\n \"options\": {\n \"legend\": {\n \"displayMode\": \"hidden\"\n },\n \"standardOptions\": {\n \"util\": \"percentUnit\"\n },\n \"thresholds\": {},\n \"tooltip\": {\n \"mode\": \"all\",\n \"sort\": \"desc\"\n }\n },\n \"targets\": [\n {\n \"expr\": \"1-(elasticsearch_fs_total_available_in_bytes{service =\\\"$service\\\",node_host=~\\\"$node_host\\\"}/elasticsearch_fs_total_total_in_bytes{service =\\\"$service\\\",node_host=~\\\"$node_host\\\"})\",\n \"legend\": \"{{node_host}}\",\n \"refId\": \"A\"\n }\n ],\n \"type\": \"timeseries\",\n \"version\": \"2.0.0\"\n },\n {\n \"custom\": {\n \"drawStyle\": \"lines\",\n \"fillOpacity\": 0.3,\n \"gradientMode\": \"opacity\",\n \"lineInterpolation\": \"smooth\",\n \"lineWidth\": 2,\n \"stack\": \"off\"\n },\n \"datasourceCate\": \"prometheus\",\n \"datasourceValue\": \"${datasource}\",\n \"id\": \"4f7ce5a7-2771-4cbf-a569-b1a90b070b93\",\n \"layout\": {\n \"h\": 4,\n \"i\": \"4f7ce5a7-2771-4cbf-a569-b1a90b070b93\",\n \"isResizable\": true,\n \"w\": 12,\n \"x\": 12,\n \"y\": 27\n },\n \"name\": \"Network usage\",\n \"options\": {\n \"legend\": {\n \"displayMode\": \"hidden\"\n },\n \"standardOptions\": {},\n \"thresholds\": {},\n \"tooltip\": {\n \"mode\": \"all\",\n \"sort\": \"desc\"\n }\n },\n \"targets\": [\n {\n \"expr\": \"irate(elasticsearch_transport_tx_size_in_bytes{service =\\\"$service\\\",node_host=~\\\"$node_host\\\"}[5m])\",\n \"legend\": \"{{node_host}}: sent\",\n \"refId\": \"A\"\n },\n {\n \"expr\": \"-irate(elasticsearch_transport_rx_size_in_bytes{service =\\\"$service\\\",node_host=~\\\"$node_host\\\"}[5m])\",\n \"legend\": \"{{node_host}}: received\",\n \"refId\": \"B\"\n }\n ],\n \"type\": \"timeseries\",\n \"version\": \"2.0.0\"\n },\n {\n \"collapsed\": true,\n \"id\": \"292b6c24-5471-4eeb-9d65-1a1e7a684fe3\",\n \"layout\": {\n \"h\": 1,\n \"i\": \"292b6c24-5471-4eeb-9d65-1a1e7a684fe3\",\n \"isResizable\": false,\n \"w\": 24,\n \"x\": 0,\n \"y\": 31\n },\n \"name\": \"Documents\",\n \"panels\": [],\n \"type\": \"row\"\n },\n {\n \"custom\": {\n \"drawStyle\": \"lines\",\n \"fillOpacity\": 0.3,\n \"gradientMode\": \"opacity\",\n \"lineInterpolation\": \"smooth\",\n \"lineWidth\": 2,\n \"stack\": \"off\"\n },\n \"datasourceCate\": \"prometheus\",\n \"datasourceValue\": \"${datasource}\",\n \"id\": \"e98839c4-e3f3-4e6e-be3a-c44b70e6072c\",\n \"layout\": {\n \"h\": 4,\n \"i\": \"e98839c4-e3f3-4e6e-be3a-c44b70e6072c\",\n \"isResizable\": true,\n \"w\": 12,\n \"x\": 0,\n \"y\": 32\n },\n \"name\": \"Documents count on node\",\n \"options\": {\n \"legend\": {\n \"displayMode\": \"hidden\"\n },\n \"standardOptions\": {},\n \"thresholds\": {},\n \"tooltip\": {\n \"mode\": \"all\",\n \"sort\": \"desc\"\n }\n },\n \"targets\": [\n {\n \"expr\": \"elasticsearch_indices_docs_count{service =\\\"$service\\\", node_host=~\\\"$node_host\\\"}\",\n \"legend\": \"{{node_host}}\",\n \"refId\": \"A\"\n }\n ],\n \"type\": \"timeseries\",\n \"version\": \"2.0.0\"\n },\n {\n \"custom\": {\n \"drawStyle\": \"lines\",\n \"fillOpacity\": 0.3,\n \"gradientMode\": \"opacity\",\n \"lineInterpolation\": \"smooth\",\n \"lineWidth\": 2,\n \"stack\": \"off\"\n },\n \"datasourceCate\": \"prometheus\",\n \"datasourceValue\": \"${datasource}\",\n \"id\": \"45c4e3d9-90f1-41bd-8169-1d8c0a921ba9\",\n \"layout\": {\n \"h\": 4,\n \"i\": \"45c4e3d9-90f1-41bd-8169-1d8c0a921ba9\",\n \"isResizable\": true,\n \"w\": 12,\n \"x\": 12,\n \"y\": 32\n },\n \"name\": \"Documents indexed rate\",\n \"options\": {\n \"legend\": {\n \"displayMode\": \"hidden\"\n },\n \"standardOptions\": {},\n \"thresholds\": {},\n \"tooltip\": {\n \"mode\": \"all\",\n \"sort\": \"desc\"\n }\n },\n \"targets\": [\n {\n \"expr\": \"irate(elasticsearch_indices_indexing_index_total{service =\\\"$service\\\",node_host=~\\\"$node_host\\\"}[5m])\",\n \"legend\": \"{{node_host}}\",\n \"refId\": \"A\"\n }\n ],\n \"type\": \"timeseries\",\n \"version\": \"2.0.0\"\n },\n {\n \"custom\": {\n \"drawStyle\": \"lines\",\n \"fillOpacity\": 0.3,\n \"gradientMode\": \"opacity\",\n \"lineInterpolation\": \"smooth\",\n \"lineWidth\": 2,\n \"stack\": \"off\"\n },\n \"datasourceCate\": \"prometheus\",\n \"datasourceValue\": \"${datasource}\",\n \"id\": \"3b2a922d-4423-4845-8cfc-95970f3300d6\",\n \"layout\": {\n \"h\": 4,\n \"i\": \"3b2a922d-4423-4845-8cfc-95970f3300d6\",\n \"isResizable\": true,\n \"w\": 12,\n \"x\": 0,\n \"y\": 36\n },\n \"name\": \"Documents deleted rate\",\n \"options\": {\n \"legend\": {\n \"displayMode\": \"hidden\"\n },\n \"standardOptions\": {},\n \"thresholds\": {},\n \"tooltip\": {\n \"mode\": \"all\",\n \"sort\": \"desc\"\n }\n },\n \"targets\": [\n {\n \"expr\": \"irate(elasticsearch_indices_docs_deleted{service =\\\"$service\\\",node_host=~\\\"$node_host\\\"}[5m])\",\n \"legend\": \"{{node_host}}\",\n \"refId\": \"A\"\n }\n ],\n \"type\": \"timeseries\",\n \"version\": \"2.0.0\"\n },\n {\n \"custom\": {\n \"drawStyle\": \"lines\",\n \"fillOpacity\": 0.3,\n \"gradientMode\": \"opacity\",\n \"lineInterpolation\": \"smooth\",\n \"lineWidth\": 2,\n \"stack\": \"off\"\n },\n \"datasourceCate\": \"prometheus\",\n \"datasourceValue\": \"${datasource}\",\n \"id\": \"764fbcf7-3056-41ef-b62a-51813a6c315f\",\n \"layout\": {\n \"h\": 4,\n \"i\": \"764fbcf7-3056-41ef-b62a-51813a6c315f\",\n \"isResizable\": true,\n \"w\": 6,\n \"x\": 12,\n \"y\": 36\n },\n \"name\": \"Documents merged rate\",\n \"options\": {\n \"legend\": {\n \"displayMode\": \"hidden\"\n },\n \"standardOptions\": {},\n \"thresholds\": {},\n \"tooltip\": {\n \"mode\": \"all\",\n \"sort\": \"desc\"\n }\n },\n \"targets\": [\n {\n \"expr\": \"rate(elasticsearch_indices_merges_total_docs{service =\\\"$service\\\",node_host=~\\\"$node_host\\\"}[5m])\",\n \"legend\": \"{{node_host}}\",\n \"refId\": \"A\"\n }\n ],\n \"type\": \"timeseries\",\n \"version\": \"2.0.0\"\n },\n {\n \"custom\": {\n \"drawStyle\": \"lines\",\n \"fillOpacity\": 0.3,\n \"gradientMode\": \"opacity\",\n \"lineInterpolation\": \"smooth\",\n \"lineWidth\": 2,\n \"stack\": \"off\"\n },\n \"datasourceCate\": \"prometheus\",\n \"datasourceValue\": \"${datasource}\",\n \"id\": \"7cc04ae4-946d-4837-9ea9-764a7cc2eecd\",\n \"layout\": {\n \"h\": 4,\n \"i\": \"97b5d900-e91e-4e0e-8184-f508a3433bc6\",\n \"isResizable\": true,\n \"w\": 6,\n \"x\": 18,\n \"y\": 36\n },\n \"name\": \"Documents merged bytes\",\n \"options\": {\n \"legend\": {\n \"displayMode\": \"hidden\"\n },\n \"standardOptions\": {\n \"decimals\": 1,\n \"util\": \"bytesIEC\"\n },\n \"thresholds\": {},\n \"tooltip\": {\n \"mode\": \"all\",\n \"sort\": \"desc\"\n }\n },\n \"targets\": [\n {\n \"expr\": \"irate(elasticsearch_indices_merges_total_size_in_bytes{service =\\\"$service\\\",node_host=~\\\"$node_host\\\"}[5m])\",\n \"legend\": \"{{node_host}}\",\n \"refId\": \"A\"\n }\n ],\n \"type\": \"timeseries\",\n \"version\": \"2.0.0\"\n },\n {\n \"collapsed\": true,\n \"id\": \"a0545cbd-6df5-4845-90e0-88a710f738ba\",\n \"layout\": {\n \"h\": 1,\n \"i\": \"a0545cbd-6df5-4845-90e0-88a710f738ba\",\n \"isResizable\": false,\n \"w\": 24,\n \"x\": 0,\n \"y\": 40\n },\n \"name\": \"Times\",\n \"panels\": [],\n \"type\": \"row\"\n },\n {\n \"custom\": {\n \"drawStyle\": \"lines\",\n \"fillOpacity\": 0.3,\n \"gradientMode\": \"opacity\",\n \"lineInterpolation\": \"smooth\",\n \"lineWidth\": 2,\n \"stack\": \"off\"\n },\n \"datasourceCate\": \"prometheus\",\n \"datasourceValue\": \"${datasource}\",\n \"id\": \"ad0445b0-8539-440d-bbf4-712450132a7a\",\n \"layout\": {\n \"h\": 4,\n \"i\": \"ad0445b0-8539-440d-bbf4-712450132a7a\",\n \"isResizable\": true,\n \"w\": 12,\n \"x\": 0,\n \"y\": 41\n },\n \"name\": \"Query time(Unit: ms)\",\n \"options\": {\n \"legend\": {\n \"displayMode\": \"hidden\"\n },\n \"standardOptions\": {},\n \"thresholds\": {},\n \"tooltip\": {\n \"mode\": \"all\",\n \"sort\": \"desc\"\n }\n },\n \"targets\": [\n {\n \"expr\": \"irate(elasticsearch_indices_search_query_time_in_millis{service =\\\"$service\\\",node_host=~\\\"$node_host\\\"}[5m])\",\n \"legend\": \"{{node_host}}\",\n \"refId\": \"A\"\n }\n ],\n \"type\": \"timeseries\",\n \"version\": \"2.0.0\"\n },\n {\n \"custom\": {\n \"drawStyle\": \"lines\",\n \"fillOpacity\": 0.3,\n \"gradientMode\": \"opacity\",\n \"lineInterpolation\": \"smooth\",\n \"lineWidth\": 2,\n \"stack\": \"off\"\n },\n \"datasourceCate\": \"prometheus\",\n \"datasourceValue\": \"${datasource}\",\n \"id\": \"c3cf6c57-c4ce-4bc2-a150-df32c4951144\",\n \"layout\": {\n \"h\": 4,\n \"i\": \"2af98dc1-f24e-4c7b-bd2c-723224facc5d\",\n \"isResizable\": true,\n \"w\": 12,\n \"x\": 12,\n \"y\": 41\n },\n \"name\": \"Indexing time(Unit: ms)\",\n \"options\": {\n \"legend\": {\n \"displayMode\": \"hidden\"\n },\n \"standardOptions\": {},\n \"thresholds\": {},\n \"tooltip\": {\n \"mode\": \"all\",\n \"sort\": \"desc\"\n }\n },\n \"targets\": [\n {\n \"expr\": \"irate(elasticsearch_indices_indexing_index_time_in_millis{service =\\\"$service\\\",node_host=~\\\"$node_host\\\"}[5m])\",\n \"legend\": \"{{node_host}}\",\n \"refId\": \"A\"\n }\n ],\n \"type\": \"timeseries\",\n \"version\": \"2.0.0\"\n },\n {\n \"custom\": {\n \"drawStyle\": \"lines\",\n \"fillOpacity\": 0.3,\n \"gradientMode\": \"opacity\",\n \"lineInterpolation\": \"smooth\",\n \"lineWidth\": 2,\n \"stack\": \"off\"\n },\n \"datasourceCate\": \"prometheus\",\n \"datasourceValue\": \"${datasource}\",\n \"id\": \"022db454-70ba-49f5-8c11-f89b76d145cb\",\n \"layout\": {\n \"h\": 4,\n \"i\": \"553c7da8-2d83-4ea0-a6ef-b064a5101633\",\n \"isResizable\": true,\n \"w\": 12,\n \"x\": 0,\n \"y\": 45\n },\n \"name\": \"Merging time(Unit: ms)\",\n \"options\": {\n \"legend\": {\n \"displayMode\": \"hidden\"\n },\n \"standardOptions\": {},\n \"thresholds\": {},\n \"tooltip\": {\n \"mode\": \"all\",\n \"sort\": \"desc\"\n }\n },\n \"targets\": [\n {\n \"expr\": \"irate(elasticsearch_indices_merges_total_time_in_millis{service =\\\"$service\\\",node_host=~\\\"$node_host\\\"}[5m])\",\n \"legend\": \"{{node_host}}\",\n \"refId\": \"A\"\n }\n ],\n \"type\": \"timeseries\",\n \"version\": \"2.0.0\"\n },\n {\n \"custom\": {\n \"drawStyle\": \"lines\",\n \"fillOpacity\": 0.3,\n \"gradientMode\": \"opacity\",\n \"lineInterpolation\": \"smooth\",\n \"lineWidth\": 2,\n \"stack\": \"off\"\n },\n \"datasourceCate\": \"prometheus\",\n \"datasourceValue\": \"${datasource}\",\n \"id\": \"f20bad4f-656c-428a-a1cf-aafb7d92137c\",\n \"layout\": {\n \"h\": 4,\n \"i\": \"51056e8d-6dc8-4c7f-91e9-9c24c056462d\",\n \"isResizable\": true,\n \"w\": 12,\n \"x\": 12,\n \"y\": 45\n },\n \"name\": \"Indexing throttle time(Unit: ms)\",\n \"options\": {\n \"legend\": {\n \"displayMode\": \"hidden\"\n },\n \"standardOptions\": {},\n \"thresholds\": {},\n \"tooltip\": {\n \"mode\": \"all\",\n \"sort\": \"desc\"\n }\n },\n \"targets\": [\n {\n \"expr\": \"irate(elasticsearch_indices_indexing_throttle_time_in_millis{service =\\\"$service\\\",node_host=~\\\"$node_host\\\"}[5m])\",\n \"legend\": \"{{node_host}}\",\n \"refId\": \"A\"\n }\n ],\n \"type\": \"timeseries\",\n \"version\": \"2.0.0\"\n },\n {\n \"collapsed\": true,\n \"id\": \"2c56fb7a-85a0-4396-a317-6754d761cff2\",\n \"layout\": {\n \"h\": 1,\n \"i\": \"2c56fb7a-85a0-4396-a317-6754d761cff2\",\n \"isResizable\": false,\n \"w\": 24,\n \"x\": 0,\n \"y\": 49\n },\n \"name\": \"Thread Pool\",\n \"panels\": [],\n \"type\": \"row\"\n },\n {\n \"custom\": {\n \"drawStyle\": \"lines\",\n \"fillOpacity\": 0.3,\n \"gradientMode\": \"opacity\",\n \"lineInterpolation\": \"smooth\",\n \"lineWidth\": 2,\n \"stack\": \"off\"\n },\n \"datasourceCate\": \"prometheus\",\n \"datasourceValue\": \"${datasource}\",\n \"id\": \"cefafeb9-fc8a-4c73-92b3-648cd6f08b11\",\n \"layout\": {\n \"h\": 4,\n \"i\": \"cefafeb9-fc8a-4c73-92b3-648cd6f08b11\",\n \"isResizable\": true,\n \"w\": 6,\n \"x\": 0,\n \"y\": 50\n },\n \"name\": \"Thread Pool operations rejected\",\n \"options\": {\n \"legend\": {\n \"displayMode\": \"hidden\"\n },\n \"standardOptions\": {},\n \"thresholds\": {},\n \"tooltip\": {\n \"mode\": \"all\",\n \"sort\": \"desc\"\n }\n },\n \"targets\": [\n {\n \"expr\": \"irate\\n(label_replace({__name__=~\\\"elasticsearch_thread_pool_(.*)_rejected\\\", service =\\\"$service\\\", node_host=~\\\"$node_host\\\"}, \\\"type\\\", \\\"$1\\\", \\\"__name__\\\", \\\"elasticsearch_thread_pool_(.*)_rejected\\\")[5m:])\",\n \"legend\": \"{{node_host}}: {{type}}\",\n \"refId\": \"A\"\n }\n ],\n \"type\": \"timeseries\",\n \"version\": \"2.0.0\"\n },\n {\n \"custom\": {\n \"drawStyle\": \"lines\",\n \"fillOpacity\": 0.3,\n \"gradientMode\": \"opacity\",\n \"lineInterpolation\": \"smooth\",\n \"lineWidth\": 2,\n \"stack\": \"off\"\n },\n \"datasourceCate\": \"prometheus\",\n \"datasourceValue\": \"${datasource}\",\n \"id\": \"0ab67903-16ea-4001-b784-ae04d8b815c0\",\n \"layout\": {\n \"h\": 4,\n \"i\": \"793e98e7-2729-4106-940c-ecccff1d4b89\",\n \"isResizable\": true,\n \"w\": 6,\n \"x\": 6,\n \"y\": 50\n },\n \"name\": \"Thread Pool threads active\",\n \"options\": {\n \"legend\": {\n \"displayMode\": \"hidden\"\n },\n \"standardOptions\": {},\n \"thresholds\": {},\n \"tooltip\": {\n \"mode\": \"all\",\n \"sort\": \"desc\"\n }\n },\n \"targets\": [\n {\n \"expr\": \"label_replace({__name__=~\\\"elasticsearch_thread_pool_(.*)_active\\\", service =\\\"$service\\\", node_host=~\\\"$node_host\\\"}, \\\"type\\\", \\\"$1\\\", \\\"__name__\\\", \\\"elasticsearch_thread_pool_(.*)_active\\\")\",\n \"legend\": \"{{node_host}}: {{type}}\",\n \"refId\": \"A\"\n }\n ],\n \"type\": \"timeseries\",\n \"version\": \"2.0.0\"\n },\n {\n \"custom\": {\n \"drawStyle\": \"lines\",\n \"fillOpacity\": 0.3,\n \"gradientMode\": \"opacity\",\n \"lineInterpolation\": \"smooth\",\n \"lineWidth\": 2,\n \"stack\": \"off\"\n },\n \"datasourceCate\": \"prometheus\",\n \"datasourceValue\": \"${datasource}\",\n \"id\": \"bb5dc07d-673b-4e2d-b44c-441acfa7c27b\",\n \"layout\": {\n \"h\": 4,\n \"i\": \"9a14c86a-86af-4464-ac82-41f621ce7166\",\n \"isResizable\": true,\n \"w\": 6,\n \"x\": 12,\n \"y\": 50\n },\n \"name\": \"Thread Pool threads queued\",\n \"options\": {\n \"legend\": {\n \"displayMode\": \"hidden\"\n },\n \"standardOptions\": {},\n \"thresholds\": {},\n \"tooltip\": {\n \"mode\": \"all\",\n \"sort\": \"desc\"\n }\n },\n \"targets\": [\n {\n \"expr\": \"label_replace({__name__=~\\\"elasticsearch_thread_pool_(.*)_queue\\\", service =\\\"$service\\\", node_host=~\\\"$node_host\\\"}, \\\"type\\\", \\\"$1\\\", \\\"__name__\\\", \\\"elasticsearch_thread_pool_(.*)_queue\\\")\",\n \"legend\": \"{{node_host}}: {{type}}\",\n \"refId\": \"A\"\n }\n ],\n \"type\": \"timeseries\",\n \"version\": \"2.0.0\"\n },\n {\n \"custom\": {\n \"drawStyle\": \"lines\",\n \"fillOpacity\": 0.3,\n \"gradientMode\": \"opacity\",\n \"lineInterpolation\": \"smooth\",\n \"lineWidth\": 2,\n \"stack\": \"off\"\n },\n \"datasourceCate\": \"prometheus\",\n \"datasourceValue\": \"${datasource}\",\n \"id\": \"4cac1498-c141-483f-97c6-e1177317a2ea\",\n \"layout\": {\n \"h\": 4,\n \"i\": \"d5f42ea7-bdb5-44da-9ba6-7c0f09ba7c71\",\n \"isResizable\": true,\n \"w\": 6,\n \"x\": 18,\n \"y\": 50\n },\n \"name\": \"Thread Pool operations completed\",\n \"options\": {\n \"legend\": {\n \"displayMode\": \"hidden\"\n },\n \"standardOptions\": {},\n \"thresholds\": {},\n \"tooltip\": {\n \"mode\": \"all\",\n \"sort\": \"desc\"\n }\n },\n \"targets\": [\n {\n \"expr\": \"irate\\n(label_replace({__name__=~\\\"elasticsearch_thread_pool_(.*)_completed\\\", service =\\\"$service\\\", node_host=~\\\"$node_host\\\"}, \\\"type\\\", \\\"$1\\\", \\\"__name__\\\", \\\"elasticsearch_thread_pool_(.*)_completed\\\")[5m:])\",\n \"legend\": \"{{node_host}}: {{type}}\",\n \"refId\": \"A\"\n }\n ],\n \"type\": \"timeseries\",\n \"version\": \"2.0.0\"\n },\n {\n \"collapsed\": true,\n \"id\": \"a5c3b529-c329-4a66-aab0-6caebba8be96\",\n \"layout\": {\n \"h\": 1,\n \"i\": \"a5c3b529-c329-4a66-aab0-6caebba8be96\",\n \"isResizable\": false,\n \"w\": 24,\n \"x\": 0,\n \"y\": 54\n },\n \"name\": \"Caches\",\n \"panels\": [],\n \"type\": \"row\"\n },\n {\n \"custom\": {\n \"drawStyle\": \"lines\",\n \"fillOpacity\": 0.3,\n \"gradientMode\": \"opacity\",\n \"lineInterpolation\": \"smooth\",\n \"lineWidth\": 2,\n \"stack\": \"off\"\n },\n \"datasourceCate\": \"prometheus\",\n \"datasourceValue\": \"${datasource}\",\n \"id\": \"5247f393-a934-4d9e-be0f-40b177d2be80\",\n \"layout\": {\n \"h\": 4,\n \"i\": \"5247f393-a934-4d9e-be0f-40b177d2be80\",\n \"isResizable\": true,\n \"w\": 4,\n \"x\": 0,\n \"y\": 55\n },\n \"name\": \"Field data memory size\",\n \"options\": {\n \"legend\": {\n \"displayMode\": \"hidden\"\n },\n \"standardOptions\": {\n \"decimals\": 0,\n \"util\": \"bytesIEC\"\n },\n \"thresholds\": {},\n \"tooltip\": {\n \"mode\": \"all\",\n \"sort\": \"desc\"\n }\n },\n \"targets\": [\n {\n \"expr\": \"elasticsearch_indices_fielddata_memory_size_in_bytes{service =\\\"$service\\\", node_host=~\\\"$node_host\\\"}\",\n \"legend\": \"{{node_host}}\",\n \"refId\": \"A\"\n }\n ],\n \"type\": \"timeseries\",\n \"version\": \"2.0.0\"\n },\n {\n \"custom\": {\n \"drawStyle\": \"lines\",\n \"fillOpacity\": 0.3,\n \"gradientMode\": \"opacity\",\n \"lineInterpolation\": \"smooth\",\n \"lineWidth\": 2,\n \"stack\": \"off\"\n },\n \"datasourceCate\": \"prometheus\",\n \"datasourceValue\": \"${datasource}\",\n \"id\": \"b87c56f7-4e50-4d15-8bcd-1218fee879d9\",\n \"layout\": {\n \"h\": 4,\n \"i\": \"c33fceb6-df37-483e-ba53-4ffa5f5e5456\",\n \"isResizable\": true,\n \"w\": 4,\n \"x\": 4,\n \"y\": 55\n },\n \"name\": \"Field data evictions\",\n \"options\": {\n \"legend\": {\n \"displayMode\": \"hidden\"\n },\n \"standardOptions\": {\n \"decimals\": 0,\n \"util\": \"bytesIEC\"\n },\n \"thresholds\": {},\n \"tooltip\": {\n \"mode\": \"all\",\n \"sort\": \"desc\"\n }\n },\n \"targets\": [\n {\n \"expr\": \"rate(elasticsearch_indices_fielddata_evictions{service =\\\"$service\\\", node_host=~\\\"$node_host\\\"}[5m])\",\n \"legend\": \"{{node_host}}\",\n \"refId\": \"A\"\n }\n ],\n \"type\": \"timeseries\",\n \"version\": \"2.0.0\"\n },\n {\n \"custom\": {\n \"drawStyle\": \"lines\",\n \"fillOpacity\": 0.3,\n \"gradientMode\": \"opacity\",\n \"lineInterpolation\": \"smooth\",\n \"lineWidth\": 2,\n \"stack\": \"off\"\n },\n \"datasourceCate\": \"prometheus\",\n \"datasourceValue\": \"${datasource}\",\n \"id\": \"ae2d0a7a-b6cd-4fd5-99d4-3c4289b8b5a8\",\n \"layout\": {\n \"h\": 4,\n \"i\": \"445484f4-32d3-4569-af8d-76790d0aa56b\",\n \"isResizable\": true,\n \"w\": 4,\n \"x\": 8,\n \"y\": 55\n },\n \"name\": \"Query cache size\",\n \"options\": {\n \"legend\": {\n \"displayMode\": \"hidden\"\n },\n \"standardOptions\": {\n \"decimals\": 0,\n \"util\": \"bytesIEC\"\n },\n \"thresholds\": {},\n \"tooltip\": {\n \"mode\": \"all\",\n \"sort\": \"desc\"\n }\n },\n \"targets\": [\n {\n \"expr\": \"elasticsearch_indices_query_cache_memory_size_in_bytes{service =\\\"$service\\\", node_host=~\\\"$node_host\\\"}\",\n \"legend\": \"{{node_host}}\",\n \"refId\": \"A\"\n }\n ],\n \"type\": \"timeseries\",\n \"version\": \"2.0.0\"\n },\n {\n \"custom\": {\n \"drawStyle\": \"lines\",\n \"fillOpacity\": 0.3,\n \"gradientMode\": \"opacity\",\n \"lineInterpolation\": \"smooth\",\n \"lineWidth\": 2,\n \"stack\": \"off\"\n },\n \"datasourceCate\": \"prometheus\",\n \"datasourceValue\": \"${datasource}\",\n \"id\": \"78e4badc-8d51-4aa6-81c5-d1c9183810a2\",\n \"layout\": {\n \"h\": 4,\n \"i\": \"ce9aa255-9d5b-44ed-9071-85e9d95675ec\",\n \"isResizable\": true,\n \"w\": 4,\n \"x\": 12,\n \"y\": 55\n },\n \"name\": \"Query cache evictions\",\n \"options\": {\n \"legend\": {\n \"displayMode\": \"hidden\"\n },\n \"standardOptions\": {\n \"decimals\": 0,\n \"util\": \"bytesIEC\"\n },\n \"thresholds\": {},\n \"tooltip\": {\n \"mode\": \"all\",\n \"sort\": \"desc\"\n }\n },\n \"targets\": [\n {\n \"expr\": \"rate(elasticsearch_indices_query_cache_evictions{service =\\\"$service\\\", node_host=~\\\"$node_host\\\"}[5m])\",\n \"legend\": \"{{node_host}}\",\n \"refId\": \"A\"\n }\n ],\n \"type\": \"timeseries\",\n \"version\": \"2.0.0\"\n },\n {\n \"custom\": {\n \"drawStyle\": \"lines\",\n \"fillOpacity\": 0.3,\n \"gradientMode\": \"opacity\",\n \"lineInterpolation\": \"smooth\",\n \"lineWidth\": 2,\n \"stack\": \"off\"\n },\n \"datasourceCate\": \"prometheus\",\n \"datasourceValue\": \"${datasource}\",\n \"id\": \"296b43f1-2f33-492a-bce8-6f0fde1e7b52\",\n \"layout\": {\n \"h\": 4,\n \"i\": \"b8b2604c-d84f-426f-b033-af9035a9e80d\",\n \"isResizable\": true,\n \"w\": 8,\n \"x\": 16,\n \"y\": 55\n },\n \"name\": \"Request cache evictions\",\n \"options\": {\n \"legend\": {\n \"displayMode\": \"hidden\"\n },\n \"standardOptions\": {\n \"decimals\": 0,\n \"util\": \"bytesIEC\"\n },\n \"thresholds\": {},\n \"tooltip\": {\n \"mode\": \"all\",\n \"sort\": \"desc\"\n }\n },\n \"targets\": [\n {\n \"expr\": \"rate(elasticsearch_indices_request_cache_evictions{service =\\\"$service\\\", node_host=~\\\"$node_host\\\"}[5m])\",\n \"legend\": \"{{node_host}}\",\n \"refId\": \"A\"\n }\n ],\n \"type\": \"timeseries\",\n \"version\": \"2.0.0\"\n },\n {\n \"collapsed\": true,\n \"id\": \"d3161bf5-27a7-4552-a7d6-7b2b7d46b611\",\n \"layout\": {\n \"h\": 1,\n \"i\": \"d3161bf5-27a7-4552-a7d6-7b2b7d46b611\",\n \"isResizable\": false,\n \"w\": 24,\n \"x\": 0,\n \"y\": 59\n },\n \"name\": \"Segments\",\n \"type\": \"row\"\n },\n {\n \"custom\": {\n \"drawStyle\": \"lines\",\n \"fillOpacity\": 0.3,\n \"gradientMode\": \"opacity\",\n \"lineInterpolation\": \"smooth\",\n \"lineWidth\": 2,\n \"stack\": \"off\"\n },\n \"datasourceCate\": \"prometheus\",\n \"datasourceValue\": \"${datasource}\",\n \"id\": \"1537acaa-d5ce-48c5-b740-26fd543eb120\",\n \"layout\": {\n \"h\": 4,\n \"i\": \"1537acaa-d5ce-48c5-b740-26fd543eb120\",\n \"isResizable\": true,\n \"w\": 12,\n \"x\": 0,\n \"y\": 60\n },\n \"name\": \"Count of index segments\",\n \"options\": {\n \"legend\": {\n \"displayMode\": \"hidden\"\n },\n \"standardOptions\": {},\n \"thresholds\": {},\n \"tooltip\": {\n \"mode\": \"all\",\n \"sort\": \"desc\"\n }\n },\n \"targets\": [\n {\n \"expr\": \"elasticsearch_indices_segments_count{service =\\\"$service\\\", node_host=~\\\"$node_host\\\"}\",\n \"legend\": \"{{node_host}}\",\n \"refId\": \"A\"\n }\n ],\n \"type\": \"timeseries\",\n \"version\": \"2.0.0\"\n },\n {\n \"custom\": {\n \"drawStyle\": \"lines\",\n \"fillOpacity\": 0.3,\n \"gradientMode\": \"opacity\",\n \"lineInterpolation\": \"smooth\",\n \"lineWidth\": 2,\n \"stack\": \"off\"\n },\n \"datasourceCate\": \"prometheus\",\n \"datasourceValue\": \"${datasource}\",\n \"id\": \"a1c34fa4-4549-41a6-8d31-d25e7d860106\",\n \"layout\": {\n \"h\": 4,\n \"i\": \"9c8efed6-7ced-4805-87e0-3da3b18d2989\",\n \"isResizable\": true,\n \"w\": 12,\n \"x\": 12,\n \"y\": 60\n },\n \"name\": \"Current memory size of segments in bytes\",\n \"options\": {\n \"legend\": {\n \"displayMode\": \"hidden\"\n },\n \"standardOptions\": {},\n \"thresholds\": {},\n \"tooltip\": {\n \"mode\": \"all\",\n \"sort\": \"desc\"\n }\n },\n \"targets\": [\n {\n \"expr\": \"elasticsearch_indices_segments_memory_in_bytes{service =\\\"$service\\\", node_host=~\\\"$node_host\\\"}\",\n \"legend\": \"{{node_host}}\",\n \"refId\": \"A\"\n }\n ],\n \"type\": \"timeseries\",\n \"version\": \"2.0.0\"\n }\n ],\n \"var\": [\n {\n \"definition\": \"prometheus\",\n \"name\": \"datasource\",\n \"type\": \"datasource\"\n },\n {\n \"datasource\": {\n \"cate\": \"prometheus\",\n \"value\": \"${datasource}\"\n },\n \"definition\": \"label_values(elasticsearch_up, service)\",\n \"name\": \"service\",\n \"type\": \"query\"\n },\n {\n \"allOption\": true,\n \"datasource\": {\n \"cate\": \"prometheus\",\n \"value\": \"${datasource}\"\n },\n \"definition\": \"label_values(elasticsearch_jvm_uptime_in_millis{service =\\\"$service\\\"}, node_host)\",\n \"multi\": true,\n \"name\": \"node_host\",\n \"type\": \"query\"\n }\n ],\n \"version\": \"3.0.0\"\n },\n \"public\": 0,\n \"public_cate\": 0,\n \"bgids\": null,\n \"built_in\": 0,\n \"hide\": 0,\n \"uuid\": 1717556327369517000\n}"
},
{
"path": "integrations/Elasticsearch/dashboards/elasticsearch_by_categraf_0.3.102.json",
"content": "{\n \"name\": \"Elasticsearch Dashboard\",\n \"tags\": \"Elasticsearch Categraf Categraf_version>0.3.102\",\n \"ident\": \"\",\n \"uuid\": 1755618101588000,\n \"configs\": {\n \"panels\": [\n {\n \"type\": \"row\",\n \"id\": \"16c2d8ff-6596-48c6-bd81-56e01024c146\",\n \"name\": \"KPI\",\n \"collapsed\": true,\n \"layout\": {\n \"h\": 1,\n \"w\": 24,\n \"x\": 0,\n \"y\": 0,\n \"i\": \"16c2d8ff-6596-48c6-bd81-56e01024c146\",\n \"isResizable\": false\n },\n \"panels\": []\n },\n {\n \"type\": \"stat\",\n \"id\": \"f70f4198-dec2-40c0-97d9-6986c7001e73\",\n \"layout\": {\n \"h\": 3,\n \"w\": 4,\n \"x\": 0,\n \"y\": 1,\n \"i\": \"f70f4198-dec2-40c0-97d9-6986c7001e73\",\n \"isResizable\": true\n },\n \"version\": \"3.0.0\",\n \"datasourceCate\": \"prometheus\",\n \"datasourceValue\": \"${datasource}\",\n \"targets\": [\n {\n \"expr\": \"elasticsearch_cluster_health_status{cluster=\\\"$cluster\\\", color=\\\"green\\\"} == 1 or (elasticsearch_cluster_health_status{cluster=\\\"$cluster\\\", color=\\\"yellow\\\"} == 1)+1 or (elasticsearch_cluster_health_status{cluster=\\\"$cluster\\\", color=\\\"red\\\"} == 1)+2\",\n \"refId\": \"A\",\n \"maxDataPoints\": 240,\n \"instant\": true,\n \"legend\": \"{{color}}\"\n }\n ],\n \"transformations\": [\n {\n \"id\": \"organize\",\n \"options\": {}\n }\n ],\n \"name\": \"Cluster health\",\n \"description\": \"绿色:健康,黄色:存在副本分片异常,红色:存在主分片异常\",\n \"maxPerRow\": 4,\n \"custom\": {\n \"textMode\": \"value\",\n \"graphMode\": \"none\",\n \"colorMode\": \"background\",\n \"calc\": \"lastNotNull\",\n \"valueField\": \"Value\",\n \"colSpan\": 1,\n \"textSize\": {},\n \"orientation\": \"horizontal\"\n },\n \"options\": {\n \"thresholds\": {\n \"steps\": [\n {\n \"color\": \"rgba(99, 76, 217, 1)\",\n \"value\": null,\n \"type\": \"base\"\n }\n ]\n },\n \"valueMappings\": [\n {\n \"type\": \"special\",\n \"result\": {\n \"color\": \"rgba(65, 117, 5, 1)\",\n \"text\": \"Green\"\n },\n \"match\": {\n \"textValue\": \"green\",\n \"special\": 1\n }\n },\n {\n \"type\": \"special\",\n \"result\": {\n \"color\": \"rgba(245, 166, 35, 1)\",\n \"text\": \"Yellow\"\n },\n \"match\": {\n \"textValue\": \"yellow\",\n \"special\": 2\n }\n },\n {\n \"type\": \"special\",\n \"result\": {\n \"color\": \"rgba(208, 2, 27, 1)\",\n \"text\": \"Red\"\n },\n \"match\": {\n \"textValue\": \"red\",\n \"special\": 3\n }\n },\n {\n \"type\": \"specialValue\",\n \"result\": {\n \"color\": \"rgba(99, 76, 217, 1)\",\n \"text\": \"N/A\"\n },\n \"match\": {\n \"specialValue\": \"null\"\n }\n }\n ],\n \"standardOptions\": {}\n },\n \"overrides\": [\n {\n \"matcher\": {\n \"id\": \"byFrameRefID\",\n \"value\": \"B\"\n },\n \"properties\": {\n \"thresholds\": {\n \"steps\": [\n {\n \"color\": \"#6C53B1\",\n \"value\": null,\n \"type\": \"base\"\n }\n ]\n },\n \"valueMappings\": []\n }\n }\n ]\n },\n {\n \"type\": \"stat\",\n \"id\": \"7dafe232-ee30-479b-a2f1-e1064572c154\",\n \"layout\": {\n \"h\": 3,\n \"w\": 4,\n \"x\": 4,\n \"y\": 1,\n \"i\": \"7dafe232-ee30-479b-a2f1-e1064572c154\",\n \"isResizable\": true\n },\n \"version\": \"3.0.0\",\n \"datasourceCate\": \"prometheus\",\n \"datasourceValue\": \"${datasource}\",\n \"targets\": [\n {\n \"expr\": \"min(elasticsearch_cluster_health_number_of_nodes{cluster=\\\"$cluster\\\"})\",\n \"refId\": \"A\",\n \"maxDataPoints\": 240,\n \"instant\": true\n }\n ],\n \"transformations\": [\n {\n \"id\": \"organize\",\n \"options\": {}\n }\n ],\n \"name\": \"Nodes\",\n \"description\": \"集群节点数量\",\n \"maxPerRow\": 4,\n \"custom\": {\n \"textMode\": \"value\",\n \"graphMode\": \"none\",\n \"colorMode\": \"value\",\n \"calc\": \"lastNotNull\",\n \"valueField\": \"Value\",\n \"colSpan\": 0,\n \"textSize\": {\n \"value\": null\n },\n \"orientation\": \"auto\"\n },\n \"options\": {\n \"thresholds\": {\n \"steps\": [\n {\n \"color\": \"#6C53B1\",\n \"value\": null,\n \"type\": \"base\"\n }\n ]\n },\n \"standardOptions\": {}\n },\n \"overrides\": [\n {\n \"matcher\": {\n \"id\": \"byFrameRefID\"\n },\n \"properties\": {\n \"thresholds\": {\n \"steps\": [\n {\n \"color\": \"#6C53B1\",\n \"value\": null,\n \"type\": \"base\"\n }\n ]\n }\n }\n }\n ]\n },\n {\n \"type\": \"stat\",\n \"id\": \"447fb784-a7e4-41cf-820f-6086837590e6\",\n \"layout\": {\n \"h\": 3,\n \"w\": 4,\n \"x\": 8,\n \"y\": 1,\n \"i\": \"c6953ef5-3e29-44dc-bf9e-74905934e9df\",\n \"isResizable\": true\n },\n \"version\": \"3.0.0\",\n \"datasourceCate\": \"prometheus\",\n \"datasourceValue\": \"${datasource}\",\n \"targets\": [\n {\n \"expr\": \"min(elasticsearch_cluster_health_number_of_data_nodes{cluster=\\\"$cluster\\\"})\",\n \"refId\": \"A\",\n \"maxDataPoints\": 240\n }\n ],\n \"transformations\": [\n {\n \"id\": \"organize\",\n \"options\": {}\n }\n ],\n \"name\": \"Data Nodes\",\n \"description\": \"集群数据节点数量\",\n \"maxPerRow\": 4,\n \"custom\": {\n \"textMode\": \"valueAndName\",\n \"graphMode\": \"none\",\n \"colorMode\": \"value\",\n \"calc\": \"lastNotNull\",\n \"valueField\": \"Value\",\n \"colSpan\": 0,\n \"textSize\": {},\n \"orientation\": \"auto\"\n },\n \"options\": {\n \"thresholds\": {\n \"steps\": [\n {\n \"color\": \"#6C53B1\",\n \"value\": null,\n \"type\": \"base\"\n }\n ]\n },\n \"standardOptions\": {}\n },\n \"overrides\": [\n {\n \"matcher\": {\n \"id\": \"byFrameRefID\"\n },\n \"properties\": {\n \"thresholds\": {\n \"steps\": [\n {\n \"color\": \"#6C53B1\",\n \"value\": null,\n \"type\": \"base\"\n }\n ]\n }\n }\n }\n ]\n },\n {\n \"type\": \"stat\",\n \"id\": \"f0375f72-4ca1-474f-81e9-ce6b64f22204\",\n \"layout\": {\n \"h\": 3,\n \"w\": 4,\n \"x\": 12,\n \"y\": 1,\n \"i\": \"e6cf29e7-bb5d-4c8f-8aa6-67a63fc325c7\",\n \"isResizable\": true\n },\n \"version\": \"3.0.0\",\n \"datasourceCate\": \"prometheus\",\n \"datasourceValue\": \"${datasource}\",\n \"targets\": [\n {\n \"expr\": \"max(elasticsearch_process_cpu_percent{cluster=\\\"$cluster\\\", host=~\\\"$host\\\"})\",\n \"refId\": \"A\",\n \"maxDataPoints\": 240\n }\n ],\n \"transformations\": [\n {\n \"id\": \"organize\",\n \"options\": {}\n }\n ],\n \"name\": \"CPU usage Max\",\n \"links\": [],\n \"description\": \"\",\n \"maxPerRow\": 4,\n \"custom\": {\n \"textMode\": \"valueAndName\",\n \"graphMode\": \"none\",\n \"colorMode\": \"value\",\n \"calc\": \"lastNotNull\",\n \"valueField\": \"Value\",\n \"colSpan\": 0,\n \"textSize\": {},\n \"orientation\": \"auto\"\n },\n \"options\": {\n \"thresholds\": {\n \"steps\": [\n {\n \"color\": \"#6C53B1\",\n \"value\": null,\n \"type\": \"base\"\n }\n ]\n },\n \"valueMappings\": [\n {\n \"match\": {\n \"to\": 50\n },\n \"result\": {\n \"color\": \"#417505\"\n },\n \"type\": \"range\"\n },\n {\n \"match\": {\n \"from\": 50,\n \"to\": 80\n },\n \"result\": {\n \"color\": \"#f5a623\"\n },\n \"type\": \"range\"\n },\n {\n \"match\": {\n \"from\": 80\n },\n \"result\": {\n \"color\": \"#d0021b\"\n },\n \"type\": \"range\"\n }\n ],\n \"standardOptions\": {\n \"util\": \"percent\"\n }\n },\n \"overrides\": [\n {\n \"matcher\": {\n \"id\": \"byFrameRefID\"\n },\n \"properties\": {\n \"thresholds\": {\n \"steps\": [\n {\n \"color\": \"#6C53B1\",\n \"value\": null,\n \"type\": \"base\"\n }\n ]\n }\n }\n }\n ]\n },\n {\n \"type\": \"stat\",\n \"id\": \"288ee5f1-b484-43f5-86bf-5b81c01b3c2c\",\n \"layout\": {\n \"h\": 3,\n \"w\": 4,\n \"x\": 16,\n \"y\": 1,\n \"i\": \"34ae1975-6acb-48a7-adce-1d67b7c581ec\",\n \"isResizable\": true\n },\n \"version\": \"3.0.0\",\n \"datasourceCate\": \"prometheus\",\n \"datasourceValue\": \"${datasource}\",\n \"targets\": [\n {\n \"expr\": \"max(elasticsearch_jvm_mem_heap_used_percent{cluster=\\\"$cluster\\\", host=~\\\"$host\\\"})\",\n \"refId\": \"A\",\n \"maxDataPoints\": 240,\n \"instant\": true\n }\n ],\n \"transformations\": [\n {\n \"id\": \"organize\",\n \"options\": {}\n }\n ],\n \"name\": \"JVM Heap Util Percent Max\",\n \"description\": \"\",\n \"maxPerRow\": 4,\n \"custom\": {\n \"textMode\": \"valueAndName\",\n \"graphMode\": \"none\",\n \"colorMode\": \"value\",\n \"calc\": \"lastNotNull\",\n \"valueField\": \"Value\",\n \"colSpan\": 0,\n \"textSize\": {},\n \"orientation\": \"auto\"\n },\n \"options\": {\n \"thresholds\": {\n \"steps\": [\n {\n \"color\": \"#6C53B1\",\n \"value\": null,\n \"type\": \"base\"\n }\n ]\n },\n \"valueMappings\": [\n {\n \"match\": {\n \"to\": 50\n },\n \"result\": {\n \"color\": \"#417505\"\n },\n \"type\": \"range\"\n },\n {\n \"match\": {\n \"from\": 50,\n \"to\": 80\n },\n \"result\": {\n \"color\": \"#f5a623\"\n },\n \"type\": \"range\"\n },\n {\n \"match\": {\n \"from\": 80\n },\n \"result\": {\n \"color\": \"#d0021b\"\n },\n \"type\": \"range\"\n }\n ],\n \"standardOptions\": {\n \"util\": \"percent\"\n }\n },\n \"overrides\": [\n {\n \"matcher\": {\n \"id\": \"byFrameRefID\"\n },\n \"properties\": {\n \"thresholds\": {\n \"steps\": [\n {\n \"color\": \"#6C53B1\",\n \"value\": null,\n \"type\": \"base\"\n }\n ]\n }\n }\n }\n ]\n },\n {\n \"type\": \"stat\",\n \"id\": \"4dd345c1-2bc1-474e-83b1-153be10a5b5b\",\n \"layout\": {\n \"h\": 3,\n \"w\": 4,\n \"x\": 20,\n \"y\": 1,\n \"i\": \"01c403f3-c3b0-4910-84df-a50d4968bcd6\",\n \"isResizable\": true\n },\n \"version\": \"3.0.0\",\n \"datasourceCate\": \"prometheus\",\n \"datasourceValue\": \"${datasource}\",\n \"targets\": [\n {\n \"expr\": \"max(elasticsearch_cluster_health_number_of_pending_tasks{cluster=\\\"$cluster\\\"})\",\n \"refId\": \"A\",\n \"maxDataPoints\": 240\n }\n ],\n \"transformations\": [\n {\n \"id\": \"organize\",\n \"options\": {}\n }\n ],\n \"name\": \"Pending Tasks\",\n \"description\": \"\",\n \"maxPerRow\": 4,\n \"custom\": {\n \"textMode\": \"valueAndName\",\n \"graphMode\": \"none\",\n \"colorMode\": \"value\",\n \"calc\": \"lastNotNull\",\n \"valueField\": \"Value\",\n \"colSpan\": 0,\n \"textSize\": {},\n \"orientation\": \"auto\"\n },\n \"options\": {\n \"thresholds\": {\n \"steps\": [\n {\n \"color\": \"#6C53B1\",\n \"value\": null,\n \"type\": \"base\"\n }\n ]\n },\n \"valueMappings\": [\n {\n \"match\": {\n \"to\": 1\n },\n \"result\": {\n \"color\": \"#417505\"\n },\n \"type\": \"range\"\n },\n {\n \"match\": {\n \"from\": 1\n },\n \"result\": {\n \"color\": \"#d0021b\"\n },\n \"type\": \"range\"\n }\n ],\n \"standardOptions\": {}\n },\n \"overrides\": [\n {\n \"matcher\": {\n \"id\": \"byFrameRefID\"\n },\n \"properties\": {\n \"thresholds\": {\n \"steps\": [\n {\n \"color\": \"#6C53B1\",\n \"value\": null,\n \"type\": \"base\"\n }\n ]\n }\n }\n }\n ]\n },\n {\n \"collapsed\": true,\n \"id\": \"b398d46e-7345-4cc9-90b4-918cbd1e8d1f\",\n \"layout\": {\n \"h\": 1,\n \"w\": 24,\n \"x\": 0,\n \"y\": 4,\n \"i\": \"b398d46e-7345-4cc9-90b4-918cbd1e8d1f\",\n \"isResizable\": false\n },\n \"name\": \"Breakers\",\n \"panels\": [],\n \"type\": \"row\"\n },\n {\n \"type\": \"timeseries\",\n \"id\": \"15882e6f-0585-4035-bfb6-71cb9caaa0a8\",\n \"layout\": {\n \"h\": 4,\n \"w\": 12,\n \"x\": 0,\n \"y\": 5,\n \"i\": \"15882e6f-0585-4035-bfb6-71cb9caaa0a8\",\n \"isResizable\": true\n },\n \"version\": \"3.0.0\",\n \"datasourceCate\": \"prometheus\",\n \"datasourceValue\": \"${datasource}\",\n \"targets\": [\n {\n \"expr\": \"sum(elasticsearch_breakers_tripped{cluster=\\\"$cluster\\\", host=~\\\"$host\\\"}) by (host, breaker)\",\n \"legend\": \"\",\n \"refId\": \"A\",\n \"maxDataPoints\": 240\n }\n ],\n \"transformations\": [\n {\n \"id\": \"organize\",\n \"options\": {}\n }\n ],\n \"name\": \"Tripped for breakers\",\n \"maxPerRow\": 4,\n \"options\": {\n \"tooltip\": {\n \"mode\": \"all\",\n \"sort\": \"desc\"\n },\n \"legend\": {\n \"displayMode\": \"hidden\",\n \"heightInPercentage\": 30,\n \"placement\": \"bottom\",\n \"behaviour\": \"showItem\",\n \"selectMode\": \"single\"\n },\n \"standardOptions\": {},\n \"thresholds\": {\n \"steps\": [\n {\n \"color\": \"#6C53B1\",\n \"value\": null,\n \"type\": \"base\"\n }\n ]\n }\n },\n \"custom\": {\n \"drawStyle\": \"lines\",\n \"lineInterpolation\": \"smooth\",\n \"spanNulls\": false,\n \"lineWidth\": 2,\n \"fillOpacity\": 0.04,\n \"gradientMode\": \"none\",\n \"stack\": \"off\",\n \"scaleDistribution\": {\n \"type\": \"linear\"\n },\n \"showPoints\": \"none\",\n \"pointSize\": 5\n },\n \"overrides\": [\n {\n \"matcher\": {\n \"id\": \"byFrameRefID\"\n },\n \"properties\": {\n \"rightYAxisDisplay\": \"off\"\n }\n }\n ]\n },\n {\n \"type\": \"timeseries\",\n \"id\": \"8adbc8e4-f630-4a25-98e3-ee03dec92011\",\n \"layout\": {\n \"h\": 4,\n \"w\": 12,\n \"x\": 12,\n \"y\": 5,\n \"i\": \"d05d16d0-022d-49f8-9b55-2388c4cbb2b1\",\n \"isResizable\": true\n },\n \"version\": \"3.0.0\",\n \"datasourceCate\": \"prometheus\",\n \"datasourceValue\": \"${datasource}\",\n \"targets\": [\n {\n \"expr\": \"{__name__=~\\\"elasticsearch_breakers_.+_size_in_bytes\\\", cluster=\\\"$cluster\\\", host=~\\\"$host\\\"}\",\n \"legend\": \"{{__name__}} {{host}}\",\n \"refId\": \"A\",\n \"maxDataPoints\": 240\n }\n ],\n \"transformations\": [\n {\n \"id\": \"organize\",\n \"options\": {}\n }\n ],\n \"name\": \"Estimated size in bytes of breaker\",\n \"maxPerRow\": 4,\n \"options\": {\n \"tooltip\": {\n \"mode\": \"all\",\n \"sort\": \"desc\"\n },\n \"legend\": {\n \"displayMode\": \"hidden\",\n \"heightInPercentage\": 30,\n \"placement\": \"bottom\",\n \"behaviour\": \"showItem\",\n \"selectMode\": \"single\"\n },\n \"standardOptions\": {},\n \"thresholds\": {\n \"steps\": [\n {\n \"color\": \"#634CD9\",\n \"value\": null,\n \"type\": \"base\"\n }\n ]\n }\n },\n \"custom\": {\n \"drawStyle\": \"lines\",\n \"lineInterpolation\": \"smooth\",\n \"spanNulls\": false,\n \"lineWidth\": 1,\n \"fillOpacity\": 0.04,\n \"gradientMode\": \"none\",\n \"stack\": \"off\",\n \"scaleDistribution\": {\n \"type\": \"linear\"\n },\n \"showPoints\": \"none\",\n \"pointSize\": 5\n },\n \"overrides\": [\n {\n \"matcher\": {\n \"id\": \"byFrameRefID\"\n },\n \"properties\": {\n \"rightYAxisDisplay\": \"off\"\n }\n }\n ]\n },\n {\n \"collapsed\": true,\n \"id\": \"2aadd697-3bed-4f70-bc74-4bc801ef7d1d\",\n \"layout\": {\n \"h\": 1,\n \"w\": 24,\n \"x\": 0,\n \"y\": 9,\n \"i\": \"2aadd697-3bed-4f70-bc74-4bc801ef7d1d\",\n \"isResizable\": false\n },\n \"name\": \"Shards\",\n \"panels\": [],\n \"type\": \"row\"\n },\n {\n \"type\": \"stat\",\n \"id\": \"7aec074e-1672-4dbb-8529-28292f9a4221\",\n \"layout\": {\n \"h\": 3,\n \"w\": 4,\n \"x\": 0,\n \"y\": 10,\n \"i\": \"7aec074e-1672-4dbb-8529-28292f9a4221\",\n \"isResizable\": true\n },\n \"version\": \"3.0.0\",\n \"datasourceCate\": \"prometheus\",\n \"datasourceValue\": \"${datasource}\",\n \"targets\": [\n {\n \"expr\": \"max(elasticsearch_cluster_health_active_shards{cluster=\\\"$cluster\\\"})\",\n \"refId\": \"A\",\n \"maxDataPoints\": 240\n }\n ],\n \"transformations\": [\n {\n \"id\": \"organize\",\n \"options\": {}\n }\n ],\n \"name\": \"Active shards\",\n \"maxPerRow\": 4,\n \"custom\": {\n \"textMode\": \"valueAndName\",\n \"graphMode\": \"none\",\n \"colorMode\": \"value\",\n \"calc\": \"lastNotNull\",\n \"valueField\": \"Value\",\n \"colSpan\": 0,\n \"textSize\": {},\n \"orientation\": \"auto\"\n },\n \"options\": {\n \"thresholds\": {\n \"steps\": [\n {\n \"color\": \"#6C53B1\",\n \"value\": null,\n \"type\": \"base\"\n }\n ]\n },\n \"standardOptions\": {}\n },\n \"overrides\": [\n {\n \"matcher\": {\n \"id\": \"byFrameRefID\"\n },\n \"properties\": {\n \"thresholds\": {\n \"steps\": [\n {\n \"color\": \"#6C53B1\",\n \"value\": null,\n \"type\": \"base\"\n }\n ]\n }\n }\n }\n ]\n },\n {\n \"type\": \"stat\",\n \"id\": \"f138daa7-b98f-4575-89e3-42363a8102c9\",\n \"layout\": {\n \"h\": 3,\n \"w\": 4,\n \"x\": 4,\n \"y\": 10,\n \"i\": \"fe82bb33-7b8d-4909-adda-64a4121f29fd\",\n \"isResizable\": true\n },\n \"version\": \"3.0.0\",\n \"datasourceCate\": \"prometheus\",\n \"datasourceValue\": \"${datasource}\",\n \"targets\": [\n {\n \"expr\": \"max(elasticsearch_cluster_health_active_primary_shards{cluster=\\\"$cluster\\\"})\",\n \"refId\": \"A\",\n \"maxDataPoints\": 240\n }\n ],\n \"transformations\": [\n {\n \"id\": \"organize\",\n \"options\": {}\n }\n ],\n \"name\": \"Active primary shards\",\n \"maxPerRow\": 4,\n \"custom\": {\n \"textMode\": \"valueAndName\",\n \"graphMode\": \"none\",\n \"colorMode\": \"value\",\n \"calc\": \"lastNotNull\",\n \"valueField\": \"Value\",\n \"colSpan\": 0,\n \"textSize\": {},\n \"orientation\": \"auto\"\n },\n \"options\": {\n \"thresholds\": {\n \"steps\": [\n {\n \"color\": \"#6C53B1\",\n \"value\": null,\n \"type\": \"base\"\n }\n ]\n },\n \"standardOptions\": {}\n },\n \"overrides\": [\n {\n \"matcher\": {\n \"id\": \"byFrameRefID\"\n },\n \"properties\": {\n \"thresholds\": {\n \"steps\": [\n {\n \"color\": \"#6C53B1\",\n \"value\": null,\n \"type\": \"base\"\n }\n ]\n }\n }\n }\n ]\n },\n {\n \"type\": \"stat\",\n \"id\": \"7412543a-dba5-4624-96ff-11e30b7e8ff4\",\n \"layout\": {\n \"h\": 3,\n \"w\": 4,\n \"x\": 8,\n \"y\": 10,\n \"i\": \"de2c46fd-dcfd-43a3-847b-9fd1320dfaa7\",\n \"isResizable\": true\n },\n \"version\": \"3.0.0\",\n \"datasourceCate\": \"prometheus\",\n \"datasourceValue\": \"${datasource}\",\n \"targets\": [\n {\n \"expr\": \"max(elasticsearch_cluster_health_initializing_shards{cluster=\\\"$cluster\\\"})\",\n \"refId\": \"A\",\n \"maxDataPoints\": 240\n }\n ],\n \"transformations\": [\n {\n \"id\": \"organize\",\n \"options\": {}\n }\n ],\n \"name\": \"Initializing shards\",\n \"maxPerRow\": 4,\n \"custom\": {\n \"textMode\": \"valueAndName\",\n \"graphMode\": \"none\",\n \"colorMode\": \"value\",\n \"calc\": \"lastNotNull\",\n \"valueField\": \"Value\",\n \"colSpan\": 0,\n \"textSize\": {},\n \"orientation\": \"auto\"\n },\n \"options\": {\n \"thresholds\": {\n \"steps\": [\n {\n \"color\": \"#6C53B1\",\n \"value\": null,\n \"type\": \"base\"\n }\n ]\n },\n \"standardOptions\": {}\n },\n \"overrides\": [\n {\n \"matcher\": {\n \"id\": \"byFrameRefID\"\n },\n \"properties\": {\n \"thresholds\": {\n \"steps\": [\n {\n \"color\": \"#6C53B1\",\n \"value\": null,\n \"type\": \"base\"\n }\n ]\n }\n }\n }\n ]\n },\n {\n \"type\": \"stat\",\n \"id\": \"2f26f24f-2a79-4552-b79d-60b41fa3aee6\",\n \"layout\": {\n \"h\": 3,\n \"w\": 4,\n \"x\": 12,\n \"y\": 10,\n \"i\": \"4403206d-a491-4564-9f61-db25a6beb356\",\n \"isResizable\": true\n },\n \"version\": \"3.0.0\",\n \"datasourceCate\": \"prometheus\",\n \"datasourceValue\": \"${datasource}\",\n \"targets\": [\n {\n \"expr\": \"max(elasticsearch_cluster_health_relocating_shards{cluster=\\\"$cluster\\\"})\",\n \"refId\": \"A\",\n \"maxDataPoints\": 240\n }\n ],\n \"transformations\": [\n {\n \"id\": \"organize\",\n \"options\": {}\n }\n ],\n \"name\": \"Relocating shards\",\n \"maxPerRow\": 4,\n \"custom\": {\n \"textMode\": \"valueAndName\",\n \"graphMode\": \"none\",\n \"colorMode\": \"value\",\n \"calc\": \"lastNotNull\",\n \"valueField\": \"Value\",\n \"colSpan\": 0,\n \"textSize\": {},\n \"orientation\": \"auto\"\n },\n \"options\": {\n \"thresholds\": {\n \"steps\": [\n {\n \"color\": \"#6C53B1\",\n \"value\": null,\n \"type\": \"base\"\n }\n ]\n },\n \"standardOptions\": {}\n },\n \"overrides\": [\n {\n \"matcher\": {\n \"id\": \"byFrameRefID\"\n },\n \"properties\": {\n \"thresholds\": {\n \"steps\": [\n {\n \"color\": \"#6C53B1\",\n \"value\": null,\n \"type\": \"base\"\n }\n ]\n }\n }\n }\n ]\n },\n {\n \"type\": \"stat\",\n \"id\": \"394a83cc-f4e1-467e-83fa-b77d2c2be907\",\n \"layout\": {\n \"h\": 3,\n \"w\": 4,\n \"x\": 16,\n \"y\": 10,\n \"i\": \"e24c847a-5704-4b7c-861e-75dd4e4b59d8\",\n \"isResizable\": true\n },\n \"version\": \"3.0.0\",\n \"datasourceCate\": \"prometheus\",\n \"datasourceValue\": \"${datasource}\",\n \"targets\": [\n {\n \"expr\": \"max(elasticsearch_cluster_health_delayed_unassigned_shards{cluster=\\\"$cluster\\\"})\",\n \"refId\": \"A\",\n \"maxDataPoints\": 240\n }\n ],\n \"transformations\": [\n {\n \"id\": \"organize\",\n \"options\": {}\n }\n ],\n \"name\": \"Delayed Unassigned shards\",\n \"maxPerRow\": 4,\n \"custom\": {\n \"textMode\": \"valueAndName\",\n \"graphMode\": \"none\",\n \"colorMode\": \"value\",\n \"calc\": \"lastNotNull\",\n \"valueField\": \"Value\",\n \"colSpan\": 0,\n \"textSize\": {},\n \"orientation\": \"auto\"\n },\n \"options\": {\n \"thresholds\": {\n \"steps\": [\n {\n \"color\": \"#6C53B1\",\n \"value\": null,\n \"type\": \"base\"\n }\n ]\n },\n \"standardOptions\": {}\n },\n \"overrides\": [\n {\n \"matcher\": {\n \"id\": \"byFrameRefID\"\n },\n \"properties\": {\n \"thresholds\": {\n \"steps\": [\n {\n \"color\": \"#6C53B1\",\n \"value\": null,\n \"type\": \"base\"\n }\n ]\n }\n }\n }\n ]\n },\n {\n \"type\": \"stat\",\n \"id\": \"720b9719-5c37-44d9-bce8-539308afa6ae\",\n \"layout\": {\n \"h\": 3,\n \"w\": 4,\n \"x\": 20,\n \"y\": 10,\n \"i\": \"d82314d5-028c-41fb-a79f-34699d56d17a\",\n \"isResizable\": true\n },\n \"version\": \"3.0.0\",\n \"datasourceCate\": \"prometheus\",\n \"datasourceValue\": \"${datasource}\",\n \"targets\": [\n {\n \"expr\": \"max(elasticsearch_cluster_health_unassigned_shards{cluster=\\\"$cluster\\\"})\",\n \"refId\": \"A\",\n \"maxDataPoints\": 240\n }\n ],\n \"transformations\": [\n {\n \"id\": \"organize\",\n \"options\": {}\n }\n ],\n \"name\": \"Unassigned shards\",\n \"maxPerRow\": 4,\n \"custom\": {\n \"textMode\": \"valueAndName\",\n \"graphMode\": \"none\",\n \"colorMode\": \"value\",\n \"calc\": \"lastNotNull\",\n \"valueField\": \"Value\",\n \"colSpan\": 0,\n \"textSize\": {},\n \"orientation\": \"auto\"\n },\n \"options\": {\n \"thresholds\": {\n \"steps\": [\n {\n \"color\": \"#6C53B1\",\n \"value\": null,\n \"type\": \"base\"\n }\n ]\n },\n \"standardOptions\": {}\n },\n \"overrides\": [\n {\n \"matcher\": {\n \"id\": \"byFrameRefID\"\n },\n \"properties\": {\n \"thresholds\": {\n \"steps\": [\n {\n \"color\": \"#6C53B1\",\n \"value\": null,\n \"type\": \"base\"\n }\n ]\n }\n }\n }\n ]\n },\n {\n \"collapsed\": true,\n \"id\": \"a1bc2be7-723b-4fe4-b217-bfdd8248559e\",\n \"layout\": {\n \"h\": 1,\n \"w\": 24,\n \"x\": 0,\n \"y\": 13,\n \"i\": \"a1bc2be7-723b-4fe4-b217-bfdd8248559e\",\n \"isResizable\": false\n },\n \"name\": \"JVM\",\n \"panels\": [],\n \"type\": \"row\"\n },\n {\n \"type\": \"timeseries\",\n \"id\": \"ee0c56e0-8f8e-4cbe-ac41-de2afad7b75a\",\n \"layout\": {\n \"h\": 4,\n \"w\": 12,\n \"x\": 0,\n \"y\": 14,\n \"i\": \"ee0c56e0-8f8e-4cbe-ac41-de2afad7b75a\",\n \"isResizable\": true\n },\n \"version\": \"3.0.0\",\n \"datasourceCate\": \"prometheus\",\n \"datasourceValue\": \"${datasource}\",\n \"targets\": [\n {\n \"expr\": \"irate(elasticsearch_jvm_gc_collection_seconds_count{cluster=\\\"$cluster\\\", host=~\\\"$host\\\"}[5m])\",\n \"legend\": \"{{host}}\",\n \"refId\": \"A\",\n \"maxDataPoints\": 240\n },\n {\n \"expr\": \"irate(elasticsearch_jvm_gc_collectors_young_collection_count{cluster=\\\"$cluster\\\", host=~\\\"$host\\\"}[5m])\",\n \"legend\": \"young gc {{host}}\",\n \"refId\": \"B\",\n \"maxDataPoints\": 240\n }\n ],\n \"transformations\": [\n {\n \"id\": \"organize\",\n \"options\": {}\n }\n ],\n \"name\": \"GC counts / second\",\n \"maxPerRow\": 4,\n \"options\": {\n \"tooltip\": {\n \"mode\": \"all\",\n \"sort\": \"none\"\n },\n \"legend\": {\n \"displayMode\": \"hidden\",\n \"heightInPercentage\": 30,\n \"placement\": \"bottom\",\n \"behaviour\": \"showItem\",\n \"selectMode\": \"single\"\n },\n \"standardOptions\": {},\n \"thresholds\": {\n \"steps\": [\n {\n \"color\": \"#6C53B1\",\n \"value\": null,\n \"type\": \"base\"\n }\n ]\n }\n },\n \"custom\": {\n \"drawStyle\": \"lines\",\n \"lineInterpolation\": \"smooth\",\n \"spanNulls\": false,\n \"lineWidth\": 2,\n \"fillOpacity\": 0.3,\n \"gradientMode\": \"opacity\",\n \"stack\": \"off\",\n \"scaleDistribution\": {\n \"type\": \"linear\"\n },\n \"showPoints\": \"none\",\n \"pointSize\": 5\n },\n \"overrides\": [\n {\n \"matcher\": {\n \"id\": \"byFrameRefID\"\n },\n \"properties\": {\n \"rightYAxisDisplay\": \"off\"\n }\n }\n ]\n },\n {\n \"type\": \"timeseries\",\n \"id\": \"5c361278-8a94-4b16-afdd-e6def804b9ff\",\n \"layout\": {\n \"h\": 4,\n \"w\": 12,\n \"x\": 12,\n \"y\": 14,\n \"i\": \"4f21ebfc-b51c-469b-b149-479966750920\",\n \"isResizable\": true\n },\n \"version\": \"3.0.0\",\n \"datasourceCate\": \"prometheus\",\n \"datasourceValue\": \"${datasource}\",\n \"targets\": [\n {\n \"expr\": \"irate(elasticsearch_jvm_gc_collection_seconds_sum{cluster=\\\"$cluster\\\", host=~\\\"$host\\\"}[5m])\",\n \"legend\": \"{{host}}\",\n \"refId\": \"A\",\n \"maxDataPoints\": 240\n },\n {\n \"expr\": \"irate(elasticsearch_jvm_gc_collectors_young_collection_time_in_millis{cluster=\\\"$cluster\\\", host=~\\\"$host\\\"}[5m])\",\n \"legend\": \"young gc {{host}}\",\n \"refId\": \"B\",\n \"maxDataPoints\": 240\n }\n ],\n \"transformations\": [\n {\n \"id\": \"organize\",\n \"options\": {}\n }\n ],\n \"name\": \"GC time in seconds\",\n \"maxPerRow\": 4,\n \"options\": {\n \"tooltip\": {\n \"mode\": \"all\",\n \"sort\": \"none\"\n },\n \"legend\": {\n \"displayMode\": \"hidden\",\n \"heightInPercentage\": 30,\n \"placement\": \"bottom\",\n \"behaviour\": \"showItem\",\n \"selectMode\": \"single\"\n },\n \"standardOptions\": {},\n \"thresholds\": {\n \"steps\": [\n {\n \"color\": \"#6C53B1\",\n \"value\": null,\n \"type\": \"base\"\n }\n ]\n }\n },\n \"custom\": {\n \"drawStyle\": \"lines\",\n \"lineInterpolation\": \"smooth\",\n \"spanNulls\": false,\n \"lineWidth\": 2,\n \"fillOpacity\": 0.3,\n \"gradientMode\": \"opacity\",\n \"stack\": \"off\",\n \"scaleDistribution\": {\n \"type\": \"linear\"\n },\n \"showPoints\": \"none\",\n \"pointSize\": 5\n },\n \"overrides\": [\n {\n \"matcher\": {\n \"id\": \"byFrameRefID\"\n },\n \"properties\": {\n \"rightYAxisDisplay\": \"off\"\n }\n }\n ]\n },\n {\n \"type\": \"timeseries\",\n \"id\": \"ff81d109-79e5-4909-8765-857a75cebf17\",\n \"layout\": {\n \"h\": 4,\n \"w\": 6,\n \"x\": 0,\n \"y\": 18,\n \"i\": \"5105f1dc-26cb-4818-a04d-90f2e5803da2\",\n \"isResizable\": true\n },\n \"version\": \"3.0.0\",\n \"datasourceCate\": \"prometheus\",\n \"datasourceValue\": \"${datasource}\",\n \"targets\": [\n {\n \"expr\": \"elasticsearch_jvm_memory_pools_young_used_in_bytes{cluster=\\\"$cluster\\\", host=~\\\"$host\\\"}\",\n \"legend\": \"{{host}}\",\n \"refId\": \"A\",\n \"maxDataPoints\": 240\n }\n ],\n \"transformations\": [\n {\n \"id\": \"organize\",\n \"options\": {}\n }\n ],\n \"name\": \"Yong Used(Bytes)\",\n \"maxPerRow\": 4,\n \"options\": {\n \"tooltip\": {\n \"mode\": \"all\",\n \"sort\": \"desc\"\n },\n \"legend\": {\n \"displayMode\": \"hidden\",\n \"heightInPercentage\": 30,\n \"placement\": \"bottom\",\n \"behaviour\": \"showItem\",\n \"selectMode\": \"single\"\n },\n \"standardOptions\": {\n \"util\": \"bytesIEC\",\n \"decimals\": 1\n },\n \"thresholds\": {\n \"steps\": [\n {\n \"color\": \"#634CD9\",\n \"value\": null,\n \"type\": \"base\"\n }\n ]\n }\n },\n \"custom\": {\n \"drawStyle\": \"lines\",\n \"lineInterpolation\": \"smooth\",\n \"spanNulls\": false,\n \"lineWidth\": 2,\n \"fillOpacity\": 0.3,\n \"gradientMode\": \"opacity\",\n \"stack\": \"off\",\n \"scaleDistribution\": {\n \"type\": \"linear\"\n },\n \"showPoints\": \"none\",\n \"pointSize\": 5\n },\n \"overrides\": [\n {\n \"matcher\": {\n \"id\": \"byFrameRefID\"\n },\n \"properties\": {\n \"rightYAxisDisplay\": \"off\"\n }\n }\n ]\n },\n {\n \"type\": \"timeseries\",\n \"id\": \"d7c76456-8f34-4e1b-843b-9d174bbdfcee\",\n \"layout\": {\n \"h\": 4,\n \"w\": 6,\n \"x\": 6,\n \"y\": 18,\n \"i\": \"86841663-2a17-4858-a9e1-13c296b3bb76\",\n \"isResizable\": true\n },\n \"version\": \"3.0.0\",\n \"datasourceCate\": \"prometheus\",\n \"datasourceValue\": \"${datasource}\",\n \"targets\": [\n {\n \"expr\": \"elasticsearch_jvm_memory_pools_old_used_in_bytes{cluster=\\\"$cluster\\\", host=~\\\"$host\\\"}\",\n \"legend\": \"{{host}}\",\n \"refId\": \"A\",\n \"maxDataPoints\": 240\n }\n ],\n \"transformations\": [\n {\n \"id\": \"organize\",\n \"options\": {}\n }\n ],\n \"name\": \"Old Used(Bytes)\",\n \"maxPerRow\": 4,\n \"options\": {\n \"tooltip\": {\n \"mode\": \"all\",\n \"sort\": \"desc\"\n },\n \"legend\": {\n \"displayMode\": \"hidden\",\n \"heightInPercentage\": 30,\n \"placement\": \"bottom\",\n \"behaviour\": \"showItem\",\n \"selectMode\": \"single\"\n },\n \"standardOptions\": {\n \"util\": \"bytesIEC\",\n \"decimals\": 1\n },\n \"thresholds\": {\n \"steps\": [\n {\n \"color\": \"#634CD9\",\n \"value\": null,\n \"type\": \"base\"\n }\n ]\n }\n },\n \"custom\": {\n \"drawStyle\": \"lines\",\n \"lineInterpolation\": \"smooth\",\n \"spanNulls\": false,\n \"lineWidth\": 2,\n \"fillOpacity\": 0.3,\n \"gradientMode\": \"opacity\",\n \"stack\": \"off\",\n \"scaleDistribution\": {\n \"type\": \"linear\"\n },\n \"showPoints\": \"none\",\n \"pointSize\": 5\n },\n \"overrides\": [\n {\n \"matcher\": {\n \"id\": \"byFrameRefID\"\n },\n \"properties\": {\n \"rightYAxisDisplay\": \"off\"\n }\n }\n ]\n },\n {\n \"custom\": {\n \"drawStyle\": \"lines\",\n \"fillOpacity\": 0.3,\n \"gradientMode\": \"opacity\",\n \"lineInterpolation\": \"smooth\",\n \"lineWidth\": 2,\n \"stack\": \"off\"\n },\n \"datasourceCate\": \"prometheus\",\n \"datasourceValue\": \"${datasource}\",\n \"id\": \"a0096936-3790-40a1-b2ad-d7805945b948\",\n \"layout\": {\n \"h\": 4,\n \"w\": 12,\n \"x\": 12,\n \"y\": 18,\n \"i\": \"14f655ac-9c1c-40fa-bfef-158cc8601ead\",\n \"isResizable\": true\n },\n \"name\": \"Committed Bytes\",\n \"options\": {\n \"legend\": {\n \"displayMode\": \"hidden\"\n },\n \"standardOptions\": {\n \"decimals\": 1,\n \"util\": \"bytesIEC\"\n },\n \"thresholds\": {},\n \"tooltip\": {\n \"mode\": \"all\",\n \"sort\": \"desc\"\n }\n },\n \"targets\": [\n {\n \"expr\": \"{__name__=~\\\"elasticsearch_jvm_mem_.+_committed_in_bytes\\\", cluster=\\\"$cluster\\\", host=~\\\"$host\\\"}\",\n \"legend\": \"{{__name__}} {{node_name}}\",\n \"refId\": \"A\"\n }\n ],\n \"type\": \"timeseries\",\n \"version\": \"2.0.0\"\n },\n {\n \"collapsed\": true,\n \"id\": \"e1d04a8c-81ee-4949-87de-3b70bc637584\",\n \"layout\": {\n \"h\": 1,\n \"w\": 24,\n \"x\": 0,\n \"y\": 22,\n \"i\": \"e1d04a8c-81ee-4949-87de-3b70bc637584\",\n \"isResizable\": false\n },\n \"name\": \"Translog\",\n \"panels\": [],\n \"type\": \"row\"\n },\n {\n \"custom\": {\n \"drawStyle\": \"lines\",\n \"fillOpacity\": 0.3,\n \"gradientMode\": \"opacity\",\n \"lineInterpolation\": \"smooth\",\n \"lineWidth\": 2,\n \"stack\": \"off\"\n },\n \"datasourceCate\": \"prometheus\",\n \"datasourceValue\": \"${datasource}\",\n \"id\": \"45aafb11-c694-4686-89ab-685068f91560\",\n \"layout\": {\n \"h\": 4,\n \"w\": 12,\n \"x\": 0,\n \"y\": 23,\n \"i\": \"45aafb11-c694-4686-89ab-685068f91560\",\n \"isResizable\": true\n },\n \"name\": \"Total translog operations\",\n \"options\": {\n \"legend\": {\n \"displayMode\": \"hidden\"\n },\n \"standardOptions\": {},\n \"thresholds\": {},\n \"tooltip\": {\n \"mode\": \"all\",\n \"sort\": \"none\"\n }\n },\n \"targets\": [\n {\n \"expr\": \"irate(elasticsearch_indices_translog_operations{cluster=\\\"$cluster\\\", host=~\\\"$host\\\"}[5m])\",\n \"legend\": \"{{host}}\",\n \"refId\": \"A\"\n }\n ],\n \"type\": \"timeseries\",\n \"version\": \"2.0.0\"\n },\n {\n \"custom\": {\n \"drawStyle\": \"lines\",\n \"fillOpacity\": 0.3,\n \"gradientMode\": \"opacity\",\n \"lineInterpolation\": \"smooth\",\n \"lineWidth\": 2,\n \"stack\": \"off\"\n },\n \"datasourceCate\": \"prometheus\",\n \"datasourceValue\": \"${datasource}\",\n \"id\": \"09ca6329-8eec-4a61-b19e-9bbeea2b9712\",\n \"layout\": {\n \"h\": 4,\n \"w\": 12,\n \"x\": 12,\n \"y\": 23,\n \"i\": \"56806f8a-525a-4ab4-a9d3-c83559ae4828\",\n \"isResizable\": true\n },\n \"name\": \"Total translog size in bytes\",\n \"options\": {\n \"legend\": {\n \"displayMode\": \"hidden\"\n },\n \"standardOptions\": {\n \"decimals\": 1,\n \"util\": \"bytesIEC\"\n },\n \"thresholds\": {},\n \"tooltip\": {\n \"mode\": \"all\",\n \"sort\": \"none\"\n }\n },\n \"targets\": [\n {\n \"expr\": \"irate(elasticsearch_indices_translog_size_in_bytes{cluster=\\\"$cluster\\\", host=~\\\"$host\\\"}[5m])\",\n \"legend\": \"{{host}}\",\n \"refId\": \"A\"\n }\n ],\n \"type\": \"timeseries\",\n \"version\": \"2.0.0\"\n },\n {\n \"collapsed\": true,\n \"id\": \"d9694c3f-9a14-4bde-9427-88531b0ea3a6\",\n \"layout\": {\n \"h\": 1,\n \"w\": 24,\n \"x\": 0,\n \"y\": 27,\n \"i\": \"d9694c3f-9a14-4bde-9427-88531b0ea3a6\",\n \"isResizable\": false\n },\n \"name\": \"Disk and Network\",\n \"panels\": [],\n \"type\": \"row\"\n },\n {\n \"type\": \"timeseries\",\n \"id\": \"6c0d9b3c-dda5-4da9-825e-33f650dbb008\",\n \"layout\": {\n \"h\": 4,\n \"w\": 12,\n \"x\": 0,\n \"y\": 28,\n \"i\": \"6c0d9b3c-dda5-4da9-825e-33f650dbb008\",\n \"isResizable\": true\n },\n \"version\": \"3.0.0\",\n \"datasourceCate\": \"prometheus\",\n \"datasourceValue\": \"${datasource}\",\n \"targets\": [\n {\n \"expr\": \"1-(elasticsearch_filesystem_data_free_bytes{cluster=\\\"$cluster\\\",host=~\\\"$host\\\"}/elasticsearch_filesystem_data_size_in_bytes{cluster=\\\"$cluster\\\",host=~\\\"$host\\\"})\",\n \"legend\": \"{{host}}\",\n \"refId\": \"A\",\n \"maxDataPoints\": 240\n }\n ],\n \"transformations\": [\n {\n \"id\": \"organize\",\n \"options\": {}\n }\n ],\n \"name\": \"Disk usage %\",\n \"maxPerRow\": 4,\n \"options\": {\n \"tooltip\": {\n \"mode\": \"all\",\n \"sort\": \"desc\"\n },\n \"legend\": {\n \"displayMode\": \"hidden\",\n \"heightInPercentage\": 30,\n \"placement\": \"bottom\",\n \"behaviour\": \"showItem\",\n \"selectMode\": \"single\"\n },\n \"standardOptions\": {\n \"util\": \"percentUnit\"\n },\n \"thresholds\": {\n \"steps\": [\n {\n \"color\": \"#6C53B1\",\n \"value\": null,\n \"type\": \"base\"\n }\n ]\n }\n },\n \"custom\": {\n \"drawStyle\": \"lines\",\n \"lineInterpolation\": \"smooth\",\n \"spanNulls\": false,\n \"lineWidth\": 2,\n \"fillOpacity\": 0.3,\n \"gradientMode\": \"opacity\",\n \"stack\": \"off\",\n \"scaleDistribution\": {\n \"type\": \"linear\"\n },\n \"showPoints\": \"none\",\n \"pointSize\": 5\n },\n \"overrides\": [\n {\n \"matcher\": {\n \"id\": \"byFrameRefID\"\n },\n \"properties\": {\n \"rightYAxisDisplay\": \"off\"\n }\n }\n ]\n },\n {\n \"type\": \"timeseries\",\n \"id\": \"4f7ce5a7-2771-4cbf-a569-b1a90b070b93\",\n \"layout\": {\n \"h\": 4,\n \"w\": 12,\n \"x\": 12,\n \"y\": 28,\n \"i\": \"4f7ce5a7-2771-4cbf-a569-b1a90b070b93\",\n \"isResizable\": true\n },\n \"version\": \"3.0.0\",\n \"datasourceCate\": \"prometheus\",\n \"datasourceValue\": \"${datasource}\",\n \"targets\": [\n {\n \"expr\": \"irate(elasticsearch_transport_tx_size_in_bytes_total{cluster=\\\"$cluster\\\",host=~\\\"$host\\\"}[5m])\",\n \"legend\": \"{{host}}: sent\",\n \"refId\": \"A\",\n \"maxDataPoints\": 240\n },\n {\n \"expr\": \"-irate(elasticsearch_transport_rx_size_in_bytes_total{cluster=\\\"$cluster\\\",host=~\\\"$host\\\"}[5m])\",\n \"legend\": \"{{host}}: received\",\n \"refId\": \"B\",\n \"maxDataPoints\": 240\n }\n ],\n \"transformations\": [\n {\n \"id\": \"organize\",\n \"options\": {}\n }\n ],\n \"name\": \"Network usage\",\n \"maxPerRow\": 4,\n \"options\": {\n \"tooltip\": {\n \"mode\": \"all\",\n \"sort\": \"desc\"\n },\n \"legend\": {\n \"displayMode\": \"hidden\",\n \"heightInPercentage\": 30,\n \"placement\": \"bottom\",\n \"behaviour\": \"showItem\",\n \"selectMode\": \"single\"\n },\n \"standardOptions\": {},\n \"thresholds\": {\n \"steps\": [\n {\n \"color\": \"#6C53B1\",\n \"value\": null,\n \"type\": \"base\"\n }\n ]\n }\n },\n \"custom\": {\n \"drawStyle\": \"lines\",\n \"lineInterpolation\": \"smooth\",\n \"spanNulls\": false,\n \"lineWidth\": 2,\n \"fillOpacity\": 0.3,\n \"gradientMode\": \"opacity\",\n \"stack\": \"off\",\n \"scaleDistribution\": {\n \"type\": \"linear\"\n },\n \"showPoints\": \"none\",\n \"pointSize\": 5\n },\n \"overrides\": [\n {\n \"matcher\": {\n \"id\": \"byFrameRefID\"\n },\n \"properties\": {\n \"rightYAxisDisplay\": \"off\"\n }\n }\n ]\n },\n {\n \"collapsed\": true,\n \"id\": \"292b6c24-5471-4eeb-9d65-1a1e7a684fe3\",\n \"layout\": {\n \"h\": 1,\n \"w\": 24,\n \"x\": 0,\n \"y\": 32,\n \"i\": \"292b6c24-5471-4eeb-9d65-1a1e7a684fe3\",\n \"isResizable\": false\n },\n \"name\": \"Documents\",\n \"panels\": [],\n \"type\": \"row\"\n },\n {\n \"custom\": {\n \"drawStyle\": \"lines\",\n \"fillOpacity\": 0.3,\n \"gradientMode\": \"opacity\",\n \"lineInterpolation\": \"smooth\",\n \"lineWidth\": 2,\n \"stack\": \"off\"\n },\n \"datasourceCate\": \"prometheus\",\n \"datasourceValue\": \"${datasource}\",\n \"id\": \"e98839c4-e3f3-4e6e-be3a-c44b70e6072c\",\n \"layout\": {\n \"h\": 4,\n \"w\": 12,\n \"x\": 0,\n \"y\": 33,\n \"i\": \"e98839c4-e3f3-4e6e-be3a-c44b70e6072c\",\n \"isResizable\": true\n },\n \"name\": \"Documents count on node\",\n \"options\": {\n \"legend\": {\n \"displayMode\": \"hidden\"\n },\n \"standardOptions\": {},\n \"thresholds\": {},\n \"tooltip\": {\n \"mode\": \"all\",\n \"sort\": \"desc\"\n }\n },\n \"targets\": [\n {\n \"expr\": \"elasticsearch_indices_docs_count{cluster=\\\"$cluster\\\", host=~\\\"$host\\\"}\",\n \"legend\": \"{{host}}\",\n \"refId\": \"A\"\n }\n ],\n \"type\": \"timeseries\",\n \"version\": \"2.0.0\"\n },\n {\n \"custom\": {\n \"drawStyle\": \"lines\",\n \"fillOpacity\": 0.3,\n \"gradientMode\": \"opacity\",\n \"lineInterpolation\": \"smooth\",\n \"lineWidth\": 2,\n \"stack\": \"off\"\n },\n \"datasourceCate\": \"prometheus\",\n \"datasourceValue\": \"${datasource}\",\n \"id\": \"45c4e3d9-90f1-41bd-8169-1d8c0a921ba9\",\n \"layout\": {\n \"h\": 4,\n \"w\": 12,\n \"x\": 12,\n \"y\": 33,\n \"i\": \"45c4e3d9-90f1-41bd-8169-1d8c0a921ba9\",\n \"isResizable\": true\n },\n \"name\": \"Documents indexed rate\",\n \"options\": {\n \"legend\": {\n \"displayMode\": \"hidden\"\n },\n \"standardOptions\": {},\n \"thresholds\": {},\n \"tooltip\": {\n \"mode\": \"all\",\n \"sort\": \"desc\"\n }\n },\n \"targets\": [\n {\n \"expr\": \"irate(elasticsearch_indices_indexing_index_total{cluster=\\\"$cluster\\\",host=~\\\"$host\\\"}[5m])\",\n \"legend\": \"{{host}}\",\n \"refId\": \"A\"\n }\n ],\n \"type\": \"timeseries\",\n \"version\": \"2.0.0\"\n },\n {\n \"custom\": {\n \"drawStyle\": \"lines\",\n \"fillOpacity\": 0.3,\n \"gradientMode\": \"opacity\",\n \"lineInterpolation\": \"smooth\",\n \"lineWidth\": 2,\n \"stack\": \"off\"\n },\n \"datasourceCate\": \"prometheus\",\n \"datasourceValue\": \"${datasource}\",\n \"id\": \"3b2a922d-4423-4845-8cfc-95970f3300d6\",\n \"layout\": {\n \"h\": 4,\n \"w\": 12,\n \"x\": 0,\n \"y\": 37,\n \"i\": \"3b2a922d-4423-4845-8cfc-95970f3300d6\",\n \"isResizable\": true\n },\n \"name\": \"Documents deleted rate\",\n \"options\": {\n \"legend\": {\n \"displayMode\": \"hidden\"\n },\n \"standardOptions\": {},\n \"thresholds\": {},\n \"tooltip\": {\n \"mode\": \"all\",\n \"sort\": \"desc\"\n }\n },\n \"targets\": [\n {\n \"expr\": \"irate(elasticsearch_indices_docs_deleted{cluster=\\\"$cluster\\\",host=~\\\"$host\\\"}[5m])\",\n \"legend\": \"{{host}}\",\n \"refId\": \"A\"\n }\n ],\n \"type\": \"timeseries\",\n \"version\": \"2.0.0\"\n },\n {\n \"type\": \"timeseries\",\n \"id\": \"764fbcf7-3056-41ef-b62a-51813a6c315f\",\n \"layout\": {\n \"h\": 4,\n \"w\": 6,\n \"x\": 12,\n \"y\": 37,\n \"i\": \"764fbcf7-3056-41ef-b62a-51813a6c315f\",\n \"isResizable\": true\n },\n \"version\": \"3.0.0\",\n \"datasourceCate\": \"prometheus\",\n \"datasourceValue\": \"${datasource}\",\n \"targets\": [\n {\n \"expr\": \"rate(elasticsearch_indices_merges_docs_total{cluster=\\\"$cluster\\\",host=~\\\"$host\\\"}[5m])\",\n \"legend\": \"{{host}}\",\n \"refId\": \"A\",\n \"maxDataPoints\": 240\n }\n ],\n \"transformations\": [\n {\n \"id\": \"organize\",\n \"options\": {}\n }\n ],\n \"name\": \"Documents merged rate\",\n \"maxPerRow\": 4,\n \"options\": {\n \"tooltip\": {\n \"mode\": \"all\",\n \"sort\": \"desc\"\n },\n \"legend\": {\n \"displayMode\": \"hidden\",\n \"heightInPercentage\": 30,\n \"placement\": \"bottom\",\n \"behaviour\": \"showItem\",\n \"selectMode\": \"single\"\n },\n \"standardOptions\": {},\n \"thresholds\": {\n \"steps\": [\n {\n \"color\": \"#6C53B1\",\n \"value\": null,\n \"type\": \"base\"\n }\n ]\n }\n },\n \"custom\": {\n \"drawStyle\": \"lines\",\n \"lineInterpolation\": \"smooth\",\n \"spanNulls\": false,\n \"lineWidth\": 2,\n \"fillOpacity\": 0.3,\n \"gradientMode\": \"opacity\",\n \"stack\": \"off\",\n \"scaleDistribution\": {\n \"type\": \"linear\"\n },\n \"showPoints\": \"none\",\n \"pointSize\": 5\n },\n \"overrides\": [\n {\n \"matcher\": {\n \"id\": \"byFrameRefID\"\n },\n \"properties\": {\n \"rightYAxisDisplay\": \"off\"\n }\n }\n ]\n },\n {\n \"custom\": {\n \"drawStyle\": \"lines\",\n \"fillOpacity\": 0.3,\n \"gradientMode\": \"opacity\",\n \"lineInterpolation\": \"smooth\",\n \"lineWidth\": 2,\n \"stack\": \"off\"\n },\n \"datasourceCate\": \"prometheus\",\n \"datasourceValue\": \"${datasource}\",\n \"id\": \"7cc04ae4-946d-4837-9ea9-764a7cc2eecd\",\n \"layout\": {\n \"h\": 4,\n \"w\": 6,\n \"x\": 18,\n \"y\": 37,\n \"i\": \"97b5d900-e91e-4e0e-8184-f508a3433bc6\",\n \"isResizable\": true\n },\n \"name\": \"Documents merged bytes\",\n \"options\": {\n \"legend\": {\n \"displayMode\": \"hidden\"\n },\n \"standardOptions\": {\n \"decimals\": 1,\n \"util\": \"bytesIEC\"\n },\n \"thresholds\": {},\n \"tooltip\": {\n \"mode\": \"all\",\n \"sort\": \"desc\"\n }\n },\n \"targets\": [\n {\n \"expr\": \"irate(elasticsearch_indices_merges_total_size_in_bytes{cluster=\\\"$cluster\\\",host=~\\\"$host\\\"}[5m])\",\n \"legend\": \"{{host}}\",\n \"refId\": \"A\"\n }\n ],\n \"type\": \"timeseries\",\n \"version\": \"2.0.0\"\n },\n {\n \"collapsed\": true,\n \"id\": \"a0545cbd-6df5-4845-90e0-88a710f738ba\",\n \"layout\": {\n \"h\": 1,\n \"w\": 24,\n \"x\": 0,\n \"y\": 41,\n \"i\": \"a0545cbd-6df5-4845-90e0-88a710f738ba\",\n \"isResizable\": false\n },\n \"name\": \"Times\",\n \"panels\": [],\n \"type\": \"row\"\n },\n {\n \"type\": \"timeseries\",\n \"id\": \"ad0445b0-8539-440d-bbf4-712450132a7a\",\n \"layout\": {\n \"h\": 4,\n \"w\": 12,\n \"x\": 0,\n \"y\": 42,\n \"i\": \"ad0445b0-8539-440d-bbf4-712450132a7a\",\n \"isResizable\": true\n },\n \"version\": \"3.0.0\",\n \"datasourceCate\": \"prometheus\",\n \"datasourceValue\": \"${datasource}\",\n \"targets\": [\n {\n \"expr\": \"irate(elasticsearch_indices_search_query_time_seconds{cluster=\\\"$cluster\\\",host=~\\\"$host\\\"}[5m])\",\n \"legend\": \"{{host}}\",\n \"refId\": \"A\",\n \"maxDataPoints\": 240\n }\n ],\n \"transformations\": [\n {\n \"id\": \"organize\",\n \"options\": {}\n }\n ],\n \"name\": \"Query time(Unit: s)\",\n \"maxPerRow\": 4,\n \"options\": {\n \"tooltip\": {\n \"mode\": \"all\",\n \"sort\": \"desc\"\n },\n \"legend\": {\n \"displayMode\": \"hidden\",\n \"heightInPercentage\": 30,\n \"placement\": \"bottom\",\n \"behaviour\": \"showItem\",\n \"selectMode\": \"single\"\n },\n \"standardOptions\": {},\n \"thresholds\": {\n \"steps\": [\n {\n \"color\": \"#6C53B1\",\n \"value\": null,\n \"type\": \"base\"\n }\n ]\n }\n },\n \"custom\": {\n \"drawStyle\": \"lines\",\n \"lineInterpolation\": \"smooth\",\n \"spanNulls\": false,\n \"lineWidth\": 2,\n \"fillOpacity\": 0.3,\n \"gradientMode\": \"opacity\",\n \"stack\": \"off\",\n \"scaleDistribution\": {\n \"type\": \"linear\"\n },\n \"showPoints\": \"none\",\n \"pointSize\": 5\n },\n \"overrides\": [\n {\n \"matcher\": {\n \"id\": \"byFrameRefID\"\n },\n \"properties\": {\n \"rightYAxisDisplay\": \"off\"\n }\n }\n ]\n },\n {\n \"type\": \"timeseries\",\n \"id\": \"c3cf6c57-c4ce-4bc2-a150-df32c4951144\",\n \"layout\": {\n \"h\": 4,\n \"w\": 12,\n \"x\": 12,\n \"y\": 42,\n \"i\": \"2af98dc1-f24e-4c7b-bd2c-723224facc5d\",\n \"isResizable\": true\n },\n \"version\": \"3.0.0\",\n \"datasourceCate\": \"prometheus\",\n \"datasourceValue\": \"${datasource}\",\n \"targets\": [\n {\n \"expr\": \"irate(elasticsearch_indices_indexing_index_time_seconds_total{cluster=\\\"$cluster\\\",host=~\\\"$host\\\"}[5m])\",\n \"legend\": \"{{host}}\",\n \"refId\": \"A\",\n \"maxDataPoints\": 240\n }\n ],\n \"transformations\": [\n {\n \"id\": \"organize\",\n \"options\": {}\n }\n ],\n \"name\": \"Indexing time(Unit: s)\",\n \"maxPerRow\": 4,\n \"options\": {\n \"tooltip\": {\n \"mode\": \"all\",\n \"sort\": \"desc\"\n },\n \"legend\": {\n \"displayMode\": \"hidden\",\n \"heightInPercentage\": 30,\n \"placement\": \"bottom\",\n \"behaviour\": \"showItem\",\n \"selectMode\": \"single\"\n },\n \"standardOptions\": {},\n \"thresholds\": {\n \"steps\": [\n {\n \"color\": \"#6C53B1\",\n \"value\": null,\n \"type\": \"base\"\n }\n ]\n }\n },\n \"custom\": {\n \"drawStyle\": \"lines\",\n \"lineInterpolation\": \"smooth\",\n \"spanNulls\": false,\n \"lineWidth\": 2,\n \"fillOpacity\": 0.3,\n \"gradientMode\": \"opacity\",\n \"stack\": \"off\",\n \"scaleDistribution\": {\n \"type\": \"linear\"\n },\n \"showPoints\": \"none\",\n \"pointSize\": 5\n },\n \"overrides\": [\n {\n \"matcher\": {\n \"id\": \"byFrameRefID\"\n },\n \"properties\": {\n \"rightYAxisDisplay\": \"off\"\n }\n }\n ]\n },\n {\n \"type\": \"timeseries\",\n \"id\": \"022db454-70ba-49f5-8c11-f89b76d145cb\",\n \"layout\": {\n \"h\": 4,\n \"w\": 12,\n \"x\": 0,\n \"y\": 46,\n \"i\": \"553c7da8-2d83-4ea0-a6ef-b064a5101633\",\n \"isResizable\": true\n },\n \"version\": \"3.0.0\",\n \"datasourceCate\": \"prometheus\",\n \"datasourceValue\": \"${datasource}\",\n \"targets\": [\n {\n \"expr\": \"irate(elasticsearch_indices_merges_total_time_seconds_total{cluster=\\\"$cluster\\\",host=~\\\"$host\\\"}[5m])\",\n \"legend\": \"{{host}}\",\n \"refId\": \"A\",\n \"maxDataPoints\": 240,\n \"step\": null\n }\n ],\n \"transformations\": [\n {\n \"id\": \"organize\",\n \"options\": {}\n }\n ],\n \"name\": \"Merging time(Unit: s)\",\n \"maxPerRow\": 4,\n \"options\": {\n \"tooltip\": {\n \"mode\": \"all\",\n \"sort\": \"desc\"\n },\n \"legend\": {\n \"displayMode\": \"hidden\",\n \"heightInPercentage\": 30,\n \"placement\": \"bottom\",\n \"behaviour\": \"showItem\",\n \"selectMode\": \"single\"\n },\n \"standardOptions\": {},\n \"thresholds\": {\n \"steps\": [\n {\n \"color\": \"#6C53B1\",\n \"value\": null,\n \"type\": \"base\"\n }\n ]\n }\n },\n \"custom\": {\n \"drawStyle\": \"lines\",\n \"lineInterpolation\": \"smooth\",\n \"spanNulls\": false,\n \"lineWidth\": 2,\n \"fillOpacity\": 0.3,\n \"gradientMode\": \"opacity\",\n \"stack\": \"off\",\n \"scaleDistribution\": {\n \"type\": \"linear\"\n },\n \"showPoints\": \"none\",\n \"pointSize\": 5\n },\n \"overrides\": [\n {\n \"matcher\": {\n \"id\": \"byFrameRefID\"\n },\n \"properties\": {\n \"rightYAxisDisplay\": \"off\"\n }\n }\n ]\n },\n {\n \"type\": \"timeseries\",\n \"id\": \"f20bad4f-656c-428a-a1cf-aafb7d92137c\",\n \"layout\": {\n \"h\": 4,\n \"w\": 12,\n \"x\": 12,\n \"y\": 46,\n \"i\": \"51056e8d-6dc8-4c7f-91e9-9c24c056462d\",\n \"isResizable\": true\n },\n \"version\": \"3.0.0\",\n \"datasourceCate\": \"prometheus\",\n \"datasourceValue\": \"${datasource}\",\n \"targets\": [\n {\n \"expr\": \"irate(elasticsearch_indices_indexing_throttle_time_seconds_total{cluster=\\\"$cluster\\\",host=~\\\"$host\\\"}[5m])\",\n \"legend\": \"{{host}}\",\n \"refId\": \"A\",\n \"maxDataPoints\": 240\n }\n ],\n \"transformations\": [\n {\n \"id\": \"organize\",\n \"options\": {}\n }\n ],\n \"name\": \"Indexing throttle time(Unit: s)\",\n \"maxPerRow\": 4,\n \"options\": {\n \"tooltip\": {\n \"mode\": \"all\",\n \"sort\": \"desc\"\n },\n \"legend\": {\n \"displayMode\": \"hidden\",\n \"heightInPercentage\": 30,\n \"placement\": \"bottom\",\n \"behaviour\": \"showItem\",\n \"selectMode\": \"single\"\n },\n \"standardOptions\": {},\n \"thresholds\": {\n \"steps\": [\n {\n \"color\": \"#6C53B1\",\n \"value\": null,\n \"type\": \"base\"\n }\n ]\n }\n },\n \"custom\": {\n \"drawStyle\": \"lines\",\n \"lineInterpolation\": \"smooth\",\n \"spanNulls\": false,\n \"lineWidth\": 2,\n \"fillOpacity\": 0.3,\n \"gradientMode\": \"opacity\",\n \"stack\": \"off\",\n \"scaleDistribution\": {\n \"type\": \"linear\"\n },\n \"showPoints\": \"none\",\n \"pointSize\": 5\n },\n \"overrides\": [\n {\n \"matcher\": {\n \"id\": \"byFrameRefID\"\n },\n \"properties\": {\n \"rightYAxisDisplay\": \"off\"\n }\n }\n ]\n },\n {\n \"collapsed\": true,\n \"id\": \"2c56fb7a-85a0-4396-a317-6754d761cff2\",\n \"layout\": {\n \"h\": 1,\n \"w\": 24,\n \"x\": 0,\n \"y\": 50,\n \"i\": \"2c56fb7a-85a0-4396-a317-6754d761cff2\",\n \"isResizable\": false\n },\n \"name\": \"Thread Pool\",\n \"panels\": [],\n \"type\": \"row\"\n },\n {\n \"type\": \"timeseries\",\n \"id\": \"cefafeb9-fc8a-4c73-92b3-648cd6f08b11\",\n \"layout\": {\n \"h\": 4,\n \"w\": 6,\n \"x\": 0,\n \"y\": 51,\n \"i\": \"cefafeb9-fc8a-4c73-92b3-648cd6f08b11\",\n \"isResizable\": true\n },\n \"version\": \"3.0.0\",\n \"datasourceCate\": \"prometheus\",\n \"datasourceValue\": \"${datasource}\",\n \"targets\": [\n {\n \"expr\": \"irate(elasticsearch_thread_pool_rejected_count{cluster=\\\"$cluster\\\", host=~\\\"$host\\\"}[5m])\",\n \"legend\": \"{{host}}: {{type}}\",\n \"refId\": \"A\",\n \"maxDataPoints\": 240\n }\n ],\n \"transformations\": [\n {\n \"id\": \"organize\",\n \"options\": {}\n }\n ],\n \"name\": \"Thread Pool operations rejected\",\n \"maxPerRow\": 4,\n \"options\": {\n \"tooltip\": {\n \"mode\": \"all\",\n \"sort\": \"desc\"\n },\n \"legend\": {\n \"displayMode\": \"hidden\",\n \"heightInPercentage\": 30,\n \"placement\": \"bottom\",\n \"behaviour\": \"showItem\",\n \"selectMode\": \"single\"\n },\n \"standardOptions\": {},\n \"thresholds\": {\n \"steps\": [\n {\n \"color\": \"#6C53B1\",\n \"value\": null,\n \"type\": \"base\"\n }\n ]\n }\n },\n \"custom\": {\n \"drawStyle\": \"lines\",\n \"lineInterpolation\": \"smooth\",\n \"spanNulls\": false,\n \"lineWidth\": 2,\n \"fillOpacity\": 0.3,\n \"gradientMode\": \"opacity\",\n \"stack\": \"off\",\n \"scaleDistribution\": {\n \"type\": \"linear\"\n },\n \"showPoints\": \"none\",\n \"pointSize\": 5\n },\n \"overrides\": [\n {\n \"matcher\": {\n \"id\": \"byFrameRefID\"\n },\n \"properties\": {\n \"rightYAxisDisplay\": \"off\"\n }\n }\n ]\n },\n {\n \"type\": \"timeseries\",\n \"id\": \"0ab67903-16ea-4001-b784-ae04d8b815c0\",\n \"layout\": {\n \"h\": 4,\n \"w\": 6,\n \"x\": 6,\n \"y\": 51,\n \"i\": \"793e98e7-2729-4106-940c-ecccff1d4b89\",\n \"isResizable\": true\n },\n \"version\": \"3.0.0\",\n \"datasourceCate\": \"prometheus\",\n \"datasourceValue\": \"${datasource}\",\n \"targets\": [\n {\n \"expr\": \"elasticsearch_thread_pool_active_count{cluster=\\\"$cluster\\\", host=~\\\"$host\\\"}\",\n \"legend\": \"{{host}}: {{type}}\",\n \"refId\": \"A\",\n \"maxDataPoints\": 240\n }\n ],\n \"transformations\": [\n {\n \"id\": \"organize\",\n \"options\": {}\n }\n ],\n \"name\": \"Thread Pool threads active\",\n \"maxPerRow\": 4,\n \"options\": {\n \"tooltip\": {\n \"mode\": \"all\",\n \"sort\": \"desc\"\n },\n \"legend\": {\n \"displayMode\": \"hidden\",\n \"heightInPercentage\": 30,\n \"placement\": \"bottom\",\n \"behaviour\": \"showItem\",\n \"selectMode\": \"single\"\n },\n \"standardOptions\": {},\n \"thresholds\": {\n \"steps\": [\n {\n \"color\": \"#6C53B1\",\n \"value\": null,\n \"type\": \"base\"\n }\n ]\n }\n },\n \"custom\": {\n \"drawStyle\": \"lines\",\n \"lineInterpolation\": \"smooth\",\n \"spanNulls\": false,\n \"lineWidth\": 2,\n \"fillOpacity\": 0.3,\n \"gradientMode\": \"opacity\",\n \"stack\": \"off\",\n \"scaleDistribution\": {\n \"type\": \"linear\"\n },\n \"showPoints\": \"none\",\n \"pointSize\": 5\n },\n \"overrides\": [\n {\n \"matcher\": {\n \"id\": \"byFrameRefID\"\n },\n \"properties\": {\n \"rightYAxisDisplay\": \"off\"\n }\n }\n ]\n },\n {\n \"type\": \"timeseries\",\n \"id\": \"bb5dc07d-673b-4e2d-b44c-441acfa7c27b\",\n \"layout\": {\n \"h\": 4,\n \"w\": 6,\n \"x\": 12,\n \"y\": 51,\n \"i\": \"9a14c86a-86af-4464-ac82-41f621ce7166\",\n \"isResizable\": true\n },\n \"version\": \"3.0.0\",\n \"datasourceCate\": \"prometheus\",\n \"datasourceValue\": \"${datasource}\",\n \"targets\": [\n {\n \"expr\": \"elasticsearch_thread_pool_queue_count{cluster=\\\"$cluster\\\", host=~\\\"$host\\\"}\",\n \"legend\": \"{{host}}: {{type}}\",\n \"refId\": \"A\",\n \"maxDataPoints\": 240\n }\n ],\n \"transformations\": [\n {\n \"id\": \"organize\",\n \"options\": {}\n }\n ],\n \"name\": \"Thread Pool threads queued\",\n \"maxPerRow\": 4,\n \"options\": {\n \"tooltip\": {\n \"mode\": \"all\",\n \"sort\": \"desc\"\n },\n \"legend\": {\n \"displayMode\": \"hidden\",\n \"heightInPercentage\": 30,\n \"placement\": \"bottom\",\n \"behaviour\": \"showItem\",\n \"selectMode\": \"single\"\n },\n \"standardOptions\": {},\n \"thresholds\": {\n \"steps\": [\n {\n \"color\": \"#6C53B1\",\n \"value\": null,\n \"type\": \"base\"\n }\n ]\n }\n },\n \"custom\": {\n \"drawStyle\": \"lines\",\n \"lineInterpolation\": \"smooth\",\n \"spanNulls\": false,\n \"lineWidth\": 2,\n \"fillOpacity\": 0.3,\n \"gradientMode\": \"opacity\",\n \"stack\": \"off\",\n \"scaleDistribution\": {\n \"type\": \"linear\"\n },\n \"showPoints\": \"none\",\n \"pointSize\": 5\n },\n \"overrides\": [\n {\n \"matcher\": {\n \"id\": \"byFrameRefID\"\n },\n \"properties\": {\n \"rightYAxisDisplay\": \"off\"\n }\n }\n ]\n },\n {\n \"type\": \"timeseries\",\n \"id\": \"4cac1498-c141-483f-97c6-e1177317a2ea\",\n \"layout\": {\n \"h\": 4,\n \"w\": 6,\n \"x\": 18,\n \"y\": 51,\n \"i\": \"d5f42ea7-bdb5-44da-9ba6-7c0f09ba7c71\",\n \"isResizable\": true\n },\n \"version\": \"3.0.0\",\n \"datasourceCate\": \"prometheus\",\n \"datasourceValue\": \"${datasource}\",\n \"targets\": [\n {\n \"expr\": \"irate(elasticsearch_thread_pool_completed_count{cluster=\\\"$cluster\\\",host=~\\\"$host\\\"}[5m])\",\n \"legend\": \"{{host}}: {{type}}\",\n \"refId\": \"A\",\n \"maxDataPoints\": 240\n }\n ],\n \"transformations\": [\n {\n \"id\": \"organize\",\n \"options\": {}\n }\n ],\n \"name\": \"Thread Pool operations completed\",\n \"maxPerRow\": 4,\n \"options\": {\n \"tooltip\": {\n \"mode\": \"all\",\n \"sort\": \"desc\"\n },\n \"legend\": {\n \"displayMode\": \"hidden\",\n \"heightInPercentage\": 30,\n \"placement\": \"bottom\",\n \"behaviour\": \"showItem\",\n \"selectMode\": \"single\"\n },\n \"standardOptions\": {},\n \"thresholds\": {\n \"steps\": [\n {\n \"color\": \"#6C53B1\",\n \"value\": null,\n \"type\": \"base\"\n }\n ]\n }\n },\n \"custom\": {\n \"drawStyle\": \"lines\",\n \"lineInterpolation\": \"smooth\",\n \"spanNulls\": false,\n \"lineWidth\": 2,\n \"fillOpacity\": 0.3,\n \"gradientMode\": \"opacity\",\n \"stack\": \"off\",\n \"scaleDistribution\": {\n \"type\": \"linear\"\n },\n \"showPoints\": \"none\",\n \"pointSize\": 5\n },\n \"overrides\": [\n {\n \"matcher\": {\n \"id\": \"byFrameRefID\"\n },\n \"properties\": {\n \"rightYAxisDisplay\": \"off\"\n }\n }\n ]\n },\n {\n \"collapsed\": true,\n \"id\": \"a5c3b529-c329-4a66-aab0-6caebba8be96\",\n \"layout\": {\n \"h\": 1,\n \"w\": 24,\n \"x\": 0,\n \"y\": 55,\n \"i\": \"a5c3b529-c329-4a66-aab0-6caebba8be96\",\n \"isResizable\": false\n },\n \"name\": \"Caches\",\n \"panels\": [],\n \"type\": \"row\"\n },\n {\n \"custom\": {\n \"drawStyle\": \"lines\",\n \"fillOpacity\": 0.3,\n \"gradientMode\": \"opacity\",\n \"lineInterpolation\": \"smooth\",\n \"lineWidth\": 2,\n \"stack\": \"off\"\n },\n \"datasourceCate\": \"prometheus\",\n \"datasourceValue\": \"${datasource}\",\n \"id\": \"5247f393-a934-4d9e-be0f-40b177d2be80\",\n \"layout\": {\n \"h\": 4,\n \"w\": 4,\n \"x\": 0,\n \"y\": 56,\n \"i\": \"5247f393-a934-4d9e-be0f-40b177d2be80\",\n \"isResizable\": true\n },\n \"name\": \"Field data memory size\",\n \"options\": {\n \"legend\": {\n \"displayMode\": \"hidden\"\n },\n \"standardOptions\": {\n \"decimals\": 0,\n \"util\": \"bytesIEC\"\n },\n \"thresholds\": {},\n \"tooltip\": {\n \"mode\": \"all\",\n \"sort\": \"desc\"\n }\n },\n \"targets\": [\n {\n \"expr\": \"elasticsearch_indices_fielddata_memory_size_in_bytes{cluster=\\\"$cluster\\\", host=~\\\"$host\\\"}\",\n \"legend\": \"{{host}}\",\n \"refId\": \"A\"\n }\n ],\n \"type\": \"timeseries\",\n \"version\": \"2.0.0\"\n },\n {\n \"custom\": {\n \"drawStyle\": \"lines\",\n \"fillOpacity\": 0.3,\n \"gradientMode\": \"opacity\",\n \"lineInterpolation\": \"smooth\",\n \"lineWidth\": 2,\n \"stack\": \"off\"\n },\n \"datasourceCate\": \"prometheus\",\n \"datasourceValue\": \"${datasource}\",\n \"id\": \"b87c56f7-4e50-4d15-8bcd-1218fee879d9\",\n \"layout\": {\n \"h\": 4,\n \"w\": 4,\n \"x\": 4,\n \"y\": 56,\n \"i\": \"c33fceb6-df37-483e-ba53-4ffa5f5e5456\",\n \"isResizable\": true\n },\n \"name\": \"Field data evictions\",\n \"options\": {\n \"legend\": {\n \"displayMode\": \"hidden\"\n },\n \"standardOptions\": {\n \"decimals\": 0,\n \"util\": \"bytesIEC\"\n },\n \"thresholds\": {},\n \"tooltip\": {\n \"mode\": \"all\",\n \"sort\": \"desc\"\n }\n },\n \"targets\": [\n {\n \"expr\": \"rate(elasticsearch_indices_fielddata_evictions{cluster=\\\"$cluster\\\", host=~\\\"$host\\\"}[5m])\",\n \"legend\": \"{{host}}\",\n \"refId\": \"A\"\n }\n ],\n \"type\": \"timeseries\",\n \"version\": \"2.0.0\"\n },\n {\n \"custom\": {\n \"drawStyle\": \"lines\",\n \"fillOpacity\": 0.3,\n \"gradientMode\": \"opacity\",\n \"lineInterpolation\": \"smooth\",\n \"lineWidth\": 2,\n \"stack\": \"off\"\n },\n \"datasourceCate\": \"prometheus\",\n \"datasourceValue\": \"${datasource}\",\n \"id\": \"ae2d0a7a-b6cd-4fd5-99d4-3c4289b8b5a8\",\n \"layout\": {\n \"h\": 4,\n \"w\": 4,\n \"x\": 8,\n \"y\": 56,\n \"i\": \"445484f4-32d3-4569-af8d-76790d0aa56b\",\n \"isResizable\": true\n },\n \"name\": \"Query cache size\",\n \"options\": {\n \"legend\": {\n \"displayMode\": \"hidden\"\n },\n \"standardOptions\": {\n \"decimals\": 0,\n \"util\": \"bytesIEC\"\n },\n \"thresholds\": {},\n \"tooltip\": {\n \"mode\": \"all\",\n \"sort\": \"desc\"\n }\n },\n \"targets\": [\n {\n \"expr\": \"elasticsearch_indices_query_cache_memory_size_in_bytes{cluster=\\\"$cluster\\\", host=~\\\"$host\\\"}\",\n \"legend\": \"{{host}}\",\n \"refId\": \"A\"\n }\n ],\n \"type\": \"timeseries\",\n \"version\": \"2.0.0\"\n },\n {\n \"custom\": {\n \"drawStyle\": \"lines\",\n \"fillOpacity\": 0.3,\n \"gradientMode\": \"opacity\",\n \"lineInterpolation\": \"smooth\",\n \"lineWidth\": 2,\n \"stack\": \"off\"\n },\n \"datasourceCate\": \"prometheus\",\n \"datasourceValue\": \"${datasource}\",\n \"id\": \"78e4badc-8d51-4aa6-81c5-d1c9183810a2\",\n \"layout\": {\n \"h\": 4,\n \"w\": 4,\n \"x\": 12,\n \"y\": 56,\n \"i\": \"ce9aa255-9d5b-44ed-9071-85e9d95675ec\",\n \"isResizable\": true\n },\n \"name\": \"Query cache evictions\",\n \"options\": {\n \"legend\": {\n \"displayMode\": \"hidden\"\n },\n \"standardOptions\": {\n \"decimals\": 0,\n \"util\": \"bytesIEC\"\n },\n \"thresholds\": {},\n \"tooltip\": {\n \"mode\": \"all\",\n \"sort\": \"desc\"\n }\n },\n \"targets\": [\n {\n \"expr\": \"rate(elasticsearch_indices_query_cache_evictions{cluster=\\\"$cluster\\\", host=~\\\"$host\\\"}[5m])\",\n \"legend\": \"{{host}}\",\n \"refId\": \"A\"\n }\n ],\n \"type\": \"timeseries\",\n \"version\": \"2.0.0\"\n },\n {\n \"custom\": {\n \"drawStyle\": \"lines\",\n \"fillOpacity\": 0.3,\n \"gradientMode\": \"opacity\",\n \"lineInterpolation\": \"smooth\",\n \"lineWidth\": 2,\n \"stack\": \"off\"\n },\n \"datasourceCate\": \"prometheus\",\n \"datasourceValue\": \"${datasource}\",\n \"id\": \"296b43f1-2f33-492a-bce8-6f0fde1e7b52\",\n \"layout\": {\n \"h\": 4,\n \"w\": 8,\n \"x\": 16,\n \"y\": 56,\n \"i\": \"b8b2604c-d84f-426f-b033-af9035a9e80d\",\n \"isResizable\": true\n },\n \"name\": \"Request cache evictions\",\n \"options\": {\n \"legend\": {\n \"displayMode\": \"hidden\"\n },\n \"standardOptions\": {\n \"decimals\": 0,\n \"util\": \"bytesIEC\"\n },\n \"thresholds\": {},\n \"tooltip\": {\n \"mode\": \"all\",\n \"sort\": \"desc\"\n }\n },\n \"targets\": [\n {\n \"expr\": \"rate(elasticsearch_indices_request_cache_evictions{cluster=\\\"$cluster\\\", host=~\\\"$host\\\"}[5m])\",\n \"legend\": \"{{host}}\",\n \"refId\": \"A\"\n }\n ],\n \"type\": \"timeseries\",\n \"version\": \"2.0.0\"\n },\n {\n \"collapsed\": true,\n \"id\": \"d3161bf5-27a7-4552-a7d6-7b2b7d46b611\",\n \"layout\": {\n \"h\": 1,\n \"w\": 24,\n \"x\": 0,\n \"y\": 60,\n \"i\": \"d3161bf5-27a7-4552-a7d6-7b2b7d46b611\",\n \"isResizable\": false\n },\n \"name\": \"Segments\",\n \"type\": \"row\"\n },\n {\n \"custom\": {\n \"drawStyle\": \"lines\",\n \"fillOpacity\": 0.3,\n \"gradientMode\": \"opacity\",\n \"lineInterpolation\": \"smooth\",\n \"lineWidth\": 2,\n \"stack\": \"off\"\n },\n \"datasourceCate\": \"prometheus\",\n \"datasourceValue\": \"${datasource}\",\n \"id\": \"1537acaa-d5ce-48c5-b740-26fd543eb120\",\n \"layout\": {\n \"h\": 4,\n \"w\": 12,\n \"x\": 0,\n \"y\": 61,\n \"i\": \"1537acaa-d5ce-48c5-b740-26fd543eb120\",\n \"isResizable\": true\n },\n \"name\": \"Count of index segments\",\n \"options\": {\n \"legend\": {\n \"displayMode\": \"hidden\"\n },\n \"standardOptions\": {},\n \"thresholds\": {},\n \"tooltip\": {\n \"mode\": \"all\",\n \"sort\": \"desc\"\n }\n },\n \"targets\": [\n {\n \"expr\": \"elasticsearch_indices_segments_count{cluster=\\\"$cluster\\\", host=~\\\"$host\\\"}\",\n \"legend\": \"{{host}}\",\n \"refId\": \"A\"\n }\n ],\n \"type\": \"timeseries\",\n \"version\": \"2.0.0\"\n },\n {\n \"custom\": {\n \"drawStyle\": \"lines\",\n \"fillOpacity\": 0.3,\n \"gradientMode\": \"opacity\",\n \"lineInterpolation\": \"smooth\",\n \"lineWidth\": 2,\n \"stack\": \"off\"\n },\n \"datasourceCate\": \"prometheus\",\n \"datasourceValue\": \"${datasource}\",\n \"id\": \"a1c34fa4-4549-41a6-8d31-d25e7d860106\",\n \"layout\": {\n \"h\": 4,\n \"w\": 12,\n \"x\": 12,\n \"y\": 61,\n \"i\": \"9c8efed6-7ced-4805-87e0-3da3b18d2989\",\n \"isResizable\": true\n },\n \"name\": \"Current memory size of segments in bytes\",\n \"options\": {\n \"legend\": {\n \"displayMode\": \"hidden\"\n },\n \"standardOptions\": {},\n \"thresholds\": {},\n \"tooltip\": {\n \"mode\": \"all\",\n \"sort\": \"desc\"\n }\n },\n \"targets\": [\n {\n \"expr\": \"elasticsearch_indices_segments_memory_in_bytes{cluster=\\\"$cluster\\\", host=~\\\"$host\\\"}\",\n \"legend\": \"{{host}}\",\n \"refId\": \"A\"\n }\n ],\n \"type\": \"timeseries\",\n \"version\": \"2.0.0\"\n }\n ],\n \"var\": [\n {\n \"name\": \"datasource\",\n \"label\": \"Datasource\",\n \"type\": \"datasource\",\n \"hide\": false,\n \"definition\": \"prometheus\"\n },\n {\n \"name\": \"cluster\",\n \"label\": \"Cluster\",\n \"type\": \"query\",\n \"hide\": false,\n \"datasource\": {\n \"cate\": \"prometheus\",\n \"value\": \"${datasource}\"\n },\n \"definition\": \"label_values(elasticsearch_cluster_health_status, cluster)\"\n },\n {\n \"name\": \"host\",\n \"label\": \"Host\",\n \"type\": \"query\",\n \"hide\": false,\n \"datasource\": {\n \"cate\": \"prometheus\",\n \"value\": \"${datasource}\"\n },\n \"definition\": \"label_values(elasticsearch_process_cpu_seconds_total{cluster=\\\"$cluster\\\"}, host)\",\n \"multi\": true,\n \"allOption\": true,\n \"allValue\": \".*\"\n },\n {\n \"name\": \"name\",\n \"label\": \"Name\",\n \"type\": \"query\",\n \"hide\": false,\n \"datasource\": {\n \"cate\": \"prometheus\",\n \"value\": \"${datasource}\"\n },\n \"definition\": \"label_values(elasticsearch_jvm_gc_collection_seconds_count{cluster=\\\"$cluster\\\", host=~\\\"$host\\\"}, name)\",\n \"reg\": \"\",\n \"multi\": true,\n \"allOption\": true\n }\n ],\n \"version\": \"3.0.0\",\n \"graphTooltip\": \"default\",\n \"graphZoom\": \"default\"\n }\n}"
},
{
"path": "integrations/Elasticsearch/dashboards/elasticsearch_by_categraf_a.json",
"content": "{\n \"id\": 0,\n \"group_id\": 0,\n \"name\": \"ElasticSearch, group by service\",\n \"ident\": \"\",\n \"tags\": \"ElasticSearch Prometheus Categraf\",\n \"create_at\": 0,\n \"create_by\": \"\",\n \"update_at\": 0,\n \"update_by\": \"\",\n \"configs\": {\n \"panels\": [\n {\n \"custom\": {\n \"calc\": \"lastNotNull\",\n \"colSpan\": 1,\n \"colorMode\": \"background\",\n \"textMode\": \"valueAndName\",\n \"textSize\": {},\n \"valueField\": \"Value\"\n },\n \"datasourceCate\": \"prometheus\",\n \"datasourceValue\": \"${datasource}\",\n \"id\": \"f70f4198-dec2-40c0-97d9-6986c7001e73\",\n \"layout\": {\n \"h\": 3,\n \"i\": \"f70f4198-dec2-40c0-97d9-6986c7001e73\",\n \"isResizable\": true,\n \"w\": 4,\n \"x\": 0,\n \"y\": 0\n },\n \"name\": \"\",\n \"options\": {\n \"standardOptions\": {},\n \"thresholds\": {\n \"steps\": [\n {\n \"color\": \"#634CD9\",\n \"type\": \"base\",\n \"value\": null\n }\n ]\n },\n \"valueMappings\": [\n {\n \"match\": {\n \"special\": 0\n },\n \"result\": {\n \"text\": \"N/A\"\n },\n \"type\": \"special\"\n },\n {\n \"match\": {\n \"special\": 1\n },\n \"result\": {\n \"color\": \"#417505\",\n \"text\": \"Green\"\n },\n \"type\": \"special\"\n },\n {\n \"match\": {\n \"special\": 2\n },\n \"result\": {\n \"color\": \"#f5a623\",\n \"text\": \"Yellow\"\n },\n \"type\": \"special\"\n },\n {\n \"match\": {\n \"special\": 3\n },\n \"result\": {\n \"color\": \"#d0021b\",\n \"text\": \"Red\"\n },\n \"type\": \"special\"\n }\n ]\n },\n \"targets\": [\n {\n \"expr\": \"min(elasticsearch_cluster_health_status_code{service =\\\"$service\\\"})\",\n \"refId\": \"A\"\n }\n ],\n \"type\": \"stat\",\n \"version\": \"2.0.0\"\n },\n {\n \"custom\": {\n \"calc\": \"lastNotNull\",\n \"colSpan\": 1,\n \"colorMode\": \"value\",\n \"textMode\": \"valueAndName\",\n \"textSize\": {}\n },\n \"datasourceCate\": \"prometheus\",\n \"datasourceValue\": \"${datasource}\",\n \"id\": \"7dafe232-ee30-479b-a2f1-e1064572c154\",\n \"layout\": {\n \"h\": 3,\n \"i\": \"7dafe232-ee30-479b-a2f1-e1064572c154\",\n \"isResizable\": true,\n \"w\": 4,\n \"x\": 4,\n \"y\": 0\n },\n \"name\": \"Nodes\",\n \"options\": {\n \"standardOptions\": {}\n },\n \"targets\": [\n {\n \"expr\": \"min(elasticsearch_cluster_health_number_of_nodes{service =\\\"$service\\\"})\",\n \"refId\": \"A\"\n }\n ],\n \"type\": \"stat\",\n \"version\": \"2.0.0\"\n },\n {\n \"custom\": {\n \"calc\": \"lastNotNull\",\n \"colSpan\": 1,\n \"colorMode\": \"value\",\n \"textMode\": \"valueAndName\",\n \"textSize\": {}\n },\n \"datasourceCate\": \"prometheus\",\n \"datasourceValue\": \"${datasource}\",\n \"id\": \"447fb784-a7e4-41cf-820f-6086837590e6\",\n \"layout\": {\n \"h\": 3,\n \"i\": \"c6953ef5-3e29-44dc-bf9e-74905934e9df\",\n \"isResizable\": true,\n \"w\": 4,\n \"x\": 8,\n \"y\": 0\n },\n \"name\": \"Data Nodes\",\n \"options\": {\n \"standardOptions\": {}\n },\n \"targets\": [\n {\n \"expr\": \"min(elasticsearch_cluster_health_number_of_data_nodes{service =\\\"$service\\\"})\",\n \"refId\": \"A\"\n }\n ],\n \"type\": \"stat\",\n \"version\": \"2.0.0\"\n },\n {\n \"custom\": {\n \"calc\": \"lastNotNull\",\n \"colSpan\": 1,\n \"colorMode\": \"value\",\n \"textMode\": \"valueAndName\",\n \"textSize\": {}\n },\n \"datasourceCate\": \"prometheus\",\n \"datasourceValue\": \"${datasource}\",\n \"id\": \"f0375f72-4ca1-474f-81e9-ce6b64f22204\",\n \"layout\": {\n \"h\": 3,\n \"i\": \"e6cf29e7-bb5d-4c8f-8aa6-67a63fc325c7\",\n \"isResizable\": true,\n \"w\": 4,\n \"x\": 12,\n \"y\": 0\n },\n \"name\": \"CPU Util Percent\",\n \"options\": {\n \"standardOptions\": {\n \"util\": \"percent\"\n },\n \"valueMappings\": [\n {\n \"match\": {\n \"to\": 50\n },\n \"result\": {\n \"color\": \"#417505\"\n },\n \"type\": \"range\"\n },\n {\n \"match\": {\n \"from\": 50,\n \"to\": 80\n },\n \"result\": {\n \"color\": \"#f5a623\"\n },\n \"type\": \"range\"\n },\n {\n \"match\": {\n \"from\": 80\n },\n \"result\": {\n \"color\": \"#d0021b\"\n },\n \"type\": \"range\"\n }\n ]\n },\n \"targets\": [\n {\n \"expr\": \"max(elasticsearch_process_cpu_percent{service =\\\"$service\\\", node_host=~\\\"$node_host\\\"})\",\n \"refId\": \"A\"\n }\n ],\n \"type\": \"stat\",\n \"version\": \"2.0.0\"\n },\n {\n \"custom\": {\n \"calc\": \"lastNotNull\",\n \"colSpan\": 1,\n \"colorMode\": \"value\",\n \"textMode\": \"valueAndName\",\n \"textSize\": {}\n },\n \"datasourceCate\": \"prometheus\",\n \"datasourceValue\": \"${datasource}\",\n \"id\": \"288ee5f1-b484-43f5-86bf-5b81c01b3c2c\",\n \"layout\": {\n \"h\": 3,\n \"i\": \"34ae1975-6acb-48a7-adce-1d67b7c581ec\",\n \"isResizable\": true,\n \"w\": 4,\n \"x\": 16,\n \"y\": 0\n },\n \"name\": \"JVM Heap Util Percent\",\n \"options\": {\n \"standardOptions\": {\n \"util\": \"percent\"\n },\n \"valueMappings\": [\n {\n \"match\": {\n \"to\": 50\n },\n \"result\": {\n \"color\": \"#417505\"\n },\n \"type\": \"range\"\n },\n {\n \"match\": {\n \"from\": 50,\n \"to\": 80\n },\n \"result\": {\n \"color\": \"#f5a623\"\n },\n \"type\": \"range\"\n },\n {\n \"match\": {\n \"from\": 80\n },\n \"result\": {\n \"color\": \"#d0021b\"\n },\n \"type\": \"range\"\n }\n ]\n },\n \"targets\": [\n {\n \"expr\": \"max(elasticsearch_jvm_mem_heap_used_percent{service =\\\"$service\\\", node_host=~\\\"$node_host\\\"})\",\n \"refId\": \"A\"\n }\n ],\n \"type\": \"stat\",\n \"version\": \"2.0.0\"\n },\n {\n \"custom\": {\n \"calc\": \"lastNotNull\",\n \"colSpan\": 1,\n \"colorMode\": \"value\",\n \"textMode\": \"valueAndName\",\n \"textSize\": {}\n },\n \"datasourceCate\": \"prometheus\",\n \"datasourceValue\": \"${datasource}\",\n \"id\": \"4dd345c1-2bc1-474e-83b1-153be10a5b5b\",\n \"layout\": {\n \"h\": 3,\n \"i\": \"01c403f3-c3b0-4910-84df-a50d4968bcd6\",\n \"isResizable\": true,\n \"w\": 4,\n \"x\": 20,\n \"y\": 0\n },\n \"name\": \"Pending Tasks\",\n \"options\": {\n \"standardOptions\": {},\n \"valueMappings\": [\n {\n \"match\": {\n \"to\": 1\n },\n \"result\": {\n \"color\": \"#417505\"\n },\n \"type\": \"range\"\n },\n {\n \"match\": {\n \"from\": 1\n },\n \"result\": {\n \"color\": \"#d0021b\"\n },\n \"type\": \"range\"\n }\n ]\n },\n \"targets\": [\n {\n \"expr\": \"max(elasticsearch_cluster_health_number_of_pending_tasks{service =\\\"$service\\\"})\",\n \"refId\": \"A\"\n }\n ],\n \"type\": \"stat\",\n \"version\": \"2.0.0\"\n },\n {\n \"collapsed\": true,\n \"id\": \"b398d46e-7345-4cc9-90b4-918cbd1e8d1f\",\n \"layout\": {\n \"h\": 1,\n \"i\": \"b398d46e-7345-4cc9-90b4-918cbd1e8d1f\",\n \"isResizable\": false,\n \"w\": 24,\n \"x\": 0,\n \"y\": 3\n },\n \"name\": \"Breakers\",\n \"panels\": [],\n \"type\": \"row\"\n },\n {\n \"custom\": {\n \"drawStyle\": \"lines\",\n \"fillOpacity\": 0.04,\n \"lineInterpolation\": \"smooth\",\n \"stack\": \"off\"\n },\n \"datasourceCate\": \"prometheus\",\n \"datasourceValue\": \"${datasource}\",\n \"id\": \"15882e6f-0585-4035-bfb6-71cb9caaa0a8\",\n \"layout\": {\n \"h\": 4,\n \"i\": \"15882e6f-0585-4035-bfb6-71cb9caaa0a8\",\n \"isResizable\": true,\n \"w\": 12,\n \"x\": 0,\n \"y\": 4\n },\n \"name\": \"Tripped for breakers\",\n \"options\": {\n \"legend\": {\n \"displayMode\": \"hidden\"\n },\n \"standardOptions\": {},\n \"thresholds\": {},\n \"tooltip\": {\n \"mode\": \"all\",\n \"sort\": \"none\"\n }\n },\n \"targets\": [\n {\n \"expr\": \"sum({__name__=~\\\"elasticsearch_breakers_.+_tripped\\\", service =\\\"$service\\\", node_host=~\\\"$node_host\\\"}) by (node_host)\",\n \"legend\": \"\",\n \"refId\": \"A\"\n }\n ],\n \"type\": \"timeseries\",\n \"version\": \"2.0.0\"\n },\n {\n \"custom\": {\n \"drawStyle\": \"lines\",\n \"fillOpacity\": 0.04,\n \"gradientMode\": \"none\",\n \"lineInterpolation\": \"smooth\",\n \"lineWidth\": 1,\n \"scaleDistribution\": {\n \"type\": \"linear\"\n },\n \"spanNulls\": false,\n \"stack\": \"off\"\n },\n \"datasourceCate\": \"prometheus\",\n \"datasourceValue\": \"${datasource}\",\n \"id\": \"8adbc8e4-f630-4a25-98e3-ee03dec92011\",\n \"layout\": {\n \"h\": 4,\n \"i\": \"d05d16d0-022d-49f8-9b55-2388c4cbb2b1\",\n \"isResizable\": true,\n \"w\": 12,\n \"x\": 12,\n \"y\": 4\n },\n \"name\": \"Estimated size in bytes of breaker\",\n \"options\": {\n \"legend\": {\n \"displayMode\": \"hidden\"\n },\n \"standardOptions\": {},\n \"thresholds\": {\n \"steps\": [\n {\n \"color\": \"#634CD9\",\n \"type\": \"base\",\n \"value\": null\n }\n ]\n },\n \"tooltip\": {\n \"mode\": \"all\",\n \"sort\": \"desc\"\n }\n },\n \"targets\": [\n {\n \"expr\": \"{__name__=~\\\"elasticsearch_breakers_.+_size_in_bytes\\\", service =\\\"$service\\\", node_host=~\\\"$node_host\\\"}\",\n \"legend\": \"{{__name__}} {{node_host}}\",\n \"refId\": \"A\"\n }\n ],\n \"type\": \"timeseries\",\n \"version\": \"2.0.0\"\n },\n {\n \"collapsed\": true,\n \"id\": \"2aadd697-3bed-4f70-bc74-4bc801ef7d1d\",\n \"layout\": {\n \"h\": 1,\n \"i\": \"2aadd697-3bed-4f70-bc74-4bc801ef7d1d\",\n \"isResizable\": false,\n \"w\": 24,\n \"x\": 0,\n \"y\": 8\n },\n \"name\": \"Shards\",\n \"panels\": [],\n \"type\": \"row\"\n },\n {\n \"custom\": {\n \"calc\": \"lastNotNull\",\n \"colSpan\": 1,\n \"colorMode\": \"value\",\n \"textMode\": \"valueAndName\",\n \"textSize\": {}\n },\n \"datasourceCate\": \"prometheus\",\n \"datasourceValue\": \"${datasource}\",\n \"id\": \"7aec074e-1672-4dbb-8529-28292f9a4221\",\n \"layout\": {\n \"h\": 3,\n \"i\": \"7aec074e-1672-4dbb-8529-28292f9a4221\",\n \"isResizable\": true,\n \"w\": 4,\n \"x\": 0,\n \"y\": 9\n },\n \"name\": \"Active shards\",\n \"options\": {\n \"standardOptions\": {}\n },\n \"targets\": [\n {\n \"expr\": \"max(elasticsearch_cluster_health_active_shards{service =\\\"$service\\\"})\",\n \"refId\": \"A\"\n }\n ],\n \"type\": \"stat\",\n \"version\": \"2.0.0\"\n },\n {\n \"custom\": {\n \"calc\": \"lastNotNull\",\n \"colSpan\": 1,\n \"colorMode\": \"value\",\n \"textMode\": \"valueAndName\",\n \"textSize\": {}\n },\n \"datasourceCate\": \"prometheus\",\n \"datasourceValue\": \"${datasource}\",\n \"id\": \"f138daa7-b98f-4575-89e3-42363a8102c9\",\n \"layout\": {\n \"h\": 3,\n \"i\": \"fe82bb33-7b8d-4909-adda-64a4121f29fd\",\n \"isResizable\": true,\n \"w\": 4,\n \"x\": 4,\n \"y\": 9\n },\n \"name\": \"Active primary shards\",\n \"options\": {\n \"standardOptions\": {}\n },\n \"targets\": [\n {\n \"expr\": \"max(elasticsearch_cluster_health_active_primary_shards{service =\\\"$service\\\"})\",\n \"refId\": \"A\"\n }\n ],\n \"type\": \"stat\",\n \"version\": \"2.0.0\"\n },\n {\n \"custom\": {\n \"calc\": \"lastNotNull\",\n \"colSpan\": 1,\n \"colorMode\": \"value\",\n \"textMode\": \"valueAndName\",\n \"textSize\": {}\n },\n \"datasourceCate\": \"prometheus\",\n \"datasourceValue\": \"${datasource}\",\n \"id\": \"7412543a-dba5-4624-96ff-11e30b7e8ff4\",\n \"layout\": {\n \"h\": 3,\n \"i\": \"de2c46fd-dcfd-43a3-847b-9fd1320dfaa7\",\n \"isResizable\": true,\n \"w\": 4,\n \"x\": 8,\n \"y\": 9\n },\n \"name\": \"Initializing shards\",\n \"options\": {\n \"standardOptions\": {}\n },\n \"targets\": [\n {\n \"expr\": \"max(elasticsearch_cluster_health_initializing_shards{service =\\\"$service\\\"})\",\n \"refId\": \"A\"\n }\n ],\n \"type\": \"stat\",\n \"version\": \"2.0.0\"\n },\n {\n \"custom\": {\n \"calc\": \"lastNotNull\",\n \"colSpan\": 1,\n \"colorMode\": \"value\",\n \"textMode\": \"valueAndName\",\n \"textSize\": {}\n },\n \"datasourceCate\": \"prometheus\",\n \"datasourceValue\": \"${datasource}\",\n \"id\": \"2f26f24f-2a79-4552-b79d-60b41fa3aee6\",\n \"layout\": {\n \"h\": 3,\n \"i\": \"4403206d-a491-4564-9f61-db25a6beb356\",\n \"isResizable\": true,\n \"w\": 4,\n \"x\": 12,\n \"y\": 9\n },\n \"name\": \"Relocating shards\",\n \"options\": {\n \"standardOptions\": {}\n },\n \"targets\": [\n {\n \"expr\": \"max(elasticsearch_cluster_health_relocating_shards{service =\\\"$service\\\"})\",\n \"refId\": \"A\"\n }\n ],\n \"type\": \"stat\",\n \"version\": \"2.0.0\"\n },\n {\n \"custom\": {\n \"calc\": \"lastNotNull\",\n \"colSpan\": 1,\n \"colorMode\": \"value\",\n \"textMode\": \"valueAndName\",\n \"textSize\": {}\n },\n \"datasourceCate\": \"prometheus\",\n \"datasourceValue\": \"${datasource}\",\n \"id\": \"394a83cc-f4e1-467e-83fa-b77d2c2be907\",\n \"layout\": {\n \"h\": 3,\n \"i\": \"e24c847a-5704-4b7c-861e-75dd4e4b59d8\",\n \"isResizable\": true,\n \"w\": 4,\n \"x\": 16,\n \"y\": 9\n },\n \"name\": \"Delayed Unassigned shards\",\n \"options\": {\n \"standardOptions\": {}\n },\n \"targets\": [\n {\n \"expr\": \"max(elasticsearch_cluster_health_delayed_unassigned_shards{service =\\\"$service\\\"})\",\n \"refId\": \"A\"\n }\n ],\n \"type\": \"stat\",\n \"version\": \"2.0.0\"\n },\n {\n \"custom\": {\n \"calc\": \"lastNotNull\",\n \"colSpan\": 1,\n \"colorMode\": \"value\",\n \"textMode\": \"valueAndName\",\n \"textSize\": {}\n },\n \"datasourceCate\": \"prometheus\",\n \"datasourceValue\": \"${datasource}\",\n \"id\": \"720b9719-5c37-44d9-bce8-539308afa6ae\",\n \"layout\": {\n \"h\": 3,\n \"i\": \"d82314d5-028c-41fb-a79f-34699d56d17a\",\n \"isResizable\": true,\n \"w\": 4,\n \"x\": 20,\n \"y\": 9\n },\n \"name\": \"Unassigned shards\",\n \"options\": {\n \"standardOptions\": {}\n },\n \"targets\": [\n {\n \"expr\": \"max(elasticsearch_cluster_health_unassigned_shards{service =\\\"$service\\\"})\",\n \"refId\": \"A\"\n }\n ],\n \"type\": \"stat\",\n \"version\": \"2.0.0\"\n },\n {\n \"collapsed\": true,\n \"id\": \"a1bc2be7-723b-4fe4-b217-bfdd8248559e\",\n \"layout\": {\n \"h\": 1,\n \"i\": \"a1bc2be7-723b-4fe4-b217-bfdd8248559e\",\n \"isResizable\": false,\n \"w\": 24,\n \"x\": 0,\n \"y\": 12\n },\n \"name\": \"JVM\",\n \"panels\": [],\n \"type\": \"row\"\n },\n {\n \"custom\": {\n \"drawStyle\": \"lines\",\n \"fillOpacity\": 0.3,\n \"gradientMode\": \"opacity\",\n \"lineInterpolation\": \"smooth\",\n \"lineWidth\": 2,\n \"stack\": \"off\"\n },\n \"datasourceCate\": \"prometheus\",\n \"datasourceValue\": \"${datasource}\",\n \"id\": \"ee0c56e0-8f8e-4cbe-ac41-de2afad7b75a\",\n \"layout\": {\n \"h\": 4,\n \"i\": \"ee0c56e0-8f8e-4cbe-ac41-de2afad7b75a\",\n \"isResizable\": true,\n \"w\": 12,\n \"x\": 0,\n \"y\": 13\n },\n \"name\": \"GC counts / second\",\n \"options\": {\n \"legend\": {\n \"displayMode\": \"hidden\"\n },\n \"standardOptions\": {},\n \"thresholds\": {},\n \"tooltip\": {\n \"mode\": \"all\",\n \"sort\": \"none\"\n }\n },\n \"targets\": [\n {\n \"expr\": \"irate(elasticsearch_jvm_gc_collectors_old_collection_count{service =\\\"$service\\\", node_host=~\\\"$node_host\\\"}[5m])\",\n \"legend\": \"old gc {{node_host}}\",\n \"refId\": \"A\"\n },\n {\n \"expr\": \"irate(elasticsearch_jvm_gc_collectors_young_collection_count{service =\\\"$service\\\", node_host=~\\\"$node_host\\\"}[5m])\",\n \"legend\": \"young gc {{node_host}}\",\n \"refId\": \"B\"\n }\n ],\n \"type\": \"timeseries\",\n \"version\": \"2.0.0\"\n },\n {\n \"custom\": {\n \"drawStyle\": \"lines\",\n \"fillOpacity\": 0.3,\n \"gradientMode\": \"opacity\",\n \"lineInterpolation\": \"smooth\",\n \"lineWidth\": 2,\n \"stack\": \"off\"\n },\n \"datasourceCate\": \"prometheus\",\n \"datasourceValue\": \"${datasource}\",\n \"id\": \"5c361278-8a94-4b16-afdd-e6def804b9ff\",\n \"layout\": {\n \"h\": 4,\n \"i\": \"4f21ebfc-b51c-469b-b149-479966750920\",\n \"isResizable\": true,\n \"w\": 12,\n \"x\": 12,\n \"y\": 13\n },\n \"name\": \"GC time in millis\",\n \"options\": {\n \"legend\": {\n \"displayMode\": \"hidden\"\n },\n \"standardOptions\": {},\n \"thresholds\": {},\n \"tooltip\": {\n \"mode\": \"all\",\n \"sort\": \"none\"\n }\n },\n \"targets\": [\n {\n \"expr\": \"irate(elasticsearch_jvm_gc_collectors_old_collection_time_in_millis{service =\\\"$service\\\", node_host=~\\\"$node_host\\\"}[5m])\",\n \"legend\": \"old gc {{node_host}}\",\n \"refId\": \"A\"\n },\n {\n \"expr\": \"irate(elasticsearch_jvm_gc_collectors_young_collection_time_in_millis{service =\\\"$service\\\", node_host=~\\\"$node_host\\\"}[5m])\",\n \"legend\": \"young gc {{node_host}}\",\n \"refId\": \"B\"\n }\n ],\n \"type\": \"timeseries\",\n \"version\": \"2.0.0\"\n },\n {\n \"custom\": {\n \"drawStyle\": \"lines\",\n \"fillOpacity\": 0.3,\n \"gradientMode\": \"opacity\",\n \"lineInterpolation\": \"smooth\",\n \"lineWidth\": 2,\n \"scaleDistribution\": {\n \"type\": \"linear\"\n },\n \"spanNulls\": false,\n \"stack\": \"off\"\n },\n \"datasourceCate\": \"prometheus\",\n \"datasourceValue\": \"${datasource}\",\n \"id\": \"ff81d109-79e5-4909-8765-857a75cebf17\",\n \"layout\": {\n \"h\": 4,\n \"i\": \"5105f1dc-26cb-4818-a04d-90f2e5803da2\",\n \"isResizable\": true,\n \"w\": 6,\n \"x\": 0,\n \"y\": 17\n },\n \"name\": \"Yong Used(Bytes)\",\n \"options\": {\n \"legend\": {\n \"displayMode\": \"hidden\"\n },\n \"standardOptions\": {\n \"decimals\": 1,\n \"util\": \"bytesIEC\"\n },\n \"thresholds\": {\n \"steps\": [\n {\n \"color\": \"#634CD9\",\n \"type\": \"base\",\n \"value\": null\n }\n ]\n },\n \"tooltip\": {\n \"mode\": \"all\",\n \"sort\": \"desc\"\n }\n },\n \"targets\": [\n {\n \"expr\": \"{__name__=~\\\"elasticsearch_jvm_mem_pools_young_used_in_bytes\\\", service =\\\"$service\\\", node_host=~\\\"$node_host\\\"}\",\n \"legend\": \"{{__name__}} {{node_name}}\",\n \"refId\": \"A\"\n }\n ],\n \"type\": \"timeseries\",\n \"version\": \"2.0.0\"\n },\n {\n \"custom\": {\n \"drawStyle\": \"lines\",\n \"fillOpacity\": 0.3,\n \"gradientMode\": \"opacity\",\n \"lineInterpolation\": \"smooth\",\n \"lineWidth\": 2,\n \"scaleDistribution\": {\n \"type\": \"linear\"\n },\n \"spanNulls\": false,\n \"stack\": \"off\"\n },\n \"datasourceCate\": \"prometheus\",\n \"datasourceValue\": \"${datasource}\",\n \"id\": \"d7c76456-8f34-4e1b-843b-9d174bbdfcee\",\n \"layout\": {\n \"h\": 4,\n \"i\": \"86841663-2a17-4858-a9e1-13c296b3bb76\",\n \"isResizable\": true,\n \"w\": 6,\n \"x\": 6,\n \"y\": 17\n },\n \"name\": \"Old Used(Bytes)\",\n \"options\": {\n \"legend\": {\n \"displayMode\": \"hidden\"\n },\n \"standardOptions\": {\n \"decimals\": 1,\n \"util\": \"bytesIEC\"\n },\n \"thresholds\": {\n \"steps\": [\n {\n \"color\": \"#634CD9\",\n \"type\": \"base\",\n \"value\": null\n }\n ]\n },\n \"tooltip\": {\n \"mode\": \"all\",\n \"sort\": \"desc\"\n }\n },\n \"targets\": [\n {\n \"expr\": \"{__name__=~\\\"elasticsearch_jvm_mem_pools_old_used_in_bytes\\\", service =\\\"$service\\\", node_host=~\\\"$node_host\\\"}\",\n \"legend\": \"{{__name__}} {{node_name}}\",\n \"refId\": \"A\"\n }\n ],\n \"type\": \"timeseries\",\n \"version\": \"2.0.0\"\n },\n {\n \"custom\": {\n \"drawStyle\": \"lines\",\n \"fillOpacity\": 0.3,\n \"gradientMode\": \"opacity\",\n \"lineInterpolation\": \"smooth\",\n \"lineWidth\": 2,\n \"stack\": \"off\"\n },\n \"datasourceCate\": \"prometheus\",\n \"datasourceValue\": \"${datasource}\",\n \"id\": \"a0096936-3790-40a1-b2ad-d7805945b948\",\n \"layout\": {\n \"h\": 4,\n \"i\": \"14f655ac-9c1c-40fa-bfef-158cc8601ead\",\n \"isResizable\": true,\n \"w\": 12,\n \"x\": 12,\n \"y\": 17\n },\n \"name\": \"Committed Bytes\",\n \"options\": {\n \"legend\": {\n \"displayMode\": \"hidden\"\n },\n \"standardOptions\": {\n \"decimals\": 1,\n \"util\": \"bytesIEC\"\n },\n \"thresholds\": {},\n \"tooltip\": {\n \"mode\": \"all\",\n \"sort\": \"desc\"\n }\n },\n \"targets\": [\n {\n \"expr\": \"{__name__=~\\\"elasticsearch_jvm_mem_.+_committed_in_bytes\\\", service =\\\"$service\\\", node_host=~\\\"$node_host\\\"}\",\n \"legend\": \"{{__name__}} {{node_name}}\",\n \"refId\": \"A\"\n }\n ],\n \"type\": \"timeseries\",\n \"version\": \"2.0.0\"\n },\n {\n \"collapsed\": true,\n \"id\": \"e1d04a8c-81ee-4949-87de-3b70bc637584\",\n \"layout\": {\n \"h\": 1,\n \"i\": \"e1d04a8c-81ee-4949-87de-3b70bc637584\",\n \"isResizable\": false,\n \"w\": 24,\n \"x\": 0,\n \"y\": 21\n },\n \"name\": \"Translog\",\n \"panels\": [],\n \"type\": \"row\"\n },\n {\n \"custom\": {\n \"drawStyle\": \"lines\",\n \"fillOpacity\": 0.3,\n \"gradientMode\": \"opacity\",\n \"lineInterpolation\": \"smooth\",\n \"lineWidth\": 2,\n \"stack\": \"off\"\n },\n \"datasourceCate\": \"prometheus\",\n \"datasourceValue\": \"${datasource}\",\n \"id\": \"45aafb11-c694-4686-89ab-685068f91560\",\n \"layout\": {\n \"h\": 4,\n \"i\": \"45aafb11-c694-4686-89ab-685068f91560\",\n \"isResizable\": true,\n \"w\": 12,\n \"x\": 0,\n \"y\": 22\n },\n \"name\": \"Total translog operations\",\n \"options\": {\n \"legend\": {\n \"displayMode\": \"hidden\"\n },\n \"standardOptions\": {},\n \"thresholds\": {},\n \"tooltip\": {\n \"mode\": \"all\",\n \"sort\": \"none\"\n }\n },\n \"targets\": [\n {\n \"expr\": \"irate(elasticsearch_indices_translog_operations{service =\\\"$service\\\", node_host=~\\\"$node_host\\\"}[5m])\",\n \"legend\": \"{{node_host}}\",\n \"refId\": \"A\"\n }\n ],\n \"type\": \"timeseries\",\n \"version\": \"2.0.0\"\n },\n {\n \"custom\": {\n \"drawStyle\": \"lines\",\n \"fillOpacity\": 0.3,\n \"gradientMode\": \"opacity\",\n \"lineInterpolation\": \"smooth\",\n \"lineWidth\": 2,\n \"stack\": \"off\"\n },\n \"datasourceCate\": \"prometheus\",\n \"datasourceValue\": \"${datasource}\",\n \"id\": \"09ca6329-8eec-4a61-b19e-9bbeea2b9712\",\n \"layout\": {\n \"h\": 4,\n \"i\": \"56806f8a-525a-4ab4-a9d3-c83559ae4828\",\n \"isResizable\": true,\n \"w\": 12,\n \"x\": 12,\n \"y\": 22\n },\n \"name\": \"Total translog size in bytes\",\n \"options\": {\n \"legend\": {\n \"displayMode\": \"hidden\"\n },\n \"standardOptions\": {\n \"decimals\": 1,\n \"util\": \"bytesIEC\"\n },\n \"thresholds\": {},\n \"tooltip\": {\n \"mode\": \"all\",\n \"sort\": \"none\"\n }\n },\n \"targets\": [\n {\n \"expr\": \"irate(elasticsearch_indices_translog_size_in_bytes{service =\\\"$service\\\", node_host=~\\\"$node_host\\\"}[5m])\",\n \"legend\": \"{{node_host}}\",\n \"refId\": \"A\"\n }\n ],\n \"type\": \"timeseries\",\n \"version\": \"2.0.0\"\n },\n {\n \"collapsed\": true,\n \"id\": \"d9694c3f-9a14-4bde-9427-88531b0ea3a6\",\n \"layout\": {\n \"h\": 1,\n \"i\": \"d9694c3f-9a14-4bde-9427-88531b0ea3a6\",\n \"isResizable\": false,\n \"w\": 24,\n \"x\": 0,\n \"y\": 26\n },\n \"name\": \"Disk and Network\",\n \"panels\": [],\n \"type\": \"row\"\n },\n {\n \"custom\": {\n \"drawStyle\": \"lines\",\n \"fillOpacity\": 0.3,\n \"gradientMode\": \"opacity\",\n \"lineInterpolation\": \"smooth\",\n \"lineWidth\": 2,\n \"stack\": \"off\"\n },\n \"datasourceCate\": \"prometheus\",\n \"datasourceValue\": \"${datasource}\",\n \"id\": \"6c0d9b3c-dda5-4da9-825e-33f650dbb008\",\n \"layout\": {\n \"h\": 4,\n \"i\": \"6c0d9b3c-dda5-4da9-825e-33f650dbb008\",\n \"isResizable\": true,\n \"w\": 12,\n \"x\": 0,\n \"y\": 27\n },\n \"name\": \"Disk usage %\",\n \"options\": {\n \"legend\": {\n \"displayMode\": \"hidden\"\n },\n \"standardOptions\": {\n \"util\": \"percentUnit\"\n },\n \"thresholds\": {},\n \"tooltip\": {\n \"mode\": \"all\",\n \"sort\": \"desc\"\n }\n },\n \"targets\": [\n {\n \"expr\": \"1-(elasticsearch_fs_total_available_in_bytes{service =\\\"$service\\\",node_host=~\\\"$node_host\\\"}/elasticsearch_fs_total_total_in_bytes{service =\\\"$service\\\",node_host=~\\\"$node_host\\\"})\",\n \"legend\": \"{{node_host}}\",\n \"refId\": \"A\"\n }\n ],\n \"type\": \"timeseries\",\n \"version\": \"2.0.0\"\n },\n {\n \"custom\": {\n \"drawStyle\": \"lines\",\n \"fillOpacity\": 0.3,\n \"gradientMode\": \"opacity\",\n \"lineInterpolation\": \"smooth\",\n \"lineWidth\": 2,\n \"stack\": \"off\"\n },\n \"datasourceCate\": \"prometheus\",\n \"datasourceValue\": \"${datasource}\",\n \"id\": \"4f7ce5a7-2771-4cbf-a569-b1a90b070b93\",\n \"layout\": {\n \"h\": 4,\n \"i\": \"4f7ce5a7-2771-4cbf-a569-b1a90b070b93\",\n \"isResizable\": true,\n \"w\": 12,\n \"x\": 12,\n \"y\": 27\n },\n \"name\": \"Network usage\",\n \"options\": {\n \"legend\": {\n \"displayMode\": \"hidden\"\n },\n \"standardOptions\": {},\n \"thresholds\": {},\n \"tooltip\": {\n \"mode\": \"all\",\n \"sort\": \"desc\"\n }\n },\n \"targets\": [\n {\n \"expr\": \"irate(elasticsearch_transport_tx_size_in_bytes{service =\\\"$service\\\",node_host=~\\\"$node_host\\\"}[5m])\",\n \"legend\": \"{{node_host}}: sent\",\n \"refId\": \"A\"\n },\n {\n \"expr\": \"-irate(elasticsearch_transport_rx_size_in_bytes{service =\\\"$service\\\",node_host=~\\\"$node_host\\\"}[5m])\",\n \"legend\": \"{{node_host}}: received\",\n \"refId\": \"B\"\n }\n ],\n \"type\": \"timeseries\",\n \"version\": \"2.0.0\"\n },\n {\n \"collapsed\": true,\n \"id\": \"292b6c24-5471-4eeb-9d65-1a1e7a684fe3\",\n \"layout\": {\n \"h\": 1,\n \"i\": \"292b6c24-5471-4eeb-9d65-1a1e7a684fe3\",\n \"isResizable\": false,\n \"w\": 24,\n \"x\": 0,\n \"y\": 31\n },\n \"name\": \"Documents\",\n \"panels\": [],\n \"type\": \"row\"\n },\n {\n \"custom\": {\n \"drawStyle\": \"lines\",\n \"fillOpacity\": 0.3,\n \"gradientMode\": \"opacity\",\n \"lineInterpolation\": \"smooth\",\n \"lineWidth\": 2,\n \"stack\": \"off\"\n },\n \"datasourceCate\": \"prometheus\",\n \"datasourceValue\": \"${datasource}\",\n \"id\": \"e98839c4-e3f3-4e6e-be3a-c44b70e6072c\",\n \"layout\": {\n \"h\": 4,\n \"i\": \"e98839c4-e3f3-4e6e-be3a-c44b70e6072c\",\n \"isResizable\": true,\n \"w\": 12,\n \"x\": 0,\n \"y\": 32\n },\n \"name\": \"Documents count on node\",\n \"options\": {\n \"legend\": {\n \"displayMode\": \"hidden\"\n },\n \"standardOptions\": {},\n \"thresholds\": {},\n \"tooltip\": {\n \"mode\": \"all\",\n \"sort\": \"desc\"\n }\n },\n \"targets\": [\n {\n \"expr\": \"elasticsearch_indices_docs_count{service =\\\"$service\\\", node_host=~\\\"$node_host\\\"}\",\n \"legend\": \"{{node_host}}\",\n \"refId\": \"A\"\n }\n ],\n \"type\": \"timeseries\",\n \"version\": \"2.0.0\"\n },\n {\n \"custom\": {\n \"drawStyle\": \"lines\",\n \"fillOpacity\": 0.3,\n \"gradientMode\": \"opacity\",\n \"lineInterpolation\": \"smooth\",\n \"lineWidth\": 2,\n \"stack\": \"off\"\n },\n \"datasourceCate\": \"prometheus\",\n \"datasourceValue\": \"${datasource}\",\n \"id\": \"45c4e3d9-90f1-41bd-8169-1d8c0a921ba9\",\n \"layout\": {\n \"h\": 4,\n \"i\": \"45c4e3d9-90f1-41bd-8169-1d8c0a921ba9\",\n \"isResizable\": true,\n \"w\": 12,\n \"x\": 12,\n \"y\": 32\n },\n \"name\": \"Documents indexed rate\",\n \"options\": {\n \"legend\": {\n \"displayMode\": \"hidden\"\n },\n \"standardOptions\": {},\n \"thresholds\": {},\n \"tooltip\": {\n \"mode\": \"all\",\n \"sort\": \"desc\"\n }\n },\n \"targets\": [\n {\n \"expr\": \"irate(elasticsearch_indices_indexing_index_total{service =\\\"$service\\\",node_host=~\\\"$node_host\\\"}[5m])\",\n \"legend\": \"{{node_host}}\",\n \"refId\": \"A\"\n }\n ],\n \"type\": \"timeseries\",\n \"version\": \"2.0.0\"\n },\n {\n \"custom\": {\n \"drawStyle\": \"lines\",\n \"fillOpacity\": 0.3,\n \"gradientMode\": \"opacity\",\n \"lineInterpolation\": \"smooth\",\n \"lineWidth\": 2,\n \"stack\": \"off\"\n },\n \"datasourceCate\": \"prometheus\",\n \"datasourceValue\": \"${datasource}\",\n \"id\": \"3b2a922d-4423-4845-8cfc-95970f3300d6\",\n \"layout\": {\n \"h\": 4,\n \"i\": \"3b2a922d-4423-4845-8cfc-95970f3300d6\",\n \"isResizable\": true,\n \"w\": 12,\n \"x\": 0,\n \"y\": 36\n },\n \"name\": \"Documents deleted rate\",\n \"options\": {\n \"legend\": {\n \"displayMode\": \"hidden\"\n },\n \"standardOptions\": {},\n \"thresholds\": {},\n \"tooltip\": {\n \"mode\": \"all\",\n \"sort\": \"desc\"\n }\n },\n \"targets\": [\n {\n \"expr\": \"irate(elasticsearch_indices_docs_deleted{service =\\\"$service\\\",node_host=~\\\"$node_host\\\"}[5m])\",\n \"legend\": \"{{node_host}}\",\n \"refId\": \"A\"\n }\n ],\n \"type\": \"timeseries\",\n \"version\": \"2.0.0\"\n },\n {\n \"custom\": {\n \"drawStyle\": \"lines\",\n \"fillOpacity\": 0.3,\n \"gradientMode\": \"opacity\",\n \"lineInterpolation\": \"smooth\",\n \"lineWidth\": 2,\n \"stack\": \"off\"\n },\n \"datasourceCate\": \"prometheus\",\n \"datasourceValue\": \"${datasource}\",\n \"id\": \"764fbcf7-3056-41ef-b62a-51813a6c315f\",\n \"layout\": {\n \"h\": 4,\n \"i\": \"764fbcf7-3056-41ef-b62a-51813a6c315f\",\n \"isResizable\": true,\n \"w\": 6,\n \"x\": 12,\n \"y\": 36\n },\n \"name\": \"Documents merged rate\",\n \"options\": {\n \"legend\": {\n \"displayMode\": \"hidden\"\n },\n \"standardOptions\": {},\n \"thresholds\": {},\n \"tooltip\": {\n \"mode\": \"all\",\n \"sort\": \"desc\"\n }\n },\n \"targets\": [\n {\n \"expr\": \"rate(elasticsearch_indices_merges_total_docs{service =\\\"$service\\\",node_host=~\\\"$node_host\\\"}[5m])\",\n \"legend\": \"{{node_host}}\",\n \"refId\": \"A\"\n }\n ],\n \"type\": \"timeseries\",\n \"version\": \"2.0.0\"\n },\n {\n \"custom\": {\n \"drawStyle\": \"lines\",\n \"fillOpacity\": 0.3,\n \"gradientMode\": \"opacity\",\n \"lineInterpolation\": \"smooth\",\n \"lineWidth\": 2,\n \"stack\": \"off\"\n },\n \"datasourceCate\": \"prometheus\",\n \"datasourceValue\": \"${datasource}\",\n \"id\": \"7cc04ae4-946d-4837-9ea9-764a7cc2eecd\",\n \"layout\": {\n \"h\": 4,\n \"i\": \"97b5d900-e91e-4e0e-8184-f508a3433bc6\",\n \"isResizable\": true,\n \"w\": 6,\n \"x\": 18,\n \"y\": 36\n },\n \"name\": \"Documents merged bytes\",\n \"options\": {\n \"legend\": {\n \"displayMode\": \"hidden\"\n },\n \"standardOptions\": {\n \"decimals\": 1,\n \"util\": \"bytesIEC\"\n },\n \"thresholds\": {},\n \"tooltip\": {\n \"mode\": \"all\",\n \"sort\": \"desc\"\n }\n },\n \"targets\": [\n {\n \"expr\": \"irate(elasticsearch_indices_merges_total_size_in_bytes{service =\\\"$service\\\",node_host=~\\\"$node_host\\\"}[5m])\",\n \"legend\": \"{{node_host}}\",\n \"refId\": \"A\"\n }\n ],\n \"type\": \"timeseries\",\n \"version\": \"2.0.0\"\n },\n {\n \"collapsed\": true,\n \"id\": \"a0545cbd-6df5-4845-90e0-88a710f738ba\",\n \"layout\": {\n \"h\": 1,\n \"i\": \"a0545cbd-6df5-4845-90e0-88a710f738ba\",\n \"isResizable\": false,\n \"w\": 24,\n \"x\": 0,\n \"y\": 40\n },\n \"name\": \"Times\",\n \"panels\": [],\n \"type\": \"row\"\n },\n {\n \"custom\": {\n \"drawStyle\": \"lines\",\n \"fillOpacity\": 0.3,\n \"gradientMode\": \"opacity\",\n \"lineInterpolation\": \"smooth\",\n \"lineWidth\": 2,\n \"stack\": \"off\"\n },\n \"datasourceCate\": \"prometheus\",\n \"datasourceValue\": \"${datasource}\",\n \"id\": \"ad0445b0-8539-440d-bbf4-712450132a7a\",\n \"layout\": {\n \"h\": 4,\n \"i\": \"ad0445b0-8539-440d-bbf4-712450132a7a\",\n \"isResizable\": true,\n \"w\": 12,\n \"x\": 0,\n \"y\": 41\n },\n \"name\": \"Query time(Unit: ms)\",\n \"options\": {\n \"legend\": {\n \"displayMode\": \"hidden\"\n },\n \"standardOptions\": {},\n \"thresholds\": {},\n \"tooltip\": {\n \"mode\": \"all\",\n \"sort\": \"desc\"\n }\n },\n \"targets\": [\n {\n \"expr\": \"irate(elasticsearch_indices_search_query_time_in_millis{service =\\\"$service\\\",node_host=~\\\"$node_host\\\"}[5m])\",\n \"legend\": \"{{node_host}}\",\n \"refId\": \"A\"\n }\n ],\n \"type\": \"timeseries\",\n \"version\": \"2.0.0\"\n },\n {\n \"custom\": {\n \"drawStyle\": \"lines\",\n \"fillOpacity\": 0.3,\n \"gradientMode\": \"opacity\",\n \"lineInterpolation\": \"smooth\",\n \"lineWidth\": 2,\n \"stack\": \"off\"\n },\n \"datasourceCate\": \"prometheus\",\n \"datasourceValue\": \"${datasource}\",\n \"id\": \"c3cf6c57-c4ce-4bc2-a150-df32c4951144\",\n \"layout\": {\n \"h\": 4,\n \"i\": \"2af98dc1-f24e-4c7b-bd2c-723224facc5d\",\n \"isResizable\": true,\n \"w\": 12,\n \"x\": 12,\n \"y\": 41\n },\n \"name\": \"Indexing time(Unit: ms)\",\n \"options\": {\n \"legend\": {\n \"displayMode\": \"hidden\"\n },\n \"standardOptions\": {},\n \"thresholds\": {},\n \"tooltip\": {\n \"mode\": \"all\",\n \"sort\": \"desc\"\n }\n },\n \"targets\": [\n {\n \"expr\": \"irate(elasticsearch_indices_indexing_index_time_in_millis{service =\\\"$service\\\",node_host=~\\\"$node_host\\\"}[5m])\",\n \"legend\": \"{{node_host}}\",\n \"refId\": \"A\"\n }\n ],\n \"type\": \"timeseries\",\n \"version\": \"2.0.0\"\n },\n {\n \"custom\": {\n \"drawStyle\": \"lines\",\n \"fillOpacity\": 0.3,\n \"gradientMode\": \"opacity\",\n \"lineInterpolation\": \"smooth\",\n \"lineWidth\": 2,\n \"stack\": \"off\"\n },\n \"datasourceCate\": \"prometheus\",\n \"datasourceValue\": \"${datasource}\",\n \"id\": \"022db454-70ba-49f5-8c11-f89b76d145cb\",\n \"layout\": {\n \"h\": 4,\n \"i\": \"553c7da8-2d83-4ea0-a6ef-b064a5101633\",\n \"isResizable\": true,\n \"w\": 12,\n \"x\": 0,\n \"y\": 45\n },\n \"name\": \"Merging time(Unit: ms)\",\n \"options\": {\n \"legend\": {\n \"displayMode\": \"hidden\"\n },\n \"standardOptions\": {},\n \"thresholds\": {},\n \"tooltip\": {\n \"mode\": \"all\",\n \"sort\": \"desc\"\n }\n },\n \"targets\": [\n {\n \"expr\": \"irate(elasticsearch_indices_merges_total_time_in_millis{service =\\\"$service\\\",node_host=~\\\"$node_host\\\"}[5m])\",\n \"legend\": \"{{node_host}}\",\n \"refId\": \"A\"\n }\n ],\n \"type\": \"timeseries\",\n \"version\": \"2.0.0\"\n },\n {\n \"custom\": {\n \"drawStyle\": \"lines\",\n \"fillOpacity\": 0.3,\n \"gradientMode\": \"opacity\",\n \"lineInterpolation\": \"smooth\",\n \"lineWidth\": 2,\n \"stack\": \"off\"\n },\n \"datasourceCate\": \"prometheus\",\n \"datasourceValue\": \"${datasource}\",\n \"id\": \"f20bad4f-656c-428a-a1cf-aafb7d92137c\",\n \"layout\": {\n \"h\": 4,\n \"i\": \"51056e8d-6dc8-4c7f-91e9-9c24c056462d\",\n \"isResizable\": true,\n \"w\": 12,\n \"x\": 12,\n \"y\": 45\n },\n \"name\": \"Indexing throttle time(Unit: ms)\",\n \"options\": {\n \"legend\": {\n \"displayMode\": \"hidden\"\n },\n \"standardOptions\": {},\n \"thresholds\": {},\n \"tooltip\": {\n \"mode\": \"all\",\n \"sort\": \"desc\"\n }\n },\n \"targets\": [\n {\n \"expr\": \"irate(elasticsearch_indices_indexing_throttle_time_in_millis{service =\\\"$service\\\",node_host=~\\\"$node_host\\\"}[5m])\",\n \"legend\": \"{{node_host}}\",\n \"refId\": \"A\"\n }\n ],\n \"type\": \"timeseries\",\n \"version\": \"2.0.0\"\n },\n {\n \"collapsed\": true,\n \"id\": \"2c56fb7a-85a0-4396-a317-6754d761cff2\",\n \"layout\": {\n \"h\": 1,\n \"i\": \"2c56fb7a-85a0-4396-a317-6754d761cff2\",\n \"isResizable\": false,\n \"w\": 24,\n \"x\": 0,\n \"y\": 49\n },\n \"name\": \"Thread Pool\",\n \"panels\": [],\n \"type\": \"row\"\n },\n {\n \"custom\": {\n \"drawStyle\": \"lines\",\n \"fillOpacity\": 0.3,\n \"gradientMode\": \"opacity\",\n \"lineInterpolation\": \"smooth\",\n \"lineWidth\": 2,\n \"stack\": \"off\"\n },\n \"datasourceCate\": \"prometheus\",\n \"datasourceValue\": \"${datasource}\",\n \"id\": \"cefafeb9-fc8a-4c73-92b3-648cd6f08b11\",\n \"layout\": {\n \"h\": 4,\n \"i\": \"cefafeb9-fc8a-4c73-92b3-648cd6f08b11\",\n \"isResizable\": true,\n \"w\": 6,\n \"x\": 0,\n \"y\": 50\n },\n \"name\": \"Thread Pool operations rejected\",\n \"options\": {\n \"legend\": {\n \"displayMode\": \"hidden\"\n },\n \"standardOptions\": {},\n \"thresholds\": {},\n \"tooltip\": {\n \"mode\": \"all\",\n \"sort\": \"desc\"\n }\n },\n \"targets\": [\n {\n \"expr\": \"irate\\n(label_replace({__name__=~\\\"elasticsearch_thread_pool_(.*)_rejected\\\", service =\\\"$service\\\", node_host=~\\\"$node_host\\\"}, \\\"type\\\", \\\"$1\\\", \\\"__name__\\\", \\\"elasticsearch_thread_pool_(.*)_rejected\\\")[5m:])\",\n \"legend\": \"{{node_host}}: {{type}}\",\n \"refId\": \"A\"\n }\n ],\n \"type\": \"timeseries\",\n \"version\": \"2.0.0\"\n },\n {\n \"custom\": {\n \"drawStyle\": \"lines\",\n \"fillOpacity\": 0.3,\n \"gradientMode\": \"opacity\",\n \"lineInterpolation\": \"smooth\",\n \"lineWidth\": 2,\n \"stack\": \"off\"\n },\n \"datasourceCate\": \"prometheus\",\n \"datasourceValue\": \"${datasource}\",\n \"id\": \"0ab67903-16ea-4001-b784-ae04d8b815c0\",\n \"layout\": {\n \"h\": 4,\n \"i\": \"793e98e7-2729-4106-940c-ecccff1d4b89\",\n \"isResizable\": true,\n \"w\": 6,\n \"x\": 6,\n \"y\": 50\n },\n \"name\": \"Thread Pool threads active\",\n \"options\": {\n \"legend\": {\n \"displayMode\": \"hidden\"\n },\n \"standardOptions\": {},\n \"thresholds\": {},\n \"tooltip\": {\n \"mode\": \"all\",\n \"sort\": \"desc\"\n }\n },\n \"targets\": [\n {\n \"expr\": \"label_replace({__name__=~\\\"elasticsearch_thread_pool_(.*)_active\\\", service =\\\"$service\\\", node_host=~\\\"$node_host\\\"}, \\\"type\\\", \\\"$1\\\", \\\"__name__\\\", \\\"elasticsearch_thread_pool_(.*)_active\\\")\",\n \"legend\": \"{{node_host}}: {{type}}\",\n \"refId\": \"A\"\n }\n ],\n \"type\": \"timeseries\",\n \"version\": \"2.0.0\"\n },\n {\n \"custom\": {\n \"drawStyle\": \"lines\",\n \"fillOpacity\": 0.3,\n \"gradientMode\": \"opacity\",\n \"lineInterpolation\": \"smooth\",\n \"lineWidth\": 2,\n \"stack\": \"off\"\n },\n \"datasourceCate\": \"prometheus\",\n \"datasourceValue\": \"${datasource}\",\n \"id\": \"bb5dc07d-673b-4e2d-b44c-441acfa7c27b\",\n \"layout\": {\n \"h\": 4,\n \"i\": \"9a14c86a-86af-4464-ac82-41f621ce7166\",\n \"isResizable\": true,\n \"w\": 6,\n \"x\": 12,\n \"y\": 50\n },\n \"name\": \"Thread Pool threads queued\",\n \"options\": {\n \"legend\": {\n \"displayMode\": \"hidden\"\n },\n \"standardOptions\": {},\n \"thresholds\": {},\n \"tooltip\": {\n \"mode\": \"all\",\n \"sort\": \"desc\"\n }\n },\n \"targets\": [\n {\n \"expr\": \"label_replace({__name__=~\\\"elasticsearch_thread_pool_(.*)_queue\\\", service =\\\"$service\\\", node_host=~\\\"$node_host\\\"}, \\\"type\\\", \\\"$1\\\", \\\"__name__\\\", \\\"elasticsearch_thread_pool_(.*)_queue\\\")\",\n \"legend\": \"{{node_host}}: {{type}}\",\n \"refId\": \"A\"\n }\n ],\n \"type\": \"timeseries\",\n \"version\": \"2.0.0\"\n },\n {\n \"custom\": {\n \"drawStyle\": \"lines\",\n \"fillOpacity\": 0.3,\n \"gradientMode\": \"opacity\",\n \"lineInterpolation\": \"smooth\",\n \"lineWidth\": 2,\n \"stack\": \"off\"\n },\n \"datasourceCate\": \"prometheus\",\n \"datasourceValue\": \"${datasource}\",\n \"id\": \"4cac1498-c141-483f-97c6-e1177317a2ea\",\n \"layout\": {\n \"h\": 4,\n \"i\": \"d5f42ea7-bdb5-44da-9ba6-7c0f09ba7c71\",\n \"isResizable\": true,\n \"w\": 6,\n \"x\": 18,\n \"y\": 50\n },\n \"name\": \"Thread Pool operations completed\",\n \"options\": {\n \"legend\": {\n \"displayMode\": \"hidden\"\n },\n \"standardOptions\": {},\n \"thresholds\": {},\n \"tooltip\": {\n \"mode\": \"all\",\n \"sort\": \"desc\"\n }\n },\n \"targets\": [\n {\n \"expr\": \"irate\\n(label_replace({__name__=~\\\"elasticsearch_thread_pool_(.*)_completed\\\", service =\\\"$service\\\", node_host=~\\\"$node_host\\\"}, \\\"type\\\", \\\"$1\\\", \\\"__name__\\\", \\\"elasticsearch_thread_pool_(.*)_completed\\\")[5m:])\",\n \"legend\": \"{{node_host}}: {{type}}\",\n \"refId\": \"A\"\n }\n ],\n \"type\": \"timeseries\",\n \"version\": \"2.0.0\"\n },\n {\n \"collapsed\": true,\n \"id\": \"a5c3b529-c329-4a66-aab0-6caebba8be96\",\n \"layout\": {\n \"h\": 1,\n \"i\": \"a5c3b529-c329-4a66-aab0-6caebba8be96\",\n \"isResizable\": false,\n \"w\": 24,\n \"x\": 0,\n \"y\": 54\n },\n \"name\": \"Caches\",\n \"panels\": [],\n \"type\": \"row\"\n },\n {\n \"custom\": {\n \"drawStyle\": \"lines\",\n \"fillOpacity\": 0.3,\n \"gradientMode\": \"opacity\",\n \"lineInterpolation\": \"smooth\",\n \"lineWidth\": 2,\n \"stack\": \"off\"\n },\n \"datasourceCate\": \"prometheus\",\n \"datasourceValue\": \"${datasource}\",\n \"id\": \"5247f393-a934-4d9e-be0f-40b177d2be80\",\n \"layout\": {\n \"h\": 4,\n \"i\": \"5247f393-a934-4d9e-be0f-40b177d2be80\",\n \"isResizable\": true,\n \"w\": 4,\n \"x\": 0,\n \"y\": 55\n },\n \"name\": \"Field data memory size\",\n \"options\": {\n \"legend\": {\n \"displayMode\": \"hidden\"\n },\n \"standardOptions\": {\n \"decimals\": 0,\n \"util\": \"bytesIEC\"\n },\n \"thresholds\": {},\n \"tooltip\": {\n \"mode\": \"all\",\n \"sort\": \"desc\"\n }\n },\n \"targets\": [\n {\n \"expr\": \"elasticsearch_indices_fielddata_memory_size_in_bytes{service =\\\"$service\\\", node_host=~\\\"$node_host\\\"}\",\n \"legend\": \"{{node_host}}\",\n \"refId\": \"A\"\n }\n ],\n \"type\": \"timeseries\",\n \"version\": \"2.0.0\"\n },\n {\n \"custom\": {\n \"drawStyle\": \"lines\",\n \"fillOpacity\": 0.3,\n \"gradientMode\": \"opacity\",\n \"lineInterpolation\": \"smooth\",\n \"lineWidth\": 2,\n \"stack\": \"off\"\n },\n \"datasourceCate\": \"prometheus\",\n \"datasourceValue\": \"${datasource}\",\n \"id\": \"b87c56f7-4e50-4d15-8bcd-1218fee879d9\",\n \"layout\": {\n \"h\": 4,\n \"i\": \"c33fceb6-df37-483e-ba53-4ffa5f5e5456\",\n \"isResizable\": true,\n \"w\": 4,\n \"x\": 4,\n \"y\": 55\n },\n \"name\": \"Field data evictions\",\n \"options\": {\n \"legend\": {\n \"displayMode\": \"hidden\"\n },\n \"standardOptions\": {\n \"decimals\": 0,\n \"util\": \"bytesIEC\"\n },\n \"thresholds\": {},\n \"tooltip\": {\n \"mode\": \"all\",\n \"sort\": \"desc\"\n }\n },\n \"targets\": [\n {\n \"expr\": \"rate(elasticsearch_indices_fielddata_evictions{service =\\\"$service\\\", node_host=~\\\"$node_host\\\"}[5m])\",\n \"legend\": \"{{node_host}}\",\n \"refId\": \"A\"\n }\n ],\n \"type\": \"timeseries\",\n \"version\": \"2.0.0\"\n },\n {\n \"custom\": {\n \"drawStyle\": \"lines\",\n \"fillOpacity\": 0.3,\n \"gradientMode\": \"opacity\",\n \"lineInterpolation\": \"smooth\",\n \"lineWidth\": 2,\n \"stack\": \"off\"\n },\n \"datasourceCate\": \"prometheus\",\n \"datasourceValue\": \"${datasource}\",\n \"id\": \"ae2d0a7a-b6cd-4fd5-99d4-3c4289b8b5a8\",\n \"layout\": {\n \"h\": 4,\n \"i\": \"445484f4-32d3-4569-af8d-76790d0aa56b\",\n \"isResizable\": true,\n \"w\": 4,\n \"x\": 8,\n \"y\": 55\n },\n \"name\": \"Query cache size\",\n \"options\": {\n \"legend\": {\n \"displayMode\": \"hidden\"\n },\n \"standardOptions\": {\n \"decimals\": 0,\n \"util\": \"bytesIEC\"\n },\n \"thresholds\": {},\n \"tooltip\": {\n \"mode\": \"all\",\n \"sort\": \"desc\"\n }\n },\n \"targets\": [\n {\n \"expr\": \"elasticsearch_indices_query_cache_memory_size_in_bytes{service =\\\"$service\\\", node_host=~\\\"$node_host\\\"}\",\n \"legend\": \"{{node_host}}\",\n \"refId\": \"A\"\n }\n ],\n \"type\": \"timeseries\",\n \"version\": \"2.0.0\"\n },\n {\n \"custom\": {\n \"drawStyle\": \"lines\",\n \"fillOpacity\": 0.3,\n \"gradientMode\": \"opacity\",\n \"lineInterpolation\": \"smooth\",\n \"lineWidth\": 2,\n \"stack\": \"off\"\n },\n \"datasourceCate\": \"prometheus\",\n \"datasourceValue\": \"${datasource}\",\n \"id\": \"78e4badc-8d51-4aa6-81c5-d1c9183810a2\",\n \"layout\": {\n \"h\": 4,\n \"i\": \"ce9aa255-9d5b-44ed-9071-85e9d95675ec\",\n \"isResizable\": true,\n \"w\": 4,\n \"x\": 12,\n \"y\": 55\n },\n \"name\": \"Query cache evictions\",\n \"options\": {\n \"legend\": {\n \"displayMode\": \"hidden\"\n },\n \"standardOptions\": {\n \"decimals\": 0,\n \"util\": \"bytesIEC\"\n },\n \"thresholds\": {},\n \"tooltip\": {\n \"mode\": \"all\",\n \"sort\": \"desc\"\n }\n },\n \"targets\": [\n {\n \"expr\": \"rate(elasticsearch_indices_query_cache_evictions{service =\\\"$service\\\", node_host=~\\\"$node_host\\\"}[5m])\",\n \"legend\": \"{{node_host}}\",\n \"refId\": \"A\"\n }\n ],\n \"type\": \"timeseries\",\n \"version\": \"2.0.0\"\n },\n {\n \"custom\": {\n \"drawStyle\": \"lines\",\n \"fillOpacity\": 0.3,\n \"gradientMode\": \"opacity\",\n \"lineInterpolation\": \"smooth\",\n \"lineWidth\": 2,\n \"stack\": \"off\"\n },\n \"datasourceCate\": \"prometheus\",\n \"datasourceValue\": \"${datasource}\",\n \"id\": \"296b43f1-2f33-492a-bce8-6f0fde1e7b52\",\n \"layout\": {\n \"h\": 4,\n \"i\": \"b8b2604c-d84f-426f-b033-af9035a9e80d\",\n \"isResizable\": true,\n \"w\": 8,\n \"x\": 16,\n \"y\": 55\n },\n \"name\": \"Request cache evictions\",\n \"options\": {\n \"legend\": {\n \"displayMode\": \"hidden\"\n },\n \"standardOptions\": {\n \"decimals\": 0,\n \"util\": \"bytesIEC\"\n },\n \"thresholds\": {},\n \"tooltip\": {\n \"mode\": \"all\",\n \"sort\": \"desc\"\n }\n },\n \"targets\": [\n {\n \"expr\": \"rate(elasticsearch_indices_request_cache_evictions{service =\\\"$service\\\", node_host=~\\\"$node_host\\\"}[5m])\",\n \"legend\": \"{{node_host}}\",\n \"refId\": \"A\"\n }\n ],\n \"type\": \"timeseries\",\n \"version\": \"2.0.0\"\n },\n {\n \"collapsed\": true,\n \"id\": \"d3161bf5-27a7-4552-a7d6-7b2b7d46b611\",\n \"layout\": {\n \"h\": 1,\n \"i\": \"d3161bf5-27a7-4552-a7d6-7b2b7d46b611\",\n \"isResizable\": false,\n \"w\": 24,\n \"x\": 0,\n \"y\": 59\n },\n \"name\": \"Segments\",\n \"type\": \"row\"\n },\n {\n \"custom\": {\n \"drawStyle\": \"lines\",\n \"fillOpacity\": 0.3,\n \"gradientMode\": \"opacity\",\n \"lineInterpolation\": \"smooth\",\n \"lineWidth\": 2,\n \"stack\": \"off\"\n },\n \"datasourceCate\": \"prometheus\",\n \"datasourceValue\": \"${datasource}\",\n \"id\": \"1537acaa-d5ce-48c5-b740-26fd543eb120\",\n \"layout\": {\n \"h\": 4,\n \"i\": \"1537acaa-d5ce-48c5-b740-26fd543eb120\",\n \"isResizable\": true,\n \"w\": 12,\n \"x\": 0,\n \"y\": 60\n },\n \"name\": \"Count of index segments\",\n \"options\": {\n \"legend\": {\n \"displayMode\": \"hidden\"\n },\n \"standardOptions\": {},\n \"thresholds\": {},\n \"tooltip\": {\n \"mode\": \"all\",\n \"sort\": \"desc\"\n }\n },\n \"targets\": [\n {\n \"expr\": \"elasticsearch_indices_segments_count{service =\\\"$service\\\", node_host=~\\\"$node_host\\\"}\",\n \"legend\": \"{{node_host}}\",\n \"refId\": \"A\"\n }\n ],\n \"type\": \"timeseries\",\n \"version\": \"2.0.0\"\n },\n {\n \"custom\": {\n \"drawStyle\": \"lines\",\n \"fillOpacity\": 0.3,\n \"gradientMode\": \"opacity\",\n \"lineInterpolation\": \"smooth\",\n \"lineWidth\": 2,\n \"stack\": \"off\"\n },\n \"datasourceCate\": \"prometheus\",\n \"datasourceValue\": \"${datasource}\",\n \"id\": \"a1c34fa4-4549-41a6-8d31-d25e7d860106\",\n \"layout\": {\n \"h\": 4,\n \"i\": \"9c8efed6-7ced-4805-87e0-3da3b18d2989\",\n \"isResizable\": true,\n \"w\": 12,\n \"x\": 12,\n \"y\": 60\n },\n \"name\": \"Current memory size of segments in bytes\",\n \"options\": {\n \"legend\": {\n \"displayMode\": \"hidden\"\n },\n \"standardOptions\": {},\n \"thresholds\": {},\n \"tooltip\": {\n \"mode\": \"all\",\n \"sort\": \"desc\"\n }\n },\n \"targets\": [\n {\n \"expr\": \"elasticsearch_indices_segments_memory_in_bytes{service =\\\"$service\\\", node_host=~\\\"$node_host\\\"}\",\n \"legend\": \"{{node_host}}\",\n \"refId\": \"A\"\n }\n ],\n \"type\": \"timeseries\",\n \"version\": \"2.0.0\"\n }\n ],\n \"var\": [\n {\n \"definition\": \"prometheus\",\n \"name\": \"datasource\",\n \"type\": \"datasource\"\n },\n {\n \"datasource\": {\n \"cate\": \"prometheus\",\n \"value\": \"${datasource}\"\n },\n \"definition\": \"label_values(elasticsearch_up, service)\",\n \"name\": \"service\",\n \"type\": \"query\"\n },\n {\n \"allOption\": true,\n \"datasource\": {\n \"cate\": \"prometheus\",\n \"value\": \"${datasource}\"\n },\n \"definition\": \"label_values(elasticsearch_jvm_uptime_in_millis{service =\\\"$service\\\"}, node_host)\",\n \"multi\": true,\n \"name\": \"node_host\",\n \"type\": \"query\"\n }\n ],\n \"version\": \"3.0.0\"\n },\n \"public\": 0,\n \"public_cate\": 0,\n \"bgids\": null,\n \"built_in\": 0,\n \"hide\": 0,\n \"uuid\": 1717556327373675000\n}"
},
{
"path": "integrations/Elasticsearch/dashboards/elasticsearch_by_categraf_b.json",
"content": "{\n \"id\": 0,\n \"group_id\": 0,\n \"name\": \"ElasticSearch, group by cluster\",\n \"ident\": \"\",\n \"tags\": \"ElasticSearch Categraf\",\n \"create_at\": 0,\n \"create_by\": \"\",\n \"update_at\": 0,\n \"update_by\": \"\",\n \"configs\": {\n \"panels\": [\n {\n \"custom\": {\n \"calc\": \"lastNotNull\",\n \"colSpan\": 1,\n \"colorMode\": \"background\",\n \"textMode\": \"valueAndName\",\n \"textSize\": {},\n \"valueField\": \"Value\"\n },\n \"datasourceCate\": \"prometheus\",\n \"datasourceValue\": \"${datasource}\",\n \"id\": \"f70f4198-dec2-40c0-97d9-6986c7001e73\",\n \"layout\": {\n \"h\": 3,\n \"i\": \"f70f4198-dec2-40c0-97d9-6986c7001e73\",\n \"isResizable\": true,\n \"w\": 4,\n \"x\": 0,\n \"y\": 0\n },\n \"name\": \"\",\n \"options\": {\n \"standardOptions\": {},\n \"thresholds\": {\n \"steps\": [\n {\n \"color\": \"#634CD9\",\n \"type\": \"base\",\n \"value\": null\n }\n ]\n },\n \"valueMappings\": [\n {\n \"match\": {\n \"special\": 0\n },\n \"result\": {\n \"text\": \"N/A\"\n },\n \"type\": \"special\"\n },\n {\n \"match\": {\n \"special\": 1\n },\n \"result\": {\n \"color\": \"#417505\",\n \"text\": \"Green\"\n },\n \"type\": \"special\"\n },\n {\n \"match\": {\n \"special\": 2\n },\n \"result\": {\n \"color\": \"#f5a623\",\n \"text\": \"Yellow\"\n },\n \"type\": \"special\"\n },\n {\n \"match\": {\n \"special\": 3\n },\n \"result\": {\n \"color\": \"#d0021b\",\n \"text\": \"Red\"\n },\n \"type\": \"special\"\n }\n ]\n },\n \"targets\": [\n {\n \"expr\": \"min(elasticsearch_cluster_health_status_code{cluster=\\\"$cluster\\\"})\",\n \"refId\": \"A\"\n }\n ],\n \"type\": \"stat\",\n \"version\": \"2.0.0\"\n },\n {\n \"custom\": {\n \"calc\": \"lastNotNull\",\n \"colSpan\": 1,\n \"colorMode\": \"value\",\n \"textMode\": \"valueAndName\",\n \"textSize\": {}\n },\n \"datasourceCate\": \"prometheus\",\n \"datasourceValue\": \"${datasource}\",\n \"id\": \"7dafe232-ee30-479b-a2f1-e1064572c154\",\n \"layout\": {\n \"h\": 3,\n \"i\": \"7dafe232-ee30-479b-a2f1-e1064572c154\",\n \"isResizable\": true,\n \"w\": 4,\n \"x\": 4,\n \"y\": 0\n },\n \"name\": \"Nodes\",\n \"options\": {\n \"standardOptions\": {}\n },\n \"targets\": [\n {\n \"expr\": \"min(elasticsearch_cluster_health_number_of_nodes{cluster=\\\"$cluster\\\"})\",\n \"refId\": \"A\"\n }\n ],\n \"type\": \"stat\",\n \"version\": \"2.0.0\"\n },\n {\n \"custom\": {\n \"calc\": \"lastNotNull\",\n \"colSpan\": 1,\n \"colorMode\": \"value\",\n \"textMode\": \"valueAndName\",\n \"textSize\": {}\n },\n \"datasourceCate\": \"prometheus\",\n \"datasourceValue\": \"${datasource}\",\n \"id\": \"447fb784-a7e4-41cf-820f-6086837590e6\",\n \"layout\": {\n \"h\": 3,\n \"i\": \"c6953ef5-3e29-44dc-bf9e-74905934e9df\",\n \"isResizable\": true,\n \"w\": 4,\n \"x\": 8,\n \"y\": 0\n },\n \"name\": \"Data Nodes\",\n \"options\": {\n \"standardOptions\": {}\n },\n \"targets\": [\n {\n \"expr\": \"min(elasticsearch_cluster_health_number_of_data_nodes{cluster=\\\"$cluster\\\"})\",\n \"refId\": \"A\"\n }\n ],\n \"type\": \"stat\",\n \"version\": \"2.0.0\"\n },\n {\n \"custom\": {\n \"calc\": \"lastNotNull\",\n \"colSpan\": 1,\n \"colorMode\": \"value\",\n \"textMode\": \"valueAndName\",\n \"textSize\": {}\n },\n \"datasourceCate\": \"prometheus\",\n \"datasourceValue\": \"${datasource}\",\n \"id\": \"f0375f72-4ca1-474f-81e9-ce6b64f22204\",\n \"layout\": {\n \"h\": 3,\n \"i\": \"e6cf29e7-bb5d-4c8f-8aa6-67a63fc325c7\",\n \"isResizable\": true,\n \"w\": 4,\n \"x\": 12,\n \"y\": 0\n },\n \"name\": \"CPU Util Percent\",\n \"options\": {\n \"standardOptions\": {\n \"util\": \"percent\"\n },\n \"valueMappings\": [\n {\n \"match\": {\n \"to\": 50\n },\n \"result\": {\n \"color\": \"#417505\"\n },\n \"type\": \"range\"\n },\n {\n \"match\": {\n \"from\": 50,\n \"to\": 80\n },\n \"result\": {\n \"color\": \"#f5a623\"\n },\n \"type\": \"range\"\n },\n {\n \"match\": {\n \"from\": 80\n },\n \"result\": {\n \"color\": \"#d0021b\"\n },\n \"type\": \"range\"\n }\n ]\n },\n \"targets\": [\n {\n \"expr\": \"max(elasticsearch_process_cpu_percent{cluster=\\\"$cluster\\\", node_host=~\\\"$node_host\\\"})\",\n \"refId\": \"A\"\n }\n ],\n \"type\": \"stat\",\n \"version\": \"2.0.0\"\n },\n {\n \"custom\": {\n \"calc\": \"lastNotNull\",\n \"colSpan\": 1,\n \"colorMode\": \"value\",\n \"textMode\": \"valueAndName\",\n \"textSize\": {}\n },\n \"datasourceCate\": \"prometheus\",\n \"datasourceValue\": \"${datasource}\",\n \"id\": \"288ee5f1-b484-43f5-86bf-5b81c01b3c2c\",\n \"layout\": {\n \"h\": 3,\n \"i\": \"34ae1975-6acb-48a7-adce-1d67b7c581ec\",\n \"isResizable\": true,\n \"w\": 4,\n \"x\": 16,\n \"y\": 0\n },\n \"name\": \"JVM Heap Util Percent\",\n \"options\": {\n \"standardOptions\": {\n \"util\": \"percent\"\n },\n \"valueMappings\": [\n {\n \"match\": {\n \"to\": 50\n },\n \"result\": {\n \"color\": \"#417505\"\n },\n \"type\": \"range\"\n },\n {\n \"match\": {\n \"from\": 50,\n \"to\": 80\n },\n \"result\": {\n \"color\": \"#f5a623\"\n },\n \"type\": \"range\"\n },\n {\n \"match\": {\n \"from\": 80\n },\n \"result\": {\n \"color\": \"#d0021b\"\n },\n \"type\": \"range\"\n }\n ]\n },\n \"targets\": [\n {\n \"expr\": \"max(elasticsearch_jvm_mem_heap_used_percent{cluster=\\\"$cluster\\\", node_host=~\\\"$node_host\\\"})\",\n \"refId\": \"A\"\n }\n ],\n \"type\": \"stat\",\n \"version\": \"2.0.0\"\n },\n {\n \"custom\": {\n \"calc\": \"lastNotNull\",\n \"colSpan\": 1,\n \"colorMode\": \"value\",\n \"textMode\": \"valueAndName\",\n \"textSize\": {}\n },\n \"datasourceCate\": \"prometheus\",\n \"datasourceValue\": \"${datasource}\",\n \"id\": \"4dd345c1-2bc1-474e-83b1-153be10a5b5b\",\n \"layout\": {\n \"h\": 3,\n \"i\": \"01c403f3-c3b0-4910-84df-a50d4968bcd6\",\n \"isResizable\": true,\n \"w\": 4,\n \"x\": 20,\n \"y\": 0\n },\n \"name\": \"Pending Tasks\",\n \"options\": {\n \"standardOptions\": {},\n \"valueMappings\": [\n {\n \"match\": {\n \"to\": 1\n },\n \"result\": {\n \"color\": \"#417505\"\n },\n \"type\": \"range\"\n },\n {\n \"match\": {\n \"from\": 1\n },\n \"result\": {\n \"color\": \"#d0021b\"\n },\n \"type\": \"range\"\n }\n ]\n },\n \"targets\": [\n {\n \"expr\": \"max(elasticsearch_cluster_health_number_of_pending_tasks{cluster=\\\"$cluster\\\"})\",\n \"refId\": \"A\"\n }\n ],\n \"type\": \"stat\",\n \"version\": \"2.0.0\"\n },\n {\n \"collapsed\": true,\n \"id\": \"b398d46e-7345-4cc9-90b4-918cbd1e8d1f\",\n \"layout\": {\n \"h\": 1,\n \"i\": \"b398d46e-7345-4cc9-90b4-918cbd1e8d1f\",\n \"isResizable\": false,\n \"w\": 24,\n \"x\": 0,\n \"y\": 3\n },\n \"name\": \"Breakers\",\n \"panels\": [],\n \"type\": \"row\"\n },\n {\n \"custom\": {\n \"drawStyle\": \"lines\",\n \"fillOpacity\": 0.04,\n \"lineInterpolation\": \"smooth\",\n \"stack\": \"off\"\n },\n \"datasourceCate\": \"prometheus\",\n \"datasourceValue\": \"${datasource}\",\n \"id\": \"15882e6f-0585-4035-bfb6-71cb9caaa0a8\",\n \"layout\": {\n \"h\": 4,\n \"i\": \"15882e6f-0585-4035-bfb6-71cb9caaa0a8\",\n \"isResizable\": true,\n \"w\": 12,\n \"x\": 0,\n \"y\": 4\n },\n \"name\": \"Tripped for breakers\",\n \"options\": {\n \"legend\": {\n \"displayMode\": \"hidden\"\n },\n \"standardOptions\": {},\n \"thresholds\": {},\n \"tooltip\": {\n \"mode\": \"all\",\n \"sort\": \"none\"\n }\n },\n \"targets\": [\n {\n \"expr\": \"sum({__name__=~\\\"elasticsearch_breakers_.+_tripped\\\", cluster=\\\"$cluster\\\", node_host=~\\\"$node_host\\\"}) by (node_host)\",\n \"legend\": \"\",\n \"refId\": \"A\"\n }\n ],\n \"type\": \"timeseries\",\n \"version\": \"2.0.0\"\n },\n {\n \"custom\": {\n \"drawStyle\": \"lines\",\n \"fillOpacity\": 0.04,\n \"gradientMode\": \"none\",\n \"lineInterpolation\": \"smooth\",\n \"lineWidth\": 1,\n \"scaleDistribution\": {\n \"type\": \"linear\"\n },\n \"spanNulls\": false,\n \"stack\": \"off\"\n },\n \"datasourceCate\": \"prometheus\",\n \"datasourceValue\": \"${datasource}\",\n \"id\": \"8adbc8e4-f630-4a25-98e3-ee03dec92011\",\n \"layout\": {\n \"h\": 4,\n \"i\": \"d05d16d0-022d-49f8-9b55-2388c4cbb2b1\",\n \"isResizable\": true,\n \"w\": 12,\n \"x\": 12,\n \"y\": 4\n },\n \"name\": \"Estimated size in bytes of breaker\",\n \"options\": {\n \"legend\": {\n \"displayMode\": \"hidden\"\n },\n \"standardOptions\": {},\n \"thresholds\": {\n \"steps\": [\n {\n \"color\": \"#634CD9\",\n \"type\": \"base\",\n \"value\": null\n }\n ]\n },\n \"tooltip\": {\n \"mode\": \"all\",\n \"sort\": \"desc\"\n }\n },\n \"targets\": [\n {\n \"expr\": \"{__name__=~\\\"elasticsearch_breakers_.+_size_in_bytes\\\", cluster=\\\"$cluster\\\", node_host=~\\\"$node_host\\\"}\",\n \"legend\": \"{{__name__}} {{node_host}}\",\n \"refId\": \"A\"\n }\n ],\n \"type\": \"timeseries\",\n \"version\": \"2.0.0\"\n },\n {\n \"collapsed\": true,\n \"id\": \"2aadd697-3bed-4f70-bc74-4bc801ef7d1d\",\n \"layout\": {\n \"h\": 1,\n \"i\": \"2aadd697-3bed-4f70-bc74-4bc801ef7d1d\",\n \"isResizable\": false,\n \"w\": 24,\n \"x\": 0,\n \"y\": 8\n },\n \"name\": \"Shards\",\n \"panels\": [],\n \"type\": \"row\"\n },\n {\n \"custom\": {\n \"calc\": \"lastNotNull\",\n \"colSpan\": 1,\n \"colorMode\": \"value\",\n \"textMode\": \"valueAndName\",\n \"textSize\": {}\n },\n \"datasourceCate\": \"prometheus\",\n \"datasourceValue\": \"${datasource}\",\n \"id\": \"7aec074e-1672-4dbb-8529-28292f9a4221\",\n \"layout\": {\n \"h\": 3,\n \"i\": \"7aec074e-1672-4dbb-8529-28292f9a4221\",\n \"isResizable\": true,\n \"w\": 4,\n \"x\": 0,\n \"y\": 9\n },\n \"name\": \"Active shards\",\n \"options\": {\n \"standardOptions\": {}\n },\n \"targets\": [\n {\n \"expr\": \"max(elasticsearch_cluster_health_active_shards{cluster=\\\"$cluster\\\"})\",\n \"refId\": \"A\"\n }\n ],\n \"type\": \"stat\",\n \"version\": \"2.0.0\"\n },\n {\n \"custom\": {\n \"calc\": \"lastNotNull\",\n \"colSpan\": 1,\n \"colorMode\": \"value\",\n \"textMode\": \"valueAndName\",\n \"textSize\": {}\n },\n \"datasourceCate\": \"prometheus\",\n \"datasourceValue\": \"${datasource}\",\n \"id\": \"f138daa7-b98f-4575-89e3-42363a8102c9\",\n \"layout\": {\n \"h\": 3,\n \"i\": \"fe82bb33-7b8d-4909-adda-64a4121f29fd\",\n \"isResizable\": true,\n \"w\": 4,\n \"x\": 4,\n \"y\": 9\n },\n \"name\": \"Active primary shards\",\n \"options\": {\n \"standardOptions\": {}\n },\n \"targets\": [\n {\n \"expr\": \"max(elasticsearch_cluster_health_active_primary_shards{cluster=\\\"$cluster\\\"})\",\n \"refId\": \"A\"\n }\n ],\n \"type\": \"stat\",\n \"version\": \"2.0.0\"\n },\n {\n \"custom\": {\n \"calc\": \"lastNotNull\",\n \"colSpan\": 1,\n \"colorMode\": \"value\",\n \"textMode\": \"valueAndName\",\n \"textSize\": {}\n },\n \"datasourceCate\": \"prometheus\",\n \"datasourceValue\": \"${datasource}\",\n \"id\": \"7412543a-dba5-4624-96ff-11e30b7e8ff4\",\n \"layout\": {\n \"h\": 3,\n \"i\": \"de2c46fd-dcfd-43a3-847b-9fd1320dfaa7\",\n \"isResizable\": true,\n \"w\": 4,\n \"x\": 8,\n \"y\": 9\n },\n \"name\": \"Initializing shards\",\n \"options\": {\n \"standardOptions\": {}\n },\n \"targets\": [\n {\n \"expr\": \"max(elasticsearch_cluster_health_initializing_shards{cluster=\\\"$cluster\\\"})\",\n \"refId\": \"A\"\n }\n ],\n \"type\": \"stat\",\n \"version\": \"2.0.0\"\n },\n {\n \"custom\": {\n \"calc\": \"lastNotNull\",\n \"colSpan\": 1,\n \"colorMode\": \"value\",\n \"textMode\": \"valueAndName\",\n \"textSize\": {}\n },\n \"datasourceCate\": \"prometheus\",\n \"datasourceValue\": \"${datasource}\",\n \"id\": \"2f26f24f-2a79-4552-b79d-60b41fa3aee6\",\n \"layout\": {\n \"h\": 3,\n \"i\": \"4403206d-a491-4564-9f61-db25a6beb356\",\n \"isResizable\": true,\n \"w\": 4,\n \"x\": 12,\n \"y\": 9\n },\n \"name\": \"Relocating shards\",\n \"options\": {\n \"standardOptions\": {}\n },\n \"targets\": [\n {\n \"expr\": \"max(elasticsearch_cluster_health_relocating_shards{cluster=\\\"$cluster\\\"})\",\n \"refId\": \"A\"\n }\n ],\n \"type\": \"stat\",\n \"version\": \"2.0.0\"\n },\n {\n \"custom\": {\n \"calc\": \"lastNotNull\",\n \"colSpan\": 1,\n \"colorMode\": \"value\",\n \"textMode\": \"valueAndName\",\n \"textSize\": {}\n },\n \"datasourceCate\": \"prometheus\",\n \"datasourceValue\": \"${datasource}\",\n \"id\": \"394a83cc-f4e1-467e-83fa-b77d2c2be907\",\n \"layout\": {\n \"h\": 3,\n \"i\": \"e24c847a-5704-4b7c-861e-75dd4e4b59d8\",\n \"isResizable\": true,\n \"w\": 4,\n \"x\": 16,\n \"y\": 9\n },\n \"name\": \"Delayed Unassigned shards\",\n \"options\": {\n \"standardOptions\": {}\n },\n \"targets\": [\n {\n \"expr\": \"max(elasticsearch_cluster_health_delayed_unassigned_shards{cluster=\\\"$cluster\\\"})\",\n \"refId\": \"A\"\n }\n ],\n \"type\": \"stat\",\n \"version\": \"2.0.0\"\n },\n {\n \"custom\": {\n \"calc\": \"lastNotNull\",\n \"colSpan\": 1,\n \"colorMode\": \"value\",\n \"textMode\": \"valueAndName\",\n \"textSize\": {}\n },\n \"datasourceCate\": \"prometheus\",\n \"datasourceValue\": \"${datasource}\",\n \"id\": \"720b9719-5c37-44d9-bce8-539308afa6ae\",\n \"layout\": {\n \"h\": 3,\n \"i\": \"d82314d5-028c-41fb-a79f-34699d56d17a\",\n \"isResizable\": true,\n \"w\": 4,\n \"x\": 20,\n \"y\": 9\n },\n \"name\": \"Unassigned shards\",\n \"options\": {\n \"standardOptions\": {}\n },\n \"targets\": [\n {\n \"expr\": \"max(elasticsearch_cluster_health_unassigned_shards{cluster=\\\"$cluster\\\"})\",\n \"refId\": \"A\"\n }\n ],\n \"type\": \"stat\",\n \"version\": \"2.0.0\"\n },\n {\n \"collapsed\": true,\n \"id\": \"a1bc2be7-723b-4fe4-b217-bfdd8248559e\",\n \"layout\": {\n \"h\": 1,\n \"i\": \"a1bc2be7-723b-4fe4-b217-bfdd8248559e\",\n \"isResizable\": false,\n \"w\": 24,\n \"x\": 0,\n \"y\": 12\n },\n \"name\": \"JVM\",\n \"panels\": [],\n \"type\": \"row\"\n },\n {\n \"custom\": {\n \"drawStyle\": \"lines\",\n \"fillOpacity\": 0.3,\n \"gradientMode\": \"opacity\",\n \"lineInterpolation\": \"smooth\",\n \"lineWidth\": 2,\n \"stack\": \"off\"\n },\n \"datasourceCate\": \"prometheus\",\n \"datasourceValue\": \"${datasource}\",\n \"id\": \"ee0c56e0-8f8e-4cbe-ac41-de2afad7b75a\",\n \"layout\": {\n \"h\": 4,\n \"i\": \"ee0c56e0-8f8e-4cbe-ac41-de2afad7b75a\",\n \"isResizable\": true,\n \"w\": 12,\n \"x\": 0,\n \"y\": 13\n },\n \"name\": \"GC counts / second\",\n \"options\": {\n \"legend\": {\n \"displayMode\": \"hidden\"\n },\n \"standardOptions\": {},\n \"thresholds\": {},\n \"tooltip\": {\n \"mode\": \"all\",\n \"sort\": \"none\"\n }\n },\n \"targets\": [\n {\n \"expr\": \"irate(elasticsearch_jvm_gc_collectors_old_collection_count{cluster=\\\"$cluster\\\", node_host=~\\\"$node_host\\\"}[5m])\",\n \"legend\": \"old gc {{node_host}}\",\n \"refId\": \"A\"\n },\n {\n \"expr\": \"irate(elasticsearch_jvm_gc_collectors_young_collection_count{cluster=\\\"$cluster\\\", node_host=~\\\"$node_host\\\"}[5m])\",\n \"legend\": \"young gc {{node_host}}\",\n \"refId\": \"B\"\n }\n ],\n \"type\": \"timeseries\",\n \"version\": \"2.0.0\"\n },\n {\n \"custom\": {\n \"drawStyle\": \"lines\",\n \"fillOpacity\": 0.3,\n \"gradientMode\": \"opacity\",\n \"lineInterpolation\": \"smooth\",\n \"lineWidth\": 2,\n \"stack\": \"off\"\n },\n \"datasourceCate\": \"prometheus\",\n \"datasourceValue\": \"${datasource}\",\n \"id\": \"5c361278-8a94-4b16-afdd-e6def804b9ff\",\n \"layout\": {\n \"h\": 4,\n \"i\": \"4f21ebfc-b51c-469b-b149-479966750920\",\n \"isResizable\": true,\n \"w\": 12,\n \"x\": 12,\n \"y\": 13\n },\n \"name\": \"GC time in millis\",\n \"options\": {\n \"legend\": {\n \"displayMode\": \"hidden\"\n },\n \"standardOptions\": {},\n \"thresholds\": {},\n \"tooltip\": {\n \"mode\": \"all\",\n \"sort\": \"none\"\n }\n },\n \"targets\": [\n {\n \"expr\": \"irate(elasticsearch_jvm_gc_collectors_old_collection_time_in_millis{cluster=\\\"$cluster\\\", node_host=~\\\"$node_host\\\"}[5m])\",\n \"legend\": \"old gc {{node_host}}\",\n \"refId\": \"A\"\n },\n {\n \"expr\": \"irate(elasticsearch_jvm_gc_collectors_young_collection_time_in_millis{cluster=\\\"$cluster\\\", node_host=~\\\"$node_host\\\"}[5m])\",\n \"legend\": \"young gc {{node_host}}\",\n \"refId\": \"B\"\n }\n ],\n \"type\": \"timeseries\",\n \"version\": \"2.0.0\"\n },\n {\n \"custom\": {\n \"drawStyle\": \"lines\",\n \"fillOpacity\": 0.3,\n \"gradientMode\": \"opacity\",\n \"lineInterpolation\": \"smooth\",\n \"lineWidth\": 2,\n \"scaleDistribution\": {\n \"type\": \"linear\"\n },\n \"spanNulls\": false,\n \"stack\": \"off\"\n },\n \"datasourceCate\": \"prometheus\",\n \"datasourceValue\": \"${datasource}\",\n \"id\": \"ff81d109-79e5-4909-8765-857a75cebf17\",\n \"layout\": {\n \"h\": 4,\n \"i\": \"5105f1dc-26cb-4818-a04d-90f2e5803da2\",\n \"isResizable\": true,\n \"w\": 6,\n \"x\": 0,\n \"y\": 17\n },\n \"name\": \"Yong Used(Bytes)\",\n \"options\": {\n \"legend\": {\n \"displayMode\": \"hidden\"\n },\n \"standardOptions\": {\n \"decimals\": 1,\n \"util\": \"bytesIEC\"\n },\n \"thresholds\": {\n \"steps\": [\n {\n \"color\": \"#634CD9\",\n \"type\": \"base\",\n \"value\": null\n }\n ]\n },\n \"tooltip\": {\n \"mode\": \"all\",\n \"sort\": \"desc\"\n }\n },\n \"targets\": [\n {\n \"expr\": \"{__name__=~\\\"elasticsearch_jvm_mem_pools_young_used_in_bytes\\\", cluster=\\\"$cluster\\\", node_host=~\\\"$node_host\\\"}\",\n \"legend\": \"{{__name__}} {{node_name}}\",\n \"refId\": \"A\"\n }\n ],\n \"type\": \"timeseries\",\n \"version\": \"2.0.0\"\n },\n {\n \"custom\": {\n \"drawStyle\": \"lines\",\n \"fillOpacity\": 0.3,\n \"gradientMode\": \"opacity\",\n \"lineInterpolation\": \"smooth\",\n \"lineWidth\": 2,\n \"scaleDistribution\": {\n \"type\": \"linear\"\n },\n \"spanNulls\": false,\n \"stack\": \"off\"\n },\n \"datasourceCate\": \"prometheus\",\n \"datasourceValue\": \"${datasource}\",\n \"id\": \"d7c76456-8f34-4e1b-843b-9d174bbdfcee\",\n \"layout\": {\n \"h\": 4,\n \"i\": \"86841663-2a17-4858-a9e1-13c296b3bb76\",\n \"isResizable\": true,\n \"w\": 6,\n \"x\": 6,\n \"y\": 17\n },\n \"name\": \"Old Used(Bytes)\",\n \"options\": {\n \"legend\": {\n \"displayMode\": \"hidden\"\n },\n \"standardOptions\": {\n \"decimals\": 1,\n \"util\": \"bytesIEC\"\n },\n \"thresholds\": {\n \"steps\": [\n {\n \"color\": \"#634CD9\",\n \"type\": \"base\",\n \"value\": null\n }\n ]\n },\n \"tooltip\": {\n \"mode\": \"all\",\n \"sort\": \"desc\"\n }\n },\n \"targets\": [\n {\n \"expr\": \"{__name__=~\\\"elasticsearch_jvm_mem_pools_old_used_in_bytes\\\", cluster=\\\"$cluster\\\", node_host=~\\\"$node_host\\\"}\",\n \"legend\": \"{{__name__}} {{node_name}}\",\n \"refId\": \"A\"\n }\n ],\n \"type\": \"timeseries\",\n \"version\": \"2.0.0\"\n },\n {\n \"custom\": {\n \"drawStyle\": \"lines\",\n \"fillOpacity\": 0.3,\n \"gradientMode\": \"opacity\",\n \"lineInterpolation\": \"smooth\",\n \"lineWidth\": 2,\n \"stack\": \"off\"\n },\n \"datasourceCate\": \"prometheus\",\n \"datasourceValue\": \"${datasource}\",\n \"id\": \"a0096936-3790-40a1-b2ad-d7805945b948\",\n \"layout\": {\n \"h\": 4,\n \"i\": \"14f655ac-9c1c-40fa-bfef-158cc8601ead\",\n \"isResizable\": true,\n \"w\": 12,\n \"x\": 12,\n \"y\": 17\n },\n \"name\": \"Committed Bytes\",\n \"options\": {\n \"legend\": {\n \"displayMode\": \"hidden\"\n },\n \"standardOptions\": {\n \"decimals\": 1,\n \"util\": \"bytesIEC\"\n },\n \"thresholds\": {},\n \"tooltip\": {\n \"mode\": \"all\",\n \"sort\": \"desc\"\n }\n },\n \"targets\": [\n {\n \"expr\": \"{__name__=~\\\"elasticsearch_jvm_mem_.+_committed_in_bytes\\\", cluster=\\\"$cluster\\\", node_host=~\\\"$node_host\\\"}\",\n \"legend\": \"{{__name__}} {{node_name}}\",\n \"refId\": \"A\"\n }\n ],\n \"type\": \"timeseries\",\n \"version\": \"2.0.0\"\n },\n {\n \"collapsed\": true,\n \"id\": \"e1d04a8c-81ee-4949-87de-3b70bc637584\",\n \"layout\": {\n \"h\": 1,\n \"i\": \"e1d04a8c-81ee-4949-87de-3b70bc637584\",\n \"isResizable\": false,\n \"w\": 24,\n \"x\": 0,\n \"y\": 21\n },\n \"name\": \"Translog\",\n \"panels\": [],\n \"type\": \"row\"\n },\n {\n \"custom\": {\n \"drawStyle\": \"lines\",\n \"fillOpacity\": 0.3,\n \"gradientMode\": \"opacity\",\n \"lineInterpolation\": \"smooth\",\n \"lineWidth\": 2,\n \"stack\": \"off\"\n },\n \"datasourceCate\": \"prometheus\",\n \"datasourceValue\": \"${datasource}\",\n \"id\": \"45aafb11-c694-4686-89ab-685068f91560\",\n \"layout\": {\n \"h\": 4,\n \"i\": \"45aafb11-c694-4686-89ab-685068f91560\",\n \"isResizable\": true,\n \"w\": 12,\n \"x\": 0,\n \"y\": 22\n },\n \"name\": \"Total translog operations\",\n \"options\": {\n \"legend\": {\n \"displayMode\": \"hidden\"\n },\n \"standardOptions\": {},\n \"thresholds\": {},\n \"tooltip\": {\n \"mode\": \"all\",\n \"sort\": \"none\"\n }\n },\n \"targets\": [\n {\n \"expr\": \"irate(elasticsearch_indices_translog_operations{cluster=\\\"$cluster\\\", node_host=~\\\"$node_host\\\"}[5m])\",\n \"legend\": \"{{node_host}}\",\n \"refId\": \"A\"\n }\n ],\n \"type\": \"timeseries\",\n \"version\": \"2.0.0\"\n },\n {\n \"custom\": {\n \"drawStyle\": \"lines\",\n \"fillOpacity\": 0.3,\n \"gradientMode\": \"opacity\",\n \"lineInterpolation\": \"smooth\",\n \"lineWidth\": 2,\n \"stack\": \"off\"\n },\n \"datasourceCate\": \"prometheus\",\n \"datasourceValue\": \"${datasource}\",\n \"id\": \"09ca6329-8eec-4a61-b19e-9bbeea2b9712\",\n \"layout\": {\n \"h\": 4,\n \"i\": \"56806f8a-525a-4ab4-a9d3-c83559ae4828\",\n \"isResizable\": true,\n \"w\": 12,\n \"x\": 12,\n \"y\": 22\n },\n \"name\": \"Total translog size in bytes\",\n \"options\": {\n \"legend\": {\n \"displayMode\": \"hidden\"\n },\n \"standardOptions\": {\n \"decimals\": 1,\n \"util\": \"bytesIEC\"\n },\n \"thresholds\": {},\n \"tooltip\": {\n \"mode\": \"all\",\n \"sort\": \"none\"\n }\n },\n \"targets\": [\n {\n \"expr\": \"irate(elasticsearch_indices_translog_size_in_bytes{cluster=\\\"$cluster\\\", node_host=~\\\"$node_host\\\"}[5m])\",\n \"legend\": \"{{node_host}}\",\n \"refId\": \"A\"\n }\n ],\n \"type\": \"timeseries\",\n \"version\": \"2.0.0\"\n },\n {\n \"collapsed\": true,\n \"id\": \"d9694c3f-9a14-4bde-9427-88531b0ea3a6\",\n \"layout\": {\n \"h\": 1,\n \"i\": \"d9694c3f-9a14-4bde-9427-88531b0ea3a6\",\n \"isResizable\": false,\n \"w\": 24,\n \"x\": 0,\n \"y\": 26\n },\n \"name\": \"Disk and Network\",\n \"panels\": [],\n \"type\": \"row\"\n },\n {\n \"custom\": {\n \"drawStyle\": \"lines\",\n \"fillOpacity\": 0.3,\n \"gradientMode\": \"opacity\",\n \"lineInterpolation\": \"smooth\",\n \"lineWidth\": 2,\n \"stack\": \"off\"\n },\n \"datasourceCate\": \"prometheus\",\n \"datasourceValue\": \"${datasource}\",\n \"id\": \"6c0d9b3c-dda5-4da9-825e-33f650dbb008\",\n \"layout\": {\n \"h\": 4,\n \"i\": \"6c0d9b3c-dda5-4da9-825e-33f650dbb008\",\n \"isResizable\": true,\n \"w\": 12,\n \"x\": 0,\n \"y\": 27\n },\n \"name\": \"Disk usage %\",\n \"options\": {\n \"legend\": {\n \"displayMode\": \"hidden\"\n },\n \"standardOptions\": {\n \"util\": \"percentUnit\"\n },\n \"thresholds\": {},\n \"tooltip\": {\n \"mode\": \"all\",\n \"sort\": \"desc\"\n }\n },\n \"targets\": [\n {\n \"expr\": \"1-(elasticsearch_fs_total_available_in_bytes{cluster=\\\"$cluster\\\",node_host=~\\\"$node_host\\\"}/elasticsearch_fs_total_total_in_bytes{cluster=\\\"$cluster\\\",node_host=~\\\"$node_host\\\"})\",\n \"legend\": \"{{node_host}}\",\n \"refId\": \"A\"\n }\n ],\n \"type\": \"timeseries\",\n \"version\": \"2.0.0\"\n },\n {\n \"custom\": {\n \"drawStyle\": \"lines\",\n \"fillOpacity\": 0.3,\n \"gradientMode\": \"opacity\",\n \"lineInterpolation\": \"smooth\",\n \"lineWidth\": 2,\n \"stack\": \"off\"\n },\n \"datasourceCate\": \"prometheus\",\n \"datasourceValue\": \"${datasource}\",\n \"id\": \"4f7ce5a7-2771-4cbf-a569-b1a90b070b93\",\n \"layout\": {\n \"h\": 4,\n \"i\": \"4f7ce5a7-2771-4cbf-a569-b1a90b070b93\",\n \"isResizable\": true,\n \"w\": 12,\n \"x\": 12,\n \"y\": 27\n },\n \"name\": \"Network usage\",\n \"options\": {\n \"legend\": {\n \"displayMode\": \"hidden\"\n },\n \"standardOptions\": {},\n \"thresholds\": {},\n \"tooltip\": {\n \"mode\": \"all\",\n \"sort\": \"desc\"\n }\n },\n \"targets\": [\n {\n \"expr\": \"irate(elasticsearch_transport_tx_size_in_bytes{cluster=\\\"$cluster\\\",node_host=~\\\"$node_host\\\"}[5m])\",\n \"legend\": \"{{node_host}}: sent\",\n \"refId\": \"A\"\n },\n {\n \"expr\": \"-irate(elasticsearch_transport_rx_size_in_bytes{cluster=\\\"$cluster\\\",node_host=~\\\"$node_host\\\"}[5m])\",\n \"legend\": \"{{node_host}}: received\",\n \"refId\": \"B\"\n }\n ],\n \"type\": \"timeseries\",\n \"version\": \"2.0.0\"\n },\n {\n \"collapsed\": true,\n \"id\": \"292b6c24-5471-4eeb-9d65-1a1e7a684fe3\",\n \"layout\": {\n \"h\": 1,\n \"i\": \"292b6c24-5471-4eeb-9d65-1a1e7a684fe3\",\n \"isResizable\": false,\n \"w\": 24,\n \"x\": 0,\n \"y\": 31\n },\n \"name\": \"Documents\",\n \"panels\": [],\n \"type\": \"row\"\n },\n {\n \"custom\": {\n \"drawStyle\": \"lines\",\n \"fillOpacity\": 0.3,\n \"gradientMode\": \"opacity\",\n \"lineInterpolation\": \"smooth\",\n \"lineWidth\": 2,\n \"stack\": \"off\"\n },\n \"datasourceCate\": \"prometheus\",\n \"datasourceValue\": \"${datasource}\",\n \"id\": \"e98839c4-e3f3-4e6e-be3a-c44b70e6072c\",\n \"layout\": {\n \"h\": 4,\n \"i\": \"e98839c4-e3f3-4e6e-be3a-c44b70e6072c\",\n \"isResizable\": true,\n \"w\": 12,\n \"x\": 0,\n \"y\": 32\n },\n \"name\": \"Documents count on node\",\n \"options\": {\n \"legend\": {\n \"displayMode\": \"hidden\"\n },\n \"standardOptions\": {},\n \"thresholds\": {},\n \"tooltip\": {\n \"mode\": \"all\",\n \"sort\": \"desc\"\n }\n },\n \"targets\": [\n {\n \"expr\": \"elasticsearch_indices_docs_count{cluster=\\\"$cluster\\\", node_host=~\\\"$node_host\\\"}\",\n \"legend\": \"{{node_host}}\",\n \"refId\": \"A\"\n }\n ],\n \"type\": \"timeseries\",\n \"version\": \"2.0.0\"\n },\n {\n \"custom\": {\n \"drawStyle\": \"lines\",\n \"fillOpacity\": 0.3,\n \"gradientMode\": \"opacity\",\n \"lineInterpolation\": \"smooth\",\n \"lineWidth\": 2,\n \"stack\": \"off\"\n },\n \"datasourceCate\": \"prometheus\",\n \"datasourceValue\": \"${datasource}\",\n \"id\": \"45c4e3d9-90f1-41bd-8169-1d8c0a921ba9\",\n \"layout\": {\n \"h\": 4,\n \"i\": \"45c4e3d9-90f1-41bd-8169-1d8c0a921ba9\",\n \"isResizable\": true,\n \"w\": 12,\n \"x\": 12,\n \"y\": 32\n },\n \"name\": \"Documents indexed rate\",\n \"options\": {\n \"legend\": {\n \"displayMode\": \"hidden\"\n },\n \"standardOptions\": {},\n \"thresholds\": {},\n \"tooltip\": {\n \"mode\": \"all\",\n \"sort\": \"desc\"\n }\n },\n \"targets\": [\n {\n \"expr\": \"irate(elasticsearch_indices_indexing_index_total{cluster=\\\"$cluster\\\",node_host=~\\\"$node_host\\\"}[5m])\",\n \"legend\": \"{{node_host}}\",\n \"refId\": \"A\"\n }\n ],\n \"type\": \"timeseries\",\n \"version\": \"2.0.0\"\n },\n {\n \"custom\": {\n \"drawStyle\": \"lines\",\n \"fillOpacity\": 0.3,\n \"gradientMode\": \"opacity\",\n \"lineInterpolation\": \"smooth\",\n \"lineWidth\": 2,\n \"stack\": \"off\"\n },\n \"datasourceCate\": \"prometheus\",\n \"datasourceValue\": \"${datasource}\",\n \"id\": \"3b2a922d-4423-4845-8cfc-95970f3300d6\",\n \"layout\": {\n \"h\": 4,\n \"i\": \"3b2a922d-4423-4845-8cfc-95970f3300d6\",\n \"isResizable\": true,\n \"w\": 12,\n \"x\": 0,\n \"y\": 36\n },\n \"name\": \"Documents deleted rate\",\n \"options\": {\n \"legend\": {\n \"displayMode\": \"hidden\"\n },\n \"standardOptions\": {},\n \"thresholds\": {},\n \"tooltip\": {\n \"mode\": \"all\",\n \"sort\": \"desc\"\n }\n },\n \"targets\": [\n {\n \"expr\": \"irate(elasticsearch_indices_docs_deleted{cluster=\\\"$cluster\\\",node_host=~\\\"$node_host\\\"}[5m])\",\n \"legend\": \"{{node_host}}\",\n \"refId\": \"A\"\n }\n ],\n \"type\": \"timeseries\",\n \"version\": \"2.0.0\"\n },\n {\n \"custom\": {\n \"drawStyle\": \"lines\",\n \"fillOpacity\": 0.3,\n \"gradientMode\": \"opacity\",\n \"lineInterpolation\": \"smooth\",\n \"lineWidth\": 2,\n \"stack\": \"off\"\n },\n \"datasourceCate\": \"prometheus\",\n \"datasourceValue\": \"${datasource}\",\n \"id\": \"764fbcf7-3056-41ef-b62a-51813a6c315f\",\n \"layout\": {\n \"h\": 4,\n \"i\": \"764fbcf7-3056-41ef-b62a-51813a6c315f\",\n \"isResizable\": true,\n \"w\": 6,\n \"x\": 12,\n \"y\": 36\n },\n \"name\": \"Documents merged rate\",\n \"options\": {\n \"legend\": {\n \"displayMode\": \"hidden\"\n },\n \"standardOptions\": {},\n \"thresholds\": {},\n \"tooltip\": {\n \"mode\": \"all\",\n \"sort\": \"desc\"\n }\n },\n \"targets\": [\n {\n \"expr\": \"rate(elasticsearch_indices_merges_total_docs{cluster=\\\"$cluster\\\",node_host=~\\\"$node_host\\\"}[5m])\",\n \"legend\": \"{{node_host}}\",\n \"refId\": \"A\"\n }\n ],\n \"type\": \"timeseries\",\n \"version\": \"2.0.0\"\n },\n {\n \"custom\": {\n \"drawStyle\": \"lines\",\n \"fillOpacity\": 0.3,\n \"gradientMode\": \"opacity\",\n \"lineInterpolation\": \"smooth\",\n \"lineWidth\": 2,\n \"stack\": \"off\"\n },\n \"datasourceCate\": \"prometheus\",\n \"datasourceValue\": \"${datasource}\",\n \"id\": \"7cc04ae4-946d-4837-9ea9-764a7cc2eecd\",\n \"layout\": {\n \"h\": 4,\n \"i\": \"97b5d900-e91e-4e0e-8184-f508a3433bc6\",\n \"isResizable\": true,\n \"w\": 6,\n \"x\": 18,\n \"y\": 36\n },\n \"name\": \"Documents merged bytes\",\n \"options\": {\n \"legend\": {\n \"displayMode\": \"hidden\"\n },\n \"standardOptions\": {\n \"decimals\": 1,\n \"util\": \"bytesIEC\"\n },\n \"thresholds\": {},\n \"tooltip\": {\n \"mode\": \"all\",\n \"sort\": \"desc\"\n }\n },\n \"targets\": [\n {\n \"expr\": \"irate(elasticsearch_indices_merges_total_size_in_bytes{cluster=\\\"$cluster\\\",node_host=~\\\"$node_host\\\"}[5m])\",\n \"legend\": \"{{node_host}}\",\n \"refId\": \"A\"\n }\n ],\n \"type\": \"timeseries\",\n \"version\": \"2.0.0\"\n },\n {\n \"collapsed\": true,\n \"id\": \"a0545cbd-6df5-4845-90e0-88a710f738ba\",\n \"layout\": {\n \"h\": 1,\n \"i\": \"a0545cbd-6df5-4845-90e0-88a710f738ba\",\n \"isResizable\": false,\n \"w\": 24,\n \"x\": 0,\n \"y\": 40\n },\n \"name\": \"Times\",\n \"panels\": [],\n \"type\": \"row\"\n },\n {\n \"custom\": {\n \"drawStyle\": \"lines\",\n \"fillOpacity\": 0.3,\n \"gradientMode\": \"opacity\",\n \"lineInterpolation\": \"smooth\",\n \"lineWidth\": 2,\n \"stack\": \"off\"\n },\n \"datasourceCate\": \"prometheus\",\n \"datasourceValue\": \"${datasource}\",\n \"id\": \"ad0445b0-8539-440d-bbf4-712450132a7a\",\n \"layout\": {\n \"h\": 4,\n \"i\": \"ad0445b0-8539-440d-bbf4-712450132a7a\",\n \"isResizable\": true,\n \"w\": 12,\n \"x\": 0,\n \"y\": 41\n },\n \"name\": \"Query time(Unit: ms)\",\n \"options\": {\n \"legend\": {\n \"displayMode\": \"hidden\"\n },\n \"standardOptions\": {},\n \"thresholds\": {},\n \"tooltip\": {\n \"mode\": \"all\",\n \"sort\": \"desc\"\n }\n },\n \"targets\": [\n {\n \"expr\": \"irate(elasticsearch_indices_search_query_time_in_millis{cluster=\\\"$cluster\\\",node_host=~\\\"$node_host\\\"}[5m])\",\n \"legend\": \"{{node_host}}\",\n \"refId\": \"A\"\n }\n ],\n \"type\": \"timeseries\",\n \"version\": \"2.0.0\"\n },\n {\n \"custom\": {\n \"drawStyle\": \"lines\",\n \"fillOpacity\": 0.3,\n \"gradientMode\": \"opacity\",\n \"lineInterpolation\": \"smooth\",\n \"lineWidth\": 2,\n \"stack\": \"off\"\n },\n \"datasourceCate\": \"prometheus\",\n \"datasourceValue\": \"${datasource}\",\n \"id\": \"c3cf6c57-c4ce-4bc2-a150-df32c4951144\",\n \"layout\": {\n \"h\": 4,\n \"i\": \"2af98dc1-f24e-4c7b-bd2c-723224facc5d\",\n \"isResizable\": true,\n \"w\": 12,\n \"x\": 12,\n \"y\": 41\n },\n \"name\": \"Indexing time(Unit: ms)\",\n \"options\": {\n \"legend\": {\n \"displayMode\": \"hidden\"\n },\n \"standardOptions\": {},\n \"thresholds\": {},\n \"tooltip\": {\n \"mode\": \"all\",\n \"sort\": \"desc\"\n }\n },\n \"targets\": [\n {\n \"expr\": \"irate(elasticsearch_indices_indexing_index_time_in_millis{cluster=\\\"$cluster\\\",node_host=~\\\"$node_host\\\"}[5m])\",\n \"legend\": \"{{node_host}}\",\n \"refId\": \"A\"\n }\n ],\n \"type\": \"timeseries\",\n \"version\": \"2.0.0\"\n },\n {\n \"custom\": {\n \"drawStyle\": \"lines\",\n \"fillOpacity\": 0.3,\n \"gradientMode\": \"opacity\",\n \"lineInterpolation\": \"smooth\",\n \"lineWidth\": 2,\n \"stack\": \"off\"\n },\n \"datasourceCate\": \"prometheus\",\n \"datasourceValue\": \"${datasource}\",\n \"id\": \"022db454-70ba-49f5-8c11-f89b76d145cb\",\n \"layout\": {\n \"h\": 4,\n \"i\": \"553c7da8-2d83-4ea0-a6ef-b064a5101633\",\n \"isResizable\": true,\n \"w\": 12,\n \"x\": 0,\n \"y\": 45\n },\n \"name\": \"Merging time(Unit: ms)\",\n \"options\": {\n \"legend\": {\n \"displayMode\": \"hidden\"\n },\n \"standardOptions\": {},\n \"thresholds\": {},\n \"tooltip\": {\n \"mode\": \"all\",\n \"sort\": \"desc\"\n }\n },\n \"targets\": [\n {\n \"expr\": \"irate(elasticsearch_indices_merges_total_time_in_millis{cluster=\\\"$cluster\\\",node_host=~\\\"$node_host\\\"}[5m])\",\n \"legend\": \"{{node_host}}\",\n \"refId\": \"A\"\n }\n ],\n \"type\": \"timeseries\",\n \"version\": \"2.0.0\"\n },\n {\n \"custom\": {\n \"drawStyle\": \"lines\",\n \"fillOpacity\": 0.3,\n \"gradientMode\": \"opacity\",\n \"lineInterpolation\": \"smooth\",\n \"lineWidth\": 2,\n \"stack\": \"off\"\n },\n \"datasourceCate\": \"prometheus\",\n \"datasourceValue\": \"${datasource}\",\n \"id\": \"f20bad4f-656c-428a-a1cf-aafb7d92137c\",\n \"layout\": {\n \"h\": 4,\n \"i\": \"51056e8d-6dc8-4c7f-91e9-9c24c056462d\",\n \"isResizable\": true,\n \"w\": 12,\n \"x\": 12,\n \"y\": 45\n },\n \"name\": \"Indexing throttle time(Unit: ms)\",\n \"options\": {\n \"legend\": {\n \"displayMode\": \"hidden\"\n },\n \"standardOptions\": {},\n \"thresholds\": {},\n \"tooltip\": {\n \"mode\": \"all\",\n \"sort\": \"desc\"\n }\n },\n \"targets\": [\n {\n \"expr\": \"irate(elasticsearch_indices_indexing_throttle_time_in_millis{cluster=\\\"$cluster\\\",node_host=~\\\"$node_host\\\"}[5m])\",\n \"legend\": \"{{node_host}}\",\n \"refId\": \"A\"\n }\n ],\n \"type\": \"timeseries\",\n \"version\": \"2.0.0\"\n },\n {\n \"collapsed\": true,\n \"id\": \"2c56fb7a-85a0-4396-a317-6754d761cff2\",\n \"layout\": {\n \"h\": 1,\n \"i\": \"2c56fb7a-85a0-4396-a317-6754d761cff2\",\n \"isResizable\": false,\n \"w\": 24,\n \"x\": 0,\n \"y\": 49\n },\n \"name\": \"Thread Pool\",\n \"panels\": [],\n \"type\": \"row\"\n },\n {\n \"custom\": {\n \"drawStyle\": \"lines\",\n \"fillOpacity\": 0.3,\n \"gradientMode\": \"opacity\",\n \"lineInterpolation\": \"smooth\",\n \"lineWidth\": 2,\n \"stack\": \"off\"\n },\n \"datasourceCate\": \"prometheus\",\n \"datasourceValue\": \"${datasource}\",\n \"id\": \"cefafeb9-fc8a-4c73-92b3-648cd6f08b11\",\n \"layout\": {\n \"h\": 4,\n \"i\": \"cefafeb9-fc8a-4c73-92b3-648cd6f08b11\",\n \"isResizable\": true,\n \"w\": 6,\n \"x\": 0,\n \"y\": 50\n },\n \"name\": \"Thread Pool operations rejected\",\n \"options\": {\n \"legend\": {\n \"displayMode\": \"hidden\"\n },\n \"standardOptions\": {},\n \"thresholds\": {},\n \"tooltip\": {\n \"mode\": \"all\",\n \"sort\": \"desc\"\n }\n },\n \"targets\": [\n {\n \"expr\": \"irate\\n(label_replace({__name__=~\\\"elasticsearch_thread_pool_(.*)_rejected\\\", cluster=\\\"$cluster\\\", node_host=~\\\"$node_host\\\"}, \\\"type\\\", \\\"$1\\\", \\\"__name__\\\", \\\"elasticsearch_thread_pool_(.*)_rejected\\\")[5m:])\",\n \"legend\": \"{{node_host}}: {{type}}\",\n \"refId\": \"A\"\n }\n ],\n \"type\": \"timeseries\",\n \"version\": \"2.0.0\"\n },\n {\n \"custom\": {\n \"drawStyle\": \"lines\",\n \"fillOpacity\": 0.3,\n \"gradientMode\": \"opacity\",\n \"lineInterpolation\": \"smooth\",\n \"lineWidth\": 2,\n \"stack\": \"off\"\n },\n \"datasourceCate\": \"prometheus\",\n \"datasourceValue\": \"${datasource}\",\n \"id\": \"0ab67903-16ea-4001-b784-ae04d8b815c0\",\n \"layout\": {\n \"h\": 4,\n \"i\": \"793e98e7-2729-4106-940c-ecccff1d4b89\",\n \"isResizable\": true,\n \"w\": 6,\n \"x\": 6,\n \"y\": 50\n },\n \"name\": \"Thread Pool threads active\",\n \"options\": {\n \"legend\": {\n \"displayMode\": \"hidden\"\n },\n \"standardOptions\": {},\n \"thresholds\": {},\n \"tooltip\": {\n \"mode\": \"all\",\n \"sort\": \"desc\"\n }\n },\n \"targets\": [\n {\n \"expr\": \"label_replace({__name__=~\\\"elasticsearch_thread_pool_(.*)_active\\\", cluster=\\\"$cluster\\\", node_host=~\\\"$node_host\\\"}, \\\"type\\\", \\\"$1\\\", \\\"__name__\\\", \\\"elasticsearch_thread_pool_(.*)_active\\\")\",\n \"legend\": \"{{node_host}}: {{type}}\",\n \"refId\": \"A\"\n }\n ],\n \"type\": \"timeseries\",\n \"version\": \"2.0.0\"\n },\n {\n \"custom\": {\n \"drawStyle\": \"lines\",\n \"fillOpacity\": 0.3,\n \"gradientMode\": \"opacity\",\n \"lineInterpolation\": \"smooth\",\n \"lineWidth\": 2,\n \"stack\": \"off\"\n },\n \"datasourceCate\": \"prometheus\",\n \"datasourceValue\": \"${datasource}\",\n \"id\": \"bb5dc07d-673b-4e2d-b44c-441acfa7c27b\",\n \"layout\": {\n \"h\": 4,\n \"i\": \"9a14c86a-86af-4464-ac82-41f621ce7166\",\n \"isResizable\": true,\n \"w\": 6,\n \"x\": 12,\n \"y\": 50\n },\n \"name\": \"Thread Pool threads queued\",\n \"options\": {\n \"legend\": {\n \"displayMode\": \"hidden\"\n },\n \"standardOptions\": {},\n \"thresholds\": {},\n \"tooltip\": {\n \"mode\": \"all\",\n \"sort\": \"desc\"\n }\n },\n \"targets\": [\n {\n \"expr\": \"label_replace({__name__=~\\\"elasticsearch_thread_pool_(.*)_queue\\\", cluster=\\\"$cluster\\\", node_host=~\\\"$node_host\\\"}, \\\"type\\\", \\\"$1\\\", \\\"__name__\\\", \\\"elasticsearch_thread_pool_(.*)_queue\\\")\",\n \"legend\": \"{{node_host}}: {{type}}\",\n \"refId\": \"A\"\n }\n ],\n \"type\": \"timeseries\",\n \"version\": \"2.0.0\"\n },\n {\n \"custom\": {\n \"drawStyle\": \"lines\",\n \"fillOpacity\": 0.3,\n \"gradientMode\": \"opacity\",\n \"lineInterpolation\": \"smooth\",\n \"lineWidth\": 2,\n \"stack\": \"off\"\n },\n \"datasourceCate\": \"prometheus\",\n \"datasourceValue\": \"${datasource}\",\n \"id\": \"4cac1498-c141-483f-97c6-e1177317a2ea\",\n \"layout\": {\n \"h\": 4,\n \"i\": \"d5f42ea7-bdb5-44da-9ba6-7c0f09ba7c71\",\n \"isResizable\": true,\n \"w\": 6,\n \"x\": 18,\n \"y\": 50\n },\n \"name\": \"Thread Pool operations completed\",\n \"options\": {\n \"legend\": {\n \"displayMode\": \"hidden\"\n },\n \"standardOptions\": {},\n \"thresholds\": {},\n \"tooltip\": {\n \"mode\": \"all\",\n \"sort\": \"desc\"\n }\n },\n \"targets\": [\n {\n \"expr\": \"irate\\n(label_replace({__name__=~\\\"elasticsearch_thread_pool_(.*)_completed\\\", cluster=\\\"$cluster\\\", node_host=~\\\"$node_host\\\"}, \\\"type\\\", \\\"$1\\\", \\\"__name__\\\", \\\"elasticsearch_thread_pool_(.*)_completed\\\")[5m:])\",\n \"legend\": \"{{node_host}}: {{type}}\",\n \"refId\": \"A\"\n }\n ],\n \"type\": \"timeseries\",\n \"version\": \"2.0.0\"\n },\n {\n \"collapsed\": true,\n \"id\": \"a5c3b529-c329-4a66-aab0-6caebba8be96\",\n \"layout\": {\n \"h\": 1,\n \"i\": \"a5c3b529-c329-4a66-aab0-6caebba8be96\",\n \"isResizable\": false,\n \"w\": 24,\n \"x\": 0,\n \"y\": 54\n },\n \"name\": \"Caches\",\n \"panels\": [],\n \"type\": \"row\"\n },\n {\n \"custom\": {\n \"drawStyle\": \"lines\",\n \"fillOpacity\": 0.3,\n \"gradientMode\": \"opacity\",\n \"lineInterpolation\": \"smooth\",\n \"lineWidth\": 2,\n \"stack\": \"off\"\n },\n \"datasourceCate\": \"prometheus\",\n \"datasourceValue\": \"${datasource}\",\n \"id\": \"5247f393-a934-4d9e-be0f-40b177d2be80\",\n \"layout\": {\n \"h\": 4,\n \"i\": \"5247f393-a934-4d9e-be0f-40b177d2be80\",\n \"isResizable\": true,\n \"w\": 4,\n \"x\": 0,\n \"y\": 55\n },\n \"name\": \"Field data memory size\",\n \"options\": {\n \"legend\": {\n \"displayMode\": \"hidden\"\n },\n \"standardOptions\": {\n \"decimals\": 0,\n \"util\": \"bytesIEC\"\n },\n \"thresholds\": {},\n \"tooltip\": {\n \"mode\": \"all\",\n \"sort\": \"desc\"\n }\n },\n \"targets\": [\n {\n \"expr\": \"elasticsearch_indices_fielddata_memory_size_in_bytes{cluster=\\\"$cluster\\\", node_host=~\\\"$node_host\\\"}\",\n \"legend\": \"{{node_host}}\",\n \"refId\": \"A\"\n }\n ],\n \"type\": \"timeseries\",\n \"version\": \"2.0.0\"\n },\n {\n \"custom\": {\n \"drawStyle\": \"lines\",\n \"fillOpacity\": 0.3,\n \"gradientMode\": \"opacity\",\n \"lineInterpolation\": \"smooth\",\n \"lineWidth\": 2,\n \"stack\": \"off\"\n },\n \"datasourceCate\": \"prometheus\",\n \"datasourceValue\": \"${datasource}\",\n \"id\": \"b87c56f7-4e50-4d15-8bcd-1218fee879d9\",\n \"layout\": {\n \"h\": 4,\n \"i\": \"c33fceb6-df37-483e-ba53-4ffa5f5e5456\",\n \"isResizable\": true,\n \"w\": 4,\n \"x\": 4,\n \"y\": 55\n },\n \"name\": \"Field data evictions\",\n \"options\": {\n \"legend\": {\n \"displayMode\": \"hidden\"\n },\n \"standardOptions\": {\n \"decimals\": 0,\n \"util\": \"bytesIEC\"\n },\n \"thresholds\": {},\n \"tooltip\": {\n \"mode\": \"all\",\n \"sort\": \"desc\"\n }\n },\n \"targets\": [\n {\n \"expr\": \"rate(elasticsearch_indices_fielddata_evictions{cluster=\\\"$cluster\\\", node_host=~\\\"$node_host\\\"}[5m])\",\n \"legend\": \"{{node_host}}\",\n \"refId\": \"A\"\n }\n ],\n \"type\": \"timeseries\",\n \"version\": \"2.0.0\"\n },\n {\n \"custom\": {\n \"drawStyle\": \"lines\",\n \"fillOpacity\": 0.3,\n \"gradientMode\": \"opacity\",\n \"lineInterpolation\": \"smooth\",\n \"lineWidth\": 2,\n \"stack\": \"off\"\n },\n \"datasourceCate\": \"prometheus\",\n \"datasourceValue\": \"${datasource}\",\n \"id\": \"ae2d0a7a-b6cd-4fd5-99d4-3c4289b8b5a8\",\n \"layout\": {\n \"h\": 4,\n \"i\": \"445484f4-32d3-4569-af8d-76790d0aa56b\",\n \"isResizable\": true,\n \"w\": 4,\n \"x\": 8,\n \"y\": 55\n },\n \"name\": \"Query cache size\",\n \"options\": {\n \"legend\": {\n \"displayMode\": \"hidden\"\n },\n \"standardOptions\": {\n \"decimals\": 0,\n \"util\": \"bytesIEC\"\n },\n \"thresholds\": {},\n \"tooltip\": {\n \"mode\": \"all\",\n \"sort\": \"desc\"\n }\n },\n \"targets\": [\n {\n \"expr\": \"elasticsearch_indices_query_cache_memory_size_in_bytes{cluster=\\\"$cluster\\\", node_host=~\\\"$node_host\\\"}\",\n \"legend\": \"{{node_host}}\",\n \"refId\": \"A\"\n }\n ],\n \"type\": \"timeseries\",\n \"version\": \"2.0.0\"\n },\n {\n \"custom\": {\n \"drawStyle\": \"lines\",\n \"fillOpacity\": 0.3,\n \"gradientMode\": \"opacity\",\n \"lineInterpolation\": \"smooth\",\n \"lineWidth\": 2,\n \"stack\": \"off\"\n },\n \"datasourceCate\": \"prometheus\",\n \"datasourceValue\": \"${datasource}\",\n \"id\": \"78e4badc-8d51-4aa6-81c5-d1c9183810a2\",\n \"layout\": {\n \"h\": 4,\n \"i\": \"ce9aa255-9d5b-44ed-9071-85e9d95675ec\",\n \"isResizable\": true,\n \"w\": 4,\n \"x\": 12,\n \"y\": 55\n },\n \"name\": \"Query cache evictions\",\n \"options\": {\n \"legend\": {\n \"displayMode\": \"hidden\"\n },\n \"standardOptions\": {\n \"decimals\": 0,\n \"util\": \"bytesIEC\"\n },\n \"thresholds\": {},\n \"tooltip\": {\n \"mode\": \"all\",\n \"sort\": \"desc\"\n }\n },\n \"targets\": [\n {\n \"expr\": \"rate(elasticsearch_indices_query_cache_evictions{cluster=\\\"$cluster\\\", node_host=~\\\"$node_host\\\"}[5m])\",\n \"legend\": \"{{node_host}}\",\n \"refId\": \"A\"\n }\n ],\n \"type\": \"timeseries\",\n \"version\": \"2.0.0\"\n },\n {\n \"custom\": {\n \"drawStyle\": \"lines\",\n \"fillOpacity\": 0.3,\n \"gradientMode\": \"opacity\",\n \"lineInterpolation\": \"smooth\",\n \"lineWidth\": 2,\n \"stack\": \"off\"\n },\n \"datasourceCate\": \"prometheus\",\n \"datasourceValue\": \"${datasource}\",\n \"id\": \"296b43f1-2f33-492a-bce8-6f0fde1e7b52\",\n \"layout\": {\n \"h\": 4,\n \"i\": \"b8b2604c-d84f-426f-b033-af9035a9e80d\",\n \"isResizable\": true,\n \"w\": 8,\n \"x\": 16,\n \"y\": 55\n },\n \"name\": \"Request cache evictions\",\n \"options\": {\n \"legend\": {\n \"displayMode\": \"hidden\"\n },\n \"standardOptions\": {\n \"decimals\": 0,\n \"util\": \"bytesIEC\"\n },\n \"thresholds\": {},\n \"tooltip\": {\n \"mode\": \"all\",\n \"sort\": \"desc\"\n }\n },\n \"targets\": [\n {\n \"expr\": \"rate(elasticsearch_indices_request_cache_evictions{cluster=\\\"$cluster\\\", node_host=~\\\"$node_host\\\"}[5m])\",\n \"legend\": \"{{node_host}}\",\n \"refId\": \"A\"\n }\n ],\n \"type\": \"timeseries\",\n \"version\": \"2.0.0\"\n },\n {\n \"collapsed\": true,\n \"id\": \"d3161bf5-27a7-4552-a7d6-7b2b7d46b611\",\n \"layout\": {\n \"h\": 1,\n \"i\": \"d3161bf5-27a7-4552-a7d6-7b2b7d46b611\",\n \"isResizable\": false,\n \"w\": 24,\n \"x\": 0,\n \"y\": 59\n },\n \"name\": \"Segments\",\n \"type\": \"row\"\n },\n {\n \"custom\": {\n \"drawStyle\": \"lines\",\n \"fillOpacity\": 0.3,\n \"gradientMode\": \"opacity\",\n \"lineInterpolation\": \"smooth\",\n \"lineWidth\": 2,\n \"stack\": \"off\"\n },\n \"datasourceCate\": \"prometheus\",\n \"datasourceValue\": \"${datasource}\",\n \"id\": \"1537acaa-d5ce-48c5-b740-26fd543eb120\",\n \"layout\": {\n \"h\": 4,\n \"i\": \"1537acaa-d5ce-48c5-b740-26fd543eb120\",\n \"isResizable\": true,\n \"w\": 12,\n \"x\": 0,\n \"y\": 60\n },\n \"name\": \"Count of index segments\",\n \"options\": {\n \"legend\": {\n \"displayMode\": \"hidden\"\n },\n \"standardOptions\": {},\n \"thresholds\": {},\n \"tooltip\": {\n \"mode\": \"all\",\n \"sort\": \"desc\"\n }\n },\n \"targets\": [\n {\n \"expr\": \"elasticsearch_indices_segments_count{cluster=\\\"$cluster\\\", node_host=~\\\"$node_host\\\"}\",\n \"legend\": \"{{node_host}}\",\n \"refId\": \"A\"\n }\n ],\n \"type\": \"timeseries\",\n \"version\": \"2.0.0\"\n },\n {\n \"custom\": {\n \"drawStyle\": \"lines\",\n \"fillOpacity\": 0.3,\n \"gradientMode\": \"opacity\",\n \"lineInterpolation\": \"smooth\",\n \"lineWidth\": 2,\n \"stack\": \"off\"\n },\n \"datasourceCate\": \"prometheus\",\n \"datasourceValue\": \"${datasource}\",\n \"id\": \"a1c34fa4-4549-41a6-8d31-d25e7d860106\",\n \"layout\": {\n \"h\": 4,\n \"i\": \"9c8efed6-7ced-4805-87e0-3da3b18d2989\",\n \"isResizable\": true,\n \"w\": 12,\n \"x\": 12,\n \"y\": 60\n },\n \"name\": \"Current memory size of segments in bytes\",\n \"options\": {\n \"legend\": {\n \"displayMode\": \"hidden\"\n },\n \"standardOptions\": {},\n \"thresholds\": {},\n \"tooltip\": {\n \"mode\": \"all\",\n \"sort\": \"desc\"\n }\n },\n \"targets\": [\n {\n \"expr\": \"elasticsearch_indices_segments_memory_in_bytes{cluster=\\\"$cluster\\\", node_host=~\\\"$node_host\\\"}\",\n \"legend\": \"{{node_host}}\",\n \"refId\": \"A\"\n }\n ],\n \"type\": \"timeseries\",\n \"version\": \"2.0.0\"\n }\n ],\n \"var\": [\n {\n \"definition\": \"prometheus\",\n \"name\": \"datasource\",\n \"type\": \"datasource\"\n },\n {\n \"datasource\": {\n \"cate\": \"prometheus\",\n \"value\": \"${datasource}\"\n },\n \"definition\": \"label_values(elasticsearch_up, cluster)\",\n \"name\": \"cluster\",\n \"type\": \"query\"\n },\n {\n \"allOption\": true,\n \"datasource\": {\n \"cate\": \"prometheus\",\n \"value\": \"${datasource}\"\n },\n \"definition\": \"label_values(elasticsearch_jvm_uptime_in_millis{cluster=\\\"$cluster\\\"}, node_host)\",\n \"multi\": true,\n \"name\": \"node_host\",\n \"type\": \"query\"\n }\n ],\n \"version\": \"3.0.0\"\n },\n \"public\": 0,\n \"public_cate\": 0,\n \"bgids\": null,\n \"built_in\": 0,\n \"hide\": 0,\n \"uuid\": 1717556327376754000\n}"
},
{
"path": "integrations/Elasticsearch/dashboards/elasticsearch_by_exporter.json",
"content": "{\n \"id\": 0,\n \"group_id\": 0,\n \"name\": \"ElasticSearch By Exporter\",\n \"ident\": \"\",\n \"tags\": \"Prometheus ElasticSearch ES\",\n \"create_at\": 0,\n \"create_by\": \"\",\n \"update_at\": 0,\n \"update_by\": \"\",\n \"configs\": {\n \"panels\": [\n {\n \"collapsed\": true,\n \"id\": \"7d06624d-28be-4586-a804-11ca2f036964\",\n \"layout\": {\n \"h\": 1,\n \"i\": \"7d06624d-28be-4586-a804-11ca2f036964\",\n \"w\": 24,\n \"x\": 0,\n \"y\": 0\n },\n \"name\": \"KPI\",\n \"type\": \"row\"\n },\n {\n \"custom\": {\n \"calc\": \"lastNotNull\",\n \"colSpan\": 1,\n \"colorMode\": \"value\",\n \"textMode\": \"value\",\n \"textSize\": {}\n },\n \"datasourceCate\": \"prometheus\",\n \"datasourceValue\": \"${prom}\",\n \"description\": \"集群数据节点数量\",\n \"id\": \"ae1ebc12-8639-4812-b5ae-9391a0ec4dbc\",\n \"layout\": {\n \"h\": 3,\n \"i\": \"ae1ebc12-8639-4812-b5ae-9391a0ec4dbc\",\n \"w\": 3,\n \"x\": 6,\n \"y\": 1\n },\n \"name\": \"Data Nodes\",\n \"options\": {\n \"standardOptions\": {}\n },\n \"targets\": [\n {\n \"expr\": \"elasticsearch_cluster_health_number_of_nodes{instance=\\\"$instance\\\",cluster=\\\"$cluster\\\"}\",\n \"refId\": \"A\"\n }\n ],\n \"type\": \"stat\",\n \"version\": \"2.0.0\"\n },\n {\n \"custom\": {\n \"calc\": \"lastNotNull\",\n \"colSpan\": 1,\n \"colorMode\": \"value\",\n \"textMode\": \"value\",\n \"textSize\": {}\n },\n \"datasourceCate\": \"prometheus\",\n \"datasourceValue\": \"${prom}\",\n \"description\": \"集群节点数量\",\n \"id\": \"8648c6f9-ab82-4067-a02c-eebe84ae3a96\",\n \"layout\": {\n \"h\": 3,\n \"i\": \"8648c6f9-ab82-4067-a02c-eebe84ae3a96\",\n \"w\": 3,\n \"x\": 3,\n \"y\": 1\n },\n \"name\": \"Nodes\",\n \"options\": {\n \"standardOptions\": {}\n },\n \"targets\": [\n {\n \"expr\": \"elasticsearch_cluster_health_number_of_nodes{instance=\\\"$instance\\\",cluster=\\\"$cluster\\\"}\",\n \"refId\": \"A\"\n }\n ],\n \"type\": \"stat\",\n \"version\": \"2.0.0\"\n },\n {\n \"custom\": {\n \"calc\": \"lastNotNull\",\n \"colSpan\": 1,\n \"colorMode\": \"value\",\n \"textMode\": \"value\",\n \"textSize\": {}\n },\n \"datasourceCate\": \"prometheus\",\n \"datasourceValue\": \"${prom}\",\n \"description\": \"平均CPU使用率\",\n \"id\": \"20bf6dec-36cb-4e3a-a096-275a33e791b9\",\n \"layout\": {\n \"h\": 3,\n \"i\": \"20bf6dec-36cb-4e3a-a096-275a33e791b9\",\n \"w\": 3,\n \"x\": 9,\n \"y\": 1\n },\n \"name\": \"CPU usage Avg\",\n \"options\": {\n \"standardOptions\": {\n \"util\": \"percent\"\n },\n \"valueMappings\": [\n {\n \"match\": {\n \"from\": 80,\n \"special\": 80\n },\n \"result\": {\n \"color\": \"#f90606\"\n },\n \"type\": \"range\"\n },\n {\n \"match\": {\n \"from\": 70,\n \"special\": 70\n },\n \"result\": {\n \"color\": \"#f5ac0f\"\n },\n \"type\": \"range\"\n },\n {\n \"match\": {\n \"to\": 70\n },\n \"result\": {\n \"color\": \"#21c00c\"\n },\n \"type\": \"range\"\n }\n ]\n },\n \"targets\": [\n {\n \"expr\": \"sum (elasticsearch_process_cpu_percent{instance=\\\"$instance\\\",cluster=\\\"$cluster\\\",name=~\\\"$name\\\"} ) / count (elasticsearch_process_cpu_percent{instance=\\\"$instance\\\",cluster=\\\"$cluster\\\",name=~\\\"$name\\\"} )\",\n \"refId\": \"A\"\n }\n ],\n \"type\": \"stat\",\n \"version\": \"2.0.0\"\n },\n {\n \"custom\": {\n \"calc\": \"lastNotNull\",\n \"colSpan\": 1,\n \"colorMode\": \"value\",\n \"textMode\": \"value\",\n \"textSize\": {}\n },\n \"datasourceCate\": \"prometheus\",\n \"datasourceValue\": \"${prom}\",\n \"description\": \"平均JVM内存使用率\",\n \"id\": \"6380e6f2-3aec-4d56-a07a-efe6106c492f\",\n \"layout\": {\n \"h\": 3,\n \"i\": \"6380e6f2-3aec-4d56-a07a-efe6106c492f\",\n \"w\": 3,\n \"x\": 12,\n \"y\": 1\n },\n \"name\": \"JVM memory used Avg\",\n \"options\": {\n \"standardOptions\": {\n \"util\": \"percent\"\n },\n \"valueMappings\": [\n {\n \"match\": {\n \"from\": 80,\n \"special\": 80\n },\n \"result\": {\n \"color\": \"#f12c09\"\n },\n \"type\": \"range\"\n },\n {\n \"match\": {\n \"from\": 70,\n \"to\": 80\n },\n \"result\": {\n \"color\": \"#fbca18\"\n },\n \"type\": \"range\"\n },\n {\n \"match\": {\n \"to\": 70\n },\n \"result\": {\n \"color\": \"#21c00c\"\n },\n \"type\": \"range\"\n }\n ]\n },\n \"targets\": [\n {\n \"expr\": \"sum (elasticsearch_jvm_memory_used_bytes{instance=\\\"$instance\\\",cluster=\\\"$cluster\\\",name=~\\\"$name\\\"}) / sum (elasticsearch_jvm_memory_max_bytes{instance=\\\"$instance\\\",cluster=\\\"$cluster\\\",name=~\\\"$name\\\"}) * 100\",\n \"refId\": \"A\"\n }\n ],\n \"type\": \"stat\",\n \"version\": \"2.0.0\"\n },\n {\n \"custom\": {\n \"calc\": \"lastNotNull\",\n \"colSpan\": 1,\n \"colorMode\": \"value\",\n \"textMode\": \"value\",\n \"textSize\": {}\n },\n \"datasourceCate\": \"prometheus\",\n \"datasourceValue\": \"${prom}\",\n \"id\": \"de70ff1e-5ad6-4d68-b961-10eb78840d90\",\n \"layout\": {\n \"h\": 3,\n \"i\": \"de70ff1e-5ad6-4d68-b961-10eb78840d90\",\n \"w\": 3,\n \"x\": 15,\n \"y\": 1\n },\n \"name\": \"Open file descriptors\",\n \"options\": {\n \"standardOptions\": {}\n },\n \"targets\": [\n {\n \"expr\": \"sum (elasticsearch_process_open_files_count{instance=\\\"$instance\\\",cluster=\\\"$cluster\\\",name=~\\\"$name\\\"})\",\n \"refId\": \"A\"\n }\n ],\n \"type\": \"stat\",\n \"version\": \"2.0.0\"\n },\n {\n \"custom\": {\n \"calc\": \"lastNotNull\",\n \"colSpan\": 1,\n \"colorMode\": \"value\",\n \"textMode\": \"value\",\n \"textSize\": {}\n },\n \"datasourceCate\": \"prometheus\",\n \"datasourceValue\": \"${prom}\",\n \"description\": \"集群断路器阻断总数\",\n \"id\": \"88631ba2-b3d4-45e1-966a-9c3eb12a1d49\",\n \"layout\": {\n \"h\": 3,\n \"i\": \"88631ba2-b3d4-45e1-966a-9c3eb12a1d49\",\n \"w\": 3,\n \"x\": 18,\n \"y\": 1\n },\n \"name\": \"Tripped for breakers\",\n \"options\": {\n \"standardOptions\": {},\n \"valueMappings\": [\n {\n \"match\": {\n \"special\": 0\n },\n \"result\": {\n \"color\": \"#21c00c\",\n \"text\": \"\"\n },\n \"type\": \"special\"\n }\n ]\n },\n \"targets\": [\n {\n \"expr\": \"sum(elasticsearch_breakers_tripped{instance=\\\"$instance\\\",cluster=\\\"$cluster\\\",name=~\\\"$name\\\"})\",\n \"refId\": \"A\"\n }\n ],\n \"type\": \"stat\",\n \"version\": \"2.0.0\"\n },\n {\n \"custom\": {\n \"calc\": \"lastNotNull\",\n \"colSpan\": 1,\n \"colorMode\": \"value\",\n \"textMode\": \"value\",\n \"textSize\": {}\n },\n \"datasourceCate\": \"prometheus\",\n \"datasourceValue\": \"${prom}\",\n \"description\": \"等待执行的集群变更任务数量\",\n \"id\": \"7b85a99f-9cee-4cda-936c-eedcd2409e42\",\n \"layout\": {\n \"h\": 3,\n \"i\": \"7b85a99f-9cee-4cda-936c-eedcd2409e42\",\n \"w\": 3,\n \"x\": 21,\n \"y\": 1\n },\n \"name\": \"Pending tasks\",\n \"options\": {\n \"standardOptions\": {},\n \"valueMappings\": [\n {\n \"match\": {\n \"from\": 5\n },\n \"result\": {\n \"color\": \"#f24207\"\n },\n \"type\": \"range\"\n },\n {\n \"match\": {\n \"from\": 1,\n \"to\": 5\n },\n \"result\": {\n \"color\": \"#f9a006\"\n },\n \"type\": \"range\"\n },\n {\n \"match\": {\n \"to\": 1\n },\n \"result\": {\n \"color\": \"#21c00c\"\n },\n \"type\": \"range\"\n }\n ]\n },\n \"targets\": [\n {\n \"expr\": \"elasticsearch_cluster_health_number_of_pending_tasks{instance=\\\"$instance\\\",cluster=\\\"$cluster\\\"}\",\n \"refId\": \"A\"\n }\n ],\n \"type\": \"stat\",\n \"version\": \"2.0.0\"\n },\n {\n \"custom\": {\n \"calc\": \"lastNotNull\",\n \"colSpan\": 1,\n \"colorMode\": \"value\",\n \"textMode\": \"value\",\n \"textSize\": {}\n },\n \"datasourceCate\": \"prometheus\",\n \"datasourceValue\": \"${prom}\",\n \"description\": \"绿色:健康,黄色:存在副本分片异常,红色:存在主分片异常\",\n \"id\": \"a9c1c7fa-2985-4a14-bbe9-2ee7db630e94\",\n \"layout\": {\n \"h\": 3,\n \"i\": \"a9c1c7fa-2985-4a14-bbe9-2ee7db630e94\",\n \"w\": 3,\n \"x\": 0,\n \"y\": 1\n },\n \"name\": \"Cluster health\",\n \"options\": {\n \"standardOptions\": {},\n \"valueMappings\": [\n {\n \"match\": {},\n \"result\": {\n \"text\": \"N/A\"\n },\n \"type\": \"special\"\n },\n {\n \"match\": {\n \"special\": 5\n },\n \"result\": {\n \"color\": \"#21c00c\",\n \"text\": \"Green\"\n },\n \"type\": \"special\"\n },\n {\n \"match\": {\n \"special\": 3\n },\n \"result\": {\n \"color\": \"#f9e406\",\n \"text\": \"Yellow\"\n },\n \"type\": \"special\"\n },\n {\n \"match\": {\n \"special\": 1\n },\n \"result\": {\n \"color\": \"#f43606\",\n \"text\": \"Red\"\n },\n \"type\": \"special\"\n }\n ]\n },\n \"targets\": [\n {\n \"expr\": \"elasticsearch_cluster_health_status{instance=\\\"$instance\\\",cluster=\\\"$cluster\\\",color=\\\"red\\\"}==1 or (elasticsearch_cluster_health_status{instance=\\\"$instance\\\",cluster=\\\"$cluster\\\",color=\\\"green\\\"}==1)+4 or (elasticsearch_cluster_health_status{instance=\\\"$instance\\\",cluster=\\\"$cluster\\\",color=\\\"yellow\\\"}==1)+2\",\n \"refId\": \"A\"\n }\n ],\n \"type\": \"stat\",\n \"version\": \"2.0.0\"\n },\n {\n \"collapsed\": true,\n \"id\": \"12024030-3476-44b0-94b1-194629ce4efa\",\n \"layout\": {\n \"h\": 1,\n \"i\": \"12024030-3476-44b0-94b1-194629ce4efa\",\n \"w\": 24,\n \"x\": 0,\n \"y\": 4\n },\n \"name\": \"Shards\",\n \"type\": \"row\"\n },\n {\n \"custom\": {\n \"calc\": \"lastNotNull\",\n \"colSpan\": 1,\n \"colorMode\": \"value\",\n \"textMode\": \"value\",\n \"textSize\": {}\n },\n \"datasourceCate\": \"prometheus\",\n \"datasourceValue\": \"${prom}\",\n \"description\": \"活跃分片数\\nAggregate total of all shards across all indices, which includes replica shards\",\n \"id\": \"717067e8-5f9c-4485-8158-d977c217d620\",\n \"layout\": {\n \"h\": 3,\n \"i\": \"717067e8-5f9c-4485-8158-d977c217d620\",\n \"w\": 4,\n \"x\": 0,\n \"y\": 5\n },\n \"name\": \"Active shards\",\n \"options\": {\n \"standardOptions\": {}\n },\n \"targets\": [\n {\n \"expr\": \"elasticsearch_cluster_health_active_shards{instance=\\\"$instance\\\",cluster=\\\"$cluster\\\"}\",\n \"refId\": \"A\"\n }\n ],\n \"type\": \"stat\",\n \"version\": \"2.0.0\"\n },\n {\n \"custom\": {\n \"calc\": \"lastNotNull\",\n \"colSpan\": 1,\n \"colorMode\": \"value\",\n \"textMode\": \"value\",\n \"textSize\": {}\n },\n \"datasourceCate\": \"prometheus\",\n \"datasourceValue\": \"${prom}\",\n \"description\": \"活跃主分片数\\nThe number of primary shards in your cluster. This is an aggregate total across all indices.\",\n \"id\": \"03e4fbef-93dd-488c-bb52-3eac620cc331\",\n \"layout\": {\n \"h\": 3,\n \"i\": \"03e4fbef-93dd-488c-bb52-3eac620cc331\",\n \"w\": 4,\n \"x\": 4,\n \"y\": 5\n },\n \"name\": \"Active primary shards\",\n \"options\": {\n \"standardOptions\": {}\n },\n \"targets\": [\n {\n \"expr\": \"elasticsearch_cluster_health_active_primary_shards{instance=\\\"$instance\\\",cluster=\\\"$cluster\\\"}\",\n \"refId\": \"A\"\n }\n ],\n \"type\": \"stat\",\n \"version\": \"2.0.0\"\n },\n {\n \"custom\": {\n \"calc\": \"lastNotNull\",\n \"colSpan\": 1,\n \"colorMode\": \"value\",\n \"textMode\": \"value\",\n \"textSize\": {}\n },\n \"datasourceCate\": \"prometheus\",\n \"datasourceValue\": \"${prom}\",\n \"description\": \"创建中分片数量\\nCount of shards that are being freshly created\",\n \"id\": \"90b642aa-4815-492b-a821-94a8120f2dc9\",\n \"layout\": {\n \"h\": 3,\n \"i\": \"90b642aa-4815-492b-a821-94a8120f2dc9\",\n \"w\": 4,\n \"x\": 8,\n \"y\": 5\n },\n \"name\": \"Initializing shards\",\n \"options\": {\n \"standardOptions\": {}\n },\n \"targets\": [\n {\n \"expr\": \"elasticsearch_cluster_health_initializing_shards{instance=\\\"$instance\\\",cluster=\\\"$cluster\\\"}\",\n \"refId\": \"A\"\n }\n ],\n \"type\": \"stat\",\n \"version\": \"2.0.0\"\n },\n {\n \"custom\": {\n \"calc\": \"lastNotNull\",\n \"colSpan\": 1,\n \"colorMode\": \"value\",\n \"textMode\": \"value\",\n \"textSize\": {}\n },\n \"datasourceCate\": \"prometheus\",\n \"datasourceValue\": \"${prom}\",\n \"description\": \"迁移中分片数量\\nThe number of shards that are currently moving from one node to another node.\",\n \"id\": \"684d1be6-ebdf-4075-a7bc-6580c148b997\",\n \"layout\": {\n \"h\": 3,\n \"i\": \"684d1be6-ebdf-4075-a7bc-6580c148b997\",\n \"w\": 4,\n \"x\": 12,\n \"y\": 5\n },\n \"name\": \"Relocating shards\",\n \"options\": {\n \"standardOptions\": {}\n },\n \"targets\": [\n {\n \"expr\": \"elasticsearch_cluster_health_relocating_shards{instance=\\\"$instance\\\",cluster=\\\"$cluster\\\"}\",\n \"refId\": \"A\"\n }\n ],\n \"type\": \"stat\",\n \"version\": \"2.0.0\"\n },\n {\n \"custom\": {\n \"calc\": \"lastNotNull\",\n \"colSpan\": 1,\n \"colorMode\": \"value\",\n \"textMode\": \"value\",\n \"textSize\": {}\n },\n \"datasourceCate\": \"prometheus\",\n \"datasourceValue\": \"${prom}\",\n \"description\": \"未分配的分片数量\\nThe number of shards that exist in the cluster state, but cannot be found in the cluster itself\",\n \"id\": \"df959515-14fa-44e5-a16c-f40f87eacb01\",\n \"layout\": {\n \"h\": 3,\n \"i\": \"df959515-14fa-44e5-a16c-f40f87eacb01\",\n \"w\": 4,\n \"x\": 20,\n \"y\": 5\n },\n \"name\": \"Unassigned shards\",\n \"options\": {\n \"standardOptions\": {}\n },\n \"targets\": [\n {\n \"expr\": \"elasticsearch_cluster_health_unassigned_shards{instance=\\\"$instance\\\",cluster=\\\"$cluster\\\"}\",\n \"refId\": \"A\"\n }\n ],\n \"type\": \"stat\",\n \"version\": \"2.0.0\"\n },\n {\n \"custom\": {\n \"calc\": \"lastNotNull\",\n \"colSpan\": 1,\n \"colorMode\": \"value\",\n \"textMode\": \"value\",\n \"textSize\": {}\n },\n \"datasourceCate\": \"prometheus\",\n \"datasourceValue\": \"${prom}\",\n \"description\": \"暂缓分配的分片数量,当节点丢失,会发生选主和数据拷贝。为了较少网络抖动等原因导致的重分配情况,配置delay参数,该值为等待delay到期将被重分配的分片数量\\nShards delayed to reduce reallocation overhead\",\n \"id\": \"f307f045-cfcf-4cd9-a39f-10d4360a85b2\",\n \"layout\": {\n \"h\": 3,\n \"i\": \"f307f045-cfcf-4cd9-a39f-10d4360a85b2\",\n \"w\": 4,\n \"x\": 16,\n \"y\": 5\n },\n \"name\": \"Delayed shards\",\n \"options\": {\n \"standardOptions\": {}\n },\n \"targets\": [\n {\n \"expr\": \"elasticsearch_cluster_health_delayed_unassigned_shards{instance=\\\"$instance\\\",cluster=\\\"$cluster\\\"}\",\n \"refId\": \"A\"\n }\n ],\n \"type\": \"stat\",\n \"version\": \"2.0.0\"\n },\n {\n \"collapsed\": true,\n \"id\": \"ff67d655-1664-4432-bcef-52c00f77ef33\",\n \"layout\": {\n \"h\": 1,\n \"i\": \"ff67d655-1664-4432-bcef-52c00f77ef33\",\n \"w\": 24,\n \"x\": 0,\n \"y\": 8\n },\n \"name\": \"JVM Garbage Collection\",\n \"type\": \"row\"\n },\n {\n \"custom\": {\n \"drawStyle\": \"lines\",\n \"fillOpacity\": 0.3,\n \"gradientMode\": \"opacity\",\n \"lineInterpolation\": \"smooth\",\n \"lineWidth\": 2,\n \"stack\": \"off\"\n },\n \"datasourceCate\": \"prometheus\",\n \"datasourceValue\": \"${prom}\",\n \"description\": \"GC运行次数\",\n \"id\": \"f39502b5-a6a8-4bed-93d7-be83096eecbf\",\n \"layout\": {\n \"h\": 7,\n \"i\": \"f39502b5-a6a8-4bed-93d7-be83096eecbf\",\n \"w\": 12,\n \"x\": 0,\n \"y\": 9\n },\n \"name\": \"GC count\",\n \"options\": {\n \"legend\": {\n \"displayMode\": \"hidden\"\n },\n \"standardOptions\": {},\n \"thresholds\": {},\n \"tooltip\": {\n \"mode\": \"all\",\n \"sort\": \"none\"\n }\n },\n \"targets\": [\n {\n \"expr\": \"irate(elasticsearch_jvm_gc_collection_seconds_count{instance=\\\"$instance\\\",cluster=\\\"$cluster\\\",name=~\\\"$name\\\"}[5m])\",\n \"legend\": \"{{name}} - {{gc}}\",\n \"refId\": \"A\"\n }\n ],\n \"type\": \"timeseries\",\n \"version\": \"2.0.0\"\n },\n {\n \"custom\": {\n \"drawStyle\": \"lines\",\n \"fillOpacity\": 0.3,\n \"gradientMode\": \"opacity\",\n \"lineInterpolation\": \"smooth\",\n \"lineWidth\": 2,\n \"stack\": \"off\"\n },\n \"datasourceCate\": \"prometheus\",\n \"datasourceValue\": \"${prom}\",\n \"description\": \"GC运行耗时(秒)\",\n \"id\": \"df97e013-e810-4b78-8253-0a1fe7c96b3a\",\n \"layout\": {\n \"h\": 7,\n \"i\": \"df97e013-e810-4b78-8253-0a1fe7c96b3a\",\n \"w\": 12,\n \"x\": 12,\n \"y\": 9\n },\n \"name\": \"GC time\",\n \"options\": {\n \"legend\": {\n \"displayMode\": \"hidden\"\n },\n \"standardOptions\": {\n \"util\": \"seconds\"\n },\n \"thresholds\": {},\n \"tooltip\": {\n \"mode\": \"all\",\n \"sort\": \"none\"\n }\n },\n \"targets\": [\n {\n \"expr\": \"irate(elasticsearch_jvm_gc_collection_seconds_sum{instance=\\\"$instance\\\",cluster=\\\"$cluster\\\",name=~\\\"$name\\\"}[5m])\",\n \"legend\": \"{{name}} - {{gc}}\",\n \"refId\": \"A\"\n }\n ],\n \"type\": \"timeseries\",\n \"version\": \"2.0.0\"\n },\n {\n \"collapsed\": true,\n \"id\": \"674eb58f-4afe-440b-81eb-2c007c5bf598\",\n \"layout\": {\n \"h\": 1,\n \"i\": \"674eb58f-4afe-440b-81eb-2c007c5bf598\",\n \"w\": 24,\n \"x\": 0,\n \"y\": 16\n },\n \"name\": \"Translog\",\n \"type\": \"row\"\n },\n {\n \"custom\": {\n \"drawStyle\": \"lines\",\n \"fillOpacity\": 0.3,\n \"gradientMode\": \"opacity\",\n \"lineInterpolation\": \"smooth\",\n \"lineWidth\": 2,\n \"stack\": \"off\"\n },\n \"datasourceCate\": \"prometheus\",\n \"datasourceValue\": \"${prom}\",\n \"description\": \"translog大小(byte)\",\n \"id\": \"47583195-3a48-4d76-8b36-c08c29be936e\",\n \"layout\": {\n \"h\": 7,\n \"i\": \"47583195-3a48-4d76-8b36-c08c29be936e\",\n \"w\": 12,\n \"x\": 0,\n \"y\": 17\n },\n \"name\": \"Total translog operations\",\n \"options\": {\n \"legend\": {\n \"displayMode\": \"hidden\"\n },\n \"standardOptions\": {\n \"util\": \"none\"\n },\n \"thresholds\": {},\n \"tooltip\": {\n \"mode\": \"all\",\n \"sort\": \"none\"\n }\n },\n \"targets\": [\n {\n \"expr\": \"irate(elasticsearch_indices_translog_operations{instance=\\\"$instance\\\",cluster=\\\"$cluster\\\",name=~\\\"$name\\\"}[5m])\",\n \"legend\": \"{{name}}\",\n \"refId\": \"A\"\n }\n ],\n \"type\": \"timeseries\",\n \"version\": \"2.0.0\"\n },\n {\n \"custom\": {\n \"drawStyle\": \"lines\",\n \"fillOpacity\": 0.3,\n \"gradientMode\": \"opacity\",\n \"lineInterpolation\": \"smooth\",\n \"lineWidth\": 2,\n \"stack\": \"off\"\n },\n \"datasourceCate\": \"prometheus\",\n \"datasourceValue\": \"${prom}\",\n \"description\": \"translog大小(byte)\",\n \"id\": \"dca13d7f-90ca-4302-afed-753c2c181cf5\",\n \"layout\": {\n \"h\": 7,\n \"i\": \"dca13d7f-90ca-4302-afed-753c2c181cf5\",\n \"w\": 12,\n \"x\": 12,\n \"y\": 17\n },\n \"name\": \"Total translog size in bytes\",\n \"options\": {\n \"legend\": {\n \"displayMode\": \"hidden\"\n },\n \"standardOptions\": {\n \"util\": \"bytesIEC\"\n },\n \"thresholds\": {},\n \"tooltip\": {\n \"mode\": \"all\",\n \"sort\": \"none\"\n }\n },\n \"targets\": [\n {\n \"expr\": \"irate(elasticsearch_indices_translog_size_in_bytes{instance=\\\"$instance\\\",cluster=\\\"$cluster\\\",name=~\\\"$name\\\"}[5m])\",\n \"legend\": \"{{name}}\",\n \"refId\": \"A\"\n }\n ],\n \"type\": \"timeseries\",\n \"version\": \"2.0.0\"\n },\n {\n \"collapsed\": true,\n \"id\": \"6c7202e2-b991-482b-a6d4-ad26cc97f6d2\",\n \"layout\": {\n \"h\": 1,\n \"i\": \"6c7202e2-b991-482b-a6d4-ad26cc97f6d2\",\n \"w\": 24,\n \"x\": 0,\n \"y\": 24\n },\n \"name\": \"Breakers\",\n \"type\": \"row\"\n },\n {\n \"custom\": {\n \"drawStyle\": \"lines\",\n \"fillOpacity\": 0.3,\n \"gradientMode\": \"opacity\",\n \"lineInterpolation\": \"smooth\",\n \"lineWidth\": 2,\n \"stack\": \"off\"\n },\n \"datasourceCate\": \"prometheus\",\n \"datasourceValue\": \"${prom}\",\n \"description\": \"节点断路器阻断总数\",\n \"id\": \"7040d182-228f-4a58-b4ce-1eb4addeb88f\",\n \"layout\": {\n \"h\": 7,\n \"i\": \"7040d182-228f-4a58-b4ce-1eb4addeb88f\",\n \"w\": 12,\n \"x\": 0,\n \"y\": 25\n },\n \"name\": \"Tripped for breakers\",\n \"options\": {\n \"legend\": {\n \"displayMode\": \"hidden\"\n },\n \"standardOptions\": {},\n \"thresholds\": {},\n \"tooltip\": {\n \"mode\": \"all\",\n \"sort\": \"none\"\n }\n },\n \"targets\": [\n {\n \"expr\": \"elasticsearch_breakers_tripped{instance=\\\"$instance\\\",cluster=\\\"$cluster\\\",name=~\\\"$name\\\"}\",\n \"legend\": \"{{name}}: {{breaker}}\",\n \"refId\": \"A\"\n }\n ],\n \"type\": \"timeseries\",\n \"version\": \"2.0.0\"\n },\n {\n \"custom\": {\n \"drawStyle\": \"lines\",\n \"fillOpacity\": 0.3,\n \"gradientMode\": \"opacity\",\n \"lineInterpolation\": \"smooth\",\n \"lineWidth\": 2,\n \"stack\": \"off\"\n },\n \"datasourceCate\": \"prometheus\",\n \"datasourceValue\": \"${prom}\",\n \"description\": \"预估内存大小和限制内存大小\",\n \"id\": \"31d1efe8-d58a-4f1c-b510-1854ec1f491a\",\n \"layout\": {\n \"h\": 7,\n \"i\": \"31d1efe8-d58a-4f1c-b510-1854ec1f491a\",\n \"w\": 12,\n \"x\": 12,\n \"y\": 25\n },\n \"name\": \"Estimated size in bytes of breaker\",\n \"options\": {\n \"legend\": {\n \"displayMode\": \"hidden\"\n },\n \"standardOptions\": {\n \"util\": \"bytesIEC\"\n },\n \"thresholds\": {},\n \"tooltip\": {\n \"mode\": \"all\",\n \"sort\": \"none\"\n }\n },\n \"targets\": [\n {\n \"expr\": \"elasticsearch_breakers_estimated_size_bytes{instance=\\\"$instance\\\",cluster=\\\"$cluster\\\",name=~\\\"$name\\\"}\",\n \"legend\": \"{{name}}: {{breaker}}\",\n \"refId\": \"A\"\n },\n {\n \"expr\": \"elasticsearch_breakers_limit_size_bytes{instance=\\\"$instance\\\",cluster=\\\"$cluster\\\",name=~\\\"$name\\\"}\",\n \"legend\": \"{{name}}: limit for {{breaker}}\",\n \"refId\": \"B\"\n }\n ],\n \"type\": \"timeseries\",\n \"version\": \"2.0.0\"\n },\n {\n \"collapsed\": true,\n \"id\": \"0df4ccb6-d6c1-4235-a186-6b596f68dc61\",\n \"layout\": {\n \"h\": 1,\n \"i\": \"0df4ccb6-d6c1-4235-a186-6b596f68dc61\",\n \"w\": 24,\n \"x\": 0,\n \"y\": 32\n },\n \"name\": \"Cpu and Memory\",\n \"type\": \"row\"\n },\n {\n \"custom\": {\n \"drawStyle\": \"lines\",\n \"fillOpacity\": 0.3,\n \"gradientMode\": \"opacity\",\n \"lineInterpolation\": \"smooth\",\n \"lineWidth\": 2,\n \"stack\": \"off\"\n },\n \"datasourceCate\": \"prometheus\",\n \"datasourceValue\": \"${prom}\",\n \"description\": \"1m/5m/15m系统负载\",\n \"id\": \"1295b795-0e8a-4db7-afc1-5248e386062d\",\n \"layout\": {\n \"h\": 7,\n \"i\": \"1295b795-0e8a-4db7-afc1-5248e386062d\",\n \"w\": 12,\n \"x\": 0,\n \"y\": 33\n },\n \"name\": \"Load average\",\n \"options\": {\n \"legend\": {\n \"displayMode\": \"hidden\"\n },\n \"standardOptions\": {},\n \"thresholds\": {},\n \"tooltip\": {\n \"mode\": \"all\",\n \"sort\": \"none\"\n }\n },\n \"targets\": [\n {\n \"expr\": \"elasticsearch_os_load1{instance=\\\"$instance\\\",cluster=\\\"$cluster\\\",name=~\\\"$name\\\"}\",\n \"legend\": \"load1: {{name}}\",\n \"refId\": \"A\"\n },\n {\n \"expr\": \"elasticsearch_os_load5{instance=\\\"$instance\\\",cluster=\\\"$cluster\\\",name=~\\\"$name\\\"}\",\n \"legend\": \"load5: {{name}}\",\n \"refId\": \"B\"\n },\n {\n \"expr\": \"elasticsearch_os_load15{instance=\\\"$instance\\\",cluster=\\\"$cluster\\\",name=~\\\"$name\\\"}\",\n \"legend\": \"load15: {{name}}\",\n \"refId\": \"C\"\n }\n ],\n \"type\": \"timeseries\",\n \"version\": \"2.0.0\"\n },\n {\n \"custom\": {\n \"drawStyle\": \"lines\",\n \"fillOpacity\": 0.3,\n \"gradientMode\": \"opacity\",\n \"lineInterpolation\": \"smooth\",\n \"lineWidth\": 2,\n \"stack\": \"off\"\n },\n \"datasourceCate\": \"prometheus\",\n \"datasourceValue\": \"${prom}\",\n \"description\": \"进程CPU占比\",\n \"id\": \"356d363a-682b-41f9-9fdd-7212e943fc49\",\n \"layout\": {\n \"h\": 7,\n \"i\": \"356d363a-682b-41f9-9fdd-7212e943fc49\",\n \"w\": 12,\n \"x\": 12,\n \"y\": 33\n },\n \"name\": \"CPU usage\",\n \"options\": {\n \"legend\": {\n \"displayMode\": \"hidden\"\n },\n \"standardOptions\": {\n \"util\": \"percent\"\n },\n \"thresholds\": {},\n \"tooltip\": {\n \"mode\": \"all\",\n \"sort\": \"none\"\n }\n },\n \"targets\": [\n {\n \"expr\": \"elasticsearch_process_cpu_percent{instance=\\\"$instance\\\",cluster=\\\"$cluster\\\",name=~\\\"$name\\\"}\",\n \"legend\": \"{{name}}\",\n \"refId\": \"A\"\n }\n ],\n \"type\": \"timeseries\",\n \"version\": \"2.0.0\"\n },\n {\n \"custom\": {\n \"drawStyle\": \"lines\",\n \"fillOpacity\": 0.3,\n \"gradientMode\": \"opacity\",\n \"lineInterpolation\": \"smooth\",\n \"lineWidth\": 2,\n \"stack\": \"off\"\n },\n \"datasourceCate\": \"prometheus\",\n \"datasourceValue\": \"${prom}\",\n \"description\": \"进程内存占用/限制/峰值(byte)\",\n \"id\": \"f0216c7e-ade7-47c0-aec1-6efab9543e58\",\n \"layout\": {\n \"h\": 7,\n \"i\": \"f0216c7e-ade7-47c0-aec1-6efab9543e58\",\n \"w\": 12,\n \"x\": 0,\n \"y\": 35\n },\n \"name\": \"JVM memory usage\",\n \"options\": {\n \"legend\": {\n \"displayMode\": \"hidden\"\n },\n \"standardOptions\": {\n \"util\": \"bytesIEC\"\n },\n \"thresholds\": {},\n \"tooltip\": {\n \"mode\": \"all\",\n \"sort\": \"none\"\n }\n },\n \"targets\": [\n {\n \"expr\": \"elasticsearch_jvm_memory_used_bytes{instance=\\\"$instance\\\",cluster=\\\"$cluster\\\",name=~\\\"$name\\\"}\",\n \"legend\": \"{{name}} used: {{area}}\",\n \"refId\": \"A\"\n },\n {\n \"expr\": \"elasticsearch_jvm_memory_max_bytes{instance=\\\"$instance\\\",cluster=\\\"$cluster\\\",name=~\\\"$name\\\"}\",\n \"legend\": \"{{name}} max: {{area}}\",\n \"refId\": \"B\"\n },\n {\n \"expr\": \"elasticsearch_jvm_memory_pool_peak_used_bytes{instance=\\\"$instance\\\",cluster=\\\"$cluster\\\",name=~\\\"$name\\\"}\",\n \"legend\": \"{{name}} peak used pool: {{pool}}\",\n \"refId\": \"C\"\n }\n ],\n \"type\": \"timeseries\",\n \"version\": \"2.0.0\"\n },\n {\n \"custom\": {\n \"drawStyle\": \"lines\",\n \"fillOpacity\": 0.3,\n \"gradientMode\": \"opacity\",\n \"lineInterpolation\": \"smooth\",\n \"lineWidth\": 2,\n \"stack\": \"off\"\n },\n \"datasourceCate\": \"prometheus\",\n \"datasourceValue\": \"${prom}\",\n \"description\": \"JVM申请/限制内存(byte)\",\n \"id\": \"12bce6cc-a0fc-4e98-ba19-5cf5fdeb6332\",\n \"layout\": {\n \"h\": 7,\n \"i\": \"12bce6cc-a0fc-4e98-ba19-5cf5fdeb6332\",\n \"w\": 12,\n \"x\": 12,\n \"y\": 35\n },\n \"name\": \"JVM memory committed\",\n \"options\": {\n \"legend\": {\n \"displayMode\": \"hidden\"\n },\n \"standardOptions\": {\n \"util\": \"bytesIEC\"\n },\n \"thresholds\": {},\n \"tooltip\": {\n \"mode\": \"all\",\n \"sort\": \"none\"\n }\n },\n \"targets\": [\n {\n \"expr\": \"elasticsearch_jvm_memory_committed_bytes{instance=\\\"$instance\\\",cluster=\\\"$cluster\\\",name=~\\\"$name\\\"}\",\n \"legend\": \"{{name}} committed: {{area}}\",\n \"refId\": \"A\"\n },\n {\n \"expr\": \"elasticsearch_jvm_memory_max_bytes{instance=\\\"$instance\\\",cluster=\\\"$cluster\\\",name=~\\\"$name\\\"}\",\n \"legend\": \"{{name}} max: {{area}}\",\n \"refId\": \"B\"\n }\n ],\n \"type\": \"timeseries\",\n \"version\": \"2.0.0\"\n },\n {\n \"collapsed\": true,\n \"id\": \"df751a4b-72b5-4e4b-bc33-b89f8b4b8cac\",\n \"layout\": {\n \"h\": 1,\n \"i\": \"df751a4b-72b5-4e4b-bc33-b89f8b4b8cac\",\n \"w\": 24,\n \"x\": 0,\n \"y\": 42\n },\n \"name\": \"Disk and Network\",\n \"type\": \"row\"\n },\n {\n \"custom\": {\n \"drawStyle\": \"lines\",\n \"fillOpacity\": 0.3,\n \"gradientMode\": \"opacity\",\n \"lineInterpolation\": \"smooth\",\n \"lineWidth\": 2,\n \"stack\": \"off\"\n },\n \"datasourceCate\": \"prometheus\",\n \"datasourceValue\": \"${prom}\",\n \"description\": \"磁盘使用率\",\n \"id\": \"5de089e7-c5cd-4a01-9cd7-70e39feef131\",\n \"layout\": {\n \"h\": 7,\n \"i\": \"5de089e7-c5cd-4a01-9cd7-70e39feef131\",\n \"w\": 12,\n \"x\": 0,\n \"y\": 43\n },\n \"name\": \"Disk usage\",\n \"options\": {\n \"legend\": {\n \"displayMode\": \"hidden\"\n },\n \"standardOptions\": {\n \"util\": \"percentUnit\"\n },\n \"thresholds\": {},\n \"tooltip\": {\n \"mode\": \"all\",\n \"sort\": \"none\"\n }\n },\n \"targets\": [\n {\n \"expr\": \"1-(elasticsearch_filesystem_data_available_bytes{instance=\\\"$instance\\\",cluster=\\\"$cluster\\\",name=~\\\"$name\\\"}/elasticsearch_filesystem_data_size_bytes{instance=\\\"$instance\\\",cluster=\\\"$cluster\\\",name=~\\\"$name\\\"})\",\n \"legend\": \"{{name}}: {{path}}\",\n \"refId\": \"A\"\n }\n ],\n \"type\": \"timeseries\",\n \"version\": \"2.0.0\"\n },\n {\n \"custom\": {\n \"drawStyle\": \"lines\",\n \"fillOpacity\": 0.3,\n \"gradientMode\": \"opacity\",\n \"lineInterpolation\": \"smooth\",\n \"lineWidth\": 2,\n \"stack\": \"off\"\n },\n \"datasourceCate\": \"prometheus\",\n \"datasourceValue\": \"${prom}\",\n \"description\": \"网络流量(byte)\",\n \"id\": \"957402f9-2e17-4c67-8d6b-02a8cc6789d9\",\n \"layout\": {\n \"h\": 7,\n \"i\": \"957402f9-2e17-4c67-8d6b-02a8cc6789d9\",\n \"w\": 12,\n \"x\": 12,\n \"y\": 43\n },\n \"name\": \"Network usage\",\n \"options\": {\n \"legend\": {\n \"displayMode\": \"hidden\"\n },\n \"standardOptions\": {\n \"util\": \"bytesSI\"\n },\n \"thresholds\": {},\n \"tooltip\": {\n \"mode\": \"all\",\n \"sort\": \"none\"\n }\n },\n \"targets\": [\n {\n \"expr\": \"irate(elasticsearch_transport_tx_size_bytes_total{instance=\\\"$instance\\\",cluster=\\\"$cluster\\\",name=~\\\"$name\\\"}[5m])\",\n \"legend\": \"{{name}}: sent\",\n \"refId\": \"A\"\n },\n {\n \"expr\": \"-irate(elasticsearch_transport_rx_size_bytes_total{instance=\\\"$instance\\\",cluster=\\\"$cluster\\\",name=~\\\"$name\\\"}[5m])\",\n \"legend\": \"{{name}}: received\",\n \"refId\": \"B\"\n }\n ],\n \"type\": \"timeseries\",\n \"version\": \"2.0.0\"\n },\n {\n \"collapsed\": true,\n \"id\": \"f26bc1c8-5528-4faa-950d-075d39c023a8\",\n \"layout\": {\n \"h\": 1,\n \"i\": \"f26bc1c8-5528-4faa-950d-075d39c023a8\",\n \"w\": 24,\n \"x\": 0,\n \"y\": 50\n },\n \"name\": \"Documents\",\n \"type\": \"row\"\n },\n {\n \"custom\": {\n \"drawStyle\": \"lines\",\n \"fillOpacity\": 0.3,\n \"gradientMode\": \"opacity\",\n \"lineInterpolation\": \"smooth\",\n \"lineWidth\": 2,\n \"stack\": \"off\"\n },\n \"datasourceCate\": \"prometheus\",\n \"datasourceValue\": \"${prom}\",\n \"description\": \"节点文档总数,不包含已删除文档和子文档以及刚索引的文档\",\n \"id\": \"6220138b-3452-4529-a008-c78e20672169\",\n \"layout\": {\n \"h\": 7,\n \"i\": \"6220138b-3452-4529-a008-c78e20672169\",\n \"w\": 12,\n \"x\": 0,\n \"y\": 51\n },\n \"name\": \"Documents count on node\",\n \"options\": {\n \"legend\": {\n \"displayMode\": \"hidden\"\n },\n \"standardOptions\": {},\n \"thresholds\": {},\n \"tooltip\": {\n \"mode\": \"all\",\n \"sort\": \"none\"\n }\n },\n \"targets\": [\n {\n \"expr\": \"elasticsearch_indices_docs{instance=\\\"$instance\\\",cluster=\\\"$cluster\\\",name=~\\\"$name\\\"}\",\n \"legend\": \"{{name}}\",\n \"refId\": \"A\"\n }\n ],\n \"type\": \"timeseries\",\n \"version\": \"2.0.0\"\n },\n {\n \"custom\": {\n \"drawStyle\": \"lines\",\n \"fillOpacity\": 0.3,\n \"gradientMode\": \"opacity\",\n \"lineInterpolation\": \"smooth\",\n \"lineWidth\": 2,\n \"stack\": \"off\"\n },\n \"datasourceCate\": \"prometheus\",\n \"datasourceValue\": \"${prom}\",\n \"description\": \"平均每秒索引文档数\",\n \"id\": \"242dff44-09b1-4468-856d-642e76048296\",\n \"layout\": {\n \"h\": 7,\n \"i\": \"242dff44-09b1-4468-856d-642e76048296\",\n \"w\": 12,\n \"x\": 12,\n \"y\": 51\n },\n \"name\": \"Documents indexed rate\",\n \"options\": {\n \"legend\": {\n \"displayMode\": \"hidden\"\n },\n \"standardOptions\": {},\n \"thresholds\": {},\n \"tooltip\": {\n \"mode\": \"all\",\n \"sort\": \"none\"\n }\n },\n \"targets\": [\n {\n \"expr\": \"irate(elasticsearch_indices_indexing_index_total{instance=\\\"$instance\\\",cluster=\\\"$cluster\\\",name=~\\\"$name\\\"}[5m])\",\n \"legend\": \"{{name}}\",\n \"refId\": \"A\"\n }\n ],\n \"type\": \"timeseries\",\n \"version\": \"2.0.0\"\n },\n {\n \"custom\": {\n \"drawStyle\": \"lines\",\n \"fillOpacity\": 0.3,\n \"gradientMode\": \"opacity\",\n \"lineInterpolation\": \"smooth\",\n \"lineWidth\": 2,\n \"stack\": \"off\"\n },\n \"datasourceCate\": \"prometheus\",\n \"datasourceValue\": \"${prom}\",\n \"description\": \"平均每秒删除文档数\",\n \"id\": \"400efbe3-a4c5-49af-a0bf-eabf2511ebf5\",\n \"layout\": {\n \"h\": 7,\n \"i\": \"400efbe3-a4c5-49af-a0bf-eabf2511ebf5\",\n \"w\": 8,\n \"x\": 0,\n \"y\": 53\n },\n \"name\": \"Documents deleted rate\",\n \"options\": {\n \"legend\": {\n \"displayMode\": \"hidden\"\n },\n \"standardOptions\": {},\n \"thresholds\": {},\n \"tooltip\": {\n \"mode\": \"all\",\n \"sort\": \"none\"\n }\n },\n \"targets\": [\n {\n \"expr\": \"irate(elasticsearch_indices_docs_deleted{instance=\\\"$instance\\\",cluster=\\\"$cluster\\\",name=~\\\"$name\\\"}[5m])\",\n \"legend\": \"{{name}}\",\n \"refId\": \"A\"\n }\n ],\n \"type\": \"timeseries\",\n \"version\": \"2.0.0\"\n },\n {\n \"custom\": {\n \"drawStyle\": \"lines\",\n \"fillOpacity\": 0.3,\n \"gradientMode\": \"opacity\",\n \"lineInterpolation\": \"smooth\",\n \"lineWidth\": 2,\n \"stack\": \"off\"\n },\n \"datasourceCate\": \"prometheus\",\n \"datasourceValue\": \"${prom}\",\n \"description\": \"平均每秒合并文档数\",\n \"id\": \"0b2d6480-6f50-413f-8552-f49109d2be59\",\n \"layout\": {\n \"h\": 7,\n \"i\": \"0b2d6480-6f50-413f-8552-f49109d2be59\",\n \"w\": 8,\n \"x\": 8,\n \"y\": 53\n },\n \"name\": \"Documents merged rate\",\n \"options\": {\n \"legend\": {\n \"displayMode\": \"hidden\"\n },\n \"standardOptions\": {},\n \"thresholds\": {},\n \"tooltip\": {\n \"mode\": \"all\",\n \"sort\": \"none\"\n }\n },\n \"targets\": [\n {\n \"expr\": \"rate(elasticsearch_indices_merges_docs_total{instance=\\\"$instance\\\",cluster=\\\"$cluster\\\",name=~\\\"$name\\\"}[5m])\",\n \"legend\": \"{{name}}\",\n \"refId\": \"A\"\n }\n ],\n \"type\": \"timeseries\",\n \"version\": \"2.0.0\"\n },\n {\n \"custom\": {\n \"drawStyle\": \"lines\",\n \"fillOpacity\": 0.3,\n \"gradientMode\": \"opacity\",\n \"lineInterpolation\": \"smooth\",\n \"lineWidth\": 2,\n \"stack\": \"off\"\n },\n \"datasourceCate\": \"prometheus\",\n \"datasourceValue\": \"${prom}\",\n \"description\": \"平均每秒合并文档大小\",\n \"id\": \"981c2d24-56df-437c-bc43-77682008dd01\",\n \"layout\": {\n \"h\": 7,\n \"i\": \"981c2d24-56df-437c-bc43-77682008dd01\",\n \"w\": 8,\n \"x\": 16,\n \"y\": 53\n },\n \"name\": \"Documents merged bytes\",\n \"options\": {\n \"legend\": {\n \"displayMode\": \"hidden\"\n },\n \"standardOptions\": {\n \"util\": \"bytesSI\"\n },\n \"thresholds\": {},\n \"tooltip\": {\n \"mode\": \"all\",\n \"sort\": \"none\"\n }\n },\n \"targets\": [\n {\n \"expr\": \"irate(elasticsearch_indices_merges_total_size_bytes_total{instance=\\\"$instance\\\",cluster=\\\"$cluster\\\",name=~\\\"$name\\\"}[5m])\",\n \"legend\": \"{{name}}\",\n \"refId\": \"A\"\n }\n ],\n \"type\": \"timeseries\",\n \"version\": \"2.0.0\"\n },\n {\n \"collapsed\": true,\n \"id\": \"301ccb76-3b75-48a3-b37c-0ab035c2c2e9\",\n \"layout\": {\n \"h\": 1,\n \"i\": \"301ccb76-3b75-48a3-b37c-0ab035c2c2e9\",\n \"w\": 24,\n \"x\": 0,\n \"y\": 60\n },\n \"name\": \"Times\",\n \"type\": \"row\"\n },\n {\n \"custom\": {\n \"drawStyle\": \"lines\",\n \"fillOpacity\": 0.3,\n \"gradientMode\": \"opacity\",\n \"lineInterpolation\": \"smooth\",\n \"lineWidth\": 2,\n \"stack\": \"off\"\n },\n \"datasourceCate\": \"prometheus\",\n \"datasourceValue\": \"${prom}\",\n \"description\": \"查询操作耗时(秒)\",\n \"id\": \"e217b136-6021-473a-859e-7ac4218c4e86\",\n \"layout\": {\n \"h\": 7,\n \"i\": \"e217b136-6021-473a-859e-7ac4218c4e86\",\n \"w\": 12,\n \"x\": 0,\n \"y\": 61\n },\n \"name\": \"Query time\",\n \"options\": {\n \"legend\": {\n \"displayMode\": \"hidden\"\n },\n \"standardOptions\": {\n \"util\": \"seconds\"\n },\n \"thresholds\": {},\n \"tooltip\": {\n \"mode\": \"all\",\n \"sort\": \"none\"\n }\n },\n \"targets\": [\n {\n \"expr\": \"irate(elasticsearch_indices_search_query_time_seconds{instance=\\\"$instance\\\",cluster=\\\"$cluster\\\",name=~\\\"$name\\\"}[5m])\",\n \"legend\": \"{{name}}\",\n \"refId\": \"A\"\n }\n ],\n \"type\": \"timeseries\",\n \"version\": \"2.0.0\"\n },\n {\n \"custom\": {\n \"drawStyle\": \"lines\",\n \"fillOpacity\": 0.3,\n \"gradientMode\": \"opacity\",\n \"lineInterpolation\": \"smooth\",\n \"lineWidth\": 2,\n \"stack\": \"off\"\n },\n \"datasourceCate\": \"prometheus\",\n \"datasourceValue\": \"${prom}\",\n \"description\": \"索引操作耗时(秒)\",\n \"id\": \"d51a4ef1-1fc5-4d1b-ba6c-a2fd483295ee\",\n \"layout\": {\n \"h\": 7,\n \"i\": \"d51a4ef1-1fc5-4d1b-ba6c-a2fd483295ee\",\n \"w\": 12,\n \"x\": 12,\n \"y\": 61\n },\n \"name\": \"Indexing time\",\n \"options\": {\n \"legend\": {\n \"displayMode\": \"hidden\"\n },\n \"standardOptions\": {\n \"util\": \"seconds\"\n },\n \"thresholds\": {},\n \"tooltip\": {\n \"mode\": \"all\",\n \"sort\": \"none\"\n }\n },\n \"targets\": [\n {\n \"expr\": \"irate(elasticsearch_indices_indexing_index_time_seconds_total{instance=\\\"$instance\\\",cluster=\\\"$cluster\\\",name=~\\\"$name\\\"}[5m])\",\n \"legend\": \"{{name}}\",\n \"refId\": \"A\"\n }\n ],\n \"type\": \"timeseries\",\n \"version\": \"2.0.0\"\n },\n {\n \"custom\": {\n \"drawStyle\": \"lines\",\n \"fillOpacity\": 0.3,\n \"gradientMode\": \"opacity\",\n \"lineInterpolation\": \"smooth\",\n \"lineWidth\": 2,\n \"stack\": \"off\"\n },\n \"datasourceCate\": \"prometheus\",\n \"datasourceValue\": \"${prom}\",\n \"description\": \"合并操作耗时(秒)\",\n \"id\": \"20751b64-38da-4263-a055-02bc844bd416\",\n \"layout\": {\n \"h\": 7,\n \"i\": \"20751b64-38da-4263-a055-02bc844bd416\",\n \"w\": 12,\n \"x\": 0,\n \"y\": 63\n },\n \"name\": \"Merging time\",\n \"options\": {\n \"legend\": {\n \"displayMode\": \"hidden\"\n },\n \"standardOptions\": {\n \"util\": \"seconds\"\n },\n \"thresholds\": {},\n \"tooltip\": {\n \"mode\": \"all\",\n \"sort\": \"none\"\n }\n },\n \"targets\": [\n {\n \"expr\": \"irate(elasticsearch_indices_merges_total_time_seconds_total{instance=\\\"$instance\\\",cluster=\\\"$cluster\\\",name=~\\\"$name\\\"}[5m])\",\n \"legend\": \"{{name}}\",\n \"refId\": \"A\"\n }\n ],\n \"type\": \"timeseries\",\n \"version\": \"2.0.0\"\n },\n {\n \"custom\": {\n \"drawStyle\": \"lines\",\n \"fillOpacity\": 0.3,\n \"gradientMode\": \"opacity\",\n \"lineInterpolation\": \"smooth\",\n \"lineWidth\": 2,\n \"stack\": \"off\"\n },\n \"datasourceCate\": \"prometheus\",\n \"datasourceValue\": \"${prom}\",\n \"description\": \"索引存储限制耗时(秒)\",\n \"id\": \"d688b715-5959-433a-89b2-51bcd2b0b1f3\",\n \"layout\": {\n \"h\": 7,\n \"i\": \"d688b715-5959-433a-89b2-51bcd2b0b1f3\",\n \"w\": 12,\n \"x\": 12,\n \"y\": 63\n },\n \"name\": \"Throttle time for index store\",\n \"options\": {\n \"legend\": {\n \"displayMode\": \"hidden\"\n },\n \"standardOptions\": {\n \"util\": \"seconds\"\n },\n \"thresholds\": {},\n \"tooltip\": {\n \"mode\": \"all\",\n \"sort\": \"none\"\n }\n },\n \"targets\": [\n {\n \"expr\": \"irate(elasticsearch_indices_store_throttle_time_seconds_total{instance=\\\"$instance\\\",cluster=\\\"$cluster\\\",name=~\\\"$name\\\"}[5m])\",\n \"legend\": \"{{name}}\",\n \"refId\": \"A\"\n }\n ],\n \"type\": \"timeseries\",\n \"version\": \"2.0.0\"\n },\n {\n \"collapsed\": true,\n \"id\": \"f83e7128-21d7-4d5d-9956-61c9537f9b20\",\n \"layout\": {\n \"h\": 1,\n \"i\": \"f83e7128-21d7-4d5d-9956-61c9537f9b20\",\n \"w\": 24,\n \"x\": 0,\n \"y\": 70\n },\n \"name\": \"Total Operations states\",\n \"type\": \"row\"\n },\n {\n \"custom\": {\n \"drawStyle\": \"lines\",\n \"fillOpacity\": 0.3,\n \"gradientMode\": \"opacity\",\n \"lineInterpolation\": \"smooth\",\n \"lineWidth\": 2,\n \"stack\": \"off\"\n },\n \"datasourceCate\": \"prometheus\",\n \"datasourceValue\": \"${prom}\",\n \"id\": \"9be3061f-ade2-43a5-ab5f-bfdc8861e4be\",\n \"layout\": {\n \"h\": 7,\n \"i\": \"9be3061f-ade2-43a5-ab5f-bfdc8861e4be\",\n \"w\": 12,\n \"x\": 0,\n \"y\": 71\n },\n \"name\": \"Total Operations time\",\n \"options\": {\n \"legend\": {\n \"displayMode\": \"hidden\"\n },\n \"standardOptions\": {\n \"util\": \"seconds\"\n },\n \"thresholds\": {},\n \"tooltip\": {\n \"mode\": \"all\",\n \"sort\": \"none\"\n }\n },\n \"targets\": [\n {\n \"expr\": \"irate(elasticsearch_indices_indexing_index_time_seconds_total{instance=\\\"$instance\\\",cluster=\\\"$cluster\\\",name=~\\\"$name\\\"}[5m])\",\n \"legend\": \"{{name}}: indexing\",\n \"refId\": \"A\"\n },\n {\n \"expr\": \"irate(elasticsearch_indices_search_query_time_seconds{instance=\\\"$instance\\\",cluster=\\\"$cluster\\\",name=~\\\"$name\\\"}[5m])\",\n \"legend\": \"{{name}}: query\",\n \"refId\": \"B\"\n },\n {\n \"expr\": \"irate(elasticsearch_indices_search_fetch_time_seconds{instance=\\\"$instance\\\",cluster=\\\"$cluster\\\",name=~\\\"$name\\\"}[5m])\",\n \"legend\": \"{{name}}: fetch\",\n \"refId\": \"C\"\n },\n {\n \"expr\": \"irate(elasticsearch_indices_merges_total_time_seconds_total{instance=\\\"$instance\\\",cluster=\\\"$cluster\\\",name=~\\\"$name\\\"}[5m])\",\n \"legend\": \"{{name}}: merges\",\n \"refId\": \"D\"\n },\n {\n \"expr\": \"irate(elasticsearch_indices_refresh_time_seconds_total{instance=\\\"$instance\\\",cluster=\\\"$cluster\\\",name=~\\\"$name\\\"}[5m])\",\n \"legend\": \"{{name}}: refresh\",\n \"refId\": \"E\"\n },\n {\n \"expr\": \"irate(elasticsearch_indices_flush_time_seconds{instance=\\\"$instance\\\",cluster=\\\"$cluster\\\",name=~\\\"$name\\\"}[5m])\",\n \"legend\": \"{{name}}: flush\",\n \"refId\": \"F\"\n },\n {\n \"expr\": \"irate(elasticsearch_indices_get_exists_time_seconds{instance=\\\"$instance\\\",cluster=\\\"$cluster\\\",name=~\\\"$name\\\"}[5m])\",\n \"legend\": \"{{name}}: get_exists\",\n \"refId\": \"G\"\n },\n {\n \"expr\": \"irate(elasticsearch_indices_get_time_seconds{instance=\\\"$instance\\\",cluster=\\\"$cluster\\\",name=~\\\"$name\\\"}[5m])\",\n \"legend\": \"{{name}}: get_time\",\n \"refId\": \"H\"\n },\n {\n \"expr\": \"irate(elasticsearch_indices_get_missing_time_seconds{instance=\\\"$instance\\\",cluster=\\\"$cluster\\\",name=~\\\"$name\\\"}[5m])\",\n \"legend\": \"{{name}}: get_missing\",\n \"refId\": \"I\"\n },\n {\n \"expr\": \"irate(elasticsearch_indices_indexing_delete_time_seconds_total{instance=\\\"$instance\\\",cluster=\\\"$cluster\\\",name=~\\\"$name\\\"}[5m])\",\n \"legend\": \"{{name}}: indexing_delete\",\n \"refId\": \"K\"\n },\n {\n \"expr\": \"irate(elasticsearch_indices_get_time_seconds{instance=\\\"$instance\\\",cluster=\\\"$cluster\\\",name=~\\\"$name\\\"}[5m])\",\n \"legend\": \"{{name}}: get\",\n \"refId\": \"L\"\n }\n ],\n \"type\": \"timeseries\",\n \"version\": \"2.0.0\"\n },\n {\n \"custom\": {\n \"drawStyle\": \"lines\",\n \"fillOpacity\": 0.3,\n \"gradientMode\": \"opacity\",\n \"lineInterpolation\": \"smooth\",\n \"lineWidth\": 2,\n \"stack\": \"off\"\n },\n \"datasourceCate\": \"prometheus\",\n \"datasourceValue\": \"${prom}\",\n \"id\": \"55cf0c8e-bf4f-430c-bc68-1eca72d7055d\",\n \"layout\": {\n \"h\": 7,\n \"i\": \"55cf0c8e-bf4f-430c-bc68-1eca72d7055d\",\n \"w\": 12,\n \"x\": 12,\n \"y\": 71\n },\n \"name\": \"Total Operations rate\",\n \"options\": {\n \"legend\": {\n \"displayMode\": \"hidden\"\n },\n \"standardOptions\": {},\n \"thresholds\": {},\n \"tooltip\": {\n \"mode\": \"all\",\n \"sort\": \"none\"\n }\n },\n \"targets\": [\n {\n \"expr\": \"rate(elasticsearch_indices_indexing_index_total{instance=\\\"$instance\\\",cluster=\\\"$cluster\\\",name=~\\\"$name\\\"}[5m])\",\n \"legend\": \"{{name}}: indexing\",\n \"refId\": \"A\"\n },\n {\n \"expr\": \"rate(elasticsearch_indices_search_query_total{instance=\\\"$instance\\\",cluster=\\\"$cluster\\\",name=~\\\"$name\\\"}[5m])\",\n \"legend\": \"{{name}}: query\",\n \"refId\": \"B\"\n },\n {\n \"expr\": \"rate(elasticsearch_indices_search_fetch_total{instance=\\\"$instance\\\",cluster=\\\"$cluster\\\",name=~\\\"$name\\\"}[5m])\",\n \"legend\": \"{{name}}: fetch\",\n \"refId\": \"C\"\n },\n {\n \"expr\": \"rate(elasticsearch_indices_merges_total{instance=\\\"$instance\\\",cluster=\\\"$cluster\\\",name=~\\\"$name\\\"}[5m])\",\n \"legend\": \"{{name}}: merges\",\n \"refId\": \"D\"\n },\n {\n \"expr\": \"rate(elasticsearch_indices_refresh_total{instance=\\\"$instance\\\",cluster=\\\"$cluster\\\",name=~\\\"$name\\\"}[5m])\",\n \"legend\": \"{{name}}: refresh\",\n \"refId\": \"E\"\n },\n {\n \"expr\": \"rate(elasticsearch_indices_flush_total{instance=\\\"$instance\\\",cluster=\\\"$cluster\\\",name=~\\\"$name\\\"}[5m])\",\n \"legend\": \"{{name}}: flush\",\n \"refId\": \"F\"\n },\n {\n \"expr\": \"rate(elasticsearch_indices_get_exists_total{instance=\\\"$instance\\\",cluster=\\\"$cluster\\\",name=~\\\"$name\\\"}[5m])\",\n \"legend\": \"{{name}}: get_exists\",\n \"refId\": \"G\"\n },\n {\n \"expr\": \"rate(elasticsearch_indices_get_missing_total{instance=\\\"$instance\\\",cluster=\\\"$cluster\\\",name=~\\\"$name\\\"}[5m])\",\n \"legend\": \"{{name}}: get_missing\",\n \"refId\": \"H\"\n },\n {\n \"expr\": \"rate(elasticsearch_indices_get_tota{instance=\\\"$instance\\\",cluster=\\\"$cluster\\\",name=~\\\"$name\\\"}[5m])\",\n \"legend\": \"{{name}}: get\",\n \"refId\": \"I\"\n },\n {\n \"expr\": \"rate(elasticsearch_indices_indexing_delete_total{instance=\\\"$instance\\\",cluster=\\\"$cluster\\\",name=~\\\"$name\\\"}[5m])\",\n \"legend\": \"{{name}}: indexing_delete\",\n \"refId\": \"K\"\n }\n ],\n \"type\": \"timeseries\",\n \"version\": \"2.0.0\"\n },\n {\n \"collapsed\": true,\n \"id\": \"7f948b8c-2881-416c-83b7-0819823c7b70\",\n \"layout\": {\n \"h\": 1,\n \"i\": \"7f948b8c-2881-416c-83b7-0819823c7b70\",\n \"w\": 24,\n \"x\": 0,\n \"y\": 78\n },\n \"name\": \"Thread Pool\",\n \"type\": \"row\"\n },\n {\n \"custom\": {\n \"drawStyle\": \"lines\",\n \"fillOpacity\": 0.3,\n \"gradientMode\": \"opacity\",\n \"lineInterpolation\": \"smooth\",\n \"lineWidth\": 2,\n \"stack\": \"off\"\n },\n \"datasourceCate\": \"prometheus\",\n \"datasourceValue\": \"${prom}\",\n \"description\": \"线程池reject次数\",\n \"id\": \"d337f12c-6fbe-4463-9181-faecdc612a90\",\n \"layout\": {\n \"h\": 7,\n \"i\": \"d337f12c-6fbe-4463-9181-faecdc612a90\",\n \"w\": 6,\n \"x\": 0,\n \"y\": 79\n },\n \"name\": \"Thread Pool operations rejected\",\n \"options\": {\n \"legend\": {\n \"displayMode\": \"hidden\"\n },\n \"standardOptions\": {},\n \"thresholds\": {},\n \"tooltip\": {\n \"mode\": \"all\",\n \"sort\": \"none\"\n }\n },\n \"targets\": [\n {\n \"expr\": \"irate(elasticsearch_thread_pool_rejected_count{instance=\\\"$instance\\\",cluster=\\\"$cluster\\\",name=~\\\"$name\\\"}[5m])\",\n \"legend\": \"{{name}}: {{ type }}\",\n \"refId\": \"A\"\n }\n ],\n \"type\": \"timeseries\",\n \"version\": \"2.0.0\"\n },\n {\n \"custom\": {\n \"drawStyle\": \"lines\",\n \"fillOpacity\": 0.3,\n \"gradientMode\": \"opacity\",\n \"lineInterpolation\": \"smooth\",\n \"lineWidth\": 2,\n \"stack\": \"off\"\n },\n \"datasourceCate\": \"prometheus\",\n \"datasourceValue\": \"${prom}\",\n \"description\": \"活跃线程数\",\n \"id\": \"1053fab0-f105-4a6b-9508-dc87c4f78956\",\n \"layout\": {\n \"h\": 7,\n \"i\": \"1053fab0-f105-4a6b-9508-dc87c4f78956\",\n \"w\": 6,\n \"x\": 6,\n \"y\": 79\n },\n \"name\": \"Thread Pool threads active\",\n \"options\": {\n \"legend\": {\n \"displayMode\": \"hidden\"\n },\n \"standardOptions\": {},\n \"thresholds\": {},\n \"tooltip\": {\n \"mode\": \"all\",\n \"sort\": \"none\"\n }\n },\n \"targets\": [\n {\n \"expr\": \"elasticsearch_thread_pool_active_count{instance=\\\"$instance\\\",cluster=\\\"$cluster\\\",name=~\\\"$name\\\"}\",\n \"legend\": \"{{name}}: {{ type }}\",\n \"refId\": \"A\"\n }\n ],\n \"type\": \"timeseries\",\n \"version\": \"2.0.0\"\n },\n {\n \"custom\": {\n \"drawStyle\": \"lines\",\n \"fillOpacity\": 0.3,\n \"gradientMode\": \"opacity\",\n \"lineInterpolation\": \"smooth\",\n \"lineWidth\": 2,\n \"stack\": \"off\"\n },\n \"datasourceCate\": \"prometheus\",\n \"datasourceValue\": \"${prom}\",\n \"description\": \"排队等待线程任务数量\",\n \"id\": \"aad51280-5725-4485-841d-c08f0277508f\",\n \"layout\": {\n \"h\": 7,\n \"i\": \"aad51280-5725-4485-841d-c08f0277508f\",\n \"w\": 6,\n \"x\": 12,\n \"y\": 79\n },\n \"name\": \"Thread Pool threads queued\",\n \"options\": {\n \"legend\": {\n \"displayMode\": \"hidden\"\n },\n \"standardOptions\": {},\n \"thresholds\": {},\n \"tooltip\": {\n \"mode\": \"all\",\n \"sort\": \"none\"\n }\n },\n \"targets\": [\n {\n \"expr\": \"elasticsearch_thread_pool_queue_count{instance=\\\"$instance\\\",cluster=\\\"$cluster\\\",name=~\\\"$name\\\"}\",\n \"legend\": \"{{name}}: {{ type }}\",\n \"refId\": \"A\"\n }\n ],\n \"type\": \"timeseries\",\n \"version\": \"2.0.0\"\n },\n {\n \"custom\": {\n \"drawStyle\": \"lines\",\n \"fillOpacity\": 0.3,\n \"gradientMode\": \"opacity\",\n \"lineInterpolation\": \"smooth\",\n \"lineWidth\": 2,\n \"stack\": \"off\"\n },\n \"datasourceCate\": \"prometheus\",\n \"datasourceValue\": \"${prom}\",\n \"description\": \"线程池complete次数\",\n \"id\": \"76538cda-67f3-4040-b42e-be27078440e4\",\n \"layout\": {\n \"h\": 7,\n \"i\": \"76538cda-67f3-4040-b42e-be27078440e4\",\n \"w\": 6,\n \"x\": 18,\n \"y\": 79\n },\n \"name\": \"Thread Pool operations completed\",\n \"options\": {\n \"legend\": {\n \"displayMode\": \"hidden\"\n },\n \"standardOptions\": {},\n \"thresholds\": {},\n \"tooltip\": {\n \"mode\": \"all\",\n \"sort\": \"none\"\n }\n },\n \"targets\": [\n {\n \"expr\": \"irate(elasticsearch_thread_pool_completed_count{instance=\\\"$instance\\\",cluster=\\\"$cluster\\\",name=~\\\"$name\\\"}[5m])\",\n \"legend\": \"{{name}}: {{ type }}\",\n \"refId\": \"A\"\n }\n ],\n \"type\": \"timeseries\",\n \"version\": \"2.0.0\"\n },\n {\n \"collapsed\": true,\n \"id\": \"2f6f4c26-2203-4f94-a105-a166f35608da\",\n \"layout\": {\n \"h\": 1,\n \"i\": \"2f6f4c26-2203-4f94-a105-a166f35608da\",\n \"w\": 24,\n \"x\": 0,\n \"y\": 86\n },\n \"name\": \"Caches\",\n \"type\": \"row\"\n },\n {\n \"custom\": {\n \"drawStyle\": \"lines\",\n \"fillOpacity\": 0.3,\n \"gradientMode\": \"opacity\",\n \"lineInterpolation\": \"smooth\",\n \"lineWidth\": 2,\n \"stack\": \"off\"\n },\n \"datasourceCate\": \"prometheus\",\n \"datasourceValue\": \"${prom}\",\n \"description\": \"fielddata cache内存占用(byte)\",\n \"id\": \"100f8d6d-073b-46f4-a664-db11e889a111\",\n \"layout\": {\n \"h\": 7,\n \"i\": \"100f8d6d-073b-46f4-a664-db11e889a111\",\n \"w\": 12,\n \"x\": 0,\n \"y\": 87\n },\n \"name\": \"Field data memory size\",\n \"options\": {\n \"legend\": {\n \"displayMode\": \"hidden\"\n },\n \"standardOptions\": {\n \"util\": \"bytesIEC\"\n },\n \"thresholds\": {},\n \"tooltip\": {\n \"mode\": \"all\",\n \"sort\": \"none\"\n }\n },\n \"targets\": [\n {\n \"expr\": \"elasticsearch_indices_fielddata_memory_size_bytes{instance=\\\"$instance\\\",cluster=\\\"$cluster\\\",name=~\\\"$name\\\"}\",\n \"legend\": \"{{name}}\",\n \"refId\": \"A\"\n }\n ],\n \"type\": \"timeseries\",\n \"version\": \"2.0.0\"\n },\n {\n \"custom\": {\n \"drawStyle\": \"lines\",\n \"fillOpacity\": 0.3,\n \"gradientMode\": \"opacity\",\n \"lineInterpolation\": \"smooth\",\n \"lineWidth\": 2,\n \"stack\": \"off\"\n },\n \"datasourceCate\": \"prometheus\",\n \"datasourceValue\": \"${prom}\",\n \"description\": \"fielddata cache平均每秒内存剔除次数\",\n \"id\": \"4af09644-306e-404d-a1a0-174397b26c4e\",\n \"layout\": {\n \"h\": 7,\n \"i\": \"4af09644-306e-404d-a1a0-174397b26c4e\",\n \"w\": 12,\n \"x\": 12,\n \"y\": 87\n },\n \"name\": \"Field data evictions\",\n \"options\": {\n \"legend\": {\n \"displayMode\": \"hidden\"\n },\n \"standardOptions\": {\n \"util\": \"none\"\n },\n \"thresholds\": {},\n \"tooltip\": {\n \"mode\": \"all\",\n \"sort\": \"none\"\n }\n },\n \"targets\": [\n {\n \"expr\": \"rate(elasticsearch_indices_fielddata_evictions{instance=\\\"$instance\\\",cluster=\\\"$cluster\\\",name=~\\\"$name\\\"}[5m])\",\n \"legend\": \"{{name}}\",\n \"refId\": \"A\"\n }\n ],\n \"type\": \"timeseries\",\n \"version\": \"2.0.0\"\n },\n {\n \"custom\": {\n \"drawStyle\": \"lines\",\n \"fillOpacity\": 0.3,\n \"gradientMode\": \"opacity\",\n \"lineInterpolation\": \"smooth\",\n \"lineWidth\": 2,\n \"stack\": \"off\"\n },\n \"datasourceCate\": \"prometheus\",\n \"datasourceValue\": \"${prom}\",\n \"description\": \"query cache内存占用(byte)\",\n \"id\": \"e9632f58-8186-43bf-81b1-c57e91078e35\",\n \"layout\": {\n \"h\": 7,\n \"i\": \"e9632f58-8186-43bf-81b1-c57e91078e35\",\n \"w\": 8,\n \"x\": 0,\n \"y\": 89\n },\n \"name\": \"Query cache size\",\n \"options\": {\n \"legend\": {\n \"displayMode\": \"hidden\"\n },\n \"standardOptions\": {\n \"util\": \"bytesIEC\"\n },\n \"thresholds\": {},\n \"tooltip\": {\n \"mode\": \"all\",\n \"sort\": \"none\"\n }\n },\n \"targets\": [\n {\n \"expr\": \"elasticsearch_indices_query_cache_memory_size_bytes{instance=\\\"$instance\\\",cluster=\\\"$cluster\\\",name=~\\\"$name\\\"}\",\n \"legend\": \"{{name}}\",\n \"refId\": \"A\"\n }\n ],\n \"type\": \"timeseries\",\n \"version\": \"2.0.0\"\n },\n {\n \"custom\": {\n \"drawStyle\": \"lines\",\n \"fillOpacity\": 0.3,\n \"gradientMode\": \"opacity\",\n \"lineInterpolation\": \"smooth\",\n \"lineWidth\": 2,\n \"stack\": \"off\"\n },\n \"datasourceCate\": \"prometheus\",\n \"datasourceValue\": \"${prom}\",\n \"description\": \"query cache平均每秒内存剔除次数\",\n \"id\": \"e1145b0d-b839-4189-bd02-d955ae3dbcf3\",\n \"layout\": {\n \"h\": 7,\n \"i\": \"e1145b0d-b839-4189-bd02-d955ae3dbcf3\",\n \"w\": 8,\n \"x\": 8,\n \"y\": 89\n },\n \"name\": \"Query cache evictions\",\n \"options\": {\n \"legend\": {\n \"displayMode\": \"hidden\"\n },\n \"standardOptions\": {\n \"util\": \"none\"\n },\n \"thresholds\": {},\n \"tooltip\": {\n \"mode\": \"all\",\n \"sort\": \"none\"\n }\n },\n \"targets\": [\n {\n \"expr\": \"rate(elasticsearch_indices_query_cache_evictions{instance=\\\"$instance\\\",cluster=\\\"$cluster\\\",name=~\\\"$name\\\"}[5m])\",\n \"legend\": \"{{name}}\",\n \"refId\": \"A\"\n }\n ],\n \"type\": \"timeseries\",\n \"version\": \"2.0.0\"\n },\n {\n \"custom\": {\n \"drawStyle\": \"lines\",\n \"fillOpacity\": 0.3,\n \"gradientMode\": \"opacity\",\n \"lineInterpolation\": \"smooth\",\n \"lineWidth\": 2,\n \"stack\": \"off\"\n },\n \"datasourceCate\": \"prometheus\",\n \"datasourceValue\": \"${prom}\",\n \"description\": \"老版本的filter cache内存剔除次数\",\n \"id\": \"14ce9ebf-5ff7-42da-9628-8746e18fe32b\",\n \"layout\": {\n \"h\": 7,\n \"i\": \"14ce9ebf-5ff7-42da-9628-8746e18fe32b\",\n \"w\": 8,\n \"x\": 16,\n \"y\": 89\n },\n \"name\": \"Evictions from filter cache\",\n \"options\": {\n \"legend\": {\n \"displayMode\": \"hidden\"\n },\n \"standardOptions\": {\n \"util\": \"none\"\n },\n \"thresholds\": {},\n \"tooltip\": {\n \"mode\": \"all\",\n \"sort\": \"none\"\n }\n },\n \"targets\": [\n {\n \"expr\": \"rate(elasticsearch_indices_filter_cache_evictions{instance=\\\"$instance\\\",cluster=\\\"$cluster\\\",name=~\\\"$name\\\"}[5m])\",\n \"legend\": \"{{name}}\",\n \"refId\": \"A\"\n }\n ],\n \"type\": \"timeseries\",\n \"version\": \"2.0.0\"\n },\n {\n \"collapsed\": true,\n \"id\": \"f645ba3f-d2eb-4335-a2ff-56037184c779\",\n \"layout\": {\n \"h\": 1,\n \"i\": \"f645ba3f-d2eb-4335-a2ff-56037184c779\",\n \"w\": 24,\n \"x\": 0,\n \"y\": 96\n },\n \"name\": \"Segments\",\n \"type\": \"row\"\n },\n {\n \"custom\": {\n \"drawStyle\": \"lines\",\n \"fillOpacity\": 0.3,\n \"gradientMode\": \"opacity\",\n \"lineInterpolation\": \"smooth\",\n \"lineWidth\": 2,\n \"stack\": \"off\"\n },\n \"datasourceCate\": \"prometheus\",\n \"datasourceValue\": \"${prom}\",\n \"description\": \"segment个数\",\n \"id\": \"7f3f74ca-a8ca-4d07-b17a-72bb198f9726\",\n \"layout\": {\n \"h\": 7,\n \"i\": \"7f3f74ca-a8ca-4d07-b17a-72bb198f9726\",\n \"w\": 12,\n \"x\": 0,\n \"y\": 97\n },\n \"name\": \"Count of index segments\",\n \"options\": {\n \"legend\": {\n \"displayMode\": \"hidden\"\n },\n \"standardOptions\": {},\n \"thresholds\": {},\n \"tooltip\": {\n \"mode\": \"all\",\n \"sort\": \"none\"\n }\n },\n \"targets\": [\n {\n \"expr\": \"elasticsearch_indices_segments_count{instance=\\\"$instance\\\",cluster=\\\"$cluster\\\",name=~\\\"$name\\\"}\",\n \"legend\": \"{{name}}\",\n \"refId\": \"A\"\n }\n ],\n \"type\": \"timeseries\",\n \"version\": \"2.0.0\"\n },\n {\n \"custom\": {\n \"drawStyle\": \"lines\",\n \"fillOpacity\": 0.3,\n \"gradientMode\": \"opacity\",\n \"lineInterpolation\": \"smooth\",\n \"lineWidth\": 2,\n \"stack\": \"off\"\n },\n \"datasourceCate\": \"prometheus\",\n \"datasourceValue\": \"${prom}\",\n \"description\": \"segment内存占用(byte)\",\n \"id\": \"0d2bbc28-2211-4097-acbc-e1f72b3cad88\",\n \"layout\": {\n \"h\": 7,\n \"i\": \"0d2bbc28-2211-4097-acbc-e1f72b3cad88\",\n \"w\": 12,\n \"x\": 12,\n \"y\": 97\n },\n \"name\": \"Current memory size of segments in bytes\",\n \"options\": {\n \"legend\": {\n \"displayMode\": \"hidden\"\n },\n \"standardOptions\": {\n \"util\": \"bytesIEC\"\n },\n \"thresholds\": {},\n \"tooltip\": {\n \"mode\": \"all\",\n \"sort\": \"none\"\n }\n },\n \"targets\": [\n {\n \"expr\": \"elasticsearch_indices_segments_memory_bytes{instance=\\\"$instance\\\",cluster=\\\"$cluster\\\",name=~\\\"$name\\\"}\",\n \"legend\": \"{{name}}\",\n \"refId\": \"A\"\n }\n ],\n \"type\": \"timeseries\",\n \"version\": \"2.0.0\"\n },\n {\n \"collapsed\": true,\n \"id\": \"6e28b8b4-dc24-45fb-9d60-351f08716296\",\n \"layout\": {\n \"h\": 1,\n \"i\": \"6e28b8b4-dc24-45fb-9d60-351f08716296\",\n \"w\": 24,\n \"x\": 0,\n \"y\": 104\n },\n \"name\": \"Indices: Count of documents and Total size\",\n \"type\": \"row\"\n },\n {\n \"custom\": {\n \"drawStyle\": \"lines\",\n \"fillOpacity\": 0.3,\n \"gradientMode\": \"opacity\",\n \"lineInterpolation\": \"smooth\",\n \"lineWidth\": 2,\n \"stack\": \"off\"\n },\n \"datasourceCate\": \"prometheus\",\n \"datasourceValue\": \"${prom}\",\n \"description\": \"主分片文档数\",\n \"id\": \"8620f336-4e26-40db-8c85-6a336a5fb7c9\",\n \"layout\": {\n \"h\": 7,\n \"i\": \"8620f336-4e26-40db-8c85-6a336a5fb7c9\",\n \"w\": 24,\n \"x\": 0,\n \"y\": 105\n },\n \"name\": \"Count of documents with only primary shards\",\n \"options\": {\n \"legend\": {\n \"displayMode\": \"hidden\"\n },\n \"standardOptions\": {},\n \"thresholds\": {},\n \"tooltip\": {\n \"mode\": \"all\",\n \"sort\": \"none\"\n }\n },\n \"targets\": [\n {\n \"expr\": \"elasticsearch_indices_docs_primary{instance=~\\\"$instance\\\"}\",\n \"legend\": \"{{index}}\",\n \"refId\": \"A\"\n }\n ],\n \"type\": \"timeseries\",\n \"version\": \"2.0.0\"\n },\n {\n \"custom\": {\n \"drawStyle\": \"lines\",\n \"fillOpacity\": 0.3,\n \"gradientMode\": \"opacity\",\n \"lineInterpolation\": \"smooth\",\n \"lineWidth\": 2,\n \"stack\": \"off\"\n },\n \"datasourceCate\": \"prometheus\",\n \"datasourceValue\": \"${prom}\",\n \"description\": \"主分片索引容量(byte)\",\n \"id\": \"d4541f1a-136f-4b3e-b5e9-8cc92267aa8a\",\n \"layout\": {\n \"h\": 7,\n \"i\": \"d4541f1a-136f-4b3e-b5e9-8cc92267aa8a\",\n \"w\": 24,\n \"x\": 0,\n \"y\": 107\n },\n \"name\": \"Total size of stored index data in bytes with only primary shards on all nodes\",\n \"options\": {\n \"legend\": {\n \"displayMode\": \"hidden\"\n },\n \"standardOptions\": {\n \"util\": \"bytesIEC\"\n },\n \"thresholds\": {},\n \"tooltip\": {\n \"mode\": \"all\",\n \"sort\": \"none\"\n }\n },\n \"targets\": [\n {\n \"expr\": \"elasticsearch_indices_store_size_bytes_primary{instance=~\\\"$instance\\\"}\",\n \"legend\": \"{{index}}\",\n \"refId\": \"A\"\n }\n ],\n \"type\": \"timeseries\",\n \"version\": \"2.0.0\"\n },\n {\n \"custom\": {\n \"drawStyle\": \"lines\",\n \"fillOpacity\": 0.3,\n \"gradientMode\": \"opacity\",\n \"lineInterpolation\": \"smooth\",\n \"lineWidth\": 2,\n \"stack\": \"off\"\n },\n \"datasourceCate\": \"prometheus\",\n \"datasourceValue\": \"${prom}\",\n \"description\": \"所有分片索引容量(byte)\",\n \"id\": \"66926f5a-d562-428e-b48b-d69b4d705b8f\",\n \"layout\": {\n \"h\": 7,\n \"i\": \"66926f5a-d562-428e-b48b-d69b4d705b8f\",\n \"w\": 24,\n \"x\": 0,\n \"y\": 109\n },\n \"name\": \"Total size of stored index data in bytes with all shards on all nodes\",\n \"options\": {\n \"legend\": {\n \"displayMode\": \"hidden\"\n },\n \"standardOptions\": {\n \"util\": \"bytesIEC\"\n },\n \"thresholds\": {},\n \"tooltip\": {\n \"mode\": \"all\",\n \"sort\": \"none\"\n }\n },\n \"targets\": [\n {\n \"expr\": \"elasticsearch_indices_store_size_bytes_total{instance=~\\\"$instance\\\"}\",\n \"legend\": \"{{index}}\",\n \"refId\": \"A\"\n }\n ],\n \"type\": \"timeseries\",\n \"version\": \"2.0.0\"\n },\n {\n \"collapsed\": true,\n \"id\": \"c92992cf-3b56-4472-9278-9103b8fe55b7\",\n \"layout\": {\n \"h\": 1,\n \"i\": \"c92992cf-3b56-4472-9278-9103b8fe55b7\",\n \"w\": 24,\n \"x\": 0,\n \"y\": 116\n },\n \"name\": \"Indices: Index writer\",\n \"type\": \"row\"\n },\n {\n \"custom\": {\n \"drawStyle\": \"lines\",\n \"fillOpacity\": 0.3,\n \"gradientMode\": \"opacity\",\n \"lineInterpolation\": \"smooth\",\n \"lineWidth\": 2,\n \"stack\": \"off\"\n },\n \"datasourceCate\": \"prometheus\",\n \"datasourceValue\": \"${prom}\",\n \"description\": \"主分片索引写入数据量(byte)\",\n \"id\": \"7837ae60-c490-4e8a-a604-133cdeb5a3e7\",\n \"layout\": {\n \"h\": 7,\n \"i\": \"7837ae60-c490-4e8a-a604-133cdeb5a3e7\",\n \"w\": 24,\n \"x\": 0,\n \"y\": 117\n },\n \"name\": \"Index writer with only primary shards on all nodes in bytes\",\n \"options\": {\n \"legend\": {\n \"displayMode\": \"hidden\"\n },\n \"standardOptions\": {\n \"util\": \"bytesIEC\"\n },\n \"thresholds\": {},\n \"tooltip\": {\n \"mode\": \"all\",\n \"sort\": \"none\"\n }\n },\n \"targets\": [\n {\n \"expr\": \"elasticsearch_indices_segment_index_writer_memory_bytes_primary{instance=~\\\"$instance\\\"}\",\n \"legend\": \"{{index}}\",\n \"refId\": \"A\"\n }\n ],\n \"type\": \"timeseries\",\n \"version\": \"2.0.0\"\n },\n {\n \"custom\": {\n \"drawStyle\": \"lines\",\n \"fillOpacity\": 0.3,\n \"gradientMode\": \"opacity\",\n \"lineInterpolation\": \"smooth\",\n \"lineWidth\": 2,\n \"stack\": \"off\"\n },\n \"datasourceCate\": \"prometheus\",\n \"datasourceValue\": \"${prom}\",\n \"description\": \"所有分片索引写入数据量(byte)\",\n \"id\": \"8f200ba5-8c9b-4a26-b7b3-307cdb504316\",\n \"layout\": {\n \"h\": 7,\n \"i\": \"8f200ba5-8c9b-4a26-b7b3-307cdb504316\",\n \"w\": 24,\n \"x\": 0,\n \"y\": 119\n },\n \"name\": \"Index writer with all shards on all nodes in bytes\",\n \"options\": {\n \"legend\": {\n \"displayMode\": \"hidden\"\n },\n \"standardOptions\": {\n \"util\": \"bytesIEC\"\n },\n \"thresholds\": {},\n \"tooltip\": {\n \"mode\": \"all\",\n \"sort\": \"none\"\n }\n },\n \"targets\": [\n {\n \"expr\": \"elasticsearch_indices_segment_index_writer_memory_bytes_total{instance=~\\\"$instance\\\"}\",\n \"legend\": \"{{index}}\",\n \"refId\": \"A\"\n }\n ],\n \"type\": \"timeseries\",\n \"version\": \"2.0.0\"\n },\n {\n \"collapsed\": true,\n \"id\": \"fb8887c4-c0a4-44c1-83da-f077fa0feb9d\",\n \"layout\": {\n \"h\": 1,\n \"i\": \"fb8887c4-c0a4-44c1-83da-f077fa0feb9d\",\n \"w\": 24,\n \"x\": 0,\n \"y\": 126\n },\n \"name\": \"Indices: Segments\",\n \"type\": \"row\"\n },\n {\n \"custom\": {\n \"drawStyle\": \"lines\",\n \"fillOpacity\": 0.3,\n \"gradientMode\": \"opacity\",\n \"lineInterpolation\": \"smooth\",\n \"lineWidth\": 2,\n \"stack\": \"off\"\n },\n \"datasourceCate\": \"prometheus\",\n \"datasourceValue\": \"${prom}\",\n \"description\": \"主分片segment数\",\n \"id\": \"d20fb2f9-0e51-4bd1-a580-1308349e0b71\",\n \"layout\": {\n \"h\": 7,\n \"i\": \"d20fb2f9-0e51-4bd1-a580-1308349e0b71\",\n \"w\": 24,\n \"x\": 0,\n \"y\": 127\n },\n \"name\": \"Segments with only primary shards on all nodes\",\n \"options\": {\n \"legend\": {\n \"displayMode\": \"hidden\"\n },\n \"standardOptions\": {},\n \"thresholds\": {},\n \"tooltip\": {\n \"mode\": \"all\",\n \"sort\": \"none\"\n }\n },\n \"targets\": [\n {\n \"expr\": \"elasticsearch_indices_segment_count_primary{instance=~\\\"$instance\\\"}\",\n \"legend\": \"{{index}}\",\n \"refId\": \"A\"\n }\n ],\n \"type\": \"timeseries\",\n \"version\": \"2.0.0\"\n },\n {\n \"custom\": {\n \"drawStyle\": \"lines\",\n \"fillOpacity\": 0.3,\n \"gradientMode\": \"opacity\",\n \"lineInterpolation\": \"smooth\",\n \"lineWidth\": 2,\n \"stack\": \"off\"\n },\n \"datasourceCate\": \"prometheus\",\n \"datasourceValue\": \"${prom}\",\n \"description\": \"所有分片segment总数\",\n \"id\": \"b8f5151d-d7d9-4cf2-822e-56ce5b0f58b2\",\n \"layout\": {\n \"h\": 7,\n \"i\": \"b8f5151d-d7d9-4cf2-822e-56ce5b0f58b2\",\n \"w\": 24,\n \"x\": 0,\n \"y\": 129\n },\n \"name\": \"Segments with all shards on all nodes\",\n \"options\": {\n \"legend\": {\n \"displayMode\": \"hidden\"\n },\n \"standardOptions\": {},\n \"thresholds\": {},\n \"tooltip\": {\n \"mode\": \"all\",\n \"sort\": \"none\"\n }\n },\n \"targets\": [\n {\n \"expr\": \"elasticsearch_indices_segment_count_total{instance=~\\\"$instance\\\"}\",\n \"legend\": \"{{index}}\",\n \"refId\": \"A\"\n }\n ],\n \"type\": \"timeseries\",\n \"version\": \"2.0.0\"\n },\n {\n \"custom\": {\n \"drawStyle\": \"lines\",\n \"fillOpacity\": 0.3,\n \"gradientMode\": \"opacity\",\n \"lineInterpolation\": \"smooth\",\n \"lineWidth\": 2,\n \"stack\": \"off\"\n },\n \"datasourceCate\": \"prometheus\",\n \"datasourceValue\": \"${prom}\",\n \"description\": \"主分片segment容量\",\n \"id\": \"c6c1eee0-4c93-462e-8c53-f369fee48e46\",\n \"layout\": {\n \"h\": 7,\n \"i\": \"c6c1eee0-4c93-462e-8c53-f369fee48e46\",\n \"w\": 24,\n \"x\": 0,\n \"y\": 131\n },\n \"name\": \"Size of segments with only primary shards on all nodes in bytes\",\n \"options\": {\n \"legend\": {\n \"displayMode\": \"hidden\"\n },\n \"standardOptions\": {\n \"util\": \"bytesIEC\"\n },\n \"thresholds\": {},\n \"tooltip\": {\n \"mode\": \"all\",\n \"sort\": \"none\"\n }\n },\n \"targets\": [\n {\n \"expr\": \"elasticsearch_indices_segment_memory_bytes_primary{instance=~\\\"$instance\\\"}\",\n \"legend\": \"{{index}}\",\n \"refId\": \"A\"\n }\n ],\n \"type\": \"timeseries\",\n \"version\": \"2.0.0\"\n },\n {\n \"custom\": {\n \"drawStyle\": \"lines\",\n \"fillOpacity\": 0.3,\n \"gradientMode\": \"opacity\",\n \"lineInterpolation\": \"smooth\",\n \"lineWidth\": 2,\n \"stack\": \"off\"\n },\n \"datasourceCate\": \"prometheus\",\n \"datasourceValue\": \"${prom}\",\n \"description\": \"所有分片segment容量\",\n \"id\": \"d9b36d80-c753-4bde-8e6d-29af8c5a7e83\",\n \"layout\": {\n \"h\": 7,\n \"i\": \"d9b36d80-c753-4bde-8e6d-29af8c5a7e83\",\n \"w\": 24,\n \"x\": 0,\n \"y\": 133\n },\n \"name\": \"Size of segments with all shards on all nodes in bytes\",\n \"options\": {\n \"legend\": {\n \"displayMode\": \"hidden\"\n },\n \"standardOptions\": {\n \"util\": \"bytesIEC\"\n },\n \"thresholds\": {},\n \"tooltip\": {\n \"mode\": \"all\",\n \"sort\": \"none\"\n }\n },\n \"targets\": [\n {\n \"expr\": \"elasticsearch_indices_segment_memory_bytes_total{instance=~\\\"$instance\\\"}\",\n \"legend\": \"{{index}}\",\n \"refId\": \"A\"\n }\n ],\n \"type\": \"timeseries\",\n \"version\": \"2.0.0\"\n },\n {\n \"collapsed\": true,\n \"id\": \"abf4df7c-975a-493e-8951-be33c7d3ec6b\",\n \"layout\": {\n \"h\": 1,\n \"i\": \"abf4df7c-975a-493e-8951-be33c7d3ec6b\",\n \"w\": 24,\n \"x\": 0,\n \"y\": 140\n },\n \"name\": \"Indices: Doc values\",\n \"type\": \"row\"\n },\n {\n \"custom\": {\n \"drawStyle\": \"lines\",\n \"fillOpacity\": 0.3,\n \"gradientMode\": \"opacity\",\n \"lineInterpolation\": \"smooth\",\n \"lineWidth\": 2,\n \"stack\": \"off\"\n },\n \"datasourceCate\": \"prometheus\",\n \"datasourceValue\": \"${prom}\",\n \"description\": \"主分片doc value内存占用(byte)\",\n \"id\": \"205f362a-ad57-4cb8-ac3f-7afdb5dc87d6\",\n \"layout\": {\n \"h\": 7,\n \"i\": \"205f362a-ad57-4cb8-ac3f-7afdb5dc87d6\",\n \"w\": 24,\n \"x\": 0,\n \"y\": 141\n },\n \"name\": \"Doc values with only primary shards on all nodes in bytes\",\n \"options\": {\n \"legend\": {\n \"displayMode\": \"hidden\"\n },\n \"standardOptions\": {\n \"util\": \"bytesIEC\"\n },\n \"thresholds\": {},\n \"tooltip\": {\n \"mode\": \"all\",\n \"sort\": \"none\"\n }\n },\n \"targets\": [\n {\n \"expr\": \"elasticsearch_indices_segment_doc_values_memory_bytes_primary{instance=~\\\"$instance\\\"}\",\n \"legend\": \"{{index}}\",\n \"refId\": \"A\"\n }\n ],\n \"type\": \"timeseries\",\n \"version\": \"2.0.0\"\n },\n {\n \"custom\": {\n \"drawStyle\": \"lines\",\n \"fillOpacity\": 0.3,\n \"gradientMode\": \"opacity\",\n \"lineInterpolation\": \"smooth\",\n \"lineWidth\": 2,\n \"stack\": \"off\"\n },\n \"datasourceCate\": \"prometheus\",\n \"datasourceValue\": \"${prom}\",\n \"description\": \"所有分片doc value内存占用(byte)\",\n \"id\": \"ea838448-825c-4627-a09d-19db6c1e4a14\",\n \"layout\": {\n \"h\": 7,\n \"i\": \"ea838448-825c-4627-a09d-19db6c1e4a14\",\n \"w\": 24,\n \"x\": 0,\n \"y\": 143\n },\n \"name\": \"Doc values with all shards on all nodes in bytes\",\n \"options\": {\n \"legend\": {\n \"displayMode\": \"hidden\"\n },\n \"standardOptions\": {\n \"util\": \"bytesIEC\"\n },\n \"thresholds\": {},\n \"tooltip\": {\n \"mode\": \"all\",\n \"sort\": \"none\"\n }\n },\n \"targets\": [\n {\n \"expr\": \"elasticsearch_indices_segment_doc_values_memory_bytes_total{instance=~\\\"$instance\\\"}\",\n \"legend\": \"{{index}}\",\n \"refId\": \"A\"\n }\n ],\n \"type\": \"timeseries\",\n \"version\": \"2.0.0\"\n },\n {\n \"collapsed\": true,\n \"id\": \"43768cea-7ee8-430a-9aa3-e8c38817de55\",\n \"layout\": {\n \"h\": 1,\n \"i\": \"43768cea-7ee8-430a-9aa3-e8c38817de55\",\n \"w\": 24,\n \"x\": 0,\n \"y\": 150\n },\n \"name\": \"Indices: Fields\",\n \"type\": \"row\"\n },\n {\n \"custom\": {\n \"drawStyle\": \"lines\",\n \"fillOpacity\": 0.3,\n \"gradientMode\": \"opacity\",\n \"lineInterpolation\": \"smooth\",\n \"lineWidth\": 2,\n \"stack\": \"off\"\n },\n \"datasourceCate\": \"prometheus\",\n \"datasourceValue\": \"${prom}\",\n \"description\": \"分片field内存占用(byte)\",\n \"id\": \"6f8efb01-aac1-427c-bf7b-d6b90a968185\",\n \"layout\": {\n \"h\": 7,\n \"i\": \"6f8efb01-aac1-427c-bf7b-d6b90a968185\",\n \"w\": 24,\n \"x\": 0,\n \"y\": 151\n },\n \"name\": \"Size of fields with only primary shards on all nodes in bytes\",\n \"options\": {\n \"legend\": {\n \"displayMode\": \"hidden\"\n },\n \"standardOptions\": {\n \"util\": \"bytesIEC\"\n },\n \"thresholds\": {},\n \"tooltip\": {\n \"mode\": \"all\",\n \"sort\": \"none\"\n }\n },\n \"targets\": [\n {\n \"expr\": \"elasticsearch_indices_segment_fields_memory_bytes_primary{instance=~\\\"$instance\\\"}\",\n \"legend\": \"{{index}}\",\n \"refId\": \"A\"\n }\n ],\n \"type\": \"timeseries\",\n \"version\": \"2.0.0\"\n },\n {\n \"custom\": {\n \"drawStyle\": \"lines\",\n \"fillOpacity\": 0.3,\n \"gradientMode\": \"opacity\",\n \"lineInterpolation\": \"smooth\",\n \"lineWidth\": 2,\n \"stack\": \"off\"\n },\n \"datasourceCate\": \"prometheus\",\n \"datasourceValue\": \"${prom}\",\n \"description\": \"所有分片field内存占用(byte)\",\n \"id\": \"b82b390b-8f72-427b-9d1f-37d279f94366\",\n \"layout\": {\n \"h\": 7,\n \"i\": \"b82b390b-8f72-427b-9d1f-37d279f94366\",\n \"w\": 24,\n \"x\": 0,\n \"y\": 153\n },\n \"name\": \"Size of fields with all shards on all nodes in bytes\",\n \"options\": {\n \"legend\": {\n \"displayMode\": \"hidden\"\n },\n \"standardOptions\": {\n \"util\": \"bytesIEC\"\n },\n \"thresholds\": {},\n \"tooltip\": {\n \"mode\": \"all\",\n \"sort\": \"none\"\n }\n },\n \"targets\": [\n {\n \"expr\": \"elasticsearch_indices_segment_fields_memory_bytes_total{instance=~\\\"$instance\\\"}\",\n \"legend\": \"{{index}}\",\n \"refId\": \"A\"\n }\n ],\n \"type\": \"timeseries\",\n \"version\": \"2.0.0\"\n },\n {\n \"collapsed\": true,\n \"id\": \"41285e05-696c-4a94-946f-f75021316665\",\n \"layout\": {\n \"h\": 1,\n \"i\": \"41285e05-696c-4a94-946f-f75021316665\",\n \"w\": 24,\n \"x\": 0,\n \"y\": 160\n },\n \"name\": \"Indices: Fixed bit\",\n \"type\": \"row\"\n },\n {\n \"custom\": {\n \"drawStyle\": \"lines\",\n \"fillOpacity\": 0.3,\n \"gradientMode\": \"opacity\",\n \"lineInterpolation\": \"smooth\",\n \"lineWidth\": 2,\n \"stack\": \"off\"\n },\n \"datasourceCate\": \"prometheus\",\n \"datasourceValue\": \"${prom}\",\n \"description\": \"主分片fixed bit set内存占用(byte)\",\n \"id\": \"707cfc5f-cdbe-43dc-9d1f-f79e306ca7ff\",\n \"layout\": {\n \"h\": 7,\n \"i\": \"707cfc5f-cdbe-43dc-9d1f-f79e306ca7ff\",\n \"w\": 24,\n \"x\": 0,\n \"y\": 161\n },\n \"name\": \"Size of fixed bit with only primary shards on all nodes in bytes\",\n \"options\": {\n \"legend\": {\n \"displayMode\": \"hidden\"\n },\n \"standardOptions\": {\n \"util\": \"bytesIEC\"\n },\n \"thresholds\": {},\n \"tooltip\": {\n \"mode\": \"all\",\n \"sort\": \"none\"\n }\n },\n \"targets\": [\n {\n \"expr\": \"elasticsearch_indices_segment_fixed_bit_set_memory_bytes_primary{instance=~\\\"$instance\\\"}\",\n \"legend\": \"{{index}}\",\n \"refId\": \"A\"\n }\n ],\n \"type\": \"timeseries\",\n \"version\": \"2.0.0\"\n },\n {\n \"custom\": {\n \"drawStyle\": \"lines\",\n \"fillOpacity\": 0.3,\n \"gradientMode\": \"opacity\",\n \"lineInterpolation\": \"smooth\",\n \"lineWidth\": 2,\n \"stack\": \"off\"\n },\n \"datasourceCate\": \"prometheus\",\n \"datasourceValue\": \"${prom}\",\n \"description\": \"所有分片fixed bit set内存占用(byte)\",\n \"id\": \"ee949fc8-2c50-4ca3-944f-b42030439968\",\n \"layout\": {\n \"h\": 7,\n \"i\": \"ee949fc8-2c50-4ca3-944f-b42030439968\",\n \"w\": 24,\n \"x\": 0,\n \"y\": 163\n },\n \"name\": \"Size of fixed bit with all shards on all nodes in bytes\",\n \"options\": {\n \"legend\": {\n \"displayMode\": \"hidden\"\n },\n \"standardOptions\": {\n \"util\": \"bytesIEC\"\n },\n \"thresholds\": {},\n \"tooltip\": {\n \"mode\": \"all\",\n \"sort\": \"none\"\n }\n },\n \"targets\": [\n {\n \"expr\": \"elasticsearch_indices_segment_fixed_bit_set_memory_bytes_total{instance=~\\\"$instance\\\"}\",\n \"legend\": \"{{index}}\",\n \"refId\": \"A\"\n }\n ],\n \"type\": \"timeseries\",\n \"version\": \"2.0.0\"\n },\n {\n \"collapsed\": true,\n \"id\": \"23141b77-a525-44b1-a3b8-9ff4a65af597\",\n \"layout\": {\n \"h\": 1,\n \"i\": \"23141b77-a525-44b1-a3b8-9ff4a65af597\",\n \"w\": 24,\n \"x\": 0,\n \"y\": 170\n },\n \"name\": \"Indices: Norms\",\n \"type\": \"row\"\n },\n {\n \"custom\": {\n \"drawStyle\": \"lines\",\n \"fillOpacity\": 0.3,\n \"gradientMode\": \"opacity\",\n \"lineInterpolation\": \"smooth\",\n \"lineWidth\": 2,\n \"stack\": \"off\"\n },\n \"datasourceCate\": \"prometheus\",\n \"datasourceValue\": \"${prom}\",\n \"description\": \"主分片normalization factor内存占用(byte)\",\n \"id\": \"167f10ca-179d-4dfd-ba1d-e2184be993be\",\n \"layout\": {\n \"h\": 7,\n \"i\": \"167f10ca-179d-4dfd-ba1d-e2184be993be\",\n \"w\": 24,\n \"x\": 0,\n \"y\": 171\n },\n \"name\": \"Size of norms with only primary shards on all nodes in bytes\",\n \"options\": {\n \"legend\": {\n \"displayMode\": \"hidden\"\n },\n \"standardOptions\": {},\n \"thresholds\": {},\n \"tooltip\": {\n \"mode\": \"all\",\n \"sort\": \"none\"\n }\n },\n \"targets\": [\n {\n \"expr\": \"elasticsearch_indices_segment_norms_memory_bytes_primary{instance=~\\\"$instance\\\"}\",\n \"legend\": \"{{index}}\",\n \"refId\": \"A\"\n }\n ],\n \"type\": \"timeseries\",\n \"version\": \"2.0.0\"\n },\n {\n \"custom\": {\n \"drawStyle\": \"lines\",\n \"fillOpacity\": 0.3,\n \"gradientMode\": \"opacity\",\n \"lineInterpolation\": \"smooth\",\n \"lineWidth\": 2,\n \"stack\": \"off\"\n },\n \"datasourceCate\": \"prometheus\",\n \"datasourceValue\": \"${prom}\",\n \"description\": \"所有分片normalization factor内存占用(byte)\",\n \"id\": \"41fba22d-bbb0-4cbd-a8cd-c7910991cecf\",\n \"layout\": {\n \"h\": 7,\n \"i\": \"41fba22d-bbb0-4cbd-a8cd-c7910991cecf\",\n \"w\": 24,\n \"x\": 0,\n \"y\": 173\n },\n \"name\": \"Size of norms with all shards on all nodes in bytes\",\n \"options\": {\n \"legend\": {\n \"displayMode\": \"hidden\"\n },\n \"standardOptions\": {},\n \"thresholds\": {},\n \"tooltip\": {\n \"mode\": \"all\",\n \"sort\": \"none\"\n }\n },\n \"targets\": [\n {\n \"expr\": \"elasticsearch_indices_segment_norms_memory_bytes_total{instance=~\\\"$instance\\\"}\",\n \"legend\": \"{{index}}\",\n \"refId\": \"A\"\n }\n ],\n \"type\": \"timeseries\",\n \"version\": \"2.0.0\"\n },\n {\n \"collapsed\": true,\n \"id\": \"1f40b15b-8f0e-4c57-a1fd-602242195863\",\n \"layout\": {\n \"h\": 1,\n \"i\": \"1f40b15b-8f0e-4c57-a1fd-602242195863\",\n \"w\": 24,\n \"x\": 0,\n \"y\": 180\n },\n \"name\": \"Indices: Points\",\n \"type\": \"row\"\n },\n {\n \"custom\": {\n \"drawStyle\": \"lines\",\n \"fillOpacity\": 0.3,\n \"gradientMode\": \"opacity\",\n \"lineInterpolation\": \"smooth\",\n \"lineWidth\": 2,\n \"stack\": \"off\"\n },\n \"datasourceCate\": \"prometheus\",\n \"datasourceValue\": \"${prom}\",\n \"description\": \"主分片point内存占用(byte)\",\n \"id\": \"24e451cb-3835-4172-926b-54a33aa3b9b4\",\n \"layout\": {\n \"h\": 7,\n \"i\": \"24e451cb-3835-4172-926b-54a33aa3b9b4\",\n \"w\": 24,\n \"x\": 0,\n \"y\": 181\n },\n \"name\": \"Size of points with only primary shards on all nodes in bytes\",\n \"options\": {\n \"legend\": {\n \"displayMode\": \"hidden\"\n },\n \"standardOptions\": {\n \"util\": \"bytesIEC\"\n },\n \"thresholds\": {},\n \"tooltip\": {\n \"mode\": \"all\",\n \"sort\": \"none\"\n }\n },\n \"targets\": [\n {\n \"expr\": \"elasticsearch_indices_segment_points_memory_bytes_primary{instance=~\\\"$instance\\\"}\",\n \"legend\": \"{{index}}\",\n \"refId\": \"A\"\n }\n ],\n \"type\": \"timeseries\",\n \"version\": \"2.0.0\"\n },\n {\n \"custom\": {\n \"drawStyle\": \"lines\",\n \"fillOpacity\": 0.3,\n \"gradientMode\": \"opacity\",\n \"lineInterpolation\": \"smooth\",\n \"lineWidth\": 2,\n \"stack\": \"off\"\n },\n \"datasourceCate\": \"prometheus\",\n \"datasourceValue\": \"${prom}\",\n \"description\": \"所有分片point内存占用(byte)\",\n \"id\": \"79665ebe-5804-4809-af68-15d3a72a2c2c\",\n \"layout\": {\n \"h\": 7,\n \"i\": \"79665ebe-5804-4809-af68-15d3a72a2c2c\",\n \"w\": 24,\n \"x\": 0,\n \"y\": 183\n },\n \"name\": \"Size of points with all shards on all nodes in bytes\",\n \"options\": {\n \"legend\": {\n \"displayMode\": \"hidden\"\n },\n \"standardOptions\": {\n \"util\": \"bytesIEC\"\n },\n \"thresholds\": {},\n \"tooltip\": {\n \"mode\": \"all\",\n \"sort\": \"none\"\n }\n },\n \"targets\": [\n {\n \"expr\": \"elasticsearch_indices_segment_points_memory_bytes_total{instance=~\\\"$instance\\\"}\",\n \"legend\": \"{{index}}\",\n \"refId\": \"A\"\n }\n ],\n \"type\": \"timeseries\",\n \"version\": \"2.0.0\"\n },\n {\n \"collapsed\": true,\n \"id\": \"a62b3a9f-f3ac-4c4e-9d20-bde6c9eb3372\",\n \"layout\": {\n \"h\": 1,\n \"i\": \"a62b3a9f-f3ac-4c4e-9d20-bde6c9eb3372\",\n \"w\": 24,\n \"x\": 0,\n \"y\": 190\n },\n \"name\": \"Indices: Terms\",\n \"type\": \"row\"\n },\n {\n \"custom\": {\n \"drawStyle\": \"lines\",\n \"fillOpacity\": 0.3,\n \"gradientMode\": \"opacity\",\n \"lineInterpolation\": \"smooth\",\n \"lineWidth\": 2,\n \"stack\": \"off\"\n },\n \"datasourceCate\": \"prometheus\",\n \"datasourceValue\": \"${prom}\",\n \"description\": \"主分片term内存占用(byte)\",\n \"id\": \"c464e467-a6cf-4d60-8108-fb0359c801d8\",\n \"layout\": {\n \"h\": 7,\n \"i\": \"c464e467-a6cf-4d60-8108-fb0359c801d8\",\n \"w\": 24,\n \"x\": 0,\n \"y\": 191\n },\n \"name\": \"Size of terms with only primary shards on all nodes in bytes\",\n \"options\": {\n \"legend\": {\n \"displayMode\": \"hidden\"\n },\n \"standardOptions\": {\n \"util\": \"bytesIEC\"\n },\n \"thresholds\": {},\n \"tooltip\": {\n \"mode\": \"all\",\n \"sort\": \"none\"\n }\n },\n \"targets\": [\n {\n \"expr\": \"elasticsearch_indices_segment_terms_memory_primary{instance=~\\\"$instance\\\"}\",\n \"legend\": \"{{index}}\",\n \"refId\": \"A\"\n }\n ],\n \"type\": \"timeseries\",\n \"version\": \"2.0.0\"\n },\n {\n \"custom\": {\n \"drawStyle\": \"lines\",\n \"fillOpacity\": 0.3,\n \"gradientMode\": \"opacity\",\n \"lineInterpolation\": \"smooth\",\n \"lineWidth\": 2,\n \"stack\": \"off\"\n },\n \"datasourceCate\": \"prometheus\",\n \"datasourceValue\": \"${prom}\",\n \"description\": \"所有分片term内存占用(byte)\",\n \"id\": \"b0befc26-33c8-44f3-aa3e-80a9ed99180a\",\n \"layout\": {\n \"h\": 7,\n \"i\": \"b0befc26-33c8-44f3-aa3e-80a9ed99180a\",\n \"w\": 24,\n \"x\": 0,\n \"y\": 193\n },\n \"name\": \"Number of terms with all shards on all nodes in bytes\",\n \"options\": {\n \"legend\": {\n \"displayMode\": \"hidden\"\n },\n \"standardOptions\": {\n \"util\": \"bytesIEC\"\n },\n \"thresholds\": {},\n \"tooltip\": {\n \"mode\": \"all\",\n \"sort\": \"none\"\n }\n },\n \"targets\": [\n {\n \"expr\": \"elasticsearch_indices_segment_terms_memory_total{instance=~\\\"$instance\\\"}\",\n \"legend\": \"{{index}}\",\n \"refId\": \"A\"\n }\n ],\n \"type\": \"timeseries\",\n \"version\": \"2.0.0\"\n },\n {\n \"collapsed\": true,\n \"id\": \"df60be90-b370-4995-93c6-b26ee8584e6f\",\n \"layout\": {\n \"h\": 1,\n \"i\": \"df60be90-b370-4995-93c6-b26ee8584e6f\",\n \"w\": 24,\n \"x\": 0,\n \"y\": 200\n },\n \"name\": \"Indices: Terms\",\n \"type\": \"row\"\n },\n {\n \"custom\": {\n \"drawStyle\": \"lines\",\n \"fillOpacity\": 0.3,\n \"gradientMode\": \"opacity\",\n \"lineInterpolation\": \"smooth\",\n \"lineWidth\": 2,\n \"stack\": \"off\"\n },\n \"datasourceCate\": \"prometheus\",\n \"datasourceValue\": \"${prom}\",\n \"description\": \"所有分片version map内存占用(byte)\",\n \"id\": \"a2778c3a-6473-4482-bade-398904922e2f\",\n \"layout\": {\n \"h\": 7,\n \"i\": \"a2778c3a-6473-4482-bade-398904922e2f\",\n \"w\": 24,\n \"x\": 0,\n \"y\": 201\n },\n \"name\": \"Size of version map with only primary shards on all nodes in bytes\",\n \"options\": {\n \"legend\": {\n \"displayMode\": \"hidden\"\n },\n \"standardOptions\": {\n \"util\": \"bytesIEC\"\n },\n \"thresholds\": {},\n \"tooltip\": {\n \"mode\": \"all\",\n \"sort\": \"none\"\n }\n },\n \"targets\": [\n {\n \"expr\": \"elasticsearch_indices_segment_version_map_memory_bytes_primary{instance=~\\\"$instance\\\"}\",\n \"legend\": \"{{index}}\",\n \"refId\": \"A\"\n }\n ],\n \"type\": \"timeseries\",\n \"version\": \"2.0.0\"\n },\n {\n \"custom\": {\n \"drawStyle\": \"lines\",\n \"fillOpacity\": 0.3,\n \"gradientMode\": \"opacity\",\n \"lineInterpolation\": \"smooth\",\n \"lineWidth\": 2,\n \"stack\": \"off\"\n },\n \"datasourceCate\": \"prometheus\",\n \"datasourceValue\": \"${prom}\",\n \"description\": \"所有分片version map内存占用(byte)\",\n \"id\": \"322b0c1b-982a-4654-8552-7f246f496480\",\n \"layout\": {\n \"h\": 7,\n \"i\": \"322b0c1b-982a-4654-8552-7f246f496480\",\n \"w\": 24,\n \"x\": 0,\n \"y\": 203\n },\n \"name\": \"Size of version map with all shards on all nodes in bytes\",\n \"options\": {\n \"legend\": {\n \"displayMode\": \"hidden\"\n },\n \"standardOptions\": {\n \"util\": \"bytesIEC\"\n },\n \"thresholds\": {},\n \"tooltip\": {\n \"mode\": \"all\",\n \"sort\": \"none\"\n }\n },\n \"targets\": [\n {\n \"expr\": \"elasticsearch_indices_segment_version_map_memory_bytes_total{instance=~\\\"$instance\\\"}\",\n \"legend\": \"{{index}}\",\n \"refId\": \"A\"\n }\n ],\n \"type\": \"timeseries\",\n \"version\": \"2.0.0\"\n }\n ],\n \"var\": [\n {\n \"definition\": \"prometheus\",\n \"name\": \"prom\",\n \"type\": \"datasource\"\n },\n {\n \"datasource\": {\n \"cate\": \"prometheus\",\n \"value\": \"${prom}\"\n },\n \"definition\": \"label_values(elasticsearch_indices_docs,cluster)\",\n \"name\": \"cluster\",\n \"options\": [\n \"elasticsearch-cluster\"\n ],\n \"type\": \"query\"\n },\n {\n \"datasource\": {\n \"cate\": \"prometheus\",\n \"value\": \"${prom}\"\n },\n \"definition\": \"label_values(elasticsearch_indices_docs{cluster=\\\"$cluster\\\", name!=\\\"\\\"},instance)\",\n \"name\": \"instance\",\n \"options\": [\n \"10.206.0.7:9200\"\n ],\n \"type\": \"query\"\n },\n {\n \"allOption\": true,\n \"datasource\": {\n \"cate\": \"prometheus\",\n \"value\": \"${prom}\"\n },\n \"definition\": \"label_values(elasticsearch_indices_docs{instance=\\\"$instance\\\",cluster=\\\"$cluster\\\", name!=\\\"\\\"},name)\",\n \"multi\": true,\n \"name\": \"name\",\n \"options\": [\n \"node-2\",\n \"node-1\",\n \"node-3\"\n ],\n \"type\": \"query\"\n }\n ],\n \"version\": \"3.0.0\"\n },\n \"public\": 0,\n \"public_cate\": 0,\n \"bgids\": null,\n \"built_in\": 0,\n \"hide\": 0,\n \"uuid\": 1717556327380871000\n}"
},
{
"path": "integrations/Elasticsearch/markdown/README.md",
"content": "# elasticsearch plugin\n\nElasticSearch 通过 HTTP JSON 的方式暴露了自身的监控指标,通过 categraf 的 [elasticsearch](https://github.com/flashcatcloud/categraf/tree/main/inputs/elasticsearch) 插件抓取。\n\n如果是小规模集群,设置 `local=false`,从集群中某一个节点抓取数据,即可拿到整个集群所有节点的监控数据。如果是大规模集群,建议设置 `local=true`,在集群的每个节点上都部署抓取器,抓取本地 elasticsearch 进程的监控数据。\n\n\n## 配置示例\n\ncategraf 配置文件:`conf/input.elasticsearch/elasticsearch.toml`\n\n```yaml\n[[instances]]\nservers = [\"http://192.168.11.177:9200\"]\nhttp_timeout = \"10s\"\nlocal = false\ncluster_health = true\ncluster_health_level = \"cluster\"\ncluster_stats = true\nindices_level = \"\"\nnode_stats = [\"jvm\", \"breaker\", \"process\", \"os\", \"fs\", \"indices\", \"thread_pool\", \"transport\"]\nusername = \"elastic\"\npassword = \"xxxxxxxx\"\nnum_most_recent_indices = 1\nlabels = { service=\"es\" }\n```\n"
},
{
"path": "integrations/Elasticsearch/metrics/categraf-base.json",
"content": "[\n {\n \"id\": 0,\n \"uuid\": 1717556327385727000,\n \"collector\": \"Categraf\",\n \"typ\": \"Elasticsearch\",\n \"name\": \"Cluster Health delayed unassigned 的分片数\",\n \"unit\": \"sishort\",\n \"note\": \"\",\n \"lang\": \"zh_CN\",\n \"expression\": \"elasticsearch_cluster_health_delayed_unassigned_shards\",\n \"created_at\": 0,\n \"created_by\": \"\",\n \"updated_at\": 0,\n \"updated_by\": \"\",\n \"translation\": [\n {\n \"lang\": \"zh_CN\",\n \"name\": \"Cluster Health delayed unassigned 的分片数\",\n \"note\": \"\"\n },\n {\n \"lang\": \"en_US\",\n \"name\": \"Number of Cluster Health delayed unassigned shards\",\n \"note\": \"\"\n }\n ]\n },\n {\n \"id\": 0,\n \"uuid\": 1717556327389271000,\n \"collector\": \"Categraf\",\n \"typ\": \"Elasticsearch\",\n \"name\": \"Cluster Health Pending task 数量\",\n \"unit\": \"none\",\n \"note\": \"\",\n \"lang\": \"zh_CN\",\n \"expression\": \"elasticsearch_cluster_health_number_of_pending_tasks\",\n \"created_at\": 0,\n \"created_by\": \"\",\n \"updated_at\": 0,\n \"updated_by\": \"\",\n \"translation\": [\n {\n \"lang\": \"zh_CN\",\n \"name\": \"Cluster Health Pending task 数量\",\n \"note\": \"\"\n },\n {\n \"lang\": \"en_US\",\n \"name\": \"Cluster Health Pending tasks quantity\",\n \"note\": \"\"\n }\n ]\n },\n {\n \"id\": 0,\n \"uuid\": 1717556327391502000,\n \"collector\": \"Categraf\",\n \"typ\": \"Elasticsearch\",\n \"name\": \"Cluster Health relocating 的分片数\",\n \"unit\": \"sishort\",\n \"note\": \"\",\n \"lang\": \"zh_CN\",\n \"expression\": \"elasticsearch_cluster_health_relocating_shards\",\n \"created_at\": 0,\n \"created_by\": \"\",\n \"updated_at\": 0,\n \"updated_by\": \"\",\n \"translation\": [\n {\n \"lang\": \"zh_CN\",\n \"name\": \"Cluster Health relocating 的分片数\",\n \"note\": \"\"\n },\n {\n \"lang\": \"en_US\",\n \"name\": \"Number of shards for Cluster Health relocating\",\n \"note\": \"\"\n }\n ]\n },\n {\n \"id\": 0,\n \"uuid\": 1717556327393576000,\n \"collector\": \"Categraf\",\n \"typ\": \"Elasticsearch\",\n \"name\": \"Cluster Health unassigned 的分片数\",\n \"unit\": \"sishort\",\n \"note\": \"\",\n \"lang\": \"zh_CN\",\n \"expression\": \"elasticsearch_cluster_health_unassigned_shards\",\n \"created_at\": 0,\n \"created_by\": \"\",\n \"updated_at\": 0,\n \"updated_by\": \"\",\n \"translation\": [\n {\n \"lang\": \"zh_CN\",\n \"name\": \"Cluster Health unassigned 的分片数\",\n \"note\": \"\"\n },\n {\n \"lang\": \"en_US\",\n \"name\": \"Cluster Health unassigned number of shards\",\n \"note\": \"\"\n }\n ]\n },\n {\n \"id\": 0,\n \"uuid\": 1717556327396682000,\n \"collector\": \"Categraf\",\n \"typ\": \"Elasticsearch\",\n \"name\": \"Cluster Health 健康度状态码\",\n \"unit\": \"none\",\n \"note\": \"- 1:Green,绿色状态,表示所有分片都正常\\n- 2:Yellow,黄色状态,主分片都正常,从分片有不正常的\\n- 3:Red,红色状态,有些主分片不正常\",\n \"lang\": \"zh_CN\",\n \"expression\": \"elasticsearch_cluster_health_status_code\",\n \"created_at\": 0,\n \"created_by\": \"\",\n \"updated_at\": 0,\n \"updated_by\": \"\",\n \"translation\": [\n {\n \"lang\": \"zh_CN\",\n \"name\": \"Cluster Health 健康度状态码\",\n \"note\": \"- 1:Green,绿色状态,表示所有分片都正常\\n- 2:Yellow,黄色状态,主分片都正常,从分片有不正常的\\n- 3:Red,红色状态,有些主分片不正常\"\n },\n {\n \"lang\": \"en_US\",\n \"name\": \"Cluster Health health status code\",\n \"note\": \"-1: Green, Green state, indicating that all shards are normal \\n-2: Yellow, Yellow state, the main shard is normal, the slave shard is abnormal \\n-3: Red, Red state, some main shards are abnormal\"\n }\n ]\n },\n {\n \"id\": 0,\n \"uuid\": 1717556327398665000,\n \"collector\": \"Categraf\",\n \"typ\": \"Elasticsearch\",\n \"name\": \"Cluster Health 数据节点数量\",\n \"unit\": \"none\",\n \"note\": \"\",\n \"lang\": \"zh_CN\",\n \"expression\": \"elasticsearch_cluster_health_number_of_data_nodes\",\n \"created_at\": 0,\n \"created_by\": \"\",\n \"updated_at\": 0,\n \"updated_by\": \"\",\n \"translation\": [\n {\n \"lang\": \"zh_CN\",\n \"name\": \"Cluster Health 数据节点数量\",\n \"note\": \"\"\n },\n {\n \"lang\": \"en_US\",\n \"name\": \"Number of Cluster Health data nodes\",\n \"note\": \"\"\n }\n ]\n },\n {\n \"id\": 0,\n \"uuid\": 1717556327400525000,\n \"collector\": \"Categraf\",\n \"typ\": \"Elasticsearch\",\n \"name\": \"Cluster Health 正在初始化的分片数\",\n \"unit\": \"sishort\",\n \"note\": \"\",\n \"lang\": \"zh_CN\",\n \"expression\": \"elasticsearch_cluster_health_initializing_shards\",\n \"created_at\": 0,\n \"created_by\": \"\",\n \"updated_at\": 0,\n \"updated_by\": \"\",\n \"translation\": [\n {\n \"lang\": \"zh_CN\",\n \"name\": \"Cluster Health 正在初始化的分片数\",\n \"note\": \"\"\n },\n {\n \"lang\": \"en_US\",\n \"name\": \"Number of shards being initialized by Cluster Health\",\n \"note\": \"\"\n }\n ]\n },\n {\n \"id\": 0,\n \"uuid\": 1717556327402553000,\n \"collector\": \"Categraf\",\n \"typ\": \"Elasticsearch\",\n \"name\": \"Cluster Health 活跃主分片数\",\n \"unit\": \"sishort\",\n \"note\": \"\",\n \"lang\": \"zh_CN\",\n \"expression\": \"elasticsearch_cluster_health_active_primary_shards\",\n \"created_at\": 0,\n \"created_by\": \"\",\n \"updated_at\": 0,\n \"updated_by\": \"\",\n \"translation\": [\n {\n \"lang\": \"zh_CN\",\n \"name\": \"Cluster Health 活跃主分片数\",\n \"note\": \"\"\n },\n {\n \"lang\": \"en_US\",\n \"name\": \"Cluster Health Number of active primary shards\",\n \"note\": \"\"\n }\n ]\n },\n {\n \"id\": 0,\n \"uuid\": 1717556327404570000,\n \"collector\": \"Categraf\",\n \"typ\": \"Elasticsearch\",\n \"name\": \"Cluster Health 活跃分片数\",\n \"unit\": \"sishort\",\n \"note\": \"\",\n \"lang\": \"zh_CN\",\n \"expression\": \"elasticsearch_cluster_health_active_shards\",\n \"created_at\": 0,\n \"created_by\": \"\",\n \"updated_at\": 0,\n \"updated_by\": \"\",\n \"translation\": [\n {\n \"lang\": \"zh_CN\",\n \"name\": \"Cluster Health 活跃分片数\",\n \"note\": \"\"\n },\n {\n \"lang\": \"en_US\",\n \"name\": \"Cluster Health Active Shards\",\n \"note\": \"\"\n }\n ]\n },\n {\n \"id\": 0,\n \"uuid\": 1717556327406404000,\n \"collector\": \"Categraf\",\n \"typ\": \"Elasticsearch\",\n \"name\": \"Cluster Health 节点数量\",\n \"unit\": \"none\",\n \"note\": \"\",\n \"lang\": \"zh_CN\",\n \"expression\": \"elasticsearch_cluster_health_number_of_nodes\",\n \"created_at\": 0,\n \"created_by\": \"\",\n \"updated_at\": 0,\n \"updated_by\": \"\",\n \"translation\": [\n {\n \"lang\": \"zh_CN\",\n \"name\": \"Cluster Health 节点数量\",\n \"note\": \"\"\n },\n {\n \"lang\": \"en_US\",\n \"name\": \"Number of Cluster Health nodes\",\n \"note\": \"\"\n }\n ]\n },\n {\n \"id\": 0,\n \"uuid\": 1717556327408587000,\n \"collector\": \"Categraf\",\n \"typ\": \"Elasticsearch\",\n \"name\": \"Indexing 平均耗时\",\n \"unit\": \"milliseconds\",\n \"note\": \"\",\n \"lang\": \"zh_CN\",\n \"expression\": \"irate(elasticsearch_indices_indexing_index_time_in_millis[3m])\\n/\\nirate(elasticsearch_indices_indexing_index_total[3m])\",\n \"created_at\": 0,\n \"created_by\": \"\",\n \"updated_at\": 0,\n \"updated_by\": \"\",\n \"translation\": [\n {\n \"lang\": \"zh_CN\",\n \"name\": \"Indexing 平均耗时\",\n \"note\": \"\"\n },\n {\n \"lang\": \"en_US\",\n \"name\": \"Indexing average time consumption\",\n \"note\": \"\"\n }\n ]\n },\n {\n \"id\": 0,\n \"uuid\": 1717556327410419000,\n \"collector\": \"Categraf\",\n \"typ\": \"Elasticsearch\",\n \"name\": \"Merge 平均耗时\",\n \"unit\": \"milliseconds\",\n \"note\": \"\",\n \"lang\": \"zh_CN\",\n \"expression\": \"irate(elasticsearch_indices_merges_total_time_in_millis[3m])\\n/\\nirate(elasticsearch_indices_merges_total[3m])\",\n \"created_at\": 0,\n \"created_by\": \"\",\n \"updated_at\": 0,\n \"updated_by\": \"\",\n \"translation\": [\n {\n \"lang\": \"zh_CN\",\n \"name\": \"Merge 平均耗时\",\n \"note\": \"\"\n },\n {\n \"lang\": \"en_US\",\n \"name\": \"Average time consumed by Merge\",\n \"note\": \"\"\n }\n ]\n },\n {\n \"id\": 0,\n \"uuid\": 1717556327413133000,\n \"collector\": \"Categraf\",\n \"typ\": \"Elasticsearch\",\n \"name\": \"Query 平均耗时\",\n \"unit\": \"milliseconds\",\n \"note\": \"\",\n \"lang\": \"zh_CN\",\n \"expression\": \"irate(elasticsearch_indices_search_query_time_in_millis[3m])\\n/\\nirate(elasticsearch_indices_search_query_total[3m])\",\n \"created_at\": 0,\n \"created_by\": \"\",\n \"updated_at\": 0,\n \"updated_by\": \"\",\n \"translation\": [\n {\n \"lang\": \"zh_CN\",\n \"name\": \"Query 平均耗时\",\n \"note\": \"\"\n },\n {\n \"lang\": \"en_US\",\n \"name\": \"Query average time consumption\",\n \"note\": \"\"\n }\n ]\n },\n {\n \"id\": 0,\n \"uuid\": 1717556327415242000,\n \"collector\": \"Categraf\",\n \"typ\": \"Elasticsearch\",\n \"name\": \"每秒 indexing 数量\",\n \"unit\": \"sishort\",\n \"note\": \"\",\n \"lang\": \"zh_CN\",\n \"expression\": \"irate(elasticsearch_indices_indexing_index_total[3m])\",\n \"created_at\": 0,\n \"created_by\": \"\",\n \"updated_at\": 0,\n \"updated_by\": \"\",\n \"translation\": [\n {\n \"lang\": \"zh_CN\",\n \"name\": \"每秒 indexing 数量\",\n \"note\": \"\"\n },\n {\n \"lang\": \"en_US\",\n \"name\": \"indexing per second\",\n \"note\": \"\"\n }\n ]\n },\n {\n \"id\": 0,\n \"uuid\": 1717556327417739000,\n \"collector\": \"Categraf\",\n \"typ\": \"Elasticsearch\",\n \"name\": \"每秒 merge 大小\",\n \"unit\": \"bytesSecIEC\",\n \"note\": \"\",\n \"lang\": \"zh_CN\",\n \"expression\": \"irate(elasticsearch_indices_merges_total_size_in_bytes[3m])\",\n \"created_at\": 0,\n \"created_by\": \"\",\n \"updated_at\": 0,\n \"updated_by\": \"\",\n \"translation\": [\n {\n \"lang\": \"zh_CN\",\n \"name\": \"每秒 merge 大小\",\n \"note\": \"\"\n },\n {\n \"lang\": \"en_US\",\n \"name\": \"merge size per second\",\n \"note\": \"\"\n }\n ]\n },\n {\n \"id\": 0,\n \"uuid\": 1717556327419933000,\n \"collector\": \"Categraf\",\n \"typ\": \"Elasticsearch\",\n \"name\": \"每秒 merge 数量\",\n \"unit\": \"sishort\",\n \"note\": \"\",\n \"lang\": \"zh_CN\",\n \"expression\": \"irate(elasticsearch_indices_merges_total_docs[3m])\",\n \"created_at\": 0,\n \"created_by\": \"\",\n \"updated_at\": 0,\n \"updated_by\": \"\",\n \"translation\": [\n {\n \"lang\": \"zh_CN\",\n \"name\": \"每秒 merge 数量\",\n \"note\": \"\"\n },\n {\n \"lang\": \"en_US\",\n \"name\": \"Number of merges per second\",\n \"note\": \"\"\n }\n ]\n },\n {\n \"id\": 0,\n \"uuid\": 1717556327421867000,\n \"collector\": \"Categraf\",\n \"typ\": \"Elasticsearch\",\n \"name\": \"每秒删除 doc 数量\",\n \"unit\": \"sishort\",\n \"note\": \"\",\n \"lang\": \"zh_CN\",\n \"expression\": \"irate(elasticsearch_indices_docs_deleted[3m])\",\n \"created_at\": 0,\n \"created_by\": \"\",\n \"updated_at\": 0,\n \"updated_by\": \"\",\n \"translation\": [\n {\n \"lang\": \"zh_CN\",\n \"name\": \"每秒删除 doc 数量\",\n \"note\": \"\"\n },\n {\n \"lang\": \"en_US\",\n \"name\": \"Number of docs deleted per second\",\n \"note\": \"\"\n }\n ]\n },\n {\n \"id\": 0,\n \"uuid\": 1717556327424001000,\n \"collector\": \"Categraf\",\n \"typ\": \"Elasticsearch\",\n \"name\": \"硬盘使用率\",\n \"unit\": \"percent\",\n \"note\": \"\",\n \"lang\": \"zh_CN\",\n \"expression\": \"100 - 100 * elasticsearch_fs_total_available_in_bytes / elasticsearch_fs_total_total_in_bytes\",\n \"created_at\": 0,\n \"created_by\": \"\",\n \"updated_at\": 0,\n \"updated_by\": \"\",\n \"translation\": [\n {\n \"lang\": \"zh_CN\",\n \"name\": \"硬盘使用率\",\n \"note\": \"\"\n },\n {\n \"lang\": \"en_US\",\n \"name\": \"Hard Drive Usage\",\n \"note\": \"\"\n }\n ]\n },\n {\n \"id\": 0,\n \"uuid\": 1717556327425727000,\n \"collector\": \"Categraf\",\n \"typ\": \"Elasticsearch\",\n \"name\": \"网络流量 - 入向每秒流量\",\n \"unit\": \"bytesSecIEC\",\n \"note\": \"\",\n \"lang\": \"zh_CN\",\n \"expression\": \"irate(elasticsearch_transport_rx_size_in_bytes[3m])\",\n \"created_at\": 0,\n \"created_by\": \"\",\n \"updated_at\": 0,\n \"updated_by\": \"\",\n \"translation\": [\n {\n \"lang\": \"zh_CN\",\n \"name\": \"网络流量 - 入向每秒流量\",\n \"note\": \"\"\n },\n {\n \"lang\": \"en_US\",\n \"name\": \"Network traffic-inbound traffic per second\",\n \"note\": \"\"\n }\n ]\n },\n {\n \"id\": 0,\n \"uuid\": 1717556327428683000,\n \"collector\": \"Categraf\",\n \"typ\": \"Elasticsearch\",\n \"name\": \"网络流量 - 出向每秒流量\",\n \"unit\": \"bytesSecIEC\",\n \"note\": \"\",\n \"lang\": \"zh_CN\",\n \"expression\": \"irate(elasticsearch_transport_tx_size_in_bytes[3m])\",\n \"created_at\": 0,\n \"created_by\": \"\",\n \"updated_at\": 0,\n \"updated_by\": \"\",\n \"translation\": [\n {\n \"lang\": \"zh_CN\",\n \"name\": \"网络流量 - 出向每秒流量\",\n \"note\": \"\"\n },\n {\n \"lang\": \"en_US\",\n \"name\": \"Network traffic-outbound traffic per second\",\n \"note\": \"\"\n }\n ]\n },\n {\n \"id\": 0,\n \"uuid\": 1717556327434651000,\n \"collector\": \"Categraf\",\n \"typ\": \"Elasticsearch\",\n \"name\": \"进程 CPU 使用率\",\n \"unit\": \"percent\",\n \"note\": \"\",\n \"lang\": \"zh_CN\",\n \"expression\": \"elasticsearch_process_cpu_percent\",\n \"created_at\": 0,\n \"created_by\": \"\",\n \"updated_at\": 0,\n \"updated_by\": \"\",\n \"translation\": [\n {\n \"lang\": \"zh_CN\",\n \"name\": \"进程 CPU 使用率\",\n \"note\": \"\"\n },\n {\n \"lang\": \"en_US\",\n \"name\": \"Process CPU usage\",\n \"note\": \"\"\n }\n ]\n },\n {\n \"id\": 0,\n \"uuid\": 1717556327437231000,\n \"collector\": \"Categraf\",\n \"typ\": \"Elasticsearch\",\n \"name\": \"进程 JVM Heap 使用率\",\n \"unit\": \"percent\",\n \"note\": \"\",\n \"lang\": \"zh_CN\",\n \"expression\": \"elasticsearch_jvm_mem_heap_used_percent\",\n \"created_at\": 0,\n \"created_by\": \"\",\n \"updated_at\": 0,\n \"updated_by\": \"\",\n \"translation\": [\n {\n \"lang\": \"zh_CN\",\n \"name\": \"进程 JVM Heap 使用率\",\n \"note\": \"\"\n },\n {\n \"lang\": \"en_US\",\n \"name\": \"Process JVM Heap Usage\",\n \"note\": \"\"\n }\n ]\n },\n {\n \"id\": 0,\n \"uuid\": 1717556327439234000,\n \"collector\": \"Categraf\",\n \"typ\": \"Elasticsearch\",\n \"name\": \"进程 JVM Heap 区 committed 大小\",\n \"unit\": \"bytesIEC\",\n \"note\": \"\",\n \"lang\": \"zh_CN\",\n \"expression\": \"elasticsearch_jvm_mem_heap_committed_in_bytes\",\n \"created_at\": 0,\n \"created_by\": \"\",\n \"updated_at\": 0,\n \"updated_by\": \"\",\n \"translation\": [\n {\n \"lang\": \"zh_CN\",\n \"name\": \"进程 JVM Heap 区 committed 大小\",\n \"note\": \"\"\n },\n {\n \"lang\": \"en_US\",\n \"name\": \"Process JVM Heap area committed size\",\n \"note\": \"\"\n }\n ]\n },\n {\n \"id\": 0,\n \"uuid\": 1717556327441202000,\n \"collector\": \"Categraf\",\n \"typ\": \"Elasticsearch\",\n \"name\": \"进程 JVM Non Heap 区 committed 大小\",\n \"unit\": \"bytesIEC\",\n \"note\": \"\",\n \"lang\": \"zh_CN\",\n \"expression\": \"elasticsearch_jvm_mem_non_heap_committed_in_bytes\",\n \"created_at\": 0,\n \"created_by\": \"\",\n \"updated_at\": 0,\n \"updated_by\": \"\",\n \"translation\": [\n {\n \"lang\": \"zh_CN\",\n \"name\": \"进程 JVM Non Heap 区 committed 大小\",\n \"note\": \"\"\n },\n {\n \"lang\": \"en_US\",\n \"name\": \"Process JVM Non Heap area committed size\",\n \"note\": \"\"\n }\n ]\n },\n {\n \"id\": 0,\n \"uuid\": 1717556327443058000,\n \"collector\": \"Categraf\",\n \"typ\": \"Elasticsearch\",\n \"name\": \"进程 JVM Old 内存池 used 大小\",\n \"unit\": \"bytesIEC\",\n \"note\": \"\",\n \"lang\": \"zh_CN\",\n \"expression\": \"elasticsearch_jvm_mem_pools_old_used_in_bytes\",\n \"created_at\": 0,\n \"created_by\": \"\",\n \"updated_at\": 0,\n \"updated_by\": \"\",\n \"translation\": [\n {\n \"lang\": \"zh_CN\",\n \"name\": \"进程 JVM Old 内存池 used 大小\",\n \"note\": \"\"\n },\n {\n \"lang\": \"en_US\",\n \"name\": \"Process JVM Old memory pool used size\",\n \"note\": \"\"\n }\n ]\n },\n {\n \"id\": 0,\n \"uuid\": 1717556327444862000,\n \"collector\": \"Categraf\",\n \"typ\": \"Elasticsearch\",\n \"name\": \"进程 JVM Young 内存池 used 大小\",\n \"unit\": \"bytesIEC\",\n \"note\": \"\",\n \"lang\": \"zh_CN\",\n \"expression\": \"elasticsearch_jvm_mem_pools_young_used_in_bytes\",\n \"created_at\": 0,\n \"created_by\": \"\",\n \"updated_at\": 0,\n \"updated_by\": \"\",\n \"translation\": [\n {\n \"lang\": \"zh_CN\",\n \"name\": \"进程 JVM Young 内存池 used 大小\",\n \"note\": \"\"\n },\n {\n \"lang\": \"en_US\",\n \"name\": \"Process JVM Young memory pool used size\",\n \"note\": \"\"\n }\n ]\n },\n {\n \"id\": 0,\n \"uuid\": 1717556327447174000,\n \"collector\": \"Categraf\",\n \"typ\": \"Elasticsearch\",\n \"name\": \"进程新生代每秒 GC 次数\",\n \"unit\": \"none\",\n \"note\": \"\",\n \"lang\": \"zh_CN\",\n \"expression\": \"irate(elasticsearch_jvm_gc_collectors_young_collection_count[3m])\",\n \"created_at\": 0,\n \"created_by\": \"\",\n \"updated_at\": 0,\n \"updated_by\": \"\",\n \"translation\": [\n {\n \"lang\": \"zh_CN\",\n \"name\": \"进程新生代每秒 GC 次数\",\n \"note\": \"\"\n },\n {\n \"lang\": \"en_US\",\n \"name\": \"Number of GCs per second for the new generation of the process\",\n \"note\": \"\"\n }\n ]\n },\n {\n \"id\": 0,\n \"uuid\": 1717556327449234000,\n \"collector\": \"Categraf\",\n \"typ\": \"Elasticsearch\",\n \"name\": \"进程新生代每秒 GC 耗时\",\n \"unit\": \"milliseconds\",\n \"note\": \"\",\n \"lang\": \"zh_CN\",\n \"expression\": \"irate(elasticsearch_jvm_gc_collectors_young_collection_time_in_millis[3m])\",\n \"created_at\": 0,\n \"created_by\": \"\",\n \"updated_at\": 0,\n \"updated_by\": \"\",\n \"translation\": [\n {\n \"lang\": \"zh_CN\",\n \"name\": \"进程新生代每秒 GC 耗时\",\n \"note\": \"\"\n },\n {\n \"lang\": \"en_US\",\n \"name\": \"Process new generation time per second GC\",\n \"note\": \"\"\n }\n ]\n },\n {\n \"id\": 0,\n \"uuid\": 1717556327451371000,\n \"collector\": \"Categraf\",\n \"typ\": \"Elasticsearch\",\n \"name\": \"进程老生代每秒 GC 次数\",\n \"unit\": \"none\",\n \"note\": \"\",\n \"lang\": \"zh_CN\",\n \"expression\": \"irate(elasticsearch_jvm_gc_collectors_old_collection_count[3m])\",\n \"created_at\": 0,\n \"created_by\": \"\",\n \"updated_at\": 0,\n \"updated_by\": \"\",\n \"translation\": [\n {\n \"lang\": \"zh_CN\",\n \"name\": \"进程老生代每秒 GC 次数\",\n \"note\": \"\"\n },\n {\n \"lang\": \"en_US\",\n \"name\": \"Number of GCs per second of process old generation\",\n \"note\": \"\"\n }\n ]\n },\n {\n \"id\": 0,\n \"uuid\": 1717556327459172000,\n \"collector\": \"Categraf\",\n \"typ\": \"Elasticsearch\",\n \"name\": \"进程老生代每秒 GC 耗时\",\n \"unit\": \"milliseconds\",\n \"note\": \"\",\n \"lang\": \"zh_CN\",\n \"expression\": \"irate(elasticsearch_jvm_gc_collectors_old_collection_time_in_millis[3m])\",\n \"created_at\": 0,\n \"created_by\": \"\",\n \"updated_at\": 0,\n \"updated_by\": \"\",\n \"translation\": [\n {\n \"lang\": \"zh_CN\",\n \"name\": \"进程老生代每秒 GC 耗时\",\n \"note\": \"\"\n },\n {\n \"lang\": \"en_US\",\n \"name\": \"Process old generation GC time per second\",\n \"note\": \"\"\n }\n ]\n }\n]"
},
{
"path": "integrations/Exec/collect/exec/exec.toml",
"content": "# # collect interval\n# interval = 15\n\n[[instances]]\n# # commands, support glob\ncommands = [\n# \"/opt/categraf/scripts/*.sh\"\n]\n\n# # timeout for each command to complete\n# timeout = 5\n\n# # interval = global.interval * interval_times\n# interval_times = 1\n\n# # choices: influx prometheus falcon\n# # influx stdout example: measurement,labelkey1=labelval1,labelkey2=labelval2 field1=1.2,field2=2.3\n# data_format = \"influx\"\n"
},
{
"path": "integrations/Exec/markdown/README.md",
"content": "# 应用场景\n```\n应用于input插件库exec目录之外的特殊或自定义实现指定业务的监控。\n监控脚本采集到监控数据之后通过相应的格式输出到stdout,categraf截获stdout内容,解析之后传给服务端,\n脚本的输出格式支持3种:influx、falcon、prometheus,通过 exec.toml 的 `data_format` 配置告诉 Categraf。\ndata_format有3个值,其用法为:\n```\n\n## influx\n\ninflux 格式的内容规范:\n```\nmeasurement,labelkey1=labelval1,labelkey2=labelval2 field1=1.2,field2=2.3\n```\n- 首先measurement,表示一个类别的监控指标,比如 connections;\n- measurement后面是逗号,逗号后面是标签,如果没有标签,则measurement后面不需要逗号\n- 标签是k=v的格式,多个标签用逗号分隔,比如region=beijing,env=test\n- 标签后面是空格\n- 空格后面是属性字段,多个属性字段用逗号分隔\n- 属性字段是字段名=值的格式,在categraf里值只能是数字\n 最终,measurement和各个属性字段名称拼接成metric名字\n\n## falcon\nOpen-Falcon的格式如下,举例:\n\n```json\n[\n {\n \"endpoint\": \"test-endpoint\",\n \"metric\": \"test-metric\",\n \"timestamp\": 1658490609,\n \"step\": 60,\n \"value\": 1,\n \"counterType\": \"GAUGE\",\n \"tags\": \"idc=lg,loc=beijing\",\n },\n {\n \"endpoint\": \"test-endpoint\",\n \"metric\": \"test-metric2\",\n \"timestamp\": 1658490609,\n \"step\": 60,\n \"value\": 2,\n \"counterType\": \"GAUGE\",\n \"tags\": \"idc=lg,loc=beijing\",\n }\n]\n```\ntimestamp、step、counterType,这三个字段在categraf处理的时候会直接忽略掉,endpoint会放到labels里上报。\n\n## prometheus\nprometheus 格式大家不陌生了,比如我这里准备一个监控脚本,输出 prometheus 的格式数据:\n```shell\n#!/bin/sh\n\necho '# HELP demo_http_requests_total Total number of http api requests'\necho '# TYPE demo_http_requests_total counter'\necho 'demo_http_requests_total{api=\"add_product\"} 4633433'\n```\n其中 `#` 注释的部分,其实会被 categraf 忽略,不要也罢,prometheus 协议的数据具体的格式,请大家参考 prometheus 官方文档\n\n\n# 部署场景\n一般在复合型用途或独立的虚拟机启用此插件。\n\n# 前置条件\n```\n1.需使用人解读每个脚本或程序的逻辑,其脚本或程序顶部有大概作用的描述。\n```\n\n# 配置场景\n本配置启用或数据定义如下功能:\n增加自定义标签,可通过自定义标签筛选数据及更加精确的告警推送。\n响应超时时间为5秒。\ncommands字段正确应用脚本所在位置。\n\n# 修改exec.toml文件配置\n```\n[root@aliyun input.exec]# vi exec.toml\n\n# # collect interval\n# interval = 15\n\n[[instances]]\n# # commands, support glob\ncommands = [\n \"/opt/categraf/scripts/*/collect_*.sh\"\n #\"/opt/categraf/scripts/*/collect_*.py\"\n #\"/opt/categraf/scripts/*/collect_*.go\"\n #\"/opt/categraf/scripts/*/collect_*.lua\"\n #\"/opt/categraf/scripts/*/collect_*.java\"\n #\"/opt/categraf/scripts/*/collect_*.bat\"\n #\"/opt/categraf/scripts/*/collect_*.cmd\"\n #\"/opt/categraf/scripts/*/collect_*.ps1\"\n]\n\n# # timeout for each command to complete\n# timeout = 5\n\n# # interval = global.interval * interval_times\n# interval_times = 1\n\n# # measurement,labelkey1=labelval1,labelkey2=labelval2 field1=1.2,field2=2.3\ndata_format = \"influx\"\n```\n\n# 测试配置\n```\n以cert/collect_cert_expiretime.sh为例:\nsh /opt/categraf/cert/collect_cert_expiretime.sh 出现:\ncert,cloud=huaweicloud,region=huabei-beijing-4,azone=az1,product=cert,domain_name=www.baidu.com expire_days=163\ncert,cloud=huaweicloud,region=huabei-beijing-4,azone=az1,product=cert,domain_name=www.weibo.com expire_days=85\ncert,cloud=huaweicloud,region=huabei-beijing-4,azone=az1,product=cert,domain_name=www.csdn.net expire_days=281\n```\n\n# 重启服务\n```\n重启categraf服务生效\nsystemctl daemon-reload && systemctl restart categraf && systemctl status categraf\n\n查看启动日志是否有错误\njournalctl -f -n 500 -u categraf | grep \"E\\!\" | grep \"W\\!\"\n```\n\n# 检查数据呈现\n如图:\n\n"
},
{
"path": "integrations/Filecount/collect/filecount/filecount.toml",
"content": "# # collect interval\n# interval = 15\n\n[[instances]]\n# # append some labels for series\n# labels = { region=\"cloud\", product=\"n9e\" }\n\n# # interval = global.interval * interval_times\n# interval_times = 1\n\n## Directories to gather stats about.\n## This accept standard unit glob matching rules, but with the addition of\n## ** as a \"super asterisk\". ie:\n## /var/log/** -> recursively find all directories in /var/log and count files in each directories\n## /var/log/*/* -> find all directories with a parent dir in /var/log and count files in each directories\n## /var/log -> count all files in /var/log and all of its subdirectories\n## directories = [\"/var/cache/apt\", \"/tmp\"]\ndirectories = [\"/tmp\"]\n\n## Only count files that match the name pattern. Defaults to \"*\".\nfile_name = \"*\"\n\n## Count files in subdirectories. Defaults to true.\nrecursive = true\n\n## Only count regular files. Defaults to true.\nregular_only = true\n\n## Follow all symlinks while walking the directory tree. Defaults to false.\nfollow_symlinks = false\n\n## Only count files that are at least this size. If size is\n## a negative number, only count files that are smaller than the\n## absolute value of size. Acceptable units are B, KiB, MiB, KB, ...\n## Without quotes and units, interpreted as size in bytes.\nsize = \"0B\"\n\n## Only count files that have not been touched for at least this\n## duration. If mtime is negative, only count files that have been\n## touched in this duration. Defaults to \"0s\".\nmtime = \"0s\"\n"
},
{
"path": "integrations/Filecount/markdown/README.md",
"content": "# Filecount Input Plugin\n\nforked from telegraf/inputs.filecount\n\nReports the number and total size of files in specified directories.\n\n\n## Configuration\n\n```toml filecount.toml\n# # collect interval\n# interval = 15\n\n[[instances]]\n# # append some labels for series\n# labels = { region=\"cloud\", product=\"n9e\" }\n\n# # interval = global.interval * interval_times\n# interval_times = 1\n\n## Directories to gather stats about.\n## This accept standard unit glob matching rules, but with the addition of\n## ** as a \"super asterisk\". ie:\n## /var/log/** -> recursively find all directories in /var/log and count files in each directories\n## /var/log/*/* -> find all directories with a parent dir in /var/log and count files in each directories\n## /var/log -> count all files in /var/log and all of its subdirectories\n## directories = [\"/var/cache/apt\", \"/tmp\"]\ndirectories = [\"/tmp\", \"/root\"]\n\n## Only count files that match the name pattern. Defaults to \"*\".\nfile_name = \"*\"\n\n## Count files in subdirectories. Defaults to true.\nrecursive = true\n\n## Only count regular files. Defaults to true.\nregular_only = true\n\n## Follow all symlinks while walking the directory tree. Defaults to false.\nfollow_symlinks = false\n\n## Only count files that are at least this size. If size is\n## a negative number, only count files that are smaller than the\n## absolute value of size. Acceptable units are B, KiB, MiB, KB, ...\n## Without quotes and units, interpreted as size in bytes.\nsize = \"0B\"\n\n## Only count files that have not been touched for at least this\n## duration. If mtime is negative, only count files that have been\n## touched in this duration. Defaults to \"0s\".\nmtime = \"0s\"\n\n```\n\n## Metrics\n\n- filecount\n - tags:\n - directory (the directory path)\n - fields:\n - count (integer)\n - size_bytes (integer)\n - oldest_file_timestamp (int, unix time nanoseconds)\n - newest_file_timestamp (int, unix time nanoseconds)\n\n## Example Output\n\n```text\n13:25:07 filecount_count agent_hostname=host1 directory=/tmp 319\n13:25:07 filecount_size_bytes agent_hostname=host1 directory=/tmp 83196547\n13:25:07 filecount_oldest_file_timestamp agent_hostname=host1 directory=/tmp 0\n13:25:07 filecount_newest_file_timestamp agent_hostname=host1 directory=/tmp 1692336254306413522\n```\n"
},
{
"path": "integrations/Gitlab/alerts/gitlab_by_categraf.json",
"content": "[\n {\n \"id\": 0,\n \"group_id\": 0,\n \"cate\": \"prometheus\",\n \"datasource_ids\": [\n 0\n ],\n \"cluster\": \"\",\n \"name\": \"HighgRPCResourceExhaustedRate\",\n \"note\": \"High gRPC ResourceExhausted error rate\",\n \"prod\": \"metric\",\n \"algorithm\": \"\",\n \"algo_params\": null,\n \"delay\": 0,\n \"severity\": 2,\n \"severities\": [\n 2\n ],\n \"disabled\": 1,\n \"prom_for_duration\": 3600,\n \"prom_ql\": \"sum without (grpc_code, grpc_method, grpc_service, grpc_type) (\\n rate(grpc_server_handled_total{grpc_code=\\\"ResourceExhausted\\\"}[5m])\\n) / sum without (grpc_code, grpc_method, grpc_service, grpc_type) (\\n rate(grpc_server_handled_total[5m])\\n) * 100 \\u003e 1\\n\",\n \"rule_config\": {\n \"algo_params\": null,\n \"inhibit\": false,\n \"prom_ql\": \"\",\n \"queries\": [\n {\n \"prom_ql\": \"sum without (grpc_code, grpc_method, grpc_service, grpc_type) (\\n rate(grpc_server_handled_total{grpc_code=\\\"ResourceExhausted\\\"}[5m])\\n) / sum without (grpc_code, grpc_method, grpc_service, grpc_type) (\\n rate(grpc_server_handled_total[5m])\\n) * 100 \\u003e 1\\n\",\n \"severity\": 2\n }\n ],\n \"severity\": 0\n },\n \"prom_eval_interval\": 15,\n \"enable_stime\": \"00:00\",\n \"enable_stimes\": [\n \"00:00\"\n ],\n \"enable_etime\": \"23:59\",\n \"enable_etimes\": [\n \"23:59\"\n ],\n \"enable_days_of_week\": [\n \"1\",\n \"2\",\n \"3\",\n \"4\",\n \"5\",\n \"6\",\n \"0\"\n ],\n \"enable_days_of_weeks\": [\n [\n \"1\",\n \"2\",\n \"3\",\n \"4\",\n \"5\",\n \"6\",\n \"0\"\n ]\n ],\n \"enable_in_bg\": 0,\n \"notify_recovered\": 1,\n \"notify_channels\": [],\n \"notify_groups_obj\": null,\n \"notify_groups\": null,\n \"notify_repeat_step\": 60,\n \"notify_max_number\": 0,\n \"recover_duration\": 0,\n \"callbacks\": [],\n \"runbook_url\": \"\",\n \"append_tags\": [],\n \"annotations\": null,\n \"extra_config\": null,\n \"create_at\": 0,\n \"create_by\": \"\",\n \"update_at\": 0,\n \"update_by\": \"\",\n \"uuid\": 1717556327473722000\n },\n {\n \"id\": 0,\n \"group_id\": 0,\n \"cate\": \"prometheus\",\n \"datasource_ids\": [\n 0\n ],\n \"cluster\": \"\",\n \"name\": \"HighPumaUtilization\",\n \"note\": \"Puma instance {{ $labels.instance }} has more than 90% thread utilization ({{ $value | printf \\\"%.1f\\\" }}%) over the last 60 minutes.\",\n \"prod\": \"metric\",\n \"algorithm\": \"\",\n \"algo_params\": null,\n \"delay\": 0,\n \"severity\": 2,\n \"severities\": [\n 2\n ],\n \"disabled\": 1,\n \"prom_for_duration\": 3600,\n \"prom_ql\": \"instance:puma_utilization:ratio * 100 \\u003e 90\",\n \"rule_config\": {\n \"algo_params\": null,\n \"inhibit\": false,\n \"prom_ql\": \"\",\n \"queries\": [\n {\n \"prom_ql\": \"instance:puma_utilization:ratio * 100 \\u003e 90\",\n \"severity\": 2\n }\n ],\n \"severity\": 0\n },\n \"prom_eval_interval\": 15,\n \"enable_stime\": \"00:00\",\n \"enable_stimes\": [\n \"00:00\"\n ],\n \"enable_etime\": \"23:59\",\n \"enable_etimes\": [\n \"23:59\"\n ],\n \"enable_days_of_week\": [\n \"1\",\n \"2\",\n \"3\",\n \"4\",\n \"5\",\n \"6\",\n \"0\"\n ],\n \"enable_days_of_weeks\": [\n [\n \"1\",\n \"2\",\n \"3\",\n \"4\",\n \"5\",\n \"6\",\n \"0\"\n ]\n ],\n \"enable_in_bg\": 0,\n \"notify_recovered\": 1,\n \"notify_channels\": [],\n \"notify_groups_obj\": null,\n \"notify_groups\": null,\n \"notify_repeat_step\": 60,\n \"notify_max_number\": 0,\n \"recover_duration\": 0,\n \"callbacks\": [],\n \"runbook_url\": \"\",\n \"append_tags\": [],\n \"annotations\": null,\n \"extra_config\": null,\n \"create_at\": 0,\n \"create_by\": \"\",\n \"update_at\": 0,\n \"update_by\": \"\",\n \"uuid\": 1717556327474171000\n },\n {\n \"id\": 0,\n \"group_id\": 0,\n \"cate\": \"prometheus\",\n \"datasource_ids\": [\n 0\n ],\n \"cluster\": \"\",\n \"name\": \"PostgresDatabaseDeadlockCancels\",\n \"note\": \"Postgres database has queries canceled due to deadlocks\",\n \"prod\": \"metric\",\n \"algorithm\": \"\",\n \"algo_params\": null,\n \"delay\": 0,\n \"severity\": 2,\n \"severities\": [\n 2\n ],\n \"disabled\": 1,\n \"prom_for_duration\": 0,\n \"prom_ql\": \"increase(pg_stat_database_deadlocks[5m]) \\u003e 0\",\n \"rule_config\": {\n \"algo_params\": null,\n \"inhibit\": false,\n \"prom_ql\": \"\",\n \"queries\": [\n {\n \"prom_ql\": \"increase(pg_stat_database_deadlocks[5m]) \\u003e 0\",\n \"severity\": 2\n }\n ],\n \"severity\": 0\n },\n \"prom_eval_interval\": 15,\n \"enable_stime\": \"00:00\",\n \"enable_stimes\": [\n \"00:00\"\n ],\n \"enable_etime\": \"23:59\",\n \"enable_etimes\": [\n \"23:59\"\n ],\n \"enable_days_of_week\": [\n \"1\",\n \"2\",\n \"3\",\n \"4\",\n \"5\",\n \"6\",\n \"0\"\n ],\n \"enable_days_of_weeks\": [\n [\n \"1\",\n \"2\",\n \"3\",\n \"4\",\n \"5\",\n \"6\",\n \"0\"\n ]\n ],\n \"enable_in_bg\": 0,\n \"notify_recovered\": 1,\n \"notify_channels\": [],\n \"notify_groups_obj\": null,\n \"notify_groups\": null,\n \"notify_repeat_step\": 60,\n \"notify_max_number\": 0,\n \"recover_duration\": 0,\n \"callbacks\": [],\n \"runbook_url\": \"\",\n \"append_tags\": [],\n \"annotations\": null,\n \"extra_config\": null,\n \"create_at\": 0,\n \"create_by\": \"\",\n \"update_at\": 0,\n \"update_by\": \"\",\n \"uuid\": 1717556327474653000\n },\n {\n \"id\": 0,\n \"group_id\": 0,\n \"cate\": \"prometheus\",\n \"datasource_ids\": [\n 0\n ],\n \"cluster\": \"\",\n \"name\": \"PostgresDatabaseDeadlocks\",\n \"note\": \"Postgres database has deadlocks\",\n \"prod\": \"metric\",\n \"algorithm\": \"\",\n \"algo_params\": null,\n \"delay\": 0,\n \"severity\": 2,\n \"severities\": [\n 2\n ],\n \"disabled\": 1,\n \"prom_for_duration\": 0,\n \"prom_ql\": \"increase(pg_stat_database_deadlocks[5m]) \\u003e 0\",\n \"rule_config\": {\n \"algo_params\": null,\n \"inhibit\": false,\n \"prom_ql\": \"\",\n \"queries\": [\n {\n \"prom_ql\": \"increase(pg_stat_database_deadlocks[5m]) \\u003e 0\",\n \"severity\": 2\n }\n ],\n \"severity\": 0\n },\n \"prom_eval_interval\": 15,\n \"enable_stime\": \"00:00\",\n \"enable_stimes\": [\n \"00:00\"\n ],\n \"enable_etime\": \"23:59\",\n \"enable_etimes\": [\n \"23:59\"\n ],\n \"enable_days_of_week\": [\n \"1\",\n \"2\",\n \"3\",\n \"4\",\n \"5\",\n \"6\",\n \"0\"\n ],\n \"enable_days_of_weeks\": [\n [\n \"1\",\n \"2\",\n \"3\",\n \"4\",\n \"5\",\n \"6\",\n \"0\"\n ]\n ],\n \"enable_in_bg\": 0,\n \"notify_recovered\": 1,\n \"notify_channels\": [],\n \"notify_groups_obj\": null,\n \"notify_groups\": null,\n \"notify_repeat_step\": 60,\n \"notify_max_number\": 0,\n \"recover_duration\": 0,\n \"callbacks\": [],\n \"runbook_url\": \"\",\n \"append_tags\": [],\n \"annotations\": null,\n \"extra_config\": null,\n \"create_at\": 0,\n \"create_by\": \"\",\n \"update_at\": 0,\n \"update_by\": \"\",\n \"uuid\": 1717556327475111000\n },\n {\n \"id\": 0,\n \"group_id\": 0,\n \"cate\": \"prometheus\",\n \"datasource_ids\": [\n 0\n ],\n \"cluster\": \"\",\n \"name\": \"PostgresDown\",\n \"note\": \"The Postgres service {{ $labels.job }} instance {{ $labels.instance }} is not responding for more than 50% of the time for 5 minutes.\",\n \"prod\": \"metric\",\n \"algorithm\": \"\",\n \"algo_params\": null,\n \"delay\": 0,\n \"severity\": 2,\n \"severities\": [\n 2\n ],\n \"disabled\": 1,\n \"prom_for_duration\": 0,\n \"prom_ql\": \"avg_over_time(pg_up[5m]) * 100 \\u003c 50\",\n \"rule_config\": {\n \"algo_params\": null,\n \"inhibit\": false,\n \"prom_ql\": \"\",\n \"queries\": [\n {\n \"prom_ql\": \"avg_over_time(pg_up[5m]) * 100 \\u003c 50\",\n \"severity\": 2\n }\n ],\n \"severity\": 0\n },\n \"prom_eval_interval\": 15,\n \"enable_stime\": \"00:00\",\n \"enable_stimes\": [\n \"00:00\"\n ],\n \"enable_etime\": \"23:59\",\n \"enable_etimes\": [\n \"23:59\"\n ],\n \"enable_days_of_week\": [\n \"1\",\n \"2\",\n \"3\",\n \"4\",\n \"5\",\n \"6\",\n \"0\"\n ],\n \"enable_days_of_weeks\": [\n [\n \"1\",\n \"2\",\n \"3\",\n \"4\",\n \"5\",\n \"6\",\n \"0\"\n ]\n ],\n \"enable_in_bg\": 0,\n \"notify_recovered\": 1,\n \"notify_channels\": [],\n \"notify_groups_obj\": null,\n \"notify_groups\": null,\n \"notify_repeat_step\": 60,\n \"notify_max_number\": 0,\n \"recover_duration\": 0,\n \"callbacks\": [],\n \"runbook_url\": \"\",\n \"append_tags\": [],\n \"annotations\": null,\n \"extra_config\": null,\n \"create_at\": 0,\n \"create_by\": \"\",\n \"update_at\": 0,\n \"update_by\": \"\",\n \"uuid\": 1717556327475499000\n },\n {\n \"id\": 0,\n \"group_id\": 0,\n \"cate\": \"prometheus\",\n \"datasource_ids\": [\n 0\n ],\n \"cluster\": \"\",\n \"name\": \"PumaQueueing\",\n \"note\": \"Puma instance {{ $labels.instance }} is queueing requests with an average of {{ $value | printf \\\"%.1f\\\" }} over the last 30 minutes.\",\n \"prod\": \"metric\",\n \"algorithm\": \"\",\n \"algo_params\": null,\n \"delay\": 0,\n \"severity\": 2,\n \"severities\": [\n 2\n ],\n \"disabled\": 1,\n \"prom_for_duration\": 0,\n \"prom_ql\": \"avg_over_time(puma_queued_connections[30m]) \\u003e 1\",\n \"rule_config\": {\n \"algo_params\": null,\n \"inhibit\": false,\n \"prom_ql\": \"\",\n \"queries\": [\n {\n \"prom_ql\": \"avg_over_time(puma_queued_connections[30m]) \\u003e 1\",\n \"severity\": 2\n }\n ],\n \"severity\": 0\n },\n \"prom_eval_interval\": 15,\n \"enable_stime\": \"00:00\",\n \"enable_stimes\": [\n \"00:00\"\n ],\n \"enable_etime\": \"23:59\",\n \"enable_etimes\": [\n \"23:59\"\n ],\n \"enable_days_of_week\": [\n \"1\",\n \"2\",\n \"3\",\n \"4\",\n \"5\",\n \"6\",\n \"0\"\n ],\n \"enable_days_of_weeks\": [\n [\n \"1\",\n \"2\",\n \"3\",\n \"4\",\n \"5\",\n \"6\",\n \"0\"\n ]\n ],\n \"enable_in_bg\": 0,\n \"notify_recovered\": 1,\n \"notify_channels\": [],\n \"notify_groups_obj\": null,\n \"notify_groups\": null,\n \"notify_repeat_step\": 60,\n \"notify_max_number\": 0,\n \"recover_duration\": 0,\n \"callbacks\": [],\n \"runbook_url\": \"\",\n \"append_tags\": [],\n \"annotations\": null,\n \"extra_config\": null,\n \"create_at\": 0,\n \"create_by\": \"\",\n \"update_at\": 0,\n \"update_by\": \"\",\n \"uuid\": 1717556327475980000\n },\n {\n \"id\": 0,\n \"group_id\": 0,\n \"cate\": \"prometheus\",\n \"datasource_ids\": [\n 0\n ],\n \"cluster\": \"\",\n \"name\": \"RedisDown\",\n \"note\": \"The Redis service {{ $labels.job }} instance {{ $labels.instance }} is not responding for more than 50% of the time for 5 minutes.\",\n \"prod\": \"metric\",\n \"algorithm\": \"\",\n \"algo_params\": null,\n \"delay\": 0,\n \"severity\": 2,\n \"severities\": [\n 2\n ],\n \"disabled\": 1,\n \"prom_for_duration\": 0,\n \"prom_ql\": \"avg_over_time(redis_up[5m]) * 100 \\u003c 50\",\n \"rule_config\": {\n \"algo_params\": null,\n \"inhibit\": false,\n \"prom_ql\": \"\",\n \"queries\": [\n {\n \"prom_ql\": \"avg_over_time(redis_up[5m]) * 100 \\u003c 50\",\n \"severity\": 2\n }\n ],\n \"severity\": 0\n },\n \"prom_eval_interval\": 15,\n \"enable_stime\": \"00:00\",\n \"enable_stimes\": [\n \"00:00\"\n ],\n \"enable_etime\": \"23:59\",\n \"enable_etimes\": [\n \"23:59\"\n ],\n \"enable_days_of_week\": [\n \"1\",\n \"2\",\n \"3\",\n \"4\",\n \"5\",\n \"6\",\n \"0\"\n ],\n \"enable_days_of_weeks\": [\n [\n \"1\",\n \"2\",\n \"3\",\n \"4\",\n \"5\",\n \"6\",\n \"0\"\n ]\n ],\n \"enable_in_bg\": 0,\n \"notify_recovered\": 1,\n \"notify_channels\": [],\n \"notify_groups_obj\": null,\n \"notify_groups\": null,\n \"notify_repeat_step\": 60,\n \"notify_max_number\": 0,\n \"recover_duration\": 0,\n \"callbacks\": [],\n \"runbook_url\": \"\",\n \"append_tags\": [],\n \"annotations\": null,\n \"extra_config\": null,\n \"create_at\": 0,\n \"create_by\": \"\",\n \"update_at\": 0,\n \"update_by\": \"\",\n \"uuid\": 1717556327476393000\n },\n {\n \"id\": 0,\n \"group_id\": 0,\n \"cate\": \"prometheus\",\n \"datasource_ids\": [\n 0\n ],\n \"cluster\": \"\",\n \"name\": \"ServiceDown\",\n \"note\": \"The service {{ $labels.job }} instance {{ $labels.instance }} is not responding for more than 50% of the time for 5 minutes.\",\n \"prod\": \"metric\",\n \"algorithm\": \"\",\n \"algo_params\": null,\n \"delay\": 0,\n \"severity\": 2,\n \"severities\": [\n 2\n ],\n \"disabled\": 1,\n \"prom_for_duration\": 0,\n \"prom_ql\": \"avg_over_time(up[5m]) * 100 \\u003c 50\",\n \"rule_config\": {\n \"algo_params\": null,\n \"inhibit\": false,\n \"prom_ql\": \"\",\n \"queries\": [\n {\n \"prom_ql\": \"avg_over_time(up[5m]) * 100 \\u003c 50\",\n \"severity\": 2\n }\n ],\n \"severity\": 0\n },\n \"prom_eval_interval\": 15,\n \"enable_stime\": \"00:00\",\n \"enable_stimes\": [\n \"00:00\"\n ],\n \"enable_etime\": \"23:59\",\n \"enable_etimes\": [\n \"23:59\"\n ],\n \"enable_days_of_week\": [\n \"1\",\n \"2\",\n \"3\",\n \"4\",\n \"5\",\n \"6\",\n \"0\"\n ],\n \"enable_days_of_weeks\": [\n [\n \"1\",\n \"2\",\n \"3\",\n \"4\",\n \"5\",\n \"6\",\n \"0\"\n ]\n ],\n \"enable_in_bg\": 0,\n \"notify_recovered\": 1,\n \"notify_channels\": [],\n \"notify_groups_obj\": null,\n \"notify_groups\": null,\n \"notify_repeat_step\": 60,\n \"notify_max_number\": 0,\n \"recover_duration\": 0,\n \"callbacks\": [],\n \"runbook_url\": \"\",\n \"append_tags\": [],\n \"annotations\": null,\n \"extra_config\": null,\n \"create_at\": 0,\n \"create_by\": \"\",\n \"update_at\": 0,\n \"update_by\": \"\",\n \"uuid\": 1717556327476862000\n },\n {\n \"id\": 0,\n \"group_id\": 0,\n \"cate\": \"prometheus\",\n \"datasource_ids\": [\n 0\n ],\n \"cluster\": \"\",\n \"name\": \"SidekiqJobsQueuing\",\n \"note\": \"Sidekiq has jobs queued\",\n \"prod\": \"metric\",\n \"algorithm\": \"\",\n \"algo_params\": null,\n \"delay\": 0,\n \"severity\": 2,\n \"severities\": [\n 2\n ],\n \"disabled\": 1,\n \"prom_for_duration\": 3600,\n \"prom_ql\": \"sum by (name) (sidekiq_queue_size) \\u003e 0\",\n \"rule_config\": {\n \"algo_params\": null,\n \"inhibit\": false,\n \"prom_ql\": \"\",\n \"queries\": [\n {\n \"prom_ql\": \"sum by (name) (sidekiq_queue_size) \\u003e 0\",\n \"severity\": 2\n }\n ],\n \"severity\": 0\n },\n \"prom_eval_interval\": 15,\n \"enable_stime\": \"00:00\",\n \"enable_stimes\": [\n \"00:00\"\n ],\n \"enable_etime\": \"23:59\",\n \"enable_etimes\": [\n \"23:59\"\n ],\n \"enable_days_of_week\": [\n \"1\",\n \"2\",\n \"3\",\n \"4\",\n \"5\",\n \"6\",\n \"0\"\n ],\n \"enable_days_of_weeks\": [\n [\n \"1\",\n \"2\",\n \"3\",\n \"4\",\n \"5\",\n \"6\",\n \"0\"\n ]\n ],\n \"enable_in_bg\": 0,\n \"notify_recovered\": 1,\n \"notify_channels\": [],\n \"notify_groups_obj\": null,\n \"notify_groups\": null,\n \"notify_repeat_step\": 60,\n \"notify_max_number\": 0,\n \"recover_duration\": 0,\n \"callbacks\": [],\n \"runbook_url\": \"\",\n \"append_tags\": [],\n \"annotations\": null,\n \"extra_config\": null,\n \"create_at\": 0,\n \"create_by\": \"\",\n \"update_at\": 0,\n \"update_by\": \"\",\n \"uuid\": 1717556327477358000\n },\n {\n \"id\": 0,\n \"group_id\": 0,\n \"cate\": \"prometheus\",\n \"datasource_ids\": [\n 0\n ],\n \"cluster\": \"\",\n \"name\": \"WorkhorseHighErrorRate\",\n \"note\": \"Workhorse has high error rates\",\n \"prod\": \"metric\",\n \"algorithm\": \"\",\n \"algo_params\": null,\n \"delay\": 0,\n \"severity\": 2,\n \"severities\": [\n 2\n ],\n \"disabled\": 1,\n \"prom_for_duration\": 0,\n \"prom_ql\": \"(\\n sum without (job, code) (\\n job_route_method_code:gitlab_workhorse_http_request_duration_seconds_count:rate5m{code=~\\\"5..\\\"}\\n ) /\\n sum without (job,code) (\\n job_route_method_code:gitlab_workhorse_http_request_duration_seconds_count:rate5m\\n ) \\u003c 10\\n) * 100 \\u003e 50\\n\",\n \"rule_config\": {\n \"algo_params\": null,\n \"inhibit\": false,\n \"prom_ql\": \"\",\n \"queries\": [\n {\n \"prom_ql\": \"(\\n sum without (job, code) (\\n job_route_method_code:gitlab_workhorse_http_request_duration_seconds_count:rate5m{code=~\\\"5..\\\"}\\n ) /\\n sum without (job,code) (\\n job_route_method_code:gitlab_workhorse_http_request_duration_seconds_count:rate5m\\n ) \\u003c 10\\n) * 100 \\u003e 50\\n\",\n \"severity\": 2\n }\n ],\n \"severity\": 0\n },\n \"prom_eval_interval\": 15,\n \"enable_stime\": \"00:00\",\n \"enable_stimes\": [\n \"00:00\"\n ],\n \"enable_etime\": \"23:59\",\n \"enable_etimes\": [\n \"23:59\"\n ],\n \"enable_days_of_week\": [\n \"1\",\n \"2\",\n \"3\",\n \"4\",\n \"5\",\n \"6\",\n \"0\"\n ],\n \"enable_days_of_weeks\": [\n [\n \"1\",\n \"2\",\n \"3\",\n \"4\",\n \"5\",\n \"6\",\n \"0\"\n ]\n ],\n \"enable_in_bg\": 0,\n \"notify_recovered\": 1,\n \"notify_channels\": [],\n \"notify_groups_obj\": null,\n \"notify_groups\": null,\n \"notify_repeat_step\": 60,\n \"notify_max_number\": 0,\n \"recover_duration\": 0,\n \"callbacks\": [],\n \"runbook_url\": \"\",\n \"append_tags\": [],\n \"annotations\": null,\n \"extra_config\": null,\n \"create_at\": 0,\n \"create_by\": \"\",\n \"update_at\": 0,\n \"update_by\": \"\",\n \"uuid\": 1717556327477956000\n }\n]"
},
{
"path": "integrations/Gitlab/dashboards/MachinePerformance.json",
"content": "{\n \"id\": 0,\n \"group_id\": 0,\n \"name\": \"GitLab - Machine Performance\",\n \"ident\": \"\",\n \"tags\": \"\",\n \"create_at\": 0,\n \"create_by\": \"\",\n \"update_at\": 0,\n \"update_by\": \"\",\n \"configs\": {\n \"links\": [],\n \"panels\": [\n {\n \"custom\": {\n \"calc\": \"lastNotNull\",\n \"colSpan\": 1,\n \"colorMode\": \"value\",\n \"graphMode\": \"none\",\n \"textMode\": \"value\",\n \"textSize\": {},\n \"valueField\": \"Value\"\n },\n \"datasourceCate\": \"prometheus\",\n \"datasourceValue\": \"${DS_PROMETHEUS}\",\n \"id\": \"a4389d18-8aed-4207-8fa9-4b25da036d6a\",\n \"layout\": {\n \"h\": 3,\n \"i\": \"a4389d18-8aed-4207-8fa9-4b25da036d6a\",\n \"isResizable\": true,\n \"w\": 5,\n \"x\": 0,\n \"y\": 0\n },\n \"links\": [],\n \"maxPerRow\": 4,\n \"name\": \"Uptime\",\n \"options\": {\n \"standardOptions\": {\n \"decimals\": 0,\n \"util\": \"none\"\n },\n \"thresholds\": {\n \"steps\": [\n {\n \"color\": \"#73BF69\",\n \"type\": \"base\",\n \"value\": null\n }\n ]\n },\n \"valueMappings\": []\n },\n \"targets\": [\n {\n \"expr\": \"node_boot_time_seconds{instance=~\\\"$instance\\\"} / 60 / 60 /24 / 30 / 365\",\n \"legend\": \"Uptime\",\n \"refId\": \"B\"\n }\n ],\n \"transformations\": [\n {\n \"id\": \"organize\",\n \"options\": {}\n }\n ],\n \"type\": \"stat\",\n \"version\": \"3.0.0\"\n },\n {\n \"custom\": {\n \"calc\": \"lastNotNull\",\n \"colSpan\": 1,\n \"colorMode\": \"value\",\n \"graphMode\": \"none\",\n \"textMode\": \"value\",\n \"textSize\": {},\n \"valueField\": \"service\"\n },\n \"datasourceCate\": \"prometheus\",\n \"datasourceValue\": \"${DS_PROMETHEUS}\",\n \"id\": \"fe9d5645-e775-446e-876b-35852b751961\",\n \"layout\": {\n \"h\": 3,\n \"i\": \"fe9d5645-e775-446e-876b-35852b751961\",\n \"isResizable\": true,\n \"w\": 2,\n \"x\": 5,\n \"y\": 0\n },\n \"links\": [],\n \"maxPerRow\": 4,\n \"name\": \"Running\",\n \"options\": {\n \"standardOptions\": {\n \"util\": \"none\"\n },\n \"thresholds\": {\n \"steps\": [\n {\n \"color\": \"#73BF69\",\n \"type\": \"base\",\n \"value\": null\n }\n ]\n },\n \"valueMappings\": []\n },\n \"targets\": [\n {\n \"expr\": \"node_boot_time_seconds{instance=~\\\"$instance\\\"} / 60 / 60 /24 / 30 / 365\",\n \"legend\": \"Uptime\",\n \"refId\": \"B\"\n }\n ],\n \"transformations\": [\n {\n \"id\": \"organize\",\n \"options\": {}\n }\n ],\n \"type\": \"stat\",\n \"version\": \"3.0.0\"\n },\n {\n \"custom\": {\n \"baseColor\": \"#9470FF\",\n \"calc\": \"avg\",\n \"serieWidth\": 20,\n \"sortOrder\": \"desc\"\n },\n \"datasourceCate\": \"prometheus\",\n \"datasourceValue\": \"${DS_PROMETHEUS}\",\n \"description\": \"\",\n \"id\": \"3190bf4b-c7a3-4044-955c-f488b31a200b\",\n \"layout\": {\n \"h\": 3,\n \"i\": \"3190bf4b-c7a3-4044-955c-f488b31a200b\",\n \"isResizable\": true,\n \"w\": 5,\n \"x\": 7,\n \"y\": 0\n },\n \"links\": [],\n \"maxPerRow\": 4,\n \"name\": \"NTP\",\n \"options\": {\n \"standardOptions\": {\n \"util\": \"milliseconds\"\n },\n \"valueMappings\": []\n },\n \"targets\": [\n {\n \"expr\": \"node_timex_sync_status{instance=\\\"$instance\\\"}\",\n \"legend\": \"NTP Enabled\",\n \"refId\": \"A\"\n },\n {\n \"expr\": \"node_timex_offset_seconds{instance=\\\"$instance\\\"}\",\n \"legend\": \"NTP Offset\",\n \"refId\": \"B\"\n }\n ],\n \"transformations\": [\n {\n \"id\": \"organize\",\n \"options\": {}\n }\n ],\n \"type\": \"barGauge\",\n \"version\": \"3.0.0\"\n },\n {\n \"custom\": {\n \"calc\": \"lastNotNull\",\n \"colorDomainAuto\": true,\n \"colorRange\": [\n \"#83c898\",\n \"#c2c2c2\",\n \"#fc653f\"\n ],\n \"reverseColorOrder\": false,\n \"textMode\": \"valueAndName\"\n },\n \"datasourceCate\": \"prometheus\",\n \"datasourceValue\": \"${DS_PROMETHEUS}\",\n \"id\": \"f1c435fa-8c9d-40cc-96ab-54889f32a178\",\n \"layout\": {\n \"h\": 3,\n \"i\": \"f1c435fa-8c9d-40cc-96ab-54889f32a178\",\n \"isResizable\": true,\n \"w\": 12,\n \"x\": 12,\n \"y\": 0\n },\n \"links\": [],\n \"maxPerRow\": 4,\n \"name\": \"System Info\",\n \"options\": {\n \"standardOptions\": {}\n },\n \"targets\": [\n {\n \"expr\": \"count(count(node_cpu_seconds_total{instance=~\\\"$instance\\\"}) by (cpu))\",\n \"legend\": \"Core\",\n \"refId\": \"A\"\n },\n {\n \"expr\": \"node_memory_MemTotal_bytes{instance=~\\\"$instance\\\"}\",\n \"legend\": \"Mem\",\n \"refId\": \"B\"\n },\n {\n \"expr\": \"node_memory_SwapTotal_bytes{instance=~\\\"$instance\\\"}\",\n \"legend\": \"Swap\",\n \"refId\": \"C\"\n },\n {\n \"expr\": \"sum(node_filesystem_size_bytes{instance=~\\\"$instance\\\"}) \",\n \"legend\": \"Disk\",\n \"refId\": \"D\"\n },\n {\n \"expr\": \"node_filefd_allocated{instance=~\\\"$instance\\\"}\",\n \"legend\": \"Openfiles\",\n \"refId\": \"E\"\n },\n {\n \"expr\": \"rate(node_context_switches_total{instance=~\\\"$instance\\\"}[1m])\",\n \"legend\": \"ContextSwitch\",\n \"refId\": \"F\"\n }\n ],\n \"transformations\": [\n {\n \"id\": \"organize\",\n \"options\": {}\n }\n ],\n \"type\": \"hexbin\",\n \"version\": \"3.0.0\"\n },\n {\n \"custom\": {\n \"drawStyle\": \"lines\",\n \"fillOpacity\": 0.3,\n \"gradientMode\": \"opacity\",\n \"lineInterpolation\": \"smooth\",\n \"lineWidth\": 2,\n \"scaleDistribution\": {\n \"type\": \"linear\"\n },\n \"spanNulls\": false,\n \"stack\": \"off\"\n },\n \"datasourceCate\": \"prometheus\",\n \"datasourceValue\": \"${DS_PROMETHEUS}\",\n \"id\": \"d0add8e0-c815-4442-8a3b-d86d3bc3d8fd\",\n \"layout\": {\n \"h\": 7,\n \"i\": \"d0add8e0-c815-4442-8a3b-d86d3bc3d8fd\",\n \"isResizable\": true,\n \"w\": 9,\n \"x\": 0,\n \"y\": 3\n },\n \"links\": [],\n \"maxPerRow\": 4,\n \"name\": \"Load Average\",\n \"options\": {\n \"legend\": {\n \"displayMode\": \"hidden\"\n },\n \"standardOptions\": {},\n \"thresholds\": {\n \"steps\": [\n {\n \"color\": \"#634CD9\",\n \"type\": \"base\",\n \"value\": null\n }\n ]\n },\n \"tooltip\": {\n \"mode\": \"all\",\n \"sort\": \"none\"\n }\n },\n \"targets\": [\n {\n \"expr\": \"max(node_load1{instance=~\\\"$instance\\\"}) / max(count(node_cpu_seconds_total{instance=~\\\"$instance\\\", mode=~\\\"system\\\"}))\",\n \"legend\": \"1m\",\n \"refId\": \"A\"\n },\n {\n \"expr\": \"max(node_load5{instance=~\\\"$instance\\\"}) / max(count(node_cpu_seconds_total{instance=~\\\"$instance\\\", mode=~\\\"system\\\"}))\",\n \"legend\": \"5m\",\n \"refId\": \"B\"\n },\n {\n \"expr\": \"max(node_load15{instance=~\\\"$instance\\\"}) / max(count(node_cpu_seconds_total{instance=~\\\"$instance\\\", mode=~\\\"system\\\"}))\",\n \"legend\": \"15m\",\n \"refId\": \"C\"\n }\n ],\n \"transformations\": [\n {\n \"id\": \"organize\",\n \"options\": {}\n }\n ],\n \"type\": \"timeseries\",\n \"version\": \"3.0.0\"\n },\n {\n \"custom\": {\n \"drawStyle\": \"lines\",\n \"fillOpacity\": 0.3,\n \"gradientMode\": \"opacity\",\n \"lineInterpolation\": \"smooth\",\n \"lineWidth\": 2,\n \"scaleDistribution\": {\n \"type\": \"linear\"\n },\n \"spanNulls\": false,\n \"stack\": \"off\"\n },\n \"datasourceCate\": \"prometheus\",\n \"datasourceValue\": \"${DS_PROMETHEUS}\",\n \"id\": \"83f3134f-1fdb-4bd6-bc2e-7d32222c2660\",\n \"layout\": {\n \"h\": 7,\n \"i\": \"83f3134f-1fdb-4bd6-bc2e-7d32222c2660\",\n \"isResizable\": true,\n \"w\": 15,\n \"x\": 9,\n \"y\": 3\n },\n \"links\": [],\n \"maxPerRow\": 4,\n \"name\": \"Resource Usage\",\n \"options\": {\n \"legend\": {\n \"displayMode\": \"hidden\"\n },\n \"standardOptions\": {},\n \"thresholds\": {\n \"steps\": [\n {\n \"color\": \"#634CD9\",\n \"type\": \"base\",\n \"value\": null\n }\n ]\n },\n \"tooltip\": {\n \"mode\": \"all\",\n \"sort\": \"none\"\n }\n },\n \"targets\": [\n {\n \"expr\": \"1 - (avg(irate(node_cpu_seconds_total{instance=~\\\"$instance\\\",mode=~\\\"idle\\\"}[2m])))\",\n \"legend\": \"CPU\",\n \"refId\": \"A\"\n },\n {\n \"expr\": \"(node_memory_MemTotal_bytes{instance=~\\\"$instance\\\"} - (node_memory_MemFree_bytes{instance=~\\\"$instance\\\"} + node_memory_Buffers_bytes{instance=~\\\"$instance\\\"} + node_memory_Cached_bytes{instance=~\\\"$instance\\\"})) / node_memory_MemTotal_bytes{instance=~\\\"$instance\\\"}\",\n \"legend\": \"MEM\",\n \"refId\": \"B\"\n },\n {\n \"expr\": \"avg(irate(node_cpu_seconds_total{instance=~\\\"$instance\\\",mode=~\\\"iowait\\\"}[2m]))\",\n \"legend\": \"IOWAIT\",\n \"refId\": \"C\"\n }\n ],\n \"transformations\": [\n {\n \"id\": \"organize\",\n \"options\": {}\n }\n ],\n \"type\": \"timeseries\",\n \"version\": \"3.0.0\"\n },\n {\n \"custom\": {\n \"drawStyle\": \"lines\",\n \"fillOpacity\": 0.3,\n \"gradientMode\": \"opacity\",\n \"lineInterpolation\": \"smooth\",\n \"lineWidth\": 2,\n \"scaleDistribution\": {\n \"type\": \"linear\"\n },\n \"spanNulls\": false,\n \"stack\": \"off\"\n },\n \"datasourceCate\": \"prometheus\",\n \"datasourceValue\": \"${DS_PROMETHEUS}\",\n \"id\": \"2a57ae69-c0e1-447c-825d-bcee2bcb6d3f\",\n \"layout\": {\n \"h\": 5,\n \"i\": \"2a57ae69-c0e1-447c-825d-bcee2bcb6d3f\",\n \"isResizable\": true,\n \"w\": 24,\n \"x\": 0,\n \"y\": 10\n },\n \"links\": [],\n \"maxPerRow\": 4,\n \"name\": \"Memory Usage\",\n \"options\": {\n \"legend\": {\n \"displayMode\": \"list\",\n \"placement\": \"bottom\"\n },\n \"standardOptions\": {},\n \"thresholds\": {\n \"steps\": [\n {\n \"color\": \"#634CD9\",\n \"type\": \"base\",\n \"value\": null\n }\n ]\n },\n \"tooltip\": {\n \"mode\": \"all\",\n \"sort\": \"desc\"\n }\n },\n \"targets\": [\n {\n \"expr\": \"node_memory_MemAvailable_bytes{instance=~\\\"$instance\\\"}\",\n \"legend\": \"Available\",\n \"refId\": \"A\"\n },\n {\n \"expr\": \"node_memory_Buffers_bytes{instance=~\\\"$instance\\\"} + node_memory_Cached_bytes{instance=~\\\"$instance\\\"}\",\n \"legend\": \"Buffers/Cached\",\n \"refId\": \"B\"\n },\n {\n \"expr\": \"node_memory_MemTotal_bytes{instance=~\\\"$instance\\\"} - node_memory_MemAvailable_bytes{instance=~\\\"$instance\\\"}\",\n \"legend\": \"Used\",\n \"refId\": \"C\"\n },\n {\n \"expr\": \"node_memory_MemFree_bytes{instance=~\\\"$instance\\\"}\",\n \"legend\": \"Free\",\n \"refId\": \"D\"\n },\n {\n \"expr\": \"node_memory_MemTotal_bytes{instance=~\\\"$instance\\\"}\",\n \"legend\": \"Total\",\n \"refId\": \"E\"\n }\n ],\n \"transformations\": [\n {\n \"id\": \"organize\",\n \"options\": {}\n }\n ],\n \"type\": \"timeseries\",\n \"version\": \"3.0.0\"\n },\n {\n \"custom\": {\n \"drawStyle\": \"lines\",\n \"fillOpacity\": 0.1,\n \"gradientMode\": \"none\",\n \"lineInterpolation\": \"linear\",\n \"lineWidth\": 1,\n \"scaleDistribution\": {\n \"type\": \"linear\"\n },\n \"spanNulls\": false,\n \"stack\": \"off\"\n },\n \"datasourceCate\": \"prometheus\",\n \"datasourceValue\": \"${DS_PROMETHEUS}\",\n \"id\": \"f291673f-3b9d-4b4f-a2b1-2ed7131e57f0\",\n \"layout\": {\n \"h\": 9,\n \"i\": \"f291673f-3b9d-4b4f-a2b1-2ed7131e57f0\",\n \"isResizable\": true,\n \"w\": 15,\n \"x\": 0,\n \"y\": 15\n },\n \"links\": [],\n \"maxPerRow\": 4,\n \"name\": \"Disk IO\",\n \"options\": {\n \"legend\": {\n \"displayMode\": \"list\",\n \"placement\": \"bottom\"\n },\n \"standardOptions\": {\n \"util\": \"none\"\n },\n \"thresholds\": {\n \"steps\": [\n {\n \"color\": \"#73BF69\",\n \"type\": \"base\",\n \"value\": null\n }\n ]\n },\n \"tooltip\": {\n \"mode\": \"multi\"\n }\n },\n \"targets\": [\n {\n \"expr\": \"sum by (instance) (irate(node_disk_reads_completed_total{instance=~\\\"$instance\\\"}[1m]))\",\n \"legend\": \"{{instance}}-Reads\",\n \"refId\": \"A\"\n },\n {\n \"expr\": \"sum by (instance) (irate(node_disk_writes_completed_total{instance=~\\\"$instance\\\"}[1m]))\",\n \"legend\": \"{{instance}}-Writes\",\n \"refId\": \"B\"\n },\n {\n \"expr\": \"sum by (instance) (node_disk_io_now{instance=~\\\"$instance\\\"})\",\n \"legend\": \"{{instance}}-CurrentIO\",\n \"refId\": \"C\"\n },\n {\n \"expr\": \"sum by (instance) (irate(node_disk_read_time_seconds_total{instance=~\\\"$instance\\\"}[5m])) / sum by (instance) (irate(node_disk_reads_completed_total{instance=~\\\"$instance\\\"}[5m]))\",\n \"legend\": \"{{instance}}-Read-consuming\",\n \"refId\": \"D\"\n },\n {\n \"expr\": \"sum by (instance) (irate(node_disk_write_time_seconds_total{instance=~\\\"$instance\\\"}[5m])) / sum by (instance) (irate(node_disk_writes_completed_total{instance=~\\\"$instance\\\"}[5m]))\",\n \"legend\": \"{{instance}}-Write-consuming\",\n \"refId\": \"E\"\n }\n ],\n \"transformations\": [\n {\n \"id\": \"organize\",\n \"options\": {}\n }\n ],\n \"type\": \"timeseries\",\n \"version\": \"3.0.0\"\n },\n {\n \"custom\": {\n \"drawStyle\": \"lines\",\n \"fillOpacity\": 0.3,\n \"gradientMode\": \"opacity\",\n \"lineInterpolation\": \"smooth\",\n \"lineWidth\": 2,\n \"scaleDistribution\": {\n \"type\": \"linear\"\n },\n \"spanNulls\": false,\n \"stack\": \"off\"\n },\n \"datasourceCate\": \"prometheus\",\n \"datasourceValue\": \"${DS_PROMETHEUS}\",\n \"id\": \"8cb012a2-113c-4d06-8bea-da7d14a870d2\",\n \"layout\": {\n \"h\": 9,\n \"i\": \"8cb012a2-113c-4d06-8bea-da7d14a870d2\",\n \"isResizable\": true,\n \"w\": 9,\n \"x\": 15,\n \"y\": 15\n },\n \"links\": [],\n \"maxPerRow\": 4,\n \"name\": \"Disk Usage\",\n \"options\": {\n \"legend\": {\n \"displayMode\": \"list\",\n \"placement\": \"bottom\"\n },\n \"standardOptions\": {},\n \"thresholds\": {\n \"steps\": [\n {\n \"color\": \"#634CD9\",\n \"type\": \"base\",\n \"value\": null\n }\n ]\n },\n \"tooltip\": {\n \"mode\": \"all\",\n \"sort\": \"none\"\n }\n },\n \"targets\": [\n {\n \"expr\": \"node_filesystem_avail_bytes{instance=~\\\"$instance\\\",fstype=~\\\"ext4|xfs|nfs\\\"}\",\n \"instant\": false,\n \"legend\": \"{{device}}\",\n \"refId\": \"A\"\n },\n {\n \"expr\": \"1-(node_filesystem_free_bytes{instance=~\\\"$instance\\\",fstype=~\\\"ext4|xfs|nfs\\\"} / node_filesystem_size_bytes{instance=\\\"$instance\\\",fstype=~\\\"ext4|xfs|nfs\\\"})\",\n \"legend\": \"{{device}}\",\n \"refId\": \"B\"\n },\n {\n \"expr\": \"sum(node_filesystem_size_bytes{instance=~\\\"$instance\\\",fstype=~\\\"ext4|xfs|nfs\\\"})\",\n \"legend\": \"{{device}}\",\n \"refId\": \"C\"\n }\n ],\n \"transformations\": [\n {\n \"id\": \"organize\",\n \"options\": {}\n }\n ],\n \"type\": \"timeseries\",\n \"version\": \"3.0.0\"\n },\n {\n \"custom\": {\n \"drawStyle\": \"lines\",\n \"fillOpacity\": 0.3,\n \"gradientMode\": \"opacity\",\n \"lineInterpolation\": \"linear\",\n \"lineWidth\": 2,\n \"scaleDistribution\": {\n \"type\": \"linear\"\n },\n \"spanNulls\": false,\n \"stack\": \"off\"\n },\n \"datasourceCate\": \"prometheus\",\n \"datasourceValue\": \"${DS_PROMETHEUS}\",\n \"id\": \"2f11831d-6bdd-4cfa-9b3f-3bc5b1722185\",\n \"layout\": {\n \"h\": 10,\n \"i\": \"2f11831d-6bdd-4cfa-9b3f-3bc5b1722185\",\n \"isResizable\": true,\n \"w\": 24,\n \"x\": 0,\n \"y\": 24\n },\n \"links\": [],\n \"maxPerRow\": 4,\n \"name\": \"Network Traffic\",\n \"options\": {\n \"legend\": {\n \"displayMode\": \"hidden\"\n },\n \"standardOptions\": {},\n \"thresholds\": {\n \"steps\": [\n {\n \"color\": \"#634CD9\",\n \"type\": \"base\",\n \"value\": null\n }\n ]\n },\n \"tooltip\": {\n \"mode\": \"all\",\n \"sort\": \"none\"\n }\n },\n \"targets\": [\n {\n \"expr\": \"sum by (instance) (irate(node_network_receive_bytes_total{instance=~\\\"$instance\\\",device!~\\\"tap.*|veth.*|br.*|docker.*|virbr*|lo*|nointernet*\\\"}[5m]))\",\n \"legend\": \"{{instance}}-{{device}}-receive\",\n \"refId\": \"A\"\n },\n {\n \"expr\": \"sum by (instance) (irate(node_network_transmit_bytes_total{instance=~\\\"$instance\\\",device!~\\\"tap.*|veth.*|br.*|docker.*|virbr*|lo*|nointernet*\\\"}[5m]))\",\n \"legend\": \"{{instance}}-{{device}}-transmit\",\n \"refId\": \"B\"\n }\n ],\n \"transformations\": [\n {\n \"id\": \"organize\",\n \"options\": {}\n }\n ],\n \"type\": \"timeseries\",\n \"version\": \"3.0.0\"\n }\n ],\n \"var\": [\n {\n \"definition\": \"prometheus\",\n \"name\": \"DS_PROMETHEUS\",\n \"type\": \"datasource\"\n },\n {\n \"datasource\": {\n \"cate\": \"prometheus\",\n \"value\": \"${DS_PROMETHEUS}\"\n },\n \"definition\": \"query_result(node_boot_time_seconds)\",\n \"multi\": false,\n \"name\": \"instance\",\n \"reg\": \"/instance=\\\"(?\\u003ctext\\u003e[^\\\"]*)/\",\n \"type\": \"query\"\n }\n ],\n \"version\": \"3.0.0\"\n },\n \"public\": 0,\n \"public_cate\": 0,\n \"bgids\": null,\n \"built_in\": 0,\n \"hide\": 0,\n \"uuid\": 1717556327479287000\n}"
},
{
"path": "integrations/Gitlab/dashboards/NGINXVTS.json",
"content": "{\n \"id\": 0,\n \"group_id\": 0,\n \"name\": \"GitLab - NGINX VTS\",\n \"ident\": \"\",\n \"tags\": \"\",\n \"create_at\": 0,\n \"create_by\": \"\",\n \"update_at\": 0,\n \"update_by\": \"\",\n \"configs\": {\n \"links\": [],\n \"panels\": [\n {\n \"custom\": {\n \"drawStyle\": \"lines\",\n \"fillOpacity\": 0.3,\n \"gradientMode\": \"opacity\",\n \"lineInterpolation\": \"smooth\",\n \"lineWidth\": 2,\n \"scaleDistribution\": {\n \"type\": \"linear\"\n },\n \"spanNulls\": false,\n \"stack\": \"off\"\n },\n \"datasourceCate\": \"prometheus\",\n \"datasourceValue\": \"${DS_PROMETHEUS}\",\n \"id\": \"ad321a25-c895-4cf0-b5ce-2a60c7f035ac\",\n \"layout\": {\n \"h\": 4,\n \"i\": \"ad321a25-c895-4cf0-b5ce-2a60c7f035ac\",\n \"w\": 7,\n \"x\": 0,\n \"y\": 0\n },\n \"links\": [],\n \"maxPerRow\": 4,\n \"name\": \"Nginx Info\",\n \"options\": {\n \"legend\": {\n \"displayMode\": \"hidden\"\n },\n \"standardOptions\": {},\n \"thresholds\": {\n \"steps\": [\n {\n \"color\": \"#634CD9\",\n \"type\": \"base\",\n \"value\": null\n }\n ]\n },\n \"tooltip\": {\n \"mode\": \"all\",\n \"sort\": \"none\"\n }\n },\n \"targets\": [\n {\n \"expr\": \"topk(1, count by (hostname) (nginx_vts_info{instance=~\\\"$instance\\\"}))\",\n \"legend\": \"hostname: {{hostname}}\",\n \"refId\": \"B\"\n },\n {\n \"expr\": \"topk(1, count by (version) (nginx_vts_info{instance=~\\\"$instance\\\"}))\",\n \"legend\": \"nginx: {{version}}\",\n \"refId\": \"C\"\n }\n ],\n \"transformations\": [\n {\n \"id\": \"organize\",\n \"options\": {}\n }\n ],\n \"type\": \"timeseries\",\n \"version\": \"3.0.0\"\n },\n {\n \"custom\": {\n \"drawStyle\": \"lines\",\n \"fillOpacity\": 0.1,\n \"gradientMode\": \"none\",\n \"lineInterpolation\": \"linear\",\n \"lineWidth\": 1,\n \"scaleDistribution\": {\n \"type\": \"linear\"\n },\n \"spanNulls\": false,\n \"stack\": \"off\"\n },\n \"datasourceCate\": \"prometheus\",\n \"datasourceValue\": \"${DS_PROMETHEUS}\",\n \"id\": \"f6643654-98f5-4d4a-8dd2-943a2f4f8e68\",\n \"layout\": {\n \"h\": 12,\n \"i\": \"f6643654-98f5-4d4a-8dd2-943a2f4f8e68\",\n \"w\": 17,\n \"x\": 7,\n \"y\": 0\n },\n \"links\": [],\n \"maxPerRow\": 4,\n \"name\": \"Latency\",\n \"options\": {\n \"legend\": {\n \"displayMode\": \"list\",\n \"placement\": \"bottom\"\n },\n \"standardOptions\": {\n \"min\": 0,\n \"util\": \"seconds\"\n },\n \"thresholds\": {\n \"steps\": [\n {\n \"color\": \"#73BF69\",\n \"type\": \"base\",\n \"value\": null\n },\n {\n \"color\": \"#F2495C\",\n \"value\": 80\n }\n ]\n },\n \"tooltip\": {\n \"mode\": \"multi\"\n }\n },\n \"targets\": [\n {\n \"expr\": \"sum by (instance) (\\n rate(nginx_vts_upstream_request_seconds_total{instance=~\\\"$instance\\\"}[5m])\\n) /\\nsum by (instance) (\\n rate(nginx_vts_upstream_requests_total{instance=~\\\"$instance\\\"}[5m])\\n)\",\n \"instant\": false,\n \"legend\": \"{{instance}}\",\n \"refId\": \"A\",\n \"step\": 15,\n \"time\": {\n \"end\": \"now\",\n \"start\": \"now-6h\"\n }\n }\n ],\n \"transformations\": [\n {\n \"id\": \"organize\",\n \"options\": {}\n }\n ],\n \"type\": \"timeseries\",\n \"version\": \"3.0.0\"\n },\n {\n \"custom\": {\n \"drawStyle\": \"lines\",\n \"fillOpacity\": 0.3,\n \"gradientMode\": \"opacity\",\n \"lineInterpolation\": \"smooth\",\n \"lineWidth\": 2,\n \"scaleDistribution\": {\n \"type\": \"linear\"\n },\n \"spanNulls\": false,\n \"stack\": \"off\"\n },\n \"datasourceCate\": \"prometheus\",\n \"datasourceValue\": \"${DS_PROMETHEUS}\",\n \"id\": \"cb24fbce-8bb5-425e-89f3-c32e22532b5d\",\n \"layout\": {\n \"h\": 8,\n \"i\": \"cb24fbce-8bb5-425e-89f3-c32e22532b5d\",\n \"w\": 7,\n \"x\": 0,\n \"y\": 4\n },\n \"links\": [],\n \"maxPerRow\": 4,\n \"name\": \"Shared Memory Usage\",\n \"options\": {\n \"legend\": {\n \"displayMode\": \"hidden\"\n },\n \"standardOptions\": {},\n \"thresholds\": {\n \"steps\": [\n {\n \"color\": \"#634CD9\",\n \"type\": \"base\",\n \"value\": null\n }\n ]\n },\n \"tooltip\": {\n \"mode\": \"all\",\n \"sort\": \"none\"\n }\n },\n \"targets\": [\n {\n \"expr\": \"sum by (shared) (nginx_vts_main_shm_usage_bytes{instance=~\\\"$instance\\\", job=~\\\"nginx\\\"})\",\n \"legend\": \"{{shared}}\",\n \"refId\": \"A\"\n }\n ],\n \"transformations\": [\n {\n \"id\": \"organize\",\n \"options\": {}\n }\n ],\n \"type\": \"timeseries\",\n \"version\": \"3.0.0\"\n },\n {\n \"custom\": {\n \"drawStyle\": \"lines\",\n \"fillOpacity\": 0.2,\n \"gradientMode\": \"none\",\n \"lineInterpolation\": \"linear\",\n \"lineWidth\": 1,\n \"scaleDistribution\": {\n \"type\": \"linear\"\n },\n \"spanNulls\": false,\n \"stack\": \"off\"\n },\n \"datasourceCate\": \"prometheus\",\n \"datasourceValue\": \"${DS_PROMETHEUS}\",\n \"id\": \"54c5264a-a596-486f-a4a8-4ab451d91870\",\n \"layout\": {\n \"h\": 8,\n \"i\": \"54c5264a-a596-486f-a4a8-4ab451d91870\",\n \"w\": 12,\n \"x\": 0,\n \"y\": 13\n },\n \"links\": [],\n \"maxPerRow\": 4,\n \"name\": \"Server - Current total of incoming / outgoing bytes\",\n \"options\": {\n \"legend\": {\n \"displayMode\": \"list\",\n \"placement\": \"bottom\"\n },\n \"standardOptions\": {\n \"util\": \"bytesSI\"\n },\n \"thresholds\": {\n \"steps\": [\n {\n \"color\": \"#73BF69\",\n \"type\": \"base\",\n \"value\": null\n },\n {\n \"color\": \"#F2495C\",\n \"value\": 80\n }\n ]\n },\n \"tooltip\": {\n \"mode\": \"multi\"\n }\n },\n \"targets\": [\n {\n \"expr\": \"sum without (instance) (\\n rate(nginx_vts_server_bytes_total{instance=~\\\"$instance\\\"}[5m])\\n)\",\n \"legend\": \"{{direction}}-{{host}}\",\n \"refId\": \"A\"\n }\n ],\n \"transformations\": [\n {\n \"id\": \"organize\",\n \"options\": {}\n }\n ],\n \"type\": \"timeseries\",\n \"version\": \"3.0.0\"\n },\n {\n \"custom\": {\n \"drawStyle\": \"lines\",\n \"fillOpacity\": 0.1,\n \"gradientMode\": \"none\",\n \"lineInterpolation\": \"linear\",\n \"lineWidth\": 1,\n \"scaleDistribution\": {\n \"type\": \"linear\"\n },\n \"spanNulls\": false,\n \"stack\": \"off\"\n },\n \"datasourceCate\": \"prometheus\",\n \"datasourceValue\": \"${DS_PROMETHEUS}\",\n \"id\": \"d0efa52f-862e-49b0-aa8c-7a9ba4f2af0b\",\n \"layout\": {\n \"h\": 8,\n \"i\": \"d0efa52f-862e-49b0-aa8c-7a9ba4f2af0b\",\n \"w\": 12,\n \"x\": 12,\n \"y\": 13\n },\n \"links\": [],\n \"maxPerRow\": 4,\n \"name\": \"Upstream - Current total of incoming / outgoing bytes\",\n \"options\": {\n \"legend\": {\n \"displayMode\": \"list\",\n \"placement\": \"bottom\"\n },\n \"standardOptions\": {\n \"util\": \"bytesSI\"\n },\n \"thresholds\": {\n \"steps\": [\n {\n \"color\": \"#73BF69\",\n \"type\": \"base\",\n \"value\": null\n },\n {\n \"color\": \"#F2495C\",\n \"value\": 80\n }\n ]\n },\n \"tooltip\": {\n \"mode\": \"multi\"\n }\n },\n \"targets\": [\n {\n \"expr\": \"sum without (instance) (\\n rate(nginx_vts_upstream_bytes_total{instance=~\\\"$instance\\\"}[5m])\\n)\",\n \"legend\": \"{{direction}}-{{backend}}-{{upstream}}\",\n \"refId\": \"A\"\n }\n ],\n \"transformations\": [\n {\n \"id\": \"organize\",\n \"options\": {}\n }\n ],\n \"type\": \"timeseries\",\n \"version\": \"3.0.0\"\n },\n {\n \"custom\": {\n \"drawStyle\": \"lines\",\n \"fillOpacity\": 0.2,\n \"gradientMode\": \"none\",\n \"lineInterpolation\": \"linear\",\n \"lineWidth\": 1,\n \"scaleDistribution\": {\n \"type\": \"linear\"\n },\n \"spanNulls\": false,\n \"stack\": \"off\"\n },\n \"datasourceCate\": \"prometheus\",\n \"datasourceValue\": \"${DS_PROMETHEUS}\",\n \"id\": \"712b82cd-633a-4088-8695-fa2d75ab37ca\",\n \"layout\": {\n \"h\": 8,\n \"i\": \"712b82cd-633a-4088-8695-fa2d75ab37ca\",\n \"w\": 12,\n \"x\": 0,\n \"y\": 22\n },\n \"links\": [],\n \"maxPerRow\": 4,\n \"name\": \"Server - Requests by HTTP code\",\n \"options\": {\n \"legend\": {\n \"displayMode\": \"list\",\n \"placement\": \"bottom\"\n },\n \"standardOptions\": {\n \"min\": 0,\n \"util\": \"none\"\n },\n \"thresholds\": {\n \"steps\": [\n {\n \"color\": \"#73BF69\",\n \"type\": \"base\",\n \"value\": null\n },\n {\n \"color\": \"#F2495C\",\n \"value\": 80\n }\n ]\n },\n \"tooltip\": {\n \"mode\": \"multi\"\n }\n },\n \"targets\": [\n {\n \"expr\": \"sum without (instance) (\\n rate(nginx_vts_server_requests_total{instance=~\\\"$instance\\\"}[5m])\\n)\",\n \"legend\": \"{{code}} {{host}}\",\n \"refId\": \"A\"\n }\n ],\n \"transformations\": [\n {\n \"id\": \"organize\",\n \"options\": {}\n }\n ],\n \"type\": \"timeseries\",\n \"version\": \"3.0.0\"\n },\n {\n \"custom\": {\n \"drawStyle\": \"lines\",\n \"fillOpacity\": 0.2,\n \"gradientMode\": \"none\",\n \"lineInterpolation\": \"linear\",\n \"lineWidth\": 1,\n \"scaleDistribution\": {\n \"type\": \"linear\"\n },\n \"spanNulls\": false,\n \"stack\": \"off\"\n },\n \"datasourceCate\": \"prometheus\",\n \"datasourceValue\": \"${DS_PROMETHEUS}\",\n \"id\": \"09ca96b6-4e23-4db2-bc14-79c5f965d16f\",\n \"layout\": {\n \"h\": 8,\n \"i\": \"09ca96b6-4e23-4db2-bc14-79c5f965d16f\",\n \"w\": 12,\n \"x\": 12,\n \"y\": 22\n },\n \"links\": [],\n \"maxPerRow\": 4,\n \"name\": \"Upstream - Requests by HTTP code\",\n \"options\": {\n \"legend\": {\n \"displayMode\": \"list\",\n \"placement\": \"bottom\"\n },\n \"standardOptions\": {\n \"util\": \"none\"\n },\n \"thresholds\": {\n \"steps\": [\n {\n \"color\": \"#73BF69\",\n \"type\": \"base\",\n \"value\": null\n },\n {\n \"color\": \"#F2495C\",\n \"value\": 80\n }\n ]\n },\n \"tooltip\": {\n \"mode\": \"multi\"\n }\n },\n \"targets\": [\n {\n \"expr\": \"sum without (instance) (\\n rate(nginx_vts_upstream_requests_total{instance=~\\\"$instance\\\"}[5m])\\n)\",\n \"legend\": \"{{code}} {{backend}} {{upstream }}\",\n \"refId\": \"A\"\n }\n ],\n \"transformations\": [\n {\n \"id\": \"organize\",\n \"options\": {}\n }\n ],\n \"type\": \"timeseries\",\n \"version\": \"3.0.0\"\n }\n ],\n \"var\": [\n {\n \"definition\": \"prometheus\",\n \"name\": \"DS_PROMETHEUS\",\n \"type\": \"datasource\"\n },\n {\n \"allOption\": true,\n \"datasource\": {\n \"cate\": \"prometheus\",\n \"value\": \"${DS_PROMETHEUS}\"\n },\n \"definition\": \"label_values(up{job=\\\"nginx\\\"}, instance)\",\n \"multi\": true,\n \"name\": \"instance\",\n \"reg\": \"\",\n \"type\": \"query\"\n }\n ],\n \"version\": \"3.0.0\"\n },\n \"public\": 0,\n \"public_cate\": 0,\n \"bgids\": null,\n \"built_in\": 0,\n \"hide\": 0,\n \"uuid\": 1717556327480972000\n}"
},
{
"path": "integrations/Gitlab/dashboards/Overview.json",
"content": "{\n \"id\": 0,\n \"group_id\": 0,\n \"name\": \"GitLab - Overview\",\n \"ident\": \"\",\n \"tags\": \"\",\n \"create_at\": 0,\n \"create_by\": \"\",\n \"update_at\": 0,\n \"update_by\": \"\",\n \"configs\": {\n \"links\": [\n {\n \"title\": \"GitLab Docs\",\n \"url\": \"https://docs.gitlab.com/\"\n }\n ],\n \"panels\": [\n {\n \"custom\": {\n \"alignItems\": \"center\",\n \"bgColor\": \"#FFFFFF\",\n \"content\": \"\\u003cbr\\u003e\\u003ch1\\u003e\\u003ci\\u003e\\u003cfont color=#5991A7\\u003e\\u003cb\\u003eGitLab Service Status\\u003c/b\\u003e\\u003c/font\\u003e\\u003c/i\\u003e\\u003c/h1\\u003e\\n\",\n \"justifyContent\": \"center\",\n \"textColor\": \"#000000\",\n \"textSize\": 12\n },\n \"id\": \"ffcfeb75-3a21-40b1-8fe7-313aa3e5f4e3\",\n \"layout\": {\n \"h\": 3,\n \"i\": \"ffcfeb75-3a21-40b1-8fe7-313aa3e5f4e3\",\n \"isResizable\": true,\n \"w\": 24,\n \"x\": 0,\n \"y\": 0\n },\n \"links\": [],\n \"maxPerRow\": 4,\n \"name\": \"\",\n \"type\": \"text\",\n \"version\": \"3.0.0\"\n },\n {\n \"custom\": {\n \"alignItems\": \"center\",\n \"bgColor\": \"#FFFFFF\",\n \"content\": \"\\u003cp style=\\\"text-align:center;\\\"\\u003e\\u003cimg src=\\\"https://www.cloudfoundry.org/wp-content/uploads/2017/10/icon_gitlab_cf@2x.png\\\" width=80px/\\u003e\\u003c/p\\u003e\",\n \"justifyContent\": \"center\",\n \"textColor\": \"#000000\",\n \"textSize\": 12\n },\n \"id\": \"9991440f-1e01-4807-8911-2619329af244\",\n \"layout\": {\n \"h\": 3,\n \"i\": \"9991440f-1e01-4807-8911-2619329af244\",\n \"isResizable\": true,\n \"w\": 2,\n \"x\": 0,\n \"y\": 3\n },\n \"links\": [],\n \"maxPerRow\": 4,\n \"name\": \"Gitlab\",\n \"type\": \"text\",\n \"version\": \"3.0.0\"\n },\n {\n \"custom\": {\n \"calc\": \"first\",\n \"colSpan\": 1,\n \"colorMode\": \"value\",\n \"graphMode\": \"none\",\n \"textMode\": \"value\",\n \"textSize\": {},\n \"valueField\": \"version\"\n },\n \"datasourceCate\": \"prometheus\",\n \"datasourceValue\": \"${DS_PROMETHEUS}\",\n \"id\": \"f3fcab1f-d198-48c6-bf1d-44e481a9fa7a\",\n \"layout\": {\n \"h\": 3,\n \"i\": \"f3fcab1f-d198-48c6-bf1d-44e481a9fa7a\",\n \"isResizable\": true,\n \"w\": 5,\n \"x\": 2,\n \"y\": 3\n },\n \"links\": [],\n \"maxPerRow\": 4,\n \"name\": \"GitLab Version\",\n \"options\": {\n \"standardOptions\": {\n \"util\": \"none\"\n },\n \"thresholds\": {\n \"steps\": [\n {\n \"color\": \"#73BF69\",\n \"type\": \"base\",\n \"value\": null\n },\n {\n \"color\": \"#F2495C\",\n \"value\": 80\n }\n ]\n },\n \"valueMappings\": [\n {\n \"id\": 0,\n \"op\": \"=\",\n \"text\": \"N/A\",\n \"type\": 1,\n \"value\": \"null\"\n }\n ]\n },\n \"targets\": [\n {\n \"expr\": \"topk(1, count by (version) (gitlab_build_info{job=~\\\"gitlab-workhorse\\\"}))\",\n \"legend\": \"\",\n \"refId\": \"A\"\n }\n ],\n \"transformations\": [\n {\n \"id\": \"organize\",\n \"options\": {}\n }\n ],\n \"type\": \"stat\",\n \"version\": \"3.0.0\"\n },\n {\n \"custom\": {\n \"calc\": \"lastNotNull\",\n \"colorDomainAuto\": true,\n \"colorRange\": [\n \"#f0ee6e\",\n \"#6ba261\",\n \"#306d52\"\n ],\n \"reverseColorOrder\": false,\n \"textMode\": \"valueAndName\"\n },\n \"datasourceCate\": \"prometheus\",\n \"datasourceValue\": \"${DS_PROMETHEUS}\",\n \"id\": \"7a4c7be6-56de-4c76-8c2f-cef5a80e84b5\",\n \"layout\": {\n \"h\": 3,\n \"i\": \"7a4c7be6-56de-4c76-8c2f-cef5a80e84b5\",\n \"isResizable\": true,\n \"w\": 17,\n \"x\": 7,\n \"y\": 3\n },\n \"links\": [],\n \"maxPerRow\": 4,\n \"name\": \"Service Status\",\n \"options\": {\n \"standardOptions\": {}\n },\n \"targets\": [\n {\n \"expr\": \"sum(up{job!~\\\"gitlab_exporter.*|node\\\",instance!~\\\".*:9168\\\",service=~\\\"gitlab\\\"}) by (job) / count(up{job!~\\\"gitlab_exporter.*|node\\\",instance!~\\\".*:9168\\\",service=~\\\"gitlab\\\"}) by (job) * 100\",\n \"legend\": \"{{job}}\",\n \"refId\": \"A\"\n }\n ],\n \"transformations\": [\n {\n \"id\": \"organize\",\n \"options\": {}\n }\n ],\n \"type\": \"hexbin\",\n \"version\": \"3.0.0\"\n },\n {\n \"custom\": {\n \"content\": \"\\u003cbr\\u003e\\u003ch1\\u003e\\u003ci\\u003e\\u003cfont color=#5991A7\\u003e\\u003cb\\u003eSidekiq Statistics\\u003c/b\\u003e\\u003c/font\\u003e\\u003c/i\\u003e\\u003c/h1\\u003e\\n\",\n \"version\": \"3.0.0\"\n },\n \"id\": \"9efa19b0-18fd-4f4d-abee-cebe09a36803\",\n \"layout\": {\n \"h\": 2,\n \"i\": \"9efa19b0-18fd-4f4d-abee-cebe09a36803\",\n \"isResizable\": true,\n \"w\": 24,\n \"x\": 0,\n \"y\": 6\n },\n \"links\": [],\n \"maxPerRow\": 4,\n \"options\": {\n \"legend\": {\n \"displayMode\": \"list\"\n },\n \"standardOptions\": {\n \"util\": \"none\"\n },\n \"thresholds\": {\n \"steps\": [],\n \"style\": \"line\"\n },\n \"tooltip\": {\n \"mode\": \"multi\"\n }\n },\n \"targets\": [],\n \"type\": \"text\",\n \"version\": \"3.0.0\"\n },\n {\n \"custom\": {\n \"calc\": \"lastNotNull\",\n \"colorDomainAuto\": true,\n \"colorRange\": [\n \"#83c898\",\n \"#c2c2c2\",\n \"#fc653f\"\n ],\n \"reverseColorOrder\": false,\n \"textMode\": \"valueAndName\"\n },\n \"datasourceCate\": \"prometheus\",\n \"datasourceValue\": \"${DS_PROMETHEUS}\",\n \"id\": \"fd0e96e0-7577-4475-8287-143d9d7e0bc7\",\n \"layout\": {\n \"h\": 4,\n \"i\": \"fd0e96e0-7577-4475-8287-143d9d7e0bc7\",\n \"isResizable\": true,\n \"w\": 12,\n \"x\": 0,\n \"y\": 8\n },\n \"links\": [],\n \"maxPerRow\": 4,\n \"name\": \"Background Jobs\",\n \"options\": {\n \"standardOptions\": {}\n },\n \"targets\": [\n {\n \"expr\": \"max(sidekiq_jobs_processed_total)\",\n \"legend\": \"Processed\",\n \"refId\": \"A\"\n },\n {\n \"expr\": \"max(sidekiq_jobs_failed_total)\",\n \"legend\": \"Failed\",\n \"refId\": \"B\"\n },\n {\n \"expr\": \"max(sidekiq_jobs_enqueued_size)\",\n \"legend\": \"Enqueued\",\n \"refId\": \"C\"\n },\n {\n \"expr\": \"max(sidekiq_jobs_scheduled_size)\",\n \"legend\": \"Scheduled\",\n \"refId\": \"D\"\n },\n {\n \"expr\": \"max(sidekiq_jobs_retry_size)\",\n \"legend\": \"Retry\",\n \"refId\": \"E\"\n },\n {\n \"expr\": \"max(sidekiq_jobs_dead_size)\",\n \"legend\": \"Dead\",\n \"refId\": \"F\"\n },\n {\n \"expr\": \"max(sidekiq_processes_size)\",\n \"legend\": \"Processes\",\n \"refId\": \"G\"\n }\n ],\n \"transformations\": [\n {\n \"id\": \"organize\",\n \"options\": {}\n }\n ],\n \"type\": \"hexbin\",\n \"version\": \"3.0.0\"\n },\n {\n \"custom\": {\n \"drawStyle\": \"lines\",\n \"fillOpacity\": 0.3,\n \"gradientMode\": \"opacity\",\n \"lineInterpolation\": \"linear\",\n \"lineWidth\": 2,\n \"scaleDistribution\": {\n \"type\": \"linear\"\n },\n \"spanNulls\": false,\n \"stack\": \"off\"\n },\n \"datasourceCate\": \"prometheus\",\n \"datasourceValue\": \"${DS_PROMETHEUS}\",\n \"id\": \"1645b734-ef79-4ff5-8be4-a24747cf4e6e\",\n \"layout\": {\n \"h\": 4,\n \"i\": \"1645b734-ef79-4ff5-8be4-a24747cf4e6e\",\n \"isResizable\": true,\n \"w\": 12,\n \"x\": 12,\n \"y\": 8\n },\n \"links\": [],\n \"maxPerRow\": 4,\n \"name\": \"Queue Size Top 10\",\n \"options\": {\n \"legend\": {\n \"displayMode\": \"hidden\"\n },\n \"standardOptions\": {},\n \"thresholds\": {\n \"steps\": [\n {\n \"color\": \"#634CD9\",\n \"type\": \"base\",\n \"value\": null\n }\n ]\n },\n \"tooltip\": {\n \"mode\": \"all\",\n \"sort\": \"none\"\n }\n },\n \"targets\": [\n {\n \"expr\": \"topk(10, avg_over_time(sidekiq_queue_size{}[5m]))\",\n \"legend\": \"{{name}}\",\n \"refId\": \"B\"\n }\n ],\n \"transformations\": [\n {\n \"id\": \"organize\",\n \"options\": {}\n }\n ],\n \"type\": \"timeseries\",\n \"version\": \"3.0.0\"\n },\n {\n \"custom\": {\n \"content\": \"\\u003cbr\\u003e\\u003ch1\\u003e\\u003ci\\u003e\\u003cfont color=#5991A7\\u003e\\u003cb\\u003eWorkhorse Statistics\\u003c/b\\u003e\\u003c/font\\u003e\\u003c/i\\u003e\\u003c/h1\\u003e\",\n \"version\": \"3.0.0\"\n },\n \"id\": \"e25e6cfb-020b-4743-8de9-ef6240144a94\",\n \"layout\": {\n \"h\": 2,\n \"i\": \"e25e6cfb-020b-4743-8de9-ef6240144a94\",\n \"isResizable\": true,\n \"w\": 24,\n \"x\": 0,\n \"y\": 12\n },\n \"links\": [],\n \"maxPerRow\": 4,\n \"options\": {\n \"legend\": {\n \"displayMode\": \"list\"\n },\n \"standardOptions\": {\n \"util\": \"none\"\n },\n \"thresholds\": {\n \"steps\": [],\n \"style\": \"line\"\n },\n \"tooltip\": {\n \"mode\": \"multi\"\n }\n },\n \"targets\": [],\n \"type\": \"text\",\n \"version\": \"3.0.0\"\n },\n {\n \"custom\": {\n \"drawStyle\": \"lines\",\n \"fillOpacity\": 0.3,\n \"gradientMode\": \"opacity\",\n \"lineInterpolation\": \"linear\",\n \"lineWidth\": 2,\n \"scaleDistribution\": {\n \"type\": \"linear\"\n },\n \"spanNulls\": false,\n \"stack\": \"off\"\n },\n \"datasourceCate\": \"prometheus\",\n \"datasourceValue\": \"${DS_PROMETHEUS}\",\n \"id\": \"dd030993-481d-43e4-887a-3c0dee279ea0\",\n \"layout\": {\n \"h\": 9,\n \"i\": \"dd030993-481d-43e4-887a-3c0dee279ea0\",\n \"isResizable\": true,\n \"w\": 12,\n \"x\": 0,\n \"y\": 14\n },\n \"links\": [],\n \"maxPerRow\": 4,\n \"name\": \"Http Request Total\",\n \"options\": {\n \"legend\": {\n \"displayMode\": \"hidden\"\n },\n \"standardOptions\": {},\n \"thresholds\": {\n \"steps\": [\n {\n \"color\": \"#634CD9\",\n \"type\": \"base\",\n \"value\": null\n }\n ]\n },\n \"tooltip\": {\n \"mode\": \"all\",\n \"sort\": \"none\"\n }\n },\n \"targets\": [\n {\n \"expr\": \"sum by (code) (\\n rate(gitlab_workhorse_http_requests_total{instance=~\\\".*:9229\\\"}[5m])\\n)\",\n \"legend\": \"{{code}}\",\n \"refId\": \"B\"\n }\n ],\n \"transformations\": [\n {\n \"id\": \"organize\",\n \"options\": {}\n }\n ],\n \"type\": \"timeseries\",\n \"version\": \"3.0.0\"\n },\n {\n \"custom\": {\n \"drawStyle\": \"lines\",\n \"fillOpacity\": 0.3,\n \"gradientMode\": \"opacity\",\n \"lineInterpolation\": \"smooth\",\n \"lineWidth\": 2,\n \"scaleDistribution\": {\n \"type\": \"linear\"\n },\n \"spanNulls\": false,\n \"stack\": \"off\"\n },\n \"datasourceCate\": \"prometheus\",\n \"datasourceValue\": \"${DS_PROMETHEUS}\",\n \"id\": \"77343eca-60d3-4be9-b80d-6db471399339\",\n \"layout\": {\n \"h\": 9,\n \"i\": \"77343eca-60d3-4be9-b80d-6db471399339\",\n \"isResizable\": true,\n \"w\": 12,\n \"x\": 12,\n \"y\": 14\n },\n \"links\": [],\n \"maxPerRow\": 4,\n \"name\": \"Workhorse Latency\",\n \"options\": {\n \"legend\": {\n \"displayMode\": \"hidden\"\n },\n \"standardOptions\": {\n \"util\": \"seconds\"\n },\n \"thresholds\": {\n \"steps\": [\n {\n \"color\": \"#634CD9\",\n \"type\": \"base\",\n \"value\": null\n }\n ]\n },\n \"tooltip\": {\n \"mode\": \"all\",\n \"sort\": \"none\"\n }\n },\n \"targets\": [\n {\n \"expr\": \"sum by (le) (\\n rate(gitlab_workhorse_http_request_duration_seconds_bucket{instance=~\\\".*:9229\\\"}[5m])\\n)\",\n \"legend\": \"{{le}}\",\n \"refId\": \"B\"\n }\n ],\n \"transformations\": [\n {\n \"id\": \"organize\",\n \"options\": {}\n }\n ],\n \"type\": \"timeseries\",\n \"version\": \"3.0.0\"\n }\n ],\n \"var\": [\n {\n \"definition\": \"prometheus\",\n \"name\": \"DS_PROMETHEUS\",\n \"type\": \"datasource\"\n }\n ],\n \"version\": \"3.0.0\"\n },\n \"public\": 0,\n \"public_cate\": 0,\n \"bgids\": null,\n \"built_in\": 0,\n \"hide\": 0,\n \"uuid\": 1717556327482615000\n}"
},
{
"path": "integrations/Gitlab/dashboards/PostgreSQL.json",
"content": "{\n \"id\": 0,\n \"group_id\": 0,\n \"name\": \"GitLab - PostgreSQL\",\n \"ident\": \"\",\n \"tags\": \"\",\n \"create_at\": 0,\n \"create_by\": \"\",\n \"update_at\": 0,\n \"update_by\": \"\",\n \"configs\": {\n \"links\": [],\n \"panels\": [\n {\n \"custom\": {\n \"calc\": \"lastNotNull\",\n \"colSpan\": 1,\n \"colorMode\": \"value\",\n \"graphMode\": \"none\",\n \"textMode\": \"value\",\n \"textSize\": {},\n \"valueField\": \"Value\"\n },\n \"datasourceCate\": \"prometheus\",\n \"datasourceValue\": \"${DS_PROMETHEUS}\",\n \"description\": \"start time of the process\",\n \"id\": \"dbbd49e7-f2e4-49e1-ad75-1010e5c24266\",\n \"layout\": {\n \"h\": 4,\n \"i\": \"dbbd49e7-f2e4-49e1-ad75-1010e5c24266\",\n \"w\": 5,\n \"x\": 0,\n \"y\": 1\n },\n \"links\": [],\n \"maxPerRow\": 4,\n \"name\": \"Start Time\",\n \"options\": {\n \"standardOptions\": {\n \"util\": \"datetimeMilliseconds\"\n },\n \"thresholds\": {\n \"steps\": [\n {\n \"color\": \"#56A64B\",\n \"type\": \"base\",\n \"value\": null\n }\n ]\n },\n \"valueMappings\": [\n {\n \"options\": {\n \"match\": \"null\",\n \"result\": {\n \"text\": \"N/A\"\n }\n },\n \"type\": \"special\"\n }\n ]\n },\n \"targets\": [\n {\n \"expr\": \"min(pg_postmaster_start_time_seconds{instance=~\\\"$instance\\\"} * 1000)\",\n \"legend\": \"\",\n \"refId\": \"A\"\n }\n ],\n \"transformations\": [\n {\n \"id\": \"organize\",\n \"options\": {}\n }\n ],\n \"type\": \"stat\",\n \"version\": \"3.0.0\"\n },\n {\n \"custom\": {\n \"calc\": \"lastNotNull\",\n \"colorDomainAuto\": true,\n \"colorRange\": [\n \"#83c898\",\n \"#c2c2c2\",\n \"#fc653f\"\n ],\n \"reverseColorOrder\": false,\n \"textMode\": \"valueAndName\"\n },\n \"datasourceCate\": \"prometheus\",\n \"datasourceValue\": \"${DS_PROMETHEUS}\",\n \"id\": \"0a2e21b9-2cb0-46b4-99f3-141896ddce93\",\n \"layout\": {\n \"h\": 4,\n \"i\": \"0a2e21b9-2cb0-46b4-99f3-141896ddce93\",\n \"w\": 15,\n \"x\": 5,\n \"y\": 1\n },\n \"links\": [],\n \"maxPerRow\": 4,\n \"name\": \"memory status\",\n \"options\": {\n \"standardOptions\": {}\n },\n \"targets\": [\n {\n \"expr\": \"pg_settings_shared_buffers_bytes{instance=~\\\"$instance\\\"}\",\n \"legend\": \"Shared Buffers\",\n \"refId\": \"A\"\n },\n {\n \"expr\": \"pg_settings_wal_buffers_bytes{instance=~\\\"$instance\\\"}\",\n \"legend\": \"WAL Buffers\",\n \"refId\": \"B\"\n },\n {\n \"expr\": \"pg_settings_work_mem_bytes{instance=~\\\"$instance\\\"}\",\n \"legend\": \"Work Mem\",\n \"refId\": \"D\"\n },\n {\n \"expr\": \"pg_settings_maintenance_work_mem_bytes{instance=~\\\"$instance\\\"}\",\n \"legend\": \"Maintenance Work Mem\",\n \"refId\": \"E\"\n },\n {\n \"expr\": \"pg_settings_temp_buffers_bytes{instance=~\\\"$instance\\\"}\",\n \"legend\": \"Temp Buffers\",\n \"refId\": \"F\"\n },\n {\n \"expr\": \"pg_settings_wal_buffers_bytes{instance=~\\\"$instance\\\"}\",\n \"legend\": \"WAL Buffers\",\n \"refId\": \"G\"\n },\n {\n \"expr\": \"pg_settings_wal_segment_size_bytes{instance=~\\\"$instance\\\"}\",\n \"legend\": \"WAL Segment Size\",\n \"refId\": \"H\"\n },\n {\n \"expr\": \"pg_settings_wal_keep_segments{instance=~\\\"$instance\\\"}\",\n \"legend\": \"WAL Keep Segments\",\n \"refId\": \"I\"\n }\n ],\n \"transformations\": [\n {\n \"id\": \"organize\",\n \"options\": {}\n }\n ],\n \"type\": \"hexbin\",\n \"version\": \"3.0.0\"\n },\n {\n \"custom\": {\n \"drawStyle\": \"lines\",\n \"fillOpacity\": 0.3,\n \"gradientMode\": \"opacity\",\n \"lineInterpolation\": \"smooth\",\n \"lineWidth\": 2,\n \"scaleDistribution\": {\n \"type\": \"linear\"\n },\n \"spanNulls\": false,\n \"stack\": \"off\"\n },\n \"datasourceCate\": \"prometheus\",\n \"datasourceValue\": \"${DS_PROMETHEUS}\",\n \"id\": \"87c6f320-cf0c-4b71-9a95-53144518cb4a\",\n \"layout\": {\n \"h\": 4,\n \"i\": \"87c6f320-cf0c-4b71-9a95-53144518cb4a\",\n \"w\": 4,\n \"x\": 20,\n \"y\": 1\n },\n \"links\": [],\n \"maxPerRow\": 4,\n \"name\": \"Worker\",\n \"options\": {\n \"legend\": {\n \"displayMode\": \"hidden\"\n },\n \"standardOptions\": {},\n \"thresholds\": {\n \"steps\": [\n {\n \"color\": \"#634CD9\",\n \"type\": \"base\",\n \"value\": null\n }\n ]\n },\n \"tooltip\": {\n \"mode\": \"all\",\n \"sort\": \"none\"\n }\n },\n \"targets\": [\n {\n \"expr\": \"pg_settings_max_worker_processes{instance=~\\\"$instance\\\"}\",\n \"legend\": \"Max Workers\",\n \"refId\": \"A\"\n },\n {\n \"expr\": \"pg_settings_max_parallel_workers{instance=~\\\"$instance\\\"}\",\n \"legend\": \"Max Parallel Workers\",\n \"refId\": \"B\"\n },\n {\n \"expr\": \"pg_settings_max_parallel_workers_per_gather{instance=~\\\"$instance\\\"}\",\n \"legend\": \"Max Parallel Workers Per Gather\",\n \"refId\": \"C\"\n }\n ],\n \"transformations\": [\n {\n \"id\": \"organize\",\n \"options\": {}\n }\n ],\n \"type\": \"timeseries\",\n \"version\": \"3.0.0\"\n },\n {\n \"custom\": {\n \"drawStyle\": \"lines\",\n \"fillOpacity\": 0.3,\n \"gradientMode\": \"opacity\",\n \"lineInterpolation\": \"smooth\",\n \"lineWidth\": 2,\n \"scaleDistribution\": {\n \"type\": \"linear\"\n },\n \"spanNulls\": false,\n \"stack\": \"off\"\n },\n \"datasourceCate\": \"prometheus\",\n \"datasourceValue\": \"${DS_PROMETHEUS}\",\n \"id\": \"6e5f1534-1f9f-401f-b1bb-b42690b59b76\",\n \"layout\": {\n \"h\": 4,\n \"i\": \"6e5f1534-1f9f-401f-b1bb-b42690b59b76\",\n \"w\": 4,\n \"x\": 0,\n \"y\": 5\n },\n \"links\": [],\n \"maxPerRow\": 4,\n \"name\": \"Current Conn\",\n \"options\": {\n \"legend\": {\n \"displayMode\": \"list\",\n \"placement\": \"bottom\"\n },\n \"standardOptions\": {},\n \"thresholds\": {\n \"steps\": [\n {\n \"color\": \"#634CD9\",\n \"type\": \"base\",\n \"value\": null\n }\n ]\n },\n \"tooltip\": {\n \"mode\": \"all\",\n \"sort\": \"none\"\n }\n },\n \"targets\": [\n {\n \"expr\": \"sum(pg_stat_activity_count{datname=~\\\"$datname\\\", instance=~\\\"$instance\\\"})\",\n \"legend\": \" Current Conn\",\n \"refId\": \"A\"\n },\n {\n \"expr\": \"pg_settings_max_connections{instance=~\\\"$instance\\\"}\",\n \"legend\": \" {{instance}}-Max Conn\",\n \"refId\": \"B\"\n }\n ],\n \"transformations\": [\n {\n \"id\": \"organize\",\n \"options\": {}\n }\n ],\n \"type\": \"timeseries\",\n \"version\": \"3.0.0\"\n },\n {\n \"custom\": {\n \"calc\": \"lastNotNull\",\n \"colSpan\": 1,\n \"colorMode\": \"value\",\n \"graphMode\": \"none\",\n \"textMode\": \"value\",\n \"textSize\": {},\n \"valueField\": \"Value\"\n },\n \"datasourceCate\": \"prometheus\",\n \"datasourceValue\": \"${DS_PROMETHEUS}\",\n \"description\": \"Lag behind master in seconds.\\n\\nOnly available on a standby System.\",\n \"id\": \"af3c4f59-a47b-4556-bcd5-e1ca89057e86\",\n \"layout\": {\n \"h\": 4,\n \"i\": \"af3c4f59-a47b-4556-bcd5-e1ca89057e86\",\n \"w\": 3,\n \"x\": 4,\n \"y\": 5\n },\n \"links\": [],\n \"maxPerRow\": 4,\n \"name\": \"Replication Lag \",\n \"options\": {\n \"standardOptions\": {\n \"util\": \"bytesSI\"\n },\n \"thresholds\": {\n \"steps\": [\n {\n \"color\": \"#73BF69\",\n \"type\": \"base\",\n \"value\": null\n },\n {\n \"color\": \"#F2495C\",\n \"value\": 1\n }\n ]\n },\n \"valueMappings\": []\n },\n \"targets\": [\n {\n \"expr\": \"max(pg_replication_lag{instance=\\\"$instance\\\"})\",\n \"legend\": \"\",\n \"refId\": \"A\",\n \"step\": 120,\n \"time\": {\n \"end\": \"now\",\n \"start\": \"now-15m\"\n }\n }\n ],\n \"transformations\": [\n {\n \"id\": \"organize\",\n \"options\": {}\n }\n ],\n \"type\": \"stat\",\n \"version\": \"3.0.0\"\n },\n {\n \"custom\": {\n \"drawStyle\": \"lines\",\n \"fillOpacity\": 0.3,\n \"gradientMode\": \"opacity\",\n \"lineInterpolation\": \"smooth\",\n \"lineWidth\": 2,\n \"scaleDistribution\": {\n \"type\": \"linear\"\n },\n \"spanNulls\": false,\n \"stack\": \"off\"\n },\n \"datasourceCate\": \"prometheus\",\n \"datasourceValue\": \"${DS_PROMETHEUS}\",\n \"id\": \"c923682c-4337-4d20-82f5-db463714234b\",\n \"layout\": {\n \"h\": 4,\n \"i\": \"c923682c-4337-4d20-82f5-db463714234b\",\n \"w\": 8,\n \"x\": 7,\n \"y\": 5\n },\n \"links\": [],\n \"maxPerRow\": 4,\n \"name\": \"SQL\",\n \"options\": {\n \"legend\": {\n \"displayMode\": \"hidden\"\n },\n \"standardOptions\": {},\n \"thresholds\": {\n \"steps\": [\n {\n \"color\": \"#634CD9\",\n \"type\": \"base\",\n \"value\": null\n }\n ]\n },\n \"tooltip\": {\n \"mode\": \"all\",\n \"sort\": \"none\"\n }\n },\n \"targets\": [\n {\n \"expr\": \"sum(pg_stat_database_tup_inserted{datname=~\\\"$datname\\\", instance=~\\\"$instance\\\"})\",\n \"legend\": \"Tuples Inserted\",\n \"refId\": \"A\"\n },\n {\n \"expr\": \"sum(pg_stat_database_tup_updated{datname=~\\\"$datname\\\", instance=~\\\"$instance\\\"})\",\n \"legend\": \"Tuples Updated\",\n \"refId\": \"B\"\n },\n {\n \"expr\": \"sum(pg_stat_database_tup_deleted{datname=~\\\"$datname\\\", instance=~\\\"$instance\\\"})\",\n \"legend\": \"Tuples Deleted\",\n \"refId\": \"C\"\n },\n {\n \"expr\": \"sum(pg_stat_database_tup_fetched{datname=~\\\"$datname\\\", instance=~\\\"$instance\\\"})\",\n \"legend\": \"Tuples Fetched\",\n \"refId\": \"D\"\n },\n {\n \"expr\": \"sum(pg_stat_database_tup_returned{datname=~\\\"$datname\\\", instance=~\\\"$instance\\\"})\",\n \"legend\": \"Tuples Returned\",\n \"refId\": \"E\"\n }\n ],\n \"transformations\": [\n {\n \"id\": \"organize\",\n \"options\": {}\n }\n ],\n \"type\": \"timeseries\",\n \"version\": \"3.0.0\"\n },\n {\n \"custom\": {\n \"drawStyle\": \"lines\",\n \"fillOpacity\": 0.3,\n \"gradientMode\": \"opacity\",\n \"lineInterpolation\": \"smooth\",\n \"lineWidth\": 2,\n \"scaleDistribution\": {\n \"type\": \"linear\"\n },\n \"spanNulls\": false,\n \"stack\": \"off\"\n },\n \"datasourceCate\": \"prometheus\",\n \"datasourceValue\": \"${DS_PROMETHEUS}\",\n \"description\": \"\",\n \"id\": \"d8c5523d-0fa2-417f-8739-d20e5d48e234\",\n \"layout\": {\n \"h\": 4,\n \"i\": \"d8c5523d-0fa2-417f-8739-d20e5d48e234\",\n \"w\": 9,\n \"x\": 15,\n \"y\": 5\n },\n \"links\": [],\n \"maxPerRow\": 4,\n \"name\": \"Database Size\",\n \"options\": {\n \"legend\": {\n \"displayMode\": \"hidden\"\n },\n \"standardOptions\": {},\n \"thresholds\": {\n \"steps\": [\n {\n \"color\": \"#634CD9\",\n \"type\": \"base\",\n \"value\": null\n }\n ]\n },\n \"tooltip\": {\n \"mode\": \"all\",\n \"sort\": \"none\"\n }\n },\n \"targets\": [\n {\n \"expr\": \"sum(pg_database_size_bytes{instance=~\\\"$instance\\\",datname!~\\\"template.*|postgres.*\\\"}) by (datname)\",\n \"legend\": \" {{datname}}\",\n \"refId\": \"B\"\n }\n ],\n \"transformations\": [\n {\n \"id\": \"organize\",\n \"options\": {}\n }\n ],\n \"type\": \"timeseries\",\n \"version\": \"3.0.0\"\n },\n {\n \"custom\": {\n \"drawStyle\": \"lines\",\n \"fillOpacity\": 0.1,\n \"gradientMode\": \"none\",\n \"lineInterpolation\": \"linear\",\n \"lineWidth\": 1,\n \"scaleDistribution\": {\n \"type\": \"linear\"\n },\n \"spanNulls\": false,\n \"stack\": \"off\"\n },\n \"datasourceCate\": \"prometheus\",\n \"datasourceValue\": \"${DS_PROMETHEUS}\",\n \"id\": \"08ab8c71-d04a-463e-9857-e52c05f08877\",\n \"layout\": {\n \"h\": 8,\n \"i\": \"08ab8c71-d04a-463e-9857-e52c05f08877\",\n \"w\": 12,\n \"x\": 0,\n \"y\": 9\n },\n \"links\": [],\n \"maxPerRow\": 4,\n \"name\": \"Connections\",\n \"options\": {\n \"legend\": {\n \"displayMode\": \"list\",\n \"placement\": \"bottom\"\n },\n \"standardOptions\": {\n \"util\": \"none\"\n },\n \"thresholds\": {\n \"steps\": [\n {\n \"color\": \"#73BF69\",\n \"type\": \"base\",\n \"value\": null\n },\n {\n \"color\": \"#F2495C\",\n \"value\": 80\n }\n ]\n },\n \"tooltip\": {\n \"mode\": \"multi\"\n }\n },\n \"targets\": [\n {\n \"expr\": \"sum(pg_stat_activity_count{instance=~\\\"$instance\\\"})\",\n \"legend\": \"CurrConn\",\n \"refId\": \"A\"\n },\n {\n \"expr\": \"sum(pg_settings_max_connections{instance=~\\\"$instance\\\"})\",\n \"legend\": \"MaxConn\",\n \"refId\": \"B\"\n },\n {\n \"expr\": \"sum(pg_stat_activity_count{instance=~\\\"$instance\\\"}) * 100 / sum(pg_settings_max_connections{instance=~\\\"$instance\\\"})\",\n \"legend\": \"RatioConn\",\n \"refId\": \"C\"\n },\n {\n \"expr\": \"sum(pg_stat_activity_count{instance=~\\\"$instance\\\",state!~\\\"idle\\\"}) * 100 / sum(pg_stat_activity_count{instance=~\\\"$instance\\\"})\",\n \"legend\": \"SaturationConn\",\n \"refId\": \"D\"\n },\n {\n \"expr\": \"sum(pg_stat_activity_count{instance=~\\\"$instance\\\"}) by (state)\",\n \"legend\": \"{{state}}\",\n \"refId\": \"E\"\n }\n ],\n \"transformations\": [\n {\n \"id\": \"organize\",\n \"options\": {}\n }\n ],\n \"type\": \"timeseries\",\n \"version\": \"3.0.0\"\n },\n {\n \"custom\": {\n \"drawStyle\": \"lines\",\n \"fillOpacity\": 0.3,\n \"gradientMode\": \"opacity\",\n \"lineInterpolation\": \"smooth\",\n \"lineWidth\": 2,\n \"scaleDistribution\": {\n \"type\": \"linear\"\n },\n \"spanNulls\": false,\n \"stack\": \"off\"\n },\n \"datasourceCate\": \"prometheus\",\n \"datasourceValue\": \"${DS_PROMETHEUS}\",\n \"id\": \"9f4089ed-bd47-47a5-a26d-17ab97262ee0\",\n \"layout\": {\n \"h\": 8,\n \"i\": \"9f4089ed-bd47-47a5-a26d-17ab97262ee0\",\n \"w\": 12,\n \"x\": 12,\n \"y\": 9\n },\n \"links\": [],\n \"maxPerRow\": 4,\n \"name\": \"Cache Hit Rate\",\n \"options\": {\n \"legend\": {\n \"displayMode\": \"list\",\n \"placement\": \"bottom\"\n },\n \"standardOptions\": {},\n \"thresholds\": {\n \"steps\": [\n {\n \"color\": \"#634CD9\",\n \"type\": \"base\",\n \"value\": null\n }\n ]\n },\n \"tooltip\": {\n \"mode\": \"all\",\n \"sort\": \"none\"\n }\n },\n \"targets\": [\n {\n \"expr\": \"pg_stat_database_blks_hit{instance=~\\\"$instance\\\",datname=~\\\"$datname\\\"} / (pg_stat_database_blks_read{instance=~\\\"$instance\\\"} + pg_stat_database_blks_hit{instance=~\\\"$instance\\\"})\",\n \"legend\": \"Cache Hit Ratio - {{datname}} \",\n \"refId\": \"A\"\n }\n ],\n \"transformations\": [\n {\n \"id\": \"organize\",\n \"options\": {}\n }\n ],\n \"type\": \"timeseries\",\n \"version\": \"3.0.0\"\n },\n {\n \"custom\": {\n \"drawStyle\": \"lines\",\n \"fillOpacity\": 0.1,\n \"gradientMode\": \"none\",\n \"lineInterpolation\": \"linear\",\n \"lineWidth\": 1,\n \"scaleDistribution\": {\n \"type\": \"linear\"\n },\n \"spanNulls\": false,\n \"stack\": \"off\"\n },\n \"datasourceCate\": \"prometheus\",\n \"datasourceValue\": \"${DS_PROMETHEUS}\",\n \"description\": \"1 Minute rate of transactions committed or rollback.\",\n \"id\": \"16780d96-8d43-439a-acae-cdf763074884\",\n \"layout\": {\n \"h\": 9,\n \"i\": \"16780d96-8d43-439a-acae-cdf763074884\",\n \"w\": 12,\n \"x\": 0,\n \"y\": 18\n },\n \"links\": [],\n \"maxPerRow\": 4,\n \"name\": \"Transactions\",\n \"options\": {\n \"legend\": {\n \"displayMode\": \"list\",\n \"placement\": \"bottom\"\n },\n \"standardOptions\": {\n \"util\": \"none\"\n },\n \"thresholds\": {\n \"steps\": [\n {\n \"color\": \"#73BF69\",\n \"type\": \"base\",\n \"value\": null\n },\n {\n \"color\": \"#F2495C\",\n \"value\": 80\n }\n ]\n },\n \"tooltip\": {\n \"mode\": \"multi\"\n }\n },\n \"targets\": [\n {\n \"expr\": \"sum(rate(pg_stat_database_xact_commit{instance=~\\\"$instance\\\"}[1m])) by (datname) !=0\",\n \"legend\": \"commit-{{datname}}\",\n \"refId\": \"A\"\n },\n {\n \"expr\": \"sum(rate(pg_stat_database_xact_rollback{instance=~\\\"$instance\\\"}[1m])) by (datname) !=0\",\n \"legend\": \"rollback-{{datname}}\",\n \"refId\": \"B\"\n }\n ],\n \"transformations\": [\n {\n \"id\": \"organize\",\n \"options\": {}\n }\n ],\n \"type\": \"timeseries\",\n \"version\": \"3.0.0\"\n },\n {\n \"custom\": {\n \"drawStyle\": \"lines\",\n \"fillOpacity\": 0.1,\n \"gradientMode\": \"none\",\n \"lineInterpolation\": \"linear\",\n \"lineWidth\": 1,\n \"scaleDistribution\": {\n \"type\": \"linear\"\n },\n \"spanNulls\": false,\n \"stack\": \"off\"\n },\n \"datasourceCate\": \"prometheus\",\n \"datasourceValue\": \"${DS_PROMETHEUS}\",\n \"id\": \"bb023ef8-c926-4380-8c40-a972a5d69dd3\",\n \"layout\": {\n \"h\": 9,\n \"i\": \"bb023ef8-c926-4380-8c40-a972a5d69dd3\",\n \"w\": 12,\n \"x\": 12,\n \"y\": 18\n },\n \"links\": [],\n \"maxPerRow\": 4,\n \"name\": \"Longest Transaction\",\n \"options\": {\n \"legend\": {\n \"displayMode\": \"list\",\n \"placement\": \"bottom\"\n },\n \"standardOptions\": {\n \"util\": \"seconds\"\n },\n \"thresholds\": {\n \"steps\": [\n {\n \"color\": \"#73BF69\",\n \"type\": \"base\",\n \"value\": null\n },\n {\n \"color\": \"#F2495C\",\n \"value\": 80\n }\n ]\n },\n \"tooltip\": {\n \"mode\": \"multi\"\n }\n },\n \"targets\": [\n {\n \"expr\": \"sum(pg_stat_activity_max_tx_duration{instance=~\\\"$instance\\\"}) by (datname)\",\n \"legend\": \"{{datname}}\",\n \"refId\": \"A\"\n }\n ],\n \"transformations\": [\n {\n \"id\": \"organize\",\n \"options\": {}\n }\n ],\n \"type\": \"timeseries\",\n \"version\": \"3.0.0\"\n },\n {\n \"custom\": {\n \"drawStyle\": \"lines\",\n \"fillOpacity\": 0.1,\n \"gradientMode\": \"none\",\n \"lineInterpolation\": \"linear\",\n \"lineWidth\": 1,\n \"scaleDistribution\": {\n \"type\": \"linear\"\n },\n \"spanNulls\": false,\n \"stack\": \"off\"\n },\n \"datasourceCate\": \"prometheus\",\n \"datasourceValue\": \"${DS_PROMETHEUS}\",\n \"description\": \"Should be 0 \\n\\nSource: pg_stat_database\\n\\nWith log_lock_waits turned on, deadlocks will be logged to the PostgreSQL Logfiles.\",\n \"id\": \"2db8688d-c88a-4d8c-93cf-5889de67e3db\",\n \"layout\": {\n \"h\": 10,\n \"i\": \"2db8688d-c88a-4d8c-93cf-5889de67e3db\",\n \"w\": 12,\n \"x\": 0,\n \"y\": 27\n },\n \"links\": [],\n \"maxPerRow\": 4,\n \"name\": \"Deadlocks\",\n \"options\": {\n \"legend\": {\n \"displayMode\": \"list\",\n \"placement\": \"bottom\"\n },\n \"standardOptions\": {\n \"min\": 0,\n \"util\": \"none\"\n },\n \"thresholds\": {\n \"steps\": [\n {\n \"color\": \"#73BF69\",\n \"type\": \"base\",\n \"value\": null\n },\n {\n \"color\": \"#F2495C\",\n \"value\": 80\n }\n ]\n },\n \"tooltip\": {\n \"mode\": \"multi\"\n }\n },\n \"targets\": [\n {\n \"expr\": \"sum by (datname) (pg_stat_database_deadlocks{instance=~\\\"$instance\\\"})\",\n \"legend\": \"{{datname}}\",\n \"refId\": \"A\"\n }\n ],\n \"transformations\": [\n {\n \"id\": \"organize\",\n \"options\": {}\n }\n ],\n \"type\": \"timeseries\",\n \"version\": \"3.0.0\"\n },\n {\n \"custom\": {\n \"drawStyle\": \"lines\",\n \"fillOpacity\": 0.1,\n \"gradientMode\": \"none\",\n \"lineInterpolation\": \"linear\",\n \"lineWidth\": 1,\n \"scaleDistribution\": {\n \"type\": \"linear\"\n },\n \"spanNulls\": false,\n \"stack\": \"off\"\n },\n \"datasourceCate\": \"prometheus\",\n \"datasourceValue\": \"${DS_PROMETHEUS}\",\n \"description\": \"Source: pg_locks\",\n \"id\": \"c96d2e4e-1e72-484f-bbbe-7194ac306d97\",\n \"layout\": {\n \"h\": 10,\n \"i\": \"c96d2e4e-1e72-484f-bbbe-7194ac306d97\",\n \"w\": 12,\n \"x\": 12,\n \"y\": 27\n },\n \"links\": [],\n \"maxPerRow\": 4,\n \"name\": \"Locks by state\",\n \"options\": {\n \"legend\": {\n \"displayMode\": \"list\",\n \"placement\": \"bottom\"\n },\n \"standardOptions\": {\n \"util\": \"none\"\n },\n \"thresholds\": {\n \"steps\": [\n {\n \"color\": \"#73BF69\",\n \"type\": \"base\",\n \"value\": null\n },\n {\n \"color\": \"#F2495C\",\n \"value\": 80\n }\n ]\n },\n \"tooltip\": {\n \"mode\": \"multi\"\n }\n },\n \"targets\": [\n {\n \"expr\": \"sum by (mode) (pg_locks_count{instance=~\\\"$instance\\\",datname=~\\\"$datname\\\"})\",\n \"legend\": \"{{mode}}\",\n \"refId\": \"A\"\n }\n ],\n \"transformations\": [\n {\n \"id\": \"organize\",\n \"options\": {}\n }\n ],\n \"type\": \"timeseries\",\n \"version\": \"3.0.0\"\n },\n {\n \"custom\": {\n \"drawStyle\": \"lines\",\n \"fillOpacity\": 0.1,\n \"gradientMode\": \"none\",\n \"lineInterpolation\": \"linear\",\n \"lineWidth\": 1,\n \"scaleDistribution\": {\n \"type\": \"linear\"\n },\n \"spanNulls\": false,\n \"stack\": \"off\"\n },\n \"datasourceCate\": \"prometheus\",\n \"datasourceValue\": \"${DS_PROMETHEUS}\",\n \"description\": \"* blk_read_time: Time spent reading data file blocks by backends in this database, in milliseconds\\n* blk_write_time: Time spent writing data file blocks by backends in this database, in milliseconds\\n\\ntrack_io_timings needs to be activated\",\n \"id\": \"bc11b349-8f36-4606-9ac1-a229ebe9a709\",\n \"layout\": {\n \"h\": 9,\n \"i\": \"bc11b349-8f36-4606-9ac1-a229ebe9a709\",\n \"w\": 12,\n \"x\": 0,\n \"y\": 38\n },\n \"links\": [],\n \"maxPerRow\": 4,\n \"name\": \"I/O Read/Write Time\",\n \"options\": {\n \"legend\": {\n \"displayMode\": \"list\",\n \"placement\": \"bottom\"\n },\n \"standardOptions\": {\n \"min\": 0,\n \"util\": \"milliseconds\"\n },\n \"thresholds\": {\n \"steps\": [\n {\n \"color\": \"#73BF69\",\n \"type\": \"base\",\n \"value\": null\n },\n {\n \"color\": \"#F2495C\",\n \"value\": 80\n }\n ]\n },\n \"tooltip\": {\n \"mode\": \"multi\"\n }\n },\n \"targets\": [\n {\n \"expr\": \"sum (pg_stat_database_blk_read_time{instance=~\\\"$instance\\\",datname=~\\\"$datname\\\"})\",\n \"legend\": \"blk_read_time\",\n \"refId\": \"A\"\n },\n {\n \"expr\": \"sum (pg_stat_database_blk_write_time{instance=~\\\"$instance\\\",datname=~\\\"$datname\\\"})\",\n \"legend\": \"blk_write_time\",\n \"refId\": \"B\"\n }\n ],\n \"transformations\": [\n {\n \"id\": \"organize\",\n \"options\": {}\n }\n ],\n \"type\": \"timeseries\",\n \"version\": \"3.0.0\"\n },\n {\n \"custom\": {\n \"drawStyle\": \"lines\",\n \"fillOpacity\": 0.1,\n \"gradientMode\": \"none\",\n \"lineInterpolation\": \"linear\",\n \"lineWidth\": 1,\n \"scaleDistribution\": {\n \"type\": \"linear\"\n },\n \"spanNulls\": false,\n \"stack\": \"off\"\n },\n \"datasourceCate\": \"prometheus\",\n \"datasourceValue\": \"${DS_PROMETHEUS}\",\n \"id\": \"a67d7b7a-c34a-4277-b3fc-fc10b4b88ec5\",\n \"layout\": {\n \"h\": 9,\n \"i\": \"a67d7b7a-c34a-4277-b3fc-fc10b4b88ec5\",\n \"w\": 12,\n \"x\": 12,\n \"y\": 38\n },\n \"links\": [],\n \"maxPerRow\": 4,\n \"name\": \"Checkpoint Stats\",\n \"options\": {\n \"legend\": {\n \"displayMode\": \"list\",\n \"placement\": \"bottom\"\n },\n \"standardOptions\": {\n \"util\": \"milliseconds\"\n },\n \"thresholds\": {\n \"steps\": [\n {\n \"color\": \"#73BF69\",\n \"type\": \"base\",\n \"value\": null\n },\n {\n \"color\": \"#F2495C\",\n \"value\": 80\n }\n ]\n },\n \"tooltip\": {\n \"mode\": \"multi\"\n }\n },\n \"targets\": [\n {\n \"expr\": \"irate(pg_stat_bgwriter_checkpoint_write_time_total{instance=~\\\"$instance\\\"}[5m])\",\n \"legend\": \"write_time\",\n \"refId\": \"B\"\n },\n {\n \"expr\": \"irate(pg_stat_bgwriter_checkpoint_sync_time_total{instance=~\\\"$instance\\\"}[5m])\",\n \"legend\": \"sync_time\",\n \"refId\": \"A\"\n }\n ],\n \"transformations\": [\n {\n \"id\": \"organize\",\n \"options\": {}\n }\n ],\n \"type\": \"timeseries\",\n \"version\": \"3.0.0\"\n }\n ],\n \"var\": [\n {\n \"definition\": \"prometheus\",\n \"name\": \"DS_PROMETHEUS\",\n \"type\": \"datasource\"\n },\n {\n \"datasource\": {\n \"cate\": \"prometheus\",\n \"value\": \"${DS_PROMETHEUS}\"\n },\n \"definition\": \"label_values(up{job=~'postgres'},instance)\",\n \"multi\": false,\n \"name\": \"instance\",\n \"reg\": \"\",\n \"type\": \"query\"\n },\n {\n \"allOption\": false,\n \"datasource\": {\n \"cate\": \"prometheus\",\n \"value\": \"${DS_PROMETHEUS}\"\n },\n \"definition\": \"label_values(datname)\",\n \"multi\": true,\n \"name\": \"datname\",\n \"reg\": \"/^(?!template)/\",\n \"type\": \"query\"\n }\n ],\n \"version\": \"3.0.0\"\n },\n \"public\": 0,\n \"public_cate\": 0,\n \"bgids\": null,\n \"built_in\": 0,\n \"hide\": 0,\n \"uuid\": 1717556327484272000\n}"
},
{
"path": "integrations/Gitlab/dashboards/Redis.json",
"content": "{\n \"id\": 0,\n \"group_id\": 0,\n \"name\": \"GitLab - Redis\",\n \"ident\": \"\",\n \"tags\": \"\",\n \"create_at\": 0,\n \"create_by\": \"\",\n \"update_at\": 0,\n \"update_by\": \"\",\n \"configs\": {\n \"links\": [],\n \"panels\": [\n {\n \"custom\": {\n \"calc\": \"lastNotNull\",\n \"colSpan\": 1,\n \"colorMode\": \"value\",\n \"graphMode\": \"none\",\n \"textMode\": \"value\",\n \"textSize\": {},\n \"valueField\": \"Value\"\n },\n \"datasourceCate\": \"prometheus\",\n \"datasourceValue\": \"${DS_PROMETHEUS}\",\n \"id\": \"4ff9943b-6edd-4b6d-960c-0b992b8e1fd3\",\n \"layout\": {\n \"h\": 3,\n \"i\": \"4ff9943b-6edd-4b6d-960c-0b992b8e1fd3\",\n \"w\": 4,\n \"x\": 0,\n \"y\": 0\n },\n \"links\": [],\n \"maxPerRow\": 4,\n \"name\": \"Uptime\",\n \"options\": {\n \"standardOptions\": {\n \"decimals\": 0,\n \"util\": \"seconds\"\n },\n \"thresholds\": {\n \"steps\": [\n {\n \"color\": \"#73BF69\",\n \"type\": \"base\",\n \"value\": null\n }\n ]\n },\n \"valueMappings\": [\n {\n \"options\": {\n \"match\": \"null\",\n \"result\": {\n \"text\": \"N/A\"\n }\n },\n \"type\": \"special\"\n }\n ]\n },\n \"targets\": [\n {\n \"expr\": \"avg(time() - redis_start_time_seconds{instance=~\\\"$instance\\\"})\",\n \"legend\": \"\",\n \"refId\": \"A\"\n }\n ],\n \"transformations\": [\n {\n \"id\": \"organize\",\n \"options\": {}\n }\n ],\n \"type\": \"stat\",\n \"version\": \"3.0.0\"\n },\n {\n \"custom\": {\n \"calc\": \"avg\",\n \"colSpan\": 1,\n \"colorMode\": \"value\",\n \"graphMode\": \"none\",\n \"textMode\": \"value\",\n \"textSize\": {},\n \"valueField\": \"Value\"\n },\n \"datasourceCate\": \"prometheus\",\n \"datasourceValue\": \"${DS_PROMETHEUS}\",\n \"id\": \"38a6c015-4dae-4765-8f5f-9961ca302e18\",\n \"layout\": {\n \"h\": 3,\n \"i\": \"38a6c015-4dae-4765-8f5f-9961ca302e18\",\n \"w\": 4,\n \"x\": 4,\n \"y\": 0\n },\n \"links\": [],\n \"maxPerRow\": 4,\n \"name\": \"Clients\",\n \"options\": {\n \"standardOptions\": {\n \"decimals\": 0,\n \"util\": \"none\"\n },\n \"thresholds\": {\n \"steps\": [\n {\n \"color\": \"#73BF69\",\n \"type\": \"base\",\n \"value\": null\n },\n {\n \"color\": \"#F2495C\",\n \"value\": 80\n }\n ]\n },\n \"valueMappings\": [\n {\n \"options\": {\n \"match\": \"null\",\n \"result\": {\n \"text\": \"N/A\"\n }\n },\n \"type\": \"special\"\n }\n ]\n },\n \"targets\": [\n {\n \"expr\": \"sum(\\n avg_over_time(redis_connected_clients{instance=~\\\"$instance\\\"}[5m])\\n)\",\n \"legend\": \"Clients\",\n \"refId\": \"A\"\n },\n {\n \"expr\": \"sum(\\n avg_over_time(redis_connected_slaves{instance=~\\\"$instance\\\"}[5m])\\n)\",\n \"legend\": \"Slaves\",\n \"refId\": \"B\"\n }\n ],\n \"transformations\": [\n {\n \"id\": \"organize\",\n \"options\": {}\n }\n ],\n \"type\": \"stat\",\n \"version\": \"3.0.0\"\n },\n {\n \"custom\": {\n \"drawStyle\": \"lines\",\n \"fillOpacity\": 0.1,\n \"gradientMode\": \"none\",\n \"lineInterpolation\": \"linear\",\n \"lineWidth\": 1,\n \"scaleDistribution\": {\n \"type\": \"linear\"\n },\n \"spanNulls\": false,\n \"stack\": \"off\"\n },\n \"datasourceCate\": \"prometheus\",\n \"datasourceValue\": \"${DS_PROMETHEUS}\",\n \"id\": \"0739f047-3fcd-4bf0-ac63-09c0a4170452\",\n \"layout\": {\n \"h\": 6,\n \"i\": \"0739f047-3fcd-4bf0-ac63-09c0a4170452\",\n \"w\": 8,\n \"x\": 8,\n \"y\": 0\n },\n \"links\": [],\n \"maxPerRow\": 4,\n \"name\": \"Commands Executed\",\n \"options\": {\n \"legend\": {\n \"displayMode\": \"list\",\n \"placement\": \"bottom\"\n },\n \"standardOptions\": {\n \"min\": 0,\n \"util\": \"none\"\n },\n \"thresholds\": {\n \"steps\": [\n {\n \"color\": \"#73BF69\",\n \"type\": \"base\",\n \"value\": null\n },\n {\n \"color\": \"#F2495C\",\n \"value\": 80\n }\n ]\n },\n \"tooltip\": {\n \"mode\": \"multi\"\n }\n },\n \"targets\": [\n {\n \"expr\": \"sum(\\n rate(redis_commands_processed_total{instance=~\\\"$instance\\\"}[5m])\\n)\",\n \"legend\": \"\",\n \"refId\": \"A\"\n }\n ],\n \"transformations\": [\n {\n \"id\": \"organize\",\n \"options\": {}\n }\n ],\n \"type\": \"timeseries\",\n \"version\": \"3.0.0\"\n },\n {\n \"custom\": {\n \"drawStyle\": \"lines\",\n \"fillOpacity\": 0.1,\n \"gradientMode\": \"none\",\n \"lineInterpolation\": \"linear\",\n \"lineWidth\": 1,\n \"scaleDistribution\": {\n \"type\": \"linear\"\n },\n \"spanNulls\": false,\n \"stack\": \"off\"\n },\n \"datasourceCate\": \"prometheus\",\n \"datasourceValue\": \"${DS_PROMETHEUS}\",\n \"id\": \"7b23fa98-74eb-49b5-a29b-cb68fbd6d4d9\",\n \"layout\": {\n \"h\": 6,\n \"i\": \"7b23fa98-74eb-49b5-a29b-cb68fbd6d4d9\",\n \"w\": 8,\n \"x\": 16,\n \"y\": 0\n },\n \"links\": [],\n \"maxPerRow\": 4,\n \"name\": \"Hits, Misses per Second\",\n \"options\": {\n \"legend\": {\n \"displayMode\": \"list\",\n \"placement\": \"bottom\"\n },\n \"standardOptions\": {\n \"min\": 0,\n \"util\": \"none\"\n },\n \"thresholds\": {\n \"steps\": [\n {\n \"color\": \"#73BF69\",\n \"type\": \"base\",\n \"value\": null\n },\n {\n \"color\": \"#F2495C\",\n \"value\": 80\n }\n ]\n },\n \"tooltip\": {\n \"mode\": \"multi\"\n }\n },\n \"targets\": [\n {\n \"expr\": \"sum(\\n rate(redis_keyspace_hits_total{instance=~\\\"$instance\\\"}[5m])\\n)\",\n \"legend\": \"hits\",\n \"refId\": \"A\"\n },\n {\n \"expr\": \"sum(\\n rate(redis_keyspace_misses_total{instance=~\\\"$instance\\\"}[5m])\\n)\",\n \"legend\": \"misses\",\n \"refId\": \"B\"\n }\n ],\n \"transformations\": [\n {\n \"id\": \"organize\",\n \"options\": {}\n }\n ],\n \"type\": \"timeseries\",\n \"version\": \"3.0.0\"\n },\n {\n \"custom\": {\n \"drawStyle\": \"lines\",\n \"fillOpacity\": 0.1,\n \"gradientMode\": \"none\",\n \"lineInterpolation\": \"linear\",\n \"lineWidth\": 1,\n \"scaleDistribution\": {\n \"type\": \"linear\"\n },\n \"spanNulls\": false,\n \"stack\": \"off\"\n },\n \"datasourceCate\": \"prometheus\",\n \"datasourceValue\": \"${DS_PROMETHEUS}\",\n \"id\": \"8a29cc91-697c-48d7-a613-14e81aeb6772\",\n \"layout\": {\n \"h\": 10,\n \"i\": \"8a29cc91-697c-48d7-a613-14e81aeb6772\",\n \"w\": 8,\n \"x\": 0,\n \"y\": 3\n },\n \"links\": [],\n \"maxPerRow\": 4,\n \"name\": \"Memory Usage\",\n \"options\": {\n \"legend\": {\n \"displayMode\": \"list\",\n \"placement\": \"bottom\"\n },\n \"standardOptions\": {\n \"min\": 0,\n \"util\": \"bytesIEC\"\n },\n \"thresholds\": {\n \"steps\": [\n {\n \"color\": \"#73BF69\",\n \"type\": \"base\",\n \"value\": null\n },\n {\n \"color\": \"#F2495C\",\n \"value\": 80\n }\n ]\n },\n \"tooltip\": {\n \"mode\": \"multi\"\n }\n },\n \"targets\": [\n {\n \"expr\": \"redis_memory_used_bytes{instance=~\\\"$instance\\\"}\",\n \"legend\": \"used - {{instance}}\",\n \"refId\": \"A\"\n },\n {\n \"expr\": \"redis_config_maxmemory{instance=~\\\"$instance\\\"} \\u003e 0\",\n \"legend\": \"max - {{instance}}\",\n \"refId\": \"B\"\n }\n ],\n \"transformations\": [\n {\n \"id\": \"organize\",\n \"options\": {}\n }\n ],\n \"type\": \"timeseries\",\n \"version\": \"3.0.0\"\n },\n {\n \"custom\": {\n \"drawStyle\": \"lines\",\n \"fillOpacity\": 0.1,\n \"gradientMode\": \"none\",\n \"lineInterpolation\": \"linear\",\n \"lineWidth\": 1,\n \"scaleDistribution\": {\n \"type\": \"linear\"\n },\n \"spanNulls\": false,\n \"stack\": \"off\"\n },\n \"datasourceCate\": \"prometheus\",\n \"datasourceValue\": \"${DS_PROMETHEUS}\",\n \"id\": \"34e0f67f-acf1-49bb-b13c-ceebd0b17a7e\",\n \"layout\": {\n \"h\": 7,\n \"i\": \"34e0f67f-acf1-49bb-b13c-ceebd0b17a7e\",\n \"w\": 8,\n \"x\": 8,\n \"y\": 6\n },\n \"links\": [],\n \"maxPerRow\": 4,\n \"name\": \"Expired / Evicted\",\n \"options\": {\n \"legend\": {\n \"displayMode\": \"list\",\n \"placement\": \"bottom\"\n },\n \"standardOptions\": {\n \"min\": 0,\n \"util\": \"none\"\n },\n \"thresholds\": {\n \"steps\": [\n {\n \"color\": \"#73BF69\",\n \"type\": \"base\",\n \"value\": null\n },\n {\n \"color\": \"#F2495C\",\n \"value\": 80\n }\n ]\n },\n \"tooltip\": {\n \"mode\": \"multi\"\n }\n },\n \"targets\": [\n {\n \"expr\": \"sum(rate(redis_expired_keys_total{instance=~\\\"$instance\\\"}[5m]))\",\n \"legend\": \"expired\",\n \"refId\": \"A\"\n },\n {\n \"expr\": \"sum(rate(redis_evicted_keys_total{instance=~\\\"$instance\\\"}[5m]))\",\n \"legend\": \"evicted\",\n \"refId\": \"B\"\n }\n ],\n \"transformations\": [\n {\n \"id\": \"organize\",\n \"options\": {}\n }\n ],\n \"type\": \"timeseries\",\n \"version\": \"3.0.0\"\n },\n {\n \"custom\": {\n \"drawStyle\": \"lines\",\n \"fillOpacity\": 0.1,\n \"gradientMode\": \"none\",\n \"lineInterpolation\": \"linear\",\n \"lineWidth\": 1,\n \"scaleDistribution\": {\n \"type\": \"linear\"\n },\n \"spanNulls\": false,\n \"stack\": \"off\"\n },\n \"datasourceCate\": \"prometheus\",\n \"datasourceValue\": \"${DS_PROMETHEUS}\",\n \"id\": \"634f53c0-31d8-4a9f-9cfc-a7c241797359\",\n \"layout\": {\n \"h\": 7,\n \"i\": \"634f53c0-31d8-4a9f-9cfc-a7c241797359\",\n \"w\": 8,\n \"x\": 16,\n \"y\": 6\n },\n \"links\": [],\n \"maxPerRow\": 4,\n \"name\": \"Network I/O\",\n \"options\": {\n \"legend\": {\n \"displayMode\": \"list\",\n \"placement\": \"bottom\"\n },\n \"standardOptions\": {\n \"min\": 0,\n \"util\": \"none\"\n },\n \"thresholds\": {\n \"steps\": [\n {\n \"color\": \"#73BF69\",\n \"type\": \"base\",\n \"value\": null\n },\n {\n \"color\": \"#F2495C\",\n \"value\": 80\n }\n ]\n },\n \"tooltip\": {\n \"mode\": \"multi\"\n }\n },\n \"targets\": [\n {\n \"expr\": \"sum(\\n rate(redis_net_input_bytes_total{instance=~\\\"$instance\\\"}[5m])\\n)\",\n \"legend\": \"In\",\n \"refId\": \"A\"\n },\n {\n \"expr\": \"sum(\\n rate(redis_net_output_bytes_total{instance=~\\\"$instance\\\"}[5m])\\n)\",\n \"legend\": \"Out\",\n \"refId\": \"B\"\n }\n ],\n \"transformations\": [\n {\n \"id\": \"organize\",\n \"options\": {}\n }\n ],\n \"type\": \"timeseries\",\n \"version\": \"3.0.0\"\n },\n {\n \"custom\": {\n \"drawStyle\": \"lines\",\n \"fillOpacity\": 0.3,\n \"gradientMode\": \"opacity\",\n \"lineInterpolation\": \"linear\",\n \"lineWidth\": 2,\n \"scaleDistribution\": {\n \"type\": \"linear\"\n },\n \"spanNulls\": false,\n \"stack\": \"normal\"\n },\n \"datasourceCate\": \"prometheus\",\n \"datasourceValue\": \"${DS_PROMETHEUS}\",\n \"id\": \"9267bb6a-edc7-4088-913e-5902e81cf736\",\n \"layout\": {\n \"h\": 7,\n \"i\": \"9267bb6a-edc7-4088-913e-5902e81cf736\",\n \"w\": 16,\n \"x\": 0,\n \"y\": 13\n },\n \"links\": [],\n \"maxPerRow\": 4,\n \"name\": \"Command Calls / sec\",\n \"options\": {\n \"legend\": {\n \"displayMode\": \"list\",\n \"placement\": \"right\"\n },\n \"standardOptions\": {\n \"min\": 0,\n \"util\": \"none\"\n },\n \"thresholds\": {\n \"steps\": [\n {\n \"color\": \"#73BF69\",\n \"type\": \"base\",\n \"value\": null\n },\n {\n \"color\": \"#F2495C\",\n \"value\": 80\n }\n ]\n },\n \"tooltip\": {\n \"mode\": \"multi\"\n }\n },\n \"targets\": [\n {\n \"expr\": \"sum without (instance) (\\n rate(redis_commands_total{instance=~\\\"$instance\\\"}[5m])\\n) \\u003e 0\",\n \"legend\": \"{{ cmd }}\",\n \"refId\": \"A\"\n }\n ],\n \"transformations\": [\n {\n \"id\": \"organize\",\n \"options\": {}\n }\n ],\n \"type\": \"timeseries\",\n \"version\": \"3.0.0\"\n },\n {\n \"custom\": {\n \"drawStyle\": \"lines\",\n \"fillOpacity\": 0.3,\n \"gradientMode\": \"opacity\",\n \"lineInterpolation\": \"linear\",\n \"lineWidth\": 2,\n \"scaleDistribution\": {\n \"type\": \"linear\"\n },\n \"spanNulls\": false,\n \"stack\": \"normal\"\n },\n \"datasourceCate\": \"prometheus\",\n \"datasourceValue\": \"${DS_PROMETHEUS}\",\n \"id\": \"51d28f91-c2f3-4f22-859e-bdc88f25ead2\",\n \"layout\": {\n \"h\": 14,\n \"i\": \"51d28f91-c2f3-4f22-859e-bdc88f25ead2\",\n \"w\": 8,\n \"x\": 16,\n \"y\": 13\n },\n \"links\": [],\n \"maxPerRow\": 4,\n \"name\": \"Expiring vs Not-Expiring Keys\",\n \"options\": {\n \"legend\": {\n \"displayMode\": \"list\",\n \"placement\": \"bottom\"\n },\n \"standardOptions\": {\n \"min\": 0,\n \"util\": \"none\"\n },\n \"thresholds\": {\n \"steps\": [\n {\n \"color\": \"#73BF69\",\n \"type\": \"base\",\n \"value\": null\n },\n {\n \"color\": \"#F2495C\",\n \"value\": 80\n }\n ]\n },\n \"tooltip\": {\n \"mode\": \"multi\"\n }\n },\n \"targets\": [\n {\n \"expr\": \"sum(redis_db_keys{instance=~\\\"$instance\\\"} - redis_db_keys_expiring{instance=~\\\"$instance\\\"}) \",\n \"legend\": \"not expiring\",\n \"refId\": \"A\"\n },\n {\n \"expr\": \"sum(redis_db_keys_expiring{instance=~\\\"$instance\\\"})\",\n \"legend\": \"expiring\",\n \"refId\": \"B\"\n }\n ],\n \"transformations\": [\n {\n \"id\": \"organize\",\n \"options\": {}\n }\n ],\n \"type\": \"timeseries\",\n \"version\": \"3.0.0\"\n },\n {\n \"custom\": {\n \"drawStyle\": \"lines\",\n \"fillOpacity\": 0.3,\n \"gradientMode\": \"opacity\",\n \"lineInterpolation\": \"linear\",\n \"lineWidth\": 2,\n \"scaleDistribution\": {\n \"type\": \"linear\"\n },\n \"spanNulls\": false,\n \"stack\": \"normal\"\n },\n \"datasourceCate\": \"prometheus\",\n \"datasourceValue\": \"${DS_PROMETHEUS}\",\n \"id\": \"1c0cd7d9-5899-49c0-8939-a361b76f60ac\",\n \"layout\": {\n \"h\": 7,\n \"i\": \"1c0cd7d9-5899-49c0-8939-a361b76f60ac\",\n \"w\": 16,\n \"x\": 0,\n \"y\": 20\n },\n \"links\": [],\n \"maxPerRow\": 4,\n \"name\": \"Items per DB\",\n \"options\": {\n \"legend\": {\n \"displayMode\": \"list\",\n \"placement\": \"right\"\n },\n \"standardOptions\": {\n \"min\": 0,\n \"util\": \"none\"\n },\n \"thresholds\": {\n \"steps\": [\n {\n \"color\": \"#73BF69\",\n \"type\": \"base\",\n \"value\": null\n },\n {\n \"color\": \"#F2495C\",\n \"value\": 80\n }\n ]\n },\n \"tooltip\": {\n \"mode\": \"multi\"\n }\n },\n \"targets\": [\n {\n \"expr\": \"sum by (db) (\\n redis_db_keys{instance=~\\\"$instance\\\"}\\n)\",\n \"legend\": \"{{ db }} \",\n \"refId\": \"A\"\n }\n ],\n \"transformations\": [\n {\n \"id\": \"organize\",\n \"options\": {}\n }\n ],\n \"type\": \"timeseries\",\n \"version\": \"3.0.0\"\n }\n ],\n \"var\": [\n {\n \"definition\": \"prometheus\",\n \"name\": \"DS_PROMETHEUS\",\n \"type\": \"datasource\"\n },\n {\n \"allOption\": true,\n \"datasource\": {\n \"cate\": \"prometheus\",\n \"value\": \"${DS_PROMETHEUS}\"\n },\n \"definition\": \"label_values(up{job=\\\"redis\\\"}, instance)\",\n \"multi\": true,\n \"name\": \"instance\",\n \"reg\": \"\",\n \"type\": \"query\"\n }\n ],\n \"version\": \"3.0.0\"\n },\n \"public\": 0,\n \"public_cate\": 0,\n \"bgids\": null,\n \"built_in\": 0,\n \"hide\": 0,\n \"uuid\": 1717556327485951000\n}"
},
{
"path": "integrations/Gitlab/markdown/README.md",
"content": "# Gitlab\n\nGitlab 默认提供 Prometheus 协议的监控数据,参考:[Monitoring GitLab with Prometheus](https://docs.gitlab.com/ee/administration/monitoring/prometheus/)。所以,使用 categraf 的 prometheus 插件即可采集。\n\n## 采集配置\n\n配置文件:categraf 的 `conf/input.prometheus/prometheus.toml`\n\n```toml\n[[instances]]\nurls = [\n \"http://192.168.11.77:9236/metrics\"\n]\nlabels = {service=\"gitlab\", job=\"gitaly\"}\n\n[[instances]]\nurls = [\n \"http://192.168.11.77:9168/sidekiq\"\n]\nlabels = {service=\"gitlab\", job=\"gitlab-exporter-sidekiq\"}\n\n[[instances]]\nurls = [\n \"http://192.168.11.77:9168/database\"\n]\nlabels = {service=\"gitlab\",job=\"gitlab-exporter-database\"}\n\n[[instances]]\nurls = [\n \"http://192.168.11.77:8082/metrics\"\n]\nlabels = {service=\"gitlab\", job=\"gitlab-sidekiq\"}\n\n[[instances]]\nurls = [\n \"http://192.168.11.77:8082/metrics\"\n]\nlabels = {service=\"gitlab\", job=\"gitlab-sidekiq\"}\n\n[[instances]]\nurls = [\n \"http://192.168.11.77:9229/metrics\"\n]\nlabels = {service=\"gitlab\",job=\"gitlab-workhorse\"}\n\n[[instances]]\nurls = [\n \"http://192.168.11.77:9100/metrics\"\n]\nlabels = {service=\"gitlab\", job=\"node\"}\n\n[[instances]]\nurls = [\n \"http://192.168.11.77:9187/metrics\"\n]\nlabels = {service=\"gitlab\", job=\"postgres\"}\n\n[[instances]]\nurls = [\n \"http://192.168.11.77:9121/metrics\"\n]\nlabels = {service=\"gitlab\", job=\"redis\"}\n\n[[instances]]\nurls = [\n \"http://192.168.11.77:9999/metrics\"\n]\nlabels = {service=\"gitlab\", job=\"nginx\"}\n```\n\n"
},
{
"path": "integrations/GoogleCloud/collect/googlecloud/gcp.toml",
"content": "#interval=60\n#[[instances]]\n#project_id=\"your-project-id\"\n#credentials_file=\"/path/to/your/key.json\"\n#delay=\"2m\"\n#period=\"1m\"\n#filter=\"metric.type=\\\"compute.googleapis.com/instance/cpu/utilization\\\" AND resource.labels.zone=\\\"asia-northeast1-a\\\"\"\n#timeout=\"5s\"\n#cache_ttl=\"1h\"\n#gce_host_tag=\"xxx\"\n#request_inflight=30\n"
},
{
"path": "integrations/GoogleCloud/markdown/README.md",
"content": "\n\n# GCP 指标获取插件\n\n## 需要权限\n```shell\nhttps://www.googleapis.com/auth/monitoring.read\n```\n\n## 配置\n```toml\n#采集周期,建议 >= 1分钟\ninterval=60\n[[instances]]\n#配置 project_id\nproject_id=\"your-project-id\"\n#配置认证的key文件\ncredentials_file=\"/path/to/your/key.json\"\n#或者配置认证的JSON\ncredentials_json=\"xxx\"\n\n# 指标的end time = now - delay\n#delay=\"2m\"\n# 指标的start time = now - deley - period\n#period=\"1m\"\n# 过滤器\n#filter=\"metric.type=\\\"compute.googleapis.com/instance/cpu/utilization\\\" AND resource.labels.zone=\\\"asia-northeast1-a\\\"\"\n# 请求超时时间\n#timeout=\"5s\"\n# 指标列表的缓存时长 ,filter为空时 启用\n#cache_ttl=\"1h\"\n\n# 给gce的instance_name 取个别名,放到label中\n#gce_host_tag=\"xxx\"\n# 每次最多有多少请求同时发起\n#request_inflight=30\n\n# request_inflight 取值(0,100]\n# 想配置更大的值 ,前提是你知道你在做什么\nforce_request_inflight= 200\n```\n"
},
{
"path": "integrations/HAProxy/collect/haproxy/haproxy.toml",
"content": "[[instances]]\n# URI on which to scrape HAProxy.\n# e.g. \n# uri = \"http://localhost:5000/baz?stats;csv\"\n# uri = \"http://user:pass@haproxy.example.com/haproxy?stats;csv\"\n# uri = \"unix:/run/haproxy/admin.sock\"\nuri = \"\"\n\n# Flag that enables SSL certificate verification for the scrape URI\nssl_verify = false\n\n# Comma-separated list of exported server metrics. See http://cbonte.github.io/haproxy-dconv/configuration-1.5.html#9.1\nserver_metric_fields = \"\"\n\n# Comma-separated list of exported server states to exclude. See https://cbonte.github.io/haproxy-dconv/1.8/management.html#9.1, field 17 status\nserver_exclude_states = \"\"\n\n# Timeout for trying to get stats from HAProxy.\ntimeout = \"5s\"\n\n# Flag that enables using HTTP proxy settings from environment variables ($http_proxy, $https_proxy, $no_proxy)\nproxy_from_env = false\n"
},
{
"path": "integrations/HAProxy/dashboards/dashboard.json",
"content": "{\n \"id\": 0,\n \"group_id\": 0,\n \"name\": \"HAProxy By Categraf\",\n \"ident\": \"\",\n \"tags\": \"\",\n \"create_at\": 0,\n \"create_by\": \"\",\n \"update_at\": 0,\n \"update_by\": \"\",\n \"configs\": {\n \"links\": [\n {\n \"targetBlank\": true,\n \"title\": \"GitHub\",\n \"url\": \"https://github.com/rfmoz/grafana-dashboards\"\n },\n {\n \"targetBlank\": true,\n \"title\": \"Grafana\",\n \"url\": \"https://grafana.com/grafana/dashboards/12693-haproxy-2-full/\"\n }\n ],\n \"panels\": [\n {\n \"custom\": {\n \"calc\": \"lastNotNull\",\n \"colSpan\": 1,\n \"colorMode\": \"background\",\n \"textMode\": \"value\",\n \"textSize\": {},\n \"valueField\": \"Value\"\n },\n \"datasourceCate\": \"prometheus\",\n \"datasourceValue\": \"${datasource}\",\n \"id\": \"3895acd5-4825-4ea6-b120-383b9b96d8de\",\n \"layout\": {\n \"h\": 6,\n \"i\": \"3895acd5-4825-4ea6-b120-383b9b96d8de\",\n \"isResizable\": true,\n \"w\": 2,\n \"x\": 0,\n \"y\": 0\n },\n \"links\": [],\n \"name\": \"Stats API UP?\",\n \"options\": {\n \"standardOptions\": {},\n \"thresholds\": {\n \"steps\": [\n {\n \"color\": \"#634CD9\",\n \"type\": \"base\",\n \"value\": null\n }\n ]\n },\n \"valueMappings\": [\n {\n \"match\": {\n \"special\": 1\n },\n \"result\": {\n \"color\": \"#2c9d3d\",\n \"text\": \"UP\"\n },\n \"type\": \"special\"\n },\n {\n \"match\": {\n \"special\": 0\n },\n \"result\": {\n \"color\": \"#ce4f52\",\n \"text\": \"DOWN\"\n },\n \"type\": \"special\"\n }\n ]\n },\n \"targets\": [\n {\n \"expr\": \"haproxy_up\",\n \"refId\": \"A\"\n }\n ],\n \"type\": \"stat\",\n \"version\": \"2.0.0\"\n },\n {\n \"custom\": {\n \"calc\": \"lastNotNull\",\n \"colorMode\": \"value\",\n \"columns\": [\n \"backend\",\n \"value\"\n ],\n \"displayMode\": \"labelsOfSeriesToRows\",\n \"showHeader\": true\n },\n \"datasourceCate\": \"prometheus\",\n \"datasourceValue\": \"${datasource}\",\n \"id\": \"f98cd0f9-9979-4f4d-807f-757241d72d06\",\n \"layout\": {\n \"h\": 6,\n \"i\": \"39b7c4ea-e19d-45b2-8a02-35b6cd1a0348\",\n \"isResizable\": true,\n \"w\": 5,\n \"x\": 2,\n \"y\": 0\n },\n \"links\": [],\n \"name\": \"Backends UP?\",\n \"options\": {\n \"standardOptions\": {},\n \"valueMappings\": [\n {\n \"match\": {\n \"special\": 1\n },\n \"result\": {\n \"color\": \"#2c9d3d\",\n \"text\": \"UP\"\n },\n \"type\": \"special\"\n },\n {\n \"match\": {\n \"to\": 0\n },\n \"result\": {\n \"color\": \"#e91515\",\n \"text\": \"DOWN\"\n },\n \"type\": \"range\"\n }\n ]\n },\n \"overrides\": [\n {}\n ],\n \"targets\": [\n {\n \"expr\": \"haproxy_backend_up{ident=\\\"$ident\\\"}\",\n \"refId\": \"A\"\n }\n ],\n \"type\": \"table\",\n \"version\": \"2.0.0\"\n },\n {\n \"custom\": {\n \"calc\": \"lastNotNull\",\n \"colorMode\": \"value\",\n \"columns\": [\n \"backend\",\n \"server\",\n \"value\"\n ],\n \"displayMode\": \"labelsOfSeriesToRows\",\n \"showHeader\": true\n },\n \"datasourceCate\": \"prometheus\",\n \"datasourceValue\": \"${datasource}\",\n \"id\": \"fb61f168-1f3e-4385-93e8-2bb168e01945\",\n \"layout\": {\n \"h\": 6,\n \"i\": \"18fdab37-131a-4f24-8f0f-c173d5c8c9f9\",\n \"isResizable\": true,\n \"w\": 5,\n \"x\": 7,\n \"y\": 0\n },\n \"links\": [],\n \"name\": \"Servers UP?\",\n \"options\": {\n \"standardOptions\": {},\n \"valueMappings\": [\n {\n \"match\": {\n \"special\": 1\n },\n \"result\": {\n \"color\": \"#2c9d3d\",\n \"text\": \"UP\"\n },\n \"type\": \"special\"\n },\n {\n \"match\": {\n \"special\": 0,\n \"to\": 0\n },\n \"result\": {\n \"color\": \"#e91515\",\n \"text\": \"DOWN\"\n },\n \"type\": \"special\"\n }\n ]\n },\n \"overrides\": [\n {}\n ],\n \"targets\": [\n {\n \"expr\": \"haproxy_server_up{ident=\\\"$ident\\\"}\",\n \"refId\": \"A\"\n }\n ],\n \"type\": \"table\",\n \"version\": \"2.0.0\"\n },\n {\n \"custom\": {\n \"drawStyle\": \"lines\",\n \"fillOpacity\": 0.2,\n \"gradientMode\": \"none\",\n \"lineInterpolation\": \"linear\",\n \"lineWidth\": 1,\n \"scaleDistribution\": {\n \"type\": \"linear\"\n },\n \"spanNulls\": false,\n \"stack\": \"off\"\n },\n \"datasourceCate\": \"prometheus\",\n \"datasourceValue\": \"${datasource}\",\n \"description\": \"\",\n \"id\": \"aeeb951c-a4d6-4b0e-918e-2f81c2f3b3be\",\n \"layout\": {\n \"h\": 6,\n \"i\": \"aeeb951c-a4d6-4b0e-918e-2f81c2f3b3be\",\n \"isResizable\": true,\n \"w\": 12,\n \"x\": 12,\n \"y\": 0\n },\n \"links\": [],\n \"name\": \"Active sessions\",\n \"options\": {\n \"legend\": {\n \"displayMode\": \"list\",\n \"placement\": \"bottom\"\n },\n \"standardOptions\": {\n \"util\": \"none\"\n },\n \"thresholds\": {\n \"steps\": [\n {\n \"color\": \"green\",\n \"type\": \"base\",\n \"value\": null\n }\n ]\n },\n \"tooltip\": {\n \"mode\": \"all\",\n \"sort\": \"desc\"\n }\n },\n \"targets\": [\n {\n \"expr\": \"sum(haproxy_frontend_current_sessions{frontend=~\\\"$frontend\\\",ident=\\\"$ident\\\"}) by (frontend)\",\n \"legend\": \"Front-{{frontend}}\",\n \"refId\": \"B\"\n },\n {\n \"expr\": \"sum(haproxy_backend_current_sessions{backend=~\\\"$backend\\\",ident=\\\"$ident\\\"}) by (backend)\",\n \"legend\": \"Back-{{backend}}\",\n \"refId\": \"A\"\n }\n ],\n \"type\": \"timeseries\",\n \"version\": \"2.0.0\"\n },\n {\n \"custom\": {\n \"drawStyle\": \"lines\",\n \"fillOpacity\": 0.2,\n \"gradientMode\": \"none\",\n \"lineInterpolation\": \"linear\",\n \"lineWidth\": 1,\n \"scaleDistribution\": {\n \"type\": \"linear\"\n },\n \"spanNulls\": false,\n \"stack\": \"off\"\n },\n \"datasourceCate\": \"prometheus\",\n \"datasourceValue\": \"${datasource}\",\n \"description\": \"\",\n \"id\": \"96ca72c3-745e-458a-902f-fd3841b5453d\",\n \"layout\": {\n \"h\": 6,\n \"i\": \"96ca72c3-745e-458a-902f-fd3841b5453d\",\n \"isResizable\": true,\n \"w\": 12,\n \"x\": 0,\n \"y\": 6\n },\n \"links\": [],\n \"name\": \"Frontend responses by code\",\n \"options\": {\n \"legend\": {\n \"displayMode\": \"list\",\n \"placement\": \"bottom\"\n },\n \"standardOptions\": {\n \"util\": \"none\"\n },\n \"thresholds\": {\n \"steps\": [\n {\n \"color\": \"green\",\n \"type\": \"base\",\n \"value\": null\n }\n ]\n },\n \"tooltip\": {\n \"mode\": \"all\",\n \"sort\": \"desc\"\n }\n },\n \"targets\": [\n {\n \"expr\": \"sum(rate(haproxy_frontend_http_responses_total{frontend=~\\\"$frontend\\\",code=~\\\"$code\\\",ident=\\\"$ident\\\"}[5m])) by (code)\",\n \"legend\": \"{{ code }}\",\n \"refId\": \"B\"\n }\n ],\n \"type\": \"timeseries\",\n \"version\": \"2.0.0\"\n },\n {\n \"custom\": {\n \"drawStyle\": \"lines\",\n \"fillOpacity\": 0.2,\n \"gradientMode\": \"none\",\n \"lineInterpolation\": \"linear\",\n \"lineWidth\": 1,\n \"scaleDistribution\": {\n \"type\": \"linear\"\n },\n \"spanNulls\": false,\n \"stack\": \"off\"\n },\n \"datasourceCate\": \"prometheus\",\n \"datasourceValue\": \"${datasource}\",\n \"description\": \"\",\n \"id\": \"cbadd1e1-25e2-41bd-9fe2-f5e932753c02\",\n \"layout\": {\n \"h\": 6,\n \"i\": \"e9d01556-c4d0-4c2e-b555-97f0d99f7f6a\",\n \"isResizable\": true,\n \"w\": 12,\n \"x\": 12,\n \"y\": 6\n },\n \"links\": [],\n \"name\": \"Backend responses by code\",\n \"options\": {\n \"legend\": {\n \"displayMode\": \"list\",\n \"placement\": \"bottom\"\n },\n \"standardOptions\": {\n \"util\": \"none\"\n },\n \"thresholds\": {\n \"steps\": [\n {\n \"color\": \"green\",\n \"type\": \"base\",\n \"value\": null\n }\n ]\n },\n \"tooltip\": {\n \"mode\": \"all\",\n \"sort\": \"desc\"\n }\n },\n \"targets\": [\n {\n \"expr\": \"sum(rate(haproxy_backend_http_responses_total{backend=~\\\"$backend\\\",code=~\\\"$code\\\",ident=\\\"$ident\\\"}[5m])) by (code)\",\n \"legend\": \"{{ code }}\",\n \"refId\": \"B\"\n }\n ],\n \"type\": \"timeseries\",\n \"version\": \"2.0.0\"\n },\n {\n \"custom\": {\n \"drawStyle\": \"lines\",\n \"fillOpacity\": 0.2,\n \"gradientMode\": \"none\",\n \"lineInterpolation\": \"linear\",\n \"lineWidth\": 1,\n \"scaleDistribution\": {\n \"type\": \"linear\"\n },\n \"spanNulls\": false,\n \"stack\": \"off\"\n },\n \"datasourceCate\": \"prometheus\",\n \"datasourceValue\": \"${datasource}\",\n \"description\": \"\",\n \"id\": \"bb9db80d-7f9c-4b6b-8434-24e3ec480d5b\",\n \"layout\": {\n \"h\": 6,\n \"i\": \"bb9db80d-7f9c-4b6b-8434-24e3ec480d5b\",\n \"isResizable\": true,\n \"w\": 12,\n \"x\": 0,\n \"y\": 12\n },\n \"links\": [],\n \"name\": \"Incoming / Outgoing bits (Frontend)\",\n \"options\": {\n \"legend\": {\n \"displayMode\": \"list\",\n \"placement\": \"bottom\"\n },\n \"standardOptions\": {\n \"util\": \"bitsIEC\"\n },\n \"thresholds\": {\n \"steps\": [\n {\n \"color\": \"green\",\n \"type\": \"base\",\n \"value\": null\n }\n ]\n },\n \"tooltip\": {\n \"mode\": \"all\",\n \"sort\": \"desc\"\n }\n },\n \"targets\": [\n {\n \"expr\": \"sum(rate(haproxy_frontend_bytes_in_total{frontend=~\\\"$frontend\\\",ident=\\\"$ident\\\"}[5m])*8) by (frontend)\",\n \"legend\": \"IN {{frontend}}\",\n \"refId\": \"A\"\n },\n {\n \"expr\": \"-sum(rate(haproxy_frontend_bytes_out_total{frontend=~\\\"$frontend\\\",ident=\\\"$ident\\\"}[5m])*8) by (frontend)\",\n \"legend\": \"OUT {{frontend}}\",\n \"refId\": \"B\"\n }\n ],\n \"type\": \"timeseries\",\n \"version\": \"2.0.0\"\n },\n {\n \"custom\": {\n \"drawStyle\": \"lines\",\n \"fillOpacity\": 0.2,\n \"gradientMode\": \"none\",\n \"lineInterpolation\": \"linear\",\n \"lineWidth\": 1,\n \"scaleDistribution\": {\n \"type\": \"linear\"\n },\n \"spanNulls\": false,\n \"stack\": \"off\"\n },\n \"datasourceCate\": \"prometheus\",\n \"datasourceValue\": \"${datasource}\",\n \"description\": \"\",\n \"id\": \"6ab18da8-c354-4349-b25b-a50cdb02aae8\",\n \"layout\": {\n \"h\": 6,\n \"i\": \"299e6721-990a-4070-afdd-6f6e402ca3af\",\n \"isResizable\": true,\n \"w\": 12,\n \"x\": 12,\n \"y\": 12\n },\n \"links\": [],\n \"name\": \"Incoming / Outgoing bits(Backend)\",\n \"options\": {\n \"legend\": {\n \"displayMode\": \"list\",\n \"placement\": \"bottom\"\n },\n \"standardOptions\": {\n \"util\": \"bitsIEC\"\n },\n \"thresholds\": {\n \"steps\": [\n {\n \"color\": \"green\",\n \"type\": \"base\",\n \"value\": null\n }\n ]\n },\n \"tooltip\": {\n \"mode\": \"all\",\n \"sort\": \"desc\"\n }\n },\n \"targets\": [\n {\n \"expr\": \"sum(rate(haproxy_backend_bytes_in_total{backend=~\\\"$backend\\\",ident=\\\"$ident\\\"}[5m])*8) by (backend)\",\n \"legend\": \"IN {{backend}}\",\n \"refId\": \"A\"\n },\n {\n \"expr\": \"-sum(rate(haproxy_backend_bytes_out_total{backend=~\\\"$backend\\\",ident=\\\"$ident\\\"}[5m])*8) by (backend)\",\n \"legend\": \"OUT {{backend}}\",\n \"refId\": \"B\"\n }\n ],\n \"type\": \"timeseries\",\n \"version\": \"2.0.0\"\n },\n {\n \"custom\": {\n \"drawStyle\": \"lines\",\n \"fillOpacity\": 0.2,\n \"gradientMode\": \"none\",\n \"lineInterpolation\": \"linear\",\n \"lineWidth\": 1,\n \"scaleDistribution\": {\n \"type\": \"linear\"\n },\n \"spanNulls\": false,\n \"stack\": \"off\"\n },\n \"datasourceCate\": \"prometheus\",\n \"datasourceValue\": \"${datasource}\",\n \"description\": \"\",\n \"id\": \"5805c4b5-66c9-40d2-846d-4acc8a434ecd\",\n \"layout\": {\n \"h\": 7,\n \"i\": \"5805c4b5-66c9-40d2-846d-4acc8a434ecd\",\n \"isResizable\": true,\n \"w\": 12,\n \"x\": 0,\n \"y\": 18\n },\n \"links\": [],\n \"name\": \"Frontend Requests\",\n \"options\": {\n \"legend\": {\n \"displayMode\": \"list\",\n \"placement\": \"bottom\"\n },\n \"standardOptions\": {\n \"util\": \"none\"\n },\n \"thresholds\": {\n \"steps\": [\n {\n \"color\": \"green\",\n \"type\": \"base\",\n \"value\": null\n }\n ]\n },\n \"tooltip\": {\n \"mode\": \"all\",\n \"sort\": \"desc\"\n }\n },\n \"targets\": [\n {\n \"expr\": \"sum(rate(haproxy_frontend_http_requests_total{frontend=~\\\"$frontend\\\",ident=\\\"$ident\\\"}[5m])) by (frontend)\",\n \"legend\": \"Front requests - {{frontend}}\",\n \"refId\": \"A\"\n },\n {\n \"expr\": \"sum(rate(haproxy_frontend_request_errors_total{frontend=~\\\"$frontend\\\",ident=\\\"$ident\\\"}[5m])) by (frontend)\",\n \"legend\": \"Front requests errors - {{frontend}}\",\n \"refId\": \"C\"\n },\n {\n \"expr\": \"sum(rate(haproxy_frontend_requests_denied_total{frontend=~\\\"$frontend\\\",ident=\\\"$ident\\\"}[5m])) by (frontend)\",\n \"legend\": \"Front request denied - {{frontend}}\",\n \"refId\": \"F\"\n }\n ],\n \"type\": \"timeseries\",\n \"version\": \"2.0.0\"\n },\n {\n \"custom\": {\n \"drawStyle\": \"lines\",\n \"fillOpacity\": 0.2,\n \"gradientMode\": \"none\",\n \"lineInterpolation\": \"linear\",\n \"lineWidth\": 1,\n \"scaleDistribution\": {\n \"type\": \"linear\"\n },\n \"spanNulls\": false,\n \"stack\": \"off\"\n },\n \"datasourceCate\": \"prometheus\",\n \"datasourceValue\": \"${datasource}\",\n \"description\": \"\",\n \"id\": \"d1d2d177-eab6-43f5-a778-7999c6cd646c\",\n \"layout\": {\n \"h\": 7,\n \"i\": \"5530a396-b52e-491b-8ca2-4c18ebf9c3f2\",\n \"isResizable\": true,\n \"w\": 12,\n \"x\": 12,\n \"y\": 18\n },\n \"links\": [],\n \"name\": \"Backend Requests\",\n \"options\": {\n \"legend\": {\n \"displayMode\": \"list\",\n \"placement\": \"bottom\"\n },\n \"standardOptions\": {\n \"util\": \"none\"\n },\n \"thresholds\": {\n \"steps\": [\n {\n \"color\": \"green\",\n \"type\": \"base\",\n \"value\": null\n }\n ]\n },\n \"tooltip\": {\n \"mode\": \"all\",\n \"sort\": \"desc\"\n }\n },\n \"targets\": [\n {\n \"expr\": \"sum(rate(haproxy_backend_redispatch_warnings_total{backend=~\\\"$backend\\\",ident=\\\"$ident\\\"}[5m])) by (backend)\",\n \"legend\": \"Back redispatch warnings + {{backend}}\",\n \"refId\": \"D\"\n },\n {\n \"expr\": \"sum(rate(haproxy_backend_retry_warnings_total{backend=~\\\"$backend\\\",ident=\\\"$ident\\\"}[5m])) by (backend)\",\n \"legend\": \"Back retry warnings + {{backend}}\",\n \"refId\": \"E\"\n },\n {\n \"expr\": \"sum(rate(haproxy_backend_response_errors_total{backend=~\\\"$backend\\\",ident=\\\"$ident\\\"}[5m])) by (backend)\",\n \"legend\": \"Back response errors + {{backend}}\",\n \"refId\": \"I\"\n },\n {\n \"expr\": \"sum(haproxy_backend_current_queue{backend=~\\\"$backend\\\",ident=\\\"$host\\\"}) by (backend)\",\n \"legend\": \"Back queued requests + {{backend}}\",\n \"refId\": \"G\"\n },\n {\n \"expr\": \"sum(rate(haproxy_backend_connection_errors_total{backend=~\\\"$backend\\\", ident=\\\"$ident\\\"}[5m])) by (backend)\",\n \"legend\": \"Back conn errors + {{backend}}\",\n \"refId\": \"A\"\n }\n ],\n \"type\": \"timeseries\",\n \"version\": \"2.0.0\"\n }\n ],\n \"var\": [\n {\n \"definition\": \"prometheus\",\n \"name\": \"datasource\",\n \"type\": \"datasource\"\n },\n {\n \"datasource\": {\n \"cate\": \"prometheus\",\n \"value\": \"${datasource}\"\n },\n \"definition\": \"label_values(haproxy_up,ident)\",\n \"multi\": false,\n \"name\": \"ident\",\n \"reg\": \"\",\n \"type\": \"query\"\n },\n {\n \"allOption\": true,\n \"datasource\": {\n \"cate\": \"prometheus\",\n \"value\": \"${datasource}\"\n },\n \"definition\": \"label_values(haproxy_frontend_bytes_in_total{ident=\\\"$ident\\\"}, frontend)\",\n \"multi\": true,\n \"name\": \"frontend\",\n \"reg\": \"\",\n \"type\": \"query\"\n },\n {\n \"allOption\": true,\n \"datasource\": {\n \"cate\": \"prometheus\",\n \"value\": \"${datasource}\"\n },\n \"definition\": \"label_values(haproxy_backend_bytes_in_total{ident=\\\"$ident\\\"}, backend)\",\n \"multi\": true,\n \"name\": \"backend\",\n \"reg\": \"\",\n \"type\": \"query\"\n },\n {\n \"allOption\": true,\n \"datasource\": {\n \"cate\": \"prometheus\",\n \"value\": \"${datasource}\"\n },\n \"definition\": \"label_values(haproxy_server_bytes_in_total{ident=\\\"$ident\\\", backend=~\\\"$backend\\\"}, server)\",\n \"multi\": true,\n \"name\": \"server\",\n \"reg\": \"\",\n \"type\": \"query\"\n },\n {\n \"allOption\": true,\n \"datasource\": {\n \"cate\": \"prometheus\",\n \"value\": \"${datasource}\"\n },\n \"definition\": \"label_values(haproxy_server_http_responses_total{ident=\\\"$ident\\\",backend=~\\\"$backend\\\", server=~\\\"$server\\\"}, code)\",\n \"multi\": true,\n \"name\": \"code\",\n \"reg\": \"\",\n \"type\": \"query\"\n }\n ],\n \"version\": \"3.0.0\"\n },\n \"public\": 0,\n \"public_cate\": 0,\n \"bgids\": null,\n \"built_in\": 0,\n \"hide\": 0,\n \"uuid\": 1717556327492256000\n}"
},
{
"path": "integrations/HAProxy/markdown/README.md",
"content": "# HAProxy\n\nforked from [haproxy_exporter](https://github.com/prometheus/haproxy_exporter)\n\nNote: since HAProxy 2.0.0, the official source includes a Prometheus exporter module that can be built into your binary with a single flag during build time and offers an exporter-free Prometheus endpoint.\n\n\nhaproxy configurations for `/stats`:\n\n```\nfrontend stats\n bind *:8404\n stats enable\n stats uri /stats\n stats refresh 10s\n```"
},
{
"path": "integrations/HTTP_Response/alerts/http_response_by_categraf.json",
"content": "[\n {\n \"id\": 0,\n \"group_id\": 0,\n \"cate\": \"prometheus\",\n \"datasource_ids\": [\n 52\n ],\n \"cluster\": \"\",\n \"name\": \"http detect failed\",\n \"note\": \"\",\n \"prod\": \"metric\",\n \"algorithm\": \"\",\n \"algo_params\": null,\n \"delay\": 0,\n \"severity\": 2,\n \"severities\": [\n 2\n ],\n \"disabled\": 1,\n \"prom_for_duration\": 60,\n \"prom_ql\": \"\",\n \"rule_config\": {\n \"algo_params\": null,\n \"inhibit\": false,\n \"prom_ql\": \"\",\n \"queries\": [\n {\n \"prom_ql\": \"http_response_result_code != 0\",\n \"severity\": 2\n }\n ],\n \"severity\": 0\n },\n \"prom_eval_interval\": 15,\n \"enable_stime\": \"00:00\",\n \"enable_stimes\": [\n \"00:00\"\n ],\n \"enable_etime\": \"23:59\",\n \"enable_etimes\": [\n \"23:59\"\n ],\n \"enable_days_of_week\": [\n \"1\",\n \"2\",\n \"3\",\n \"4\",\n \"5\",\n \"6\",\n \"0\"\n ],\n \"enable_days_of_weeks\": [\n [\n \"1\",\n \"2\",\n \"3\",\n \"4\",\n \"5\",\n \"6\",\n \"0\"\n ]\n ],\n \"enable_in_bg\": 0,\n \"notify_recovered\": 1,\n \"notify_channels\": [],\n \"notify_groups_obj\": null,\n \"notify_groups\": null,\n \"notify_repeat_step\": 60,\n \"notify_max_number\": 0,\n \"recover_duration\": 0,\n \"callbacks\": [],\n \"runbook_url\": \"\",\n \"append_tags\": [],\n \"annotations\": null,\n \"extra_config\": null,\n \"create_at\": 0,\n \"create_by\": \"\",\n \"update_at\": 0,\n \"update_by\": \"\",\n \"uuid\": 1717556327498098000\n },\n {\n \"id\": 0,\n \"group_id\": 0,\n \"cate\": \"prometheus\",\n \"datasource_ids\": [\n 52\n ],\n \"cluster\": \"\",\n \"name\": \"https certificate will expire within 7 days\",\n \"note\": \"\",\n \"prod\": \"metric\",\n \"algorithm\": \"\",\n \"algo_params\": null,\n \"delay\": 0,\n \"severity\": 2,\n \"severities\": [\n 2\n ],\n \"disabled\": 1,\n \"prom_for_duration\": 60,\n \"prom_ql\": \"\",\n \"rule_config\": {\n \"algo_params\": null,\n \"inhibit\": false,\n \"prom_ql\": \"\",\n \"queries\": [\n {\n \"prom_ql\": \"(http_response_cert_expire_timestamp - time())/86400 \\u003c= 7\",\n \"severity\": 2\n }\n ],\n \"severity\": 0\n },\n \"prom_eval_interval\": 15,\n \"enable_stime\": \"00:00\",\n \"enable_stimes\": [\n \"00:00\"\n ],\n \"enable_etime\": \"23:59\",\n \"enable_etimes\": [\n \"23:59\"\n ],\n \"enable_days_of_week\": [\n \"1\",\n \"2\",\n \"3\",\n \"4\",\n \"5\",\n \"6\",\n \"0\"\n ],\n \"enable_days_of_weeks\": [\n [\n \"1\",\n \"2\",\n \"3\",\n \"4\",\n \"5\",\n \"6\",\n \"0\"\n ]\n ],\n \"enable_in_bg\": 0,\n \"notify_recovered\": 1,\n \"notify_channels\": [],\n \"notify_groups_obj\": null,\n \"notify_groups\": null,\n \"notify_repeat_step\": 60,\n \"notify_max_number\": 0,\n \"recover_duration\": 0,\n \"callbacks\": [],\n \"runbook_url\": \"\",\n \"append_tags\": [],\n \"annotations\": null,\n \"extra_config\": null,\n \"create_at\": 0,\n \"create_by\": \"\",\n \"update_at\": 0,\n \"update_by\": \"\",\n \"uuid\": 1717556327498589000\n }\n]"
},
{
"path": "integrations/HTTP_Response/collect/http_response/http_response.toml",
"content": "## collect interval\n# interval = 15\n\n## Set the mapping of extra tags in batches\n[mappings]\n# \"http://localhost\" = { \"job\" = \"local\" }\n# \"https://www.baidu.com\" = { \"job\" = \"baidu\" }\n\n[[instances]]\ntargets = [\n# \"http://localhost\",\n# \"https://www.baidu.com\"\n]\n\n## append some labels for series\n# labels = { region=\"cloud\", product=\"n9e\" }\n\n## interval = global.interval * interval_times\n# interval_times = 1\n\n## Set http_proxy (categraf uses the system wide proxy settings if it's is not set)\n# http_proxy = \"http://localhost:8888\"\n\n## Interface to use when dialing an address\n# interface = \"eth0\"\n\n## HTTP Request Method\n# method = \"GET\"\n\n## Set response_timeout (default 5 seconds)\n# response_timeout = \"5s\"\n\n## Whether to follow redirects from the server (defaults to false)\n# follow_redirects = false\n\n## Optional HTTP Basic Auth Credentials\n# username = \"username\"\n# password = \"pa$$word\"\n\n## Optional headers\n# headers = [\"Header-Key-1\", \"Header-Value-1\", \"Header-Key-2\", \"Header-Value-2\"]\n\n## Optional HTTP Request Body\n# body = '''\n# {'fake':'data'}\n# '''\n\n## Optional substring or regular expression match in body of the response(substring case sensitive).\n## When both of the following parameters are enabled, one of them can be satisfied.\n# expect_response_substring = \"ok\"\n# expect_response_regular_expression = \"green|yellow\"\n\n## Optional expected response status codes.\n## \"expect_response_status_codes\" Supports adding multiple codes by delimiter(\"|\" or \",\").\n## When both of the following parameters are enabled, one of them can be satisfied.\n# expect_response_status_code = 0\n# expect_response_status_codes = \"200|301\"\n\n## Optional TLS Config\n# use_tls = false\n# tls_ca = \"/etc/categraf/ca.pem\"\n# tls_cert = \"/etc/categraf/cert.pem\"\n# tls_key = \"/etc/categraf/key.pem\"\n## Use TLS but skip chain & host verification\n# insecure_skip_verify = false\n"
},
{
"path": "integrations/HTTP_Response/dashboards/http_response_by_categraf.json",
"content": "{\n \"id\": 0,\n \"group_id\": 0,\n \"name\": \"HTTP detect by UlricQin\",\n \"ident\": \"\",\n \"tags\": \"\",\n \"create_at\": 0,\n \"create_by\": \"\",\n \"update_at\": 0,\n \"update_by\": \"\",\n \"configs\": {\n \"panels\": [\n {\n \"custom\": {\n \"aggrDimension\": \"target\",\n \"calc\": \"lastNotNull\",\n \"colorMode\": \"background\",\n \"displayMode\": \"labelValuesToRows\",\n \"showHeader\": true,\n \"sortColumn\": \"target\",\n \"sortOrder\": \"ascend\"\n },\n \"datasourceCate\": \"prometheus\",\n \"datasourceValue\": \"${Datasource}\",\n \"id\": \"3674dbfa-243a-49f6-baa5-b7f887c1afb0\",\n \"layout\": {\n \"h\": 15,\n \"i\": \"3674dbfa-243a-49f6-baa5-b7f887c1afb0\",\n \"isResizable\": true,\n \"w\": 24,\n \"x\": 0,\n \"y\": 0\n },\n \"name\": \"URL Details\",\n \"options\": {\n \"standardOptions\": {},\n \"valueMappings\": []\n },\n \"overrides\": [\n {\n \"matcher\": {\n \"value\": \"A\"\n },\n \"properties\": {\n \"standardOptions\": {},\n \"valueMappings\": [\n {\n \"match\": {\n \"special\": 0\n },\n \"result\": {\n \"color\": \"#417505\",\n \"text\": \"UP\"\n },\n \"type\": \"special\"\n },\n {\n \"match\": {\n \"from\": 1,\n \"special\": 1\n },\n \"result\": {\n \"color\": \"#e90f0f\",\n \"text\": \"DOWN\"\n },\n \"type\": \"range\"\n }\n ]\n }\n },\n {\n \"matcher\": {\n \"value\": \"D\"\n },\n \"properties\": {\n \"standardOptions\": {\n \"util\": \"humantimeSeconds\"\n },\n \"valueMappings\": [\n {\n \"match\": {\n \"to\": 604800\n },\n \"result\": {\n \"color\": \"#f60c0c\"\n },\n \"type\": \"range\"\n },\n {\n \"match\": {\n \"to\": 2592000\n },\n \"result\": {\n \"color\": \"#ffae39\"\n },\n \"type\": \"range\"\n }\n ]\n },\n \"type\": \"special\"\n },\n {\n \"matcher\": {\n \"value\": \"B\"\n },\n \"properties\": {\n \"standardOptions\": {},\n \"valueMappings\": [\n {\n \"match\": {\n \"to\": 399\n },\n \"result\": {\n \"color\": \"#2c9d3d\"\n },\n \"type\": \"range\"\n },\n {\n \"match\": {\n \"to\": 499\n },\n \"result\": {\n \"color\": \"#ff656b\"\n },\n \"type\": \"range\"\n },\n {\n \"match\": {\n \"from\": 500\n },\n \"result\": {\n \"color\": \"#f10808\"\n },\n \"type\": \"range\"\n }\n ]\n },\n \"type\": \"special\"\n },\n {\n \"matcher\": {\n \"value\": \"C\"\n },\n \"properties\": {\n \"standardOptions\": {\n \"util\": \"milliseconds\"\n },\n \"valueMappings\": [\n {\n \"match\": {\n \"to\": 400\n },\n \"result\": {\n \"color\": \"#2c9d3d\"\n },\n \"type\": \"range\"\n },\n {\n \"match\": {\n \"from\": 400\n },\n \"result\": {\n \"color\": \"#ff656b\"\n },\n \"type\": \"range\"\n },\n {\n \"match\": {\n \"from\": 2000\n },\n \"result\": {\n \"color\": \"#f11313\"\n },\n \"type\": \"range\"\n }\n ]\n },\n \"type\": \"special\"\n }\n ],\n \"targets\": [\n {\n \"expr\": \"max(http_response_result_code) by (target)\",\n \"instant\": true,\n \"legend\": \"UP?\",\n \"refId\": \"A\"\n },\n {\n \"expr\": \"max(http_response_response_code) by (target)\",\n \"instant\": true,\n \"legend\": \"status code\",\n \"refId\": \"B\"\n },\n {\n \"expr\": \"max(http_response_response_time) by (target) *1000\",\n \"instant\": true,\n \"legend\": \"latency\",\n \"refId\": \"C\"\n },\n {\n \"expr\": \"max(http_response_cert_expire_timestamp) by (target) - time()\",\n \"instant\": true,\n \"legend\": \"cert expire\",\n \"refId\": \"D\"\n }\n ],\n \"transformations\": [\n {\n \"id\": \"organize\",\n \"options\": {}\n }\n ],\n \"type\": \"table\",\n \"version\": \"3.0.0\"\n }\n ],\n \"var\": [\n {\n \"definition\": \"prometheus\",\n \"name\": \"Datasource\",\n \"type\": \"datasource\"\n }\n ],\n \"version\": \"3.0.0\"\n },\n \"public\": 0,\n \"public_cate\": 0,\n \"bgids\": null,\n \"built_in\": 0,\n \"hide\": 0,\n \"uuid\": 1717556327500066000\n}"
},
{
"path": "integrations/HTTP_Response/markdown/http.md",
"content": "# http_response plugin\n\nHTTP 探测插件,用于检测 HTTP 地址的连通性、延迟、HTTPS 证书过期时间。因为 Prometheus 生态的时序库只能存储 float64 类型的值,所以 HTTP 地址探测的结果也是 float64 类型的值,但是这个值的含义是不同的,具体含义如下:\n\n```\nSuccess = 0\nConnectionFailed = 1\nTimeout = 2\nDNSError = 3\nAddressError = 4\nBodyMismatch = 5\nCodeMismatch = 6\n```\n\n如果一切正常,这个值是 0,如果有异常,这个值是 1-6 之间的值,具体含义如上。这个值对应的指标名字是 `http_response_result_code`。\n\n## Configuration\n\ncategraf 的 `conf/input.http_response/http_response.toml`。最核心的配置就是 targets 配置,配置目标地址,比如想要监控两个地址:\n\n```toml\n[[instances]]\ntargets = [\n \"http://localhost:8080\",\n \"https://www.baidu.com\"\n]\n```\n\ninstances 下面的所有 targets 共享同一个 `[[instances]]` 下面的配置,比如超时时间,HTTP方法等,如果有些配置不同,可以拆成多个不同的 `[[instances]]`,比如:\n\n```toml\n[[instances]]\ntargets = [\n \"http://localhost:8080\",\n \"https://www.baidu.com\"\n]\nmethod = \"GET\"\n\n[[instances]]\ntargets = [\n \"http://localhost:9090\"\n]\nmethod = \"POST\"\n```\n\n完整的带有注释的配置如下:\n\n```toml\n[[instances]]\ntargets = [\n# \"http://localhost\",\n# \"https://www.baidu.com\"\n]\n\n# # append some labels for series\n# labels = { region=\"cloud\", product=\"n9e\" }\n\n# # interval = global.interval * interval_times\n# interval_times = 1\n\n## Set http_proxy (categraf uses the system wide proxy settings if it's is not set)\n# http_proxy = \"http://localhost:8888\"\n\n## Interface to use when dialing an address\n# interface = \"eth0\"\n\n## HTTP Request Method\n# method = \"GET\"\n\n## Set response_timeout (default 5 seconds)\n# response_timeout = \"5s\"\n\n## Whether to follow redirects from the server (defaults to false)\n# follow_redirects = false\n\n## Optional HTTP Basic Auth Credentials\n# username = \"username\"\n# password = \"pa$$word\"\n\n## Optional headers\n# headers = [\"Header-Key-1\", \"Header-Value-1\", \"Header-Key-2\", \"Header-Value-2\"]\n\n## Optional HTTP Request Body\n# body = '''\n# {'fake':'data'}\n# '''\n\n## Optional substring match in body of the response (case sensitive)\n# expect_response_substring = \"ok\"\n\n## Optional expected response status code.\n# expect_response_status_code = 0\n\n## Optional TLS Config\n# use_tls = false\n# tls_ca = \"/etc/categraf/ca.pem\"\n# tls_cert = \"/etc/categraf/cert.pem\"\n# tls_key = \"/etc/categraf/key.pem\"\n## Use TLS but skip chain & host verification\n# insecure_skip_verify = false\n```\n"
},
{
"path": "integrations/HTTP_Response/metrics/categraf.json",
"content": "[\n {\n \"id\": 0,\n \"uuid\": 1717556327501087000,\n \"collector\": \"Categraf\",\n \"typ\": \"HTTP_Response\",\n \"name\": \"HTTP 探测响应码\",\n \"unit\": \"none\",\n \"note\": \"如果没有拿到 response,这个指标就没有值了\",\n \"lang\": \"zh_CN\",\n \"expression\": \"http_response_response_code\",\n \"created_at\": 0,\n \"created_by\": \"\",\n \"updated_at\": 0,\n \"updated_by\": \"\",\n \"translation\": [\n {\n \"lang\": \"zh_CN\",\n \"name\": \"HTTP 探测响应码\",\n \"note\": \"如果没有拿到 response,这个指标就没有值了\"\n },\n {\n \"lang\": \"en_US\",\n \"name\": \"HTTP probe response code\",\n \"note\": \"If you don't get response, this indicator has no value\"\n }\n ]\n },\n {\n \"id\": 0,\n \"uuid\": 1717556327503611000,\n \"collector\": \"Categraf\",\n \"typ\": \"HTTP_Response\",\n \"name\": \"HTTP 探测结果状态码\",\n \"unit\": \"none\",\n \"note\": \"0 值表示正常,大于 0 就是异常,各个值的含义如下:\\n\\n```\\nSuccess = 0\\nConnectionFailed = 1\\nTimeout = 2\\nDNSError = 3\\nAddressError = 4\\nBodyMismatch = 5\\nCodeMismatch = 6\\n```\",\n \"lang\": \"zh_CN\",\n \"expression\": \"http_response_result_code\",\n \"created_at\": 0,\n \"created_by\": \"\",\n \"updated_at\": 0,\n \"updated_by\": \"\",\n \"translation\": [\n {\n \"lang\": \"zh_CN\",\n \"name\": \"HTTP 探测结果状态码\",\n \"note\": \"0 值表示正常,大于 0 就是异常,各个值的含义如下:\\n\\n```\\nSuccess = 0\\nConnectionFailed = 1\\nTimeout = 2\\nDNSError = 3\\nAddressError = 4\\nBodyMismatch = 5\\nCodeMismatch = 6\\n```\"\n },\n {\n \"lang\": \"en_US\",\n \"name\": \"HTTP probe result status code\",\n \"note\": \"A value of 0 means normal, and a value greater than 0 means abnormal. The meanings of each value are as follows: \\n \\n``` \\nSuccess = 0 \\nConnectionFailed = 1 \\nTimeout = 2 \\nDNSError = 3 \\nAddressError = 4 \\nBodyMismatch = 5 \\nCodeMismatch = 6 \\n```\"\n }\n ]\n },\n {\n \"id\": 0,\n \"uuid\": 1717556327506135000,\n \"collector\": \"Categraf\",\n \"typ\": \"HTTP_Response\",\n \"name\": \"HTTP 探测耗时\",\n \"unit\": \"seconds\",\n \"note\": \"\",\n \"lang\": \"zh_CN\",\n \"expression\": \"http_response_response_time\",\n \"created_at\": 0,\n \"created_by\": \"\",\n \"updated_at\": 0,\n \"updated_by\": \"\",\n \"translation\": [\n {\n \"lang\": \"zh_CN\",\n \"name\": \"HTTP 探测耗时\",\n \"note\": \"\"\n },\n {\n \"lang\": \"en_US\",\n \"name\": \"HTTP probe time-consuming\",\n \"note\": \"\"\n }\n ]\n },\n {\n \"id\": 0,\n \"uuid\": 1717556327508519000,\n \"collector\": \"Categraf\",\n \"typ\": \"HTTP_Response\",\n \"name\": \"HTTP 证书过期时间\",\n \"unit\": \"datetimeSeconds\",\n \"note\": \"\",\n \"lang\": \"zh_CN\",\n \"expression\": \"http_response_cert_expire_timestamp\",\n \"created_at\": 0,\n \"created_by\": \"\",\n \"updated_at\": 0,\n \"updated_by\": \"\",\n \"translation\": [\n {\n \"lang\": \"zh_CN\",\n \"name\": \"HTTP 证书过期时间\",\n \"note\": \"\"\n },\n {\n \"lang\": \"en_US\",\n \"name\": \"HTTP certificate expiration time\",\n \"note\": \"\"\n }\n ]\n },\n {\n \"id\": 0,\n \"uuid\": 1717556327511202000,\n \"collector\": \"Categraf\",\n \"typ\": \"HTTP_Response\",\n \"name\": \"拨测 - DNS 请求耗时\",\n \"unit\": \"milliseconds\",\n \"note\": \"\",\n \"lang\": \"zh_CN\",\n \"expression\": \"cdn_dns_request\",\n \"created_at\": 0,\n \"created_by\": \"\",\n \"updated_at\": 0,\n \"updated_by\": \"\",\n \"translation\": [\n {\n \"lang\": \"zh_CN\",\n \"name\": \"拨测 - DNS 请求耗时\",\n \"note\": \"\"\n },\n {\n \"lang\": \"en_US\",\n \"name\": \"Dial test-DNS request time-consuming\",\n \"note\": \"\"\n }\n ]\n },\n {\n \"id\": 0,\n \"uuid\": 1717556327514018000,\n \"collector\": \"Categraf\",\n \"typ\": \"HTTP_Response\",\n \"name\": \"拨测 - TCP建连耗时\",\n \"unit\": \"milliseconds\",\n \"note\": \"\",\n \"lang\": \"zh_CN\",\n \"expression\": \"cdn_tcp_connect\",\n \"created_at\": 0,\n \"created_by\": \"\",\n \"updated_at\": 0,\n \"updated_by\": \"\",\n \"translation\": [\n {\n \"lang\": \"zh_CN\",\n \"name\": \"拨测 - TCP建连耗时\",\n \"note\": \"\"\n },\n {\n \"lang\": \"en_US\",\n \"name\": \"Dial test-TCP connection establishment time\",\n \"note\": \"\"\n }\n ]\n },\n {\n \"id\": 0,\n \"uuid\": 1717556327516118000,\n \"collector\": \"Categraf\",\n \"typ\": \"HTTP_Response\",\n \"name\": \"拨测 - TLS握手耗时\",\n \"unit\": \"milliseconds\",\n \"note\": \"\",\n \"lang\": \"zh_CN\",\n \"expression\": \"cdn_tls_handshake\",\n \"created_at\": 0,\n \"created_by\": \"\",\n \"updated_at\": 0,\n \"updated_by\": \"\",\n \"translation\": [\n {\n \"lang\": \"zh_CN\",\n \"name\": \"拨测 - TLS握手耗时\",\n \"note\": \"\"\n },\n {\n \"lang\": \"en_US\",\n \"name\": \"Dial test-TLS handshake time-consuming\",\n \"note\": \"\"\n }\n ]\n },\n {\n \"id\": 0,\n \"uuid\": 1717556327518519000,\n \"collector\": \"Categraf\",\n \"typ\": \"HTTP_Response\",\n \"name\": \"拨测 - 探测结果状态码\",\n \"unit\": \"none\",\n \"note\": \"探测结果,0 是正常,其他数字有不同含义\\n- 0:成功\\n- 1:连接失败\\n- 2:监测超时\\n- 3:DNS解析失败\\n- 4:地址格式错误\\n- 5:返回内容不匹配\\n- 6:返回码不匹配\\n- 其他数字为未知错误\",\n \"lang\": \"zh_CN\",\n \"expression\": \"cdn_probe_result_code\",\n \"created_at\": 0,\n \"created_by\": \"\",\n \"updated_at\": 0,\n \"updated_by\": \"\",\n \"translation\": [\n {\n \"lang\": \"zh_CN\",\n \"name\": \"拨测 - 探测结果状态码\",\n \"note\": \"探测结果,0 是正常,其他数字有不同含义\\n- 0:成功\\n- 1:连接失败\\n- 2:监测超时\\n- 3:DNS解析失败\\n- 4:地址格式错误\\n- 5:返回内容不匹配\\n- 6:返回码不匹配\\n- 其他数字为未知错误\"\n },\n {\n \"lang\": \"en_US\",\n \"name\": \"Dial test-detection result status code\",\n \"note\": \"Detection result, 0 is normal, other numbers have different meanings \\n-0: Success \\n-1: Connection failed \\n-2: Monitoring timeout \\n-3: DNS resolution failed \\n-4: Address format is wrong \\n-5: Return content does not match \\n-6: Return code mismatch \\n-Other numbers are unknown error\"\n }\n ]\n },\n {\n \"id\": 0,\n \"uuid\": 1717556327521098000,\n \"collector\": \"Categraf\",\n \"typ\": \"HTTP_Response\",\n \"name\": \"拨测 - 整体耗时\",\n \"unit\": \"milliseconds\",\n \"note\": \"\",\n \"lang\": \"zh_CN\",\n \"expression\": \"cdn_total_cost\",\n \"created_at\": 0,\n \"created_by\": \"\",\n \"updated_at\": 0,\n \"updated_by\": \"\",\n \"translation\": [\n {\n \"lang\": \"zh_CN\",\n \"name\": \"拨测 - 整体耗时\",\n \"note\": \"\"\n },\n {\n \"lang\": \"en_US\",\n \"name\": \"Dial test-overall time-consuming\",\n \"note\": \"\"\n }\n ]\n },\n {\n \"id\": 0,\n \"uuid\": 1717556327523493000,\n \"collector\": \"Categraf\",\n \"typ\": \"HTTP_Response\",\n \"name\": \"拨测 - 返回状态码\",\n \"unit\": \"none\",\n \"note\": \"\",\n \"lang\": \"zh_CN\",\n \"expression\": \"cdn_response_status_code\",\n \"created_at\": 0,\n \"created_by\": \"\",\n \"updated_at\": 0,\n \"updated_by\": \"\",\n \"translation\": [\n {\n \"lang\": \"zh_CN\",\n \"name\": \"拨测 - 返回状态码\",\n \"note\": \"\"\n },\n {\n \"lang\": \"en_US\",\n \"name\": \"Dial test-Return status code\",\n \"note\": \"\"\n }\n ]\n },\n {\n \"id\": 0,\n \"uuid\": 1717556327525787000,\n \"collector\": \"Categraf\",\n \"typ\": \"HTTP_Response\",\n \"name\": \"拨测 - 首包耗时\",\n \"unit\": \"milliseconds\",\n \"note\": \"\",\n \"lang\": \"zh_CN\",\n \"expression\": \"cdn_first_byte\",\n \"created_at\": 0,\n \"created_by\": \"\",\n \"updated_at\": 0,\n \"updated_by\": \"\",\n \"translation\": [\n {\n \"lang\": \"zh_CN\",\n \"name\": \"拨测 - 首包耗时\",\n \"note\": \"\"\n },\n {\n \"lang\": \"en_US\",\n \"name\": \"Dial test-first package time-consuming\",\n \"note\": \"\"\n }\n ]\n }\n]"
},
{
"path": "integrations/IPMI/alerts/alerts.json",
"content": "[\n {\n \"id\": 0,\n \"group_id\": 0,\n \"cate\": \"prometheus\",\n \"datasource_ids\": [\n 0\n ],\n \"cluster\": \"\",\n \"name\": \"CPU温度超过90\",\n \"note\": \"\",\n \"prod\": \"metric\",\n \"algorithm\": \"\",\n \"algo_params\": null,\n \"delay\": 0,\n \"severity\": 0,\n \"severities\": [\n 2\n ],\n \"disabled\": 0,\n \"prom_for_duration\": 60,\n \"prom_ql\": \"\",\n \"rule_config\": {\n \"queries\": [\n {\n \"prom_ql\": \"ipmi_cpu1_temp{} \\u003e 90 or ipmi_cpu2_temp{} \\u003e 90\",\n \"severity\": 2\n }\n ]\n },\n \"prom_eval_interval\": 30,\n \"enable_stime\": \"00:00\",\n \"enable_stimes\": [\n \"00:00\"\n ],\n \"enable_etime\": \"23:59\",\n \"enable_etimes\": [\n \"23:59\"\n ],\n \"enable_days_of_week\": [\n \"0\",\n \"1\",\n \"2\",\n \"3\",\n \"4\",\n \"5\",\n \"6\"\n ],\n \"enable_days_of_weeks\": [\n [\n \"0\",\n \"1\",\n \"2\",\n \"3\",\n \"4\",\n \"5\",\n \"6\"\n ]\n ],\n \"enable_in_bg\": 0,\n \"notify_recovered\": 1,\n \"notify_channels\": [],\n \"notify_groups_obj\": null,\n \"notify_groups\": null,\n \"notify_repeat_step\": 60,\n \"notify_max_number\": 0,\n \"recover_duration\": 0,\n \"callbacks\": [],\n \"runbook_url\": \"\",\n \"append_tags\": [],\n \"annotations\": {},\n \"extra_config\": null,\n \"create_at\": 0,\n \"create_by\": \"\",\n \"update_at\": 0,\n \"update_by\": \"\",\n \"uuid\": 1717556327537842000\n },\n {\n \"id\": 0,\n \"group_id\": 0,\n \"cate\": \"prometheus\",\n \"datasource_ids\": [\n 0\n ],\n \"cluster\": \"\",\n \"name\": \"CPU电压大于10\",\n \"note\": \"\",\n \"prod\": \"metric\",\n \"algorithm\": \"\",\n \"algo_params\": null,\n \"delay\": 0,\n \"severity\": 0,\n \"severities\": [\n 2\n ],\n \"disabled\": 0,\n \"prom_for_duration\": 60,\n \"prom_ql\": \"\",\n \"rule_config\": {\n \"queries\": [\n {\n \"prom_ql\": \"ipmi_vcpu1 \\u003e 10 or ipmi_vcpu1 \\u003e 10\",\n \"severity\": 2\n }\n ]\n },\n \"prom_eval_interval\": 30,\n \"enable_stime\": \"00:00\",\n \"enable_stimes\": [\n \"00:00\"\n ],\n \"enable_etime\": \"23:59\",\n \"enable_etimes\": [\n \"23:59\"\n ],\n \"enable_days_of_week\": [\n \"0\",\n \"1\",\n \"2\",\n \"3\",\n \"4\",\n \"5\",\n \"6\"\n ],\n \"enable_days_of_weeks\": [\n [\n \"0\",\n \"1\",\n \"2\",\n \"3\",\n \"4\",\n \"5\",\n \"6\"\n ]\n ],\n \"enable_in_bg\": 0,\n \"notify_recovered\": 1,\n \"notify_channels\": [],\n \"notify_groups_obj\": null,\n \"notify_groups\": null,\n \"notify_repeat_step\": 60,\n \"notify_max_number\": 0,\n \"recover_duration\": 0,\n \"callbacks\": [],\n \"runbook_url\": \"\",\n \"append_tags\": [],\n \"annotations\": {},\n \"extra_config\": null,\n \"create_at\": 0,\n \"create_by\": \"\",\n \"update_at\": 0,\n \"update_by\": \"\",\n \"uuid\": 1717556327538351000\n },\n {\n \"id\": 0,\n \"group_id\": 0,\n \"cate\": \"prometheus\",\n \"datasource_ids\": [\n 0\n ],\n \"cluster\": \"\",\n \"name\": \"CPU风扇转速超过1000\",\n \"note\": \"\",\n \"prod\": \"metric\",\n \"algorithm\": \"\",\n \"algo_params\": null,\n \"delay\": 0,\n \"severity\": 0,\n \"severities\": [\n 2\n ],\n \"disabled\": 0,\n \"prom_for_duration\": 60,\n \"prom_ql\": \"\",\n \"rule_config\": {\n \"queries\": [\n {\n \"prom_ql\": \"ipmi_fan1 \\u003e 1000 or ipmi_fan2 \\u003e 1000 or ipmi_fan3 \\u003e 1000 or ipmi_fan4 \\u003e 1000 or ipmi_fan5 \\u003e 1000 or ipmi_fan6 \\u003e 1000\",\n \"severity\": 2\n }\n ]\n },\n \"prom_eval_interval\": 30,\n \"enable_stime\": \"00:00\",\n \"enable_stimes\": [\n \"00:00\"\n ],\n \"enable_etime\": \"23:59\",\n \"enable_etimes\": [\n \"23:59\"\n ],\n \"enable_days_of_week\": [\n \"0\",\n \"1\",\n \"2\",\n \"3\",\n \"4\",\n \"5\",\n \"6\"\n ],\n \"enable_days_of_weeks\": [\n [\n \"0\",\n \"1\",\n \"2\",\n \"3\",\n \"4\",\n \"5\",\n \"6\"\n ]\n ],\n \"enable_in_bg\": 0,\n \"notify_recovered\": 1,\n \"notify_channels\": [],\n \"notify_groups_obj\": null,\n \"notify_groups\": null,\n \"notify_repeat_step\": 60,\n \"notify_max_number\": 0,\n \"recover_duration\": 0,\n \"callbacks\": [],\n \"runbook_url\": \"\",\n \"append_tags\": [],\n \"annotations\": {},\n \"extra_config\": null,\n \"create_at\": 0,\n \"create_by\": \"\",\n \"update_at\": 0,\n \"update_by\": \"\",\n \"uuid\": 1717556327538796000\n },\n {\n \"id\": 0,\n \"group_id\": 0,\n \"cate\": \"prometheus\",\n \"datasource_ids\": [\n 0\n ],\n \"cluster\": \"\",\n \"name\": \"主板温度超过90\",\n \"note\": \"\",\n \"prod\": \"metric\",\n \"algorithm\": \"\",\n \"algo_params\": null,\n \"delay\": 0,\n \"severity\": 0,\n \"severities\": [\n 2\n ],\n \"disabled\": 0,\n \"prom_for_duration\": 60,\n \"prom_ql\": \"\",\n \"rule_config\": {\n \"queries\": [\n {\n \"prom_ql\": \"ipmi_system_temp \\u003e 90 or ipmi_pch_temp \\u003e 90\",\n \"severity\": 2\n }\n ]\n },\n \"prom_eval_interval\": 30,\n \"enable_stime\": \"00:00\",\n \"enable_stimes\": [\n \"00:00\"\n ],\n \"enable_etime\": \"23:59\",\n \"enable_etimes\": [\n \"23:59\"\n ],\n \"enable_days_of_week\": [\n \"0\",\n \"1\",\n \"2\",\n \"3\",\n \"4\",\n \"5\",\n \"6\"\n ],\n \"enable_days_of_weeks\": [\n [\n \"0\",\n \"1\",\n \"2\",\n \"3\",\n \"4\",\n \"5\",\n \"6\"\n ]\n ],\n \"enable_in_bg\": 0,\n \"notify_recovered\": 1,\n \"notify_channels\": [],\n \"notify_groups_obj\": null,\n \"notify_groups\": null,\n \"notify_repeat_step\": 60,\n \"notify_max_number\": 0,\n \"recover_duration\": 0,\n \"callbacks\": [],\n \"runbook_url\": \"\",\n \"append_tags\": [],\n \"annotations\": {},\n \"extra_config\": null,\n \"create_at\": 0,\n \"create_by\": \"\",\n \"update_at\": 0,\n \"update_by\": \"\",\n \"uuid\": 1717556327539285000\n }\n]"
},
{
"path": "integrations/IPMI/collect/ipmi/conf.toml",
"content": "# Read metrics from the bare metal servers via freeipmi\n[[instances]]\n# target指定是本地采集还是远程采集\n#target=\"localhost\"\n# 指定采集的用户名和密码,这里务必保证ipmi命令能获取正确输出,不是网上查到一个用户名 密码就可以。\n#user = \"user\"\n#pass = \"1234\"\n\n# ipmi协议版本,支持1.5 和 2.0\n#driver = \"LAN_2_0\"\n\n# 指定特权用户名\n#privilege = \"user\"\n\n## session-timeout, ms\n#timeout = 100000\n\n# 支持的采集器 bmc, bmc-watchdog, ipmi, chassis, dcmi, sel,sm-lan-mode\n# 默认使用 bmc, ipmi, chassis和dcmi,建议保持下列配置便于仪表盘更好的展示\ncollectors = [ \"bmc\", \"ipmi\", \"chassis\", \"sel\", \"dcmi\"]\n\n# 不关注的传感器,指定id 排除掉\n#exclude_sensor_ids = [ 2, 29, 32, 50, 52, 55 ]\n\n# 如果你想使用定制化的参数覆盖内置的命令,可以修改以下内容; 建议保持注释\n#[instances.collector_cmd]\n#ipmi = \"sudo\"\n#sel = \"sudo\"\n#[instances.default_args]\n#ipmi = [ \"--bridge-sensors\" ]\n#[instances.custom_args]\n#ipmi = [ \"--bridge-sensors\" ]\n#sel = [ \"ipmi-sel\" ]"
},
{
"path": "integrations/IPMI/dashboards/IPMI.json",
"content": "{\n \"id\": 0,\n \"group_id\": 0,\n \"name\": \"IPMI\",\n \"ident\": \"\",\n \"tags\": \"Categraf latest\",\n \"create_at\": 0,\n \"create_by\": \"\",\n \"update_at\": 0,\n \"update_by\": \"\",\n \"configs\": {\n \"links\": [],\n \"panels\": [\n {\n \"custom\": {\n \"calc\": \"lastNotNull\",\n \"colSpan\": 1,\n \"colorMode\": \"value\",\n \"graphMode\": \"none\",\n \"textMode\": \"value\",\n \"textSize\": {},\n \"valueField\": \"Value\"\n },\n \"datasourceCate\": \"prometheus\",\n \"datasourceValue\": \"${datasource}\",\n \"id\": \"a9c9b473-8182-4f84-9083-e96d656ac4fe\",\n \"layout\": {\n \"h\": 4,\n \"i\": \"a9c9b473-8182-4f84-9083-e96d656ac4fe\",\n \"w\": 4,\n \"x\": 0,\n \"y\": 0\n },\n \"links\": [],\n \"maxPerRow\": 4,\n \"name\": \"Power Status\",\n \"options\": {\n \"standardOptions\": {\n \"util\": \"none\"\n },\n \"thresholds\": {\n \"steps\": [\n {\n \"color\": \"#73BF69\",\n \"type\": \"base\",\n \"value\": null\n }\n ]\n },\n \"valueMappings\": [\n {\n \"options\": {\n \"0\": {\n \"color\": \"red\",\n \"index\": 1,\n \"text\": \"Powered Off\"\n },\n \"1\": {\n \"color\": \"dark-green\",\n \"index\": 0,\n \"text\": \"Powered On\"\n }\n },\n \"type\": \"value\"\n }\n ]\n },\n \"targets\": [\n {\n \"expr\": \"ipmi_chassis_power_state{target=\\\"$instance\\\"}\",\n \"legend\": \"{{target}}\",\n \"maxDataPoints\": 240,\n \"refId\": \"A\"\n }\n ],\n \"transformations\": [\n {\n \"id\": \"organize\",\n \"options\": {}\n }\n ],\n \"type\": \"stat\",\n \"version\": \"3.0.0\"\n },\n {\n \"custom\": {\n \"calc\": \"lastNotNull\",\n \"colorMode\": \"value\",\n \"columns\": [\n \"data_center\",\n \"dept\",\n \"env\",\n \"firmware_revision\",\n \"manufacturer_id\",\n \"target\"\n ],\n \"displayMode\": \"labelsOfSeriesToRows\",\n \"linkMode\": \"appendLinkColumn\",\n \"showHeader\": true\n },\n \"datasourceCate\": \"prometheus\",\n \"datasourceValue\": \"${datasource}\",\n \"id\": \"47c94f54-43a2-46d1-b549-d199b30736a3\",\n \"layout\": {\n \"h\": 4,\n \"i\": \"47c94f54-43a2-46d1-b549-d199b30736a3\",\n \"w\": 12,\n \"x\": 4,\n \"y\": 0\n },\n \"links\": [],\n \"maxPerRow\": 4,\n \"name\": \"Machine Info\",\n \"options\": {\n \"standardOptions\": {}\n },\n \"overrides\": [\n {\n \"matcher\": {\n \"id\": \"byFrameRefID\"\n }\n }\n ],\n \"targets\": [\n {\n \"expr\": \"ipmi_bmc_info{target=\\\"$instance\\\"}\",\n \"legend\": \"\",\n \"maxDataPoints\": 240,\n \"refId\": \"A\"\n }\n ],\n \"transformations\": [\n {\n \"id\": \"organize\",\n \"options\": {}\n }\n ],\n \"type\": \"table\",\n \"version\": \"3.0.0\"\n },\n {\n \"custom\": {\n \"calc\": \"lastNotNull\",\n \"colorMode\": \"value\",\n \"displayMode\": \"seriesToRows\",\n \"linkMode\": \"appendLinkColumn\",\n \"showHeader\": true\n },\n \"datasourceCate\": \"prometheus\",\n \"datasourceValue\": \"${datasource}\",\n \"id\": \"c782803d-a0b5-4d13-a6ed-ae6dcceb6049\",\n \"layout\": {\n \"h\": 9,\n \"i\": \"c782803d-a0b5-4d13-a6ed-ae6dcceb6049\",\n \"w\": 8,\n \"x\": 16,\n \"y\": 0\n },\n \"links\": [],\n \"maxPerRow\": 4,\n \"name\": \"Fan Speed State\",\n \"options\": {\n \"standardOptions\": {}\n },\n \"overrides\": [\n {\n \"matcher\": {\n \"id\": \"byFrameRefID\"\n }\n }\n ],\n \"targets\": [\n {\n \"expr\": \"ipmi_fan_speed_state{target=\\\"$instance\\\"}\",\n \"legend\": \"{{name}}\",\n \"maxDataPoints\": 240,\n \"refId\": \"A\"\n }\n ],\n \"transformations\": [\n {\n \"id\": \"organize\",\n \"options\": {}\n }\n ],\n \"type\": \"table\",\n \"version\": \"3.0.0\"\n },\n {\n \"custom\": {\n \"calc\": \"lastNotNull\",\n \"textMode\": \"value\",\n \"valueField\": \"Value\"\n },\n \"datasourceCate\": \"prometheus\",\n \"datasourceValue\": \"${datasource}\",\n \"id\": \"99586558-1e82-48f0-8bc4-132e54369872\",\n \"layout\": {\n \"h\": 5,\n \"i\": \"99586558-1e82-48f0-8bc4-132e54369872\",\n \"w\": 16,\n \"x\": 0,\n \"y\": 4\n },\n \"links\": [],\n \"maxPerRow\": 4,\n \"name\": \"Fan speed in rotations per minute\",\n \"options\": {\n \"standardOptions\": {\n \"util\": \"none\"\n },\n \"thresholds\": {\n \"steps\": [\n {\n \"color\": \"#73BF69\",\n \"type\": \"base\",\n \"value\": null\n }\n ]\n },\n \"valueMappings\": []\n },\n \"targets\": [\n {\n \"expr\": \"ipmi_fan_speed_rpm{target=\\\"$instance\\\"}\",\n \"legend\": \"{{name}}\",\n \"maxDataPoints\": 240,\n \"refId\": \"A\"\n }\n ],\n \"transformations\": [\n {\n \"id\": \"organize\",\n \"options\": {}\n }\n ],\n \"type\": \"gauge\",\n \"version\": \"3.0.0\"\n },\n {\n \"custom\": {\n \"drawStyle\": \"lines\",\n \"fillOpacity\": 0,\n \"gradientMode\": \"none\",\n \"lineInterpolation\": \"linear\",\n \"lineWidth\": 1,\n \"scaleDistribution\": {\n \"type\": \"linear\"\n },\n \"spanNulls\": false,\n \"stack\": \"off\"\n },\n \"datasourceCate\": \"prometheus\",\n \"datasourceValue\": \"${datasource}\",\n \"description\": \"\",\n \"id\": \"53982e93-520d-41f2-bac4-cfed93fea2aa\",\n \"layout\": {\n \"h\": 8,\n \"i\": \"53982e93-520d-41f2-bac4-cfed93fea2aa\",\n \"w\": 12,\n \"x\": 0,\n \"y\": 9\n },\n \"links\": [],\n \"maxPerRow\": 4,\n \"name\": \"Power Consumption watts\",\n \"options\": {\n \"legend\": {\n \"behaviour\": \"showItem\",\n \"displayMode\": \"list\",\n \"placement\": \"bottom\"\n },\n \"standardOptions\": {\n \"util\": \"none\"\n },\n \"thresholds\": {\n \"steps\": [\n {\n \"color\": \"#73BF69\",\n \"type\": \"base\",\n \"value\": null\n },\n {\n \"color\": \"#F2495C\",\n \"value\": 80\n }\n ]\n },\n \"tooltip\": {\n \"mode\": \"single\"\n },\n \"valueMappings\": []\n },\n \"overrides\": [\n {\n \"matcher\": {\n \"id\": \"byFrameRefID\"\n },\n \"properties\": {\n \"rightYAxisDisplay\": \"off\"\n }\n }\n ],\n \"targets\": [\n {\n \"expr\": \"ipmi_dcmi_power_consumption_watts{target=\\\"$instance\\\"}\",\n \"legend\": \"{{target}}\",\n \"maxDataPoints\": 240,\n \"refId\": \"A\"\n }\n ],\n \"transformations\": [\n {\n \"id\": \"organize\",\n \"options\": {}\n }\n ],\n \"type\": \"timeseries\",\n \"version\": \"3.0.0\"\n },\n {\n \"custom\": {\n \"calc\": \"lastNotNull\",\n \"colorMode\": \"value\",\n \"displayMode\": \"seriesToRows\",\n \"linkMode\": \"appendLinkColumn\",\n \"showHeader\": true\n },\n \"datasourceCate\": \"prometheus\",\n \"datasourceValue\": \"${datasource}\",\n \"id\": \"6c73328d-c927-4329-8a54-19cdc9c1f056\",\n \"layout\": {\n \"h\": 8,\n \"i\": \"6c73328d-c927-4329-8a54-19cdc9c1f056\",\n \"w\": 4,\n \"x\": 12,\n \"y\": 9\n },\n \"links\": [],\n \"maxPerRow\": 4,\n \"name\": \"Power State\",\n \"options\": {\n \"standardOptions\": {}\n },\n \"overrides\": [\n {\n \"matcher\": {\n \"id\": \"byFrameRefID\"\n }\n }\n ],\n \"targets\": [\n {\n \"expr\": \"ipmi_power_state{target=\\\"$instance\\\"}\",\n \"legend\": \"{{name}}\",\n \"maxDataPoints\": 240,\n \"refId\": \"A\"\n }\n ],\n \"transformations\": [\n {\n \"id\": \"organize\",\n \"options\": {}\n }\n ],\n \"type\": \"table\",\n \"version\": \"3.0.0\"\n },\n {\n \"custom\": {\n \"calc\": \"lastNotNull\",\n \"textMode\": \"value\",\n \"valueField\": \"Value\"\n },\n \"datasourceCate\": \"prometheus\",\n \"datasourceValue\": \"${datasource}\",\n \"id\": \"3e7ac15e-4cf6-4472-9b99-f686e337a2c5\",\n \"layout\": {\n \"h\": 8,\n \"i\": \"3e7ac15e-4cf6-4472-9b99-f686e337a2c5\",\n \"w\": 8,\n \"x\": 16,\n \"y\": 9\n },\n \"links\": [],\n \"maxPerRow\": 4,\n \"name\": \"Power reading in Watts\",\n \"options\": {\n \"standardOptions\": {\n \"util\": \"none\"\n },\n \"thresholds\": {\n \"steps\": [\n {\n \"color\": \"#73BF69\",\n \"type\": \"base\",\n \"value\": null\n }\n ]\n },\n \"valueMappings\": []\n },\n \"targets\": [\n {\n \"expr\": \"ipmi_power_watts{target=\\\"$instance\\\"}\",\n \"legend\": \"{{name}}\",\n \"maxDataPoints\": 240,\n \"refId\": \"A\"\n }\n ],\n \"transformations\": [\n {\n \"id\": \"organize\",\n \"options\": {}\n }\n ],\n \"type\": \"gauge\",\n \"version\": \"3.0.0\"\n },\n {\n \"custom\": {\n \"calc\": \"lastNotNull\",\n \"colorMode\": \"value\",\n \"columns\": [\n \"data_center\",\n \"dept\",\n \"env\",\n \"target\",\n \"name\",\n \"type\",\n \"value\"\n ],\n \"displayMode\": \"labelsOfSeriesToRows\",\n \"linkMode\": \"appendLinkColumn\",\n \"showHeader\": true\n },\n \"datasourceCate\": \"prometheus\",\n \"datasourceValue\": \"${datasource}\",\n \"id\": \"605380bb-763e-4fbd-af57-ad329ba2ac71\",\n \"layout\": {\n \"h\": 8,\n \"i\": \"605380bb-763e-4fbd-af57-ad329ba2ac71\",\n \"w\": 12,\n \"x\": 0,\n \"y\": 17\n },\n \"links\": [],\n \"maxPerRow\": 4,\n \"name\": \"IPMI Sensors State\",\n \"options\": {\n \"standardOptions\": {}\n },\n \"overrides\": [\n {\n \"matcher\": {\n \"id\": \"byFrameRefID\"\n }\n }\n ],\n \"targets\": [\n {\n \"expr\": \"ipmi_sensor_state{target=\\\"$instance\\\"}\",\n \"legend\": \"\",\n \"maxDataPoints\": 240,\n \"refId\": \"A\"\n }\n ],\n \"transformations\": [\n {\n \"id\": \"organize\",\n \"options\": {}\n }\n ],\n \"type\": \"table\",\n \"version\": \"3.0.0\"\n },\n {\n \"custom\": {\n \"calc\": \"lastNotNull\",\n \"colorMode\": \"value\",\n \"displayMode\": \"seriesToRows\",\n \"linkMode\": \"appendLinkColumn\",\n \"showHeader\": true\n },\n \"datasourceCate\": \"prometheus\",\n \"datasourceValue\": \"${datasource}\",\n \"id\": \"68e23440-dc48-4a05-bb59-441349b02afd\",\n \"layout\": {\n \"h\": 8,\n \"i\": \"68e23440-dc48-4a05-bb59-441349b02afd\",\n \"w\": 6,\n \"x\": 12,\n \"y\": 17\n },\n \"links\": [],\n \"maxPerRow\": 4,\n \"name\": \"Temperature State\",\n \"options\": {\n \"standardOptions\": {}\n },\n \"overrides\": [\n {\n \"matcher\": {\n \"id\": \"byFrameRefID\"\n }\n }\n ],\n \"targets\": [\n {\n \"expr\": \"ipmi_temperature_state{target=\\\"$instance\\\"}\",\n \"legend\": \"{{name}}\",\n \"maxDataPoints\": 240,\n \"refId\": \"A\"\n }\n ],\n \"transformations\": [\n {\n \"id\": \"organize\",\n \"options\": {}\n }\n ],\n \"type\": \"table\",\n \"version\": \"3.0.0\"\n },\n {\n \"custom\": {\n \"calc\": \"lastNotNull\",\n \"textMode\": \"value\",\n \"valueField\": \"Value\"\n },\n \"datasourceCate\": \"prometheus\",\n \"datasourceValue\": \"${datasource}\",\n \"id\": \"663a5ef9-b735-4187-8793-074a3d78dd39\",\n \"layout\": {\n \"h\": 8,\n \"i\": \"663a5ef9-b735-4187-8793-074a3d78dd39\",\n \"w\": 6,\n \"x\": 18,\n \"y\": 17\n },\n \"links\": [],\n \"maxPerRow\": 4,\n \"name\": \"Temperatures\",\n \"options\": {\n \"standardOptions\": {\n \"util\": \"none\"\n },\n \"thresholds\": {\n \"steps\": [\n {\n \"color\": \"#8AB8FF\",\n \"type\": \"base\",\n \"value\": null\n },\n {\n \"color\": \"#F2495C\",\n \"value\": 70\n }\n ]\n },\n \"valueMappings\": []\n },\n \"targets\": [\n {\n \"expr\": \"ipmi_temperature_celsius{target=\\\"$instance\\\"}\",\n \"legend\": \"{{name}}\",\n \"maxDataPoints\": 240,\n \"refId\": \"A\"\n }\n ],\n \"transformations\": [\n {\n \"id\": \"organize\",\n \"options\": {}\n }\n ],\n \"type\": \"gauge\",\n \"version\": \"3.0.0\"\n },\n {\n \"custom\": {\n \"calc\": \"lastNotNull\",\n \"colorRange\": [\n \"thresholds\"\n ],\n \"textMode\": \"valueAndName\",\n \"valueField\": \"Value\"\n },\n \"datasourceCate\": \"prometheus\",\n \"datasourceValue\": \"${datasource}\",\n \"id\": \"e7027cd8-1ccb-4238-9b91-5a18a3ccd29c\",\n \"layout\": {\n \"h\": 3,\n \"i\": \"e7027cd8-1ccb-4238-9b91-5a18a3ccd29c\",\n \"w\": 24,\n \"x\": 0,\n \"y\": 25\n },\n \"links\": [],\n \"maxPerRow\": 4,\n \"name\": \"Reported state of a voltage sensor\",\n \"options\": {\n \"standardOptions\": {},\n \"thresholds\": {\n \"steps\": [\n {\n \"color\": \"#634CD9\",\n \"type\": \"base\",\n \"value\": null\n }\n ]\n }\n },\n \"targets\": [\n {\n \"expr\": \"ipmi_voltage_state{target=\\\"$instance\\\"}\",\n \"legend\": \"{{name}}\",\n \"maxDataPoints\": 240,\n \"refId\": \"A\"\n }\n ],\n \"transformations\": [\n {\n \"id\": \"organize\",\n \"options\": {}\n }\n ],\n \"type\": \"hexbin\",\n \"version\": \"3.0.0\"\n },\n {\n \"custom\": {\n \"calc\": \"lastNotNull\",\n \"textMode\": \"value\",\n \"valueField\": \"Value\"\n },\n \"datasourceCate\": \"prometheus\",\n \"datasourceValue\": \"${datasource}\",\n \"id\": \"38437e8e-5c8c-4fc2-a274-515e8cc38ea0\",\n \"layout\": {\n \"h\": 5,\n \"i\": \"38437e8e-5c8c-4fc2-a274-515e8cc38ea0\",\n \"w\": 24,\n \"x\": 0,\n \"y\": 28\n },\n \"links\": [],\n \"maxPerRow\": 4,\n \"name\": \"Voltage reading in Volts\",\n \"options\": {\n \"standardOptions\": {\n \"util\": \"none\"\n },\n \"thresholds\": {\n \"steps\": [\n {\n \"color\": \"#73BF69\",\n \"type\": \"base\",\n \"value\": null\n }\n ]\n },\n \"valueMappings\": []\n },\n \"targets\": [\n {\n \"expr\": \"ipmi_voltage_volts{target=\\\"$instance\\\"}\",\n \"legend\": \"{{name}}\",\n \"maxDataPoints\": 240,\n \"refId\": \"A\"\n }\n ],\n \"transformations\": [\n {\n \"id\": \"organize\",\n \"options\": {}\n }\n ],\n \"type\": \"gauge\",\n \"version\": \"3.0.0\"\n }\n ],\n \"var\": [\n {\n \"defaultValue\": 1,\n \"definition\": \"prometheus\",\n \"name\": \"datasource\",\n \"type\": \"datasource\"\n },\n {\n \"datasource\": {\n \"cate\": \"prometheus\",\n \"value\": \"${datasource}\"\n },\n \"definition\": \"label_values(ipmi_bmc_info, target)\",\n \"hide\": false,\n \"multi\": false,\n \"name\": \"instance\",\n \"reg\": \"/.*/\",\n \"type\": \"query\"\n }\n ],\n \"version\": \"3.0.0\"\n },\n \"public\": 0,\n \"public_cate\": 0,\n \"bgids\": null,\n \"built_in\": 0,\n \"hide\": 0,\n \"uuid\": 1717556327540521000\n}"
},
{
"path": "integrations/IPMI/dashboards/IPMI_by_categraf.json",
"content": "{\n \"id\": 0,\n \"group_id\": 0,\n \"name\": \"IPMI by Categraf\",\n \"ident\": \"\",\n \"tags\": \"Categraf ~v0.3.44-pre Exporter\",\n \"create_at\": 0,\n \"create_by\": \"\",\n \"update_at\": 0,\n \"update_by\": \"\",\n \"configs\": {\n \"links\": [],\n \"panels\": [\n {\n \"custom\": {\n \"calc\": \"lastNotNull\",\n \"colSpan\": 1,\n \"colorMode\": \"background\",\n \"graphMode\": \"area\",\n \"textMode\": \"value\",\n \"textSize\": {},\n \"valueField\": \"Value\"\n },\n \"datasourceCate\": \"prometheus\",\n \"datasourceValue\": \"${datasource}\",\n \"id\": \"f7d72708-f857-4d67-b9ab-1df6464bc685\",\n \"layout\": {\n \"h\": 4,\n \"i\": \"f7d72708-f857-4d67-b9ab-1df6464bc685\",\n \"isResizable\": true,\n \"w\": 4,\n \"x\": 0,\n \"y\": 0\n },\n \"links\": [],\n \"maxPerRow\": 4,\n \"name\": \"Power Status\",\n \"options\": {\n \"standardOptions\": {\n \"util\": \"none\"\n },\n \"thresholds\": {\n \"steps\": [\n {\n \"color\": \"#73BF69\",\n \"type\": \"base\",\n \"value\": null\n }\n ]\n },\n \"valueMappings\": [\n {\n \"match\": {\n \"special\": 1\n },\n \"options\": {\n \"0\": {\n \"color\": \"red\",\n \"index\": 1,\n \"text\": \"Powered Off\"\n },\n \"1\": {\n \"color\": \"dark-green\",\n \"index\": 0,\n \"text\": \"Powered On\"\n }\n },\n \"result\": {\n \"color\": \"rgba(44, 157, 61, 1)\",\n \"text\": \"Powered On\"\n },\n \"type\": \"special\"\n },\n {\n \"match\": {\n \"special\": 0\n },\n \"result\": {\n \"color\": \"rgba(206, 79, 82, 1)\",\n \"text\": \"Powered Off\"\n },\n \"type\": \"special\"\n }\n ]\n },\n \"targets\": [\n {\n \"expr\": \"ipmi_chassis_power_state\",\n \"legend\": \"{{ident}}\",\n \"refId\": \"A\"\n }\n ],\n \"transformations\": [\n {\n \"id\": \"organize\",\n \"options\": {}\n }\n ],\n \"type\": \"stat\",\n \"version\": \"3.0.0\"\n },\n {\n \"custom\": {\n \"calc\": \"lastNotNull\",\n \"colorMode\": \"value\",\n \"columns\": [],\n \"displayMode\": \"labelsOfSeriesToRows\",\n \"linkMode\": \"appendLinkColumn\",\n \"showHeader\": true\n },\n \"datasourceCate\": \"prometheus\",\n \"datasourceValue\": \"${datasource}\",\n \"id\": \"0d86649f-8b64-4a3c-8794-984ab92052a2\",\n \"layout\": {\n \"h\": 4,\n \"i\": \"0d86649f-8b64-4a3c-8794-984ab92052a2\",\n \"isResizable\": true,\n \"w\": 12,\n \"x\": 4,\n \"y\": 0\n },\n \"links\": [],\n \"maxPerRow\": 4,\n \"name\": \"Machine Info\",\n \"options\": {\n \"standardOptions\": {}\n },\n \"overrides\": [\n {\n \"matcher\": {\n \"id\": \"byFrameRefID\"\n }\n }\n ],\n \"targets\": [\n {\n \"expr\": \"ipmi_bmc_info\",\n \"legend\": \"\",\n \"maxDataPoints\": 240,\n \"refId\": \"A\"\n }\n ],\n \"transformations\": [\n {\n \"id\": \"organize\",\n \"options\": {\n \"excludeByName\": {\n \"__name__\": true,\n \"value\": true\n }\n }\n }\n ],\n \"type\": \"table\",\n \"version\": \"3.0.0\"\n },\n {\n \"custom\": {\n \"calc\": \"lastNotNull\",\n \"colorMode\": \"background\",\n \"displayMode\": \"seriesToRows\",\n \"linkMode\": \"appendLinkColumn\",\n \"showHeader\": false\n },\n \"datasourceCate\": \"prometheus\",\n \"datasourceValue\": \"${datasource}\",\n \"id\": \"20e67b9f-3d7b-4915-86a9-abbc74a11b57\",\n \"layout\": {\n \"h\": 8,\n \"i\": \"20e67b9f-3d7b-4915-86a9-abbc74a11b57\",\n \"isResizable\": true,\n \"w\": 8,\n \"x\": 16,\n \"y\": 0\n },\n \"links\": [],\n \"maxPerRow\": 4,\n \"name\": \"Fan Speed State\",\n \"options\": {\n \"standardOptions\": {},\n \"valueMappings\": [\n {\n \"match\": {\n \"special\": 0\n },\n \"result\": {\n \"color\": \"rgba(44, 157, 61, 1)\",\n \"text\": \"Normal\"\n },\n \"type\": \"special\"\n },\n {\n \"match\": {\n \"special\": 1\n },\n \"result\": {\n \"color\": \"rgba(255, 174, 57, 1)\",\n \"text\": \"Warning\"\n },\n \"type\": \"special\"\n },\n {\n \"match\": {\n \"special\": 2\n },\n \"result\": {\n \"color\": \"rgba(206, 79, 82, 1)\",\n \"text\": \"Critical\"\n },\n \"type\": \"special\"\n }\n ]\n },\n \"overrides\": [\n {\n \"matcher\": {\n \"id\": \"byFrameRefID\"\n }\n }\n ],\n \"targets\": [\n {\n \"expr\": \"ipmi_fan_speed_state{ident=\\\"$ident\\\"}\",\n \"legend\": \"{{name}}\",\n \"refId\": \"A\"\n }\n ],\n \"transformations\": [\n {\n \"id\": \"organize\",\n \"options\": {}\n }\n ],\n \"type\": \"table\",\n \"version\": \"3.0.0\"\n },\n {\n \"custom\": {\n \"calc\": \"lastNotNull\",\n \"colorDomainAuto\": true,\n \"colorRange\": [\n \"#c7f1ff\",\n \"#42a1fa\",\n \"#083294\"\n ],\n \"reverseColorOrder\": false,\n \"textMode\": \"valueAndName\",\n \"valueField\": \"Value\"\n },\n \"datasourceCate\": \"prometheus\",\n \"datasourceValue\": \"${datasource}\",\n \"id\": \"62decb7d-fcdb-4865-87eb-38217ceaaddf\",\n \"layout\": {\n \"h\": 4,\n \"i\": \"62decb7d-fcdb-4865-87eb-38217ceaaddf\",\n \"isResizable\": true,\n \"w\": 16,\n \"x\": 0,\n \"y\": 4\n },\n \"links\": [],\n \"maxPerRow\": 4,\n \"name\": \"Fan speed in rotations per minute\",\n \"options\": {\n \"standardOptions\": {},\n \"thresholds\": {\n \"steps\": [\n {\n \"color\": \"#634CD9\",\n \"type\": \"base\",\n \"value\": null\n }\n ]\n }\n },\n \"targets\": [\n {\n \"expr\": \"ipmi_fan_speed_rpm{ident=\\\"$ident\\\"}\",\n \"legend\": \"{{name}}\",\n \"refId\": \"B\"\n }\n ],\n \"transformations\": [\n {\n \"id\": \"organize\",\n \"options\": {}\n }\n ],\n \"type\": \"hexbin\",\n \"version\": \"3.0.0\"\n },\n {\n \"custom\": {\n \"drawStyle\": \"lines\",\n \"fillOpacity\": 0,\n \"gradientMode\": \"none\",\n \"lineInterpolation\": \"linear\",\n \"lineWidth\": 1,\n \"scaleDistribution\": {\n \"type\": \"linear\"\n },\n \"spanNulls\": false,\n \"stack\": \"off\"\n },\n \"datasourceCate\": \"prometheus\",\n \"datasourceValue\": \"${datasource}\",\n \"description\": \"This chart is only provided if the dcmi collector is enabled.\",\n \"id\": \"a9796ec2-79dd-4ba9-946b-2849434523e0\",\n \"layout\": {\n \"h\": 4,\n \"i\": \"a9796ec2-79dd-4ba9-946b-2849434523e0\",\n \"isResizable\": true,\n \"w\": 12,\n \"x\": 0,\n \"y\": 8\n },\n \"links\": [],\n \"maxPerRow\": 4,\n \"name\": \" Power Consumption watts\",\n \"options\": {\n \"legend\": {\n \"behaviour\": \"showItem\",\n \"displayMode\": \"list\",\n \"placement\": \"bottom\"\n },\n \"standardOptions\": {\n \"util\": \"none\"\n },\n \"thresholds\": {\n \"steps\": [\n {\n \"color\": \"#73BF69\",\n \"type\": \"base\",\n \"value\": null\n },\n {\n \"color\": \"#F2495C\",\n \"value\": 80\n }\n ]\n },\n \"tooltip\": {\n \"mode\": \"single\"\n },\n \"valueMappings\": []\n },\n \"overrides\": [\n {\n \"matcher\": {\n \"id\": \"byFrameRefID\"\n },\n \"properties\": {\n \"rightYAxisDisplay\": \"off\"\n }\n }\n ],\n \"targets\": [\n {\n \"expr\": \"ipmi_dcmi_power_consumption_watts{ident=\\\"$ident\\\"}\",\n \"legend\": \"{{ident}}\",\n \"refId\": \"A\"\n }\n ],\n \"transformations\": [\n {\n \"id\": \"organize\",\n \"options\": {}\n }\n ],\n \"type\": \"timeseries\",\n \"version\": \"3.0.0\"\n },\n {\n \"custom\": {\n \"calc\": \"lastNotNull\",\n \"colorMode\": \"background\",\n \"displayMode\": \"seriesToRows\",\n \"linkMode\": \"appendLinkColumn\",\n \"showHeader\": false\n },\n \"datasourceCate\": \"prometheus\",\n \"datasourceValue\": \"${datasource}\",\n \"id\": \"0ad29227-43f9-4649-9170-3930103c4c38\",\n \"layout\": {\n \"h\": 4,\n \"i\": \"0ad29227-43f9-4649-9170-3930103c4c38\",\n \"isResizable\": true,\n \"w\": 4,\n \"x\": 12,\n \"y\": 8\n },\n \"links\": [],\n \"maxPerRow\": 4,\n \"name\": \"Power State\",\n \"options\": {\n \"standardOptions\": {},\n \"valueMappings\": [\n {\n \"match\": {\n \"special\": 0\n },\n \"result\": {\n \"color\": \"rgba(44, 157, 61, 1)\",\n \"text\": \"Normal\"\n },\n \"type\": \"special\"\n },\n {\n \"match\": {\n \"special\": 1\n },\n \"result\": {\n \"color\": \"rgba(255, 153, 25, 1)\",\n \"text\": \"Warning\"\n },\n \"type\": \"special\"\n },\n {\n \"match\": {\n \"special\": 2\n },\n \"result\": {\n \"color\": \"rgba(206, 79, 82, 1)\",\n \"text\": \"Critical\"\n },\n \"type\": \"special\"\n }\n ]\n },\n \"overrides\": [\n {\n \"matcher\": {\n \"id\": \"byFrameRefID\"\n }\n }\n ],\n \"targets\": [\n {\n \"expr\": \"ipmi_power_state{ident=\\\"$ident\\\"}\",\n \"legend\": \"{{name}}\",\n \"refId\": \"A\"\n }\n ],\n \"transformations\": [\n {\n \"id\": \"organize\",\n \"options\": {}\n }\n ],\n \"type\": \"table\",\n \"version\": \"3.0.0\"\n },\n {\n \"custom\": {\n \"calc\": \"lastNotNull\",\n \"colorDomainAuto\": true,\n \"colorRange\": [\n \"#ffeda0\",\n \"#fc4e2a\",\n \"#800026\"\n ],\n \"reverseColorOrder\": false,\n \"textMode\": \"value\",\n \"valueField\": \"Value\"\n },\n \"datasourceCate\": \"prometheus\",\n \"datasourceValue\": \"${datasource}\",\n \"id\": \"38e2b452-3d6d-4b50-b821-6bafdcb6b1ba\",\n \"layout\": {\n \"h\": 4,\n \"i\": \"38e2b452-3d6d-4b50-b821-6bafdcb6b1ba\",\n \"isResizable\": true,\n \"w\": 8,\n \"x\": 16,\n \"y\": 8\n },\n \"links\": [],\n \"maxPerRow\": 4,\n \"name\": \"Power reading in Watts\",\n \"options\": {\n \"standardOptions\": {},\n \"thresholds\": {\n \"steps\": [\n {\n \"color\": \"#634CD9\",\n \"type\": \"base\",\n \"value\": null\n }\n ]\n }\n },\n \"targets\": [\n {\n \"expr\": \"ipmi_power_watts{ident=\\\"$ident\\\"}\",\n \"legend\": \"{{name}}\",\n \"refId\": \"A\"\n }\n ],\n \"transformations\": [\n {\n \"id\": \"organize\",\n \"options\": {}\n }\n ],\n \"type\": \"hexbin\",\n \"version\": \"3.0.0\"\n },\n {\n \"custom\": {\n \"calc\": \"lastNotNull\",\n \"colorMode\": \"background\",\n \"columns\": [],\n \"displayMode\": \"labelsOfSeriesToRows\",\n \"linkMode\": \"appendLinkColumn\",\n \"showHeader\": true\n },\n \"datasourceCate\": \"prometheus\",\n \"datasourceValue\": \"${datasource}\",\n \"id\": \"726d9793-87a9-4942-ad36-8359f56cdbf2\",\n \"layout\": {\n \"h\": 8,\n \"i\": \"726d9793-87a9-4942-ad36-8359f56cdbf2\",\n \"isResizable\": true,\n \"w\": 12,\n \"x\": 0,\n \"y\": 12\n },\n \"links\": [],\n \"maxPerRow\": 4,\n \"name\": \"IPMI Sensors State\",\n \"options\": {\n \"standardOptions\": {},\n \"valueMappings\": [\n {\n \"match\": {\n \"special\": 0\n },\n \"result\": {\n \"color\": \"rgba(44, 157, 61, 1)\",\n \"text\": \"Normal\"\n },\n \"type\": \"special\"\n },\n {\n \"match\": {\n \"special\": 1\n },\n \"result\": {\n \"color\": \"rgba(255, 174, 57, 1)\",\n \"text\": \"Warning\"\n },\n \"type\": \"special\"\n },\n {\n \"match\": {\n \"special\": 2\n },\n \"result\": {\n \"color\": \"rgba(206, 79, 82, 1)\",\n \"text\": \"Critical\"\n },\n \"type\": \"special\"\n }\n ]\n },\n \"overrides\": [\n {\n \"matcher\": {\n \"id\": \"byFrameRefID\"\n }\n }\n ],\n \"targets\": [\n {\n \"expr\": \"ipmi_sensor_state{ident=\\\"$ident\\\"}\",\n \"legend\": \"\",\n \"refId\": \"A\"\n }\n ],\n \"transformations\": [\n {\n \"id\": \"organize\",\n \"options\": {\n \"excludeByName\": {\n \"__name__\": true,\n \"id\": true\n },\n \"indexByName\": {\n \"__name__\": 1,\n \"id\": 2,\n \"ident\": 0,\n \"name\": 3,\n \"type\": 4,\n \"value\": 5\n },\n \"renameByName\": {\n \"value\": \"state\"\n }\n }\n }\n ],\n \"type\": \"table\",\n \"version\": \"3.0.0\"\n },\n {\n \"custom\": {\n \"calc\": \"lastNotNull\",\n \"colorMode\": \"background\",\n \"displayMode\": \"seriesToRows\",\n \"linkMode\": \"appendLinkColumn\",\n \"showHeader\": true\n },\n \"datasourceCate\": \"prometheus\",\n \"datasourceValue\": \"${datasource}\",\n \"id\": \"59080d53-8b88-4f32-8d66-f4a3f7b092b4\",\n \"layout\": {\n \"h\": 8,\n \"i\": \"59080d53-8b88-4f32-8d66-f4a3f7b092b4\",\n \"isResizable\": true,\n \"w\": 6,\n \"x\": 12,\n \"y\": 12\n },\n \"links\": [],\n \"maxPerRow\": 4,\n \"name\": \"Temperature State\",\n \"options\": {\n \"standardOptions\": {},\n \"valueMappings\": [\n {\n \"match\": {\n \"special\": 0\n },\n \"result\": {\n \"color\": \"rgba(44, 157, 61, 1)\",\n \"text\": \"Normal\"\n },\n \"type\": \"special\"\n },\n {\n \"match\": {\n \"special\": 1\n },\n \"result\": {\n \"color\": \"rgba(255, 153, 25, 1)\",\n \"text\": \"Warning\"\n },\n \"type\": \"special\"\n },\n {\n \"match\": {\n \"special\": 2\n },\n \"result\": {\n \"color\": \"rgba(206, 79, 82, 1)\",\n \"text\": \"Critical\"\n },\n \"type\": \"special\"\n }\n ]\n },\n \"overrides\": [\n {\n \"matcher\": {\n \"id\": \"byFrameRefID\"\n }\n }\n ],\n \"targets\": [\n {\n \"expr\": \"ipmi_temperature_state{ident=\\\"$ident\\\"}\",\n \"legend\": \"{{name}}\",\n \"refId\": \"A\"\n }\n ],\n \"transformations\": [\n {\n \"id\": \"organize\",\n \"options\": {}\n }\n ],\n \"type\": \"table\",\n \"version\": \"3.0.0\"\n },\n {\n \"custom\": {\n \"calc\": \"lastNotNull\",\n \"textMode\": \"value\",\n \"valueField\": \"Value\"\n },\n \"datasourceCate\": \"prometheus\",\n \"datasourceValue\": \"${datasource}\",\n \"id\": \"4c20f19c-878e-4dba-a6b2-b2af197ceee1\",\n \"layout\": {\n \"h\": 8,\n \"i\": \"4c20f19c-878e-4dba-a6b2-b2af197ceee1\",\n \"isResizable\": true,\n \"w\": 6,\n \"x\": 18,\n \"y\": 12\n },\n \"links\": [],\n \"maxPerRow\": 4,\n \"name\": \"Temperatures\",\n \"options\": {\n \"standardOptions\": {\n \"util\": \"none\"\n },\n \"thresholds\": {\n \"steps\": [\n {\n \"color\": \"rgba(138, 202, 255, 1)\",\n \"type\": \"base\",\n \"value\": null\n },\n {\n \"color\": \"#F2495C\",\n \"value\": 70\n }\n ]\n },\n \"valueMappings\": []\n },\n \"targets\": [\n {\n \"expr\": \"ipmi_temperature_celsius{ident=\\\"$ident\\\"}\",\n \"legend\": \"{{name}}\",\n \"refId\": \"A\"\n }\n ],\n \"transformations\": [\n {\n \"id\": \"organize\",\n \"options\": {}\n }\n ],\n \"type\": \"gauge\",\n \"version\": \"3.0.0\"\n },\n {\n \"custom\": {\n \"calc\": \"lastNotNull\",\n \"colorMode\": \"background\",\n \"columns\": [],\n \"displayMode\": \"labelsOfSeriesToRows\",\n \"linkMode\": \"appendLinkColumn\",\n \"showHeader\": true\n },\n \"datasourceCate\": \"prometheus\",\n \"datasourceValue\": \"${datasource}\",\n \"id\": \"25c1201e-a1b8-4c65-a00e-3b6322aa4da5\",\n \"layout\": {\n \"h\": 7,\n \"i\": \"25c1201e-a1b8-4c65-a00e-3b6322aa4da5\",\n \"isResizable\": true,\n \"w\": 24,\n \"x\": 0,\n \"y\": 20\n },\n \"links\": [],\n \"maxPerRow\": 4,\n \"name\": \"Reported state of a voltage sensor\",\n \"options\": {\n \"standardOptions\": {},\n \"valueMappings\": [\n {\n \"match\": {\n \"special\": 0\n },\n \"result\": {\n \"color\": \"rgba(44, 157, 61, 1)\",\n \"text\": \"Normal\"\n },\n \"type\": \"special\"\n },\n {\n \"match\": {\n \"special\": 1\n },\n \"result\": {\n \"color\": \"rgba(255, 174, 57, 1)\",\n \"text\": \"Warning\"\n },\n \"type\": \"special\"\n },\n {\n \"match\": {\n \"special\": 2\n },\n \"result\": {\n \"color\": \"rgba(206, 79, 82, 1)\",\n \"text\": \"Critical\"\n },\n \"type\": \"special\"\n }\n ]\n },\n \"overrides\": [\n {\n \"matcher\": {},\n \"properties\": {\n \"valueMappings\": []\n }\n }\n ],\n \"targets\": [\n {\n \"expr\": \"ipmi_voltage_state{ident=\\\"$ident\\\"}\",\n \"legend\": \"{{name}}\",\n \"refId\": \"A\"\n }\n ],\n \"transformations\": [\n {\n \"id\": \"organize\",\n \"options\": {\n \"excludeByName\": {\n \"__name__\": true,\n \"ident\": true\n }\n }\n }\n ],\n \"type\": \"table\",\n \"version\": \"3.0.0\"\n },\n {\n \"custom\": {\n \"calc\": \"lastNotNull\",\n \"textMode\": \"valueAndName\",\n \"valueField\": \"Value\"\n },\n \"datasourceCate\": \"prometheus\",\n \"datasourceValue\": \"${datasource}\",\n \"id\": \"4373d423-43e7-4001-b1f9-6ac53a4a1ae6\",\n \"layout\": {\n \"h\": 4,\n \"i\": \"4373d423-43e7-4001-b1f9-6ac53a4a1ae6\",\n \"isResizable\": true,\n \"w\": 24,\n \"x\": 0,\n \"y\": 27\n },\n \"links\": [],\n \"maxPerRow\": 4,\n \"name\": \"Voltage reading in Volts\",\n \"options\": {\n \"standardOptions\": {\n \"util\": \"none\"\n },\n \"thresholds\": {\n \"steps\": [\n {\n \"color\": \"#73BF69\",\n \"type\": \"base\",\n \"value\": null\n }\n ]\n },\n \"valueMappings\": []\n },\n \"targets\": [\n {\n \"expr\": \"ipmi_voltage_volts{ident=\\\"$ident\\\"}\",\n \"legend\": \"{{name}}\",\n \"refId\": \"A\"\n }\n ],\n \"transformations\": [\n {\n \"id\": \"organize\",\n \"options\": {}\n }\n ],\n \"type\": \"gauge\",\n \"version\": \"3.0.0\"\n }\n ],\n \"var\": [\n {\n \"definition\": \"prometheus\",\n \"name\": \"datasource\",\n \"type\": \"datasource\"\n },\n {\n \"datasource\": {\n \"cate\": \"prometheus\",\n \"value\": \"${datasource}\"\n },\n \"definition\": \"label_values(ipmi_bmc_info, ident)\",\n \"hide\": false,\n \"multi\": false,\n \"name\": \"ident\",\n \"reg\": \"\",\n \"type\": \"query\"\n }\n ],\n \"version\": \"3.0.0\"\n },\n \"public\": 0,\n \"public_cate\": 0,\n \"bgids\": null,\n \"built_in\": 0,\n \"hide\": 0,\n \"uuid\": 1717556327542077000\n}"
},
{
"path": "integrations/IPMI/dashboards/IPMI_by_prometheus.json",
"content": "{\n \"name\": \"IPMI for Prometheus\",\n \"ident\": \"\",\n \"configs\": {\n \"version\": \"2.0.0\",\n \"links\": [],\n \"var\": [\n {\n \"name\": \"node\",\n \"type\": \"query\",\n \"datasource\": {\n \"cate\": \"prometheus\"\n },\n \"definition\": \"label_values(ipmi_bmc_info, ident)\",\n \"reg\": \"\",\n \"multi\": false\n }\n ],\n \"panels\": [\n {\n \"type\": \"gauge\",\n \"id\": \"f975fded-f57e-4a6e-80b4-50d5be6dd84c\",\n \"layout\": {\n \"h\": 7,\n \"w\": 24,\n \"x\": 0,\n \"y\": 0,\n \"i\": \"f975fded-f57e-4a6e-80b4-50d5be6dd84c\",\n \"isResizable\": true\n },\n \"version\": \"2.0.0\",\n \"datasourceCate\": \"prometheus\",\n \"targets\": [\n {\n \"refId\": \"A\",\n \"expr\": \"ipmi_temperature_celsius{ident='$node'}\",\n \"legend\": \"{{name}}\"\n }\n ],\n \"transformations\": [\n {\n \"id\": \"organize\",\n \"options\": {}\n }\n ],\n \"name\": \"Temperatures\",\n \"links\": [],\n \"custom\": {\n \"textMode\": \"valueAndName\",\n \"calc\": \"avg\"\n },\n \"options\": {\n \"valueMappings\": [],\n \"standardOptions\": {\n \"util\": \"none\"\n },\n \"thresholds\": {\n \"steps\": [\n {\n \"color\": \"green\",\n \"value\": null,\n \"type\": \"base\"\n },\n {\n \"color\": \"red\",\n \"value\": 80\n }\n ]\n }\n }\n },\n {\n \"type\": \"timeseries\",\n \"id\": \"681f1191-4777-4377-8b77-404d9f036406\",\n \"layout\": {\n \"h\": 5,\n \"w\": 12,\n \"x\": 0,\n \"y\": 7,\n \"i\": \"681f1191-4777-4377-8b77-404d9f036406\",\n \"isResizable\": true\n },\n \"version\": \"2.0.0\",\n \"datasourceCate\": \"prometheus\",\n \"targets\": [\n {\n \"refId\": \"A\",\n \"expr\": \"ipmi_power_watts{ident='$node'}\",\n \"legend\": \"{{name}}\"\n }\n ],\n \"transformations\": [\n {\n \"id\": \"organize\",\n \"options\": {}\n }\n ],\n \"name\": \"Power\",\n \"links\": [],\n \"options\": {\n \"tooltip\": {\n \"mode\": \"all\",\n \"sort\": \"none\"\n },\n \"legend\": {\n \"displayMode\": \"hidden\"\n },\n \"standardOptions\": {},\n \"thresholds\": {\n \"steps\": [\n {\n \"color\": \"#634CD9\",\n \"value\": null,\n \"type\": \"base\"\n }\n ]\n }\n },\n \"custom\": {\n \"drawStyle\": \"lines\",\n \"lineInterpolation\": \"smooth\",\n \"spanNulls\": false,\n \"lineWidth\": 1,\n \"fillOpacity\": 0.5,\n \"gradientMode\": \"none\",\n \"stack\": \"off\",\n \"scaleDistribution\": {\n \"type\": \"linear\"\n }\n }\n },\n {\n \"type\": \"timeseries\",\n \"id\": \"feede24c-8296-4127-982e-08cfc4151933\",\n \"layout\": {\n \"h\": 5,\n \"w\": 12,\n \"x\": 12,\n \"y\": 7,\n \"i\": \"feede24c-8296-4127-982e-08cfc4151933\",\n \"isResizable\": true\n },\n \"version\": \"2.0.0\",\n \"datasourceCate\": \"prometheus\",\n \"targets\": [\n {\n \"refId\": \"A\",\n \"expr\": \"ipmi_power_watts{ident='$node'} * 30 * 24 \",\n \"legend\": \"{{name}}\"\n }\n ],\n \"transformations\": [\n {\n \"id\": \"organize\",\n \"options\": {}\n }\n ],\n \"name\": \"Power usage 30d\",\n \"links\": [],\n \"options\": {\n \"tooltip\": {\n \"mode\": \"all\",\n \"sort\": \"none\"\n },\n \"legend\": {\n \"displayMode\": \"hidden\"\n },\n \"standardOptions\": {},\n \"thresholds\": {\n \"steps\": [\n {\n \"color\": \"#634CD9\",\n \"value\": null,\n \"type\": \"base\"\n }\n ]\n }\n },\n \"custom\": {\n \"drawStyle\": \"lines\",\n \"lineInterpolation\": \"smooth\",\n \"spanNulls\": false,\n \"lineWidth\": 1,\n \"fillOpacity\": 0.5,\n \"gradientMode\": \"none\",\n \"stack\": \"off\",\n \"scaleDistribution\": {\n \"type\": \"linear\"\n }\n }\n },\n {\n \"type\": \"timeseries\",\n \"id\": \"9e11e7f5-ed3c-49eb-8a72-ee76c8700c24\",\n \"layout\": {\n \"h\": 7,\n \"w\": 12,\n \"x\": 0,\n \"y\": 12,\n \"i\": \"9e11e7f5-ed3c-49eb-8a72-ee76c8700c24\",\n \"isResizable\": true\n },\n \"version\": \"2.0.0\",\n \"datasourceCate\": \"prometheus\",\n \"targets\": [\n {\n \"refId\": \"A\",\n \"expr\": \"ipmi_temperature_celsius{ident='$node'}\",\n \"legend\": \"{{name}}\"\n }\n ],\n \"transformations\": [\n {\n \"id\": \"organize\",\n \"options\": {}\n }\n ],\n \"name\": \"Temperatures\",\n \"links\": [],\n \"description\": \"\",\n \"options\": {\n \"tooltip\": {\n \"mode\": \"multi\"\n },\n \"legend\": {\n \"displayMode\": \"list\",\n \"placement\": \"bottom\"\n },\n \"standardOptions\": {\n \"util\": \"none\"\n },\n \"thresholds\": {\n \"steps\": [\n {\n \"color\": \"green\",\n \"value\": null,\n \"type\": \"base\"\n },\n {\n \"color\": \"red\",\n \"value\": 80\n }\n ]\n }\n },\n \"custom\": {\n \"drawStyle\": \"lines\",\n \"lineInterpolation\": \"linear\",\n \"spanNulls\": false,\n \"lineWidth\": 1,\n \"fillOpacity\": 0.5,\n \"gradientMode\": \"none\",\n \"stack\": \"off\",\n \"scaleDistribution\": {\n \"type\": \"linear\"\n }\n }\n },\n {\n \"type\": \"timeseries\",\n \"id\": \"95c734f7-26cb-41a7-8376-49332cc220c2\",\n \"layout\": {\n \"h\": 7,\n \"w\": 12,\n \"x\": 12,\n \"y\": 12,\n \"i\": \"95c734f7-26cb-41a7-8376-49332cc220c2\",\n \"isResizable\": true\n },\n \"version\": \"2.0.0\",\n \"datasourceCate\": \"prometheus\",\n \"targets\": [\n {\n \"refId\": \"A\",\n \"expr\": \"ipmi_power_watts{ident='$node'}\",\n \"legend\": \"{{name}}\"\n }\n ],\n \"transformations\": [\n {\n \"id\": \"organize\",\n \"options\": {}\n }\n ],\n \"name\": \"Power\",\n \"links\": [],\n \"description\": \"\",\n \"options\": {\n \"tooltip\": {\n \"mode\": \"multi\"\n },\n \"legend\": {\n \"displayMode\": \"list\",\n \"placement\": \"bottom\"\n },\n \"standardOptions\": {\n \"util\": \"none\"\n },\n \"thresholds\": {\n \"steps\": [\n {\n \"color\": \"green\",\n \"value\": null,\n \"type\": \"base\"\n },\n {\n \"color\": \"red\",\n \"value\": 80\n }\n ]\n }\n },\n \"custom\": {\n \"drawStyle\": \"lines\",\n \"lineInterpolation\": \"linear\",\n \"spanNulls\": false,\n \"lineWidth\": 1,\n \"fillOpacity\": 0.01,\n \"gradientMode\": \"none\",\n \"stack\": \"off\",\n \"scaleDistribution\": {\n \"type\": \"linear\"\n }\n }\n },\n {\n \"type\": \"timeseries\",\n \"id\": \"0313f34f-afcf-41e9-8f69-9a3dbd4b2e56\",\n \"layout\": {\n \"h\": 7,\n \"w\": 12,\n \"x\": 0,\n \"y\": 19,\n \"i\": \"0313f34f-afcf-41e9-8f69-9a3dbd4b2e56\",\n \"isResizable\": true\n },\n \"version\": \"2.0.0\",\n \"datasourceCate\": \"prometheus\",\n \"targets\": [\n {\n \"refId\": \"A\",\n \"expr\": \"ipmi_fan_speed_rpm{ident='$node'}\",\n \"legend\": \"{{name}}\"\n }\n ],\n \"transformations\": [\n {\n \"id\": \"organize\",\n \"options\": {}\n }\n ],\n \"name\": \"Fans\",\n \"links\": [],\n \"description\": \"\",\n \"options\": {\n \"tooltip\": {\n \"mode\": \"multi\"\n },\n \"legend\": {\n \"displayMode\": \"list\",\n \"placement\": \"bottom\"\n },\n \"standardOptions\": {\n \"util\": \"none\"\n },\n \"thresholds\": {\n \"steps\": [\n {\n \"color\": \"green\",\n \"value\": null,\n \"type\": \"base\"\n },\n {\n \"color\": \"red\",\n \"value\": 80\n }\n ]\n }\n },\n \"custom\": {\n \"drawStyle\": \"lines\",\n \"lineInterpolation\": \"linear\",\n \"spanNulls\": false,\n \"lineWidth\": 1,\n \"fillOpacity\": 0.5,\n \"gradientMode\": \"none\",\n \"stack\": \"off\",\n \"scaleDistribution\": {\n \"type\": \"linear\"\n }\n }\n },\n {\n \"type\": \"timeseries\",\n \"id\": \"29ee004d-a95c-405d-97d1-d715fab4e1de\",\n \"layout\": {\n \"h\": 7,\n \"w\": 12,\n \"x\": 12,\n \"y\": 19,\n \"i\": \"29ee004d-a95c-405d-97d1-d715fab4e1de\",\n \"isResizable\": true\n },\n \"version\": \"2.0.0\",\n \"datasourceCate\": \"prometheus\",\n \"targets\": [\n {\n \"refId\": \"A\",\n \"expr\": \"ipmi_voltage_volts{ident='$node',name!~\\\"Voltage 1|Voltage 2\\\"}\",\n \"legend\": \"{{name}}\"\n }\n ],\n \"transformations\": [\n {\n \"id\": \"organize\",\n \"options\": {}\n }\n ],\n \"name\": \"Voltages\",\n \"links\": [],\n \"description\": \"\",\n \"options\": {\n \"tooltip\": {\n \"mode\": \"multi\"\n },\n \"legend\": {\n \"displayMode\": \"list\",\n \"placement\": \"bottom\"\n },\n \"standardOptions\": {\n \"util\": \"none\"\n },\n \"thresholds\": {\n \"steps\": [\n {\n \"color\": \"green\",\n \"value\": null,\n \"type\": \"base\"\n },\n {\n \"color\": \"red\",\n \"value\": 80\n }\n ]\n }\n },\n \"custom\": {\n \"drawStyle\": \"lines\",\n \"lineInterpolation\": \"linear\",\n \"spanNulls\": false,\n \"lineWidth\": 1,\n \"fillOpacity\": 0.5,\n \"gradientMode\": \"none\",\n \"stack\": \"off\",\n \"scaleDistribution\": {\n \"type\": \"linear\"\n }\n }\n }\n ]\n },\n \"uuid\": 1727587308068775000\n}\n"
},
{
"path": "integrations/IPMI/markdown/README.md",
"content": "# IPMI plugin\nipmi插件是从ipmi exporter迁移过来。 基本原理是通过执行ipmi的一系列命令并将命令输出转换为指标,如果ipmi没有配置好,是无法采集到指标的,请务必将ipmi配置好。\n\ncategraf的ipmi插件配置举例如下:\n```toml\n# Read metrics from the bare metal servers via freeipmi\n[[instances]]\n# target指定是本地采集还是远程采集\n#target=\"localhost\"\n# 指定采集的用户名和密码,这里务必保证ipmi命令能获取正确输出,不是网上查到一个用户名 密码就可以。\n#user = \"user\"\n#pass = \"1234\"\n\n# ipmi协议版本,支持1.5 和 2.0 \n#driver = \"LAN_2_0\"\n\n# 指定特权用户名\n#privilege = \"user\"\n\n## session-timeout, ms\n#timeout = 100000\n\n# 支持的采集器 bmc, bmc-watchdog, ipmi, chassis, dcmi, sel,sm-lan-mode\n# 默认使用 bmc, ipmi, chassis和dcmi,建议保持下列配置便于仪表盘更好的展示\ncollectors = [ \"bmc\", \"ipmi\", \"chassis\", \"sel\", \"dcmi\"]\n\n# 不关注的传感器,指定id 排除掉\n#exclude_sensor_ids = [ 2, 29, 32, 50, 52, 55 ]\n\n# 如果你想使用定制化的参数覆盖内置的命令,可以修改以下内容; 建议保持注释\n#[instances.collector_cmd]\n#ipmi = \"sudo\"\n#sel = \"sudo\"\n#[instances.default_args]\n#ipmi = [ \"--bridge-sensors\" ]\n#[instances.custom_args]\n#ipmi = [ \"--bridge-sensors\" ]\n#sel = [ \"ipmi-sel\" ]\n```"
},
{
"path": "integrations/IPVS/collect/ipvs/ipvs.toml",
"content": "# Collect virtual and real server stats from Linux IPVS\n# no configuration\n"
},
{
"path": "integrations/IPVS/markdown/README.md",
"content": "# ipvs\n\nForked from telegraf. The IPVS input plugin uses the linux kernel netlink socket interface to gather\nmetrics about ipvs virtual and real servers.\n**Supported Platforms:** Linux\n\n### Permissions\n\nAssuming you installed the telegraf package via one of the published packages,\nthe process will be running as the `telegraf` user. However, in order for this\nplugin to communicate over netlink sockets it needs the telegraf process to be\nrunning as `root` (or some user with `CAP_NET_ADMIN` and `CAP_NET_RAW`). Be sure\nto ensure these permissions before running telegraf with this plugin included.\n\n## Configuration\n```\n# Collect virtual and real server stats from Linux IPVS\n # no configuration\n```\n\n## Metrics\n\nServer will contain tags identifying how it was configured, using one of\n`address` + `port` + `protocol` *OR* `fwmark`. This is how one would normally\nconfigure a virtual server using `ipvsadm`.\n\n- ipvs_virtual_server\n - tags:\n - sched (the scheduler in use)\n - netmask (the mask used for determining affinity)\n - address_family (inet/inet6)\n - address\n - port\n - protocol\n - fwmark\n - fields:\n - connections\n - pkts_in\n - pkts_out\n - bytes_in\n - bytes_out\n - pps_in\n - pps_out\n - cps\n\n- ipvs_real_server\n - tags:\n - address\n - port\n - address_family (inet/inet6)\n - virtual_address\n - virtual_port\n - virtual_protocol\n - virtual_fwmark\n - fields:\n - active_connections\n - inactive_connections\n - connections\n - pkts_in\n - pkts_out\n - bytes_in\n - bytes_out\n - pps_in\n - pps_out\n - cps\n\n## Example Output\n\nVirtual server is configured using `fwmark` and backed by 2 real servers:\n\n```shell\nipvs_virtual_server,address=172.18.64.234,address_family=inet,netmask=32,port=9000,protocol=tcp,sched=rr bytes_in=0i,bytes_out=0i,pps_in=0i,pps_out=0i,cps=0i,connections=0i,pkts_in=0i,pkts_out=0i 1541019340000000000\nipvs_real_server,address=172.18.64.220,address_family=inet,port=9000,virtual_address=172.18.64.234,virtual_port=9000,virtual_protocol=tcp active_connections=0i,inactive_connections=0i,pkts_in=0i,bytes_out=0i,pps_out=0i,connections=0i,pkts_out=0i,bytes_in=0i,pps_in=0i,cps=0i 1541019340000000000\nipvs_real_server,address=172.18.64.219,address_family=inet,port=9000,virtual_address=172.18.64.234,virtual_port=9000,virtual_protocol=tcp active_connections=0i,inactive_connections=0i,pps_in=0i,pps_out=0i,connections=0i,pkts_in=0i,pkts_out=0i,bytes_in=0i,bytes_out=0i,cps=0i 1541019340000000000\n```\n\nVirtual server is configured using `proto+addr+port` and backed by 2 real\nservers:\n\n```shell\nipvs_virtual_server,address_family=inet,fwmark=47,netmask=32,sched=rr cps=0i,connections=0i,pkts_in=0i,pkts_out=0i,bytes_in=0i,bytes_out=0i,pps_in=0i,pps_out=0i 1541019340000000000\nipvs_real_server,address=172.18.64.220,address_family=inet,port=9000,virtual_fwmark=47 inactive_connections=0i,pkts_out=0i,bytes_out=0i,pps_in=0i,cps=0i,active_connections=0i,pkts_in=0i,bytes_in=0i,pps_out=0i,connections=0i 1541019340000000000\nipvs_real_server,address=172.18.64.219,address_family=inet,port=9000,virtual_fwmark=47 cps=0i,active_connections=0i,inactive_connections=0i,connections=0i,pkts_in=0i,bytes_out=0i,pkts_out=0i,bytes_in=0i,pps_in=0i,pps_out=0i 1541019340000000000\n```"
},
{
"path": "integrations/Java/dashboards/jmx_by_exporter.json",
"content": "{\n \"name\": \"JMX\",\n \"tags\": \"Prometheus JMX\",\n \"ident\": \"\",\n \"uuid\": 1760503245274000,\n \"configs\": {\n \"panels\": [\n {\n \"collapsed\": true,\n \"id\": \"a26c5c3d-7b60-4746-bd1f-ca95581cf2fd\",\n \"layout\": {\n \"h\": 1,\n \"i\": \"a26c5c3d-7b60-4746-bd1f-ca95581cf2fd\",\n \"w\": 24,\n \"x\": 0,\n \"y\": 0\n },\n \"name\": \"Basic Info\",\n \"type\": \"row\"\n },\n {\n \"custom\": {\n \"calc\": \"lastNotNull\",\n \"colSpan\": 1,\n \"colorMode\": \"value\",\n \"textMode\": \"value\",\n \"textSize\": {}\n },\n \"datasourceCate\": \"prometheus\",\n \"datasourceValue\": \"${prom}\",\n \"id\": \"0721ee76-816b-469f-9c49-2bef94a9299e\",\n \"layout\": {\n \"h\": 3,\n \"i\": \"0721ee76-816b-469f-9c49-2bef94a9299e\",\n \"w\": 6,\n \"x\": 0,\n \"y\": 1\n },\n \"name\": \"Status\",\n \"options\": {\n \"standardOptions\": {},\n \"valueMappings\": [\n {\n \"match\": {\n \"special\": 1\n },\n \"result\": {\n \"color\": \"#1eac02\",\n \"text\": \"UP\"\n },\n \"type\": \"special\"\n },\n {\n \"match\": {\n \"special\": 0\n },\n \"result\": {\n \"color\": \"#f00a0a\",\n \"text\": \"DOWN\"\n },\n \"type\": \"special\"\n }\n ]\n },\n \"targets\": [\n {\n \"expr\": \"up{job=\\\"$job\\\", instance=\\\"$instance\\\"}\",\n \"refId\": \"A\"\n }\n ],\n \"type\": \"stat\",\n \"version\": \"2.0.0\"\n },\n {\n \"custom\": {\n \"calc\": \"lastNotNull\",\n \"colSpan\": 1,\n \"colorMode\": \"value\",\n \"textMode\": \"value\",\n \"textSize\": {}\n },\n \"datasourceCate\": \"prometheus\",\n \"datasourceValue\": \"${prom}\",\n \"id\": \"a55c40fc-dc25-4d2a-8e99-928e02c5ff5d\",\n \"layout\": {\n \"h\": 3,\n \"i\": \"a55c40fc-dc25-4d2a-8e99-928e02c5ff5d\",\n \"w\": 6,\n \"x\": 6,\n \"y\": 1\n },\n \"name\": \"Uptime\",\n \"options\": {\n \"standardOptions\": {\n \"util\": \"humantimeSeconds\"\n }\n },\n \"targets\": [\n {\n \"expr\": \"time() - process_start_time_seconds{job=\\\"$job\\\",instance=\\\"$instance\\\"}\",\n \"refId\": \"A\"\n }\n ],\n \"type\": \"stat\",\n \"version\": \"2.0.0\"\n },\n {\n \"custom\": {\n \"calc\": \"lastNotNull\",\n \"colSpan\": 1,\n \"colorMode\": \"value\",\n \"textMode\": \"value\",\n \"textSize\": {}\n },\n \"datasourceCate\": \"prometheus\",\n \"datasourceValue\": \"${prom}\",\n \"id\": \"60c3389c-808d-4412-b74b-cb762e89a8ad\",\n \"layout\": {\n \"h\": 3,\n \"i\": \"60c3389c-808d-4412-b74b-cb762e89a8ad\",\n \"w\": 6,\n \"x\": 12,\n \"y\": 1\n },\n \"name\": \"Available CPUs\",\n \"options\": {\n \"standardOptions\": {}\n },\n \"targets\": [\n {\n \"expr\": \"os_available_processors{job=\\\"$job\\\",instance=\\\"$instance\\\"}\",\n \"refId\": \"A\"\n }\n ],\n \"type\": \"stat\",\n \"version\": \"2.0.0\"\n },\n {\n \"custom\": {\n \"calc\": \"lastNotNull\",\n \"colSpan\": 1,\n \"colorMode\": \"value\",\n \"textMode\": \"value\",\n \"textSize\": {}\n },\n \"datasourceCate\": \"prometheus\",\n \"datasourceValue\": \"${prom}\",\n \"id\": \"1c9a8cca-3578-485e-837d-21618d383065\",\n \"layout\": {\n \"h\": 3,\n \"i\": \"1c9a8cca-3578-485e-837d-21618d383065\",\n \"w\": 6,\n \"x\": 18,\n \"y\": 1\n },\n \"name\": \"Open file descriptors\",\n \"options\": {\n \"standardOptions\": {}\n },\n \"targets\": [\n {\n \"expr\": \"os_open_file_descriptor_count{job=\\\"$job\\\",instance=\\\"$instance\\\"}\",\n \"refId\": \"A\"\n }\n ],\n \"type\": \"stat\",\n \"version\": \"2.0.0\"\n },\n {\n \"collapsed\": true,\n \"id\": \"705c90e0-e8b6-4f1c-b35c-c8a785009a20\",\n \"layout\": {\n \"h\": 1,\n \"i\": \"705c90e0-e8b6-4f1c-b35c-c8a785009a20\",\n \"w\": 24,\n \"x\": 0,\n \"y\": 4\n },\n \"name\": \"JVM Memory\",\n \"type\": \"row\"\n },\n {\n \"type\": \"timeseries\",\n \"id\": \"5455e2f2-f6bb-4888-9d88-240d7e12cce2\",\n \"layout\": {\n \"h\": 7,\n \"i\": \"5455e2f2-f6bb-4888-9d88-240d7e12cce2\",\n \"w\": 12,\n \"x\": 0,\n \"y\": 5\n },\n \"version\": \"3.1.0\",\n \"datasourceCate\": \"prometheus\",\n \"datasourceValue\": \"${prom}\",\n \"targets\": [\n {\n \"expr\": \"jvm_memory_used_bytes{area=\\\"heap\\\",job=\\\"$job\\\",instance=\\\"$instance\\\"}\",\n \"legend\": \"Used\",\n \"refId\": \"A\",\n \"maxDataPoints\": 240\n },\n {\n \"expr\": \"jvm_memory_bytes_max{area=\\\"heap\\\",job=\\\"$job\\\",instance=\\\"$instance\\\"}\",\n \"legend\": \"Max\",\n \"refId\": \"B\",\n \"maxDataPoints\": 240\n }\n ],\n \"transformations\": [\n {\n \"id\": \"organize\",\n \"options\": {}\n }\n ],\n \"name\": \"JVM Memory(heap)\",\n \"maxPerRow\": 4,\n \"options\": {\n \"tooltip\": {\n \"mode\": \"all\",\n \"sort\": \"desc\"\n },\n \"legend\": {\n \"displayMode\": \"hidden\",\n \"placement\": \"bottom\",\n \"behaviour\": \"showItem\",\n \"selectMode\": \"single\"\n },\n \"standardOptions\": {\n \"util\": \"bytesIEC\",\n \"decimals\": 1\n },\n \"thresholds\": {\n \"mode\": \"absolute\",\n \"steps\": [\n {\n \"color\": \"rgb(44, 157, 61)\",\n \"value\": null,\n \"type\": \"base\"\n }\n ]\n },\n \"thresholdsStyle\": {\n \"mode\": \"dashed\"\n }\n },\n \"custom\": {\n \"drawStyle\": \"lines\",\n \"lineInterpolation\": \"smooth\",\n \"spanNulls\": false,\n \"lineWidth\": 2,\n \"fillOpacity\": 0.3,\n \"gradientMode\": \"opacity\",\n \"stack\": \"off\",\n \"scaleDistribution\": {\n \"type\": \"linear\"\n },\n \"showPoints\": \"none\",\n \"pointSize\": 5\n },\n \"overrides\": [\n {\n \"matcher\": {\n \"id\": \"byFrameRefID\"\n },\n \"properties\": {\n \"rightYAxisDisplay\": \"off\"\n }\n }\n ]\n },\n {\n \"type\": \"timeseries\",\n \"id\": \"765b22a9-1ddc-4c08-8758-684e3c13252b\",\n \"layout\": {\n \"h\": 7,\n \"i\": \"765b22a9-1ddc-4c08-8758-684e3c13252b\",\n \"w\": 12,\n \"x\": 12,\n \"y\": 5\n },\n \"version\": \"3.1.0\",\n \"datasourceCate\": \"prometheus\",\n \"datasourceValue\": \"${prom}\",\n \"targets\": [\n {\n \"expr\": \"jvm_memory_used_bytes{area=\\\"nonheap\\\",job=\\\"$job\\\",instance=\\\"$instance\\\"}\",\n \"legend\": \"Used\",\n \"refId\": \"A\",\n \"maxDataPoints\": 240\n },\n {\n \"expr\": \"jvm_memory_bytes_max{area=\\\"nonheap\\\",job=\\\"$job\\\",instance=\\\"$instance\\\"}\",\n \"legend\": \"Max\",\n \"refId\": \"B\",\n \"maxDataPoints\": 240\n }\n ],\n \"transformations\": [\n {\n \"id\": \"organize\",\n \"options\": {}\n }\n ],\n \"name\": \"JVM Memory(nonheap)\",\n \"maxPerRow\": 4,\n \"options\": {\n \"tooltip\": {\n \"mode\": \"all\",\n \"sort\": \"desc\"\n },\n \"legend\": {\n \"displayMode\": \"hidden\",\n \"placement\": \"bottom\",\n \"behaviour\": \"showItem\",\n \"selectMode\": \"single\"\n },\n \"standardOptions\": {\n \"util\": \"bytesIEC\",\n \"decimals\": 1\n },\n \"thresholds\": {\n \"mode\": \"absolute\",\n \"steps\": [\n {\n \"color\": \"rgb(44, 157, 61)\",\n \"value\": null,\n \"type\": \"base\"\n }\n ]\n },\n \"thresholdsStyle\": {\n \"mode\": \"dashed\"\n }\n },\n \"custom\": {\n \"drawStyle\": \"lines\",\n \"lineInterpolation\": \"smooth\",\n \"spanNulls\": false,\n \"lineWidth\": 2,\n \"fillOpacity\": 0.3,\n \"gradientMode\": \"opacity\",\n \"stack\": \"off\",\n \"scaleDistribution\": {\n \"type\": \"linear\"\n },\n \"showPoints\": \"none\",\n \"pointSize\": 5\n },\n \"overrides\": [\n {\n \"matcher\": {\n \"id\": \"byFrameRefID\"\n },\n \"properties\": {\n \"rightYAxisDisplay\": \"off\"\n }\n }\n ]\n },\n {\n \"collapsed\": true,\n \"id\": \"c43aa6f5-7252-400f-bb9f-8c96e436151c\",\n \"layout\": {\n \"h\": 1,\n \"i\": \"c43aa6f5-7252-400f-bb9f-8c96e436151c\",\n \"w\": 24,\n \"x\": 0,\n \"y\": 12\n },\n \"name\": \"Memory Pool\",\n \"type\": \"row\"\n },\n {\n \"type\": \"timeseries\",\n \"id\": \"5ab2434c-a905-43c1-a563-4cee2dc9dce9\",\n \"layout\": {\n \"h\": 7,\n \"i\": \"5ab2434c-a905-43c1-a563-4cee2dc9dce9\",\n \"w\": 6,\n \"x\": 0,\n \"y\": 13\n },\n \"version\": \"3.1.0\",\n \"datasourceCate\": \"prometheus\",\n \"datasourceValue\": \"${prom}\",\n \"targets\": [\n {\n \"expr\": \"jvm_memory_pool_max_bytes{pool=\\\"CodeHeap 'non-nmethods'\\\", job=\\\"$job\\\",instance=\\\"$instance\\\"}\",\n \"legend\": \"Max\",\n \"refId\": \"A\",\n \"maxDataPoints\": 240\n },\n {\n \"expr\": \"jvm_memory_pool_bytes_used{pool=\\\"CodeHeap 'non-nmethods'\\\", job=\\\"$job\\\",instance=\\\"$instance\\\"}\",\n \"legend\": \"Used\",\n \"refId\": \"B\",\n \"maxDataPoints\": 240\n },\n {\n \"expr\": \"jvm_memory_pool_bytes_committed{pool=\\\"CodeHeap 'non-nmethods'\\\", job=\\\"$job\\\",instance=\\\"$instance\\\"}\",\n \"legend\": \"Committed\",\n \"refId\": \"C\",\n \"maxDataPoints\": 240\n }\n ],\n \"transformations\": [\n {\n \"id\": \"organize\",\n \"options\": {}\n }\n ],\n \"name\": \"CodeHeap 'non-nmethods'\",\n \"maxPerRow\": 4,\n \"options\": {\n \"tooltip\": {\n \"mode\": \"all\",\n \"sort\": \"desc\"\n },\n \"legend\": {\n \"displayMode\": \"hidden\",\n \"placement\": \"bottom\",\n \"behaviour\": \"showItem\",\n \"selectMode\": \"single\"\n },\n \"standardOptions\": {\n \"util\": \"bytesIEC\",\n \"decimals\": 1\n },\n \"thresholds\": {\n \"mode\": \"absolute\",\n \"steps\": [\n {\n \"color\": \"rgb(44, 157, 61)\",\n \"value\": null,\n \"type\": \"base\"\n }\n ]\n },\n \"thresholdsStyle\": {\n \"mode\": \"dashed\"\n }\n },\n \"custom\": {\n \"drawStyle\": \"lines\",\n \"lineInterpolation\": \"smooth\",\n \"spanNulls\": false,\n \"lineWidth\": 2,\n \"fillOpacity\": 0.3,\n \"gradientMode\": \"opacity\",\n \"stack\": \"off\",\n \"scaleDistribution\": {\n \"type\": \"linear\"\n },\n \"showPoints\": \"none\",\n \"pointSize\": 5\n },\n \"overrides\": [\n {\n \"matcher\": {\n \"id\": \"byFrameRefID\"\n },\n \"properties\": {\n \"rightYAxisDisplay\": \"off\"\n }\n }\n ]\n },\n {\n \"type\": \"timeseries\",\n \"id\": \"bfe16d07-91ff-44e6-87bc-9d5d93d2ebd6\",\n \"layout\": {\n \"h\": 7,\n \"i\": \"bfe16d07-91ff-44e6-87bc-9d5d93d2ebd6\",\n \"w\": 6,\n \"x\": 6,\n \"y\": 13\n },\n \"version\": \"3.1.0\",\n \"datasourceCate\": \"prometheus\",\n \"datasourceValue\": \"${prom}\",\n \"targets\": [\n {\n \"expr\": \"jvm_memory_pool_max_bytes{pool=\\\"CodeHeap 'profiled nmethods'\\\", job=\\\"$job\\\",instance=\\\"$instance\\\"}\",\n \"legend\": \"Max\",\n \"refId\": \"A\",\n \"maxDataPoints\": 240\n },\n {\n \"expr\": \"jvm_memory_pool_bytes_used{pool=\\\"CodeHeap 'profiled nmethods'\\\", job=\\\"$job\\\",instance=\\\"$instance\\\"}\",\n \"legend\": \"Used\",\n \"refId\": \"B\",\n \"maxDataPoints\": 240\n },\n {\n \"expr\": \"jvm_memory_pool_bytes_committed{pool=\\\"CodeHeap 'profiled nmethods'\\\", job=\\\"$job\\\",instance=\\\"$instance\\\"}\",\n \"legend\": \"Committed\",\n \"refId\": \"C\",\n \"maxDataPoints\": 240\n }\n ],\n \"transformations\": [\n {\n \"id\": \"organize\",\n \"options\": {}\n }\n ],\n \"name\": \"CodeHeap 'profiled nmethods'\",\n \"maxPerRow\": 4,\n \"options\": {\n \"tooltip\": {\n \"mode\": \"all\",\n \"sort\": \"desc\"\n },\n \"legend\": {\n \"displayMode\": \"hidden\",\n \"placement\": \"bottom\",\n \"behaviour\": \"showItem\",\n \"selectMode\": \"single\"\n },\n \"standardOptions\": {\n \"util\": \"bytesIEC\",\n \"decimals\": 1\n },\n \"thresholds\": {\n \"mode\": \"absolute\",\n \"steps\": [\n {\n \"color\": \"rgb(44, 157, 61)\",\n \"value\": null,\n \"type\": \"base\"\n }\n ]\n },\n \"thresholdsStyle\": {\n \"mode\": \"dashed\"\n }\n },\n \"custom\": {\n \"drawStyle\": \"lines\",\n \"lineInterpolation\": \"smooth\",\n \"spanNulls\": false,\n \"lineWidth\": 2,\n \"fillOpacity\": 0.3,\n \"gradientMode\": \"opacity\",\n \"stack\": \"off\",\n \"scaleDistribution\": {\n \"type\": \"linear\"\n },\n \"showPoints\": \"none\",\n \"pointSize\": 5\n },\n \"overrides\": [\n {\n \"matcher\": {\n \"id\": \"byFrameRefID\"\n },\n \"properties\": {\n \"rightYAxisDisplay\": \"off\"\n }\n }\n ]\n },\n {\n \"type\": \"timeseries\",\n \"id\": \"18d10f97-5ab2-41c4-a3ad-09f2c7a03e1a\",\n \"layout\": {\n \"h\": 7,\n \"i\": \"18d10f97-5ab2-41c4-a3ad-09f2c7a03e1a\",\n \"w\": 6,\n \"x\": 12,\n \"y\": 13\n },\n \"version\": \"3.1.0\",\n \"datasourceCate\": \"prometheus\",\n \"datasourceValue\": \"${prom}\",\n \"targets\": [\n {\n \"expr\": \"jvm_memory_pool_max_bytes{pool=\\\"CodeHeap 'non-profiled nmethods'\\\", job=\\\"$job\\\",instance=\\\"$instance\\\"}\",\n \"legend\": \"Max\",\n \"refId\": \"A\",\n \"maxDataPoints\": 240\n },\n {\n \"expr\": \"jvm_memory_pool_bytes_used{pool=\\\"CodeHeap 'non-profiled nmethods'\\\", job=\\\"$job\\\",instance=\\\"$instance\\\"}\",\n \"legend\": \"Used\",\n \"refId\": \"B\",\n \"maxDataPoints\": 240\n },\n {\n \"expr\": \"jvm_memory_pool_bytes_committed{pool=\\\"CodeHeap 'non-profiled nmethods'\\\", job=\\\"$job\\\",instance=\\\"$instance\\\"}\",\n \"legend\": \"Committed\",\n \"refId\": \"C\",\n \"maxDataPoints\": 240\n }\n ],\n \"transformations\": [\n {\n \"id\": \"organize\",\n \"options\": {}\n }\n ],\n \"name\": \"CodeHeap 'non-profiled nmethods'\",\n \"maxPerRow\": 4,\n \"options\": {\n \"tooltip\": {\n \"mode\": \"all\",\n \"sort\": \"desc\"\n },\n \"legend\": {\n \"displayMode\": \"hidden\",\n \"placement\": \"bottom\",\n \"behaviour\": \"showItem\",\n \"selectMode\": \"single\"\n },\n \"standardOptions\": {\n \"util\": \"bytesIEC\",\n \"decimals\": 1\n },\n \"thresholds\": {\n \"mode\": \"absolute\",\n \"steps\": [\n {\n \"color\": \"rgb(44, 157, 61)\",\n \"value\": null,\n \"type\": \"base\"\n }\n ]\n },\n \"thresholdsStyle\": {\n \"mode\": \"dashed\"\n }\n },\n \"custom\": {\n \"drawStyle\": \"lines\",\n \"lineInterpolation\": \"smooth\",\n \"spanNulls\": false,\n \"lineWidth\": 2,\n \"fillOpacity\": 0.3,\n \"gradientMode\": \"opacity\",\n \"stack\": \"off\",\n \"scaleDistribution\": {\n \"type\": \"linear\"\n },\n \"showPoints\": \"none\",\n \"pointSize\": 5\n },\n \"overrides\": [\n {\n \"matcher\": {\n \"id\": \"byFrameRefID\"\n },\n \"properties\": {\n \"rightYAxisDisplay\": \"off\"\n }\n }\n ]\n },\n {\n \"type\": \"timeseries\",\n \"id\": \"314a3893-c1d4-4f85-bce0-33ecfda2f521\",\n \"layout\": {\n \"h\": 7,\n \"i\": \"314a3893-c1d4-4f85-bce0-33ecfda2f521\",\n \"w\": 6,\n \"x\": 18,\n \"y\": 13\n },\n \"version\": \"3.1.0\",\n \"datasourceCate\": \"prometheus\",\n \"datasourceValue\": \"${prom}\",\n \"targets\": [\n {\n \"expr\": \"jvm_memory_pool_max_bytes{pool=~\\\"G1 Eden Space|Eden Space|PS Eden Space\\\", job=\\\"$job\\\",instance=\\\"$instance\\\"}\",\n \"legend\": \"Max {{pool}}\",\n \"refId\": \"A\",\n \"maxDataPoints\": 240\n },\n {\n \"expr\": \"jvm_memory_pool_bytes_used{pool=~\\\"G1 Eden Space|Eden Space|PS Eden Space\\\", job=\\\"$job\\\",instance=\\\"$instance\\\"}\",\n \"legend\": \"Used {{pool}}\",\n \"refId\": \"B\",\n \"maxDataPoints\": 240\n },\n {\n \"expr\": \"jvm_memory_pool_bytes_committed{pool=~\\\"G1 Eden Space|Eden Space|PS Eden Space\\\", job=\\\"$job\\\",instance=\\\"$instance\\\"}\",\n \"legend\": \"Committed {{pool}}\",\n \"refId\": \"C\",\n \"maxDataPoints\": 240\n }\n ],\n \"name\": \"Eden Space\",\n \"maxPerRow\": 4,\n \"options\": {\n \"tooltip\": {\n \"mode\": \"all\",\n \"sort\": \"desc\"\n },\n \"legend\": {\n \"displayMode\": \"hidden\",\n \"placement\": \"bottom\",\n \"behaviour\": \"showItem\",\n \"selectMode\": \"single\"\n },\n \"standardOptions\": {\n \"util\": \"bytesIEC\",\n \"decimals\": 1\n },\n \"thresholds\": {\n \"mode\": \"absolute\",\n \"steps\": [\n {\n \"color\": \"rgb(44, 157, 61)\",\n \"value\": null,\n \"type\": \"base\"\n }\n ]\n },\n \"thresholdsStyle\": {\n \"mode\": \"dashed\"\n }\n },\n \"custom\": {\n \"drawStyle\": \"lines\",\n \"lineInterpolation\": \"smooth\",\n \"spanNulls\": false,\n \"lineWidth\": 2,\n \"fillOpacity\": 0.3,\n \"gradientMode\": \"opacity\",\n \"stack\": \"off\",\n \"scaleDistribution\": {\n \"type\": \"linear\"\n },\n \"showPoints\": \"none\",\n \"pointSize\": 5\n },\n \"overrides\": [\n {\n \"matcher\": {\n \"id\": \"byFrameRefID\"\n },\n \"properties\": {\n \"rightYAxisDisplay\": \"off\"\n }\n }\n ]\n },\n {\n \"type\": \"timeseries\",\n \"id\": \"1e5f03e7-af5d-447b-9c1b-23d81915e8df\",\n \"layout\": {\n \"h\": 7,\n \"i\": \"1e5f03e7-af5d-447b-9c1b-23d81915e8df\",\n \"w\": 6,\n \"x\": 0,\n \"y\": 15\n },\n \"version\": \"3.1.0\",\n \"datasourceCate\": \"prometheus\",\n \"datasourceValue\": \"${prom}\",\n \"targets\": [\n {\n \"expr\": \"jvm_memory_pool_max_bytes{pool=\\\"Compressed Class Space\\\", job=\\\"$job\\\",instance=\\\"$instance\\\"}\",\n \"legend\": \"Max\",\n \"refId\": \"A\",\n \"maxDataPoints\": 240\n },\n {\n \"expr\": \"jvm_memory_pool_bytes_used{pool=\\\"Compressed Class Space\\\", job=\\\"$job\\\",instance=\\\"$instance\\\"}\",\n \"legend\": \"Used\",\n \"refId\": \"B\",\n \"maxDataPoints\": 240\n },\n {\n \"expr\": \"jvm_memory_pool_bytes_committed{pool=\\\"Compressed Class Space\\\", job=\\\"$job\\\",instance=\\\"$instance\\\"}\",\n \"legend\": \"Committed\",\n \"refId\": \"C\",\n \"maxDataPoints\": 240\n }\n ],\n \"transformations\": [\n {\n \"id\": \"organize\",\n \"options\": {}\n }\n ],\n \"name\": \"Compressed Class Space\",\n \"maxPerRow\": 4,\n \"options\": {\n \"tooltip\": {\n \"mode\": \"all\",\n \"sort\": \"desc\"\n },\n \"legend\": {\n \"displayMode\": \"hidden\",\n \"placement\": \"bottom\",\n \"behaviour\": \"showItem\",\n \"selectMode\": \"single\"\n },\n \"standardOptions\": {\n \"util\": \"bytesIEC\",\n \"decimals\": 1\n },\n \"thresholds\": {\n \"mode\": \"absolute\",\n \"steps\": [\n {\n \"color\": \"rgb(44, 157, 61)\",\n \"value\": null,\n \"type\": \"base\"\n }\n ]\n },\n \"thresholdsStyle\": {\n \"mode\": \"dashed\"\n }\n },\n \"custom\": {\n \"drawStyle\": \"lines\",\n \"lineInterpolation\": \"smooth\",\n \"spanNulls\": false,\n \"lineWidth\": 2,\n \"fillOpacity\": 0.3,\n \"gradientMode\": \"opacity\",\n \"stack\": \"off\",\n \"scaleDistribution\": {\n \"type\": \"linear\"\n },\n \"showPoints\": \"none\",\n \"pointSize\": 5\n },\n \"overrides\": [\n {\n \"matcher\": {\n \"id\": \"byFrameRefID\"\n },\n \"properties\": {\n \"rightYAxisDisplay\": \"off\"\n }\n }\n ]\n },\n {\n \"type\": \"timeseries\",\n \"id\": \"86a68ff6-238c-4fc9-b77e-3b964e564500\",\n \"layout\": {\n \"h\": 7,\n \"i\": \"86a68ff6-238c-4fc9-b77e-3b964e564500\",\n \"w\": 6,\n \"x\": 6,\n \"y\": 15\n },\n \"version\": \"3.1.0\",\n \"datasourceCate\": \"prometheus\",\n \"datasourceValue\": \"${prom}\",\n \"targets\": [\n {\n \"expr\": \"jvm_memory_pool_max_bytes{pool=~\\\"Survivor Space|PS Survivor Space|G1 Survivor Space\\\", job=\\\"$job\\\",instance=\\\"$instance\\\"}\",\n \"legend\": \"Max {{pool}}\",\n \"refId\": \"A\",\n \"maxDataPoints\": 240\n },\n {\n \"expr\": \"jvm_memory_pool_bytes_used{pool=~\\\"Survivor Space|PS Survivor Space|G1 Survivor Space\\\", job=\\\"$job\\\",instance=\\\"$instance\\\"}\",\n \"legend\": \"Used {{pool}}\",\n \"refId\": \"B\",\n \"maxDataPoints\": 240\n },\n {\n \"expr\": \"jvm_memory_pool_bytes_committed{pool=~\\\"Survivor Space|PS Survivor Space|G1 Survivor Space\\\", job=\\\"$job\\\",instance=\\\"$instance\\\"}\",\n \"legend\": \"Committed {{pool}}\",\n \"refId\": \"C\",\n \"maxDataPoints\": 240\n }\n ],\n \"name\": \"Survivor Space\",\n \"maxPerRow\": 4,\n \"options\": {\n \"tooltip\": {\n \"mode\": \"all\",\n \"sort\": \"desc\"\n },\n \"legend\": {\n \"displayMode\": \"hidden\",\n \"placement\": \"bottom\",\n \"behaviour\": \"showItem\",\n \"selectMode\": \"single\"\n },\n \"standardOptions\": {\n \"util\": \"bytesIEC\",\n \"decimals\": 1\n },\n \"thresholds\": {\n \"mode\": \"absolute\",\n \"steps\": [\n {\n \"color\": \"rgb(44, 157, 61)\",\n \"value\": null,\n \"type\": \"base\"\n }\n ]\n },\n \"thresholdsStyle\": {\n \"mode\": \"dashed\"\n }\n },\n \"custom\": {\n \"drawStyle\": \"lines\",\n \"lineInterpolation\": \"smooth\",\n \"spanNulls\": false,\n \"lineWidth\": 2,\n \"fillOpacity\": 0.3,\n \"gradientMode\": \"opacity\",\n \"stack\": \"off\",\n \"scaleDistribution\": {\n \"type\": \"linear\"\n },\n \"showPoints\": \"none\",\n \"pointSize\": 5\n },\n \"overrides\": [\n {\n \"matcher\": {\n \"id\": \"byFrameRefID\"\n },\n \"properties\": {\n \"rightYAxisDisplay\": \"off\"\n }\n }\n ]\n },\n {\n \"type\": \"timeseries\",\n \"id\": \"595af7d1-e53c-43b5-8f62-ddb9b3a4ffcb\",\n \"layout\": {\n \"h\": 7,\n \"i\": \"595af7d1-e53c-43b5-8f62-ddb9b3a4ffcb\",\n \"w\": 6,\n \"x\": 12,\n \"y\": 15\n },\n \"version\": \"3.1.0\",\n \"datasourceCate\": \"prometheus\",\n \"datasourceValue\": \"${prom}\",\n \"targets\": [\n {\n \"expr\": \"jvm_memory_pool_max_bytes{pool=~\\\"PS Old Gen|G1 Old Gen|Tenured Gen\\\", job=\\\"$job\\\",instance=\\\"$instance\\\"}\",\n \"legend\": \"Max {{pool}}\",\n \"refId\": \"A\",\n \"maxDataPoints\": 240\n },\n {\n \"expr\": \"jvm_memory_pool_bytes_used{pool=~\\\"PS Old Gen|G1 Old Gen|Tenured Gen\\\", job=\\\"$job\\\",instance=\\\"$instance\\\"}\",\n \"legend\": \"Used {{pool}}\",\n \"refId\": \"B\",\n \"maxDataPoints\": 240\n },\n {\n \"expr\": \"jvm_memory_pool_bytes_committed{pool=~\\\"PS Old Gen|G1 Old Gen|Tenured Gen\\\", job=\\\"$job\\\",instance=\\\"$instance\\\"}\",\n \"legend\": \"Committed {{pool}}\",\n \"refId\": \"C\",\n \"maxDataPoints\": 240\n }\n ],\n \"name\": \"Old Gen\",\n \"maxPerRow\": 4,\n \"options\": {\n \"tooltip\": {\n \"mode\": \"all\",\n \"sort\": \"desc\"\n },\n \"legend\": {\n \"displayMode\": \"hidden\",\n \"placement\": \"bottom\",\n \"behaviour\": \"showItem\",\n \"selectMode\": \"single\"\n },\n \"standardOptions\": {\n \"util\": \"bytesIEC\",\n \"decimals\": 1\n },\n \"thresholds\": {\n \"mode\": \"absolute\",\n \"steps\": [\n {\n \"color\": \"rgb(44, 157, 61)\",\n \"value\": null,\n \"type\": \"base\"\n }\n ]\n },\n \"thresholdsStyle\": {\n \"mode\": \"dashed\"\n }\n },\n \"custom\": {\n \"drawStyle\": \"lines\",\n \"lineInterpolation\": \"smooth\",\n \"spanNulls\": false,\n \"lineWidth\": 2,\n \"fillOpacity\": 0.3,\n \"gradientMode\": \"opacity\",\n \"stack\": \"off\",\n \"scaleDistribution\": {\n \"type\": \"linear\"\n },\n \"showPoints\": \"none\",\n \"pointSize\": 5\n },\n \"overrides\": [\n {\n \"matcher\": {\n \"id\": \"byFrameRefID\"\n },\n \"properties\": {\n \"rightYAxisDisplay\": \"off\"\n }\n }\n ]\n },\n {\n \"type\": \"timeseries\",\n \"id\": \"380fdfcb-16a6-4131-abaa-a3911b7de6fa\",\n \"layout\": {\n \"h\": 7,\n \"i\": \"380fdfcb-16a6-4131-abaa-a3911b7de6fa\",\n \"w\": 6,\n \"x\": 18,\n \"y\": 15\n },\n \"version\": \"3.1.0\",\n \"datasourceCate\": \"prometheus\",\n \"datasourceValue\": \"${prom}\",\n \"targets\": [\n {\n \"expr\": \"jvm_memory_pool_max_bytes{pool=\\\"Metaspace\\\", job=\\\"$job\\\",instance=\\\"$instance\\\"}\",\n \"legend\": \"Max\",\n \"refId\": \"A\",\n \"maxDataPoints\": 240\n },\n {\n \"expr\": \"jvm_memory_pool_bytes_used{pool=\\\"Metaspace\\\", job=\\\"$job\\\",instance=\\\"$instance\\\"}\",\n \"legend\": \"Used\",\n \"refId\": \"B\",\n \"maxDataPoints\": 240\n },\n {\n \"expr\": \"jvm_memory_pool_bytes_committed{pool=\\\"Metaspace\\\", job=\\\"$job\\\",instance=\\\"$instance\\\"}\",\n \"legend\": \"Committed\",\n \"refId\": \"C\",\n \"maxDataPoints\": 240\n }\n ],\n \"transformations\": [\n {\n \"id\": \"organize\",\n \"options\": {}\n }\n ],\n \"name\": \"Metaspace\",\n \"maxPerRow\": 4,\n \"options\": {\n \"tooltip\": {\n \"mode\": \"all\",\n \"sort\": \"desc\"\n },\n \"legend\": {\n \"displayMode\": \"hidden\",\n \"placement\": \"bottom\",\n \"behaviour\": \"showItem\",\n \"selectMode\": \"single\"\n },\n \"standardOptions\": {\n \"util\": \"bytesIEC\",\n \"decimals\": 1\n },\n \"thresholds\": {\n \"mode\": \"absolute\",\n \"steps\": [\n {\n \"color\": \"rgb(44, 157, 61)\",\n \"value\": null,\n \"type\": \"base\"\n }\n ]\n },\n \"thresholdsStyle\": {\n \"mode\": \"dashed\"\n }\n },\n \"custom\": {\n \"drawStyle\": \"lines\",\n \"lineInterpolation\": \"smooth\",\n \"spanNulls\": false,\n \"lineWidth\": 2,\n \"fillOpacity\": 0.3,\n \"gradientMode\": \"opacity\",\n \"stack\": \"off\",\n \"scaleDistribution\": {\n \"type\": \"linear\"\n },\n \"showPoints\": \"none\",\n \"pointSize\": 5\n },\n \"overrides\": [\n {\n \"matcher\": {\n \"id\": \"byFrameRefID\"\n },\n \"properties\": {\n \"rightYAxisDisplay\": \"off\"\n }\n }\n ]\n },\n {\n \"collapsed\": true,\n \"id\": \"0aaf3516-4938-41e3-b7cb-323de6de75d9\",\n \"layout\": {\n \"h\": 1,\n \"i\": \"0aaf3516-4938-41e3-b7cb-323de6de75d9\",\n \"w\": 24,\n \"x\": 0,\n \"y\": 22\n },\n \"name\": \"GC\",\n \"type\": \"row\"\n },\n {\n \"custom\": {\n \"drawStyle\": \"lines\",\n \"fillOpacity\": 0.3,\n \"gradientMode\": \"opacity\",\n \"lineInterpolation\": \"smooth\",\n \"lineWidth\": 2,\n \"stack\": \"off\"\n },\n \"datasourceCate\": \"prometheus\",\n \"datasourceValue\": \"${prom}\",\n \"id\": \"5303bda0-47c2-4aca-bb12-1da512500f4a\",\n \"layout\": {\n \"h\": 7,\n \"i\": \"5303bda0-47c2-4aca-bb12-1da512500f4a\",\n \"w\": 8,\n \"x\": 0,\n \"y\": 23\n },\n \"name\": \"过去一分钟GC耗时(秒)\",\n \"options\": {\n \"legend\": {\n \"displayMode\": \"hidden\"\n },\n \"standardOptions\": {\n \"util\": \"none\"\n },\n \"thresholds\": {},\n \"tooltip\": {\n \"mode\": \"all\",\n \"sort\": \"desc\"\n }\n },\n \"targets\": [\n {\n \"expr\": \"increase(jvm_gc_collection_seconds_sum{job=\\\"$job\\\",instance=~\\\"$instance\\\"}[1m])\",\n \"refId\": \"A\"\n }\n ],\n \"type\": \"timeseries\",\n \"version\": \"2.0.0\"\n },\n {\n \"custom\": {\n \"drawStyle\": \"lines\",\n \"fillOpacity\": 0.3,\n \"gradientMode\": \"opacity\",\n \"lineInterpolation\": \"smooth\",\n \"lineWidth\": 2,\n \"stack\": \"off\"\n },\n \"datasourceCate\": \"prometheus\",\n \"datasourceValue\": \"${prom}\",\n \"id\": \"cf410459-b5df-4aca-a410-ecda091d6097\",\n \"layout\": {\n \"h\": 7,\n \"i\": \"cf410459-b5df-4aca-a410-ecda091d6097\",\n \"w\": 8,\n \"x\": 8,\n \"y\": 23\n },\n \"name\": \"过去一分钟GC次数\",\n \"options\": {\n \"legend\": {\n \"displayMode\": \"hidden\"\n },\n \"standardOptions\": {\n \"util\": \"none\"\n },\n \"thresholds\": {},\n \"tooltip\": {\n \"mode\": \"all\",\n \"sort\": \"desc\"\n }\n },\n \"targets\": [\n {\n \"expr\": \"increase(jvm_gc_collection_seconds_count{job=\\\"$job\\\",instance=\\\"$instance\\\"}[1m])\",\n \"legend\": \"\",\n \"refId\": \"A\"\n }\n ],\n \"type\": \"timeseries\",\n \"version\": \"2.0.0\"\n },\n {\n \"custom\": {\n \"drawStyle\": \"bars\",\n \"fillOpacity\": 0.3,\n \"gradientMode\": \"opacity\",\n \"lineWidth\": 2,\n \"stack\": \"off\"\n },\n \"datasourceCate\": \"prometheus\",\n \"datasourceValue\": \"${prom}\",\n \"id\": \"30feb928-b7c3-4e71-aeeb-cc10994b313c\",\n \"layout\": {\n \"h\": 7,\n \"i\": \"30feb928-b7c3-4e71-aeeb-cc10994b313c\",\n \"w\": 8,\n \"x\": 16,\n \"y\": 23\n },\n \"name\": \"过去一分钟每次GC平均耗时(秒)\",\n \"options\": {\n \"legend\": {\n \"displayMode\": \"hidden\"\n },\n \"standardOptions\": {\n \"util\": \"none\"\n },\n \"thresholds\": {},\n \"tooltip\": {\n \"mode\": \"all\",\n \"sort\": \"desc\"\n }\n },\n \"targets\": [\n {\n \"expr\": \"increase(jvm_gc_collection_seconds_sum{job=\\\"$job\\\",instance=\\\"$instance\\\"}[1m])/increase(jvm_gc_collection_seconds_count{job=\\\"$job\\\",instance=\\\"$instance\\\"}[1m])\",\n \"legend\": \"\",\n \"refId\": \"A\"\n }\n ],\n \"type\": \"timeseries\",\n \"version\": \"2.0.0\"\n },\n {\n \"collapsed\": true,\n \"id\": \"fd6d0772-40d7-4211-b9bb-601e35fb6431\",\n \"layout\": {\n \"h\": 1,\n \"i\": \"fd6d0772-40d7-4211-b9bb-601e35fb6431\",\n \"w\": 24,\n \"x\": 0,\n \"y\": 30\n },\n \"name\": \"Threads and Class loading\",\n \"type\": \"row\"\n },\n {\n \"custom\": {\n \"drawStyle\": \"lines\",\n \"fillOpacity\": 0.3,\n \"gradientMode\": \"opacity\",\n \"lineInterpolation\": \"smooth\",\n \"lineWidth\": 2,\n \"stack\": \"off\"\n },\n \"datasourceCate\": \"prometheus\",\n \"datasourceValue\": \"${prom}\",\n \"id\": \"65c74a2b-5f01-4491-b45a-dffe4a9b678a\",\n \"layout\": {\n \"h\": 7,\n \"i\": \"65c74a2b-5f01-4491-b45a-dffe4a9b678a\",\n \"w\": 12,\n \"x\": 0,\n \"y\": 31\n },\n \"name\": \"Threads\",\n \"options\": {\n \"legend\": {\n \"displayMode\": \"hidden\"\n },\n \"standardOptions\": {},\n \"thresholds\": {},\n \"tooltip\": {\n \"mode\": \"all\",\n \"sort\": \"desc\"\n }\n },\n \"targets\": [\n {\n \"expr\": \"jvm_threads_current{job=\\\"$job\\\",instance=\\\"$instance\\\"}\",\n \"legend\": \"current\",\n \"refId\": \"A\"\n },\n {\n \"expr\": \"jvm_threads_daemon{job=\\\"$job\\\",instance=\\\"$instance\\\"}\",\n \"legend\": \"daemon\",\n \"refId\": \"B\"\n },\n {\n \"expr\": \"jvm_threads_deadlocked{job=\\\"$job\\\",instance=\\\"$instance\\\"}\",\n \"legend\": \"deadlocked\",\n \"refId\": \"C\"\n }\n ],\n \"type\": \"timeseries\",\n \"version\": \"2.0.0\"\n },\n {\n \"type\": \"timeseries\",\n \"id\": \"2da16907-adf7-4561-9338-4254c89a311b\",\n \"layout\": {\n \"h\": 7,\n \"i\": \"2da16907-adf7-4561-9338-4254c89a311b\",\n \"w\": 12,\n \"x\": 12,\n \"y\": 31\n },\n \"version\": \"3.1.0\",\n \"datasourceCate\": \"prometheus\",\n \"datasourceValue\": \"${prom}\",\n \"targets\": [\n {\n \"expr\": \"jvm_classes_loaded_total{job=\\\"$job\\\", instance=\\\"$instance\\\"}\",\n \"refId\": \"A\",\n \"maxDataPoints\": 240\n }\n ],\n \"transformations\": [\n {\n \"id\": \"organize\",\n \"options\": {}\n }\n ],\n \"name\": \"Class loading\",\n \"maxPerRow\": 4,\n \"options\": {\n \"tooltip\": {\n \"mode\": \"all\",\n \"sort\": \"none\"\n },\n \"legend\": {\n \"displayMode\": \"hidden\",\n \"placement\": \"bottom\",\n \"behaviour\": \"showItem\",\n \"selectMode\": \"single\"\n },\n \"standardOptions\": {},\n \"thresholds\": {\n \"mode\": \"absolute\",\n \"steps\": [\n {\n \"color\": \"rgb(44, 157, 61)\",\n \"value\": null,\n \"type\": \"base\"\n }\n ]\n },\n \"thresholdsStyle\": {\n \"mode\": \"dashed\"\n }\n },\n \"custom\": {\n \"drawStyle\": \"lines\",\n \"lineInterpolation\": \"smooth\",\n \"spanNulls\": false,\n \"lineWidth\": 2,\n \"fillOpacity\": 0.3,\n \"gradientMode\": \"opacity\",\n \"stack\": \"off\",\n \"scaleDistribution\": {\n \"type\": \"linear\"\n },\n \"showPoints\": \"none\",\n \"pointSize\": 5\n },\n \"overrides\": [\n {\n \"matcher\": {\n \"id\": \"byFrameRefID\"\n },\n \"properties\": {\n \"rightYAxisDisplay\": \"off\"\n }\n }\n ]\n },\n {\n \"collapsed\": true,\n \"id\": \"12fe119e-54f0-4219-9846-ac982c1e9b4d\",\n \"layout\": {\n \"h\": 1,\n \"i\": \"12fe119e-54f0-4219-9846-ac982c1e9b4d\",\n \"w\": 24,\n \"x\": 0,\n \"y\": 38\n },\n \"name\": \"Physical memory\",\n \"type\": \"row\"\n },\n {\n \"custom\": {\n \"drawStyle\": \"lines\",\n \"fillOpacity\": 0.3,\n \"gradientMode\": \"opacity\",\n \"lineInterpolation\": \"smooth\",\n \"lineWidth\": 2,\n \"stack\": \"off\"\n },\n \"datasourceCate\": \"prometheus\",\n \"datasourceValue\": \"${prom}\",\n \"id\": \"5a859147-edfc-4dac-9457-8a928213bc00\",\n \"layout\": {\n \"h\": 7,\n \"i\": \"5a859147-edfc-4dac-9457-8a928213bc00\",\n \"w\": 24,\n \"x\": 0,\n \"y\": 39\n },\n \"name\": \"Physical memory\",\n \"options\": {\n \"legend\": {\n \"displayMode\": \"hidden\"\n },\n \"standardOptions\": {\n \"decimals\": 1,\n \"util\": \"bytesIEC\"\n },\n \"thresholds\": {},\n \"tooltip\": {\n \"mode\": \"all\",\n \"sort\": \"desc\"\n }\n },\n \"targets\": [\n {\n \"expr\": \"os_total_physical_memory_bytes{job=\\\"$job\\\",instance=\\\"$instance\\\"}\",\n \"legend\": \"Total physical memory\",\n \"refId\": \"A\"\n },\n {\n \"expr\": \"os_committed_virtual_memory_bytes{job=\\\"$job\\\",instance=\\\"$instance\\\"}\",\n \"legend\": \"Committed virtual memory\",\n \"refId\": \"B\"\n },\n {\n \"expr\": \"os_free_physical_memory_bytes{job=\\\"$job\\\",instance=\\\"$instance\\\"}\",\n \"legend\": \"Free physical memory\",\n \"refId\": \"C\"\n }\n ],\n \"type\": \"timeseries\",\n \"version\": \"2.0.0\"\n }\n ],\n \"var\": [\n {\n \"definition\": \"prometheus\",\n \"name\": \"prom\",\n \"type\": \"datasource\"\n },\n {\n \"name\": \"job\",\n \"type\": \"query\",\n \"hide\": false,\n \"datasource\": {\n \"cate\": \"prometheus\",\n \"value\": \"${prom}\"\n },\n \"definition\": \"label_values(jmx_exporter_build_info,job)\"\n },\n {\n \"name\": \"instance\",\n \"type\": \"query\",\n \"hide\": false,\n \"datasource\": {\n \"cate\": \"prometheus\",\n \"value\": \"${prom}\"\n },\n \"definition\": \"label_values(jmx_exporter_build_info{job=\\\"$job\\\"},instance)\"\n }\n ],\n \"version\": \"3.0.0\"\n }\n}"
},
{
"path": "integrations/Java/dashboards/jmx_by_kubernetes.json",
"content": "{\n \"name\": \"JMX - Kubernetes\",\n \"tags\": \"Prometheus JMX Kubernetes\",\n \"configs\": {\n \"panels\": [\n {\n \"collapsed\": true,\n \"id\": \"a26c5c3d-7b60-4746-bd1f-ca95581cf2fd\",\n \"layout\": {\n \"h\": 1,\n \"i\": \"a26c5c3d-7b60-4746-bd1f-ca95581cf2fd\",\n \"w\": 24,\n \"x\": 0,\n \"y\": 0\n },\n \"name\": \"Basic Info\",\n \"type\": \"row\"\n },\n {\n \"custom\": {\n \"calc\": \"lastNotNull\",\n \"colSpan\": 1,\n \"colorMode\": \"value\",\n \"graphMode\": \"none\",\n \"orientation\": \"auto\",\n \"textMode\": \"value\",\n \"textSize\": {},\n \"valueField\": \"Value\"\n },\n \"datasourceCate\": \"prometheus\",\n \"datasourceValue\": \"${prom}\",\n \"id\": \"0721ee76-816b-469f-9c49-2bef94a9299e\",\n \"layout\": {\n \"h\": 3,\n \"i\": \"0721ee76-816b-469f-9c49-2bef94a9299e\",\n \"w\": 6,\n \"x\": 0,\n \"y\": 1\n },\n \"maxPerRow\": 4,\n \"name\": \"Status\",\n \"options\": {\n \"standardOptions\": {},\n \"thresholds\": {\n \"steps\": [\n {\n \"color\": \"rgb(44, 157, 61)\",\n \"type\": \"base\",\n \"value\": null\n }\n ]\n },\n \"valueMappings\": [\n {\n \"match\": {\n \"special\": 1\n },\n \"result\": {\n \"color\": \"#1eac02\",\n \"text\": \"UP\"\n },\n \"type\": \"special\"\n },\n {\n \"match\": {\n \"special\": 0\n },\n \"result\": {\n \"color\": \"#f00a0a\",\n \"text\": \"DOWN\"\n },\n \"type\": \"special\"\n }\n ]\n },\n \"overrides\": [\n {\n \"matcher\": {\n \"id\": \"byFrameRefID\"\n },\n \"properties\": {\n \"thresholds\": {\n \"steps\": [\n {\n \"color\": \"#6C53B1\",\n \"type\": \"base\",\n \"value\": null\n }\n ]\n }\n }\n }\n ],\n \"targets\": [\n {\n \"expr\": \"up{namespace=\\\"$namespace\\\", container=\\\"$service\\\", pod=\\\"$pod\\\"}\",\n \"maxDataPoints\": 240,\n \"refId\": \"A\"\n }\n ],\n \"transformations\": [\n {\n \"id\": \"organize\",\n \"options\": {}\n }\n ],\n \"type\": \"stat\",\n \"version\": \"3.1.0\"\n },\n {\n \"custom\": {\n \"calc\": \"lastNotNull\",\n \"colSpan\": 1,\n \"colorMode\": \"value\",\n \"graphMode\": \"none\",\n \"orientation\": \"auto\",\n \"textMode\": \"value\",\n \"textSize\": {},\n \"valueField\": \"Value\"\n },\n \"datasourceCate\": \"prometheus\",\n \"datasourceValue\": \"${prom}\",\n \"id\": \"a55c40fc-dc25-4d2a-8e99-928e02c5ff5d\",\n \"layout\": {\n \"h\": 3,\n \"i\": \"a55c40fc-dc25-4d2a-8e99-928e02c5ff5d\",\n \"w\": 6,\n \"x\": 6,\n \"y\": 1\n },\n \"maxPerRow\": 4,\n \"name\": \"Uptime\",\n \"options\": {\n \"standardOptions\": {\n \"util\": \"humantimeSeconds\"\n },\n \"thresholds\": {\n \"steps\": [\n {\n \"color\": \"rgb(44, 157, 61)\",\n \"type\": \"base\",\n \"value\": null\n }\n ]\n }\n },\n \"overrides\": [\n {\n \"matcher\": {\n \"id\": \"byFrameRefID\"\n },\n \"properties\": {\n \"thresholds\": {\n \"steps\": [\n {\n \"color\": \"#6C53B1\",\n \"type\": \"base\",\n \"value\": null\n }\n ]\n }\n }\n }\n ],\n \"targets\": [\n {\n \"expr\": \"time() - process_start_time_seconds{namespace=\\\"$namespace\\\", container=\\\"$service\\\", pod=\\\"$pod\\\"}\",\n \"maxDataPoints\": 240,\n \"refId\": \"A\"\n }\n ],\n \"transformations\": [\n {\n \"id\": \"organize\",\n \"options\": {}\n }\n ],\n \"type\": \"stat\",\n \"version\": \"3.1.0\"\n },\n {\n \"custom\": {\n \"calc\": \"lastNotNull\",\n \"colSpan\": 1,\n \"colorMode\": \"value\",\n \"graphMode\": \"none\",\n \"orientation\": \"auto\",\n \"textMode\": \"value\",\n \"textSize\": {},\n \"valueField\": \"Value\"\n },\n \"datasourceCate\": \"prometheus\",\n \"datasourceValue\": \"${prom}\",\n \"id\": \"60c3389c-808d-4412-b74b-cb762e89a8ad\",\n \"layout\": {\n \"h\": 3,\n \"i\": \"60c3389c-808d-4412-b74b-cb762e89a8ad\",\n \"w\": 6,\n \"x\": 12,\n \"y\": 1\n },\n \"maxPerRow\": 4,\n \"name\": \"Container CPU Limit\",\n \"options\": {\n \"standardOptions\": {},\n \"thresholds\": {\n \"steps\": [\n {\n \"color\": \"rgb(44, 157, 61)\",\n \"type\": \"base\",\n \"value\": null\n }\n ]\n }\n },\n \"overrides\": [\n {\n \"matcher\": {\n \"id\": \"byFrameRefID\"\n },\n \"properties\": {\n \"thresholds\": {\n \"steps\": [\n {\n \"color\": \"#6C53B1\",\n \"type\": \"base\",\n \"value\": null\n }\n ]\n }\n }\n }\n ],\n \"targets\": [\n {\n \"expr\": \"container_spec_cpu_quota{namespace=\\\"$namespace\\\", container=\\\"$service\\\", pod=\\\"$pod\\\"}/container_spec_cpu_period{namespace=\\\"$namespace\\\", container=\\\"$service\\\", pod=\\\"$pod\\\"}\",\n \"maxDataPoints\": 240,\n \"refId\": \"A\"\n }\n ],\n \"transformations\": [\n {\n \"id\": \"organize\",\n \"options\": {}\n }\n ],\n \"type\": \"stat\",\n \"version\": \"3.1.0\"\n },\n {\n \"custom\": {\n \"calc\": \"lastNotNull\",\n \"colSpan\": 1,\n \"colorMode\": \"value\",\n \"graphMode\": \"none\",\n \"orientation\": \"auto\",\n \"textMode\": \"value\",\n \"textSize\": {},\n \"valueField\": \"Value\"\n },\n \"datasourceCate\": \"prometheus\",\n \"datasourceValue\": \"${prom}\",\n \"id\": \"1c9a8cca-3578-485e-837d-21618d383065\",\n \"layout\": {\n \"h\": 3,\n \"i\": \"1c9a8cca-3578-485e-837d-21618d383065\",\n \"w\": 6,\n \"x\": 18,\n \"y\": 1\n },\n \"maxPerRow\": 4,\n \"name\": \"Container Open File Descriptors\",\n \"options\": {\n \"standardOptions\": {},\n \"thresholds\": {\n \"steps\": [\n {\n \"color\": \"rgb(44, 157, 61)\",\n \"type\": \"base\",\n \"value\": null\n }\n ]\n }\n },\n \"overrides\": [\n {\n \"matcher\": {\n \"id\": \"byFrameRefID\"\n },\n \"properties\": {\n \"thresholds\": {\n \"steps\": [\n {\n \"color\": \"#6C53B1\",\n \"type\": \"base\",\n \"value\": null\n }\n ]\n }\n }\n }\n ],\n \"targets\": [\n {\n \"expr\": \"container_file_descriptors{namespace=\\\"$namespace\\\", container=\\\"$service\\\", pod=\\\"$pod\\\"}\",\n \"maxDataPoints\": 240,\n \"refId\": \"A\"\n }\n ],\n \"transformations\": [\n {\n \"id\": \"organize\",\n \"options\": {}\n }\n ],\n \"type\": \"stat\",\n \"version\": \"3.1.0\"\n },\n {\n \"collapsed\": true,\n \"id\": \"705c90e0-e8b6-4f1c-b35c-c8a785009a20\",\n \"layout\": {\n \"h\": 1,\n \"i\": \"705c90e0-e8b6-4f1c-b35c-c8a785009a20\",\n \"w\": 24,\n \"x\": 0,\n \"y\": 4\n },\n \"name\": \"JVM Memory\",\n \"type\": \"row\"\n },\n {\n \"custom\": {\n \"drawStyle\": \"lines\",\n \"fillOpacity\": 0.3,\n \"gradientMode\": \"opacity\",\n \"lineInterpolation\": \"smooth\",\n \"lineWidth\": 2,\n \"pointSize\": 5,\n \"scaleDistribution\": {\n \"type\": \"linear\"\n },\n \"showPoints\": \"none\",\n \"spanNulls\": false,\n \"stack\": \"off\"\n },\n \"datasourceCate\": \"prometheus\",\n \"datasourceValue\": \"${prom}\",\n \"id\": \"5455e2f2-f6bb-4888-9d88-240d7e12cce2\",\n \"layout\": {\n \"h\": 7,\n \"i\": \"5455e2f2-f6bb-4888-9d88-240d7e12cce2\",\n \"w\": 12,\n \"x\": 0,\n \"y\": 5\n },\n \"maxPerRow\": 4,\n \"name\": \"JVM Memory(heap)\",\n \"options\": {\n \"legend\": {\n \"behaviour\": \"showItem\",\n \"displayMode\": \"hidden\",\n \"placement\": \"bottom\",\n \"selectMode\": \"single\"\n },\n \"standardOptions\": {\n \"decimals\": 1,\n \"util\": \"bytesIEC\"\n },\n \"thresholds\": {\n \"mode\": \"absolute\",\n \"steps\": [\n {\n \"color\": \"rgb(44, 157, 61)\",\n \"type\": \"base\",\n \"value\": null\n }\n ]\n },\n \"thresholdsStyle\": {\n \"mode\": \"dashed\"\n },\n \"tooltip\": {\n \"mode\": \"all\",\n \"sort\": \"desc\"\n }\n },\n \"overrides\": [\n {\n \"matcher\": {\n \"id\": \"byFrameRefID\"\n },\n \"properties\": {\n \"rightYAxisDisplay\": \"off\"\n }\n }\n ],\n \"targets\": [\n {\n \"expr\": \"jvm_memory_used_bytes{namespace=\\\"$namespace\\\", container=\\\"$service\\\", pod=\\\"$pod\\\"}\",\n \"legend\": \"Used\",\n \"maxDataPoints\": 240,\n \"refId\": \"A\"\n },\n {\n \"expr\": \"jvm_memory_bytes_max{area=\\\"heap\\\",job=\\\"$job\\\",instance=\\\"$instance\\\"}\",\n \"legend\": \"Max\",\n \"maxDataPoints\": 240,\n \"refId\": \"B\"\n }\n ],\n \"transformations\": [\n {\n \"id\": \"organize\",\n \"options\": {}\n }\n ],\n \"type\": \"timeseries\",\n \"version\": \"3.1.0\"\n },\n {\n \"custom\": {\n \"drawStyle\": \"lines\",\n \"fillOpacity\": 0.3,\n \"gradientMode\": \"opacity\",\n \"lineInterpolation\": \"smooth\",\n \"lineWidth\": 2,\n \"pointSize\": 5,\n \"scaleDistribution\": {\n \"type\": \"linear\"\n },\n \"showPoints\": \"none\",\n \"spanNulls\": false,\n \"stack\": \"off\"\n },\n \"datasourceCate\": \"prometheus\",\n \"datasourceValue\": \"${prom}\",\n \"id\": \"765b22a9-1ddc-4c08-8758-684e3c13252b\",\n \"layout\": {\n \"h\": 7,\n \"i\": \"765b22a9-1ddc-4c08-8758-684e3c13252b\",\n \"w\": 12,\n \"x\": 12,\n \"y\": 5\n },\n \"maxPerRow\": 4,\n \"name\": \"JVM Memory(nonheap)\",\n \"options\": {\n \"legend\": {\n \"behaviour\": \"showItem\",\n \"displayMode\": \"hidden\",\n \"placement\": \"bottom\",\n \"selectMode\": \"single\"\n },\n \"standardOptions\": {\n \"decimals\": 1,\n \"util\": \"bytesIEC\"\n },\n \"thresholds\": {\n \"mode\": \"absolute\",\n \"steps\": [\n {\n \"color\": \"rgb(44, 157, 61)\",\n \"type\": \"base\",\n \"value\": null\n }\n ]\n },\n \"thresholdsStyle\": {\n \"mode\": \"dashed\"\n },\n \"tooltip\": {\n \"mode\": \"all\",\n \"sort\": \"desc\"\n }\n },\n \"overrides\": [\n {\n \"matcher\": {\n \"id\": \"byFrameRefID\"\n },\n \"properties\": {\n \"rightYAxisDisplay\": \"off\"\n }\n }\n ],\n \"targets\": [\n {\n \"expr\": \"jvm_memory_used_bytes{namespace=\\\"$namespace\\\", container=\\\"$service\\\", pod=\\\"$pod\\\"}\",\n \"legend\": \"Used\",\n \"maxDataPoints\": 240,\n \"refId\": \"A\"\n },\n {\n \"expr\": \"jvm_memory_bytes_max{area=\\\"nonheap\\\",job=\\\"$job\\\",instance=\\\"$instance\\\"}\",\n \"legend\": \"Max\",\n \"maxDataPoints\": 240,\n \"refId\": \"B\"\n }\n ],\n \"transformations\": [\n {\n \"id\": \"organize\",\n \"options\": {}\n }\n ],\n \"type\": \"timeseries\",\n \"version\": \"3.1.0\"\n },\n {\n \"collapsed\": true,\n \"id\": \"c43aa6f5-7252-400f-bb9f-8c96e436151c\",\n \"layout\": {\n \"h\": 1,\n \"i\": \"c43aa6f5-7252-400f-bb9f-8c96e436151c\",\n \"w\": 24,\n \"x\": 0,\n \"y\": 12\n },\n \"name\": \"Memory Pool\",\n \"type\": \"row\"\n },\n {\n \"custom\": {\n \"drawStyle\": \"lines\",\n \"fillOpacity\": 0.3,\n \"gradientMode\": \"opacity\",\n \"lineInterpolation\": \"smooth\",\n \"lineWidth\": 2,\n \"pointSize\": 5,\n \"scaleDistribution\": {\n \"type\": \"linear\"\n },\n \"showPoints\": \"none\",\n \"spanNulls\": false,\n \"stack\": \"off\"\n },\n \"datasourceCate\": \"prometheus\",\n \"datasourceValue\": \"${prom}\",\n \"id\": \"5ab2434c-a905-43c1-a563-4cee2dc9dce9\",\n \"layout\": {\n \"h\": 7,\n \"i\": \"5ab2434c-a905-43c1-a563-4cee2dc9dce9\",\n \"w\": 6,\n \"x\": 0,\n \"y\": 13\n },\n \"maxPerRow\": 4,\n \"name\": \"CodeHeap 'non-nmethods'\",\n \"options\": {\n \"legend\": {\n \"behaviour\": \"showItem\",\n \"displayMode\": \"hidden\",\n \"placement\": \"bottom\",\n \"selectMode\": \"single\"\n },\n \"standardOptions\": {\n \"decimals\": 1,\n \"util\": \"bytesIEC\"\n },\n \"thresholds\": {\n \"mode\": \"absolute\",\n \"steps\": [\n {\n \"color\": \"rgb(44, 157, 61)\",\n \"type\": \"base\",\n \"value\": null\n }\n ]\n },\n \"thresholdsStyle\": {\n \"mode\": \"dashed\"\n },\n \"tooltip\": {\n \"mode\": \"all\",\n \"sort\": \"desc\"\n }\n },\n \"overrides\": [\n {\n \"matcher\": {\n \"id\": \"byFrameRefID\"\n },\n \"properties\": {\n \"rightYAxisDisplay\": \"off\"\n }\n }\n ],\n \"targets\": [\n {\n \"expr\": \"jvm_memory_pool_max_bytes{pool=\\\"CodeHeap 'non-nmethods'\\\", namespace=\\\"$namespace\\\", container=\\\"$service\\\", pod=\\\"$pod\\\"}\",\n \"legend\": \"Max\",\n \"maxDataPoints\": 240,\n \"refId\": \"A\"\n },\n {\n \"expr\": \"jvm_memory_pool_bytes_used{pool=\\\"CodeHeap 'non-nmethods'\\\", namespace=\\\"$namespace\\\", container=\\\"$service\\\", pod=\\\"$pod\\\"}\",\n \"legend\": \"Used\",\n \"maxDataPoints\": 240,\n \"refId\": \"B\"\n },\n {\n \"expr\": \"jvm_memory_pool_bytes_committed{pool=\\\"CodeHeap 'non-nmethods'\\\", namespace=\\\"$namespace\\\", container=\\\"$service\\\", pod=\\\"$pod\\\"}\",\n \"legend\": \"Committed\",\n \"maxDataPoints\": 240,\n \"refId\": \"C\"\n }\n ],\n \"transformations\": [\n {\n \"id\": \"organize\",\n \"options\": {}\n }\n ],\n \"type\": \"timeseries\",\n \"version\": \"3.1.0\"\n },\n {\n \"custom\": {\n \"drawStyle\": \"lines\",\n \"fillOpacity\": 0.3,\n \"gradientMode\": \"opacity\",\n \"lineInterpolation\": \"smooth\",\n \"lineWidth\": 2,\n \"pointSize\": 5,\n \"scaleDistribution\": {\n \"type\": \"linear\"\n },\n \"showPoints\": \"none\",\n \"spanNulls\": false,\n \"stack\": \"off\"\n },\n \"datasourceCate\": \"prometheus\",\n \"datasourceValue\": \"${prom}\",\n \"id\": \"bfe16d07-91ff-44e6-87bc-9d5d93d2ebd6\",\n \"layout\": {\n \"h\": 7,\n \"i\": \"bfe16d07-91ff-44e6-87bc-9d5d93d2ebd6\",\n \"w\": 6,\n \"x\": 6,\n \"y\": 13\n },\n \"maxPerRow\": 4,\n \"name\": \"CodeHeap 'profiled nmethods'\",\n \"options\": {\n \"legend\": {\n \"behaviour\": \"showItem\",\n \"displayMode\": \"hidden\",\n \"placement\": \"bottom\",\n \"selectMode\": \"single\"\n },\n \"standardOptions\": {\n \"decimals\": 1,\n \"util\": \"bytesIEC\"\n },\n \"thresholds\": {\n \"mode\": \"absolute\",\n \"steps\": [\n {\n \"color\": \"rgb(44, 157, 61)\",\n \"type\": \"base\",\n \"value\": null\n }\n ]\n },\n \"thresholdsStyle\": {\n \"mode\": \"dashed\"\n },\n \"tooltip\": {\n \"mode\": \"all\",\n \"sort\": \"desc\"\n }\n },\n \"overrides\": [\n {\n \"matcher\": {\n \"id\": \"byFrameRefID\"\n },\n \"properties\": {\n \"rightYAxisDisplay\": \"off\"\n }\n }\n ],\n \"targets\": [\n {\n \"expr\": \"jvm_memory_pool_max_bytes{pool=\\\"CodeHeap 'profiled nmethods'\\\", namespace=\\\"$namespace\\\", container=\\\"$service\\\", pod=\\\"$pod\\\"}\",\n \"legend\": \"Max\",\n \"maxDataPoints\": 240,\n \"refId\": \"A\"\n },\n {\n \"expr\": \"jvm_memory_pool_bytes_used{pool=\\\"CodeHeap 'profiled nmethods'\\\", namespace=\\\"$namespace\\\", container=\\\"$service\\\", pod=\\\"$pod\\\"}\",\n \"legend\": \"Used\",\n \"maxDataPoints\": 240,\n \"refId\": \"B\"\n },\n {\n \"expr\": \"jvm_memory_pool_bytes_committed{pool=\\\"CodeHeap 'profiled nmethods'\\\", namespace=\\\"$namespace\\\", container=\\\"$service\\\", pod=\\\"$pod\\\"}\",\n \"legend\": \"Committed\",\n \"maxDataPoints\": 240,\n \"refId\": \"C\"\n }\n ],\n \"transformations\": [\n {\n \"id\": \"organize\",\n \"options\": {}\n }\n ],\n \"type\": \"timeseries\",\n \"version\": \"3.1.0\"\n },\n {\n \"custom\": {\n \"drawStyle\": \"lines\",\n \"fillOpacity\": 0.3,\n \"gradientMode\": \"opacity\",\n \"lineInterpolation\": \"smooth\",\n \"lineWidth\": 2,\n \"pointSize\": 5,\n \"scaleDistribution\": {\n \"type\": \"linear\"\n },\n \"showPoints\": \"none\",\n \"spanNulls\": false,\n \"stack\": \"off\"\n },\n \"datasourceCate\": \"prometheus\",\n \"datasourceValue\": \"${prom}\",\n \"id\": \"18d10f97-5ab2-41c4-a3ad-09f2c7a03e1a\",\n \"layout\": {\n \"h\": 7,\n \"i\": \"18d10f97-5ab2-41c4-a3ad-09f2c7a03e1a\",\n \"w\": 6,\n \"x\": 12,\n \"y\": 13\n },\n \"maxPerRow\": 4,\n \"name\": \"CodeHeap 'non-profiled nmethods'\",\n \"options\": {\n \"legend\": {\n \"behaviour\": \"showItem\",\n \"displayMode\": \"hidden\",\n \"placement\": \"bottom\",\n \"selectMode\": \"single\"\n },\n \"standardOptions\": {\n \"decimals\": 1,\n \"util\": \"bytesIEC\"\n },\n \"thresholds\": {\n \"mode\": \"absolute\",\n \"steps\": [\n {\n \"color\": \"rgb(44, 157, 61)\",\n \"type\": \"base\",\n \"value\": null\n }\n ]\n },\n \"thresholdsStyle\": {\n \"mode\": \"dashed\"\n },\n \"tooltip\": {\n \"mode\": \"all\",\n \"sort\": \"desc\"\n }\n },\n \"overrides\": [\n {\n \"matcher\": {\n \"id\": \"byFrameRefID\"\n },\n \"properties\": {\n \"rightYAxisDisplay\": \"off\"\n }\n }\n ],\n \"targets\": [\n {\n \"expr\": \"jvm_memory_pool_max_bytes{pool=\\\"CodeHeap 'non-profiled nmethods'\\\", namespace=\\\"$namespace\\\", container=\\\"$service\\\", pod=\\\"$pod\\\"}\",\n \"legend\": \"Max\",\n \"maxDataPoints\": 240,\n \"refId\": \"A\"\n },\n {\n \"expr\": \"jvm_memory_pool_bytes_used{pool=\\\"CodeHeap 'non-profiled nmethods'\\\", namespace=\\\"$namespace\\\", container=\\\"$service\\\", pod=\\\"$pod\\\"}\",\n \"legend\": \"Used\",\n \"maxDataPoints\": 240,\n \"refId\": \"B\"\n },\n {\n \"expr\": \"jvm_memory_pool_bytes_committed{pool=\\\"CodeHeap 'non-profiled nmethods'\\\", namespace=\\\"$namespace\\\", container=\\\"$service\\\", pod=\\\"$pod\\\"}\",\n \"legend\": \"Committed\",\n \"maxDataPoints\": 240,\n \"refId\": \"C\"\n }\n ],\n \"transformations\": [\n {\n \"id\": \"organize\",\n \"options\": {}\n }\n ],\n \"type\": \"timeseries\",\n \"version\": \"3.1.0\"\n },\n {\n \"custom\": {\n \"drawStyle\": \"lines\",\n \"fillOpacity\": 0.3,\n \"gradientMode\": \"opacity\",\n \"lineInterpolation\": \"smooth\",\n \"lineWidth\": 2,\n \"pointSize\": 5,\n \"scaleDistribution\": {\n \"type\": \"linear\"\n },\n \"showPoints\": \"none\",\n \"spanNulls\": false,\n \"stack\": \"off\"\n },\n \"datasourceCate\": \"prometheus\",\n \"datasourceValue\": \"${prom}\",\n \"id\": \"314a3893-c1d4-4f85-bce0-33ecfda2f521\",\n \"layout\": {\n \"h\": 7,\n \"i\": \"314a3893-c1d4-4f85-bce0-33ecfda2f521\",\n \"w\": 6,\n \"x\": 18,\n \"y\": 13\n },\n \"maxPerRow\": 4,\n \"name\": \"G1 Eden Space\",\n \"options\": {\n \"legend\": {\n \"behaviour\": \"showItem\",\n \"displayMode\": \"hidden\",\n \"placement\": \"bottom\",\n \"selectMode\": \"single\"\n },\n \"standardOptions\": {\n \"decimals\": 1,\n \"util\": \"bytesIEC\"\n },\n \"thresholds\": {\n \"mode\": \"absolute\",\n \"steps\": [\n {\n \"color\": \"rgb(44, 157, 61)\",\n \"type\": \"base\",\n \"value\": null\n }\n ]\n },\n \"thresholdsStyle\": {\n \"mode\": \"dashed\"\n },\n \"tooltip\": {\n \"mode\": \"all\",\n \"sort\": \"desc\"\n }\n },\n \"overrides\": [\n {\n \"matcher\": {\n \"id\": \"byFrameRefID\"\n },\n \"properties\": {\n \"rightYAxisDisplay\": \"off\"\n }\n }\n ],\n \"targets\": [\n {\n \"expr\": \"jvm_memory_pool_max_bytes{pool=\\\"G1 Eden Space\\\", namespace=\\\"$namespace\\\", container=\\\"$service\\\", pod=\\\"$pod\\\"}\",\n \"legend\": \"Max\",\n \"maxDataPoints\": 240,\n \"refId\": \"A\"\n },\n {\n \"expr\": \"jvm_memory_pool_bytes_used{pool=\\\"G1 Eden Space\\\", namespace=\\\"$namespace\\\", container=\\\"$service\\\", pod=\\\"$pod\\\"}\",\n \"legend\": \"Used\",\n \"maxDataPoints\": 240,\n \"refId\": \"B\"\n },\n {\n \"expr\": \"jvm_memory_pool_bytes_committed{pool=\\\"G1 Eden Space\\\", namespace=\\\"$namespace\\\", container=\\\"$service\\\", pod=\\\"$pod\\\"}\",\n \"legend\": \"Committed\",\n \"maxDataPoints\": 240,\n \"refId\": \"C\"\n }\n ],\n \"transformations\": [\n {\n \"id\": \"organize\",\n \"options\": {}\n }\n ],\n \"type\": \"timeseries\",\n \"version\": \"3.1.0\"\n },\n {\n \"custom\": {\n \"drawStyle\": \"lines\",\n \"fillOpacity\": 0.3,\n \"gradientMode\": \"opacity\",\n \"lineInterpolation\": \"smooth\",\n \"lineWidth\": 2,\n \"pointSize\": 5,\n \"scaleDistribution\": {\n \"type\": \"linear\"\n },\n \"showPoints\": \"none\",\n \"spanNulls\": false,\n \"stack\": \"off\"\n },\n \"datasourceCate\": \"prometheus\",\n \"datasourceValue\": \"${prom}\",\n \"id\": \"1e5f03e7-af5d-447b-9c1b-23d81915e8df\",\n \"layout\": {\n \"h\": 7,\n \"i\": \"1e5f03e7-af5d-447b-9c1b-23d81915e8df\",\n \"w\": 6,\n \"x\": 0,\n \"y\": 15\n },\n \"maxPerRow\": 4,\n \"name\": \"Compressed Class Space\",\n \"options\": {\n \"legend\": {\n \"behaviour\": \"showItem\",\n \"displayMode\": \"hidden\",\n \"placement\": \"bottom\",\n \"selectMode\": \"single\"\n },\n \"standardOptions\": {\n \"decimals\": 1,\n \"util\": \"bytesIEC\"\n },\n \"thresholds\": {\n \"mode\": \"absolute\",\n \"steps\": [\n {\n \"color\": \"rgb(44, 157, 61)\",\n \"type\": \"base\",\n \"value\": null\n }\n ]\n },\n \"thresholdsStyle\": {\n \"mode\": \"dashed\"\n },\n \"tooltip\": {\n \"mode\": \"all\",\n \"sort\": \"desc\"\n }\n },\n \"overrides\": [\n {\n \"matcher\": {\n \"id\": \"byFrameRefID\"\n },\n \"properties\": {\n \"rightYAxisDisplay\": \"off\"\n }\n }\n ],\n \"targets\": [\n {\n \"expr\": \"jvm_memory_pool_max_bytes{pool=\\\"Compressed Class Space\\\", namespace=\\\"$namespace\\\", container=\\\"$service\\\", pod=\\\"$pod\\\"}\",\n \"legend\": \"Max\",\n \"maxDataPoints\": 240,\n \"refId\": \"A\"\n },\n {\n \"expr\": \"jvm_memory_pool_bytes_used{pool=\\\"Compressed Class Space\\\", namespace=\\\"$namespace\\\", container=\\\"$service\\\", pod=\\\"$pod\\\"}\",\n \"legend\": \"Used\",\n \"maxDataPoints\": 240,\n \"refId\": \"B\"\n },\n {\n \"expr\": \"jvm_memory_pool_bytes_committed{pool=\\\"Compressed Class Space\\\", namespace=\\\"$namespace\\\", container=\\\"$service\\\", pod=\\\"$pod\\\"}\",\n \"legend\": \"Committed\",\n \"maxDataPoints\": 240,\n \"refId\": \"C\"\n }\n ],\n \"transformations\": [\n {\n \"id\": \"organize\",\n \"options\": {}\n }\n ],\n \"type\": \"timeseries\",\n \"version\": \"3.1.0\"\n },\n {\n \"custom\": {\n \"drawStyle\": \"lines\",\n \"fillOpacity\": 0.3,\n \"gradientMode\": \"opacity\",\n \"lineInterpolation\": \"smooth\",\n \"lineWidth\": 2,\n \"pointSize\": 5,\n \"scaleDistribution\": {\n \"type\": \"linear\"\n },\n \"showPoints\": \"none\",\n \"spanNulls\": false,\n \"stack\": \"off\"\n },\n \"datasourceCate\": \"prometheus\",\n \"datasourceValue\": \"${prom}\",\n \"id\": \"86a68ff6-238c-4fc9-b77e-3b964e564500\",\n \"layout\": {\n \"h\": 7,\n \"i\": \"86a68ff6-238c-4fc9-b77e-3b964e564500\",\n \"w\": 6,\n \"x\": 6,\n \"y\": 15\n },\n \"maxPerRow\": 4,\n \"name\": \"G1 Survivor Space\",\n \"options\": {\n \"legend\": {\n \"behaviour\": \"showItem\",\n \"displayMode\": \"hidden\",\n \"placement\": \"bottom\",\n \"selectMode\": \"single\"\n },\n \"standardOptions\": {\n \"decimals\": 1,\n \"util\": \"bytesIEC\"\n },\n \"thresholds\": {\n \"mode\": \"absolute\",\n \"steps\": [\n {\n \"color\": \"rgb(44, 157, 61)\",\n \"type\": \"base\",\n \"value\": null\n }\n ]\n },\n \"thresholdsStyle\": {\n \"mode\": \"dashed\"\n },\n \"tooltip\": {\n \"mode\": \"all\",\n \"sort\": \"desc\"\n }\n },\n \"overrides\": [\n {\n \"matcher\": {\n \"id\": \"byFrameRefID\"\n },\n \"properties\": {\n \"rightYAxisDisplay\": \"off\"\n }\n }\n ],\n \"targets\": [\n {\n \"expr\": \"jvm_memory_pool_max_bytes{pool=\\\"G1 Survivor Space\\\", namespace=\\\"$namespace\\\", container=\\\"$service\\\", pod=\\\"$pod\\\"}\",\n \"legend\": \"Max\",\n \"maxDataPoints\": 240,\n \"refId\": \"A\"\n },\n {\n \"expr\": \"jvm_memory_pool_bytes_used{pool=\\\"G1 Survivor Space\\\", job=\\\"$job\\\",instance=\\\"$instance\\\"}\",\n \"legend\": \"Used\",\n \"maxDataPoints\": 240,\n \"refId\": \"B\"\n },\n {\n \"expr\": \"jvm_memory_pool_bytes_committed{pool=\\\"G1 Survivor Space\\\", job=\\\"$job\\\",instance=\\\"$instance\\\"}\",\n \"legend\": \"Committed\",\n \"maxDataPoints\": 240,\n \"refId\": \"C\"\n }\n ],\n \"transformations\": [\n {\n \"id\": \"organize\",\n \"options\": {}\n }\n ],\n \"type\": \"timeseries\",\n \"version\": \"3.1.0\"\n },\n {\n \"custom\": {\n \"drawStyle\": \"lines\",\n \"fillOpacity\": 0.3,\n \"gradientMode\": \"opacity\",\n \"lineInterpolation\": \"smooth\",\n \"lineWidth\": 2,\n \"pointSize\": 5,\n \"scaleDistribution\": {\n \"type\": \"linear\"\n },\n \"showPoints\": \"none\",\n \"spanNulls\": false,\n \"stack\": \"off\"\n },\n \"datasourceCate\": \"prometheus\",\n \"datasourceValue\": \"${prom}\",\n \"id\": \"595af7d1-e53c-43b5-8f62-ddb9b3a4ffcb\",\n \"layout\": {\n \"h\": 7,\n \"i\": \"595af7d1-e53c-43b5-8f62-ddb9b3a4ffcb\",\n \"w\": 6,\n \"x\": 12,\n \"y\": 15\n },\n \"maxPerRow\": 4,\n \"name\": \"G1 Old Gen\",\n \"options\": {\n \"legend\": {\n \"behaviour\": \"showItem\",\n \"displayMode\": \"hidden\",\n \"placement\": \"bottom\",\n \"selectMode\": \"single\"\n },\n \"standardOptions\": {\n \"decimals\": 1,\n \"util\": \"bytesIEC\"\n },\n \"thresholds\": {\n \"mode\": \"absolute\",\n \"steps\": [\n {\n \"color\": \"rgb(44, 157, 61)\",\n \"type\": \"base\",\n \"value\": null\n }\n ]\n },\n \"thresholdsStyle\": {\n \"mode\": \"dashed\"\n },\n \"tooltip\": {\n \"mode\": \"all\",\n \"sort\": \"desc\"\n }\n },\n \"overrides\": [\n {\n \"matcher\": {\n \"id\": \"byFrameRefID\"\n },\n \"properties\": {\n \"rightYAxisDisplay\": \"off\"\n }\n }\n ],\n \"targets\": [\n {\n \"expr\": \"jvm_memory_pool_max_bytes{pool=\\\"G1 Old Gen\\\", namespace=\\\"$namespace\\\", container=\\\"$service\\\", pod=\\\"$pod\\\"}\",\n \"legend\": \"Max\",\n \"maxDataPoints\": 240,\n \"refId\": \"A\"\n },\n {\n \"expr\": \"jvm_memory_pool_bytes_used{pool=\\\"G1 Old Gen\\\", namespace=\\\"$namespace\\\", container=\\\"$service\\\", pod=\\\"$pod\\\"}\",\n \"legend\": \"Used\",\n \"maxDataPoints\": 240,\n \"refId\": \"B\"\n },\n {\n \"expr\": \"jvm_memory_pool_bytes_committed{pool=\\\"G1 Old Gen\\\", namespace=\\\"$namespace\\\", container=\\\"$service\\\", pod=\\\"$pod\\\"}\",\n \"legend\": \"Committed\",\n \"maxDataPoints\": 240,\n \"refId\": \"C\"\n }\n ],\n \"transformations\": [\n {\n \"id\": \"organize\",\n \"options\": {}\n }\n ],\n \"type\": \"timeseries\",\n \"version\": \"3.1.0\"\n },\n {\n \"custom\": {\n \"drawStyle\": \"lines\",\n \"fillOpacity\": 0.3,\n \"gradientMode\": \"opacity\",\n \"lineInterpolation\": \"smooth\",\n \"lineWidth\": 2,\n \"pointSize\": 5,\n \"scaleDistribution\": {\n \"type\": \"linear\"\n },\n \"showPoints\": \"none\",\n \"spanNulls\": false,\n \"stack\": \"off\"\n },\n \"datasourceCate\": \"prometheus\",\n \"datasourceValue\": \"${prom}\",\n \"id\": \"380fdfcb-16a6-4131-abaa-a3911b7de6fa\",\n \"layout\": {\n \"h\": 7,\n \"i\": \"380fdfcb-16a6-4131-abaa-a3911b7de6fa\",\n \"w\": 6,\n \"x\": 18,\n \"y\": 15\n },\n \"maxPerRow\": 4,\n \"name\": \"Metaspace\",\n \"options\": {\n \"legend\": {\n \"behaviour\": \"showItem\",\n \"displayMode\": \"hidden\",\n \"placement\": \"bottom\",\n \"selectMode\": \"single\"\n },\n \"standardOptions\": {\n \"decimals\": 1,\n \"util\": \"bytesIEC\"\n },\n \"thresholds\": {\n \"mode\": \"absolute\",\n \"steps\": [\n {\n \"color\": \"rgb(44, 157, 61)\",\n \"type\": \"base\",\n \"value\": null\n }\n ]\n },\n \"thresholdsStyle\": {\n \"mode\": \"dashed\"\n },\n \"tooltip\": {\n \"mode\": \"all\",\n \"sort\": \"desc\"\n }\n },\n \"overrides\": [\n {\n \"matcher\": {\n \"id\": \"byFrameRefID\"\n },\n \"properties\": {\n \"rightYAxisDisplay\": \"off\"\n }\n }\n ],\n \"targets\": [\n {\n \"expr\": \"jvm_memory_pool_max_bytes{pool=\\\"Metaspace\\\", namespace=\\\"$namespace\\\", container=\\\"$service\\\", pod=\\\"$pod\\\"}\",\n \"legend\": \"Max\",\n \"maxDataPoints\": 240,\n \"refId\": \"A\"\n },\n {\n \"expr\": \"jvm_memory_pool_bytes_used{pool=\\\"Metaspace\\\", namespace=\\\"$namespace\\\", container=\\\"$service\\\", pod=\\\"$pod\\\"}\",\n \"legend\": \"Used\",\n \"maxDataPoints\": 240,\n \"refId\": \"B\"\n },\n {\n \"expr\": \"jvm_memory_pool_bytes_committed{pool=\\\"Metaspace\\\", namespace=\\\"$namespace\\\", container=\\\"$service\\\", pod=\\\"$pod\\\"}\",\n \"legend\": \"Committed\",\n \"maxDataPoints\": 240,\n \"refId\": \"C\"\n }\n ],\n \"transformations\": [\n {\n \"id\": \"organize\",\n \"options\": {}\n }\n ],\n \"type\": \"timeseries\",\n \"version\": \"3.1.0\"\n },\n {\n \"collapsed\": true,\n \"id\": \"0aaf3516-4938-41e3-b7cb-323de6de75d9\",\n \"layout\": {\n \"h\": 1,\n \"i\": \"0aaf3516-4938-41e3-b7cb-323de6de75d9\",\n \"w\": 24,\n \"x\": 0,\n \"y\": 22\n },\n \"name\": \"GC\",\n \"type\": \"row\"\n },\n {\n \"custom\": {\n \"drawStyle\": \"lines\",\n \"fillOpacity\": 0.3,\n \"gradientMode\": \"opacity\",\n \"lineInterpolation\": \"smooth\",\n \"lineWidth\": 2,\n \"pointSize\": 5,\n \"scaleDistribution\": {\n \"type\": \"linear\"\n },\n \"showPoints\": \"none\",\n \"spanNulls\": false,\n \"stack\": \"off\"\n },\n \"datasourceCate\": \"prometheus\",\n \"datasourceValue\": \"${prom}\",\n \"id\": \"5303bda0-47c2-4aca-bb12-1da512500f4a\",\n \"layout\": {\n \"h\": 7,\n \"i\": \"5303bda0-47c2-4aca-bb12-1da512500f4a\",\n \"w\": 8,\n \"x\": 0,\n \"y\": 23\n },\n \"maxPerRow\": 4,\n \"name\": \"过去一分钟GC耗时(秒)\",\n \"options\": {\n \"legend\": {\n \"behaviour\": \"showItem\",\n \"displayMode\": \"hidden\",\n \"placement\": \"bottom\",\n \"selectMode\": \"single\"\n },\n \"standardOptions\": {\n \"util\": \"none\"\n },\n \"thresholds\": {\n \"mode\": \"absolute\",\n \"steps\": [\n {\n \"color\": \"rgb(44, 157, 61)\",\n \"type\": \"base\",\n \"value\": null\n }\n ]\n },\n \"thresholdsStyle\": {\n \"mode\": \"dashed\"\n },\n \"tooltip\": {\n \"mode\": \"all\",\n \"sort\": \"desc\"\n }\n },\n \"overrides\": [\n {\n \"matcher\": {\n \"id\": \"byFrameRefID\"\n },\n \"properties\": {\n \"rightYAxisDisplay\": \"off\"\n }\n }\n ],\n \"targets\": [\n {\n \"expr\": \"increase(jvm_gc_collection_seconds_sum{namespace=\\\"$namespace\\\", container=\\\"$service\\\", pod=\\\"$pod\\\"}[1m])\",\n \"maxDataPoints\": 240,\n \"refId\": \"A\"\n }\n ],\n \"transformations\": [\n {\n \"id\": \"organize\",\n \"options\": {}\n }\n ],\n \"type\": \"timeseries\",\n \"version\": \"3.1.0\"\n },\n {\n \"custom\": {\n \"drawStyle\": \"lines\",\n \"fillOpacity\": 0.3,\n \"gradientMode\": \"opacity\",\n \"lineInterpolation\": \"smooth\",\n \"lineWidth\": 2,\n \"pointSize\": 5,\n \"scaleDistribution\": {\n \"type\": \"linear\"\n },\n \"showPoints\": \"none\",\n \"spanNulls\": false,\n \"stack\": \"off\"\n },\n \"datasourceCate\": \"prometheus\",\n \"datasourceValue\": \"${prom}\",\n \"id\": \"cf410459-b5df-4aca-a410-ecda091d6097\",\n \"layout\": {\n \"h\": 7,\n \"i\": \"cf410459-b5df-4aca-a410-ecda091d6097\",\n \"w\": 8,\n \"x\": 8,\n \"y\": 23\n },\n \"maxPerRow\": 4,\n \"name\": \"过去一分钟GC次数\",\n \"options\": {\n \"legend\": {\n \"behaviour\": \"showItem\",\n \"displayMode\": \"hidden\",\n \"placement\": \"bottom\",\n \"selectMode\": \"single\"\n },\n \"standardOptions\": {\n \"util\": \"none\"\n },\n \"thresholds\": {\n \"mode\": \"absolute\",\n \"steps\": [\n {\n \"color\": \"rgb(44, 157, 61)\",\n \"type\": \"base\",\n \"value\": null\n }\n ]\n },\n \"thresholdsStyle\": {\n \"mode\": \"dashed\"\n },\n \"tooltip\": {\n \"mode\": \"all\",\n \"sort\": \"desc\"\n }\n },\n \"overrides\": [\n {\n \"matcher\": {\n \"id\": \"byFrameRefID\"\n },\n \"properties\": {\n \"rightYAxisDisplay\": \"off\"\n }\n }\n ],\n \"targets\": [\n {\n \"expr\": \"increase(jvm_gc_collection_seconds_count{namespace=\\\"$namespace\\\", container=\\\"$service\\\", pod=\\\"$pod\\\"}[1m])\",\n \"legend\": \"\",\n \"maxDataPoints\": 240,\n \"refId\": \"A\"\n }\n ],\n \"transformations\": [\n {\n \"id\": \"organize\",\n \"options\": {}\n }\n ],\n \"type\": \"timeseries\",\n \"version\": \"3.1.0\"\n },\n {\n \"custom\": {\n \"drawStyle\": \"bars\",\n \"fillOpacity\": 0.3,\n \"gradientMode\": \"opacity\",\n \"lineWidth\": 2,\n \"pointSize\": 5,\n \"scaleDistribution\": {\n \"type\": \"linear\"\n },\n \"showPoints\": \"none\",\n \"spanNulls\": false,\n \"stack\": \"off\"\n },\n \"datasourceCate\": \"prometheus\",\n \"datasourceValue\": \"${prom}\",\n \"id\": \"30feb928-b7c3-4e71-aeeb-cc10994b313c\",\n \"layout\": {\n \"h\": 7,\n \"i\": \"30feb928-b7c3-4e71-aeeb-cc10994b313c\",\n \"w\": 8,\n \"x\": 16,\n \"y\": 23\n },\n \"maxPerRow\": 4,\n \"name\": \"过去一分钟每次GC平均耗时(秒)\",\n \"options\": {\n \"legend\": {\n \"behaviour\": \"showItem\",\n \"displayMode\": \"hidden\",\n \"placement\": \"bottom\",\n \"selectMode\": \"single\"\n },\n \"standardOptions\": {\n \"util\": \"none\"\n },\n \"thresholds\": {\n \"mode\": \"absolute\",\n \"steps\": [\n {\n \"color\": \"rgb(44, 157, 61)\",\n \"type\": \"base\",\n \"value\": null\n }\n ]\n },\n \"thresholdsStyle\": {\n \"mode\": \"dashed\"\n },\n \"tooltip\": {\n \"mode\": \"all\",\n \"sort\": \"desc\"\n }\n },\n \"overrides\": [\n {\n \"matcher\": {\n \"id\": \"byFrameRefID\"\n },\n \"properties\": {\n \"rightYAxisDisplay\": \"off\"\n }\n }\n ],\n \"targets\": [\n {\n \"expr\": \"increase(jvm_gc_collection_seconds_sum{namespace=\\\"$namespace\\\", container=\\\"$service\\\", pod=\\\"$pod\\\"}[1m])/increase(jvm_gc_collection_seconds_count{namespace=\\\"$namespace\\\", container=\\\"$service\\\", pod=\\\"$pod\\\"}[1m])\",\n \"legend\": \"\",\n \"maxDataPoints\": 240,\n \"refId\": \"A\"\n }\n ],\n \"transformations\": [\n {\n \"id\": \"organize\",\n \"options\": {}\n }\n ],\n \"type\": \"timeseries\",\n \"version\": \"3.1.0\"\n },\n {\n \"collapsed\": true,\n \"id\": \"fd6d0772-40d7-4211-b9bb-601e35fb6431\",\n \"layout\": {\n \"h\": 1,\n \"i\": \"fd6d0772-40d7-4211-b9bb-601e35fb6431\",\n \"w\": 24,\n \"x\": 0,\n \"y\": 30\n },\n \"name\": \"Threads and Class loading\",\n \"type\": \"row\"\n },\n {\n \"custom\": {\n \"drawStyle\": \"lines\",\n \"fillOpacity\": 0.3,\n \"gradientMode\": \"opacity\",\n \"lineInterpolation\": \"smooth\",\n \"lineWidth\": 2,\n \"pointSize\": 5,\n \"scaleDistribution\": {\n \"type\": \"linear\"\n },\n \"showPoints\": \"none\",\n \"spanNulls\": false,\n \"stack\": \"off\"\n },\n \"datasourceCate\": \"prometheus\",\n \"datasourceValue\": \"${prom}\",\n \"id\": \"65c74a2b-5f01-4491-b45a-dffe4a9b678a\",\n \"layout\": {\n \"h\": 7,\n \"i\": \"65c74a2b-5f01-4491-b45a-dffe4a9b678a\",\n \"w\": 12,\n \"x\": 0,\n \"y\": 31\n },\n \"maxPerRow\": 4,\n \"name\": \"Threads\",\n \"options\": {\n \"legend\": {\n \"behaviour\": \"showItem\",\n \"displayMode\": \"hidden\",\n \"placement\": \"bottom\",\n \"selectMode\": \"single\"\n },\n \"standardOptions\": {},\n \"thresholds\": {\n \"mode\": \"absolute\",\n \"steps\": [\n {\n \"color\": \"rgb(44, 157, 61)\",\n \"type\": \"base\",\n \"value\": null\n }\n ]\n },\n \"thresholdsStyle\": {\n \"mode\": \"dashed\"\n },\n \"tooltip\": {\n \"mode\": \"all\",\n \"sort\": \"desc\"\n }\n },\n \"overrides\": [\n {\n \"matcher\": {\n \"id\": \"byFrameRefID\"\n },\n \"properties\": {\n \"rightYAxisDisplay\": \"off\"\n }\n }\n ],\n \"targets\": [\n {\n \"expr\": \"jvm_threads_current{namespace=\\\"$namespace\\\", container=\\\"$service\\\", pod=\\\"$pod\\\"}\",\n \"legend\": \"current\",\n \"maxDataPoints\": 240,\n \"refId\": \"A\"\n },\n {\n \"expr\": \"jvm_threads_daemon{job=\\\"$job\\\",instance=\\\"$instance\\\"}\",\n \"legend\": \"daemon\",\n \"maxDataPoints\": 240,\n \"refId\": \"B\"\n },\n {\n \"expr\": \"jvm_threads_deadlocked{job=\\\"$job\\\",instance=\\\"$instance\\\"}\",\n \"legend\": \"deadlocked\",\n \"maxDataPoints\": 240,\n \"refId\": \"C\"\n }\n ],\n \"transformations\": [\n {\n \"id\": \"organize\",\n \"options\": {}\n }\n ],\n \"type\": \"timeseries\",\n \"version\": \"3.1.0\"\n },\n {\n \"custom\": {\n \"drawStyle\": \"lines\",\n \"fillOpacity\": 0.3,\n \"gradientMode\": \"opacity\",\n \"lineInterpolation\": \"smooth\",\n \"lineWidth\": 2,\n \"pointSize\": 5,\n \"scaleDistribution\": {\n \"type\": \"linear\"\n },\n \"showPoints\": \"none\",\n \"spanNulls\": false,\n \"stack\": \"off\"\n },\n \"datasourceCate\": \"prometheus\",\n \"datasourceValue\": \"${prom}\",\n \"id\": \"2da16907-adf7-4561-9338-4254c89a311b\",\n \"layout\": {\n \"h\": 7,\n \"i\": \"2da16907-adf7-4561-9338-4254c89a311b\",\n \"w\": 12,\n \"x\": 12,\n \"y\": 31\n },\n \"maxPerRow\": 4,\n \"name\": \"Class loading\",\n \"options\": {\n \"legend\": {\n \"behaviour\": \"showItem\",\n \"displayMode\": \"hidden\",\n \"placement\": \"bottom\",\n \"selectMode\": \"single\"\n },\n \"standardOptions\": {},\n \"thresholds\": {\n \"mode\": \"absolute\",\n \"steps\": [\n {\n \"color\": \"rgb(44, 157, 61)\",\n \"type\": \"base\",\n \"value\": null\n }\n ]\n },\n \"thresholdsStyle\": {\n \"mode\": \"dashed\"\n },\n \"tooltip\": {\n \"mode\": \"all\",\n \"sort\": \"none\"\n }\n },\n \"overrides\": [\n {\n \"matcher\": {\n \"id\": \"byFrameRefID\"\n },\n \"properties\": {\n \"rightYAxisDisplay\": \"off\"\n }\n }\n ],\n \"targets\": [\n {\n \"expr\": \"jvm_classes_loaded_total{namespace=\\\"$namespace\\\", container=\\\"$service\\\", pod=\\\"$pod\\\"}\",\n \"maxDataPoints\": 240,\n \"refId\": \"A\"\n }\n ],\n \"transformations\": [\n {\n \"id\": \"organize\",\n \"options\": {}\n }\n ],\n \"type\": \"timeseries\",\n \"version\": \"3.1.0\"\n },\n {\n \"collapsed\": true,\n \"id\": \"12fe119e-54f0-4219-9846-ac982c1e9b4d\",\n \"layout\": {\n \"h\": 1,\n \"i\": \"12fe119e-54f0-4219-9846-ac982c1e9b4d\",\n \"w\": 24,\n \"x\": 0,\n \"y\": 38\n },\n \"name\": \"Container memory\",\n \"type\": \"row\"\n },\n {\n \"custom\": {\n \"drawStyle\": \"lines\",\n \"fillOpacity\": 0.3,\n \"gradientMode\": \"opacity\",\n \"lineInterpolation\": \"smooth\",\n \"lineWidth\": 2,\n \"pointSize\": 5,\n \"scaleDistribution\": {\n \"type\": \"linear\"\n },\n \"showPoints\": \"none\",\n \"spanNulls\": false,\n \"stack\": \"off\"\n },\n \"datasourceCate\": \"prometheus\",\n \"datasourceValue\": \"${prom}\",\n \"id\": \"5a859147-edfc-4dac-9457-8a928213bc00\",\n \"layout\": {\n \"h\": 7,\n \"i\": \"5a859147-edfc-4dac-9457-8a928213bc00\",\n \"w\": 24,\n \"x\": 0,\n \"y\": 39\n },\n \"maxPerRow\": 4,\n \"name\": \"Container Memory Limit\",\n \"options\": {\n \"legend\": {\n \"behaviour\": \"showItem\",\n \"displayMode\": \"hidden\",\n \"placement\": \"bottom\",\n \"selectMode\": \"single\"\n },\n \"standardOptions\": {\n \"decimals\": 1,\n \"util\": \"bytesIEC\"\n },\n \"thresholds\": {\n \"mode\": \"absolute\",\n \"steps\": [\n {\n \"color\": \"rgb(44, 157, 61)\",\n \"type\": \"base\",\n \"value\": null\n }\n ]\n },\n \"thresholdsStyle\": {\n \"mode\": \"dashed\"\n },\n \"tooltip\": {\n \"mode\": \"all\",\n \"sort\": \"desc\"\n }\n },\n \"overrides\": [\n {\n \"matcher\": {\n \"id\": \"byFrameRefID\"\n },\n \"properties\": {\n \"rightYAxisDisplay\": \"off\"\n }\n }\n ],\n \"targets\": [\n {\n \"expr\": \"os_total_physical_memory_bytes{namespace=\\\"$namespace\\\", container=\\\"$service\\\", pod=\\\"$pod\\\"}\",\n \"legend\": \"Total physical memory\",\n \"maxDataPoints\": 240,\n \"refId\": \"A\"\n },\n {\n \"expr\": \"os_committed_virtual_memory_bytes{job=\\\"$job\\\",instance=\\\"$instance\\\"}\",\n \"legend\": \"Committed virtual memory\",\n \"maxDataPoints\": 240,\n \"refId\": \"B\"\n },\n {\n \"expr\": \"os_free_physical_memory_bytes{job=\\\"$job\\\",instance=\\\"$instance\\\"}\",\n \"legend\": \"Free physical memory\",\n \"maxDataPoints\": 240,\n \"refId\": \"C\"\n }\n ],\n \"transformations\": [\n {\n \"id\": \"organize\",\n \"options\": {}\n }\n ],\n \"type\": \"timeseries\",\n \"version\": \"3.1.0\"\n }\n ],\n \"var\": [\n {\n \"definition\": \"prometheus\",\n \"name\": \"prom\",\n \"type\": \"datasource\"\n },\n {\n \"datasource\": {\n \"cate\": \"prometheus\",\n \"value\": \"${prom}\"\n },\n \"definition\": \"label_values(jmx_exporter_build_info, namespace)\",\n \"hide\": false,\n \"name\": \"namespace\",\n \"type\": \"query\"\n },\n {\n \"datasource\": {\n \"cate\": \"prometheus\",\n \"value\": \"${prom}\"\n },\n \"definition\": \"label_values(jmx_exporter_build_info{namespace=\\\"$namespace\\\"},container)\",\n \"hide\": false,\n \"name\": \"service\",\n \"type\": \"query\"\n },\n {\n \"datasource\": {\n \"cate\": \"prometheus\",\n \"value\": \"${prom}\"\n },\n \"definition\": \"label_values(jmx_exporter_build_info{namespace=\\\"$namespace\\\", container=\\\"$service\\\"},pod)\",\n \"hide\": false,\n \"name\": \"pod\",\n \"type\": \"query\"\n }\n ],\n \"version\": \"3.0.0\"\n },\n \"uuid\": 1755595969673000\n }"
},
{
"path": "integrations/Java/dashboards/jvm_by_opentelementry.json",
"content": "{\n \"name\": \"JVM by OpenTelementry\",\n \"tags\": \"Prometheus OpenTelementry\",\n \"ident\": \"\",\n \"uuid\": 1749052689795000,\n \"configs\": {\n \"panels\": [\n {\n \"collapsed\": true,\n \"id\": \"a26c5c3d-7b60-4746-bd1f-ca95581cf2fd\",\n \"layout\": {\n \"h\": 1,\n \"w\": 24,\n \"x\": 0,\n \"y\": 0,\n \"i\": \"a26c5c3d-7b60-4746-bd1f-ca95581cf2fd\",\n \"isResizable\": false\n },\n \"name\": \"CPU Info\",\n \"type\": \"row\"\n },\n {\n \"type\": \"stat\",\n \"id\": \"a55c40fc-dc25-4d2a-8e99-928e02c5ff5d\",\n \"layout\": {\n \"h\": 4,\n \"w\": 8,\n \"x\": 0,\n \"y\": 1,\n \"i\": \"a55c40fc-dc25-4d2a-8e99-928e02c5ff5d\",\n \"isResizable\": true\n },\n \"version\": \"3.1.0\",\n \"datasourceCate\": \"prometheus\",\n \"datasourceValue\": \"${prom}\",\n \"targets\": [\n {\n \"expr\": \"jvm_cpu_count{job=\\\"$job\\\",instance=~\\\"$instance\\\"}\",\n \"refId\": \"A\",\n \"maxDataPoints\": 240\n }\n ],\n \"transformations\": [\n {\n \"id\": \"organize\",\n \"options\": {}\n }\n ],\n \"name\": \"CPU Count\",\n \"maxPerRow\": 4,\n \"custom\": {\n \"textMode\": \"value\",\n \"graphMode\": \"none\",\n \"colorMode\": \"value\",\n \"calc\": \"lastNotNull\",\n \"valueField\": \"Value\",\n \"colSpan\": 1,\n \"textSize\": {\n \"value\": 64\n },\n \"orientation\": \"auto\"\n },\n \"options\": {\n \"thresholds\": {\n \"steps\": [\n {\n \"color\": \"rgb(44, 157, 61)\",\n \"value\": null,\n \"type\": \"base\"\n }\n ]\n },\n \"standardOptions\": {\n \"util\": \"\"\n }\n },\n \"overrides\": [\n {\n \"matcher\": {\n \"id\": \"byFrameRefID\"\n },\n \"properties\": {\n \"thresholds\": {\n \"steps\": [\n {\n \"color\": \"#6C53B1\",\n \"value\": null,\n \"type\": \"base\"\n }\n ]\n }\n }\n }\n ]\n },\n {\n \"type\": \"timeseries\",\n \"id\": \"0721ee76-816b-469f-9c49-2bef94a9299e\",\n \"layout\": {\n \"h\": 4,\n \"w\": 8,\n \"x\": 8,\n \"y\": 1,\n \"i\": \"0721ee76-816b-469f-9c49-2bef94a9299e\",\n \"isResizable\": true\n },\n \"version\": \"3.1.0\",\n \"datasourceCate\": \"prometheus\",\n \"datasourceValue\": \"${prom}\",\n \"targets\": [\n {\n \"expr\": \"((increase(jvm_cpu_time_seconds_total{instance=~\\\"$instance\\\",job=\\\"$job\\\"}[1m]) /60)/jvm_cpu_count{job=\\\"$job\\\",instance=~\\\"$instance\\\"}) *100\",\n \"refId\": \"A\",\n \"maxDataPoints\": 240\n }\n ],\n \"transformations\": [\n {\n \"id\": \"organize\",\n \"options\": {}\n }\n ],\n \"name\": \"JVM CPU 每分钟平均使用率\",\n \"description\": \"CPU 每分钟平均使用率,已做归一化处理,即不管几个核,CPU使用率最大值为 100%\",\n \"maxPerRow\": 4,\n \"options\": {\n \"tooltip\": {\n \"mode\": \"single\"\n },\n \"legend\": {\n \"displayMode\": \"hidden\",\n \"placement\": \"bottom\",\n \"behaviour\": \"showItem\",\n \"selectMode\": \"single\"\n },\n \"standardOptions\": {\n \"util\": \"percentUnit\"\n },\n \"thresholds\": {\n \"mode\": \"absolute\",\n \"steps\": [\n {\n \"color\": \"rgb(44, 157, 61)\",\n \"value\": null,\n \"type\": \"base\"\n }\n ]\n },\n \"thresholdsStyle\": {\n \"mode\": \"dashed\"\n }\n },\n \"custom\": {\n \"drawStyle\": \"lines\",\n \"lineInterpolation\": \"smooth\",\n \"spanNulls\": false,\n \"lineWidth\": 2,\n \"fillOpacity\": 0.01,\n \"gradientMode\": \"none\",\n \"stack\": \"off\",\n \"scaleDistribution\": {\n \"type\": \"linear\"\n },\n \"showPoints\": \"none\",\n \"pointSize\": 5\n },\n \"overrides\": [\n {\n \"matcher\": {\n \"id\": \"byFrameRefID\"\n },\n \"properties\": {\n \"thresholds\": {\n \"steps\": [\n {\n \"color\": \"#6C53B1\",\n \"value\": null,\n \"type\": \"base\"\n }\n ]\n },\n \"rightYAxisDisplay\": \"off\"\n }\n }\n ]\n },\n {\n \"type\": \"timeseries\",\n \"id\": \"9d27fdb7-9ab5-41ce-9266-c97860244283\",\n \"layout\": {\n \"h\": 4,\n \"w\": 8,\n \"x\": 16,\n \"y\": 1,\n \"i\": \"83786365-c832-479c-ae25-e9ff69c5245f\",\n \"isResizable\": true\n },\n \"version\": \"3.1.0\",\n \"datasourceCate\": \"prometheus\",\n \"datasourceValue\": \"${prom}\",\n \"targets\": [\n {\n \"expr\": \"jvm_cpu_recent_utilization_ratio{instance=~\\\"$instance\\\",job=\\\"$job\\\"}*100\",\n \"refId\": \"A\",\n \"maxDataPoints\": 240\n }\n ],\n \"transformations\": [\n {\n \"id\": \"organize\",\n \"options\": {}\n }\n ],\n \"name\": \"JVM CPU 瞬时使用率\",\n \"links\": [],\n \"description\": \"JVM 进程在最近系统采样周期内(通常是几百毫秒) CPU 的使用率\\nhttps://opentelemetry.io/docs/specs/semconv/runtime/jvm-metrics/\",\n \"maxPerRow\": 4,\n \"options\": {\n \"tooltip\": {\n \"mode\": \"single\"\n },\n \"legend\": {\n \"displayMode\": \"hidden\",\n \"placement\": \"bottom\",\n \"behaviour\": \"showItem\",\n \"selectMode\": \"single\"\n },\n \"standardOptions\": {\n \"util\": \"percentUnit\"\n },\n \"thresholds\": {\n \"mode\": \"absolute\",\n \"steps\": [\n {\n \"color\": \"rgb(44, 157, 61)\",\n \"value\": null,\n \"type\": \"base\"\n }\n ]\n },\n \"thresholdsStyle\": {\n \"mode\": \"dashed\"\n }\n },\n \"custom\": {\n \"drawStyle\": \"lines\",\n \"lineInterpolation\": \"smooth\",\n \"spanNulls\": false,\n \"lineWidth\": 2,\n \"fillOpacity\": 0.01,\n \"gradientMode\": \"none\",\n \"stack\": \"off\",\n \"scaleDistribution\": {\n \"type\": \"linear\"\n },\n \"showPoints\": \"none\",\n \"pointSize\": 5\n },\n \"overrides\": [\n {\n \"matcher\": {\n \"id\": \"byFrameRefID\"\n },\n \"properties\": {\n \"thresholds\": {\n \"steps\": [\n {\n \"color\": \"#6C53B1\",\n \"value\": null,\n \"type\": \"base\"\n }\n ]\n },\n \"rightYAxisDisplay\": \"off\"\n }\n }\n ]\n },\n {\n \"collapsed\": true,\n \"id\": \"705c90e0-e8b6-4f1c-b35c-c8a785009a20\",\n \"layout\": {\n \"h\": 1,\n \"w\": 24,\n \"x\": 0,\n \"y\": 5,\n \"i\": \"705c90e0-e8b6-4f1c-b35c-c8a785009a20\",\n \"isResizable\": false\n },\n \"name\": \"JVM Memory\",\n \"type\": \"row\",\n \"panels\": []\n },\n {\n \"type\": \"timeseries\",\n \"id\": \"5455e2f2-f6bb-4888-9d88-240d7e12cce2\",\n \"layout\": {\n \"h\": 7,\n \"w\": 12,\n \"x\": 0,\n \"y\": 6,\n \"i\": \"5455e2f2-f6bb-4888-9d88-240d7e12cce2\",\n \"isResizable\": true\n },\n \"version\": \"3.1.0\",\n \"datasourceCate\": \"prometheus\",\n \"datasourceValue\": \"${prom}\",\n \"targets\": [\n {\n \"expr\": \"jvm_memory_committed_bytes{jvm_memory_type=\\\"heap\\\",job=\\\"$job\\\",instance=\\\"$instance\\\"}\",\n \"legend\": \"{{jvm_memory_pool_name}}\",\n \"refId\": \"A\",\n \"maxDataPoints\": 240\n }\n ],\n \"transformations\": [\n {\n \"id\": \"organize\",\n \"options\": {}\n }\n ],\n \"name\": \"JVM Commit Memory(heap)\",\n \"description\": \"已提交内存\\nhttps://opentelemetry.io/docs/specs/semconv/runtime/jvm-metrics/\",\n \"maxPerRow\": 4,\n \"options\": {\n \"tooltip\": {\n \"mode\": \"all\",\n \"sort\": \"desc\"\n },\n \"legend\": {\n \"displayMode\": \"list\",\n \"placement\": \"bottom\",\n \"behaviour\": \"showItem\",\n \"selectMode\": \"single\"\n },\n \"standardOptions\": {\n \"util\": \"bytesIEC\",\n \"decimals\": 1\n },\n \"thresholds\": {\n \"mode\": \"absolute\",\n \"steps\": [\n {\n \"color\": \"rgb(44, 157, 61)\",\n \"value\": null,\n \"type\": \"base\"\n }\n ]\n },\n \"thresholdsStyle\": {\n \"mode\": \"dashed\"\n }\n },\n \"custom\": {\n \"drawStyle\": \"lines\",\n \"lineInterpolation\": \"smooth\",\n \"spanNulls\": false,\n \"lineWidth\": 2,\n \"fillOpacity\": 0.3,\n \"gradientMode\": \"opacity\",\n \"stack\": \"off\",\n \"scaleDistribution\": {\n \"type\": \"linear\"\n },\n \"showPoints\": \"none\",\n \"pointSize\": 5\n },\n \"overrides\": [\n {\n \"matcher\": {\n \"id\": \"byFrameRefID\"\n },\n \"properties\": {\n \"rightYAxisDisplay\": \"off\"\n }\n }\n ]\n },\n {\n \"type\": \"timeseries\",\n \"id\": \"765b22a9-1ddc-4c08-8758-684e3c13252b\",\n \"layout\": {\n \"h\": 7,\n \"w\": 12,\n \"x\": 12,\n \"y\": 6,\n \"i\": \"765b22a9-1ddc-4c08-8758-684e3c13252b\",\n \"isResizable\": true\n },\n \"version\": \"3.1.0\",\n \"datasourceCate\": \"prometheus\",\n \"datasourceValue\": \"${prom}\",\n \"targets\": [\n {\n \"expr\": \"jvm_memory_committed_bytes{jvm_memory_type=\\\"non_heap\\\",job=\\\"$job\\\",instance=\\\"$instance\\\"}\",\n \"legend\": \"{{jvm_memory_pool_name}}\",\n \"refId\": \"A\",\n \"maxDataPoints\": 240\n }\n ],\n \"transformations\": [\n {\n \"id\": \"organize\",\n \"options\": {}\n }\n ],\n \"name\": \"JVM Commit Memory(nonheap)\",\n \"description\": \"已提交内存\\nhttps://opentelemetry.io/docs/specs/semconv/runtime/jvm-metrics/\",\n \"maxPerRow\": 4,\n \"options\": {\n \"tooltip\": {\n \"mode\": \"all\",\n \"sort\": \"desc\"\n },\n \"legend\": {\n \"displayMode\": \"list\",\n \"placement\": \"bottom\",\n \"behaviour\": \"showItem\",\n \"selectMode\": \"single\"\n },\n \"standardOptions\": {\n \"util\": \"bytesIEC\",\n \"decimals\": 1\n },\n \"thresholds\": {\n \"mode\": \"absolute\",\n \"steps\": [\n {\n \"color\": \"rgb(44, 157, 61)\",\n \"value\": null,\n \"type\": \"base\"\n }\n ]\n },\n \"thresholdsStyle\": {\n \"mode\": \"dashed\"\n }\n },\n \"custom\": {\n \"drawStyle\": \"lines\",\n \"lineInterpolation\": \"smooth\",\n \"spanNulls\": false,\n \"lineWidth\": 2,\n \"fillOpacity\": 0.3,\n \"gradientMode\": \"opacity\",\n \"stack\": \"off\",\n \"scaleDistribution\": {\n \"type\": \"linear\"\n },\n \"showPoints\": \"none\",\n \"pointSize\": 5\n },\n \"overrides\": [\n {\n \"matcher\": {\n \"id\": \"byFrameRefID\"\n },\n \"properties\": {\n \"rightYAxisDisplay\": \"off\"\n }\n }\n ]\n },\n {\n \"type\": \"timeseries\",\n \"id\": \"6d4caef8-cd49-4fd5-9bb5-feadeb4f777e\",\n \"layout\": {\n \"h\": 7,\n \"w\": 12,\n \"x\": 0,\n \"y\": 13,\n \"i\": \"af0eee36-6791-48a1-8715-39e57848e1b8\",\n \"isResizable\": true\n },\n \"version\": \"3.1.0\",\n \"datasourceCate\": \"prometheus\",\n \"datasourceValue\": \"${prom}\",\n \"targets\": [\n {\n \"expr\": \"jvm_memory_limit_bytes{jvm_memory_type=\\\"heap\\\",job=\\\"$job\\\",instance=\\\"$instance\\\"}\",\n \"legend\": \"{{jvm_memory_pool_name}}\",\n \"refId\": \"A\",\n \"maxDataPoints\": 240\n }\n ],\n \"transformations\": [\n {\n \"id\": \"organize\",\n \"options\": {}\n }\n ],\n \"name\": \"JVM Memory Limit(heap)\",\n \"description\": \"最大可获取内存\\nhttps://opentelemetry.io/docs/specs/semconv/runtime/jvm-metrics/\",\n \"maxPerRow\": 4,\n \"options\": {\n \"tooltip\": {\n \"mode\": \"all\",\n \"sort\": \"desc\"\n },\n \"legend\": {\n \"displayMode\": \"list\",\n \"placement\": \"bottom\",\n \"behaviour\": \"showItem\",\n \"selectMode\": \"single\"\n },\n \"standardOptions\": {\n \"util\": \"bytesIEC\",\n \"decimals\": 1\n },\n \"thresholds\": {\n \"mode\": \"absolute\",\n \"steps\": [\n {\n \"color\": \"rgb(44, 157, 61)\",\n \"value\": null,\n \"type\": \"base\"\n }\n ]\n },\n \"thresholdsStyle\": {\n \"mode\": \"dashed\"\n }\n },\n \"custom\": {\n \"drawStyle\": \"lines\",\n \"lineInterpolation\": \"smooth\",\n \"spanNulls\": false,\n \"lineWidth\": 2,\n \"fillOpacity\": 0.3,\n \"gradientMode\": \"opacity\",\n \"stack\": \"off\",\n \"scaleDistribution\": {\n \"type\": \"linear\"\n },\n \"showPoints\": \"none\",\n \"pointSize\": 5\n },\n \"overrides\": [\n {\n \"matcher\": {\n \"id\": \"byFrameRefID\"\n },\n \"properties\": {\n \"rightYAxisDisplay\": \"off\"\n }\n }\n ]\n },\n {\n \"type\": \"timeseries\",\n \"id\": \"aee4fa22-73ac-4991-ab6c-935999ac4729\",\n \"layout\": {\n \"h\": 7,\n \"w\": 12,\n \"x\": 12,\n \"y\": 13,\n \"i\": \"d2c78767-39bb-4ac4-858f-cc5501311f0b\",\n \"isResizable\": true\n },\n \"version\": \"3.1.0\",\n \"datasourceCate\": \"prometheus\",\n \"datasourceValue\": \"${prom}\",\n \"targets\": [\n {\n \"expr\": \"jvm_memory_limit_bytes{jvm_memory_type=\\\"non_heap\\\",job=\\\"$job\\\",instance=\\\"$instance\\\"}\",\n \"legend\": \"{{jvm_memory_pool_name}}\",\n \"refId\": \"A\",\n \"maxDataPoints\": 240\n }\n ],\n \"transformations\": [\n {\n \"id\": \"organize\",\n \"options\": {}\n }\n ],\n \"name\": \"JVM Memory Limit(nonheap)\",\n \"description\": \"最大可获取内存\\nhttps://opentelemetry.io/docs/specs/semconv/runtime/jvm-metrics/\",\n \"maxPerRow\": 4,\n \"options\": {\n \"tooltip\": {\n \"mode\": \"all\",\n \"sort\": \"desc\"\n },\n \"legend\": {\n \"displayMode\": \"list\",\n \"placement\": \"bottom\",\n \"behaviour\": \"showItem\",\n \"selectMode\": \"single\"\n },\n \"standardOptions\": {\n \"util\": \"bytesIEC\",\n \"decimals\": 1\n },\n \"thresholds\": {\n \"mode\": \"absolute\",\n \"steps\": [\n {\n \"color\": \"rgb(44, 157, 61)\",\n \"value\": null,\n \"type\": \"base\"\n }\n ]\n },\n \"thresholdsStyle\": {\n \"mode\": \"dashed\"\n }\n },\n \"custom\": {\n \"drawStyle\": \"lines\",\n \"lineInterpolation\": \"smooth\",\n \"spanNulls\": false,\n \"lineWidth\": 2,\n \"fillOpacity\": 0.3,\n \"gradientMode\": \"opacity\",\n \"stack\": \"off\",\n \"scaleDistribution\": {\n \"type\": \"linear\"\n },\n \"showPoints\": \"none\",\n \"pointSize\": 5\n },\n \"overrides\": [\n {\n \"matcher\": {\n \"id\": \"byFrameRefID\"\n },\n \"properties\": {\n \"rightYAxisDisplay\": \"off\"\n }\n }\n ]\n },\n {\n \"type\": \"timeseries\",\n \"id\": \"5a96cae3-a0f5-4b8d-b76a-063efd592060\",\n \"layout\": {\n \"h\": 7,\n \"w\": 12,\n \"x\": 0,\n \"y\": 20,\n \"i\": \"0381f655-147e-4cfb-84b4-46ea8a1ae4b2\",\n \"isResizable\": true\n },\n \"version\": \"3.1.0\",\n \"datasourceCate\": \"prometheus\",\n \"datasourceValue\": \"${prom}\",\n \"targets\": [\n {\n \"expr\": \"jvm_memory_used_bytes{jvm_memory_type=\\\"heap\\\",job=\\\"$job\\\",instance=\\\"$instance\\\"}\",\n \"legend\": \"{{jvm_memory_pool_name}}\",\n \"refId\": \"A\",\n \"maxDataPoints\": 240\n }\n ],\n \"transformations\": [\n {\n \"id\": \"organize\",\n \"options\": {}\n }\n ],\n \"name\": \"JVM Memory Used(heap)\",\n \"description\": \"已使用内存\\nhttps://opentelemetry.io/docs/specs/semconv/runtime/jvm-metrics/\",\n \"maxPerRow\": 4,\n \"options\": {\n \"tooltip\": {\n \"mode\": \"all\",\n \"sort\": \"desc\"\n },\n \"legend\": {\n \"displayMode\": \"list\",\n \"placement\": \"bottom\",\n \"behaviour\": \"showItem\",\n \"selectMode\": \"single\"\n },\n \"standardOptions\": {\n \"util\": \"bytesIEC\",\n \"decimals\": 1\n },\n \"thresholds\": {\n \"mode\": \"absolute\",\n \"steps\": [\n {\n \"color\": \"rgb(44, 157, 61)\",\n \"value\": null,\n \"type\": \"base\"\n }\n ]\n },\n \"thresholdsStyle\": {\n \"mode\": \"dashed\"\n }\n },\n \"custom\": {\n \"drawStyle\": \"lines\",\n \"lineInterpolation\": \"smooth\",\n \"spanNulls\": false,\n \"lineWidth\": 2,\n \"fillOpacity\": 0.3,\n \"gradientMode\": \"opacity\",\n \"stack\": \"off\",\n \"scaleDistribution\": {\n \"type\": \"linear\"\n },\n \"showPoints\": \"none\",\n \"pointSize\": 5\n },\n \"overrides\": [\n {\n \"matcher\": {\n \"id\": \"byFrameRefID\"\n },\n \"properties\": {\n \"rightYAxisDisplay\": \"off\"\n }\n }\n ]\n },\n {\n \"type\": \"timeseries\",\n \"id\": \"ef4c8781-8876-4e59-8b6d-781813ae433e\",\n \"layout\": {\n \"h\": 7,\n \"w\": 12,\n \"x\": 12,\n \"y\": 20,\n \"i\": \"be93dba2-55c5-49a3-a511-ef0c9835843c\",\n \"isResizable\": true\n },\n \"version\": \"3.1.0\",\n \"datasourceCate\": \"prometheus\",\n \"datasourceValue\": \"${prom}\",\n \"targets\": [\n {\n \"expr\": \"jvm_memory_used_bytes{jvm_memory_type=\\\"non_heap\\\",job=\\\"$job\\\",instance=\\\"$instance\\\"}\",\n \"legend\": \"{{jvm_memory_pool_name}}\",\n \"refId\": \"A\",\n \"maxDataPoints\": 240\n }\n ],\n \"transformations\": [\n {\n \"id\": \"organize\",\n \"options\": {}\n }\n ],\n \"name\": \"JVM Memory Used(nonheap)\",\n \"description\": \"已使用内存\\nhttps://opentelemetry.io/docs/specs/semconv/runtime/jvm-metrics/\",\n \"maxPerRow\": 4,\n \"options\": {\n \"tooltip\": {\n \"mode\": \"all\",\n \"sort\": \"desc\"\n },\n \"legend\": {\n \"displayMode\": \"list\",\n \"placement\": \"bottom\",\n \"behaviour\": \"showItem\",\n \"selectMode\": \"single\"\n },\n \"standardOptions\": {\n \"util\": \"bytesIEC\",\n \"decimals\": 1\n },\n \"thresholds\": {\n \"mode\": \"absolute\",\n \"steps\": [\n {\n \"color\": \"rgb(44, 157, 61)\",\n \"value\": null,\n \"type\": \"base\"\n }\n ]\n },\n \"thresholdsStyle\": {\n \"mode\": \"dashed\"\n }\n },\n \"custom\": {\n \"drawStyle\": \"lines\",\n \"lineInterpolation\": \"smooth\",\n \"spanNulls\": false,\n \"lineWidth\": 2,\n \"fillOpacity\": 0.3,\n \"gradientMode\": \"opacity\",\n \"stack\": \"off\",\n \"scaleDistribution\": {\n \"type\": \"linear\"\n },\n \"showPoints\": \"none\",\n \"pointSize\": 5\n },\n \"overrides\": [\n {\n \"matcher\": {\n \"id\": \"byFrameRefID\"\n },\n \"properties\": {\n \"rightYAxisDisplay\": \"off\"\n }\n }\n ]\n },\n {\n \"type\": \"timeseries\",\n \"id\": \"29b53a9d-b38a-4462-a4f4-d4c1db300596\",\n \"layout\": {\n \"h\": 7,\n \"w\": 12,\n \"x\": 0,\n \"y\": 27,\n \"i\": \"5b7c0a0d-d887-4edb-a025-ec3bb2298f1c\",\n \"isResizable\": true\n },\n \"version\": \"3.1.0\",\n \"datasourceCate\": \"prometheus\",\n \"datasourceValue\": \"${prom}\",\n \"targets\": [\n {\n \"expr\": \"jvm_memory_used_after_last_gc_bytes{jvm_memory_type=\\\"heap\\\",job=\\\"$job\\\",instance=\\\"$instance\\\"}\",\n \"legend\": \"{{jvm_memory_pool_name}}\",\n \"refId\": \"A\",\n \"maxDataPoints\": 240\n }\n ],\n \"transformations\": [\n {\n \"id\": \"organize\",\n \"options\": {}\n }\n ],\n \"name\": \"上次GC后 JVM Memory Used(heap)\",\n \"description\": \"最近一次GC后的内存使用量\",\n \"maxPerRow\": 4,\n \"options\": {\n \"tooltip\": {\n \"mode\": \"all\",\n \"sort\": \"desc\"\n },\n \"legend\": {\n \"displayMode\": \"list\",\n \"placement\": \"bottom\",\n \"behaviour\": \"showItem\",\n \"selectMode\": \"single\"\n },\n \"standardOptions\": {\n \"util\": \"bytesIEC\",\n \"decimals\": 1\n },\n \"thresholds\": {\n \"mode\": \"absolute\",\n \"steps\": [\n {\n \"color\": \"rgb(44, 157, 61)\",\n \"value\": null,\n \"type\": \"base\"\n }\n ]\n },\n \"thresholdsStyle\": {\n \"mode\": \"dashed\"\n }\n },\n \"custom\": {\n \"drawStyle\": \"lines\",\n \"lineInterpolation\": \"smooth\",\n \"spanNulls\": false,\n \"lineWidth\": 2,\n \"fillOpacity\": 0.3,\n \"gradientMode\": \"opacity\",\n \"stack\": \"off\",\n \"scaleDistribution\": {\n \"type\": \"linear\"\n },\n \"showPoints\": \"none\",\n \"pointSize\": 5\n },\n \"overrides\": [\n {\n \"matcher\": {\n \"id\": \"byFrameRefID\"\n },\n \"properties\": {\n \"rightYAxisDisplay\": \"off\"\n }\n }\n ]\n },\n {\n \"type\": \"timeseries\",\n \"id\": \"d50ff8ea-d8c1-4f87-b34c-64661cca7700\",\n \"layout\": {\n \"h\": 7,\n \"w\": 12,\n \"x\": 12,\n \"y\": 27,\n \"i\": \"66887b68-53ea-4d9b-96f6-1cbcf8531c92\",\n \"isResizable\": true\n },\n \"version\": \"3.1.0\",\n \"datasourceCate\": \"prometheus\",\n \"datasourceValue\": \"${prom}\",\n \"targets\": [\n {\n \"expr\": \"jvm_memory_used_after_last_gc_bytes{jvm_memory_type=\\\"non_heap\\\",job=\\\"$job\\\",instance=\\\"$instance\\\"}\",\n \"legend\": \"{{jvm_memory_pool_name}}\",\n \"refId\": \"A\",\n \"maxDataPoints\": 240\n }\n ],\n \"transformations\": [\n {\n \"id\": \"organize\",\n \"options\": {}\n }\n ],\n \"name\": \"上次GC后 JVM Memory Used(nonheap)\",\n \"description\": \"最近一次GC后的内存使用量\",\n \"maxPerRow\": 4,\n \"options\": {\n \"tooltip\": {\n \"mode\": \"all\",\n \"sort\": \"desc\"\n },\n \"legend\": {\n \"displayMode\": \"list\",\n \"placement\": \"bottom\",\n \"behaviour\": \"showItem\",\n \"selectMode\": \"single\"\n },\n \"standardOptions\": {\n \"util\": \"bytesIEC\",\n \"decimals\": 1\n },\n \"thresholds\": {\n \"mode\": \"absolute\",\n \"steps\": [\n {\n \"color\": \"rgb(44, 157, 61)\",\n \"value\": null,\n \"type\": \"base\"\n }\n ]\n },\n \"thresholdsStyle\": {\n \"mode\": \"dashed\"\n }\n },\n \"custom\": {\n \"drawStyle\": \"lines\",\n \"lineInterpolation\": \"smooth\",\n \"spanNulls\": false,\n \"lineWidth\": 2,\n \"fillOpacity\": 0.3,\n \"gradientMode\": \"opacity\",\n \"stack\": \"off\",\n \"scaleDistribution\": {\n \"type\": \"linear\"\n },\n \"showPoints\": \"none\",\n \"pointSize\": 5\n },\n \"overrides\": [\n {\n \"matcher\": {\n \"id\": \"byFrameRefID\"\n },\n \"properties\": {\n \"rightYAxisDisplay\": \"off\"\n }\n }\n ]\n },\n {\n \"collapsed\": true,\n \"id\": \"0aaf3516-4938-41e3-b7cb-323de6de75d9\",\n \"layout\": {\n \"h\": 1,\n \"w\": 24,\n \"x\": 0,\n \"y\": 34,\n \"i\": \"0aaf3516-4938-41e3-b7cb-323de6de75d9\",\n \"isResizable\": false\n },\n \"name\": \"GC\",\n \"type\": \"row\",\n \"panels\": []\n },\n {\n \"type\": \"timeseries\",\n \"id\": \"5303bda0-47c2-4aca-bb12-1da512500f4a\",\n \"layout\": {\n \"h\": 7,\n \"w\": 8,\n \"x\": 0,\n \"y\": 35,\n \"i\": \"5303bda0-47c2-4aca-bb12-1da512500f4a\",\n \"isResizable\": true\n },\n \"version\": \"3.1.0\",\n \"datasourceCate\": \"prometheus\",\n \"datasourceValue\": \"${prom}\",\n \"targets\": [\n {\n \"expr\": \"increase(jvm_gc_duration_seconds_sum{job=\\\"$job\\\",instance=~\\\"$instance\\\"}[1m])\",\n \"refId\": \"A\",\n \"maxDataPoints\": 240,\n \"legend\": \"{{jvm_gc_action}} - {{jvm_gc_name}}\"\n }\n ],\n \"transformations\": [\n {\n \"id\": \"organize\",\n \"options\": {}\n }\n ],\n \"name\": \"过去一分钟GC总耗时(秒)\",\n \"maxPerRow\": 4,\n \"options\": {\n \"tooltip\": {\n \"mode\": \"all\",\n \"sort\": \"desc\"\n },\n \"legend\": {\n \"displayMode\": \"list\",\n \"placement\": \"bottom\",\n \"behaviour\": \"showItem\",\n \"selectMode\": \"single\"\n },\n \"standardOptions\": {\n \"util\": \"none\"\n },\n \"thresholds\": {\n \"mode\": \"absolute\",\n \"steps\": [\n {\n \"color\": \"rgb(44, 157, 61)\",\n \"value\": null,\n \"type\": \"base\"\n }\n ]\n },\n \"thresholdsStyle\": {\n \"mode\": \"dashed\"\n }\n },\n \"custom\": {\n \"drawStyle\": \"lines\",\n \"lineInterpolation\": \"smooth\",\n \"spanNulls\": false,\n \"lineWidth\": 2,\n \"fillOpacity\": 0.3,\n \"gradientMode\": \"opacity\",\n \"stack\": \"off\",\n \"scaleDistribution\": {\n \"type\": \"linear\"\n },\n \"showPoints\": \"none\",\n \"pointSize\": 5\n },\n \"overrides\": [\n {\n \"matcher\": {\n \"id\": \"byFrameRefID\"\n },\n \"properties\": {\n \"rightYAxisDisplay\": \"off\"\n }\n }\n ]\n },\n {\n \"type\": \"timeseries\",\n \"id\": \"cf410459-b5df-4aca-a410-ecda091d6097\",\n \"layout\": {\n \"h\": 7,\n \"w\": 8,\n \"x\": 8,\n \"y\": 35,\n \"i\": \"cf410459-b5df-4aca-a410-ecda091d6097\",\n \"isResizable\": true\n },\n \"version\": \"3.1.0\",\n \"datasourceCate\": \"prometheus\",\n \"datasourceValue\": \"${prom}\",\n \"targets\": [\n {\n \"expr\": \"increase(jvm_gc_duration_seconds_count{job=\\\"$job\\\",instance=\\\"$instance\\\"}[1m])\",\n \"legend\": \"{{jvm_gc_action}} - {{jvm_gc_name}}\",\n \"refId\": \"A\",\n \"maxDataPoints\": 240\n }\n ],\n \"transformations\": [\n {\n \"id\": \"organize\",\n \"options\": {}\n }\n ],\n \"name\": \"过去一分钟GC次数\",\n \"maxPerRow\": 4,\n \"options\": {\n \"tooltip\": {\n \"mode\": \"all\",\n \"sort\": \"desc\"\n },\n \"legend\": {\n \"displayMode\": \"list\",\n \"placement\": \"bottom\",\n \"behaviour\": \"showItem\",\n \"selectMode\": \"single\"\n },\n \"standardOptions\": {\n \"util\": \"none\"\n },\n \"thresholds\": {\n \"mode\": \"absolute\",\n \"steps\": [\n {\n \"color\": \"rgb(44, 157, 61)\",\n \"value\": null,\n \"type\": \"base\"\n }\n ]\n },\n \"thresholdsStyle\": {\n \"mode\": \"dashed\"\n }\n },\n \"custom\": {\n \"drawStyle\": \"lines\",\n \"lineInterpolation\": \"smooth\",\n \"spanNulls\": false,\n \"lineWidth\": 2,\n \"fillOpacity\": 0.3,\n \"gradientMode\": \"opacity\",\n \"stack\": \"off\",\n \"scaleDistribution\": {\n \"type\": \"linear\"\n },\n \"showPoints\": \"none\",\n \"pointSize\": 5\n },\n \"overrides\": [\n {\n \"matcher\": {\n \"id\": \"byFrameRefID\"\n },\n \"properties\": {\n \"rightYAxisDisplay\": \"off\"\n }\n }\n ]\n },\n {\n \"type\": \"timeseries\",\n \"id\": \"30feb928-b7c3-4e71-aeeb-cc10994b313c\",\n \"layout\": {\n \"h\": 7,\n \"w\": 8,\n \"x\": 16,\n \"y\": 35,\n \"i\": \"30feb928-b7c3-4e71-aeeb-cc10994b313c\",\n \"isResizable\": true\n },\n \"version\": \"3.1.0\",\n \"datasourceCate\": \"prometheus\",\n \"datasourceValue\": \"${prom}\",\n \"targets\": [\n {\n \"expr\": \"histogram_quantile(\\n 0.95,\\n sum by(le, jvm_gc_action, jvm_gc_name) (\\n rate(jvm_gc_duration_seconds_bucket{instance=\\\"$instance\\\", job=\\\"$job\\\"}[1m])\\n )\\n)\",\n \"legend\": \"{{jvm_gc_action}} - {{jvm_gc_name}}\",\n \"refId\": \"A\",\n \"maxDataPoints\": 240\n }\n ],\n \"transformations\": [\n {\n \"id\": \"organize\",\n \"options\": {}\n }\n ],\n \"name\": \"过去1分钟单次GC耗时95分位值(秒)\",\n \"maxPerRow\": 4,\n \"options\": {\n \"tooltip\": {\n \"mode\": \"all\",\n \"sort\": \"desc\"\n },\n \"legend\": {\n \"displayMode\": \"list\",\n \"placement\": \"bottom\",\n \"behaviour\": \"showItem\",\n \"selectMode\": \"single\"\n },\n \"standardOptions\": {\n \"util\": \"none\"\n },\n \"thresholds\": {\n \"mode\": \"absolute\",\n \"steps\": [\n {\n \"color\": \"rgb(44, 157, 61)\",\n \"value\": null,\n \"type\": \"base\"\n }\n ]\n },\n \"thresholdsStyle\": {\n \"mode\": \"dashed\"\n }\n },\n \"custom\": {\n \"drawStyle\": \"bars\",\n \"spanNulls\": false,\n \"lineWidth\": 2,\n \"fillOpacity\": 0.3,\n \"gradientMode\": \"opacity\",\n \"stack\": \"off\",\n \"scaleDistribution\": {\n \"type\": \"linear\"\n },\n \"showPoints\": \"none\",\n \"pointSize\": 5\n },\n \"overrides\": [\n {\n \"matcher\": {\n \"id\": \"byFrameRefID\"\n },\n \"properties\": {\n \"rightYAxisDisplay\": \"off\"\n }\n }\n ]\n },\n {\n \"collapsed\": true,\n \"id\": \"fd6d0772-40d7-4211-b9bb-601e35fb6431\",\n \"layout\": {\n \"h\": 1,\n \"w\": 24,\n \"x\": 0,\n \"y\": 42,\n \"i\": \"fd6d0772-40d7-4211-b9bb-601e35fb6431\",\n \"isResizable\": false\n },\n \"name\": \"Threads and Class Loading\",\n \"type\": \"row\",\n \"panels\": []\n },\n {\n \"type\": \"timeseries\",\n \"id\": \"65c74a2b-5f01-4491-b45a-dffe4a9b678a\",\n \"layout\": {\n \"h\": 4,\n \"w\": 6,\n \"x\": 0,\n \"y\": 43,\n \"i\": \"65c74a2b-5f01-4491-b45a-dffe4a9b678a\",\n \"isResizable\": true\n },\n \"version\": \"3.1.0\",\n \"datasourceCate\": \"prometheus\",\n \"datasourceValue\": \"${prom}\",\n \"targets\": [\n {\n \"expr\": \"jvm_thread_count{job=\\\"$job\\\",instance=\\\"$instance\\\"}\",\n \"legend\": \"{{jvm_thread_daemon}} - {{jvm_thread_state}}\",\n \"refId\": \"A\",\n \"maxDataPoints\": 240\n },\n {\n \"expr\": \"jvm_threads_daemon{job=\\\"$job\\\",instance=\\\"$instance\\\"}\",\n \"legend\": \"daemon\",\n \"refId\": \"B\",\n \"maxDataPoints\": 240\n },\n {\n \"expr\": \"jvm_threads_deadlocked{job=\\\"$job\\\",instance=\\\"$instance\\\"}\",\n \"legend\": \"deadlocked\",\n \"refId\": \"C\",\n \"maxDataPoints\": 240\n }\n ],\n \"transformations\": [\n {\n \"id\": \"organize\",\n \"options\": {}\n }\n ],\n \"name\": \"Threads\",\n \"maxPerRow\": 4,\n \"options\": {\n \"tooltip\": {\n \"mode\": \"all\",\n \"sort\": \"desc\"\n },\n \"legend\": {\n \"displayMode\": \"list\",\n \"placement\": \"bottom\",\n \"behaviour\": \"showItem\",\n \"selectMode\": \"single\"\n },\n \"standardOptions\": {},\n \"thresholds\": {\n \"mode\": \"absolute\",\n \"steps\": [\n {\n \"color\": \"rgb(44, 157, 61)\",\n \"value\": null,\n \"type\": \"base\"\n }\n ]\n },\n \"thresholdsStyle\": {\n \"mode\": \"dashed\"\n }\n },\n \"custom\": {\n \"drawStyle\": \"lines\",\n \"lineInterpolation\": \"smooth\",\n \"spanNulls\": false,\n \"lineWidth\": 2,\n \"fillOpacity\": 0.3,\n \"gradientMode\": \"opacity\",\n \"stack\": \"off\",\n \"scaleDistribution\": {\n \"type\": \"linear\"\n },\n \"showPoints\": \"none\",\n \"pointSize\": 5\n },\n \"overrides\": [\n {\n \"matcher\": {\n \"id\": \"byFrameRefID\"\n },\n \"properties\": {\n \"rightYAxisDisplay\": \"off\"\n }\n }\n ]\n },\n {\n \"type\": \"timeseries\",\n \"id\": \"2da16907-adf7-4561-9338-4254c89a311b\",\n \"layout\": {\n \"h\": 4,\n \"w\": 6,\n \"x\": 6,\n \"y\": 43,\n \"i\": \"2da16907-adf7-4561-9338-4254c89a311b\",\n \"isResizable\": true\n },\n \"version\": \"3.1.0\",\n \"datasourceCate\": \"prometheus\",\n \"datasourceValue\": \"${prom}\",\n \"targets\": [\n {\n \"expr\": \"jvm_class_count{job=\\\"$job\\\", instance=\\\"$instance\\\"}\",\n \"refId\": \"A\",\n \"maxDataPoints\": 240\n }\n ],\n \"transformations\": [\n {\n \"id\": \"organize\",\n \"options\": {}\n }\n ],\n \"name\": \"Class Count\",\n \"description\": \"Number of classes currently loaded.\",\n \"maxPerRow\": 4,\n \"options\": {\n \"tooltip\": {\n \"mode\": \"all\",\n \"sort\": \"none\"\n },\n \"legend\": {\n \"displayMode\": \"hidden\",\n \"placement\": \"bottom\",\n \"behaviour\": \"showItem\",\n \"selectMode\": \"single\"\n },\n \"standardOptions\": {},\n \"thresholds\": {\n \"mode\": \"absolute\",\n \"steps\": [\n {\n \"color\": \"rgb(44, 157, 61)\",\n \"value\": null,\n \"type\": \"base\"\n }\n ]\n },\n \"thresholdsStyle\": {\n \"mode\": \"dashed\"\n }\n },\n \"custom\": {\n \"drawStyle\": \"lines\",\n \"lineInterpolation\": \"smooth\",\n \"spanNulls\": false,\n \"lineWidth\": 2,\n \"fillOpacity\": 0.3,\n \"gradientMode\": \"opacity\",\n \"stack\": \"off\",\n \"scaleDistribution\": {\n \"type\": \"linear\"\n },\n \"showPoints\": \"none\",\n \"pointSize\": 5\n },\n \"overrides\": [\n {\n \"matcher\": {\n \"id\": \"byFrameRefID\"\n },\n \"properties\": {\n \"rightYAxisDisplay\": \"off\"\n }\n }\n ]\n },\n {\n \"type\": \"timeseries\",\n \"id\": \"2eaccbc6-0084-40e8-8c4d-ea12fd562ba0\",\n \"layout\": {\n \"h\": 4,\n \"w\": 6,\n \"x\": 12,\n \"y\": 43,\n \"i\": \"7b261291-6429-4bb4-a433-3266495f10ce\",\n \"isResizable\": true\n },\n \"version\": \"3.1.0\",\n \"datasourceCate\": \"prometheus\",\n \"datasourceValue\": \"${prom}\",\n \"targets\": [\n {\n \"expr\": \"jvm_class_loaded_total{job=\\\"$job\\\", instance=\\\"$instance\\\"}\",\n \"refId\": \"A\",\n \"maxDataPoints\": 240\n }\n ],\n \"transformations\": [\n {\n \"id\": \"organize\",\n \"options\": {}\n }\n ],\n \"name\": \"Class Loaded Count\",\n \"description\": \"Number of classes loaded since JVM start.\\n\",\n \"maxPerRow\": 4,\n \"options\": {\n \"tooltip\": {\n \"mode\": \"all\",\n \"sort\": \"none\"\n },\n \"legend\": {\n \"displayMode\": \"hidden\",\n \"placement\": \"bottom\",\n \"behaviour\": \"showItem\",\n \"selectMode\": \"single\"\n },\n \"standardOptions\": {},\n \"thresholds\": {\n \"mode\": \"absolute\",\n \"steps\": [\n {\n \"color\": \"rgb(44, 157, 61)\",\n \"value\": null,\n \"type\": \"base\"\n }\n ]\n },\n \"thresholdsStyle\": {\n \"mode\": \"dashed\"\n }\n },\n \"custom\": {\n \"drawStyle\": \"lines\",\n \"lineInterpolation\": \"smooth\",\n \"spanNulls\": false,\n \"lineWidth\": 2,\n \"fillOpacity\": 0.3,\n \"gradientMode\": \"opacity\",\n \"stack\": \"off\",\n \"scaleDistribution\": {\n \"type\": \"linear\"\n },\n \"showPoints\": \"none\",\n \"pointSize\": 5\n },\n \"overrides\": [\n {\n \"matcher\": {\n \"id\": \"byFrameRefID\"\n },\n \"properties\": {\n \"rightYAxisDisplay\": \"off\"\n }\n }\n ]\n },\n {\n \"type\": \"timeseries\",\n \"id\": \"ce49545c-3cd3-4a9f-ac3d-163e1aafa3f8\",\n \"layout\": {\n \"h\": 4,\n \"w\": 6,\n \"x\": 18,\n \"y\": 43,\n \"i\": \"94b94ee3-a907-4815-b8c6-80ffa8502df1\",\n \"isResizable\": true\n },\n \"version\": \"3.1.0\",\n \"datasourceCate\": \"prometheus\",\n \"datasourceValue\": \"${prom}\",\n \"targets\": [\n {\n \"expr\": \"jvm_class_unloaded_total{job=\\\"$job\\\", instance=\\\"$instance\\\"}\",\n \"refId\": \"A\",\n \"maxDataPoints\": 240\n }\n ],\n \"transformations\": [\n {\n \"id\": \"organize\",\n \"options\": {}\n }\n ],\n \"name\": \"Class Unload Count\",\n \"description\": \"Number of classes unloaded since JVM start.\",\n \"maxPerRow\": 4,\n \"options\": {\n \"tooltip\": {\n \"mode\": \"all\",\n \"sort\": \"none\"\n },\n \"legend\": {\n \"displayMode\": \"hidden\",\n \"placement\": \"bottom\",\n \"behaviour\": \"showItem\",\n \"selectMode\": \"single\"\n },\n \"standardOptions\": {},\n \"thresholds\": {\n \"mode\": \"absolute\",\n \"steps\": [\n {\n \"color\": \"rgb(44, 157, 61)\",\n \"value\": null,\n \"type\": \"base\"\n }\n ]\n },\n \"thresholdsStyle\": {\n \"mode\": \"dashed\"\n }\n },\n \"custom\": {\n \"drawStyle\": \"lines\",\n \"lineInterpolation\": \"smooth\",\n \"spanNulls\": false,\n \"lineWidth\": 2,\n \"fillOpacity\": 0.3,\n \"gradientMode\": \"opacity\",\n \"stack\": \"off\",\n \"scaleDistribution\": {\n \"type\": \"linear\"\n },\n \"showPoints\": \"none\",\n \"pointSize\": 5\n },\n \"overrides\": [\n {\n \"matcher\": {\n \"id\": \"byFrameRefID\"\n },\n \"properties\": {\n \"rightYAxisDisplay\": \"off\"\n }\n }\n ]\n }\n ],\n \"var\": [\n {\n \"definition\": \"prometheus\",\n \"name\": \"prom\",\n \"type\": \"datasource\"\n },\n {\n \"name\": \"job\",\n \"type\": \"query\",\n \"hide\": false,\n \"datasource\": {\n \"cate\": \"prometheus\",\n \"value\": \"${prom}\"\n },\n \"definition\": \"label_values(jvm_class_count, job)\",\n \"multi\": false\n },\n {\n \"name\": \"instance\",\n \"type\": \"query\",\n \"hide\": false,\n \"datasource\": {\n \"cate\": \"prometheus\",\n \"value\": \"${prom}\"\n },\n \"definition\": \"label_values(jvm_class_count{job=\\\"$job\\\"}, instance)\",\n \"multi\": false\n }\n ],\n \"version\": \"3.0.0\"\n }\n}"
},
{
"path": "integrations/Jenkins/collect/jenkins/jenkins.toml",
"content": "# # collect interval\n# interval = 15\n\n[[instances]]\n# Address (host:port) of jenkins server.\n# jenkins_url = \"http://my-jenkins-instance:8080\"\n\n#jenkins_username = \"admin\"\n#jenkins_password = \"\"\n\n#response_timeout = \"5s\"\n\n"
},
{
"path": "integrations/Jenkins/markdown/README.md",
"content": "## Jenkins\n\nJenkins 采集插件, 采集 Jenkins 数据\n\n## Configuration\n\n```toml\n# # collect interval\n# interval = 15\n\n[[instances]]\n# Address (host:port) of jenkins server.\n# jenkins_url = \"http://my-jenkins-instance:8080\"\n\n#jenkins_username = \"admin\"\n#jenkins_password = \"\"\n\n#response_timeout = \"5s\"\n\n\n```"
},
{
"path": "integrations/Jolokia_Agent/collect/jolokia_agent/activemq.toml",
"content": "## JolokiaAgent is bundled with ActiveMQ\n\n[[instances]]\n urls = [\"http://localhost:8161/api/jolokia\"]\n metrics_name_prefix = \"activemq_\"\n username = \"admin\"\n password = \"admin\"\n\n ### JVM Generic\n\n [[instances.metric]]\n name = \"OperatingSystem\"\n mbean = \"java.lang:type=OperatingSystem\"\n paths = [\"ProcessCpuLoad\",\"SystemLoadAverage\",\"SystemCpuLoad\"]\n\n [[instances.metric]]\n name = \"jvm_runtime\"\n mbean = \"java.lang:type=Runtime\"\n paths = [\"Uptime\"]\n\n [[instances.metric]]\n name = \"jvm_memory\"\n mbean = \"java.lang:type=Memory\"\n paths = [\"HeapMemoryUsage\", \"NonHeapMemoryUsage\", \"ObjectPendingFinalizationCount\"]\n\n [[instances.metric]]\n name = \"jvm_garbage_collector\"\n mbean = \"java.lang:name=*,type=GarbageCollector\"\n paths = [\"CollectionTime\", \"CollectionCount\"]\n tag_keys = [\"name\"]\n\n [[instances.metric]]\n name = \"jvm_memory_pool\"\n mbean = \"java.lang:name=*,type=MemoryPool\"\n paths = [\"Usage\", \"PeakUsage\", \"CollectionUsage\"]\n tag_keys = [\"name\"]\n tag_prefix = \"pool_\"\n\n ### ACTIVEMQ\n\n [[instances.metric]]\n name = \"queue\"\n mbean = \"org.apache.activemq:brokerName=*,destinationName=*,destinationType=Queue,type=Broker\"\n paths = [\"QueueSize\",\"EnqueueCount\",\"ConsumerCount\",\"DispatchCount\",\"DequeueCount\",\"ProducerCount\",\"InFlightCount\"]\n tag_keys = [\"brokerName\",\"destinationName\"]\n\n [[instances.metric]]\n name = \"topic\"\n mbean = \"org.apache.activemq:brokerName=*,destinationName=*,destinationType=Topic,type=Broker\"\n paths = [\"ProducerCount\",\"DequeueCount\",\"ConsumerCount\",\"QueueSize\",\"EnqueueCount\"]\n tag_keys = [\"brokerName\",\"destinationName\"]\n\n [[instances.metric]]\n name = \"broker\"\n mbean = \"org.apache.activemq:brokerName=*,type=Broker\"\n paths = [\"TotalConsumerCount\",\"TotalMessageCount\",\"TotalEnqueueCount\",\"TotalDequeueCount\",\"MemoryLimit\",\"MemoryPercentUsage\",\"StoreLimit\",\"StorePercentUsage\",\"TempPercentUsage\",\"TempLimit\"]\n tag_keys = [\"brokerName\"]\n"
},
{
"path": "integrations/Jolokia_Agent/collect/jolokia_agent/bitbucket.toml",
"content": "[[instances]]\n urls = [\"http://localhost:8778/jolokia\"]\n metrics_name_prefix = \"bitbucket_\"\n\n [[instances.metric]]\n name = \"jvm_operatingsystem\"\n mbean = \"java.lang:type=OperatingSystem\"\n\n [[instances.metric]]\n name = \"jvm_runtime\"\n mbean = \"java.lang:type=Runtime\"\n\n [[instances.metric]]\n name = \"jvm_thread\"\n mbean = \"java.lang:type=Threading\"\n\n [[instances.metric]]\n name = \"jvm_memory\"\n mbean = \"java.lang:type=Memory\"\n\n [[instances.metric]]\n name = \"jvm_class_loading\"\n mbean = \"java.lang:type=ClassLoading\"\n\n [[instances.metric]]\n name = \"jvm_memory_pool\"\n mbean = \"java.lang:type=MemoryPool,name=*\"\n\n [[instances.metric]]\n name = \"webhooks\"\n mbean = \"com.atlassian.webhooks:name=*\"\n\n [[instances.metric]]\n name = \"atlassian\"\n mbean = \"com.atlassian.bitbucket:name=*\"\n\n [[instances.metric]]\n name = \"thread_pools\"\n mbean = \"com.atlassian.bitbucket.thread-pools:name=*\"\n"
},
{
"path": "integrations/Jolokia_Agent/collect/jolokia_agent/cassandra.toml",
"content": "[[instances]]\n urls = [\"http://localhost:8778/jolokia\"]\n metrics_name_prefix = \"java_\"\n\n [[instances.metric]]\n name = \"Memory\"\n mbean = \"java.lang:type=Memory\"\n\n [[instances.metric]]\n name = \"GarbageCollector\"\n mbean = \"java.lang:name=*,type=GarbageCollector\"\n tag_keys = [\"name\"]\n field_prefix = \"$1_\"\n\n[[instances]]\n urls = [\"http://localhost:8778/jolokia\"]\n metrics_name_prefix = \"cassandra_\"\n\n [[instances.metric]]\n name = \"Cache\"\n mbean = \"org.apache.cassandra.metrics:name=*,scope=*,type=Cache\"\n tag_keys = [\"name\", \"scope\"]\n field_prefix = \"$1_\"\n\n [[instances.metric]]\n name = \"Client\"\n mbean = \"org.apache.cassandra.metrics:name=*,type=Client\"\n tag_keys = [\"name\"]\n field_prefix = \"$1_\"\n\n [[instances.metric]]\n name = \"ClientRequestMetrics\"\n mbean = \"org.apache.cassandra.metrics:name=*,type=ClientRequestMetrics\"\n tag_keys = [\"name\"]\n field_prefix = \"$1_\"\n\n [[instances.metric]]\n name = \"ClientRequest\"\n mbean = \"org.apache.cassandra.metrics:name=*,scope=*,type=ClientRequest\"\n tag_keys = [\"name\", \"scope\"]\n field_prefix = \"$1_\"\n\n [[instances.metric]]\n name = \"ColumnFamily\"\n mbean = \"org.apache.cassandra.metrics:keyspace=*,name=*,scope=*,type=ColumnFamily\"\n tag_keys = [\"keyspace\", \"name\", \"scope\"]\n field_prefix = \"$2_\"\n\n [[instances.metric]]\n name = \"CommitLog\"\n mbean = \"org.apache.cassandra.metrics:name=*,type=CommitLog\"\n tag_keys = [\"name\"]\n field_prefix = \"$1_\"\n\n [[instances.metric]]\n name = \"Compaction\"\n mbean = \"org.apache.cassandra.metrics:name=*,type=Compaction\"\n tag_keys = [\"name\"]\n field_prefix = \"$1_\"\n\n [[instances.metric]]\n name = \"CQL\"\n mbean = \"org.apache.cassandra.metrics:name=*,type=CQL\"\n tag_keys = [\"name\"]\n field_prefix = \"$1_\"\n\n [[instances.metric]]\n name = \"DroppedMessage\"\n mbean = \"org.apache.cassandra.metrics:name=*,scope=*,type=DroppedMessage\"\n tag_keys = [\"name\", \"scope\"]\n field_prefix = \"$1_\"\n\n [[instances.metric]]\n name = \"FileCache\"\n mbean = \"org.apache.cassandra.metrics:name=*,type=FileCache\"\n tag_keys = [\"name\"]\n field_prefix = \"$1_\"\n\n [[instances.metric]]\n name = \"ReadRepair\"\n mbean = \"org.apache.cassandra.metrics:name=*,type=ReadRepair\"\n tag_keys = [\"name\"]\n field_prefix = \"$1_\"\n\n [[instances.metric]]\n name = \"Storage\"\n mbean = \"org.apache.cassandra.metrics:name=*,type=Storage\"\n tag_keys = [\"name\"]\n field_prefix = \"$1_\"\n\n [[instances.metric]]\n name = \"ThreadPools\"\n mbean = \"org.apache.cassandra.metrics:name=*,path=*,scope=*,type=ThreadPools\"\n tag_keys = [\"name\", \"path\", \"scope\"]\n field_prefix = \"$1_\"\n"
},
{
"path": "integrations/Jolokia_Agent/collect/jolokia_agent/hadoop-hdfs.toml",
"content": "################\n# NAMENODE #\n################\n[[instances]]\n urls = [\"http://localhost:8778/jolokia\"]\n metrics_name_prefix = \"hadoop_hdfs_namenode_\"\n\n [[instances.metric]]\n name = \"FSNamesystem\"\n mbean = \"Hadoop:name=FSNamesystem,service=NameNode\"\n paths = [\"CapacityTotal\", \"CapacityRemaining\", \"CapacityUsedNonDFS\", \"NumLiveDataNodes\", \"NumDeadDataNodes\", \"NumInMaintenanceDeadDataNodes\", \"NumDecomDeadDataNodes\"]\n\n [[instances.metric]]\n name = \"FSNamesystemState\"\n mbean = \"Hadoop:name=FSNamesystemState,service=NameNode\"\n paths = [\"VolumeFailuresTotal\", \"UnderReplicatedBlocks\", \"BlocksTotal\"]\n \n [[instances.metric]]\n name = \"OperatingSystem\"\n mbean = \"java.lang:type=OperatingSystem\"\n paths = [\"ProcessCpuLoad\", \"SystemLoadAverage\", \"SystemCpuLoad\"]\n\n [[instances.metric]]\n name = \"jvm_runtime\"\n mbean = \"java.lang:type=Runtime\"\n paths = [\"Uptime\"]\n\n [[instances.metric]]\n name = \"jvm_memory\"\n mbean = \"java.lang:type=Memory\"\n paths = [\"HeapMemoryUsage\", \"NonHeapMemoryUsage\", \"ObjectPendingFinalizationCount\"]\n\n [[instances.metric]]\n name = \"jvm_garbage_collector\"\n mbean = \"java.lang:name=*,type=GarbageCollector\"\n paths = [\"CollectionTime\", \"CollectionCount\"]\n tag_keys = [\"name\"]\n\n [[instances.metric]]\n name = \"jvm_memory_pool\"\n mbean = \"java.lang:name=*,type=MemoryPool\"\n paths = [\"Usage\", \"PeakUsage\", \"CollectionUsage\"]\n tag_keys = [\"name\"]\n tag_prefix = \"pool_\"\n\n\n################\n# DATANODE #\n################\n[[instances]]\n urls = [\"http://localhost:7778/jolokia\"]\n metrics_name_prefix = \"hadoop_hdfs_datanode_\"\n\n [[instances.metric]]\n name = \"FSDatasetState\"\n mbean = \"Hadoop:name=FSDatasetState,service=DataNode\"\n paths = [\"Capacity\", \"DfsUsed\", \"Remaining\", \"NumBlocksFailedToUnCache\", \"NumBlocksFailedToCache\", \"NumBlocksCached\"]\n\n [[instances.metric]]\n name = \"OperatingSystem\"\n mbean = \"java.lang:type=OperatingSystem\"\n paths = [\"ProcessCpuLoad\", \"SystemLoadAverage\", \"SystemCpuLoad\"]\n\n [[instances.metric]]\n name = \"jvm_runtime\"\n mbean = \"java.lang:type=Runtime\"\n paths = [\"Uptime\"]\n\n [[instances.metric]]\n name = \"jvm_memory\"\n mbean = \"java.lang:type=Memory\"\n paths = [\"HeapMemoryUsage\", \"NonHeapMemoryUsage\", \"ObjectPendingFinalizationCount\"]\n\n [[instances.metric]]\n name = \"jvm_garbage_collector\"\n mbean = \"java.lang:name=*,type=GarbageCollector\"\n paths = [\"CollectionTime\", \"CollectionCount\"]\n tag_keys = [\"name\"]\n\n [[instances.metric]]\n name = \"jvm_memory_pool\"\n mbean = \"java.lang:name=*,type=MemoryPool\"\n paths = [\"Usage\", \"PeakUsage\", \"CollectionUsage\"]\n tag_keys = [\"name\"]\n tag_prefix = \"pool_\"\n"
},
{
"path": "integrations/Jolokia_Agent/collect/jolokia_agent/java.toml",
"content": "\n[[instances]]\n urls = [\"http://localhost:8080/jolokia\"]\n\n [[instances.metric]]\n name = \"java_runtime\"\n mbean = \"java.lang:type=Runtime\"\n paths = [\"Uptime\"]\n\n [[instances.metric]]\n name = \"java_memory\"\n mbean = \"java.lang:type=Memory\"\n paths = [\"HeapMemoryUsage\", \"NonHeapMemoryUsage\", \"ObjectPendingFinalizationCount\"]\n\n [[instances.metric]]\n name = \"java_garbage_collector\"\n mbean = \"java.lang:name=*,type=GarbageCollector\"\n paths = [\"CollectionTime\", \"CollectionCount\"]\n tag_keys = [\"name\"]\n\n [[instances.metric]]\n name = \"java_last_garbage_collection\"\n mbean = \"java.lang:name=G1 Young Generation,type=GarbageCollector\"\n paths = [\"LastGcInfo/duration\", \"LastGcInfo/GcThreadCount\", \"LastGcInfo/memoryUsageAfterGc\"]\n\n [[instances.metric]]\n name = \"java_threading\"\n mbean = \"java.lang:type=Threading\"\n paths = [\"TotalStartedThreadCount\", \"ThreadCount\", \"DaemonThreadCount\", \"PeakThreadCount\"]\n\n [[instances.metric]]\n name = \"java_class_loading\"\n mbean = \"java.lang:type=ClassLoading\"\n paths = [\"LoadedClassCount\", \"UnloadedClassCount\", \"TotalLoadedClassCount\"]\n\n [[instances.metric]]\n name = \"java_memory_pool\"\n mbean = \"java.lang:name=*,type=MemoryPool\"\n paths = [\"Usage\", \"PeakUsage\", \"CollectionUsage\"]\n tag_keys = [\"name\"]\n"
},
{
"path": "integrations/Jolokia_Agent/collect/jolokia_agent/jboss.toml",
"content": "[[instances]]\n urls = [\"http://localhost:8080/jolokia\"]\n metrics_name_prefix = \"jboss_\"\n\n ### JVM Generic\n\n [[instances.metric]]\n name = \"OperatingSystem\"\n mbean = \"java.lang:type=OperatingSystem\"\n paths = [\"ProcessCpuLoad\",\"SystemLoadAverage\",\"SystemCpuLoad\"]\n\n [[instances.metric]]\n name = \"jvm_runtime\"\n mbean = \"java.lang:type=Runtime\"\n paths = [\"Uptime\"]\n\n [[instances.metric]]\n name = \"jvm_memory\"\n mbean = \"java.lang:type=Memory\"\n paths = [\"HeapMemoryUsage\", \"NonHeapMemoryUsage\", \"ObjectPendingFinalizationCount\"]\n\n [[instances.metric]]\n name = \"jvm_garbage_collector\"\n mbean = \"java.lang:name=*,type=GarbageCollector\"\n paths = [\"CollectionTime\", \"CollectionCount\"]\n tag_keys = [\"name\"]\n\n [[instances.metric]]\n name = \"jvm_memory_pool\"\n mbean = \"java.lang:name=*,type=MemoryPool\"\n paths = [\"Usage\", \"PeakUsage\", \"CollectionUsage\"]\n tag_keys = [\"name\"]\n tag_prefix = \"pool_\"\n\n ### JBOSS\n\n [[instances.metric]]\n name = \"connectors.http\"\n mbean = \"jboss.as:https-listener=*,server=*,subsystem=undertow\"\n paths = [\"bytesReceived\",\"bytesSent\",\"errorCount\",\"requestCount\"]\n tag_keys = [\"server\",\"https-listener\"]\n\n [[instances.metric]]\n name = \"connectors.http\"\n mbean = \"jboss.as:http-listener=*,server=*,subsystem=undertow\"\n paths = [\"bytesReceived\",\"bytesSent\",\"errorCount\",\"requestCount\"]\n tag_keys = [\"server\",\"http-listener\"]\n\n [[instances.metric]]\n name = \"datasource.jdbc\"\n mbean = \"jboss.as:data-source=*,statistics=jdbc,subsystem=datasources\"\n paths = [\"PreparedStatementCacheAccessCount\",\"PreparedStatementCacheHitCount\",\"PreparedStatementCacheMissCount\"]\n tag_keys = [\"data-source\"]\n\n [[instances.metric]]\n name = \"datasource.pool\"\n mbean = \"jboss.as:data-source=*,statistics=pool,subsystem=datasources\"\n paths = [\"AvailableCount\",\"ActiveCount\",\"MaxUsedCount\"]\n tag_keys = [\"data-source\"]\n"
},
{
"path": "integrations/Jolokia_Agent/collect/jolokia_agent/kafka-connect.toml",
"content": "[[instances]]\n urls = [\"http://localhost:8080/jolokia\"]\n metrics_name_prefix = \"kafka_connect_\"\n\n [[processor_enum]]\n metrics = [\"status\"]\n\n [processor_enum.value_mappings]\n paused = 0\n running = 1\n unassigned = 2\n failed = 3\n destroyed = 4\n\n [instances.labels]\n input_type = \"kafka-connect\"\n\n # https://kafka.apache.org/documentation/#connect_monitoring\n [[instances.metric]]\n name = \"connectWorkerMetrics\"\n mbean = \"kafka.connect:type=connect-worker-metrics\"\n paths = [\"connector-count\", \"connector-startup-attempts-total\", \"connector-startup-failure-percentage\", \"connector-startup-failure-total\", \"connector-startup-success-percentage\", \"connector-startup-success-total\", \"task-count\", \"task-startup-attempts-total\", \"task-startup-failure-percentage\", \"task-startup-failure-total\", \"task-startup-success-percentage\", \"task-startup-success-total\"]\n\n [[instances.metric]]\n name = \"connectWorkerMetrics\"\n mbean = \"kafka.connect:type=connect-worker-metrics,connector=*\"\n paths = [\"connector-destroyed-task-count\", \"connector-failed-task-count\", \"connector-paused-task-count\", \"connector-running-task-count\", \"connector-total-task-count\", \"connector-unassigned-task-count\"]\n tag_keys = [\"connector\"]\n\n [[instances.metric]]\n name = \"connectWorkerRebalanceMetrics\"\n mbean = \"kafka.connect:type=connect-worker-rebalance-metrics\"\n paths = [\"completed-rebalances-total\", \"connect-protocol\", \"epoch\", \"leader-name\", \"rebalance-avg-time-ms\", \"rebalance-max-time-ms\", \"rebalancing\", \"time-since-last-rebalance-ms\"]\n\n [[instances.metric]]\n name = \"connectorMetrics\"\n mbean = \"kafka.connect:type=connector-metrics,connector=*\"\n paths = [\"connector-class\", \"connector-version\", \"connector-type\", \"status\"]\n tag_keys = [\"connector\"]\n\n [[instances.metric]]\n name = \"connectorTaskMetrics\"\n mbean = \"kafka.connect:type=connector-task-metrics,connector=*,task=*\"\n paths = [\"batch-size-avg\", \"batch-size-max\", \"offset-commit-avg-time-ms\", \"offset-commit-failure-percentage\", \"offset-commit-max-time-ms\", \"offset-commit-success-percentage\", \"pause-ratio\", \"running-ratio\", \"status\"]\n tag_keys = [\"connector\", \"task\"]\n\n [[instances.metric]]\n name = \"sinkTaskMetrics\"\n mbean = \"kafka.connect:type=sink-task-metrics,connector=*,task=*\"\n paths = [\"offset-commit-completion-rate\", \"offset-commit-completion-total\", \"offset-commit-seq-no\", \"offset-commit-skip-rate\", \"offset-commit-skip-total\", \"partition-count\", \"put-batch-avg-time-ms\", \"put-batch-max-time-ms\", \"sink-record-active-count\", \"sink-record-active-count-avg\", \"sink-record-active-count-max\", \"sink-record-lag-max\", \"sink-record-read-rate\", \"sink-record-read-total\", \"sink-record-send-rate\", \"sink-record-send-total\"]\n tag_keys = [\"connector\", \"task\"]\n\n [[instances.metric]]\n name = \"sourceTaskMetrics\"\n mbean = \"kafka.connect:type=source-task-metrics,connector=*,task=*\"\n paths = [\"poll-batch-avg-time-ms\", \"poll-batch-max-time-ms\", \"source-record-active-count\", \"source-record-active-count-avg\", \"source-record-active-count-max\", \"source-record-poll-rate\", \"source-record-poll-total\", \"source-record-write-rate\", \"source-record-write-total\"]\n tag_keys = [\"connector\", \"task\"]\n\n [[instances.metric]]\n name = \"taskErrorMetrics\"\n mbean = \"kafka.connect:type=task-error-metrics,connector=*,task=*\"\n paths = [\"deadletterqueue-produce-failures\", \"deadletterqueue-produce-requests\", \"last-error-timestamp\", \"total-errors-logged\", \"total-record-errors\", \"total-record-failures\", \"total-records-skipped\", \"total-retries\"]\n tag_keys = [\"connector\", \"task\"]\n\n # https://kafka.apache.org/documentation/#selector_monitoring\n [[instances.metric]]\n name = \"connectMetrics\"\n mbean = \"kafka.connect:type=connect-metrics,client-id=*\"\n paths = [\"connection-close-rate\", \"connection-close-total\", \"connection-creation-rate\", \"connection-creation-total\", \"network-io-rate\", \"network-io-total\", \"outgoing-byte-rate\", \"outgoing-byte-total\", \"request-rate\", \"request-total\", \"request-size-avg\", \"request-size-max\", \"incoming-byte-rate\", \"incoming-byte-rate\", \"incoming-byte-total\", \"response-rate\", \"response-total\", \"select-rate\", \"select-total\", \"io-wait-time-ns-avg\", \"io-wait-ratio\", \"io-time-ns-avg\", \"io-ratio\", \"connection-count\", \"successful-authentication-rate\", \"successful-authentication-total\", \"failed-authentication-rate\", \"failed-authentication-total\", \"successful-reauthentication-rate\", \"successful-reauthentication-total\", \"reauthentication-latency-max\", \"reauthentication-latency-avg\", \"failed-reauthentication-rate\", \"failed-reauthentication-total\", \"successful-authentication-no-reauth-total\"]\n tag_keys = [\"client-id\"]\n\n # https://kafka.apache.org/documentation/#common_node_monitoring\n [[instances.metric]]\n name = \"connectNodeMetrics\"\n mbean = \"kafka.connect:type=connect-node-metrics,client-id=*,node-id=*\"\n paths = [\"outgoing-byte-rate\", \"outgoing-byte-total\", \"request-rate\", \"request-total\", \"request-size-avg\", \"request-size-max\", \"incoming-byte-rate\", \"incoming-byte-total\", \"request-latency-avg\", \"request-latency-max\", \"response-rate\", \"response-total\"]\n tag_keys = [\"client-id\", \"node-id\"]\n\n [[instances.metric]]\n name = \"appInfo\"\n mbean = \"kafka.connect:type=app-info,client-id=*\"\n paths = [\"start-time-ms\", \"commit-id\", \"version\"]\n tag_keys = [\"client-id\"]\n\n [[instances.metric]]\n name = \"connectCoordinatorMetrics\"\n mbean = \"kafka.connect:type=connect-coordinator-metrics,client-id=*\"\n paths = [\"join-time-max\", \"failed-rebalance-rate-per-hour\", \"rebalance-latency-total\", \"sync-time-avg\", \"join-rate\", \"sync-rate\", \"failed-rebalance-total\", \"rebalance-total\", \"last-heartbeat-seconds-ago\", \"heartbeat-rate\", \"join-time-avg\", \"sync-total\", \"rebalance-latency-max\", \"sync-time-max\", \"last-rebalance-seconds-ago\", \"rebalance-rate-per-hour\", \"assigned-connectors\", \"heartbeat-total\", \"assigned-tasks\", \"heartbeat-response-time-max\", \"rebalance-latency-avg\", \"join-total\"]\n tag_keys = [\"client-id\"]"
},
{
"path": "integrations/Jolokia_Agent/collect/jolokia_agent/kafka.toml",
"content": "[[instances]]\n metrics_name_prefix = \"kafka_\"\n \n ## If you intend to use \"non_negative_derivative(1s)\" with \"*.count\" fields, you don't need precalculated fields.\n # fielddrop = [\n # \"*.EventType\",\n # \"*.FifteenMinuteRate\",\n # \"*.FiveMinuteRate\",\n # \"*.MeanRate\",\n # \"*.OneMinuteRate\",\n # \"*.RateUnit\",\n # \"*.LatencyUnit\",\n # \"*.50thPercentile\",\n # \"*.75thPercentile\",\n # \"*.95thPercentile\",\n # \"*.98thPercentile\",\n # \"*.99thPercentile\",\n # \"*.999thPercentile\",\n # \"*.Min\",\n # \"*.Mean\",\n # \"*.Max\",\n # \"*.StdDev\"\n # ]\n \n urls = [\"http://localhost:8080/jolokia\"]\n\n [[instances.metric]]\n name = \"controller\"\n mbean = \"kafka.controller:name=*,type=*\"\n field_prefix = \"$1.\"\n\n [[instances.metric]]\n name = \"replica_manager\"\n mbean = \"kafka.server:name=*,type=ReplicaManager\"\n field_prefix = \"$1.\"\n\n [[instances.metric]]\n name = \"purgatory\"\n mbean = \"kafka.server:delayedOperation=*,name=*,type=DelayedOperationPurgatory\"\n field_prefix = \"$1.\"\n field_name = \"$2\"\n\n [[instances.metric]]\n name = \"zookeeper\"\n mbean = \"kafka.server:name=*,type=SessionExpireListener\"\n field_prefix = \"$1.\"\n\n [[instances.metric]]\n name = \"user\"\n mbean = \"kafka.server:user=*,type=Request\"\n field_prefix = \"\"\n tag_keys = [\"user\"]\n\n [[instances.metric]]\n name = \"request\"\n mbean = \"kafka.network:name=*,request=*,type=RequestMetrics\"\n field_prefix = \"$1.\"\n tag_keys = [\"request\"]\n\n [[instances.metric]]\n name = \"topics\"\n mbean = \"kafka.server:name=*,type=BrokerTopicMetrics\"\n field_prefix = \"$1.\"\n\n [[instances.metric]]\n name = \"topic\"\n mbean = \"kafka.server:name=*,topic=*,type=BrokerTopicMetrics\"\n field_prefix = \"$1.\"\n tag_keys = [\"topic\"]\n\n [[instances.metric]]\n name = \"partition\"\n mbean = \"kafka.log:name=*,partition=*,topic=*,type=Log\"\n field_name = \"$1\"\n tag_keys = [\"topic\", \"partition\"]\n\n [[instances.metric]]\n name = \"partition\"\n mbean = \"kafka.cluster:name=UnderReplicated,partition=*,topic=*,type=Partition\"\n field_name = \"UnderReplicatedPartitions\"\n tag_keys = [\"topic\", \"partition\"]\n\n## If you have multiple instances of Kafka on the server, use 'jolokia_agent_url' as identity of each instance\n# [[processors.rename]]\n# namepass = [\"kafka_*\"]\n# order = 1\n# [[processors.rename.replace]]\n# tag = \"jolokia_agent_url\"\n# dest = \"instance\"\n# \n# [[processors.regex]]\n# namepass = [\"kafka_*\"]\n# order = 2\n# [[processors.regex.tags]]\n# key = \"instance\"\n# pattern = \"^.+:8080/.+$\"\n# replacement = \"0\"\n# [[processors.regex.tags]]\n# key = \"instance\"\n# pattern = \"^.+:8081/.+$\"\n# replacement = \"1\"\n# [[processors.regex.tags]]\n# key = \"instance\"\n# pattern = \"^.+:8082/.+$\"\n# replacement = \"2\"\n"
},
{
"path": "integrations/Jolokia_Agent/collect/jolokia_agent/tomcat.toml",
"content": "[[instances]]\n urls = [\"http://localhost:8080/jolokia\"]\n metrics_name_prefix = \"tomcat_\"\n\n ### JVM Generic\n\n [[instances.metric]]\n name = \"OperatingSystem\"\n mbean = \"java.lang:type=OperatingSystem\"\n paths = [\"ProcessCpuLoad\",\"SystemLoadAverage\",\"SystemCpuLoad\"]\n\n [[instances.metric]]\n name = \"jvm_runtime\"\n mbean = \"java.lang:type=Runtime\"\n paths = [\"Uptime\"]\n\n [[instances.metric]]\n name = \"jvm_memory\"\n mbean = \"java.lang:type=Memory\"\n paths = [\"HeapMemoryUsage\", \"NonHeapMemoryUsage\", \"ObjectPendingFinalizationCount\"]\n\n [[instances.metric]]\n name = \"jvm_garbage_collector\"\n mbean = \"java.lang:name=*,type=GarbageCollector\"\n paths = [\"CollectionTime\", \"CollectionCount\"]\n tag_keys = [\"name\"]\n\n [[instances.metric]]\n name = \"jvm_memory_pool\"\n mbean = \"java.lang:name=*,type=MemoryPool\"\n paths = [\"Usage\", \"PeakUsage\", \"CollectionUsage\"]\n tag_keys = [\"name\"]\n tag_prefix = \"pool_\"\n\n ### TOMCAT\n\n [[instances.metric]]\n name = \"GlobalRequestProcessor\"\n mbean = \"Catalina:name=*,type=GlobalRequestProcessor\"\n paths = [\"requestCount\",\"bytesReceived\",\"bytesSent\",\"processingTime\",\"errorCount\"]\n tag_keys = [\"name\"]\n\n [[instances.metric]]\n name = \"JspMonitor\"\n mbean = \"Catalina:J2EEApplication=*,J2EEServer=*,WebModule=*,name=jsp,type=JspMonitor\"\n paths = [\"jspReloadCount\",\"jspCount\",\"jspUnloadCount\"]\n tag_keys = [\"J2EEApplication\",\"J2EEServer\",\"WebModule\"]\n\n [[instances.metric]]\n name = \"ThreadPool\"\n mbean = \"Catalina:name=*,type=ThreadPool\"\n paths = [\"maxThreads\",\"currentThreadCount\",\"currentThreadsBusy\"]\n tag_keys = [\"name\"]\n\n [[instances.metric]]\n name = \"Servlet\"\n mbean = \"Catalina:J2EEApplication=*,J2EEServer=*,WebModule=*,j2eeType=Servlet,name=*\"\n paths = [\"processingTime\",\"errorCount\",\"requestCount\"]\n tag_keys = [\"name\",\"J2EEApplication\",\"J2EEServer\",\"WebModule\"]\n\n [[instances.metric]]\n name = \"Cache\"\n mbean = \"Catalina:context=*,host=*,name=Cache,type=WebResourceRoot\"\n paths = [\"hitCount\",\"lookupCount\"]\n tag_keys = [\"context\",\"host\"]\n"
},
{
"path": "integrations/Jolokia_Agent/collect/jolokia_agent/weblogic.toml",
"content": "[[instances]]\n urls = [\"http://localhost:8080/jolokia\"]\n metrics_name_prefix = \"weblogic_\"\n\n ### JVM Generic\n\n [[instances.metric]]\n name = \"OperatingSystem\"\n mbean = \"java.lang:type=OperatingSystem\"\n paths = [\"ProcessCpuLoad\",\"SystemLoadAverage\",\"SystemCpuLoad\"]\n\n [[instances.metric]]\n name = \"jvm_runtime\"\n mbean = \"java.lang:type=Runtime\"\n paths = [\"Uptime\"]\n\n [[instances.metric]]\n name = \"jvm_memory\"\n mbean = \"java.lang:type=Memory\"\n paths = [\"HeapMemoryUsage\", \"NonHeapMemoryUsage\", \"ObjectPendingFinalizationCount\"]\n\n [[instances.metric]]\n name = \"jvm_garbage_collector\"\n mbean = \"java.lang:name=*,type=GarbageCollector\"\n paths = [\"CollectionTime\", \"CollectionCount\"]\n tag_keys = [\"name\"]\n\n [[instances.metric]]\n name = \"jvm_memory_pool\"\n mbean = \"java.lang:name=*,type=MemoryPool\"\n paths = [\"Usage\", \"PeakUsage\", \"CollectionUsage\"]\n tag_keys = [\"name\"]\n tag_prefix = \"pool_\"\n\n ### WLS\n\n [[instances.metric]]\n name = \"JTARuntime\"\n mbean = \"com.bea:Name=JTARuntime,ServerRuntime=*,Type=JTARuntime\"\n paths = [\"SecondsActiveTotalCount\",\"TransactionRolledBackTotalCount\",\"TransactionRolledBackSystemTotalCount\",\"TransactionRolledBackAppTotalCount\",\"TransactionRolledBackResourceTotalCount\",\"TransactionHeuristicsTotalCount\",\"TransactionAbandonedTotalCount\",\"TransactionTotalCount\",\"TransactionRolledBackTimeoutTotalCount\",\"ActiveTransactionsTotalCount\",\"TransactionCommittedTotalCount\"]\n tag_keys = [\"ServerRuntime\"]\n tag_prefix = \"wls_\"\n\n [[instances.metric]]\n name = \"ThreadPoolRuntime\"\n mbean = \"com.bea:Name=ThreadPoolRuntime,ServerRuntime=*,Type=ThreadPoolRuntime\"\n paths = [\"StuckThreadCount\",\"CompletedRequestCount\",\"ExecuteThreadTotalCount\",\"ExecuteThreadIdleCount\",\"StandbyThreadCount\",\"Throughput\",\"HoggingThreadCount\",\"PendingUserRequestCount\"]\n tag_keys = [\"ServerRuntime\"]\n tag_prefix = \"wls_\"\n\n [[instances.metric]]\n name = \"JMSRuntime\"\n mbean = \"com.bea:Name=*.jms,ServerRuntime=*,Type=JMSRuntime\"\n paths = [\"ConnectionsCurrentCount\",\"ConnectionsHighCount\",\"ConnectionsTotalCount\",\"JMSServersCurrentCount\",\"JMSServersHighCount\",\"JMSServersTotalCount\"]\n tag_keys = [\"name\",\"ServerRuntime\"]\n tag_prefix = \"wls_\"\n"
},
{
"path": "integrations/Jolokia_Agent/collect/jolokia_agent/zookeeper.toml",
"content": "[[instances]]\n urls = [\"http://localhost:8080/jolokia\"]\n name_prefix = \"zk_\"\n\n [[instances.metric]]\n name = \"quorum\"\n mbean = \"org.apache.ZooKeeperService:name0=*\"\n tag_keys = [\"name0\"]\n\n [[instances.metric]]\n name = \"leader\"\n mbean = \"org.apache.ZooKeeperService:name0=*,name1=*,name2=Leader\"\n tag_keys = [\"name1\"]\n\n [[instances.metric]]\n name = \"follower\"\n mbean = \"org.apache.ZooKeeperService:name0=*,name1=*,name2=Follower\"\n tag_keys = [\"name1\"]\n"
},
{
"path": "integrations/Jolokia_Agent/markdown/README.md",
"content": "# Jolokia Agent\n\nforked from telegraf/inputs.jolokia2_agent\n\n## 停用该插件\n\n- 方法一:把 `input.jolokia_agent_misc` 目录改个别的名字,不用 `input.` 打头\n- 方法二:xx.toml 中的配置留空"
},
{
"path": "integrations/Kafka/alerts/kafka_by_categraf.json",
"content": "[\n {\n \"id\": 0,\n \"group_id\": 0,\n \"cate\": \"prometheus\",\n \"datasource_ids\": [\n 52\n ],\n \"cluster\": \"\",\n \"name\": \"kafka 数据有丢失风险-副本数小于3\",\n \"note\": \"\",\n \"prod\": \"metric\",\n \"algorithm\": \"\",\n \"algo_params\": null,\n \"delay\": 0,\n \"severity\": 2,\n \"severities\": [\n 2\n ],\n \"disabled\": 1,\n \"prom_for_duration\": 60,\n \"prom_ql\": \"\",\n \"rule_config\": {\n \"algo_params\": null,\n \"inhibit\": false,\n \"prom_ql\": \"\",\n \"queries\": [\n {\n \"prom_ql\": \"sum(kafka_topic_partition_in_sync_replica) by (topic) \\u003c 3\",\n \"severity\": 2\n }\n ],\n \"severity\": 0\n },\n \"prom_eval_interval\": 15,\n \"enable_stime\": \"00:00\",\n \"enable_stimes\": [\n \"00:00\"\n ],\n \"enable_etime\": \"23:59\",\n \"enable_etimes\": [\n \"23:59\"\n ],\n \"enable_days_of_week\": [\n \"1\",\n \"2\",\n \"3\",\n \"4\",\n \"5\",\n \"6\",\n \"0\"\n ],\n \"enable_days_of_weeks\": [\n [\n \"1\",\n \"2\",\n \"3\",\n \"4\",\n \"5\",\n \"6\",\n \"0\"\n ]\n ],\n \"enable_in_bg\": 0,\n \"notify_recovered\": 1,\n \"notify_channels\": [],\n \"notify_groups_obj\": null,\n \"notify_groups\": null,\n \"notify_repeat_step\": 60,\n \"notify_max_number\": 0,\n \"recover_duration\": 0,\n \"callbacks\": [],\n \"runbook_url\": \"\",\n \"append_tags\": [\n \"service=kafka\",\n \"type=categraf\"\n ],\n \"annotations\": null,\n \"extra_config\": null,\n \"create_at\": 0,\n \"create_by\": \"\",\n \"update_at\": 0,\n \"update_by\": \"\",\n \"uuid\": 1717556327567317000\n },\n {\n \"id\": 0,\n \"group_id\": 0,\n \"cate\": \"prometheus\",\n \"datasource_ids\": [\n 52\n ],\n \"cluster\": \"\",\n \"name\": \"kafka 服务宕机\",\n \"note\": \"\",\n \"prod\": \"metric\",\n \"algorithm\": \"\",\n \"algo_params\": null,\n \"delay\": 0,\n \"severity\": 1,\n \"severities\": [\n 1\n ],\n \"disabled\": 1,\n \"prom_for_duration\": 60,\n \"prom_ql\": \"\",\n \"rule_config\": {\n \"algo_params\": null,\n \"inhibit\": false,\n \"prom_ql\": \"\",\n \"queries\": [\n {\n \"prom_ql\": \"kafka_broker_info{service=~\\\"kafka\\\"} \\u003c 1\",\n \"severity\": 1\n }\n ],\n \"severity\": 0\n },\n \"prom_eval_interval\": 60,\n \"enable_stime\": \"00:00\",\n \"enable_stimes\": [\n \"00:00\"\n ],\n \"enable_etime\": \"23:59\",\n \"enable_etimes\": [\n \"23:59\"\n ],\n \"enable_days_of_week\": [\n \"1\",\n \"2\",\n \"3\",\n \"4\",\n \"5\",\n \"6\",\n \"0\"\n ],\n \"enable_days_of_weeks\": [\n [\n \"1\",\n \"2\",\n \"3\",\n \"4\",\n \"5\",\n \"6\",\n \"0\"\n ]\n ],\n \"enable_in_bg\": 0,\n \"notify_recovered\": 1,\n \"notify_channels\": [],\n \"notify_groups_obj\": null,\n \"notify_groups\": null,\n \"notify_repeat_step\": 60,\n \"notify_max_number\": 0,\n \"recover_duration\": 0,\n \"callbacks\": [],\n \"runbook_url\": \"\",\n \"append_tags\": [\n \"type=categraf\",\n \"service=kafka\"\n ],\n \"annotations\": null,\n \"extra_config\": null,\n \"create_at\": 0,\n \"create_by\": \"\",\n \"update_at\": 0,\n \"update_by\": \"\",\n \"uuid\": 1717556327568065000\n },\n {\n \"id\": 0,\n \"group_id\": 0,\n \"cate\": \"prometheus\",\n \"datasource_ids\": [\n 52\n ],\n \"cluster\": \"\",\n \"name\": \"kafka 消费能力不足-延迟超过5分钟\",\n \"note\": \"\",\n \"prod\": \"metric\",\n \"algorithm\": \"\",\n \"algo_params\": null,\n \"delay\": 0,\n \"severity\": 2,\n \"severities\": [\n 2\n ],\n \"disabled\": 1,\n \"prom_for_duration\": 60,\n \"prom_ql\": \"\",\n \"rule_config\": {\n \"algo_params\": null,\n \"inhibit\": false,\n \"prom_ql\": \"\",\n \"queries\": [\n {\n \"prom_ql\": \"max(kafka_consumer_lag_millis) by (topic, consumergroup) / 1000 \\u003e 300\",\n \"severity\": 2\n }\n ],\n \"severity\": 0\n },\n \"prom_eval_interval\": 15,\n \"enable_stime\": \"00:00\",\n \"enable_stimes\": [\n \"00:00\"\n ],\n \"enable_etime\": \"23:59\",\n \"enable_etimes\": [\n \"23:59\"\n ],\n \"enable_days_of_week\": [\n \"1\",\n \"2\",\n \"3\",\n \"4\",\n \"5\",\n \"6\",\n \"0\"\n ],\n \"enable_days_of_weeks\": [\n [\n \"1\",\n \"2\",\n \"3\",\n \"4\",\n \"5\",\n \"6\",\n \"0\"\n ]\n ],\n \"enable_in_bg\": 0,\n \"notify_recovered\": 1,\n \"notify_channels\": [],\n \"notify_groups_obj\": null,\n \"notify_groups\": null,\n \"notify_repeat_step\": 60,\n \"notify_max_number\": 0,\n \"recover_duration\": 0,\n \"callbacks\": [],\n \"runbook_url\": \"\",\n \"append_tags\": [\n \"service=kafka\",\n \"type=categraf\"\n ],\n \"annotations\": null,\n \"extra_config\": null,\n \"create_at\": 0,\n \"create_by\": \"\",\n \"update_at\": 0,\n \"update_by\": \"\",\n \"uuid\": 1717556327568624000\n }\n]"
},
{
"path": "integrations/Kafka/alerts/kafka_by_exporter.json",
"content": "[\n {\n \"id\": 0,\n \"group_id\": 0,\n \"cate\": \"prometheus\",\n \"datasource_ids\": [\n 52\n ],\n \"cluster\": \"\",\n \"name\": \"Insufficient consumption ability - delay exceeds 5 minutes - exporter\",\n \"note\": \"\",\n \"prod\": \"metric\",\n \"algorithm\": \"\",\n \"algo_params\": null,\n \"delay\": 0,\n \"severity\": 2,\n \"severities\": [\n 2\n ],\n \"disabled\": 1,\n \"prom_for_duration\": 60,\n \"prom_ql\": \"\",\n \"rule_config\": {\n \"algo_params\": null,\n \"inhibit\": false,\n \"prom_ql\": \"\",\n \"queries\": [\n {\n \"prom_ql\": \"kafka_consumer_lag_millis / 1000 \\u003e 300\",\n \"severity\": 2\n }\n ],\n \"severity\": 0\n },\n \"prom_eval_interval\": 15,\n \"enable_stime\": \"00:00\",\n \"enable_stimes\": [\n \"00:00\"\n ],\n \"enable_etime\": \"23:59\",\n \"enable_etimes\": [\n \"23:59\"\n ],\n \"enable_days_of_week\": [\n \"1\",\n \"2\",\n \"3\",\n \"4\",\n \"5\",\n \"6\",\n \"0\"\n ],\n \"enable_days_of_weeks\": [\n [\n \"1\",\n \"2\",\n \"3\",\n \"4\",\n \"5\",\n \"6\",\n \"0\"\n ]\n ],\n \"enable_in_bg\": 0,\n \"notify_recovered\": 1,\n \"notify_channels\": [],\n \"notify_groups_obj\": null,\n \"notify_groups\": null,\n \"notify_repeat_step\": 60,\n \"notify_max_number\": 0,\n \"recover_duration\": 0,\n \"callbacks\": [],\n \"runbook_url\": \"\",\n \"append_tags\": [\n \"service=kafka\"\n ],\n \"annotations\": null,\n \"extra_config\": null,\n \"create_at\": 0,\n \"create_by\": \"\",\n \"update_at\": 0,\n \"update_by\": \"\",\n \"uuid\": 1717556327569664000\n },\n {\n \"id\": 0,\n \"group_id\": 0,\n \"cate\": \"prometheus\",\n \"datasource_ids\": [\n 52\n ],\n \"cluster\": \"\",\n \"name\": \"Risk of data loss - number of replicas less than 3 - exporter\",\n \"note\": \"\",\n \"prod\": \"metric\",\n \"algorithm\": \"\",\n \"algo_params\": null,\n \"delay\": 0,\n \"severity\": 2,\n \"severities\": [\n 2\n ],\n \"disabled\": 1,\n \"prom_for_duration\": 60,\n \"prom_ql\": \"\",\n \"rule_config\": {\n \"algo_params\": null,\n \"inhibit\": false,\n \"prom_ql\": \"\",\n \"queries\": [\n {\n \"prom_ql\": \"sum(kafka_topic_partition_in_sync_replica) by (topic) \\u003c 3 - exporter\",\n \"severity\": 2\n }\n ],\n \"severity\": 0\n },\n \"prom_eval_interval\": 15,\n \"enable_stime\": \"00:00\",\n \"enable_stimes\": [\n \"00:00\"\n ],\n \"enable_etime\": \"23:59\",\n \"enable_etimes\": [\n \"23:59\"\n ],\n \"enable_days_of_week\": [\n \"1\",\n \"2\",\n \"3\",\n \"4\",\n \"5\",\n \"6\",\n \"0\"\n ],\n \"enable_days_of_weeks\": [\n [\n \"1\",\n \"2\",\n \"3\",\n \"4\",\n \"5\",\n \"6\",\n \"0\"\n ]\n ],\n \"enable_in_bg\": 0,\n \"notify_recovered\": 1,\n \"notify_channels\": [],\n \"notify_groups_obj\": null,\n \"notify_groups\": null,\n \"notify_repeat_step\": 60,\n \"notify_max_number\": 0,\n \"recover_duration\": 0,\n \"callbacks\": [],\n \"runbook_url\": \"\",\n \"append_tags\": [\n \"service=kafka\"\n ],\n \"annotations\": null,\n \"extra_config\": null,\n \"create_at\": 0,\n \"create_by\": \"\",\n \"update_at\": 0,\n \"update_by\": \"\",\n \"uuid\": 1717556327570285000\n }\n]"
},
{
"path": "integrations/Kafka/collect/kafka/kafka.toml",
"content": "# # collect interval\n# interval = 15\n\n############################################################################\n# !!! uncomment [[instances]] to enable this plugin\n[[instances]]\n# # interval = global.interval * interval_times\n# interval_times = 1\n\n# append some labels to metrics\n# cluster is a preferred tag with the cluster name. If none is provided, the first of kafka_uris will be used\nlabels = { cluster=\"kafka-cluster-01\" }\n\n# log level only for kafka exporter\nlog_level = \"error\"\n\n# Address (host:port) of Kafka server.\n# kafka_uris = [\"127.0.0.1:9092\",\"127.0.0.1:9092\",\"127.0.0.1:9092\"]\nkafka_uris = []\n\n# Connect using SASL/PLAIN\n# Default is false\n# use_sasl = false\n\n# Only set this to false if using a non-Kafka SASL proxy\n# Default is true\n# use_sasl_handshake = false\n\n# SASL user name\n# sasl_username = \"username\"\n\n# SASL user password\n# sasl_password = \"password\"\n\n# The SASL SCRAM SHA algorithm sha256 or sha512 as mechanism\n# sasl_mechanism = \"\"\n\n# Connect using TLS\n# use_tls = false\n\n# The optional certificate authority file for TLS client authentication\n# ca_file = \"\"\n\n# The optional certificate file for TLS client authentication\n# cert_file = \"\"\n\n# The optional key file for TLS client authentication\n# key_file = \"\"\n\n# If true, the server's certificate will not be checked for validity. This will make your HTTPS connections insecure\n# insecure_skip_verify = true\n\n# Kafka broker version\n# Default is 2.0.0\n# kafka_version = \"2.0.0\"\n\n# if you need to use a group from zookeeper\n# Default is false\n# use_zookeeper_lag = false\n\n# Address array (hosts) of zookeeper server.\n# zookeeper_uris = []\n\n# Metadata refresh interval\n# Default is 1m\n# metadata_refresh_interval = \"1m\"\n\n# Whether show the offset/lag for all consumer group, otherwise, only show connected consumer groups, default is true\n# Default is true\n# offset_show_all = true\n\n# If true, all scrapes will trigger kafka operations otherwise, they will share results. WARN: This should be disabled on large clusters\n# Default is false\n# allow_concurrency = false\n\n# Maximum number of offsets to store in the interpolation table for a partition\n# Default is 1000\n# max_offsets = 1000\n\n# How frequently should the interpolation table be pruned, in seconds.\n# Default is 30\n# prune_interval_seconds = 30\n\n# Regex filter for topics to be monitored\n# Default is \".*\"\n# topics_filter_regex = \".*\"\n\n# Regex filter for consumer groups to be monitored\n# Default is \".*\"\n# groups_filter_regex = \".*\"\n\n# if rename kafka_consumergroup_uncommitted_offsets to kafka_consumergroup_lag\n# Default is false\n# rename_uncommit_offset_to_lag = false\n\n\n# if disable calculating lag rate\n# Default is false\n# disable_calculate_lag_rate = false"
},
{
"path": "integrations/Kafka/dashboards/kafka_by_categraf.json",
"content": "{\n \"id\": 0,\n \"group_id\": 0,\n \"name\": \"Kafka By Categraf\",\n \"ident\": \"\",\n \"tags\": \"Kafka Prometheus Categraf\",\n \"create_at\": 0,\n \"create_by\": \"\",\n \"update_at\": 0,\n \"update_by\": \"\",\n \"configs\": {\n \"links\": [\n {\n \"targetBlank\": true,\n \"title\": \"文档\",\n \"url\": \"https://github.com/ccfos/nightingale/tree/main/integrations/kafka/markdown/\"\n }\n ],\n \"panels\": [\n {\n \"collapsed\": true,\n \"id\": \"51502c3a-dd6f-41c7-b8f1-87b88826c96e\",\n \"layout\": {\n \"h\": 1,\n \"i\": \"51502c3a-dd6f-41c7-b8f1-87b88826c96e\",\n \"isResizable\": false,\n \"w\": 24,\n \"x\": 0,\n \"y\": 0\n },\n \"name\": \"overview\",\n \"type\": \"row\"\n },\n {\n \"custom\": {\n \"calc\": \"lastNotNull\",\n \"colSpan\": 1,\n \"colorMode\": \"value\",\n \"textMode\": \"value\",\n \"textSize\": {\n \"value\": 50\n }\n },\n \"datasourceCate\": \"prometheus\",\n \"datasourceValue\": \"${datasource}\",\n \"id\": \"e2c1d271-ec43-4821-aa19-451e856af755\",\n \"layout\": {\n \"h\": 3,\n \"i\": \"e2c1d271-ec43-4821-aa19-451e856af755\",\n \"isResizable\": true,\n \"w\": 6,\n \"x\": 0,\n \"y\": 1\n },\n \"name\": \"brokers\",\n \"options\": {\n \"standardOptions\": {}\n },\n \"targets\": [\n {\n \"expr\": \"kafka_brokers{cluster=\\\"$cluster\\\"}\",\n \"refId\": \"A\"\n }\n ],\n \"type\": \"stat\",\n \"version\": \"2.0.0\"\n },\n {\n \"custom\": {\n \"calc\": \"lastNotNull\",\n \"colSpan\": 1,\n \"colorMode\": \"value\",\n \"textMode\": \"value\",\n \"textSize\": {\n \"value\": 50\n }\n },\n \"datasourceCate\": \"prometheus\",\n \"datasourceValue\": \"${datasource}\",\n \"id\": \"fd3a0b9f-fd67-4360-a94c-869fee7b5b98\",\n \"layout\": {\n \"h\": 3,\n \"i\": \"fd3a0b9f-fd67-4360-a94c-869fee7b5b98\",\n \"isResizable\": true,\n \"w\": 6,\n \"x\": 6,\n \"y\": 1\n },\n \"name\": \"topics\",\n \"options\": {\n \"standardOptions\": {}\n },\n \"targets\": [\n {\n \"expr\": \"count(count by (topic) (kafka_topic_partitions{cluster=\\\"$cluster\\\"}))\",\n \"refId\": \"A\"\n }\n ],\n \"type\": \"stat\",\n \"version\": \"2.0.0\"\n },\n {\n \"custom\": {\n \"calc\": \"lastNotNull\",\n \"colSpan\": 1,\n \"colorMode\": \"value\",\n \"textMode\": \"value\",\n \"textSize\": {\n \"value\": 50\n }\n },\n \"datasourceCate\": \"prometheus\",\n \"datasourceValue\": \"${datasource}\",\n \"id\": \"e228d857-746b-41b6-8d2d-0152453c46f4\",\n \"layout\": {\n \"h\": 3,\n \"i\": \"e228d857-746b-41b6-8d2d-0152453c46f4\",\n \"isResizable\": true,\n \"w\": 6,\n \"x\": 12,\n \"y\": 1\n },\n \"name\": \"partitions\",\n \"options\": {\n \"standardOptions\": {}\n },\n \"targets\": [\n {\n \"expr\": \"sum(kafka_topic_partitions{cluster=\\\"$cluster\\\"})\",\n \"refId\": \"A\"\n }\n ],\n \"type\": \"stat\",\n \"version\": \"2.0.0\"\n },\n {\n \"custom\": {\n \"calc\": \"lastNotNull\",\n \"colSpan\": 1,\n \"colorMode\": \"value\",\n \"textMode\": \"valueAndName\",\n \"textSize\": {}\n },\n \"datasourceCate\": \"prometheus\",\n \"datasourceValue\": \"${datasource}\",\n \"id\": \"85438099-8d6b-4817-b9b9-1d0ed36029cd\",\n \"layout\": {\n \"h\": 3,\n \"i\": \"85438099-8d6b-4817-b9b9-1d0ed36029cd\",\n \"isResizable\": true,\n \"w\": 6,\n \"x\": 18,\n \"y\": 1\n },\n \"name\": \"Replicas\",\n \"options\": {\n \"standardOptions\": {}\n },\n \"targets\": [\n {\n \"expr\": \"sum(kafka_topic_partition_replicas{cluster=\\\"$cluster\\\"})\",\n \"refId\": \"A\"\n }\n ],\n \"type\": \"stat\",\n \"version\": \"2.0.0\"\n },\n {\n \"collapsed\": true,\n \"id\": \"0db4aac4-86cf-44cd-950e-6c6a99be8ff4\",\n \"layout\": {\n \"h\": 1,\n \"i\": \"0db4aac4-86cf-44cd-950e-6c6a99be8ff4\",\n \"isResizable\": false,\n \"w\": 24,\n \"x\": 0,\n \"y\": 4\n },\n \"name\": \"throughput\",\n \"type\": \"row\"\n },\n {\n \"custom\": {\n \"drawStyle\": \"lines\",\n \"fillOpacity\": 0.3,\n \"gradientMode\": \"opacity\",\n \"lineInterpolation\": \"smooth\",\n \"lineWidth\": 2,\n \"stack\": \"off\"\n },\n \"datasourceCate\": \"prometheus\",\n \"datasourceValue\": \"${datasource}\",\n \"id\": \"c2ec4036-3081-45cc-b672-024c6df93833\",\n \"layout\": {\n \"h\": 7,\n \"i\": \"c2ec4036-3081-45cc-b672-024c6df93833\",\n \"isResizable\": true,\n \"w\": 8,\n \"x\": 0,\n \"y\": 5\n },\n \"name\": \"Messages produced per second\",\n \"options\": {\n \"legend\": {\n \"displayMode\": \"hidden\"\n },\n \"standardOptions\": {},\n \"thresholds\": {},\n \"tooltip\": {\n \"mode\": \"all\",\n \"sort\": \"none\"\n }\n },\n \"targets\": [\n {\n \"expr\": \"sum(rate(kafka_topic_partition_current_offset{cluster=\\\"$cluster\\\"}[1m])) by (topic)\"\n }\n ],\n \"type\": \"timeseries\",\n \"version\": \"2.0.0\"\n },\n {\n \"custom\": {\n \"drawStyle\": \"lines\",\n \"fillOpacity\": 0.3,\n \"gradientMode\": \"opacity\",\n \"lineInterpolation\": \"smooth\",\n \"lineWidth\": 2,\n \"stack\": \"off\"\n },\n \"datasourceCate\": \"prometheus\",\n \"datasourceValue\": \"${datasource}\",\n \"id\": \"7ad651a6-c12c-4d46-8d01-749fa776faef\",\n \"layout\": {\n \"h\": 7,\n \"i\": \"7ad651a6-c12c-4d46-8d01-749fa776faef\",\n \"isResizable\": true,\n \"w\": 8,\n \"x\": 8,\n \"y\": 5\n },\n \"name\": \"Messages consumed per second\",\n \"options\": {\n \"legend\": {\n \"displayMode\": \"hidden\"\n },\n \"standardOptions\": {},\n \"thresholds\": {},\n \"tooltip\": {\n \"mode\": \"all\",\n \"sort\": \"none\"\n }\n },\n \"targets\": [\n {\n \"expr\": \"sum(rate(kafka_consumergroup_current_offset{cluster=\\\"$cluster\\\"}[1m])) by (topic)\"\n }\n ],\n \"type\": \"timeseries\",\n \"version\": \"2.0.0\"\n },\n {\n \"custom\": {\n \"drawStyle\": \"lines\",\n \"fillOpacity\": 0.3,\n \"gradientMode\": \"opacity\",\n \"lineInterpolation\": \"smooth\",\n \"lineWidth\": 2,\n \"stack\": \"off\"\n },\n \"datasourceCate\": \"prometheus\",\n \"datasourceValue\": \"${datasource}\",\n \"id\": \"855aa8f5-0c51-42d4-b9a4-5460b7cd0f5a\",\n \"layout\": {\n \"h\": 7,\n \"i\": \"855aa8f5-0c51-42d4-b9a4-5460b7cd0f5a\",\n \"isResizable\": true,\n \"w\": 8,\n \"x\": 16,\n \"y\": 5\n },\n \"name\": \"Latency by Consumer Group\",\n \"options\": {\n \"legend\": {\n \"displayMode\": \"hidden\"\n },\n \"standardOptions\": {\n \"util\": \"humantimeMilliseconds\"\n },\n \"thresholds\": {},\n \"tooltip\": {\n \"mode\": \"all\",\n \"sort\": \"none\"\n }\n },\n \"targets\": [\n {\n \"expr\": \"sum(kafka_consumer_lag_millis{cluster=\\\"$cluster\\\"}) by (consumergroup, topic)\",\n \"legend\": \"{{consumergroup}} (topic: {{topic}})\"\n }\n ],\n \"type\": \"timeseries\",\n \"version\": \"2.0.0\"\n },\n {\n \"collapsed\": true,\n \"id\": \"20166830-7f85-4665-8f39-bf904267af29\",\n \"layout\": {\n \"h\": 1,\n \"i\": \"20166830-7f85-4665-8f39-bf904267af29\",\n \"isResizable\": false,\n \"w\": 24,\n \"x\": 0,\n \"y\": 18\n },\n \"name\": \"patition/replicate\",\n \"type\": \"row\"\n },\n {\n \"custom\": {\n \"calc\": \"lastNotNull\",\n \"colorMode\": \"value\",\n \"displayMode\": \"seriesToRows\",\n \"showHeader\": true\n },\n \"datasourceCate\": \"prometheus\",\n \"datasourceValue\": \"${datasource}\",\n \"id\": \"8837a52e-c9eb-4afa-acc1-c3a5dac72d3b\",\n \"layout\": {\n \"h\": 7,\n \"i\": \"8837a52e-c9eb-4afa-acc1-c3a5dac72d3b\",\n \"isResizable\": true,\n \"w\": 12,\n \"x\": 0,\n \"y\": 19\n },\n \"name\": \"Partitions per Topic\",\n \"options\": {\n \"standardOptions\": {}\n },\n \"overrides\": [\n {}\n ],\n \"targets\": [\n {\n \"expr\": \"kafka_topic_partitions{cluster=\\\"$cluster\\\"}\",\n \"legend\": \"{{topic}}\",\n \"refId\": \"A\"\n }\n ],\n \"type\": \"table\",\n \"version\": \"2.0.0\"\n },\n {\n \"custom\": {\n \"calc\": \"lastNotNull\",\n \"colorMode\": \"value\",\n \"displayMode\": \"seriesToRows\",\n \"showHeader\": true\n },\n \"datasourceCate\": \"prometheus\",\n \"datasourceValue\": \"${datasource}\",\n \"description\": \"副本不同步预案\\n1. Restart the Zookeeper leader.\\n2. Restart the broker\\\\brokers that are not replicating some of the partitions.\",\n \"id\": \"dd615767-dda7-4da6-b37f-0d484553aac6\",\n \"layout\": {\n \"h\": 7,\n \"i\": \"dd615767-dda7-4da6-b37f-0d484553aac6\",\n \"isResizable\": true,\n \"w\": 12,\n \"x\": 12,\n \"y\": 19\n },\n \"name\": \"Partitions Under Replicated\",\n \"options\": {\n \"standardOptions\": {}\n },\n \"overrides\": [\n {}\n ],\n \"targets\": [\n {\n \"expr\": \"kafka_topic_partition_under_replicated_partition{cluster=\\\"$cluster\\\"}\",\n \"legend\": \"{{topic}}-{{partition}}\",\n \"refId\": \"A\"\n }\n ],\n \"type\": \"table\",\n \"version\": \"2.0.0\"\n }\n ],\n \"var\": [\n {\n \"definition\": \"prometheus\",\n \"name\": \"datasource\",\n \"type\": \"datasource\"\n },\n {\n \"datasource\": {\n \"cate\": \"prometheus\",\n \"value\": \"${datasource}\"\n },\n \"definition\": \"label_values(kafka_brokers, cluster)\",\n \"name\": \"cluster\",\n \"type\": \"query\"\n }\n ],\n \"version\": \"3.0.0\"\n },\n \"public\": 0,\n \"public_cate\": 0,\n \"bgids\": null,\n \"built_in\": 0,\n \"hide\": 0,\n \"uuid\": 1717556327571507000\n}"
},
{
"path": "integrations/Kafka/dashboards/kafka_by_exporter.json",
"content": "{\n \"id\": 0,\n \"group_id\": 0,\n \"name\": \"Kafka - exporter\",\n \"ident\": \"\",\n \"tags\": \"Kafka Prometheus \",\n \"create_at\": 0,\n \"create_by\": \"\",\n \"update_at\": 0,\n \"update_by\": \"\",\n \"configs\": {\n \"panels\": [\n {\n \"collapsed\": true,\n \"id\": \"a3ac9979-6e3a-42ae-9d52-ebddb8960dc4\",\n \"layout\": {\n \"h\": 1,\n \"i\": \"a3ac9979-6e3a-42ae-9d52-ebddb8960dc4\",\n \"w\": 24,\n \"x\": 0,\n \"y\": 0\n },\n \"name\": \"overview\",\n \"type\": \"row\"\n },\n {\n \"custom\": {\n \"calc\": \"lastNotNull\",\n \"colSpan\": 1,\n \"colorMode\": \"value\",\n \"textMode\": \"value\",\n \"textSize\": {\n \"value\": 50\n }\n },\n \"datasourceCate\": \"prometheus\",\n \"datasourceValue\": \"${prom}\",\n \"id\": \"ed68dc7b-4f01-4aef-ab10-20158aadfab7\",\n \"layout\": {\n \"h\": 3,\n \"i\": \"ed68dc7b-4f01-4aef-ab10-20158aadfab7\",\n \"w\": 8,\n \"x\": 8,\n \"y\": 1\n },\n \"name\": \"topics\",\n \"options\": {\n \"standardOptions\": {}\n },\n \"targets\": [\n {\n \"expr\": \"count(count by (topic) (kafka_topic_partitions))\",\n \"refId\": \"A\"\n }\n ],\n \"type\": \"stat\",\n \"version\": \"2.0.0\"\n },\n {\n \"custom\": {\n \"calc\": \"lastNotNull\",\n \"colSpan\": 1,\n \"colorMode\": \"value\",\n \"textMode\": \"value\",\n \"textSize\": {\n \"value\": 50\n }\n },\n \"datasourceCate\": \"prometheus\",\n \"datasourceValue\": \"${prom}\",\n \"id\": \"3678c9d7-cb0a-4114-a0cd-7a06b976f6b8\",\n \"layout\": {\n \"h\": 3,\n \"i\": \"3678c9d7-cb0a-4114-a0cd-7a06b976f6b8\",\n \"w\": 8,\n \"x\": 0,\n \"y\": 1\n },\n \"name\": \"brokers\",\n \"options\": {\n \"standardOptions\": {}\n },\n \"targets\": [\n {\n \"expr\": \"kafka_brokers\",\n \"refId\": \"A\"\n }\n ],\n \"type\": \"stat\",\n \"version\": \"2.0.0\"\n },\n {\n \"custom\": {\n \"calc\": \"lastNotNull\",\n \"colSpan\": 1,\n \"colorMode\": \"value\",\n \"textMode\": \"value\",\n \"textSize\": {\n \"value\": 50\n }\n },\n \"datasourceCate\": \"prometheus\",\n \"datasourceValue\": \"${prom}\",\n \"id\": \"8adb0df0-13bc-452a-ac63-209ae3748d77\",\n \"layout\": {\n \"h\": 3,\n \"i\": \"8adb0df0-13bc-452a-ac63-209ae3748d77\",\n \"w\": 8,\n \"x\": 16,\n \"y\": 1\n },\n \"name\": \"partitions\",\n \"options\": {\n \"standardOptions\": {}\n },\n \"targets\": [\n {\n \"expr\": \"sum(kafka_topic_partitions)\",\n \"refId\": \"A\"\n }\n ],\n \"type\": \"stat\",\n \"version\": \"2.0.0\"\n },\n {\n \"collapsed\": true,\n \"id\": \"7071dc1f-9410-4899-9c43-206a11bfaab2\",\n \"layout\": {\n \"h\": 1,\n \"i\": \"7071dc1f-9410-4899-9c43-206a11bfaab2\",\n \"w\": 24,\n \"x\": 0,\n \"y\": 4\n },\n \"name\": \"throughput\",\n \"type\": \"row\"\n },\n {\n \"custom\": {\n \"drawStyle\": \"lines\",\n \"fillOpacity\": 0.3,\n \"gradientMode\": \"opacity\",\n \"lineInterpolation\": \"smooth\",\n \"lineWidth\": 2,\n \"stack\": \"off\"\n },\n \"datasourceCate\": \"prometheus\",\n \"datasourceValue\": \"${prom}\",\n \"id\": \"b68719ad-ba54-4326-a956-43acaef10e2e\",\n \"layout\": {\n \"h\": 7,\n \"i\": \"b68719ad-ba54-4326-a956-43acaef10e2e\",\n \"w\": 12,\n \"x\": 0,\n \"y\": 5\n },\n \"name\": \"Message in per second\",\n \"options\": {\n \"legend\": {\n \"displayMode\": \"hidden\"\n },\n \"standardOptions\": {},\n \"thresholds\": {},\n \"tooltip\": {\n \"mode\": \"all\",\n \"sort\": \"none\"\n }\n },\n \"targets\": [\n {\n \"expr\": \"sum(rate(kafka_topic_partition_current_offset{instance=\\\"$instance\\\"}[1m])) by (topic)\"\n }\n ],\n \"type\": \"timeseries\",\n \"version\": \"2.0.0\"\n },\n {\n \"custom\": {\n \"drawStyle\": \"lines\",\n \"fillOpacity\": 0.3,\n \"gradientMode\": \"opacity\",\n \"lineInterpolation\": \"smooth\",\n \"lineWidth\": 2,\n \"stack\": \"off\"\n },\n \"datasourceCate\": \"prometheus\",\n \"datasourceValue\": \"${prom}\",\n \"id\": \"bfd08ec7-a539-4c5e-8499-4e5c437b97d7\",\n \"layout\": {\n \"h\": 7,\n \"i\": \"bfd08ec7-a539-4c5e-8499-4e5c437b97d7\",\n \"w\": 12,\n \"x\": 0,\n \"y\": 7\n },\n \"name\": \"Latency by Consumer Group\",\n \"options\": {\n \"legend\": {\n \"displayMode\": \"hidden\"\n },\n \"standardOptions\": {\n \"util\": \"humantimeMilliseconds\"\n },\n \"thresholds\": {},\n \"tooltip\": {\n \"mode\": \"all\",\n \"sort\": \"none\"\n }\n },\n \"targets\": [\n {\n \"expr\": \"sum(kafka_consumer_lag_millis{instance=\\\"$instance\\\"}) by (consumergroup, topic) \",\n \"legend\": \"{{consumergroup}} (topic: {{topic}})\"\n }\n ],\n \"type\": \"timeseries\",\n \"version\": \"2.0.0\"\n },\n {\n \"custom\": {\n \"drawStyle\": \"lines\",\n \"fillOpacity\": 0.3,\n \"gradientMode\": \"opacity\",\n \"lineInterpolation\": \"smooth\",\n \"lineWidth\": 2,\n \"stack\": \"off\"\n },\n \"datasourceCate\": \"prometheus\",\n \"datasourceValue\": \"${prom}\",\n \"id\": \"9a42427a-0e01-432e-838d-a6baca6c42b2\",\n \"layout\": {\n \"h\": 7,\n \"i\": \"9a42427a-0e01-432e-838d-a6baca6c42b2\",\n \"w\": 12,\n \"x\": 12,\n \"y\": 5\n },\n \"name\": \"Message consume per second\",\n \"options\": {\n \"legend\": {\n \"displayMode\": \"hidden\"\n },\n \"standardOptions\": {},\n \"thresholds\": {},\n \"tooltip\": {\n \"mode\": \"all\",\n \"sort\": \"none\"\n }\n },\n \"targets\": [\n {\n \"expr\": \"sum(rate(kafka_consumergroup_current_offset{instance=\\\"$instance\\\"}[1m])) by (topic)\"\n }\n ],\n \"type\": \"timeseries\",\n \"version\": \"2.0.0\"\n },\n {\n \"custom\": {\n \"drawStyle\": \"lines\",\n \"fillOpacity\": 0.3,\n \"gradientMode\": \"opacity\",\n \"lineInterpolation\": \"smooth\",\n \"lineWidth\": 2,\n \"stack\": \"off\"\n },\n \"datasourceCate\": \"prometheus\",\n \"datasourceValue\": \"${prom}\",\n \"id\": \"7324f196-467b-4590-ae47-d56be683a0c3\",\n \"layout\": {\n \"h\": 7,\n \"i\": \"7324f196-467b-4590-ae47-d56be683a0c3\",\n \"w\": 12,\n \"x\": 12,\n \"y\": 7\n },\n \"name\": \"Lag by Consumer Group\",\n \"options\": {\n \"legend\": {\n \"displayMode\": \"hidden\"\n },\n \"standardOptions\": {},\n \"thresholds\": {},\n \"tooltip\": {\n \"mode\": \"all\",\n \"sort\": \"none\"\n }\n },\n \"targets\": [\n {\n \"expr\": \"sum(kafka_topic_partition_current_offset{instance=\\\"$instance\\\"}) by (topic) - sum(kafka_consumergroup_current_offset{instance=\\\"$instance\\\"}) by (topic) \",\n \"legend\": \"{{consumergroup}} (topic: {{topic}})\"\n }\n ],\n \"type\": \"timeseries\",\n \"version\": \"2.0.0\"\n },\n {\n \"collapsed\": true,\n \"id\": \"bd4d2d51-7b4d-4523-b586-0bf2b248d4d4\",\n \"layout\": {\n \"h\": 1,\n \"i\": \"bd4d2d51-7b4d-4523-b586-0bf2b248d4d4\",\n \"w\": 24,\n \"x\": 0,\n \"y\": 14\n },\n \"name\": \"patition/replicate\",\n \"type\": \"row\"\n },\n {\n \"custom\": {\n \"calc\": \"lastNotNull\",\n \"displayMode\": \"seriesToRows\",\n \"showHeader\": true\n },\n \"datasourceCate\": \"prometheus\",\n \"datasourceValue\": \"${prom}\",\n \"id\": \"04d1f6cc-40ec-4584-be17-a4d10cd5b6e9\",\n \"layout\": {\n \"h\": 7,\n \"i\": \"04d1f6cc-40ec-4584-be17-a4d10cd5b6e9\",\n \"w\": 12,\n \"x\": 0,\n \"y\": 15\n },\n \"name\": \"Partitions per Topic\",\n \"options\": {\n \"standardOptions\": {}\n },\n \"overrides\": [\n {}\n ],\n \"targets\": [\n {\n \"expr\": \"kafka_topic_partitions{instance=\\\"$instance\\\"}\",\n \"legend\": \"{{topic}}\",\n \"refId\": \"A\"\n }\n ],\n \"type\": \"table\",\n \"version\": \"2.0.0\"\n },\n {\n \"custom\": {\n \"calc\": \"lastNotNull\",\n \"displayMode\": \"seriesToRows\",\n \"showHeader\": true\n },\n \"datasourceCate\": \"prometheus\",\n \"datasourceValue\": \"${prom}\",\n \"description\": \"副本不同步预案\\n1. Restart the Zookeeper leader.\\n2. Restart the broker\\\\brokers that are not replicating some of the partitions.\",\n \"id\": \"5b589c1c-fd35-4ce5-8b24-c0e05d307345\",\n \"layout\": {\n \"h\": 7,\n \"i\": \"5b589c1c-fd35-4ce5-8b24-c0e05d307345\",\n \"w\": 12,\n \"x\": 12,\n \"y\": 15\n },\n \"name\": \"Under Replicated\",\n \"options\": {\n \"standardOptions\": {}\n },\n \"overrides\": [\n {}\n ],\n \"targets\": [\n {\n \"expr\": \"kafka_topic_partition_under_replicated_partition\",\n \"legend\": \"{{topic}}-{{partition}}\",\n \"refId\": \"A\"\n }\n ],\n \"type\": \"table\",\n \"version\": \"2.0.0\"\n }\n ],\n \"var\": [\n {\n \"definition\": \"prometheus\",\n \"name\": \"prom\",\n \"type\": \"datasource\"\n },\n {\n \"datasource\": {\n \"cate\": \"prometheus\",\n \"value\": \"${prom}\"\n },\n \"definition\": \"label_values(kafka_brokers, instance)\",\n \"name\": \"instance\",\n \"type\": \"query\"\n },\n {\n \"datasource\": {\n \"cate\": \"prometheus\",\n \"value\": \"${prom}\"\n },\n \"definition\": \"label_values(kafka_brokers, job)\",\n \"name\": \"job\",\n \"type\": \"query\"\n }\n ],\n \"version\": \"3.0.0\"\n },\n \"public\": 0,\n \"public_cate\": 0,\n \"bgids\": null,\n \"built_in\": 0,\n \"hide\": 0,\n \"uuid\": 1717556327573482000\n}"
},
{
"path": "integrations/Kafka/markdown/README.md",
"content": "# kafka plugin\n\nKafka 的核心指标,其实都是通过 JMX 的方式暴露的。对于 JMX 暴露的指标,使用 jolokia 或者使用 jmx_exporter 那个 jar 包来采集即可,不需要本插件。\n\n本插件主要是采集的消费者延迟数据,这个数据无法通过 Kafka 服务端的 JMX 拿到。\n\n本插件 fork 自 [https://github.com/davidmparrott/kafka_exporter](https://github.com/davidmparrott/kafka_exporter)(以下简称 davidmparrott 版本),davidmparrott 版本 fork 自 [https://github.com/danielqsj/kafka_exporter](https://github.com/danielqsj/kafka_exporter)(以下简称 danielqsj 版本)。\n\ndanielqsj 版本作为原始版本, github 版本也相对活跃, prometheus 生态使用较多。davidmparrott 版本与 danielqsj 版本相比, 有以下 metric 名字不同:\n\n| davidmparrott 版本 | danielqsj 版本 |\n| ---- | ---- |\n| kafka_consumergroup_uncommit_offsets | kafka_consumergroup_lag |\n| kafka_consumergroup_uncommit_offsets_sum | kafka_consumergroup_lag_sum |\n| kafka_consumergroup_uncommitted_offsets_zookeeper | kafka_consumergroup_lag_zookeeper |\n\n如果想使用 danielqsj 版本的 metric, 在 `[[instances]]` 中进行如下配置:\n\n```toml\nrename_uncommit_offset_to_lag = true\n```\n\ndavidmparrott 版本比 danielqsj 版本多了以下 metric,这些指标是对延迟速率做了预估计算:\n\n- kafka_consumer_lag_millis\n- kafka_consumer_lag_interpolation\n- kafka_consumer_lag_extrapolation\n\n为什么要计算速率?因为 lag 很大,但是消费很快,是不会积压的,而 lag 很小,消费很慢,仍然会积压,所以,通过 lag 大小是没法判断积压风险的。通过计算历史消费速率,来判断积压风险会更为合理。要计算这个速率,需要占用较多内存,可以通过如下配置关闭这个计算逻辑:\n\n```toml\ndisable_calculate_lag_rate = true\n```\n\n## 采集配置\n\ncategraf 配置文件:`conf/input.kafka/kafka.toml`。配置样例如下:\n\n```toml\n[[instances]]\nlog_level = \"error\"\nkafka_uris = [\"192.168.0.250:9092\"]\nlabels = { cluster=\"kafka-cluster-01\", service=\"kafka\" }\n```\n\n完整的带有注释的配置如下:\n\n```toml\n[[instances]]\n# # interval = global.interval * interval_times\n# interval_times = 1\n\n# append some labels to metrics\n# cluster is a preferred tag with the cluster name. If none is provided, the first of kafka_uris will be used\nlabels = { cluster=\"kafka-cluster-01\" }\n\n# log level only for kafka exporter\nlog_level = \"error\"\n\n# Address (host:port) of Kafka server.\n# kafka_uris = [\"127.0.0.1:9092\",\"127.0.0.1:9092\",\"127.0.0.1:9092\"]\nkafka_uris = []\n\n# Connect using SASL/PLAIN\n# Default is false\n# use_sasl = false\n\n# Only set this to false if using a non-Kafka SASL proxy\n# Default is true\n# use_sasl_handshake = false\n\n# SASL user name\n# sasl_username = \"username\"\n\n# SASL user password\n# sasl_password = \"password\"\n\n# The SASL SCRAM SHA algorithm sha256 or sha512 as mechanism\n# sasl_mechanism = \"\"\n\n# Connect using TLS\n# use_tls = false\n\n# The optional certificate authority file for TLS client authentication\n# ca_file = \"\"\n\n# The optional certificate file for TLS client authentication\n# cert_file = \"\"\n\n# The optional key file for TLS client authentication\n# key_file = \"\"\n\n# If true, the server's certificate will not be checked for validity. This will make your HTTPS connections insecure\n# insecure_skip_verify = true\n\n# Kafka broker version\n# Default is 2.0.0\n# kafka_version = \"2.0.0\"\n\n# if you need to use a group from zookeeper\n# Default is false\n# use_zookeeper_lag = false\n\n# Address array (hosts) of zookeeper server.\n# zookeeper_uris = []\n\n# Metadata refresh interval\n# Default is 1m\n# metadata_refresh_interval = \"1m\"\n\n# Whether show the offset/lag for all consumer group, otherwise, only show connected consumer groups, default is true\n# Default is true\n# offset_show_all = true\n\n# If true, all scrapes will trigger kafka operations otherwise, they will share results. WARN: This should be disabled on large clusters\n# Default is false\n# allow_concurrency = false\n\n# Maximum number of offsets to store in the interpolation table for a partition\n# Default is 1000\n# max_offsets = 1000\n\n# How frequently should the interpolation table be pruned, in seconds.\n# Default is 30\n# prune_interval_seconds = 30\n\n# Regex filter for topics to be monitored\n# Default is \".*\"\n# topics_filter_regex = \".*\"\n\n# Regex filter for consumer groups to be monitored\n# Default is \".*\"\n# groups_filter_regex = \".*\"\n\n# if rename kafka_consumergroup_uncommitted_offsets to kafka_consumergroup_lag\n# Default is false\n# rename_uncommit_offset_to_lag = false\n\n\n# if disable calculating lag rate\n# Default is false\n# disable_calculate_lag_rate = false\n```\n\n"
},
{
"path": "integrations/Kafka/metrics/categraf-base.json",
"content": "[\n {\n \"id\": 0,\n \"uuid\": 1717556327574937000,\n \"collector\": \"Categraf\",\n \"typ\": \"Kafka\",\n \"name\": \"Broker 数量\",\n \"unit\": \"none\",\n \"note\": \"\",\n \"lang\": \"zh_CN\",\n \"expression\": \"kafka_brokers\",\n \"created_at\": 0,\n \"created_by\": \"\",\n \"updated_at\": 0,\n \"updated_by\": \"\",\n \"translation\": [\n {\n \"lang\": \"zh_CN\",\n \"name\": \"Broker 数量\",\n \"note\": \"\"\n },\n {\n \"lang\": \"en_US\",\n \"name\": \"Number of Brokers\",\n \"note\": \"\"\n }\n ]\n },\n {\n \"id\": 0,\n \"uuid\": 1717556327578367000,\n \"collector\": \"Categraf\",\n \"typ\": \"Kafka\",\n \"name\": \"Partition 副本不同步的数量\",\n \"unit\": \"none\",\n \"note\": \"\",\n \"lang\": \"zh_CN\",\n \"expression\": \"kafka_topic_partition_under_replicated_partition\",\n \"created_at\": 0,\n \"created_by\": \"\",\n \"updated_at\": 0,\n \"updated_by\": \"\",\n \"translation\": [\n {\n \"lang\": \"zh_CN\",\n \"name\": \"Partition 副本不同步的数量\",\n \"note\": \"\"\n },\n {\n \"lang\": \"en_US\",\n \"name\": \"Number of out-of-sync copies of Partition\",\n \"note\": \"\"\n }\n ]\n },\n {\n \"id\": 0,\n \"uuid\": 1717556327581728000,\n \"collector\": \"Categraf\",\n \"typ\": \"Kafka\",\n \"name\": \"Partition 副本数量\",\n \"unit\": \"none\",\n \"note\": \"\",\n \"lang\": \"zh_CN\",\n \"expression\": \"kafka_topic_partition_replicas\",\n \"created_at\": 0,\n \"created_by\": \"\",\n \"updated_at\": 0,\n \"updated_by\": \"\",\n \"translation\": [\n {\n \"lang\": \"zh_CN\",\n \"name\": \"Partition 副本数量\",\n \"note\": \"\"\n },\n {\n \"lang\": \"en_US\",\n \"name\": \"Number of Partition copies\",\n \"note\": \"\"\n }\n ]\n },\n {\n \"id\": 0,\n \"uuid\": 1717556327584595000,\n \"collector\": \"Categraf\",\n \"typ\": \"Kafka\",\n \"name\": \"各个 Topic 每秒消费消息量\",\n \"unit\": \"none\",\n \"note\": \"\",\n \"lang\": \"zh_CN\",\n \"expression\": \"sum(irate(kafka_consumergroup_current_offset[3m])) without (partition)\",\n \"created_at\": 0,\n \"created_by\": \"\",\n \"updated_at\": 0,\n \"updated_by\": \"\",\n \"translation\": [\n {\n \"lang\": \"zh_CN\",\n \"name\": \"各个 Topic 每秒消费消息量\",\n \"note\": \"\"\n },\n {\n \"lang\": \"en_US\",\n \"name\": \"Each Topic consumes messages per second\",\n \"note\": \"\"\n }\n ]\n },\n {\n \"id\": 0,\n \"uuid\": 1717556327590335000,\n \"collector\": \"Categraf\",\n \"typ\": \"Kafka\",\n \"name\": \"各个 Topic 每秒生产消息量\",\n \"unit\": \"none\",\n \"note\": \"\",\n \"lang\": \"zh_CN\",\n \"expression\": \"sum(irate(kafka_topic_partition_current_offset[3m])) without (partition)\",\n \"created_at\": 0,\n \"created_by\": \"\",\n \"updated_at\": 0,\n \"updated_by\": \"\",\n \"translation\": [\n {\n \"lang\": \"zh_CN\",\n \"name\": \"各个 Topic 每秒生产消息量\",\n \"note\": \"\"\n },\n {\n \"lang\": \"en_US\",\n \"name\": \"Production message volume per second per Topic\",\n \"note\": \"\"\n }\n ]\n },\n {\n \"id\": 0,\n \"uuid\": 1717556327592951000,\n \"collector\": \"Categraf\",\n \"typ\": \"Kafka\",\n \"name\": \"各个 Topic 的 Partition 数量\",\n \"unit\": \"none\",\n \"note\": \"\",\n \"lang\": \"zh_CN\",\n \"expression\": \"kafka_topic_partitions\",\n \"created_at\": 0,\n \"created_by\": \"\",\n \"updated_at\": 0,\n \"updated_by\": \"\",\n \"translation\": [\n {\n \"lang\": \"zh_CN\",\n \"name\": \"各个 Topic 的 Partition 数量\",\n \"note\": \"\"\n },\n {\n \"lang\": \"en_US\",\n \"name\": \"Number of Partitions for each Topic\",\n \"note\": \"\"\n }\n ]\n }\n]"
},
{
"path": "integrations/Kubernetes/alerts/apiserver.json",
"content": "[\n {\n \"id\": 0,\n \"group_id\": 0,\n \"cate\": \"\",\n \"datasource_ids\": null,\n \"cluster\": \"\",\n \"name\": \"KubeClientCertificateExpiration-S2\",\n \"note\": \"A client certificate used to authenticate to the apiserver is expiring in less than 7.0 days.\",\n \"prod\": \"\",\n \"algorithm\": \"\",\n \"algo_params\": null,\n \"delay\": 0,\n \"severity\": 2,\n \"severities\": null,\n \"disabled\": 0,\n \"prom_for_duration\": 0,\n \"prom_ql\": \"apiserver_client_certificate_expiration_seconds_count{job=\\\"apiserver\\\"} \\u003e 0 and on(job) histogram_quantile(0.01, sum by (job, le) (rate(apiserver_client_certificate_expiration_seconds_bucket{job=\\\"apiserver\\\"}[5m]))) \\u003c 604800\\n\",\n \"rule_config\": null,\n \"prom_eval_interval\": 15,\n \"enable_stime\": \"00:00\",\n \"enable_stimes\": null,\n \"enable_etime\": \"23:59\",\n \"enable_etimes\": null,\n \"enable_days_of_week\": [\n \"1\",\n \"2\",\n \"3\",\n \"4\",\n \"5\",\n \"6\",\n \"0\"\n ],\n \"enable_days_of_weeks\": null,\n \"enable_in_bg\": 0,\n \"notify_recovered\": 1,\n \"notify_channels\": [],\n \"notify_groups_obj\": null,\n \"notify_groups\": null,\n \"notify_repeat_step\": 60,\n \"notify_max_number\": 0,\n \"recover_duration\": 0,\n \"callbacks\": [],\n \"runbook_url\": \"\",\n \"append_tags\": [],\n \"annotations\": null,\n \"extra_config\": null,\n \"create_at\": 0,\n \"create_by\": \"\",\n \"update_at\": 0,\n \"update_by\": \"\",\n \"uuid\": 1717556327602560000\n },\n {\n \"id\": 0,\n \"group_id\": 0,\n \"cate\": \"\",\n \"datasource_ids\": null,\n \"cluster\": \"\",\n \"name\": \"KubeClientCertificateExpiration-S1\",\n \"note\": \"A client certificate used to authenticate to the apiserver is expiring in less than 24.0 hours.\",\n \"prod\": \"\",\n \"algorithm\": \"\",\n \"algo_params\": null,\n \"delay\": 0,\n \"severity\": 1,\n \"severities\": null,\n \"disabled\": 0,\n \"prom_for_duration\": 0,\n \"prom_ql\": \"apiserver_client_certificate_expiration_seconds_count{job=\\\"apiserver\\\"} \\u003e 0 and on(job) histogram_quantile(0.01, sum by (job, le) (rate(apiserver_client_certificate_expiration_seconds_bucket{job=\\\"apiserver\\\"}[5m]))) \\u003c 86400\\n\",\n \"rule_config\": null,\n \"prom_eval_interval\": 15,\n \"enable_stime\": \"00:00\",\n \"enable_stimes\": null,\n \"enable_etime\": \"23:59\",\n \"enable_etimes\": null,\n \"enable_days_of_week\": [\n \"1\",\n \"2\",\n \"3\",\n \"4\",\n \"5\",\n \"6\",\n \"0\"\n ],\n \"enable_days_of_weeks\": null,\n \"enable_in_bg\": 0,\n \"notify_recovered\": 1,\n \"notify_channels\": [],\n \"notify_groups_obj\": null,\n \"notify_groups\": null,\n \"notify_repeat_step\": 60,\n \"notify_max_number\": 0,\n \"recover_duration\": 0,\n \"callbacks\": [],\n \"runbook_url\": \"\",\n \"append_tags\": [],\n \"annotations\": null,\n \"extra_config\": null,\n \"create_at\": 0,\n \"create_by\": \"\",\n \"update_at\": 0,\n \"update_by\": \"\",\n \"uuid\": 1717556327603535000\n },\n {\n \"id\": 0,\n \"group_id\": 0,\n \"cate\": \"\",\n \"datasource_ids\": null,\n \"cluster\": \"\",\n \"name\": \"AggregatedAPIErrors\",\n \"note\": \"An aggregated API {{ $labels.name }}/{{ $labels.namespace }} has reported errors. The number of errors have increased for it in the past five minutes. High values indicate that the availability of the service changes too often.\",\n \"prod\": \"\",\n \"algorithm\": \"\",\n \"algo_params\": null,\n \"delay\": 0,\n \"severity\": 2,\n \"severities\": null,\n \"disabled\": 0,\n \"prom_for_duration\": 0,\n \"prom_ql\": \"sum by(name, namespace)(increase(aggregator_unavailable_apiservice_count[5m])) \\u003e 2\\n\",\n \"rule_config\": null,\n \"prom_eval_interval\": 15,\n \"enable_stime\": \"00:00\",\n \"enable_stimes\": null,\n \"enable_etime\": \"23:59\",\n \"enable_etimes\": null,\n \"enable_days_of_week\": [\n \"1\",\n \"2\",\n \"3\",\n \"4\",\n \"5\",\n \"6\",\n \"0\"\n ],\n \"enable_days_of_weeks\": null,\n \"enable_in_bg\": 0,\n \"notify_recovered\": 1,\n \"notify_channels\": [],\n \"notify_groups_obj\": null,\n \"notify_groups\": null,\n \"notify_repeat_step\": 60,\n \"notify_max_number\": 0,\n \"recover_duration\": 0,\n \"callbacks\": [],\n \"runbook_url\": \"\",\n \"append_tags\": [],\n \"annotations\": null,\n \"extra_config\": null,\n \"create_at\": 0,\n \"create_by\": \"\",\n \"update_at\": 0,\n \"update_by\": \"\",\n \"uuid\": 1717556327604347000\n },\n {\n \"id\": 0,\n \"group_id\": 0,\n \"cate\": \"\",\n \"datasource_ids\": null,\n \"cluster\": \"\",\n \"name\": \"AggregatedAPIDown\",\n \"note\": \"An aggregated API {{ $labels.name }}/{{ $labels.namespace }} has been only {{ $value | humanize }}% available over the last 10m.\",\n \"prod\": \"\",\n \"algorithm\": \"\",\n \"algo_params\": null,\n \"delay\": 0,\n \"severity\": 2,\n \"severities\": null,\n \"disabled\": 0,\n \"prom_for_duration\": 300,\n \"prom_ql\": \"(1 - max by(name, namespace)(avg_over_time(aggregator_unavailable_apiservice[10m]))) * 100 \\u003c 85\\n\",\n \"rule_config\": null,\n \"prom_eval_interval\": 15,\n \"enable_stime\": \"00:00\",\n \"enable_stimes\": null,\n \"enable_etime\": \"23:59\",\n \"enable_etimes\": null,\n \"enable_days_of_week\": [\n \"1\",\n \"2\",\n \"3\",\n \"4\",\n \"5\",\n \"6\",\n \"0\"\n ],\n \"enable_days_of_weeks\": null,\n \"enable_in_bg\": 0,\n \"notify_recovered\": 1,\n \"notify_channels\": [],\n \"notify_groups_obj\": null,\n \"notify_groups\": null,\n \"notify_repeat_step\": 60,\n \"notify_max_number\": 0,\n \"recover_duration\": 0,\n \"callbacks\": [],\n \"runbook_url\": \"\",\n \"append_tags\": [],\n \"annotations\": null,\n \"extra_config\": null,\n \"create_at\": 0,\n \"create_by\": \"\",\n \"update_at\": 0,\n \"update_by\": \"\",\n \"uuid\": 1717556327605135000\n },\n {\n \"id\": 0,\n \"group_id\": 0,\n \"cate\": \"\",\n \"datasource_ids\": null,\n \"cluster\": \"\",\n \"name\": \"KubeAPIDown\",\n \"note\": \"KubeAPI has disappeared from Prometheus target discovery.\",\n \"prod\": \"\",\n \"algorithm\": \"\",\n \"algo_params\": null,\n \"delay\": 0,\n \"severity\": 1,\n \"severities\": null,\n \"disabled\": 0,\n \"prom_for_duration\": 900,\n \"prom_ql\": \"absent(up{job=\\\"apiserver\\\"} == 1)\\n\",\n \"rule_config\": null,\n \"prom_eval_interval\": 15,\n \"enable_stime\": \"00:00\",\n \"enable_stimes\": null,\n \"enable_etime\": \"23:59\",\n \"enable_etimes\": null,\n \"enable_days_of_week\": [\n \"1\",\n \"2\",\n \"3\",\n \"4\",\n \"5\",\n \"6\",\n \"0\"\n ],\n \"enable_days_of_weeks\": null,\n \"enable_in_bg\": 0,\n \"notify_recovered\": 1,\n \"notify_channels\": [],\n \"notify_groups_obj\": null,\n \"notify_groups\": null,\n \"notify_repeat_step\": 60,\n \"notify_max_number\": 0,\n \"recover_duration\": 0,\n \"callbacks\": [],\n \"runbook_url\": \"\",\n \"append_tags\": [],\n \"annotations\": null,\n \"extra_config\": null,\n \"create_at\": 0,\n \"create_by\": \"\",\n \"update_at\": 0,\n \"update_by\": \"\",\n \"uuid\": 1717556327606255000\n },\n {\n \"id\": 0,\n \"group_id\": 0,\n \"cate\": \"\",\n \"datasource_ids\": null,\n \"cluster\": \"\",\n \"name\": \"KubeAPIErrorBudgetBurn-S1-120秒\",\n \"note\": \"The API server is burning too much error budget.\",\n \"prod\": \"\",\n \"algorithm\": \"\",\n \"algo_params\": null,\n \"delay\": 0,\n \"severity\": 1,\n \"severities\": null,\n \"disabled\": 0,\n \"prom_for_duration\": 120,\n \"prom_ql\": \"sum(apiserver_request:burnrate1h) \\u003e (14.40 * 0.01000)\\nand\\nsum(apiserver_request:burnrate5m) \\u003e (14.40 * 0.01000)\\n\",\n \"rule_config\": null,\n \"prom_eval_interval\": 15,\n \"enable_stime\": \"00:00\",\n \"enable_stimes\": null,\n \"enable_etime\": \"23:59\",\n \"enable_etimes\": null,\n \"enable_days_of_week\": [\n \"1\",\n \"2\",\n \"3\",\n \"4\",\n \"5\",\n \"6\",\n \"0\"\n ],\n \"enable_days_of_weeks\": null,\n \"enable_in_bg\": 0,\n \"notify_recovered\": 1,\n \"notify_channels\": [],\n \"notify_groups_obj\": null,\n \"notify_groups\": null,\n \"notify_repeat_step\": 60,\n \"notify_max_number\": 0,\n \"recover_duration\": 0,\n \"callbacks\": [],\n \"runbook_url\": \"\",\n \"append_tags\": [\n \"long=1h\",\n \"short=5m\"\n ],\n \"annotations\": null,\n \"extra_config\": null,\n \"create_at\": 0,\n \"create_by\": \"\",\n \"update_at\": 0,\n \"update_by\": \"\",\n \"uuid\": 1717556327608028000\n },\n {\n \"id\": 0,\n \"group_id\": 0,\n \"cate\": \"\",\n \"datasource_ids\": null,\n \"cluster\": \"\",\n \"name\": \"KubeAPIErrorBudgetBurn-S1-900秒\",\n \"note\": \"The API server is burning too much error budget.\",\n \"prod\": \"\",\n \"algorithm\": \"\",\n \"algo_params\": null,\n \"delay\": 0,\n \"severity\": 1,\n \"severities\": null,\n \"disabled\": 0,\n \"prom_for_duration\": 900,\n \"prom_ql\": \"sum(apiserver_request:burnrate6h) \\u003e (6.00 * 0.01000)\\nand\\nsum(apiserver_request:burnrate30m) \\u003e (6.00 * 0.01000)\\n\",\n \"rule_config\": null,\n \"prom_eval_interval\": 15,\n \"enable_stime\": \"00:00\",\n \"enable_stimes\": null,\n \"enable_etime\": \"23:59\",\n \"enable_etimes\": null,\n \"enable_days_of_week\": [\n \"1\",\n \"2\",\n \"3\",\n \"4\",\n \"5\",\n \"6\",\n \"0\"\n ],\n \"enable_days_of_weeks\": null,\n \"enable_in_bg\": 0,\n \"notify_recovered\": 1,\n \"notify_channels\": [],\n \"notify_groups_obj\": null,\n \"notify_groups\": null,\n \"notify_repeat_step\": 60,\n \"notify_max_number\": 0,\n \"recover_duration\": 0,\n \"callbacks\": [],\n \"runbook_url\": \"\",\n \"append_tags\": [\n \"long=6h\",\n \"short=30m\"\n ],\n \"annotations\": null,\n \"extra_config\": null,\n \"create_at\": 0,\n \"create_by\": \"\",\n \"update_at\": 0,\n \"update_by\": \"\",\n \"uuid\": 1717556327608676000\n },\n {\n \"id\": 0,\n \"group_id\": 0,\n \"cate\": \"\",\n \"datasource_ids\": null,\n \"cluster\": \"\",\n \"name\": \"KubeAPIErrorBudgetBurn-S2-3600秒\",\n \"note\": \"The API server is burning too much error budget.\",\n \"prod\": \"\",\n \"algorithm\": \"\",\n \"algo_params\": null,\n \"delay\": 0,\n \"severity\": 2,\n \"severities\": null,\n \"disabled\": 0,\n \"prom_for_duration\": 3600,\n \"prom_ql\": \"sum(apiserver_request:burnrate1d) \\u003e (3.00 * 0.01000)\\nand\\nsum(apiserver_request:burnrate2h) \\u003e (3.00 * 0.01000)\\n\",\n \"rule_config\": null,\n \"prom_eval_interval\": 15,\n \"enable_stime\": \"00:00\",\n \"enable_stimes\": null,\n \"enable_etime\": \"23:59\",\n \"enable_etimes\": null,\n \"enable_days_of_week\": [\n \"1\",\n \"2\",\n \"3\",\n \"4\",\n \"5\",\n \"6\",\n \"0\"\n ],\n \"enable_days_of_weeks\": null,\n \"enable_in_bg\": 0,\n \"notify_recovered\": 1,\n \"notify_channels\": [],\n \"notify_groups_obj\": null,\n \"notify_groups\": null,\n \"notify_repeat_step\": 60,\n \"notify_max_number\": 0,\n \"recover_duration\": 0,\n \"callbacks\": [],\n \"runbook_url\": \"\",\n \"append_tags\": [\n \"long=1d\",\n \"short=2h\"\n ],\n \"annotations\": null,\n \"extra_config\": null,\n \"create_at\": 0,\n \"create_by\": \"\",\n \"update_at\": 0,\n \"update_by\": \"\",\n \"uuid\": 1717556327609366000\n },\n {\n \"id\": 0,\n \"group_id\": 0,\n \"cate\": \"\",\n \"datasource_ids\": null,\n \"cluster\": \"\",\n \"name\": \"KubeAPIErrorBudgetBurn-S2-10800秒\",\n \"note\": \"The API server is burning too much error budget.\",\n \"prod\": \"\",\n \"algorithm\": \"\",\n \"algo_params\": null,\n \"delay\": 0,\n \"severity\": 2,\n \"severities\": null,\n \"disabled\": 0,\n \"prom_for_duration\": 10800,\n \"prom_ql\": \"sum(apiserver_request:burnrate3d) \\u003e (1.00 * 0.01000)\\nand\\nsum(apiserver_request:burnrate6h) \\u003e (1.00 * 0.01000)\\n\",\n \"rule_config\": null,\n \"prom_eval_interval\": 15,\n \"enable_stime\": \"00:00\",\n \"enable_stimes\": null,\n \"enable_etime\": \"23:59\",\n \"enable_etimes\": null,\n \"enable_days_of_week\": [\n \"1\",\n \"2\",\n \"3\",\n \"4\",\n \"5\",\n \"6\",\n \"0\"\n ],\n \"enable_days_of_weeks\": null,\n \"enable_in_bg\": 0,\n \"notify_recovered\": 1,\n \"notify_channels\": [],\n \"notify_groups_obj\": null,\n \"notify_groups\": null,\n \"notify_repeat_step\": 60,\n \"notify_max_number\": 0,\n \"recover_duration\": 0,\n \"callbacks\": [],\n \"runbook_url\": \"\",\n \"append_tags\": [\n \"long=3d\",\n \"short=6h\"\n ],\n \"annotations\": null,\n \"extra_config\": null,\n \"create_at\": 0,\n \"create_by\": \"\",\n \"update_at\": 0,\n \"update_by\": \"\",\n \"uuid\": 1717556327609980000\n }\n]"
},
{
"path": "integrations/Kubernetes/alerts/kube-controller-plane.json",
"content": "[\n {\n \"id\": 0,\n \"group_id\": 0,\n \"cate\": \"prometheus\",\n \"datasource_ids\": [\n 0\n ],\n \"cluster\": \"\",\n \"name\": \"CPUThrottlingHigh\",\n \"note\": \"{{ $value | humanizePercentage }} throttling of CPU in namespace {{ $labels.namespace }} for container {{ $labels.container }} in pod {{ $labels.pod }}.\",\n \"prod\": \"metric\",\n \"algorithm\": \"\",\n \"algo_params\": null,\n \"delay\": 0,\n \"severity\": 3,\n \"severities\": [\n 3\n ],\n \"disabled\": 1,\n \"prom_for_duration\": 900,\n \"prom_ql\": \"sum(increase(container_cpu_cfs_throttled_periods_total{container!=\\\"\\\", }[5m])) by (container, pod, namespace)\\n /\\nsum(increase(container_cpu_cfs_periods_total{}[5m])) by (container, pod, namespace)\\n \\u003e ( 25 / 100 )\\n\",\n \"rule_config\": {\n \"algo_params\": null,\n \"inhibit\": false,\n \"prom_ql\": \"\",\n \"queries\": [\n {\n \"prom_ql\": \"sum(increase(container_cpu_cfs_throttled_periods_total{container!=\\\"\\\", }[5m])) by (container, pod, namespace)\\n /\\nsum(increase(container_cpu_cfs_periods_total{}[5m])) by (container, pod, namespace)\\n \\u003e ( 25 / 100 )\\n\",\n \"severity\": 3\n }\n ],\n \"severity\": 0\n },\n \"prom_eval_interval\": 15,\n \"enable_stime\": \"00:00\",\n \"enable_stimes\": [\n \"00:00\"\n ],\n \"enable_etime\": \"23:59\",\n \"enable_etimes\": [\n \"23:59\"\n ],\n \"enable_days_of_week\": [\n \"1\",\n \"2\",\n \"3\",\n \"4\",\n \"5\",\n \"6\",\n \"0\"\n ],\n \"enable_days_of_weeks\": [\n [\n \"1\",\n \"2\",\n \"3\",\n \"4\",\n \"5\",\n \"6\",\n \"0\"\n ]\n ],\n \"enable_in_bg\": 0,\n \"notify_recovered\": 1,\n \"notify_channels\": [],\n \"notify_groups_obj\": null,\n \"notify_groups\": null,\n \"notify_repeat_step\": 60,\n \"notify_max_number\": 0,\n \"recover_duration\": 0,\n \"callbacks\": [],\n \"runbook_url\": \"\",\n \"append_tags\": [],\n \"annotations\": null,\n \"extra_config\": null,\n \"create_at\": 0,\n \"create_by\": \"\",\n \"update_at\": 0,\n \"update_by\": \"\",\n \"uuid\": 1717556327613181000\n },\n {\n \"id\": 0,\n \"group_id\": 0,\n \"cate\": \"prometheus\",\n \"datasource_ids\": [\n 0\n ],\n \"cluster\": \"\",\n \"name\": \"KubeAggregatedAPIDown\",\n \"note\": \"Kubernetes aggregated API {{ $labels.name }}/{{ $labels.namespace }} has been only {{ $value | humanize }}% available over the last 10m.\",\n \"prod\": \"metric\",\n \"algorithm\": \"\",\n \"algo_params\": null,\n \"delay\": 0,\n \"severity\": 2,\n \"severities\": [\n 2\n ],\n \"disabled\": 1,\n \"prom_for_duration\": 300,\n \"prom_ql\": \"(1 - max by(name, namespace, cluster)(avg_over_time(aggregator_unavailable_apiservice{job=\\\"apiserver\\\"}[10m]))) * 100 \\u003c 85\\n\",\n \"rule_config\": {\n \"algo_params\": null,\n \"inhibit\": false,\n \"prom_ql\": \"\",\n \"queries\": [\n {\n \"prom_ql\": \"(1 - max by(name, namespace, cluster)(avg_over_time(aggregator_unavailable_apiservice{job=\\\"apiserver\\\"}[10m]))) * 100 \\u003c 85\\n\",\n \"severity\": 2\n }\n ],\n \"severity\": 0\n },\n \"prom_eval_interval\": 15,\n \"enable_stime\": \"00:00\",\n \"enable_stimes\": [\n \"00:00\"\n ],\n \"enable_etime\": \"23:59\",\n \"enable_etimes\": [\n \"23:59\"\n ],\n \"enable_days_of_week\": [\n \"1\",\n \"2\",\n \"3\",\n \"4\",\n \"5\",\n \"6\",\n \"0\"\n ],\n \"enable_days_of_weeks\": [\n [\n \"1\",\n \"2\",\n \"3\",\n \"4\",\n \"5\",\n \"6\",\n \"0\"\n ]\n ],\n \"enable_in_bg\": 0,\n \"notify_recovered\": 1,\n \"notify_channels\": [],\n \"notify_groups_obj\": null,\n \"notify_groups\": null,\n \"notify_repeat_step\": 60,\n \"notify_max_number\": 0,\n \"recover_duration\": 0,\n \"callbacks\": [],\n \"runbook_url\": \"\",\n \"append_tags\": [],\n \"annotations\": null,\n \"extra_config\": null,\n \"create_at\": 0,\n \"create_by\": \"\",\n \"update_at\": 0,\n \"update_by\": \"\",\n \"uuid\": 1717556327613934000\n },\n {\n \"id\": 0,\n \"group_id\": 0,\n \"cate\": \"prometheus\",\n \"datasource_ids\": [\n 0\n ],\n \"cluster\": \"\",\n \"name\": \"KubeAggregatedAPIErrors\",\n \"note\": \"Kubernetes aggregated API {{ $labels.name }}/{{ $labels.namespace }} has reported errors. It has appeared unavailable {{ $value | humanize }} times averaged over the past 10m.\",\n \"prod\": \"metric\",\n \"algorithm\": \"\",\n \"algo_params\": null,\n \"delay\": 0,\n \"severity\": 2,\n \"severities\": [\n 2\n ],\n \"disabled\": 1,\n \"prom_for_duration\": 0,\n \"prom_ql\": \"sum by(name, namespace, cluster)(increase(aggregator_unavailable_apiservice_total{job=\\\"apiserver\\\"}[10m])) \\u003e 4\\n\",\n \"rule_config\": {\n \"algo_params\": null,\n \"inhibit\": false,\n \"prom_ql\": \"\",\n \"queries\": [\n {\n \"prom_ql\": \"sum by(name, namespace, cluster)(increase(aggregator_unavailable_apiservice_total{job=\\\"apiserver\\\"}[10m])) \\u003e 4\\n\",\n \"severity\": 2\n }\n ],\n \"severity\": 0\n },\n \"prom_eval_interval\": 15,\n \"enable_stime\": \"00:00\",\n \"enable_stimes\": [\n \"00:00\"\n ],\n \"enable_etime\": \"23:59\",\n \"enable_etimes\": [\n \"23:59\"\n ],\n \"enable_days_of_week\": [\n \"1\",\n \"2\",\n \"3\",\n \"4\",\n \"5\",\n \"6\",\n \"0\"\n ],\n \"enable_days_of_weeks\": [\n [\n \"1\",\n \"2\",\n \"3\",\n \"4\",\n \"5\",\n \"6\",\n \"0\"\n ]\n ],\n \"enable_in_bg\": 0,\n \"notify_recovered\": 1,\n \"notify_channels\": [],\n \"notify_groups_obj\": null,\n \"notify_groups\": null,\n \"notify_repeat_step\": 60,\n \"notify_max_number\": 0,\n \"recover_duration\": 0,\n \"callbacks\": [],\n \"runbook_url\": \"\",\n \"append_tags\": [],\n \"annotations\": null,\n \"extra_config\": null,\n \"create_at\": 0,\n \"create_by\": \"\",\n \"update_at\": 0,\n \"update_by\": \"\",\n \"uuid\": 1717556327614501000\n },\n {\n \"id\": 0,\n \"group_id\": 0,\n \"cate\": \"prometheus\",\n \"datasource_ids\": [\n 0\n ],\n \"cluster\": \"\",\n \"name\": \"KubeAPIDown\",\n \"note\": \"KubeAPI has disappeared from Prometheus target discovery.\",\n \"prod\": \"metric\",\n \"algorithm\": \"\",\n \"algo_params\": null,\n \"delay\": 0,\n \"severity\": 1,\n \"severities\": [\n 1\n ],\n \"disabled\": 1,\n \"prom_for_duration\": 900,\n \"prom_ql\": \"absent(up{job=\\\"apiserver\\\"} == 1)\\n\",\n \"rule_config\": {\n \"algo_params\": null,\n \"inhibit\": false,\n \"prom_ql\": \"\",\n \"queries\": [\n {\n \"prom_ql\": \"absent(up{job=\\\"apiserver\\\"} == 1)\\n\",\n \"severity\": 1\n }\n ],\n \"severity\": 0\n },\n \"prom_eval_interval\": 15,\n \"enable_stime\": \"00:00\",\n \"enable_stimes\": [\n \"00:00\"\n ],\n \"enable_etime\": \"23:59\",\n \"enable_etimes\": [\n \"23:59\"\n ],\n \"enable_days_of_week\": [\n \"1\",\n \"2\",\n \"3\",\n \"4\",\n \"5\",\n \"6\",\n \"0\"\n ],\n \"enable_days_of_weeks\": [\n [\n \"1\",\n \"2\",\n \"3\",\n \"4\",\n \"5\",\n \"6\",\n \"0\"\n ]\n ],\n \"enable_in_bg\": 0,\n \"notify_recovered\": 1,\n \"notify_channels\": [],\n \"notify_groups_obj\": null,\n \"notify_groups\": null,\n \"notify_repeat_step\": 60,\n \"notify_max_number\": 0,\n \"recover_duration\": 0,\n \"callbacks\": [],\n \"runbook_url\": \"\",\n \"append_tags\": [],\n \"annotations\": null,\n \"extra_config\": null,\n \"create_at\": 0,\n \"create_by\": \"\",\n \"update_at\": 0,\n \"update_by\": \"\",\n \"uuid\": 1717556327615035000\n },\n {\n \"id\": 0,\n \"group_id\": 0,\n \"cate\": \"prometheus\",\n \"datasource_ids\": [\n 0\n ],\n \"cluster\": \"\",\n \"name\": \"KubeAPIErrorBudgetBurn\",\n \"note\": \"The API server is burning too much error budget.\",\n \"prod\": \"metric\",\n \"algorithm\": \"\",\n \"algo_params\": null,\n \"delay\": 0,\n \"severity\": 1,\n \"severities\": [\n 1\n ],\n \"disabled\": 1,\n \"prom_for_duration\": 120,\n \"prom_ql\": \"sum(apiserver_request:burnrate1h) \\u003e (14.40 * 0.01000)\\nand\\nsum(apiserver_request:burnrate5m) \\u003e (14.40 * 0.01000)\\n\",\n \"rule_config\": {\n \"algo_params\": null,\n \"inhibit\": false,\n \"prom_ql\": \"\",\n \"queries\": [\n {\n \"prom_ql\": \"sum(apiserver_request:burnrate1h) \\u003e (14.40 * 0.01000)\\nand\\nsum(apiserver_request:burnrate5m) \\u003e (14.40 * 0.01000)\\n\",\n \"severity\": 1\n }\n ],\n \"severity\": 0\n },\n \"prom_eval_interval\": 15,\n \"enable_stime\": \"00:00\",\n \"enable_stimes\": [\n \"00:00\"\n ],\n \"enable_etime\": \"23:59\",\n \"enable_etimes\": [\n \"23:59\"\n ],\n \"enable_days_of_week\": [\n \"1\",\n \"2\",\n \"3\",\n \"4\",\n \"5\",\n \"6\",\n \"0\"\n ],\n \"enable_days_of_weeks\": [\n [\n \"1\",\n \"2\",\n \"3\",\n \"4\",\n \"5\",\n \"6\",\n \"0\"\n ]\n ],\n \"enable_in_bg\": 0,\n \"notify_recovered\": 1,\n \"notify_channels\": [],\n \"notify_groups_obj\": null,\n \"notify_groups\": null,\n \"notify_repeat_step\": 60,\n \"notify_max_number\": 0,\n \"recover_duration\": 0,\n \"callbacks\": [],\n \"runbook_url\": \"\",\n \"append_tags\": [\n \"long=1h\",\n \"short=5m\"\n ],\n \"annotations\": null,\n \"extra_config\": null,\n \"create_at\": 0,\n \"create_by\": \"\",\n \"update_at\": 0,\n \"update_by\": \"\",\n \"uuid\": 1717556327615643000\n },\n {\n \"id\": 0,\n \"group_id\": 0,\n \"cate\": \"prometheus\",\n \"datasource_ids\": [\n 0\n ],\n \"cluster\": \"\",\n \"name\": \"KubeAPITerminatedRequests\",\n \"note\": \"The kubernetes apiserver has terminated {{ $value | humanizePercentage }} of its incoming requests.\",\n \"prod\": \"metric\",\n \"algorithm\": \"\",\n \"algo_params\": null,\n \"delay\": 0,\n \"severity\": 2,\n \"severities\": [\n 2\n ],\n \"disabled\": 1,\n \"prom_for_duration\": 300,\n \"prom_ql\": \"sum(rate(apiserver_request_terminations_total{job=\\\"apiserver\\\"}[10m])) / ( sum(rate(apiserver_request_total{job=\\\"apiserver\\\"}[10m])) + sum(rate(apiserver_request_terminations_total{job=\\\"apiserver\\\"}[10m])) ) \\u003e 0.20\\n\",\n \"rule_config\": {\n \"algo_params\": null,\n \"inhibit\": false,\n \"prom_ql\": \"\",\n \"queries\": [\n {\n \"prom_ql\": \"sum(rate(apiserver_request_terminations_total{job=\\\"apiserver\\\"}[10m])) / ( sum(rate(apiserver_request_total{job=\\\"apiserver\\\"}[10m])) + sum(rate(apiserver_request_terminations_total{job=\\\"apiserver\\\"}[10m])) ) \\u003e 0.20\\n\",\n \"severity\": 2\n }\n ],\n \"severity\": 0\n },\n \"prom_eval_interval\": 15,\n \"enable_stime\": \"00:00\",\n \"enable_stimes\": [\n \"00:00\"\n ],\n \"enable_etime\": \"23:59\",\n \"enable_etimes\": [\n \"23:59\"\n ],\n \"enable_days_of_week\": [\n \"1\",\n \"2\",\n \"3\",\n \"4\",\n \"5\",\n \"6\",\n \"0\"\n ],\n \"enable_days_of_weeks\": [\n [\n \"1\",\n \"2\",\n \"3\",\n \"4\",\n \"5\",\n \"6\",\n \"0\"\n ]\n ],\n \"enable_in_bg\": 0,\n \"notify_recovered\": 1,\n \"notify_channels\": [],\n \"notify_groups_obj\": null,\n \"notify_groups\": null,\n \"notify_repeat_step\": 60,\n \"notify_max_number\": 0,\n \"recover_duration\": 0,\n \"callbacks\": [],\n \"runbook_url\": \"\",\n \"append_tags\": [],\n \"annotations\": null,\n \"extra_config\": null,\n \"create_at\": 0,\n \"create_by\": \"\",\n \"update_at\": 0,\n \"update_by\": \"\",\n \"uuid\": 1717556327616331000\n },\n {\n \"id\": 0,\n \"group_id\": 0,\n \"cate\": \"prometheus\",\n \"datasource_ids\": [\n 0\n ],\n \"cluster\": \"\",\n \"name\": \"KubeClientCertificateExpiration\",\n \"note\": \"A client certificate used to authenticate to kubernetes apiserver is expiring in less than 7.0 days.\",\n \"prod\": \"metric\",\n \"algorithm\": \"\",\n \"algo_params\": null,\n \"delay\": 0,\n \"severity\": 2,\n \"severities\": [\n 2\n ],\n \"disabled\": 1,\n \"prom_for_duration\": 300,\n \"prom_ql\": \"apiserver_client_certificate_expiration_seconds_count{job=\\\"apiserver\\\"} \\u003e 0 and on(job) histogram_quantile(0.01, sum by (job, le) (rate(apiserver_client_certificate_expiration_seconds_bucket{job=\\\"apiserver\\\"}[5m]))) \\u003c 604800\\n\",\n \"rule_config\": {\n \"algo_params\": null,\n \"inhibit\": false,\n \"prom_ql\": \"\",\n \"queries\": [\n {\n \"prom_ql\": \"apiserver_client_certificate_expiration_seconds_count{job=\\\"apiserver\\\"} \\u003e 0 and on(job) histogram_quantile(0.01, sum by (job, le) (rate(apiserver_client_certificate_expiration_seconds_bucket{job=\\\"apiserver\\\"}[5m]))) \\u003c 604800\\n\",\n \"severity\": 2\n }\n ],\n \"severity\": 0\n },\n \"prom_eval_interval\": 15,\n \"enable_stime\": \"00:00\",\n \"enable_stimes\": [\n \"00:00\"\n ],\n \"enable_etime\": \"23:59\",\n \"enable_etimes\": [\n \"23:59\"\n ],\n \"enable_days_of_week\": [\n \"1\",\n \"2\",\n \"3\",\n \"4\",\n \"5\",\n \"6\",\n \"0\"\n ],\n \"enable_days_of_weeks\": [\n [\n \"1\",\n \"2\",\n \"3\",\n \"4\",\n \"5\",\n \"6\",\n \"0\"\n ]\n ],\n \"enable_in_bg\": 0,\n \"notify_recovered\": 1,\n \"notify_channels\": [],\n \"notify_groups_obj\": null,\n \"notify_groups\": null,\n \"notify_repeat_step\": 60,\n \"notify_max_number\": 0,\n \"recover_duration\": 0,\n \"callbacks\": [],\n \"runbook_url\": \"\",\n \"append_tags\": [],\n \"annotations\": null,\n \"extra_config\": null,\n \"create_at\": 0,\n \"create_by\": \"\",\n \"update_at\": 0,\n \"update_by\": \"\",\n \"uuid\": 1717556327616904000\n },\n {\n \"id\": 0,\n \"group_id\": 0,\n \"cate\": \"prometheus\",\n \"datasource_ids\": [\n 0\n ],\n \"cluster\": \"\",\n \"name\": \"KubeClientErrors\",\n \"note\": \"Kubernetes API server client '{{ $labels.job }}/{{ $labels.instance }}' is experiencing {{ $value | humanizePercentage }} errors.'\",\n \"prod\": \"metric\",\n \"algorithm\": \"\",\n \"algo_params\": null,\n \"delay\": 0,\n \"severity\": 2,\n \"severities\": [\n 2\n ],\n \"disabled\": 1,\n \"prom_for_duration\": 900,\n \"prom_ql\": \"(sum(rate(rest_client_requests_total{job=\\\"apiserver\\\",code=~\\\"5..\\\"}[5m])) by (cluster, instance, job, namespace)\\n /\\nsum(rate(rest_client_requests_total{job=\\\"apiserver\\\"}[5m])) by (cluster, instance, job, namespace))\\n\\u003e 0.01\\n\",\n \"rule_config\": {\n \"algo_params\": null,\n \"inhibit\": false,\n \"prom_ql\": \"\",\n \"queries\": [\n {\n \"prom_ql\": \"(sum(rate(rest_client_requests_total{job=\\\"apiserver\\\",code=~\\\"5..\\\"}[5m])) by (cluster, instance, job, namespace)\\n /\\nsum(rate(rest_client_requests_total{job=\\\"apiserver\\\"}[5m])) by (cluster, instance, job, namespace))\\n\\u003e 0.01\\n\",\n \"severity\": 2\n }\n ],\n \"severity\": 0\n },\n \"prom_eval_interval\": 15,\n \"enable_stime\": \"00:00\",\n \"enable_stimes\": [\n \"00:00\"\n ],\n \"enable_etime\": \"23:59\",\n \"enable_etimes\": [\n \"23:59\"\n ],\n \"enable_days_of_week\": [\n \"1\",\n \"2\",\n \"3\",\n \"4\",\n \"5\",\n \"6\",\n \"0\"\n ],\n \"enable_days_of_weeks\": [\n [\n \"1\",\n \"2\",\n \"3\",\n \"4\",\n \"5\",\n \"6\",\n \"0\"\n ]\n ],\n \"enable_in_bg\": 0,\n \"notify_recovered\": 1,\n \"notify_channels\": [],\n \"notify_groups_obj\": null,\n \"notify_groups\": null,\n \"notify_repeat_step\": 60,\n \"notify_max_number\": 0,\n \"recover_duration\": 0,\n \"callbacks\": [],\n \"runbook_url\": \"\",\n \"append_tags\": [],\n \"annotations\": null,\n \"extra_config\": null,\n \"create_at\": 0,\n \"create_by\": \"\",\n \"update_at\": 0,\n \"update_by\": \"\",\n \"uuid\": 1717556327617388000\n },\n {\n \"id\": 0,\n \"group_id\": 0,\n \"cate\": \"prometheus\",\n \"datasource_ids\": [\n 0\n ],\n \"cluster\": \"\",\n \"name\": \"KubeContainerWaiting\",\n \"note\": \"pod/{{ $labels.pod }} in namespace {{ $labels.namespace }} on container {{ $labels.container}} has been in waiting state for longer than 1 hour.\",\n \"prod\": \"metric\",\n \"algorithm\": \"\",\n \"algo_params\": null,\n \"delay\": 0,\n \"severity\": 2,\n \"severities\": [\n 2\n ],\n \"disabled\": 1,\n \"prom_for_duration\": 3600,\n \"prom_ql\": \"sum by (namespace, pod, container, cluster) (kube_pod_container_status_waiting_reason{job=\\\"kube-state-metrics\\\"}) \\u003e 0\\n\",\n \"rule_config\": {\n \"algo_params\": null,\n \"inhibit\": false,\n \"prom_ql\": \"\",\n \"queries\": [\n {\n \"prom_ql\": \"sum by (namespace, pod, container, cluster) (kube_pod_container_status_waiting_reason{job=\\\"kube-state-metrics\\\"}) \\u003e 0\\n\",\n \"severity\": 2\n }\n ],\n \"severity\": 0\n },\n \"prom_eval_interval\": 15,\n \"enable_stime\": \"00:00\",\n \"enable_stimes\": [\n \"00:00\"\n ],\n \"enable_etime\": \"23:59\",\n \"enable_etimes\": [\n \"23:59\"\n ],\n \"enable_days_of_week\": [\n \"1\",\n \"2\",\n \"3\",\n \"4\",\n \"5\",\n \"6\",\n \"0\"\n ],\n \"enable_days_of_weeks\": [\n [\n \"1\",\n \"2\",\n \"3\",\n \"4\",\n \"5\",\n \"6\",\n \"0\"\n ]\n ],\n \"enable_in_bg\": 0,\n \"notify_recovered\": 1,\n \"notify_channels\": [],\n \"notify_groups_obj\": null,\n \"notify_groups\": null,\n \"notify_repeat_step\": 60,\n \"notify_max_number\": 0,\n \"recover_duration\": 0,\n \"callbacks\": [],\n \"runbook_url\": \"\",\n \"append_tags\": [],\n \"annotations\": null,\n \"extra_config\": null,\n \"create_at\": 0,\n \"create_by\": \"\",\n \"update_at\": 0,\n \"update_by\": \"\",\n \"uuid\": 1717556327618152000\n },\n {\n \"id\": 0,\n \"group_id\": 0,\n \"cate\": \"prometheus\",\n \"datasource_ids\": [\n 0\n ],\n \"cluster\": \"\",\n \"name\": \"KubeControllerManagerDown\",\n \"note\": \"KubeControllerManager has disappeared from Prometheus target discovery.\",\n \"prod\": \"metric\",\n \"algorithm\": \"\",\n \"algo_params\": null,\n \"delay\": 0,\n \"severity\": 1,\n \"severities\": [\n 1\n ],\n \"disabled\": 1,\n \"prom_for_duration\": 900,\n \"prom_ql\": \"absent(up{job=\\\"kube-controller-manager\\\"} == 1)\\n\",\n \"rule_config\": {\n \"algo_params\": null,\n \"inhibit\": false,\n \"prom_ql\": \"\",\n \"queries\": [\n {\n \"prom_ql\": \"absent(up{job=\\\"kube-controller-manager\\\"} == 1)\\n\",\n \"severity\": 1\n }\n ],\n \"severity\": 0\n },\n \"prom_eval_interval\": 15,\n \"enable_stime\": \"00:00\",\n \"enable_stimes\": [\n \"00:00\"\n ],\n \"enable_etime\": \"23:59\",\n \"enable_etimes\": [\n \"23:59\"\n ],\n \"enable_days_of_week\": [\n \"1\",\n \"2\",\n \"3\",\n \"4\",\n \"5\",\n \"6\",\n \"0\"\n ],\n \"enable_days_of_weeks\": [\n [\n \"1\",\n \"2\",\n \"3\",\n \"4\",\n \"5\",\n \"6\",\n \"0\"\n ]\n ],\n \"enable_in_bg\": 0,\n \"notify_recovered\": 1,\n \"notify_channels\": [],\n \"notify_groups_obj\": null,\n \"notify_groups\": null,\n \"notify_repeat_step\": 60,\n \"notify_max_number\": 0,\n \"recover_duration\": 0,\n \"callbacks\": [],\n \"runbook_url\": \"\",\n \"append_tags\": [],\n \"annotations\": null,\n \"extra_config\": null,\n \"create_at\": 0,\n \"create_by\": \"\",\n \"update_at\": 0,\n \"update_by\": \"\",\n \"uuid\": 1717556327618705000\n },\n {\n \"id\": 0,\n \"group_id\": 0,\n \"cate\": \"prometheus\",\n \"datasource_ids\": [\n 0\n ],\n \"cluster\": \"\",\n \"name\": \"KubeCPUOvercommit\",\n \"note\": \"Cluster {{ $labels.cluster }} has overcommitted CPU resource requests for Pods by {{ $value }} CPU shares and cannot tolerate node failure.\",\n \"prod\": \"metric\",\n \"algorithm\": \"\",\n \"algo_params\": null,\n \"delay\": 0,\n \"severity\": 2,\n \"severities\": [\n 2\n ],\n \"disabled\": 1,\n \"prom_for_duration\": 600,\n \"prom_ql\": \"sum(namespace_cpu:kube_pod_container_resource_requests:sum{job=\\\"kube-state-metrics\\\",}) by (cluster) - (sum(kube_node_status_allocatable{job=\\\"kube-state-metrics\\\",resource=\\\"cpu\\\"}) by (cluster) - max(kube_node_status_allocatable{job=\\\"kube-state-metrics\\\",resource=\\\"cpu\\\"}) by (cluster)) \\u003e 0\\nand\\n(sum(kube_node_status_allocatable{job=\\\"kube-state-metrics\\\",resource=\\\"cpu\\\"}) by (cluster) - max(kube_node_status_allocatable{job=\\\"kube-state-metrics\\\",resource=\\\"cpu\\\"}) by (cluster)) \\u003e 0\\n\",\n \"rule_config\": {\n \"algo_params\": null,\n \"inhibit\": false,\n \"prom_ql\": \"\",\n \"queries\": [\n {\n \"prom_ql\": \"sum(namespace_cpu:kube_pod_container_resource_requests:sum{job=\\\"kube-state-metrics\\\",}) by (cluster) - (sum(kube_node_status_allocatable{job=\\\"kube-state-metrics\\\",resource=\\\"cpu\\\"}) by (cluster) - max(kube_node_status_allocatable{job=\\\"kube-state-metrics\\\",resource=\\\"cpu\\\"}) by (cluster)) \\u003e 0\\nand\\n(sum(kube_node_status_allocatable{job=\\\"kube-state-metrics\\\",resource=\\\"cpu\\\"}) by (cluster) - max(kube_node_status_allocatable{job=\\\"kube-state-metrics\\\",resource=\\\"cpu\\\"}) by (cluster)) \\u003e 0\\n\",\n \"severity\": 2\n }\n ],\n \"severity\": 0\n },\n \"prom_eval_interval\": 15,\n \"enable_stime\": \"00:00\",\n \"enable_stimes\": [\n \"00:00\"\n ],\n \"enable_etime\": \"23:59\",\n \"enable_etimes\": [\n \"23:59\"\n ],\n \"enable_days_of_week\": [\n \"1\",\n \"2\",\n \"3\",\n \"4\",\n \"5\",\n \"6\",\n \"0\"\n ],\n \"enable_days_of_weeks\": [\n [\n \"1\",\n \"2\",\n \"3\",\n \"4\",\n \"5\",\n \"6\",\n \"0\"\n ]\n ],\n \"enable_in_bg\": 0,\n \"notify_recovered\": 1,\n \"notify_channels\": [],\n \"notify_groups_obj\": null,\n \"notify_groups\": null,\n \"notify_repeat_step\": 60,\n \"notify_max_number\": 0,\n \"recover_duration\": 0,\n \"callbacks\": [],\n \"runbook_url\": \"\",\n \"append_tags\": [],\n \"annotations\": null,\n \"extra_config\": null,\n \"create_at\": 0,\n \"create_by\": \"\",\n \"update_at\": 0,\n \"update_by\": \"\",\n \"uuid\": 1717556327619215000\n },\n {\n \"id\": 0,\n \"group_id\": 0,\n \"cate\": \"prometheus\",\n \"datasource_ids\": [\n 0\n ],\n \"cluster\": \"\",\n \"name\": \"KubeCPUQuotaOvercommit\",\n \"note\": \"Cluster {{ $labels.cluster }} has overcommitted CPU resource requests for Namespaces.\",\n \"prod\": \"metric\",\n \"algorithm\": \"\",\n \"algo_params\": null,\n \"delay\": 0,\n \"severity\": 2,\n \"severities\": [\n 2\n ],\n \"disabled\": 1,\n \"prom_for_duration\": 300,\n \"prom_ql\": \"sum(min without(resource) (kube_resourcequota{job=\\\"kube-state-metrics\\\", type=\\\"hard\\\", resource=~\\\"(cpu|requests.cpu)\\\"})) by (cluster)\\n /\\nsum(kube_node_status_allocatable{resource=\\\"cpu\\\", job=\\\"kube-state-metrics\\\"}) by (cluster)\\n \\u003e 1.5\\n\",\n \"rule_config\": {\n \"algo_params\": null,\n \"inhibit\": false,\n \"prom_ql\": \"\",\n \"queries\": [\n {\n \"prom_ql\": \"sum(min without(resource) (kube_resourcequota{job=\\\"kube-state-metrics\\\", type=\\\"hard\\\", resource=~\\\"(cpu|requests.cpu)\\\"})) by (cluster)\\n /\\nsum(kube_node_status_allocatable{resource=\\\"cpu\\\", job=\\\"kube-state-metrics\\\"}) by (cluster)\\n \\u003e 1.5\\n\",\n \"severity\": 2\n }\n ],\n \"severity\": 0\n },\n \"prom_eval_interval\": 15,\n \"enable_stime\": \"00:00\",\n \"enable_stimes\": [\n \"00:00\"\n ],\n \"enable_etime\": \"23:59\",\n \"enable_etimes\": [\n \"23:59\"\n ],\n \"enable_days_of_week\": [\n \"1\",\n \"2\",\n \"3\",\n \"4\",\n \"5\",\n \"6\",\n \"0\"\n ],\n \"enable_days_of_weeks\": [\n [\n \"1\",\n \"2\",\n \"3\",\n \"4\",\n \"5\",\n \"6\",\n \"0\"\n ]\n ],\n \"enable_in_bg\": 0,\n \"notify_recovered\": 1,\n \"notify_channels\": [],\n \"notify_groups_obj\": null,\n \"notify_groups\": null,\n \"notify_repeat_step\": 60,\n \"notify_max_number\": 0,\n \"recover_duration\": 0,\n \"callbacks\": [],\n \"runbook_url\": \"\",\n \"append_tags\": [],\n \"annotations\": null,\n \"extra_config\": null,\n \"create_at\": 0,\n \"create_by\": \"\",\n \"update_at\": 0,\n \"update_by\": \"\",\n \"uuid\": 1717556327619730000\n },\n {\n \"id\": 0,\n \"group_id\": 0,\n \"cate\": \"prometheus\",\n \"datasource_ids\": [\n 0\n ],\n \"cluster\": \"\",\n \"name\": \"KubeDaemonSetMisScheduled\",\n \"note\": \"{{ $value }} Pods of DaemonSet {{ $labels.namespace }}/{{ $labels.daemonset }} are running where they are not supposed to run.\",\n \"prod\": \"metric\",\n \"algorithm\": \"\",\n \"algo_params\": null,\n \"delay\": 0,\n \"severity\": 2,\n \"severities\": [\n 2\n ],\n \"disabled\": 1,\n \"prom_for_duration\": 900,\n \"prom_ql\": \"kube_daemonset_status_number_misscheduled{job=\\\"kube-state-metrics\\\"} \\u003e 0\\n\",\n \"rule_config\": {\n \"algo_params\": null,\n \"inhibit\": false,\n \"prom_ql\": \"\",\n \"queries\": [\n {\n \"prom_ql\": \"kube_daemonset_status_number_misscheduled{job=\\\"kube-state-metrics\\\"} \\u003e 0\\n\",\n \"severity\": 2\n }\n ],\n \"severity\": 0\n },\n \"prom_eval_interval\": 15,\n \"enable_stime\": \"00:00\",\n \"enable_stimes\": [\n \"00:00\"\n ],\n \"enable_etime\": \"23:59\",\n \"enable_etimes\": [\n \"23:59\"\n ],\n \"enable_days_of_week\": [\n \"1\",\n \"2\",\n \"3\",\n \"4\",\n \"5\",\n \"6\",\n \"0\"\n ],\n \"enable_days_of_weeks\": [\n [\n \"1\",\n \"2\",\n \"3\",\n \"4\",\n \"5\",\n \"6\",\n \"0\"\n ]\n ],\n \"enable_in_bg\": 0,\n \"notify_recovered\": 1,\n \"notify_channels\": [],\n \"notify_groups_obj\": null,\n \"notify_groups\": null,\n \"notify_repeat_step\": 60,\n \"notify_max_number\": 0,\n \"recover_duration\": 0,\n \"callbacks\": [],\n \"runbook_url\": \"\",\n \"append_tags\": [],\n \"annotations\": null,\n \"extra_config\": null,\n \"create_at\": 0,\n \"create_by\": \"\",\n \"update_at\": 0,\n \"update_by\": \"\",\n \"uuid\": 1717556327620239000\n },\n {\n \"id\": 0,\n \"group_id\": 0,\n \"cate\": \"prometheus\",\n \"datasource_ids\": [\n 0\n ],\n \"cluster\": \"\",\n \"name\": \"KubeDaemonSetNotScheduled\",\n \"note\": \"{{ $value }} Pods of DaemonSet {{ $labels.namespace }}/{{ $labels.daemonset }} are not scheduled.\",\n \"prod\": \"metric\",\n \"algorithm\": \"\",\n \"algo_params\": null,\n \"delay\": 0,\n \"severity\": 2,\n \"severities\": [\n 2\n ],\n \"disabled\": 1,\n \"prom_for_duration\": 600,\n \"prom_ql\": \"kube_daemonset_status_desired_number_scheduled{job=\\\"kube-state-metrics\\\"}\\n -\\nkube_daemonset_status_current_number_scheduled{job=\\\"kube-state-metrics\\\"} \\u003e 0\\n\",\n \"rule_config\": {\n \"algo_params\": null,\n \"inhibit\": false,\n \"prom_ql\": \"\",\n \"queries\": [\n {\n \"prom_ql\": \"kube_daemonset_status_desired_number_scheduled{job=\\\"kube-state-metrics\\\"}\\n -\\nkube_daemonset_status_current_number_scheduled{job=\\\"kube-state-metrics\\\"} \\u003e 0\\n\",\n \"severity\": 2\n }\n ],\n \"severity\": 0\n },\n \"prom_eval_interval\": 15,\n \"enable_stime\": \"00:00\",\n \"enable_stimes\": [\n \"00:00\"\n ],\n \"enable_etime\": \"23:59\",\n \"enable_etimes\": [\n \"23:59\"\n ],\n \"enable_days_of_week\": [\n \"1\",\n \"2\",\n \"3\",\n \"4\",\n \"5\",\n \"6\",\n \"0\"\n ],\n \"enable_days_of_weeks\": [\n [\n \"1\",\n \"2\",\n \"3\",\n \"4\",\n \"5\",\n \"6\",\n \"0\"\n ]\n ],\n \"enable_in_bg\": 0,\n \"notify_recovered\": 1,\n \"notify_channels\": [],\n \"notify_groups_obj\": null,\n \"notify_groups\": null,\n \"notify_repeat_step\": 60,\n \"notify_max_number\": 0,\n \"recover_duration\": 0,\n \"callbacks\": [],\n \"runbook_url\": \"\",\n \"append_tags\": [],\n \"annotations\": null,\n \"extra_config\": null,\n \"create_at\": 0,\n \"create_by\": \"\",\n \"update_at\": 0,\n \"update_by\": \"\",\n \"uuid\": 1717556327620796000\n },\n {\n \"id\": 0,\n \"group_id\": 0,\n \"cate\": \"prometheus\",\n \"datasource_ids\": [\n 0\n ],\n \"cluster\": \"\",\n \"name\": \"KubeDaemonSetRolloutStuck\",\n \"note\": \"DaemonSet {{ $labels.namespace }}/{{ $labels.daemonset }} has not finished or progressed for at least 15 minutes.\",\n \"prod\": \"metric\",\n \"algorithm\": \"\",\n \"algo_params\": null,\n \"delay\": 0,\n \"severity\": 2,\n \"severities\": [\n 2\n ],\n \"disabled\": 1,\n \"prom_for_duration\": 900,\n \"prom_ql\": \"(\\n (\\n kube_daemonset_status_current_number_scheduled{job=\\\"kube-state-metrics\\\"}\\n !=\\n kube_daemonset_status_desired_number_scheduled{job=\\\"kube-state-metrics\\\"}\\n ) or (\\n kube_daemonset_status_number_misscheduled{job=\\\"kube-state-metrics\\\"}\\n !=\\n 0\\n ) or (\\n kube_daemonset_status_updated_number_scheduled{job=\\\"kube-state-metrics\\\"}\\n !=\\n kube_daemonset_status_desired_number_scheduled{job=\\\"kube-state-metrics\\\"}\\n ) or (\\n kube_daemonset_status_number_available{job=\\\"kube-state-metrics\\\"}\\n !=\\n kube_daemonset_status_desired_number_scheduled{job=\\\"kube-state-metrics\\\"}\\n )\\n) and (\\n changes(kube_daemonset_status_updated_number_scheduled{job=\\\"kube-state-metrics\\\"}[5m])\\n ==\\n 0\\n)\\n\",\n \"rule_config\": {\n \"algo_params\": null,\n \"inhibit\": false,\n \"prom_ql\": \"\",\n \"queries\": [\n {\n \"prom_ql\": \"(\\n (\\n kube_daemonset_status_current_number_scheduled{job=\\\"kube-state-metrics\\\"}\\n !=\\n kube_daemonset_status_desired_number_scheduled{job=\\\"kube-state-metrics\\\"}\\n ) or (\\n kube_daemonset_status_number_misscheduled{job=\\\"kube-state-metrics\\\"}\\n !=\\n 0\\n ) or (\\n kube_daemonset_status_updated_number_scheduled{job=\\\"kube-state-metrics\\\"}\\n !=\\n kube_daemonset_status_desired_number_scheduled{job=\\\"kube-state-metrics\\\"}\\n ) or (\\n kube_daemonset_status_number_available{job=\\\"kube-state-metrics\\\"}\\n !=\\n kube_daemonset_status_desired_number_scheduled{job=\\\"kube-state-metrics\\\"}\\n )\\n) and (\\n changes(kube_daemonset_status_updated_number_scheduled{job=\\\"kube-state-metrics\\\"}[5m])\\n ==\\n 0\\n)\\n\",\n \"severity\": 2\n }\n ],\n \"severity\": 0\n },\n \"prom_eval_interval\": 15,\n \"enable_stime\": \"00:00\",\n \"enable_stimes\": [\n \"00:00\"\n ],\n \"enable_etime\": \"23:59\",\n \"enable_etimes\": [\n \"23:59\"\n ],\n \"enable_days_of_week\": [\n \"1\",\n \"2\",\n \"3\",\n \"4\",\n \"5\",\n \"6\",\n \"0\"\n ],\n \"enable_days_of_weeks\": [\n [\n \"1\",\n \"2\",\n \"3\",\n \"4\",\n \"5\",\n \"6\",\n \"0\"\n ]\n ],\n \"enable_in_bg\": 0,\n \"notify_recovered\": 1,\n \"notify_channels\": [],\n \"notify_groups_obj\": null,\n \"notify_groups\": null,\n \"notify_repeat_step\": 60,\n \"notify_max_number\": 0,\n \"recover_duration\": 0,\n \"callbacks\": [],\n \"runbook_url\": \"\",\n \"append_tags\": [],\n \"annotations\": null,\n \"extra_config\": null,\n \"create_at\": 0,\n \"create_by\": \"\",\n \"update_at\": 0,\n \"update_by\": \"\",\n \"uuid\": 1717556327621274000\n },\n {\n \"id\": 0,\n \"group_id\": 0,\n \"cate\": \"prometheus\",\n \"datasource_ids\": [\n 0\n ],\n \"cluster\": \"\",\n \"name\": \"KubeDeploymentGenerationMismatch\",\n \"note\": \"Deployment generation for {{ $labels.namespace }}/{{ $labels.deployment }} does not match, this indicates that the Deployment has failed but has not been rolled back.\",\n \"prod\": \"metric\",\n \"algorithm\": \"\",\n \"algo_params\": null,\n \"delay\": 0,\n \"severity\": 2,\n \"severities\": [\n 2\n ],\n \"disabled\": 1,\n \"prom_for_duration\": 900,\n \"prom_ql\": \"kube_deployment_status_observed_generation{job=\\\"kube-state-metrics\\\"}\\n !=\\nkube_deployment_metadata_generation{job=\\\"kube-state-metrics\\\"}\\n\",\n \"rule_config\": {\n \"algo_params\": null,\n \"inhibit\": false,\n \"prom_ql\": \"\",\n \"queries\": [\n {\n \"prom_ql\": \"kube_deployment_status_observed_generation{job=\\\"kube-state-metrics\\\"}\\n !=\\nkube_deployment_metadata_generation{job=\\\"kube-state-metrics\\\"}\\n\",\n \"severity\": 2\n }\n ],\n \"severity\": 0\n },\n \"prom_eval_interval\": 15,\n \"enable_stime\": \"00:00\",\n \"enable_stimes\": [\n \"00:00\"\n ],\n \"enable_etime\": \"23:59\",\n \"enable_etimes\": [\n \"23:59\"\n ],\n \"enable_days_of_week\": [\n \"1\",\n \"2\",\n \"3\",\n \"4\",\n \"5\",\n \"6\",\n \"0\"\n ],\n \"enable_days_of_weeks\": [\n [\n \"1\",\n \"2\",\n \"3\",\n \"4\",\n \"5\",\n \"6\",\n \"0\"\n ]\n ],\n \"enable_in_bg\": 0,\n \"notify_recovered\": 1,\n \"notify_channels\": [],\n \"notify_groups_obj\": null,\n \"notify_groups\": null,\n \"notify_repeat_step\": 60,\n \"notify_max_number\": 0,\n \"recover_duration\": 0,\n \"callbacks\": [],\n \"runbook_url\": \"\",\n \"append_tags\": [],\n \"annotations\": null,\n \"extra_config\": null,\n \"create_at\": 0,\n \"create_by\": \"\",\n \"update_at\": 0,\n \"update_by\": \"\",\n \"uuid\": 1717556327621811000\n },\n {\n \"id\": 0,\n \"group_id\": 0,\n \"cate\": \"prometheus\",\n \"datasource_ids\": [\n 0\n ],\n \"cluster\": \"\",\n \"name\": \"KubeDeploymentReplicasMismatch\",\n \"note\": \"Deployment {{ $labels.namespace }}/{{ $labels.deployment }} has not matched the expected number of replicas for longer than 15 minutes.\",\n \"prod\": \"metric\",\n \"algorithm\": \"\",\n \"algo_params\": null,\n \"delay\": 0,\n \"severity\": 2,\n \"severities\": [\n 2\n ],\n \"disabled\": 1,\n \"prom_for_duration\": 900,\n \"prom_ql\": \"(\\n kube_deployment_spec_replicas{job=\\\"kube-state-metrics\\\"}\\n \\u003e\\n kube_deployment_status_replicas_available{job=\\\"kube-state-metrics\\\"}\\n) and (\\n changes(kube_deployment_status_replicas_updated{job=\\\"kube-state-metrics\\\"}[10m])\\n ==\\n 0\\n)\\n\",\n \"rule_config\": {\n \"algo_params\": null,\n \"inhibit\": false,\n \"prom_ql\": \"\",\n \"queries\": [\n {\n \"prom_ql\": \"(\\n kube_deployment_spec_replicas{job=\\\"kube-state-metrics\\\"}\\n \\u003e\\n kube_deployment_status_replicas_available{job=\\\"kube-state-metrics\\\"}\\n) and (\\n changes(kube_deployment_status_replicas_updated{job=\\\"kube-state-metrics\\\"}[10m])\\n ==\\n 0\\n)\\n\",\n \"severity\": 2\n }\n ],\n \"severity\": 0\n },\n \"prom_eval_interval\": 15,\n \"enable_stime\": \"00:00\",\n \"enable_stimes\": [\n \"00:00\"\n ],\n \"enable_etime\": \"23:59\",\n \"enable_etimes\": [\n \"23:59\"\n ],\n \"enable_days_of_week\": [\n \"1\",\n \"2\",\n \"3\",\n \"4\",\n \"5\",\n \"6\",\n \"0\"\n ],\n \"enable_days_of_weeks\": [\n [\n \"1\",\n \"2\",\n \"3\",\n \"4\",\n \"5\",\n \"6\",\n \"0\"\n ]\n ],\n \"enable_in_bg\": 0,\n \"notify_recovered\": 1,\n \"notify_channels\": [],\n \"notify_groups_obj\": null,\n \"notify_groups\": null,\n \"notify_repeat_step\": 60,\n \"notify_max_number\": 0,\n \"recover_duration\": 0,\n \"callbacks\": [],\n \"runbook_url\": \"\",\n \"append_tags\": [],\n \"annotations\": null,\n \"extra_config\": null,\n \"create_at\": 0,\n \"create_by\": \"\",\n \"update_at\": 0,\n \"update_by\": \"\",\n \"uuid\": 1717556327622401000\n },\n {\n \"id\": 0,\n \"group_id\": 0,\n \"cate\": \"prometheus\",\n \"datasource_ids\": [\n 0\n ],\n \"cluster\": \"\",\n \"name\": \"KubeDeploymentRolloutStuck\",\n \"note\": \"Rollout of deployment {{ $labels.namespace }}/{{ $labels.deployment }} is not progressing for longer than 15 minutes.\",\n \"prod\": \"metric\",\n \"algorithm\": \"\",\n \"algo_params\": null,\n \"delay\": 0,\n \"severity\": 2,\n \"severities\": [\n 2\n ],\n \"disabled\": 1,\n \"prom_for_duration\": 900,\n \"prom_ql\": \"kube_deployment_status_condition{condition=\\\"Progressing\\\", status=\\\"false\\\",job=\\\"kube-state-metrics\\\"}\\n!= 0\\n\",\n \"rule_config\": {\n \"algo_params\": null,\n \"inhibit\": false,\n \"prom_ql\": \"\",\n \"queries\": [\n {\n \"prom_ql\": \"kube_deployment_status_condition{condition=\\\"Progressing\\\", status=\\\"false\\\",job=\\\"kube-state-metrics\\\"}\\n!= 0\\n\",\n \"severity\": 2\n }\n ],\n \"severity\": 0\n },\n \"prom_eval_interval\": 15,\n \"enable_stime\": \"00:00\",\n \"enable_stimes\": [\n \"00:00\"\n ],\n \"enable_etime\": \"23:59\",\n \"enable_etimes\": [\n \"23:59\"\n ],\n \"enable_days_of_week\": [\n \"1\",\n \"2\",\n \"3\",\n \"4\",\n \"5\",\n \"6\",\n \"0\"\n ],\n \"enable_days_of_weeks\": [\n [\n \"1\",\n \"2\",\n \"3\",\n \"4\",\n \"5\",\n \"6\",\n \"0\"\n ]\n ],\n \"enable_in_bg\": 0,\n \"notify_recovered\": 1,\n \"notify_channels\": [],\n \"notify_groups_obj\": null,\n \"notify_groups\": null,\n \"notify_repeat_step\": 60,\n \"notify_max_number\": 0,\n \"recover_duration\": 0,\n \"callbacks\": [],\n \"runbook_url\": \"\",\n \"append_tags\": [],\n \"annotations\": null,\n \"extra_config\": null,\n \"create_at\": 0,\n \"create_by\": \"\",\n \"update_at\": 0,\n \"update_by\": \"\",\n \"uuid\": 1717556327622995000\n },\n {\n \"id\": 0,\n \"group_id\": 0,\n \"cate\": \"prometheus\",\n \"datasource_ids\": [\n 0\n ],\n \"cluster\": \"\",\n \"name\": \"KubeHpaMaxedOut\",\n \"note\": \"HPA {{ $labels.namespace }}/{{ $labels.horizontalpodautoscaler }} has been running at max replicas for longer than 15 minutes.\",\n \"prod\": \"metric\",\n \"algorithm\": \"\",\n \"algo_params\": null,\n \"delay\": 0,\n \"severity\": 2,\n \"severities\": [\n 2\n ],\n \"disabled\": 1,\n \"prom_for_duration\": 900,\n \"prom_ql\": \"kube_horizontalpodautoscaler_status_current_replicas{job=\\\"kube-state-metrics\\\"}\\n ==\\nkube_horizontalpodautoscaler_spec_max_replicas{job=\\\"kube-state-metrics\\\"}\\n\",\n \"rule_config\": {\n \"algo_params\": null,\n \"inhibit\": false,\n \"prom_ql\": \"\",\n \"queries\": [\n {\n \"prom_ql\": \"kube_horizontalpodautoscaler_status_current_replicas{job=\\\"kube-state-metrics\\\"}\\n ==\\nkube_horizontalpodautoscaler_spec_max_replicas{job=\\\"kube-state-metrics\\\"}\\n\",\n \"severity\": 2\n }\n ],\n \"severity\": 0\n },\n \"prom_eval_interval\": 15,\n \"enable_stime\": \"00:00\",\n \"enable_stimes\": [\n \"00:00\"\n ],\n \"enable_etime\": \"23:59\",\n \"enable_etimes\": [\n \"23:59\"\n ],\n \"enable_days_of_week\": [\n \"1\",\n \"2\",\n \"3\",\n \"4\",\n \"5\",\n \"6\",\n \"0\"\n ],\n \"enable_days_of_weeks\": [\n [\n \"1\",\n \"2\",\n \"3\",\n \"4\",\n \"5\",\n \"6\",\n \"0\"\n ]\n ],\n \"enable_in_bg\": 0,\n \"notify_recovered\": 1,\n \"notify_channels\": [],\n \"notify_groups_obj\": null,\n \"notify_groups\": null,\n \"notify_repeat_step\": 60,\n \"notify_max_number\": 0,\n \"recover_duration\": 0,\n \"callbacks\": [],\n \"runbook_url\": \"\",\n \"append_tags\": [],\n \"annotations\": null,\n \"extra_config\": null,\n \"create_at\": 0,\n \"create_by\": \"\",\n \"update_at\": 0,\n \"update_by\": \"\",\n \"uuid\": 1717556327623537000\n },\n {\n \"id\": 0,\n \"group_id\": 0,\n \"cate\": \"prometheus\",\n \"datasource_ids\": [\n 0\n ],\n \"cluster\": \"\",\n \"name\": \"KubeHpaReplicasMismatch\",\n \"note\": \"HPA {{ $labels.namespace }}/{{ $labels.horizontalpodautoscaler }} has not matched the desired number of replicas for longer than 15 minutes.\",\n \"prod\": \"metric\",\n \"algorithm\": \"\",\n \"algo_params\": null,\n \"delay\": 0,\n \"severity\": 2,\n \"severities\": [\n 2\n ],\n \"disabled\": 1,\n \"prom_for_duration\": 900,\n \"prom_ql\": \"(kube_horizontalpodautoscaler_status_desired_replicas{job=\\\"kube-state-metrics\\\"}\\n !=\\nkube_horizontalpodautoscaler_status_current_replicas{job=\\\"kube-state-metrics\\\"})\\n and\\n(kube_horizontalpodautoscaler_status_current_replicas{job=\\\"kube-state-metrics\\\"}\\n \\u003e\\nkube_horizontalpodautoscaler_spec_min_replicas{job=\\\"kube-state-metrics\\\"})\\n and\\n(kube_horizontalpodautoscaler_status_current_replicas{job=\\\"kube-state-metrics\\\"}\\n \\u003c\\nkube_horizontalpodautoscaler_spec_max_replicas{job=\\\"kube-state-metrics\\\"})\\n and\\nchanges(kube_horizontalpodautoscaler_status_current_replicas{job=\\\"kube-state-metrics\\\"}[15m]) == 0\\n\",\n \"rule_config\": {\n \"algo_params\": null,\n \"inhibit\": false,\n \"prom_ql\": \"\",\n \"queries\": [\n {\n \"prom_ql\": \"(kube_horizontalpodautoscaler_status_desired_replicas{job=\\\"kube-state-metrics\\\"}\\n !=\\nkube_horizontalpodautoscaler_status_current_replicas{job=\\\"kube-state-metrics\\\"})\\n and\\n(kube_horizontalpodautoscaler_status_current_replicas{job=\\\"kube-state-metrics\\\"}\\n \\u003e\\nkube_horizontalpodautoscaler_spec_min_replicas{job=\\\"kube-state-metrics\\\"})\\n and\\n(kube_horizontalpodautoscaler_status_current_replicas{job=\\\"kube-state-metrics\\\"}\\n \\u003c\\nkube_horizontalpodautoscaler_spec_max_replicas{job=\\\"kube-state-metrics\\\"})\\n and\\nchanges(kube_horizontalpodautoscaler_status_current_replicas{job=\\\"kube-state-metrics\\\"}[15m]) == 0\\n\",\n \"severity\": 2\n }\n ],\n \"severity\": 0\n },\n \"prom_eval_interval\": 15,\n \"enable_stime\": \"00:00\",\n \"enable_stimes\": [\n \"00:00\"\n ],\n \"enable_etime\": \"23:59\",\n \"enable_etimes\": [\n \"23:59\"\n ],\n \"enable_days_of_week\": [\n \"1\",\n \"2\",\n \"3\",\n \"4\",\n \"5\",\n \"6\",\n \"0\"\n ],\n \"enable_days_of_weeks\": [\n [\n \"1\",\n \"2\",\n \"3\",\n \"4\",\n \"5\",\n \"6\",\n \"0\"\n ]\n ],\n \"enable_in_bg\": 0,\n \"notify_recovered\": 1,\n \"notify_channels\": [],\n \"notify_groups_obj\": null,\n \"notify_groups\": null,\n \"notify_repeat_step\": 60,\n \"notify_max_number\": 0,\n \"recover_duration\": 0,\n \"callbacks\": [],\n \"runbook_url\": \"\",\n \"append_tags\": [],\n \"annotations\": null,\n \"extra_config\": null,\n \"create_at\": 0,\n \"create_by\": \"\",\n \"update_at\": 0,\n \"update_by\": \"\",\n \"uuid\": 1717556327624174000\n },\n {\n \"id\": 0,\n \"group_id\": 0,\n \"cate\": \"prometheus\",\n \"datasource_ids\": [\n 0\n ],\n \"cluster\": \"\",\n \"name\": \"KubeJobFailed\",\n \"note\": \"Job {{ $labels.namespace }}/{{ $labels.job_name }} failed to complete. Removing failed job after investigation should clear this alert.\",\n \"prod\": \"metric\",\n \"algorithm\": \"\",\n \"algo_params\": null,\n \"delay\": 0,\n \"severity\": 2,\n \"severities\": [\n 2\n ],\n \"disabled\": 1,\n \"prom_for_duration\": 900,\n \"prom_ql\": \"kube_job_failed{job=\\\"kube-state-metrics\\\"} \\u003e 0\\n\",\n \"rule_config\": {\n \"algo_params\": null,\n \"inhibit\": false,\n \"prom_ql\": \"\",\n \"queries\": [\n {\n \"prom_ql\": \"kube_job_failed{job=\\\"kube-state-metrics\\\"} \\u003e 0\\n\",\n \"severity\": 2\n }\n ],\n \"severity\": 0\n },\n \"prom_eval_interval\": 15,\n \"enable_stime\": \"00:00\",\n \"enable_stimes\": [\n \"00:00\"\n ],\n \"enable_etime\": \"23:59\",\n \"enable_etimes\": [\n \"23:59\"\n ],\n \"enable_days_of_week\": [\n \"1\",\n \"2\",\n \"3\",\n \"4\",\n \"5\",\n \"6\",\n \"0\"\n ],\n \"enable_days_of_weeks\": [\n [\n \"1\",\n \"2\",\n \"3\",\n \"4\",\n \"5\",\n \"6\",\n \"0\"\n ]\n ],\n \"enable_in_bg\": 0,\n \"notify_recovered\": 1,\n \"notify_channels\": [],\n \"notify_groups_obj\": null,\n \"notify_groups\": null,\n \"notify_repeat_step\": 60,\n \"notify_max_number\": 0,\n \"recover_duration\": 0,\n \"callbacks\": [],\n \"runbook_url\": \"\",\n \"append_tags\": [],\n \"annotations\": null,\n \"extra_config\": null,\n \"create_at\": 0,\n \"create_by\": \"\",\n \"update_at\": 0,\n \"update_by\": \"\",\n \"uuid\": 1717556327624761000\n },\n {\n \"id\": 0,\n \"group_id\": 0,\n \"cate\": \"prometheus\",\n \"datasource_ids\": [\n 0\n ],\n \"cluster\": \"\",\n \"name\": \"KubeJobNotCompleted\",\n \"note\": \"Job {{ $labels.namespace }}/{{ $labels.job_name }} is taking more than {{ \\\"43200\\\" | humanizeDuration }} to complete.\",\n \"prod\": \"metric\",\n \"algorithm\": \"\",\n \"algo_params\": null,\n \"delay\": 0,\n \"severity\": 2,\n \"severities\": [\n 2\n ],\n \"disabled\": 1,\n \"prom_for_duration\": 0,\n \"prom_ql\": \"time() - max by(namespace, job_name, cluster) (kube_job_status_start_time{job=\\\"kube-state-metrics\\\"}\\n and\\nkube_job_status_active{job=\\\"kube-state-metrics\\\"} \\u003e 0) \\u003e 43200\\n\",\n \"rule_config\": {\n \"algo_params\": null,\n \"inhibit\": false,\n \"prom_ql\": \"\",\n \"queries\": [\n {\n \"prom_ql\": \"time() - max by(namespace, job_name, cluster) (kube_job_status_start_time{job=\\\"kube-state-metrics\\\"}\\n and\\nkube_job_status_active{job=\\\"kube-state-metrics\\\"} \\u003e 0) \\u003e 43200\\n\",\n \"severity\": 2\n }\n ],\n \"severity\": 0\n },\n \"prom_eval_interval\": 15,\n \"enable_stime\": \"00:00\",\n \"enable_stimes\": [\n \"00:00\"\n ],\n \"enable_etime\": \"23:59\",\n \"enable_etimes\": [\n \"23:59\"\n ],\n \"enable_days_of_week\": [\n \"1\",\n \"2\",\n \"3\",\n \"4\",\n \"5\",\n \"6\",\n \"0\"\n ],\n \"enable_days_of_weeks\": [\n [\n \"1\",\n \"2\",\n \"3\",\n \"4\",\n \"5\",\n \"6\",\n \"0\"\n ]\n ],\n \"enable_in_bg\": 0,\n \"notify_recovered\": 1,\n \"notify_channels\": [],\n \"notify_groups_obj\": null,\n \"notify_groups\": null,\n \"notify_repeat_step\": 60,\n \"notify_max_number\": 0,\n \"recover_duration\": 0,\n \"callbacks\": [],\n \"runbook_url\": \"\",\n \"append_tags\": [],\n \"annotations\": null,\n \"extra_config\": null,\n \"create_at\": 0,\n \"create_by\": \"\",\n \"update_at\": 0,\n \"update_by\": \"\",\n \"uuid\": 1717556327625347000\n },\n {\n \"id\": 0,\n \"group_id\": 0,\n \"cate\": \"prometheus\",\n \"datasource_ids\": [\n 0\n ],\n \"cluster\": \"\",\n \"name\": \"KubeletClientCertificateExpiration\",\n \"note\": \"Client certificate for Kubelet on node {{ $labels.node }} expires in {{ $value | humanizeDuration }}.\",\n \"prod\": \"metric\",\n \"algorithm\": \"\",\n \"algo_params\": null,\n \"delay\": 0,\n \"severity\": 2,\n \"severities\": [\n 2\n ],\n \"disabled\": 1,\n \"prom_for_duration\": 0,\n \"prom_ql\": \"kubelet_certificate_manager_client_ttl_seconds \\u003c 604800\\n\",\n \"rule_config\": {\n \"algo_params\": null,\n \"inhibit\": false,\n \"prom_ql\": \"\",\n \"queries\": [\n {\n \"prom_ql\": \"kubelet_certificate_manager_client_ttl_seconds \\u003c 604800\\n\",\n \"severity\": 2\n }\n ],\n \"severity\": 0\n },\n \"prom_eval_interval\": 15,\n \"enable_stime\": \"00:00\",\n \"enable_stimes\": [\n \"00:00\"\n ],\n \"enable_etime\": \"23:59\",\n \"enable_etimes\": [\n \"23:59\"\n ],\n \"enable_days_of_week\": [\n \"1\",\n \"2\",\n \"3\",\n \"4\",\n \"5\",\n \"6\",\n \"0\"\n ],\n \"enable_days_of_weeks\": [\n [\n \"1\",\n \"2\",\n \"3\",\n \"4\",\n \"5\",\n \"6\",\n \"0\"\n ]\n ],\n \"enable_in_bg\": 0,\n \"notify_recovered\": 1,\n \"notify_channels\": [],\n \"notify_groups_obj\": null,\n \"notify_groups\": null,\n \"notify_repeat_step\": 60,\n \"notify_max_number\": 0,\n \"recover_duration\": 0,\n \"callbacks\": [],\n \"runbook_url\": \"\",\n \"append_tags\": [],\n \"annotations\": null,\n \"extra_config\": null,\n \"create_at\": 0,\n \"create_by\": \"\",\n \"update_at\": 0,\n \"update_by\": \"\",\n \"uuid\": 1717556327625941000\n },\n {\n \"id\": 0,\n \"group_id\": 0,\n \"cate\": \"prometheus\",\n \"datasource_ids\": [\n 0\n ],\n \"cluster\": \"\",\n \"name\": \"KubeletClientCertificateRenewalErrors\",\n \"note\": \"Kubelet on node {{ $labels.node }} has failed to renew its client certificate ({{ $value | humanize }} errors in the last 5 minutes).\",\n \"prod\": \"metric\",\n \"algorithm\": \"\",\n \"algo_params\": null,\n \"delay\": 0,\n \"severity\": 2,\n \"severities\": [\n 2\n ],\n \"disabled\": 1,\n \"prom_for_duration\": 900,\n \"prom_ql\": \"increase(kubelet_certificate_manager_client_expiration_renew_errors[5m]) \\u003e 0\\n\",\n \"rule_config\": {\n \"algo_params\": null,\n \"inhibit\": false,\n \"prom_ql\": \"\",\n \"queries\": [\n {\n \"prom_ql\": \"increase(kubelet_certificate_manager_client_expiration_renew_errors[5m]) \\u003e 0\\n\",\n \"severity\": 2\n }\n ],\n \"severity\": 0\n },\n \"prom_eval_interval\": 15,\n \"enable_stime\": \"00:00\",\n \"enable_stimes\": [\n \"00:00\"\n ],\n \"enable_etime\": \"23:59\",\n \"enable_etimes\": [\n \"23:59\"\n ],\n \"enable_days_of_week\": [\n \"1\",\n \"2\",\n \"3\",\n \"4\",\n \"5\",\n \"6\",\n \"0\"\n ],\n \"enable_days_of_weeks\": [\n [\n \"1\",\n \"2\",\n \"3\",\n \"4\",\n \"5\",\n \"6\",\n \"0\"\n ]\n ],\n \"enable_in_bg\": 0,\n \"notify_recovered\": 1,\n \"notify_channels\": [],\n \"notify_groups_obj\": null,\n \"notify_groups\": null,\n \"notify_repeat_step\": 60,\n \"notify_max_number\": 0,\n \"recover_duration\": 0,\n \"callbacks\": [],\n \"runbook_url\": \"\",\n \"append_tags\": [],\n \"annotations\": null,\n \"extra_config\": null,\n \"create_at\": 0,\n \"create_by\": \"\",\n \"update_at\": 0,\n \"update_by\": \"\",\n \"uuid\": 1717556327626429000\n },\n {\n \"id\": 0,\n \"group_id\": 0,\n \"cate\": \"prometheus\",\n \"datasource_ids\": [\n 0\n ],\n \"cluster\": \"\",\n \"name\": \"KubeletDown\",\n \"note\": \"Kubelet has disappeared from Prometheus target discovery.\",\n \"prod\": \"metric\",\n \"algorithm\": \"\",\n \"algo_params\": null,\n \"delay\": 0,\n \"severity\": 1,\n \"severities\": [\n 1\n ],\n \"disabled\": 1,\n \"prom_for_duration\": 900,\n \"prom_ql\": \"absent(up{job=\\\"kubelet\\\", metrics_path=\\\"/metrics\\\"} == 1)\\n\",\n \"rule_config\": {\n \"algo_params\": null,\n \"inhibit\": false,\n \"prom_ql\": \"\",\n \"queries\": [\n {\n \"prom_ql\": \"absent(up{job=\\\"kubelet\\\", metrics_path=\\\"/metrics\\\"} == 1)\\n\",\n \"severity\": 1\n }\n ],\n \"severity\": 0\n },\n \"prom_eval_interval\": 15,\n \"enable_stime\": \"00:00\",\n \"enable_stimes\": [\n \"00:00\"\n ],\n \"enable_etime\": \"23:59\",\n \"enable_etimes\": [\n \"23:59\"\n ],\n \"enable_days_of_week\": [\n \"1\",\n \"2\",\n \"3\",\n \"4\",\n \"5\",\n \"6\",\n \"0\"\n ],\n \"enable_days_of_weeks\": [\n [\n \"1\",\n \"2\",\n \"3\",\n \"4\",\n \"5\",\n \"6\",\n \"0\"\n ]\n ],\n \"enable_in_bg\": 0,\n \"notify_recovered\": 1,\n \"notify_channels\": [],\n \"notify_groups_obj\": null,\n \"notify_groups\": null,\n \"notify_repeat_step\": 60,\n \"notify_max_number\": 0,\n \"recover_duration\": 0,\n \"callbacks\": [],\n \"runbook_url\": \"\",\n \"append_tags\": [],\n \"annotations\": null,\n \"extra_config\": null,\n \"create_at\": 0,\n \"create_by\": \"\",\n \"update_at\": 0,\n \"update_by\": \"\",\n \"uuid\": 1717556327626961000\n },\n {\n \"id\": 0,\n \"group_id\": 0,\n \"cate\": \"prometheus\",\n \"datasource_ids\": [\n 0\n ],\n \"cluster\": \"\",\n \"name\": \"KubeletPlegDurationHigh\",\n \"note\": \"The Kubelet Pod Lifecycle Event Generator has a 99th percentile duration of {{ $value }} seconds on node {{ $labels.node }}.\",\n \"prod\": \"metric\",\n \"algorithm\": \"\",\n \"algo_params\": null,\n \"delay\": 0,\n \"severity\": 2,\n \"severities\": [\n 2\n ],\n \"disabled\": 1,\n \"prom_for_duration\": 300,\n \"prom_ql\": \"node_quantile:kubelet_pleg_relist_duration_seconds:histogram_quantile{quantile=\\\"0.99\\\"} \\u003e= 10\\n\",\n \"rule_config\": {\n \"algo_params\": null,\n \"inhibit\": false,\n \"prom_ql\": \"\",\n \"queries\": [\n {\n \"prom_ql\": \"node_quantile:kubelet_pleg_relist_duration_seconds:histogram_quantile{quantile=\\\"0.99\\\"} \\u003e= 10\\n\",\n \"severity\": 2\n }\n ],\n \"severity\": 0\n },\n \"prom_eval_interval\": 15,\n \"enable_stime\": \"00:00\",\n \"enable_stimes\": [\n \"00:00\"\n ],\n \"enable_etime\": \"23:59\",\n \"enable_etimes\": [\n \"23:59\"\n ],\n \"enable_days_of_week\": [\n \"1\",\n \"2\",\n \"3\",\n \"4\",\n \"5\",\n \"6\",\n \"0\"\n ],\n \"enable_days_of_weeks\": [\n [\n \"1\",\n \"2\",\n \"3\",\n \"4\",\n \"5\",\n \"6\",\n \"0\"\n ]\n ],\n \"enable_in_bg\": 0,\n \"notify_recovered\": 1,\n \"notify_channels\": [],\n \"notify_groups_obj\": null,\n \"notify_groups\": null,\n \"notify_repeat_step\": 60,\n \"notify_max_number\": 0,\n \"recover_duration\": 0,\n \"callbacks\": [],\n \"runbook_url\": \"\",\n \"append_tags\": [],\n \"annotations\": null,\n \"extra_config\": null,\n \"create_at\": 0,\n \"create_by\": \"\",\n \"update_at\": 0,\n \"update_by\": \"\",\n \"uuid\": 1717556327627451000\n },\n {\n \"id\": 0,\n \"group_id\": 0,\n \"cate\": \"prometheus\",\n \"datasource_ids\": [\n 0\n ],\n \"cluster\": \"\",\n \"name\": \"KubeletPodStartUpLatencyHigh\",\n \"note\": \"Kubelet Pod startup 99th percentile latency is {{ $value }} seconds on node {{ $labels.node }}.\",\n \"prod\": \"metric\",\n \"algorithm\": \"\",\n \"algo_params\": null,\n \"delay\": 0,\n \"severity\": 2,\n \"severities\": [\n 2\n ],\n \"disabled\": 1,\n \"prom_for_duration\": 900,\n \"prom_ql\": \"histogram_quantile(0.99, sum(rate(kubelet_pod_worker_duration_seconds_bucket{job=\\\"kubelet\\\", metrics_path=\\\"/metrics\\\"}[5m])) by (cluster, instance, le)) * on(cluster, instance) group_left(node) kubelet_node_name{job=\\\"kubelet\\\", metrics_path=\\\"/metrics\\\"} \\u003e 60\\n\",\n \"rule_config\": {\n \"algo_params\": null,\n \"inhibit\": false,\n \"prom_ql\": \"\",\n \"queries\": [\n {\n \"prom_ql\": \"histogram_quantile(0.99, sum(rate(kubelet_pod_worker_duration_seconds_bucket{job=\\\"kubelet\\\", metrics_path=\\\"/metrics\\\"}[5m])) by (cluster, instance, le)) * on(cluster, instance) group_left(node) kubelet_node_name{job=\\\"kubelet\\\", metrics_path=\\\"/metrics\\\"} \\u003e 60\\n\",\n \"severity\": 2\n }\n ],\n \"severity\": 0\n },\n \"prom_eval_interval\": 15,\n \"enable_stime\": \"00:00\",\n \"enable_stimes\": [\n \"00:00\"\n ],\n \"enable_etime\": \"23:59\",\n \"enable_etimes\": [\n \"23:59\"\n ],\n \"enable_days_of_week\": [\n \"1\",\n \"2\",\n \"3\",\n \"4\",\n \"5\",\n \"6\",\n \"0\"\n ],\n \"enable_days_of_weeks\": [\n [\n \"1\",\n \"2\",\n \"3\",\n \"4\",\n \"5\",\n \"6\",\n \"0\"\n ]\n ],\n \"enable_in_bg\": 0,\n \"notify_recovered\": 1,\n \"notify_channels\": [],\n \"notify_groups_obj\": null,\n \"notify_groups\": null,\n \"notify_repeat_step\": 60,\n \"notify_max_number\": 0,\n \"recover_duration\": 0,\n \"callbacks\": [],\n \"runbook_url\": \"\",\n \"append_tags\": [],\n \"annotations\": null,\n \"extra_config\": null,\n \"create_at\": 0,\n \"create_by\": \"\",\n \"update_at\": 0,\n \"update_by\": \"\",\n \"uuid\": 1717556327628011000\n },\n {\n \"id\": 0,\n \"group_id\": 0,\n \"cate\": \"prometheus\",\n \"datasource_ids\": [\n 0\n ],\n \"cluster\": \"\",\n \"name\": \"KubeletServerCertificateExpiration\",\n \"note\": \"Server certificate for Kubelet on node {{ $labels.node }} expires in {{ $value | humanizeDuration }}.\",\n \"prod\": \"metric\",\n \"algorithm\": \"\",\n \"algo_params\": null,\n \"delay\": 0,\n \"severity\": 2,\n \"severities\": [\n 2\n ],\n \"disabled\": 1,\n \"prom_for_duration\": 0,\n \"prom_ql\": \"kubelet_certificate_manager_server_ttl_seconds \\u003c 604800\\n\",\n \"rule_config\": {\n \"algo_params\": null,\n \"inhibit\": false,\n \"prom_ql\": \"\",\n \"queries\": [\n {\n \"prom_ql\": \"kubelet_certificate_manager_server_ttl_seconds \\u003c 604800\\n\",\n \"severity\": 2\n }\n ],\n \"severity\": 0\n },\n \"prom_eval_interval\": 15,\n \"enable_stime\": \"00:00\",\n \"enable_stimes\": [\n \"00:00\"\n ],\n \"enable_etime\": \"23:59\",\n \"enable_etimes\": [\n \"23:59\"\n ],\n \"enable_days_of_week\": [\n \"1\",\n \"2\",\n \"3\",\n \"4\",\n \"5\",\n \"6\",\n \"0\"\n ],\n \"enable_days_of_weeks\": [\n [\n \"1\",\n \"2\",\n \"3\",\n \"4\",\n \"5\",\n \"6\",\n \"0\"\n ]\n ],\n \"enable_in_bg\": 0,\n \"notify_recovered\": 1,\n \"notify_channels\": [],\n \"notify_groups_obj\": null,\n \"notify_groups\": null,\n \"notify_repeat_step\": 60,\n \"notify_max_number\": 0,\n \"recover_duration\": 0,\n \"callbacks\": [],\n \"runbook_url\": \"\",\n \"append_tags\": [],\n \"annotations\": null,\n \"extra_config\": null,\n \"create_at\": 0,\n \"create_by\": \"\",\n \"update_at\": 0,\n \"update_by\": \"\",\n \"uuid\": 1717556327628498000\n },\n {\n \"id\": 0,\n \"group_id\": 0,\n \"cate\": \"prometheus\",\n \"datasource_ids\": [\n 0\n ],\n \"cluster\": \"\",\n \"name\": \"KubeletServerCertificateRenewalErrors\",\n \"note\": \"Kubelet on node {{ $labels.node }} has failed to renew its server certificate ({{ $value | humanize }} errors in the last 5 minutes).\",\n \"prod\": \"metric\",\n \"algorithm\": \"\",\n \"algo_params\": null,\n \"delay\": 0,\n \"severity\": 2,\n \"severities\": [\n 2\n ],\n \"disabled\": 1,\n \"prom_for_duration\": 900,\n \"prom_ql\": \"increase(kubelet_server_expiration_renew_errors[5m]) \\u003e 0\\n\",\n \"rule_config\": {\n \"algo_params\": null,\n \"inhibit\": false,\n \"prom_ql\": \"\",\n \"queries\": [\n {\n \"prom_ql\": \"increase(kubelet_server_expiration_renew_errors[5m]) \\u003e 0\\n\",\n \"severity\": 2\n }\n ],\n \"severity\": 0\n },\n \"prom_eval_interval\": 15,\n \"enable_stime\": \"00:00\",\n \"enable_stimes\": [\n \"00:00\"\n ],\n \"enable_etime\": \"23:59\",\n \"enable_etimes\": [\n \"23:59\"\n ],\n \"enable_days_of_week\": [\n \"1\",\n \"2\",\n \"3\",\n \"4\",\n \"5\",\n \"6\",\n \"0\"\n ],\n \"enable_days_of_weeks\": [\n [\n \"1\",\n \"2\",\n \"3\",\n \"4\",\n \"5\",\n \"6\",\n \"0\"\n ]\n ],\n \"enable_in_bg\": 0,\n \"notify_recovered\": 1,\n \"notify_channels\": [],\n \"notify_groups_obj\": null,\n \"notify_groups\": null,\n \"notify_repeat_step\": 60,\n \"notify_max_number\": 0,\n \"recover_duration\": 0,\n \"callbacks\": [],\n \"runbook_url\": \"\",\n \"append_tags\": [],\n \"annotations\": null,\n \"extra_config\": null,\n \"create_at\": 0,\n \"create_by\": \"\",\n \"update_at\": 0,\n \"update_by\": \"\",\n \"uuid\": 1717556327629074000\n },\n {\n \"id\": 0,\n \"group_id\": 0,\n \"cate\": \"prometheus\",\n \"datasource_ids\": [\n 0\n ],\n \"cluster\": \"\",\n \"name\": \"KubeletTooManyPods\",\n \"note\": \"Kubelet '{{ $labels.node }}' is running at {{ $value | humanizePercentage }} of its Pod capacity.\",\n \"prod\": \"metric\",\n \"algorithm\": \"\",\n \"algo_params\": null,\n \"delay\": 0,\n \"severity\": 3,\n \"severities\": [\n 3\n ],\n \"disabled\": 1,\n \"prom_for_duration\": 900,\n \"prom_ql\": \"count by(cluster, node) (\\n (kube_pod_status_phase{job=\\\"kube-state-metrics\\\",phase=\\\"Running\\\"} == 1) * on(instance,pod,namespace,cluster) group_left(node) topk by(instance,pod,namespace,cluster) (1, kube_pod_info{job=\\\"kube-state-metrics\\\"})\\n)\\n/\\nmax by(cluster, node) (\\n kube_node_status_capacity{job=\\\"kube-state-metrics\\\",resource=\\\"pods\\\"} != 1\\n) \\u003e 0.95\\n\",\n \"rule_config\": {\n \"algo_params\": null,\n \"inhibit\": false,\n \"prom_ql\": \"\",\n \"queries\": [\n {\n \"prom_ql\": \"count by(cluster, node) (\\n (kube_pod_status_phase{job=\\\"kube-state-metrics\\\",phase=\\\"Running\\\"} == 1) * on(instance,pod,namespace,cluster) group_left(node) topk by(instance,pod,namespace,cluster) (1, kube_pod_info{job=\\\"kube-state-metrics\\\"})\\n)\\n/\\nmax by(cluster, node) (\\n kube_node_status_capacity{job=\\\"kube-state-metrics\\\",resource=\\\"pods\\\"} != 1\\n) \\u003e 0.95\\n\",\n \"severity\": 3\n }\n ],\n \"severity\": 0\n },\n \"prom_eval_interval\": 15,\n \"enable_stime\": \"00:00\",\n \"enable_stimes\": [\n \"00:00\"\n ],\n \"enable_etime\": \"23:59\",\n \"enable_etimes\": [\n \"23:59\"\n ],\n \"enable_days_of_week\": [\n \"1\",\n \"2\",\n \"3\",\n \"4\",\n \"5\",\n \"6\",\n \"0\"\n ],\n \"enable_days_of_weeks\": [\n [\n \"1\",\n \"2\",\n \"3\",\n \"4\",\n \"5\",\n \"6\",\n \"0\"\n ]\n ],\n \"enable_in_bg\": 0,\n \"notify_recovered\": 1,\n \"notify_channels\": [],\n \"notify_groups_obj\": null,\n \"notify_groups\": null,\n \"notify_repeat_step\": 60,\n \"notify_max_number\": 0,\n \"recover_duration\": 0,\n \"callbacks\": [],\n \"runbook_url\": \"\",\n \"append_tags\": [],\n \"annotations\": null,\n \"extra_config\": null,\n \"create_at\": 0,\n \"create_by\": \"\",\n \"update_at\": 0,\n \"update_by\": \"\",\n \"uuid\": 1717556327629530000\n },\n {\n \"id\": 0,\n \"group_id\": 0,\n \"cate\": \"prometheus\",\n \"datasource_ids\": [\n 0\n ],\n \"cluster\": \"\",\n \"name\": \"KubeMemoryOvercommit\",\n \"note\": \"Cluster {{ $labels.cluster }} has overcommitted memory resource requests for Pods by {{ $value | humanize }} bytes and cannot tolerate node failure.\",\n \"prod\": \"metric\",\n \"algorithm\": \"\",\n \"algo_params\": null,\n \"delay\": 0,\n \"severity\": 2,\n \"severities\": [\n 2\n ],\n \"disabled\": 1,\n \"prom_for_duration\": 600,\n \"prom_ql\": \"sum(namespace_memory:kube_pod_container_resource_requests:sum{}) by (cluster) - (sum(kube_node_status_allocatable{resource=\\\"memory\\\", job=\\\"kube-state-metrics\\\"}) by (cluster) - max(kube_node_status_allocatable{resource=\\\"memory\\\", job=\\\"kube-state-metrics\\\"}) by (cluster)) \\u003e 0\\nand\\n(sum(kube_node_status_allocatable{resource=\\\"memory\\\", job=\\\"kube-state-metrics\\\"}) by (cluster) - max(kube_node_status_allocatable{resource=\\\"memory\\\", job=\\\"kube-state-metrics\\\"}) by (cluster)) \\u003e 0\\n\",\n \"rule_config\": {\n \"algo_params\": null,\n \"inhibit\": false,\n \"prom_ql\": \"\",\n \"queries\": [\n {\n \"prom_ql\": \"sum(namespace_memory:kube_pod_container_resource_requests:sum{}) by (cluster) - (sum(kube_node_status_allocatable{resource=\\\"memory\\\", job=\\\"kube-state-metrics\\\"}) by (cluster) - max(kube_node_status_allocatable{resource=\\\"memory\\\", job=\\\"kube-state-metrics\\\"}) by (cluster)) \\u003e 0\\nand\\n(sum(kube_node_status_allocatable{resource=\\\"memory\\\", job=\\\"kube-state-metrics\\\"}) by (cluster) - max(kube_node_status_allocatable{resource=\\\"memory\\\", job=\\\"kube-state-metrics\\\"}) by (cluster)) \\u003e 0\\n\",\n \"severity\": 2\n }\n ],\n \"severity\": 0\n },\n \"prom_eval_interval\": 15,\n \"enable_stime\": \"00:00\",\n \"enable_stimes\": [\n \"00:00\"\n ],\n \"enable_etime\": \"23:59\",\n \"enable_etimes\": [\n \"23:59\"\n ],\n \"enable_days_of_week\": [\n \"1\",\n \"2\",\n \"3\",\n \"4\",\n \"5\",\n \"6\",\n \"0\"\n ],\n \"enable_days_of_weeks\": [\n [\n \"1\",\n \"2\",\n \"3\",\n \"4\",\n \"5\",\n \"6\",\n \"0\"\n ]\n ],\n \"enable_in_bg\": 0,\n \"notify_recovered\": 1,\n \"notify_channels\": [],\n \"notify_groups_obj\": null,\n \"notify_groups\": null,\n \"notify_repeat_step\": 60,\n \"notify_max_number\": 0,\n \"recover_duration\": 0,\n \"callbacks\": [],\n \"runbook_url\": \"\",\n \"append_tags\": [],\n \"annotations\": null,\n \"extra_config\": null,\n \"create_at\": 0,\n \"create_by\": \"\",\n \"update_at\": 0,\n \"update_by\": \"\",\n \"uuid\": 1717556327630107000\n },\n {\n \"id\": 0,\n \"group_id\": 0,\n \"cate\": \"prometheus\",\n \"datasource_ids\": [\n 0\n ],\n \"cluster\": \"\",\n \"name\": \"KubeMemoryQuotaOvercommit\",\n \"note\": \"Cluster {{ $labels.cluster }} has overcommitted memory resource requests for Namespaces.\",\n \"prod\": \"metric\",\n \"algorithm\": \"\",\n \"algo_params\": null,\n \"delay\": 0,\n \"severity\": 2,\n \"severities\": [\n 2\n ],\n \"disabled\": 1,\n \"prom_for_duration\": 300,\n \"prom_ql\": \"sum(min without(resource) (kube_resourcequota{job=\\\"kube-state-metrics\\\", type=\\\"hard\\\", resource=~\\\"(memory|requests.memory)\\\"})) by (cluster)\\n /\\nsum(kube_node_status_allocatable{resource=\\\"memory\\\", job=\\\"kube-state-metrics\\\"}) by (cluster)\\n \\u003e 1.5\\n\",\n \"rule_config\": {\n \"algo_params\": null,\n \"inhibit\": false,\n \"prom_ql\": \"\",\n \"queries\": [\n {\n \"prom_ql\": \"sum(min without(resource) (kube_resourcequota{job=\\\"kube-state-metrics\\\", type=\\\"hard\\\", resource=~\\\"(memory|requests.memory)\\\"})) by (cluster)\\n /\\nsum(kube_node_status_allocatable{resource=\\\"memory\\\", job=\\\"kube-state-metrics\\\"}) by (cluster)\\n \\u003e 1.5\\n\",\n \"severity\": 2\n }\n ],\n \"severity\": 0\n },\n \"prom_eval_interval\": 15,\n \"enable_stime\": \"00:00\",\n \"enable_stimes\": [\n \"00:00\"\n ],\n \"enable_etime\": \"23:59\",\n \"enable_etimes\": [\n \"23:59\"\n ],\n \"enable_days_of_week\": [\n \"1\",\n \"2\",\n \"3\",\n \"4\",\n \"5\",\n \"6\",\n \"0\"\n ],\n \"enable_days_of_weeks\": [\n [\n \"1\",\n \"2\",\n \"3\",\n \"4\",\n \"5\",\n \"6\",\n \"0\"\n ]\n ],\n \"enable_in_bg\": 0,\n \"notify_recovered\": 1,\n \"notify_channels\": [],\n \"notify_groups_obj\": null,\n \"notify_groups\": null,\n \"notify_repeat_step\": 60,\n \"notify_max_number\": 0,\n \"recover_duration\": 0,\n \"callbacks\": [],\n \"runbook_url\": \"\",\n \"append_tags\": [],\n \"annotations\": null,\n \"extra_config\": null,\n \"create_at\": 0,\n \"create_by\": \"\",\n \"update_at\": 0,\n \"update_by\": \"\",\n \"uuid\": 1717556327630617000\n },\n {\n \"id\": 0,\n \"group_id\": 0,\n \"cate\": \"prometheus\",\n \"datasource_ids\": [\n 0\n ],\n \"cluster\": \"\",\n \"name\": \"KubeNodeNotReady\",\n \"note\": \"{{ $labels.node }} has been unready for more than 15 minutes.\",\n \"prod\": \"metric\",\n \"algorithm\": \"\",\n \"algo_params\": null,\n \"delay\": 0,\n \"severity\": 2,\n \"severities\": [\n 2\n ],\n \"disabled\": 1,\n \"prom_for_duration\": 900,\n \"prom_ql\": \"kube_node_status_condition{job=\\\"kube-state-metrics\\\",condition=\\\"Ready\\\",status=\\\"true\\\"} == 0\\n\",\n \"rule_config\": {\n \"algo_params\": null,\n \"inhibit\": false,\n \"prom_ql\": \"\",\n \"queries\": [\n {\n \"prom_ql\": \"kube_node_status_condition{job=\\\"kube-state-metrics\\\",condition=\\\"Ready\\\",status=\\\"true\\\"} == 0\\n\",\n \"severity\": 2\n }\n ],\n \"severity\": 0\n },\n \"prom_eval_interval\": 15,\n \"enable_stime\": \"00:00\",\n \"enable_stimes\": [\n \"00:00\"\n ],\n \"enable_etime\": \"23:59\",\n \"enable_etimes\": [\n \"23:59\"\n ],\n \"enable_days_of_week\": [\n \"1\",\n \"2\",\n \"3\",\n \"4\",\n \"5\",\n \"6\",\n \"0\"\n ],\n \"enable_days_of_weeks\": [\n [\n \"1\",\n \"2\",\n \"3\",\n \"4\",\n \"5\",\n \"6\",\n \"0\"\n ]\n ],\n \"enable_in_bg\": 0,\n \"notify_recovered\": 1,\n \"notify_channels\": [],\n \"notify_groups_obj\": null,\n \"notify_groups\": null,\n \"notify_repeat_step\": 60,\n \"notify_max_number\": 0,\n \"recover_duration\": 0,\n \"callbacks\": [],\n \"runbook_url\": \"\",\n \"append_tags\": [],\n \"annotations\": null,\n \"extra_config\": null,\n \"create_at\": 0,\n \"create_by\": \"\",\n \"update_at\": 0,\n \"update_by\": \"\",\n \"uuid\": 1717556327631263000\n },\n {\n \"id\": 0,\n \"group_id\": 0,\n \"cate\": \"prometheus\",\n \"datasource_ids\": [\n 0\n ],\n \"cluster\": \"\",\n \"name\": \"KubeNodeReadinessFlapping\",\n \"note\": \"The readiness status of node {{ $labels.node }} has changed {{ $value }} times in the last 15 minutes.\",\n \"prod\": \"metric\",\n \"algorithm\": \"\",\n \"algo_params\": null,\n \"delay\": 0,\n \"severity\": 2,\n \"severities\": [\n 2\n ],\n \"disabled\": 1,\n \"prom_for_duration\": 900,\n \"prom_ql\": \"sum(changes(kube_node_status_condition{job=\\\"kube-state-metrics\\\",status=\\\"true\\\",condition=\\\"Ready\\\"}[15m])) by (cluster, node) \\u003e 2\\n\",\n \"rule_config\": {\n \"algo_params\": null,\n \"inhibit\": false,\n \"prom_ql\": \"\",\n \"queries\": [\n {\n \"prom_ql\": \"sum(changes(kube_node_status_condition{job=\\\"kube-state-metrics\\\",status=\\\"true\\\",condition=\\\"Ready\\\"}[15m])) by (cluster, node) \\u003e 2\\n\",\n \"severity\": 2\n }\n ],\n \"severity\": 0\n },\n \"prom_eval_interval\": 15,\n \"enable_stime\": \"00:00\",\n \"enable_stimes\": [\n \"00:00\"\n ],\n \"enable_etime\": \"23:59\",\n \"enable_etimes\": [\n \"23:59\"\n ],\n \"enable_days_of_week\": [\n \"1\",\n \"2\",\n \"3\",\n \"4\",\n \"5\",\n \"6\",\n \"0\"\n ],\n \"enable_days_of_weeks\": [\n [\n \"1\",\n \"2\",\n \"3\",\n \"4\",\n \"5\",\n \"6\",\n \"0\"\n ]\n ],\n \"enable_in_bg\": 0,\n \"notify_recovered\": 1,\n \"notify_channels\": [],\n \"notify_groups_obj\": null,\n \"notify_groups\": null,\n \"notify_repeat_step\": 60,\n \"notify_max_number\": 0,\n \"recover_duration\": 0,\n \"callbacks\": [],\n \"runbook_url\": \"\",\n \"append_tags\": [],\n \"annotations\": null,\n \"extra_config\": null,\n \"create_at\": 0,\n \"create_by\": \"\",\n \"update_at\": 0,\n \"update_by\": \"\",\n \"uuid\": 1717556327631823000\n },\n {\n \"id\": 0,\n \"group_id\": 0,\n \"cate\": \"prometheus\",\n \"datasource_ids\": [\n 0\n ],\n \"cluster\": \"\",\n \"name\": \"KubeNodeUnreachable\",\n \"note\": \"{{ $labels.node }} is unreachable and some workloads may be rescheduled.\",\n \"prod\": \"metric\",\n \"algorithm\": \"\",\n \"algo_params\": null,\n \"delay\": 0,\n \"severity\": 2,\n \"severities\": [\n 2\n ],\n \"disabled\": 1,\n \"prom_for_duration\": 900,\n \"prom_ql\": \"(kube_node_spec_taint{job=\\\"kube-state-metrics\\\",key=\\\"node.kubernetes.io/unreachable\\\",effect=\\\"NoSchedule\\\"} unless ignoring(key,value) kube_node_spec_taint{job=\\\"kube-state-metrics\\\",key=~\\\"ToBeDeletedByClusterAutoscaler|cloud.google.com/impending-node-termination|aws-node-termination-handler/spot-itn\\\"}) == 1\\n\",\n \"rule_config\": {\n \"algo_params\": null,\n \"inhibit\": false,\n \"prom_ql\": \"\",\n \"queries\": [\n {\n \"prom_ql\": \"(kube_node_spec_taint{job=\\\"kube-state-metrics\\\",key=\\\"node.kubernetes.io/unreachable\\\",effect=\\\"NoSchedule\\\"} unless ignoring(key,value) kube_node_spec_taint{job=\\\"kube-state-metrics\\\",key=~\\\"ToBeDeletedByClusterAutoscaler|cloud.google.com/impending-node-termination|aws-node-termination-handler/spot-itn\\\"}) == 1\\n\",\n \"severity\": 2\n }\n ],\n \"severity\": 0\n },\n \"prom_eval_interval\": 15,\n \"enable_stime\": \"00:00\",\n \"enable_stimes\": [\n \"00:00\"\n ],\n \"enable_etime\": \"23:59\",\n \"enable_etimes\": [\n \"23:59\"\n ],\n \"enable_days_of_week\": [\n \"1\",\n \"2\",\n \"3\",\n \"4\",\n \"5\",\n \"6\",\n \"0\"\n ],\n \"enable_days_of_weeks\": [\n [\n \"1\",\n \"2\",\n \"3\",\n \"4\",\n \"5\",\n \"6\",\n \"0\"\n ]\n ],\n \"enable_in_bg\": 0,\n \"notify_recovered\": 1,\n \"notify_channels\": [],\n \"notify_groups_obj\": null,\n \"notify_groups\": null,\n \"notify_repeat_step\": 60,\n \"notify_max_number\": 0,\n \"recover_duration\": 0,\n \"callbacks\": [],\n \"runbook_url\": \"\",\n \"append_tags\": [],\n \"annotations\": null,\n \"extra_config\": null,\n \"create_at\": 0,\n \"create_by\": \"\",\n \"update_at\": 0,\n \"update_by\": \"\",\n \"uuid\": 1717556327632304000\n },\n {\n \"id\": 0,\n \"group_id\": 0,\n \"cate\": \"prometheus\",\n \"datasource_ids\": [\n 0\n ],\n \"cluster\": \"\",\n \"name\": \"KubePersistentVolumeErrors\",\n \"note\": \"The persistent volume {{ $labels.persistentvolume }} has status {{ $labels.phase }}.\",\n \"prod\": \"metric\",\n \"algorithm\": \"\",\n \"algo_params\": null,\n \"delay\": 0,\n \"severity\": 1,\n \"severities\": [\n 1\n ],\n \"disabled\": 1,\n \"prom_for_duration\": 300,\n \"prom_ql\": \"kube_persistentvolume_status_phase{phase=~\\\"Failed|Pending\\\",job=\\\"kube-state-metrics\\\"} \\u003e 0\\n\",\n \"rule_config\": {\n \"algo_params\": null,\n \"inhibit\": false,\n \"prom_ql\": \"\",\n \"queries\": [\n {\n \"prom_ql\": \"kube_persistentvolume_status_phase{phase=~\\\"Failed|Pending\\\",job=\\\"kube-state-metrics\\\"} \\u003e 0\\n\",\n \"severity\": 1\n }\n ],\n \"severity\": 0\n },\n \"prom_eval_interval\": 15,\n \"enable_stime\": \"00:00\",\n \"enable_stimes\": [\n \"00:00\"\n ],\n \"enable_etime\": \"23:59\",\n \"enable_etimes\": [\n \"23:59\"\n ],\n \"enable_days_of_week\": [\n \"1\",\n \"2\",\n \"3\",\n \"4\",\n \"5\",\n \"6\",\n \"0\"\n ],\n \"enable_days_of_weeks\": [\n [\n \"1\",\n \"2\",\n \"3\",\n \"4\",\n \"5\",\n \"6\",\n \"0\"\n ]\n ],\n \"enable_in_bg\": 0,\n \"notify_recovered\": 1,\n \"notify_channels\": [],\n \"notify_groups_obj\": null,\n \"notify_groups\": null,\n \"notify_repeat_step\": 60,\n \"notify_max_number\": 0,\n \"recover_duration\": 0,\n \"callbacks\": [],\n \"runbook_url\": \"\",\n \"append_tags\": [],\n \"annotations\": null,\n \"extra_config\": null,\n \"create_at\": 0,\n \"create_by\": \"\",\n \"update_at\": 0,\n \"update_by\": \"\",\n \"uuid\": 1717556327632772000\n },\n {\n \"id\": 0,\n \"group_id\": 0,\n \"cate\": \"prometheus\",\n \"datasource_ids\": [\n 0\n ],\n \"cluster\": \"\",\n \"name\": \"KubePersistentVolumeFillingUp\",\n \"note\": \"The PersistentVolume claimed by {{ $labels.persistentvolumeclaim }} in Namespace {{ $labels.namespace }} is only {{ $value | humanizePercentage }} free.\",\n \"prod\": \"metric\",\n \"algorithm\": \"\",\n \"algo_params\": null,\n \"delay\": 0,\n \"severity\": 1,\n \"severities\": [\n 1\n ],\n \"disabled\": 1,\n \"prom_for_duration\": 60,\n \"prom_ql\": \"(\\n kubelet_volume_stats_available_bytes{job=\\\"kubelet\\\", metrics_path=\\\"/metrics\\\"}\\n /\\n kubelet_volume_stats_capacity_bytes{job=\\\"kubelet\\\", metrics_path=\\\"/metrics\\\"}\\n) \\u003c 0.03\\nand\\nkubelet_volume_stats_used_bytes{job=\\\"kubelet\\\", metrics_path=\\\"/metrics\\\"} \\u003e 0\\nunless on(namespace, persistentvolumeclaim)\\nkube_persistentvolumeclaim_access_mode{ access_mode=\\\"ReadOnlyMany\\\"} == 1\\nunless on(namespace, persistentvolumeclaim)\\nkube_persistentvolumeclaim_labels{label_excluded_from_alerts=\\\"true\\\"} == 1\\n\",\n \"rule_config\": {\n \"algo_params\": null,\n \"inhibit\": false,\n \"prom_ql\": \"\",\n \"queries\": [\n {\n \"prom_ql\": \"(\\n kubelet_volume_stats_available_bytes{job=\\\"kubelet\\\", metrics_path=\\\"/metrics\\\"}\\n /\\n kubelet_volume_stats_capacity_bytes{job=\\\"kubelet\\\", metrics_path=\\\"/metrics\\\"}\\n) \\u003c 0.03\\nand\\nkubelet_volume_stats_used_bytes{job=\\\"kubelet\\\", metrics_path=\\\"/metrics\\\"} \\u003e 0\\nunless on(namespace, persistentvolumeclaim)\\nkube_persistentvolumeclaim_access_mode{ access_mode=\\\"ReadOnlyMany\\\"} == 1\\nunless on(namespace, persistentvolumeclaim)\\nkube_persistentvolumeclaim_labels{label_excluded_from_alerts=\\\"true\\\"} == 1\\n\",\n \"severity\": 1\n }\n ],\n \"severity\": 0\n },\n \"prom_eval_interval\": 15,\n \"enable_stime\": \"00:00\",\n \"enable_stimes\": [\n \"00:00\"\n ],\n \"enable_etime\": \"23:59\",\n \"enable_etimes\": [\n \"23:59\"\n ],\n \"enable_days_of_week\": [\n \"1\",\n \"2\",\n \"3\",\n \"4\",\n \"5\",\n \"6\",\n \"0\"\n ],\n \"enable_days_of_weeks\": [\n [\n \"1\",\n \"2\",\n \"3\",\n \"4\",\n \"5\",\n \"6\",\n \"0\"\n ]\n ],\n \"enable_in_bg\": 0,\n \"notify_recovered\": 1,\n \"notify_channels\": [],\n \"notify_groups_obj\": null,\n \"notify_groups\": null,\n \"notify_repeat_step\": 60,\n \"notify_max_number\": 0,\n \"recover_duration\": 0,\n \"callbacks\": [],\n \"runbook_url\": \"\",\n \"append_tags\": [],\n \"annotations\": null,\n \"extra_config\": null,\n \"create_at\": 0,\n \"create_by\": \"\",\n \"update_at\": 0,\n \"update_by\": \"\",\n \"uuid\": 1717556327633208000\n },\n {\n \"id\": 0,\n \"group_id\": 0,\n \"cate\": \"prometheus\",\n \"datasource_ids\": [\n 0\n ],\n \"cluster\": \"\",\n \"name\": \"KubePersistentVolumeInodesFillingUp\",\n \"note\": \"The PersistentVolume claimed by {{ $labels.persistentvolumeclaim }} in Namespace {{ $labels.namespace }} only has {{ $value | humanizePercentage }} free inodes.\",\n \"prod\": \"metric\",\n \"algorithm\": \"\",\n \"algo_params\": null,\n \"delay\": 0,\n \"severity\": 1,\n \"severities\": [\n 1\n ],\n \"disabled\": 1,\n \"prom_for_duration\": 60,\n \"prom_ql\": \"(\\n kubelet_volume_stats_inodes_free{job=\\\"kubelet\\\", metrics_path=\\\"/metrics\\\"}\\n /\\n kubelet_volume_stats_inodes{job=\\\"kubelet\\\", metrics_path=\\\"/metrics\\\"}\\n) \\u003c 0.03\\nand\\nkubelet_volume_stats_inodes_used{job=\\\"kubelet\\\", metrics_path=\\\"/metrics\\\"} \\u003e 0\\nunless on(namespace, persistentvolumeclaim)\\nkube_persistentvolumeclaim_access_mode{ access_mode=\\\"ReadOnlyMany\\\"} == 1\\nunless on(namespace, persistentvolumeclaim)\\nkube_persistentvolumeclaim_labels{label_excluded_from_alerts=\\\"true\\\"} == 1\\n\",\n \"rule_config\": {\n \"algo_params\": null,\n \"inhibit\": false,\n \"prom_ql\": \"\",\n \"queries\": [\n {\n \"prom_ql\": \"(\\n kubelet_volume_stats_inodes_free{job=\\\"kubelet\\\", metrics_path=\\\"/metrics\\\"}\\n /\\n kubelet_volume_stats_inodes{job=\\\"kubelet\\\", metrics_path=\\\"/metrics\\\"}\\n) \\u003c 0.03\\nand\\nkubelet_volume_stats_inodes_used{job=\\\"kubelet\\\", metrics_path=\\\"/metrics\\\"} \\u003e 0\\nunless on(namespace, persistentvolumeclaim)\\nkube_persistentvolumeclaim_access_mode{ access_mode=\\\"ReadOnlyMany\\\"} == 1\\nunless on(namespace, persistentvolumeclaim)\\nkube_persistentvolumeclaim_labels{label_excluded_from_alerts=\\\"true\\\"} == 1\\n\",\n \"severity\": 1\n }\n ],\n \"severity\": 0\n },\n \"prom_eval_interval\": 15,\n \"enable_stime\": \"00:00\",\n \"enable_stimes\": [\n \"00:00\"\n ],\n \"enable_etime\": \"23:59\",\n \"enable_etimes\": [\n \"23:59\"\n ],\n \"enable_days_of_week\": [\n \"1\",\n \"2\",\n \"3\",\n \"4\",\n \"5\",\n \"6\",\n \"0\"\n ],\n \"enable_days_of_weeks\": [\n [\n \"1\",\n \"2\",\n \"3\",\n \"4\",\n \"5\",\n \"6\",\n \"0\"\n ]\n ],\n \"enable_in_bg\": 0,\n \"notify_recovered\": 1,\n \"notify_channels\": [],\n \"notify_groups_obj\": null,\n \"notify_groups\": null,\n \"notify_repeat_step\": 60,\n \"notify_max_number\": 0,\n \"recover_duration\": 0,\n \"callbacks\": [],\n \"runbook_url\": \"\",\n \"append_tags\": [],\n \"annotations\": null,\n \"extra_config\": null,\n \"create_at\": 0,\n \"create_by\": \"\",\n \"update_at\": 0,\n \"update_by\": \"\",\n \"uuid\": 1717556327633654000\n },\n {\n \"id\": 0,\n \"group_id\": 0,\n \"cate\": \"prometheus\",\n \"datasource_ids\": [\n 0\n ],\n \"cluster\": \"\",\n \"name\": \"KubePodCrashLooping\",\n \"note\": \"Pod {{ $labels.namespace }}/{{ $labels.pod }} ({{ $labels.container }}) is in waiting state (reason: \\\"CrashLoopBackOff\\\").\",\n \"prod\": \"metric\",\n \"algorithm\": \"\",\n \"algo_params\": null,\n \"delay\": 0,\n \"severity\": 2,\n \"severities\": [\n 2\n ],\n \"disabled\": 1,\n \"prom_for_duration\": 900,\n \"prom_ql\": \"max_over_time(kube_pod_container_status_waiting_reason{reason=\\\"CrashLoopBackOff\\\", job=\\\"kube-state-metrics\\\"}[5m]) \\u003e= 1\\n\",\n \"rule_config\": {\n \"algo_params\": null,\n \"inhibit\": false,\n \"prom_ql\": \"\",\n \"queries\": [\n {\n \"prom_ql\": \"max_over_time(kube_pod_container_status_waiting_reason{reason=\\\"CrashLoopBackOff\\\", job=\\\"kube-state-metrics\\\"}[5m]) \\u003e= 1\\n\",\n \"severity\": 2\n }\n ],\n \"severity\": 0\n },\n \"prom_eval_interval\": 15,\n \"enable_stime\": \"00:00\",\n \"enable_stimes\": [\n \"00:00\"\n ],\n \"enable_etime\": \"23:59\",\n \"enable_etimes\": [\n \"23:59\"\n ],\n \"enable_days_of_week\": [\n \"1\",\n \"2\",\n \"3\",\n \"4\",\n \"5\",\n \"6\",\n \"0\"\n ],\n \"enable_days_of_weeks\": [\n [\n \"1\",\n \"2\",\n \"3\",\n \"4\",\n \"5\",\n \"6\",\n \"0\"\n ]\n ],\n \"enable_in_bg\": 0,\n \"notify_recovered\": 1,\n \"notify_channels\": [],\n \"notify_groups_obj\": null,\n \"notify_groups\": null,\n \"notify_repeat_step\": 60,\n \"notify_max_number\": 0,\n \"recover_duration\": 0,\n \"callbacks\": [],\n \"runbook_url\": \"\",\n \"append_tags\": [],\n \"annotations\": null,\n \"extra_config\": null,\n \"create_at\": 0,\n \"create_by\": \"\",\n \"update_at\": 0,\n \"update_by\": \"\",\n \"uuid\": 1717556327634127000\n },\n {\n \"id\": 0,\n \"group_id\": 0,\n \"cate\": \"prometheus\",\n \"datasource_ids\": [\n 0\n ],\n \"cluster\": \"\",\n \"name\": \"KubePodNotReady\",\n \"note\": \"Pod {{ $labels.namespace }}/{{ $labels.pod }} has been in a non-ready state for longer than 15 minutes.\",\n \"prod\": \"metric\",\n \"algorithm\": \"\",\n \"algo_params\": null,\n \"delay\": 0,\n \"severity\": 2,\n \"severities\": [\n 2\n ],\n \"disabled\": 1,\n \"prom_for_duration\": 900,\n \"prom_ql\": \"sum by (namespace, pod, cluster) (\\n max by(namespace, pod, cluster) (\\n kube_pod_status_phase{job=\\\"kube-state-metrics\\\", phase=~\\\"Pending|Unknown|Failed\\\"}\\n ) * on(namespace, pod, cluster) group_left(owner_kind) topk by(namespace, pod, cluster) (\\n 1, max by(namespace, pod, owner_kind, cluster) (kube_pod_owner{owner_kind!=\\\"Job\\\"})\\n )\\n) \\u003e 0\\n\",\n \"rule_config\": {\n \"algo_params\": null,\n \"inhibit\": false,\n \"prom_ql\": \"\",\n \"queries\": [\n {\n \"prom_ql\": \"sum by (namespace, pod, cluster) (\\n max by(namespace, pod, cluster) (\\n kube_pod_status_phase{job=\\\"kube-state-metrics\\\", phase=~\\\"Pending|Unknown|Failed\\\"}\\n ) * on(namespace, pod, cluster) group_left(owner_kind) topk by(namespace, pod, cluster) (\\n 1, max by(namespace, pod, owner_kind, cluster) (kube_pod_owner{owner_kind!=\\\"Job\\\"})\\n )\\n) \\u003e 0\\n\",\n \"severity\": 2\n }\n ],\n \"severity\": 0\n },\n \"prom_eval_interval\": 15,\n \"enable_stime\": \"00:00\",\n \"enable_stimes\": [\n \"00:00\"\n ],\n \"enable_etime\": \"23:59\",\n \"enable_etimes\": [\n \"23:59\"\n ],\n \"enable_days_of_week\": [\n \"1\",\n \"2\",\n \"3\",\n \"4\",\n \"5\",\n \"6\",\n \"0\"\n ],\n \"enable_days_of_weeks\": [\n [\n \"1\",\n \"2\",\n \"3\",\n \"4\",\n \"5\",\n \"6\",\n \"0\"\n ]\n ],\n \"enable_in_bg\": 0,\n \"notify_recovered\": 1,\n \"notify_channels\": [],\n \"notify_groups_obj\": null,\n \"notify_groups\": null,\n \"notify_repeat_step\": 60,\n \"notify_max_number\": 0,\n \"recover_duration\": 0,\n \"callbacks\": [],\n \"runbook_url\": \"\",\n \"append_tags\": [],\n \"annotations\": null,\n \"extra_config\": null,\n \"create_at\": 0,\n \"create_by\": \"\",\n \"update_at\": 0,\n \"update_by\": \"\",\n \"uuid\": 1717556327634578000\n },\n {\n \"id\": 0,\n \"group_id\": 0,\n \"cate\": \"prometheus\",\n \"datasource_ids\": [\n 0\n ],\n \"cluster\": \"\",\n \"name\": \"KubeQuotaAlmostFull\",\n \"note\": \"Namespace {{ $labels.namespace }} is using {{ $value | humanizePercentage }} of its {{ $labels.resource }} quota.\",\n \"prod\": \"metric\",\n \"algorithm\": \"\",\n \"algo_params\": null,\n \"delay\": 0,\n \"severity\": 3,\n \"severities\": [\n 3\n ],\n \"disabled\": 1,\n \"prom_for_duration\": 900,\n \"prom_ql\": \"kube_resourcequota{job=\\\"kube-state-metrics\\\", type=\\\"used\\\"}\\n / ignoring(instance, job, type)\\n(kube_resourcequota{job=\\\"kube-state-metrics\\\", type=\\\"hard\\\"} \\u003e 0)\\n \\u003e 0.9 \\u003c 1\\n\",\n \"rule_config\": {\n \"algo_params\": null,\n \"inhibit\": false,\n \"prom_ql\": \"\",\n \"queries\": [\n {\n \"prom_ql\": \"kube_resourcequota{job=\\\"kube-state-metrics\\\", type=\\\"used\\\"}\\n / ignoring(instance, job, type)\\n(kube_resourcequota{job=\\\"kube-state-metrics\\\", type=\\\"hard\\\"} \\u003e 0)\\n \\u003e 0.9 \\u003c 1\\n\",\n \"severity\": 3\n }\n ],\n \"severity\": 0\n },\n \"prom_eval_interval\": 15,\n \"enable_stime\": \"00:00\",\n \"enable_stimes\": [\n \"00:00\"\n ],\n \"enable_etime\": \"23:59\",\n \"enable_etimes\": [\n \"23:59\"\n ],\n \"enable_days_of_week\": [\n \"1\",\n \"2\",\n \"3\",\n \"4\",\n \"5\",\n \"6\",\n \"0\"\n ],\n \"enable_days_of_weeks\": [\n [\n \"1\",\n \"2\",\n \"3\",\n \"4\",\n \"5\",\n \"6\",\n \"0\"\n ]\n ],\n \"enable_in_bg\": 0,\n \"notify_recovered\": 1,\n \"notify_channels\": [],\n \"notify_groups_obj\": null,\n \"notify_groups\": null,\n \"notify_repeat_step\": 60,\n \"notify_max_number\": 0,\n \"recover_duration\": 0,\n \"callbacks\": [],\n \"runbook_url\": \"\",\n \"append_tags\": [],\n \"annotations\": null,\n \"extra_config\": null,\n \"create_at\": 0,\n \"create_by\": \"\",\n \"update_at\": 0,\n \"update_by\": \"\",\n \"uuid\": 1717556327634994000\n },\n {\n \"id\": 0,\n \"group_id\": 0,\n \"cate\": \"prometheus\",\n \"datasource_ids\": [\n 0\n ],\n \"cluster\": \"\",\n \"name\": \"KubeQuotaExceeded\",\n \"note\": \"Namespace {{ $labels.namespace }} is using {{ $value | humanizePercentage }} of its {{ $labels.resource }} quota.\",\n \"prod\": \"metric\",\n \"algorithm\": \"\",\n \"algo_params\": null,\n \"delay\": 0,\n \"severity\": 2,\n \"severities\": [\n 2\n ],\n \"disabled\": 1,\n \"prom_for_duration\": 900,\n \"prom_ql\": \"kube_resourcequota{job=\\\"kube-state-metrics\\\", type=\\\"used\\\"}\\n / ignoring(instance, job, type)\\n(kube_resourcequota{job=\\\"kube-state-metrics\\\", type=\\\"hard\\\"} \\u003e 0)\\n \\u003e 1\\n\",\n \"rule_config\": {\n \"algo_params\": null,\n \"inhibit\": false,\n \"prom_ql\": \"\",\n \"queries\": [\n {\n \"prom_ql\": \"kube_resourcequota{job=\\\"kube-state-metrics\\\", type=\\\"used\\\"}\\n / ignoring(instance, job, type)\\n(kube_resourcequota{job=\\\"kube-state-metrics\\\", type=\\\"hard\\\"} \\u003e 0)\\n \\u003e 1\\n\",\n \"severity\": 2\n }\n ],\n \"severity\": 0\n },\n \"prom_eval_interval\": 15,\n \"enable_stime\": \"00:00\",\n \"enable_stimes\": [\n \"00:00\"\n ],\n \"enable_etime\": \"23:59\",\n \"enable_etimes\": [\n \"23:59\"\n ],\n \"enable_days_of_week\": [\n \"1\",\n \"2\",\n \"3\",\n \"4\",\n \"5\",\n \"6\",\n \"0\"\n ],\n \"enable_days_of_weeks\": [\n [\n \"1\",\n \"2\",\n \"3\",\n \"4\",\n \"5\",\n \"6\",\n \"0\"\n ]\n ],\n \"enable_in_bg\": 0,\n \"notify_recovered\": 1,\n \"notify_channels\": [],\n \"notify_groups_obj\": null,\n \"notify_groups\": null,\n \"notify_repeat_step\": 60,\n \"notify_max_number\": 0,\n \"recover_duration\": 0,\n \"callbacks\": [],\n \"runbook_url\": \"\",\n \"append_tags\": [],\n \"annotations\": null,\n \"extra_config\": null,\n \"create_at\": 0,\n \"create_by\": \"\",\n \"update_at\": 0,\n \"update_by\": \"\",\n \"uuid\": 1717556327635438000\n },\n {\n \"id\": 0,\n \"group_id\": 0,\n \"cate\": \"prometheus\",\n \"datasource_ids\": [\n 0\n ],\n \"cluster\": \"\",\n \"name\": \"KubeQuotaFullyUsed\",\n \"note\": \"Namespace {{ $labels.namespace }} is using {{ $value | humanizePercentage }} of its {{ $labels.resource }} quota.\",\n \"prod\": \"metric\",\n \"algorithm\": \"\",\n \"algo_params\": null,\n \"delay\": 0,\n \"severity\": 3,\n \"severities\": [\n 3\n ],\n \"disabled\": 1,\n \"prom_for_duration\": 900,\n \"prom_ql\": \"kube_resourcequota{job=\\\"kube-state-metrics\\\", type=\\\"used\\\"}\\n / ignoring(instance, job, type)\\n(kube_resourcequota{job=\\\"kube-state-metrics\\\", type=\\\"hard\\\"} \\u003e 0)\\n == 1\\n\",\n \"rule_config\": {\n \"algo_params\": null,\n \"inhibit\": false,\n \"prom_ql\": \"\",\n \"queries\": [\n {\n \"prom_ql\": \"kube_resourcequota{job=\\\"kube-state-metrics\\\", type=\\\"used\\\"}\\n / ignoring(instance, job, type)\\n(kube_resourcequota{job=\\\"kube-state-metrics\\\", type=\\\"hard\\\"} \\u003e 0)\\n == 1\\n\",\n \"severity\": 3\n }\n ],\n \"severity\": 0\n },\n \"prom_eval_interval\": 15,\n \"enable_stime\": \"00:00\",\n \"enable_stimes\": [\n \"00:00\"\n ],\n \"enable_etime\": \"23:59\",\n \"enable_etimes\": [\n \"23:59\"\n ],\n \"enable_days_of_week\": [\n \"1\",\n \"2\",\n \"3\",\n \"4\",\n \"5\",\n \"6\",\n \"0\"\n ],\n \"enable_days_of_weeks\": [\n [\n \"1\",\n \"2\",\n \"3\",\n \"4\",\n \"5\",\n \"6\",\n \"0\"\n ]\n ],\n \"enable_in_bg\": 0,\n \"notify_recovered\": 1,\n \"notify_channels\": [],\n \"notify_groups_obj\": null,\n \"notify_groups\": null,\n \"notify_repeat_step\": 60,\n \"notify_max_number\": 0,\n \"recover_duration\": 0,\n \"callbacks\": [],\n \"runbook_url\": \"\",\n \"append_tags\": [],\n \"annotations\": null,\n \"extra_config\": null,\n \"create_at\": 0,\n \"create_by\": \"\",\n \"update_at\": 0,\n \"update_by\": \"\",\n \"uuid\": 1717556327635894000\n },\n {\n \"id\": 0,\n \"group_id\": 0,\n \"cate\": \"prometheus\",\n \"datasource_ids\": [\n 0\n ],\n \"cluster\": \"\",\n \"name\": \"KubeSchedulerDown\",\n \"note\": \"KubeScheduler has disappeared from Prometheus target discovery.\",\n \"prod\": \"metric\",\n \"algorithm\": \"\",\n \"algo_params\": null,\n \"delay\": 0,\n \"severity\": 1,\n \"severities\": [\n 1\n ],\n \"disabled\": 1,\n \"prom_for_duration\": 900,\n \"prom_ql\": \"absent(up{job=\\\"kube-scheduler\\\"} == 1)\\n\",\n \"rule_config\": {\n \"algo_params\": null,\n \"inhibit\": false,\n \"prom_ql\": \"\",\n \"queries\": [\n {\n \"prom_ql\": \"absent(up{job=\\\"kube-scheduler\\\"} == 1)\\n\",\n \"severity\": 1\n }\n ],\n \"severity\": 0\n },\n \"prom_eval_interval\": 15,\n \"enable_stime\": \"00:00\",\n \"enable_stimes\": [\n \"00:00\"\n ],\n \"enable_etime\": \"23:59\",\n \"enable_etimes\": [\n \"23:59\"\n ],\n \"enable_days_of_week\": [\n \"1\",\n \"2\",\n \"3\",\n \"4\",\n \"5\",\n \"6\",\n \"0\"\n ],\n \"enable_days_of_weeks\": [\n [\n \"1\",\n \"2\",\n \"3\",\n \"4\",\n \"5\",\n \"6\",\n \"0\"\n ]\n ],\n \"enable_in_bg\": 0,\n \"notify_recovered\": 1,\n \"notify_channels\": [],\n \"notify_groups_obj\": null,\n \"notify_groups\": null,\n \"notify_repeat_step\": 60,\n \"notify_max_number\": 0,\n \"recover_duration\": 0,\n \"callbacks\": [],\n \"runbook_url\": \"\",\n \"append_tags\": [],\n \"annotations\": null,\n \"extra_config\": null,\n \"create_at\": 0,\n \"create_by\": \"\",\n \"update_at\": 0,\n \"update_by\": \"\",\n \"uuid\": 1717556327636372000\n },\n {\n \"id\": 0,\n \"group_id\": 0,\n \"cate\": \"prometheus\",\n \"datasource_ids\": [\n 0\n ],\n \"cluster\": \"\",\n \"name\": \"KubeStatefulSetGenerationMismatch\",\n \"note\": \"StatefulSet generation for {{ $labels.namespace }}/{{ $labels.statefulset }} does not match, this indicates that the StatefulSet has failed but has not been rolled back.\",\n \"prod\": \"metric\",\n \"algorithm\": \"\",\n \"algo_params\": null,\n \"delay\": 0,\n \"severity\": 2,\n \"severities\": [\n 2\n ],\n \"disabled\": 1,\n \"prom_for_duration\": 900,\n \"prom_ql\": \"kube_statefulset_status_observed_generation{job=\\\"kube-state-metrics\\\"}\\n !=\\nkube_statefulset_metadata_generation{job=\\\"kube-state-metrics\\\"}\\n\",\n \"rule_config\": {\n \"algo_params\": null,\n \"inhibit\": false,\n \"prom_ql\": \"\",\n \"queries\": [\n {\n \"prom_ql\": \"kube_statefulset_status_observed_generation{job=\\\"kube-state-metrics\\\"}\\n !=\\nkube_statefulset_metadata_generation{job=\\\"kube-state-metrics\\\"}\\n\",\n \"severity\": 2\n }\n ],\n \"severity\": 0\n },\n \"prom_eval_interval\": 15,\n \"enable_stime\": \"00:00\",\n \"enable_stimes\": [\n \"00:00\"\n ],\n \"enable_etime\": \"23:59\",\n \"enable_etimes\": [\n \"23:59\"\n ],\n \"enable_days_of_week\": [\n \"1\",\n \"2\",\n \"3\",\n \"4\",\n \"5\",\n \"6\",\n \"0\"\n ],\n \"enable_days_of_weeks\": [\n [\n \"1\",\n \"2\",\n \"3\",\n \"4\",\n \"5\",\n \"6\",\n \"0\"\n ]\n ],\n \"enable_in_bg\": 0,\n \"notify_recovered\": 1,\n \"notify_channels\": [],\n \"notify_groups_obj\": null,\n \"notify_groups\": null,\n \"notify_repeat_step\": 60,\n \"notify_max_number\": 0,\n \"recover_duration\": 0,\n \"callbacks\": [],\n \"runbook_url\": \"\",\n \"append_tags\": [],\n \"annotations\": null,\n \"extra_config\": null,\n \"create_at\": 0,\n \"create_by\": \"\",\n \"update_at\": 0,\n \"update_by\": \"\",\n \"uuid\": 1717556327636798000\n },\n {\n \"id\": 0,\n \"group_id\": 0,\n \"cate\": \"prometheus\",\n \"datasource_ids\": [\n 0\n ],\n \"cluster\": \"\",\n \"name\": \"KubeStatefulSetReplicasMismatch\",\n \"note\": \"StatefulSet {{ $labels.namespace }}/{{ $labels.statefulset }} has not matched the expected number of replicas for longer than 15 minutes.\",\n \"prod\": \"metric\",\n \"algorithm\": \"\",\n \"algo_params\": null,\n \"delay\": 0,\n \"severity\": 2,\n \"severities\": [\n 2\n ],\n \"disabled\": 1,\n \"prom_for_duration\": 900,\n \"prom_ql\": \"(\\n kube_statefulset_status_replicas_ready{job=\\\"kube-state-metrics\\\"}\\n !=\\n kube_statefulset_status_replicas{job=\\\"kube-state-metrics\\\"}\\n) and (\\n changes(kube_statefulset_status_replicas_updated{job=\\\"kube-state-metrics\\\"}[10m])\\n ==\\n 0\\n)\\n\",\n \"rule_config\": {\n \"algo_params\": null,\n \"inhibit\": false,\n \"prom_ql\": \"\",\n \"queries\": [\n {\n \"prom_ql\": \"(\\n kube_statefulset_status_replicas_ready{job=\\\"kube-state-metrics\\\"}\\n !=\\n kube_statefulset_status_replicas{job=\\\"kube-state-metrics\\\"}\\n) and (\\n changes(kube_statefulset_status_replicas_updated{job=\\\"kube-state-metrics\\\"}[10m])\\n ==\\n 0\\n)\\n\",\n \"severity\": 2\n }\n ],\n \"severity\": 0\n },\n \"prom_eval_interval\": 15,\n \"enable_stime\": \"00:00\",\n \"enable_stimes\": [\n \"00:00\"\n ],\n \"enable_etime\": \"23:59\",\n \"enable_etimes\": [\n \"23:59\"\n ],\n \"enable_days_of_week\": [\n \"1\",\n \"2\",\n \"3\",\n \"4\",\n \"5\",\n \"6\",\n \"0\"\n ],\n \"enable_days_of_weeks\": [\n [\n \"1\",\n \"2\",\n \"3\",\n \"4\",\n \"5\",\n \"6\",\n \"0\"\n ]\n ],\n \"enable_in_bg\": 0,\n \"notify_recovered\": 1,\n \"notify_channels\": [],\n \"notify_groups_obj\": null,\n \"notify_groups\": null,\n \"notify_repeat_step\": 60,\n \"notify_max_number\": 0,\n \"recover_duration\": 0,\n \"callbacks\": [],\n \"runbook_url\": \"\",\n \"append_tags\": [],\n \"annotations\": null,\n \"extra_config\": null,\n \"create_at\": 0,\n \"create_by\": \"\",\n \"update_at\": 0,\n \"update_by\": \"\",\n \"uuid\": 1717556327637207000\n },\n {\n \"id\": 0,\n \"group_id\": 0,\n \"cate\": \"prometheus\",\n \"datasource_ids\": [\n 0\n ],\n \"cluster\": \"\",\n \"name\": \"KubeStatefulSetUpdateNotRolledOut\",\n \"note\": \"StatefulSet {{ $labels.namespace }}/{{ $labels.statefulset }} update has not been rolled out.\",\n \"prod\": \"metric\",\n \"algorithm\": \"\",\n \"algo_params\": null,\n \"delay\": 0,\n \"severity\": 2,\n \"severities\": [\n 2\n ],\n \"disabled\": 1,\n \"prom_for_duration\": 900,\n \"prom_ql\": \"(\\n max without (revision) (\\n kube_statefulset_status_current_revision{job=\\\"kube-state-metrics\\\"}\\n unless\\n kube_statefulset_status_update_revision{job=\\\"kube-state-metrics\\\"}\\n )\\n *\\n (\\n kube_statefulset_replicas{job=\\\"kube-state-metrics\\\"}\\n !=\\n kube_statefulset_status_replicas_updated{job=\\\"kube-state-metrics\\\"}\\n )\\n) and (\\n changes(kube_statefulset_status_replicas_updated{job=\\\"kube-state-metrics\\\"}[5m])\\n ==\\n 0\\n)\\n\",\n \"rule_config\": {\n \"algo_params\": null,\n \"inhibit\": false,\n \"prom_ql\": \"\",\n \"queries\": [\n {\n \"prom_ql\": \"(\\n max without (revision) (\\n kube_statefulset_status_current_revision{job=\\\"kube-state-metrics\\\"}\\n unless\\n kube_statefulset_status_update_revision{job=\\\"kube-state-metrics\\\"}\\n )\\n *\\n (\\n kube_statefulset_replicas{job=\\\"kube-state-metrics\\\"}\\n !=\\n kube_statefulset_status_replicas_updated{job=\\\"kube-state-metrics\\\"}\\n )\\n) and (\\n changes(kube_statefulset_status_replicas_updated{job=\\\"kube-state-metrics\\\"}[5m])\\n ==\\n 0\\n)\\n\",\n \"severity\": 2\n }\n ],\n \"severity\": 0\n },\n \"prom_eval_interval\": 15,\n \"enable_stime\": \"00:00\",\n \"enable_stimes\": [\n \"00:00\"\n ],\n \"enable_etime\": \"23:59\",\n \"enable_etimes\": [\n \"23:59\"\n ],\n \"enable_days_of_week\": [\n \"1\",\n \"2\",\n \"3\",\n \"4\",\n \"5\",\n \"6\",\n \"0\"\n ],\n \"enable_days_of_weeks\": [\n [\n \"1\",\n \"2\",\n \"3\",\n \"4\",\n \"5\",\n \"6\",\n \"0\"\n ]\n ],\n \"enable_in_bg\": 0,\n \"notify_recovered\": 1,\n \"notify_channels\": [],\n \"notify_groups_obj\": null,\n \"notify_groups\": null,\n \"notify_repeat_step\": 60,\n \"notify_max_number\": 0,\n \"recover_duration\": 0,\n \"callbacks\": [],\n \"runbook_url\": \"\",\n \"append_tags\": [],\n \"annotations\": null,\n \"extra_config\": null,\n \"create_at\": 0,\n \"create_by\": \"\",\n \"update_at\": 0,\n \"update_by\": \"\",\n \"uuid\": 1717556327637666000\n },\n {\n \"id\": 0,\n \"group_id\": 0,\n \"cate\": \"prometheus\",\n \"datasource_ids\": [\n 0\n ],\n \"cluster\": \"\",\n \"name\": \"KubeVersionMismatch\",\n \"note\": \"There are {{ $value }} different semantic versions of Kubernetes components running.\",\n \"prod\": \"metric\",\n \"algorithm\": \"\",\n \"algo_params\": null,\n \"delay\": 0,\n \"severity\": 2,\n \"severities\": [\n 2\n ],\n \"disabled\": 1,\n \"prom_for_duration\": 900,\n \"prom_ql\": \"count by (cluster) (count by (git_version, cluster) (label_replace(kubernetes_build_info{job!~\\\"kube-dns|coredns\\\"},\\\"git_version\\\",\\\"$1\\\",\\\"git_version\\\",\\\"(v[0-9]*.[0-9]*).*\\\"))) \\u003e 1\\n\",\n \"rule_config\": {\n \"algo_params\": null,\n \"inhibit\": false,\n \"prom_ql\": \"\",\n \"queries\": [\n {\n \"prom_ql\": \"count by (cluster) (count by (git_version, cluster) (label_replace(kubernetes_build_info{job!~\\\"kube-dns|coredns\\\"},\\\"git_version\\\",\\\"$1\\\",\\\"git_version\\\",\\\"(v[0-9]*.[0-9]*).*\\\"))) \\u003e 1\\n\",\n \"severity\": 2\n }\n ],\n \"severity\": 0\n },\n \"prom_eval_interval\": 15,\n \"enable_stime\": \"00:00\",\n \"enable_stimes\": [\n \"00:00\"\n ],\n \"enable_etime\": \"23:59\",\n \"enable_etimes\": [\n \"23:59\"\n ],\n \"enable_days_of_week\": [\n \"1\",\n \"2\",\n \"3\",\n \"4\",\n \"5\",\n \"6\",\n \"0\"\n ],\n \"enable_days_of_weeks\": [\n [\n \"1\",\n \"2\",\n \"3\",\n \"4\",\n \"5\",\n \"6\",\n \"0\"\n ]\n ],\n \"enable_in_bg\": 0,\n \"notify_recovered\": 1,\n \"notify_channels\": [],\n \"notify_groups_obj\": null,\n \"notify_groups\": null,\n \"notify_repeat_step\": 60,\n \"notify_max_number\": 0,\n \"recover_duration\": 0,\n \"callbacks\": [],\n \"runbook_url\": \"\",\n \"append_tags\": [],\n \"annotations\": null,\n \"extra_config\": null,\n \"create_at\": 0,\n \"create_by\": \"\",\n \"update_at\": 0,\n \"update_by\": \"\",\n \"uuid\": 1717556327638202000\n }\n]"
},
{
"path": "integrations/Kubernetes/alerts/kubelet.json",
"content": "[\n {\n \"id\": 0,\n \"group_id\": 0,\n \"cate\": \"\",\n \"datasource_ids\": null,\n \"cluster\": \"\",\n \"name\": \"Node状态异常\",\n \"note\": \"{{ $labels.node }} has been unready for more than 15 minutes.\",\n \"prod\": \"\",\n \"algorithm\": \"\",\n \"algo_params\": null,\n \"delay\": 0,\n \"severity\": 2,\n \"severities\": null,\n \"disabled\": 0,\n \"prom_for_duration\": 900,\n \"prom_ql\": \"kube_node_status_condition{job=\\\"kube-state-metrics\\\",condition=\\\"Ready\\\",status=\\\"true\\\"} == 0\\n\",\n \"rule_config\": null,\n \"prom_eval_interval\": 15,\n \"enable_stime\": \"00:00\",\n \"enable_stimes\": null,\n \"enable_etime\": \"23:59\",\n \"enable_etimes\": null,\n \"enable_days_of_week\": [\n \"1\",\n \"2\",\n \"3\",\n \"4\",\n \"5\",\n \"6\",\n \"0\"\n ],\n \"enable_days_of_weeks\": null,\n \"enable_in_bg\": 0,\n \"notify_recovered\": 1,\n \"notify_channels\": [],\n \"notify_groups_obj\": null,\n \"notify_groups\": null,\n \"notify_repeat_step\": 60,\n \"notify_max_number\": 0,\n \"recover_duration\": 0,\n \"callbacks\": [],\n \"runbook_url\": \"\",\n \"append_tags\": [],\n \"annotations\": null,\n \"extra_config\": null,\n \"create_at\": 0,\n \"create_by\": \"\",\n \"update_at\": 0,\n \"update_by\": \"\",\n \"uuid\": 1717556327639942000\n },\n {\n \"id\": 0,\n \"group_id\": 0,\n \"cate\": \"\",\n \"datasource_ids\": null,\n \"cluster\": \"\",\n \"name\": \"Node不可达\",\n \"note\": \"{{ $labels.node }} is unreachable and some workloads may be rescheduled.\",\n \"prod\": \"\",\n \"algorithm\": \"\",\n \"algo_params\": null,\n \"delay\": 0,\n \"severity\": 2,\n \"severities\": null,\n \"disabled\": 0,\n \"prom_for_duration\": 900,\n \"prom_ql\": \"(kube_node_spec_taint{job=\\\"kube-state-metrics\\\",key=\\\"node.kubernetes.io/unreachable\\\",effect=\\\"NoSchedule\\\"} unless ignoring(key,value) kube_node_spec_taint{job=\\\"kube-state-metrics\\\",key=~\\\"ToBeDeletedByClusterAutoscaler|cloud.google.com/impending-node-termination|aws-node-termination-handler/spot-itn\\\"}) == 1\\n\",\n \"rule_config\": null,\n \"prom_eval_interval\": 15,\n \"enable_stime\": \"00:00\",\n \"enable_stimes\": null,\n \"enable_etime\": \"23:59\",\n \"enable_etimes\": null,\n \"enable_days_of_week\": [\n \"1\",\n \"2\",\n \"3\",\n \"4\",\n \"5\",\n \"6\",\n \"0\"\n ],\n \"enable_days_of_weeks\": null,\n \"enable_in_bg\": 0,\n \"notify_recovered\": 1,\n \"notify_channels\": [],\n \"notify_groups_obj\": null,\n \"notify_groups\": null,\n \"notify_repeat_step\": 60,\n \"notify_max_number\": 0,\n \"recover_duration\": 0,\n \"callbacks\": [],\n \"runbook_url\": \"\",\n \"append_tags\": [],\n \"annotations\": null,\n \"extra_config\": null,\n \"create_at\": 0,\n \"create_by\": \"\",\n \"update_at\": 0,\n \"update_by\": \"\",\n \"uuid\": 1717556327640501000\n },\n {\n \"id\": 0,\n \"group_id\": 0,\n \"cate\": \"\",\n \"datasource_ids\": null,\n \"cluster\": \"\",\n \"name\": \"Node运行太多Pod\",\n \"note\": \"Kubelet '{{ $labels.node }}' is running at {{ $value | humanizePercentage }} of its Pod capacity.\",\n \"prod\": \"\",\n \"algorithm\": \"\",\n \"algo_params\": null,\n \"delay\": 0,\n \"severity\": 2,\n \"severities\": null,\n \"disabled\": 0,\n \"prom_for_duration\": 900,\n \"prom_ql\": \"count by(node) (\\n (kube_pod_status_phase{job=\\\"kube-state-metrics\\\",phase=\\\"Running\\\"} == 1) * on(instance,pod,namespace,cluster) group_left(node) topk by(instance,pod,namespace,cluster) (1, kube_pod_info{job=\\\"kube-state-metrics\\\"})\\n)\\n/\\nmax by(node) (\\n kube_node_status_capacity_pods{job=\\\"kube-state-metrics\\\"} != 1\\n) \\u003e 0.95\\n\",\n \"rule_config\": null,\n \"prom_eval_interval\": 15,\n \"enable_stime\": \"00:00\",\n \"enable_stimes\": null,\n \"enable_etime\": \"23:59\",\n \"enable_etimes\": null,\n \"enable_days_of_week\": [\n \"1\",\n \"2\",\n \"3\",\n \"4\",\n \"5\",\n \"6\",\n \"0\"\n ],\n \"enable_days_of_weeks\": null,\n \"enable_in_bg\": 0,\n \"notify_recovered\": 1,\n \"notify_channels\": [],\n \"notify_groups_obj\": null,\n \"notify_groups\": null,\n \"notify_repeat_step\": 60,\n \"notify_max_number\": 0,\n \"recover_duration\": 0,\n \"callbacks\": [],\n \"runbook_url\": \"\",\n \"append_tags\": [],\n \"annotations\": null,\n \"extra_config\": null,\n \"create_at\": 0,\n \"create_by\": \"\",\n \"update_at\": 0,\n \"update_by\": \"\",\n \"uuid\": 1717556327641040000\n },\n {\n \"id\": 0,\n \"group_id\": 0,\n \"cate\": \"\",\n \"datasource_ids\": null,\n \"cluster\": \"\",\n \"name\": \"Node状态抖动\",\n \"note\": \"The readiness status of node {{ $labels.node }} has changed {{ $value }} times in the last 15 minutes.\",\n \"prod\": \"\",\n \"algorithm\": \"\",\n \"algo_params\": null,\n \"delay\": 0,\n \"severity\": 2,\n \"severities\": null,\n \"disabled\": 0,\n \"prom_for_duration\": 900,\n \"prom_ql\": \"sum(changes(kube_node_status_condition{status=\\\"true\\\",condition=\\\"Ready\\\"}[15m])) by (node) \\u003e 2\\n\",\n \"rule_config\": null,\n \"prom_eval_interval\": 15,\n \"enable_stime\": \"00:00\",\n \"enable_stimes\": null,\n \"enable_etime\": \"23:59\",\n \"enable_etimes\": null,\n \"enable_days_of_week\": [\n \"1\",\n \"2\",\n \"3\",\n \"4\",\n \"5\",\n \"6\",\n \"0\"\n ],\n \"enable_days_of_weeks\": null,\n \"enable_in_bg\": 0,\n \"notify_recovered\": 1,\n \"notify_channels\": [],\n \"notify_groups_obj\": null,\n \"notify_groups\": null,\n \"notify_repeat_step\": 60,\n \"notify_max_number\": 0,\n \"recover_duration\": 0,\n \"callbacks\": [],\n \"runbook_url\": \"\",\n \"append_tags\": [],\n \"annotations\": null,\n \"extra_config\": null,\n \"create_at\": 0,\n \"create_by\": \"\",\n \"update_at\": 0,\n \"update_by\": \"\",\n \"uuid\": 1717556327641505000\n },\n {\n \"id\": 0,\n \"group_id\": 0,\n \"cate\": \"\",\n \"datasource_ids\": null,\n \"cluster\": \"\",\n \"name\": \"PLEG耗时高\",\n \"note\": \"The Kubelet Pod Lifecycle Event Generator has a 99th percentile duration of {{ $value }} seconds on node {{ $labels.node }}.\",\n \"prod\": \"\",\n \"algorithm\": \"\",\n \"algo_params\": null,\n \"delay\": 0,\n \"severity\": 2,\n \"severities\": null,\n \"disabled\": 0,\n \"prom_for_duration\": 300,\n \"prom_ql\": \"node_quantile:kubelet_pleg_relist_duration_seconds:histogram_quantile{quantile=\\\"0.99\\\"} \\u003e= 10\\n\",\n \"rule_config\": null,\n \"prom_eval_interval\": 15,\n \"enable_stime\": \"00:00\",\n \"enable_stimes\": null,\n \"enable_etime\": \"23:59\",\n \"enable_etimes\": null,\n \"enable_days_of_week\": [\n \"1\",\n \"2\",\n \"3\",\n \"4\",\n \"5\",\n \"6\",\n \"0\"\n ],\n \"enable_days_of_weeks\": null,\n \"enable_in_bg\": 0,\n \"notify_recovered\": 1,\n \"notify_channels\": [],\n \"notify_groups_obj\": null,\n \"notify_groups\": null,\n \"notify_repeat_step\": 60,\n \"notify_max_number\": 0,\n \"recover_duration\": 0,\n \"callbacks\": [],\n \"runbook_url\": \"\",\n \"append_tags\": [],\n \"annotations\": null,\n \"extra_config\": null,\n \"create_at\": 0,\n \"create_by\": \"\",\n \"update_at\": 0,\n \"update_by\": \"\",\n \"uuid\": 1717556327642077000\n },\n {\n \"id\": 0,\n \"group_id\": 0,\n \"cate\": \"\",\n \"datasource_ids\": null,\n \"cluster\": \"\",\n \"name\": \"Pod启动耗时高\",\n \"note\": \"Kubelet Pod startup 99th percentile latency is {{ $value }} seconds on node {{ $labels.node }}.\",\n \"prod\": \"\",\n \"algorithm\": \"\",\n \"algo_params\": null,\n \"delay\": 0,\n \"severity\": 2,\n \"severities\": null,\n \"disabled\": 0,\n \"prom_for_duration\": 900,\n \"prom_ql\": \"histogram_quantile(0.99, sum(rate(kubelet_pod_worker_duration_seconds_bucket{job=\\\"kubelet\\\", metrics_path=\\\"/metrics\\\"}[5m])) by (instance, le)) * on(instance) group_left(node) kubelet_node_name{job=\\\"kubelet\\\", metrics_path=\\\"/metrics\\\"} \\u003e 60\\n\",\n \"rule_config\": null,\n \"prom_eval_interval\": 15,\n \"enable_stime\": \"00:00\",\n \"enable_stimes\": null,\n \"enable_etime\": \"23:59\",\n \"enable_etimes\": null,\n \"enable_days_of_week\": [\n \"1\",\n \"2\",\n \"3\",\n \"4\",\n \"5\",\n \"6\",\n \"0\"\n ],\n \"enable_days_of_weeks\": null,\n \"enable_in_bg\": 0,\n \"notify_recovered\": 1,\n \"notify_channels\": [],\n \"notify_groups_obj\": null,\n \"notify_groups\": null,\n \"notify_repeat_step\": 60,\n \"notify_max_number\": 0,\n \"recover_duration\": 0,\n \"callbacks\": [],\n \"runbook_url\": \"\",\n \"append_tags\": [],\n \"annotations\": null,\n \"extra_config\": null,\n \"create_at\": 0,\n \"create_by\": \"\",\n \"update_at\": 0,\n \"update_by\": \"\",\n \"uuid\": 1717556327642559000\n },\n {\n \"id\": 0,\n \"group_id\": 0,\n \"cate\": \"\",\n \"datasource_ids\": null,\n \"cluster\": \"\",\n \"name\": \"客户端证书过期-S2\",\n \"note\": \"Client certificate for Kubelet on node {{ $labels.node }} expires in {{ $value | humanizeDuration }}.\",\n \"prod\": \"\",\n \"algorithm\": \"\",\n \"algo_params\": null,\n \"delay\": 0,\n \"severity\": 2,\n \"severities\": null,\n \"disabled\": 0,\n \"prom_for_duration\": 0,\n \"prom_ql\": \"kubelet_certificate_manager_client_ttl_seconds \\u003c 604800\\n\",\n \"rule_config\": null,\n \"prom_eval_interval\": 15,\n \"enable_stime\": \"00:00\",\n \"enable_stimes\": null,\n \"enable_etime\": \"23:59\",\n \"enable_etimes\": null,\n \"enable_days_of_week\": [\n \"1\",\n \"2\",\n \"3\",\n \"4\",\n \"5\",\n \"6\",\n \"0\"\n ],\n \"enable_days_of_weeks\": null,\n \"enable_in_bg\": 0,\n \"notify_recovered\": 1,\n \"notify_channels\": [],\n \"notify_groups_obj\": null,\n \"notify_groups\": null,\n \"notify_repeat_step\": 60,\n \"notify_max_number\": 0,\n \"recover_duration\": 0,\n \"callbacks\": [],\n \"runbook_url\": \"\",\n \"append_tags\": [],\n \"annotations\": null,\n \"extra_config\": null,\n \"create_at\": 0,\n \"create_by\": \"\",\n \"update_at\": 0,\n \"update_by\": \"\",\n \"uuid\": 1717556327643034000\n },\n {\n \"id\": 0,\n \"group_id\": 0,\n \"cate\": \"\",\n \"datasource_ids\": null,\n \"cluster\": \"\",\n \"name\": \"客户端证书过期-S1\",\n \"note\": \"Client certificate for Kubelet on node {{ $labels.node }} expires in {{ $value | humanizeDuration }}.\",\n \"prod\": \"\",\n \"algorithm\": \"\",\n \"algo_params\": null,\n \"delay\": 0,\n \"severity\": 1,\n \"severities\": null,\n \"disabled\": 0,\n \"prom_for_duration\": 0,\n \"prom_ql\": \"kubelet_certificate_manager_client_ttl_seconds \\u003c 86400\\n\",\n \"rule_config\": null,\n \"prom_eval_interval\": 15,\n \"enable_stime\": \"00:00\",\n \"enable_stimes\": null,\n \"enable_etime\": \"23:59\",\n \"enable_etimes\": null,\n \"enable_days_of_week\": [\n \"1\",\n \"2\",\n \"3\",\n \"4\",\n \"5\",\n \"6\",\n \"0\"\n ],\n \"enable_days_of_weeks\": null,\n \"enable_in_bg\": 0,\n \"notify_recovered\": 1,\n \"notify_channels\": [],\n \"notify_groups_obj\": null,\n \"notify_groups\": null,\n \"notify_repeat_step\": 60,\n \"notify_max_number\": 0,\n \"recover_duration\": 0,\n \"callbacks\": [],\n \"runbook_url\": \"\",\n \"append_tags\": [],\n \"annotations\": null,\n \"extra_config\": null,\n \"create_at\": 0,\n \"create_by\": \"\",\n \"update_at\": 0,\n \"update_by\": \"\",\n \"uuid\": 1717556327643517000\n },\n {\n \"id\": 0,\n \"group_id\": 0,\n \"cate\": \"\",\n \"datasource_ids\": null,\n \"cluster\": \"\",\n \"name\": \"服务端证书过期-S2\",\n \"note\": \"Server certificate for Kubelet on node {{ $labels.node }} expires in {{ $value | humanizeDuration }}.\",\n \"prod\": \"\",\n \"algorithm\": \"\",\n \"algo_params\": null,\n \"delay\": 0,\n \"severity\": 2,\n \"severities\": null,\n \"disabled\": 0,\n \"prom_for_duration\": 0,\n \"prom_ql\": \"kubelet_certificate_manager_server_ttl_seconds \\u003c 604800\\n\",\n \"rule_config\": null,\n \"prom_eval_interval\": 15,\n \"enable_stime\": \"00:00\",\n \"enable_stimes\": null,\n \"enable_etime\": \"23:59\",\n \"enable_etimes\": null,\n \"enable_days_of_week\": [\n \"1\",\n \"2\",\n \"3\",\n \"4\",\n \"5\",\n \"6\",\n \"0\"\n ],\n \"enable_days_of_weeks\": null,\n \"enable_in_bg\": 0,\n \"notify_recovered\": 1,\n \"notify_channels\": [],\n \"notify_groups_obj\": null,\n \"notify_groups\": null,\n \"notify_repeat_step\": 60,\n \"notify_max_number\": 0,\n \"recover_duration\": 0,\n \"callbacks\": [],\n \"runbook_url\": \"\",\n \"append_tags\": [],\n \"annotations\": null,\n \"extra_config\": null,\n \"create_at\": 0,\n \"create_by\": \"\",\n \"update_at\": 0,\n \"update_by\": \"\",\n \"uuid\": 1717556327643966000\n },\n {\n \"id\": 0,\n \"group_id\": 0,\n \"cate\": \"\",\n \"datasource_ids\": null,\n \"cluster\": \"\",\n \"name\": \"服务端证书过期-S1\",\n \"note\": \"Server certificate for Kubelet on node {{ $labels.node }} expires in {{ $value | humanizeDuration }}.\",\n \"prod\": \"\",\n \"algorithm\": \"\",\n \"algo_params\": null,\n \"delay\": 0,\n \"severity\": 1,\n \"severities\": null,\n \"disabled\": 0,\n \"prom_for_duration\": 0,\n \"prom_ql\": \"kubelet_certificate_manager_server_ttl_seconds \\u003c 86400\\n\",\n \"rule_config\": null,\n \"prom_eval_interval\": 15,\n \"enable_stime\": \"00:00\",\n \"enable_stimes\": null,\n \"enable_etime\": \"23:59\",\n \"enable_etimes\": null,\n \"enable_days_of_week\": [\n \"1\",\n \"2\",\n \"3\",\n \"4\",\n \"5\",\n \"6\",\n \"0\"\n ],\n \"enable_days_of_weeks\": null,\n \"enable_in_bg\": 0,\n \"notify_recovered\": 1,\n \"notify_channels\": [],\n \"notify_groups_obj\": null,\n \"notify_groups\": null,\n \"notify_repeat_step\": 60,\n \"notify_max_number\": 0,\n \"recover_duration\": 0,\n \"callbacks\": [],\n \"runbook_url\": \"\",\n \"append_tags\": [],\n \"annotations\": null,\n \"extra_config\": null,\n \"create_at\": 0,\n \"create_by\": \"\",\n \"update_at\": 0,\n \"update_by\": \"\",\n \"uuid\": 1717556327644422000\n },\n {\n \"id\": 0,\n \"group_id\": 0,\n \"cate\": \"\",\n \"datasource_ids\": null,\n \"cluster\": \"\",\n \"name\": \"客户端证书续签错误\",\n \"note\": \"Kubelet on node {{ $labels.node }} has failed to renew its client certificate ({{ $value | humanize }} errors in the last 5 minutes).\",\n \"prod\": \"\",\n \"algorithm\": \"\",\n \"algo_params\": null,\n \"delay\": 0,\n \"severity\": 2,\n \"severities\": null,\n \"disabled\": 0,\n \"prom_for_duration\": 900,\n \"prom_ql\": \"increase(kubelet_certificate_manager_client_expiration_renew_errors[5m]) \\u003e 0\\n\",\n \"rule_config\": null,\n \"prom_eval_interval\": 15,\n \"enable_stime\": \"00:00\",\n \"enable_stimes\": null,\n \"enable_etime\": \"23:59\",\n \"enable_etimes\": null,\n \"enable_days_of_week\": [\n \"1\",\n \"2\",\n \"3\",\n \"4\",\n \"5\",\n \"6\",\n \"0\"\n ],\n \"enable_days_of_weeks\": null,\n \"enable_in_bg\": 0,\n \"notify_recovered\": 1,\n \"notify_channels\": [],\n \"notify_groups_obj\": null,\n \"notify_groups\": null,\n \"notify_repeat_step\": 60,\n \"notify_max_number\": 0,\n \"recover_duration\": 0,\n \"callbacks\": [],\n \"runbook_url\": \"\",\n \"append_tags\": [],\n \"annotations\": null,\n \"extra_config\": null,\n \"create_at\": 0,\n \"create_by\": \"\",\n \"update_at\": 0,\n \"update_by\": \"\",\n \"uuid\": 1717556327644887000\n },\n {\n \"id\": 0,\n \"group_id\": 0,\n \"cate\": \"\",\n \"datasource_ids\": null,\n \"cluster\": \"\",\n \"name\": \"服务证书续签错误\",\n \"note\": \"Kubelet on node {{ $labels.node }} has failed to renew its server certificate ({{ $value | humanize }} errors in the last 5 minutes).\",\n \"prod\": \"\",\n \"algorithm\": \"\",\n \"algo_params\": null,\n \"delay\": 0,\n \"severity\": 2,\n \"severities\": null,\n \"disabled\": 0,\n \"prom_for_duration\": 900,\n \"prom_ql\": \"increase(kubelet_server_expiration_renew_errors[5m]) \\u003e 0\\n\",\n \"rule_config\": null,\n \"prom_eval_interval\": 15,\n \"enable_stime\": \"00:00\",\n \"enable_stimes\": null,\n \"enable_etime\": \"23:59\",\n \"enable_etimes\": null,\n \"enable_days_of_week\": [\n \"1\",\n \"2\",\n \"3\",\n \"4\",\n \"5\",\n \"6\",\n \"0\"\n ],\n \"enable_days_of_weeks\": null,\n \"enable_in_bg\": 0,\n \"notify_recovered\": 1,\n \"notify_channels\": [],\n \"notify_groups_obj\": null,\n \"notify_groups\": null,\n \"notify_repeat_step\": 60,\n \"notify_max_number\": 0,\n \"recover_duration\": 0,\n \"callbacks\": [],\n \"runbook_url\": \"\",\n \"append_tags\": [],\n \"annotations\": null,\n \"extra_config\": null,\n \"create_at\": 0,\n \"create_by\": \"\",\n \"update_at\": 0,\n \"update_by\": \"\",\n \"uuid\": 1717556327645326000\n },\n {\n \"id\": 0,\n \"group_id\": 0,\n \"cate\": \"\",\n \"datasource_ids\": null,\n \"cluster\": \"\",\n \"name\": \"kubelet故障\",\n \"note\": \"Kubelet has disappeared from Prometheus target discovery.\",\n \"prod\": \"\",\n \"algorithm\": \"\",\n \"algo_params\": null,\n \"delay\": 0,\n \"severity\": 1,\n \"severities\": null,\n \"disabled\": 0,\n \"prom_for_duration\": 900,\n \"prom_ql\": \"absent(up{job=\\\"kubelet\\\"} == 1)\\n\",\n \"rule_config\": null,\n \"prom_eval_interval\": 15,\n \"enable_stime\": \"00:00\",\n \"enable_stimes\": null,\n \"enable_etime\": \"23:59\",\n \"enable_etimes\": null,\n \"enable_days_of_week\": [\n \"1\",\n \"2\",\n \"3\",\n \"4\",\n \"5\",\n \"6\",\n \"0\"\n ],\n \"enable_days_of_weeks\": null,\n \"enable_in_bg\": 0,\n \"notify_recovered\": 1,\n \"notify_channels\": [],\n \"notify_groups_obj\": null,\n \"notify_groups\": null,\n \"notify_repeat_step\": 60,\n \"notify_max_number\": 0,\n \"recover_duration\": 0,\n \"callbacks\": [],\n \"runbook_url\": \"\",\n \"append_tags\": [],\n \"annotations\": null,\n \"extra_config\": null,\n \"create_at\": 0,\n \"create_by\": \"\",\n \"update_at\": 0,\n \"update_by\": \"\",\n \"uuid\": 1717556327645784000\n }\n]"
},
{
"path": "integrations/Kubernetes/alerts/node-exporter.json",
"content": "[\n {\n \"id\": 0,\n \"group_id\": 0,\n \"cate\": \"\",\n \"datasource_ids\": null,\n \"cluster\": \"\",\n \"name\": \"主机内存不足\",\n \"note\": \"节点内存不足 (instance {{ $labels.instance }})\",\n \"prod\": \"\",\n \"algorithm\": \"\",\n \"algo_params\": null,\n \"delay\": 0,\n \"severity\": 2,\n \"severities\": null,\n \"disabled\": 0,\n \"prom_for_duration\": 120,\n \"prom_ql\": \"node_memory_MemAvailable_bytes / node_memory_MemTotal_bytes * 100 \\u003c 10\",\n \"rule_config\": null,\n \"prom_eval_interval\": 15,\n \"enable_stime\": \"00:00\",\n \"enable_stimes\": null,\n \"enable_etime\": \"23:59\",\n \"enable_etimes\": null,\n \"enable_days_of_week\": [\n \"1\",\n \"2\",\n \"3\",\n \"4\",\n \"5\",\n \"6\",\n \"0\"\n ],\n \"enable_days_of_weeks\": null,\n \"enable_in_bg\": 0,\n \"notify_recovered\": 1,\n \"notify_channels\": [],\n \"notify_groups_obj\": null,\n \"notify_groups\": null,\n \"notify_repeat_step\": 60,\n \"notify_max_number\": 0,\n \"recover_duration\": 0,\n \"callbacks\": [],\n \"runbook_url\": \"\",\n \"append_tags\": [],\n \"annotations\": null,\n \"extra_config\": null,\n \"create_at\": 0,\n \"create_by\": \"\",\n \"update_at\": 0,\n \"update_by\": \"\",\n \"uuid\": 1717556327647038000\n },\n {\n \"id\": 0,\n \"group_id\": 0,\n \"cate\": \"\",\n \"datasource_ids\": null,\n \"cluster\": \"\",\n \"name\": \"主机内存有压力\",\n \"note\": \"节点内存压力大 (instance {{ $labels.instance }})\",\n \"prod\": \"\",\n \"algorithm\": \"\",\n \"algo_params\": null,\n \"delay\": 0,\n \"severity\": 2,\n \"severities\": null,\n \"disabled\": 0,\n \"prom_for_duration\": 120,\n \"prom_ql\": \"rate(node_vmstat_pgmajfault[1m]) \\u003e 1000\",\n \"rule_config\": null,\n \"prom_eval_interval\": 15,\n \"enable_stime\": \"00:00\",\n \"enable_stimes\": null,\n \"enable_etime\": \"23:59\",\n \"enable_etimes\": null,\n \"enable_days_of_week\": [\n \"1\",\n \"2\",\n \"3\",\n \"4\",\n \"5\",\n \"6\",\n \"0\"\n ],\n \"enable_days_of_weeks\": null,\n \"enable_in_bg\": 0,\n \"notify_recovered\": 1,\n \"notify_channels\": [],\n \"notify_groups_obj\": null,\n \"notify_groups\": null,\n \"notify_repeat_step\": 60,\n \"notify_max_number\": 0,\n \"recover_duration\": 0,\n \"callbacks\": [],\n \"runbook_url\": \"\",\n \"append_tags\": [],\n \"annotations\": null,\n \"extra_config\": null,\n \"create_at\": 0,\n \"create_by\": \"\",\n \"update_at\": 0,\n \"update_by\": \"\",\n \"uuid\": 1717556327647631000\n },\n {\n \"id\": 0,\n \"group_id\": 0,\n \"cate\": \"\",\n \"datasource_ids\": null,\n \"cluster\": \"\",\n \"name\": \"主机入口网络吞吐量异常\",\n \"note\": \"主机异常网络吞吐量 入 (instance {{ $labels.instance }})\",\n \"prod\": \"\",\n \"algorithm\": \"\",\n \"algo_params\": null,\n \"delay\": 0,\n \"severity\": 2,\n \"severities\": null,\n \"disabled\": 0,\n \"prom_for_duration\": 300,\n \"prom_ql\": \"sum by (instance) (rate(node_network_receive_bytes_total[2m])) / 1024 / 1024 \\u003e 100\",\n \"rule_config\": null,\n \"prom_eval_interval\": 15,\n \"enable_stime\": \"00:00\",\n \"enable_stimes\": null,\n \"enable_etime\": \"23:59\",\n \"enable_etimes\": null,\n \"enable_days_of_week\": [\n \"1\",\n \"2\",\n \"3\",\n \"4\",\n \"5\",\n \"6\",\n \"0\"\n ],\n \"enable_days_of_weeks\": null,\n \"enable_in_bg\": 0,\n \"notify_recovered\": 1,\n \"notify_channels\": [],\n \"notify_groups_obj\": null,\n \"notify_groups\": null,\n \"notify_repeat_step\": 60,\n \"notify_max_number\": 0,\n \"recover_duration\": 0,\n \"callbacks\": [],\n \"runbook_url\": \"\",\n \"append_tags\": [],\n \"annotations\": null,\n \"extra_config\": null,\n \"create_at\": 0,\n \"create_by\": \"\",\n \"update_at\": 0,\n \"update_by\": \"\",\n \"uuid\": 1717556327648186000\n },\n {\n \"id\": 0,\n \"group_id\": 0,\n \"cate\": \"\",\n \"datasource_ids\": null,\n \"cluster\": \"\",\n \"name\": \"主机出口网络吞吐量异常\",\n \"note\": \"主机异常网络吞吐量 出 (instance {{ $labels.instance }})\",\n \"prod\": \"\",\n \"algorithm\": \"\",\n \"algo_params\": null,\n \"delay\": 0,\n \"severity\": 2,\n \"severities\": null,\n \"disabled\": 0,\n \"prom_for_duration\": 300,\n \"prom_ql\": \"sum by (instance) (rate(node_network_transmit_bytes_total[2m])) / 1024 / 1024 \\u003e 100\",\n \"rule_config\": null,\n \"prom_eval_interval\": 15,\n \"enable_stime\": \"00:00\",\n \"enable_stimes\": null,\n \"enable_etime\": \"23:59\",\n \"enable_etimes\": null,\n \"enable_days_of_week\": [\n \"1\",\n \"2\",\n \"3\",\n \"4\",\n \"5\",\n \"6\",\n \"0\"\n ],\n \"enable_days_of_weeks\": null,\n \"enable_in_bg\": 0,\n \"notify_recovered\": 1,\n \"notify_channels\": [],\n \"notify_groups_obj\": null,\n \"notify_groups\": null,\n \"notify_repeat_step\": 60,\n \"notify_max_number\": 0,\n \"recover_duration\": 0,\n \"callbacks\": [],\n \"runbook_url\": \"\",\n \"append_tags\": [],\n \"annotations\": null,\n \"extra_config\": null,\n \"create_at\": 0,\n \"create_by\": \"\",\n \"update_at\": 0,\n \"update_by\": \"\",\n \"uuid\": 1717556327648692000\n },\n {\n \"id\": 0,\n \"group_id\": 0,\n \"cate\": \"\",\n \"datasource_ids\": null,\n \"cluster\": \"\",\n \"name\": \"主机磁盘读取速率异常\",\n \"note\": \"主机异常磁盘读取率 (instance {{ $labels.instance }})\",\n \"prod\": \"\",\n \"algorithm\": \"\",\n \"algo_params\": null,\n \"delay\": 0,\n \"severity\": 2,\n \"severities\": null,\n \"disabled\": 0,\n \"prom_for_duration\": 300,\n \"prom_ql\": \"sum by (instance) (rate(node_disk_read_bytes_total[2m])) / 1024 / 1024 \\u003e 50\",\n \"rule_config\": null,\n \"prom_eval_interval\": 15,\n \"enable_stime\": \"00:00\",\n \"enable_stimes\": null,\n \"enable_etime\": \"23:59\",\n \"enable_etimes\": null,\n \"enable_days_of_week\": [\n \"1\",\n \"2\",\n \"3\",\n \"4\",\n \"5\",\n \"6\",\n \"0\"\n ],\n \"enable_days_of_weeks\": null,\n \"enable_in_bg\": 0,\n \"notify_recovered\": 1,\n \"notify_channels\": [],\n \"notify_groups_obj\": null,\n \"notify_groups\": null,\n \"notify_repeat_step\": 60,\n \"notify_max_number\": 0,\n \"recover_duration\": 0,\n \"callbacks\": [],\n \"runbook_url\": \"\",\n \"append_tags\": [],\n \"annotations\": null,\n \"extra_config\": null,\n \"create_at\": 0,\n \"create_by\": \"\",\n \"update_at\": 0,\n \"update_by\": \"\",\n \"uuid\": 1717556327649279000\n },\n {\n \"id\": 0,\n \"group_id\": 0,\n \"cate\": \"\",\n \"datasource_ids\": null,\n \"cluster\": \"\",\n \"name\": \"主机磁盘写入速率异常\",\n \"note\": \"主机异常磁盘写入率 (instance {{ $labels.instance }})\",\n \"prod\": \"\",\n \"algorithm\": \"\",\n \"algo_params\": null,\n \"delay\": 0,\n \"severity\": 2,\n \"severities\": null,\n \"disabled\": 0,\n \"prom_for_duration\": 120,\n \"prom_ql\": \"sum by (instance) (rate(node_disk_written_bytes_total[2m])) / 1024 / 1024 \\u003e 50\",\n \"rule_config\": null,\n \"prom_eval_interval\": 15,\n \"enable_stime\": \"00:00\",\n \"enable_stimes\": null,\n \"enable_etime\": \"23:59\",\n \"enable_etimes\": null,\n \"enable_days_of_week\": [\n \"1\",\n \"2\",\n \"3\",\n \"4\",\n \"5\",\n \"6\",\n \"0\"\n ],\n \"enable_days_of_weeks\": null,\n \"enable_in_bg\": 0,\n \"notify_recovered\": 1,\n \"notify_channels\": [],\n \"notify_groups_obj\": null,\n \"notify_groups\": null,\n \"notify_repeat_step\": 60,\n \"notify_max_number\": 0,\n \"recover_duration\": 0,\n \"callbacks\": [],\n \"runbook_url\": \"\",\n \"append_tags\": [],\n \"annotations\": null,\n \"extra_config\": null,\n \"create_at\": 0,\n \"create_by\": \"\",\n \"update_at\": 0,\n \"update_by\": \"\",\n \"uuid\": 1717556327649827000\n },\n {\n \"id\": 0,\n \"group_id\": 0,\n \"cate\": \"\",\n \"datasource_ids\": null,\n \"cluster\": \"\",\n \"name\": \"主机磁盘空间不足\",\n \"note\": \"主机磁盘空间不足 (instance {{ $labels.instance }})\",\n \"prod\": \"\",\n \"algorithm\": \"\",\n \"algo_params\": null,\n \"delay\": 0,\n \"severity\": 2,\n \"severities\": null,\n \"disabled\": 0,\n \"prom_for_duration\": 120,\n \"prom_ql\": \"(node_filesystem_avail_bytes * 100) / node_filesystem_size_bytes \\u003c 10 and ON (instance, device, mountpoint) node_filesystem_readonly == 0\",\n \"rule_config\": null,\n \"prom_eval_interval\": 15,\n \"enable_stime\": \"00:00\",\n \"enable_stimes\": null,\n \"enable_etime\": \"23:59\",\n \"enable_etimes\": null,\n \"enable_days_of_week\": [\n \"1\",\n \"2\",\n \"3\",\n \"4\",\n \"5\",\n \"6\",\n \"0\"\n ],\n \"enable_days_of_weeks\": null,\n \"enable_in_bg\": 0,\n \"notify_recovered\": 1,\n \"notify_channels\": [],\n \"notify_groups_obj\": null,\n \"notify_groups\": null,\n \"notify_repeat_step\": 60,\n \"notify_max_number\": 0,\n \"recover_duration\": 0,\n \"callbacks\": [],\n \"runbook_url\": \"\",\n \"append_tags\": [],\n \"annotations\": null,\n \"extra_config\": null,\n \"create_at\": 0,\n \"create_by\": \"\",\n \"update_at\": 0,\n \"update_by\": \"\",\n \"uuid\": 1717556327650331000\n },\n {\n \"id\": 0,\n \"group_id\": 0,\n \"cate\": \"\",\n \"datasource_ids\": null,\n \"cluster\": \"\",\n \"name\": \"主机磁盘将在 24 小时内填满\",\n \"note\": \"主机磁盘将在 24 小时内填满 (instance {{ $labels.instance }})\",\n \"prod\": \"\",\n \"algorithm\": \"\",\n \"algo_params\": null,\n \"delay\": 0,\n \"severity\": 2,\n \"severities\": null,\n \"disabled\": 0,\n \"prom_for_duration\": 120,\n \"prom_ql\": \"(node_filesystem_avail_bytes * 100) / node_filesystem_size_bytes \\u003c 10 and ON (instance, device, mountpoint) predict_linear(node_filesystem_avail_bytes{fstype!~\\\"tmpfs\\\"}[1h], 24 * 3600) \\u003c 0 and ON (instance, device, mountpoint) node_filesystem_readonly == 0\",\n \"rule_config\": null,\n \"prom_eval_interval\": 15,\n \"enable_stime\": \"00:00\",\n \"enable_stimes\": null,\n \"enable_etime\": \"23:59\",\n \"enable_etimes\": null,\n \"enable_days_of_week\": [\n \"1\",\n \"2\",\n \"3\",\n \"4\",\n \"5\",\n \"6\",\n \"0\"\n ],\n \"enable_days_of_weeks\": null,\n \"enable_in_bg\": 0,\n \"notify_recovered\": 1,\n \"notify_channels\": [],\n \"notify_groups_obj\": null,\n \"notify_groups\": null,\n \"notify_repeat_step\": 60,\n \"notify_max_number\": 0,\n \"recover_duration\": 0,\n \"callbacks\": [],\n \"runbook_url\": \"\",\n \"append_tags\": [],\n \"annotations\": null,\n \"extra_config\": null,\n \"create_at\": 0,\n \"create_by\": \"\",\n \"update_at\": 0,\n \"update_by\": \"\",\n \"uuid\": 1717556327650785000\n },\n {\n \"id\": 0,\n \"group_id\": 0,\n \"cate\": \"\",\n \"datasource_ids\": null,\n \"cluster\": \"\",\n \"name\": \"文件系统inode使用率高\",\n \"note\": \"主机不足 inode (instance {{ $labels.instance }})\",\n \"prod\": \"\",\n \"algorithm\": \"\",\n \"algo_params\": null,\n \"delay\": 0,\n \"severity\": 2,\n \"severities\": null,\n \"disabled\": 0,\n \"prom_for_duration\": 120,\n \"prom_ql\": \"node_filesystem_files_free{mountpoint =\\\"/rootfs\\\"} / node_filesystem_files{mountpoint=\\\"/rootfs\\\"} * 100 \\u003c 10 and ON (instance, device, mountpoint) node_filesystem_readonly{mountpoint=\\\"/rootfs\\\"} == 0\",\n \"rule_config\": null,\n \"prom_eval_interval\": 15,\n \"enable_stime\": \"00:00\",\n \"enable_stimes\": null,\n \"enable_etime\": \"23:59\",\n \"enable_etimes\": null,\n \"enable_days_of_week\": [\n \"1\",\n \"2\",\n \"3\",\n \"4\",\n \"5\",\n \"6\",\n \"0\"\n ],\n \"enable_days_of_weeks\": null,\n \"enable_in_bg\": 0,\n \"notify_recovered\": 1,\n \"notify_channels\": [],\n \"notify_groups_obj\": null,\n \"notify_groups\": null,\n \"notify_repeat_step\": 60,\n \"notify_max_number\": 0,\n \"recover_duration\": 0,\n \"callbacks\": [],\n \"runbook_url\": \"\",\n \"append_tags\": [],\n \"annotations\": null,\n \"extra_config\": null,\n \"create_at\": 0,\n \"create_by\": \"\",\n \"update_at\": 0,\n \"update_by\": \"\",\n \"uuid\": 1717556327651197000\n },\n {\n \"id\": 0,\n \"group_id\": 0,\n \"cate\": \"\",\n \"datasource_ids\": null,\n \"cluster\": \"\",\n \"name\": \"文件系统inode将在24小时内填满\",\n \"note\": \"主机 inode 将在 24 小时内填满 (instance {{ $labels.instance }})\",\n \"prod\": \"\",\n \"algorithm\": \"\",\n \"algo_params\": null,\n \"delay\": 0,\n \"severity\": 2,\n \"severities\": null,\n \"disabled\": 0,\n \"prom_for_duration\": 120,\n \"prom_ql\": \"node_filesystem_files_free{mountpoint =\\\"/rootfs\\\"} / node_filesystem_files{mountpoint=\\\"/rootfs\\\"} * 100 \\u003c 10 and predict_linear(node_filesystem_files_free{mountpoint=\\\"/rootfs\\\"}[1h], 24 * 3600) \\u003c 0 and ON (instance, device, mountpoint) node_filesystem_readonly{mountpoint=\\\"/rootfs\\\"} == 0\",\n \"rule_config\": null,\n \"prom_eval_interval\": 15,\n \"enable_stime\": \"00:00\",\n \"enable_stimes\": null,\n \"enable_etime\": \"23:59\",\n \"enable_etimes\": null,\n \"enable_days_of_week\": [\n \"1\",\n \"2\",\n \"3\",\n \"4\",\n \"5\",\n \"6\",\n \"0\"\n ],\n \"enable_days_of_weeks\": null,\n \"enable_in_bg\": 0,\n \"notify_recovered\": 1,\n \"notify_channels\": [],\n \"notify_groups_obj\": null,\n \"notify_groups\": null,\n \"notify_repeat_step\": 60,\n \"notify_max_number\": 0,\n \"recover_duration\": 0,\n \"callbacks\": [],\n \"runbook_url\": \"\",\n \"append_tags\": [],\n \"annotations\": null,\n \"extra_config\": null,\n \"create_at\": 0,\n \"create_by\": \"\",\n \"update_at\": 0,\n \"update_by\": \"\",\n \"uuid\": 1717556327651641000\n },\n {\n \"id\": 0,\n \"group_id\": 0,\n \"cate\": \"\",\n \"datasource_ids\": null,\n \"cluster\": \"\",\n \"name\": \"主机磁盘读取延迟异常\",\n \"note\": \"主机异常磁盘读取延迟 (instance {{ $labels.instance }})\",\n \"prod\": \"\",\n \"algorithm\": \"\",\n \"algo_params\": null,\n \"delay\": 0,\n \"severity\": 2,\n \"severities\": null,\n \"disabled\": 0,\n \"prom_for_duration\": 120,\n \"prom_ql\": \"rate(node_disk_read_time_seconds_total[1m]) / rate(node_disk_reads_completed_total[1m]) \\u003e 0.1 and rate(node_disk_reads_completed_total[1m]) \\u003e 0\",\n \"rule_config\": null,\n \"prom_eval_interval\": 15,\n \"enable_stime\": \"00:00\",\n \"enable_stimes\": null,\n \"enable_etime\": \"23:59\",\n \"enable_etimes\": null,\n \"enable_days_of_week\": [\n \"1\",\n \"2\",\n \"3\",\n \"4\",\n \"5\",\n \"6\",\n \"0\"\n ],\n \"enable_days_of_weeks\": null,\n \"enable_in_bg\": 0,\n \"notify_recovered\": 1,\n \"notify_channels\": [],\n \"notify_groups_obj\": null,\n \"notify_groups\": null,\n \"notify_repeat_step\": 60,\n \"notify_max_number\": 0,\n \"recover_duration\": 0,\n \"callbacks\": [],\n \"runbook_url\": \"\",\n \"append_tags\": [],\n \"annotations\": null,\n \"extra_config\": null,\n \"create_at\": 0,\n \"create_by\": \"\",\n \"update_at\": 0,\n \"update_by\": \"\",\n \"uuid\": 1717556327652097000\n },\n {\n \"id\": 0,\n \"group_id\": 0,\n \"cate\": \"\",\n \"datasource_ids\": null,\n \"cluster\": \"\",\n \"name\": \"主机磁盘写入延迟异常\",\n \"note\": \"主机异常磁盘写入延迟 (instance {{ $labels.instance }})\",\n \"prod\": \"\",\n \"algorithm\": \"\",\n \"algo_params\": null,\n \"delay\": 0,\n \"severity\": 2,\n \"severities\": null,\n \"disabled\": 0,\n \"prom_for_duration\": 120,\n \"prom_ql\": \"rate(node_disk_write_time_seconds_total[1m]) / rate(node_disk_writes_completed_total[1m]) \\u003e 0.1 and rate(node_disk_writes_completed_total[1m]) \\u003e 0\",\n \"rule_config\": null,\n \"prom_eval_interval\": 15,\n \"enable_stime\": \"00:00\",\n \"enable_stimes\": null,\n \"enable_etime\": \"23:59\",\n \"enable_etimes\": null,\n \"enable_days_of_week\": [\n \"1\",\n \"2\",\n \"3\",\n \"4\",\n \"5\",\n \"6\",\n \"0\"\n ],\n \"enable_days_of_weeks\": null,\n \"enable_in_bg\": 0,\n \"notify_recovered\": 1,\n \"notify_channels\": [],\n \"notify_groups_obj\": null,\n \"notify_groups\": null,\n \"notify_repeat_step\": 60,\n \"notify_max_number\": 0,\n \"recover_duration\": 0,\n \"callbacks\": [],\n \"runbook_url\": \"\",\n \"append_tags\": [],\n \"annotations\": null,\n \"extra_config\": null,\n \"create_at\": 0,\n \"create_by\": \"\",\n \"update_at\": 0,\n \"update_by\": \"\",\n \"uuid\": 1717556327652522000\n },\n {\n \"id\": 0,\n \"group_id\": 0,\n \"cate\": \"\",\n \"datasource_ids\": null,\n \"cluster\": \"\",\n \"name\": \"节点cpu负载高\",\n \"note\": \"主机 CPU 负载高 (instance {{ $labels.instance }})\",\n \"prod\": \"\",\n \"algorithm\": \"\",\n \"algo_params\": null,\n \"delay\": 0,\n \"severity\": 2,\n \"severities\": null,\n \"disabled\": 0,\n \"prom_for_duration\": 0,\n \"prom_ql\": \"100 - (avg by(instance) (rate(node_cpu_seconds_total{mode=\\\"idle\\\"}[2m])) * 100) \\u003e 80\",\n \"rule_config\": null,\n \"prom_eval_interval\": 15,\n \"enable_stime\": \"00:00\",\n \"enable_stimes\": null,\n \"enable_etime\": \"23:59\",\n \"enable_etimes\": null,\n \"enable_days_of_week\": [\n \"1\",\n \"2\",\n \"3\",\n \"4\",\n \"5\",\n \"6\",\n \"0\"\n ],\n \"enable_days_of_weeks\": null,\n \"enable_in_bg\": 0,\n \"notify_recovered\": 1,\n \"notify_channels\": [],\n \"notify_groups_obj\": null,\n \"notify_groups\": null,\n \"notify_repeat_step\": 60,\n \"notify_max_number\": 0,\n \"recover_duration\": 0,\n \"callbacks\": [],\n \"runbook_url\": \"\",\n \"append_tags\": [],\n \"annotations\": null,\n \"extra_config\": null,\n \"create_at\": 0,\n \"create_by\": \"\",\n \"update_at\": 0,\n \"update_by\": \"\",\n \"uuid\": 1717556327652932000\n },\n {\n \"id\": 0,\n \"group_id\": 0,\n \"cate\": \"\",\n \"datasource_ids\": null,\n \"cluster\": \"\",\n \"name\": \"有其他云主机窃取cpu\",\n \"note\": \"Host CPU steal noisy neighbor (instance {{ $labels.instance }})\",\n \"prod\": \"\",\n \"algorithm\": \"\",\n \"algo_params\": null,\n \"delay\": 0,\n \"severity\": 2,\n \"severities\": null,\n \"disabled\": 0,\n \"prom_for_duration\": 0,\n \"prom_ql\": \"avg by(instance) (rate(node_cpu_seconds_total{mode=\\\"steal\\\"}[5m])) * 100 \\u003e 10\",\n \"rule_config\": null,\n \"prom_eval_interval\": 15,\n \"enable_stime\": \"00:00\",\n \"enable_stimes\": null,\n \"enable_etime\": \"23:59\",\n \"enable_etimes\": null,\n \"enable_days_of_week\": [\n \"1\",\n \"2\",\n \"3\",\n \"4\",\n \"5\",\n \"6\",\n \"0\"\n ],\n \"enable_days_of_weeks\": null,\n \"enable_in_bg\": 0,\n \"notify_recovered\": 1,\n \"notify_channels\": [],\n \"notify_groups_obj\": null,\n \"notify_groups\": null,\n \"notify_repeat_step\": 60,\n \"notify_max_number\": 0,\n \"recover_duration\": 0,\n \"callbacks\": [],\n \"runbook_url\": \"\",\n \"append_tags\": [],\n \"annotations\": null,\n \"extra_config\": null,\n \"create_at\": 0,\n \"create_by\": \"\",\n \"update_at\": 0,\n \"update_by\": \"\",\n \"uuid\": 1717556327653518000\n },\n {\n \"id\": 0,\n \"group_id\": 0,\n \"cate\": \"\",\n \"datasource_ids\": null,\n \"cluster\": \"\",\n \"name\": \"主机上下文切换异常\",\n \"note\": \"主机上下文切换 (instance {{ $labels.instance }})\",\n \"prod\": \"\",\n \"algorithm\": \"\",\n \"algo_params\": null,\n \"delay\": 0,\n \"severity\": 2,\n \"severities\": null,\n \"disabled\": 0,\n \"prom_for_duration\": 0,\n \"prom_ql\": \"(rate(node_context_switches_total[5m])) / (count without(cpu, mode) (node_cpu_seconds_total{mode=\\\"idle\\\"})) \\u003e 1000\",\n \"rule_config\": null,\n \"prom_eval_interval\": 15,\n \"enable_stime\": \"00:00\",\n \"enable_stimes\": null,\n \"enable_etime\": \"23:59\",\n \"enable_etimes\": null,\n \"enable_days_of_week\": [\n \"1\",\n \"2\",\n \"3\",\n \"4\",\n \"5\",\n \"6\",\n \"0\"\n ],\n \"enable_days_of_weeks\": null,\n \"enable_in_bg\": 0,\n \"notify_recovered\": 1,\n \"notify_channels\": [],\n \"notify_groups_obj\": null,\n \"notify_groups\": null,\n \"notify_repeat_step\": 60,\n \"notify_max_number\": 0,\n \"recover_duration\": 0,\n \"callbacks\": [],\n \"runbook_url\": \"\",\n \"append_tags\": [],\n \"annotations\": null,\n \"extra_config\": null,\n \"create_at\": 0,\n \"create_by\": \"\",\n \"update_at\": 0,\n \"update_by\": \"\",\n \"uuid\": 1717556327653948000\n },\n {\n \"id\": 0,\n \"group_id\": 0,\n \"cate\": \"\",\n \"datasource_ids\": null,\n \"cluster\": \"\",\n \"name\": \"主机交换内存快满了\",\n \"note\": \"主机交换内存已满 (instance {{ $labels.instance }})\",\n \"prod\": \"\",\n \"algorithm\": \"\",\n \"algo_params\": null,\n \"delay\": 0,\n \"severity\": 2,\n \"severities\": null,\n \"disabled\": 0,\n \"prom_for_duration\": 120,\n \"prom_ql\": \"(1 - (node_memory_SwapFree_bytes / node_memory_SwapTotal_bytes)) * 100 \\u003e 80\",\n \"rule_config\": null,\n \"prom_eval_interval\": 15,\n \"enable_stime\": \"00:00\",\n \"enable_stimes\": null,\n \"enable_etime\": \"23:59\",\n \"enable_etimes\": null,\n \"enable_days_of_week\": [\n \"1\",\n \"2\",\n \"3\",\n \"4\",\n \"5\",\n \"6\",\n \"0\"\n ],\n \"enable_days_of_weeks\": null,\n \"enable_in_bg\": 0,\n \"notify_recovered\": 1,\n \"notify_channels\": [],\n \"notify_groups_obj\": null,\n \"notify_groups\": null,\n \"notify_repeat_step\": 60,\n \"notify_max_number\": 0,\n \"recover_duration\": 0,\n \"callbacks\": [],\n \"runbook_url\": \"\",\n \"append_tags\": [],\n \"annotations\": null,\n \"extra_config\": null,\n \"create_at\": 0,\n \"create_by\": \"\",\n \"update_at\": 0,\n \"update_by\": \"\",\n \"uuid\": 1717556327654459000\n },\n {\n \"id\": 0,\n \"group_id\": 0,\n \"cate\": \"\",\n \"datasource_ids\": null,\n \"cluster\": \"\",\n \"name\": \"主机系统服务崩溃\",\n \"note\": \"主机 systemd 服务崩溃 (instance {{ $labels.instance }})\",\n \"prod\": \"\",\n \"algorithm\": \"\",\n \"algo_params\": null,\n \"delay\": 0,\n \"severity\": 2,\n \"severities\": null,\n \"disabled\": 0,\n \"prom_for_duration\": 0,\n \"prom_ql\": \"node_systemd_unit_state{state=\\\"failed\\\"} == 1\",\n \"rule_config\": null,\n \"prom_eval_interval\": 15,\n \"enable_stime\": \"00:00\",\n \"enable_stimes\": null,\n \"enable_etime\": \"23:59\",\n \"enable_etimes\": null,\n \"enable_days_of_week\": [\n \"1\",\n \"2\",\n \"3\",\n \"4\",\n \"5\",\n \"6\",\n \"0\"\n ],\n \"enable_days_of_weeks\": null,\n \"enable_in_bg\": 0,\n \"notify_recovered\": 1,\n \"notify_channels\": [],\n \"notify_groups_obj\": null,\n \"notify_groups\": null,\n \"notify_repeat_step\": 60,\n \"notify_max_number\": 0,\n \"recover_duration\": 0,\n \"callbacks\": [],\n \"runbook_url\": \"\",\n \"append_tags\": [],\n \"annotations\": null,\n \"extra_config\": null,\n \"create_at\": 0,\n \"create_by\": \"\",\n \"update_at\": 0,\n \"update_by\": \"\",\n \"uuid\": 1717556327654942000\n },\n {\n \"id\": 0,\n \"group_id\": 0,\n \"cate\": \"\",\n \"datasource_ids\": null,\n \"cluster\": \"\",\n \"name\": \"主机内核版本偏差\",\n \"note\": \"主机内核版本偏差 (instance {{ $labels.instance }})\",\n \"prod\": \"\",\n \"algorithm\": \"\",\n \"algo_params\": null,\n \"delay\": 0,\n \"severity\": 2,\n \"severities\": null,\n \"disabled\": 0,\n \"prom_for_duration\": 21600,\n \"prom_ql\": \"count(sum(label_replace(node_uname_info, \\\"kernel\\\", \\\"$1\\\", \\\"release\\\", \\\"([0-9]+.[0-9]+.[0-9]+).*\\\")) by (kernel)) \\u003e 1\",\n \"rule_config\": null,\n \"prom_eval_interval\": 15,\n \"enable_stime\": \"00:00\",\n \"enable_stimes\": null,\n \"enable_etime\": \"23:59\",\n \"enable_etimes\": null,\n \"enable_days_of_week\": [\n \"1\",\n \"2\",\n \"3\",\n \"4\",\n \"5\",\n \"6\",\n \"0\"\n ],\n \"enable_days_of_weeks\": null,\n \"enable_in_bg\": 0,\n \"notify_recovered\": 1,\n \"notify_channels\": [],\n \"notify_groups_obj\": null,\n \"notify_groups\": null,\n \"notify_repeat_step\": 60,\n \"notify_max_number\": 0,\n \"recover_duration\": 0,\n \"callbacks\": [],\n \"runbook_url\": \"\",\n \"append_tags\": [],\n \"annotations\": null,\n \"extra_config\": null,\n \"create_at\": 0,\n \"create_by\": \"\",\n \"update_at\": 0,\n \"update_by\": \"\",\n \"uuid\": 1717556327655373000\n },\n {\n \"id\": 0,\n \"group_id\": 0,\n \"cate\": \"\",\n \"datasource_ids\": null,\n \"cluster\": \"\",\n \"name\": \"检测到 HostOomKill\",\n \"note\": \"检测到主机 OOM 终止 (instance {{ $labels.instance }})\",\n \"prod\": \"\",\n \"algorithm\": \"\",\n \"algo_params\": null,\n \"delay\": 0,\n \"severity\": 2,\n \"severities\": null,\n \"disabled\": 0,\n \"prom_for_duration\": 0,\n \"prom_ql\": \"increase(node_vmstat_oom_kill[1m]) \\u003e 0\",\n \"rule_config\": null,\n \"prom_eval_interval\": 15,\n \"enable_stime\": \"00:00\",\n \"enable_stimes\": null,\n \"enable_etime\": \"23:59\",\n \"enable_etimes\": null,\n \"enable_days_of_week\": [\n \"1\",\n \"2\",\n \"3\",\n \"4\",\n \"5\",\n \"6\",\n \"0\"\n ],\n \"enable_days_of_weeks\": null,\n \"enable_in_bg\": 0,\n \"notify_recovered\": 1,\n \"notify_channels\": [],\n \"notify_groups_obj\": null,\n \"notify_groups\": null,\n \"notify_repeat_step\": 60,\n \"notify_max_number\": 0,\n \"recover_duration\": 0,\n \"callbacks\": [],\n \"runbook_url\": \"\",\n \"append_tags\": [],\n \"annotations\": null,\n \"extra_config\": null,\n \"create_at\": 0,\n \"create_by\": \"\",\n \"update_at\": 0,\n \"update_by\": \"\",\n \"uuid\": 1717556327655821000\n },\n {\n \"id\": 0,\n \"group_id\": 0,\n \"cate\": \"\",\n \"datasource_ids\": null,\n \"cluster\": \"\",\n \"name\": \"主机网络接收错误\",\n \"note\": \"主机网络接收错误 (instance {{ $labels.instance }})\",\n \"prod\": \"\",\n \"algorithm\": \"\",\n \"algo_params\": null,\n \"delay\": 0,\n \"severity\": 2,\n \"severities\": null,\n \"disabled\": 0,\n \"prom_for_duration\": 120,\n \"prom_ql\": \"rate(node_network_receive_errs_total[2m]) / rate(node_network_receive_packets_total[2m]) \\u003e 0.01\",\n \"rule_config\": null,\n \"prom_eval_interval\": 15,\n \"enable_stime\": \"00:00\",\n \"enable_stimes\": null,\n \"enable_etime\": \"23:59\",\n \"enable_etimes\": null,\n \"enable_days_of_week\": [\n \"1\",\n \"2\",\n \"3\",\n \"4\",\n \"5\",\n \"6\",\n \"0\"\n ],\n \"enable_days_of_weeks\": null,\n \"enable_in_bg\": 0,\n \"notify_recovered\": 1,\n \"notify_channels\": [],\n \"notify_groups_obj\": null,\n \"notify_groups\": null,\n \"notify_repeat_step\": 60,\n \"notify_max_number\": 0,\n \"recover_duration\": 0,\n \"callbacks\": [],\n \"runbook_url\": \"\",\n \"append_tags\": [],\n \"annotations\": null,\n \"extra_config\": null,\n \"create_at\": 0,\n \"create_by\": \"\",\n \"update_at\": 0,\n \"update_by\": \"\",\n \"uuid\": 1717556327656340000\n },\n {\n \"id\": 0,\n \"group_id\": 0,\n \"cate\": \"\",\n \"datasource_ids\": null,\n \"cluster\": \"\",\n \"name\": \"主机网络出口错误\",\n \"note\": \"主机网络传输错误 (instance {{ $labels.instance }})\",\n \"prod\": \"\",\n \"algorithm\": \"\",\n \"algo_params\": null,\n \"delay\": 0,\n \"severity\": 2,\n \"severities\": null,\n \"disabled\": 0,\n \"prom_for_duration\": 120,\n \"prom_ql\": \"rate(node_network_transmit_errs_total[2m]) / rate(node_network_transmit_packets_total[2m]) \\u003e 0.01\",\n \"rule_config\": null,\n \"prom_eval_interval\": 15,\n \"enable_stime\": \"00:00\",\n \"enable_stimes\": null,\n \"enable_etime\": \"23:59\",\n \"enable_etimes\": null,\n \"enable_days_of_week\": [\n \"1\",\n \"2\",\n \"3\",\n \"4\",\n \"5\",\n \"6\",\n \"0\"\n ],\n \"enable_days_of_weeks\": null,\n \"enable_in_bg\": 0,\n \"notify_recovered\": 1,\n \"notify_channels\": [],\n \"notify_groups_obj\": null,\n \"notify_groups\": null,\n \"notify_repeat_step\": 60,\n \"notify_max_number\": 0,\n \"recover_duration\": 0,\n \"callbacks\": [],\n \"runbook_url\": \"\",\n \"append_tags\": [],\n \"annotations\": null,\n \"extra_config\": null,\n \"create_at\": 0,\n \"create_by\": \"\",\n \"update_at\": 0,\n \"update_by\": \"\",\n \"uuid\": 1717556327656756000\n },\n {\n \"id\": 0,\n \"group_id\": 0,\n \"cate\": \"\",\n \"datasource_ids\": null,\n \"cluster\": \"\",\n \"name\": \"主机网络接口饱和\",\n \"note\": \"主机网络接口饱和 (instance {{ $labels.instance }})\",\n \"prod\": \"\",\n \"algorithm\": \"\",\n \"algo_params\": null,\n \"delay\": 0,\n \"severity\": 2,\n \"severities\": null,\n \"disabled\": 0,\n \"prom_for_duration\": 60,\n \"prom_ql\": \"(rate(node_network_receive_bytes_total{device!~\\\"^tap.*\\\"}[1m]) + rate(node_network_transmit_bytes_total{device!~\\\"^tap.*\\\"}[1m])) / node_network_speed_bytes{device!~\\\"^tap.*\\\"} \\u003e 0.8 \\u003c 10000\",\n \"rule_config\": null,\n \"prom_eval_interval\": 15,\n \"enable_stime\": \"00:00\",\n \"enable_stimes\": null,\n \"enable_etime\": \"23:59\",\n \"enable_etimes\": null,\n \"enable_days_of_week\": [\n \"1\",\n \"2\",\n \"3\",\n \"4\",\n \"5\",\n \"6\",\n \"0\"\n ],\n \"enable_days_of_weeks\": null,\n \"enable_in_bg\": 0,\n \"notify_recovered\": 1,\n \"notify_channels\": [],\n \"notify_groups_obj\": null,\n \"notify_groups\": null,\n \"notify_repeat_step\": 60,\n \"notify_max_number\": 0,\n \"recover_duration\": 0,\n \"callbacks\": [],\n \"runbook_url\": \"\",\n \"append_tags\": [],\n \"annotations\": null,\n \"extra_config\": null,\n \"create_at\": 0,\n \"create_by\": \"\",\n \"update_at\": 0,\n \"update_by\": \"\",\n \"uuid\": 1717556327657159000\n },\n {\n \"id\": 0,\n \"group_id\": 0,\n \"cate\": \"\",\n \"datasource_ids\": null,\n \"cluster\": \"\",\n \"name\": \"conntrack数量接近极限\",\n \"note\": \"主机连接限制 (instance {{ $labels.instance }})\",\n \"prod\": \"\",\n \"algorithm\": \"\",\n \"algo_params\": null,\n \"delay\": 0,\n \"severity\": 2,\n \"severities\": null,\n \"disabled\": 0,\n \"prom_for_duration\": 300,\n \"prom_ql\": \"node_nf_conntrack_entries / node_nf_conntrack_entries_limit \\u003e 0.8\",\n \"rule_config\": null,\n \"prom_eval_interval\": 15,\n \"enable_stime\": \"00:00\",\n \"enable_stimes\": null,\n \"enable_etime\": \"23:59\",\n \"enable_etimes\": null,\n \"enable_days_of_week\": [\n \"1\",\n \"2\",\n \"3\",\n \"4\",\n \"5\",\n \"6\",\n \"0\"\n ],\n \"enable_days_of_weeks\": null,\n \"enable_in_bg\": 0,\n \"notify_recovered\": 1,\n \"notify_channels\": [],\n \"notify_groups_obj\": null,\n \"notify_groups\": null,\n \"notify_repeat_step\": 60,\n \"notify_max_number\": 0,\n \"recover_duration\": 0,\n \"callbacks\": [],\n \"runbook_url\": \"\",\n \"append_tags\": [],\n \"annotations\": null,\n \"extra_config\": null,\n \"create_at\": 0,\n \"create_by\": \"\",\n \"update_at\": 0,\n \"update_by\": \"\",\n \"uuid\": 1717556327657626000\n },\n {\n \"id\": 0,\n \"group_id\": 0,\n \"cate\": \"\",\n \"datasource_ids\": null,\n \"cluster\": \"\",\n \"name\": \"主机时钟偏差\",\n \"note\": \"主机时钟偏差 (instance {{ $labels.instance }})\",\n \"prod\": \"\",\n \"algorithm\": \"\",\n \"algo_params\": null,\n \"delay\": 0,\n \"severity\": 2,\n \"severities\": null,\n \"disabled\": 0,\n \"prom_for_duration\": 120,\n \"prom_ql\": \"(node_timex_offset_seconds \\u003e 0.05 and deriv(node_timex_offset_seconds[5m]) \\u003e= 0) or (node_timex_offset_seconds \\u003c -0.05 and deriv(node_timex_offset_seconds[5m]) \\u003c= 0)\",\n \"rule_config\": null,\n \"prom_eval_interval\": 15,\n \"enable_stime\": \"00:00\",\n \"enable_stimes\": null,\n \"enable_etime\": \"23:59\",\n \"enable_etimes\": null,\n \"enable_days_of_week\": [\n \"1\",\n \"2\",\n \"3\",\n \"4\",\n \"5\",\n \"6\",\n \"0\"\n ],\n \"enable_days_of_weeks\": null,\n \"enable_in_bg\": 0,\n \"notify_recovered\": 1,\n \"notify_channels\": [],\n \"notify_groups_obj\": null,\n \"notify_groups\": null,\n \"notify_repeat_step\": 60,\n \"notify_max_number\": 0,\n \"recover_duration\": 0,\n \"callbacks\": [],\n \"runbook_url\": \"\",\n \"append_tags\": [],\n \"annotations\": null,\n \"extra_config\": null,\n \"create_at\": 0,\n \"create_by\": \"\",\n \"update_at\": 0,\n \"update_by\": \"\",\n \"uuid\": 1717556327658114000\n },\n {\n \"id\": 0,\n \"group_id\": 0,\n \"cate\": \"\",\n \"datasource_ids\": null,\n \"cluster\": \"\",\n \"name\": \"主机时钟不同步\",\n \"note\": \"主机时钟不同步 (instance {{ $labels.instance }})\",\n \"prod\": \"\",\n \"algorithm\": \"\",\n \"algo_params\": null,\n \"delay\": 0,\n \"severity\": 2,\n \"severities\": null,\n \"disabled\": 0,\n \"prom_for_duration\": 120,\n \"prom_ql\": \"min_over_time(node_timex_sync_status[1m]) == 0 and node_timex_maxerror_seconds \\u003e= 16\",\n \"rule_config\": null,\n \"prom_eval_interval\": 15,\n \"enable_stime\": \"00:00\",\n \"enable_stimes\": null,\n \"enable_etime\": \"23:59\",\n \"enable_etimes\": null,\n \"enable_days_of_week\": [\n \"1\",\n \"2\",\n \"3\",\n \"4\",\n \"5\",\n \"6\",\n \"0\"\n ],\n \"enable_days_of_weeks\": null,\n \"enable_in_bg\": 0,\n \"notify_recovered\": 1,\n \"notify_channels\": [],\n \"notify_groups_obj\": null,\n \"notify_groups\": null,\n \"notify_repeat_step\": 60,\n \"notify_max_number\": 0,\n \"recover_duration\": 0,\n \"callbacks\": [],\n \"runbook_url\": \"\",\n \"append_tags\": [],\n \"annotations\": null,\n \"extra_config\": null,\n \"create_at\": 0,\n \"create_by\": \"\",\n \"update_at\": 0,\n \"update_by\": \"\",\n \"uuid\": 1717556327658621000\n },\n {\n \"id\": 0,\n \"group_id\": 0,\n \"cate\": \"\",\n \"datasource_ids\": null,\n \"cluster\": \"\",\n \"name\": \"节点文件系统空间填满-S2\",\n \"note\": \"Filesystem on {{ $labels.device }} at {{ $labels.instance }} has only {{ printf \\\"%.2f\\\" $value }}% available space left and is filling up.\",\n \"prod\": \"\",\n \"algorithm\": \"\",\n \"algo_params\": null,\n \"delay\": 0,\n \"severity\": 2,\n \"severities\": null,\n \"disabled\": 0,\n \"prom_for_duration\": 3600,\n \"prom_ql\": \"(\\n node_filesystem_avail_bytes{job=\\\"node-exporter\\\",fstype!=\\\"\\\"} / node_filesystem_size_bytes{job=\\\"node-exporter\\\",fstype!=\\\"\\\"} * 100 \\u003c 40\\nand\\n predict_linear(node_filesystem_avail_bytes{job=\\\"node-exporter\\\",fstype!=\\\"\\\"}[6h], 24*60*60) \\u003c 0\\nand\\n node_filesystem_readonly{job=\\\"node-exporter\\\",fstype!=\\\"\\\"} == 0\\n)\\n\",\n \"rule_config\": null,\n \"prom_eval_interval\": 15,\n \"enable_stime\": \"00:00\",\n \"enable_stimes\": null,\n \"enable_etime\": \"23:59\",\n \"enable_etimes\": null,\n \"enable_days_of_week\": [\n \"1\",\n \"2\",\n \"3\",\n \"4\",\n \"5\",\n \"6\",\n \"0\"\n ],\n \"enable_days_of_weeks\": null,\n \"enable_in_bg\": 0,\n \"notify_recovered\": 1,\n \"notify_channels\": [],\n \"notify_groups_obj\": null,\n \"notify_groups\": null,\n \"notify_repeat_step\": 60,\n \"notify_max_number\": 0,\n \"recover_duration\": 0,\n \"callbacks\": [],\n \"runbook_url\": \"\",\n \"append_tags\": [],\n \"annotations\": null,\n \"extra_config\": null,\n \"create_at\": 0,\n \"create_by\": \"\",\n \"update_at\": 0,\n \"update_by\": \"\",\n \"uuid\": 1717556327659253000\n },\n {\n \"id\": 0,\n \"group_id\": 0,\n \"cate\": \"\",\n \"datasource_ids\": null,\n \"cluster\": \"\",\n \"name\": \"节点文件系统空间填满-S1\",\n \"note\": \"Filesystem on {{ $labels.device }} at {{ $labels.instance }} has only {{ printf \\\"%.2f\\\" $value }}% available space left and is filling up fast.\",\n \"prod\": \"\",\n \"algorithm\": \"\",\n \"algo_params\": null,\n \"delay\": 0,\n \"severity\": 1,\n \"severities\": null,\n \"disabled\": 0,\n \"prom_for_duration\": 3600,\n \"prom_ql\": \"(\\n node_filesystem_avail_bytes{job=\\\"node-exporter\\\",fstype!=\\\"\\\"} / node_filesystem_size_bytes{job=\\\"node-exporter\\\",fstype!=\\\"\\\"} * 100 \\u003c 15\\nand\\n predict_linear(node_filesystem_avail_bytes{job=\\\"node-exporter\\\",fstype!=\\\"\\\"}[6h], 4*60*60) \\u003c 0\\nand\\n node_filesystem_readonly{job=\\\"node-exporter\\\",fstype!=\\\"\\\"} == 0\\n)\\n\",\n \"rule_config\": null,\n \"prom_eval_interval\": 15,\n \"enable_stime\": \"00:00\",\n \"enable_stimes\": null,\n \"enable_etime\": \"23:59\",\n \"enable_etimes\": null,\n \"enable_days_of_week\": [\n \"1\",\n \"2\",\n \"3\",\n \"4\",\n \"5\",\n \"6\",\n \"0\"\n ],\n \"enable_days_of_weeks\": null,\n \"enable_in_bg\": 0,\n \"notify_recovered\": 1,\n \"notify_channels\": [],\n \"notify_groups_obj\": null,\n \"notify_groups\": null,\n \"notify_repeat_step\": 60,\n \"notify_max_number\": 0,\n \"recover_duration\": 0,\n \"callbacks\": [],\n \"runbook_url\": \"\",\n \"append_tags\": [],\n \"annotations\": null,\n \"extra_config\": null,\n \"create_at\": 0,\n \"create_by\": \"\",\n \"update_at\": 0,\n \"update_by\": \"\",\n \"uuid\": 1717556327659712000\n },\n {\n \"id\": 0,\n \"group_id\": 0,\n \"cate\": \"\",\n \"datasource_ids\": null,\n \"cluster\": \"\",\n \"name\": \"节点磁盘快满了-S2-space-5\",\n \"note\": \"Filesystem on {{ $labels.device }} at {{ $labels.instance }} has only {{ printf \\\"%.2f\\\" $value }}% available space left.\",\n \"prod\": \"\",\n \"algorithm\": \"\",\n \"algo_params\": null,\n \"delay\": 0,\n \"severity\": 2,\n \"severities\": null,\n \"disabled\": 0,\n \"prom_for_duration\": 3600,\n \"prom_ql\": \"(\\n node_filesystem_avail_bytes{job=\\\"node-exporter\\\",fstype!=\\\"\\\"} / node_filesystem_size_bytes{job=\\\"node-exporter\\\",fstype!=\\\"\\\"} * 100 \\u003c 5\\nand\\n node_filesystem_readonly{job=\\\"node-exporter\\\",fstype!=\\\"\\\"} == 0\\n)\\n\",\n \"rule_config\": null,\n \"prom_eval_interval\": 15,\n \"enable_stime\": \"00:00\",\n \"enable_stimes\": null,\n \"enable_etime\": \"23:59\",\n \"enable_etimes\": null,\n \"enable_days_of_week\": [\n \"1\",\n \"2\",\n \"3\",\n \"4\",\n \"5\",\n \"6\",\n \"0\"\n ],\n \"enable_days_of_weeks\": null,\n \"enable_in_bg\": 0,\n \"notify_recovered\": 1,\n \"notify_channels\": [],\n \"notify_groups_obj\": null,\n \"notify_groups\": null,\n \"notify_repeat_step\": 60,\n \"notify_max_number\": 0,\n \"recover_duration\": 0,\n \"callbacks\": [],\n \"runbook_url\": \"\",\n \"append_tags\": [],\n \"annotations\": null,\n \"extra_config\": null,\n \"create_at\": 0,\n \"create_by\": \"\",\n \"update_at\": 0,\n \"update_by\": \"\",\n \"uuid\": 1717556327660233000\n },\n {\n \"id\": 0,\n \"group_id\": 0,\n \"cate\": \"\",\n \"datasource_ids\": null,\n \"cluster\": \"\",\n \"name\": \"节点磁盘快满了-S1-space-3\",\n \"note\": \"Filesystem on {{ $labels.device }} at {{ $labels.instance }} has only {{ printf \\\"%.2f\\\" $value }}% available space left.\",\n \"prod\": \"\",\n \"algorithm\": \"\",\n \"algo_params\": null,\n \"delay\": 0,\n \"severity\": 1,\n \"severities\": null,\n \"disabled\": 0,\n \"prom_for_duration\": 3600,\n \"prom_ql\": \"(\\n node_filesystem_avail_bytes{job=\\\"node-exporter\\\",fstype!=\\\"\\\"} / node_filesystem_size_bytes{job=\\\"node-exporter\\\",fstype!=\\\"\\\"} * 100 \\u003c 3\\nand\\n node_filesystem_readonly{job=\\\"node-exporter\\\",fstype!=\\\"\\\"} == 0\\n)\\n\",\n \"rule_config\": null,\n \"prom_eval_interval\": 15,\n \"enable_stime\": \"00:00\",\n \"enable_stimes\": null,\n \"enable_etime\": \"23:59\",\n \"enable_etimes\": null,\n \"enable_days_of_week\": [\n \"1\",\n \"2\",\n \"3\",\n \"4\",\n \"5\",\n \"6\",\n \"0\"\n ],\n \"enable_days_of_weeks\": null,\n \"enable_in_bg\": 0,\n \"notify_recovered\": 1,\n \"notify_channels\": [],\n \"notify_groups_obj\": null,\n \"notify_groups\": null,\n \"notify_repeat_step\": 60,\n \"notify_max_number\": 0,\n \"recover_duration\": 0,\n \"callbacks\": [],\n \"runbook_url\": \"\",\n \"append_tags\": [],\n \"annotations\": null,\n \"extra_config\": null,\n \"create_at\": 0,\n \"create_by\": \"\",\n \"update_at\": 0,\n \"update_by\": \"\",\n \"uuid\": 1717556327660700000\n },\n {\n \"id\": 0,\n \"group_id\": 0,\n \"cate\": \"\",\n \"datasource_ids\": null,\n \"cluster\": \"\",\n \"name\": \"节点磁盘快满了-S2-inodes-40\",\n \"note\": \"Filesystem on {{ $labels.device }} at {{ $labels.instance }} has only {{ printf \\\"%.2f\\\" $value }}% available inodes left and is filling up.\",\n \"prod\": \"\",\n \"algorithm\": \"\",\n \"algo_params\": null,\n \"delay\": 0,\n \"severity\": 2,\n \"severities\": null,\n \"disabled\": 0,\n \"prom_for_duration\": 3600,\n \"prom_ql\": \"(\\n node_filesystem_files_free{job=\\\"node-exporter\\\",fstype!=\\\"\\\"} / node_filesystem_files{job=\\\"node-exporter\\\",fstype!=\\\"\\\"} * 100 \\u003c 40\\nand\\n predict_linear(node_filesystem_files_free{job=\\\"node-exporter\\\",fstype!=\\\"\\\"}[6h], 24*60*60) \\u003c 0\\nand\\n node_filesystem_readonly{job=\\\"node-exporter\\\",fstype!=\\\"\\\"} == 0\\n)\\n\",\n \"rule_config\": null,\n \"prom_eval_interval\": 15,\n \"enable_stime\": \"00:00\",\n \"enable_stimes\": null,\n \"enable_etime\": \"23:59\",\n \"enable_etimes\": null,\n \"enable_days_of_week\": [\n \"1\",\n \"2\",\n \"3\",\n \"4\",\n \"5\",\n \"6\",\n \"0\"\n ],\n \"enable_days_of_weeks\": null,\n \"enable_in_bg\": 0,\n \"notify_recovered\": 1,\n \"notify_channels\": [],\n \"notify_groups_obj\": null,\n \"notify_groups\": null,\n \"notify_repeat_step\": 60,\n \"notify_max_number\": 0,\n \"recover_duration\": 0,\n \"callbacks\": [],\n \"runbook_url\": \"\",\n \"append_tags\": [],\n \"annotations\": null,\n \"extra_config\": null,\n \"create_at\": 0,\n \"create_by\": \"\",\n \"update_at\": 0,\n \"update_by\": \"\",\n \"uuid\": 1717556327661181000\n },\n {\n \"id\": 0,\n \"group_id\": 0,\n \"cate\": \"\",\n \"datasource_ids\": null,\n \"cluster\": \"\",\n \"name\": \"节点磁盘快满了-S1-inodes-20\",\n \"note\": \"Filesystem on {{ $labels.device }} at {{ $labels.instance }} has only {{ printf \\\"%.2f\\\" $value }}% available inodes left and is filling up fast.\",\n \"prod\": \"\",\n \"algorithm\": \"\",\n \"algo_params\": null,\n \"delay\": 0,\n \"severity\": 1,\n \"severities\": null,\n \"disabled\": 0,\n \"prom_for_duration\": 3600,\n \"prom_ql\": \"(\\n node_filesystem_files_free{job=\\\"node-exporter\\\",fstype!=\\\"\\\"} / node_filesystem_files{job=\\\"node-exporter\\\",fstype!=\\\"\\\"} * 100 \\u003c 20\\nand\\n predict_linear(node_filesystem_files_free{job=\\\"node-exporter\\\",fstype!=\\\"\\\"}[6h], 4*60*60) \\u003c 0\\nand\\n node_filesystem_readonly{job=\\\"node-exporter\\\",fstype!=\\\"\\\"} == 0\\n)\\n\",\n \"rule_config\": null,\n \"prom_eval_interval\": 15,\n \"enable_stime\": \"00:00\",\n \"enable_stimes\": null,\n \"enable_etime\": \"23:59\",\n \"enable_etimes\": null,\n \"enable_days_of_week\": [\n \"1\",\n \"2\",\n \"3\",\n \"4\",\n \"5\",\n \"6\",\n \"0\"\n ],\n \"enable_days_of_weeks\": null,\n \"enable_in_bg\": 0,\n \"notify_recovered\": 1,\n \"notify_channels\": [],\n \"notify_groups_obj\": null,\n \"notify_groups\": null,\n \"notify_repeat_step\": 60,\n \"notify_max_number\": 0,\n \"recover_duration\": 0,\n \"callbacks\": [],\n \"runbook_url\": \"\",\n \"append_tags\": [],\n \"annotations\": null,\n \"extra_config\": null,\n \"create_at\": 0,\n \"create_by\": \"\",\n \"update_at\": 0,\n \"update_by\": \"\",\n \"uuid\": 1717556327661660000\n },\n {\n \"id\": 0,\n \"group_id\": 0,\n \"cate\": \"\",\n \"datasource_ids\": null,\n \"cluster\": \"\",\n \"name\": \"节点磁盘快满了-S2-inodes-5\",\n \"note\": \"Filesystem on {{ $labels.device }} at {{ $labels.instance }} has only {{ printf \\\"%.2f\\\" $value }}% available inodes left.\",\n \"prod\": \"\",\n \"algorithm\": \"\",\n \"algo_params\": null,\n \"delay\": 0,\n \"severity\": 2,\n \"severities\": null,\n \"disabled\": 0,\n \"prom_for_duration\": 3600,\n \"prom_ql\": \"(\\n node_filesystem_files_free{job=\\\"node-exporter\\\",fstype!=\\\"\\\"} / node_filesystem_files{job=\\\"node-exporter\\\",fstype!=\\\"\\\"} * 100 \\u003c 5\\nand\\n node_filesystem_readonly{job=\\\"node-exporter\\\",fstype!=\\\"\\\"} == 0\\n)\\n\",\n \"rule_config\": null,\n \"prom_eval_interval\": 15,\n \"enable_stime\": \"00:00\",\n \"enable_stimes\": null,\n \"enable_etime\": \"23:59\",\n \"enable_etimes\": null,\n \"enable_days_of_week\": [\n \"1\",\n \"2\",\n \"3\",\n \"4\",\n \"5\",\n \"6\",\n \"0\"\n ],\n \"enable_days_of_weeks\": null,\n \"enable_in_bg\": 0,\n \"notify_recovered\": 1,\n \"notify_channels\": [],\n \"notify_groups_obj\": null,\n \"notify_groups\": null,\n \"notify_repeat_step\": 60,\n \"notify_max_number\": 0,\n \"recover_duration\": 0,\n \"callbacks\": [],\n \"runbook_url\": \"\",\n \"append_tags\": [],\n \"annotations\": null,\n \"extra_config\": null,\n \"create_at\": 0,\n \"create_by\": \"\",\n \"update_at\": 0,\n \"update_by\": \"\",\n \"uuid\": 1717556327662110000\n },\n {\n \"id\": 0,\n \"group_id\": 0,\n \"cate\": \"\",\n \"datasource_ids\": null,\n \"cluster\": \"\",\n \"name\": \"节点磁盘快满了-S1-inodes-3\",\n \"note\": \"Filesystem on {{ $labels.device }} at {{ $labels.instance }} has only {{ printf \\\"%.2f\\\" $value }}% available inodes left.\",\n \"prod\": \"\",\n \"algorithm\": \"\",\n \"algo_params\": null,\n \"delay\": 0,\n \"severity\": 1,\n \"severities\": null,\n \"disabled\": 0,\n \"prom_for_duration\": 3600,\n \"prom_ql\": \"(\\n node_filesystem_files_free{job=\\\"node-exporter\\\",fstype!=\\\"\\\"} / node_filesystem_files{job=\\\"node-exporter\\\",fstype!=\\\"\\\"} * 100 \\u003c 3\\nand\\n node_filesystem_readonly{job=\\\"node-exporter\\\",fstype!=\\\"\\\"} == 0\\n)\\n\",\n \"rule_config\": null,\n \"prom_eval_interval\": 15,\n \"enable_stime\": \"00:00\",\n \"enable_stimes\": null,\n \"enable_etime\": \"23:59\",\n \"enable_etimes\": null,\n \"enable_days_of_week\": [\n \"1\",\n \"2\",\n \"3\",\n \"4\",\n \"5\",\n \"6\",\n \"0\"\n ],\n \"enable_days_of_weeks\": null,\n \"enable_in_bg\": 0,\n \"notify_recovered\": 1,\n \"notify_channels\": [],\n \"notify_groups_obj\": null,\n \"notify_groups\": null,\n \"notify_repeat_step\": 60,\n \"notify_max_number\": 0,\n \"recover_duration\": 0,\n \"callbacks\": [],\n \"runbook_url\": \"\",\n \"append_tags\": [],\n \"annotations\": null,\n \"extra_config\": null,\n \"create_at\": 0,\n \"create_by\": \"\",\n \"update_at\": 0,\n \"update_by\": \"\",\n \"uuid\": 1717556327662492000\n },\n {\n \"id\": 0,\n \"group_id\": 0,\n \"cate\": \"\",\n \"datasource_ids\": null,\n \"cluster\": \"\",\n \"name\": \"使用的节点Conntrack条目数量高\",\n \"note\": \"{{ $value | humanizePercentage }} of conntrack entries are used.\",\n \"prod\": \"\",\n \"algorithm\": \"\",\n \"algo_params\": null,\n \"delay\": 0,\n \"severity\": 2,\n \"severities\": null,\n \"disabled\": 0,\n \"prom_for_duration\": 0,\n \"prom_ql\": \"(node_nf_conntrack_entries / node_nf_conntrack_entries_limit) \\u003e 0.75\\n\",\n \"rule_config\": null,\n \"prom_eval_interval\": 15,\n \"enable_stime\": \"00:00\",\n \"enable_stimes\": null,\n \"enable_etime\": \"23:59\",\n \"enable_etimes\": null,\n \"enable_days_of_week\": [\n \"1\",\n \"2\",\n \"3\",\n \"4\",\n \"5\",\n \"6\",\n \"0\"\n ],\n \"enable_days_of_weeks\": null,\n \"enable_in_bg\": 0,\n \"notify_recovered\": 1,\n \"notify_channels\": [],\n \"notify_groups_obj\": null,\n \"notify_groups\": null,\n \"notify_repeat_step\": 60,\n \"notify_max_number\": 0,\n \"recover_duration\": 0,\n \"callbacks\": [],\n \"runbook_url\": \"\",\n \"append_tags\": [],\n \"annotations\": null,\n \"extra_config\": null,\n \"create_at\": 0,\n \"create_by\": \"\",\n \"update_at\": 0,\n \"update_by\": \"\",\n \"uuid\": 1717556327662954000\n },\n {\n \"id\": 0,\n \"group_id\": 0,\n \"cate\": \"\",\n \"datasource_ids\": null,\n \"cluster\": \"\",\n \"name\": \"节点文本文件收集器抓取错误\",\n \"note\": \"Node Exporter text file collector failed to scrape.\",\n \"prod\": \"\",\n \"algorithm\": \"\",\n \"algo_params\": null,\n \"delay\": 0,\n \"severity\": 2,\n \"severities\": null,\n \"disabled\": 0,\n \"prom_for_duration\": 0,\n \"prom_ql\": \"node_textfile_scrape_error{job=\\\"node-exporter\\\"} == 1\\n\",\n \"rule_config\": null,\n \"prom_eval_interval\": 15,\n \"enable_stime\": \"00:00\",\n \"enable_stimes\": null,\n \"enable_etime\": \"23:59\",\n \"enable_etimes\": null,\n \"enable_days_of_week\": [\n \"1\",\n \"2\",\n \"3\",\n \"4\",\n \"5\",\n \"6\",\n \"0\"\n ],\n \"enable_days_of_weeks\": null,\n \"enable_in_bg\": 0,\n \"notify_recovered\": 1,\n \"notify_channels\": [],\n \"notify_groups_obj\": null,\n \"notify_groups\": null,\n \"notify_repeat_step\": 60,\n \"notify_max_number\": 0,\n \"recover_duration\": 0,\n \"callbacks\": [],\n \"runbook_url\": \"\",\n \"append_tags\": [],\n \"annotations\": null,\n \"extra_config\": null,\n \"create_at\": 0,\n \"create_by\": \"\",\n \"update_at\": 0,\n \"update_by\": \"\",\n \"uuid\": 1717556327663328000\n },\n {\n \"id\": 0,\n \"group_id\": 0,\n \"cate\": \"\",\n \"datasource_ids\": null,\n \"cluster\": \"\",\n \"name\": \"节点网络接口抖动\",\n \"note\": \"Network interface \\\"{{ $labels.device }}\\\" changing it's up status often on node-exporter {{ $labels.namespace }}/{{ $labels.pod }}\\\"\",\n \"prod\": \"\",\n \"algorithm\": \"\",\n \"algo_params\": null,\n \"delay\": 0,\n \"severity\": 2,\n \"severities\": null,\n \"disabled\": 0,\n \"prom_for_duration\": 120,\n \"prom_ql\": \"changes(node_network_up{job=\\\"node-exporter\\\",device!~\\\"veth.+\\\"}[2m]) \\u003e 2\\n\",\n \"rule_config\": null,\n \"prom_eval_interval\": 15,\n \"enable_stime\": \"00:00\",\n \"enable_stimes\": null,\n \"enable_etime\": \"23:59\",\n \"enable_etimes\": null,\n \"enable_days_of_week\": [\n \"1\",\n \"2\",\n \"3\",\n \"4\",\n \"5\",\n \"6\",\n \"0\"\n ],\n \"enable_days_of_weeks\": null,\n \"enable_in_bg\": 0,\n \"notify_recovered\": 1,\n \"notify_channels\": [],\n \"notify_groups_obj\": null,\n \"notify_groups\": null,\n \"notify_repeat_step\": 60,\n \"notify_max_number\": 0,\n \"recover_duration\": 0,\n \"callbacks\": [],\n \"runbook_url\": \"\",\n \"append_tags\": [],\n \"annotations\": null,\n \"extra_config\": null,\n \"create_at\": 0,\n \"create_by\": \"\",\n \"update_at\": 0,\n \"update_by\": \"\",\n \"uuid\": 1717556327663731000\n }\n]"
},
{
"path": "integrations/Kubernetes/alerts/prometheus-operator.json",
"content": "[\n {\n \"id\": 0,\n \"group_id\": 0,\n \"cate\": \"prometheus\",\n \"datasource_ids\": [\n 0\n ],\n \"cluster\": \"\",\n \"name\": \"ConfigReloaderSidecarErrors\",\n \"note\": \"Errors encountered while the {{$labels.pod}} config-reloader sidecar attempts to sync config in {{$labels.namespace}} namespace.\\nAs a result, configuration for service running in {{$labels.pod}} may be stale and cannot be updated anymore.\",\n \"prod\": \"metric\",\n \"algorithm\": \"\",\n \"algo_params\": null,\n \"delay\": 0,\n \"severity\": 2,\n \"severities\": [\n 2\n ],\n \"disabled\": 1,\n \"prom_for_duration\": 600,\n \"prom_ql\": \"max_over_time(reloader_last_reload_successful{namespace=~\\\".+\\\"}[5m]) == 0\\n\",\n \"rule_config\": {\n \"algo_params\": null,\n \"inhibit\": false,\n \"prom_ql\": \"\",\n \"queries\": [\n {\n \"prom_ql\": \"max_over_time(reloader_last_reload_successful{namespace=~\\\".+\\\"}[5m]) == 0\\n\",\n \"severity\": 2\n }\n ],\n \"severity\": 0\n },\n \"prom_eval_interval\": 15,\n \"enable_stime\": \"00:00\",\n \"enable_stimes\": [\n \"00:00\"\n ],\n \"enable_etime\": \"23:59\",\n \"enable_etimes\": [\n \"23:59\"\n ],\n \"enable_days_of_week\": [\n \"1\",\n \"2\",\n \"3\",\n \"4\",\n \"5\",\n \"6\",\n \"0\"\n ],\n \"enable_days_of_weeks\": [\n [\n \"1\",\n \"2\",\n \"3\",\n \"4\",\n \"5\",\n \"6\",\n \"0\"\n ]\n ],\n \"enable_in_bg\": 0,\n \"notify_recovered\": 1,\n \"notify_channels\": [],\n \"notify_groups_obj\": null,\n \"notify_groups\": null,\n \"notify_repeat_step\": 60,\n \"notify_max_number\": 0,\n \"recover_duration\": 0,\n \"callbacks\": [],\n \"runbook_url\": \"\",\n \"append_tags\": [],\n \"annotations\": null,\n \"extra_config\": null,\n \"create_at\": 0,\n \"create_by\": \"\",\n \"update_at\": 0,\n \"update_by\": \"\",\n \"uuid\": 1717556327664922000\n },\n {\n \"id\": 0,\n \"group_id\": 0,\n \"cate\": \"prometheus\",\n \"datasource_ids\": [\n 0\n ],\n \"cluster\": \"\",\n \"name\": \"PrometheusOperatorListErrors\",\n \"note\": \"Errors while performing List operations in controller {{$labels.controller}} in {{$labels.namespace}} namespace.\",\n \"prod\": \"metric\",\n \"algorithm\": \"\",\n \"algo_params\": null,\n \"delay\": 0,\n \"severity\": 2,\n \"severities\": [\n 2\n ],\n \"disabled\": 1,\n \"prom_for_duration\": 900,\n \"prom_ql\": \"(sum by (cluster,controller,namespace) (rate(prometheus_operator_list_operations_failed_total{job=\\\"prometheus-operator\\\",namespace=\\\"monitoring\\\"}[10m])) / sum by (cluster,controller,namespace) (rate(prometheus_operator_list_operations_total{job=\\\"prometheus-operator\\\",namespace=\\\"monitoring\\\"}[10m]))) \\u003e 0.4\\n\",\n \"rule_config\": {\n \"algo_params\": null,\n \"inhibit\": false,\n \"prom_ql\": \"\",\n \"queries\": [\n {\n \"prom_ql\": \"(sum by (cluster,controller,namespace) (rate(prometheus_operator_list_operations_failed_total{job=\\\"prometheus-operator\\\",namespace=\\\"monitoring\\\"}[10m])) / sum by (cluster,controller,namespace) (rate(prometheus_operator_list_operations_total{job=\\\"prometheus-operator\\\",namespace=\\\"monitoring\\\"}[10m]))) \\u003e 0.4\\n\",\n \"severity\": 2\n }\n ],\n \"severity\": 0\n },\n \"prom_eval_interval\": 15,\n \"enable_stime\": \"00:00\",\n \"enable_stimes\": [\n \"00:00\"\n ],\n \"enable_etime\": \"23:59\",\n \"enable_etimes\": [\n \"23:59\"\n ],\n \"enable_days_of_week\": [\n \"1\",\n \"2\",\n \"3\",\n \"4\",\n \"5\",\n \"6\",\n \"0\"\n ],\n \"enable_days_of_weeks\": [\n [\n \"1\",\n \"2\",\n \"3\",\n \"4\",\n \"5\",\n \"6\",\n \"0\"\n ]\n ],\n \"enable_in_bg\": 0,\n \"notify_recovered\": 1,\n \"notify_channels\": [],\n \"notify_groups_obj\": null,\n \"notify_groups\": null,\n \"notify_repeat_step\": 60,\n \"notify_max_number\": 0,\n \"recover_duration\": 0,\n \"callbacks\": [],\n \"runbook_url\": \"\",\n \"append_tags\": [],\n \"annotations\": null,\n \"extra_config\": null,\n \"create_at\": 0,\n \"create_by\": \"\",\n \"update_at\": 0,\n \"update_by\": \"\",\n \"uuid\": 1717556327665326000\n },\n {\n \"id\": 0,\n \"group_id\": 0,\n \"cate\": \"prometheus\",\n \"datasource_ids\": [\n 0\n ],\n \"cluster\": \"\",\n \"name\": \"PrometheusOperatorNodeLookupErrors\",\n \"note\": \"Errors while reconciling Prometheus in {{ $labels.namespace }} Namespace.\",\n \"prod\": \"metric\",\n \"algorithm\": \"\",\n \"algo_params\": null,\n \"delay\": 0,\n \"severity\": 2,\n \"severities\": [\n 2\n ],\n \"disabled\": 1,\n \"prom_for_duration\": 600,\n \"prom_ql\": \"rate(prometheus_operator_node_address_lookup_errors_total{job=\\\"prometheus-operator\\\",namespace=\\\"monitoring\\\"}[5m]) \\u003e 0.1\\n\",\n \"rule_config\": {\n \"algo_params\": null,\n \"inhibit\": false,\n \"prom_ql\": \"\",\n \"queries\": [\n {\n \"prom_ql\": \"rate(prometheus_operator_node_address_lookup_errors_total{job=\\\"prometheus-operator\\\",namespace=\\\"monitoring\\\"}[5m]) \\u003e 0.1\\n\",\n \"severity\": 2\n }\n ],\n \"severity\": 0\n },\n \"prom_eval_interval\": 15,\n \"enable_stime\": \"00:00\",\n \"enable_stimes\": [\n \"00:00\"\n ],\n \"enable_etime\": \"23:59\",\n \"enable_etimes\": [\n \"23:59\"\n ],\n \"enable_days_of_week\": [\n \"1\",\n \"2\",\n \"3\",\n \"4\",\n \"5\",\n \"6\",\n \"0\"\n ],\n \"enable_days_of_weeks\": [\n [\n \"1\",\n \"2\",\n \"3\",\n \"4\",\n \"5\",\n \"6\",\n \"0\"\n ]\n ],\n \"enable_in_bg\": 0,\n \"notify_recovered\": 1,\n \"notify_channels\": [],\n \"notify_groups_obj\": null,\n \"notify_groups\": null,\n \"notify_repeat_step\": 60,\n \"notify_max_number\": 0,\n \"recover_duration\": 0,\n \"callbacks\": [],\n \"runbook_url\": \"\",\n \"append_tags\": [],\n \"annotations\": null,\n \"extra_config\": null,\n \"create_at\": 0,\n \"create_by\": \"\",\n \"update_at\": 0,\n \"update_by\": \"\",\n \"uuid\": 1717556327665709000\n },\n {\n \"id\": 0,\n \"group_id\": 0,\n \"cate\": \"prometheus\",\n \"datasource_ids\": [\n 0\n ],\n \"cluster\": \"\",\n \"name\": \"PrometheusOperatorNotReady\",\n \"note\": \"Prometheus operator in {{ $labels.namespace }} namespace isn't ready to reconcile {{ $labels.controller }} resources.\",\n \"prod\": \"metric\",\n \"algorithm\": \"\",\n \"algo_params\": null,\n \"delay\": 0,\n \"severity\": 2,\n \"severities\": [\n 2\n ],\n \"disabled\": 1,\n \"prom_for_duration\": 300,\n \"prom_ql\": \"min by (cluster,controller,namespace) (max_over_time(prometheus_operator_ready{job=\\\"prometheus-operator\\\",namespace=\\\"monitoring\\\"}[5m]) == 0)\\n\",\n \"rule_config\": {\n \"algo_params\": null,\n \"inhibit\": false,\n \"prom_ql\": \"\",\n \"queries\": [\n {\n \"prom_ql\": \"min by (cluster,controller,namespace) (max_over_time(prometheus_operator_ready{job=\\\"prometheus-operator\\\",namespace=\\\"monitoring\\\"}[5m]) == 0)\\n\",\n \"severity\": 2\n }\n ],\n \"severity\": 0\n },\n \"prom_eval_interval\": 15,\n \"enable_stime\": \"00:00\",\n \"enable_stimes\": [\n \"00:00\"\n ],\n \"enable_etime\": \"23:59\",\n \"enable_etimes\": [\n \"23:59\"\n ],\n \"enable_days_of_week\": [\n \"1\",\n \"2\",\n \"3\",\n \"4\",\n \"5\",\n \"6\",\n \"0\"\n ],\n \"enable_days_of_weeks\": [\n [\n \"1\",\n \"2\",\n \"3\",\n \"4\",\n \"5\",\n \"6\",\n \"0\"\n ]\n ],\n \"enable_in_bg\": 0,\n \"notify_recovered\": 1,\n \"notify_channels\": [],\n \"notify_groups_obj\": null,\n \"notify_groups\": null,\n \"notify_repeat_step\": 60,\n \"notify_max_number\": 0,\n \"recover_duration\": 0,\n \"callbacks\": [],\n \"runbook_url\": \"\",\n \"append_tags\": [],\n \"annotations\": null,\n \"extra_config\": null,\n \"create_at\": 0,\n \"create_by\": \"\",\n \"update_at\": 0,\n \"update_by\": \"\",\n \"uuid\": 1717556327666207000\n },\n {\n \"id\": 0,\n \"group_id\": 0,\n \"cate\": \"prometheus\",\n \"datasource_ids\": [\n 0\n ],\n \"cluster\": \"\",\n \"name\": \"PrometheusOperatorReconcileErrors\",\n \"note\": \"{{ $value | humanizePercentage }} of reconciling operations failed for {{ $labels.controller }} controller in {{ $labels.namespace }} namespace.\",\n \"prod\": \"metric\",\n \"algorithm\": \"\",\n \"algo_params\": null,\n \"delay\": 0,\n \"severity\": 2,\n \"severities\": [\n 2\n ],\n \"disabled\": 1,\n \"prom_for_duration\": 600,\n \"prom_ql\": \"(sum by (cluster,controller,namespace) (rate(prometheus_operator_reconcile_errors_total{job=\\\"prometheus-operator\\\",namespace=\\\"monitoring\\\"}[5m]))) / (sum by (cluster,controller,namespace) (rate(prometheus_operator_reconcile_operations_total{job=\\\"prometheus-operator\\\",namespace=\\\"monitoring\\\"}[5m]))) \\u003e 0.1\\n\",\n \"rule_config\": {\n \"algo_params\": null,\n \"inhibit\": false,\n \"prom_ql\": \"\",\n \"queries\": [\n {\n \"prom_ql\": \"(sum by (cluster,controller,namespace) (rate(prometheus_operator_reconcile_errors_total{job=\\\"prometheus-operator\\\",namespace=\\\"monitoring\\\"}[5m]))) / (sum by (cluster,controller,namespace) (rate(prometheus_operator_reconcile_operations_total{job=\\\"prometheus-operator\\\",namespace=\\\"monitoring\\\"}[5m]))) \\u003e 0.1\\n\",\n \"severity\": 2\n }\n ],\n \"severity\": 0\n },\n \"prom_eval_interval\": 15,\n \"enable_stime\": \"00:00\",\n \"enable_stimes\": [\n \"00:00\"\n ],\n \"enable_etime\": \"23:59\",\n \"enable_etimes\": [\n \"23:59\"\n ],\n \"enable_days_of_week\": [\n \"1\",\n \"2\",\n \"3\",\n \"4\",\n \"5\",\n \"6\",\n \"0\"\n ],\n \"enable_days_of_weeks\": [\n [\n \"1\",\n \"2\",\n \"3\",\n \"4\",\n \"5\",\n \"6\",\n \"0\"\n ]\n ],\n \"enable_in_bg\": 0,\n \"notify_recovered\": 1,\n \"notify_channels\": [],\n \"notify_groups_obj\": null,\n \"notify_groups\": null,\n \"notify_repeat_step\": 60,\n \"notify_max_number\": 0,\n \"recover_duration\": 0,\n \"callbacks\": [],\n \"runbook_url\": \"\",\n \"append_tags\": [],\n \"annotations\": null,\n \"extra_config\": null,\n \"create_at\": 0,\n \"create_by\": \"\",\n \"update_at\": 0,\n \"update_by\": \"\",\n \"uuid\": 1717556327666637000\n },\n {\n \"id\": 0,\n \"group_id\": 0,\n \"cate\": \"prometheus\",\n \"datasource_ids\": [\n 0\n ],\n \"cluster\": \"\",\n \"name\": \"PrometheusOperatorRejectedResources\",\n \"note\": \"Prometheus operator in {{ $labels.namespace }} namespace rejected {{ printf \\\"%0.0f\\\" $value }} {{ $labels.controller }}/{{ $labels.resource }} resources.\",\n \"prod\": \"metric\",\n \"algorithm\": \"\",\n \"algo_params\": null,\n \"delay\": 0,\n \"severity\": 2,\n \"severities\": [\n 2\n ],\n \"disabled\": 1,\n \"prom_for_duration\": 300,\n \"prom_ql\": \"min_over_time(prometheus_operator_managed_resources{state=\\\"rejected\\\",job=\\\"prometheus-operator\\\",namespace=\\\"monitoring\\\"}[5m]) \\u003e 0\\n\",\n \"rule_config\": {\n \"algo_params\": null,\n \"inhibit\": false,\n \"prom_ql\": \"\",\n \"queries\": [\n {\n \"prom_ql\": \"min_over_time(prometheus_operator_managed_resources{state=\\\"rejected\\\",job=\\\"prometheus-operator\\\",namespace=\\\"monitoring\\\"}[5m]) \\u003e 0\\n\",\n \"severity\": 2\n }\n ],\n \"severity\": 0\n },\n \"prom_eval_interval\": 15,\n \"enable_stime\": \"00:00\",\n \"enable_stimes\": [\n \"00:00\"\n ],\n \"enable_etime\": \"23:59\",\n \"enable_etimes\": [\n \"23:59\"\n ],\n \"enable_days_of_week\": [\n \"1\",\n \"2\",\n \"3\",\n \"4\",\n \"5\",\n \"6\",\n \"0\"\n ],\n \"enable_days_of_weeks\": [\n [\n \"1\",\n \"2\",\n \"3\",\n \"4\",\n \"5\",\n \"6\",\n \"0\"\n ]\n ],\n \"enable_in_bg\": 0,\n \"notify_recovered\": 1,\n \"notify_channels\": [],\n \"notify_groups_obj\": null,\n \"notify_groups\": null,\n \"notify_repeat_step\": 60,\n \"notify_max_number\": 0,\n \"recover_duration\": 0,\n \"callbacks\": [],\n \"runbook_url\": \"\",\n \"append_tags\": [],\n \"annotations\": null,\n \"extra_config\": null,\n \"create_at\": 0,\n \"create_by\": \"\",\n \"update_at\": 0,\n \"update_by\": \"\",\n \"uuid\": 1717556327667061000\n },\n {\n \"id\": 0,\n \"group_id\": 0,\n \"cate\": \"prometheus\",\n \"datasource_ids\": [\n 0\n ],\n \"cluster\": \"\",\n \"name\": \"PrometheusOperatorSyncFailed\",\n \"note\": \"Controller {{ $labels.controller }} in {{ $labels.namespace }} namespace fails to reconcile {{ $value }} objects.\",\n \"prod\": \"metric\",\n \"algorithm\": \"\",\n \"algo_params\": null,\n \"delay\": 0,\n \"severity\": 2,\n \"severities\": [\n 2\n ],\n \"disabled\": 1,\n \"prom_for_duration\": 600,\n \"prom_ql\": \"min_over_time(prometheus_operator_syncs{status=\\\"failed\\\",job=\\\"prometheus-operator\\\",namespace=\\\"monitoring\\\"}[5m]) \\u003e 0\\n\",\n \"rule_config\": {\n \"algo_params\": null,\n \"inhibit\": false,\n \"prom_ql\": \"\",\n \"queries\": [\n {\n \"prom_ql\": \"min_over_time(prometheus_operator_syncs{status=\\\"failed\\\",job=\\\"prometheus-operator\\\",namespace=\\\"monitoring\\\"}[5m]) \\u003e 0\\n\",\n \"severity\": 2\n }\n ],\n \"severity\": 0\n },\n \"prom_eval_interval\": 15,\n \"enable_stime\": \"00:00\",\n \"enable_stimes\": [\n \"00:00\"\n ],\n \"enable_etime\": \"23:59\",\n \"enable_etimes\": [\n \"23:59\"\n ],\n \"enable_days_of_week\": [\n \"1\",\n \"2\",\n \"3\",\n \"4\",\n \"5\",\n \"6\",\n \"0\"\n ],\n \"enable_days_of_weeks\": [\n [\n \"1\",\n \"2\",\n \"3\",\n \"4\",\n \"5\",\n \"6\",\n \"0\"\n ]\n ],\n \"enable_in_bg\": 0,\n \"notify_recovered\": 1,\n \"notify_channels\": [],\n \"notify_groups_obj\": null,\n \"notify_groups\": null,\n \"notify_repeat_step\": 60,\n \"notify_max_number\": 0,\n \"recover_duration\": 0,\n \"callbacks\": [],\n \"runbook_url\": \"\",\n \"append_tags\": [],\n \"annotations\": null,\n \"extra_config\": null,\n \"create_at\": 0,\n \"create_by\": \"\",\n \"update_at\": 0,\n \"update_by\": \"\",\n \"uuid\": 1717556327667462000\n },\n {\n \"id\": 0,\n \"group_id\": 0,\n \"cate\": \"prometheus\",\n \"datasource_ids\": [\n 0\n ],\n \"cluster\": \"\",\n \"name\": \"PrometheusOperatorWatchErrors\",\n \"note\": \"Errors while performing watch operations in controller {{$labels.controller}} in {{$labels.namespace}} namespace.\",\n \"prod\": \"metric\",\n \"algorithm\": \"\",\n \"algo_params\": null,\n \"delay\": 0,\n \"severity\": 2,\n \"severities\": [\n 2\n ],\n \"disabled\": 1,\n \"prom_for_duration\": 900,\n \"prom_ql\": \"(sum by (cluster,controller,namespace) (rate(prometheus_operator_watch_operations_failed_total{job=\\\"prometheus-operator\\\",namespace=\\\"monitoring\\\"}[5m])) / sum by (cluster,controller,namespace) (rate(prometheus_operator_watch_operations_total{job=\\\"prometheus-operator\\\",namespace=\\\"monitoring\\\"}[5m]))) \\u003e 0.4\\n\",\n \"rule_config\": {\n \"algo_params\": null,\n \"inhibit\": false,\n \"prom_ql\": \"\",\n \"queries\": [\n {\n \"prom_ql\": \"(sum by (cluster,controller,namespace) (rate(prometheus_operator_watch_operations_failed_total{job=\\\"prometheus-operator\\\",namespace=\\\"monitoring\\\"}[5m])) / sum by (cluster,controller,namespace) (rate(prometheus_operator_watch_operations_total{job=\\\"prometheus-operator\\\",namespace=\\\"monitoring\\\"}[5m]))) \\u003e 0.4\\n\",\n \"severity\": 2\n }\n ],\n \"severity\": 0\n },\n \"prom_eval_interval\": 15,\n \"enable_stime\": \"00:00\",\n \"enable_stimes\": [\n \"00:00\"\n ],\n \"enable_etime\": \"23:59\",\n \"enable_etimes\": [\n \"23:59\"\n ],\n \"enable_days_of_week\": [\n \"1\",\n \"2\",\n \"3\",\n \"4\",\n \"5\",\n \"6\",\n \"0\"\n ],\n \"enable_days_of_weeks\": [\n [\n \"1\",\n \"2\",\n \"3\",\n \"4\",\n \"5\",\n \"6\",\n \"0\"\n ]\n ],\n \"enable_in_bg\": 0,\n \"notify_recovered\": 1,\n \"notify_channels\": [],\n \"notify_groups_obj\": null,\n \"notify_groups\": null,\n \"notify_repeat_step\": 60,\n \"notify_max_number\": 0,\n \"recover_duration\": 0,\n \"callbacks\": [],\n \"runbook_url\": \"\",\n \"append_tags\": [],\n \"annotations\": null,\n \"extra_config\": null,\n \"create_at\": 0,\n \"create_by\": \"\",\n \"update_at\": 0,\n \"update_by\": \"\",\n \"uuid\": 1717556327667840000\n }\n]"
},
{
"path": "integrations/Kubernetes/alerts/prometheus.json",
"content": "[\n {\n \"id\": 0,\n \"group_id\": 0,\n \"cate\": \"prometheus\",\n \"datasource_ids\": [\n 0\n ],\n \"cluster\": \"\",\n \"name\": \"ConfigReloaderSidecarErrors\",\n \"note\": \"Errors encountered while the {{$labels.pod}} config-reloader sidecar attempts to sync config in {{$labels.namespace}} namespace.\\nAs a result, configuration for service running in {{$labels.pod}} may be stale and cannot be updated anymore.\",\n \"prod\": \"metric\",\n \"algorithm\": \"\",\n \"algo_params\": null,\n \"delay\": 0,\n \"severity\": 2,\n \"severities\": [\n 2\n ],\n \"disabled\": 1,\n \"prom_for_duration\": 600,\n \"prom_ql\": \"max_over_time(reloader_last_reload_successful{namespace=~\\\".+\\\"}[5m]) == 0\\n\",\n \"rule_config\": {\n \"algo_params\": null,\n \"inhibit\": false,\n \"prom_ql\": \"\",\n \"queries\": [\n {\n \"prom_ql\": \"max_over_time(reloader_last_reload_successful{namespace=~\\\".+\\\"}[5m]) == 0\\n\",\n \"severity\": 2\n }\n ],\n \"severity\": 0\n },\n \"prom_eval_interval\": 15,\n \"enable_stime\": \"00:00\",\n \"enable_stimes\": [\n \"00:00\"\n ],\n \"enable_etime\": \"23:59\",\n \"enable_etimes\": [\n \"23:59\"\n ],\n \"enable_days_of_week\": [\n \"1\",\n \"2\",\n \"3\",\n \"4\",\n \"5\",\n \"6\",\n \"0\"\n ],\n \"enable_days_of_weeks\": [\n [\n \"1\",\n \"2\",\n \"3\",\n \"4\",\n \"5\",\n \"6\",\n \"0\"\n ]\n ],\n \"enable_in_bg\": 0,\n \"notify_recovered\": 1,\n \"notify_channels\": [],\n \"notify_groups_obj\": null,\n \"notify_groups\": null,\n \"notify_repeat_step\": 60,\n \"notify_max_number\": 0,\n \"recover_duration\": 0,\n \"callbacks\": [],\n \"runbook_url\": \"\",\n \"append_tags\": [],\n \"annotations\": null,\n \"extra_config\": null,\n \"create_at\": 0,\n \"create_by\": \"\",\n \"update_at\": 0,\n \"update_by\": \"\",\n \"uuid\": 1717556327669056000\n },\n {\n \"id\": 0,\n \"group_id\": 0,\n \"cate\": \"prometheus\",\n \"datasource_ids\": [\n 0\n ],\n \"cluster\": \"\",\n \"name\": \"PrometheusBadConfig\",\n \"note\": \"Prometheus {{$labels.namespace}}/{{$labels.pod}} has failed to reload its configuration.\",\n \"prod\": \"metric\",\n \"algorithm\": \"\",\n \"algo_params\": null,\n \"delay\": 0,\n \"severity\": 1,\n \"severities\": [\n 1\n ],\n \"disabled\": 1,\n \"prom_for_duration\": 600,\n \"prom_ql\": \"# Without max_over_time, failed scrapes could create false negatives, see\\n# https://www.robustperception.io/alerting-on-gauges-in-prometheus-2-0 for details.\\nmax_over_time(prometheus_config_last_reload_successful{job=\\\"prometheus-k8s\\\",namespace=\\\"monitoring\\\"}[5m]) == 0\\n\",\n \"rule_config\": {\n \"algo_params\": null,\n \"inhibit\": false,\n \"prom_ql\": \"\",\n \"queries\": [\n {\n \"prom_ql\": \"# Without max_over_time, failed scrapes could create false negatives, see\\n# https://www.robustperception.io/alerting-on-gauges-in-prometheus-2-0 for details.\\nmax_over_time(prometheus_config_last_reload_successful{job=\\\"prometheus-k8s\\\",namespace=\\\"monitoring\\\"}[5m]) == 0\\n\",\n \"severity\": 1\n }\n ],\n \"severity\": 0\n },\n \"prom_eval_interval\": 15,\n \"enable_stime\": \"00:00\",\n \"enable_stimes\": [\n \"00:00\"\n ],\n \"enable_etime\": \"23:59\",\n \"enable_etimes\": [\n \"23:59\"\n ],\n \"enable_days_of_week\": [\n \"1\",\n \"2\",\n \"3\",\n \"4\",\n \"5\",\n \"6\",\n \"0\"\n ],\n \"enable_days_of_weeks\": [\n [\n \"1\",\n \"2\",\n \"3\",\n \"4\",\n \"5\",\n \"6\",\n \"0\"\n ]\n ],\n \"enable_in_bg\": 0,\n \"notify_recovered\": 1,\n \"notify_channels\": [],\n \"notify_groups_obj\": null,\n \"notify_groups\": null,\n \"notify_repeat_step\": 60,\n \"notify_max_number\": 0,\n \"recover_duration\": 0,\n \"callbacks\": [],\n \"runbook_url\": \"\",\n \"append_tags\": [],\n \"annotations\": null,\n \"extra_config\": null,\n \"create_at\": 0,\n \"create_by\": \"\",\n \"update_at\": 0,\n \"update_by\": \"\",\n \"uuid\": 1717556327669467000\n },\n {\n \"id\": 0,\n \"group_id\": 0,\n \"cate\": \"prometheus\",\n \"datasource_ids\": [\n 0\n ],\n \"cluster\": \"\",\n \"name\": \"PrometheusDuplicateTimestamps\",\n \"note\": \"Prometheus {{$labels.namespace}}/{{$labels.pod}} is dropping {{ printf \\\"%.4g\\\" $value }} samples/s with different values but duplicated timestamp.\",\n \"prod\": \"metric\",\n \"algorithm\": \"\",\n \"algo_params\": null,\n \"delay\": 0,\n \"severity\": 2,\n \"severities\": [\n 2\n ],\n \"disabled\": 1,\n \"prom_for_duration\": 600,\n \"prom_ql\": \"rate(prometheus_target_scrapes_sample_duplicate_timestamp_total{job=\\\"prometheus-k8s\\\",namespace=\\\"monitoring\\\"}[5m]) \\u003e 0\\n\",\n \"rule_config\": {\n \"algo_params\": null,\n \"inhibit\": false,\n \"prom_ql\": \"\",\n \"queries\": [\n {\n \"prom_ql\": \"rate(prometheus_target_scrapes_sample_duplicate_timestamp_total{job=\\\"prometheus-k8s\\\",namespace=\\\"monitoring\\\"}[5m]) \\u003e 0\\n\",\n \"severity\": 2\n }\n ],\n \"severity\": 0\n },\n \"prom_eval_interval\": 15,\n \"enable_stime\": \"00:00\",\n \"enable_stimes\": [\n \"00:00\"\n ],\n \"enable_etime\": \"23:59\",\n \"enable_etimes\": [\n \"23:59\"\n ],\n \"enable_days_of_week\": [\n \"1\",\n \"2\",\n \"3\",\n \"4\",\n \"5\",\n \"6\",\n \"0\"\n ],\n \"enable_days_of_weeks\": [\n [\n \"1\",\n \"2\",\n \"3\",\n \"4\",\n \"5\",\n \"6\",\n \"0\"\n ]\n ],\n \"enable_in_bg\": 0,\n \"notify_recovered\": 1,\n \"notify_channels\": [],\n \"notify_groups_obj\": null,\n \"notify_groups\": null,\n \"notify_repeat_step\": 60,\n \"notify_max_number\": 0,\n \"recover_duration\": 0,\n \"callbacks\": [],\n \"runbook_url\": \"\",\n \"append_tags\": [],\n \"annotations\": null,\n \"extra_config\": null,\n \"create_at\": 0,\n \"create_by\": \"\",\n \"update_at\": 0,\n \"update_by\": \"\",\n \"uuid\": 1717556327669963000\n },\n {\n \"id\": 0,\n \"group_id\": 0,\n \"cate\": \"prometheus\",\n \"datasource_ids\": [\n 0\n ],\n \"cluster\": \"\",\n \"name\": \"PrometheusErrorSendingAlertsToAnyAlertmanager\",\n \"note\": \"{{ printf \\\"%.1f\\\" $value }}% minimum errors while sending alerts from Prometheus {{$labels.namespace}}/{{$labels.pod}} to any Alertmanager.\",\n \"prod\": \"metric\",\n \"algorithm\": \"\",\n \"algo_params\": null,\n \"delay\": 0,\n \"severity\": 1,\n \"severities\": [\n 1\n ],\n \"disabled\": 1,\n \"prom_for_duration\": 900,\n \"prom_ql\": \"min without (alertmanager) (\\n rate(prometheus_notifications_errors_total{job=\\\"prometheus-k8s\\\",namespace=\\\"monitoring\\\",alertmanager!~``}[5m])\\n/\\n rate(prometheus_notifications_sent_total{job=\\\"prometheus-k8s\\\",namespace=\\\"monitoring\\\",alertmanager!~``}[5m])\\n)\\n* 100\\n\\u003e 3\\n\",\n \"rule_config\": {\n \"algo_params\": null,\n \"inhibit\": false,\n \"prom_ql\": \"\",\n \"queries\": [\n {\n \"prom_ql\": \"min without (alertmanager) (\\n rate(prometheus_notifications_errors_total{job=\\\"prometheus-k8s\\\",namespace=\\\"monitoring\\\",alertmanager!~``}[5m])\\n/\\n rate(prometheus_notifications_sent_total{job=\\\"prometheus-k8s\\\",namespace=\\\"monitoring\\\",alertmanager!~``}[5m])\\n)\\n* 100\\n\\u003e 3\\n\",\n \"severity\": 1\n }\n ],\n \"severity\": 0\n },\n \"prom_eval_interval\": 15,\n \"enable_stime\": \"00:00\",\n \"enable_stimes\": [\n \"00:00\"\n ],\n \"enable_etime\": \"23:59\",\n \"enable_etimes\": [\n \"23:59\"\n ],\n \"enable_days_of_week\": [\n \"1\",\n \"2\",\n \"3\",\n \"4\",\n \"5\",\n \"6\",\n \"0\"\n ],\n \"enable_days_of_weeks\": [\n [\n \"1\",\n \"2\",\n \"3\",\n \"4\",\n \"5\",\n \"6\",\n \"0\"\n ]\n ],\n \"enable_in_bg\": 0,\n \"notify_recovered\": 1,\n \"notify_channels\": [],\n \"notify_groups_obj\": null,\n \"notify_groups\": null,\n \"notify_repeat_step\": 60,\n \"notify_max_number\": 0,\n \"recover_duration\": 0,\n \"callbacks\": [],\n \"runbook_url\": \"\",\n \"append_tags\": [],\n \"annotations\": null,\n \"extra_config\": null,\n \"create_at\": 0,\n \"create_by\": \"\",\n \"update_at\": 0,\n \"update_by\": \"\",\n \"uuid\": 1717556327670315000\n },\n {\n \"id\": 0,\n \"group_id\": 0,\n \"cate\": \"prometheus\",\n \"datasource_ids\": [\n 0\n ],\n \"cluster\": \"\",\n \"name\": \"PrometheusErrorSendingAlertsToSomeAlertmanagers\",\n \"note\": \"{{ printf \\\"%.1f\\\" $value }}% errors while sending alerts from Prometheus {{$labels.namespace}}/{{$labels.pod}} to Alertmanager {{$labels.alertmanager}}.\",\n \"prod\": \"metric\",\n \"algorithm\": \"\",\n \"algo_params\": null,\n \"delay\": 0,\n \"severity\": 2,\n \"severities\": [\n 2\n ],\n \"disabled\": 1,\n \"prom_for_duration\": 900,\n \"prom_ql\": \"(\\n rate(prometheus_notifications_errors_total{job=\\\"prometheus-k8s\\\",namespace=\\\"monitoring\\\"}[5m])\\n/\\n rate(prometheus_notifications_sent_total{job=\\\"prometheus-k8s\\\",namespace=\\\"monitoring\\\"}[5m])\\n)\\n* 100\\n\\u003e 1\\n\",\n \"rule_config\": {\n \"algo_params\": null,\n \"inhibit\": false,\n \"prom_ql\": \"\",\n \"queries\": [\n {\n \"prom_ql\": \"(\\n rate(prometheus_notifications_errors_total{job=\\\"prometheus-k8s\\\",namespace=\\\"monitoring\\\"}[5m])\\n/\\n rate(prometheus_notifications_sent_total{job=\\\"prometheus-k8s\\\",namespace=\\\"monitoring\\\"}[5m])\\n)\\n* 100\\n\\u003e 1\\n\",\n \"severity\": 2\n }\n ],\n \"severity\": 0\n },\n \"prom_eval_interval\": 15,\n \"enable_stime\": \"00:00\",\n \"enable_stimes\": [\n \"00:00\"\n ],\n \"enable_etime\": \"23:59\",\n \"enable_etimes\": [\n \"23:59\"\n ],\n \"enable_days_of_week\": [\n \"1\",\n \"2\",\n \"3\",\n \"4\",\n \"5\",\n \"6\",\n \"0\"\n ],\n \"enable_days_of_weeks\": [\n [\n \"1\",\n \"2\",\n \"3\",\n \"4\",\n \"5\",\n \"6\",\n \"0\"\n ]\n ],\n \"enable_in_bg\": 0,\n \"notify_recovered\": 1,\n \"notify_channels\": [],\n \"notify_groups_obj\": null,\n \"notify_groups\": null,\n \"notify_repeat_step\": 60,\n \"notify_max_number\": 0,\n \"recover_duration\": 0,\n \"callbacks\": [],\n \"runbook_url\": \"\",\n \"append_tags\": [],\n \"annotations\": null,\n \"extra_config\": null,\n \"create_at\": 0,\n \"create_by\": \"\",\n \"update_at\": 0,\n \"update_by\": \"\",\n \"uuid\": 1717556327670910000\n },\n {\n \"id\": 0,\n \"group_id\": 0,\n \"cate\": \"prometheus\",\n \"datasource_ids\": [\n 0\n ],\n \"cluster\": \"\",\n \"name\": \"PrometheusHighQueryLoad\",\n \"note\": \"Prometheus {{$labels.namespace}}/{{$labels.pod}} query API has less than 20% available capacity in its query engine for the last 15 minutes.\",\n \"prod\": \"metric\",\n \"algorithm\": \"\",\n \"algo_params\": null,\n \"delay\": 0,\n \"severity\": 2,\n \"severities\": [\n 2\n ],\n \"disabled\": 1,\n \"prom_for_duration\": 900,\n \"prom_ql\": \"avg_over_time(prometheus_engine_queries{job=\\\"prometheus-k8s\\\",namespace=\\\"monitoring\\\"}[5m]) / max_over_time(prometheus_engine_queries_concurrent_max{job=\\\"prometheus-k8s\\\",namespace=\\\"monitoring\\\"}[5m]) \\u003e 0.8\\n\",\n \"rule_config\": {\n \"algo_params\": null,\n \"inhibit\": false,\n \"prom_ql\": \"\",\n \"queries\": [\n {\n \"prom_ql\": \"avg_over_time(prometheus_engine_queries{job=\\\"prometheus-k8s\\\",namespace=\\\"monitoring\\\"}[5m]) / max_over_time(prometheus_engine_queries_concurrent_max{job=\\\"prometheus-k8s\\\",namespace=\\\"monitoring\\\"}[5m]) \\u003e 0.8\\n\",\n \"severity\": 2\n }\n ],\n \"severity\": 0\n },\n \"prom_eval_interval\": 15,\n \"enable_stime\": \"00:00\",\n \"enable_stimes\": [\n \"00:00\"\n ],\n \"enable_etime\": \"23:59\",\n \"enable_etimes\": [\n \"23:59\"\n ],\n \"enable_days_of_week\": [\n \"1\",\n \"2\",\n \"3\",\n \"4\",\n \"5\",\n \"6\",\n \"0\"\n ],\n \"enable_days_of_weeks\": [\n [\n \"1\",\n \"2\",\n \"3\",\n \"4\",\n \"5\",\n \"6\",\n \"0\"\n ]\n ],\n \"enable_in_bg\": 0,\n \"notify_recovered\": 1,\n \"notify_channels\": [],\n \"notify_groups_obj\": null,\n \"notify_groups\": null,\n \"notify_repeat_step\": 60,\n \"notify_max_number\": 0,\n \"recover_duration\": 0,\n \"callbacks\": [],\n \"runbook_url\": \"\",\n \"append_tags\": [],\n \"annotations\": null,\n \"extra_config\": null,\n \"create_at\": 0,\n \"create_by\": \"\",\n \"update_at\": 0,\n \"update_by\": \"\",\n \"uuid\": 1717556327671338000\n },\n {\n \"id\": 0,\n \"group_id\": 0,\n \"cate\": \"prometheus\",\n \"datasource_ids\": [\n 0\n ],\n \"cluster\": \"\",\n \"name\": \"PrometheusLabelLimitHit\",\n \"note\": \"Prometheus {{$labels.namespace}}/{{$labels.pod}} has dropped {{ printf \\\"%.0f\\\" $value }} targets because some samples exceeded the configured label_limit, label_name_length_limit or label_value_length_limit.\",\n \"prod\": \"metric\",\n \"algorithm\": \"\",\n \"algo_params\": null,\n \"delay\": 0,\n \"severity\": 2,\n \"severities\": [\n 2\n ],\n \"disabled\": 1,\n \"prom_for_duration\": 900,\n \"prom_ql\": \"increase(prometheus_target_scrape_pool_exceeded_label_limits_total{job=\\\"prometheus-k8s\\\",namespace=\\\"monitoring\\\"}[5m]) \\u003e 0\\n\",\n \"rule_config\": {\n \"algo_params\": null,\n \"inhibit\": false,\n \"prom_ql\": \"\",\n \"queries\": [\n {\n \"prom_ql\": \"increase(prometheus_target_scrape_pool_exceeded_label_limits_total{job=\\\"prometheus-k8s\\\",namespace=\\\"monitoring\\\"}[5m]) \\u003e 0\\n\",\n \"severity\": 2\n }\n ],\n \"severity\": 0\n },\n \"prom_eval_interval\": 15,\n \"enable_stime\": \"00:00\",\n \"enable_stimes\": [\n \"00:00\"\n ],\n \"enable_etime\": \"23:59\",\n \"enable_etimes\": [\n \"23:59\"\n ],\n \"enable_days_of_week\": [\n \"1\",\n \"2\",\n \"3\",\n \"4\",\n \"5\",\n \"6\",\n \"0\"\n ],\n \"enable_days_of_weeks\": [\n [\n \"1\",\n \"2\",\n \"3\",\n \"4\",\n \"5\",\n \"6\",\n \"0\"\n ]\n ],\n \"enable_in_bg\": 0,\n \"notify_recovered\": 1,\n \"notify_channels\": [],\n \"notify_groups_obj\": null,\n \"notify_groups\": null,\n \"notify_repeat_step\": 60,\n \"notify_max_number\": 0,\n \"recover_duration\": 0,\n \"callbacks\": [],\n \"runbook_url\": \"\",\n \"append_tags\": [],\n \"annotations\": null,\n \"extra_config\": null,\n \"create_at\": 0,\n \"create_by\": \"\",\n \"update_at\": 0,\n \"update_by\": \"\",\n \"uuid\": 1717556327671805000\n },\n {\n \"id\": 0,\n \"group_id\": 0,\n \"cate\": \"prometheus\",\n \"datasource_ids\": [\n 0\n ],\n \"cluster\": \"\",\n \"name\": \"PrometheusMissingRuleEvaluations\",\n \"note\": \"Prometheus {{$labels.namespace}}/{{$labels.pod}} has missed {{ printf \\\"%.0f\\\" $value }} rule group evaluations in the last 5m.\",\n \"prod\": \"metric\",\n \"algorithm\": \"\",\n \"algo_params\": null,\n \"delay\": 0,\n \"severity\": 2,\n \"severities\": [\n 2\n ],\n \"disabled\": 1,\n \"prom_for_duration\": 900,\n \"prom_ql\": \"increase(prometheus_rule_group_iterations_missed_total{job=\\\"prometheus-k8s\\\",namespace=\\\"monitoring\\\"}[5m]) \\u003e 0\\n\",\n \"rule_config\": {\n \"algo_params\": null,\n \"inhibit\": false,\n \"prom_ql\": \"\",\n \"queries\": [\n {\n \"prom_ql\": \"increase(prometheus_rule_group_iterations_missed_total{job=\\\"prometheus-k8s\\\",namespace=\\\"monitoring\\\"}[5m]) \\u003e 0\\n\",\n \"severity\": 2\n }\n ],\n \"severity\": 0\n },\n \"prom_eval_interval\": 15,\n \"enable_stime\": \"00:00\",\n \"enable_stimes\": [\n \"00:00\"\n ],\n \"enable_etime\": \"23:59\",\n \"enable_etimes\": [\n \"23:59\"\n ],\n \"enable_days_of_week\": [\n \"1\",\n \"2\",\n \"3\",\n \"4\",\n \"5\",\n \"6\",\n \"0\"\n ],\n \"enable_days_of_weeks\": [\n [\n \"1\",\n \"2\",\n \"3\",\n \"4\",\n \"5\",\n \"6\",\n \"0\"\n ]\n ],\n \"enable_in_bg\": 0,\n \"notify_recovered\": 1,\n \"notify_channels\": [],\n \"notify_groups_obj\": null,\n \"notify_groups\": null,\n \"notify_repeat_step\": 60,\n \"notify_max_number\": 0,\n \"recover_duration\": 0,\n \"callbacks\": [],\n \"runbook_url\": \"\",\n \"append_tags\": [],\n \"annotations\": null,\n \"extra_config\": null,\n \"create_at\": 0,\n \"create_by\": \"\",\n \"update_at\": 0,\n \"update_by\": \"\",\n \"uuid\": 1717556327672340000\n },\n {\n \"id\": 0,\n \"group_id\": 0,\n \"cate\": \"prometheus\",\n \"datasource_ids\": [\n 0\n ],\n \"cluster\": \"\",\n \"name\": \"PrometheusNotConnectedToAlertmanagers\",\n \"note\": \"Prometheus {{$labels.namespace}}/{{$labels.pod}} is not connected to any Alertmanagers.\",\n \"prod\": \"metric\",\n \"algorithm\": \"\",\n \"algo_params\": null,\n \"delay\": 0,\n \"severity\": 2,\n \"severities\": [\n 2\n ],\n \"disabled\": 1,\n \"prom_for_duration\": 600,\n \"prom_ql\": \"# Without max_over_time, failed scrapes could create false negatives, see\\n# https://www.robustperception.io/alerting-on-gauges-in-prometheus-2-0 for details.\\nmax_over_time(prometheus_notifications_alertmanagers_discovered{job=\\\"prometheus-k8s\\\",namespace=\\\"monitoring\\\"}[5m]) \\u003c 1\\n\",\n \"rule_config\": {\n \"algo_params\": null,\n \"inhibit\": false,\n \"prom_ql\": \"\",\n \"queries\": [\n {\n \"prom_ql\": \"# Without max_over_time, failed scrapes could create false negatives, see\\n# https://www.robustperception.io/alerting-on-gauges-in-prometheus-2-0 for details.\\nmax_over_time(prometheus_notifications_alertmanagers_discovered{job=\\\"prometheus-k8s\\\",namespace=\\\"monitoring\\\"}[5m]) \\u003c 1\\n\",\n \"severity\": 2\n }\n ],\n \"severity\": 0\n },\n \"prom_eval_interval\": 15,\n \"enable_stime\": \"00:00\",\n \"enable_stimes\": [\n \"00:00\"\n ],\n \"enable_etime\": \"23:59\",\n \"enable_etimes\": [\n \"23:59\"\n ],\n \"enable_days_of_week\": [\n \"1\",\n \"2\",\n \"3\",\n \"4\",\n \"5\",\n \"6\",\n \"0\"\n ],\n \"enable_days_of_weeks\": [\n [\n \"1\",\n \"2\",\n \"3\",\n \"4\",\n \"5\",\n \"6\",\n \"0\"\n ]\n ],\n \"enable_in_bg\": 0,\n \"notify_recovered\": 1,\n \"notify_channels\": [],\n \"notify_groups_obj\": null,\n \"notify_groups\": null,\n \"notify_repeat_step\": 60,\n \"notify_max_number\": 0,\n \"recover_duration\": 0,\n \"callbacks\": [],\n \"runbook_url\": \"\",\n \"append_tags\": [],\n \"annotations\": null,\n \"extra_config\": null,\n \"create_at\": 0,\n \"create_by\": \"\",\n \"update_at\": 0,\n \"update_by\": \"\",\n \"uuid\": 1717556327672820000\n },\n {\n \"id\": 0,\n \"group_id\": 0,\n \"cate\": \"prometheus\",\n \"datasource_ids\": [\n 0\n ],\n \"cluster\": \"\",\n \"name\": \"PrometheusNotificationQueueRunningFull\",\n \"note\": \"Alert notification queue of Prometheus {{$labels.namespace}}/{{$labels.pod}} is running full.\",\n \"prod\": \"metric\",\n \"algorithm\": \"\",\n \"algo_params\": null,\n \"delay\": 0,\n \"severity\": 2,\n \"severities\": [\n 2\n ],\n \"disabled\": 1,\n \"prom_for_duration\": 900,\n \"prom_ql\": \"# Without min_over_time, failed scrapes could create false negatives, see\\n# https://www.robustperception.io/alerting-on-gauges-in-prometheus-2-0 for details.\\n(\\n predict_linear(prometheus_notifications_queue_length{job=\\\"prometheus-k8s\\\",namespace=\\\"monitoring\\\"}[5m], 60 * 30)\\n\\u003e\\n min_over_time(prometheus_notifications_queue_capacity{job=\\\"prometheus-k8s\\\",namespace=\\\"monitoring\\\"}[5m])\\n)\\n\",\n \"rule_config\": {\n \"algo_params\": null,\n \"inhibit\": false,\n \"prom_ql\": \"\",\n \"queries\": [\n {\n \"prom_ql\": \"# Without min_over_time, failed scrapes could create false negatives, see\\n# https://www.robustperception.io/alerting-on-gauges-in-prometheus-2-0 for details.\\n(\\n predict_linear(prometheus_notifications_queue_length{job=\\\"prometheus-k8s\\\",namespace=\\\"monitoring\\\"}[5m], 60 * 30)\\n\\u003e\\n min_over_time(prometheus_notifications_queue_capacity{job=\\\"prometheus-k8s\\\",namespace=\\\"monitoring\\\"}[5m])\\n)\\n\",\n \"severity\": 2\n }\n ],\n \"severity\": 0\n },\n \"prom_eval_interval\": 15,\n \"enable_stime\": \"00:00\",\n \"enable_stimes\": [\n \"00:00\"\n ],\n \"enable_etime\": \"23:59\",\n \"enable_etimes\": [\n \"23:59\"\n ],\n \"enable_days_of_week\": [\n \"1\",\n \"2\",\n \"3\",\n \"4\",\n \"5\",\n \"6\",\n \"0\"\n ],\n \"enable_days_of_weeks\": [\n [\n \"1\",\n \"2\",\n \"3\",\n \"4\",\n \"5\",\n \"6\",\n \"0\"\n ]\n ],\n \"enable_in_bg\": 0,\n \"notify_recovered\": 1,\n \"notify_channels\": [],\n \"notify_groups_obj\": null,\n \"notify_groups\": null,\n \"notify_repeat_step\": 60,\n \"notify_max_number\": 0,\n \"recover_duration\": 0,\n \"callbacks\": [],\n \"runbook_url\": \"\",\n \"append_tags\": [],\n \"annotations\": null,\n \"extra_config\": null,\n \"create_at\": 0,\n \"create_by\": \"\",\n \"update_at\": 0,\n \"update_by\": \"\",\n \"uuid\": 1717556327673317000\n },\n {\n \"id\": 0,\n \"group_id\": 0,\n \"cate\": \"prometheus\",\n \"datasource_ids\": [\n 0\n ],\n \"cluster\": \"\",\n \"name\": \"PrometheusNotIngestingSamples\",\n \"note\": \"Prometheus {{$labels.namespace}}/{{$labels.pod}} is not ingesting samples.\",\n \"prod\": \"metric\",\n \"algorithm\": \"\",\n \"algo_params\": null,\n \"delay\": 0,\n \"severity\": 2,\n \"severities\": [\n 2\n ],\n \"disabled\": 1,\n \"prom_for_duration\": 600,\n \"prom_ql\": \"(\\n rate(prometheus_tsdb_head_samples_appended_total{job=\\\"prometheus-k8s\\\",namespace=\\\"monitoring\\\"}[5m]) \\u003c= 0\\nand\\n (\\n sum without(scrape_job) (prometheus_target_metadata_cache_entries{job=\\\"prometheus-k8s\\\",namespace=\\\"monitoring\\\"}) \\u003e 0\\n or\\n sum without(rule_group) (prometheus_rule_group_rules{job=\\\"prometheus-k8s\\\",namespace=\\\"monitoring\\\"}) \\u003e 0\\n )\\n)\\n\",\n \"rule_config\": {\n \"algo_params\": null,\n \"inhibit\": false,\n \"prom_ql\": \"\",\n \"queries\": [\n {\n \"prom_ql\": \"(\\n rate(prometheus_tsdb_head_samples_appended_total{job=\\\"prometheus-k8s\\\",namespace=\\\"monitoring\\\"}[5m]) \\u003c= 0\\nand\\n (\\n sum without(scrape_job) (prometheus_target_metadata_cache_entries{job=\\\"prometheus-k8s\\\",namespace=\\\"monitoring\\\"}) \\u003e 0\\n or\\n sum without(rule_group) (prometheus_rule_group_rules{job=\\\"prometheus-k8s\\\",namespace=\\\"monitoring\\\"}) \\u003e 0\\n )\\n)\\n\",\n \"severity\": 2\n }\n ],\n \"severity\": 0\n },\n \"prom_eval_interval\": 15,\n \"enable_stime\": \"00:00\",\n \"enable_stimes\": [\n \"00:00\"\n ],\n \"enable_etime\": \"23:59\",\n \"enable_etimes\": [\n \"23:59\"\n ],\n \"enable_days_of_week\": [\n \"1\",\n \"2\",\n \"3\",\n \"4\",\n \"5\",\n \"6\",\n \"0\"\n ],\n \"enable_days_of_weeks\": [\n [\n \"1\",\n \"2\",\n \"3\",\n \"4\",\n \"5\",\n \"6\",\n \"0\"\n ]\n ],\n \"enable_in_bg\": 0,\n \"notify_recovered\": 1,\n \"notify_channels\": [],\n \"notify_groups_obj\": null,\n \"notify_groups\": null,\n \"notify_repeat_step\": 60,\n \"notify_max_number\": 0,\n \"recover_duration\": 0,\n \"callbacks\": [],\n \"runbook_url\": \"\",\n \"append_tags\": [],\n \"annotations\": null,\n \"extra_config\": null,\n \"create_at\": 0,\n \"create_by\": \"\",\n \"update_at\": 0,\n \"update_by\": \"\",\n \"uuid\": 1717556327673794000\n },\n {\n \"id\": 0,\n \"group_id\": 0,\n \"cate\": \"prometheus\",\n \"datasource_ids\": [\n 0\n ],\n \"cluster\": \"\",\n \"name\": \"PrometheusOutOfOrderTimestamps\",\n \"note\": \"Prometheus {{$labels.namespace}}/{{$labels.pod}} is dropping {{ printf \\\"%.4g\\\" $value }} samples/s with timestamps arriving out of order.\",\n \"prod\": \"metric\",\n \"algorithm\": \"\",\n \"algo_params\": null,\n \"delay\": 0,\n \"severity\": 2,\n \"severities\": [\n 2\n ],\n \"disabled\": 1,\n \"prom_for_duration\": 600,\n \"prom_ql\": \"rate(prometheus_target_scrapes_sample_out_of_order_total{job=\\\"prometheus-k8s\\\",namespace=\\\"monitoring\\\"}[5m]) \\u003e 0\\n\",\n \"rule_config\": {\n \"algo_params\": null,\n \"inhibit\": false,\n \"prom_ql\": \"\",\n \"queries\": [\n {\n \"prom_ql\": \"rate(prometheus_target_scrapes_sample_out_of_order_total{job=\\\"prometheus-k8s\\\",namespace=\\\"monitoring\\\"}[5m]) \\u003e 0\\n\",\n \"severity\": 2\n }\n ],\n \"severity\": 0\n },\n \"prom_eval_interval\": 15,\n \"enable_stime\": \"00:00\",\n \"enable_stimes\": [\n \"00:00\"\n ],\n \"enable_etime\": \"23:59\",\n \"enable_etimes\": [\n \"23:59\"\n ],\n \"enable_days_of_week\": [\n \"1\",\n \"2\",\n \"3\",\n \"4\",\n \"5\",\n \"6\",\n \"0\"\n ],\n \"enable_days_of_weeks\": [\n [\n \"1\",\n \"2\",\n \"3\",\n \"4\",\n \"5\",\n \"6\",\n \"0\"\n ]\n ],\n \"enable_in_bg\": 0,\n \"notify_recovered\": 1,\n \"notify_channels\": [],\n \"notify_groups_obj\": null,\n \"notify_groups\": null,\n \"notify_repeat_step\": 60,\n \"notify_max_number\": 0,\n \"recover_duration\": 0,\n \"callbacks\": [],\n \"runbook_url\": \"\",\n \"append_tags\": [],\n \"annotations\": null,\n \"extra_config\": null,\n \"create_at\": 0,\n \"create_by\": \"\",\n \"update_at\": 0,\n \"update_by\": \"\",\n \"uuid\": 1717556327674275000\n },\n {\n \"id\": 0,\n \"group_id\": 0,\n \"cate\": \"prometheus\",\n \"datasource_ids\": [\n 0\n ],\n \"cluster\": \"\",\n \"name\": \"PrometheusRemoteStorageFailures\",\n \"note\": \"Prometheus {{$labels.namespace}}/{{$labels.pod}} failed to send {{ printf \\\"%.1f\\\" $value }}% of the samples to {{ $labels.remote_name}}:{{ $labels.url }}\",\n \"prod\": \"metric\",\n \"algorithm\": \"\",\n \"algo_params\": null,\n \"delay\": 0,\n \"severity\": 1,\n \"severities\": [\n 1\n ],\n \"disabled\": 1,\n \"prom_for_duration\": 900,\n \"prom_ql\": \"(\\n (rate(prometheus_remote_storage_failed_samples_total{job=\\\"prometheus-k8s\\\",namespace=\\\"monitoring\\\"}[5m]) or rate(prometheus_remote_storage_samples_failed_total{job=\\\"prometheus-k8s\\\",namespace=\\\"monitoring\\\"}[5m]))\\n/\\n (\\n (rate(prometheus_remote_storage_failed_samples_total{job=\\\"prometheus-k8s\\\",namespace=\\\"monitoring\\\"}[5m]) or rate(prometheus_remote_storage_samples_failed_total{job=\\\"prometheus-k8s\\\",namespace=\\\"monitoring\\\"}[5m]))\\n +\\n (rate(prometheus_remote_storage_succeeded_samples_total{job=\\\"prometheus-k8s\\\",namespace=\\\"monitoring\\\"}[5m]) or rate(prometheus_remote_storage_samples_total{job=\\\"prometheus-k8s\\\",namespace=\\\"monitoring\\\"}[5m]))\\n )\\n)\\n* 100\\n\\u003e 1\\n\",\n \"rule_config\": {\n \"algo_params\": null,\n \"inhibit\": false,\n \"prom_ql\": \"\",\n \"queries\": [\n {\n \"prom_ql\": \"(\\n (rate(prometheus_remote_storage_failed_samples_total{job=\\\"prometheus-k8s\\\",namespace=\\\"monitoring\\\"}[5m]) or rate(prometheus_remote_storage_samples_failed_total{job=\\\"prometheus-k8s\\\",namespace=\\\"monitoring\\\"}[5m]))\\n/\\n (\\n (rate(prometheus_remote_storage_failed_samples_total{job=\\\"prometheus-k8s\\\",namespace=\\\"monitoring\\\"}[5m]) or rate(prometheus_remote_storage_samples_failed_total{job=\\\"prometheus-k8s\\\",namespace=\\\"monitoring\\\"}[5m]))\\n +\\n (rate(prometheus_remote_storage_succeeded_samples_total{job=\\\"prometheus-k8s\\\",namespace=\\\"monitoring\\\"}[5m]) or rate(prometheus_remote_storage_samples_total{job=\\\"prometheus-k8s\\\",namespace=\\\"monitoring\\\"}[5m]))\\n )\\n)\\n* 100\\n\\u003e 1\\n\",\n \"severity\": 1\n }\n ],\n \"severity\": 0\n },\n \"prom_eval_interval\": 15,\n \"enable_stime\": \"00:00\",\n \"enable_stimes\": [\n \"00:00\"\n ],\n \"enable_etime\": \"23:59\",\n \"enable_etimes\": [\n \"23:59\"\n ],\n \"enable_days_of_week\": [\n \"1\",\n \"2\",\n \"3\",\n \"4\",\n \"5\",\n \"6\",\n \"0\"\n ],\n \"enable_days_of_weeks\": [\n [\n \"1\",\n \"2\",\n \"3\",\n \"4\",\n \"5\",\n \"6\",\n \"0\"\n ]\n ],\n \"enable_in_bg\": 0,\n \"notify_recovered\": 1,\n \"notify_channels\": [],\n \"notify_groups_obj\": null,\n \"notify_groups\": null,\n \"notify_repeat_step\": 60,\n \"notify_max_number\": 0,\n \"recover_duration\": 0,\n \"callbacks\": [],\n \"runbook_url\": \"\",\n \"append_tags\": [],\n \"annotations\": null,\n \"extra_config\": null,\n \"create_at\": 0,\n \"create_by\": \"\",\n \"update_at\": 0,\n \"update_by\": \"\",\n \"uuid\": 1717556327674647000\n },\n {\n \"id\": 0,\n \"group_id\": 0,\n \"cate\": \"prometheus\",\n \"datasource_ids\": [\n 0\n ],\n \"cluster\": \"\",\n \"name\": \"PrometheusRemoteWriteBehind\",\n \"note\": \"Prometheus {{$labels.namespace}}/{{$labels.pod}} remote write is {{ printf \\\"%.1f\\\" $value }}s behind for {{ $labels.remote_name}}:{{ $labels.url }}.\",\n \"prod\": \"metric\",\n \"algorithm\": \"\",\n \"algo_params\": null,\n \"delay\": 0,\n \"severity\": 1,\n \"severities\": [\n 1\n ],\n \"disabled\": 1,\n \"prom_for_duration\": 900,\n \"prom_ql\": \"# Without max_over_time, failed scrapes could create false negatives, see\\n# https://www.robustperception.io/alerting-on-gauges-in-prometheus-2-0 for details.\\n(\\n max_over_time(prometheus_remote_storage_highest_timestamp_in_seconds{job=\\\"prometheus-k8s\\\",namespace=\\\"monitoring\\\"}[5m])\\n- ignoring(remote_name, url) group_right\\n max_over_time(prometheus_remote_storage_queue_highest_sent_timestamp_seconds{job=\\\"prometheus-k8s\\\",namespace=\\\"monitoring\\\"}[5m])\\n)\\n\\u003e 120\\n\",\n \"rule_config\": {\n \"algo_params\": null,\n \"inhibit\": false,\n \"prom_ql\": \"\",\n \"queries\": [\n {\n \"prom_ql\": \"# Without max_over_time, failed scrapes could create false negatives, see\\n# https://www.robustperception.io/alerting-on-gauges-in-prometheus-2-0 for details.\\n(\\n max_over_time(prometheus_remote_storage_highest_timestamp_in_seconds{job=\\\"prometheus-k8s\\\",namespace=\\\"monitoring\\\"}[5m])\\n- ignoring(remote_name, url) group_right\\n max_over_time(prometheus_remote_storage_queue_highest_sent_timestamp_seconds{job=\\\"prometheus-k8s\\\",namespace=\\\"monitoring\\\"}[5m])\\n)\\n\\u003e 120\\n\",\n \"severity\": 1\n }\n ],\n \"severity\": 0\n },\n \"prom_eval_interval\": 15,\n \"enable_stime\": \"00:00\",\n \"enable_stimes\": [\n \"00:00\"\n ],\n \"enable_etime\": \"23:59\",\n \"enable_etimes\": [\n \"23:59\"\n ],\n \"enable_days_of_week\": [\n \"1\",\n \"2\",\n \"3\",\n \"4\",\n \"5\",\n \"6\",\n \"0\"\n ],\n \"enable_days_of_weeks\": [\n [\n \"1\",\n \"2\",\n \"3\",\n \"4\",\n \"5\",\n \"6\",\n \"0\"\n ]\n ],\n \"enable_in_bg\": 0,\n \"notify_recovered\": 1,\n \"notify_channels\": [],\n \"notify_groups_obj\": null,\n \"notify_groups\": null,\n \"notify_repeat_step\": 60,\n \"notify_max_number\": 0,\n \"recover_duration\": 0,\n \"callbacks\": [],\n \"runbook_url\": \"\",\n \"append_tags\": [],\n \"annotations\": null,\n \"extra_config\": null,\n \"create_at\": 0,\n \"create_by\": \"\",\n \"update_at\": 0,\n \"update_by\": \"\",\n \"uuid\": 1717556327675106000\n },\n {\n \"id\": 0,\n \"group_id\": 0,\n \"cate\": \"prometheus\",\n \"datasource_ids\": [\n 0\n ],\n \"cluster\": \"\",\n \"name\": \"PrometheusRemoteWriteDesiredShards\",\n \"note\": \"Prometheus {{$labels.namespace}}/{{$labels.pod}} remote write desired shards calculation wants to run {{ $value }} shards for queue {{ $labels.remote_name}}:{{ $labels.url }}, which is more than the max of {{ printf `prometheus_remote_storage_shards_max{instance=\\\"%s\\\",job=\\\"prometheus-k8s\\\",namespace=\\\"monitoring\\\"}` $labels.instance | query | first | value }}.\",\n \"prod\": \"metric\",\n \"algorithm\": \"\",\n \"algo_params\": null,\n \"delay\": 0,\n \"severity\": 2,\n \"severities\": [\n 2\n ],\n \"disabled\": 1,\n \"prom_for_duration\": 900,\n \"prom_ql\": \"# Without max_over_time, failed scrapes could create false negatives, see\\n# https://www.robustperception.io/alerting-on-gauges-in-prometheus-2-0 for details.\\n(\\n max_over_time(prometheus_remote_storage_shards_desired{job=\\\"prometheus-k8s\\\",namespace=\\\"monitoring\\\"}[5m])\\n\\u003e\\n max_over_time(prometheus_remote_storage_shards_max{job=\\\"prometheus-k8s\\\",namespace=\\\"monitoring\\\"}[5m])\\n)\\n\",\n \"rule_config\": {\n \"algo_params\": null,\n \"inhibit\": false,\n \"prom_ql\": \"\",\n \"queries\": [\n {\n \"prom_ql\": \"# Without max_over_time, failed scrapes could create false negatives, see\\n# https://www.robustperception.io/alerting-on-gauges-in-prometheus-2-0 for details.\\n(\\n max_over_time(prometheus_remote_storage_shards_desired{job=\\\"prometheus-k8s\\\",namespace=\\\"monitoring\\\"}[5m])\\n\\u003e\\n max_over_time(prometheus_remote_storage_shards_max{job=\\\"prometheus-k8s\\\",namespace=\\\"monitoring\\\"}[5m])\\n)\\n\",\n \"severity\": 2\n }\n ],\n \"severity\": 0\n },\n \"prom_eval_interval\": 15,\n \"enable_stime\": \"00:00\",\n \"enable_stimes\": [\n \"00:00\"\n ],\n \"enable_etime\": \"23:59\",\n \"enable_etimes\": [\n \"23:59\"\n ],\n \"enable_days_of_week\": [\n \"1\",\n \"2\",\n \"3\",\n \"4\",\n \"5\",\n \"6\",\n \"0\"\n ],\n \"enable_days_of_weeks\": [\n [\n \"1\",\n \"2\",\n \"3\",\n \"4\",\n \"5\",\n \"6\",\n \"0\"\n ]\n ],\n \"enable_in_bg\": 0,\n \"notify_recovered\": 1,\n \"notify_channels\": [],\n \"notify_groups_obj\": null,\n \"notify_groups\": null,\n \"notify_repeat_step\": 60,\n \"notify_max_number\": 0,\n \"recover_duration\": 0,\n \"callbacks\": [],\n \"runbook_url\": \"\",\n \"append_tags\": [],\n \"annotations\": null,\n \"extra_config\": null,\n \"create_at\": 0,\n \"create_by\": \"\",\n \"update_at\": 0,\n \"update_by\": \"\",\n \"uuid\": 1717556327675490000\n },\n {\n \"id\": 0,\n \"group_id\": 0,\n \"cate\": \"prometheus\",\n \"datasource_ids\": [\n 0\n ],\n \"cluster\": \"\",\n \"name\": \"PrometheusRuleFailures\",\n \"note\": \"Prometheus {{$labels.namespace}}/{{$labels.pod}} has failed to evaluate {{ printf \\\"%.0f\\\" $value }} rules in the last 5m.\",\n \"prod\": \"metric\",\n \"algorithm\": \"\",\n \"algo_params\": null,\n \"delay\": 0,\n \"severity\": 1,\n \"severities\": [\n 1\n ],\n \"disabled\": 1,\n \"prom_for_duration\": 900,\n \"prom_ql\": \"increase(prometheus_rule_evaluation_failures_total{job=\\\"prometheus-k8s\\\",namespace=\\\"monitoring\\\"}[5m]) \\u003e 0\\n\",\n \"rule_config\": {\n \"algo_params\": null,\n \"inhibit\": false,\n \"prom_ql\": \"\",\n \"queries\": [\n {\n \"prom_ql\": \"increase(prometheus_rule_evaluation_failures_total{job=\\\"prometheus-k8s\\\",namespace=\\\"monitoring\\\"}[5m]) \\u003e 0\\n\",\n \"severity\": 1\n }\n ],\n \"severity\": 0\n },\n \"prom_eval_interval\": 15,\n \"enable_stime\": \"00:00\",\n \"enable_stimes\": [\n \"00:00\"\n ],\n \"enable_etime\": \"23:59\",\n \"enable_etimes\": [\n \"23:59\"\n ],\n \"enable_days_of_week\": [\n \"1\",\n \"2\",\n \"3\",\n \"4\",\n \"5\",\n \"6\",\n \"0\"\n ],\n \"enable_days_of_weeks\": [\n [\n \"1\",\n \"2\",\n \"3\",\n \"4\",\n \"5\",\n \"6\",\n \"0\"\n ]\n ],\n \"enable_in_bg\": 0,\n \"notify_recovered\": 1,\n \"notify_channels\": [],\n \"notify_groups_obj\": null,\n \"notify_groups\": null,\n \"notify_repeat_step\": 60,\n \"notify_max_number\": 0,\n \"recover_duration\": 0,\n \"callbacks\": [],\n \"runbook_url\": \"\",\n \"append_tags\": [],\n \"annotations\": null,\n \"extra_config\": null,\n \"create_at\": 0,\n \"create_by\": \"\",\n \"update_at\": 0,\n \"update_by\": \"\",\n \"uuid\": 1717556327675864000\n },\n {\n \"id\": 0,\n \"group_id\": 0,\n \"cate\": \"prometheus\",\n \"datasource_ids\": [\n 0\n ],\n \"cluster\": \"\",\n \"name\": \"PrometheusScrapeBodySizeLimitHit\",\n \"note\": \"Prometheus {{$labels.namespace}}/{{$labels.pod}} has failed {{ printf \\\"%.0f\\\" $value }} scrapes in the last 5m because some targets exceeded the configured body_size_limit.\",\n \"prod\": \"metric\",\n \"algorithm\": \"\",\n \"algo_params\": null,\n \"delay\": 0,\n \"severity\": 2,\n \"severities\": [\n 2\n ],\n \"disabled\": 1,\n \"prom_for_duration\": 900,\n \"prom_ql\": \"increase(prometheus_target_scrapes_exceeded_body_size_limit_total{job=\\\"prometheus-k8s\\\",namespace=\\\"monitoring\\\"}[5m]) \\u003e 0\\n\",\n \"rule_config\": {\n \"algo_params\": null,\n \"inhibit\": false,\n \"prom_ql\": \"\",\n \"queries\": [\n {\n \"prom_ql\": \"increase(prometheus_target_scrapes_exceeded_body_size_limit_total{job=\\\"prometheus-k8s\\\",namespace=\\\"monitoring\\\"}[5m]) \\u003e 0\\n\",\n \"severity\": 2\n }\n ],\n \"severity\": 0\n },\n \"prom_eval_interval\": 15,\n \"enable_stime\": \"00:00\",\n \"enable_stimes\": [\n \"00:00\"\n ],\n \"enable_etime\": \"23:59\",\n \"enable_etimes\": [\n \"23:59\"\n ],\n \"enable_days_of_week\": [\n \"1\",\n \"2\",\n \"3\",\n \"4\",\n \"5\",\n \"6\",\n \"0\"\n ],\n \"enable_days_of_weeks\": [\n [\n \"1\",\n \"2\",\n \"3\",\n \"4\",\n \"5\",\n \"6\",\n \"0\"\n ]\n ],\n \"enable_in_bg\": 0,\n \"notify_recovered\": 1,\n \"notify_channels\": [],\n \"notify_groups_obj\": null,\n \"notify_groups\": null,\n \"notify_repeat_step\": 60,\n \"notify_max_number\": 0,\n \"recover_duration\": 0,\n \"callbacks\": [],\n \"runbook_url\": \"\",\n \"append_tags\": [],\n \"annotations\": null,\n \"extra_config\": null,\n \"create_at\": 0,\n \"create_by\": \"\",\n \"update_at\": 0,\n \"update_by\": \"\",\n \"uuid\": 1717556327676304000\n },\n {\n \"id\": 0,\n \"group_id\": 0,\n \"cate\": \"prometheus\",\n \"datasource_ids\": [\n 0\n ],\n \"cluster\": \"\",\n \"name\": \"PrometheusScrapeSampleLimitHit\",\n \"note\": \"Prometheus {{$labels.namespace}}/{{$labels.pod}} has failed {{ printf \\\"%.0f\\\" $value }} scrapes in the last 5m because some targets exceeded the configured sample_limit.\",\n \"prod\": \"metric\",\n \"algorithm\": \"\",\n \"algo_params\": null,\n \"delay\": 0,\n \"severity\": 2,\n \"severities\": [\n 2\n ],\n \"disabled\": 1,\n \"prom_for_duration\": 900,\n \"prom_ql\": \"increase(prometheus_target_scrapes_exceeded_sample_limit_total{job=\\\"prometheus-k8s\\\",namespace=\\\"monitoring\\\"}[5m]) \\u003e 0\\n\",\n \"rule_config\": {\n \"algo_params\": null,\n \"inhibit\": false,\n \"prom_ql\": \"\",\n \"queries\": [\n {\n \"prom_ql\": \"increase(prometheus_target_scrapes_exceeded_sample_limit_total{job=\\\"prometheus-k8s\\\",namespace=\\\"monitoring\\\"}[5m]) \\u003e 0\\n\",\n \"severity\": 2\n }\n ],\n \"severity\": 0\n },\n \"prom_eval_interval\": 15,\n \"enable_stime\": \"00:00\",\n \"enable_stimes\": [\n \"00:00\"\n ],\n \"enable_etime\": \"23:59\",\n \"enable_etimes\": [\n \"23:59\"\n ],\n \"enable_days_of_week\": [\n \"1\",\n \"2\",\n \"3\",\n \"4\",\n \"5\",\n \"6\",\n \"0\"\n ],\n \"enable_days_of_weeks\": [\n [\n \"1\",\n \"2\",\n \"3\",\n \"4\",\n \"5\",\n \"6\",\n \"0\"\n ]\n ],\n \"enable_in_bg\": 0,\n \"notify_recovered\": 1,\n \"notify_channels\": [],\n \"notify_groups_obj\": null,\n \"notify_groups\": null,\n \"notify_repeat_step\": 60,\n \"notify_max_number\": 0,\n \"recover_duration\": 0,\n \"callbacks\": [],\n \"runbook_url\": \"\",\n \"append_tags\": [],\n \"annotations\": null,\n \"extra_config\": null,\n \"create_at\": 0,\n \"create_by\": \"\",\n \"update_at\": 0,\n \"update_by\": \"\",\n \"uuid\": 1717556327676668000\n },\n {\n \"id\": 0,\n \"group_id\": 0,\n \"cate\": \"prometheus\",\n \"datasource_ids\": [\n 0\n ],\n \"cluster\": \"\",\n \"name\": \"PrometheusSDRefreshFailure\",\n \"note\": \"Prometheus {{$labels.namespace}}/{{$labels.pod}} has failed to refresh SD with mechanism {{$labels.mechanism}}.\",\n \"prod\": \"metric\",\n \"algorithm\": \"\",\n \"algo_params\": null,\n \"delay\": 0,\n \"severity\": 2,\n \"severities\": [\n 2\n ],\n \"disabled\": 1,\n \"prom_for_duration\": 1200,\n \"prom_ql\": \"increase(prometheus_sd_refresh_failures_total{job=\\\"prometheus-k8s\\\",namespace=\\\"monitoring\\\"}[10m]) \\u003e 0\\n\",\n \"rule_config\": {\n \"algo_params\": null,\n \"inhibit\": false,\n \"prom_ql\": \"\",\n \"queries\": [\n {\n \"prom_ql\": \"increase(prometheus_sd_refresh_failures_total{job=\\\"prometheus-k8s\\\",namespace=\\\"monitoring\\\"}[10m]) \\u003e 0\\n\",\n \"severity\": 2\n }\n ],\n \"severity\": 0\n },\n \"prom_eval_interval\": 15,\n \"enable_stime\": \"00:00\",\n \"enable_stimes\": [\n \"00:00\"\n ],\n \"enable_etime\": \"23:59\",\n \"enable_etimes\": [\n \"23:59\"\n ],\n \"enable_days_of_week\": [\n \"1\",\n \"2\",\n \"3\",\n \"4\",\n \"5\",\n \"6\",\n \"0\"\n ],\n \"enable_days_of_weeks\": [\n [\n \"1\",\n \"2\",\n \"3\",\n \"4\",\n \"5\",\n \"6\",\n \"0\"\n ]\n ],\n \"enable_in_bg\": 0,\n \"notify_recovered\": 1,\n \"notify_channels\": [],\n \"notify_groups_obj\": null,\n \"notify_groups\": null,\n \"notify_repeat_step\": 60,\n \"notify_max_number\": 0,\n \"recover_duration\": 0,\n \"callbacks\": [],\n \"runbook_url\": \"\",\n \"append_tags\": [],\n \"annotations\": null,\n \"extra_config\": null,\n \"create_at\": 0,\n \"create_by\": \"\",\n \"update_at\": 0,\n \"update_by\": \"\",\n \"uuid\": 1717556327677046000\n },\n {\n \"id\": 0,\n \"group_id\": 0,\n \"cate\": \"prometheus\",\n \"datasource_ids\": [\n 0\n ],\n \"cluster\": \"\",\n \"name\": \"PrometheusTargetLimitHit\",\n \"note\": \"Prometheus {{$labels.namespace}}/{{$labels.pod}} has dropped {{ printf \\\"%.0f\\\" $value }} targets because the number of targets exceeded the configured target_limit.\",\n \"prod\": \"metric\",\n \"algorithm\": \"\",\n \"algo_params\": null,\n \"delay\": 0,\n \"severity\": 2,\n \"severities\": [\n 2\n ],\n \"disabled\": 1,\n \"prom_for_duration\": 900,\n \"prom_ql\": \"increase(prometheus_target_scrape_pool_exceeded_target_limit_total{job=\\\"prometheus-k8s\\\",namespace=\\\"monitoring\\\"}[5m]) \\u003e 0\\n\",\n \"rule_config\": {\n \"algo_params\": null,\n \"inhibit\": false,\n \"prom_ql\": \"\",\n \"queries\": [\n {\n \"prom_ql\": \"increase(prometheus_target_scrape_pool_exceeded_target_limit_total{job=\\\"prometheus-k8s\\\",namespace=\\\"monitoring\\\"}[5m]) \\u003e 0\\n\",\n \"severity\": 2\n }\n ],\n \"severity\": 0\n },\n \"prom_eval_interval\": 15,\n \"enable_stime\": \"00:00\",\n \"enable_stimes\": [\n \"00:00\"\n ],\n \"enable_etime\": \"23:59\",\n \"enable_etimes\": [\n \"23:59\"\n ],\n \"enable_days_of_week\": [\n \"1\",\n \"2\",\n \"3\",\n \"4\",\n \"5\",\n \"6\",\n \"0\"\n ],\n \"enable_days_of_weeks\": [\n [\n \"1\",\n \"2\",\n \"3\",\n \"4\",\n \"5\",\n \"6\",\n \"0\"\n ]\n ],\n \"enable_in_bg\": 0,\n \"notify_recovered\": 1,\n \"notify_channels\": [],\n \"notify_groups_obj\": null,\n \"notify_groups\": null,\n \"notify_repeat_step\": 60,\n \"notify_max_number\": 0,\n \"recover_duration\": 0,\n \"callbacks\": [],\n \"runbook_url\": \"\",\n \"append_tags\": [],\n \"annotations\": null,\n \"extra_config\": null,\n \"create_at\": 0,\n \"create_by\": \"\",\n \"update_at\": 0,\n \"update_by\": \"\",\n \"uuid\": 1717556327677488000\n },\n {\n \"id\": 0,\n \"group_id\": 0,\n \"cate\": \"prometheus\",\n \"datasource_ids\": [\n 0\n ],\n \"cluster\": \"\",\n \"name\": \"PrometheusTargetSyncFailure\",\n \"note\": \"{{ printf \\\"%.0f\\\" $value }} targets in Prometheus {{$labels.namespace}}/{{$labels.pod}} have failed to sync because invalid configuration was supplied.\",\n \"prod\": \"metric\",\n \"algorithm\": \"\",\n \"algo_params\": null,\n \"delay\": 0,\n \"severity\": 1,\n \"severities\": [\n 1\n ],\n \"disabled\": 1,\n \"prom_for_duration\": 300,\n \"prom_ql\": \"increase(prometheus_target_sync_failed_total{job=\\\"prometheus-k8s\\\",namespace=\\\"monitoring\\\"}[30m]) \\u003e 0\\n\",\n \"rule_config\": {\n \"algo_params\": null,\n \"inhibit\": false,\n \"prom_ql\": \"\",\n \"queries\": [\n {\n \"prom_ql\": \"increase(prometheus_target_sync_failed_total{job=\\\"prometheus-k8s\\\",namespace=\\\"monitoring\\\"}[30m]) \\u003e 0\\n\",\n \"severity\": 1\n }\n ],\n \"severity\": 0\n },\n \"prom_eval_interval\": 15,\n \"enable_stime\": \"00:00\",\n \"enable_stimes\": [\n \"00:00\"\n ],\n \"enable_etime\": \"23:59\",\n \"enable_etimes\": [\n \"23:59\"\n ],\n \"enable_days_of_week\": [\n \"1\",\n \"2\",\n \"3\",\n \"4\",\n \"5\",\n \"6\",\n \"0\"\n ],\n \"enable_days_of_weeks\": [\n [\n \"1\",\n \"2\",\n \"3\",\n \"4\",\n \"5\",\n \"6\",\n \"0\"\n ]\n ],\n \"enable_in_bg\": 0,\n \"notify_recovered\": 1,\n \"notify_channels\": [],\n \"notify_groups_obj\": null,\n \"notify_groups\": null,\n \"notify_repeat_step\": 60,\n \"notify_max_number\": 0,\n \"recover_duration\": 0,\n \"callbacks\": [],\n \"runbook_url\": \"\",\n \"append_tags\": [],\n \"annotations\": null,\n \"extra_config\": null,\n \"create_at\": 0,\n \"create_by\": \"\",\n \"update_at\": 0,\n \"update_by\": \"\",\n \"uuid\": 1717556327677914000\n },\n {\n \"id\": 0,\n \"group_id\": 0,\n \"cate\": \"prometheus\",\n \"datasource_ids\": [\n 0\n ],\n \"cluster\": \"\",\n \"name\": \"PrometheusTSDBCompactionsFailing\",\n \"note\": \"Prometheus {{$labels.namespace}}/{{$labels.pod}} has detected {{$value | humanize}} compaction failures over the last 3h.\",\n \"prod\": \"metric\",\n \"algorithm\": \"\",\n \"algo_params\": null,\n \"delay\": 0,\n \"severity\": 2,\n \"severities\": [\n 2\n ],\n \"disabled\": 1,\n \"prom_for_duration\": 14400,\n \"prom_ql\": \"increase(prometheus_tsdb_compactions_failed_total{job=\\\"prometheus-k8s\\\",namespace=\\\"monitoring\\\"}[3h]) \\u003e 0\\n\",\n \"rule_config\": {\n \"algo_params\": null,\n \"inhibit\": false,\n \"prom_ql\": \"\",\n \"queries\": [\n {\n \"prom_ql\": \"increase(prometheus_tsdb_compactions_failed_total{job=\\\"prometheus-k8s\\\",namespace=\\\"monitoring\\\"}[3h]) \\u003e 0\\n\",\n \"severity\": 2\n }\n ],\n \"severity\": 0\n },\n \"prom_eval_interval\": 15,\n \"enable_stime\": \"00:00\",\n \"enable_stimes\": [\n \"00:00\"\n ],\n \"enable_etime\": \"23:59\",\n \"enable_etimes\": [\n \"23:59\"\n ],\n \"enable_days_of_week\": [\n \"1\",\n \"2\",\n \"3\",\n \"4\",\n \"5\",\n \"6\",\n \"0\"\n ],\n \"enable_days_of_weeks\": [\n [\n \"1\",\n \"2\",\n \"3\",\n \"4\",\n \"5\",\n \"6\",\n \"0\"\n ]\n ],\n \"enable_in_bg\": 0,\n \"notify_recovered\": 1,\n \"notify_channels\": [],\n \"notify_groups_obj\": null,\n \"notify_groups\": null,\n \"notify_repeat_step\": 60,\n \"notify_max_number\": 0,\n \"recover_duration\": 0,\n \"callbacks\": [],\n \"runbook_url\": \"\",\n \"append_tags\": [],\n \"annotations\": null,\n \"extra_config\": null,\n \"create_at\": 0,\n \"create_by\": \"\",\n \"update_at\": 0,\n \"update_by\": \"\",\n \"uuid\": 1717556327678338000\n },\n {\n \"id\": 0,\n \"group_id\": 0,\n \"cate\": \"prometheus\",\n \"datasource_ids\": [\n 0\n ],\n \"cluster\": \"\",\n \"name\": \"PrometheusTSDBReloadsFailing\",\n \"note\": \"Prometheus {{$labels.namespace}}/{{$labels.pod}} has detected {{$value | humanize}} reload failures over the last 3h.\",\n \"prod\": \"metric\",\n \"algorithm\": \"\",\n \"algo_params\": null,\n \"delay\": 0,\n \"severity\": 2,\n \"severities\": [\n 2\n ],\n \"disabled\": 1,\n \"prom_for_duration\": 14400,\n \"prom_ql\": \"increase(prometheus_tsdb_reloads_failures_total{job=\\\"prometheus-k8s\\\",namespace=\\\"monitoring\\\"}[3h]) \\u003e 0\\n\",\n \"rule_config\": {\n \"algo_params\": null,\n \"inhibit\": false,\n \"prom_ql\": \"\",\n \"queries\": [\n {\n \"prom_ql\": \"increase(prometheus_tsdb_reloads_failures_total{job=\\\"prometheus-k8s\\\",namespace=\\\"monitoring\\\"}[3h]) \\u003e 0\\n\",\n \"severity\": 2\n }\n ],\n \"severity\": 0\n },\n \"prom_eval_interval\": 15,\n \"enable_stime\": \"00:00\",\n \"enable_stimes\": [\n \"00:00\"\n ],\n \"enable_etime\": \"23:59\",\n \"enable_etimes\": [\n \"23:59\"\n ],\n \"enable_days_of_week\": [\n \"1\",\n \"2\",\n \"3\",\n \"4\",\n \"5\",\n \"6\",\n \"0\"\n ],\n \"enable_days_of_weeks\": [\n [\n \"1\",\n \"2\",\n \"3\",\n \"4\",\n \"5\",\n \"6\",\n \"0\"\n ]\n ],\n \"enable_in_bg\": 0,\n \"notify_recovered\": 1,\n \"notify_channels\": [],\n \"notify_groups_obj\": null,\n \"notify_groups\": null,\n \"notify_repeat_step\": 60,\n \"notify_max_number\": 0,\n \"recover_duration\": 0,\n \"callbacks\": [],\n \"runbook_url\": \"\",\n \"append_tags\": [],\n \"annotations\": null,\n \"extra_config\": null,\n \"create_at\": 0,\n \"create_by\": \"\",\n \"update_at\": 0,\n \"update_by\": \"\",\n \"uuid\": 1717556327678713000\n }\n]"
},
{
"path": "integrations/Kubernetes/dashboards/APIServer.json",
"content": "{\n \"id\": 0,\n \"group_id\": 0,\n \"name\": \"Kubernetes / API Server\",\n \"ident\": \"\",\n \"tags\": \"Categraf\",\n \"create_at\": 0,\n \"create_by\": \"\",\n \"update_at\": 0,\n \"update_by\": \"\",\n \"configs\": {\n \"links\": [],\n \"panels\": [\n {\n \"custom\": {\n \"calc\": \"lastNotNull\",\n \"colorMode\": \"value\",\n \"displayMode\": \"seriesToRows\",\n \"showHeader\": true\n },\n \"datasourceCate\": \"prometheus\",\n \"datasourceValue\": \"${datasource}\",\n \"description\": \"apiserver的实例健康状态,0表示down,1表示up\",\n \"id\": \"98f46bc1-c078-40f2-915c-f0836957bf2f\",\n \"layout\": {\n \"h\": 8,\n \"i\": \"98f46bc1-c078-40f2-915c-f0836957bf2f\",\n \"isResizable\": true,\n \"w\": 12,\n \"x\": 0,\n \"y\": 0\n },\n \"links\": [],\n \"name\": \"API Server - Health Status\",\n \"options\": {\n \"standardOptions\": {\n \"util\": \"none\"\n },\n \"valueMappings\": [\n {\n \"options\": {\n \"0\": {\n \"text\": \"DOWN\"\n },\n \"1\": {\n \"text\": \"UP\"\n }\n },\n \"type\": \"value\"\n },\n {\n \"match\": {\n \"special\": 1\n },\n \"result\": {\n \"color\": \"#3fc453\",\n \"text\": \"UP\"\n },\n \"type\": \"special\"\n },\n {\n \"match\": {\n \"special\": 0\n },\n \"result\": {\n \"color\": \"#f80202\",\n \"text\": \"DOWN\"\n },\n \"type\": \"special\"\n }\n ]\n },\n \"overrides\": [\n {}\n ],\n \"targets\": [\n {\n \"expr\": \"up{job=\\\"apiserver\\\"}\",\n \"legend\": \"{{ instance }}\",\n \"refId\": \"A\"\n }\n ],\n \"type\": \"table\",\n \"version\": \"2.0.0\"\n },\n {\n \"custom\": {\n \"calc\": \"lastNotNull\",\n \"colorMode\": \"value\",\n \"columns\": [\n \"group\",\n \"version\",\n \"resource\",\n \"removed_release\"\n ],\n \"displayMode\": \"labelsOfSeriesToRows\",\n \"showHeader\": true,\n \"sortOrder\": \"ascend\"\n },\n \"datasourceCate\": \"prometheus\",\n \"datasourceValue\": \"${datasource}\",\n \"description\": \"当前版本apiserver使用,未来版本中要移除的资源\",\n \"id\": \"73beb13a-bd10-4a68-bb9e-5b9ab63da154\",\n \"layout\": {\n \"h\": 8,\n \"i\": \"73beb13a-bd10-4a68-bb9e-5b9ab63da154\",\n \"isResizable\": true,\n \"w\": 12,\n \"x\": 12,\n \"y\": 0\n },\n \"links\": [],\n \"name\": \"Deprecated Kubernetes Resources\",\n \"options\": {\n \"standardOptions\": {}\n },\n \"overrides\": [\n {}\n ],\n \"targets\": [\n {\n \"expr\": \"apiserver_requested_deprecated_apis{job=\\\"apiserver\\\"}\",\n \"legend\": \"\",\n \"refId\": \"A\"\n }\n ],\n \"type\": \"table\",\n \"version\": \"2.0.0\"\n },\n {\n \"custom\": {\n \"drawStyle\": \"lines\",\n \"fillOpacity\": 0.25,\n \"gradientMode\": \"none\",\n \"lineInterpolation\": \"smooth\",\n \"lineWidth\": 1,\n \"stack\": \"off\"\n },\n \"datasourceCate\": \"prometheus\",\n \"datasourceValue\": \"${datasource}\",\n \"description\": \"按照返回码分类统计apiserver请求数\",\n \"id\": \"1cfa42b1-9dcf-471c-90ff-8ffe656d4b11\",\n \"layout\": {\n \"h\": 8,\n \"i\": \"1cfa42b1-9dcf-471c-90ff-8ffe656d4b11\",\n \"isResizable\": true,\n \"w\": 12,\n \"x\": 0,\n \"y\": 8\n },\n \"links\": [],\n \"name\": \"API Server - HTTP Requests by code\",\n \"options\": {\n \"legend\": {\n \"displayMode\": \"list\",\n \"placement\": \"bottom\"\n },\n \"standardOptions\": {\n \"util\": \"none\"\n },\n \"thresholds\": {\n \"steps\": []\n },\n \"tooltip\": {\n \"mode\": \"all\",\n \"sort\": \"none\"\n }\n },\n \"targets\": [\n {\n \"expr\": \"sum by (instance,code) (rate(apiserver_request_total{job=\\\"apiserver\\\"}[5m]))\",\n \"legend\": \"{{ instance }} {{ code }}\",\n \"refId\": \"A\"\n }\n ],\n \"type\": \"timeseries\",\n \"version\": \"2.0.0\"\n },\n {\n \"custom\": {\n \"drawStyle\": \"lines\",\n \"fillOpacity\": 0.25,\n \"gradientMode\": \"none\",\n \"lineInterpolation\": \"smooth\",\n \"lineWidth\": 1,\n \"stack\": \"off\"\n },\n \"datasourceCate\": \"prometheus\",\n \"datasourceValue\": \"${datasource}\",\n \"description\": \"按照请求动作分类统计apiserver的请求数\",\n \"id\": \"94def0cb-0b86-42f7-a4b2-dde714bbb918\",\n \"layout\": {\n \"h\": 8,\n \"i\": \"94def0cb-0b86-42f7-a4b2-dde714bbb918\",\n \"isResizable\": true,\n \"w\": 12,\n \"x\": 12,\n \"y\": 8\n },\n \"links\": [],\n \"name\": \"API Server - HTTP Requests by verb\",\n \"options\": {\n \"legend\": {\n \"displayMode\": \"list\",\n \"placement\": \"bottom\"\n },\n \"standardOptions\": {\n \"util\": \"none\"\n },\n \"thresholds\": {\n \"steps\": []\n },\n \"tooltip\": {\n \"mode\": \"all\",\n \"sort\": \"desc\"\n }\n },\n \"targets\": [\n {\n \"expr\": \"sum by (instance,verb) (rate(apiserver_request_total{job=\\\"apiserver\\\"}[5m]))\",\n \"legend\": \"{{ instance }} {{ verb }}\",\n \"refId\": \"A\"\n }\n ],\n \"type\": \"timeseries\",\n \"version\": \"2.0.0\"\n },\n {\n \"custom\": {\n \"drawStyle\": \"lines\",\n \"fillOpacity\": 0.25,\n \"gradientMode\": \"none\",\n \"lineInterpolation\": \"smooth\",\n \"lineWidth\": 1,\n \"stack\": \"off\"\n },\n \"datasourceCate\": \"prometheus\",\n \"datasourceValue\": \"${datasource}\",\n \"description\": \"当前并发请求apiserver的数量\",\n \"id\": \"fb6266a3-3da0-4310-bfe8-c64a53db5db3\",\n \"layout\": {\n \"h\": 8,\n \"i\": \"ce5a15ad-11c6-44a2-a071-be57009162e1\",\n \"isResizable\": true,\n \"w\": 12,\n \"x\": 0,\n \"y\": 16\n },\n \"links\": [],\n \"name\": \"API Server - Current Inflight Requests by kind\",\n \"options\": {\n \"legend\": {\n \"displayMode\": \"list\",\n \"placement\": \"bottom\"\n },\n \"standardOptions\": {\n \"util\": \"none\"\n },\n \"thresholds\": {\n \"steps\": []\n },\n \"tooltip\": {\n \"mode\": \"all\",\n \"sort\": \"desc\"\n }\n },\n \"targets\": [\n {\n \"expr\": \"apiserver_current_inflight_requests{job=\\\"apiserver\\\"}\",\n \"legend\": \"{{ instance }} {{ request_kind }}\",\n \"refId\": \"A\"\n }\n ],\n \"type\": \"timeseries\",\n \"version\": \"2.0.0\"\n },\n {\n \"custom\": {\n \"drawStyle\": \"lines\",\n \"fillOpacity\": 0.25,\n \"gradientMode\": \"none\",\n \"lineInterpolation\": \"smooth\",\n \"lineWidth\": 1,\n \"stack\": \"off\"\n },\n \"datasourceCate\": \"prometheus\",\n \"datasourceValue\": \"${datasource}\",\n \"description\": \"apiserver的响应延迟,按请求动作分类统计\",\n \"id\": \"045dca2d-d69b-47a7-b25e-656adb357e11\",\n \"layout\": {\n \"h\": 8,\n \"i\": \"045dca2d-d69b-47a7-b25e-656adb357e11\",\n \"isResizable\": true,\n \"w\": 12,\n \"x\": 12,\n \"y\": 16\n },\n \"links\": [],\n \"name\": \"API Server - HTTP Requests Latency by verb\",\n \"options\": {\n \"legend\": {\n \"displayMode\": \"list\",\n \"placement\": \"bottom\"\n },\n \"standardOptions\": {\n \"util\": \"milliseconds\"\n },\n \"thresholds\": {\n \"steps\": []\n },\n \"tooltip\": {\n \"mode\": \"all\",\n \"sort\": \"none\"\n }\n },\n \"targets\": [\n {\n \"expr\": \"histogram_quantile(0.9, sum(rate(apiserver_request_duration_seconds_bucket{job=\\\"apiserver\\\"}[5m])) by (instance,verb,le))*1000\",\n \"legend\": \"{{ instance }} {{ verb }}\",\n \"refId\": \"A\"\n }\n ],\n \"type\": \"timeseries\",\n \"version\": \"2.0.0\"\n },\n {\n \"custom\": {\n \"drawStyle\": \"lines\",\n \"fillOpacity\": 0.25,\n \"gradientMode\": \"none\",\n \"lineInterpolation\": \"smooth\",\n \"lineWidth\": 1,\n \"stack\": \"off\"\n },\n \"datasourceCate\": \"prometheus\",\n \"datasourceValue\": \"${datasource}\",\n \"description\": \"apiserver的响应延迟(非watch请求)\",\n \"id\": \"1e775704-9ee4-45ce-9d24-b49af89fb5c7\",\n \"layout\": {\n \"h\": 8,\n \"i\": \"1e775704-9ee4-45ce-9d24-b49af89fb5c7\",\n \"isResizable\": true,\n \"w\": 12,\n \"x\": 0,\n \"y\": 24\n },\n \"links\": [],\n \"name\": \"API Server - HTTP Requests Latency by instance\",\n \"options\": {\n \"legend\": {\n \"displayMode\": \"list\",\n \"placement\": \"bottom\"\n },\n \"standardOptions\": {\n \"util\": \"milliseconds\"\n },\n \"thresholds\": {\n \"steps\": []\n },\n \"tooltip\": {\n \"mode\": \"all\",\n \"sort\": \"desc\"\n }\n },\n \"targets\": [\n {\n \"expr\": \"histogram_quantile(0.9, sum(rate(apiserver_request_duration_seconds_bucket {job=\\\"apiserver\\\",verb!=\\\"WATCH\\\"}[5m])) by (instance,le))*1000\",\n \"legend\": \"{{ instance }}\",\n \"refId\": \"A\"\n }\n ],\n \"type\": \"timeseries\",\n \"version\": \"2.0.0\"\n },\n {\n \"custom\": {\n \"drawStyle\": \"lines\",\n \"fillOpacity\": 0.25,\n \"gradientMode\": \"none\",\n \"lineInterpolation\": \"smooth\",\n \"lineWidth\": 1,\n \"stack\": \"off\"\n },\n \"datasourceCate\": \"prometheus\",\n \"datasourceValue\": \"${datasource}\",\n \"description\": \"apiserver的5xx错误率,按请求动作分类统计\",\n \"id\": \"1ca62e0b-72df-47d1-93ba-048ed49e9cb5\",\n \"layout\": {\n \"h\": 8,\n \"i\": \"1ca62e0b-72df-47d1-93ba-048ed49e9cb5\",\n \"isResizable\": true,\n \"w\": 12,\n \"x\": 12,\n \"y\": 24\n },\n \"links\": [],\n \"name\": \"API Server - Errors by verb\",\n \"options\": {\n \"legend\": {\n \"displayMode\": \"list\",\n \"placement\": \"bottom\"\n },\n \"standardOptions\": {\n \"util\": \"none\"\n },\n \"thresholds\": {\n \"steps\": []\n },\n \"tooltip\": {\n \"mode\": \"all\",\n \"sort\": \"desc\"\n }\n },\n \"targets\": [\n {\n \"expr\": \"sum by(instance,verb) (rate(apiserver_request_total{code=~\\\"5..\\\",job=\\\"apiserver\\\"}[5m]))\\n / sum by(instance,verb) (rate(apiserver_request_total{job=\\\"apiserver\\\"}[5m]))\",\n \"legend\": \"{{ instance }} {{ verb }}\",\n \"refId\": \"A\"\n }\n ],\n \"type\": \"timeseries\",\n \"version\": \"2.0.0\"\n },\n {\n \"custom\": {\n \"drawStyle\": \"lines\",\n \"fillOpacity\": 0.25,\n \"gradientMode\": \"none\",\n \"lineInterpolation\": \"smooth\",\n \"lineWidth\": 1,\n \"stack\": \"off\"\n },\n \"datasourceCate\": \"prometheus\",\n \"datasourceValue\": \"${datasource}\",\n \"description\": \"apiserver的5xx 错误率(5xx请求数/总请求数)\",\n \"id\": \"92a209a1-7d30-4627-9ae1-55ded5095ed7\",\n \"layout\": {\n \"h\": 8,\n \"i\": \"92a209a1-7d30-4627-9ae1-55ded5095ed7\",\n \"isResizable\": true,\n \"w\": 12,\n \"x\": 0,\n \"y\": 32\n },\n \"links\": [],\n \"name\": \"API Server - Errors by Instance\",\n \"options\": {\n \"legend\": {\n \"displayMode\": \"list\",\n \"placement\": \"bottom\"\n },\n \"standardOptions\": {\n \"util\": \"none\"\n },\n \"thresholds\": {\n \"steps\": []\n },\n \"tooltip\": {\n \"mode\": \"all\",\n \"sort\": \"desc\"\n }\n },\n \"targets\": [\n {\n \"expr\": \"sum by(instance) (rate(apiserver_request_total{code=~\\\"5..\\\", job=\\\"apiserver\\\"}[5m]))\\n / sum by(instance) (rate(apiserver_request_total{job=\\\"apiserver\\\"}[5m]))\",\n \"legend\": \"{{ instance }}\",\n \"refId\": \"A\"\n }\n ],\n \"type\": \"timeseries\",\n \"version\": \"2.0.0\"\n },\n {\n \"custom\": {\n \"drawStyle\": \"lines\",\n \"fillOpacity\": 0.25,\n \"gradientMode\": \"none\",\n \"lineInterpolation\": \"smooth\",\n \"lineWidth\": 1,\n \"stack\": \"off\"\n },\n \"datasourceCate\": \"prometheus\",\n \"datasourceValue\": \"${datasource}\",\n \"description\": \"apiserver工作队列深度,越接近0越好\",\n \"id\": \"83f22cf4-9c65-4ad3-900b-fa6fc914dd88\",\n \"layout\": {\n \"h\": 8,\n \"i\": \"83f22cf4-9c65-4ad3-900b-fa6fc914dd88\",\n \"isResizable\": true,\n \"w\": 12,\n \"x\": 12,\n \"y\": 32\n },\n \"links\": [],\n \"name\": \"API Server - Work Queue by instance\",\n \"options\": {\n \"legend\": {\n \"displayMode\": \"list\",\n \"placement\": \"bottom\"\n },\n \"standardOptions\": {\n \"util\": \"none\"\n },\n \"thresholds\": {\n \"steps\": []\n },\n \"tooltip\": {\n \"mode\": \"all\",\n \"sort\": \"desc\"\n }\n },\n \"targets\": [\n {\n \"expr\": \"sum(rate(workqueue_depth{job=\\\"apiserver\\\"}[5m])) by (instance,name)\",\n \"legend\": \"{{ instance }} {{ name }}\",\n \"refId\": \"A\"\n }\n ],\n \"type\": \"timeseries\",\n \"version\": \"2.0.0\"\n },\n {\n \"custom\": {\n \"drawStyle\": \"lines\",\n \"fillOpacity\": 0.25,\n \"gradientMode\": \"none\",\n \"lineInterpolation\": \"smooth\",\n \"lineWidth\": 1,\n \"stack\": \"normal\"\n },\n \"datasourceCate\": \"prometheus\",\n \"datasourceValue\": \"${datasource}\",\n \"description\": \"5分钟内apiserver的请求数统计\",\n \"id\": \"3e9f9df7-d9fb-4791-b3b2-2c52678f060f\",\n \"layout\": {\n \"h\": 8,\n \"i\": \"3e9f9df7-d9fb-4791-b3b2-2c52678f060f\",\n \"isResizable\": true,\n \"w\": 12,\n \"x\": 0,\n \"y\": 40\n },\n \"links\": [],\n \"name\": \"API Server - HTTP Requests by instance\",\n \"options\": {\n \"legend\": {\n \"displayMode\": \"list\",\n \"placement\": \"bottom\"\n },\n \"standardOptions\": {\n \"util\": \"none\"\n },\n \"thresholds\": {\n \"steps\": []\n },\n \"tooltip\": {\n \"mode\": \"all\",\n \"sort\": \"desc\"\n }\n },\n \"targets\": [\n {\n \"expr\": \"sum(rate(apiserver_request_total{job=\\\"apiserver\\\"}[5m])) by (instance)\",\n \"legend\": \"{{ instance }}\",\n \"refId\": \"A\"\n }\n ],\n \"type\": \"timeseries\",\n \"version\": \"2.0.0\"\n },\n {\n \"custom\": {\n \"drawStyle\": \"lines\",\n \"fillOpacity\": 0.25,\n \"gradientMode\": \"none\",\n \"lineInterpolation\": \"smooth\",\n \"lineWidth\": 1,\n \"stack\": \"off\"\n },\n \"datasourceCate\": \"prometheus\",\n \"datasourceValue\": \"${datasource}\",\n \"description\": \"apiserver的cpu使用率\",\n \"id\": \"3d5c1ae5-e640-4986-9202-78258169bffb\",\n \"layout\": {\n \"h\": 8,\n \"i\": \"3d5c1ae5-e640-4986-9202-78258169bffb\",\n \"isResizable\": true,\n \"w\": 12,\n \"x\": 12,\n \"y\": 40\n },\n \"links\": [],\n \"name\": \"API Server - CPU Usage by instance\",\n \"options\": {\n \"legend\": {\n \"displayMode\": \"list\",\n \"placement\": \"bottom\"\n },\n \"standardOptions\": {\n \"decimals\": 2,\n \"util\": \"percent\"\n },\n \"thresholds\": {\n \"steps\": []\n },\n \"tooltip\": {\n \"mode\": \"all\",\n \"sort\": \"desc\"\n }\n },\n \"targets\": [\n {\n \"expr\": \"rate(process_cpu_seconds_total{job=\\\"apiserver\\\"}[5m])\",\n \"legend\": \"{{ instance }}\",\n \"refId\": \"A\"\n }\n ],\n \"type\": \"timeseries\",\n \"version\": \"2.0.0\"\n },\n {\n \"custom\": {\n \"drawStyle\": \"lines\",\n \"fillOpacity\": 0.25,\n \"gradientMode\": \"none\",\n \"lineInterpolation\": \"smooth\",\n \"lineWidth\": 1,\n \"stack\": \"off\"\n },\n \"datasourceCate\": \"prometheus\",\n \"datasourceValue\": \"${datasource}\",\n \"description\": \"apiserver的内存使用量\",\n \"id\": \"1550a2d5-c808-4174-865a-a41b2c16b486\",\n \"layout\": {\n \"h\": 8,\n \"i\": \"1550a2d5-c808-4174-865a-a41b2c16b486\",\n \"isResizable\": true,\n \"w\": 12,\n \"x\": 0,\n \"y\": 48\n },\n \"links\": [],\n \"name\": \"API Server - Memory Usage by instance\",\n \"options\": {\n \"legend\": {\n \"displayMode\": \"list\",\n \"placement\": \"bottom\"\n },\n \"standardOptions\": {\n \"util\": \"bytesIEC\"\n },\n \"thresholds\": {\n \"steps\": []\n },\n \"tooltip\": {\n \"mode\": \"all\",\n \"sort\": \"desc\"\n }\n },\n \"targets\": [\n {\n \"expr\": \"process_resident_memory_bytes{job=\\\"apiserver\\\"}\",\n \"legend\": \"{{ instance }}\",\n \"refId\": \"A\"\n }\n ],\n \"type\": \"timeseries\",\n \"version\": \"2.0.0\"\n }\n ],\n \"var\": [\n {\n \"definition\": \"prometheus\",\n \"name\": \"datasource\",\n \"type\": \"datasource\"\n }\n ],\n \"version\": \"3.0.0\"\n },\n \"public\": 0,\n \"public_cate\": 0,\n \"bgids\": null,\n \"built_in\": 0,\n \"hide\": 0,\n \"uuid\": 1717556327680034000\n}"
},
{
"path": "integrations/Kubernetes/dashboards/ControllerManager.json",
"content": "{\n \"id\": 0,\n \"group_id\": 0,\n \"name\": \"Kubernetes / Controller Manager\",\n \"ident\": \"\",\n \"tags\": \"Categraf\",\n \"create_at\": 0,\n \"create_by\": \"\",\n \"update_at\": 0,\n \"update_by\": \"\",\n \"configs\": {\n \"links\": [],\n \"panels\": [\n {\n \"custom\": {\n \"calc\": \"lastNotNull\",\n \"colorMode\": \"value\",\n \"displayMode\": \"seriesToRows\",\n \"showHeader\": true\n },\n \"datasourceCate\": \"prometheus\",\n \"datasourceValue\": \"${datasource}\",\n \"description\": \"controller manager健康状态\",\n \"id\": \"5d6560c5-6137-4632-bb88-ff8c9cf42e9d\",\n \"layout\": {\n \"h\": 6,\n \"i\": \"5d6560c5-6137-4632-bb88-ff8c9cf42e9d\",\n \"isResizable\": true,\n \"w\": 12,\n \"x\": 0,\n \"y\": 0\n },\n \"links\": [],\n \"name\": \"Controller Manager - Health Status\",\n \"options\": {\n \"standardOptions\": {\n \"util\": \"none\"\n },\n \"valueMappings\": [\n {\n \"options\": {\n \"0\": {\n \"text\": \"DOWN\"\n },\n \"1\": {\n \"text\": \"UP\"\n }\n },\n \"type\": \"value\"\n },\n {\n \"match\": {\n \"special\": 1\n },\n \"result\": {\n \"color\": \"#3fc453\",\n \"text\": \"UP\"\n },\n \"type\": \"special\"\n },\n {\n \"match\": {\n \"special\": 0\n },\n \"result\": {\n \"color\": \"#f60707\",\n \"text\": \"DOWN\"\n },\n \"type\": \"special\"\n }\n ]\n },\n \"overrides\": [\n {}\n ],\n \"targets\": [\n {\n \"expr\": \"up{job=\\\"controller-manager\\\"}\",\n \"legend\": \"{{ instance }}\",\n \"refId\": \"A\"\n }\n ],\n \"type\": \"table\",\n \"version\": \"2.0.0\"\n },\n {\n \"custom\": {\n \"calc\": \"lastNotNull\",\n \"colorMode\": \"value\",\n \"displayMode\": \"seriesToRows\",\n \"showHeader\": true\n },\n \"datasourceCate\": \"prometheus\",\n \"datasourceValue\": \"${datasource}\",\n \"description\": \"controller manager 主从状态\",\n \"id\": \"62e3b249-fefe-4f32-8baf-394eac053f2a\",\n \"layout\": {\n \"h\": 6,\n \"i\": \"a5d1ef0c-83e3-4194-b242-d5c51ba4bdd2\",\n \"isResizable\": true,\n \"w\": 12,\n \"x\": 12,\n \"y\": 0\n },\n \"links\": [],\n \"name\": \"Controller Manager - Member Status\",\n \"options\": {\n \"standardOptions\": {\n \"util\": \"none\"\n },\n \"valueMappings\": [\n {\n \"options\": {\n \"0\": {\n \"text\": \"DOWN\"\n },\n \"1\": {\n \"text\": \"UP\"\n }\n },\n \"result\": {\n \"text\": \"val\"\n },\n \"type\": \"value\"\n },\n {\n \"match\": {\n \"special\": 1\n },\n \"result\": {\n \"color\": \"#3fc453\",\n \"text\": \"MASTER\"\n },\n \"type\": \"special\"\n },\n {\n \"match\": {\n \"special\": 0\n },\n \"result\": {\n \"color\": \"#9470ff\",\n \"text\": \"BACKUP\"\n },\n \"type\": \"special\"\n }\n ]\n },\n \"overrides\": [\n {\n \"properties\": {\n \"valueMappings\": []\n }\n }\n ],\n \"targets\": [\n {\n \"expr\": \"leader_election_master_status{job=\\\"controller-manager\\\"}\",\n \"legend\": \"{{ instance }}\",\n \"refId\": \"A\"\n }\n ],\n \"type\": \"table\",\n \"version\": \"2.0.0\"\n },\n {\n \"custom\": {\n \"drawStyle\": \"lines\",\n \"fillOpacity\": 0.25,\n \"gradientMode\": \"none\",\n \"lineInterpolation\": \"smooth\",\n \"lineWidth\": 1,\n \"stack\": \"off\"\n },\n \"datasourceCate\": \"prometheus\",\n \"datasourceValue\": \"${datasource}\",\n \"description\": \"controller manager 请求量 按返回码统计\",\n \"id\": \"94713dc3-acb7-43b5-ae2f-399b2da61763\",\n \"layout\": {\n \"h\": 8,\n \"i\": \"94713dc3-acb7-43b5-ae2f-399b2da61763\",\n \"isResizable\": true,\n \"w\": 12,\n \"x\": 0,\n \"y\": 6\n },\n \"links\": [],\n \"name\": \"Controller Manager - Requests by code\",\n \"options\": {\n \"legend\": {\n \"displayMode\": \"list\",\n \"placement\": \"bottom\"\n },\n \"standardOptions\": {\n \"util\": \"none\"\n },\n \"thresholds\": {\n \"steps\": []\n },\n \"tooltip\": {\n \"mode\": \"all\",\n \"sort\": \"desc\"\n }\n },\n \"targets\": [\n {\n \"expr\": \"sum(rate(rest_client_requests_total{job=\\\"controller-manager\\\"}[5m])) by (instance,code)\",\n \"legend\": \"{{ instance }} {{ code }}\",\n \"refId\": \"A\"\n }\n ],\n \"type\": \"timeseries\",\n \"version\": \"2.0.0\"\n },\n {\n \"custom\": {\n \"drawStyle\": \"lines\",\n \"fillOpacity\": 0.25,\n \"gradientMode\": \"none\",\n \"lineInterpolation\": \"smooth\",\n \"lineWidth\": 1,\n \"stack\": \"off\"\n },\n \"datasourceCate\": \"prometheus\",\n \"datasourceValue\": \"${datasource}\",\n \"description\": \"controller manager请求量,按请求类型统计\",\n \"id\": \"a6928b49-cf0a-443e-a8fd-b999685df0be\",\n \"layout\": {\n \"h\": 8,\n \"i\": \"a6928b49-cf0a-443e-a8fd-b999685df0be\",\n \"isResizable\": true,\n \"w\": 12,\n \"x\": 12,\n \"y\": 6\n },\n \"links\": [],\n \"name\": \"Controller Manager - Requests by verb\",\n \"options\": {\n \"legend\": {\n \"displayMode\": \"list\",\n \"placement\": \"bottom\"\n },\n \"standardOptions\": {\n \"util\": \"none\"\n },\n \"thresholds\": {\n \"steps\": []\n },\n \"tooltip\": {\n \"mode\": \"all\",\n \"sort\": \"desc\"\n }\n },\n \"targets\": [\n {\n \"expr\": \"sum(rate(rest_client_requests_total{job=\\\"controller-manager\\\"}[5m])) by (instance,method)\",\n \"legend\": \"{{ instance }} {{ method }}\",\n \"refId\": \"A\"\n }\n ],\n \"type\": \"timeseries\",\n \"version\": \"2.0.0\"\n },\n {\n \"custom\": {\n \"drawStyle\": \"lines\",\n \"fillOpacity\": 0.25,\n \"gradientMode\": \"none\",\n \"lineInterpolation\": \"smooth\",\n \"lineWidth\": 1,\n \"stack\": \"off\"\n },\n \"datasourceCate\": \"prometheus\",\n \"datasourceValue\": \"${datasource}\",\n \"description\": \"controller manager请求(apiserver)量\",\n \"id\": \"69690063-d044-4547-9f5f-126e5f8bf55a\",\n \"layout\": {\n \"h\": 8,\n \"i\": \"69690063-d044-4547-9f5f-126e5f8bf55a\",\n \"isResizable\": true,\n \"w\": 12,\n \"x\": 0,\n \"y\": 14\n },\n \"links\": [],\n \"name\": \"Controller Manager -Requests by instance\",\n \"options\": {\n \"legend\": {\n \"displayMode\": \"list\",\n \"placement\": \"bottom\"\n },\n \"standardOptions\": {\n \"util\": \"none\"\n },\n \"thresholds\": {\n \"steps\": []\n },\n \"tooltip\": {\n \"mode\": \"all\",\n \"sort\": \"desc\"\n }\n },\n \"targets\": [\n {\n \"expr\": \"sum(rate(rest_client_requests_total{job=\\\"controller-manager\\\"}[5m])) by (instance)\",\n \"legend\": \"{{ instance }}\",\n \"refId\": \"A\"\n }\n ],\n \"type\": \"timeseries\",\n \"version\": \"2.0.0\"\n },\n {\n \"custom\": {\n \"drawStyle\": \"lines\",\n \"fillOpacity\": 0.25,\n \"gradientMode\": \"none\",\n \"lineInterpolation\": \"smooth\",\n \"lineWidth\": 1,\n \"stack\": \"off\"\n },\n \"datasourceCate\": \"prometheus\",\n \"datasourceValue\": \"${datasource}\",\n \"description\": \"controller manager 90分位请求apiserver延迟,按请求类型统计\",\n \"id\": \"053d10f3-1113-40e0-85aa-dfbabb706995\",\n \"layout\": {\n \"h\": 8,\n \"i\": \"d5a67103-9930-46e0-97e1-296e0d71e30e\",\n \"isResizable\": true,\n \"w\": 12,\n \"x\": 12,\n \"y\": 14\n },\n \"links\": [],\n \"name\": \"Controller Manager - Requests Latancy by verb\",\n \"options\": {\n \"legend\": {\n \"displayMode\": \"list\",\n \"placement\": \"bottom\"\n },\n \"standardOptions\": {\n \"util\": \"milliseconds\"\n },\n \"thresholds\": {\n \"steps\": []\n },\n \"tooltip\": {\n \"mode\": \"all\",\n \"sort\": \"desc\"\n }\n },\n \"targets\": [\n {\n \"expr\": \"histogram_quantile(0.9, sum(rate(rest_client_request_duration_seconds_bucket{job=\\\"controller-manager\\\"}[5m])) by (instance,verb,le))*1000\",\n \"legend\": \"{{ instance }} {{ verb }}\",\n \"refId\": \"A\"\n }\n ],\n \"type\": \"timeseries\",\n \"version\": \"2.0.0\"\n },\n {\n \"custom\": {\n \"drawStyle\": \"lines\",\n \"fillOpacity\": 0.25,\n \"gradientMode\": \"none\",\n \"lineInterpolation\": \"smooth\",\n \"lineWidth\": 1,\n \"stack\": \"off\"\n },\n \"datasourceCate\": \"prometheus\",\n \"datasourceValue\": \"${datasource}\",\n \"description\": \"controller manager90分位请求延迟,按url统计\",\n \"id\": \"c86ed101-a91c-4478-b67a-7182a5e856d1\",\n \"layout\": {\n \"h\": 8,\n \"i\": \"2924bb3f-20c3-4f56-96ff-76d473743d8b\",\n \"isResizable\": true,\n \"w\": 12,\n \"x\": 0,\n \"y\": 22\n },\n \"links\": [],\n \"name\": \"Controller Manager - Requests Latancy by url\",\n \"options\": {\n \"legend\": {\n \"displayMode\": \"list\",\n \"placement\": \"bottom\"\n },\n \"standardOptions\": {\n \"util\": \"milliseconds\"\n },\n \"thresholds\": {\n \"steps\": []\n },\n \"tooltip\": {\n \"mode\": \"all\",\n \"sort\": \"desc\"\n }\n },\n \"targets\": [\n {\n \"expr\": \"histogram_quantile(0.9, sum(rate(rest_client_request_duration_seconds_bucket{job=\\\"controller-manager\\\"}[5m])) by (instance,url,verb,le))*1000\",\n \"legend\": \"{{ instance }} {{ verb }} {{ url }}\",\n \"refId\": \"A\"\n }\n ],\n \"type\": \"timeseries\",\n \"version\": \"2.0.0\"\n },\n {\n \"custom\": {\n \"drawStyle\": \"lines\",\n \"fillOpacity\": 0.25,\n \"gradientMode\": \"none\",\n \"lineInterpolation\": \"smooth\",\n \"lineWidth\": 1,\n \"stack\": \"off\"\n },\n \"datasourceCate\": \"prometheus\",\n \"datasourceValue\": \"${datasource}\",\n \"description\": \"controller manager90分位请求延迟,按实例统计\",\n \"id\": \"80bd434e-21dc-4864-97c6-bfd1e2e27bbe\",\n \"layout\": {\n \"h\": 8,\n \"i\": \"75671720-bca1-449f-9c68-bf562f105b66\",\n \"isResizable\": true,\n \"w\": 12,\n \"x\": 12,\n \"y\": 22\n },\n \"links\": [],\n \"name\": \"Controller Manager - Requests Latancy by instance\",\n \"options\": {\n \"legend\": {\n \"displayMode\": \"list\",\n \"placement\": \"bottom\"\n },\n \"standardOptions\": {\n \"util\": \"milliseconds\"\n },\n \"thresholds\": {\n \"steps\": []\n },\n \"tooltip\": {\n \"mode\": \"all\",\n \"sort\": \"desc\"\n }\n },\n \"targets\": [\n {\n \"expr\": \"histogram_quantile(0.9, sum(rate(rest_client_request_duration_seconds_bucket{job=\\\"controller-manager\\\"}[5m])) by (instance,le)) * 1000\",\n \"legend\": \"{{ instance }}\",\n \"refId\": \"A\"\n }\n ],\n \"type\": \"timeseries\",\n \"version\": \"2.0.0\"\n },\n {\n \"custom\": {\n \"drawStyle\": \"lines\",\n \"fillOpacity\": 0.25,\n \"gradientMode\": \"none\",\n \"lineInterpolation\": \"smooth\",\n \"lineWidth\": 1,\n \"stack\": \"off\"\n },\n \"datasourceCate\": \"prometheus\",\n \"datasourceValue\": \"${datasource}\",\n \"description\": \"controller manager请求5xx,按请求类型统计\",\n \"id\": \"32a09298-d0f8-4d54-808e-d223d0a428ff\",\n \"layout\": {\n \"h\": 8,\n \"i\": \"cfc389ad-5648-4107-a5bd-1680f6ede2ed\",\n \"isResizable\": true,\n \"w\": 12,\n \"x\": 0,\n \"y\": 30\n },\n \"links\": [],\n \"name\": \"Controller Manager - Errors by verb\",\n \"options\": {\n \"legend\": {\n \"displayMode\": \"list\",\n \"placement\": \"bottom\"\n },\n \"standardOptions\": {\n \"util\": \"milliseconds\"\n },\n \"thresholds\": {\n \"steps\": []\n },\n \"tooltip\": {\n \"mode\": \"all\",\n \"sort\": \"desc\"\n }\n },\n \"targets\": [\n {\n \"expr\": \"sum by(instance,method) (rate(rest_client_requests_total{code=~\\\"5..\\\",job=\\\"controller-manager\\\"}[5m]))\\n / sum by(instance,method) (rate(rest_client_requests_total{job=\\\"controller-manager\\\"}[5m]))\",\n \"legend\": \"{{ instance }} {{ method }}\",\n \"refId\": \"A\"\n }\n ],\n \"type\": \"timeseries\",\n \"version\": \"2.0.0\"\n },\n {\n \"custom\": {\n \"drawStyle\": \"lines\",\n \"fillOpacity\": 0.25,\n \"gradientMode\": \"none\",\n \"lineInterpolation\": \"smooth\",\n \"lineWidth\": 1,\n \"stack\": \"off\"\n },\n \"datasourceCate\": \"prometheus\",\n \"datasourceValue\": \"${datasource}\",\n \"description\": \"controller manager请求5xx,按实例统计\",\n \"id\": \"b6931f1f-6c43-478e-bcc7-26d1b121bceb\",\n \"layout\": {\n \"h\": 8,\n \"i\": \"152b5817-ad87-44d0-a71f-5fbd0fc10ca3\",\n \"isResizable\": true,\n \"w\": 12,\n \"x\": 12,\n \"y\": 30\n },\n \"links\": [],\n \"name\": \"Controller Manager - Errors by instance\",\n \"options\": {\n \"legend\": {\n \"displayMode\": \"list\",\n \"placement\": \"bottom\"\n },\n \"standardOptions\": {\n \"util\": \"milliseconds\"\n },\n \"thresholds\": {\n \"steps\": []\n },\n \"tooltip\": {\n \"mode\": \"all\",\n \"sort\": \"desc\"\n }\n },\n \"targets\": [\n {\n \"expr\": \"sum by(instance) (rate(rest_client_requests_total{code=~\\\"5..\\\",job=\\\"controller-manager\\\"}[5m]))\\n / sum by(instance) (rate(rest_client_requests_total{job=\\\"controller-manager\\\"}[5m]))\",\n \"legend\": \"{{ instance }}\",\n \"refId\": \"A\"\n }\n ],\n \"type\": \"timeseries\",\n \"version\": \"2.0.0\"\n },\n {\n \"custom\": {\n \"drawStyle\": \"lines\",\n \"fillOpacity\": 0.25,\n \"gradientMode\": \"none\",\n \"lineInterpolation\": \"smooth\",\n \"lineWidth\": 1,\n \"stack\": \"off\"\n },\n \"datasourceCate\": \"prometheus\",\n \"datasourceValue\": \"${datasource}\",\n \"description\": \"controller manager workqueue 添加任务数的速率\",\n \"id\": \"0c8ac9ee-2a3e-4e7e-b338-748d79f6cbb6\",\n \"layout\": {\n \"h\": 8,\n \"i\": \"0c8ac9ee-2a3e-4e7e-b338-748d79f6cbb6\",\n \"isResizable\": true,\n \"w\": 12,\n \"x\": 0,\n \"y\": 38\n },\n \"links\": [],\n \"name\": \"Controller Manager - Average Enqueue Rate by instance\",\n \"options\": {\n \"legend\": {\n \"displayMode\": \"list\",\n \"placement\": \"bottom\"\n },\n \"standardOptions\": {\n \"util\": \"none\"\n },\n \"thresholds\": {\n \"steps\": []\n },\n \"tooltip\": {\n \"mode\": \"all\",\n \"sort\": \"desc\"\n }\n },\n \"targets\": [\n {\n \"expr\": \"avg(rate(workqueue_adds_total{job=\\\"controller-manager\\\"}[5m])) by (instance,name)\",\n \"legend\": \"{{ instance }} {{ name }}\",\n \"refId\": \"A\"\n }\n ],\n \"type\": \"timeseries\",\n \"version\": \"2.0.0\"\n },\n {\n \"custom\": {\n \"drawStyle\": \"lines\",\n \"fillOpacity\": 0.25,\n \"gradientMode\": \"none\",\n \"lineInterpolation\": \"smooth\",\n \"lineWidth\": 1,\n \"stack\": \"off\"\n },\n \"datasourceCate\": \"prometheus\",\n \"datasourceValue\": \"${datasource}\",\n \"description\": \"各个controller 队列深度\",\n \"id\": \"b15af6b1-107d-4246-9eec-06fd370d4d35\",\n \"layout\": {\n \"h\": 8,\n \"i\": \"b15af6b1-107d-4246-9eec-06fd370d4d35\",\n \"isResizable\": true,\n \"w\": 12,\n \"x\": 12,\n \"y\": 38\n },\n \"links\": [],\n \"name\": \"Controller Manager - WorkQueue Depth by name\",\n \"options\": {\n \"legend\": {\n \"displayMode\": \"list\",\n \"placement\": \"bottom\"\n },\n \"standardOptions\": {\n \"util\": \"none\"\n },\n \"thresholds\": {\n \"steps\": []\n },\n \"tooltip\": {\n \"mode\": \"all\",\n \"sort\": \"desc\"\n }\n },\n \"targets\": [\n {\n \"expr\": \"sum(rate(workqueue_depth{job=\\\"controller-manager\\\"}[5m])) by(instance,name)\",\n \"legend\": \"{{ instance }} {{ name }} workqueue depth\",\n \"refId\": \"A\"\n }\n ],\n \"type\": \"timeseries\",\n \"version\": \"2.0.0\"\n },\n {\n \"custom\": {\n \"drawStyle\": \"lines\",\n \"fillOpacity\": 0.25,\n \"gradientMode\": \"none\",\n \"lineInterpolation\": \"smooth\",\n \"lineWidth\": 1,\n \"stack\": \"off\"\n },\n \"datasourceCate\": \"prometheus\",\n \"datasourceValue\": \"${datasource}\",\n \"description\": \"任务在队列中的90分位等待耗时\",\n \"id\": \"1b4705d3-cb3c-49c9-b60d-69edd28b662c\",\n \"layout\": {\n \"h\": 8,\n \"i\": \"1f2a42da-cdf8-4ce9-830f-92dabeb387be\",\n \"isResizable\": true,\n \"w\": 12,\n \"x\": 0,\n \"y\": 46\n },\n \"links\": [],\n \"name\": \"Controller Manager - WorkQueue Queue Time by name\",\n \"options\": {\n \"legend\": {\n \"displayMode\": \"list\",\n \"placement\": \"bottom\"\n },\n \"standardOptions\": {\n \"util\": \"milliseconds\"\n },\n \"thresholds\": {\n \"steps\": []\n },\n \"tooltip\": {\n \"mode\": \"all\",\n \"sort\": \"desc\"\n }\n },\n \"targets\": [\n {\n \"expr\": \"histogram_quantile(0.9, sum(rate(workqueue_queue_duration_seconds_bucket{job=\\\"controller-manager\\\"}[5m])) by (instance,name,le))*1000\",\n \"legend\": \"{{ instance }} {{ name }}\",\n \"refId\": \"A\"\n }\n ],\n \"type\": \"timeseries\",\n \"version\": \"2.0.0\"\n },\n {\n \"custom\": {\n \"drawStyle\": \"lines\",\n \"fillOpacity\": 0.25,\n \"gradientMode\": \"none\",\n \"lineInterpolation\": \"smooth\",\n \"lineWidth\": 1,\n \"stack\": \"off\"\n },\n \"datasourceCate\": \"prometheus\",\n \"datasourceValue\": \"${datasource}\",\n \"description\": \"controller manager 90分位 任务出队到完成的耗时\",\n \"id\": \"1779a666-696e-4f07-b93f-f4b5bdd9d102\",\n \"layout\": {\n \"h\": 8,\n \"i\": \"30b7d514-fc44-4e24-9379-da697ceba79a\",\n \"isResizable\": true,\n \"w\": 12,\n \"x\": 12,\n \"y\": 46\n },\n \"links\": [],\n \"name\": \"Controller Manager - WorkQueue Work Time by name\",\n \"options\": {\n \"legend\": {\n \"displayMode\": \"list\",\n \"placement\": \"bottom\"\n },\n \"standardOptions\": {\n \"util\": \"milliseconds\"\n },\n \"thresholds\": {\n \"steps\": []\n },\n \"tooltip\": {\n \"mode\": \"all\",\n \"sort\": \"desc\"\n }\n },\n \"targets\": [\n {\n \"expr\": \"histogram_quantile(0.9, sum(rate(workqueue_work_duration_seconds_bucket{job=\\\"controller-manager\\\"}[5m])) by (instance,name,le))*1000\",\n \"legend\": \"{{ instance }} {{ name }}\",\n \"refId\": \"A\"\n }\n ],\n \"type\": \"timeseries\",\n \"version\": \"2.0.0\"\n },\n {\n \"custom\": {\n \"drawStyle\": \"lines\",\n \"fillOpacity\": 0.25,\n \"gradientMode\": \"none\",\n \"lineInterpolation\": \"smooth\",\n \"lineWidth\": 1,\n \"stack\": \"off\"\n },\n \"datasourceCate\": \"prometheus\",\n \"datasourceValue\": \"${datasource}\",\n \"description\": \"controller manager 任务进入队列的重试次数\",\n \"id\": \"084ccfb0-b7a1-4865-825d-f913bbc8456f\",\n \"layout\": {\n \"h\": 8,\n \"i\": \"4841fbd4-8393-412f-ba40-7e63d79827e8\",\n \"isResizable\": true,\n \"w\": 12,\n \"x\": 0,\n \"y\": 54\n },\n \"links\": [],\n \"name\": \"Controller Manager - WorkQueue Retries Total\",\n \"options\": {\n \"legend\": {\n \"displayMode\": \"list\",\n \"placement\": \"bottom\"\n },\n \"standardOptions\": {\n \"util\": \"none\"\n },\n \"thresholds\": {\n \"steps\": []\n },\n \"tooltip\": {\n \"mode\": \"all\",\n \"sort\": \"desc\"\n }\n },\n \"targets\": [\n {\n \"expr\": \"sum(rate(workqueue_retries_total{job=\\\"controller-manager\\\"}[5m])) by (instance,name)\",\n \"legend\": \"{{ instance }} {{ name }}\",\n \"refId\": \"A\"\n }\n ],\n \"type\": \"timeseries\",\n \"version\": \"2.0.0\"\n },\n {\n \"custom\": {\n \"drawStyle\": \"lines\",\n \"fillOpacity\": 0.25,\n \"gradientMode\": \"none\",\n \"lineInterpolation\": \"smooth\",\n \"lineWidth\": 1,\n \"stack\": \"off\"\n },\n \"datasourceCate\": \"prometheus\",\n \"datasourceValue\": \"${datasource}\",\n \"description\": \"队列中最耗时任务的处理时间(500ms采样周期,未完成的任务-任务开始处理即出队的时间)\",\n \"id\": \"a1644e81-5aee-409b-be7a-6445f9478373\",\n \"layout\": {\n \"h\": 8,\n \"i\": \"5c576ba5-0e85-4401-9e44-346b987eb8ba\",\n \"isResizable\": true,\n \"w\": 12,\n \"x\": 12,\n \"y\": 54\n },\n \"links\": [],\n \"name\": \"Controller Manager - WorkQueue longest running time\",\n \"options\": {\n \"legend\": {\n \"displayMode\": \"list\",\n \"placement\": \"bottom\"\n },\n \"standardOptions\": {\n \"util\": \"milliseconds\"\n },\n \"thresholds\": {\n \"steps\": []\n },\n \"tooltip\": {\n \"mode\": \"all\",\n \"sort\": \"desc\"\n }\n },\n \"targets\": [\n {\n \"expr\": \"workqueue_longest_running_processor_seconds{job=\\\"controller-manager\\\"}*1000\",\n \"legend\": \"{{ instance }} {{ name }}\",\n \"refId\": \"A\"\n }\n ],\n \"type\": \"timeseries\",\n \"version\": \"2.0.0\"\n },\n {\n \"custom\": {\n \"drawStyle\": \"lines\",\n \"fillOpacity\": 0.25,\n \"gradientMode\": \"none\",\n \"lineInterpolation\": \"smooth\",\n \"lineWidth\": 1,\n \"stack\": \"off\"\n },\n \"datasourceCate\": \"prometheus\",\n \"datasourceValue\": \"${datasource}\",\n \"description\": \"controller manager 绑定的pv数目\",\n \"id\": \"d17fab46-1a62-47a5-9666-ee083f2ec9e5\",\n \"layout\": {\n \"h\": 8,\n \"i\": \"c28c023d-08e3-4614-8d20-0f0f3f5c7044\",\n \"isResizable\": true,\n \"w\": 12,\n \"x\": 0,\n \"y\": 62\n },\n \"links\": [],\n \"name\": \"Controller Manager - Bound PV Count\",\n \"options\": {\n \"legend\": {\n \"displayMode\": \"list\",\n \"placement\": \"bottom\"\n },\n \"standardOptions\": {\n \"util\": \"none\"\n },\n \"thresholds\": {\n \"steps\": []\n },\n \"tooltip\": {\n \"mode\": \"all\",\n \"sort\": \"desc\"\n }\n },\n \"targets\": [\n {\n \"expr\": \"pv_collector_bound_pv_count{job=\\\"controller-manager\\\"}\",\n \"legend\": \"{{ instance }} {{ storage_class }} bound pv \",\n \"refId\": \"A\"\n },\n {\n \"expr\": \"pv_collector_total_pv_count{job=\\\"controller-manager\\\"}\",\n \"legend\": \"{{ instance }} total pv count\",\n \"refId\": \"B\"\n }\n ],\n \"type\": \"timeseries\",\n \"version\": \"2.0.0\"\n },\n {\n \"custom\": {\n \"drawStyle\": \"lines\",\n \"fillOpacity\": 0.25,\n \"gradientMode\": \"none\",\n \"lineInterpolation\": \"smooth\",\n \"lineWidth\": 1,\n \"stack\": \"off\"\n },\n \"datasourceCate\": \"prometheus\",\n \"datasourceValue\": \"${datasource}\",\n \"description\": \"controller manager zone中的node数据\",\n \"id\": \"ce8b2909-215d-4a2a-a2ea-5faff34cf4ef\",\n \"layout\": {\n \"h\": 8,\n \"i\": \"8ccebf05-e22a-475e-9c4b-308887757855\",\n \"isResizable\": true,\n \"w\": 12,\n \"x\": 12,\n \"y\": 62\n },\n \"links\": [],\n \"name\": \"Controller Manager - Zone Size\",\n \"options\": {\n \"legend\": {\n \"displayMode\": \"list\",\n \"placement\": \"bottom\"\n },\n \"standardOptions\": {\n \"util\": \"none\"\n },\n \"thresholds\": {\n \"steps\": []\n },\n \"tooltip\": {\n \"mode\": \"all\",\n \"sort\": \"desc\"\n }\n },\n \"targets\": [\n {\n \"expr\": \"node_collector_zone_size{job=\\\"controller-manager\\\"}\",\n \"legend\": \"{{ instance }}\",\n \"refId\": \"A\"\n }\n ],\n \"type\": \"timeseries\",\n \"version\": \"2.0.0\"\n },\n {\n \"custom\": {\n \"drawStyle\": \"lines\",\n \"fillOpacity\": 0.25,\n \"gradientMode\": \"none\",\n \"lineInterpolation\": \"smooth\",\n \"lineWidth\": 1,\n \"stack\": \"off\"\n },\n \"datasourceCate\": \"prometheus\",\n \"datasourceValue\": \"${datasource}\",\n \"description\": \"controller manager cpu使用率\",\n \"id\": \"9c187c1c-f5cd-4aab-af81-09169948ab82\",\n \"layout\": {\n \"h\": 8,\n \"i\": \"9c187c1c-f5cd-4aab-af81-09169948ab82\",\n \"isResizable\": true,\n \"w\": 12,\n \"x\": 0,\n \"y\": 70\n },\n \"links\": [],\n \"name\": \"Controller Manager - CPU Usage by instance\",\n \"options\": {\n \"legend\": {\n \"displayMode\": \"list\",\n \"placement\": \"bottom\"\n },\n \"standardOptions\": {\n \"decimals\": 2,\n \"util\": \"percentUnit\"\n },\n \"thresholds\": {\n \"steps\": []\n },\n \"tooltip\": {\n \"mode\": \"all\",\n \"sort\": \"desc\"\n }\n },\n \"targets\": [\n {\n \"expr\": \"rate(process_cpu_seconds_total{job=\\\"controller-manager\\\"}[5m])\",\n \"legend\": \"{{ instance }}\",\n \"refId\": \"A\"\n }\n ],\n \"type\": \"timeseries\",\n \"version\": \"2.0.0\"\n },\n {\n \"custom\": {\n \"drawStyle\": \"lines\",\n \"fillOpacity\": 0.25,\n \"gradientMode\": \"none\",\n \"lineInterpolation\": \"smooth\",\n \"lineWidth\": 1,\n \"stack\": \"off\"\n },\n \"datasourceCate\": \"prometheus\",\n \"datasourceValue\": \"${datasource}\",\n \"description\": \"controller manager 绑定/非绑定的pvc数目\",\n \"id\": \"92b035eb-2bd3-417d-b82a-f5734b8a4aec\",\n \"layout\": {\n \"h\": 8,\n \"i\": \"6ad946ea-8cee-42f5-9863-3a76d53340a4\",\n \"isResizable\": true,\n \"w\": 12,\n \"x\": 12,\n \"y\": 70\n },\n \"links\": [],\n \"name\": \"Controller Manager - PVC Count\",\n \"options\": {\n \"legend\": {\n \"displayMode\": \"list\",\n \"placement\": \"bottom\"\n },\n \"standardOptions\": {\n \"util\": \"none\"\n },\n \"thresholds\": {\n \"steps\": []\n },\n \"tooltip\": {\n \"mode\": \"all\",\n \"sort\": \"desc\"\n }\n },\n \"targets\": [\n {\n \"expr\": \"pv_collector_bound_pvc_count{job=\\\"controller-manager\\\"}\",\n \"legend\": \"{{ instance }} {{ namespace }} bound pvc\",\n \"refId\": \"A\"\n },\n {\n \"expr\": \"pv_collector_unbound_pvc_count{job=\\\"controller-manager\\\"}\",\n \"legend\": \"{{ instance }} {{ namespace }} unbound pvc\",\n \"refId\": \"B\"\n }\n ],\n \"type\": \"timeseries\",\n \"version\": \"2.0.0\"\n },\n {\n \"custom\": {\n \"drawStyle\": \"lines\",\n \"fillOpacity\": 0.25,\n \"gradientMode\": \"none\",\n \"lineInterpolation\": \"smooth\",\n \"lineWidth\": 1,\n \"stack\": \"off\"\n },\n \"datasourceCate\": \"prometheus\",\n \"datasourceValue\": \"${datasource}\",\n \"description\": \"controller manager打开的fd数量\",\n \"id\": \"94bb09a7-dbf7-41d8-b6a4-16b262365474\",\n \"layout\": {\n \"h\": 8,\n \"i\": \"e438aed2-6d4a-4254-a8ec-26752385dc74\",\n \"isResizable\": true,\n \"w\": 12,\n \"x\": 0,\n \"y\": 78\n },\n \"links\": [],\n \"name\": \"Controller Manager - Open fds by instance\",\n \"options\": {\n \"legend\": {\n \"displayMode\": \"list\",\n \"placement\": \"bottom\"\n },\n \"standardOptions\": {\n \"util\": \"none\"\n },\n \"thresholds\": {\n \"steps\": []\n },\n \"tooltip\": {\n \"mode\": \"all\",\n \"sort\": \"desc\"\n }\n },\n \"targets\": [\n {\n \"expr\": \"process_open_fds{job=\\\"controller-manager\\\"}\",\n \"legend\": \"{{ instance }}\",\n \"refId\": \"A\"\n }\n ],\n \"type\": \"timeseries\",\n \"version\": \"2.0.0\"\n },\n {\n \"custom\": {\n \"drawStyle\": \"lines\",\n \"fillOpacity\": 0.25,\n \"gradientMode\": \"none\",\n \"lineInterpolation\": \"smooth\",\n \"lineWidth\": 1,\n \"stack\": \"off\"\n },\n \"datasourceCate\": \"prometheus\",\n \"datasourceValue\": \"${datasource}\",\n \"description\": \"controller manager 内存使用量\",\n \"id\": \"8cff2618-b2d4-4fb4-bfc2-d1d4c4f1b35c\",\n \"layout\": {\n \"h\": 8,\n \"i\": \"8cff2618-b2d4-4fb4-bfc2-d1d4c4f1b35c\",\n \"isResizable\": true,\n \"w\": 12,\n \"x\": 12,\n \"y\": 78\n },\n \"links\": [],\n \"name\": \"Controller Manager - Memory Usage by instance\",\n \"options\": {\n \"legend\": {\n \"displayMode\": \"list\",\n \"placement\": \"bottom\"\n },\n \"standardOptions\": {\n \"util\": \"bytesIEC\"\n },\n \"thresholds\": {\n \"steps\": []\n },\n \"tooltip\": {\n \"mode\": \"all\",\n \"sort\": \"desc\"\n }\n },\n \"targets\": [\n {\n \"expr\": \"process_resident_memory_bytes{job=\\\"controller-manager\\\"}\",\n \"legend\": \"{{ instance }}\",\n \"refId\": \"A\"\n }\n ],\n \"type\": \"timeseries\",\n \"version\": \"2.0.0\"\n }\n ],\n \"var\": [\n {\n \"definition\": \"prometheus\",\n \"name\": \"datasource\",\n \"type\": \"datasource\"\n }\n ],\n \"version\": \"3.0.0\"\n },\n \"public\": 0,\n \"public_cate\": 0,\n \"bgids\": null,\n \"built_in\": 0,\n \"hide\": 0,\n \"uuid\": 1717556327685813000\n}"
},
{
"path": "integrations/Kubernetes/dashboards/DeploymentContainer.json",
"content": "{\n \"name\": \"Kubernetes / Deployment / Container\",\n \"tags\": \"Categraf\",\n \"configs\": {\n \"panels\": [\n {\n \"collapsed\": true,\n \"id\": \"79d7e3b0-b64f-4591-b5dd-994ce16b68ca\",\n \"layout\": {\n \"h\": 1,\n \"i\": \"79d7e3b0-b64f-4591-b5dd-994ce16b68ca\",\n \"isResizable\": false,\n \"w\": 24,\n \"x\": 0,\n \"y\": 0\n },\n \"name\": \"整体概况\",\n \"type\": \"row\"\n },\n {\n \"custom\": {\n \"drawStyle\": \"lines\",\n \"fillOpacity\": 0.5,\n \"lineInterpolation\": \"smooth\",\n \"stack\": \"off\"\n },\n \"datasourceCate\": \"prometheus\",\n \"datasourceValue\": \"${datasource}\",\n \"description\": \"容器1min CPU平均使用率,如果pod内有多个容器,会分别显示各个容器CPU使用率(pause容器默认不会显示);如果容器配置了4核,使用率400%表示当前用满4核,容器配置2核,使用率200%表示当前用满2核。\",\n \"id\": \"860c1484-1f83-497e-a061-a50fbb3ff1dc\",\n \"layout\": {\n \"h\": 7,\n \"i\": \"860c1484-1f83-497e-a061-a50fbb3ff1dc\",\n \"isResizable\": true,\n \"w\": 6,\n \"x\": 0,\n \"y\": 1\n },\n \"name\": \"容器CPU使用率\",\n \"options\": {\n \"legend\": {\n \"displayMode\": \"hidden\"\n },\n \"standardOptions\": {\n \"max\": null,\n \"min\": 0,\n \"util\": \"percent\"\n },\n \"thresholds\": {},\n \"tooltip\": {\n \"mode\": \"all\",\n \"sort\": \"none\"\n }\n },\n \"targets\": [\n {\n \"expr\": \"sum(rate(container_cpu_usage_seconds_total{pod=\\\"$pod_name\\\", image!~\\\".*pause.*\\\"}[1m])*100) by(name)\",\n \"legend\": \"\",\n \"refId\": \"A\"\n }\n ],\n \"type\": \"timeseries\",\n \"version\": \"2.0.0\"\n },\n {\n \"custom\": {\n \"drawStyle\": \"lines\",\n \"fillOpacity\": 0.5,\n \"lineInterpolation\": \"smooth\",\n \"stack\": \"off\"\n },\n \"datasourceCate\": \"prometheus\",\n \"datasourceValue\": \"${datasource}\",\n \"description\": \"容器1min CPU平均使用率,如果pod内有多个容器,会分别显示各个容器CPU使用率(pause容器默认不会显示);如果容器配置了4核,使用率100%表示当前用满4核,容器配置2核,使用率100%表示当前用满2核,如果容器没有配置cpu limit,则不会显示该数值\",\n \"id\": \"bb66b2cc-3658-4cae-817a-61ec3fbb93e4\",\n \"layout\": {\n \"h\": 7,\n \"i\": \"bb66b2cc-3658-4cae-817a-61ec3fbb93e4\",\n \"isResizable\": true,\n \"w\": 6,\n \"x\": 6,\n \"y\": 1\n },\n \"name\": \"容器CPU归一化后使用率\",\n \"options\": {\n \"legend\": {\n \"displayMode\": \"hidden\"\n },\n \"standardOptions\": {\n \"max\": null,\n \"min\": 0,\n \"util\": \"percent\"\n },\n \"thresholds\": {},\n \"tooltip\": {\n \"mode\": \"all\",\n \"sort\": \"none\"\n }\n },\n \"targets\": [\n {\n \"expr\": \"sum(rate(container_cpu_usage_seconds_total{pod=\\\"$pod_name\\\", image!~\\\".*pause.*\\\"}[1m])*100) by(name)/((sum(container_spec_cpu_quota{pod=\\\"$pod_name\\\"}/container_spec_cpu_period{pod=\\\"$pod_name\\\"}) by (name)))\",\n \"legend\": \"\",\n \"refId\": \"A\"\n }\n ],\n \"type\": \"timeseries\",\n \"version\": \"2.0.0\"\n },\n {\n \"custom\": {\n \"drawStyle\": \"lines\",\n \"fillOpacity\": 0.5,\n \"lineInterpolation\": \"smooth\",\n \"stack\": \"off\"\n },\n \"datasourceCate\": \"prometheus\",\n \"datasourceValue\": \"${datasource}\",\n \"description\": \"container_memory_rss + container_memory_cache + container_memory_swap + kernel memory\",\n \"id\": \"4d5f9cbb-3b78-4fe6-8a4e-59ca52a49666\",\n \"layout\": {\n \"h\": 7,\n \"i\": \"4d5f9cbb-3b78-4fe6-8a4e-59ca52a49666\",\n \"isResizable\": true,\n \"w\": 6,\n \"x\": 12,\n \"y\": 1\n },\n \"name\": \"容器内存使用\",\n \"options\": {\n \"legend\": {\n \"displayMode\": \"hidden\"\n },\n \"standardOptions\": {\n \"max\": null,\n \"util\": \"bytesIEC\"\n },\n \"thresholds\": {},\n \"tooltip\": {\n \"mode\": \"all\",\n \"sort\": \"none\"\n }\n },\n \"targets\": [\n {\n \"expr\": \"(sum(container_memory_usage_bytes{pod=\\\"$pod_name\\\", image!~\\\".*pause.*\\\"}) by (name)) \",\n \"refId\": \"A\"\n }\n ],\n \"type\": \"timeseries\",\n \"version\": \"2.0.0\"\n },\n {\n \"custom\": {\n \"drawStyle\": \"lines\",\n \"fillOpacity\": 0.5,\n \"lineInterpolation\": \"smooth\",\n \"stack\": \"off\"\n },\n \"datasourceCate\": \"prometheus\",\n \"datasourceValue\": \"${datasource}\",\n \"description\": \"\",\n \"id\": \"978e93a0-770e-42f5-a374-cafb5b4fc585\",\n \"layout\": {\n \"h\": 7,\n \"i\": \"978e93a0-770e-42f5-a374-cafb5b4fc585\",\n \"isResizable\": true,\n \"w\": 6,\n \"x\": 18,\n \"y\": 1\n },\n \"name\": \"文件系统写入速率\",\n \"options\": {\n \"legend\": {\n \"displayMode\": \"hidden\"\n },\n \"standardOptions\": {\n \"max\": null,\n \"min\": 0,\n \"util\": \"bytesIEC\"\n },\n \"thresholds\": {},\n \"tooltip\": {\n \"mode\": \"all\",\n \"sort\": \"none\"\n }\n },\n \"targets\": [\n {\n \"expr\": \"sum(rate(container_fs_writes_bytes_total{pod=\\\"$pod_name\\\", image!~\\\".*pause.*\\\"}[1m])) by(name)\",\n \"legend\": \"\",\n \"refId\": \"A\"\n }\n ],\n \"type\": \"timeseries\",\n \"version\": \"2.0.0\"\n },\n {\n \"custom\": {\n \"drawStyle\": \"lines\",\n \"fillOpacity\": 0.5,\n \"lineInterpolation\": \"smooth\",\n \"stack\": \"off\"\n },\n \"datasourceCate\": \"prometheus\",\n \"datasourceValue\": \"${datasource}\",\n \"description\": \"\",\n \"id\": \"f385736d-fd05-4705-a27d-41e67fb6c843\",\n \"layout\": {\n \"h\": 7,\n \"i\": \"f385736d-fd05-4705-a27d-41e67fb6c843\",\n \"isResizable\": true,\n \"w\": 6,\n \"x\": 0,\n \"y\": 8\n },\n \"name\": \"文件系统读取速率\",\n \"options\": {\n \"legend\": {\n \"displayMode\": \"hidden\"\n },\n \"standardOptions\": {\n \"max\": null,\n \"min\": 0,\n \"util\": \"bytesIEC\"\n },\n \"thresholds\": {},\n \"tooltip\": {\n \"mode\": \"all\",\n \"sort\": \"none\"\n }\n },\n \"targets\": [\n {\n \"expr\": \"sum(rate(container_fs_reads_bytes_total{pod=\\\"$pod_name\\\", image!~\\\".*pause.*\\\"}[1m])) by(name)\",\n \"legend\": \"\",\n \"refId\": \"A\"\n }\n ],\n \"type\": \"timeseries\",\n \"version\": \"2.0.0\"\n },\n {\n \"custom\": {\n \"drawStyle\": \"lines\",\n \"fillOpacity\": 0.5,\n \"lineInterpolation\": \"smooth\",\n \"stack\": \"off\"\n },\n \"datasourceCate\": \"prometheus\",\n \"datasourceValue\": \"${datasource}\",\n \"description\": \"容器网络发送的字节数(1 分钟内)\",\n \"id\": \"f9b140e8-0b44-4b32-9d54-9360b06faa48\",\n \"layout\": {\n \"h\": 7,\n \"i\": \"f9b140e8-0b44-4b32-9d54-9360b06faa48\",\n \"isResizable\": true,\n \"w\": 6,\n \"x\": 6,\n \"y\": 8\n },\n \"name\": \"网络发送速率\",\n \"options\": {\n \"legend\": {\n \"displayMode\": \"hidden\"\n },\n \"standardOptions\": {\n \"util\": \"bytesIEC\"\n },\n \"thresholds\": {},\n \"tooltip\": {\n \"mode\": \"all\",\n \"sort\": \"none\"\n }\n },\n \"targets\": [\n {\n \"expr\": \"sum(rate(container_network_transmit_bytes_total{pod=\\\"$pod_name\\\"}[1m])) by(name, interface)\",\n \"refId\": \"A\"\n }\n ],\n \"type\": \"timeseries\",\n \"version\": \"2.0.0\"\n },\n {\n \"custom\": {\n \"drawStyle\": \"lines\",\n \"fillOpacity\": 0.5,\n \"lineInterpolation\": \"smooth\",\n \"stack\": \"off\"\n },\n \"datasourceCate\": \"prometheus\",\n \"datasourceValue\": \"${datasource}\",\n \"description\": \"容器网络接收的字节数(1 分钟内)\",\n \"id\": \"8f98a264-7058-4fa0-8efc-3c87954a0370\",\n \"layout\": {\n \"h\": 7,\n \"i\": \"8f98a264-7058-4fa0-8efc-3c87954a0370\",\n \"isResizable\": true,\n \"w\": 6,\n \"x\": 12,\n \"y\": 8\n },\n \"name\": \"网络接收速率\",\n \"options\": {\n \"legend\": {\n \"displayMode\": \"hidden\"\n },\n \"standardOptions\": {\n \"util\": \"bytesIEC\"\n },\n \"thresholds\": {},\n \"tooltip\": {\n \"mode\": \"all\",\n \"sort\": \"none\"\n }\n },\n \"targets\": [\n {\n \"expr\": \"sum(rate(container_network_receive_bytes_total{pod=\\\"$pod_name\\\"}[1m])) by(name, interface)\",\n \"refId\": \"A\"\n }\n ],\n \"type\": \"timeseries\",\n \"version\": \"2.0.0\"\n },\n {\n \"custom\": {\n \"calc\": \"lastNotNull\",\n \"colSpan\": 1,\n \"colorMode\": \"value\",\n \"textMode\": \"valueAndName\",\n \"textSize\": {}\n },\n \"datasourceCate\": \"prometheus\",\n \"datasourceValue\": \"${datasource}\",\n \"id\": \"1868973e-c3d3-4fd4-83b0-36ec2e06dfe0\",\n \"layout\": {\n \"h\": 7,\n \"i\": \"1868973e-c3d3-4fd4-83b0-36ec2e06dfe0\",\n \"isResizable\": true,\n \"w\": 6,\n \"x\": 18,\n \"y\": 8\n },\n \"name\": \"容器启动时长(小时)\",\n \"options\": {\n \"standardOptions\": {\n \"util\": \"humantimeSeconds\"\n }\n },\n \"targets\": [\n {\n \"expr\": \"sum((time()-container_start_time_seconds{pod=\\\"$pod_name\\\", image!~\\\".*pause.*\\\"})) by (name)\",\n \"refId\": \"A\"\n }\n ],\n \"type\": \"stat\",\n \"version\": \"2.0.0\"\n },\n {\n \"collapsed\": true,\n \"id\": \"8a4942a2-81a3-4473-81be-79b3541e09a3\",\n \"layout\": {\n \"h\": 1,\n \"i\": \"8a4942a2-81a3-4473-81be-79b3541e09a3\",\n \"isResizable\": false,\n \"w\": 24,\n \"x\": 0,\n \"y\": 15\n },\n \"name\": \"CPU\",\n \"type\": \"row\"\n },\n {\n \"custom\": {\n \"drawStyle\": \"lines\",\n \"fillOpacity\": 0.5,\n \"lineInterpolation\": \"smooth\",\n \"stack\": \"off\"\n },\n \"datasourceCate\": \"prometheus\",\n \"datasourceValue\": \"${datasource}\",\n \"description\": \"容器1min CPU平均使用率,如果pod内有多个容器,会分别显示各个容器CPU使用率(pause容器默认不会显示);如果容器配置了4核,使用率400%表示当前用满4核,容器配置2核,使用率200%表示当前用满2核。\",\n \"id\": \"54650fe9-007f-4b16-a523-baf2e91ef823\",\n \"layout\": {\n \"h\": 7,\n \"i\": \"54650fe9-007f-4b16-a523-baf2e91ef823\",\n \"isResizable\": true,\n \"w\": 6,\n \"x\": 0,\n \"y\": 16\n },\n \"name\": \"容器CPU使用率\",\n \"options\": {\n \"legend\": {\n \"displayMode\": \"hidden\"\n },\n \"standardOptions\": {\n \"max\": null,\n \"util\": \"percent\"\n },\n \"thresholds\": {},\n \"tooltip\": {\n \"mode\": \"all\",\n \"sort\": \"none\"\n }\n },\n \"targets\": [\n {\n \"expr\": \"sum(rate(container_cpu_usage_seconds_total{pod=\\\"$pod_name\\\", image!~\\\".*pause.*\\\"}[1m])*100) by(name)\",\n \"refId\": \"A\"\n }\n ],\n \"type\": \"timeseries\",\n \"version\": \"2.0.0\"\n },\n {\n \"custom\": {\n \"drawStyle\": \"lines\",\n \"fillOpacity\": 0.5,\n \"lineInterpolation\": \"smooth\",\n \"stack\": \"off\"\n },\n \"datasourceCate\": \"prometheus\",\n \"datasourceValue\": \"${datasource}\",\n \"description\": \"容器1min CPU平均使用率,如果pod内有多个容器,会分别显示各个容器CPU使用率(pause容器默认不会显示);如果容器配置了4核,使用率100%表示当前用满4核,容器配置2核,使用率100%表示当前用满2核,如果容器没有配置cpu limit,则不会显示该数值\",\n \"id\": \"715c1e5a-c504-4f2c-a790-dad1c73aae29\",\n \"layout\": {\n \"h\": 7,\n \"i\": \"715c1e5a-c504-4f2c-a790-dad1c73aae29\",\n \"isResizable\": true,\n \"w\": 6,\n \"x\": 6,\n \"y\": 16\n },\n \"name\": \"容器CPU归一化后使用率\",\n \"options\": {\n \"legend\": {\n \"displayMode\": \"hidden\"\n },\n \"standardOptions\": {\n \"max\": null,\n \"util\": \"percent\"\n },\n \"thresholds\": {},\n \"tooltip\": {\n \"mode\": \"all\",\n \"sort\": \"none\"\n }\n },\n \"targets\": [\n {\n \"expr\": \"sum(rate(container_cpu_usage_seconds_total{pod=\\\"$pod_name\\\", image!~\\\".*pause.*\\\"}[1m])*100) by(name)/((sum(container_spec_cpu_quota{pod=\\\"$pod_name\\\"}/container_spec_cpu_period{pod=\\\"$pod_name\\\"}) by (name)))\",\n \"refId\": \"A\"\n }\n ],\n \"type\": \"timeseries\",\n \"version\": \"2.0.0\"\n },\n {\n \"custom\": {\n \"drawStyle\": \"lines\",\n \"fillOpacity\": 0.5,\n \"lineInterpolation\": \"smooth\",\n \"stack\": \"off\"\n },\n \"datasourceCate\": \"prometheus\",\n \"datasourceValue\": \"${datasource}\",\n \"description\": \"容器1min 内核态CPU平均使用率,如果pod内有多个容器,会分别显示各个容器内核态CPU使用率(pause容器默认不会显示);如果容器配置了4核,使用率400%表示当前内核态用满4核,容器配置2核,使用率200%表示当前内核态用满2核。\",\n \"id\": \"d23a509d-3bb0-4680-b579-b89a411830a4\",\n \"layout\": {\n \"h\": 7,\n \"i\": \"d23a509d-3bb0-4680-b579-b89a411830a4\",\n \"isResizable\": true,\n \"w\": 6,\n \"x\": 12,\n \"y\": 16\n },\n \"name\": \"容器内核态CPU使用率\",\n \"options\": {\n \"legend\": {\n \"displayMode\": \"hidden\"\n },\n \"standardOptions\": {\n \"max\": null,\n \"util\": \"percent\"\n },\n \"thresholds\": {},\n \"tooltip\": {\n \"mode\": \"all\",\n \"sort\": \"none\"\n }\n },\n \"targets\": [\n {\n \"expr\": \"sum(rate(container_cpu_system_seconds_total{pod=\\\"$pod_name\\\", image!~\\\".*pause.*\\\"}[1m])*100) by(name)\",\n \"refId\": \"A\"\n }\n ],\n \"type\": \"timeseries\",\n \"version\": \"2.0.0\"\n },\n {\n \"custom\": {\n \"drawStyle\": \"lines\",\n \"fillOpacity\": 0.5,\n \"lineInterpolation\": \"smooth\",\n \"stack\": \"off\"\n },\n \"datasourceCate\": \"prometheus\",\n \"datasourceValue\": \"${datasource}\",\n \"description\": \"容器1min 内核态CPU平均使用率,如果pod内有多个容器,会分别显示各个容器用户态CPU使用率(pause容器默认不会显示);如果容器配置了4核,使用率400%表示当前用户态用满4核,容器配置2核,使用率200%表示当前用户态用满2核。\",\n \"id\": \"2921e6d0-1b9c-449d-9dd8-fb29dce8ca7d\",\n \"layout\": {\n \"h\": 7,\n \"i\": \"2921e6d0-1b9c-449d-9dd8-fb29dce8ca7d\",\n \"isResizable\": true,\n \"w\": 6,\n \"x\": 18,\n \"y\": 16\n },\n \"name\": \"容器用户态CPU使用率\",\n \"options\": {\n \"legend\": {\n \"displayMode\": \"hidden\"\n },\n \"standardOptions\": {\n \"max\": null,\n \"util\": \"percent\"\n },\n \"thresholds\": {},\n \"tooltip\": {\n \"mode\": \"all\",\n \"sort\": \"none\"\n }\n },\n \"targets\": [\n {\n \"expr\": \"sum(rate(container_cpu_user_seconds_total{pod=\\\"$pod_name\\\", image!~\\\".*pause.*\\\"}[1m])*100) by(name)\",\n \"refId\": \"A\"\n }\n ],\n \"type\": \"timeseries\",\n \"version\": \"2.0.0\"\n },\n {\n \"custom\": {\n \"drawStyle\": \"lines\",\n \"fillOpacity\": 0.5,\n \"lineInterpolation\": \"smooth\",\n \"stack\": \"off\"\n },\n \"datasourceCate\": \"prometheus\",\n \"datasourceValue\": \"${datasource}\",\n \"description\": \"该值大于0,说明CPU在运行期间发生throttle情况,即容器设置的CPU规格,不满足容器当前对CPU的实际需求,在这种情况下,往往需要调大容器CPU规格,或者优化程序,降低CPU开销。\",\n \"id\": \"b302c1a0-a499-4a99-aff2-d460685846ab\",\n \"layout\": {\n \"h\": 7,\n \"i\": \"b302c1a0-a499-4a99-aff2-d460685846ab\",\n \"isResizable\": true,\n \"w\": 6,\n \"x\": 0,\n \"y\": 23\n },\n \"name\": \"容器发生CPU throttle的比率\",\n \"options\": {\n \"legend\": {\n \"displayMode\": \"hidden\"\n },\n \"standardOptions\": {\n \"util\": \"percent\"\n },\n \"thresholds\": {},\n \"tooltip\": {\n \"mode\": \"all\",\n \"sort\": \"none\"\n }\n },\n \"targets\": [\n {\n \"expr\": \"sum(rate(container_cpu_cfs_throttled_periods_total{pod=\\\"$pod_name\\\", image!~\\\".*pause.*\\\"}[1m]))by(name) *100\",\n \"refId\": \"A\"\n }\n ],\n \"type\": \"timeseries\",\n \"version\": \"2.0.0\"\n },\n {\n \"custom\": {\n \"calc\": \"lastNotNull\",\n \"colSpan\": 1,\n \"colorMode\": \"value\",\n \"textMode\": \"valueAndName\",\n \"textSize\": {}\n },\n \"datasourceCate\": \"prometheus\",\n \"datasourceValue\": \"${datasource}\",\n \"description\": \"容器CPU Limit,2代表容器CPU Limit为2核, 0.2代表容器CPU Limit为0.2核, 没有数据表明没有设置Limit值\",\n \"id\": \"cd5e8b99-8a76-4dea-b8b2-3bff825a7f8d\",\n \"layout\": {\n \"h\": 7,\n \"i\": \"cd5e8b99-8a76-4dea-b8b2-3bff825a7f8d\",\n \"isResizable\": true,\n \"w\": 6,\n \"x\": 6,\n \"y\": 23\n },\n \"name\": \"容器CPU Limit\",\n \"options\": {\n \"standardOptions\": {}\n },\n \"targets\": [\n {\n \"expr\": \"(sum(container_spec_cpu_quota{pod=\\\"$pod_name\\\"}/container_spec_cpu_period{pod=\\\"$pod_name\\\"}) by (name))\",\n \"refId\": \"A\"\n }\n ],\n \"type\": \"stat\",\n \"version\": \"2.0.0\"\n },\n {\n \"custom\": {\n \"drawStyle\": \"lines\",\n \"fillOpacity\": 0.5,\n \"lineInterpolation\": \"smooth\",\n \"stack\": \"off\"\n },\n \"datasourceCate\": \"prometheus\",\n \"datasourceValue\": \"${datasource}\",\n \"description\": \"过去10s的CPU负载\",\n \"id\": \"408c29b9-2a49-49a2-a98b-3ad7da9c57bd\",\n \"layout\": {\n \"h\": 7,\n \"i\": \"408c29b9-2a49-49a2-a98b-3ad7da9c57bd\",\n \"isResizable\": true,\n \"w\": 6,\n \"x\": 12,\n \"y\": 23\n },\n \"name\": \"容器CPU load 10\",\n \"options\": {\n \"legend\": {\n \"displayMode\": \"hidden\"\n },\n \"standardOptions\": {\n \"max\": null\n },\n \"thresholds\": {},\n \"tooltip\": {\n \"mode\": \"all\",\n \"sort\": \"none\"\n }\n },\n \"targets\": [\n {\n \"expr\": \"sum(container_cpu_load_average_10s{pod=\\\"$pod_name\\\", image!~\\\".*pause.*\\\"}) by (name)\",\n \"refId\": \"A\"\n }\n ],\n \"type\": \"timeseries\",\n \"version\": \"2.0.0\"\n },\n {\n \"custom\": {\n \"drawStyle\": \"lines\",\n \"fillOpacity\": 0.5,\n \"lineInterpolation\": \"smooth\",\n \"stack\": \"off\"\n },\n \"datasourceCate\": \"prometheus\",\n \"datasourceValue\": \"${datasource}\",\n \"id\": \"fe62f7db-4f87-4da1-bfc3-60ed5039e31e\",\n \"layout\": {\n \"h\": 7,\n \"i\": \"fe62f7db-4f87-4da1-bfc3-60ed5039e31e\",\n \"isResizable\": true,\n \"w\": 6,\n \"x\": 18,\n \"y\": 23\n },\n \"name\": \"uninterruptible task 数量\",\n \"options\": {\n \"legend\": {\n \"displayMode\": \"hidden\"\n },\n \"standardOptions\": {},\n \"thresholds\": {},\n \"tooltip\": {\n \"mode\": \"all\",\n \"sort\": \"none\"\n }\n },\n \"targets\": [\n {\n \"expr\": \"sum(container_tasks_state{pod=\\\"$pod_name\\\", image!~\\\".*pause.*\\\", state=\\\"uninterruptible\\\"}) by (name)\",\n \"refId\": \"A\"\n }\n ],\n \"type\": \"timeseries\",\n \"version\": \"2.0.0\"\n },\n {\n \"custom\": {\n \"drawStyle\": \"lines\",\n \"fillOpacity\": 0.5,\n \"lineInterpolation\": \"smooth\",\n \"stack\": \"off\"\n },\n \"datasourceCate\": \"prometheus\",\n \"datasourceValue\": \"${datasource}\",\n \"id\": \"7152f66a-d907-4ee9-afd3-a04b12f1019b\",\n \"layout\": {\n \"h\": 7,\n \"i\": \"7152f66a-d907-4ee9-afd3-a04b12f1019b\",\n \"isResizable\": true,\n \"w\": 6,\n \"x\": 0,\n \"y\": 30\n },\n \"name\": \"running task 数量\",\n \"options\": {\n \"legend\": {\n \"displayMode\": \"hidden\"\n },\n \"standardOptions\": {},\n \"thresholds\": {},\n \"tooltip\": {\n \"mode\": \"all\",\n \"sort\": \"none\"\n }\n },\n \"targets\": [\n {\n \"expr\": \"sum(container_tasks_state{pod=\\\"$pod_name\\\", image!~\\\".*pause.*\\\", state=\\\"running\\\"}) by (name)\",\n \"refId\": \"A\"\n }\n ],\n \"type\": \"timeseries\",\n \"version\": \"2.0.0\"\n },\n {\n \"custom\": {\n \"drawStyle\": \"lines\",\n \"fillOpacity\": 0.5,\n \"lineInterpolation\": \"smooth\",\n \"stack\": \"off\"\n },\n \"datasourceCate\": \"prometheus\",\n \"datasourceValue\": \"${datasource}\",\n \"id\": \"d2627af4-5753-4384-880b-84bead73002a\",\n \"layout\": {\n \"h\": 7,\n \"i\": \"d2627af4-5753-4384-880b-84bead73002a\",\n \"isResizable\": true,\n \"w\": 6,\n \"x\": 6,\n \"y\": 30\n },\n \"name\": \"ioawaiting task 数量\",\n \"options\": {\n \"legend\": {\n \"displayMode\": \"hidden\"\n },\n \"standardOptions\": {},\n \"thresholds\": {},\n \"tooltip\": {\n \"mode\": \"all\",\n \"sort\": \"none\"\n }\n },\n \"targets\": [\n {\n \"expr\": \"sum(container_tasks_state{pod=\\\"$pod_name\\\", image!~\\\".*pause.*\\\", state=\\\"iowaiting\\\"}) by (name)\",\n \"refId\": \"A\"\n }\n ],\n \"type\": \"timeseries\",\n \"version\": \"2.0.0\"\n },\n {\n \"custom\": {\n \"drawStyle\": \"lines\",\n \"fillOpacity\": 0.5,\n \"lineInterpolation\": \"smooth\",\n \"stack\": \"off\"\n },\n \"datasourceCate\": \"prometheus\",\n \"datasourceValue\": \"${datasource}\",\n \"id\": \"78801242-2aae-48dc-a3c3-3d0050fac92c\",\n \"layout\": {\n \"h\": 7,\n \"i\": \"78801242-2aae-48dc-a3c3-3d0050fac92c\",\n \"isResizable\": true,\n \"w\": 6,\n \"x\": 12,\n \"y\": 30\n },\n \"name\": \"sleeping task 数量\",\n \"options\": {\n \"legend\": {\n \"displayMode\": \"hidden\"\n },\n \"standardOptions\": {},\n \"thresholds\": {},\n \"tooltip\": {\n \"mode\": \"all\",\n \"sort\": \"none\"\n }\n },\n \"targets\": [\n {\n \"expr\": \"sum(container_tasks_state{pod=\\\"$pod_name\\\", image!~\\\".*pause.*\\\", state=\\\"sleeping\\\"}) by (name)\",\n \"refId\": \"A\"\n }\n ],\n \"type\": \"timeseries\",\n \"version\": \"2.0.0\"\n },\n {\n \"custom\": {\n \"drawStyle\": \"lines\",\n \"fillOpacity\": 0.5,\n \"lineInterpolation\": \"smooth\",\n \"stack\": \"off\"\n },\n \"datasourceCate\": \"prometheus\",\n \"datasourceValue\": \"${datasource}\",\n \"id\": \"723a4b98-52e8-4284-b193-98a470189415\",\n \"layout\": {\n \"h\": 7,\n \"i\": \"723a4b98-52e8-4284-b193-98a470189415\",\n \"isResizable\": true,\n \"w\": 6,\n \"x\": 18,\n \"y\": 30\n },\n \"name\": \"stopped task 数量\",\n \"options\": {\n \"legend\": {\n \"displayMode\": \"hidden\"\n },\n \"standardOptions\": {},\n \"thresholds\": {},\n \"tooltip\": {\n \"mode\": \"all\",\n \"sort\": \"none\"\n }\n },\n \"targets\": [\n {\n \"expr\": \"sum(container_tasks_state{pod=\\\"$pod_name\\\", image!~\\\".*pause.*\\\", state=\\\"stopped\\\"}) by (name)\",\n \"refId\": \"A\"\n }\n ],\n \"type\": \"timeseries\",\n \"version\": \"2.0.0\"\n },\n {\n \"collapsed\": true,\n \"id\": \"39a8bcef-7b91-4ec4-8644-4e5674267437\",\n \"layout\": {\n \"h\": 1,\n \"i\": \"39a8bcef-7b91-4ec4-8644-4e5674267437\",\n \"isResizable\": false,\n \"w\": 24,\n \"x\": 0,\n \"y\": 37\n },\n \"name\": \"内存\",\n \"type\": \"row\"\n },\n {\n \"custom\": {\n \"drawStyle\": \"lines\",\n \"fillOpacity\": 0.5,\n \"gradientMode\": \"none\",\n \"lineInterpolation\": \"smooth\",\n \"lineWidth\": 1,\n \"stack\": \"off\"\n },\n \"datasourceCate\": \"prometheus\",\n \"datasourceValue\": \"${datasource}\",\n \"description\": \"(container_memory_rss + container_memory_cache + container_memory_swap + kernel memory)/ (memory limit), 没有数据表明容器配置没有设置mem limit\",\n \"id\": \"e7b80412-d9b2-4589-8175-abf93a62a524\",\n \"layout\": {\n \"h\": 7,\n \"i\": \"e7b80412-d9b2-4589-8175-abf93a62a524\",\n \"isResizable\": true,\n \"w\": 6,\n \"x\": 0,\n \"y\": 38\n },\n \"name\": \"容器内存使用率\",\n \"options\": {\n \"legend\": {\n \"displayMode\": \"hidden\"\n },\n \"standardOptions\": {\n \"max\": null,\n \"util\": \"percent\"\n },\n \"thresholds\": {},\n \"tooltip\": {\n \"mode\": \"all\",\n \"sort\": \"none\"\n }\n },\n \"targets\": [\n {\n \"expr\": \"((sum(container_memory_usage_bytes{pod=\\\"$pod_name\\\", image!~\\\".*pause.*\\\"}) by (name)) /(sum(container_spec_memory_limit_bytes{pod=\\\"$pod_name\\\", image!~\\\".*pause.*\\\"}) by (name)))*100\",\n \"refId\": \"A\"\n }\n ],\n \"type\": \"timeseries\",\n \"version\": \"2.0.0\"\n },\n {\n \"custom\": {\n \"drawStyle\": \"lines\",\n \"fillOpacity\": 0.5,\n \"lineInterpolation\": \"smooth\",\n \"stack\": \"off\"\n },\n \"datasourceCate\": \"prometheus\",\n \"datasourceValue\": \"${datasource}\",\n \"description\": \"container_memory_rss + container_memory_cache + container_memory_swap + kernel memory\",\n \"id\": \"4c2e1b54-1adb-480e-a581-1763bec5113f\",\n \"layout\": {\n \"h\": 7,\n \"i\": \"4c2e1b54-1adb-480e-a581-1763bec5113f\",\n \"isResizable\": true,\n \"w\": 6,\n \"x\": 6,\n \"y\": 38\n },\n \"name\": \"容器内存使用\",\n \"options\": {\n \"legend\": {\n \"displayMode\": \"hidden\"\n },\n \"standardOptions\": {\n \"util\": \"bytesIEC\"\n },\n \"thresholds\": {},\n \"tooltip\": {\n \"mode\": \"all\",\n \"sort\": \"none\"\n }\n },\n \"targets\": [\n {\n \"expr\": \"(sum(container_memory_usage_bytes{pod=\\\"$pod_name\\\", image!~\\\".*pause.*\\\"}) by (name)) \",\n \"refId\": \"A\"\n }\n ],\n \"type\": \"timeseries\",\n \"version\": \"2.0.0\"\n },\n {\n \"custom\": {\n \"drawStyle\": \"lines\",\n \"fillOpacity\": 0.5,\n \"lineInterpolation\": \"smooth\",\n \"stack\": \"off\"\n },\n \"datasourceCate\": \"prometheus\",\n \"datasourceValue\": \"${datasource}\",\n \"description\": \"容器cache 占用大小\",\n \"id\": \"429e0214-7b71-4fc0-a771-945363948999\",\n \"layout\": {\n \"h\": 7,\n \"i\": \"429e0214-7b71-4fc0-a771-945363948999\",\n \"isResizable\": true,\n \"w\": 6,\n \"x\": 12,\n \"y\": 38\n },\n \"name\": \"容器cache使用\",\n \"options\": {\n \"legend\": {\n \"displayMode\": \"hidden\"\n },\n \"standardOptions\": {\n \"util\": \"bytesIEC\"\n },\n \"thresholds\": {},\n \"tooltip\": {\n \"mode\": \"all\",\n \"sort\": \"none\"\n }\n },\n \"targets\": [\n {\n \"expr\": \"(sum(container_memory_cache{pod=\\\"$pod_name\\\", image!~\\\".*pause.*\\\"}) by (name))\",\n \"refId\": \"A\"\n }\n ],\n \"type\": \"timeseries\",\n \"version\": \"2.0.0\"\n },\n {\n \"custom\": {\n \"drawStyle\": \"lines\",\n \"fillOpacity\": 0.5,\n \"lineInterpolation\": \"smooth\",\n \"stack\": \"off\"\n },\n \"datasourceCate\": \"prometheus\",\n \"datasourceValue\": \"${datasource}\",\n \"description\": \"容器RSS内存占用大小。\",\n \"id\": \"27c1a22c-bdf3-4a8d-bd31-16c66a307f3f\",\n \"layout\": {\n \"h\": 7,\n \"i\": \"27c1a22c-bdf3-4a8d-bd31-16c66a307f3f\",\n \"isResizable\": true,\n \"w\": 6,\n \"x\": 18,\n \"y\": 38\n },\n \"name\": \"容器RSS内存使用\",\n \"options\": {\n \"legend\": {\n \"displayMode\": \"hidden\"\n },\n \"standardOptions\": {\n \"util\": \"bytesIEC\"\n },\n \"thresholds\": {},\n \"tooltip\": {\n \"mode\": \"all\",\n \"sort\": \"none\"\n }\n },\n \"targets\": [\n {\n \"expr\": \"(sum(container_memory_rss{pod=\\\"$pod_name\\\", image!~\\\".*pause.*\\\"}) by (name))\",\n \"refId\": \"A\"\n }\n ],\n \"type\": \"timeseries\",\n \"version\": \"2.0.0\"\n },\n {\n \"custom\": {\n \"drawStyle\": \"lines\",\n \"fillOpacity\": 0.5,\n \"lineInterpolation\": \"smooth\",\n \"stack\": \"off\"\n },\n \"datasourceCate\": \"prometheus\",\n \"datasourceValue\": \"${datasource}\",\n \"description\": \"容器内存Limit配置,0表示没有设置内存 Limit\",\n \"id\": \"13173c71-14a9-43a0-9cbe-34c1bb453f2b\",\n \"layout\": {\n \"h\": 7,\n \"i\": \"13173c71-14a9-43a0-9cbe-34c1bb453f2b\",\n \"isResizable\": true,\n \"w\": 6,\n \"x\": 0,\n \"y\": 45\n },\n \"name\": \"容器内存 Limit\",\n \"options\": {\n \"legend\": {\n \"displayMode\": \"hidden\"\n },\n \"standardOptions\": {\n \"util\": \"bytesIEC\"\n },\n \"thresholds\": {},\n \"tooltip\": {\n \"mode\": \"all\",\n \"sort\": \"none\"\n }\n },\n \"targets\": [\n {\n \"expr\": \"sum(container_spec_memory_limit_bytes{pod=\\\"$pod_name\\\", image!~\\\".*pause.*\\\"}) by (name)\",\n \"refId\": \"A\"\n }\n ],\n \"type\": \"timeseries\",\n \"version\": \"2.0.0\"\n },\n {\n \"custom\": {\n \"calc\": \"lastNotNull\",\n \"colSpan\": 1,\n \"colorMode\": \"value\",\n \"textMode\": \"valueAndName\",\n \"textSize\": {}\n },\n \"datasourceCate\": \"prometheus\",\n \"datasourceValue\": \"${datasource}\",\n \"id\": \"d3a7153b-f174-473c-a5ae-1ec8ff4ef318\",\n \"layout\": {\n \"h\": 7,\n \"i\": \"d3a7153b-f174-473c-a5ae-1ec8ff4ef318\",\n \"isResizable\": true,\n \"w\": 6,\n \"x\": 6,\n \"y\": 45\n },\n \"name\": \"容器发生OOM次数\",\n \"options\": {\n \"standardOptions\": {}\n },\n \"targets\": [\n {\n \"expr\": \"sum(container_oom_events_total{pod=\\\"$pod_name\\\", image!~\\\".*pause.*\\\"}) by (name) \",\n \"refId\": \"A\"\n }\n ],\n \"type\": \"stat\",\n \"version\": \"2.0.0\"\n },\n {\n \"custom\": {\n \"drawStyle\": \"lines\",\n \"fillOpacity\": 0.5,\n \"lineInterpolation\": \"smooth\",\n \"stack\": \"off\"\n },\n \"datasourceCate\": \"prometheus\",\n \"datasourceValue\": \"${datasource}\",\n \"description\": \"网络接收错误数(1分钟内)\",\n \"id\": \"271d8ff6-2382-488d-b479-83e38b247012\",\n \"layout\": {\n \"h\": 7,\n \"i\": \"271d8ff6-2382-488d-b479-83e38b247012\",\n \"isResizable\": true,\n \"w\": 6,\n \"x\": 12,\n \"y\": 45\n },\n \"name\": \"网络接收错误数\",\n \"options\": {\n \"legend\": {\n \"displayMode\": \"hidden\"\n },\n \"standardOptions\": {},\n \"thresholds\": {},\n \"tooltip\": {\n \"mode\": \"all\",\n \"sort\": \"none\"\n }\n },\n \"targets\": [\n {\n \"expr\": \"sum(rate(container_network_receive_errors_total{pod=\\\"$pod_name\\\"}[1m])) by(name, interface)\",\n \"refId\": \"A\"\n }\n ],\n \"type\": \"timeseries\",\n \"version\": \"2.0.0\"\n },\n {\n \"custom\": {\n \"drawStyle\": \"lines\",\n \"fillOpacity\": 0.5,\n \"lineInterpolation\": \"smooth\",\n \"stack\": \"off\"\n },\n \"datasourceCate\": \"prometheus\",\n \"datasourceValue\": \"${datasource}\",\n \"description\": \"网络接收丢包数(1分钟内)\",\n \"id\": \"e7a0879b-82a9-4518-8c5c-93bc73548401\",\n \"layout\": {\n \"h\": 7,\n \"i\": \"e7a0879b-82a9-4518-8c5c-93bc73548401\",\n \"isResizable\": true,\n \"w\": 6,\n \"x\": 18,\n \"y\": 45\n },\n \"name\": \"网络接收丢包数\",\n \"options\": {\n \"legend\": {\n \"displayMode\": \"hidden\"\n },\n \"standardOptions\": {},\n \"thresholds\": {},\n \"tooltip\": {\n \"mode\": \"all\",\n \"sort\": \"none\"\n }\n },\n \"targets\": [\n {\n \"expr\": \"sum(rate(container_network_receive_packets_dropped_total{pod=\\\"$pod_name\\\"}[1m])) by(name, interface)\",\n \"refId\": \"A\"\n }\n ],\n \"type\": \"timeseries\",\n \"version\": \"2.0.0\"\n },\n {\n \"collapsed\": true,\n \"id\": \"8d49afd3-d8fa-4714-aaa2-b10e045c8976\",\n \"layout\": {\n \"h\": 1,\n \"i\": \"8d49afd3-d8fa-4714-aaa2-b10e045c8976\",\n \"isResizable\": false,\n \"w\": 24,\n \"x\": 0,\n \"y\": 52\n },\n \"name\": \"磁盘\",\n \"type\": \"row\"\n },\n {\n \"custom\": {\n \"drawStyle\": \"lines\",\n \"fillOpacity\": 0.5,\n \"lineInterpolation\": \"smooth\",\n \"stack\": \"off\"\n },\n \"datasourceCate\": \"prometheus\",\n \"datasourceValue\": \"${datasource}\",\n \"id\": \"ef7e1b00-2a77-4a34-a138-5c8207088476\",\n \"layout\": {\n \"h\": 7,\n \"i\": \"ef7e1b00-2a77-4a34-a138-5c8207088476\",\n \"isResizable\": true,\n \"w\": 6,\n \"x\": 0,\n \"y\": 53\n },\n \"name\": \"文件系统读取速率\",\n \"options\": {\n \"legend\": {\n \"displayMode\": \"hidden\"\n },\n \"standardOptions\": {\n \"util\": \"bytesIEC\"\n },\n \"thresholds\": {},\n \"tooltip\": {\n \"mode\": \"all\",\n \"sort\": \"none\"\n }\n },\n \"targets\": [\n {\n \"expr\": \"sum(rate(container_fs_reads_bytes_total{pod=\\\"$pod_name\\\", image!~\\\".*pause.*\\\"}[1m])) by(name)\",\n \"refId\": \"A\"\n }\n ],\n \"type\": \"timeseries\",\n \"version\": \"2.0.0\"\n },\n {\n \"custom\": {\n \"drawStyle\": \"lines\",\n \"fillOpacity\": 0.5,\n \"lineInterpolation\": \"smooth\",\n \"stack\": \"off\"\n },\n \"datasourceCate\": \"prometheus\",\n \"datasourceValue\": \"${datasource}\",\n \"id\": \"e55b7db3-2b13-43f9-aa2d-e9a0a929df4b\",\n \"layout\": {\n \"h\": 7,\n \"i\": \"e55b7db3-2b13-43f9-aa2d-e9a0a929df4b\",\n \"isResizable\": true,\n \"w\": 6,\n \"x\": 6,\n \"y\": 53\n },\n \"name\": \"文件系统写入速率\",\n \"options\": {\n \"legend\": {\n \"displayMode\": \"hidden\"\n },\n \"standardOptions\": {\n \"util\": \"bytesIEC\"\n },\n \"thresholds\": {},\n \"tooltip\": {\n \"mode\": \"all\",\n \"sort\": \"none\"\n }\n },\n \"targets\": [\n {\n \"expr\": \"sum(rate(container_fs_writes_bytes_total{pod=\\\"$pod_name\\\", image!~\\\".*pause.*\\\"}[1m])) by(name)\",\n \"refId\": \"A\"\n }\n ],\n \"type\": \"timeseries\",\n \"version\": \"2.0.0\"\n },\n {\n \"custom\": {\n \"drawStyle\": \"lines\",\n \"fillOpacity\": 0.5,\n \"lineInterpolation\": \"smooth\",\n \"stack\": \"off\"\n },\n \"datasourceCate\": \"prometheus\",\n \"datasourceValue\": \"${datasource}\",\n \"id\": \"a2d7ba64-fd4d-4713-9295-8663fa72f675\",\n \"layout\": {\n \"h\": 7,\n \"i\": \"a2d7ba64-fd4d-4713-9295-8663fa72f675\",\n \"isResizable\": true,\n \"w\": 6,\n \"x\": 12,\n \"y\": 53\n },\n \"name\": \"容器I/O\",\n \"options\": {\n \"legend\": {\n \"displayMode\": \"hidden\"\n },\n \"standardOptions\": {},\n \"thresholds\": {},\n \"tooltip\": {\n \"mode\": \"all\",\n \"sort\": \"none\"\n }\n },\n \"targets\": [\n {\n \"expr\": \"sum(container_fs_io_current{pod=\\\"$pod_name\\\", image!~\\\".*pause.*\\\"}) by (name) \",\n \"refId\": \"A\"\n }\n ],\n \"type\": \"timeseries\",\n \"version\": \"2.0.0\"\n },\n {\n \"custom\": {\n \"drawStyle\": \"lines\",\n \"fillOpacity\": 0.5,\n \"lineInterpolation\": \"smooth\",\n \"stack\": \"off\"\n },\n \"datasourceCate\": \"prometheus\",\n \"datasourceValue\": \"${datasource}\",\n \"id\": \"2b4e94ef-c994-4910-b72b-428bf5156a21\",\n \"layout\": {\n \"h\": 7,\n \"i\": \"2b4e94ef-c994-4910-b72b-428bf5156a21\",\n \"isResizable\": true,\n \"w\": 6,\n \"x\": 18,\n \"y\": 53\n },\n \"name\": \"inode数量\",\n \"options\": {\n \"legend\": {\n \"displayMode\": \"hidden\"\n },\n \"standardOptions\": {},\n \"thresholds\": {},\n \"tooltip\": {\n \"mode\": \"all\",\n \"sort\": \"none\"\n }\n },\n \"targets\": [\n {\n \"expr\": \"sum(container_fs_inodes_total{pod=\\\"$pod_name\\\", image!~\\\".*pause.*\\\"}) by (name) \",\n \"refId\": \"A\"\n }\n ],\n \"type\": \"timeseries\",\n \"version\": \"2.0.0\"\n },\n {\n \"custom\": {\n \"drawStyle\": \"lines\",\n \"fillOpacity\": 0.5,\n \"lineInterpolation\": \"smooth\",\n \"stack\": \"off\"\n },\n \"datasourceCate\": \"prometheus\",\n \"datasourceValue\": \"${datasource}\",\n \"id\": \"3abade99-8f34-4a1e-bb48-c5ba1e128749\",\n \"layout\": {\n \"h\": 7,\n \"i\": \"3abade99-8f34-4a1e-bb48-c5ba1e128749\",\n \"isResizable\": true,\n \"w\": 6,\n \"x\": 0,\n \"y\": 60\n },\n \"name\": \"容器已使用的文件系统大小\",\n \"options\": {\n \"legend\": {\n \"displayMode\": \"hidden\"\n },\n \"standardOptions\": {\n \"util\": \"bytesIEC\"\n },\n \"thresholds\": {},\n \"tooltip\": {\n \"mode\": \"all\",\n \"sort\": \"none\"\n }\n },\n \"targets\": [\n {\n \"expr\": \"sum(container_fs_usage_bytes{pod=\\\"$pod_name\\\", image!~\\\".*pause.*\\\"}) by (name) \",\n \"refId\": \"A\"\n }\n ],\n \"type\": \"timeseries\",\n \"version\": \"2.0.0\"\n },\n {\n \"custom\": {\n \"drawStyle\": \"lines\",\n \"fillOpacity\": 0.5,\n \"lineInterpolation\": \"smooth\",\n \"stack\": \"off\"\n },\n \"datasourceCate\": \"prometheus\",\n \"datasourceValue\": \"${datasource}\",\n \"description\": \"网络接收数据包数(1分钟内)\",\n \"id\": \"8b0bac93-8bd0-4452-a200-a9cea74345b3\",\n \"layout\": {\n \"h\": 7,\n \"i\": \"8b0bac93-8bd0-4452-a200-a9cea74345b3\",\n \"isResizable\": true,\n \"w\": 6,\n \"x\": 6,\n \"y\": 60\n },\n \"name\": \"网络接收数据包数\",\n \"options\": {\n \"legend\": {\n \"displayMode\": \"hidden\"\n },\n \"standardOptions\": {},\n \"thresholds\": {},\n \"tooltip\": {\n \"mode\": \"all\",\n \"sort\": \"none\"\n }\n },\n \"targets\": [\n {\n \"expr\": \"sum(rate(container_network_receive_packets_total{pod=\\\"$pod_name\\\"}[1m])) by(name, interface)\",\n \"refId\": \"A\"\n }\n ],\n \"type\": \"timeseries\",\n \"version\": \"2.0.0\"\n },\n {\n \"collapsed\": true,\n \"id\": \"fde213bc-fe49-431a-9495-2219fcaaa01a\",\n \"layout\": {\n \"h\": 1,\n \"i\": \"fde213bc-fe49-431a-9495-2219fcaaa01a\",\n \"isResizable\": false,\n \"w\": 24,\n \"x\": 0,\n \"y\": 67\n },\n \"name\": \"网络\",\n \"type\": \"row\"\n },\n {\n \"custom\": {\n \"drawStyle\": \"lines\",\n \"fillOpacity\": 0.5,\n \"lineInterpolation\": \"smooth\",\n \"stack\": \"off\"\n },\n \"datasourceCate\": \"prometheus\",\n \"datasourceValue\": \"${datasource}\",\n \"description\": \"容器网络发送的字节数(1 分钟内)\",\n \"id\": \"4e70bc47-1510-41fe-a924-3ffa36d11f0f\",\n \"layout\": {\n \"h\": 7,\n \"i\": \"4e70bc47-1510-41fe-a924-3ffa36d11f0f\",\n \"isResizable\": true,\n \"w\": 6,\n \"x\": 0,\n \"y\": 68\n },\n \"name\": \"网络发送速率\",\n \"options\": {\n \"legend\": {\n \"displayMode\": \"hidden\"\n },\n \"standardOptions\": {\n \"util\": \"bytesIEC\"\n },\n \"thresholds\": {},\n \"tooltip\": {\n \"mode\": \"all\",\n \"sort\": \"none\"\n }\n },\n \"targets\": [\n {\n \"expr\": \"sum(rate(container_network_transmit_bytes_total{pod=\\\"$pod_name\\\"}[1m])) by(name, interface)\",\n \"refId\": \"A\"\n }\n ],\n \"type\": \"timeseries\",\n \"version\": \"2.0.0\"\n },\n {\n \"custom\": {\n \"drawStyle\": \"lines\",\n \"fillOpacity\": 0.5,\n \"lineInterpolation\": \"smooth\",\n \"stack\": \"off\"\n },\n \"datasourceCate\": \"prometheus\",\n \"datasourceValue\": \"${datasource}\",\n \"description\": \"网络发送数据包数(1分钟内)\",\n \"id\": \"00ca29e5-7c97-491d-a28f-0f2d66ea47c5\",\n \"layout\": {\n \"h\": 7,\n \"i\": \"00ca29e5-7c97-491d-a28f-0f2d66ea47c5\",\n \"isResizable\": true,\n \"w\": 6,\n \"x\": 6,\n \"y\": 68\n },\n \"name\": \"网络发送数据包\",\n \"options\": {\n \"legend\": {\n \"displayMode\": \"hidden\"\n },\n \"standardOptions\": {},\n \"thresholds\": {},\n \"tooltip\": {\n \"mode\": \"all\",\n \"sort\": \"none\"\n }\n },\n \"targets\": [\n {\n \"expr\": \"sum(rate(container_network_transmit_packets_total{pod=\\\"$pod_name\\\"}[1m])) by(name, interface)\",\n \"refId\": \"A\"\n }\n ],\n \"type\": \"timeseries\",\n \"version\": \"2.0.0\"\n },\n {\n \"custom\": {\n \"drawStyle\": \"lines\",\n \"fillOpacity\": 0.5,\n \"lineInterpolation\": \"smooth\",\n \"stack\": \"off\"\n },\n \"datasourceCate\": \"prometheus\",\n \"datasourceValue\": \"${datasource}\",\n \"description\": \"网络发送错误数(1分钟内)\",\n \"id\": \"8cd76b5f-5bba-421a-9fda-42f406f54ed5\",\n \"layout\": {\n \"h\": 7,\n \"i\": \"8cd76b5f-5bba-421a-9fda-42f406f54ed5\",\n \"isResizable\": true,\n \"w\": 6,\n \"x\": 12,\n \"y\": 68\n },\n \"name\": \"网络发送错误数\",\n \"options\": {\n \"legend\": {\n \"displayMode\": \"hidden\"\n },\n \"standardOptions\": {},\n \"thresholds\": {},\n \"tooltip\": {\n \"mode\": \"all\",\n \"sort\": \"none\"\n }\n },\n \"targets\": [\n {\n \"expr\": \"sum(rate(container_network_transmit_errors_total{pod=\\\"$pod_name\\\"}[1m])) by(name, interface)\",\n \"refId\": \"A\"\n }\n ],\n \"type\": \"timeseries\",\n \"version\": \"2.0.0\"\n },\n {\n \"custom\": {\n \"drawStyle\": \"lines\",\n \"fillOpacity\": 0.5,\n \"lineInterpolation\": \"smooth\",\n \"stack\": \"off\"\n },\n \"datasourceCate\": \"prometheus\",\n \"datasourceValue\": \"${datasource}\",\n \"description\": \"网络发送丢包数(1分钟内)\",\n \"id\": \"58aaebbb-b1cf-4089-bcb5-70b03c05318d\",\n \"layout\": {\n \"h\": 7,\n \"i\": \"58aaebbb-b1cf-4089-bcb5-70b03c05318d\",\n \"isResizable\": true,\n \"w\": 6,\n \"x\": 18,\n \"y\": 68\n },\n \"name\": \"网络发送丢包数\",\n \"options\": {\n \"legend\": {\n \"displayMode\": \"hidden\"\n },\n \"standardOptions\": {},\n \"thresholds\": {},\n \"tooltip\": {\n \"mode\": \"all\",\n \"sort\": \"none\"\n }\n },\n \"targets\": [\n {\n \"expr\": \"sum(rate(container_network_transmit_packets_dropped_total{pod=\\\"$pod_name\\\"}[1m])) by(name, interface)\",\n \"refId\": \"A\"\n }\n ],\n \"type\": \"timeseries\",\n \"version\": \"2.0.0\"\n },\n {\n \"custom\": {\n \"drawStyle\": \"lines\",\n \"fillOpacity\": 0.5,\n \"lineInterpolation\": \"smooth\",\n \"stack\": \"off\"\n },\n \"datasourceCate\": \"prometheus\",\n \"datasourceValue\": \"${datasource}\",\n \"description\": \"容器网络接收的字节数(1 分钟内)\",\n \"id\": \"120d3540-cce5-4b08-b596-0ec6a5b2d497\",\n \"layout\": {\n \"h\": 7,\n \"i\": \"120d3540-cce5-4b08-b596-0ec6a5b2d497\",\n \"isResizable\": true,\n \"w\": 6,\n \"x\": 0,\n \"y\": 75\n },\n \"name\": \"网络接收速率\",\n \"options\": {\n \"legend\": {\n \"displayMode\": \"hidden\"\n },\n \"standardOptions\": {\n \"util\": \"bytesIEC\"\n },\n \"thresholds\": {},\n \"tooltip\": {\n \"mode\": \"all\",\n \"sort\": \"none\"\n }\n },\n \"targets\": [\n {\n \"expr\": \"sum(rate(container_network_receive_bytes_total{pod=\\\"$pod_name\\\"}[1m])) by(name, interface)\",\n \"refId\": \"A\"\n }\n ],\n \"type\": \"timeseries\",\n \"version\": \"2.0.0\"\n }\n ],\n \"var\": [\n {\n \"definition\": \"prometheus\",\n \"name\": \"datasource\",\n \"type\": \"datasource\"\n },\n {\n \"datasource\": {\n \"cate\": \"prometheus\",\n \"value\": \"${datasource}\"\n },\n \"definition\": \"label_values(kube_deployment_labels, deployment)\",\n \"hide\": false,\n \"multi\": false,\n \"name\": \"deployment\",\n \"reg\": \"\",\n \"type\": \"query\"\n },\n {\n \"datasource\": {\n \"cate\": \"prometheus\",\n \"value\": \"${datasource}\"\n },\n \"definition\": \"label_values(kube_pod_status_ready{pod=~\\\"$deployment.*\\\"}, pod)\",\n \"hide\": false,\n \"multi\": false,\n \"name\": \"pod_name\",\n \"reg\": \"\",\n \"type\": \"query\"\n }\n ],\n \"version\": \"3.0.0\"\n },\n \"uuid\": 1727335102129685000\n}"
},
{
"path": "integrations/Kubernetes/dashboards/KubeStateMetrics.json",
"content": "{\n \"id\": 0,\n \"group_id\": 0,\n \"name\": \"Kubernetes / Kube State Metrics\",\n \"ident\": \"\",\n \"tags\": \"Categraf\",\n \"create_at\": 0,\n \"create_by\": \"\",\n \"update_at\": 0,\n \"update_by\": \"\",\n \"configs\": {\n \"panels\": [\n {\n \"collapsed\": true,\n \"id\": \"0786021a-c1e7-4425-89b5-221c548e66ac\",\n \"layout\": {\n \"h\": 1,\n \"i\": \"0786021a-c1e7-4425-89b5-221c548e66ac\",\n \"isResizable\": false,\n \"w\": 24,\n \"x\": 0,\n \"y\": 0\n },\n \"name\": \"Node\",\n \"panels\": [],\n \"type\": \"row\"\n },\n {\n \"custom\": {\n \"calc\": \"lastNotNull\",\n \"colSpan\": 1,\n \"colorMode\": \"background\",\n \"textMode\": \"valueAndName\",\n \"textSize\": {}\n },\n \"datasourceCate\": \"prometheus\",\n \"datasourceValue\": \"${datasource}\",\n \"id\": \"65cefb81-39fa-455a-b514-6c7de7b666b1\",\n \"layout\": {\n \"h\": 3,\n \"i\": \"65cefb81-39fa-455a-b514-6c7de7b666b1\",\n \"isResizable\": true,\n \"w\": 4,\n \"x\": 0,\n \"y\": 1\n },\n \"name\": \"Total Node\",\n \"options\": {\n \"standardOptions\": {}\n },\n \"targets\": [\n {\n \"expr\": \"sum(kube_node_status_condition{cluster=~\\\"$cluster\\\", condition=\\\"Ready\\\"})\",\n \"refId\": \"A\"\n }\n ],\n \"type\": \"stat\",\n \"version\": \"2.0.0\"\n },\n {\n \"custom\": {\n \"calc\": \"lastNotNull\",\n \"colSpan\": 1,\n \"colorMode\": \"value\",\n \"textMode\": \"valueAndName\",\n \"textSize\": {}\n },\n \"datasourceCate\": \"prometheus\",\n \"datasourceValue\": \"${datasource}\",\n \"id\": \"2bc28c00-c417-43c0-b577-2d86e42e7cc7\",\n \"layout\": {\n \"h\": 3,\n \"i\": \"2bc28c00-c417-43c0-b577-2d86e42e7cc7\",\n \"isResizable\": true,\n \"w\": 4,\n \"x\": 4,\n \"y\": 1\n },\n \"name\": \"Not Ready Node\",\n \"options\": {\n \"standardOptions\": {},\n \"valueMappings\": [\n {\n \"match\": {\n \"from\": null,\n \"to\": 1\n },\n \"result\": {\n \"color\": \"#417505\"\n },\n \"type\": \"range\"\n },\n {\n \"match\": {\n \"from\": 1\n },\n \"result\": {\n \"color\": \"#d0021b\"\n },\n \"type\": \"range\"\n }\n ]\n },\n \"targets\": [\n {\n \"expr\": \"sum(kube_node_status_condition{cluster=~\\\"$cluster\\\",condition=\\\"Ready\\\", status!=\\\"true\\\"})\",\n \"refId\": \"A\"\n }\n ],\n \"type\": \"stat\",\n \"version\": \"2.0.0\"\n },\n {\n \"custom\": {\n \"calc\": \"lastNotNull\",\n \"colSpan\": 1,\n \"colorMode\": \"value\",\n \"textMode\": \"valueAndName\",\n \"textSize\": {}\n },\n \"datasourceCate\": \"prometheus\",\n \"datasourceValue\": \"${datasource}\",\n \"id\": \"5ea68c0a-2a9a-4dac-a134-9768bdbdc6eb\",\n \"layout\": {\n \"h\": 3,\n \"i\": \"968c87d3-6a9b-401e-895f-55e929eb37ac\",\n \"isResizable\": true,\n \"w\": 4,\n \"x\": 8,\n \"y\": 1\n },\n \"name\": \"有磁盘压力\",\n \"options\": {\n \"standardOptions\": {},\n \"valueMappings\": [\n {\n \"match\": {\n \"from\": null,\n \"to\": 1\n },\n \"result\": {\n \"color\": \"#417505\"\n },\n \"type\": \"range\"\n },\n {\n \"match\": {\n \"from\": 1\n },\n \"result\": {\n \"color\": \"#d0021b\"\n },\n \"type\": \"range\"\n }\n ]\n },\n \"targets\": [\n {\n \"expr\": \"sum(kube_node_status_condition{cluster=~\\\"$cluster\\\",condition=\\\"DiskPressure\\\", status=\\\"true\\\"})\",\n \"refId\": \"A\"\n }\n ],\n \"type\": \"stat\",\n \"version\": \"2.0.0\"\n },\n {\n \"custom\": {\n \"calc\": \"lastNotNull\",\n \"colSpan\": 1,\n \"colorMode\": \"value\",\n \"textMode\": \"valueAndName\",\n \"textSize\": {}\n },\n \"datasourceCate\": \"prometheus\",\n \"datasourceValue\": \"${datasource}\",\n \"id\": \"72462b79-e531-4bbb-a43e-26b8e40e40fd\",\n \"layout\": {\n \"h\": 3,\n \"i\": \"fd201859-06bf-42c8-b4d8-e38bd1382bbe\",\n \"isResizable\": true,\n \"w\": 4,\n \"x\": 12,\n \"y\": 1\n },\n \"name\": \"有内存压力\",\n \"options\": {\n \"standardOptions\": {},\n \"valueMappings\": [\n {\n \"match\": {\n \"from\": null,\n \"to\": 1\n },\n \"result\": {\n \"color\": \"#417505\"\n },\n \"type\": \"range\"\n },\n {\n \"match\": {\n \"from\": 1\n },\n \"result\": {\n \"color\": \"#d0021b\"\n },\n \"type\": \"range\"\n }\n ]\n },\n \"targets\": [\n {\n \"expr\": \"sum(kube_node_status_condition{cluster=~\\\"$cluster\\\",condition=\\\"MemoryPressure\\\", status=\\\"true\\\"})\",\n \"refId\": \"A\"\n }\n ],\n \"type\": \"stat\",\n \"version\": \"2.0.0\"\n },\n {\n \"custom\": {\n \"calc\": \"lastNotNull\",\n \"colSpan\": 1,\n \"colorMode\": \"value\",\n \"textMode\": \"valueAndName\",\n \"textSize\": {}\n },\n \"datasourceCate\": \"prometheus\",\n \"datasourceValue\": \"${datasource}\",\n \"id\": \"66324dd4-c937-44c2-8e71-9c97d13d2e07\",\n \"layout\": {\n \"h\": 3,\n \"i\": \"e6280126-40bf-4683-95b8-7a0a38bbd943\",\n \"isResizable\": true,\n \"w\": 4,\n \"x\": 16,\n \"y\": 1\n },\n \"name\": \"有网络压力\",\n \"options\": {\n \"standardOptions\": {},\n \"valueMappings\": [\n {\n \"match\": {\n \"from\": null,\n \"to\": 1\n },\n \"result\": {\n \"color\": \"#417505\"\n },\n \"type\": \"range\"\n },\n {\n \"match\": {\n \"from\": 1\n },\n \"result\": {\n \"color\": \"#d0021b\"\n },\n \"type\": \"range\"\n }\n ]\n },\n \"targets\": [\n {\n \"expr\": \"sum(kube_node_status_condition{cluster=~\\\"$cluster\\\",condition=\\\"NetworkUnavailable\\\", status=\\\"true\\\"})\",\n \"refId\": \"A\"\n }\n ],\n \"type\": \"stat\",\n \"version\": \"2.0.0\"\n },\n {\n \"custom\": {\n \"calc\": \"lastNotNull\",\n \"colSpan\": 1,\n \"colorMode\": \"value\",\n \"textMode\": \"valueAndName\",\n \"textSize\": {}\n },\n \"datasourceCate\": \"prometheus\",\n \"datasourceValue\": \"${datasource}\",\n \"id\": \"caa0c577-12d8-4c4d-92ac-99ba3e38995e\",\n \"layout\": {\n \"h\": 3,\n \"i\": \"9488bd89-3527-453a-aca7-3fb779a182b1\",\n \"isResizable\": true,\n \"w\": 4,\n \"x\": 20,\n \"y\": 1\n },\n \"name\": \"有PID压力\",\n \"options\": {\n \"standardOptions\": {},\n \"valueMappings\": [\n {\n \"match\": {\n \"from\": null,\n \"to\": 1\n },\n \"result\": {\n \"color\": \"#417505\"\n },\n \"type\": \"range\"\n },\n {\n \"match\": {\n \"from\": 1\n },\n \"result\": {\n \"color\": \"#d0021b\"\n },\n \"type\": \"range\"\n }\n ]\n },\n \"targets\": [\n {\n \"expr\": \"sum(kube_node_status_condition{cluster=~\\\"$cluster\\\",condition=\\\"PIDPressure\\\", status=\\\"true\\\"})\",\n \"refId\": \"A\"\n }\n ],\n \"type\": \"stat\",\n \"version\": \"2.0.0\"\n },\n {\n \"custom\": {\n \"calc\": \"lastNotNull\",\n \"colSpan\": 1,\n \"colorMode\": \"value\",\n \"textMode\": \"valueAndName\",\n \"textSize\": {}\n },\n \"datasourceCate\": \"prometheus\",\n \"datasourceValue\": \"${datasource}\",\n \"id\": \"a028f8d2-b1fd-47d7-8331-e12df56c8ae6\",\n \"layout\": {\n \"h\": 3,\n \"i\": \"a028f8d2-b1fd-47d7-8331-e12df56c8ae6\",\n \"isResizable\": true,\n \"w\": 8,\n \"x\": 0,\n \"y\": 4\n },\n \"name\": \"集群容量:CPU Cores\",\n \"options\": {\n \"standardOptions\": {}\n },\n \"targets\": [\n {\n \"expr\": \"sum(kube_node_status_capacity{cluster=~\\\"$cluster\\\", resource=\\\"cpu\\\"})\",\n \"refId\": \"A\"\n }\n ],\n \"type\": \"stat\",\n \"version\": \"2.0.0\"\n },\n {\n \"custom\": {\n \"calc\": \"lastNotNull\",\n \"colSpan\": 1,\n \"colorMode\": \"value\",\n \"textMode\": \"valueAndName\",\n \"textSize\": {}\n },\n \"datasourceCate\": \"prometheus\",\n \"datasourceValue\": \"${datasource}\",\n \"id\": \"1bdfd329-01a4-453a-b071-b14d18f943df\",\n \"layout\": {\n \"h\": 3,\n \"i\": \"81f63499-c085-44e4-a8e9-e49212c7bdcb\",\n \"isResizable\": true,\n \"w\": 8,\n \"x\": 8,\n \"y\": 4\n },\n \"name\": \"集群容量:Memory\",\n \"options\": {\n \"standardOptions\": {\n \"decimals\": 0,\n \"util\": \"bytesIEC\"\n }\n },\n \"targets\": [\n {\n \"expr\": \"sum(kube_node_status_capacity{cluster=~\\\"$cluster\\\", resource=\\\"memory\\\"})\",\n \"refId\": \"A\"\n }\n ],\n \"type\": \"stat\",\n \"version\": \"2.0.0\"\n },\n {\n \"custom\": {\n \"calc\": \"lastNotNull\",\n \"colSpan\": 1,\n \"colorMode\": \"value\",\n \"textMode\": \"valueAndName\",\n \"textSize\": {}\n },\n \"datasourceCate\": \"prometheus\",\n \"datasourceValue\": \"${datasource}\",\n \"id\": \"ffa6374c-d8ef-442b-bc3b-2fa4a0e4cc94\",\n \"layout\": {\n \"h\": 3,\n \"i\": \"c1a1d33c-2d35-41fd-a32c-6297ae8a6912\",\n \"isResizable\": true,\n \"w\": 8,\n \"x\": 16,\n \"y\": 4\n },\n \"name\": \"集群容量:Ephemeral Storage\",\n \"options\": {\n \"standardOptions\": {\n \"decimals\": 0,\n \"util\": \"bytesIEC\"\n }\n },\n \"targets\": [\n {\n \"expr\": \"sum(kube_node_status_capacity{cluster=~\\\"$cluster\\\", resource=\\\"ephemeral_storage\\\"})\",\n \"refId\": \"A\"\n }\n ],\n \"type\": \"stat\",\n \"version\": \"2.0.0\"\n },\n {\n \"collapsed\": true,\n \"id\": \"f03009d7-e495-43e0-9200-2026a84ec54b\",\n \"layout\": {\n \"h\": 1,\n \"i\": \"f03009d7-e495-43e0-9200-2026a84ec54b\",\n \"isResizable\": false,\n \"w\": 24,\n \"x\": 0,\n \"y\": 13\n },\n \"name\": \"Daemonset\",\n \"panels\": [],\n \"type\": \"row\"\n },\n {\n \"custom\": {\n \"calc\": \"lastNotNull\",\n \"colSpan\": 1,\n \"colorMode\": \"background\",\n \"textMode\": \"valueAndName\",\n \"textSize\": {}\n },\n \"datasourceCate\": \"prometheus\",\n \"datasourceValue\": \"${datasource}\",\n \"id\": \"57d6e18b-d083-4732-86ca-e266db3191f4\",\n \"layout\": {\n \"h\": 3,\n \"i\": \"57d6e18b-d083-4732-86ca-e266db3191f4\",\n \"isResizable\": true,\n \"w\": 4,\n \"x\": 0,\n \"y\": 14\n },\n \"name\": \"Desired Number Scheduled\",\n \"options\": {\n \"standardOptions\": {}\n },\n \"targets\": [\n {\n \"expr\": \"sum(kube_daemonset_status_desired_number_scheduled{cluster=~\\\"$cluster\\\"})\",\n \"refId\": \"A\"\n }\n ],\n \"type\": \"stat\",\n \"version\": \"2.0.0\"\n },\n {\n \"custom\": {\n \"calc\": \"lastNotNull\",\n \"colSpan\": 1,\n \"colorMode\": \"value\",\n \"textMode\": \"valueAndName\",\n \"textSize\": {}\n },\n \"datasourceCate\": \"prometheus\",\n \"datasourceValue\": \"${datasource}\",\n \"id\": \"43fb02d1-1647-421d-a5c7-f8f9c6bc5cdd\",\n \"layout\": {\n \"h\": 3,\n \"i\": \"67af9443-9f8e-4400-90e2-7af3b6fc2f0c\",\n \"isResizable\": true,\n \"w\": 4,\n \"x\": 4,\n \"y\": 14\n },\n \"name\": \"Current Number Scheduled\",\n \"options\": {\n \"standardOptions\": {}\n },\n \"targets\": [\n {\n \"expr\": \"sum(kube_daemonset_status_current_number_scheduled{cluster=~\\\"$cluster\\\"})\",\n \"refId\": \"A\"\n }\n ],\n \"type\": \"stat\",\n \"version\": \"2.0.0\"\n },\n {\n \"custom\": {\n \"calc\": \"lastNotNull\",\n \"colSpan\": 1,\n \"colorMode\": \"value\",\n \"textMode\": \"valueAndName\",\n \"textSize\": {}\n },\n \"datasourceCate\": \"prometheus\",\n \"datasourceValue\": \"${datasource}\",\n \"id\": \"ba24545a-3c6d-475c-b7e6-aeb4367a03e3\",\n \"layout\": {\n \"h\": 3,\n \"i\": \"fd32a463-738b-44b8-91b8-395058f177f7\",\n \"isResizable\": true,\n \"w\": 4,\n \"x\": 8,\n \"y\": 14\n },\n \"name\": \"Ready\",\n \"options\": {\n \"standardOptions\": {}\n },\n \"targets\": [\n {\n \"expr\": \"sum(kube_daemonset_status_number_ready{cluster=~\\\"$cluster\\\"})\",\n \"refId\": \"A\"\n }\n ],\n \"type\": \"stat\",\n \"version\": \"2.0.0\"\n },\n {\n \"custom\": {\n \"calc\": \"lastNotNull\",\n \"colSpan\": 1,\n \"colorMode\": \"value\",\n \"textMode\": \"valueAndName\",\n \"textSize\": {}\n },\n \"datasourceCate\": \"prometheus\",\n \"datasourceValue\": \"${datasource}\",\n \"id\": \"0a918de7-32e1-4a68-b954-81b1307d3ef2\",\n \"layout\": {\n \"h\": 3,\n \"i\": \"9b509227-dbc4-41b1-8ba1-6c9b94405cf0\",\n \"isResizable\": true,\n \"w\": 4,\n \"x\": 12,\n \"y\": 14\n },\n \"name\": \"Available\",\n \"options\": {\n \"standardOptions\": {}\n },\n \"targets\": [\n {\n \"expr\": \"sum(kube_daemonset_status_number_available{cluster=~\\\"$cluster\\\"})\",\n \"refId\": \"A\"\n }\n ],\n \"type\": \"stat\",\n \"version\": \"2.0.0\"\n },\n {\n \"custom\": {\n \"calc\": \"lastNotNull\",\n \"colSpan\": 1,\n \"colorMode\": \"value\",\n \"textMode\": \"valueAndName\",\n \"textSize\": {}\n },\n \"datasourceCate\": \"prometheus\",\n \"datasourceValue\": \"${datasource}\",\n \"id\": \"9fee3cc3-cdd2-4597-8aab-a32f5b99b7fe\",\n \"layout\": {\n \"h\": 3,\n \"i\": \"79b65e9e-f4f7-4e2b-8fa9-977b093eac11\",\n \"isResizable\": true,\n \"w\": 4,\n \"x\": 16,\n \"y\": 14\n },\n \"name\": \"Unavailable\",\n \"options\": {\n \"standardOptions\": {},\n \"valueMappings\": [\n {\n \"match\": {\n \"from\": null,\n \"to\": 1\n },\n \"result\": {\n \"color\": \"#417505\"\n },\n \"type\": \"range\"\n },\n {\n \"match\": {\n \"from\": 1\n },\n \"result\": {\n \"color\": \"#d0021b\"\n },\n \"type\": \"range\"\n }\n ]\n },\n \"targets\": [\n {\n \"expr\": \"sum(kube_daemonset_status_number_unavailable{cluster=~\\\"$cluster\\\"})\",\n \"refId\": \"A\"\n }\n ],\n \"type\": \"stat\",\n \"version\": \"2.0.0\"\n },\n {\n \"custom\": {\n \"calc\": \"lastNotNull\",\n \"colSpan\": 1,\n \"colorMode\": \"value\",\n \"textMode\": \"valueAndName\",\n \"textSize\": {}\n },\n \"datasourceCate\": \"prometheus\",\n \"datasourceValue\": \"${datasource}\",\n \"id\": \"e8dab8ca-d0ba-456d-a358-f32b39d564eb\",\n \"layout\": {\n \"h\": 3,\n \"i\": \"eb2a28b2-fb09-4273-8cc6-76a19f96ab06\",\n \"isResizable\": true,\n \"w\": 4,\n \"x\": 20,\n \"y\": 14\n },\n \"name\": \"Misscheduled\",\n \"options\": {\n \"standardOptions\": {},\n \"valueMappings\": [\n {\n \"match\": {\n \"from\": null,\n \"to\": 1\n },\n \"result\": {\n \"color\": \"#417505\"\n },\n \"type\": \"range\"\n },\n {\n \"match\": {\n \"from\": 1\n },\n \"result\": {\n \"color\": \"#d0021b\"\n },\n \"type\": \"range\"\n }\n ]\n },\n \"targets\": [\n {\n \"expr\": \"sum(kube_daemonset_status_number_misscheduled{cluster=~\\\"$cluster\\\"})\",\n \"refId\": \"A\"\n }\n ],\n \"type\": \"stat\",\n \"version\": \"2.0.0\"\n },\n {\n \"collapsed\": false,\n \"id\": \"ec1c6595-4fab-4d00-aab6-2e7e34d5d208\",\n \"layout\": {\n \"h\": 1,\n \"i\": \"ec1c6595-4fab-4d00-aab6-2e7e34d5d208\",\n \"isResizable\": false,\n \"w\": 24,\n \"x\": 0,\n \"y\": 20\n },\n \"name\": \"Deployment\",\n \"panels\": [\n {\n \"custom\": {\n \"calc\": \"lastNotNull\",\n \"colSpan\": 1,\n \"colorMode\": \"background\",\n \"textMode\": \"valueAndName\",\n \"textSize\": {}\n },\n \"datasourceCate\": \"prometheus\",\n \"datasourceValue\": \"${datasource}\",\n \"id\": \"6712f9ba-c40c-4f11-8565-485d3321b434\",\n \"layout\": {\n \"h\": 3,\n \"i\": \"9e867792-c82e-4b06-8384-fb351b1da247\",\n \"isResizable\": true,\n \"w\": 6,\n \"x\": 0,\n \"y\": 12\n },\n \"name\": \"Replicas\",\n \"options\": {\n \"standardOptions\": {}\n },\n \"targets\": [\n {\n \"expr\": \"sum(kube_deployment_status_replicas{cluster=~\\\"$cluster\\\"})\",\n \"refId\": \"A\"\n }\n ],\n \"type\": \"stat\",\n \"version\": \"2.0.0\"\n },\n {\n \"custom\": {\n \"calc\": \"lastNotNull\",\n \"colSpan\": 1,\n \"colorMode\": \"value\",\n \"textMode\": \"valueAndName\",\n \"textSize\": {}\n },\n \"datasourceCate\": \"prometheus\",\n \"datasourceValue\": \"${datasource}\",\n \"id\": \"363ed020-5a36-4322-9f8a-1a4aa6507684\",\n \"layout\": {\n \"h\": 3,\n \"i\": \"75631d60-84c9-482f-a2e4-3aaaa5738512\",\n \"isResizable\": true,\n \"w\": 6,\n \"x\": 6,\n \"y\": 12\n },\n \"name\": \"Replicas Available\",\n \"options\": {\n \"standardOptions\": {}\n },\n \"targets\": [\n {\n \"expr\": \"sum(kube_deployment_status_replicas_available{cluster=~\\\"$cluster\\\"})\",\n \"refId\": \"A\"\n }\n ],\n \"type\": \"stat\",\n \"version\": \"2.0.0\"\n },\n {\n \"custom\": {\n \"calc\": \"lastNotNull\",\n \"colSpan\": 1,\n \"colorMode\": \"value\",\n \"textMode\": \"valueAndName\",\n \"textSize\": {}\n },\n \"datasourceCate\": \"prometheus\",\n \"datasourceValue\": \"${datasource}\",\n \"id\": \"e859dd8b-8b78-4950-b406-b2b8aed3a095\",\n \"layout\": {\n \"h\": 3,\n \"i\": \"c916543c-d212-4dbc-8d53-9d46a914fdbe\",\n \"isResizable\": true,\n \"w\": 6,\n \"x\": 12,\n \"y\": 12\n },\n \"name\": \"Replicas Ready\",\n \"options\": {\n \"standardOptions\": {}\n },\n \"targets\": [\n {\n \"expr\": \"sum(kube_deployment_status_replicas_ready{cluster=~\\\"$cluster\\\"})\",\n \"refId\": \"A\"\n }\n ],\n \"type\": \"stat\",\n \"version\": \"2.0.0\"\n },\n {\n \"custom\": {\n \"calc\": \"lastNotNull\",\n \"colSpan\": 1,\n \"colorMode\": \"value\",\n \"textMode\": \"valueAndName\",\n \"textSize\": {}\n },\n \"datasourceCate\": \"prometheus\",\n \"datasourceValue\": \"${datasource}\",\n \"id\": \"abd803ab-e282-4211-adb8-036154e81b4b\",\n \"layout\": {\n \"h\": 3,\n \"i\": \"6d642aff-058a-45ed-93e2-409dcfaf32d4\",\n \"isResizable\": true,\n \"w\": 6,\n \"x\": 18,\n \"y\": 12\n },\n \"name\": \"Unavailable\",\n \"options\": {\n \"standardOptions\": {},\n \"valueMappings\": [\n {\n \"match\": {\n \"from\": null,\n \"to\": 1\n },\n \"result\": {\n \"color\": \"#417505\"\n },\n \"type\": \"range\"\n },\n {\n \"match\": {\n \"from\": 1\n },\n \"result\": {\n \"color\": \"#d0021b\"\n },\n \"type\": \"range\"\n }\n ]\n },\n \"targets\": [\n {\n \"expr\": \"sum(kube_deployment_status_replicas_unavailable{cluster=~\\\"$cluster\\\"})\",\n \"refId\": \"A\"\n }\n ],\n \"type\": \"stat\",\n \"version\": \"2.0.0\"\n }\n ],\n \"type\": \"row\"\n },\n {\n \"collapsed\": false,\n \"id\": \"b72d699a-d900-449c-ae7e-d52ba70128fe\",\n \"layout\": {\n \"h\": 1,\n \"i\": \"b72d699a-d900-449c-ae7e-d52ba70128fe\",\n \"isResizable\": false,\n \"w\": 24,\n \"x\": 0,\n \"y\": 24\n },\n \"name\": \"Statefulset\",\n \"panels\": [\n {\n \"custom\": {\n \"calc\": \"lastNotNull\",\n \"colSpan\": 1,\n \"colorMode\": \"background\",\n \"textMode\": \"valueAndName\",\n \"textSize\": {}\n },\n \"datasourceCate\": \"prometheus\",\n \"datasourceValue\": \"${datasource}\",\n \"id\": \"d77f502d-881f-4a45-bbea-dbf0acc18611\",\n \"layout\": {\n \"h\": 3,\n \"i\": \"5d69ceaa-8e93-4b1d-8a51-f7b5d295507b\",\n \"isResizable\": true,\n \"w\": 6,\n \"x\": 0,\n \"y\": 16\n },\n \"name\": \"Replicas\",\n \"options\": {\n \"standardOptions\": {}\n },\n \"targets\": [\n {\n \"expr\": \"sum(kube_statefulset_status_replicas{cluster=~\\\"$cluster\\\"})\",\n \"refId\": \"A\"\n }\n ],\n \"type\": \"stat\",\n \"version\": \"2.0.0\"\n },\n {\n \"custom\": {\n \"calc\": \"lastNotNull\",\n \"colSpan\": 1,\n \"colorMode\": \"value\",\n \"textMode\": \"valueAndName\",\n \"textSize\": {}\n },\n \"datasourceCate\": \"prometheus\",\n \"datasourceValue\": \"${datasource}\",\n \"id\": \"cdbcf704-c5c5-45ec-b392-0e53d9b177a1\",\n \"layout\": {\n \"h\": 3,\n \"i\": \"5c915ccd-0096-4812-a1d5-0772ecacf435\",\n \"isResizable\": true,\n \"w\": 6,\n \"x\": 6,\n \"y\": 16\n },\n \"name\": \"Replicas Available\",\n \"options\": {\n \"standardOptions\": {}\n },\n \"targets\": [\n {\n \"expr\": \"sum(kube_statefulset_status_replicas_available{cluster=~\\\"$cluster\\\"})\",\n \"refId\": \"A\"\n }\n ],\n \"type\": \"stat\",\n \"version\": \"2.0.0\"\n },\n {\n \"custom\": {\n \"calc\": \"lastNotNull\",\n \"colSpan\": 1,\n \"colorMode\": \"value\",\n \"textMode\": \"valueAndName\",\n \"textSize\": {}\n },\n \"datasourceCate\": \"prometheus\",\n \"datasourceValue\": \"${datasource}\",\n \"id\": \"db5d5574-9f9d-4856-b4d0-5f313e7466d9\",\n \"layout\": {\n \"h\": 3,\n \"i\": \"c01d88bb-9747-4f7f-ad38-5b055967732c\",\n \"isResizable\": true,\n \"w\": 6,\n \"x\": 12,\n \"y\": 16\n },\n \"name\": \"Replicas Current\",\n \"options\": {\n \"standardOptions\": {}\n },\n \"targets\": [\n {\n \"expr\": \"sum(kube_statefulset_status_replicas_current{cluster=~\\\"$cluster\\\"})\",\n \"refId\": \"A\"\n }\n ],\n \"type\": \"stat\",\n \"version\": \"2.0.0\"\n },\n {\n \"custom\": {\n \"calc\": \"lastNotNull\",\n \"colSpan\": 1,\n \"colorMode\": \"value\",\n \"textMode\": \"valueAndName\",\n \"textSize\": {}\n },\n \"datasourceCate\": \"prometheus\",\n \"datasourceValue\": \"${datasource}\",\n \"id\": \"0fbe57c3-58f5-4a8d-9d71-fc20b2ffe762\",\n \"layout\": {\n \"h\": 3,\n \"i\": \"cf027f9e-9257-4e5d-8548-f6c30698859f\",\n \"isResizable\": true,\n \"w\": 6,\n \"x\": 18,\n \"y\": 16\n },\n \"name\": \"Replicas Ready\",\n \"options\": {\n \"standardOptions\": {}\n },\n \"targets\": [\n {\n \"expr\": \"sum(kube_statefulset_status_replicas_ready{cluster=~\\\"$cluster\\\"})\",\n \"refId\": \"A\"\n }\n ],\n \"type\": \"stat\",\n \"version\": \"2.0.0\"\n }\n ],\n \"type\": \"row\"\n },\n {\n \"collapsed\": false,\n \"id\": \"3c515e1b-cc46-4bd3-84dc-a0ba893a6af6\",\n \"layout\": {\n \"h\": 1,\n \"i\": \"3c515e1b-cc46-4bd3-84dc-a0ba893a6af6\",\n \"isResizable\": false,\n \"w\": 24,\n \"x\": 0,\n \"y\": 28\n },\n \"name\": \"Pod\",\n \"panels\": [\n {\n \"custom\": {\n \"calc\": \"lastNotNull\",\n \"colSpan\": 1,\n \"colorMode\": \"background\",\n \"textMode\": \"valueAndName\",\n \"textSize\": {}\n },\n \"datasourceCate\": \"prometheus\",\n \"datasourceValue\": \"${datasource}\",\n \"id\": \"a3dd94c4-06e1-4425-ab32-d1a4eb173eba\",\n \"layout\": {\n \"h\": 3,\n \"i\": \"a4dfbc69-3688-4bc8-b1fb-7d5853bc4da4\",\n \"isResizable\": true,\n \"w\": 6,\n \"x\": 0,\n \"y\": 20\n },\n \"name\": \"Running Pods\",\n \"options\": {\n \"standardOptions\": {}\n },\n \"targets\": [\n {\n \"expr\": \"sum(kube_pod_status_phase{cluster=~\\\"$cluster\\\", phase=\\\"Running\\\"})\",\n \"refId\": \"A\"\n }\n ],\n \"type\": \"stat\",\n \"version\": \"2.0.0\"\n },\n {\n \"custom\": {\n \"calc\": \"lastNotNull\",\n \"colSpan\": 1,\n \"colorMode\": \"value\",\n \"textMode\": \"valueAndName\",\n \"textSize\": {}\n },\n \"datasourceCate\": \"prometheus\",\n \"datasourceValue\": \"${datasource}\",\n \"id\": \"b7379a63-cdb3-4fdb-9067-def62580822d\",\n \"layout\": {\n \"h\": 3,\n \"i\": \"34d7f46e-7efb-44d1-a0be-cfdb659b6784\",\n \"isResizable\": true,\n \"w\": 6,\n \"x\": 6,\n \"y\": 20\n },\n \"name\": \"Pending Pods\",\n \"options\": {\n \"standardOptions\": {}\n },\n \"targets\": [\n {\n \"expr\": \"sum(kube_pod_status_phase{cluster=~\\\"$cluster\\\", phase=\\\"Pending\\\"})\",\n \"refId\": \"A\"\n }\n ],\n \"type\": \"stat\",\n \"version\": \"2.0.0\"\n },\n {\n \"custom\": {\n \"calc\": \"lastNotNull\",\n \"colSpan\": 1,\n \"colorMode\": \"value\",\n \"textMode\": \"valueAndName\",\n \"textSize\": {}\n },\n \"datasourceCate\": \"prometheus\",\n \"datasourceValue\": \"${datasource}\",\n \"id\": \"fa974aab-dd2a-46ee-bb00-10461f396240\",\n \"layout\": {\n \"h\": 3,\n \"i\": \"fa974aab-dd2a-46ee-bb00-10461f396240\",\n \"isResizable\": true,\n \"w\": 6,\n \"x\": 12,\n \"y\": 20\n },\n \"name\": \"Failed | Unknown Pods\",\n \"options\": {\n \"standardOptions\": {},\n \"valueMappings\": [\n {\n \"match\": {\n \"from\": 1\n },\n \"result\": {\n \"color\": \"#eb0909\"\n },\n \"type\": \"range\"\n }\n ]\n },\n \"targets\": [\n {\n \"expr\": \"sum(kube_pod_status_phase{cluster=~\\\"$cluster\\\", phase=~\\\"Failed|Unknown\\\"})\",\n \"refId\": \"A\"\n }\n ],\n \"type\": \"stat\",\n \"version\": \"2.0.0\"\n },\n {\n \"custom\": {\n \"calc\": \"lastNotNull\",\n \"colSpan\": 1,\n \"colorMode\": \"value\",\n \"textMode\": \"valueAndName\",\n \"textSize\": {}\n },\n \"datasourceCate\": \"prometheus\",\n \"datasourceValue\": \"${datasource}\",\n \"id\": \"245eee0d-e0c1-4ff3-801d-3de31c74bdcb\",\n \"layout\": {\n \"h\": 3,\n \"i\": \"3a314f6b-7da2-40e1-8e6b-f32da4295f8e\",\n \"isResizable\": true,\n \"w\": 6,\n \"x\": 18,\n \"y\": 20\n },\n \"name\": \"Restarts in last 5min\",\n \"options\": {\n \"standardOptions\": {},\n \"valueMappings\": [\n {\n \"match\": {\n \"from\": 1\n },\n \"result\": {\n \"color\": \"#eb0909\"\n },\n \"type\": \"range\"\n }\n ]\n },\n \"targets\": [\n {\n \"expr\": \"sum(increase(kube_pod_container_status_restarts_total{cluster=~\\\"$cluster\\\"}[5m]))\",\n \"refId\": \"A\"\n }\n ],\n \"type\": \"stat\",\n \"version\": \"2.0.0\"\n }\n ],\n \"type\": \"row\"\n },\n {\n \"collapsed\": false,\n \"id\": \"3789e988-a132-48f6-9953-c2985769e23d\",\n \"layout\": {\n \"h\": 1,\n \"i\": \"3789e988-a132-48f6-9953-c2985769e23d\",\n \"isResizable\": false,\n \"w\": 24,\n \"x\": 0,\n \"y\": 32\n },\n \"name\": \"Job\",\n \"panels\": [\n {\n \"custom\": {\n \"calc\": \"lastNotNull\",\n \"colSpan\": 1,\n \"colorMode\": \"background\",\n \"textMode\": \"valueAndName\",\n \"textSize\": {}\n },\n \"datasourceCate\": \"prometheus\",\n \"datasourceValue\": \"${datasource}\",\n \"id\": \"9bb45396-e0bc-4823-a663-d6fbdeb545a1\",\n \"layout\": {\n \"h\": 3,\n \"i\": \"9bb45396-e0bc-4823-a663-d6fbdeb545a1\",\n \"isResizable\": true,\n \"w\": 6,\n \"x\": 0,\n \"y\": 24\n },\n \"name\": \"Complete\",\n \"options\": {\n \"standardOptions\": {}\n },\n \"targets\": [\n {\n \"expr\": \"sum(kube_job_complete{cluster=~\\\"$cluster\\\"})\",\n \"refId\": \"A\"\n }\n ],\n \"type\": \"stat\",\n \"version\": \"2.0.0\"\n },\n {\n \"custom\": {\n \"calc\": \"lastNotNull\",\n \"colSpan\": 1,\n \"colorMode\": \"value\",\n \"textMode\": \"valueAndName\",\n \"textSize\": {}\n },\n \"datasourceCate\": \"prometheus\",\n \"datasourceValue\": \"${datasource}\",\n \"id\": \"9660891f-767e-4e5c-bddc-638c13be6e54\",\n \"layout\": {\n \"h\": 3,\n \"i\": \"b126a364-4822-4de4-a676-56e6e7e95e87\",\n \"isResizable\": true,\n \"w\": 6,\n \"x\": 6,\n \"y\": 24\n },\n \"name\": \"Active\",\n \"options\": {\n \"standardOptions\": {}\n },\n \"targets\": [\n {\n \"expr\": \"sum(kube_job_status_active{cluster=~\\\"$cluster\\\"})\",\n \"refId\": \"A\"\n }\n ],\n \"type\": \"stat\",\n \"version\": \"2.0.0\"\n },\n {\n \"custom\": {\n \"calc\": \"lastNotNull\",\n \"colSpan\": 1,\n \"colorMode\": \"value\",\n \"textMode\": \"valueAndName\",\n \"textSize\": {}\n },\n \"datasourceCate\": \"prometheus\",\n \"datasourceValue\": \"${datasource}\",\n \"id\": \"c41b07f9-b513-4bd4-b0dc-43dbc4bbce6d\",\n \"layout\": {\n \"h\": 3,\n \"i\": \"b8afaed1-7ffc-42bb-85c2-b4aa5fa2c116\",\n \"isResizable\": true,\n \"w\": 6,\n \"x\": 12,\n \"y\": 24\n },\n \"name\": \"Succeeded\",\n \"options\": {\n \"standardOptions\": {}\n },\n \"targets\": [\n {\n \"expr\": \"sum(kube_job_status_succeeded{cluster=~\\\"$cluster\\\"})\",\n \"refId\": \"A\"\n }\n ],\n \"type\": \"stat\",\n \"version\": \"2.0.0\"\n },\n {\n \"custom\": {\n \"calc\": \"lastNotNull\",\n \"colSpan\": 1,\n \"colorMode\": \"value\",\n \"textMode\": \"valueAndName\",\n \"textSize\": {}\n },\n \"datasourceCate\": \"prometheus\",\n \"datasourceValue\": \"${datasource}\",\n \"id\": \"b65a3ee3-7e07-4347-b04f-0f77c67877e6\",\n \"layout\": {\n \"h\": 3,\n \"i\": \"52c5a536-bc77-41e0-99ec-81e769065feb\",\n \"isResizable\": true,\n \"w\": 6,\n \"x\": 18,\n \"y\": 24\n },\n \"name\": \"Failed\",\n \"options\": {\n \"standardOptions\": {}\n },\n \"targets\": [\n {\n \"expr\": \"sum(kube_job_status_failed{cluster=~\\\"$cluster\\\"})\",\n \"refId\": \"A\"\n }\n ],\n \"type\": \"stat\",\n \"version\": \"2.0.0\"\n }\n ],\n \"type\": \"row\"\n }\n ],\n \"var\": [\n {\n \"definition\": \"prometheus\",\n \"name\": \"datasource\",\n \"type\": \"datasource\"\n },\n {\n \"allOption\": true,\n \"datasource\": {\n \"cate\": \"prometheus\",\n \"value\": \"${datasource}\"\n },\n \"definition\": \"label_values(kube_node_info, cluster)\",\n \"multi\": true,\n \"name\": \"cluster\",\n \"type\": \"query\"\n }\n ],\n \"version\": \"3.0.0\"\n },\n \"public\": 0,\n \"public_cate\": 0,\n \"bgids\": null,\n \"built_in\": 0,\n \"hide\": 0,\n \"uuid\": 1717556327688278000\n}"
},
{
"path": "integrations/Kubernetes/dashboards/KubeletMetrics.json",
"content": "{\n \"id\": 0,\n \"group_id\": 0,\n \"name\": \"Kubernetes / Kubelet Metrics\",\n \"ident\": \"\",\n \"tags\": \"Categraf\",\n \"create_at\": 0,\n \"create_by\": \"\",\n \"update_at\": 0,\n \"update_by\": \"\",\n \"configs\": {\n \"panels\": [\n {\n \"custom\": {\n \"calc\": \"lastNotNull\",\n \"colSpan\": 1,\n \"colorMode\": \"background\",\n \"textMode\": \"value\",\n \"textSize\": {}\n },\n \"datasourceCate\": \"prometheus\",\n \"datasourceValue\": \"${datasource}\",\n \"id\": \"d3caf396-b3a1-449b-acec-f550967889e6\",\n \"layout\": {\n \"h\": 3,\n \"i\": \"d3caf396-b3a1-449b-acec-f550967889e6\",\n \"isResizable\": true,\n \"w\": 4,\n \"x\": 0,\n \"y\": 0\n },\n \"name\": \"Kubelet UP\",\n \"options\": {\n \"standardOptions\": {}\n },\n \"targets\": [\n {\n \"expr\": \"sum(up{source=\\\"kubelet\\\", cluster=~\\\"$cluster\\\"})\",\n \"refId\": \"A\"\n }\n ],\n \"type\": \"stat\",\n \"version\": \"2.0.0\"\n },\n {\n \"custom\": {\n \"calc\": \"lastNotNull\",\n \"colSpan\": 1,\n \"colorMode\": \"value\",\n \"textMode\": \"valueAndName\",\n \"textSize\": {}\n },\n \"datasourceCate\": \"prometheus\",\n \"datasourceValue\": \"${datasource}\",\n \"id\": \"38c38b23-a7e3-4177-8c41-3ce955ea0434\",\n \"layout\": {\n \"h\": 3,\n \"i\": \"38c38b23-a7e3-4177-8c41-3ce955ea0434\",\n \"isResizable\": true,\n \"w\": 4,\n \"x\": 4,\n \"y\": 0\n },\n \"name\": \"Running Pods\",\n \"options\": {\n \"standardOptions\": {}\n },\n \"targets\": [\n {\n \"expr\": \"sum(kubelet_running_pods{cluster=~\\\"$cluster\\\", instance=~\\\"$instance\\\"})\",\n \"refId\": \"A\"\n }\n ],\n \"type\": \"stat\",\n \"version\": \"2.0.0\"\n },\n {\n \"custom\": {\n \"calc\": \"lastNotNull\",\n \"colSpan\": 1,\n \"colorMode\": \"value\",\n \"textMode\": \"valueAndName\",\n \"textSize\": {}\n },\n \"datasourceCate\": \"prometheus\",\n \"datasourceValue\": \"${datasource}\",\n \"id\": \"525859b9-91d7-4180-b363-bf8ceec977d8\",\n \"layout\": {\n \"h\": 3,\n \"i\": \"26bf2320-fcff-48f8-a6fc-aa9076bb9329\",\n \"isResizable\": true,\n \"w\": 4,\n \"x\": 8,\n \"y\": 0\n },\n \"name\": \"Running Containers\",\n \"options\": {\n \"standardOptions\": {}\n },\n \"targets\": [\n {\n \"expr\": \"sum(kubelet_running_containers{cluster=~\\\"$cluster\\\", instance=~\\\"$instance\\\", container_state=\\\"running\\\"})\",\n \"refId\": \"A\"\n }\n ],\n \"type\": \"stat\",\n \"version\": \"2.0.0\"\n },\n {\n \"custom\": {\n \"calc\": \"lastNotNull\",\n \"colSpan\": 1,\n \"colorMode\": \"value\",\n \"textMode\": \"valueAndName\",\n \"textSize\": {}\n },\n \"datasourceCate\": \"prometheus\",\n \"datasourceValue\": \"${datasource}\",\n \"id\": \"84af4617-2ae0-4b30-a82a-6e8586342224\",\n \"layout\": {\n \"h\": 3,\n \"i\": \"54ae4ab3-e932-418c-a637-f2f515cce1b9\",\n \"isResizable\": true,\n \"w\": 4,\n \"x\": 12,\n \"y\": 0\n },\n \"name\": \"Desired Volumes\",\n \"options\": {\n \"standardOptions\": {}\n },\n \"targets\": [\n {\n \"expr\": \"sum(volume_manager_total_volumes{cluster=~\\\"$cluster\\\", instance=~\\\"$instance\\\", state=\\\"desired_state_of_world\\\"})\",\n \"refId\": \"A\"\n }\n ],\n \"type\": \"stat\",\n \"version\": \"2.0.0\"\n },\n {\n \"custom\": {\n \"calc\": \"lastNotNull\",\n \"colSpan\": 1,\n \"colorMode\": \"value\",\n \"textMode\": \"valueAndName\",\n \"textSize\": {}\n },\n \"datasourceCate\": \"prometheus\",\n \"datasourceValue\": \"${datasource}\",\n \"id\": \"d431f4bd-9115-41d2-a494-1d680bdd1e0f\",\n \"layout\": {\n \"h\": 3,\n \"i\": \"d9de76d7-2203-40e7-a792-9888ec869e82\",\n \"isResizable\": true,\n \"w\": 4,\n \"x\": 16,\n \"y\": 0\n },\n \"name\": \"Actual Volumes\",\n \"options\": {\n \"standardOptions\": {}\n },\n \"targets\": [\n {\n \"expr\": \"sum(volume_manager_total_volumes{cluster=~\\\"$cluster\\\", instance=~\\\"$instance\\\", state=\\\"actual_state_of_world\\\"})\",\n \"refId\": \"A\"\n }\n ],\n \"type\": \"stat\",\n \"version\": \"2.0.0\"\n },\n {\n \"custom\": {\n \"calc\": \"lastNotNull\",\n \"colSpan\": 1,\n \"colorMode\": \"value\",\n \"textMode\": \"value\",\n \"textSize\": {}\n },\n \"datasourceCate\": \"prometheus\",\n \"datasourceValue\": \"${datasource}\",\n \"id\": \"54de62bc-8af3-4c27-8b8e-1af567b363fc\",\n \"layout\": {\n \"h\": 3,\n \"i\": \"bf2bbd15-347d-404c-9b8f-e524875befe2\",\n \"isResizable\": true,\n \"w\": 4,\n \"x\": 20,\n \"y\": 0\n },\n \"name\": \"OP Errors in 5min\",\n \"options\": {\n \"standardOptions\": {},\n \"valueMappings\": [\n {\n \"match\": {\n \"from\": 1\n },\n \"result\": {\n \"color\": \"#d0021b\"\n },\n \"type\": \"range\"\n },\n {\n \"match\": {\n \"to\": 1\n },\n \"result\": {\n \"color\": \"#417505\"\n },\n \"type\": \"range\"\n }\n ]\n },\n \"targets\": [\n {\n \"expr\": \"sum(increase(kubelet_runtime_operations_errors_total{cluster=~\\\"$cluster\\\", instance=~\\\"$instance\\\"}[5m]))\",\n \"refId\": \"A\"\n }\n ],\n \"type\": \"stat\",\n \"version\": \"2.0.0\"\n },\n {\n \"collapsed\": true,\n \"id\": \"730d4a9b-791f-4aaf-a042-668f66e73814\",\n \"layout\": {\n \"h\": 1,\n \"i\": \"730d4a9b-791f-4aaf-a042-668f66e73814\",\n \"isResizable\": false,\n \"w\": 24,\n \"x\": 0,\n \"y\": 3\n },\n \"name\": \"Operations\",\n \"panels\": [],\n \"type\": \"row\"\n },\n {\n \"custom\": {\n \"drawStyle\": \"lines\",\n \"fillOpacity\": 0.3,\n \"gradientMode\": \"opacity\",\n \"lineInterpolation\": \"smooth\",\n \"lineWidth\": 2,\n \"stack\": \"off\"\n },\n \"datasourceCate\": \"prometheus\",\n \"datasourceValue\": \"${datasource}\",\n \"id\": \"d26e6818-6704-492a-8cbf-58473dd85716\",\n \"layout\": {\n \"h\": 4,\n \"i\": \"d26e6818-6704-492a-8cbf-58473dd85716\",\n \"isResizable\": true,\n \"w\": 12,\n \"x\": 0,\n \"y\": 4\n },\n \"name\": \"Operations in 5min\",\n \"options\": {\n \"legend\": {\n \"displayMode\": \"hidden\"\n },\n \"standardOptions\": {},\n \"thresholds\": {},\n \"tooltip\": {\n \"mode\": \"all\",\n \"sort\": \"none\"\n }\n },\n \"targets\": [\n {\n \"expr\": \"increase(kubelet_runtime_operations_total{cluster=~\\\"$cluster\\\", instance=~\\\"$instance\\\"}[5m])\",\n \"refId\": \"A\"\n }\n ],\n \"type\": \"timeseries\",\n \"version\": \"2.0.0\"\n },\n {\n \"custom\": {\n \"drawStyle\": \"lines\",\n \"fillOpacity\": 0.3,\n \"gradientMode\": \"opacity\",\n \"lineInterpolation\": \"smooth\",\n \"lineWidth\": 2,\n \"stack\": \"off\"\n },\n \"datasourceCate\": \"prometheus\",\n \"datasourceValue\": \"${datasource}\",\n \"id\": \"09a6ad5b-8c0e-4f17-b17f-3ebc514f7d20\",\n \"layout\": {\n \"h\": 4,\n \"i\": \"4e585d2f-c61c-4350-86ec-dca7ddc34ceb\",\n \"isResizable\": true,\n \"w\": 12,\n \"x\": 12,\n \"y\": 4\n },\n \"name\": \"Operation Errors in 5min\",\n \"options\": {\n \"legend\": {\n \"displayMode\": \"hidden\"\n },\n \"standardOptions\": {},\n \"thresholds\": {},\n \"tooltip\": {\n \"mode\": \"all\",\n \"sort\": \"none\"\n }\n },\n \"targets\": [\n {\n \"expr\": \"increase(kubelet_runtime_operations_errors_total{cluster=~\\\"$cluster\\\", instance=~\\\"$instance\\\"}[5m])\",\n \"refId\": \"A\"\n }\n ],\n \"type\": \"timeseries\",\n \"version\": \"2.0.0\"\n },\n {\n \"custom\": {\n \"drawStyle\": \"lines\",\n \"fillOpacity\": 0.3,\n \"gradientMode\": \"opacity\",\n \"lineInterpolation\": \"smooth\",\n \"lineWidth\": 2,\n \"stack\": \"off\"\n },\n \"datasourceCate\": \"prometheus\",\n \"datasourceValue\": \"${datasource}\",\n \"id\": \"b5e56f3e-fa20-4c19-8578-c0610fa0a7e7\",\n \"layout\": {\n \"h\": 4,\n \"i\": \"b5e56f3e-fa20-4c19-8578-c0610fa0a7e7\",\n \"isResizable\": true,\n \"w\": 24,\n \"x\": 0,\n \"y\": 8\n },\n \"name\": \"Average Operation duration in 1 hour (Unit: Second)\",\n \"options\": {\n \"legend\": {\n \"displayMode\": \"hidden\"\n },\n \"standardOptions\": {},\n \"thresholds\": {},\n \"tooltip\": {\n \"mode\": \"all\",\n \"sort\": \"none\"\n }\n },\n \"targets\": [\n {\n \"expr\": \"increase(kubelet_runtime_operations_duration_seconds_sum{cluster=~\\\"$cluster\\\", instance=~\\\"$instance\\\"}[1h])/increase(kubelet_runtime_operations_duration_seconds_count{cluster=~\\\"$cluster\\\", instance=~\\\"$instance\\\"}[1h])\",\n \"refId\": \"A\"\n }\n ],\n \"type\": \"timeseries\",\n \"version\": \"2.0.0\"\n },\n {\n \"collapsed\": true,\n \"id\": \"dd7e84c5-03ce-467c-871a-aa110fe051f4\",\n \"layout\": {\n \"h\": 1,\n \"i\": \"dd7e84c5-03ce-467c-871a-aa110fe051f4\",\n \"isResizable\": false,\n \"w\": 24,\n \"x\": 0,\n \"y\": 12\n },\n \"name\": \"PLEG relist\",\n \"type\": \"row\"\n },\n {\n \"custom\": {\n \"drawStyle\": \"lines\",\n \"fillOpacity\": 0.3,\n \"gradientMode\": \"opacity\",\n \"lineInterpolation\": \"smooth\",\n \"lineWidth\": 2,\n \"stack\": \"off\"\n },\n \"datasourceCate\": \"prometheus\",\n \"datasourceValue\": \"${datasource}\",\n \"id\": \"f3822da8-a9c9-4db1-ba12-465d3ece823e\",\n \"layout\": {\n \"h\": 4,\n \"i\": \"f3822da8-a9c9-4db1-ba12-465d3ece823e\",\n \"isResizable\": true,\n \"w\": 12,\n \"x\": 0,\n \"y\": 13\n },\n \"name\": \"relist rate\",\n \"options\": {\n \"legend\": {\n \"displayMode\": \"hidden\"\n },\n \"standardOptions\": {},\n \"thresholds\": {},\n \"tooltip\": {\n \"mode\": \"all\",\n \"sort\": \"none\"\n }\n },\n \"targets\": [\n {\n \"expr\": \"rate(kubelet_pleg_relist_duration_seconds_count{cluster=~\\\"$cluster\\\", instance=~\\\"$instance\\\"}[1h])\",\n \"refId\": \"A\"\n }\n ],\n \"type\": \"timeseries\",\n \"version\": \"2.0.0\"\n },\n {\n \"custom\": {\n \"drawStyle\": \"lines\",\n \"fillOpacity\": 0.3,\n \"gradientMode\": \"opacity\",\n \"lineInterpolation\": \"smooth\",\n \"lineWidth\": 2,\n \"stack\": \"off\"\n },\n \"datasourceCate\": \"prometheus\",\n \"datasourceValue\": \"${datasource}\",\n \"id\": \"a6e4c914-bfca-4419-a264-f5b1cbab261a\",\n \"layout\": {\n \"h\": 4,\n \"i\": \"2b4ada76-6c30-42cd-9bd3-c939b4c0139c\",\n \"isResizable\": true,\n \"w\": 12,\n \"x\": 12,\n \"y\": 13\n },\n \"name\": \"relist duration (Unit: Second)\",\n \"options\": {\n \"legend\": {\n \"displayMode\": \"hidden\"\n },\n \"standardOptions\": {},\n \"thresholds\": {},\n \"tooltip\": {\n \"mode\": \"all\",\n \"sort\": \"none\"\n }\n },\n \"targets\": [\n {\n \"expr\": \"increase(kubelet_pleg_relist_duration_seconds_sum{cluster=~\\\"$cluster\\\", instance=~\\\"$instance\\\"}[1h])/increase(kubelet_pleg_relist_duration_seconds_count{cluster=~\\\"$cluster\\\", instance=~\\\"$instance\\\"}[1h])\",\n \"refId\": \"A\"\n }\n ],\n \"type\": \"timeseries\",\n \"version\": \"2.0.0\"\n }\n ],\n \"var\": [\n {\n \"definition\": \"prometheus\",\n \"name\": \"datasource\",\n \"type\": \"datasource\"\n },\n {\n \"allOption\": true,\n \"datasource\": {\n \"cate\": \"prometheus\",\n \"value\": \"${datasource}\"\n },\n \"definition\": \"label_values(kubelet_running_pods, cluster)\",\n \"multi\": true,\n \"name\": \"cluster\",\n \"type\": \"query\"\n },\n {\n \"allOption\": true,\n \"datasource\": {\n \"cate\": \"prometheus\",\n \"value\": \"${datasource}\"\n },\n \"definition\": \"label_values(kubelet_running_pods{cluster=~\\\"$cluster\\\"}, instance)\",\n \"multi\": true,\n \"name\": \"instance\",\n \"type\": \"query\"\n }\n ],\n \"version\": \"3.0.0\"\n },\n \"public\": 0,\n \"public_cate\": 0,\n \"bgids\": null,\n \"built_in\": 0,\n \"hide\": 0,\n \"uuid\": 1717556327690164000\n}"
},
{
"path": "integrations/Kubernetes/dashboards/Pod.json",
"content": "{\n \"id\": 0,\n \"group_id\": 0,\n \"name\": \"Kubernetes / Pod\",\n \"ident\": \"\",\n \"tags\": \"Categraf\",\n \"create_at\": 0,\n \"create_by\": \"\",\n \"update_at\": 0,\n \"update_by\": \"\",\n \"configs\": {\n \"panels\": [\n {\n \"collapsed\": true,\n \"id\": \"79d7e3b0-b64f-4591-b5dd-994ce16b68ca\",\n \"layout\": {\n \"h\": 1,\n \"i\": \"79d7e3b0-b64f-4591-b5dd-994ce16b68ca\",\n \"isResizable\": false,\n \"w\": 24,\n \"x\": 0,\n \"y\": 0\n },\n \"name\": \"整体概况\",\n \"type\": \"row\"\n },\n {\n \"custom\": {\n \"drawStyle\": \"lines\",\n \"fillOpacity\": 0.3,\n \"gradientMode\": \"opacity\",\n \"lineInterpolation\": \"smooth\",\n \"lineWidth\": 2,\n \"stack\": \"off\"\n },\n \"datasourceCate\": \"prometheus\",\n \"datasourceValue\": \"${datasource}\",\n \"description\": \"容器1min CPU平均使用率,如果pod内有多个容器,会分别显示各个容器CPU使用率(pause容器默认不会显示);如果容器配置了4核,使用率400%表示当前用满4核,容器配置2核,使用率200%表示当前用满2核。\",\n \"id\": \"860c1484-1f83-497e-a061-a50fbb3ff1dc\",\n \"layout\": {\n \"h\": 7,\n \"i\": \"860c1484-1f83-497e-a061-a50fbb3ff1dc\",\n \"isResizable\": true,\n \"w\": 6,\n \"x\": 0,\n \"y\": 1\n },\n \"name\": \"容器CPU使用率\",\n \"options\": {\n \"legend\": {\n \"displayMode\": \"hidden\"\n },\n \"standardOptions\": {\n \"max\": null,\n \"min\": 0,\n \"util\": \"percent\"\n },\n \"thresholds\": {},\n \"tooltip\": {\n \"mode\": \"all\",\n \"sort\": \"none\"\n }\n },\n \"targets\": [\n {\n \"expr\": \"sum(rate(container_cpu_usage_seconds_total{pod=\\\"$pod_name\\\", image!~\\\".*pause.*\\\"}[1m])*100) by(name)\",\n \"legend\": \"\",\n \"refId\": \"A\"\n }\n ],\n \"type\": \"timeseries\",\n \"version\": \"2.0.0\"\n },\n {\n \"custom\": {\n \"drawStyle\": \"lines\",\n \"fillOpacity\": 0.3,\n \"gradientMode\": \"opacity\",\n \"lineInterpolation\": \"smooth\",\n \"lineWidth\": 2,\n \"stack\": \"off\"\n },\n \"datasourceCate\": \"prometheus\",\n \"datasourceValue\": \"${datasource}\",\n \"description\": \"容器1min CPU平均使用率,如果pod内有多个容器,会分别显示各个容器CPU使用率(pause容器默认不会显示);如果容器配置了4核,使用率100%表示当前用满4核,容器配置2核,使用率100%表示当前用满2核,如果容器没有配置cpu limit,则不会显示该数值\",\n \"id\": \"bb66b2cc-3658-4cae-817a-61ec3fbb93e4\",\n \"layout\": {\n \"h\": 7,\n \"i\": \"bb66b2cc-3658-4cae-817a-61ec3fbb93e4\",\n \"isResizable\": true,\n \"w\": 6,\n \"x\": 6,\n \"y\": 1\n },\n \"name\": \"容器CPU归一化后使用率\",\n \"options\": {\n \"legend\": {\n \"displayMode\": \"hidden\"\n },\n \"standardOptions\": {\n \"max\": null,\n \"min\": 0,\n \"util\": \"percent\"\n },\n \"thresholds\": {},\n \"tooltip\": {\n \"mode\": \"all\",\n \"sort\": \"none\"\n }\n },\n \"targets\": [\n {\n \"expr\": \"sum(rate(container_cpu_usage_seconds_total{pod=\\\"$pod_name\\\", image!~\\\".*pause.*\\\"}[1m])*100) by(name)/((sum(container_spec_cpu_quota{pod=\\\"$pod_name\\\"}/container_spec_cpu_period{pod=\\\"$pod_name\\\"}) by (name)))\",\n \"legend\": \"\",\n \"refId\": \"A\"\n }\n ],\n \"type\": \"timeseries\",\n \"version\": \"2.0.0\"\n },\n {\n \"custom\": {\n \"drawStyle\": \"lines\",\n \"fillOpacity\": 0.3,\n \"gradientMode\": \"opacity\",\n \"lineInterpolation\": \"smooth\",\n \"lineWidth\": 2,\n \"stack\": \"off\"\n },\n \"datasourceCate\": \"prometheus\",\n \"datasourceValue\": \"${datasource}\",\n \"description\": \"container_memory_rss + container_memory_cache + container_memory_swap + kernel memory\",\n \"id\": \"4d5f9cbb-3b78-4fe6-8a4e-59ca52a49666\",\n \"layout\": {\n \"h\": 7,\n \"i\": \"4d5f9cbb-3b78-4fe6-8a4e-59ca52a49666\",\n \"isResizable\": true,\n \"w\": 6,\n \"x\": 12,\n \"y\": 1\n },\n \"name\": \"容器内存使用\",\n \"options\": {\n \"legend\": {\n \"displayMode\": \"hidden\"\n },\n \"standardOptions\": {\n \"max\": null,\n \"util\": \"bytesIEC\"\n },\n \"thresholds\": {},\n \"tooltip\": {\n \"mode\": \"all\",\n \"sort\": \"none\"\n }\n },\n \"targets\": [\n {\n \"expr\": \"(sum(container_memory_usage_bytes{pod=\\\"$pod_name\\\", image!~\\\".*pause.*\\\"}) by (name)) \",\n \"refId\": \"A\"\n }\n ],\n \"type\": \"timeseries\",\n \"version\": \"2.0.0\"\n },\n {\n \"custom\": {\n \"drawStyle\": \"lines\",\n \"fillOpacity\": 0.3,\n \"gradientMode\": \"opacity\",\n \"lineInterpolation\": \"smooth\",\n \"lineWidth\": 2,\n \"stack\": \"off\"\n },\n \"datasourceCate\": \"prometheus\",\n \"datasourceValue\": \"${datasource}\",\n \"description\": \"\",\n \"id\": \"978e93a0-770e-42f5-a374-cafb5b4fc585\",\n \"layout\": {\n \"h\": 7,\n \"i\": \"978e93a0-770e-42f5-a374-cafb5b4fc585\",\n \"isResizable\": true,\n \"w\": 6,\n \"x\": 18,\n \"y\": 1\n },\n \"name\": \"文件系统写入速率\",\n \"options\": {\n \"legend\": {\n \"displayMode\": \"hidden\"\n },\n \"standardOptions\": {\n \"max\": null,\n \"min\": 0,\n \"util\": \"bytesIEC\"\n },\n \"thresholds\": {},\n \"tooltip\": {\n \"mode\": \"all\",\n \"sort\": \"none\"\n }\n },\n \"targets\": [\n {\n \"expr\": \"sum(rate(container_fs_writes_bytes_total{pod=\\\"$pod_name\\\", image!~\\\".*pause.*\\\"}[1m])) by(name)\",\n \"legend\": \"\",\n \"refId\": \"A\"\n }\n ],\n \"type\": \"timeseries\",\n \"version\": \"2.0.0\"\n },\n {\n \"custom\": {\n \"drawStyle\": \"lines\",\n \"fillOpacity\": 0.3,\n \"gradientMode\": \"opacity\",\n \"lineInterpolation\": \"smooth\",\n \"lineWidth\": 2,\n \"stack\": \"off\"\n },\n \"datasourceCate\": \"prometheus\",\n \"datasourceValue\": \"${datasource}\",\n \"description\": \"\",\n \"id\": \"f385736d-fd05-4705-a27d-41e67fb6c843\",\n \"layout\": {\n \"h\": 7,\n \"i\": \"f385736d-fd05-4705-a27d-41e67fb6c843\",\n \"isResizable\": true,\n \"w\": 6,\n \"x\": 0,\n \"y\": 8\n },\n \"name\": \"文件系统读取速率\",\n \"options\": {\n \"legend\": {\n \"displayMode\": \"hidden\"\n },\n \"standardOptions\": {\n \"max\": null,\n \"min\": 0,\n \"util\": \"bytesIEC\"\n },\n \"thresholds\": {},\n \"tooltip\": {\n \"mode\": \"all\",\n \"sort\": \"none\"\n }\n },\n \"targets\": [\n {\n \"expr\": \"sum(rate(container_fs_reads_bytes_total{pod=\\\"$pod_name\\\", image!~\\\".*pause.*\\\"}[1m])) by(name)\",\n \"legend\": \"\",\n \"refId\": \"A\"\n }\n ],\n \"type\": \"timeseries\",\n \"version\": \"2.0.0\"\n },\n {\n \"custom\": {\n \"drawStyle\": \"lines\",\n \"fillOpacity\": 0.3,\n \"gradientMode\": \"opacity\",\n \"lineInterpolation\": \"smooth\",\n \"lineWidth\": 2,\n \"stack\": \"off\"\n },\n \"datasourceCate\": \"prometheus\",\n \"datasourceValue\": \"${datasource}\",\n \"description\": \"容器网络发送的字节数(1 分钟内)\",\n \"id\": \"f9b140e8-0b44-4b32-9d54-9360b06faa48\",\n \"layout\": {\n \"h\": 7,\n \"i\": \"f9b140e8-0b44-4b32-9d54-9360b06faa48\",\n \"isResizable\": true,\n \"w\": 6,\n \"x\": 6,\n \"y\": 8\n },\n \"name\": \"网络发送速率\",\n \"options\": {\n \"legend\": {\n \"displayMode\": \"hidden\"\n },\n \"standardOptions\": {\n \"util\": \"bytesIEC\"\n },\n \"thresholds\": {},\n \"tooltip\": {\n \"mode\": \"all\",\n \"sort\": \"none\"\n }\n },\n \"targets\": [\n {\n \"expr\": \"sum(rate(container_network_transmit_bytes_total{pod=\\\"$pod_name\\\"}[1m])) by(name, interface)\",\n \"refId\": \"A\"\n }\n ],\n \"type\": \"timeseries\",\n \"version\": \"2.0.0\"\n },\n {\n \"custom\": {\n \"drawStyle\": \"lines\",\n \"fillOpacity\": 0.3,\n \"gradientMode\": \"opacity\",\n \"lineInterpolation\": \"smooth\",\n \"lineWidth\": 2,\n \"stack\": \"off\"\n },\n \"datasourceCate\": \"prometheus\",\n \"datasourceValue\": \"${datasource}\",\n \"description\": \"容器网络接收的字节数(1 分钟内)\",\n \"id\": \"8f98a264-7058-4fa0-8efc-3c87954a0370\",\n \"layout\": {\n \"h\": 7,\n \"i\": \"8f98a264-7058-4fa0-8efc-3c87954a0370\",\n \"isResizable\": true,\n \"w\": 6,\n \"x\": 12,\n \"y\": 8\n },\n \"name\": \"网络接收速率\",\n \"options\": {\n \"legend\": {\n \"displayMode\": \"hidden\"\n },\n \"standardOptions\": {\n \"util\": \"bytesIEC\"\n },\n \"thresholds\": {},\n \"tooltip\": {\n \"mode\": \"all\",\n \"sort\": \"none\"\n }\n },\n \"targets\": [\n {\n \"expr\": \"sum(rate(container_network_receive_bytes_total{pod=\\\"$pod_name\\\"}[1m])) by(name, interface)\",\n \"refId\": \"A\"\n }\n ],\n \"type\": \"timeseries\",\n \"version\": \"2.0.0\"\n },\n {\n \"custom\": {\n \"calc\": \"lastNotNull\",\n \"colSpan\": 1,\n \"colorMode\": \"value\",\n \"textMode\": \"valueAndName\",\n \"textSize\": {}\n },\n \"datasourceCate\": \"prometheus\",\n \"datasourceValue\": \"${datasource}\",\n \"id\": \"1868973e-c3d3-4fd4-83b0-36ec2e06dfe0\",\n \"layout\": {\n \"h\": 7,\n \"i\": \"1868973e-c3d3-4fd4-83b0-36ec2e06dfe0\",\n \"isResizable\": true,\n \"w\": 6,\n \"x\": 18,\n \"y\": 8\n },\n \"name\": \"容器启动时长(小时)\",\n \"options\": {\n \"standardOptions\": {\n \"util\": \"humantimeSeconds\"\n }\n },\n \"targets\": [\n {\n \"expr\": \"sum((time()-container_start_time_seconds{pod=\\\"$pod_name\\\", image!~\\\".*pause.*\\\"})) by (name)\",\n \"refId\": \"A\"\n }\n ],\n \"type\": \"stat\",\n \"version\": \"2.0.0\"\n },\n {\n \"collapsed\": true,\n \"id\": \"8a4942a2-81a3-4473-81be-79b3541e09a3\",\n \"layout\": {\n \"h\": 1,\n \"i\": \"8a4942a2-81a3-4473-81be-79b3541e09a3\",\n \"isResizable\": false,\n \"w\": 24,\n \"x\": 0,\n \"y\": 15\n },\n \"name\": \"CPU\",\n \"type\": \"row\"\n },\n {\n \"custom\": {\n \"drawStyle\": \"lines\",\n \"fillOpacity\": 0.3,\n \"gradientMode\": \"opacity\",\n \"lineInterpolation\": \"smooth\",\n \"lineWidth\": 2,\n \"stack\": \"off\"\n },\n \"datasourceCate\": \"prometheus\",\n \"datasourceValue\": \"${datasource}\",\n \"description\": \"容器1min CPU平均使用率,如果pod内有多个容器,会分别显示各个容器CPU使用率(pause容器默认不会显示);如果容器配置了4核,使用率400%表示当前用满4核,容器配置2核,使用率200%表示当前用满2核。\",\n \"id\": \"54650fe9-007f-4b16-a523-baf2e91ef823\",\n \"layout\": {\n \"h\": 7,\n \"i\": \"54650fe9-007f-4b16-a523-baf2e91ef823\",\n \"isResizable\": true,\n \"w\": 6,\n \"x\": 0,\n \"y\": 16\n },\n \"name\": \"容器CPU使用率\",\n \"options\": {\n \"legend\": {\n \"displayMode\": \"hidden\"\n },\n \"standardOptions\": {\n \"max\": null,\n \"util\": \"percent\"\n },\n \"thresholds\": {},\n \"tooltip\": {\n \"mode\": \"all\",\n \"sort\": \"none\"\n }\n },\n \"targets\": [\n {\n \"expr\": \"sum(rate(container_cpu_usage_seconds_total{pod=\\\"$pod_name\\\", image!~\\\".*pause.*\\\"}[1m])*100) by(name)\",\n \"refId\": \"A\"\n }\n ],\n \"type\": \"timeseries\",\n \"version\": \"2.0.0\"\n },\n {\n \"custom\": {\n \"drawStyle\": \"lines\",\n \"fillOpacity\": 0.3,\n \"gradientMode\": \"opacity\",\n \"lineInterpolation\": \"smooth\",\n \"lineWidth\": 2,\n \"stack\": \"off\"\n },\n \"datasourceCate\": \"prometheus\",\n \"datasourceValue\": \"${datasource}\",\n \"description\": \"容器1min CPU平均使用率,如果pod内有多个容器,会分别显示各个容器CPU使用率(pause容器默认不会显示);如果容器配置了4核,使用率100%表示当前用满4核,容器配置2核,使用率100%表示当前用满2核,如果容器没有配置cpu limit,则不会显示该数值\",\n \"id\": \"715c1e5a-c504-4f2c-a790-dad1c73aae29\",\n \"layout\": {\n \"h\": 7,\n \"i\": \"715c1e5a-c504-4f2c-a790-dad1c73aae29\",\n \"isResizable\": true,\n \"w\": 6,\n \"x\": 6,\n \"y\": 16\n },\n \"name\": \"容器CPU归一化后使用率\",\n \"options\": {\n \"legend\": {\n \"displayMode\": \"hidden\"\n },\n \"standardOptions\": {\n \"max\": null,\n \"util\": \"percent\"\n },\n \"thresholds\": {},\n \"tooltip\": {\n \"mode\": \"all\",\n \"sort\": \"none\"\n }\n },\n \"targets\": [\n {\n \"expr\": \"sum(rate(container_cpu_usage_seconds_total{pod=\\\"$pod_name\\\", image!~\\\".*pause.*\\\"}[1m])*100) by(name)/((sum(container_spec_cpu_quota{pod=\\\"$pod_name\\\"}/container_spec_cpu_period{pod=\\\"$pod_name\\\"}) by (name)))\",\n \"refId\": \"A\"\n }\n ],\n \"type\": \"timeseries\",\n \"version\": \"2.0.0\"\n },\n {\n \"custom\": {\n \"drawStyle\": \"lines\",\n \"fillOpacity\": 0.3,\n \"gradientMode\": \"opacity\",\n \"lineInterpolation\": \"smooth\",\n \"lineWidth\": 2,\n \"stack\": \"off\"\n },\n \"datasourceCate\": \"prometheus\",\n \"datasourceValue\": \"${datasource}\",\n \"description\": \"容器1min 内核态CPU平均使用率,如果pod内有多个容器,会分别显示各个容器内核态CPU使用率(pause容器默认不会显示);如果容器配置了4核,使用率400%表示当前内核态用满4核,容器配置2核,使用率200%表示当前内核态用满2核。\",\n \"id\": \"d23a509d-3bb0-4680-b579-b89a411830a4\",\n \"layout\": {\n \"h\": 7,\n \"i\": \"d23a509d-3bb0-4680-b579-b89a411830a4\",\n \"isResizable\": true,\n \"w\": 6,\n \"x\": 12,\n \"y\": 16\n },\n \"name\": \"容器内核态CPU使用率\",\n \"options\": {\n \"legend\": {\n \"displayMode\": \"hidden\"\n },\n \"standardOptions\": {\n \"max\": null,\n \"util\": \"percent\"\n },\n \"thresholds\": {},\n \"tooltip\": {\n \"mode\": \"all\",\n \"sort\": \"none\"\n }\n },\n \"targets\": [\n {\n \"expr\": \"sum(rate(container_cpu_system_seconds_total{pod=\\\"$pod_name\\\", image!~\\\".*pause.*\\\"}[1m])*100) by(name)\",\n \"refId\": \"A\"\n }\n ],\n \"type\": \"timeseries\",\n \"version\": \"2.0.0\"\n },\n {\n \"custom\": {\n \"drawStyle\": \"lines\",\n \"fillOpacity\": 0.3,\n \"gradientMode\": \"opacity\",\n \"lineInterpolation\": \"smooth\",\n \"lineWidth\": 2,\n \"stack\": \"off\"\n },\n \"datasourceCate\": \"prometheus\",\n \"datasourceValue\": \"${datasource}\",\n \"description\": \"容器1min 内核态CPU平均使用率,如果pod内有多个容器,会分别显示各个容器用户态CPU使用率(pause容器默认不会显示);如果容器配置了4核,使用率400%表示当前用户态用满4核,容器配置2核,使用率200%表示当前用户态用满2核。\",\n \"id\": \"2921e6d0-1b9c-449d-9dd8-fb29dce8ca7d\",\n \"layout\": {\n \"h\": 7,\n \"i\": \"2921e6d0-1b9c-449d-9dd8-fb29dce8ca7d\",\n \"isResizable\": true,\n \"w\": 6,\n \"x\": 18,\n \"y\": 16\n },\n \"name\": \"容器用户态CPU使用率\",\n \"options\": {\n \"legend\": {\n \"displayMode\": \"hidden\"\n },\n \"standardOptions\": {\n \"max\": null,\n \"util\": \"percent\"\n },\n \"thresholds\": {},\n \"tooltip\": {\n \"mode\": \"all\",\n \"sort\": \"none\"\n }\n },\n \"targets\": [\n {\n \"expr\": \"sum(rate(container_cpu_user_seconds_total{pod=\\\"$pod_name\\\", image!~\\\".*pause.*\\\"}[1m])*100) by(name)\",\n \"refId\": \"A\"\n }\n ],\n \"type\": \"timeseries\",\n \"version\": \"2.0.0\"\n },\n {\n \"custom\": {\n \"drawStyle\": \"lines\",\n \"fillOpacity\": 0.3,\n \"gradientMode\": \"opacity\",\n \"lineInterpolation\": \"smooth\",\n \"lineWidth\": 2,\n \"stack\": \"off\"\n },\n \"datasourceCate\": \"prometheus\",\n \"datasourceValue\": \"${datasource}\",\n \"description\": \"该值大于0,说明CPU在运行期间发生throttle情况,即容器设置的CPU规格,不满足容器当前对CPU的实际需求,在这种情况下,往往需要调大容器CPU规格,或者优化程序,降低CPU开销。\",\n \"id\": \"b302c1a0-a499-4a99-aff2-d460685846ab\",\n \"layout\": {\n \"h\": 7,\n \"i\": \"b302c1a0-a499-4a99-aff2-d460685846ab\",\n \"isResizable\": true,\n \"w\": 6,\n \"x\": 0,\n \"y\": 23\n },\n \"name\": \"容器发生CPU throttle的比率\",\n \"options\": {\n \"legend\": {\n \"displayMode\": \"hidden\"\n },\n \"standardOptions\": {\n \"util\": \"percent\"\n },\n \"thresholds\": {},\n \"tooltip\": {\n \"mode\": \"all\",\n \"sort\": \"none\"\n }\n },\n \"targets\": [\n {\n \"expr\": \"sum(rate(container_cpu_cfs_throttled_periods_total{pod=\\\"$pod_name\\\", image!~\\\".*pause.*\\\"}[1m]))by(name) *100\",\n \"refId\": \"A\"\n }\n ],\n \"type\": \"timeseries\",\n \"version\": \"2.0.0\"\n },\n {\n \"custom\": {\n \"calc\": \"lastNotNull\",\n \"colSpan\": 1,\n \"colorMode\": \"value\",\n \"textMode\": \"valueAndName\",\n \"textSize\": {}\n },\n \"datasourceCate\": \"prometheus\",\n \"datasourceValue\": \"${datasource}\",\n \"description\": \"容器CPU Limit,2代表容器CPU Limit为2核, 0.2代表容器CPU Limit为0.2核, 没有数据表明没有设置Limit值\",\n \"id\": \"cd5e8b99-8a76-4dea-b8b2-3bff825a7f8d\",\n \"layout\": {\n \"h\": 7,\n \"i\": \"cd5e8b99-8a76-4dea-b8b2-3bff825a7f8d\",\n \"isResizable\": true,\n \"w\": 6,\n \"x\": 6,\n \"y\": 23\n },\n \"name\": \"容器CPU Limit\",\n \"options\": {\n \"standardOptions\": {}\n },\n \"targets\": [\n {\n \"expr\": \"(sum(container_spec_cpu_quota{pod=\\\"$pod_name\\\"}/container_spec_cpu_period{pod=\\\"$pod_name\\\"}) by (name))\",\n \"refId\": \"A\"\n }\n ],\n \"type\": \"stat\",\n \"version\": \"2.0.0\"\n },\n {\n \"custom\": {\n \"drawStyle\": \"lines\",\n \"fillOpacity\": 0.3,\n \"gradientMode\": \"opacity\",\n \"lineInterpolation\": \"smooth\",\n \"lineWidth\": 2,\n \"stack\": \"off\"\n },\n \"datasourceCate\": \"prometheus\",\n \"datasourceValue\": \"${datasource}\",\n \"description\": \"过去10s的CPU负载\",\n \"id\": \"408c29b9-2a49-49a2-a98b-3ad7da9c57bd\",\n \"layout\": {\n \"h\": 7,\n \"i\": \"408c29b9-2a49-49a2-a98b-3ad7da9c57bd\",\n \"isResizable\": true,\n \"w\": 6,\n \"x\": 12,\n \"y\": 23\n },\n \"name\": \"容器CPU load 10\",\n \"options\": {\n \"legend\": {\n \"displayMode\": \"hidden\"\n },\n \"standardOptions\": {\n \"max\": null\n },\n \"thresholds\": {},\n \"tooltip\": {\n \"mode\": \"all\",\n \"sort\": \"none\"\n }\n },\n \"targets\": [\n {\n \"expr\": \"sum(container_cpu_load_average_10s{pod=\\\"$pod_name\\\", image!~\\\".*pause.*\\\"}) by (name)\",\n \"refId\": \"A\"\n }\n ],\n \"type\": \"timeseries\",\n \"version\": \"2.0.0\"\n },\n {\n \"custom\": {\n \"drawStyle\": \"lines\",\n \"fillOpacity\": 0.3,\n \"gradientMode\": \"opacity\",\n \"lineInterpolation\": \"smooth\",\n \"lineWidth\": 2,\n \"stack\": \"off\"\n },\n \"datasourceCate\": \"prometheus\",\n \"datasourceValue\": \"${datasource}\",\n \"id\": \"fe62f7db-4f87-4da1-bfc3-60ed5039e31e\",\n \"layout\": {\n \"h\": 7,\n \"i\": \"fe62f7db-4f87-4da1-bfc3-60ed5039e31e\",\n \"isResizable\": true,\n \"w\": 6,\n \"x\": 18,\n \"y\": 23\n },\n \"name\": \"uninterruptible task 数量\",\n \"options\": {\n \"legend\": {\n \"displayMode\": \"hidden\"\n },\n \"standardOptions\": {},\n \"thresholds\": {},\n \"tooltip\": {\n \"mode\": \"all\",\n \"sort\": \"none\"\n }\n },\n \"targets\": [\n {\n \"expr\": \"sum(container_tasks_state{pod=\\\"$pod_name\\\", image!~\\\".*pause.*\\\", state=\\\"uninterruptible\\\"}) by (name)\",\n \"refId\": \"A\"\n }\n ],\n \"type\": \"timeseries\",\n \"version\": \"2.0.0\"\n },\n {\n \"custom\": {\n \"drawStyle\": \"lines\",\n \"fillOpacity\": 0.3,\n \"gradientMode\": \"opacity\",\n \"lineInterpolation\": \"smooth\",\n \"lineWidth\": 2,\n \"stack\": \"off\"\n },\n \"datasourceCate\": \"prometheus\",\n \"datasourceValue\": \"${datasource}\",\n \"id\": \"7152f66a-d907-4ee9-afd3-a04b12f1019b\",\n \"layout\": {\n \"h\": 7,\n \"i\": \"7152f66a-d907-4ee9-afd3-a04b12f1019b\",\n \"isResizable\": true,\n \"w\": 6,\n \"x\": 0,\n \"y\": 30\n },\n \"name\": \"running task 数量\",\n \"options\": {\n \"legend\": {\n \"displayMode\": \"hidden\"\n },\n \"standardOptions\": {},\n \"thresholds\": {},\n \"tooltip\": {\n \"mode\": \"all\",\n \"sort\": \"none\"\n }\n },\n \"targets\": [\n {\n \"expr\": \"sum(container_tasks_state{pod=\\\"$pod_name\\\", image!~\\\".*pause.*\\\", state=\\\"running\\\"}) by (name)\",\n \"refId\": \"A\"\n }\n ],\n \"type\": \"timeseries\",\n \"version\": \"2.0.0\"\n },\n {\n \"custom\": {\n \"drawStyle\": \"lines\",\n \"fillOpacity\": 0.3,\n \"gradientMode\": \"opacity\",\n \"lineInterpolation\": \"smooth\",\n \"lineWidth\": 2,\n \"stack\": \"off\"\n },\n \"datasourceCate\": \"prometheus\",\n \"datasourceValue\": \"${datasource}\",\n \"id\": \"d2627af4-5753-4384-880b-84bead73002a\",\n \"layout\": {\n \"h\": 7,\n \"i\": \"d2627af4-5753-4384-880b-84bead73002a\",\n \"isResizable\": true,\n \"w\": 6,\n \"x\": 6,\n \"y\": 30\n },\n \"name\": \"ioawaiting task 数量\",\n \"options\": {\n \"legend\": {\n \"displayMode\": \"hidden\"\n },\n \"standardOptions\": {},\n \"thresholds\": {},\n \"tooltip\": {\n \"mode\": \"all\",\n \"sort\": \"none\"\n }\n },\n \"targets\": [\n {\n \"expr\": \"sum(container_tasks_state{pod=\\\"$pod_name\\\", image!~\\\".*pause.*\\\", state=\\\"iowaiting\\\"}) by (name)\",\n \"refId\": \"A\"\n }\n ],\n \"type\": \"timeseries\",\n \"version\": \"2.0.0\"\n },\n {\n \"custom\": {\n \"drawStyle\": \"lines\",\n \"fillOpacity\": 0.3,\n \"gradientMode\": \"opacity\",\n \"lineInterpolation\": \"smooth\",\n \"lineWidth\": 2,\n \"stack\": \"off\"\n },\n \"datasourceCate\": \"prometheus\",\n \"datasourceValue\": \"${datasource}\",\n \"id\": \"78801242-2aae-48dc-a3c3-3d0050fac92c\",\n \"layout\": {\n \"h\": 7,\n \"i\": \"78801242-2aae-48dc-a3c3-3d0050fac92c\",\n \"isResizable\": true,\n \"w\": 6,\n \"x\": 12,\n \"y\": 30\n },\n \"name\": \"sleeping task 数量\",\n \"options\": {\n \"legend\": {\n \"displayMode\": \"hidden\"\n },\n \"standardOptions\": {},\n \"thresholds\": {},\n \"tooltip\": {\n \"mode\": \"all\",\n \"sort\": \"none\"\n }\n },\n \"targets\": [\n {\n \"expr\": \"sum(container_tasks_state{pod=\\\"$pod_name\\\", image!~\\\".*pause.*\\\", state=\\\"sleeping\\\"}) by (name)\",\n \"refId\": \"A\"\n }\n ],\n \"type\": \"timeseries\",\n \"version\": \"2.0.0\"\n },\n {\n \"custom\": {\n \"drawStyle\": \"lines\",\n \"fillOpacity\": 0.3,\n \"gradientMode\": \"opacity\",\n \"lineInterpolation\": \"smooth\",\n \"lineWidth\": 2,\n \"stack\": \"off\"\n },\n \"datasourceCate\": \"prometheus\",\n \"datasourceValue\": \"${datasource}\",\n \"id\": \"723a4b98-52e8-4284-b193-98a470189415\",\n \"layout\": {\n \"h\": 7,\n \"i\": \"723a4b98-52e8-4284-b193-98a470189415\",\n \"isResizable\": true,\n \"w\": 6,\n \"x\": 18,\n \"y\": 30\n },\n \"name\": \"stopped task 数量\",\n \"options\": {\n \"legend\": {\n \"displayMode\": \"hidden\"\n },\n \"standardOptions\": {},\n \"thresholds\": {},\n \"tooltip\": {\n \"mode\": \"all\",\n \"sort\": \"none\"\n }\n },\n \"targets\": [\n {\n \"expr\": \"sum(container_tasks_state{pod=\\\"$pod_name\\\", image!~\\\".*pause.*\\\", state=\\\"stopped\\\"}) by (name)\",\n \"refId\": \"A\"\n }\n ],\n \"type\": \"timeseries\",\n \"version\": \"2.0.0\"\n },\n {\n \"collapsed\": true,\n \"id\": \"39a8bcef-7b91-4ec4-8644-4e5674267437\",\n \"layout\": {\n \"h\": 1,\n \"i\": \"39a8bcef-7b91-4ec4-8644-4e5674267437\",\n \"isResizable\": false,\n \"w\": 24,\n \"x\": 0,\n \"y\": 37\n },\n \"name\": \"内存\",\n \"type\": \"row\"\n },\n {\n \"custom\": {\n \"drawStyle\": \"lines\",\n \"fillOpacity\": 0.3,\n \"gradientMode\": \"opacity\",\n \"lineInterpolation\": \"smooth\",\n \"lineWidth\": 2,\n \"stack\": \"off\"\n },\n \"datasourceCate\": \"prometheus\",\n \"datasourceValue\": \"${datasource}\",\n \"description\": \"(container_memory_rss + container_memory_cache + container_memory_swap + kernel memory)/ (memory limit), 没有数据表明容器配置没有设置mem limit\",\n \"id\": \"e7b80412-d9b2-4589-8175-abf93a62a524\",\n \"layout\": {\n \"h\": 7,\n \"i\": \"e7b80412-d9b2-4589-8175-abf93a62a524\",\n \"isResizable\": true,\n \"w\": 6,\n \"x\": 0,\n \"y\": 38\n },\n \"name\": \"容器内存使用率\",\n \"options\": {\n \"legend\": {\n \"displayMode\": \"hidden\"\n },\n \"standardOptions\": {\n \"max\": null,\n \"util\": \"percent\"\n },\n \"thresholds\": {},\n \"tooltip\": {\n \"mode\": \"all\",\n \"sort\": \"none\"\n }\n },\n \"targets\": [\n {\n \"expr\": \"((sum(container_memory_usage_bytes{pod=\\\"$pod_name\\\", image!~\\\".*pause.*\\\"}) by (name)) /(sum(container_spec_memory_limit_bytes{pod=\\\"$pod_name\\\", image!~\\\".*pause.*\\\"}) by (name)))*100\",\n \"refId\": \"A\"\n }\n ],\n \"type\": \"timeseries\",\n \"version\": \"2.0.0\"\n },\n {\n \"custom\": {\n \"drawStyle\": \"lines\",\n \"fillOpacity\": 0.3,\n \"gradientMode\": \"opacity\",\n \"lineInterpolation\": \"smooth\",\n \"lineWidth\": 2,\n \"stack\": \"off\"\n },\n \"datasourceCate\": \"prometheus\",\n \"datasourceValue\": \"${datasource}\",\n \"description\": \"container_memory_rss + container_memory_cache + container_memory_swap + kernel memory\",\n \"id\": \"4c2e1b54-1adb-480e-a581-1763bec5113f\",\n \"layout\": {\n \"h\": 7,\n \"i\": \"4c2e1b54-1adb-480e-a581-1763bec5113f\",\n \"isResizable\": true,\n \"w\": 6,\n \"x\": 6,\n \"y\": 38\n },\n \"name\": \"容器内存使用\",\n \"options\": {\n \"legend\": {\n \"displayMode\": \"hidden\"\n },\n \"standardOptions\": {\n \"util\": \"bytesIEC\"\n },\n \"thresholds\": {},\n \"tooltip\": {\n \"mode\": \"all\",\n \"sort\": \"none\"\n }\n },\n \"targets\": [\n {\n \"expr\": \"(sum(container_memory_usage_bytes{pod=\\\"$pod_name\\\", image!~\\\".*pause.*\\\"}) by (name)) \",\n \"refId\": \"A\"\n }\n ],\n \"type\": \"timeseries\",\n \"version\": \"2.0.0\"\n },\n {\n \"custom\": {\n \"drawStyle\": \"lines\",\n \"fillOpacity\": 0.3,\n \"gradientMode\": \"opacity\",\n \"lineInterpolation\": \"smooth\",\n \"lineWidth\": 2,\n \"stack\": \"off\"\n },\n \"datasourceCate\": \"prometheus\",\n \"datasourceValue\": \"${datasource}\",\n \"description\": \"容器cache 占用大小\",\n \"id\": \"429e0214-7b71-4fc0-a771-945363948999\",\n \"layout\": {\n \"h\": 7,\n \"i\": \"429e0214-7b71-4fc0-a771-945363948999\",\n \"isResizable\": true,\n \"w\": 6,\n \"x\": 12,\n \"y\": 38\n },\n \"name\": \"容器cache使用\",\n \"options\": {\n \"legend\": {\n \"displayMode\": \"hidden\"\n },\n \"standardOptions\": {\n \"util\": \"bytesIEC\"\n },\n \"thresholds\": {},\n \"tooltip\": {\n \"mode\": \"all\",\n \"sort\": \"none\"\n }\n },\n \"targets\": [\n {\n \"expr\": \"(sum(container_memory_cache{pod=\\\"$pod_name\\\", image!~\\\".*pause.*\\\"}) by (name))\",\n \"refId\": \"A\"\n }\n ],\n \"type\": \"timeseries\",\n \"version\": \"2.0.0\"\n },\n {\n \"custom\": {\n \"drawStyle\": \"lines\",\n \"fillOpacity\": 0.3,\n \"gradientMode\": \"opacity\",\n \"lineInterpolation\": \"smooth\",\n \"lineWidth\": 2,\n \"stack\": \"off\"\n },\n \"datasourceCate\": \"prometheus\",\n \"datasourceValue\": \"${datasource}\",\n \"description\": \"容器RSS内存占用大小。\",\n \"id\": \"27c1a22c-bdf3-4a8d-bd31-16c66a307f3f\",\n \"layout\": {\n \"h\": 7,\n \"i\": \"27c1a22c-bdf3-4a8d-bd31-16c66a307f3f\",\n \"isResizable\": true,\n \"w\": 6,\n \"x\": 18,\n \"y\": 38\n },\n \"name\": \"容器RSS内存使用\",\n \"options\": {\n \"legend\": {\n \"displayMode\": \"hidden\"\n },\n \"standardOptions\": {\n \"util\": \"bytesIEC\"\n },\n \"thresholds\": {},\n \"tooltip\": {\n \"mode\": \"all\",\n \"sort\": \"none\"\n }\n },\n \"targets\": [\n {\n \"expr\": \"(sum(container_memory_rss{pod=\\\"$pod_name\\\", image!~\\\".*pause.*\\\"}) by (name))\",\n \"refId\": \"A\"\n }\n ],\n \"type\": \"timeseries\",\n \"version\": \"2.0.0\"\n },\n {\n \"custom\": {\n \"drawStyle\": \"lines\",\n \"fillOpacity\": 0.3,\n \"gradientMode\": \"opacity\",\n \"lineInterpolation\": \"smooth\",\n \"lineWidth\": 2,\n \"stack\": \"off\"\n },\n \"datasourceCate\": \"prometheus\",\n \"datasourceValue\": \"${datasource}\",\n \"description\": \"容器内存Limit配置,0表示没有设置内存 Limit\",\n \"id\": \"13173c71-14a9-43a0-9cbe-34c1bb453f2b\",\n \"layout\": {\n \"h\": 7,\n \"i\": \"13173c71-14a9-43a0-9cbe-34c1bb453f2b\",\n \"isResizable\": true,\n \"w\": 6,\n \"x\": 0,\n \"y\": 45\n },\n \"name\": \"容器内存 Limit\",\n \"options\": {\n \"legend\": {\n \"displayMode\": \"hidden\"\n },\n \"standardOptions\": {\n \"util\": \"bytesIEC\"\n },\n \"thresholds\": {},\n \"tooltip\": {\n \"mode\": \"all\",\n \"sort\": \"none\"\n }\n },\n \"targets\": [\n {\n \"expr\": \"sum(container_spec_memory_limit_bytes{pod=\\\"$pod_name\\\", image!~\\\".*pause.*\\\"}) by (name)\",\n \"refId\": \"A\"\n }\n ],\n \"type\": \"timeseries\",\n \"version\": \"2.0.0\"\n },\n {\n \"custom\": {\n \"calc\": \"lastNotNull\",\n \"colSpan\": 1,\n \"colorMode\": \"value\",\n \"textMode\": \"valueAndName\",\n \"textSize\": {}\n },\n \"datasourceCate\": \"prometheus\",\n \"datasourceValue\": \"${datasource}\",\n \"id\": \"d3a7153b-f174-473c-a5ae-1ec8ff4ef318\",\n \"layout\": {\n \"h\": 7,\n \"i\": \"d3a7153b-f174-473c-a5ae-1ec8ff4ef318\",\n \"isResizable\": true,\n \"w\": 6,\n \"x\": 6,\n \"y\": 45\n },\n \"name\": \"容器发生OOM次数\",\n \"options\": {\n \"standardOptions\": {}\n },\n \"targets\": [\n {\n \"expr\": \"sum(container_oom_events_total{pod=\\\"$pod_name\\\", image!~\\\".*pause.*\\\"}) by (name) \",\n \"refId\": \"A\"\n }\n ],\n \"type\": \"stat\",\n \"version\": \"2.0.0\"\n },\n {\n \"custom\": {\n \"drawStyle\": \"lines\",\n \"fillOpacity\": 0.3,\n \"gradientMode\": \"opacity\",\n \"lineInterpolation\": \"smooth\",\n \"lineWidth\": 2,\n \"stack\": \"off\"\n },\n \"datasourceCate\": \"prometheus\",\n \"datasourceValue\": \"${datasource}\",\n \"description\": \"网络接收错误数(1分钟内)\",\n \"id\": \"271d8ff6-2382-488d-b479-83e38b247012\",\n \"layout\": {\n \"h\": 7,\n \"i\": \"271d8ff6-2382-488d-b479-83e38b247012\",\n \"isResizable\": true,\n \"w\": 6,\n \"x\": 12,\n \"y\": 45\n },\n \"name\": \"网络接收错误数\",\n \"options\": {\n \"legend\": {\n \"displayMode\": \"hidden\"\n },\n \"standardOptions\": {},\n \"thresholds\": {},\n \"tooltip\": {\n \"mode\": \"all\",\n \"sort\": \"none\"\n }\n },\n \"targets\": [\n {\n \"expr\": \"sum(rate(container_network_receive_errors_total{pod=\\\"$pod_name\\\"}[1m])) by(name, interface)\",\n \"refId\": \"A\"\n }\n ],\n \"type\": \"timeseries\",\n \"version\": \"2.0.0\"\n },\n {\n \"custom\": {\n \"drawStyle\": \"lines\",\n \"fillOpacity\": 0.3,\n \"gradientMode\": \"opacity\",\n \"lineInterpolation\": \"smooth\",\n \"lineWidth\": 2,\n \"stack\": \"off\"\n },\n \"datasourceCate\": \"prometheus\",\n \"datasourceValue\": \"${datasource}\",\n \"description\": \"网络接收丢包数(1分钟内)\",\n \"id\": \"e7a0879b-82a9-4518-8c5c-93bc73548401\",\n \"layout\": {\n \"h\": 7,\n \"i\": \"e7a0879b-82a9-4518-8c5c-93bc73548401\",\n \"isResizable\": true,\n \"w\": 6,\n \"x\": 18,\n \"y\": 45\n },\n \"name\": \"网络接收丢包数\",\n \"options\": {\n \"legend\": {\n \"displayMode\": \"hidden\"\n },\n \"standardOptions\": {},\n \"thresholds\": {},\n \"tooltip\": {\n \"mode\": \"all\",\n \"sort\": \"none\"\n }\n },\n \"targets\": [\n {\n \"expr\": \"sum(rate(container_network_receive_packets_dropped_total{pod=\\\"$pod_name\\\"}[1m])) by(name, interface)\",\n \"refId\": \"A\"\n }\n ],\n \"type\": \"timeseries\",\n \"version\": \"2.0.0\"\n },\n {\n \"collapsed\": true,\n \"id\": \"8d49afd3-d8fa-4714-aaa2-b10e045c8976\",\n \"layout\": {\n \"h\": 1,\n \"i\": \"8d49afd3-d8fa-4714-aaa2-b10e045c8976\",\n \"isResizable\": false,\n \"w\": 24,\n \"x\": 0,\n \"y\": 52\n },\n \"name\": \"磁盘\",\n \"type\": \"row\"\n },\n {\n \"custom\": {\n \"drawStyle\": \"lines\",\n \"fillOpacity\": 0.3,\n \"gradientMode\": \"opacity\",\n \"lineInterpolation\": \"smooth\",\n \"lineWidth\": 2,\n \"stack\": \"off\"\n },\n \"datasourceCate\": \"prometheus\",\n \"datasourceValue\": \"${datasource}\",\n \"id\": \"ef7e1b00-2a77-4a34-a138-5c8207088476\",\n \"layout\": {\n \"h\": 7,\n \"i\": \"ef7e1b00-2a77-4a34-a138-5c8207088476\",\n \"isResizable\": true,\n \"w\": 6,\n \"x\": 0,\n \"y\": 53\n },\n \"name\": \"文件系统读取速率\",\n \"options\": {\n \"legend\": {\n \"displayMode\": \"hidden\"\n },\n \"standardOptions\": {\n \"util\": \"bytesIEC\"\n },\n \"thresholds\": {},\n \"tooltip\": {\n \"mode\": \"all\",\n \"sort\": \"none\"\n }\n },\n \"targets\": [\n {\n \"expr\": \"sum(rate(container_fs_reads_bytes_total{pod=\\\"$pod_name\\\", image!~\\\".*pause.*\\\"}[1m])) by(name)\",\n \"refId\": \"A\"\n }\n ],\n \"type\": \"timeseries\",\n \"version\": \"2.0.0\"\n },\n {\n \"custom\": {\n \"drawStyle\": \"lines\",\n \"fillOpacity\": 0.3,\n \"gradientMode\": \"opacity\",\n \"lineInterpolation\": \"smooth\",\n \"lineWidth\": 2,\n \"stack\": \"off\"\n },\n \"datasourceCate\": \"prometheus\",\n \"datasourceValue\": \"${datasource}\",\n \"id\": \"e55b7db3-2b13-43f9-aa2d-e9a0a929df4b\",\n \"layout\": {\n \"h\": 7,\n \"i\": \"e55b7db3-2b13-43f9-aa2d-e9a0a929df4b\",\n \"isResizable\": true,\n \"w\": 6,\n \"x\": 6,\n \"y\": 53\n },\n \"name\": \"文件系统写入速率\",\n \"options\": {\n \"legend\": {\n \"displayMode\": \"hidden\"\n },\n \"standardOptions\": {\n \"util\": \"bytesIEC\"\n },\n \"thresholds\": {},\n \"tooltip\": {\n \"mode\": \"all\",\n \"sort\": \"none\"\n }\n },\n \"targets\": [\n {\n \"expr\": \"sum(rate(container_fs_writes_bytes_total{pod=\\\"$pod_name\\\", image!~\\\".*pause.*\\\"}[1m])) by(name)\",\n \"refId\": \"A\"\n }\n ],\n \"type\": \"timeseries\",\n \"version\": \"2.0.0\"\n },\n {\n \"custom\": {\n \"drawStyle\": \"lines\",\n \"fillOpacity\": 0.3,\n \"gradientMode\": \"opacity\",\n \"lineInterpolation\": \"smooth\",\n \"lineWidth\": 2,\n \"stack\": \"off\"\n },\n \"datasourceCate\": \"prometheus\",\n \"datasourceValue\": \"${datasource}\",\n \"id\": \"a2d7ba64-fd4d-4713-9295-8663fa72f675\",\n \"layout\": {\n \"h\": 7,\n \"i\": \"a2d7ba64-fd4d-4713-9295-8663fa72f675\",\n \"isResizable\": true,\n \"w\": 6,\n \"x\": 12,\n \"y\": 53\n },\n \"name\": \"容器I/O\",\n \"options\": {\n \"legend\": {\n \"displayMode\": \"hidden\"\n },\n \"standardOptions\": {},\n \"thresholds\": {},\n \"tooltip\": {\n \"mode\": \"all\",\n \"sort\": \"none\"\n }\n },\n \"targets\": [\n {\n \"expr\": \"sum(container_fs_io_current{pod=\\\"$pod_name\\\", image!~\\\".*pause.*\\\"}) by (name) \",\n \"refId\": \"A\"\n }\n ],\n \"type\": \"timeseries\",\n \"version\": \"2.0.0\"\n },\n {\n \"custom\": {\n \"drawStyle\": \"lines\",\n \"fillOpacity\": 0.3,\n \"gradientMode\": \"opacity\",\n \"lineInterpolation\": \"smooth\",\n \"lineWidth\": 2,\n \"stack\": \"off\"\n },\n \"datasourceCate\": \"prometheus\",\n \"datasourceValue\": \"${datasource}\",\n \"id\": \"2b4e94ef-c994-4910-b72b-428bf5156a21\",\n \"layout\": {\n \"h\": 7,\n \"i\": \"2b4e94ef-c994-4910-b72b-428bf5156a21\",\n \"isResizable\": true,\n \"w\": 6,\n \"x\": 18,\n \"y\": 53\n },\n \"name\": \"inode数量\",\n \"options\": {\n \"legend\": {\n \"displayMode\": \"hidden\"\n },\n \"standardOptions\": {},\n \"thresholds\": {},\n \"tooltip\": {\n \"mode\": \"all\",\n \"sort\": \"none\"\n }\n },\n \"targets\": [\n {\n \"expr\": \"sum(container_fs_inodes_total{pod=\\\"$pod_name\\\", image!~\\\".*pause.*\\\"}) by (name) \",\n \"refId\": \"A\"\n }\n ],\n \"type\": \"timeseries\",\n \"version\": \"2.0.0\"\n },\n {\n \"custom\": {\n \"drawStyle\": \"lines\",\n \"fillOpacity\": 0.3,\n \"gradientMode\": \"opacity\",\n \"lineInterpolation\": \"smooth\",\n \"lineWidth\": 2,\n \"stack\": \"off\"\n },\n \"datasourceCate\": \"prometheus\",\n \"datasourceValue\": \"${datasource}\",\n \"id\": \"3abade99-8f34-4a1e-bb48-c5ba1e128749\",\n \"layout\": {\n \"h\": 7,\n \"i\": \"3abade99-8f34-4a1e-bb48-c5ba1e128749\",\n \"isResizable\": true,\n \"w\": 6,\n \"x\": 0,\n \"y\": 60\n },\n \"name\": \"容器已使用的文件系统大小\",\n \"options\": {\n \"legend\": {\n \"displayMode\": \"hidden\"\n },\n \"standardOptions\": {\n \"util\": \"bytesIEC\"\n },\n \"thresholds\": {},\n \"tooltip\": {\n \"mode\": \"all\",\n \"sort\": \"none\"\n }\n },\n \"targets\": [\n {\n \"expr\": \"sum(container_fs_usage_bytes{pod=\\\"$pod_name\\\", image!~\\\".*pause.*\\\"}) by (name) \",\n \"refId\": \"A\"\n }\n ],\n \"type\": \"timeseries\",\n \"version\": \"2.0.0\"\n },\n {\n \"custom\": {\n \"drawStyle\": \"lines\",\n \"fillOpacity\": 0.3,\n \"gradientMode\": \"opacity\",\n \"lineInterpolation\": \"smooth\",\n \"lineWidth\": 2,\n \"stack\": \"off\"\n },\n \"datasourceCate\": \"prometheus\",\n \"datasourceValue\": \"${datasource}\",\n \"description\": \"网络接收数据包数(1分钟内)\",\n \"id\": \"8b0bac93-8bd0-4452-a200-a9cea74345b3\",\n \"layout\": {\n \"h\": 7,\n \"i\": \"8b0bac93-8bd0-4452-a200-a9cea74345b3\",\n \"isResizable\": true,\n \"w\": 6,\n \"x\": 6,\n \"y\": 60\n },\n \"name\": \"网络接收数据包数\",\n \"options\": {\n \"legend\": {\n \"displayMode\": \"hidden\"\n },\n \"standardOptions\": {},\n \"thresholds\": {},\n \"tooltip\": {\n \"mode\": \"all\",\n \"sort\": \"none\"\n }\n },\n \"targets\": [\n {\n \"expr\": \"sum(rate(container_network_receive_packets_total{pod=\\\"$pod_name\\\"}[1m])) by(name, interface)\",\n \"refId\": \"A\"\n }\n ],\n \"type\": \"timeseries\",\n \"version\": \"2.0.0\"\n },\n {\n \"collapsed\": true,\n \"id\": \"fde213bc-fe49-431a-9495-2219fcaaa01a\",\n \"layout\": {\n \"h\": 1,\n \"i\": \"fde213bc-fe49-431a-9495-2219fcaaa01a\",\n \"isResizable\": false,\n \"w\": 24,\n \"x\": 0,\n \"y\": 67\n },\n \"name\": \"网络\",\n \"type\": \"row\"\n },\n {\n \"custom\": {\n \"drawStyle\": \"lines\",\n \"fillOpacity\": 0.3,\n \"gradientMode\": \"opacity\",\n \"lineInterpolation\": \"smooth\",\n \"lineWidth\": 2,\n \"stack\": \"off\"\n },\n \"datasourceCate\": \"prometheus\",\n \"datasourceValue\": \"${datasource}\",\n \"description\": \"容器网络发送的字节数(1 分钟内)\",\n \"id\": \"4e70bc47-1510-41fe-a924-3ffa36d11f0f\",\n \"layout\": {\n \"h\": 7,\n \"i\": \"4e70bc47-1510-41fe-a924-3ffa36d11f0f\",\n \"isResizable\": true,\n \"w\": 6,\n \"x\": 0,\n \"y\": 68\n },\n \"name\": \"网络发送速率\",\n \"options\": {\n \"legend\": {\n \"displayMode\": \"hidden\"\n },\n \"standardOptions\": {\n \"util\": \"bytesIEC\"\n },\n \"thresholds\": {},\n \"tooltip\": {\n \"mode\": \"all\",\n \"sort\": \"none\"\n }\n },\n \"targets\": [\n {\n \"expr\": \"sum(rate(container_network_transmit_bytes_total{pod=\\\"$pod_name\\\"}[1m])) by(name, interface)\",\n \"refId\": \"A\"\n }\n ],\n \"type\": \"timeseries\",\n \"version\": \"2.0.0\"\n },\n {\n \"custom\": {\n \"drawStyle\": \"lines\",\n \"fillOpacity\": 0.3,\n \"gradientMode\": \"opacity\",\n \"lineInterpolation\": \"smooth\",\n \"lineWidth\": 2,\n \"stack\": \"off\"\n },\n \"datasourceCate\": \"prometheus\",\n \"datasourceValue\": \"${datasource}\",\n \"description\": \"网络发送数据包数(1分钟内)\",\n \"id\": \"00ca29e5-7c97-491d-a28f-0f2d66ea47c5\",\n \"layout\": {\n \"h\": 7,\n \"i\": \"00ca29e5-7c97-491d-a28f-0f2d66ea47c5\",\n \"isResizable\": true,\n \"w\": 6,\n \"x\": 6,\n \"y\": 68\n },\n \"name\": \"网络发送数据包\",\n \"options\": {\n \"legend\": {\n \"displayMode\": \"hidden\"\n },\n \"standardOptions\": {},\n \"thresholds\": {},\n \"tooltip\": {\n \"mode\": \"all\",\n \"sort\": \"none\"\n }\n },\n \"targets\": [\n {\n \"expr\": \"sum(rate(container_network_transmit_packets_total{pod=\\\"$pod_name\\\"}[1m])) by(name, interface)\",\n \"refId\": \"A\"\n }\n ],\n \"type\": \"timeseries\",\n \"version\": \"2.0.0\"\n },\n {\n \"custom\": {\n \"drawStyle\": \"lines\",\n \"fillOpacity\": 0.3,\n \"gradientMode\": \"opacity\",\n \"lineInterpolation\": \"smooth\",\n \"lineWidth\": 2,\n \"stack\": \"off\"\n },\n \"datasourceCate\": \"prometheus\",\n \"datasourceValue\": \"${datasource}\",\n \"description\": \"网络发送错误数(1分钟内)\",\n \"id\": \"8cd76b5f-5bba-421a-9fda-42f406f54ed5\",\n \"layout\": {\n \"h\": 7,\n \"i\": \"8cd76b5f-5bba-421a-9fda-42f406f54ed5\",\n \"isResizable\": true,\n \"w\": 6,\n \"x\": 12,\n \"y\": 68\n },\n \"name\": \"网络发送错误数\",\n \"options\": {\n \"legend\": {\n \"displayMode\": \"hidden\"\n },\n \"standardOptions\": {},\n \"thresholds\": {},\n \"tooltip\": {\n \"mode\": \"all\",\n \"sort\": \"none\"\n }\n },\n \"targets\": [\n {\n \"expr\": \"sum(rate(container_network_transmit_errors_total{pod=\\\"$pod_name\\\"}[1m])) by(name, interface)\",\n \"refId\": \"A\"\n }\n ],\n \"type\": \"timeseries\",\n \"version\": \"2.0.0\"\n },\n {\n \"custom\": {\n \"drawStyle\": \"lines\",\n \"fillOpacity\": 0.3,\n \"gradientMode\": \"opacity\",\n \"lineInterpolation\": \"smooth\",\n \"lineWidth\": 2,\n \"stack\": \"off\"\n },\n \"datasourceCate\": \"prometheus\",\n \"datasourceValue\": \"${datasource}\",\n \"description\": \"网络发送丢包数(1分钟内)\",\n \"id\": \"58aaebbb-b1cf-4089-bcb5-70b03c05318d\",\n \"layout\": {\n \"h\": 7,\n \"i\": \"58aaebbb-b1cf-4089-bcb5-70b03c05318d\",\n \"isResizable\": true,\n \"w\": 6,\n \"x\": 18,\n \"y\": 68\n },\n \"name\": \"网络发送丢包数\",\n \"options\": {\n \"legend\": {\n \"displayMode\": \"hidden\"\n },\n \"standardOptions\": {},\n \"thresholds\": {},\n \"tooltip\": {\n \"mode\": \"all\",\n \"sort\": \"none\"\n }\n },\n \"targets\": [\n {\n \"expr\": \"sum(rate(container_network_transmit_packets_dropped_total{pod=\\\"$pod_name\\\"}[1m])) by(name, interface)\",\n \"refId\": \"A\"\n }\n ],\n \"type\": \"timeseries\",\n \"version\": \"2.0.0\"\n },\n {\n \"custom\": {\n \"drawStyle\": \"lines\",\n \"fillOpacity\": 0.3,\n \"gradientMode\": \"opacity\",\n \"lineInterpolation\": \"smooth\",\n \"lineWidth\": 2,\n \"stack\": \"off\"\n },\n \"datasourceCate\": \"prometheus\",\n \"datasourceValue\": \"${datasource}\",\n \"description\": \"容器网络接收的字节数(1 分钟内)\",\n \"id\": \"120d3540-cce5-4b08-b596-0ec6a5b2d497\",\n \"layout\": {\n \"h\": 7,\n \"i\": \"120d3540-cce5-4b08-b596-0ec6a5b2d497\",\n \"isResizable\": true,\n \"w\": 6,\n \"x\": 0,\n \"y\": 75\n },\n \"name\": \"网络接收速率\",\n \"options\": {\n \"legend\": {\n \"displayMode\": \"hidden\"\n },\n \"standardOptions\": {\n \"util\": \"bytesIEC\"\n },\n \"thresholds\": {},\n \"tooltip\": {\n \"mode\": \"all\",\n \"sort\": \"none\"\n }\n },\n \"targets\": [\n {\n \"expr\": \"sum(rate(container_network_receive_bytes_total{pod=\\\"$pod_name\\\"}[1m])) by(name, interface)\",\n \"refId\": \"A\"\n }\n ],\n \"type\": \"timeseries\",\n \"version\": \"2.0.0\"\n }\n ],\n \"var\": [\n {\n \"name\": \"datasource\",\n \"type\": \"datasource\",\n \"definition\": \"prometheus\",\n \"defaultValue\": 40\n },\n {\n \"name\": \"namespace\",\n \"type\": \"query\",\n \"hide\": false,\n \"datasource\": {\n \"cate\": \"prometheus\",\n \"value\": \"${datasource}\"\n },\n \"definition\": \"label_values(container_cpu_usage_seconds_total, namespace)\",\n \"reg\": \"\",\n \"multi\": false\n },\n {\n \"name\": \"pod_name\",\n \"type\": \"query\",\n \"hide\": false,\n \"datasource\": {\n \"cate\": \"prometheus\",\n \"value\": \"${datasource}\"\n },\n \"definition\": \"label_values(container_cpu_usage_seconds_total{namespace=\\\"$namespace\\\"}, pod)\",\n \"reg\": \"\",\n \"multi\": false\n }\n ],\n \"version\": \"3.0.0\"\n },\n \"public\": 0,\n \"public_cate\": 0,\n \"bgids\": null,\n \"built_in\": 0,\n \"hide\": 0,\n \"uuid\": 1717556327681975000\n}"
},
{
"path": "integrations/Kubernetes/dashboards/Scheduler.json",
"content": "{\n \"id\": 0,\n \"group_id\": 0,\n \"name\": \"Kubernetes / Scheduler\",\n \"ident\": \"\",\n \"tags\": \"Categraf\",\n \"create_at\": 0,\n \"create_by\": \"\",\n \"update_at\": 0,\n \"update_by\": \"\",\n \"configs\": {\n \"links\": [],\n \"panels\": [\n {\n \"custom\": {\n \"calc\": \"lastNotNull\",\n \"colorMode\": \"value\",\n \"displayMode\": \"seriesToRows\",\n \"showHeader\": true\n },\n \"datasourceCate\": \"prometheus\",\n \"datasourceValue\": \"${datasource}\",\n \"description\": \"scheduler健康状态\",\n \"id\": \"5d6560c5-6137-4632-bb88-ff8c9cf42e9d\",\n \"layout\": {\n \"h\": 6,\n \"i\": \"5d6560c5-6137-4632-bb88-ff8c9cf42e9d\",\n \"isResizable\": true,\n \"w\": 12,\n \"x\": 0,\n \"y\": 0\n },\n \"links\": [],\n \"name\": \"Scheduler - Health Status\",\n \"options\": {\n \"standardOptions\": {\n \"util\": \"none\"\n },\n \"valueMappings\": [\n {\n \"options\": {\n \"0\": {\n \"text\": \"DOWN\"\n },\n \"1\": {\n \"text\": \"UP\"\n }\n },\n \"type\": \"value\"\n },\n {\n \"match\": {\n \"special\": 1\n },\n \"result\": {\n \"color\": \"#3fc453\",\n \"text\": \"UP\"\n },\n \"type\": \"special\"\n },\n {\n \"match\": {\n \"special\": 0\n },\n \"result\": {\n \"color\": \"#f80202\",\n \"text\": \"DOWN\"\n },\n \"type\": \"special\"\n }\n ]\n },\n \"overrides\": [\n {}\n ],\n \"targets\": [\n {\n \"expr\": \"up{job=\\\"scheduler\\\"}\",\n \"legend\": \"{{ instance }}\",\n \"refId\": \"A\"\n }\n ],\n \"type\": \"table\",\n \"version\": \"2.0.0\"\n },\n {\n \"custom\": {\n \"calc\": \"lastNotNull\",\n \"colorMode\": \"value\",\n \"displayMode\": \"seriesToRows\",\n \"showHeader\": true\n },\n \"datasourceCate\": \"prometheus\",\n \"datasourceValue\": \"${datasource}\",\n \"description\": \"scheduler 主从状态\",\n \"id\": \"62e3b249-fefe-4f32-8baf-394eac053f2a\",\n \"layout\": {\n \"h\": 6,\n \"i\": \"a5d1ef0c-83e3-4194-b242-d5c51ba4bdd2\",\n \"isResizable\": true,\n \"w\": 12,\n \"x\": 12,\n \"y\": 0\n },\n \"links\": [],\n \"name\": \"Scheduler - Member Status\",\n \"options\": {\n \"standardOptions\": {\n \"util\": \"none\"\n },\n \"valueMappings\": [\n {\n \"options\": {\n \"0\": {\n \"text\": \"DOWN\"\n },\n \"1\": {\n \"text\": \"UP\"\n }\n },\n \"result\": {\n \"text\": \"val2\"\n },\n \"type\": \"value\"\n },\n {\n \"match\": {\n \"special\": 1\n },\n \"result\": {\n \"color\": \"#3fc453\",\n \"text\": \"MASTER\"\n },\n \"type\": \"special\"\n },\n {\n \"match\": {\n \"special\": 0\n },\n \"result\": {\n \"color\": \"#9470ff\",\n \"text\": \"BACKUP\"\n },\n \"type\": \"special\"\n }\n ]\n },\n \"overrides\": [\n {\n \"properties\": {\n \"valueMappings\": []\n }\n }\n ],\n \"targets\": [\n {\n \"expr\": \"leader_election_master_status{job=\\\"scheduler\\\"}\",\n \"legend\": \"{{ instance }}\",\n \"refId\": \"A\"\n }\n ],\n \"type\": \"table\",\n \"version\": \"2.0.0\"\n },\n {\n \"custom\": {\n \"drawStyle\": \"lines\",\n \"fillOpacity\": 0.25,\n \"gradientMode\": \"none\",\n \"lineInterpolation\": \"smooth\",\n \"lineWidth\": 1,\n \"stack\": \"off\"\n },\n \"datasourceCate\": \"prometheus\",\n \"datasourceValue\": \"${datasource}\",\n \"description\": \"scheduler 请求量 按返回码统计\",\n \"id\": \"94713dc3-acb7-43b5-ae2f-399b2da61763\",\n \"layout\": {\n \"h\": 8,\n \"i\": \"94713dc3-acb7-43b5-ae2f-399b2da61763\",\n \"isResizable\": true,\n \"w\": 12,\n \"x\": 0,\n \"y\": 6\n },\n \"links\": [],\n \"name\": \"Scheduler - Requests by code\",\n \"options\": {\n \"legend\": {\n \"displayMode\": \"list\",\n \"placement\": \"bottom\"\n },\n \"standardOptions\": {\n \"util\": \"none\"\n },\n \"thresholds\": {\n \"steps\": []\n },\n \"tooltip\": {\n \"mode\": \"all\",\n \"sort\": \"desc\"\n }\n },\n \"targets\": [\n {\n \"expr\": \"sum(rate(rest_client_requests_total{job=\\\"scheduler\\\"}[5m])) by (instance,code)\",\n \"legend\": \"{{ instance }} {{ code }}\",\n \"refId\": \"A\"\n }\n ],\n \"type\": \"timeseries\",\n \"version\": \"2.0.0\"\n },\n {\n \"custom\": {\n \"drawStyle\": \"lines\",\n \"fillOpacity\": 0.25,\n \"gradientMode\": \"none\",\n \"lineInterpolation\": \"smooth\",\n \"lineWidth\": 1,\n \"stack\": \"off\"\n },\n \"datasourceCate\": \"prometheus\",\n \"datasourceValue\": \"${datasource}\",\n \"description\": \"scheduler请求量,按请求类型统计\",\n \"id\": \"a6928b49-cf0a-443e-a8fd-b999685df0be\",\n \"layout\": {\n \"h\": 8,\n \"i\": \"a6928b49-cf0a-443e-a8fd-b999685df0be\",\n \"isResizable\": true,\n \"w\": 12,\n \"x\": 12,\n \"y\": 6\n },\n \"links\": [],\n \"name\": \"Scheduler - Requests by verb\",\n \"options\": {\n \"legend\": {\n \"displayMode\": \"list\",\n \"placement\": \"bottom\"\n },\n \"standardOptions\": {\n \"util\": \"none\"\n },\n \"thresholds\": {\n \"steps\": []\n },\n \"tooltip\": {\n \"mode\": \"all\",\n \"sort\": \"desc\"\n }\n },\n \"targets\": [\n {\n \"expr\": \"sum(rate(rest_client_requests_total{job=\\\"scheduler\\\"}[5m])) by (instance,method)\",\n \"legend\": \"{{ instance }} {{ method }}\",\n \"refId\": \"A\"\n }\n ],\n \"type\": \"timeseries\",\n \"version\": \"2.0.0\"\n },\n {\n \"custom\": {\n \"drawStyle\": \"lines\",\n \"fillOpacity\": 0.25,\n \"gradientMode\": \"none\",\n \"lineInterpolation\": \"smooth\",\n \"lineWidth\": 1,\n \"stack\": \"off\"\n },\n \"datasourceCate\": \"prometheus\",\n \"datasourceValue\": \"${datasource}\",\n \"description\": \"scheduler请求(apiserver)量\",\n \"id\": \"69690063-d044-4547-9f5f-126e5f8bf55a\",\n \"layout\": {\n \"h\": 8,\n \"i\": \"69690063-d044-4547-9f5f-126e5f8bf55a\",\n \"isResizable\": true,\n \"w\": 12,\n \"x\": 0,\n \"y\": 14\n },\n \"links\": [],\n \"name\": \"Scheduler -Requests by instance\",\n \"options\": {\n \"legend\": {\n \"displayMode\": \"list\",\n \"placement\": \"bottom\"\n },\n \"standardOptions\": {\n \"util\": \"none\"\n },\n \"thresholds\": {\n \"steps\": []\n },\n \"tooltip\": {\n \"mode\": \"all\",\n \"sort\": \"desc\"\n }\n },\n \"targets\": [\n {\n \"expr\": \"sum(rate(rest_client_requests_total{job=\\\"scheduler\\\"}[5m])) by (instance)\",\n \"legend\": \"{{ instance }}\",\n \"refId\": \"A\"\n }\n ],\n \"type\": \"timeseries\",\n \"version\": \"2.0.0\"\n },\n {\n \"custom\": {\n \"drawStyle\": \"lines\",\n \"fillOpacity\": 0.25,\n \"gradientMode\": \"none\",\n \"lineInterpolation\": \"smooth\",\n \"lineWidth\": 1,\n \"stack\": \"off\"\n },\n \"datasourceCate\": \"prometheus\",\n \"datasourceValue\": \"${datasource}\",\n \"description\": \"scheduler 90分位请求延迟,按请求类型统计\",\n \"id\": \"053d10f3-1113-40e0-85aa-dfbabb706995\",\n \"layout\": {\n \"h\": 8,\n \"i\": \"d5a67103-9930-46e0-97e1-296e0d71e30e\",\n \"isResizable\": true,\n \"w\": 12,\n \"x\": 12,\n \"y\": 14\n },\n \"links\": [],\n \"name\": \"Scheduler - Requests Latancy by verb\",\n \"options\": {\n \"legend\": {\n \"displayMode\": \"list\",\n \"placement\": \"bottom\"\n },\n \"standardOptions\": {\n \"util\": \"milliseconds\"\n },\n \"thresholds\": {\n \"steps\": []\n },\n \"tooltip\": {\n \"mode\": \"all\",\n \"sort\": \"desc\"\n }\n },\n \"targets\": [\n {\n \"expr\": \"histogram_quantile(0.9, sum(rate(rest_client_request_duration_seconds_bucket{job=\\\"scheduler\\\"}[5m])) by (instance,verb,le))*1000\",\n \"legend\": \"{{ instance }} {{ verb }}\",\n \"refId\": \"A\"\n }\n ],\n \"type\": \"timeseries\",\n \"version\": \"2.0.0\"\n },\n {\n \"custom\": {\n \"drawStyle\": \"lines\",\n \"fillOpacity\": 0.25,\n \"gradientMode\": \"none\",\n \"lineInterpolation\": \"smooth\",\n \"lineWidth\": 1,\n \"stack\": \"off\"\n },\n \"datasourceCate\": \"prometheus\",\n \"datasourceValue\": \"${datasource}\",\n \"description\": \"scheduler 90分位请求延迟,按请求类型统计\",\n \"id\": \"c86ed101-a91c-4478-b67a-7182a5e856d1\",\n \"layout\": {\n \"h\": 8,\n \"i\": \"2924bb3f-20c3-4f56-96ff-76d473743d8b\",\n \"isResizable\": true,\n \"w\": 12,\n \"x\": 0,\n \"y\": 22\n },\n \"links\": [],\n \"name\": \"Scheduler - Requests Latancy by url\",\n \"options\": {\n \"legend\": {\n \"displayMode\": \"list\",\n \"placement\": \"bottom\"\n },\n \"standardOptions\": {\n \"util\": \"milliseconds\"\n },\n \"thresholds\": {\n \"steps\": []\n },\n \"tooltip\": {\n \"mode\": \"all\",\n \"sort\": \"desc\"\n }\n },\n \"targets\": [\n {\n \"expr\": \"histogram_quantile(0.9, sum(rate(rest_client_request_duration_seconds_bucket{job=\\\"scheduler\\\"}[5m])) by (instance,url,verb,le))*1000\",\n \"legend\": \"{{ instance }} {{ verb }} {{ url }}\",\n \"refId\": \"A\"\n }\n ],\n \"type\": \"timeseries\",\n \"version\": \"2.0.0\"\n },\n {\n \"custom\": {\n \"drawStyle\": \"lines\",\n \"fillOpacity\": 0.25,\n \"gradientMode\": \"none\",\n \"lineInterpolation\": \"smooth\",\n \"lineWidth\": 1,\n \"stack\": \"off\"\n },\n \"datasourceCate\": \"prometheus\",\n \"datasourceValue\": \"${datasource}\",\n \"description\": \"scheduler 90分位请求延迟,按实例统计\",\n \"id\": \"80bd434e-21dc-4864-97c6-bfd1e2e27bbe\",\n \"layout\": {\n \"h\": 8,\n \"i\": \"75671720-bca1-449f-9c68-bf562f105b66\",\n \"isResizable\": true,\n \"w\": 12,\n \"x\": 12,\n \"y\": 22\n },\n \"links\": [],\n \"name\": \"Scheduler - Requests Latancy by instance\",\n \"options\": {\n \"legend\": {\n \"displayMode\": \"list\",\n \"placement\": \"bottom\"\n },\n \"standardOptions\": {\n \"util\": \"milliseconds\"\n },\n \"thresholds\": {\n \"steps\": []\n },\n \"tooltip\": {\n \"mode\": \"all\",\n \"sort\": \"desc\"\n }\n },\n \"targets\": [\n {\n \"expr\": \"histogram_quantile(0.9, sum(rate(rest_client_request_duration_seconds_bucket{job=\\\"scheduler\\\"}[5m])) by (instance,le))*1000\",\n \"legend\": \"{{ instance }}\",\n \"refId\": \"A\"\n }\n ],\n \"type\": \"timeseries\",\n \"version\": \"2.0.0\"\n },\n {\n \"custom\": {\n \"drawStyle\": \"lines\",\n \"fillOpacity\": 0.25,\n \"gradientMode\": \"none\",\n \"lineInterpolation\": \"smooth\",\n \"lineWidth\": 1,\n \"stack\": \"off\"\n },\n \"datasourceCate\": \"prometheus\",\n \"datasourceValue\": \"${datasource}\",\n \"description\": \"scheduler请求5xx,按请求类型统计\",\n \"id\": \"32a09298-d0f8-4d54-808e-d223d0a428ff\",\n \"layout\": {\n \"h\": 8,\n \"i\": \"cfc389ad-5648-4107-a5bd-1680f6ede2ed\",\n \"isResizable\": true,\n \"w\": 12,\n \"x\": 0,\n \"y\": 30\n },\n \"links\": [],\n \"name\": \"Scheduler - Errors by verb\",\n \"options\": {\n \"legend\": {\n \"displayMode\": \"list\",\n \"placement\": \"bottom\"\n },\n \"standardOptions\": {\n \"util\": \"milliseconds\"\n },\n \"thresholds\": {\n \"steps\": []\n },\n \"tooltip\": {\n \"mode\": \"all\",\n \"sort\": \"desc\"\n }\n },\n \"targets\": [\n {\n \"expr\": \"sum by(instance,method) (rate(rest_client_requests_total{code=~\\\"5..\\\",job=\\\"scheduler\\\"}[5m]))\\n / sum by(instance,method) (rate(rest_client_requests_total{job=\\\"scheduler\\\"}[5m]))\",\n \"legend\": \"{{ instance }} {{ method }}\",\n \"refId\": \"A\"\n }\n ],\n \"type\": \"timeseries\",\n \"version\": \"2.0.0\"\n },\n {\n \"custom\": {\n \"drawStyle\": \"lines\",\n \"fillOpacity\": 0.25,\n \"gradientMode\": \"none\",\n \"lineInterpolation\": \"smooth\",\n \"lineWidth\": 1,\n \"stack\": \"off\"\n },\n \"datasourceCate\": \"prometheus\",\n \"datasourceValue\": \"${datasource}\",\n \"description\": \"scheduler请求5xx,按实例统计\",\n \"id\": \"b6931f1f-6c43-478e-bcc7-26d1b121bceb\",\n \"layout\": {\n \"h\": 8,\n \"i\": \"152b5817-ad87-44d0-a71f-5fbd0fc10ca3\",\n \"isResizable\": true,\n \"w\": 12,\n \"x\": 12,\n \"y\": 30\n },\n \"links\": [],\n \"name\": \"Scheduler - Errors by instance\",\n \"options\": {\n \"legend\": {\n \"displayMode\": \"list\",\n \"placement\": \"bottom\"\n },\n \"standardOptions\": {\n \"util\": \"milliseconds\"\n },\n \"thresholds\": {\n \"steps\": []\n },\n \"tooltip\": {\n \"mode\": \"all\",\n \"sort\": \"desc\"\n }\n },\n \"targets\": [\n {\n \"expr\": \"sum by(instance) (rate(rest_client_requests_total{code=~\\\"5..\\\",job=\\\"scheduler\\\"}[5m]))\\n / sum by(instance) (rate(rest_client_requests_total{job=\\\"scheduler\\\"}[5m]))\",\n \"legend\": \"{{ instance }}\",\n \"refId\": \"A\"\n }\n ],\n \"type\": \"timeseries\",\n \"version\": \"2.0.0\"\n },\n {\n \"custom\": {\n \"drawStyle\": \"lines\",\n \"fillOpacity\": 0.25,\n \"gradientMode\": \"none\",\n \"lineInterpolation\": \"smooth\",\n \"lineWidth\": 1,\n \"stack\": \"off\"\n },\n \"datasourceCate\": \"prometheus\",\n \"datasourceValue\": \"${datasource}\",\n \"description\": \"pod进入调度队列的平均速率\",\n \"id\": \"0c8ac9ee-2a3e-4e7e-b338-748d79f6cbb6\",\n \"layout\": {\n \"h\": 8,\n \"i\": \"0c8ac9ee-2a3e-4e7e-b338-748d79f6cbb6\",\n \"isResizable\": true,\n \"w\": 12,\n \"x\": 0,\n \"y\": 38\n },\n \"links\": [],\n \"name\": \"Scheduler - Average Enqueue Rate by instance\",\n \"options\": {\n \"legend\": {\n \"displayMode\": \"list\",\n \"placement\": \"bottom\"\n },\n \"standardOptions\": {\n \"util\": \"none\"\n },\n \"thresholds\": {\n \"steps\": []\n },\n \"tooltip\": {\n \"mode\": \"all\",\n \"sort\": \"desc\"\n }\n },\n \"targets\": [\n {\n \"expr\": \"avg(rate(scheduler_queue_incoming_pods_total{job=\\\"scheduler\\\"}[5m])) by (instance)\",\n \"legend\": \"{{ instance }}\",\n \"refId\": \"A\"\n }\n ],\n \"type\": \"timeseries\",\n \"version\": \"2.0.0\"\n },\n {\n \"custom\": {\n \"drawStyle\": \"lines\",\n \"fillOpacity\": 0.25,\n \"gradientMode\": \"none\",\n \"lineInterpolation\": \"smooth\",\n \"lineWidth\": 1,\n \"stack\": \"off\"\n },\n \"datasourceCate\": \"prometheus\",\n \"datasourceValue\": \"${datasource}\",\n \"description\": \"调度器驱逐容器的次数\",\n \"id\": \"ed72c89c-9732-4fb0-9187-0cabe9a4a81c\",\n \"layout\": {\n \"h\": 8,\n \"i\": \"730be715-cfdd-4f2a-b878-1b2fb9a9be45\",\n \"isResizable\": true,\n \"w\": 12,\n \"x\": 12,\n \"y\": 38\n },\n \"links\": [],\n \"name\": \"Scheduler - Preemption Attempts Total by instance\",\n \"options\": {\n \"legend\": {\n \"displayMode\": \"list\",\n \"placement\": \"bottom\"\n },\n \"standardOptions\": {\n \"util\": \"none\"\n },\n \"thresholds\": {\n \"steps\": []\n },\n \"tooltip\": {\n \"mode\": \"all\",\n \"sort\": \"desc\"\n }\n },\n \"targets\": [\n {\n \"expr\": \"avg(rate(scheduler_preemption_attempts_total{job=\\\"scheduler\\\"}[5m])) by (instance)\",\n \"legend\": \"{{ instance }}\",\n \"refId\": \"A\"\n }\n ],\n \"type\": \"timeseries\",\n \"version\": \"2.0.0\"\n },\n {\n \"custom\": {\n \"drawStyle\": \"lines\",\n \"fillOpacity\": 0.25,\n \"gradientMode\": \"none\",\n \"lineInterpolation\": \"smooth\",\n \"lineWidth\": 1,\n \"stack\": \"off\"\n },\n \"datasourceCate\": \"prometheus\",\n \"datasourceValue\": \"${datasource}\",\n \"description\": \"调度器cache中pod node和已绑定pod的数量\",\n \"id\": \"dd189a18-704b-44c0-8a8b-186ccc591c81\",\n \"layout\": {\n \"h\": 8,\n \"i\": \"668362fe-211a-4286-861c-eeb90907b2fb\",\n \"isResizable\": true,\n \"w\": 12,\n \"x\": 0,\n \"y\": 46\n },\n \"links\": [],\n \"name\": \"Scheduler - Cache Size\",\n \"options\": {\n \"legend\": {\n \"displayMode\": \"list\",\n \"placement\": \"bottom\"\n },\n \"standardOptions\": {\n \"util\": \"none\"\n },\n \"thresholds\": {\n \"steps\": []\n },\n \"tooltip\": {\n \"mode\": \"all\",\n \"sort\": \"desc\"\n }\n },\n \"targets\": [\n {\n \"expr\": \" scheduler_scheduler_cache_size{job=\\\"scheduler\\\"}\",\n \"legend\": \"{{ instance }} {{ type }}\",\n \"refId\": \"A\"\n }\n ],\n \"type\": \"timeseries\",\n \"version\": \"2.0.0\"\n },\n {\n \"custom\": {\n \"drawStyle\": \"lines\",\n \"fillOpacity\": 0.25,\n \"gradientMode\": \"none\",\n \"lineInterpolation\": \"smooth\",\n \"lineWidth\": 1,\n \"stack\": \"off\"\n },\n \"datasourceCate\": \"prometheus\",\n \"datasourceValue\": \"${datasource}\",\n \"description\": \"调度队列中pending pod的数目\",\n \"id\": \"0e231e69-4651-4728-abcb-46fafd1a7d61\",\n \"layout\": {\n \"h\": 8,\n \"i\": \"f20223e4-199a-4b08-b5f0-470ac1974afc\",\n \"isResizable\": true,\n \"w\": 12,\n \"x\": 12,\n \"y\": 46\n },\n \"links\": [],\n \"name\": \"Scheduler - Pending Pod\",\n \"options\": {\n \"legend\": {\n \"displayMode\": \"list\",\n \"placement\": \"bottom\"\n },\n \"standardOptions\": {\n \"util\": \"none\"\n },\n \"thresholds\": {\n \"steps\": []\n },\n \"tooltip\": {\n \"mode\": \"all\",\n \"sort\": \"desc\"\n }\n },\n \"targets\": [\n {\n \"expr\": \"scheduler_pending_pods{job=\\\"scheduler\\\"}\",\n \"legend\": \"{{ instance }} {{ queue }}\",\n \"refId\": \"A\"\n }\n ],\n \"type\": \"timeseries\",\n \"version\": \"2.0.0\"\n },\n {\n \"custom\": {\n \"drawStyle\": \"lines\",\n \"fillOpacity\": 0.25,\n \"gradientMode\": \"none\",\n \"lineInterpolation\": \"smooth\",\n \"lineWidth\": 1,\n \"stack\": \"off\"\n },\n \"datasourceCate\": \"prometheus\",\n \"datasourceValue\": \"${datasource}\",\n \"description\": \"调度插件在每个扩展点的执行时间,90分位\",\n \"id\": \"51cb0215-0827-4543-bb58-64eaec6cdc77\",\n \"layout\": {\n \"h\": 8,\n \"i\": \"ec0db15d-fa63-4448-a961-0b8a7b977dd0\",\n \"isResizable\": true,\n \"w\": 12,\n \"x\": 0,\n \"y\": 54\n },\n \"links\": [],\n \"name\": \"Scheduler - Plugin Execution Duration by plugin\",\n \"options\": {\n \"legend\": {\n \"displayMode\": \"list\",\n \"placement\": \"bottom\"\n },\n \"standardOptions\": {\n \"util\": \"milliseconds\"\n },\n \"thresholds\": {\n \"steps\": []\n },\n \"tooltip\": {\n \"mode\": \"all\",\n \"sort\": \"desc\"\n }\n },\n \"targets\": [\n {\n \"expr\": \"histogram_quantile(0.9, sum(rate(scheduler_plugin_execution_duration_seconds_bucket{job=\\\"scheduler\\\"}[5m])) by (instance,extension_point,plugin,status,le))*1000\",\n \"legend\": \"{{ instance }} {{ plugin }} {{ extension_point }} {{ status }}\",\n \"refId\": \"A\"\n }\n ],\n \"type\": \"timeseries\",\n \"version\": \"2.0.0\"\n },\n {\n \"custom\": {\n \"drawStyle\": \"lines\",\n \"fillOpacity\": 0.25,\n \"gradientMode\": \"none\",\n \"lineInterpolation\": \"smooth\",\n \"lineWidth\": 1,\n \"stack\": \"off\"\n },\n \"datasourceCate\": \"prometheus\",\n \"datasourceValue\": \"${datasource}\",\n \"description\": \"调度算法90分位耗时\",\n \"id\": \"bf41347e-c307-4ae1-84d8-6202b563837f\",\n \"layout\": {\n \"h\": 8,\n \"i\": \"c5c557a6-0f48-4154-91f7-30a300f00813\",\n \"isResizable\": true,\n \"w\": 12,\n \"x\": 12,\n \"y\": 54\n },\n \"links\": [],\n \"name\": \"Scheduler - Scheduling Algorithm Duration by instance\",\n \"options\": {\n \"legend\": {\n \"displayMode\": \"list\",\n \"placement\": \"bottom\"\n },\n \"standardOptions\": {\n \"util\": \"milliseconds\"\n },\n \"thresholds\": {\n \"steps\": []\n },\n \"tooltip\": {\n \"mode\": \"all\",\n \"sort\": \"desc\"\n }\n },\n \"targets\": [\n {\n \"expr\": \"histogram_quantile(0.9, sum (rate(scheduler_scheduling_algorithm_duration_seconds_bucket{job=\\\"scheduler\\\"}[5m])) by (instance,le))*1000\",\n \"legend\": \"{{ instance }} \",\n \"refId\": \"B\"\n }\n ],\n \"type\": \"timeseries\",\n \"version\": \"2.0.0\"\n },\n {\n \"custom\": {\n \"drawStyle\": \"lines\",\n \"fillOpacity\": 0.25,\n \"gradientMode\": \"none\",\n \"lineInterpolation\": \"smooth\",\n \"lineWidth\": 1,\n \"stack\": \"off\"\n },\n \"datasourceCate\": \"prometheus\",\n \"datasourceValue\": \"${datasource}\",\n \"description\": \"调度算法+绑定 90分位耗时\",\n \"id\": \"4f2de85b-7fa7-4e06-bcbf-7362fa71f010\",\n \"layout\": {\n \"h\": 8,\n \"i\": \"68585816-6a08-422d-a7d3-c414ae427380\",\n \"isResizable\": true,\n \"w\": 12,\n \"x\": 0,\n \"y\": 62\n },\n \"links\": [],\n \"name\": \"Scheduler - Scheduling Duration by instance\",\n \"options\": {\n \"legend\": {\n \"displayMode\": \"list\",\n \"placement\": \"bottom\"\n },\n \"standardOptions\": {\n \"util\": \"milliseconds\"\n },\n \"thresholds\": {\n \"steps\": []\n },\n \"tooltip\": {\n \"mode\": \"all\",\n \"sort\": \"desc\"\n }\n },\n \"targets\": [\n {\n \"expr\": \"histogram_quantile(0.9, sum(rate(scheduler_scheduling_attempt_duration_seconds_bucket{job=\\\"scheduler\\\"}[5m])) by (instance,le,profile,result))*1000\",\n \"legend\": \"{{ instance }} {{ profile }} {{ result }}\",\n \"refId\": \"A\"\n }\n ],\n \"type\": \"timeseries\",\n \"version\": \"2.0.0\"\n },\n {\n \"custom\": {\n \"drawStyle\": \"lines\",\n \"fillOpacity\": 0.25,\n \"gradientMode\": \"none\",\n \"lineInterpolation\": \"smooth\",\n \"lineWidth\": 1,\n \"stack\": \"off\"\n },\n \"datasourceCate\": \"prometheus\",\n \"datasourceValue\": \"${datasource}\",\n \"description\": \"scheduler cpu使用率\",\n \"id\": \"9c187c1c-f5cd-4aab-af81-09169948ab82\",\n \"layout\": {\n \"h\": 8,\n \"i\": \"9c187c1c-f5cd-4aab-af81-09169948ab82\",\n \"isResizable\": true,\n \"w\": 12,\n \"x\": 12,\n \"y\": 62\n },\n \"links\": [],\n \"name\": \"Scheduler - CPU Usage by instance\",\n \"options\": {\n \"legend\": {\n \"displayMode\": \"list\",\n \"placement\": \"bottom\"\n },\n \"standardOptions\": {\n \"decimals\": 2,\n \"util\": \"percentUnit\"\n },\n \"thresholds\": {\n \"steps\": []\n },\n \"tooltip\": {\n \"mode\": \"all\",\n \"sort\": \"desc\"\n }\n },\n \"targets\": [\n {\n \"expr\": \"rate(process_cpu_seconds_total{job=\\\"scheduler\\\"}[5m])\",\n \"legend\": \"{{ instance }}\",\n \"refId\": \"A\"\n }\n ],\n \"type\": \"timeseries\",\n \"version\": \"2.0.0\"\n },\n {\n \"custom\": {\n \"drawStyle\": \"lines\",\n \"fillOpacity\": 0.25,\n \"gradientMode\": \"none\",\n \"lineInterpolation\": \"smooth\",\n \"lineWidth\": 1,\n \"stack\": \"off\"\n },\n \"datasourceCate\": \"prometheus\",\n \"datasourceValue\": \"${datasource}\",\n \"description\": \"scheduler 内存使用量\",\n \"id\": \"8cff2618-b2d4-4fb4-bfc2-d1d4c4f1b35c\",\n \"layout\": {\n \"h\": 8,\n \"i\": \"8cff2618-b2d4-4fb4-bfc2-d1d4c4f1b35c\",\n \"isResizable\": true,\n \"w\": 12,\n \"x\": 0,\n \"y\": 70\n },\n \"links\": [],\n \"name\": \"Scheduler - Memory Usage by instance\",\n \"options\": {\n \"legend\": {\n \"displayMode\": \"list\",\n \"placement\": \"bottom\"\n },\n \"standardOptions\": {\n \"util\": \"bytesIEC\"\n },\n \"thresholds\": {\n \"steps\": []\n },\n \"tooltip\": {\n \"mode\": \"all\",\n \"sort\": \"desc\"\n }\n },\n \"targets\": [\n {\n \"expr\": \"process_resident_memory_bytes{job=\\\"scheduler\\\"}\",\n \"legend\": \"{{ instance }}\",\n \"refId\": \"A\"\n }\n ],\n \"type\": \"timeseries\",\n \"version\": \"2.0.0\"\n },\n {\n \"custom\": {\n \"drawStyle\": \"lines\",\n \"fillOpacity\": 0.25,\n \"gradientMode\": \"none\",\n \"lineInterpolation\": \"smooth\",\n \"lineWidth\": 1,\n \"stack\": \"off\"\n },\n \"datasourceCate\": \"prometheus\",\n \"datasourceValue\": \"${datasource}\",\n \"description\": \"scheduler打开的fd数量\",\n \"id\": \"94bb09a7-dbf7-41d8-b6a4-16b262365474\",\n \"layout\": {\n \"h\": 8,\n \"i\": \"e438aed2-6d4a-4254-a8ec-26752385dc74\",\n \"isResizable\": true,\n \"w\": 12,\n \"x\": 12,\n \"y\": 70\n },\n \"links\": [],\n \"name\": \"Scheduler - Open fds by instance\",\n \"options\": {\n \"legend\": {\n \"displayMode\": \"list\"\n },\n \"standardOptions\": {\n \"util\": \"none\"\n },\n \"thresholds\": {\n \"steps\": []\n },\n \"tooltip\": {\n \"mode\": \"all\",\n \"sort\": \"desc\"\n }\n },\n \"targets\": [\n {\n \"expr\": \"process_open_fds{job=\\\"scheduler\\\"}\",\n \"legend\": \"{{ instance }}\",\n \"refId\": \"A\"\n }\n ],\n \"type\": \"timeseries\",\n \"version\": \"2.0.0\"\n }\n ],\n \"var\": [\n {\n \"definition\": \"prometheus\",\n \"name\": \"datasource\",\n \"type\": \"datasource\"\n }\n ],\n \"version\": \"3.0.0\"\n },\n \"public\": 0,\n \"public_cate\": 0,\n \"bgids\": null,\n \"built_in\": 0,\n \"hide\": 0,\n \"uuid\": 1717556327691577000\n}"
},
{
"path": "integrations/Kubernetes/dashboards/StatefulsetContainer.json",
"content": "{\n \"name\": \"Kubernetes / Statefulset / Container \",\n \"tags\": \"Categraf\",\n \"configs\": {\n \"panels\": [\n {\n \"collapsed\": true,\n \"id\": \"79d7e3b0-b64f-4591-b5dd-994ce16b68ca\",\n \"layout\": {\n \"h\": 1,\n \"i\": \"79d7e3b0-b64f-4591-b5dd-994ce16b68ca\",\n \"isResizable\": false,\n \"w\": 24,\n \"x\": 0,\n \"y\": 0\n },\n \"name\": \"整体概况\",\n \"type\": \"row\"\n },\n {\n \"custom\": {\n \"drawStyle\": \"lines\",\n \"fillOpacity\": 0.5,\n \"lineInterpolation\": \"smooth\",\n \"stack\": \"off\"\n },\n \"datasourceCate\": \"prometheus\",\n \"datasourceValue\": \"${datasource}\",\n \"description\": \"容器1min CPU平均使用率,如果pod内有多个容器,会分别显示各个容器CPU使用率(pause容器默认不会显示);如果容器配置了4核,使用率400%表示当前用满4核,容器配置2核,使用率200%表示当前用满2核。\",\n \"id\": \"860c1484-1f83-497e-a061-a50fbb3ff1dc\",\n \"layout\": {\n \"h\": 7,\n \"i\": \"860c1484-1f83-497e-a061-a50fbb3ff1dc\",\n \"isResizable\": true,\n \"w\": 6,\n \"x\": 0,\n \"y\": 1\n },\n \"name\": \"容器CPU使用率\",\n \"options\": {\n \"legend\": {\n \"displayMode\": \"hidden\"\n },\n \"standardOptions\": {\n \"max\": null,\n \"min\": 0,\n \"util\": \"percent\"\n },\n \"thresholds\": {},\n \"tooltip\": {\n \"mode\": \"all\",\n \"sort\": \"none\"\n }\n },\n \"targets\": [\n {\n \"expr\": \"sum(rate(container_cpu_usage_seconds_total{pod=\\\"$pod_name\\\", image!~\\\".*pause.*\\\"}[1m])*100) by(name)\",\n \"legend\": \"\",\n \"refId\": \"A\"\n }\n ],\n \"type\": \"timeseries\",\n \"version\": \"2.0.0\"\n },\n {\n \"custom\": {\n \"drawStyle\": \"lines\",\n \"fillOpacity\": 0.5,\n \"lineInterpolation\": \"smooth\",\n \"stack\": \"off\"\n },\n \"datasourceCate\": \"prometheus\",\n \"datasourceValue\": \"${datasource}\",\n \"description\": \"容器1min CPU平均使用率,如果pod内有多个容器,会分别显示各个容器CPU使用率(pause容器默认不会显示);如果容器配置了4核,使用率100%表示当前用满4核,容器配置2核,使用率100%表示当前用满2核,如果容器没有配置cpu limit,则不会显示该数值\",\n \"id\": \"bb66b2cc-3658-4cae-817a-61ec3fbb93e4\",\n \"layout\": {\n \"h\": 7,\n \"i\": \"bb66b2cc-3658-4cae-817a-61ec3fbb93e4\",\n \"isResizable\": true,\n \"w\": 6,\n \"x\": 6,\n \"y\": 1\n },\n \"name\": \"容器CPU归一化后使用率\",\n \"options\": {\n \"legend\": {\n \"displayMode\": \"hidden\"\n },\n \"standardOptions\": {\n \"max\": null,\n \"min\": 0,\n \"util\": \"percent\"\n },\n \"thresholds\": {},\n \"tooltip\": {\n \"mode\": \"all\",\n \"sort\": \"none\"\n }\n },\n \"targets\": [\n {\n \"expr\": \"sum(rate(container_cpu_usage_seconds_total{pod=\\\"$pod_name\\\", image!~\\\".*pause.*\\\"}[1m])*100) by(name)/((sum(container_spec_cpu_quota{pod=\\\"$pod_name\\\"}/container_spec_cpu_period{pod=\\\"$pod_name\\\"}) by (name)))\",\n \"legend\": \"\",\n \"refId\": \"A\"\n }\n ],\n \"type\": \"timeseries\",\n \"version\": \"2.0.0\"\n },\n {\n \"custom\": {\n \"drawStyle\": \"lines\",\n \"fillOpacity\": 0.5,\n \"lineInterpolation\": \"smooth\",\n \"stack\": \"off\"\n },\n \"datasourceCate\": \"prometheus\",\n \"datasourceValue\": \"${datasource}\",\n \"description\": \"container_memory_rss + container_memory_cache + container_memory_swap + kernel memory\",\n \"id\": \"4d5f9cbb-3b78-4fe6-8a4e-59ca52a49666\",\n \"layout\": {\n \"h\": 7,\n \"i\": \"4d5f9cbb-3b78-4fe6-8a4e-59ca52a49666\",\n \"isResizable\": true,\n \"w\": 6,\n \"x\": 12,\n \"y\": 1\n },\n \"name\": \"容器内存使用\",\n \"options\": {\n \"legend\": {\n \"displayMode\": \"hidden\"\n },\n \"standardOptions\": {\n \"max\": null,\n \"util\": \"bytesIEC\"\n },\n \"thresholds\": {},\n \"tooltip\": {\n \"mode\": \"all\",\n \"sort\": \"none\"\n }\n },\n \"targets\": [\n {\n \"expr\": \"(sum(container_memory_usage_bytes{pod=\\\"$pod_name\\\", image!~\\\".*pause.*\\\"}) by (name)) \",\n \"refId\": \"A\"\n }\n ],\n \"type\": \"timeseries\",\n \"version\": \"2.0.0\"\n },\n {\n \"custom\": {\n \"drawStyle\": \"lines\",\n \"fillOpacity\": 0.5,\n \"lineInterpolation\": \"smooth\",\n \"stack\": \"off\"\n },\n \"datasourceCate\": \"prometheus\",\n \"datasourceValue\": \"${datasource}\",\n \"description\": \"\",\n \"id\": \"978e93a0-770e-42f5-a374-cafb5b4fc585\",\n \"layout\": {\n \"h\": 7,\n \"i\": \"978e93a0-770e-42f5-a374-cafb5b4fc585\",\n \"isResizable\": true,\n \"w\": 6,\n \"x\": 18,\n \"y\": 1\n },\n \"name\": \"文件系统写入速率\",\n \"options\": {\n \"legend\": {\n \"displayMode\": \"hidden\"\n },\n \"standardOptions\": {\n \"max\": null,\n \"min\": 0,\n \"util\": \"bytesIEC\"\n },\n \"thresholds\": {},\n \"tooltip\": {\n \"mode\": \"all\",\n \"sort\": \"none\"\n }\n },\n \"targets\": [\n {\n \"expr\": \"sum(rate(container_fs_writes_bytes_total{pod=\\\"$pod_name\\\", image!~\\\".*pause.*\\\"}[1m])) by(name)\",\n \"legend\": \"\",\n \"refId\": \"A\"\n }\n ],\n \"type\": \"timeseries\",\n \"version\": \"2.0.0\"\n },\n {\n \"custom\": {\n \"drawStyle\": \"lines\",\n \"fillOpacity\": 0.5,\n \"lineInterpolation\": \"smooth\",\n \"stack\": \"off\"\n },\n \"datasourceCate\": \"prometheus\",\n \"datasourceValue\": \"${datasource}\",\n \"description\": \"\",\n \"id\": \"f385736d-fd05-4705-a27d-41e67fb6c843\",\n \"layout\": {\n \"h\": 7,\n \"i\": \"f385736d-fd05-4705-a27d-41e67fb6c843\",\n \"isResizable\": true,\n \"w\": 6,\n \"x\": 0,\n \"y\": 8\n },\n \"name\": \"文件系统读取速率\",\n \"options\": {\n \"legend\": {\n \"displayMode\": \"hidden\"\n },\n \"standardOptions\": {\n \"max\": null,\n \"min\": 0,\n \"util\": \"bytesIEC\"\n },\n \"thresholds\": {},\n \"tooltip\": {\n \"mode\": \"all\",\n \"sort\": \"none\"\n }\n },\n \"targets\": [\n {\n \"expr\": \"sum(rate(container_fs_reads_bytes_total{pod=\\\"$pod_name\\\", image!~\\\".*pause.*\\\"}[1m])) by(name)\",\n \"legend\": \"\",\n \"refId\": \"A\"\n }\n ],\n \"type\": \"timeseries\",\n \"version\": \"2.0.0\"\n },\n {\n \"custom\": {\n \"drawStyle\": \"lines\",\n \"fillOpacity\": 0.5,\n \"lineInterpolation\": \"smooth\",\n \"stack\": \"off\"\n },\n \"datasourceCate\": \"prometheus\",\n \"datasourceValue\": \"${datasource}\",\n \"description\": \"容器网络发送的字节数(1 分钟内)\",\n \"id\": \"f9b140e8-0b44-4b32-9d54-9360b06faa48\",\n \"layout\": {\n \"h\": 7,\n \"i\": \"f9b140e8-0b44-4b32-9d54-9360b06faa48\",\n \"isResizable\": true,\n \"w\": 6,\n \"x\": 6,\n \"y\": 8\n },\n \"name\": \"网络发送速率\",\n \"options\": {\n \"legend\": {\n \"displayMode\": \"hidden\"\n },\n \"standardOptions\": {\n \"util\": \"bytesIEC\"\n },\n \"thresholds\": {},\n \"tooltip\": {\n \"mode\": \"all\",\n \"sort\": \"none\"\n }\n },\n \"targets\": [\n {\n \"expr\": \"sum(rate(container_network_transmit_bytes_total{pod=\\\"$pod_name\\\"}[1m])) by(name, interface)\",\n \"refId\": \"A\"\n }\n ],\n \"type\": \"timeseries\",\n \"version\": \"2.0.0\"\n },\n {\n \"custom\": {\n \"drawStyle\": \"lines\",\n \"fillOpacity\": 0.5,\n \"lineInterpolation\": \"smooth\",\n \"stack\": \"off\"\n },\n \"datasourceCate\": \"prometheus\",\n \"datasourceValue\": \"${datasource}\",\n \"description\": \"容器网络接收的字节数(1 分钟内)\",\n \"id\": \"8f98a264-7058-4fa0-8efc-3c87954a0370\",\n \"layout\": {\n \"h\": 7,\n \"i\": \"8f98a264-7058-4fa0-8efc-3c87954a0370\",\n \"isResizable\": true,\n \"w\": 6,\n \"x\": 12,\n \"y\": 8\n },\n \"name\": \"网络接收速率\",\n \"options\": {\n \"legend\": {\n \"displayMode\": \"hidden\"\n },\n \"standardOptions\": {\n \"util\": \"bytesIEC\"\n },\n \"thresholds\": {},\n \"tooltip\": {\n \"mode\": \"all\",\n \"sort\": \"none\"\n }\n },\n \"targets\": [\n {\n \"expr\": \"sum(rate(container_network_receive_bytes_total{pod=\\\"$pod_name\\\"}[1m])) by(name, interface)\",\n \"refId\": \"A\"\n }\n ],\n \"type\": \"timeseries\",\n \"version\": \"2.0.0\"\n },\n {\n \"custom\": {\n \"calc\": \"lastNotNull\",\n \"colSpan\": 1,\n \"colorMode\": \"value\",\n \"textMode\": \"valueAndName\",\n \"textSize\": {}\n },\n \"datasourceCate\": \"prometheus\",\n \"datasourceValue\": \"${datasource}\",\n \"id\": \"1868973e-c3d3-4fd4-83b0-36ec2e06dfe0\",\n \"layout\": {\n \"h\": 7,\n \"i\": \"1868973e-c3d3-4fd4-83b0-36ec2e06dfe0\",\n \"isResizable\": true,\n \"w\": 6,\n \"x\": 18,\n \"y\": 8\n },\n \"name\": \"容器启动时长(小时)\",\n \"options\": {\n \"standardOptions\": {\n \"util\": \"humantimeSeconds\"\n }\n },\n \"targets\": [\n {\n \"expr\": \"sum((time()-container_start_time_seconds{pod=\\\"$pod_name\\\", image!~\\\".*pause.*\\\"})) by (name)\",\n \"refId\": \"A\"\n }\n ],\n \"type\": \"stat\",\n \"version\": \"2.0.0\"\n },\n {\n \"collapsed\": true,\n \"id\": \"8a4942a2-81a3-4473-81be-79b3541e09a3\",\n \"layout\": {\n \"h\": 1,\n \"i\": \"8a4942a2-81a3-4473-81be-79b3541e09a3\",\n \"isResizable\": false,\n \"w\": 24,\n \"x\": 0,\n \"y\": 15\n },\n \"name\": \"CPU\",\n \"type\": \"row\"\n },\n {\n \"custom\": {\n \"drawStyle\": \"lines\",\n \"fillOpacity\": 0.5,\n \"lineInterpolation\": \"smooth\",\n \"stack\": \"off\"\n },\n \"datasourceCate\": \"prometheus\",\n \"datasourceValue\": \"${datasource}\",\n \"description\": \"容器1min CPU平均使用率,如果pod内有多个容器,会分别显示各个容器CPU使用率(pause容器默认不会显示);如果容器配置了4核,使用率400%表示当前用满4核,容器配置2核,使用率200%表示当前用满2核。\",\n \"id\": \"54650fe9-007f-4b16-a523-baf2e91ef823\",\n \"layout\": {\n \"h\": 7,\n \"i\": \"54650fe9-007f-4b16-a523-baf2e91ef823\",\n \"isResizable\": true,\n \"w\": 6,\n \"x\": 0,\n \"y\": 16\n },\n \"name\": \"容器CPU使用率\",\n \"options\": {\n \"legend\": {\n \"displayMode\": \"hidden\"\n },\n \"standardOptions\": {\n \"max\": null,\n \"util\": \"percent\"\n },\n \"thresholds\": {},\n \"tooltip\": {\n \"mode\": \"all\",\n \"sort\": \"none\"\n }\n },\n \"targets\": [\n {\n \"expr\": \"sum(rate(container_cpu_usage_seconds_total{pod=\\\"$pod_name\\\", image!~\\\".*pause.*\\\"}[1m])*100) by(name)\",\n \"refId\": \"A\"\n }\n ],\n \"type\": \"timeseries\",\n \"version\": \"2.0.0\"\n },\n {\n \"custom\": {\n \"drawStyle\": \"lines\",\n \"fillOpacity\": 0.5,\n \"lineInterpolation\": \"smooth\",\n \"stack\": \"off\"\n },\n \"datasourceCate\": \"prometheus\",\n \"datasourceValue\": \"${datasource}\",\n \"description\": \"容器1min CPU平均使用率,如果pod内有多个容器,会分别显示各个容器CPU使用率(pause容器默认不会显示);如果容器配置了4核,使用率100%表示当前用满4核,容器配置2核,使用率100%表示当前用满2核,如果容器没有配置cpu limit,则不会显示该数值\",\n \"id\": \"715c1e5a-c504-4f2c-a790-dad1c73aae29\",\n \"layout\": {\n \"h\": 7,\n \"i\": \"715c1e5a-c504-4f2c-a790-dad1c73aae29\",\n \"isResizable\": true,\n \"w\": 6,\n \"x\": 6,\n \"y\": 16\n },\n \"name\": \"容器CPU归一化后使用率\",\n \"options\": {\n \"legend\": {\n \"displayMode\": \"hidden\"\n },\n \"standardOptions\": {\n \"max\": null,\n \"util\": \"percent\"\n },\n \"thresholds\": {},\n \"tooltip\": {\n \"mode\": \"all\",\n \"sort\": \"none\"\n }\n },\n \"targets\": [\n {\n \"expr\": \"sum(rate(container_cpu_usage_seconds_total{pod=\\\"$pod_name\\\", image!~\\\".*pause.*\\\"}[1m])*100) by(name)/((sum(container_spec_cpu_quota{pod=\\\"$pod_name\\\"}/container_spec_cpu_period{pod=\\\"$pod_name\\\"}) by (name)))\",\n \"refId\": \"A\"\n }\n ],\n \"type\": \"timeseries\",\n \"version\": \"2.0.0\"\n },\n {\n \"custom\": {\n \"drawStyle\": \"lines\",\n \"fillOpacity\": 0.5,\n \"lineInterpolation\": \"smooth\",\n \"stack\": \"off\"\n },\n \"datasourceCate\": \"prometheus\",\n \"datasourceValue\": \"${datasource}\",\n \"description\": \"容器1min 内核态CPU平均使用率,如果pod内有多个容器,会分别显示各个容器内核态CPU使用率(pause容器默认不会显示);如果容器配置了4核,使用率400%表示当前内核态用满4核,容器配置2核,使用率200%表示当前内核态用满2核。\",\n \"id\": \"d23a509d-3bb0-4680-b579-b89a411830a4\",\n \"layout\": {\n \"h\": 7,\n \"i\": \"d23a509d-3bb0-4680-b579-b89a411830a4\",\n \"isResizable\": true,\n \"w\": 6,\n \"x\": 12,\n \"y\": 16\n },\n \"name\": \"容器内核态CPU使用率\",\n \"options\": {\n \"legend\": {\n \"displayMode\": \"hidden\"\n },\n \"standardOptions\": {\n \"max\": null,\n \"util\": \"percent\"\n },\n \"thresholds\": {},\n \"tooltip\": {\n \"mode\": \"all\",\n \"sort\": \"none\"\n }\n },\n \"targets\": [\n {\n \"expr\": \"sum(rate(container_cpu_system_seconds_total{pod=\\\"$pod_name\\\", image!~\\\".*pause.*\\\"}[1m])*100) by(name)\",\n \"refId\": \"A\"\n }\n ],\n \"type\": \"timeseries\",\n \"version\": \"2.0.0\"\n },\n {\n \"custom\": {\n \"drawStyle\": \"lines\",\n \"fillOpacity\": 0.5,\n \"lineInterpolation\": \"smooth\",\n \"stack\": \"off\"\n },\n \"datasourceCate\": \"prometheus\",\n \"datasourceValue\": \"${datasource}\",\n \"description\": \"容器1min 内核态CPU平均使用率,如果pod内有多个容器,会分别显示各个容器用户态CPU使用率(pause容器默认不会显示);如果容器配置了4核,使用率400%表示当前用户态用满4核,容器配置2核,使用率200%表示当前用户态用满2核。\",\n \"id\": \"2921e6d0-1b9c-449d-9dd8-fb29dce8ca7d\",\n \"layout\": {\n \"h\": 7,\n \"i\": \"2921e6d0-1b9c-449d-9dd8-fb29dce8ca7d\",\n \"isResizable\": true,\n \"w\": 6,\n \"x\": 18,\n \"y\": 16\n },\n \"name\": \"容器用户态CPU使用率\",\n \"options\": {\n \"legend\": {\n \"displayMode\": \"hidden\"\n },\n \"standardOptions\": {\n \"max\": null,\n \"util\": \"percent\"\n },\n \"thresholds\": {},\n \"tooltip\": {\n \"mode\": \"all\",\n \"sort\": \"none\"\n }\n },\n \"targets\": [\n {\n \"expr\": \"sum(rate(container_cpu_user_seconds_total{pod=\\\"$pod_name\\\", image!~\\\".*pause.*\\\"}[1m])*100) by(name)\",\n \"refId\": \"A\"\n }\n ],\n \"type\": \"timeseries\",\n \"version\": \"2.0.0\"\n },\n {\n \"custom\": {\n \"drawStyle\": \"lines\",\n \"fillOpacity\": 0.5,\n \"lineInterpolation\": \"smooth\",\n \"stack\": \"off\"\n },\n \"datasourceCate\": \"prometheus\",\n \"datasourceValue\": \"${datasource}\",\n \"description\": \"该值大于0,说明CPU在运行期间发生throttle情况,即容器设置的CPU规格,不满足容器当前对CPU的实际需求,在这种情况下,往往需要调大容器CPU规格,或者优化程序,降低CPU开销。\",\n \"id\": \"b302c1a0-a499-4a99-aff2-d460685846ab\",\n \"layout\": {\n \"h\": 7,\n \"i\": \"b302c1a0-a499-4a99-aff2-d460685846ab\",\n \"isResizable\": true,\n \"w\": 6,\n \"x\": 0,\n \"y\": 23\n },\n \"name\": \"容器发生CPU throttle的比率\",\n \"options\": {\n \"legend\": {\n \"displayMode\": \"hidden\"\n },\n \"standardOptions\": {\n \"util\": \"percent\"\n },\n \"thresholds\": {},\n \"tooltip\": {\n \"mode\": \"all\",\n \"sort\": \"none\"\n }\n },\n \"targets\": [\n {\n \"expr\": \"sum(rate(container_cpu_cfs_throttled_periods_total{pod=\\\"$pod_name\\\", image!~\\\".*pause.*\\\"}[1m]))by(name) *100\",\n \"refId\": \"A\"\n }\n ],\n \"type\": \"timeseries\",\n \"version\": \"2.0.0\"\n },\n {\n \"custom\": {\n \"calc\": \"lastNotNull\",\n \"colSpan\": 1,\n \"colorMode\": \"value\",\n \"textMode\": \"valueAndName\",\n \"textSize\": {}\n },\n \"datasourceCate\": \"prometheus\",\n \"datasourceValue\": \"${datasource}\",\n \"description\": \"容器CPU Limit,2代表容器CPU Limit为2核, 0.2代表容器CPU Limit为0.2核, 没有数据表明没有设置Limit值\",\n \"id\": \"cd5e8b99-8a76-4dea-b8b2-3bff825a7f8d\",\n \"layout\": {\n \"h\": 7,\n \"i\": \"cd5e8b99-8a76-4dea-b8b2-3bff825a7f8d\",\n \"isResizable\": true,\n \"w\": 6,\n \"x\": 6,\n \"y\": 23\n },\n \"name\": \"容器CPU Limit\",\n \"options\": {\n \"standardOptions\": {}\n },\n \"targets\": [\n {\n \"expr\": \"(sum(container_spec_cpu_quota{pod=\\\"$pod_name\\\"}/container_spec_cpu_period{pod=\\\"$pod_name\\\"}) by (name))\",\n \"refId\": \"A\"\n }\n ],\n \"type\": \"stat\",\n \"version\": \"2.0.0\"\n },\n {\n \"custom\": {\n \"drawStyle\": \"lines\",\n \"fillOpacity\": 0.5,\n \"lineInterpolation\": \"smooth\",\n \"stack\": \"off\"\n },\n \"datasourceCate\": \"prometheus\",\n \"datasourceValue\": \"${datasource}\",\n \"description\": \"过去10s的CPU负载\",\n \"id\": \"408c29b9-2a49-49a2-a98b-3ad7da9c57bd\",\n \"layout\": {\n \"h\": 7,\n \"i\": \"408c29b9-2a49-49a2-a98b-3ad7da9c57bd\",\n \"isResizable\": true,\n \"w\": 6,\n \"x\": 12,\n \"y\": 23\n },\n \"name\": \"容器CPU load 10\",\n \"options\": {\n \"legend\": {\n \"displayMode\": \"hidden\"\n },\n \"standardOptions\": {\n \"max\": null\n },\n \"thresholds\": {},\n \"tooltip\": {\n \"mode\": \"all\",\n \"sort\": \"none\"\n }\n },\n \"targets\": [\n {\n \"expr\": \"sum(container_cpu_load_average_10s{pod=\\\"$pod_name\\\", image!~\\\".*pause.*\\\"}) by (name)\",\n \"refId\": \"A\"\n }\n ],\n \"type\": \"timeseries\",\n \"version\": \"2.0.0\"\n },\n {\n \"custom\": {\n \"drawStyle\": \"lines\",\n \"fillOpacity\": 0.5,\n \"lineInterpolation\": \"smooth\",\n \"stack\": \"off\"\n },\n \"datasourceCate\": \"prometheus\",\n \"datasourceValue\": \"${datasource}\",\n \"id\": \"fe62f7db-4f87-4da1-bfc3-60ed5039e31e\",\n \"layout\": {\n \"h\": 7,\n \"i\": \"fe62f7db-4f87-4da1-bfc3-60ed5039e31e\",\n \"isResizable\": true,\n \"w\": 6,\n \"x\": 18,\n \"y\": 23\n },\n \"name\": \"uninterruptible task 数量\",\n \"options\": {\n \"legend\": {\n \"displayMode\": \"hidden\"\n },\n \"standardOptions\": {},\n \"thresholds\": {},\n \"tooltip\": {\n \"mode\": \"all\",\n \"sort\": \"none\"\n }\n },\n \"targets\": [\n {\n \"expr\": \"sum(container_tasks_state{pod=\\\"$pod_name\\\", image!~\\\".*pause.*\\\", state=\\\"uninterruptible\\\"}) by (name)\",\n \"refId\": \"A\"\n }\n ],\n \"type\": \"timeseries\",\n \"version\": \"2.0.0\"\n },\n {\n \"custom\": {\n \"drawStyle\": \"lines\",\n \"fillOpacity\": 0.5,\n \"lineInterpolation\": \"smooth\",\n \"stack\": \"off\"\n },\n \"datasourceCate\": \"prometheus\",\n \"datasourceValue\": \"${datasource}\",\n \"id\": \"7152f66a-d907-4ee9-afd3-a04b12f1019b\",\n \"layout\": {\n \"h\": 7,\n \"i\": \"7152f66a-d907-4ee9-afd3-a04b12f1019b\",\n \"isResizable\": true,\n \"w\": 6,\n \"x\": 0,\n \"y\": 30\n },\n \"name\": \"running task 数量\",\n \"options\": {\n \"legend\": {\n \"displayMode\": \"hidden\"\n },\n \"standardOptions\": {},\n \"thresholds\": {},\n \"tooltip\": {\n \"mode\": \"all\",\n \"sort\": \"none\"\n }\n },\n \"targets\": [\n {\n \"expr\": \"sum(container_tasks_state{pod=\\\"$pod_name\\\", image!~\\\".*pause.*\\\", state=\\\"running\\\"}) by (name)\",\n \"refId\": \"A\"\n }\n ],\n \"type\": \"timeseries\",\n \"version\": \"2.0.0\"\n },\n {\n \"custom\": {\n \"drawStyle\": \"lines\",\n \"fillOpacity\": 0.5,\n \"lineInterpolation\": \"smooth\",\n \"stack\": \"off\"\n },\n \"datasourceCate\": \"prometheus\",\n \"datasourceValue\": \"${datasource}\",\n \"id\": \"d2627af4-5753-4384-880b-84bead73002a\",\n \"layout\": {\n \"h\": 7,\n \"i\": \"d2627af4-5753-4384-880b-84bead73002a\",\n \"isResizable\": true,\n \"w\": 6,\n \"x\": 6,\n \"y\": 30\n },\n \"name\": \"ioawaiting task 数量\",\n \"options\": {\n \"legend\": {\n \"displayMode\": \"hidden\"\n },\n \"standardOptions\": {},\n \"thresholds\": {},\n \"tooltip\": {\n \"mode\": \"all\",\n \"sort\": \"none\"\n }\n },\n \"targets\": [\n {\n \"expr\": \"sum(container_tasks_state{pod=\\\"$pod_name\\\", image!~\\\".*pause.*\\\", state=\\\"iowaiting\\\"}) by (name)\",\n \"refId\": \"A\"\n }\n ],\n \"type\": \"timeseries\",\n \"version\": \"2.0.0\"\n },\n {\n \"custom\": {\n \"drawStyle\": \"lines\",\n \"fillOpacity\": 0.5,\n \"lineInterpolation\": \"smooth\",\n \"stack\": \"off\"\n },\n \"datasourceCate\": \"prometheus\",\n \"datasourceValue\": \"${datasource}\",\n \"id\": \"78801242-2aae-48dc-a3c3-3d0050fac92c\",\n \"layout\": {\n \"h\": 7,\n \"i\": \"78801242-2aae-48dc-a3c3-3d0050fac92c\",\n \"isResizable\": true,\n \"w\": 6,\n \"x\": 12,\n \"y\": 30\n },\n \"name\": \"sleeping task 数量\",\n \"options\": {\n \"legend\": {\n \"displayMode\": \"hidden\"\n },\n \"standardOptions\": {},\n \"thresholds\": {},\n \"tooltip\": {\n \"mode\": \"all\",\n \"sort\": \"none\"\n }\n },\n \"targets\": [\n {\n \"expr\": \"sum(container_tasks_state{pod=\\\"$pod_name\\\", image!~\\\".*pause.*\\\", state=\\\"sleeping\\\"}) by (name)\",\n \"refId\": \"A\"\n }\n ],\n \"type\": \"timeseries\",\n \"version\": \"2.0.0\"\n },\n {\n \"custom\": {\n \"drawStyle\": \"lines\",\n \"fillOpacity\": 0.5,\n \"lineInterpolation\": \"smooth\",\n \"stack\": \"off\"\n },\n \"datasourceCate\": \"prometheus\",\n \"datasourceValue\": \"${datasource}\",\n \"id\": \"723a4b98-52e8-4284-b193-98a470189415\",\n \"layout\": {\n \"h\": 7,\n \"i\": \"723a4b98-52e8-4284-b193-98a470189415\",\n \"isResizable\": true,\n \"w\": 6,\n \"x\": 18,\n \"y\": 30\n },\n \"name\": \"stopped task 数量\",\n \"options\": {\n \"legend\": {\n \"displayMode\": \"hidden\"\n },\n \"standardOptions\": {},\n \"thresholds\": {},\n \"tooltip\": {\n \"mode\": \"all\",\n \"sort\": \"none\"\n }\n },\n \"targets\": [\n {\n \"expr\": \"sum(container_tasks_state{pod=\\\"$pod_name\\\", image!~\\\".*pause.*\\\", state=\\\"stopped\\\"}) by (name)\",\n \"refId\": \"A\"\n }\n ],\n \"type\": \"timeseries\",\n \"version\": \"2.0.0\"\n },\n {\n \"collapsed\": true,\n \"id\": \"39a8bcef-7b91-4ec4-8644-4e5674267437\",\n \"layout\": {\n \"h\": 1,\n \"i\": \"39a8bcef-7b91-4ec4-8644-4e5674267437\",\n \"isResizable\": false,\n \"w\": 24,\n \"x\": 0,\n \"y\": 37\n },\n \"name\": \"内存\",\n \"type\": \"row\"\n },\n {\n \"custom\": {\n \"drawStyle\": \"lines\",\n \"fillOpacity\": 0.5,\n \"gradientMode\": \"none\",\n \"lineInterpolation\": \"smooth\",\n \"lineWidth\": 1,\n \"stack\": \"off\"\n },\n \"datasourceCate\": \"prometheus\",\n \"datasourceValue\": \"${datasource}\",\n \"description\": \"(container_memory_rss + container_memory_cache + container_memory_swap + kernel memory)/ (memory limit), 没有数据表明容器配置没有设置mem limit\",\n \"id\": \"e7b80412-d9b2-4589-8175-abf93a62a524\",\n \"layout\": {\n \"h\": 7,\n \"i\": \"e7b80412-d9b2-4589-8175-abf93a62a524\",\n \"isResizable\": true,\n \"w\": 6,\n \"x\": 0,\n \"y\": 38\n },\n \"name\": \"容器内存使用率\",\n \"options\": {\n \"legend\": {\n \"displayMode\": \"hidden\"\n },\n \"standardOptions\": {\n \"max\": null,\n \"util\": \"percent\"\n },\n \"thresholds\": {},\n \"tooltip\": {\n \"mode\": \"all\",\n \"sort\": \"none\"\n }\n },\n \"targets\": [\n {\n \"expr\": \"((sum(container_memory_usage_bytes{pod=\\\"$pod_name\\\", image!~\\\".*pause.*\\\"}) by (name)) /(sum(container_spec_memory_limit_bytes{pod=\\\"$pod_name\\\", image!~\\\".*pause.*\\\"}) by (name)))*100\",\n \"refId\": \"A\"\n }\n ],\n \"type\": \"timeseries\",\n \"version\": \"2.0.0\"\n },\n {\n \"custom\": {\n \"drawStyle\": \"lines\",\n \"fillOpacity\": 0.5,\n \"lineInterpolation\": \"smooth\",\n \"stack\": \"off\"\n },\n \"datasourceCate\": \"prometheus\",\n \"datasourceValue\": \"${datasource}\",\n \"description\": \"container_memory_rss + container_memory_cache + container_memory_swap + kernel memory\",\n \"id\": \"4c2e1b54-1adb-480e-a581-1763bec5113f\",\n \"layout\": {\n \"h\": 7,\n \"i\": \"4c2e1b54-1adb-480e-a581-1763bec5113f\",\n \"isResizable\": true,\n \"w\": 6,\n \"x\": 6,\n \"y\": 38\n },\n \"name\": \"容器内存使用\",\n \"options\": {\n \"legend\": {\n \"displayMode\": \"hidden\"\n },\n \"standardOptions\": {\n \"util\": \"bytesIEC\"\n },\n \"thresholds\": {},\n \"tooltip\": {\n \"mode\": \"all\",\n \"sort\": \"none\"\n }\n },\n \"targets\": [\n {\n \"expr\": \"(sum(container_memory_usage_bytes{pod=\\\"$pod_name\\\", image!~\\\".*pause.*\\\"}) by (name)) \",\n \"refId\": \"A\"\n }\n ],\n \"type\": \"timeseries\",\n \"version\": \"2.0.0\"\n },\n {\n \"custom\": {\n \"drawStyle\": \"lines\",\n \"fillOpacity\": 0.5,\n \"lineInterpolation\": \"smooth\",\n \"stack\": \"off\"\n },\n \"datasourceCate\": \"prometheus\",\n \"datasourceValue\": \"${datasource}\",\n \"description\": \"容器cache 占用大小\",\n \"id\": \"429e0214-7b71-4fc0-a771-945363948999\",\n \"layout\": {\n \"h\": 7,\n \"i\": \"429e0214-7b71-4fc0-a771-945363948999\",\n \"isResizable\": true,\n \"w\": 6,\n \"x\": 12,\n \"y\": 38\n },\n \"name\": \"容器cache使用\",\n \"options\": {\n \"legend\": {\n \"displayMode\": \"hidden\"\n },\n \"standardOptions\": {\n \"util\": \"bytesIEC\"\n },\n \"thresholds\": {},\n \"tooltip\": {\n \"mode\": \"all\",\n \"sort\": \"none\"\n }\n },\n \"targets\": [\n {\n \"expr\": \"(sum(container_memory_cache{pod=\\\"$pod_name\\\", image!~\\\".*pause.*\\\"}) by (name))\",\n \"refId\": \"A\"\n }\n ],\n \"type\": \"timeseries\",\n \"version\": \"2.0.0\"\n },\n {\n \"custom\": {\n \"drawStyle\": \"lines\",\n \"fillOpacity\": 0.5,\n \"lineInterpolation\": \"smooth\",\n \"stack\": \"off\"\n },\n \"datasourceCate\": \"prometheus\",\n \"datasourceValue\": \"${datasource}\",\n \"description\": \"容器RSS内存占用大小。\",\n \"id\": \"27c1a22c-bdf3-4a8d-bd31-16c66a307f3f\",\n \"layout\": {\n \"h\": 7,\n \"i\": \"27c1a22c-bdf3-4a8d-bd31-16c66a307f3f\",\n \"isResizable\": true,\n \"w\": 6,\n \"x\": 18,\n \"y\": 38\n },\n \"name\": \"容器RSS内存使用\",\n \"options\": {\n \"legend\": {\n \"displayMode\": \"hidden\"\n },\n \"standardOptions\": {\n \"util\": \"bytesIEC\"\n },\n \"thresholds\": {},\n \"tooltip\": {\n \"mode\": \"all\",\n \"sort\": \"none\"\n }\n },\n \"targets\": [\n {\n \"expr\": \"(sum(container_memory_rss{pod=\\\"$pod_name\\\", image!~\\\".*pause.*\\\"}) by (name))\",\n \"refId\": \"A\"\n }\n ],\n \"type\": \"timeseries\",\n \"version\": \"2.0.0\"\n },\n {\n \"custom\": {\n \"drawStyle\": \"lines\",\n \"fillOpacity\": 0.5,\n \"lineInterpolation\": \"smooth\",\n \"stack\": \"off\"\n },\n \"datasourceCate\": \"prometheus\",\n \"datasourceValue\": \"${datasource}\",\n \"description\": \"容器内存Limit配置,0表示没有设置内存 Limit\",\n \"id\": \"13173c71-14a9-43a0-9cbe-34c1bb453f2b\",\n \"layout\": {\n \"h\": 7,\n \"i\": \"13173c71-14a9-43a0-9cbe-34c1bb453f2b\",\n \"isResizable\": true,\n \"w\": 6,\n \"x\": 0,\n \"y\": 45\n },\n \"name\": \"容器内存 Limit\",\n \"options\": {\n \"legend\": {\n \"displayMode\": \"hidden\"\n },\n \"standardOptions\": {\n \"util\": \"bytesIEC\"\n },\n \"thresholds\": {},\n \"tooltip\": {\n \"mode\": \"all\",\n \"sort\": \"none\"\n }\n },\n \"targets\": [\n {\n \"expr\": \"sum(container_spec_memory_limit_bytes{pod=\\\"$pod_name\\\", image!~\\\".*pause.*\\\"}) by (name)\",\n \"refId\": \"A\"\n }\n ],\n \"type\": \"timeseries\",\n \"version\": \"2.0.0\"\n },\n {\n \"custom\": {\n \"calc\": \"lastNotNull\",\n \"colSpan\": 1,\n \"colorMode\": \"value\",\n \"textMode\": \"valueAndName\",\n \"textSize\": {}\n },\n \"datasourceCate\": \"prometheus\",\n \"datasourceValue\": \"${datasource}\",\n \"id\": \"d3a7153b-f174-473c-a5ae-1ec8ff4ef318\",\n \"layout\": {\n \"h\": 7,\n \"i\": \"d3a7153b-f174-473c-a5ae-1ec8ff4ef318\",\n \"isResizable\": true,\n \"w\": 6,\n \"x\": 6,\n \"y\": 45\n },\n \"name\": \"容器发生OOM次数\",\n \"options\": {\n \"standardOptions\": {}\n },\n \"targets\": [\n {\n \"expr\": \"sum(container_oom_events_total{pod=\\\"$pod_name\\\", image!~\\\".*pause.*\\\"}) by (name) \",\n \"refId\": \"A\"\n }\n ],\n \"type\": \"stat\",\n \"version\": \"2.0.0\"\n },\n {\n \"custom\": {\n \"drawStyle\": \"lines\",\n \"fillOpacity\": 0.5,\n \"lineInterpolation\": \"smooth\",\n \"stack\": \"off\"\n },\n \"datasourceCate\": \"prometheus\",\n \"datasourceValue\": \"${datasource}\",\n \"description\": \"网络接收错误数(1分钟内)\",\n \"id\": \"271d8ff6-2382-488d-b479-83e38b247012\",\n \"layout\": {\n \"h\": 7,\n \"i\": \"271d8ff6-2382-488d-b479-83e38b247012\",\n \"isResizable\": true,\n \"w\": 6,\n \"x\": 12,\n \"y\": 45\n },\n \"name\": \"网络接收错误数\",\n \"options\": {\n \"legend\": {\n \"displayMode\": \"hidden\"\n },\n \"standardOptions\": {},\n \"thresholds\": {},\n \"tooltip\": {\n \"mode\": \"all\",\n \"sort\": \"none\"\n }\n },\n \"targets\": [\n {\n \"expr\": \"sum(rate(container_network_receive_errors_total{pod=\\\"$pod_name\\\"}[1m])) by(name, interface)\",\n \"refId\": \"A\"\n }\n ],\n \"type\": \"timeseries\",\n \"version\": \"2.0.0\"\n },\n {\n \"custom\": {\n \"drawStyle\": \"lines\",\n \"fillOpacity\": 0.5,\n \"lineInterpolation\": \"smooth\",\n \"stack\": \"off\"\n },\n \"datasourceCate\": \"prometheus\",\n \"datasourceValue\": \"${datasource}\",\n \"description\": \"网络接收丢包数(1分钟内)\",\n \"id\": \"e7a0879b-82a9-4518-8c5c-93bc73548401\",\n \"layout\": {\n \"h\": 7,\n \"i\": \"e7a0879b-82a9-4518-8c5c-93bc73548401\",\n \"isResizable\": true,\n \"w\": 6,\n \"x\": 18,\n \"y\": 45\n },\n \"name\": \"网络接收丢包数\",\n \"options\": {\n \"legend\": {\n \"displayMode\": \"hidden\"\n },\n \"standardOptions\": {},\n \"thresholds\": {},\n \"tooltip\": {\n \"mode\": \"all\",\n \"sort\": \"none\"\n }\n },\n \"targets\": [\n {\n \"expr\": \"sum(rate(container_network_receive_packets_dropped_total{pod=\\\"$pod_name\\\"}[1m])) by(name, interface)\",\n \"refId\": \"A\"\n }\n ],\n \"type\": \"timeseries\",\n \"version\": \"2.0.0\"\n },\n {\n \"collapsed\": true,\n \"id\": \"8d49afd3-d8fa-4714-aaa2-b10e045c8976\",\n \"layout\": {\n \"h\": 1,\n \"i\": \"8d49afd3-d8fa-4714-aaa2-b10e045c8976\",\n \"isResizable\": false,\n \"w\": 24,\n \"x\": 0,\n \"y\": 52\n },\n \"name\": \"磁盘\",\n \"type\": \"row\"\n },\n {\n \"custom\": {\n \"drawStyle\": \"lines\",\n \"fillOpacity\": 0.5,\n \"lineInterpolation\": \"smooth\",\n \"stack\": \"off\"\n },\n \"datasourceCate\": \"prometheus\",\n \"datasourceValue\": \"${datasource}\",\n \"id\": \"ef7e1b00-2a77-4a34-a138-5c8207088476\",\n \"layout\": {\n \"h\": 7,\n \"i\": \"ef7e1b00-2a77-4a34-a138-5c8207088476\",\n \"isResizable\": true,\n \"w\": 6,\n \"x\": 0,\n \"y\": 53\n },\n \"name\": \"文件系统读取速率\",\n \"options\": {\n \"legend\": {\n \"displayMode\": \"hidden\"\n },\n \"standardOptions\": {\n \"util\": \"bytesIEC\"\n },\n \"thresholds\": {},\n \"tooltip\": {\n \"mode\": \"all\",\n \"sort\": \"none\"\n }\n },\n \"targets\": [\n {\n \"expr\": \"sum(rate(container_fs_reads_bytes_total{pod=\\\"$pod_name\\\", image!~\\\".*pause.*\\\"}[1m])) by(name)\",\n \"refId\": \"A\"\n }\n ],\n \"type\": \"timeseries\",\n \"version\": \"2.0.0\"\n },\n {\n \"custom\": {\n \"drawStyle\": \"lines\",\n \"fillOpacity\": 0.5,\n \"lineInterpolation\": \"smooth\",\n \"stack\": \"off\"\n },\n \"datasourceCate\": \"prometheus\",\n \"datasourceValue\": \"${datasource}\",\n \"id\": \"e55b7db3-2b13-43f9-aa2d-e9a0a929df4b\",\n \"layout\": {\n \"h\": 7,\n \"i\": \"e55b7db3-2b13-43f9-aa2d-e9a0a929df4b\",\n \"isResizable\": true,\n \"w\": 6,\n \"x\": 6,\n \"y\": 53\n },\n \"name\": \"文件系统写入速率\",\n \"options\": {\n \"legend\": {\n \"displayMode\": \"hidden\"\n },\n \"standardOptions\": {\n \"util\": \"bytesIEC\"\n },\n \"thresholds\": {},\n \"tooltip\": {\n \"mode\": \"all\",\n \"sort\": \"none\"\n }\n },\n \"targets\": [\n {\n \"expr\": \"sum(rate(container_fs_writes_bytes_total{pod=\\\"$pod_name\\\", image!~\\\".*pause.*\\\"}[1m])) by(name)\",\n \"refId\": \"A\"\n }\n ],\n \"type\": \"timeseries\",\n \"version\": \"2.0.0\"\n },\n {\n \"custom\": {\n \"drawStyle\": \"lines\",\n \"fillOpacity\": 0.5,\n \"lineInterpolation\": \"smooth\",\n \"stack\": \"off\"\n },\n \"datasourceCate\": \"prometheus\",\n \"datasourceValue\": \"${datasource}\",\n \"id\": \"a2d7ba64-fd4d-4713-9295-8663fa72f675\",\n \"layout\": {\n \"h\": 7,\n \"i\": \"a2d7ba64-fd4d-4713-9295-8663fa72f675\",\n \"isResizable\": true,\n \"w\": 6,\n \"x\": 12,\n \"y\": 53\n },\n \"name\": \"容器I/O\",\n \"options\": {\n \"legend\": {\n \"displayMode\": \"hidden\"\n },\n \"standardOptions\": {},\n \"thresholds\": {},\n \"tooltip\": {\n \"mode\": \"all\",\n \"sort\": \"none\"\n }\n },\n \"targets\": [\n {\n \"expr\": \"sum(container_fs_io_current{pod=\\\"$pod_name\\\", image!~\\\".*pause.*\\\"}) by (name) \",\n \"refId\": \"A\"\n }\n ],\n \"type\": \"timeseries\",\n \"version\": \"2.0.0\"\n },\n {\n \"custom\": {\n \"drawStyle\": \"lines\",\n \"fillOpacity\": 0.5,\n \"lineInterpolation\": \"smooth\",\n \"stack\": \"off\"\n },\n \"datasourceCate\": \"prometheus\",\n \"datasourceValue\": \"${datasource}\",\n \"id\": \"2b4e94ef-c994-4910-b72b-428bf5156a21\",\n \"layout\": {\n \"h\": 7,\n \"i\": \"2b4e94ef-c994-4910-b72b-428bf5156a21\",\n \"isResizable\": true,\n \"w\": 6,\n \"x\": 18,\n \"y\": 53\n },\n \"name\": \"inode数量\",\n \"options\": {\n \"legend\": {\n \"displayMode\": \"hidden\"\n },\n \"standardOptions\": {},\n \"thresholds\": {},\n \"tooltip\": {\n \"mode\": \"all\",\n \"sort\": \"none\"\n }\n },\n \"targets\": [\n {\n \"expr\": \"sum(container_fs_inodes_total{pod=\\\"$pod_name\\\", image!~\\\".*pause.*\\\"}) by (name) \",\n \"refId\": \"A\"\n }\n ],\n \"type\": \"timeseries\",\n \"version\": \"2.0.0\"\n },\n {\n \"custom\": {\n \"drawStyle\": \"lines\",\n \"fillOpacity\": 0.5,\n \"lineInterpolation\": \"smooth\",\n \"stack\": \"off\"\n },\n \"datasourceCate\": \"prometheus\",\n \"datasourceValue\": \"${datasource}\",\n \"id\": \"3abade99-8f34-4a1e-bb48-c5ba1e128749\",\n \"layout\": {\n \"h\": 7,\n \"i\": \"3abade99-8f34-4a1e-bb48-c5ba1e128749\",\n \"isResizable\": true,\n \"w\": 6,\n \"x\": 0,\n \"y\": 60\n },\n \"name\": \"容器已使用的文件系统大小\",\n \"options\": {\n \"legend\": {\n \"displayMode\": \"hidden\"\n },\n \"standardOptions\": {\n \"util\": \"bytesIEC\"\n },\n \"thresholds\": {},\n \"tooltip\": {\n \"mode\": \"all\",\n \"sort\": \"none\"\n }\n },\n \"targets\": [\n {\n \"expr\": \"sum(container_fs_usage_bytes{pod=\\\"$pod_name\\\", image!~\\\".*pause.*\\\"}) by (name) \",\n \"refId\": \"A\"\n }\n ],\n \"type\": \"timeseries\",\n \"version\": \"2.0.0\"\n },\n {\n \"custom\": {\n \"drawStyle\": \"lines\",\n \"fillOpacity\": 0.5,\n \"lineInterpolation\": \"smooth\",\n \"stack\": \"off\"\n },\n \"datasourceCate\": \"prometheus\",\n \"datasourceValue\": \"${datasource}\",\n \"description\": \"网络接收数据包数(1分钟内)\",\n \"id\": \"8b0bac93-8bd0-4452-a200-a9cea74345b3\",\n \"layout\": {\n \"h\": 7,\n \"i\": \"8b0bac93-8bd0-4452-a200-a9cea74345b3\",\n \"isResizable\": true,\n \"w\": 6,\n \"x\": 6,\n \"y\": 60\n },\n \"name\": \"网络接收数据包数\",\n \"options\": {\n \"legend\": {\n \"displayMode\": \"hidden\"\n },\n \"standardOptions\": {},\n \"thresholds\": {},\n \"tooltip\": {\n \"mode\": \"all\",\n \"sort\": \"none\"\n }\n },\n \"targets\": [\n {\n \"expr\": \"sum(rate(container_network_receive_packets_total{pod=\\\"$pod_name\\\"}[1m])) by(name, interface)\",\n \"refId\": \"A\"\n }\n ],\n \"type\": \"timeseries\",\n \"version\": \"2.0.0\"\n },\n {\n \"collapsed\": true,\n \"id\": \"fde213bc-fe49-431a-9495-2219fcaaa01a\",\n \"layout\": {\n \"h\": 1,\n \"i\": \"fde213bc-fe49-431a-9495-2219fcaaa01a\",\n \"isResizable\": false,\n \"w\": 24,\n \"x\": 0,\n \"y\": 67\n },\n \"name\": \"网络\",\n \"type\": \"row\"\n },\n {\n \"custom\": {\n \"drawStyle\": \"lines\",\n \"fillOpacity\": 0.5,\n \"lineInterpolation\": \"smooth\",\n \"stack\": \"off\"\n },\n \"datasourceCate\": \"prometheus\",\n \"datasourceValue\": \"${datasource}\",\n \"description\": \"容器网络发送的字节数(1 分钟内)\",\n \"id\": \"4e70bc47-1510-41fe-a924-3ffa36d11f0f\",\n \"layout\": {\n \"h\": 7,\n \"i\": \"4e70bc47-1510-41fe-a924-3ffa36d11f0f\",\n \"isResizable\": true,\n \"w\": 6,\n \"x\": 0,\n \"y\": 68\n },\n \"name\": \"网络发送速率\",\n \"options\": {\n \"legend\": {\n \"displayMode\": \"hidden\"\n },\n \"standardOptions\": {\n \"util\": \"bytesIEC\"\n },\n \"thresholds\": {},\n \"tooltip\": {\n \"mode\": \"all\",\n \"sort\": \"none\"\n }\n },\n \"targets\": [\n {\n \"expr\": \"sum(rate(container_network_transmit_bytes_total{pod=\\\"$pod_name\\\"}[1m])) by(name, interface)\",\n \"refId\": \"A\"\n }\n ],\n \"type\": \"timeseries\",\n \"version\": \"2.0.0\"\n },\n {\n \"custom\": {\n \"drawStyle\": \"lines\",\n \"fillOpacity\": 0.5,\n \"lineInterpolation\": \"smooth\",\n \"stack\": \"off\"\n },\n \"datasourceCate\": \"prometheus\",\n \"datasourceValue\": \"${datasource}\",\n \"description\": \"网络发送数据包数(1分钟内)\",\n \"id\": \"00ca29e5-7c97-491d-a28f-0f2d66ea47c5\",\n \"layout\": {\n \"h\": 7,\n \"i\": \"00ca29e5-7c97-491d-a28f-0f2d66ea47c5\",\n \"isResizable\": true,\n \"w\": 6,\n \"x\": 6,\n \"y\": 68\n },\n \"name\": \"网络发送数据包\",\n \"options\": {\n \"legend\": {\n \"displayMode\": \"hidden\"\n },\n \"standardOptions\": {},\n \"thresholds\": {},\n \"tooltip\": {\n \"mode\": \"all\",\n \"sort\": \"none\"\n }\n },\n \"targets\": [\n {\n \"expr\": \"sum(rate(container_network_transmit_packets_total{pod=\\\"$pod_name\\\"}[1m])) by(name, interface)\",\n \"refId\": \"A\"\n }\n ],\n \"type\": \"timeseries\",\n \"version\": \"2.0.0\"\n },\n {\n \"custom\": {\n \"drawStyle\": \"lines\",\n \"fillOpacity\": 0.5,\n \"lineInterpolation\": \"smooth\",\n \"stack\": \"off\"\n },\n \"datasourceCate\": \"prometheus\",\n \"datasourceValue\": \"${datasource}\",\n \"description\": \"网络发送错误数(1分钟内)\",\n \"id\": \"8cd76b5f-5bba-421a-9fda-42f406f54ed5\",\n \"layout\": {\n \"h\": 7,\n \"i\": \"8cd76b5f-5bba-421a-9fda-42f406f54ed5\",\n \"isResizable\": true,\n \"w\": 6,\n \"x\": 12,\n \"y\": 68\n },\n \"name\": \"网络发送错误数\",\n \"options\": {\n \"legend\": {\n \"displayMode\": \"hidden\"\n },\n \"standardOptions\": {},\n \"thresholds\": {},\n \"tooltip\": {\n \"mode\": \"all\",\n \"sort\": \"none\"\n }\n },\n \"targets\": [\n {\n \"expr\": \"sum(rate(container_network_transmit_errors_total{pod=\\\"$pod_name\\\"}[1m])) by(name, interface)\",\n \"refId\": \"A\"\n }\n ],\n \"type\": \"timeseries\",\n \"version\": \"2.0.0\"\n },\n {\n \"custom\": {\n \"drawStyle\": \"lines\",\n \"fillOpacity\": 0.5,\n \"lineInterpolation\": \"smooth\",\n \"stack\": \"off\"\n },\n \"datasourceCate\": \"prometheus\",\n \"datasourceValue\": \"${datasource}\",\n \"description\": \"网络发送丢包数(1分钟内)\",\n \"id\": \"58aaebbb-b1cf-4089-bcb5-70b03c05318d\",\n \"layout\": {\n \"h\": 7,\n \"i\": \"58aaebbb-b1cf-4089-bcb5-70b03c05318d\",\n \"isResizable\": true,\n \"w\": 6,\n \"x\": 18,\n \"y\": 68\n },\n \"name\": \"网络发送丢包数\",\n \"options\": {\n \"legend\": {\n \"displayMode\": \"hidden\"\n },\n \"standardOptions\": {},\n \"thresholds\": {},\n \"tooltip\": {\n \"mode\": \"all\",\n \"sort\": \"none\"\n }\n },\n \"targets\": [\n {\n \"expr\": \"sum(rate(container_network_transmit_packets_dropped_total{pod=\\\"$pod_name\\\"}[1m])) by(name, interface)\",\n \"refId\": \"A\"\n }\n ],\n \"type\": \"timeseries\",\n \"version\": \"2.0.0\"\n },\n {\n \"custom\": {\n \"drawStyle\": \"lines\",\n \"fillOpacity\": 0.5,\n \"lineInterpolation\": \"smooth\",\n \"stack\": \"off\"\n },\n \"datasourceCate\": \"prometheus\",\n \"datasourceValue\": \"${datasource}\",\n \"description\": \"容器网络接收的字节数(1 分钟内)\",\n \"id\": \"120d3540-cce5-4b08-b596-0ec6a5b2d497\",\n \"layout\": {\n \"h\": 7,\n \"i\": \"120d3540-cce5-4b08-b596-0ec6a5b2d497\",\n \"isResizable\": true,\n \"w\": 6,\n \"x\": 0,\n \"y\": 75\n },\n \"name\": \"网络接收速率\",\n \"options\": {\n \"legend\": {\n \"displayMode\": \"hidden\"\n },\n \"standardOptions\": {\n \"util\": \"bytesIEC\"\n },\n \"thresholds\": {},\n \"tooltip\": {\n \"mode\": \"all\",\n \"sort\": \"none\"\n }\n },\n \"targets\": [\n {\n \"expr\": \"sum(rate(container_network_receive_bytes_total{pod=\\\"$pod_name\\\"}[1m])) by(name, interface)\",\n \"refId\": \"A\"\n }\n ],\n \"type\": \"timeseries\",\n \"version\": \"2.0.0\"\n }\n ],\n \"var\": [\n {\n \"definition\": \"prometheus\",\n \"name\": \"datasource\",\n \"type\": \"datasource\"\n },\n {\n \"datasource\": {\n \"cate\": \"prometheus\",\n \"value\": \"${datasource}\"\n },\n \"definition\": \"label_values(kube_statefulset_labels,statefulset)\",\n \"hide\": false,\n \"multi\": false,\n \"name\": \"statefulset\",\n \"reg\": \"\",\n \"type\": \"query\"\n },\n {\n \"datasource\": {\n \"cate\": \"prometheus\",\n \"value\": \"${datasource}\"\n },\n \"definition\": \"label_values(kube_pod_status_ready{pod=~\\\"$statefulset.*\\\"}, pod)\",\n \"hide\": false,\n \"multi\": false,\n \"name\": \"pod_name\",\n \"reg\": \"\",\n \"type\": \"query\"\n }\n ],\n \"version\": \"3.0.0\"\n },\n \"uuid\": 1727335306984008000\n}"
},
{
"path": "integrations/Kubernetes/markdown/README.md",
"content": "# Kubernetes\n\n这个插件已经废弃。Kubernetes 监控系列可以参考这个 [文章](https://flashcat.cloud/categories/kubernetes%E7%9B%91%E6%8E%A7%E4%B8%93%E6%A0%8F/)。\n\n不过 Kubernetes 这个类别下的内置告警规则和内置仪表盘都是可以使用的。\n\n---\n\n下面是老插件文档:\n\nforked from telegraf/kubernetes. 这个插件的作用是通过kubelet提供的API获取监控数据,包括系统容器的监控数据、node的、pod数据卷的、pod网络的、pod容器的。\n\n## Change\n\n增加了一些控制开关:\n\n`gather_system_container_metrics = true`\n\n是否采集 system 容器(kubelet、runtime、misc、pods),比如 kubelet 一般就是静态容器,非业务容器\n\n`gather_node_metrics = true`\n\n是否采集 node 层面的指标,机器层面的指标其实 categraf 来采集了,这里理论上不需要再采集了,可以设置为 false,采集也没问题,也没多少数据\n\n`gather_pod_container_metrics = true`\n\n是否采集 Pod 中的容器的指标,这些 Pod 一般是业务容器\n\n`gather_pod_volume_metrics = true`\n\n是否采集 Pod 的数据卷的指标\n\n`gather_pod_network_metrics = true`\n\n是否采集 Pod 的网络监控数据\n\n## 容器监控\n\n通过这些开关可以看出,kubernetes 这个插件,采集的只是 pod、容器的监控指标,这些指标数据来自 kubelet 的 `/stats/summary` `/pods` 等接口。那么问题来了,容器监控到底是应该读取 `/metrics/cadvisor` 接口还是应该用这个 kubernetes 插件?有几个决策依据:\n\n1. `/metrics/cadvisor` 采集的数据没有业务自定义标签,kubernetes 这个插件会自动带上业务自定义标签。但是业务标签可能比较混乱,建议每个公司制定规范,比如要求业务只能打 project、region、env、service、app、job 等标签,其他标签都过滤掉,通过 kubernetes 插件的 label_include label_exclude 配置,可以做标签过滤。\n2. kubernetes 这个插件采集的数据比 `/metrics/cadvisor` 吐出的指标要少,不过常见的 cpu、mem、net、volume 相关的也都有。\n"
},
{
"path": "integrations/Kubernetes/metrics/k8s-node.json",
"content": "[\n {\n \"uuid\": 1745735239727485700,\n \"collector\": \"Node\",\n \"typ\": \"Kubernetes\",\n \"name\": \"TCP当前连接数\",\n \"unit\": \"\",\n \"note\": \"节点指标\\n类型: *\",\n \"lang\": \"zh_CN\",\n \"expression\": \"node_netstat_Tcp_CurrEstab * on(instance, cluster) group_left(nodename) node_uname_info{nodename=~\\\"$node_name\\\"}\",\n \"translation\": [\n {\n \"lang\": \"zh_CN\",\n \"name\": \"TCP当前连接数\",\n \"note\": \"节点指标\\n类型: *\"\n },\n {\n \"lang\": \"en_US\",\n \"name\": \"Current TCP Connections\",\n \"note\": \"Node indicators \\nType: *\"\n }\n ]\n },\n {\n \"uuid\": 1745735239701096000,\n \"collector\": \"Node\",\n \"typ\": \"Kubernetes\",\n \"name\": \"文件描述符使用数\",\n \"unit\": \"\",\n \"note\": \"节点指标\\n类型: *\",\n \"lang\": \"zh_CN\",\n \"expression\": \"node_filefd_allocated * on(instance, cluster) group_left(nodename) node_uname_info{nodename=~\\\"$node_name\\\"}\",\n \"translation\": [\n {\n \"lang\": \"zh_CN\",\n \"name\": \"文件描述符使用数\",\n \"note\": \"节点指标\\n类型: *\"\n },\n {\n \"lang\": \"en_US\",\n \"name\": \"Number of file descriptors used\",\n \"note\": \"Node indicators \\nType: *\"\n }\n ]\n },\n {\n \"uuid\": 1745735239704160000,\n \"collector\": \"Node\",\n \"typ\": \"Kubernetes\",\n \"name\": \"文件描述符最大限制\",\n \"unit\": \"\",\n \"note\": \"节点指标\\n类型: *\",\n \"lang\": \"zh_CN\",\n \"expression\": \"node_filefd_maximum * on(instance, cluster) group_left(nodename) node_uname_info{nodename=~\\\"$node_name\\\"}\",\n \"translation\": [\n {\n \"lang\": \"zh_CN\",\n \"name\": \"文件描述符最大限制\",\n \"note\": \"节点指标\\n类型: *\"\n },\n {\n \"lang\": \"en_US\",\n \"name\": \"File Descriptor Maximum Limit\",\n \"note\": \"Node indicators \\nType: *\"\n }\n ]\n },\n {\n \"uuid\": 1745735239750006800,\n \"collector\": \"Node\",\n \"typ\": \"Kubernetes\",\n \"name\": \"文件系统inode使用率\",\n \"unit\": \"\",\n \"note\": \"节点指标\\n类型: -\",\n \"lang\": \"zh_CN\",\n \"expression\": \"100 - (node_filesystem_files_free * on(instance, cluster) group_left(nodename) node_uname_info{nodename=~\\\"$node_name\\\"} / node_filesystem_files * on(instance, cluster) group_left(nodename) node_uname_info{nodename=~\\\"$node_name\\\"} * 100)\",\n \"translation\": [\n {\n \"lang\": \"zh_CN\",\n \"name\": \"文件系统inode使用率\",\n \"note\": \"节点指标\\n类型: -\"\n },\n {\n \"lang\": \"en_US\",\n \"name\": \"File system inode usage\",\n \"note\": \"Node indicators \\nType:-\"\n }\n ]\n },\n {\n \"uuid\": 1745735239746991600,\n \"collector\": \"Node\",\n \"typ\": \"Kubernetes\",\n \"name\": \"文件系统使用率\",\n \"unit\": \"\",\n \"note\": \"节点指标\\n类型: -\",\n \"lang\": \"zh_CN\",\n \"expression\": \"100 - ((node_filesystem_avail_bytes * on(instance, cluster) group_left(nodename) node_uname_info{nodename=~\\\"$node_name\\\"} * 100) / node_filesystem_size_bytes * on(instance, cluster) group_left(nodename) node_uname_info{nodename=~\\\"$node_name\\\"})\",\n \"translation\": [\n {\n \"lang\": \"zh_CN\",\n \"name\": \"文件系统使用率\",\n \"note\": \"节点指标\\n类型: -\"\n },\n {\n \"lang\": \"en_US\",\n \"name\": \"File system usage\",\n \"note\": \"Node indicators \\nType:-\"\n }\n ]\n },\n {\n \"uuid\": 1745735239753550000,\n \"collector\": \"Node\",\n \"typ\": \"Kubernetes\",\n \"name\": \"文件系统错误数\",\n \"unit\": \"\",\n \"note\": \"节点指标\\n类型: *\",\n \"lang\": \"zh_CN\",\n \"expression\": \"sum(node_filesystem_device_error * on(instance, cluster) group_left(nodename) node_uname_info{nodename=~\\\"$node_name\\\"}) by (mountpoint)\",\n \"translation\": [\n {\n \"lang\": \"zh_CN\",\n \"name\": \"文件系统错误数\",\n \"note\": \"节点指标\\n类型: *\"\n },\n {\n \"lang\": \"en_US\",\n \"name\": \"Number of file system errors\",\n \"note\": \"Node indicators \\nType: *\"\n }\n ]\n },\n {\n \"uuid\": 1745735239743097300,\n \"collector\": \"Node\",\n \"typ\": \"Kubernetes\",\n \"name\": \"磁盘IO使用率\",\n \"unit\": \"\",\n \"note\": \"节点指标\\n类型: *\",\n \"lang\": \"zh_CN\",\n \"expression\": \"rate(node_disk_io_now[5m]) * on(instance, cluster) group_left(nodename) node_uname_info{nodename=~\\\"$node_name\\\"}\",\n \"translation\": [\n {\n \"lang\": \"zh_CN\",\n \"name\": \"磁盘IO使用率\",\n \"note\": \"节点指标\\n类型: *\"\n },\n {\n \"lang\": \"en_US\",\n \"name\": \"Disk IO usage\",\n \"note\": \"Node indicators \\nType: *\"\n }\n ]\n },\n {\n \"uuid\": 1745735239740169500,\n \"collector\": \"Node\",\n \"typ\": \"Kubernetes\",\n \"name\": \"磁盘写入IOPS\",\n \"unit\": \"\",\n \"note\": \"节点指标\\n类型: *\",\n \"lang\": \"zh_CN\",\n \"expression\": \"rate(node_disk_writes_completed_total[5m]) * on(instance, cluster) group_left(nodename) node_uname_info{nodename=~\\\"$node_name\\\"}\",\n \"translation\": [\n {\n \"lang\": \"zh_CN\",\n \"name\": \"磁盘写入IOPS\",\n \"note\": \"节点指标\\n类型: *\"\n },\n {\n \"lang\": \"en_US\",\n \"name\": \"Disk Write IOPS\",\n \"note\": \"Node indicators \\nType: *\"\n }\n ]\n },\n {\n \"uuid\": 1745735239734228700,\n \"collector\": \"Node\",\n \"typ\": \"Kubernetes\",\n \"name\": \"磁盘写入速率\",\n \"unit\": \"\",\n \"note\": \"节点指标\\n类型: *\",\n \"lang\": \"zh_CN\",\n \"expression\": \"rate(node_disk_written_bytes_total[5m]) * on(instance, cluster) group_left(nodename) node_uname_info{nodename=~\\\"$node_name\\\"}\",\n \"translation\": [\n {\n \"lang\": \"zh_CN\",\n \"name\": \"磁盘写入速率\",\n \"note\": \"节点指标\\n类型: *\"\n },\n {\n \"lang\": \"en_US\",\n \"name\": \"Disk write rate\",\n \"note\": \"Node indicators \\nType: *\"\n }\n ]\n },\n {\n \"uuid\": 1745735239737122600,\n \"collector\": \"Node\",\n \"typ\": \"Kubernetes\",\n \"name\": \"磁盘读取IOPS\",\n \"unit\": \"\",\n \"note\": \"节点指标\\n类型: *\",\n \"lang\": \"zh_CN\",\n \"expression\": \"rate(node_disk_reads_completed_total[5m]) * on(instance, cluster) group_left(nodename) node_uname_info{nodename=~\\\"$node_name\\\"}\",\n \"translation\": [\n {\n \"lang\": \"zh_CN\",\n \"name\": \"磁盘读取IOPS\",\n \"note\": \"节点指标\\n类型: *\"\n },\n {\n \"lang\": \"en_US\",\n \"name\": \"Disk Read IOPS\",\n \"note\": \"Node indicators \\nType: *\"\n }\n ]\n },\n {\n \"uuid\": 1745735239730406000,\n \"collector\": \"Node\",\n \"typ\": \"Kubernetes\",\n \"name\": \"磁盘读取速率\",\n \"unit\": \"\",\n \"note\": \"节点指标\\n类型: *\",\n \"lang\": \"zh_CN\",\n \"expression\": \"rate(node_disk_read_bytes_total[5m]) * on(instance, cluster) group_left(nodename) node_uname_info{nodename=~\\\"$node_name\\\"}\",\n \"translation\": [\n {\n \"lang\": \"zh_CN\",\n \"name\": \"磁盘读取速率\",\n \"note\": \"节点指标\\n类型: *\"\n },\n {\n \"lang\": \"en_US\",\n \"name\": \"Disk read rate\",\n \"note\": \"Node indicators \\nType: *\"\n }\n ]\n },\n {\n \"uuid\": 1745735239694202600,\n \"collector\": \"Node\",\n \"typ\": \"Kubernetes\",\n \"name\": \"系统上下文切换率\",\n \"unit\": \"\",\n \"note\": \"节点指标\\n类型: *\",\n \"lang\": \"zh_CN\",\n \"expression\": \"rate(node_context_switches_total[5m]) * on(instance, cluster) group_left(nodename) node_uname_info{nodename=~\\\"$node_name\\\"}\",\n \"translation\": [\n {\n \"lang\": \"zh_CN\",\n \"name\": \"系统上下文切换率\",\n \"note\": \"节点指标\\n类型: *\"\n },\n {\n \"lang\": \"en_US\",\n \"name\": \"System context switching rate\",\n \"note\": \"Node indicators \\nType: *\"\n }\n ]\n },\n {\n \"uuid\": 1745735239697167400,\n \"collector\": \"Node\",\n \"typ\": \"Kubernetes\",\n \"name\": \"系统中断率\",\n \"unit\": \"\",\n \"note\": \"节点指标\\n类型: *\",\n \"lang\": \"zh_CN\",\n \"expression\": \"rate(node_intr_total[5m]) * on(instance, cluster) group_left(nodename) node_uname_info{nodename=~\\\"$node_name\\\"}\",\n \"translation\": [\n {\n \"lang\": \"zh_CN\",\n \"name\": \"系统中断率\",\n \"note\": \"节点指标\\n类型: *\"\n },\n {\n \"lang\": \"en_US\",\n \"name\": \"System interruption rate\",\n \"note\": \"Node indicators \\nType: *\"\n }\n ]\n },\n {\n \"uuid\": 1745735239724650200,\n \"collector\": \"Node\",\n \"typ\": \"Kubernetes\",\n \"name\": \"网络发送丢包率\",\n \"unit\": \"\",\n \"note\": \"节点指标\\n类型: *\",\n \"lang\": \"zh_CN\",\n \"expression\": \"sum(rate(node_network_transmit_drop_total[5m]) * on(instance, cluster) group_left(nodename) node_uname_info{nodename=~\\\"$node_name\\\"})\",\n \"translation\": [\n {\n \"lang\": \"zh_CN\",\n \"name\": \"网络发送丢包率\",\n \"note\": \"节点指标\\n类型: *\"\n },\n {\n \"lang\": \"en_US\",\n \"name\": \"Network transmission packet loss rate\",\n \"note\": \"Node indicators \\nType: *\"\n }\n ]\n },\n {\n \"uuid\": 1745735239710266000,\n \"collector\": \"Node\",\n \"typ\": \"Kubernetes\",\n \"name\": \"网络发送带宽\",\n \"unit\": \"\",\n \"note\": \"节点指标\\n类型: *\",\n \"lang\": \"zh_CN\",\n \"expression\": \"sum(rate(node_network_transmit_bytes_total[5m]) * on(instance, cluster) group_left(nodename) node_uname_info{nodename=~\\\"$node_name\\\"})\",\n \"translation\": [\n {\n \"lang\": \"zh_CN\",\n \"name\": \"网络发送带宽\",\n \"note\": \"节点指标\\n类型: *\"\n },\n {\n \"lang\": \"en_US\",\n \"name\": \"Network transmission bandwidth\",\n \"note\": \"Node indicators \\nType: *\"\n }\n ]\n },\n {\n \"uuid\": 1745735239716205000,\n \"collector\": \"Node\",\n \"typ\": \"Kubernetes\",\n \"name\": \"网络发送错误率\",\n \"unit\": \"\",\n \"note\": \"节点指标\\n类型: *\",\n \"lang\": \"zh_CN\",\n \"expression\": \"sum(rate(node_network_transmit_errs_total[5m]) * on(instance, cluster) group_left(nodename) node_uname_info{nodename=~\\\"$node_name\\\"})\",\n \"translation\": [\n {\n \"lang\": \"zh_CN\",\n \"name\": \"网络发送错误率\",\n \"note\": \"节点指标\\n类型: *\"\n },\n {\n \"lang\": \"en_US\",\n \"name\": \"Network transmission error rate\",\n \"note\": \"Node indicators \\nType: *\"\n }\n ]\n },\n {\n \"uuid\": 1745735239721688800,\n \"collector\": \"Node\",\n \"typ\": \"Kubernetes\",\n \"name\": \"网络接收丢包率\",\n \"unit\": \"\",\n \"note\": \"节点指标\\n类型: *\",\n \"lang\": \"zh_CN\",\n \"expression\": \"sum(rate(node_network_receive_drop_total[5m]) * on(instance, cluster) group_left(nodename) node_uname_info{nodename=~\\\"$node_name\\\"})\",\n \"translation\": [\n {\n \"lang\": \"zh_CN\",\n \"name\": \"网络接收丢包率\",\n \"note\": \"节点指标\\n类型: *\"\n },\n {\n \"lang\": \"en_US\",\n \"name\": \"Network reception packet loss rate\",\n \"note\": \"Node indicators \\nType: *\"\n }\n ]\n },\n {\n \"uuid\": 1745735239707241500,\n \"collector\": \"Node\",\n \"typ\": \"Kubernetes\",\n \"name\": \"网络接收带宽\",\n \"unit\": \"\",\n \"note\": \"节点指标\\n类型: *\",\n \"lang\": \"zh_CN\",\n \"expression\": \"sum(rate(node_network_receive_bytes_total[5m]) * on(instance, cluster) group_left(nodename) node_uname_info{nodename=~\\\"$node_name\\\"})\",\n \"translation\": [\n {\n \"lang\": \"zh_CN\",\n \"name\": \"网络接收带宽\",\n \"note\": \"节点指标\\n类型: *\"\n },\n {\n \"lang\": \"en_US\",\n \"name\": \"Network reception bandwidth\",\n \"note\": \"Node indicators \\nType: *\"\n }\n ]\n },\n {\n \"uuid\": 1745735239713318000,\n \"collector\": \"Node\",\n \"typ\": \"Kubernetes\",\n \"name\": \"网络接收错误率\",\n \"unit\": \"\",\n \"note\": \"节点指标\\n类型: *\",\n \"lang\": \"zh_CN\",\n \"expression\": \"sum(rate(node_network_receive_errs_total[5m]) * on(instance, cluster) group_left(nodename) node_uname_info{nodename=~\\\"$node_name\\\"})\",\n \"translation\": [\n {\n \"lang\": \"zh_CN\",\n \"name\": \"网络接收错误率\",\n \"note\": \"节点指标\\n类型: *\"\n },\n {\n \"lang\": \"en_US\",\n \"name\": \"Network reception error rate\",\n \"note\": \"Node indicators \\nType: *\"\n }\n ]\n },\n {\n \"uuid\": 1745735239783181800,\n \"collector\": \"Node\",\n \"typ\": \"Kubernetes\",\n \"name\": \"网络连接跟踪条目数\",\n \"unit\": \"\",\n \"note\": \"节点指标\\n类型: *\",\n \"lang\": \"zh_CN\",\n \"expression\": \"node_nf_conntrack_entries * on(instance, cluster) group_left(nodename) node_uname_info{nodename=~\\\"$node_name\\\"}\",\n \"translation\": [\n {\n \"lang\": \"zh_CN\",\n \"name\": \"网络连接跟踪条目数\",\n \"note\": \"节点指标\\n类型: *\"\n },\n {\n \"lang\": \"en_US\",\n \"name\": \"Number of network connection tracking entries\",\n \"note\": \"Node indicators \\nType: *\"\n }\n ]\n },\n {\n \"uuid\": 1745735239786134000,\n \"collector\": \"Node\",\n \"typ\": \"Kubernetes\",\n \"name\": \"网络连接跟踪限制\",\n \"unit\": \"\",\n \"note\": \"节点指标\\n类型: *\",\n \"lang\": \"zh_CN\",\n \"expression\": \"node_nf_conntrack_entries_limit * on(instance, cluster) group_left(nodename) node_uname_info{nodename=~\\\"$node_name\\\"}\",\n \"translation\": [\n {\n \"lang\": \"zh_CN\",\n \"name\": \"网络连接跟踪限制\",\n \"note\": \"节点指标\\n类型: *\"\n },\n {\n \"lang\": \"en_US\",\n \"name\": \"Network connection tracking restrictions\",\n \"note\": \"Node indicators \\nType: *\"\n }\n ]\n },\n {\n \"uuid\": 1745735239675145700,\n \"collector\": \"Node\",\n \"typ\": \"Kubernetes\",\n \"name\": \"节点 CPU 使用率\",\n \"unit\": \"\",\n \"note\": \"节点指标\\n类型: by\",\n \"lang\": \"zh_CN\",\n \"expression\": \"sum by (instance) (rate(node_cpu_seconds_total{mode!~\\\"idle|iowait|steal\\\"}[5m])) * on(instance) group_left(nodename) node_uname_info{nodename=~\\\"$node_name\\\"} *100\",\n \"translation\": [\n {\n \"lang\": \"zh_CN\",\n \"name\": \"节点 CPU 使用率\",\n \"note\": \"节点指标\\n类型: by\"\n },\n {\n \"lang\": \"en_US\",\n \"name\": \"Node CPU usage\",\n \"note\": \"Node indicators \\nType: by\"\n }\n ]\n },\n {\n \"uuid\": 1745735239691192000,\n \"collector\": \"Node\",\n \"typ\": \"Kubernetes\",\n \"name\": \"节点15分钟负载\",\n \"unit\": \"\",\n \"note\": \"节点指标\\n类型: *\",\n \"lang\": \"zh_CN\",\n \"expression\": \"node_load15 * on(instance, cluster) group_left(nodename) node_uname_info{nodename=~\\\"$node_name\\\"}\",\n \"translation\": [\n {\n \"lang\": \"zh_CN\",\n \"name\": \"节点15分钟负载\",\n \"note\": \"节点指标\\n类型: *\"\n },\n {\n \"lang\": \"en_US\",\n \"name\": \"Node 15-minute load\",\n \"note\": \"Node indicators \\nType: *\"\n }\n ]\n },\n {\n \"uuid\": 1745735239685264100,\n \"collector\": \"Node\",\n \"typ\": \"Kubernetes\",\n \"name\": \"节点1分钟负载\",\n \"unit\": \"\",\n \"note\": \"节点指标\\n类型: *\",\n \"lang\": \"zh_CN\",\n \"expression\": \"node_load1 * on(instance, cluster) group_left(nodename) node_uname_info{nodename=~\\\"$node_name\\\"}\",\n \"translation\": [\n {\n \"lang\": \"zh_CN\",\n \"name\": \"节点1分钟负载\",\n \"note\": \"节点指标\\n类型: *\"\n },\n {\n \"lang\": \"en_US\",\n \"name\": \"Node 1 minute load\",\n \"note\": \"Node indicators \\nType: *\"\n }\n ]\n },\n {\n \"uuid\": 1745735239688232700,\n \"collector\": \"Node\",\n \"typ\": \"Kubernetes\",\n \"name\": \"节点5分钟负载\",\n \"unit\": \"\",\n \"note\": \"节点指标\\n类型: *\",\n \"lang\": \"zh_CN\",\n \"expression\": \"node_load5 * on(instance, cluster) group_left(nodename) node_uname_info{nodename=~\\\"$node_name\\\"}\",\n \"translation\": [\n {\n \"lang\": \"zh_CN\",\n \"name\": \"节点5分钟负载\",\n \"note\": \"节点指标\\n类型: *\"\n },\n {\n \"lang\": \"en_US\",\n \"name\": \"Node 5-minute load\",\n \"note\": \"Node indicators \\nType: *\"\n }\n ]\n },\n {\n \"uuid\": 1745735239776256800,\n \"collector\": \"Node\",\n \"typ\": \"Kubernetes\",\n \"name\": \"节点Swap使用量\",\n \"unit\": \"\",\n \"note\": \"节点指标\\n类型: *\",\n \"lang\": \"zh_CN\",\n \"expression\": \"node_memory_SwapTotal_bytes * on(instance, cluster) group_left(nodename) node_uname_info{nodename=~\\\"$node_name\\\"} - node_memory_SwapFree_bytes * on(instance, cluster) group_left(nodename) node_uname_info{nodename=~\\\"$node_name\\\"}\",\n \"translation\": [\n {\n \"lang\": \"zh_CN\",\n \"name\": \"节点Swap使用量\",\n \"note\": \"节点指标\\n类型: *\"\n },\n {\n \"lang\": \"en_US\",\n \"name\": \"Node Swap usage\",\n \"note\": \"Node indicators \\nType: *\"\n }\n ]\n },\n {\n \"uuid\": 1745735239779806500,\n \"collector\": \"Node\",\n \"typ\": \"Kubernetes\",\n \"name\": \"节点Swap总量\",\n \"unit\": \"\",\n \"note\": \"节点指标\\n类型: *\",\n \"lang\": \"zh_CN\",\n \"expression\": \"node_memory_SwapTotal_bytes * on(instance, cluster) group_left(nodename) node_uname_info{nodename=~\\\"$node_name\\\"}\",\n \"translation\": [\n {\n \"lang\": \"zh_CN\",\n \"name\": \"节点Swap总量\",\n \"note\": \"节点指标\\n类型: *\"\n },\n {\n \"lang\": \"en_US\",\n \"name\": \"Total Node Swap\",\n \"note\": \"Node indicators \\nType: *\"\n }\n ]\n },\n {\n \"uuid\": 1745735239681529300,\n \"collector\": \"Node\",\n \"typ\": \"Kubernetes\",\n \"name\": \"节点上运行的Pod数量\",\n \"unit\": \"\",\n \"note\": \"节点指标\\n类型: *\",\n \"lang\": \"zh_CN\",\n \"expression\": \"sum(kube_pod_info * on(node) group_left(nodename) node_uname_info{nodename=~\\\"$node_name\\\"})\",\n \"translation\": [\n {\n \"lang\": \"zh_CN\",\n \"name\": \"节点上运行的Pod数量\",\n \"note\": \"节点指标\\n类型: *\"\n },\n {\n \"lang\": \"en_US\",\n \"name\": \"Number of Pods running on a node\",\n \"note\": \"Node indicators \\nType: *\"\n }\n ]\n },\n {\n \"uuid\": 1745735239678397700,\n \"collector\": \"Node\",\n \"typ\": \"Kubernetes\",\n \"name\": \"节点内存使用率\",\n \"unit\": \"\",\n \"note\": \"节点指标\\n类型: *\",\n \"lang\": \"zh_CN\",\n \"expression\": \"sum(node_memory_MemTotal_bytes * on(instance, cluster) group_left(nodename) node_uname_info{nodename=~\\\"$node_name\\\"} - node_memory_MemAvailable_bytes * on(instance, cluster) group_left(nodename) node_uname_info{nodename=~\\\"$node_name\\\"}) / sum(node_memory_MemTotal_bytes * on(instance, cluster) group_left(nodename) node_uname_info{nodename=~\\\"$node_name\\\"})\",\n \"translation\": [\n {\n \"lang\": \"zh_CN\",\n \"name\": \"节点内存使用率\",\n \"note\": \"节点指标\\n类型: *\"\n },\n {\n \"lang\": \"en_US\",\n \"name\": \"Node memory usage\",\n \"note\": \"Node indicators \\nType: *\"\n }\n ]\n },\n {\n \"uuid\": 1745735239760507400,\n \"collector\": \"Node\",\n \"typ\": \"Kubernetes\",\n \"name\": \"节点内存详细信息 - 可用\",\n \"unit\": \"\",\n \"note\": \"节点指标\\n类型: *\",\n \"lang\": \"zh_CN\",\n \"expression\": \"node_memory_MemAvailable_bytes * on(instance, cluster) group_left(nodename) node_uname_info{nodename=~\\\"$node_name\\\"}\",\n \"translation\": [\n {\n \"lang\": \"zh_CN\",\n \"name\": \"节点内存详细信息 - 可用\",\n \"note\": \"节点指标\\n类型: *\"\n },\n {\n \"lang\": \"en_US\",\n \"name\": \"Node memory details-Available\",\n \"note\": \"Node indicators \\nType: *\"\n }\n ]\n },\n {\n \"uuid\": 1745735239756641800,\n \"collector\": \"Node\",\n \"typ\": \"Kubernetes\",\n \"name\": \"节点内存详细信息 - 总量\",\n \"unit\": \"\",\n \"note\": \"节点指标\\n类型: *\",\n \"lang\": \"zh_CN\",\n \"expression\": \"node_memory_MemTotal_bytes * on(instance, cluster) group_left(nodename) node_uname_info{nodename=~\\\"$node_name\\\"}\",\n \"translation\": [\n {\n \"lang\": \"zh_CN\",\n \"name\": \"节点内存详细信息 - 总量\",\n \"note\": \"节点指标\\n类型: *\"\n },\n {\n \"lang\": \"en_US\",\n \"name\": \"Node Memory Details-Total\",\n \"note\": \"Node indicators \\nType: *\"\n }\n ]\n },\n {\n \"uuid\": 1745735239772786200,\n \"collector\": \"Node\",\n \"typ\": \"Kubernetes\",\n \"name\": \"节点内存详细信息 - 空闲\",\n \"unit\": \"\",\n \"note\": \"节点指标\\n类型: *\",\n \"lang\": \"zh_CN\",\n \"expression\": \"node_memory_MemFree_bytes * on(instance, cluster) group_left(nodename) node_uname_info{nodename=~\\\"$node_name\\\"}\",\n \"translation\": [\n {\n \"lang\": \"zh_CN\",\n \"name\": \"节点内存详细信息 - 空闲\",\n \"note\": \"节点指标\\n类型: *\"\n },\n {\n \"lang\": \"en_US\",\n \"name\": \"Node memory details-free\",\n \"note\": \"Node indicators \\nType: *\"\n }\n ]\n },\n {\n \"uuid\": 1745735239769542000,\n \"collector\": \"Node\",\n \"typ\": \"Kubernetes\",\n \"name\": \"节点内存详细信息 - 缓冲区\",\n \"unit\": \"\",\n \"note\": \"节点指标\\n类型: *\",\n \"lang\": \"zh_CN\",\n \"expression\": \"node_memory_Buffers_bytes * on(instance, cluster) group_left(nodename) node_uname_info{nodename=~\\\"$node_name\\\"}\",\n \"translation\": [\n {\n \"lang\": \"zh_CN\",\n \"name\": \"节点内存详细信息 - 缓冲区\",\n \"note\": \"节点指标\\n类型: *\"\n },\n {\n \"lang\": \"en_US\",\n \"name\": \"Node Memory Details-Buffer\",\n \"note\": \"Node indicators \\nType: *\"\n }\n ]\n },\n {\n \"uuid\": 1745735239764136000,\n \"collector\": \"Node\",\n \"typ\": \"Kubernetes\",\n \"name\": \"节点内存详细信息 - 缓存\",\n \"unit\": \"\",\n \"note\": \"节点指标\\n类型: *\",\n \"lang\": \"zh_CN\",\n \"expression\": \"node_memory_Cached_bytes * on(instance, cluster) group_left(nodename) node_uname_info{nodename=~\\\"$node_name\\\"}\",\n \"translation\": [\n {\n \"lang\": \"zh_CN\",\n \"name\": \"节点内存详细信息 - 缓存\",\n \"note\": \"节点指标\\n类型: *\"\n },\n {\n \"lang\": \"en_US\",\n \"name\": \"Node Memory Details-Cache\",\n \"note\": \"Node indicators \\nType: *\"\n }\n ]\n }\n]"
},
{
"path": "integrations/Kubernetes/metrics/k8s-pod.json",
"content": "[\n {\n \"uuid\": 1745893024149445000,\n \"collector\": \"Pod\",\n \"typ\": \"Kubernetes\",\n \"name\": \"Inode数量\",\n \"unit\": \"\",\n \"note\": \"Pod自身指标\\n类型: pod=~\\\"$pod_name\\\",\",\n \"lang\": \"zh_CN\",\n \"expression\": \"sum(container_fs_inodes_total{namespace=\\\"$namespace\\\", pod=~\\\"$pod_name\\\", image!~\\\".*pause.*\\\"}) by (name)\",\n \"translation\": [\n {\n \"lang\": \"zh_CN\",\n \"name\": \"Inode数量\",\n \"note\": \"Pod自身指标\\n类型: pod=~\\\"$pod_name\\\",\"\n },\n {\n \"lang\": \"en_US\",\n \"name\": \"Number of Inodes\",\n \"note\": \"Pod's own indicators \\nType: pod = ~ \\\"$pod _ name\\\",\"\n }\n ]\n },\n {\n \"uuid\": 1745893024121015300,\n \"collector\": \"Pod\",\n \"typ\": \"Kubernetes\",\n \"name\": \"不可中断任务数量\",\n \"unit\": \"\",\n \"note\": \"Pod自身指标\\n类型: pod=~\\\"$pod_name\\\",\",\n \"lang\": \"zh_CN\",\n \"expression\": \"sum(container_tasks_state{namespace=\\\"$namespace\\\", pod=~\\\"$pod_name\\\", image!~\\\".*pause.*\\\", state=\\\"uninterruptible\\\"}) by (name)\",\n \"translation\": [\n {\n \"lang\": \"zh_CN\",\n \"name\": \"不可中断任务数量\",\n \"note\": \"Pod自身指标\\n类型: pod=~\\\"$pod_name\\\",\"\n },\n {\n \"lang\": \"en_US\",\n \"name\": \"Number of uninterruptible tasks\",\n \"note\": \"Pod's own indicators \\nType: pod = ~ \\\"$pod _ name\\\",\"\n }\n ]\n },\n {\n \"uuid\": 1745893024130551800,\n \"collector\": \"Pod\",\n \"typ\": \"Kubernetes\",\n \"name\": \"容器cache使用\",\n \"unit\": \"\",\n \"note\": \"Pod自身指标\\n类型: pod=~\\\"$pod_name\\\",\",\n \"lang\": \"zh_CN\",\n \"expression\": \"(sum(container_memory_cache{namespace=\\\"$namespace\\\", pod=~\\\"$pod_name\\\", image!~\\\".*pause.*\\\"}) by (name))\",\n \"translation\": [\n {\n \"lang\": \"zh_CN\",\n \"name\": \"容器cache使用\",\n \"note\": \"Pod自身指标\\n类型: pod=~\\\"$pod_name\\\",\"\n },\n {\n \"lang\": \"en_US\",\n \"name\": \"Container cache use\",\n \"note\": \"Pod's own indicators \\nType: pod = ~ \\\"$pod _ name\\\",\"\n }\n ]\n },\n {\n \"uuid\": 1745893024108569900,\n \"collector\": \"Pod\",\n \"typ\": \"Kubernetes\",\n \"name\": \"容器CPU Limit\",\n \"unit\": \"\",\n \"note\": \"Pod自身指标\\n类型: pod=~\\\"$pod_name\\\"}/container_spec_cpu_period{namespace=\\\"$namespace\\\",\",\n \"lang\": \"zh_CN\",\n \"expression\": \"(sum(container_spec_cpu_quota{namespace=\\\"$namespace\\\", pod=~\\\"$pod_name\\\"}/container_spec_cpu_period{namespace=\\\"$namespace\\\", pod=~\\\"$pod_name\\\"}) by (name))\",\n \"translation\": [\n {\n \"lang\": \"zh_CN\",\n \"name\": \"容器CPU Limit\",\n \"note\": \"Pod自身指标\\n类型: pod=~\\\"$pod_name\\\"}/container_spec_cpu_period{namespace=\\\"$namespace\\\",\"\n },\n {\n \"lang\": \"en_US\",\n \"name\": \"Container CPU Limit\",\n \"note\": \"Pod's own indicators \\nType: pod = ~ \\\"$pod _ name\\\"}/container _ spec _ cpu _ period {namespace = \\\"$namespace\\\",\"\n }\n ]\n },\n {\n \"uuid\": 1745893024112672500,\n \"collector\": \"Pod\",\n \"typ\": \"Kubernetes\",\n \"name\": \"容器CPU load 10\",\n \"unit\": \"\",\n \"note\": \"Pod自身指标\\n类型: pod=~\\\"$pod_name\\\",\",\n \"lang\": \"zh_CN\",\n \"expression\": \"sum(container_cpu_load_average_10s{namespace=\\\"$namespace\\\", pod=~\\\"$pod_name\\\", image!~\\\".*pause.*\\\"}) by (name)\",\n \"translation\": [\n {\n \"lang\": \"zh_CN\",\n \"name\": \"容器CPU load 10\",\n \"note\": \"Pod自身指标\\n类型: pod=~\\\"$pod_name\\\",\"\n },\n {\n \"lang\": \"en_US\",\n \"name\": \"Container CPU load 10\",\n \"note\": \"Pod's own indicators \\nType: pod = ~ \\\"$pod _ name\\\",\"\n }\n ]\n },\n {\n \"uuid\": 1745893024026246700,\n \"collector\": \"Pod\",\n \"typ\": \"Kubernetes\",\n \"name\": \"容器CPU使用率\",\n \"unit\": \"\",\n \"note\": \"Pod自身指标\\n类型: pod=~\\\"$pod_name\\\",\",\n \"lang\": \"zh_CN\",\n \"expression\": \"sum(rate(container_cpu_usage_seconds_total{namespace=\\\"$namespace\\\", pod=~\\\"$pod_name\\\", image!~\\\".*pause.*\\\"}[1m])*100) by(name)\",\n \"translation\": [\n {\n \"lang\": \"zh_CN\",\n \"name\": \"容器CPU使用率\",\n \"note\": \"Pod自身指标\\n类型: pod=~\\\"$pod_name\\\",\"\n },\n {\n \"lang\": \"en_US\",\n \"name\": \"Container CPU usage\",\n \"note\": \"Pod's own indicators \\nType: pod = ~ \\\"$pod _ name\\\",\"\n }\n ]\n },\n {\n \"uuid\": 1745893024029544000,\n \"collector\": \"Pod\",\n \"typ\": \"Kubernetes\",\n \"name\": \"容器CPU归一化后使用率\",\n \"unit\": \"\",\n \"note\": \"Pod自身指标\\n类型: pod=~\\\"$pod_name\\\",\",\n \"lang\": \"zh_CN\",\n \"expression\": \"sum(rate(container_cpu_usage_seconds_total{namespace=\\\"$namespace\\\", pod=~\\\"$pod_name\\\", image!~\\\".*pause.*\\\"}[1m])*100) by(name)/((sum(container_spec_cpu_quota{namespace=\\\"$namespace\\\", pod=~\\\"$pod_name\\\"}/container_spec_cpu_period{namespace=\\\"$namespace\\\", pod=~\\\"$pod_name\\\"}) by (name)))\",\n \"translation\": [\n {\n \"lang\": \"zh_CN\",\n \"name\": \"容器CPU归一化后使用率\",\n \"note\": \"Pod自身指标\\n类型: pod=~\\\"$pod_name\\\",\"\n },\n {\n \"lang\": \"en_US\",\n \"name\": \"Container CPU usage after normalization\",\n \"note\": \"Pod's own indicators \\nType: pod = ~ \\\"$pod _ name\\\",\"\n }\n ]\n },\n {\n \"uuid\": 1745893024146207700,\n \"collector\": \"Pod\",\n \"typ\": \"Kubernetes\",\n \"name\": \"容器I/O\",\n \"unit\": \"\",\n \"note\": \"Pod自身指标\\n类型: pod=~\\\"$pod_name\\\",\",\n \"lang\": \"zh_CN\",\n \"expression\": \"sum(container_fs_io_current{namespace=\\\"$namespace\\\", pod=~\\\"$pod_name\\\", image!~\\\".*pause.*\\\"}) by (name)\",\n \"translation\": [\n {\n \"lang\": \"zh_CN\",\n \"name\": \"容器I/O\",\n \"note\": \"Pod自身指标\\n类型: pod=~\\\"$pod_name\\\",\"\n },\n {\n \"lang\": \"en_US\",\n \"name\": \"Container I/O\",\n \"note\": \"Pod's own indicators \\nType: pod = ~ \\\"$pod _ name\\\",\"\n }\n ]\n },\n {\n \"uuid\": 1745893024136457000,\n \"collector\": \"Pod\",\n \"typ\": \"Kubernetes\",\n \"name\": \"容器RSS内存使用\",\n \"unit\": \"\",\n \"note\": \"Pod自身指标\\n类型: pod=~\\\"$pod_name\\\",\",\n \"lang\": \"zh_CN\",\n \"expression\": \"(sum(container_memory_rss{namespace=\\\"$namespace\\\", pod=~\\\"$pod_name\\\", image!~\\\".*pause.*\\\"}) by (name))\",\n \"translation\": [\n {\n \"lang\": \"zh_CN\",\n \"name\": \"容器RSS内存使用\",\n \"note\": \"Pod自身指标\\n类型: pod=~\\\"$pod_name\\\",\"\n },\n {\n \"lang\": \"en_US\",\n \"name\": \"Container RSS memory usage\",\n \"note\": \"Pod's own indicators \\nType: pod = ~ \\\"$pod _ name\\\",\"\n }\n ]\n },\n {\n \"uuid\": 1745893024139900200,\n \"collector\": \"Pod\",\n \"typ\": \"Kubernetes\",\n \"name\": \"容器内存 Limit\",\n \"unit\": \"\",\n \"note\": \"Pod自身指标\\n类型: pod=~\\\"$pod_name\\\",\",\n \"lang\": \"zh_CN\",\n \"expression\": \"sum(container_spec_memory_limit_bytes{namespace=\\\"$namespace\\\", pod=~\\\"$pod_name\\\", image!~\\\".*pause.*\\\"}) by (name)\",\n \"translation\": [\n {\n \"lang\": \"zh_CN\",\n \"name\": \"容器内存 Limit\",\n \"note\": \"Pod自身指标\\n类型: pod=~\\\"$pod_name\\\",\"\n },\n {\n \"lang\": \"en_US\",\n \"name\": \"Container Memory Limit\",\n \"note\": \"Pod's own indicators \\nType: pod = ~ \\\"$pod _ name\\\",\"\n }\n ]\n },\n {\n \"uuid\": 1745893024032984300,\n \"collector\": \"Pod\",\n \"typ\": \"Kubernetes\",\n \"name\": \"容器内存使用\",\n \"unit\": \"\",\n \"note\": \"Pod自身指标\\n类型: pod=~\\\"$pod_name\\\",\",\n \"lang\": \"zh_CN\",\n \"expression\": \"(sum(container_memory_usage_bytes{namespace=\\\"$namespace\\\", pod=~\\\"$pod_name\\\", image!~\\\".*pause.*\\\"}) by (name))\",\n \"translation\": [\n {\n \"lang\": \"zh_CN\",\n \"name\": \"容器内存使用\",\n \"note\": \"Pod自身指标\\n类型: pod=~\\\"$pod_name\\\",\"\n },\n {\n \"lang\": \"en_US\",\n \"name\": \"Container memory usage\",\n \"note\": \"Pod's own indicators \\nType: pod = ~ \\\"$pod _ name\\\",\"\n }\n ]\n },\n {\n \"uuid\": 1745893024127585500,\n \"collector\": \"Pod\",\n \"typ\": \"Kubernetes\",\n \"name\": \"容器内存使用率\",\n \"unit\": \"\",\n \"note\": \"Pod自身指标\\n类型: pod=~\\\"$pod_name\\\",\",\n \"lang\": \"zh_CN\",\n \"expression\": \"((sum(container_memory_usage_bytes{namespace=\\\"$namespace\\\", pod=~\\\"$pod_name\\\", image!~\\\".*pause.*\\\"}) by (name)) /(sum(container_spec_memory_limit_bytes{namespace=\\\"$namespace\\\", pod=~\\\"$pod_name\\\", image!~\\\".*pause.*\\\"}) by (name)))*100\",\n \"translation\": [\n {\n \"lang\": \"zh_CN\",\n \"name\": \"容器内存使用率\",\n \"note\": \"Pod自身指标\\n类型: pod=~\\\"$pod_name\\\",\"\n },\n {\n \"lang\": \"en_US\",\n \"name\": \"Container memory usage\",\n \"note\": \"Pod's own indicators \\nType: pod = ~ \\\"$pod _ name\\\",\"\n }\n ]\n },\n {\n \"uuid\": 1745893024093620000,\n \"collector\": \"Pod\",\n \"typ\": \"Kubernetes\",\n \"name\": \"容器内核态CPU使用率\",\n \"unit\": \"\",\n \"note\": \"Pod自身指标\\n类型: pod=~\\\"$pod_name\\\",\",\n \"lang\": \"zh_CN\",\n \"expression\": \"sum(rate(container_cpu_system_seconds_total{namespace=\\\"$namespace\\\", pod=~\\\"$pod_name\\\", image!~\\\".*pause.*\\\"}[1m])*100) by(name)\",\n \"translation\": [\n {\n \"lang\": \"zh_CN\",\n \"name\": \"容器内核态CPU使用率\",\n \"note\": \"Pod自身指标\\n类型: pod=~\\\"$pod_name\\\",\"\n },\n {\n \"lang\": \"en_US\",\n \"name\": \"Container kernel mode CPU usage\",\n \"note\": \"Pod's own indicators \\nType: pod = ~ \\\"$pod _ name\\\",\"\n }\n ]\n },\n {\n \"uuid\": 1745893024102879000,\n \"collector\": \"Pod\",\n \"typ\": \"Kubernetes\",\n \"name\": \"容器发生CPU throttle的比率\",\n \"unit\": \"\",\n \"note\": \"Pod自身指标\\n类型: pod=~\\\"$pod_name\\\",\",\n \"lang\": \"zh_CN\",\n \"expression\": \"sum(rate(container_cpu_cfs_throttled_periods_total{namespace=\\\"$namespace\\\", pod=~\\\"$pod_name\\\", image!~\\\".*pause.*\\\"}[1m]))by(name) *100\",\n \"translation\": [\n {\n \"lang\": \"zh_CN\",\n \"name\": \"容器发生CPU throttle的比率\",\n \"note\": \"Pod自身指标\\n类型: pod=~\\\"$pod_name\\\",\"\n },\n {\n \"lang\": \"en_US\",\n \"name\": \"The rate at which container CPU throttle occurs\",\n \"note\": \"Pod's own indicators \\nType: pod = ~ \\\"$pod _ name\\\",\"\n }\n ]\n },\n {\n \"uuid\": 1745893024143177000,\n \"collector\": \"Pod\",\n \"typ\": \"Kubernetes\",\n \"name\": \"容器发生OOM次数\",\n \"unit\": \"\",\n \"note\": \"Pod自身指标\\n类型: pod=~\\\"$pod_name\\\",\",\n \"lang\": \"zh_CN\",\n \"expression\": \"sum(container_oom_events_total{namespace=\\\"$namespace\\\", pod=~\\\"$pod_name\\\", image!~\\\".*pause.*\\\"}) by (name)\",\n \"translation\": [\n {\n \"lang\": \"zh_CN\",\n \"name\": \"容器发生OOM次数\",\n \"note\": \"Pod自身指标\\n类型: pod=~\\\"$pod_name\\\",\"\n },\n {\n \"lang\": \"en_US\",\n \"name\": \"Number of OOM occurrences for container\",\n \"note\": \"Pod's own indicators \\nType: pod = ~ \\\"$pod _ name\\\",\"\n }\n ]\n },\n {\n \"uuid\": 1745893024083942000,\n \"collector\": \"Pod\",\n \"typ\": \"Kubernetes\",\n \"name\": \"容器启动时长(小时)\",\n \"unit\": \"\",\n \"note\": \"Pod自身指标\\n类型: pod=~\\\"$pod_name\\\",\",\n \"lang\": \"zh_CN\",\n \"expression\": \"sum((time()-container_start_time_seconds{namespace=\\\"$namespace\\\", pod=~\\\"$pod_name\\\", image!~\\\".*pause.*\\\"})) by (name)\",\n \"translation\": [\n {\n \"lang\": \"zh_CN\",\n \"name\": \"容器启动时长(小时)\",\n \"note\": \"Pod自身指标\\n类型: pod=~\\\"$pod_name\\\",\"\n },\n {\n \"lang\": \"en_US\",\n \"name\": \"Container startup time (hours)\",\n \"note\": \"Pod's own indicators \\nType: pod = ~ \\\"$pod _ name\\\",\"\n }\n ]\n },\n {\n \"uuid\": 1745893024152466200,\n \"collector\": \"Pod\",\n \"typ\": \"Kubernetes\",\n \"name\": \"容器已使用的文件系统大小\",\n \"unit\": \"\",\n \"note\": \"Pod自身指标\\n类型: pod=~\\\"$pod_name\\\",\",\n \"lang\": \"zh_CN\",\n \"expression\": \"sum(container_fs_usage_bytes{namespace=\\\"$namespace\\\", pod=~\\\"$pod_name\\\", image!~\\\".*pause.*\\\"}) by (name)\",\n \"translation\": [\n {\n \"lang\": \"zh_CN\",\n \"name\": \"容器已使用的文件系统大小\",\n \"note\": \"Pod自身指标\\n类型: pod=~\\\"$pod_name\\\",\"\n },\n {\n \"lang\": \"en_US\",\n \"name\": \"File system size used by the container\",\n \"note\": \"Pod's own indicators \\nType: pod = ~ \\\"$pod _ name\\\",\"\n }\n ]\n },\n {\n \"uuid\": 1745893024097849600,\n \"collector\": \"Pod\",\n \"typ\": \"Kubernetes\",\n \"name\": \"容器用户态CPU使用率\",\n \"unit\": \"\",\n \"note\": \"Pod自身指标\\n类型: pod=~\\\"$pod_name\\\",\",\n \"lang\": \"zh_CN\",\n \"expression\": \"sum(rate(container_cpu_user_seconds_total{namespace=\\\"$namespace\\\", pod=~\\\"$pod_name\\\", image!~\\\".*pause.*\\\"}[1m])*100) by(name)\",\n \"translation\": [\n {\n \"lang\": \"zh_CN\",\n \"name\": \"容器用户态CPU使用率\",\n \"note\": \"Pod自身指标\\n类型: pod=~\\\"$pod_name\\\",\"\n },\n {\n \"lang\": \"en_US\",\n \"name\": \"Container user mode CPU usage\",\n \"note\": \"Pod's own indicators \\nType: pod = ~ \\\"$pod _ name\\\",\"\n }\n ]\n },\n {\n \"uuid\": 1745893024036896800,\n \"collector\": \"Pod\",\n \"typ\": \"Kubernetes\",\n \"name\": \"文件系统写入速率\",\n \"unit\": \"\",\n \"note\": \"Pod自身指标\\n类型: pod=~\\\"$pod_name\\\",\",\n \"lang\": \"zh_CN\",\n \"expression\": \"sum(rate(container_fs_writes_bytes_total{namespace=\\\"$namespace\\\", pod=~\\\"$pod_name\\\", image!~\\\".*pause.*\\\"}[1m])) by(name)\",\n \"translation\": [\n {\n \"lang\": \"zh_CN\",\n \"name\": \"文件系统写入速率\",\n \"note\": \"Pod自身指标\\n类型: pod=~\\\"$pod_name\\\",\"\n },\n {\n \"lang\": \"en_US\",\n \"name\": \"File system write rate\",\n \"note\": \"Pod's own indicators \\nType: pod = ~ \\\"$pod _ name\\\",\"\n }\n ]\n },\n {\n \"uuid\": 1745893024057722000,\n \"collector\": \"Pod\",\n \"typ\": \"Kubernetes\",\n \"name\": \"文件系统读取速率\",\n \"unit\": \"\",\n \"note\": \"Pod自身指标\\n类型: pod=~\\\"$pod_name\\\",\",\n \"lang\": \"zh_CN\",\n \"expression\": \"sum(rate(container_fs_reads_bytes_total{namespace=\\\"$namespace\\\", pod=~\\\"$pod_name\\\", image!~\\\".*pause.*\\\"}[1m])) by(name)\",\n \"translation\": [\n {\n \"lang\": \"zh_CN\",\n \"name\": \"文件系统读取速率\",\n \"note\": \"Pod自身指标\\n类型: pod=~\\\"$pod_name\\\",\"\n },\n {\n \"lang\": \"en_US\",\n \"name\": \"File system read rate\",\n \"note\": \"Pod's own indicators \\nType: pod = ~ \\\"$pod _ name\\\",\"\n }\n ]\n },\n {\n \"uuid\": 1745893024166898000,\n \"collector\": \"Pod\",\n \"typ\": \"Kubernetes\",\n \"name\": \"网络发送丢包数\",\n \"unit\": \"\",\n \"note\": \"Pod自身指标\\n类型: pod=~\\\"$pod_name\\\"}[1m]))\",\n \"lang\": \"zh_CN\",\n \"expression\": \"sum(rate(container_network_transmit_packets_dropped_total{namespace=\\\"$namespace\\\", pod=~\\\"$pod_name\\\"}[1m])) by(name, interface)\",\n \"translation\": [\n {\n \"lang\": \"zh_CN\",\n \"name\": \"网络发送丢包数\",\n \"note\": \"Pod自身指标\\n类型: pod=~\\\"$pod_name\\\"}[1m]))\"\n },\n {\n \"lang\": \"en_US\",\n \"name\": \"Number of packets lost by network transmission\",\n \"note\": \"Pod's own indicators \\nType: pod = ~ \\\"$pod _ name\\\"} [1m]))\"\n }\n ]\n },\n {\n \"uuid\": 1745893024160266500,\n \"collector\": \"Pod\",\n \"typ\": \"Kubernetes\",\n \"name\": \"网络发送数据包\",\n \"unit\": \"\",\n \"note\": \"Pod自身指标\\n类型: pod=~\\\"$pod_name\\\"}[1m]))\",\n \"lang\": \"zh_CN\",\n \"expression\": \"sum(rate(container_network_transmit_packets_total{namespace=\\\"$namespace\\\", pod=~\\\"$pod_name\\\"}[1m])) by(name, interface)\",\n \"translation\": [\n {\n \"lang\": \"zh_CN\",\n \"name\": \"网络发送数据包\",\n \"note\": \"Pod自身指标\\n类型: pod=~\\\"$pod_name\\\"}[1m]))\"\n },\n {\n \"lang\": \"en_US\",\n \"name\": \"The network sends packets\",\n \"note\": \"Pod's own indicators \\nType: pod = ~ \\\"$pod _ name\\\"} [1m]))\"\n }\n ]\n },\n {\n \"uuid\": 1745893024069935000,\n \"collector\": \"Pod\",\n \"typ\": \"Kubernetes\",\n \"name\": \"网络发送速率\",\n \"unit\": \"\",\n \"note\": \"Pod自身指标\\n类型: pod=~\\\"$pod_name\\\"}[1m]))\",\n \"lang\": \"zh_CN\",\n \"expression\": \"sum(rate(container_network_transmit_bytes_total{namespace=\\\"$namespace\\\", pod=~\\\"$pod_name\\\"}[1m])) by(name, interface)\",\n \"translation\": [\n {\n \"lang\": \"zh_CN\",\n \"name\": \"网络发送速率\",\n \"note\": \"Pod自身指标\\n类型: pod=~\\\"$pod_name\\\"}[1m]))\"\n },\n {\n \"lang\": \"en_US\",\n \"name\": \"Network transmission rate\",\n \"note\": \"Pod's own indicators \\nType: pod = ~ \\\"$pod _ name\\\"} [1m]))\"\n }\n ]\n },\n {\n \"uuid\": 1745893024163721700,\n \"collector\": \"Pod\",\n \"typ\": \"Kubernetes\",\n \"name\": \"网络发送错误数\",\n \"unit\": \"\",\n \"note\": \"Pod自身指标\\n类型: pod=~\\\"$pod_name\\\"}[1m]))\",\n \"lang\": \"zh_CN\",\n \"expression\": \"sum(rate(container_network_transmit_errors_total{namespace=\\\"$namespace\\\", pod=~\\\"$pod_name\\\"}[1m])) by(name, interface)\",\n \"translation\": [\n {\n \"lang\": \"zh_CN\",\n \"name\": \"网络发送错误数\",\n \"note\": \"Pod自身指标\\n类型: pod=~\\\"$pod_name\\\"}[1m]))\"\n },\n {\n \"lang\": \"en_US\",\n \"name\": \"Number of network transmission errors\",\n \"note\": \"Pod's own indicators \\nType: pod = ~ \\\"$pod _ name\\\"} [1m]))\"\n }\n ]\n },\n {\n \"uuid\": 1745893024173485600,\n \"collector\": \"Pod\",\n \"typ\": \"Kubernetes\",\n \"name\": \"网络接收丢包数\",\n \"unit\": \"\",\n \"note\": \"Pod自身指标\\n类型: pod=~\\\"$pod_name\\\"}[1m]))\",\n \"lang\": \"zh_CN\",\n \"expression\": \"sum(rate(container_network_receive_packets_dropped_total{namespace=\\\"$namespace\\\", pod=~\\\"$pod_name\\\"}[1m])) by(name, interface)\",\n \"translation\": [\n {\n \"lang\": \"zh_CN\",\n \"name\": \"网络接收丢包数\",\n \"note\": \"Pod自身指标\\n类型: pod=~\\\"$pod_name\\\"}[1m]))\"\n },\n {\n \"lang\": \"en_US\",\n \"name\": \"Number of packet losses received by network\",\n \"note\": \"Pod's own indicators \\nType: pod = ~ \\\"$pod _ name\\\"} [1m]))\"\n }\n ]\n },\n {\n \"uuid\": 1745893024156389600,\n \"collector\": \"Pod\",\n \"typ\": \"Kubernetes\",\n \"name\": \"网络接收数据包数\",\n \"unit\": \"\",\n \"note\": \"Pod自身指标\\n类型: pod=~\\\"$pod_name\\\"}[1m]))\",\n \"lang\": \"zh_CN\",\n \"expression\": \"sum(rate(container_network_receive_packets_total{namespace=\\\"$namespace\\\", pod=~\\\"$pod_name\\\"}[1m])) by(name, interface)\",\n \"translation\": [\n {\n \"lang\": \"zh_CN\",\n \"name\": \"网络接收数据包数\",\n \"note\": \"Pod自身指标\\n类型: pod=~\\\"$pod_name\\\"}[1m]))\"\n },\n {\n \"lang\": \"en_US\",\n \"name\": \"Number of packets received by network\",\n \"note\": \"Pod's own indicators \\nType: pod = ~ \\\"$pod _ name\\\"} [1m]))\"\n }\n ]\n },\n {\n \"uuid\": 1745893024075864800,\n \"collector\": \"Pod\",\n \"typ\": \"Kubernetes\",\n \"name\": \"网络接收速率\",\n \"unit\": \"\",\n \"note\": \"Pod自身指标\\n类型: pod=~\\\"$pod_name\\\"}[1m]))\",\n \"lang\": \"zh_CN\",\n \"expression\": \"sum(rate(container_network_receive_bytes_total{namespace=\\\"$namespace\\\", pod=~\\\"$pod_name\\\"}[1m])) by(name, interface)\",\n \"translation\": [\n {\n \"lang\": \"zh_CN\",\n \"name\": \"网络接收速率\",\n \"note\": \"Pod自身指标\\n类型: pod=~\\\"$pod_name\\\"}[1m]))\"\n },\n {\n \"lang\": \"en_US\",\n \"name\": \"Network reception rate\",\n \"note\": \"Pod's own indicators \\nType: pod = ~ \\\"$pod _ name\\\"} [1m]))\"\n }\n ]\n },\n {\n \"uuid\": 1745893024170233300,\n \"collector\": \"Pod\",\n \"typ\": \"Kubernetes\",\n \"name\": \"网络接收错误数\",\n \"unit\": \"\",\n \"note\": \"Pod自身指标\\n类型: pod=~\\\"$pod_name\\\"}[1m]))\",\n \"lang\": \"zh_CN\",\n \"expression\": \"sum(rate(container_network_receive_errors_total{namespace=\\\"$namespace\\\", pod=~\\\"$pod_name\\\"}[1m])) by(name, interface)\",\n \"translation\": [\n {\n \"lang\": \"zh_CN\",\n \"name\": \"网络接收错误数\",\n \"note\": \"Pod自身指标\\n类型: pod=~\\\"$pod_name\\\"}[1m]))\"\n },\n {\n \"lang\": \"en_US\",\n \"name\": \"Number of network reception errors\",\n \"note\": \"Pod's own indicators \\nType: pod = ~ \\\"$pod _ name\\\"} [1m]))\"\n }\n ]\n }\n]"
},
{
"path": "integrations/Kubernetes/record-rules/kube-controller-plane.json",
"content": "[\n {\n \"cluster\": \"\",\n \"name\": \":node_memory_MemAvailable_bytes:sum\",\n \"note\": \"\",\n \"disabled\": 0,\n \"prom_ql\": \"sum(\\n node_memory_MemAvailable_bytes{job=\\\"node-exporter\\\"} or\\n (\\n node_memory_Buffers_bytes{job=\\\"node-exporter\\\"} +\\n node_memory_Cached_bytes{job=\\\"node-exporter\\\"} +\\n node_memory_MemFree_bytes{job=\\\"node-exporter\\\"} +\\n node_memory_Slab_bytes{job=\\\"node-exporter\\\"}\\n )\\n) by (cluster)\\n\",\n \"prom_eval_interval\": 15,\n \"append_tags\": []\n },\n {\n \"cluster\": \"\",\n \"name\": \"apiserver_request:availability30d\",\n \"note\": \"\",\n \"disabled\": 0,\n \"prom_ql\": \"1 - (\\n (\\n # write too slow\\n sum by (cluster) (cluster_verb_scope:apiserver_request_slo_duration_seconds_count:increase30d{verb=~\\\"POST|PUT|PATCH|DELETE\\\"})\\n -\\n sum by (cluster) (cluster_verb_scope_le:apiserver_request_slo_duration_seconds_bucket:increase30d{verb=~\\\"POST|PUT|PATCH|DELETE\\\",le=\\\"1\\\"})\\n ) +\\n (\\n # read too slow\\n sum by (cluster) (cluster_verb_scope:apiserver_request_slo_duration_seconds_count:increase30d{verb=~\\\"LIST|GET\\\"})\\n -\\n (\\n (\\n sum by (cluster) (cluster_verb_scope_le:apiserver_request_slo_duration_seconds_bucket:increase30d{verb=~\\\"LIST|GET\\\",scope=~\\\"resource|\\\",le=\\\"1\\\"})\\n or\\n vector(0)\\n )\\n +\\n sum by (cluster) (cluster_verb_scope_le:apiserver_request_slo_duration_seconds_bucket:increase30d{verb=~\\\"LIST|GET\\\",scope=\\\"namespace\\\",le=\\\"5\\\"})\\n +\\n sum by (cluster) (cluster_verb_scope_le:apiserver_request_slo_duration_seconds_bucket:increase30d{verb=~\\\"LIST|GET\\\",scope=\\\"cluster\\\",le=\\\"30\\\"})\\n )\\n ) +\\n # errors\\n sum by (cluster) (code:apiserver_request_total:increase30d{code=~\\\"5..\\\"} or vector(0))\\n)\\n/\\nsum by (cluster) (code:apiserver_request_total:increase30d)\\n\",\n \"prom_eval_interval\": 180,\n \"append_tags\": [\n \"verb=all\"\n ]\n },\n {\n \"cluster\": \"\",\n \"name\": \"apiserver_request:availability30d\",\n \"note\": \"\",\n \"disabled\": 0,\n \"prom_ql\": \"1 - (\\n sum by (cluster) (cluster_verb_scope:apiserver_request_slo_duration_seconds_count:increase30d{verb=~\\\"LIST|GET\\\"})\\n -\\n (\\n # too slow\\n (\\n sum by (cluster) (cluster_verb_scope_le:apiserver_request_slo_duration_seconds_bucket:increase30d{verb=~\\\"LIST|GET\\\",scope=~\\\"resource|\\\",le=\\\"1\\\"})\\n or\\n vector(0)\\n )\\n +\\n sum by (cluster) (cluster_verb_scope_le:apiserver_request_slo_duration_seconds_bucket:increase30d{verb=~\\\"LIST|GET\\\",scope=\\\"namespace\\\",le=\\\"5\\\"})\\n +\\n sum by (cluster) (cluster_verb_scope_le:apiserver_request_slo_duration_seconds_bucket:increase30d{verb=~\\\"LIST|GET\\\",scope=\\\"cluster\\\",le=\\\"30\\\"})\\n )\\n +\\n # errors\\n sum by (cluster) (code:apiserver_request_total:increase30d{verb=\\\"read\\\",code=~\\\"5..\\\"} or vector(0))\\n)\\n/\\nsum by (cluster) (code:apiserver_request_total:increase30d{verb=\\\"read\\\"})\\n\",\n \"prom_eval_interval\": 180,\n \"append_tags\": [\n \"verb=read\"\n ]\n },\n {\n \"cluster\": \"\",\n \"name\": \"apiserver_request:availability30d\",\n \"note\": \"\",\n \"disabled\": 0,\n \"prom_ql\": \"1 - (\\n (\\n # too slow\\n sum by (cluster) (cluster_verb_scope:apiserver_request_slo_duration_seconds_count:increase30d{verb=~\\\"POST|PUT|PATCH|DELETE\\\"})\\n -\\n sum by (cluster) (cluster_verb_scope_le:apiserver_request_slo_duration_seconds_bucket:increase30d{verb=~\\\"POST|PUT|PATCH|DELETE\\\",le=\\\"1\\\"})\\n )\\n +\\n # errors\\n sum by (cluster) (code:apiserver_request_total:increase30d{verb=\\\"write\\\",code=~\\\"5..\\\"} or vector(0))\\n)\\n/\\nsum by (cluster) (code:apiserver_request_total:increase30d{verb=\\\"write\\\"})\\n\",\n \"prom_eval_interval\": 180,\n \"append_tags\": [\n \"verb=write\"\n ]\n },\n {\n \"cluster\": \"\",\n \"name\": \"apiserver_request:burnrate1d\",\n \"note\": \"\",\n \"disabled\": 0,\n \"prom_ql\": \"(\\n (\\n # too slow\\n sum by (cluster) (rate(apiserver_request_slo_duration_seconds_count{job=\\\"apiserver\\\",verb=~\\\"LIST|GET\\\",subresource!~\\\"proxy|attach|log|exec|portforward\\\"}[1d]))\\n -\\n (\\n (\\n sum by (cluster) (rate(apiserver_request_slo_duration_seconds_bucket{job=\\\"apiserver\\\",verb=~\\\"LIST|GET\\\",subresource!~\\\"proxy|attach|log|exec|portforward\\\",scope=~\\\"resource|\\\",le=\\\"1\\\"}[1d]))\\n or\\n vector(0)\\n )\\n +\\n sum by (cluster) (rate(apiserver_request_slo_duration_seconds_bucket{job=\\\"apiserver\\\",verb=~\\\"LIST|GET\\\",subresource!~\\\"proxy|attach|log|exec|portforward\\\",scope=\\\"namespace\\\",le=\\\"5\\\"}[1d]))\\n +\\n sum by (cluster) (rate(apiserver_request_slo_duration_seconds_bucket{job=\\\"apiserver\\\",verb=~\\\"LIST|GET\\\",subresource!~\\\"proxy|attach|log|exec|portforward\\\",scope=\\\"cluster\\\",le=\\\"30\\\"}[1d]))\\n )\\n )\\n +\\n # errors\\n sum by (cluster) (rate(apiserver_request_total{job=\\\"apiserver\\\",verb=~\\\"LIST|GET\\\",code=~\\\"5..\\\"}[1d]))\\n)\\n/\\nsum by (cluster) (rate(apiserver_request_total{job=\\\"apiserver\\\",verb=~\\\"LIST|GET\\\"}[1d]))\\n\",\n \"prom_eval_interval\": 15,\n \"append_tags\": [\n \"verb=read\"\n ]\n },\n {\n \"cluster\": \"\",\n \"name\": \"apiserver_request:burnrate1d\",\n \"note\": \"\",\n \"disabled\": 0,\n \"prom_ql\": \"(\\n (\\n # too slow\\n sum by (cluster) (rate(apiserver_request_slo_duration_seconds_count{job=\\\"apiserver\\\",verb=~\\\"POST|PUT|PATCH|DELETE\\\",subresource!~\\\"proxy|attach|log|exec|portforward\\\"}[1d]))\\n -\\n sum by (cluster) (rate(apiserver_request_slo_duration_seconds_bucket{job=\\\"apiserver\\\",verb=~\\\"POST|PUT|PATCH|DELETE\\\",subresource!~\\\"proxy|attach|log|exec|portforward\\\",le=\\\"1\\\"}[1d]))\\n )\\n +\\n sum by (cluster) (rate(apiserver_request_total{job=\\\"apiserver\\\",verb=~\\\"POST|PUT|PATCH|DELETE\\\",code=~\\\"5..\\\"}[1d]))\\n)\\n/\\nsum by (cluster) (rate(apiserver_request_total{job=\\\"apiserver\\\",verb=~\\\"POST|PUT|PATCH|DELETE\\\"}[1d]))\\n\",\n \"prom_eval_interval\": 15,\n \"append_tags\": [\n \"verb=write\"\n ]\n },\n {\n \"cluster\": \"\",\n \"name\": \"apiserver_request:burnrate1h\",\n \"note\": \"\",\n \"disabled\": 0,\n \"prom_ql\": \"(\\n (\\n # too slow\\n sum by (cluster) (rate(apiserver_request_slo_duration_seconds_count{job=\\\"apiserver\\\",verb=~\\\"LIST|GET\\\",subresource!~\\\"proxy|attach|log|exec|portforward\\\"}[1h]))\\n -\\n (\\n (\\n sum by (cluster) (rate(apiserver_request_slo_duration_seconds_bucket{job=\\\"apiserver\\\",verb=~\\\"LIST|GET\\\",subresource!~\\\"proxy|attach|log|exec|portforward\\\",scope=~\\\"resource|\\\",le=\\\"1\\\"}[1h]))\\n or\\n vector(0)\\n )\\n +\\n sum by (cluster) (rate(apiserver_request_slo_duration_seconds_bucket{job=\\\"apiserver\\\",verb=~\\\"LIST|GET\\\",subresource!~\\\"proxy|attach|log|exec|portforward\\\",scope=\\\"namespace\\\",le=\\\"5\\\"}[1h]))\\n +\\n sum by (cluster) (rate(apiserver_request_slo_duration_seconds_bucket{job=\\\"apiserver\\\",verb=~\\\"LIST|GET\\\",subresource!~\\\"proxy|attach|log|exec|portforward\\\",scope=\\\"cluster\\\",le=\\\"30\\\"}[1h]))\\n )\\n )\\n +\\n # errors\\n sum by (cluster) (rate(apiserver_request_total{job=\\\"apiserver\\\",verb=~\\\"LIST|GET\\\",code=~\\\"5..\\\"}[1h]))\\n)\\n/\\nsum by (cluster) (rate(apiserver_request_total{job=\\\"apiserver\\\",verb=~\\\"LIST|GET\\\"}[1h]))\\n\",\n \"prom_eval_interval\": 15,\n \"append_tags\": [\n \"verb=read\"\n ]\n },\n {\n \"cluster\": \"\",\n \"name\": \"apiserver_request:burnrate1h\",\n \"note\": \"\",\n \"disabled\": 0,\n \"prom_ql\": \"(\\n (\\n # too slow\\n sum by (cluster) (rate(apiserver_request_slo_duration_seconds_count{job=\\\"apiserver\\\",verb=~\\\"POST|PUT|PATCH|DELETE\\\",subresource!~\\\"proxy|attach|log|exec|portforward\\\"}[1h]))\\n -\\n sum by (cluster) (rate(apiserver_request_slo_duration_seconds_bucket{job=\\\"apiserver\\\",verb=~\\\"POST|PUT|PATCH|DELETE\\\",subresource!~\\\"proxy|attach|log|exec|portforward\\\",le=\\\"1\\\"}[1h]))\\n )\\n +\\n sum by (cluster) (rate(apiserver_request_total{job=\\\"apiserver\\\",verb=~\\\"POST|PUT|PATCH|DELETE\\\",code=~\\\"5..\\\"}[1h]))\\n)\\n/\\nsum by (cluster) (rate(apiserver_request_total{job=\\\"apiserver\\\",verb=~\\\"POST|PUT|PATCH|DELETE\\\"}[1h]))\\n\",\n \"prom_eval_interval\": 15,\n \"append_tags\": [\n \"verb=write\"\n ]\n },\n {\n \"cluster\": \"\",\n \"name\": \"apiserver_request:burnrate2h\",\n \"note\": \"\",\n \"disabled\": 0,\n \"prom_ql\": \"(\\n (\\n # too slow\\n sum by (cluster) (rate(apiserver_request_slo_duration_seconds_count{job=\\\"apiserver\\\",verb=~\\\"LIST|GET\\\",subresource!~\\\"proxy|attach|log|exec|portforward\\\"}[2h]))\\n -\\n (\\n (\\n sum by (cluster) (rate(apiserver_request_slo_duration_seconds_bucket{job=\\\"apiserver\\\",verb=~\\\"LIST|GET\\\",subresource!~\\\"proxy|attach|log|exec|portforward\\\",scope=~\\\"resource|\\\",le=\\\"1\\\"}[2h]))\\n or\\n vector(0)\\n )\\n +\\n sum by (cluster) (rate(apiserver_request_slo_duration_seconds_bucket{job=\\\"apiserver\\\",verb=~\\\"LIST|GET\\\",subresource!~\\\"proxy|attach|log|exec|portforward\\\",scope=\\\"namespace\\\",le=\\\"5\\\"}[2h]))\\n +\\n sum by (cluster) (rate(apiserver_request_slo_duration_seconds_bucket{job=\\\"apiserver\\\",verb=~\\\"LIST|GET\\\",subresource!~\\\"proxy|attach|log|exec|portforward\\\",scope=\\\"cluster\\\",le=\\\"30\\\"}[2h]))\\n )\\n )\\n +\\n # errors\\n sum by (cluster) (rate(apiserver_request_total{job=\\\"apiserver\\\",verb=~\\\"LIST|GET\\\",code=~\\\"5..\\\"}[2h]))\\n)\\n/\\nsum by (cluster) (rate(apiserver_request_total{job=\\\"apiserver\\\",verb=~\\\"LIST|GET\\\"}[2h]))\\n\",\n \"prom_eval_interval\": 15,\n \"append_tags\": [\n \"verb=read\"\n ]\n },\n {\n \"cluster\": \"\",\n \"name\": \"apiserver_request:burnrate2h\",\n \"note\": \"\",\n \"disabled\": 0,\n \"prom_ql\": \"(\\n (\\n # too slow\\n sum by (cluster) (rate(apiserver_request_slo_duration_seconds_count{job=\\\"apiserver\\\",verb=~\\\"POST|PUT|PATCH|DELETE\\\",subresource!~\\\"proxy|attach|log|exec|portforward\\\"}[2h]))\\n -\\n sum by (cluster) (rate(apiserver_request_slo_duration_seconds_bucket{job=\\\"apiserver\\\",verb=~\\\"POST|PUT|PATCH|DELETE\\\",subresource!~\\\"proxy|attach|log|exec|portforward\\\",le=\\\"1\\\"}[2h]))\\n )\\n +\\n sum by (cluster) (rate(apiserver_request_total{job=\\\"apiserver\\\",verb=~\\\"POST|PUT|PATCH|DELETE\\\",code=~\\\"5..\\\"}[2h]))\\n)\\n/\\nsum by (cluster) (rate(apiserver_request_total{job=\\\"apiserver\\\",verb=~\\\"POST|PUT|PATCH|DELETE\\\"}[2h]))\\n\",\n \"prom_eval_interval\": 15,\n \"append_tags\": [\n \"verb=write\"\n ]\n },\n {\n \"cluster\": \"\",\n \"name\": \"apiserver_request:burnrate30m\",\n \"note\": \"\",\n \"disabled\": 0,\n \"prom_ql\": \"(\\n (\\n # too slow\\n sum by (cluster) (rate(apiserver_request_slo_duration_seconds_count{job=\\\"apiserver\\\",verb=~\\\"LIST|GET\\\",subresource!~\\\"proxy|attach|log|exec|portforward\\\"}[30m]))\\n -\\n (\\n (\\n sum by (cluster) (rate(apiserver_request_slo_duration_seconds_bucket{job=\\\"apiserver\\\",verb=~\\\"LIST|GET\\\",subresource!~\\\"proxy|attach|log|exec|portforward\\\",scope=~\\\"resource|\\\",le=\\\"1\\\"}[30m]))\\n or\\n vector(0)\\n )\\n +\\n sum by (cluster) (rate(apiserver_request_slo_duration_seconds_bucket{job=\\\"apiserver\\\",verb=~\\\"LIST|GET\\\",subresource!~\\\"proxy|attach|log|exec|portforward\\\",scope=\\\"namespace\\\",le=\\\"5\\\"}[30m]))\\n +\\n sum by (cluster) (rate(apiserver_request_slo_duration_seconds_bucket{job=\\\"apiserver\\\",verb=~\\\"LIST|GET\\\",subresource!~\\\"proxy|attach|log|exec|portforward\\\",scope=\\\"cluster\\\",le=\\\"30\\\"}[30m]))\\n )\\n )\\n +\\n # errors\\n sum by (cluster) (rate(apiserver_request_total{job=\\\"apiserver\\\",verb=~\\\"LIST|GET\\\",code=~\\\"5..\\\"}[30m]))\\n)\\n/\\nsum by (cluster) (rate(apiserver_request_total{job=\\\"apiserver\\\",verb=~\\\"LIST|GET\\\"}[30m]))\\n\",\n \"prom_eval_interval\": 15,\n \"append_tags\": [\n \"verb=read\"\n ]\n },\n {\n \"cluster\": \"\",\n \"name\": \"apiserver_request:burnrate30m\",\n \"note\": \"\",\n \"disabled\": 0,\n \"prom_ql\": \"(\\n (\\n # too slow\\n sum by (cluster) (rate(apiserver_request_slo_duration_seconds_count{job=\\\"apiserver\\\",verb=~\\\"POST|PUT|PATCH|DELETE\\\",subresource!~\\\"proxy|attach|log|exec|portforward\\\"}[30m]))\\n -\\n sum by (cluster) (rate(apiserver_request_slo_duration_seconds_bucket{job=\\\"apiserver\\\",verb=~\\\"POST|PUT|PATCH|DELETE\\\",subresource!~\\\"proxy|attach|log|exec|portforward\\\",le=\\\"1\\\"}[30m]))\\n )\\n +\\n sum by (cluster) (rate(apiserver_request_total{job=\\\"apiserver\\\",verb=~\\\"POST|PUT|PATCH|DELETE\\\",code=~\\\"5..\\\"}[30m]))\\n)\\n/\\nsum by (cluster) (rate(apiserver_request_total{job=\\\"apiserver\\\",verb=~\\\"POST|PUT|PATCH|DELETE\\\"}[30m]))\\n\",\n \"prom_eval_interval\": 15,\n \"append_tags\": [\n \"verb=write\"\n ]\n },\n {\n \"cluster\": \"\",\n \"name\": \"apiserver_request:burnrate3d\",\n \"note\": \"\",\n \"disabled\": 0,\n \"prom_ql\": \"(\\n (\\n # too slow\\n sum by (cluster) (rate(apiserver_request_slo_duration_seconds_count{job=\\\"apiserver\\\",verb=~\\\"LIST|GET\\\",subresource!~\\\"proxy|attach|log|exec|portforward\\\"}[3d]))\\n -\\n (\\n (\\n sum by (cluster) (rate(apiserver_request_slo_duration_seconds_bucket{job=\\\"apiserver\\\",verb=~\\\"LIST|GET\\\",subresource!~\\\"proxy|attach|log|exec|portforward\\\",scope=~\\\"resource|\\\",le=\\\"1\\\"}[3d]))\\n or\\n vector(0)\\n )\\n +\\n sum by (cluster) (rate(apiserver_request_slo_duration_seconds_bucket{job=\\\"apiserver\\\",verb=~\\\"LIST|GET\\\",subresource!~\\\"proxy|attach|log|exec|portforward\\\",scope=\\\"namespace\\\",le=\\\"5\\\"}[3d]))\\n +\\n sum by (cluster) (rate(apiserver_request_slo_duration_seconds_bucket{job=\\\"apiserver\\\",verb=~\\\"LIST|GET\\\",subresource!~\\\"proxy|attach|log|exec|portforward\\\",scope=\\\"cluster\\\",le=\\\"30\\\"}[3d]))\\n )\\n )\\n +\\n # errors\\n sum by (cluster) (rate(apiserver_request_total{job=\\\"apiserver\\\",verb=~\\\"LIST|GET\\\",code=~\\\"5..\\\"}[3d]))\\n)\\n/\\nsum by (cluster) (rate(apiserver_request_total{job=\\\"apiserver\\\",verb=~\\\"LIST|GET\\\"}[3d]))\\n\",\n \"prom_eval_interval\": 15,\n \"append_tags\": [\n \"verb=read\"\n ]\n },\n {\n \"cluster\": \"\",\n \"name\": \"apiserver_request:burnrate3d\",\n \"note\": \"\",\n \"disabled\": 0,\n \"prom_ql\": \"(\\n (\\n # too slow\\n sum by (cluster) (rate(apiserver_request_slo_duration_seconds_count{job=\\\"apiserver\\\",verb=~\\\"POST|PUT|PATCH|DELETE\\\",subresource!~\\\"proxy|attach|log|exec|portforward\\\"}[3d]))\\n -\\n sum by (cluster) (rate(apiserver_request_slo_duration_seconds_bucket{job=\\\"apiserver\\\",verb=~\\\"POST|PUT|PATCH|DELETE\\\",subresource!~\\\"proxy|attach|log|exec|portforward\\\",le=\\\"1\\\"}[3d]))\\n )\\n +\\n sum by (cluster) (rate(apiserver_request_total{job=\\\"apiserver\\\",verb=~\\\"POST|PUT|PATCH|DELETE\\\",code=~\\\"5..\\\"}[3d]))\\n)\\n/\\nsum by (cluster) (rate(apiserver_request_total{job=\\\"apiserver\\\",verb=~\\\"POST|PUT|PATCH|DELETE\\\"}[3d]))\\n\",\n \"prom_eval_interval\": 15,\n \"append_tags\": [\n \"verb=write\"\n ]\n },\n {\n \"cluster\": \"\",\n \"name\": \"apiserver_request:burnrate5m\",\n \"note\": \"\",\n \"disabled\": 0,\n \"prom_ql\": \"(\\n (\\n # too slow\\n sum by (cluster) (rate(apiserver_request_slo_duration_seconds_count{job=\\\"apiserver\\\",verb=~\\\"LIST|GET\\\",subresource!~\\\"proxy|attach|log|exec|portforward\\\"}[5m]))\\n -\\n (\\n (\\n sum by (cluster) (rate(apiserver_request_slo_duration_seconds_bucket{job=\\\"apiserver\\\",verb=~\\\"LIST|GET\\\",subresource!~\\\"proxy|attach|log|exec|portforward\\\",scope=~\\\"resource|\\\",le=\\\"1\\\"}[5m]))\\n or\\n vector(0)\\n )\\n +\\n sum by (cluster) (rate(apiserver_request_slo_duration_seconds_bucket{job=\\\"apiserver\\\",verb=~\\\"LIST|GET\\\",subresource!~\\\"proxy|attach|log|exec|portforward\\\",scope=\\\"namespace\\\",le=\\\"5\\\"}[5m]))\\n +\\n sum by (cluster) (rate(apiserver_request_slo_duration_seconds_bucket{job=\\\"apiserver\\\",verb=~\\\"LIST|GET\\\",subresource!~\\\"proxy|attach|log|exec|portforward\\\",scope=\\\"cluster\\\",le=\\\"30\\\"}[5m]))\\n )\\n )\\n +\\n # errors\\n sum by (cluster) (rate(apiserver_request_total{job=\\\"apiserver\\\",verb=~\\\"LIST|GET\\\",code=~\\\"5..\\\"}[5m]))\\n)\\n/\\nsum by (cluster) (rate(apiserver_request_total{job=\\\"apiserver\\\",verb=~\\\"LIST|GET\\\"}[5m]))\\n\",\n \"prom_eval_interval\": 15,\n \"append_tags\": [\n \"verb=read\"\n ]\n },\n {\n \"cluster\": \"\",\n \"name\": \"apiserver_request:burnrate5m\",\n \"note\": \"\",\n \"disabled\": 0,\n \"prom_ql\": \"(\\n (\\n # too slow\\n sum by (cluster) (rate(apiserver_request_slo_duration_seconds_count{job=\\\"apiserver\\\",verb=~\\\"POST|PUT|PATCH|DELETE\\\",subresource!~\\\"proxy|attach|log|exec|portforward\\\"}[5m]))\\n -\\n sum by (cluster) (rate(apiserver_request_slo_duration_seconds_bucket{job=\\\"apiserver\\\",verb=~\\\"POST|PUT|PATCH|DELETE\\\",subresource!~\\\"proxy|attach|log|exec|portforward\\\",le=\\\"1\\\"}[5m]))\\n )\\n +\\n sum by (cluster) (rate(apiserver_request_total{job=\\\"apiserver\\\",verb=~\\\"POST|PUT|PATCH|DELETE\\\",code=~\\\"5..\\\"}[5m]))\\n)\\n/\\nsum by (cluster) (rate(apiserver_request_total{job=\\\"apiserver\\\",verb=~\\\"POST|PUT|PATCH|DELETE\\\"}[5m]))\\n\",\n \"prom_eval_interval\": 15,\n \"append_tags\": [\n \"verb=write\"\n ]\n },\n {\n \"cluster\": \"\",\n \"name\": \"apiserver_request:burnrate6h\",\n \"note\": \"\",\n \"disabled\": 0,\n \"prom_ql\": \"(\\n (\\n # too slow\\n sum by (cluster) (rate(apiserver_request_slo_duration_seconds_count{job=\\\"apiserver\\\",verb=~\\\"LIST|GET\\\",subresource!~\\\"proxy|attach|log|exec|portforward\\\"}[6h]))\\n -\\n (\\n (\\n sum by (cluster) (rate(apiserver_request_slo_duration_seconds_bucket{job=\\\"apiserver\\\",verb=~\\\"LIST|GET\\\",subresource!~\\\"proxy|attach|log|exec|portforward\\\",scope=~\\\"resource|\\\",le=\\\"1\\\"}[6h]))\\n or\\n vector(0)\\n )\\n +\\n sum by (cluster) (rate(apiserver_request_slo_duration_seconds_bucket{job=\\\"apiserver\\\",verb=~\\\"LIST|GET\\\",subresource!~\\\"proxy|attach|log|exec|portforward\\\",scope=\\\"namespace\\\",le=\\\"5\\\"}[6h]))\\n +\\n sum by (cluster) (rate(apiserver_request_slo_duration_seconds_bucket{job=\\\"apiserver\\\",verb=~\\\"LIST|GET\\\",subresource!~\\\"proxy|attach|log|exec|portforward\\\",scope=\\\"cluster\\\",le=\\\"30\\\"}[6h]))\\n )\\n )\\n +\\n # errors\\n sum by (cluster) (rate(apiserver_request_total{job=\\\"apiserver\\\",verb=~\\\"LIST|GET\\\",code=~\\\"5..\\\"}[6h]))\\n)\\n/\\nsum by (cluster) (rate(apiserver_request_total{job=\\\"apiserver\\\",verb=~\\\"LIST|GET\\\"}[6h]))\\n\",\n \"prom_eval_interval\": 15,\n \"append_tags\": [\n \"verb=read\"\n ]\n },\n {\n \"cluster\": \"\",\n \"name\": \"apiserver_request:burnrate6h\",\n \"note\": \"\",\n \"disabled\": 0,\n \"prom_ql\": \"(\\n (\\n # too slow\\n sum by (cluster) (rate(apiserver_request_slo_duration_seconds_count{job=\\\"apiserver\\\",verb=~\\\"POST|PUT|PATCH|DELETE\\\",subresource!~\\\"proxy|attach|log|exec|portforward\\\"}[6h]))\\n -\\n sum by (cluster) (rate(apiserver_request_slo_duration_seconds_bucket{job=\\\"apiserver\\\",verb=~\\\"POST|PUT|PATCH|DELETE\\\",subresource!~\\\"proxy|attach|log|exec|portforward\\\",le=\\\"1\\\"}[6h]))\\n )\\n +\\n sum by (cluster) (rate(apiserver_request_total{job=\\\"apiserver\\\",verb=~\\\"POST|PUT|PATCH|DELETE\\\",code=~\\\"5..\\\"}[6h]))\\n)\\n/\\nsum by (cluster) (rate(apiserver_request_total{job=\\\"apiserver\\\",verb=~\\\"POST|PUT|PATCH|DELETE\\\"}[6h]))\\n\",\n \"prom_eval_interval\": 15,\n \"append_tags\": [\n \"verb=write\"\n ]\n },\n {\n \"cluster\": \"\",\n \"name\": \"cluster:namespace:pod_cpu:active:kube_pod_container_resource_limits\",\n \"note\": \"\",\n \"disabled\": 0,\n \"prom_ql\": \"kube_pod_container_resource_limits{resource=\\\"cpu\\\",job=\\\"kube-state-metrics\\\"} * on (namespace, pod, cluster)\\ngroup_left() max by (namespace, pod, cluster) (\\n (kube_pod_status_phase{phase=~\\\"Pending|Running\\\"} == 1)\\n )\\n\",\n \"prom_eval_interval\": 15,\n \"append_tags\": []\n },\n {\n \"cluster\": \"\",\n \"name\": \"cluster:namespace:pod_cpu:active:kube_pod_container_resource_requests\",\n \"note\": \"\",\n \"disabled\": 0,\n \"prom_ql\": \"kube_pod_container_resource_requests{resource=\\\"cpu\\\",job=\\\"kube-state-metrics\\\"} * on (namespace, pod, cluster)\\ngroup_left() max by (namespace, pod, cluster) (\\n (kube_pod_status_phase{phase=~\\\"Pending|Running\\\"} == 1)\\n)\\n\",\n \"prom_eval_interval\": 15,\n \"append_tags\": []\n },\n {\n \"cluster\": \"\",\n \"name\": \"cluster:namespace:pod_memory:active:kube_pod_container_resource_limits\",\n \"note\": \"\",\n \"disabled\": 0,\n \"prom_ql\": \"kube_pod_container_resource_limits{resource=\\\"memory\\\",job=\\\"kube-state-metrics\\\"} * on (namespace, pod, cluster)\\ngroup_left() max by (namespace, pod, cluster) (\\n (kube_pod_status_phase{phase=~\\\"Pending|Running\\\"} == 1)\\n)\\n\",\n \"prom_eval_interval\": 15,\n \"append_tags\": []\n },\n {\n \"cluster\": \"\",\n \"name\": \"cluster:namespace:pod_memory:active:kube_pod_container_resource_requests\",\n \"note\": \"\",\n \"disabled\": 0,\n \"prom_ql\": \"kube_pod_container_resource_requests{resource=\\\"memory\\\",job=\\\"kube-state-metrics\\\"} * on (namespace, pod, cluster)\\ngroup_left() max by (namespace, pod, cluster) (\\n (kube_pod_status_phase{phase=~\\\"Pending|Running\\\"} == 1)\\n)\\n\",\n \"prom_eval_interval\": 15,\n \"append_tags\": []\n },\n {\n \"cluster\": \"\",\n \"name\": \"cluster:node_cpu:ratio_rate5m\",\n \"note\": \"\",\n \"disabled\": 0,\n \"prom_ql\": \"avg by (cluster) (\\n node:node_cpu_utilization:ratio_rate5m\\n)\\n\",\n \"prom_eval_interval\": 15,\n \"append_tags\": []\n },\n {\n \"cluster\": \"\",\n \"name\": \"cluster_quantile:apiserver_request_slo_duration_seconds:histogram_quantile\",\n \"note\": \"\",\n \"disabled\": 0,\n \"prom_ql\": \"histogram_quantile(0.99, sum by (cluster, le, resource) (rate(apiserver_request_slo_duration_seconds_bucket{job=\\\"apiserver\\\",verb=~\\\"LIST|GET\\\",subresource!~\\\"proxy|attach|log|exec|portforward\\\"}[5m]))) > 0\\n\",\n \"prom_eval_interval\": 15,\n \"append_tags\": [\n \"quantile=0.99\",\n \"verb=read\"\n ]\n },\n {\n \"cluster\": \"\",\n \"name\": \"cluster_quantile:apiserver_request_slo_duration_seconds:histogram_quantile\",\n \"note\": \"\",\n \"disabled\": 0,\n \"prom_ql\": \"histogram_quantile(0.99, sum by (cluster, le, resource) (rate(apiserver_request_slo_duration_seconds_bucket{job=\\\"apiserver\\\",verb=~\\\"POST|PUT|PATCH|DELETE\\\",subresource!~\\\"proxy|attach|log|exec|portforward\\\"}[5m]))) > 0\\n\",\n \"prom_eval_interval\": 15,\n \"append_tags\": [\n \"quantile=0.99\",\n \"verb=write\"\n ]\n },\n {\n \"cluster\": \"\",\n \"name\": \"cluster_quantile:scheduler_binding_duration_seconds:histogram_quantile\",\n \"note\": \"\",\n \"disabled\": 0,\n \"prom_ql\": \"histogram_quantile(0.99, sum(rate(scheduler_binding_duration_seconds_bucket{job=\\\"kube-scheduler\\\"}[5m])) without(instance, pod))\\n\",\n \"prom_eval_interval\": 15,\n \"append_tags\": [\n \"quantile=0.99\"\n ]\n },\n {\n \"cluster\": \"\",\n \"name\": \"cluster_quantile:scheduler_binding_duration_seconds:histogram_quantile\",\n \"note\": \"\",\n \"disabled\": 0,\n \"prom_ql\": \"histogram_quantile(0.9, sum(rate(scheduler_binding_duration_seconds_bucket{job=\\\"kube-scheduler\\\"}[5m])) without(instance, pod))\\n\",\n \"prom_eval_interval\": 15,\n \"append_tags\": [\n \"quantile=0.9\"\n ]\n },\n {\n \"cluster\": \"\",\n \"name\": \"cluster_quantile:scheduler_binding_duration_seconds:histogram_quantile\",\n \"note\": \"\",\n \"disabled\": 0,\n \"prom_ql\": \"histogram_quantile(0.5, sum(rate(scheduler_binding_duration_seconds_bucket{job=\\\"kube-scheduler\\\"}[5m])) without(instance, pod))\\n\",\n \"prom_eval_interval\": 15,\n \"append_tags\": [\n \"quantile=0.5\"\n ]\n },\n {\n \"cluster\": \"\",\n \"name\": \"cluster_quantile:scheduler_e2e_scheduling_duration_seconds:histogram_quantile\",\n \"note\": \"\",\n \"disabled\": 0,\n \"prom_ql\": \"histogram_quantile(0.99, sum(rate(scheduler_e2e_scheduling_duration_seconds_bucket{job=\\\"kube-scheduler\\\"}[5m])) without(instance, pod))\\n\",\n \"prom_eval_interval\": 15,\n \"append_tags\": [\n \"quantile=0.99\"\n ]\n },\n {\n \"cluster\": \"\",\n \"name\": \"cluster_quantile:scheduler_e2e_scheduling_duration_seconds:histogram_quantile\",\n \"note\": \"\",\n \"disabled\": 0,\n \"prom_ql\": \"histogram_quantile(0.9, sum(rate(scheduler_e2e_scheduling_duration_seconds_bucket{job=\\\"kube-scheduler\\\"}[5m])) without(instance, pod))\\n\",\n \"prom_eval_interval\": 15,\n \"append_tags\": [\n \"quantile=0.9\"\n ]\n }\n]"
},
{
"path": "integrations/Kubernetes/record-rules/node-exporter.json",
"content": "[\n {\n \"cluster\": \"\",\n \"name\": \"cluster:node_cpu:ratio\",\n \"note\": \"\",\n \"disabled\": 0,\n \"prom_ql\": \"cluster:node_cpu:sum_rate5m / count(sum(node_cpu_seconds_total) BY (instance, cpu))\",\n \"prom_eval_interval\": 15,\n \"append_tags\": []\n },\n {\n \"cluster\": \"\",\n \"name\": \"cluster:node_cpu:sum_rate5m\",\n \"note\": \"\",\n \"disabled\": 0,\n \"prom_ql\": \"sum(rate(node_cpu_seconds_total{mode!=\\\"idle\\\",mode!=\\\"iowait\\\",mode!=\\\"steal\\\"}[5m]))\",\n \"prom_eval_interval\": 15,\n \"append_tags\": []\n },\n {\n \"cluster\": \"\",\n \"name\": \"count:up0\",\n \"note\": \"\",\n \"disabled\": 0,\n \"prom_ql\": \"count without(instance, pod, node) (up == 0)\",\n \"prom_eval_interval\": 15,\n \"append_tags\": []\n },\n {\n \"cluster\": \"\",\n \"name\": \"count:up1\",\n \"note\": \"\",\n \"disabled\": 0,\n \"prom_ql\": \"count without(instance, pod, node) (up == 1)\",\n \"prom_eval_interval\": 15,\n \"append_tags\": []\n },\n {\n \"cluster\": \"\",\n \"name\": \"instance:node_cpu:rate:sum\",\n \"note\": \"\",\n \"disabled\": 0,\n \"prom_ql\": \"sum(rate(node_cpu_seconds_total{mode!=\\\"idle\\\",mode!=\\\"iowait\\\",mode!=\\\"steal\\\"}[3m])) BY (instance)\",\n \"prom_eval_interval\": 15,\n \"append_tags\": []\n },\n {\n \"cluster\": \"\",\n \"name\": \"instance:node_cpu:ratio\",\n \"note\": \"\",\n \"disabled\": 0,\n \"prom_ql\": \"sum(rate(node_cpu_seconds_total{mode!=\\\"idle\\\",mode!=\\\"iowait\\\",mode!=\\\"steal\\\"}[5m])) WITHOUT (cpu, mode) / ON(instance) GROUP_LEFT() count(sum(node_cpu_seconds_total) BY (instance, cpu)) BY (instance)\",\n \"prom_eval_interval\": 15,\n \"append_tags\": []\n },\n {\n \"cluster\": \"\",\n \"name\": \"instance:node_network_receive_bytes:rate:sum\",\n \"note\": \"\",\n \"disabled\": 0,\n \"prom_ql\": \"sum(rate(node_network_receive_bytes_total[3m])) BY (instance)\",\n \"prom_eval_interval\": 15,\n \"append_tags\": []\n },\n {\n \"cluster\": \"\",\n \"name\": \"instance:node_network_transmit_bytes:rate:sum\",\n \"note\": \"\",\n \"disabled\": 0,\n \"prom_ql\": \"sum(rate(node_network_transmit_bytes_total[3m])) BY (instance)\",\n \"prom_eval_interval\": 15,\n \"append_tags\": []\n }\n]"
},
{
"path": "integrations/Ldap/collect/ldap/ldap.toml",
"content": "# # collect interval\n# interval = 15\n\n[[instances]]\n# # append some labels for series\n# labels = { region=\"cloud\", product=\"n9e\" }\n\n# # interval = global.interval * interval_times\n# interval_times = 1\n\n## Server to monitor\n## The scheme determines the mode to use for connection with\n## ldap://... -- unencrypted (non-TLS) connection\n## ldaps://... -- TLS connection\n## starttls://... -- StartTLS connection\n## If no port is given, the default ports, 389 for ldap and starttls and\n## 636 for ldaps, are used.\n#server = \"ldap://localhost\"\n\n## Server dialect, can be \"openldap\" or \"389ds\"\n# dialect = \"openldap\"\n\n# DN and password to bind with\n## If bind_dn is empty an anonymous bind is performed.\nbind_dn = \"\"\nbind_password = \"\"\n\n## Reverse the field names constructed from the monitoring DN\n# reverse_field_names = false\n\n## Optional TLS Config\n# use_tls = false\n# tls_ca = \"/etc/categraf/ca.pem\"\n# tls_cert = \"/etc/categraf/cert.pem\"\n# tls_key = \"/etc/categraf/key.pem\"\n## Use TLS but skip chain & host verification\n# insecure_skip_verify = false"
},
{
"path": "integrations/Ldap/markdown/README.md",
"content": "# LDAP Input Plugin\n\nThis plugin gathers metrics from LDAP servers' monitoring (`cn=Monitor`)\nbackend. Currently this plugin supports [OpenLDAP](https://www.openldap.org/)\nand [389ds](https://www.port389.org/) servers.\n\nTo use this plugin you must enable the monitoring backend/plugin of your LDAP\nserver. See\n[OpenLDAP](https://www.openldap.org/devel/admin/monitoringslapd.html) or 389ds\ndocumentation for details.\n\n## Metrics\n\nDepending on the server dialect, different metrics are produced. The metrics\nare usually named according to the selected dialect.\n\n### Tags\n\n- server -- Server name or IP\n- port -- Port used for connecting\n\n## Example Output\n\nUsing the `openldap` dialect\n\n```text\nopenldap_modify_operations_completed agent_hostname=zy-fat port=389 server=localhost 0\nopenldap_referrals_statistics agent_hostname=zy-fat port=389 server=localhost 0\nopenldap_unbind_operations_initiated agent_hostname=zy-fat port=389 server=localhost 0\nopenldap_delete_operations_completed agent_hostname=zy-fat port=389 server=localhost 0\nopenldap_extended_operations_completed agent_hostname=zy-fat port=389 server=localhost 0\nopenldap_pdu_statistics agent_hostname=zy-fat port=389 server=localhost 42\nopenldap_starting_threads agent_hostname=zy-fat port=389 server=localhost 0\nopenldap_active_threads agent_hostname=zy-fat port=389 server=localhost 1\nopenldap_uptime_time agent_hostname=zy-fat port=389 server=localhost 102\nopenldap_bytes_statistics agent_hostname=zy-fat port=389 server=localhost 3176\nopenldap_compare_operations_completed agent_hostname=zy-fat port=389 server=localhost 0\nopenldap_bind_operations_completed agent_hostname=zy-fat port=389 server=localhost 1\nopenldap_total_connections agent_hostname=zy-fat port=389 server=localhost 1002\nopenldap_search_operations_completed agent_hostname=zy-fat port=389 server=localhost 1\nopenldap_abandon_operations_initiated agent_hostname=zy-fat port=389 server=localhost 0\nopenldap_add_operations_initiated agent_hostname=zy-fat port=389 server=localhost 0\nopenldap_open_threads agent_hostname=zy-fat port=389 server=localhost 1\nopenldap_add_operations_completed agent_hostname=zy-fat port=389 server=localhost 0\nopenldap_operations_initiated agent_hostname=zy-fat port=389 server=localhost 3\nopenldap_write_waiters agent_hostname=zy-fat port=389 server=localhost 0\nopenldap_entries_statistics agent_hostname=zy-fat port=389 server=localhost 41\nopenldap_modrdn_operations_completed agent_hostname=zy-fat port=389 server=localhost 0\nopenldap_pending_threads agent_hostname=zy-fat port=389 server=localhost 0\nopenldap_max_pending_threads agent_hostname=zy-fat port=389 server=localhost 0\nopenldap_bind_operations_initiated agent_hostname=zy-fat port=389 server=localhost 1\nopenldap_max_file_descriptors_connections agent_hostname=zy-fat port=389 server=localhost 1024\nopenldap_compare_operations_initiated agent_hostname=zy-fat port=389 server=localhost 0\nopenldap_search_operations_initiated agent_hostname=zy-fat port=389 server=localhost 2\nopenldap_modrdn_operations_initiated agent_hostname=zy-fat port=389 server=localhost 0\nopenldap_read_waiters agent_hostname=zy-fat port=389 server=localhost 1\nopenldap_backload_threads agent_hostname=zy-fat port=389 server=localhost 1\nopenldap_current_connections agent_hostname=zy-fat port=389 server=localhost 1\nopenldap_unbind_operations_completed agent_hostname=zy-fat port=389 server=localhost 0\nopenldap_delete_operations_initiated agent_hostname=zy-fat port=389 server=localhost 0\nopenldap_extended_operations_initiated agent_hostname=zy-fat port=389 server=localhost 0\nopenldap_modify_operations_initiated agent_hostname=zy-fat port=389 server=localhost 0\nopenldap_max_threads agent_hostname=zy-fat port=389 server=localhost 16\nopenldap_abandon_operations_completed agent_hostname=zy-fat port=389 server=localhost 0\nopenldap_operations_completed agent_hostname=zy-fat port=389 server=localhost 2\nopenldap_database_2_databases agent_hostname=zy-fat port=389 server=localhost 0\n```\n\nUsing the `389ds` dialect\n\n```text\n389ds_current_connections_at_max_threads agent_hostname=zy-fat port=389 server=localhost 0\n389ds_connections_max_threads agent_hostname=zy-fat port=389 server=localhost 0\n389ds_add_operations agent_hostname=zy-fat port=389 server=localhost 0\n389ds_dtablesize agent_hostname=zy-fat port=389 server=localhost 63936\n389ds_strongauth_binds agent_hostname=zy-fat port=389 server=localhost 13\n389ds_modrdn_operations agent_hostname=zy-fat port=389 server=localhost 0\n389ds_maxthreads_per_conn_hits agent_hostname=zy-fat port=389 server=localhost 0\n389ds_current_connections agent_hostname=zy-fat port=389 server=localhost 2\n389ds_security_errors agent_hostname=zy-fat port=389 server=localhost 0\n389ds_entries_sent agent_hostname=zy-fat port=389 server=localhost 13\n389ds_cache_entries agent_hostname=zy-fat port=389 server=localhost 0\n389ds_backends agent_hostname=zy-fat port=389 server=localhost 0\n389ds_threads agent_hostname=zy-fat port=389 server=localhost 17\n389ds_connections agent_hostname=zy-fat port=389 server=localhost 2\n389ds_read_operations agent_hostname=zy-fat port=389 server=localhost 0\n389ds_entries_returned agent_hostname=zy-fat port=389 server=localhost 13\n389ds_unauth_binds agent_hostname=zy-fat port=389 server=localhost 0\n389ds_search_operations agent_hostname=zy-fat port=389 server=localhost 14\n389ds_simpleauth_binds agent_hostname=zy-fat port=389 server=localhost 0\n389ds_operations_completed agent_hostname=zy-fat port=389 server=localhost 51\n389ds_connections_in_max_threads agent_hostname=zy-fat port=389 server=localhost 0\n389ds_modify_operations agent_hostname=zy-fat port=389 server=localhost 0\n389ds_wholesubtree_search_operations agent_hostname=zy-fat port=389 server=localhost 1\n389ds_read_waiters agent_hostname=zy-fat port=389 server=localhost 0\n389ds_compare_operations agent_hostname=zy-fat port=389 server=localhost 0\n389ds_errors agent_hostname=zy-fat port=389 server=localhost 13\n389ds_in_operations agent_hostname=zy-fat port=389 server=localhost 52\n389ds_total_connections agent_hostname=zy-fat port=389 server=localhost 15\n389ds_cache_hits agent_hostname=zy-fat port=389 server=localhost 0\n389ds_list_operations agent_hostname=zy-fat port=389 server=localhost 0\n389ds_referrals_returned agent_hostname=zy-fat port=389 server=localhost 0\n389ds_copy_entries agent_hostname=zy-fat port=389 server=localhost 0\n389ds_operations_initiated agent_hostname=zy-fat port=389 server=localhost 52\n389ds_chainings agent_hostname=zy-fat port=389 server=localhost 0\n389ds_bind_security_errors agent_hostname=zy-fat port=389 server=localhost 0\n389ds_onelevel_search_operations agent_hostname=zy-fat port=389 server=localhost 0\n389ds_bytes_sent agent_hostname=zy-fat port=389 server=localhost 1702\n389ds_bytes_received agent_hostname=zy-fat port=389 server=localhost 0\n389ds_referrals agent_hostname=zy-fat port=389 server=localhost 0\n389ds_delete_operations agent_hostname=zy-fat port=389 server=localhost 0\n389ds_anonymous_binds agent_hostname=zy-fat port=389 server=localhost 0\n```"
},
{
"path": "integrations/Linux/alerts/CommonAlertingRules-Categraf.json",
"content": "[\n {\n \"id\": 0,\n \"group_id\": 0,\n \"cate\": \"prometheus\",\n \"datasource_ids\": [\n 0\n ],\n \"cluster\": \"\",\n \"name\": \"Hard disk - expected to be written full in 4 hours - categraf\",\n \"note\": \"\",\n \"prod\": \"metric\",\n \"algorithm\": \"\",\n \"algo_params\": null,\n \"delay\": 0,\n \"severity\": 1,\n \"severities\": [\n 1\n ],\n \"disabled\": 1,\n \"prom_for_duration\": 60,\n \"prom_ql\": \"predict_linear(disk_free[1h], 4*3600) \\u003c 0\",\n \"rule_config\": {\n \"algo_params\": null,\n \"inhibit\": false,\n \"prom_ql\": \"\",\n \"queries\": [\n {\n \"prom_ql\": \"predict_linear(disk_free[1h], 4*3600) \\u003c 0\",\n \"severity\": 1\n }\n ],\n \"severity\": 0\n },\n \"prom_eval_interval\": 15,\n \"enable_stime\": \"\",\n \"enable_stimes\": [\n \"00:00\"\n ],\n \"enable_etime\": \"\",\n \"enable_etimes\": [\n \"23:59\"\n ],\n \"enable_days_of_week\": null,\n \"enable_days_of_weeks\": [\n [\n \"1\",\n \"2\",\n \"3\",\n \"4\",\n \"5\",\n \"6\",\n \"0\"\n ]\n ],\n \"enable_in_bg\": 0,\n \"notify_recovered\": 1,\n \"notify_channels\": [\n \"email\",\n \"dingtalk\",\n \"wecom\"\n ],\n \"notify_groups_obj\": null,\n \"notify_groups\": null,\n \"notify_repeat_step\": 60,\n \"notify_max_number\": 0,\n \"recover_duration\": 0,\n \"callbacks\": [],\n \"runbook_url\": \"\",\n \"append_tags\": [],\n \"annotations\": null,\n \"extra_config\": null,\n \"create_at\": 0,\n \"create_by\": \"\",\n \"update_at\": 0,\n \"update_by\": \"\",\n \"uuid\": 1717556327696047000\n },\n {\n \"id\": 0,\n \"group_id\": 0,\n \"cate\": \"prometheus\",\n \"datasource_ids\": [\n 0\n ],\n \"cluster\": \"\",\n \"name\": \"Hard disk - IO is a bit busy - categraf\",\n \"note\": \"\",\n \"prod\": \"metric\",\n \"algorithm\": \"\",\n \"algo_params\": null,\n \"delay\": 0,\n \"severity\": 2,\n \"severities\": [\n 2\n ],\n \"disabled\": 0,\n \"prom_for_duration\": 60,\n \"prom_ql\": \"rate(diskio_io_time[1m])/10 \\u003e 99\",\n \"rule_config\": {\n \"algo_params\": null,\n \"inhibit\": false,\n \"prom_ql\": \"\",\n \"queries\": [\n {\n \"prom_ql\": \"rate(diskio_io_time[1m])/10 \\u003e 99\",\n \"severity\": 2\n }\n ],\n \"severity\": 0\n },\n \"prom_eval_interval\": 15,\n \"enable_stime\": \"\",\n \"enable_stimes\": [\n \"00:00\"\n ],\n \"enable_etime\": \"\",\n \"enable_etimes\": [\n \"23:59\"\n ],\n \"enable_days_of_week\": null,\n \"enable_days_of_weeks\": [\n [\n \"1\",\n \"2\",\n \"3\",\n \"4\",\n \"5\",\n \"6\",\n \"0\"\n ]\n ],\n \"enable_in_bg\": 0,\n \"notify_recovered\": 1,\n \"notify_channels\": [\n \"email\",\n \"dingtalk\",\n \"wecom\"\n ],\n \"notify_groups_obj\": null,\n \"notify_groups\": null,\n \"notify_repeat_step\": 60,\n \"notify_max_number\": 0,\n \"recover_duration\": 0,\n \"callbacks\": [],\n \"runbook_url\": \"\",\n \"append_tags\": [],\n \"annotations\": null,\n \"extra_config\": null,\n \"create_at\": 0,\n \"create_by\": \"\",\n \"update_at\": 0,\n \"update_by\": \"\",\n \"uuid\": 1717556327696483000\n },\n {\n \"id\": 0,\n \"group_id\": 0,\n \"cate\": \"prometheus\",\n \"datasource_ids\": [\n 0\n ],\n \"cluster\": \"\",\n \"name\": \"Lost connection with monitoring target - categraf\",\n \"note\": \"\",\n \"prod\": \"host\",\n \"algorithm\": \"\",\n \"algo_params\": null,\n \"delay\": 0,\n \"severity\": 0,\n \"severities\": [\n 0\n ],\n \"disabled\": 0,\n \"prom_for_duration\": 0,\n \"prom_ql\": \"\",\n \"rule_config\": {\n \"inhibit\": false,\n \"queries\": [\n {\n \"key\": \"all_hosts\",\n \"op\": \"==\",\n \"values\": []\n }\n ],\n \"triggers\": [\n {\n \"duration\": 60,\n \"severity\": 2,\n \"type\": \"target_miss\"\n }\n ]\n },\n \"prom_eval_interval\": 15,\n \"enable_stime\": \"\",\n \"enable_stimes\": [\n \"00:00\"\n ],\n \"enable_etime\": \"\",\n \"enable_etimes\": [\n \"23:59\"\n ],\n \"enable_days_of_week\": null,\n \"enable_days_of_weeks\": [\n [\n \"1\",\n \"2\",\n \"3\",\n \"4\",\n \"5\",\n \"6\",\n \"0\"\n ]\n ],\n \"enable_in_bg\": 0,\n \"notify_recovered\": 1,\n \"notify_channels\": [],\n \"notify_groups_obj\": null,\n \"notify_groups\": null,\n \"notify_repeat_step\": 60,\n \"notify_max_number\": 0,\n \"recover_duration\": 0,\n \"callbacks\": [],\n \"runbook_url\": \"\",\n \"append_tags\": [],\n \"annotations\": {},\n \"extra_config\": null,\n \"create_at\": 0,\n \"create_by\": \"\",\n \"update_at\": 0,\n \"update_by\": \"\",\n \"uuid\": 1717556327697002000\n },\n {\n \"id\": 0,\n \"group_id\": 0,\n \"cate\": \"prometheus\",\n \"datasource_ids\": [\n 0\n ],\n \"cluster\": \"\",\n \"name\": \"Machine load - high memory, please pay attention - categraf\",\n \"note\": \"\",\n \"prod\": \"metric\",\n \"algorithm\": \"\",\n \"algo_params\": null,\n \"delay\": 0,\n \"severity\": 0,\n \"severities\": [\n 3,\n 2,\n 1\n ],\n \"disabled\": 0,\n \"prom_for_duration\": 60,\n \"prom_ql\": \"\",\n \"rule_config\": {\n \"inhibit\": true,\n \"queries\": [\n {\n \"prom_ql\": \"mem_available_percent \\u003c 25\",\n \"severity\": 3\n },\n {\n \"prom_ql\": \"mem_available_percent \\u003c 15\",\n \"severity\": 2\n },\n {\n \"prom_ql\": \"mem_available_percent \\u003c 5\",\n \"severity\": 1\n }\n ]\n },\n \"prom_eval_interval\": 15,\n \"enable_stime\": \"\",\n \"enable_stimes\": [\n \"00:00\"\n ],\n \"enable_etime\": \"\",\n \"enable_etimes\": [\n \"23:59\"\n ],\n \"enable_days_of_week\": null,\n \"enable_days_of_weeks\": [\n [\n \"1\",\n \"2\",\n \"3\",\n \"4\",\n \"5\",\n \"6\",\n \"0\"\n ]\n ],\n \"enable_in_bg\": 0,\n \"notify_recovered\": 1,\n \"notify_channels\": [\n \"email\",\n \"dingtalk\",\n \"wecom\"\n ],\n \"notify_groups_obj\": null,\n \"notify_groups\": null,\n \"notify_repeat_step\": 60,\n \"notify_max_number\": 0,\n \"recover_duration\": 0,\n \"callbacks\": [],\n \"runbook_url\": \"\",\n \"append_tags\": [],\n \"annotations\": {},\n \"extra_config\": null,\n \"create_at\": 0,\n \"create_by\": \"\",\n \"update_at\": 0,\n \"update_by\": \"\",\n \"uuid\": 1717556327697454000\n },\n {\n \"id\": 0,\n \"group_id\": 0,\n \"cate\": \"prometheus\",\n \"datasource_ids\": [\n 0\n ],\n \"cluster\": \"\",\n \"name\": \"number of TME_WAIT exceeds 20,000 - categraf\",\n \"note\": \"\",\n \"prod\": \"metric\",\n \"algorithm\": \"\",\n \"algo_params\": null,\n \"delay\": 0,\n \"severity\": 2,\n \"severities\": [\n 2\n ],\n \"disabled\": 0,\n \"prom_for_duration\": 60,\n \"prom_ql\": \"netstat_tcp_time_wait \\u003e 20000\",\n \"rule_config\": {\n \"algo_params\": null,\n \"inhibit\": false,\n \"prom_ql\": \"\",\n \"queries\": [\n {\n \"prom_ql\": \"netstat_tcp_time_wait \\u003e 20000\",\n \"severity\": 2\n }\n ],\n \"severity\": 0\n },\n \"prom_eval_interval\": 15,\n \"enable_stime\": \"\",\n \"enable_stimes\": [\n \"00:00\"\n ],\n \"enable_etime\": \"\",\n \"enable_etimes\": [\n \"23:59\"\n ],\n \"enable_days_of_week\": null,\n \"enable_days_of_weeks\": [\n [\n \"1\",\n \"2\",\n \"3\",\n \"4\",\n \"5\",\n \"6\",\n \"0\"\n ]\n ],\n \"enable_in_bg\": 0,\n \"notify_recovered\": 1,\n \"notify_channels\": [\n \"email\",\n \"dingtalk\",\n \"wecom\"\n ],\n \"notify_groups_obj\": null,\n \"notify_groups\": null,\n \"notify_repeat_step\": 60,\n \"notify_max_number\": 0,\n \"recover_duration\": 0,\n \"callbacks\": [],\n \"runbook_url\": \"\",\n \"append_tags\": [],\n \"annotations\": null,\n \"extra_config\": null,\n \"create_at\": 0,\n \"create_by\": \"\",\n \"update_at\": 0,\n \"update_by\": \"\",\n \"uuid\": 1717556327697935000\n },\n {\n \"id\": 0,\n \"group_id\": 0,\n \"cate\": \"prometheus\",\n \"datasource_ids\": [\n 0\n ],\n \"cluster\": \"\",\n \"name\": \"packet loss in the inbound direction - categraf\",\n \"note\": \"\",\n \"prod\": \"metric\",\n \"algorithm\": \"\",\n \"algo_params\": null,\n \"delay\": 0,\n \"severity\": 3,\n \"severities\": [\n 3\n ],\n \"disabled\": 0,\n \"prom_for_duration\": 60,\n \"prom_ql\": \"increase(net_drop_in[1m]) \\u003e 0\",\n \"rule_config\": {\n \"algo_params\": null,\n \"inhibit\": false,\n \"prom_ql\": \"\",\n \"queries\": [\n {\n \"prom_ql\": \"increase(net_drop_in[1m]) \\u003e 0\",\n \"severity\": 3\n }\n ],\n \"severity\": 0\n },\n \"prom_eval_interval\": 15,\n \"enable_stime\": \"\",\n \"enable_stimes\": [\n \"00:00\"\n ],\n \"enable_etime\": \"\",\n \"enable_etimes\": [\n \"23:59\"\n ],\n \"enable_days_of_week\": null,\n \"enable_days_of_weeks\": [\n [\n \"1\",\n \"2\",\n \"3\",\n \"4\",\n \"5\",\n \"6\",\n \"0\"\n ]\n ],\n \"enable_in_bg\": 0,\n \"notify_recovered\": 1,\n \"notify_channels\": [\n \"email\",\n \"dingtalk\",\n \"wecom\"\n ],\n \"notify_groups_obj\": null,\n \"notify_groups\": null,\n \"notify_repeat_step\": 60,\n \"notify_max_number\": 0,\n \"recover_duration\": 0,\n \"callbacks\": [],\n \"runbook_url\": \"\",\n \"append_tags\": [],\n \"annotations\": null,\n \"extra_config\": null,\n \"create_at\": 0,\n \"create_by\": \"\",\n \"update_at\": 0,\n \"update_by\": \"\",\n \"uuid\": 1717556327698403000\n },\n {\n \"id\": 0,\n \"group_id\": 0,\n \"cate\": \"prometheus\",\n \"datasource_ids\": [\n 0\n ],\n \"cluster\": \"\",\n \"name\": \"packet loss in the outbound direction - categraf\",\n \"note\": \"\",\n \"prod\": \"metric\",\n \"algorithm\": \"\",\n \"algo_params\": null,\n \"delay\": 0,\n \"severity\": 3,\n \"severities\": [\n 3\n ],\n \"disabled\": 0,\n \"prom_for_duration\": 60,\n \"prom_ql\": \"increase(net_drop_out[1m]) \\u003e 0\",\n \"rule_config\": {\n \"algo_params\": null,\n \"inhibit\": false,\n \"prom_ql\": \"\",\n \"queries\": [\n {\n \"prom_ql\": \"increase(net_drop_out[1m]) \\u003e 0\",\n \"severity\": 3\n }\n ],\n \"severity\": 0\n },\n \"prom_eval_interval\": 15,\n \"enable_stime\": \"\",\n \"enable_stimes\": [\n \"00:00\"\n ],\n \"enable_etime\": \"\",\n \"enable_etimes\": [\n \"23:59\"\n ],\n \"enable_days_of_week\": null,\n \"enable_days_of_weeks\": [\n [\n \"1\",\n \"2\",\n \"3\",\n \"4\",\n \"5\",\n \"6\",\n \"0\"\n ]\n ],\n \"enable_in_bg\": 0,\n \"notify_recovered\": 1,\n \"notify_channels\": [\n \"email\",\n \"dingtalk\",\n \"wecom\"\n ],\n \"notify_groups_obj\": null,\n \"notify_groups\": null,\n \"notify_repeat_step\": 60,\n \"notify_max_number\": 0,\n \"recover_duration\": 0,\n \"callbacks\": [],\n \"runbook_url\": \"\",\n \"append_tags\": [],\n \"annotations\": null,\n \"extra_config\": null,\n \"create_at\": 0,\n \"create_by\": \"\",\n \"update_at\": 0,\n \"update_by\": \"\",\n \"uuid\": 1717556327698824000\n },\n {\n \"id\": 0,\n \"group_id\": 0,\n \"cate\": \"prometheus\",\n \"datasource_ids\": [\n 0\n ],\n \"cluster\": \"\",\n \"name\": \"A disk larger than 200G is running out of space\",\n \"note\": \"\",\n \"prod\": \"metric\",\n \"algorithm\": \"\",\n \"algo_params\": null,\n \"delay\": 0,\n \"severity\": 0,\n \"severities\": [\n 3,\n 2,\n 1\n ],\n \"disabled\": 0,\n \"prom_for_duration\": 60,\n \"prom_ql\": \"\",\n \"rule_config\": {\n \"inhibit\": true,\n \"queries\": [\n {\n \"prom_ql\": \"disk_free/1024/1024/1024 \\u003c 20 and disk_total/1024/1024/1024 \\u003e= 200\",\n \"severity\": 3\n },\n {\n \"prom_ql\": \"disk_free/1024/1024/1024 \\u003c 10 and disk_total/1024/1024/1024 \\u003e= 200\",\n \"severity\": 2\n },\n {\n \"prom_ql\": \"disk_free/1024/1024/1024 \\u003c 2 and disk_total/1024/1024/1024 \\u003e= 200\",\n \"severity\": 1\n }\n ]\n },\n \"prom_eval_interval\": 30,\n \"enable_stime\": \"\",\n \"enable_stimes\": [\n \"00:00\"\n ],\n \"enable_etime\": \"\",\n \"enable_etimes\": [\n \"23:59\"\n ],\n \"enable_days_of_week\": null,\n \"enable_days_of_weeks\": [\n [\n \"0\",\n \"1\",\n \"2\",\n \"3\",\n \"4\",\n \"5\",\n \"6\"\n ]\n ],\n \"enable_in_bg\": 0,\n \"notify_recovered\": 1,\n \"notify_channels\": [],\n \"notify_groups_obj\": null,\n \"notify_groups\": null,\n \"notify_repeat_step\": 60,\n \"notify_max_number\": 0,\n \"recover_duration\": 0,\n \"callbacks\": [],\n \"runbook_url\": \"\",\n \"append_tags\": [],\n \"annotations\": {},\n \"extra_config\": null,\n \"create_at\": 0,\n \"create_by\": \"\",\n \"update_at\": 0,\n \"update_by\": \"\",\n \"uuid\": 1717556327699274000\n },\n {\n \"id\": 0,\n \"group_id\": 0,\n \"cate\": \"prometheus\",\n \"datasource_ids\": [\n 0\n ],\n \"cluster\": \"\",\n \"name\": \"A disk smaller than 200G is running out of space\",\n \"note\": \"\",\n \"prod\": \"metric\",\n \"algorithm\": \"\",\n \"algo_params\": null,\n \"delay\": 0,\n \"severity\": 0,\n \"severities\": [\n 3,\n 2,\n 1\n ],\n \"disabled\": 0,\n \"prom_for_duration\": 60,\n \"prom_ql\": \"\",\n \"rule_config\": {\n \"inhibit\": true,\n \"queries\": [\n {\n \"prom_ql\": \"disk_used_percent \\u003e 90 and disk_total/1024/1024/1024 \\u003c 200\",\n \"severity\": 3\n },\n {\n \"prom_ql\": \"disk_used_percent \\u003e 95 and disk_total/1024/1024/1024 \\u003c 200\",\n \"severity\": 2\n },\n {\n \"prom_ql\": \"disk_used_percent \\u003e 99 and disk_total/1024/1024/1024 \\u003c 200\",\n \"severity\": 1\n }\n ]\n },\n \"prom_eval_interval\": 30,\n \"enable_stime\": \"\",\n \"enable_stimes\": [\n \"00:00\"\n ],\n \"enable_etime\": \"\",\n \"enable_etimes\": [\n \"23:59\"\n ],\n \"enable_days_of_week\": null,\n \"enable_days_of_weeks\": [\n [\n \"0\",\n \"1\",\n \"2\",\n \"3\",\n \"4\",\n \"5\",\n \"6\"\n ]\n ],\n \"enable_in_bg\": 0,\n \"notify_recovered\": 1,\n \"notify_channels\": [],\n \"notify_groups_obj\": null,\n \"notify_groups\": null,\n \"notify_repeat_step\": 60,\n \"notify_max_number\": 0,\n \"recover_duration\": 0,\n \"callbacks\": [],\n \"runbook_url\": \"\",\n \"append_tags\": [],\n \"annotations\": {},\n \"extra_config\": null,\n \"create_at\": 0,\n \"create_by\": \"\",\n \"update_at\": 0,\n \"update_by\": \"\",\n \"uuid\": 1717556327699689000\n }\n]"
},
{
"path": "integrations/Linux/alerts/linux_by_categraf.json",
"content": "[\n {\n \"id\": 0,\n \"group_id\": 0,\n \"cate\": \"prometheus\",\n \"datasource_ids\": [\n 0\n ],\n \"cluster\": \"\",\n \"name\": \"Hard disk - expected to be written full in 4 hours - categraf\",\n \"note\": \"\",\n \"prod\": \"metric\",\n \"algorithm\": \"\",\n \"algo_params\": null,\n \"delay\": 0,\n \"severity\": 1,\n \"severities\": [\n 1\n ],\n \"disabled\": 1,\n \"prom_for_duration\": 60,\n \"prom_ql\": \"\",\n \"rule_config\": {\n \"algo_params\": null,\n \"inhibit\": false,\n \"prom_ql\": \"\",\n \"queries\": [\n {\n \"prom_ql\": \"predict_linear(disk_free[1h], 4*3600) \\u003c 0\",\n \"severity\": 1\n }\n ],\n \"severity\": 0\n },\n \"prom_eval_interval\": 15,\n \"enable_stime\": \"00:00\",\n \"enable_stimes\": [\n \"00:00\"\n ],\n \"enable_etime\": \"23:59\",\n \"enable_etimes\": [\n \"23:59\"\n ],\n \"enable_days_of_week\": [\n \"1\",\n \"2\",\n \"3\",\n \"4\",\n \"5\",\n \"6\",\n \"0\"\n ],\n \"enable_days_of_weeks\": [\n [\n \"1\",\n \"2\",\n \"3\",\n \"4\",\n \"5\",\n \"6\",\n \"0\"\n ]\n ],\n \"enable_in_bg\": 0,\n \"notify_recovered\": 1,\n \"notify_channels\": [\n \"email\",\n \"dingtalk\",\n \"wecom\"\n ],\n \"notify_groups_obj\": null,\n \"notify_groups\": null,\n \"notify_repeat_step\": 60,\n \"notify_max_number\": 0,\n \"recover_duration\": 0,\n \"callbacks\": [],\n \"runbook_url\": \"\",\n \"append_tags\": [],\n \"annotations\": null,\n \"extra_config\": null,\n \"create_at\": 0,\n \"create_by\": \"\",\n \"update_at\": 0,\n \"update_by\": \"\",\n \"uuid\": 1717556327701151000\n },\n {\n \"id\": 0,\n \"group_id\": 0,\n \"cate\": \"prometheus\",\n \"datasource_ids\": [\n 0\n ],\n \"cluster\": \"\",\n \"name\": \"Hard disk - IO is a bit busy - categraf\",\n \"note\": \"\",\n \"prod\": \"metric\",\n \"algorithm\": \"\",\n \"algo_params\": null,\n \"delay\": 0,\n \"severity\": 2,\n \"severities\": [\n 2\n ],\n \"disabled\": 1,\n \"prom_for_duration\": 60,\n \"prom_ql\": \"\",\n \"rule_config\": {\n \"algo_params\": null,\n \"inhibit\": false,\n \"prom_ql\": \"\",\n \"queries\": [\n {\n \"prom_ql\": \"rate(diskio_io_time[1m])/10 \\u003e 99\",\n \"severity\": 2\n }\n ],\n \"severity\": 0\n },\n \"prom_eval_interval\": 15,\n \"enable_stime\": \"00:00\",\n \"enable_stimes\": [\n \"00:00\"\n ],\n \"enable_etime\": \"23:59\",\n \"enable_etimes\": [\n \"23:59\"\n ],\n \"enable_days_of_week\": [\n \"1\",\n \"2\",\n \"3\",\n \"4\",\n \"5\",\n \"6\",\n \"0\"\n ],\n \"enable_days_of_weeks\": [\n [\n \"1\",\n \"2\",\n \"3\",\n \"4\",\n \"5\",\n \"6\",\n \"0\"\n ]\n ],\n \"enable_in_bg\": 0,\n \"notify_recovered\": 1,\n \"notify_channels\": [\n \"email\",\n \"dingtalk\",\n \"wecom\"\n ],\n \"notify_groups_obj\": null,\n \"notify_groups\": null,\n \"notify_repeat_step\": 60,\n \"notify_max_number\": 0,\n \"recover_duration\": 0,\n \"callbacks\": [],\n \"runbook_url\": \"\",\n \"append_tags\": [],\n \"annotations\": null,\n \"extra_config\": null,\n \"create_at\": 0,\n \"create_by\": \"\",\n \"update_at\": 0,\n \"update_by\": \"\",\n \"uuid\": 1717556327701630000\n },\n {\n \"id\": 0,\n \"group_id\": 0,\n \"cate\": \"host\",\n \"datasource_ids\": null,\n \"cluster\": \"\",\n \"name\": \"Lost connection with monitoring target - categraf\",\n \"note\": \"\",\n \"prod\": \"host\",\n \"algorithm\": \"\",\n \"algo_params\": null,\n \"delay\": 0,\n \"severity\": 0,\n \"severities\": [\n 2\n ],\n \"disabled\": 1,\n \"prom_for_duration\": 0,\n \"prom_ql\": \"\",\n \"rule_config\": {\n \"inhibit\": false,\n \"queries\": [\n {\n \"key\": \"all_hosts\",\n \"op\": \"==\",\n \"values\": []\n }\n ],\n \"triggers\": [\n {\n \"duration\": 60,\n \"severity\": 2,\n \"type\": \"target_miss\"\n }\n ]\n },\n \"prom_eval_interval\": 15,\n \"enable_stime\": \"00:00\",\n \"enable_stimes\": [\n \"00:00\"\n ],\n \"enable_etime\": \"23:59\",\n \"enable_etimes\": [\n \"23:59\"\n ],\n \"enable_days_of_week\": [\n \"1\",\n \"2\",\n \"3\",\n \"4\",\n \"5\",\n \"6\",\n \"0\"\n ],\n \"enable_days_of_weeks\": [\n [\n \"1\",\n \"2\",\n \"3\",\n \"4\",\n \"5\",\n \"6\",\n \"0\"\n ]\n ],\n \"enable_in_bg\": 0,\n \"notify_recovered\": 1,\n \"notify_channels\": [],\n \"notify_groups_obj\": null,\n \"notify_groups\": null,\n \"notify_repeat_step\": 60,\n \"notify_max_number\": 0,\n \"recover_duration\": 0,\n \"callbacks\": [],\n \"runbook_url\": \"\",\n \"append_tags\": [],\n \"annotations\": {},\n \"extra_config\": {\n \"escalation\": {},\n \"notify_aggregation\": {}\n },\n \"create_at\": 0,\n \"create_by\": \"\",\n \"update_at\": 0,\n \"update_by\": \"\",\n \"uuid\": 1717556327702101000\n },\n {\n \"id\": 0,\n \"group_id\": 0,\n \"cate\": \"prometheus\",\n \"datasource_ids\": [\n 0\n ],\n \"cluster\": \"\",\n \"name\": \"Machine load - high memory, please pay attention - categraf\",\n \"note\": \"\",\n \"prod\": \"metric\",\n \"algorithm\": \"\",\n \"algo_params\": null,\n \"delay\": 0,\n \"severity\": 0,\n \"severities\": [\n 3,\n 2,\n 1\n ],\n \"disabled\": 1,\n \"prom_for_duration\": 60,\n \"prom_ql\": \"\",\n \"rule_config\": {\n \"inhibit\": true,\n \"queries\": [\n {\n \"prom_ql\": \"mem_available_percent \\u003c 25\",\n \"severity\": 3\n },\n {\n \"prom_ql\": \"mem_available_percent \\u003c 15\",\n \"severity\": 2\n },\n {\n \"prom_ql\": \"mem_available_percent \\u003c 5\",\n \"severity\": 1\n }\n ]\n },\n \"prom_eval_interval\": 15,\n \"enable_stime\": \"00:00\",\n \"enable_stimes\": [\n \"00:00\"\n ],\n \"enable_etime\": \"23:59\",\n \"enable_etimes\": [\n \"23:59\"\n ],\n \"enable_days_of_week\": [\n \"1\",\n \"2\",\n \"3\",\n \"4\",\n \"5\",\n \"6\",\n \"0\"\n ],\n \"enable_days_of_weeks\": [\n [\n \"1\",\n \"2\",\n \"3\",\n \"4\",\n \"5\",\n \"6\",\n \"0\"\n ]\n ],\n \"enable_in_bg\": 0,\n \"notify_recovered\": 1,\n \"notify_channels\": [\n \"email\",\n \"dingtalk\",\n \"wecom\"\n ],\n \"notify_groups_obj\": null,\n \"notify_groups\": null,\n \"notify_repeat_step\": 60,\n \"notify_max_number\": 0,\n \"recover_duration\": 0,\n \"callbacks\": [],\n \"runbook_url\": \"\",\n \"append_tags\": [],\n \"annotations\": {},\n \"extra_config\": null,\n \"create_at\": 0,\n \"create_by\": \"\",\n \"update_at\": 0,\n \"update_by\": \"\",\n \"uuid\": 1717556327702614000\n },\n {\n \"id\": 0,\n \"group_id\": 0,\n \"cate\": \"prometheus\",\n \"datasource_ids\": [\n 0\n ],\n \"cluster\": \"\",\n \"name\": \"number of TME_WAIT exceeds 20,000 - categraf\",\n \"note\": \"\",\n \"prod\": \"metric\",\n \"algorithm\": \"\",\n \"algo_params\": null,\n \"delay\": 0,\n \"severity\": 2,\n \"severities\": [\n 2\n ],\n \"disabled\": 1,\n \"prom_for_duration\": 60,\n \"prom_ql\": \"\",\n \"rule_config\": {\n \"algo_params\": null,\n \"inhibit\": false,\n \"prom_ql\": \"\",\n \"queries\": [\n {\n \"prom_ql\": \"netstat_tcp_time_wait \\u003e 20000\",\n \"severity\": 2\n }\n ],\n \"severity\": 0\n },\n \"prom_eval_interval\": 15,\n \"enable_stime\": \"00:00\",\n \"enable_stimes\": [\n \"00:00\"\n ],\n \"enable_etime\": \"23:59\",\n \"enable_etimes\": [\n \"23:59\"\n ],\n \"enable_days_of_week\": [\n \"1\",\n \"2\",\n \"3\",\n \"4\",\n \"5\",\n \"6\",\n \"0\"\n ],\n \"enable_days_of_weeks\": [\n [\n \"1\",\n \"2\",\n \"3\",\n \"4\",\n \"5\",\n \"6\",\n \"0\"\n ]\n ],\n \"enable_in_bg\": 0,\n \"notify_recovered\": 1,\n \"notify_channels\": [\n \"email\",\n \"dingtalk\",\n \"wecom\"\n ],\n \"notify_groups_obj\": null,\n \"notify_groups\": null,\n \"notify_repeat_step\": 60,\n \"notify_max_number\": 0,\n \"recover_duration\": 0,\n \"callbacks\": [],\n \"runbook_url\": \"\",\n \"append_tags\": [],\n \"annotations\": null,\n \"extra_config\": null,\n \"create_at\": 0,\n \"create_by\": \"\",\n \"update_at\": 0,\n \"update_by\": \"\",\n \"uuid\": 1717556327703157000\n },\n {\n \"id\": 0,\n \"group_id\": 0,\n \"cate\": \"prometheus\",\n \"datasource_ids\": [\n 0\n ],\n \"cluster\": \"\",\n \"name\": \"packet loss in the inbound direction - categraf\",\n \"note\": \"\",\n \"prod\": \"metric\",\n \"algorithm\": \"\",\n \"algo_params\": null,\n \"delay\": 0,\n \"severity\": 3,\n \"severities\": [\n 3\n ],\n \"disabled\": 1,\n \"prom_for_duration\": 60,\n \"prom_ql\": \"\",\n \"rule_config\": {\n \"algo_params\": null,\n \"inhibit\": false,\n \"prom_ql\": \"\",\n \"queries\": [\n {\n \"prom_ql\": \"increase(net_drop_in[1m]) \\u003e 0\",\n \"severity\": 3\n }\n ],\n \"severity\": 0\n },\n \"prom_eval_interval\": 15,\n \"enable_stime\": \"00:00\",\n \"enable_stimes\": [\n \"00:00\"\n ],\n \"enable_etime\": \"23:59\",\n \"enable_etimes\": [\n \"23:59\"\n ],\n \"enable_days_of_week\": [\n \"1\",\n \"2\",\n \"3\",\n \"4\",\n \"5\",\n \"6\",\n \"0\"\n ],\n \"enable_days_of_weeks\": [\n [\n \"1\",\n \"2\",\n \"3\",\n \"4\",\n \"5\",\n \"6\",\n \"0\"\n ]\n ],\n \"enable_in_bg\": 0,\n \"notify_recovered\": 1,\n \"notify_channels\": [\n \"email\",\n \"dingtalk\",\n \"wecom\"\n ],\n \"notify_groups_obj\": null,\n \"notify_groups\": null,\n \"notify_repeat_step\": 60,\n \"notify_max_number\": 0,\n \"recover_duration\": 0,\n \"callbacks\": [],\n \"runbook_url\": \"\",\n \"append_tags\": [],\n \"annotations\": null,\n \"extra_config\": null,\n \"create_at\": 0,\n \"create_by\": \"\",\n \"update_at\": 0,\n \"update_by\": \"\",\n \"uuid\": 1717556327703673000\n },\n {\n \"id\": 0,\n \"group_id\": 0,\n \"cate\": \"prometheus\",\n \"datasource_ids\": [\n 0\n ],\n \"cluster\": \"\",\n \"name\": \"packet loss in the outbound direction - categraf\",\n \"note\": \"\",\n \"prod\": \"metric\",\n \"algorithm\": \"\",\n \"algo_params\": null,\n \"delay\": 0,\n \"severity\": 3,\n \"severities\": [\n 3\n ],\n \"disabled\": 1,\n \"prom_for_duration\": 60,\n \"prom_ql\": \"\",\n \"rule_config\": {\n \"algo_params\": null,\n \"inhibit\": false,\n \"prom_ql\": \"\",\n \"queries\": [\n {\n \"prom_ql\": \"increase(net_drop_out[1m]) \\u003e 0\",\n \"severity\": 3\n }\n ],\n \"severity\": 0\n },\n \"prom_eval_interval\": 15,\n \"enable_stime\": \"00:00\",\n \"enable_stimes\": [\n \"00:00\"\n ],\n \"enable_etime\": \"23:59\",\n \"enable_etimes\": [\n \"23:59\"\n ],\n \"enable_days_of_week\": [\n \"1\",\n \"2\",\n \"3\",\n \"4\",\n \"5\",\n \"6\",\n \"0\"\n ],\n \"enable_days_of_weeks\": [\n [\n \"1\",\n \"2\",\n \"3\",\n \"4\",\n \"5\",\n \"6\",\n \"0\"\n ]\n ],\n \"enable_in_bg\": 0,\n \"notify_recovered\": 1,\n \"notify_channels\": [\n \"email\",\n \"dingtalk\",\n \"wecom\"\n ],\n \"notify_groups_obj\": null,\n \"notify_groups\": null,\n \"notify_repeat_step\": 60,\n \"notify_max_number\": 0,\n \"recover_duration\": 0,\n \"callbacks\": [],\n \"runbook_url\": \"\",\n \"append_tags\": [],\n \"annotations\": null,\n \"extra_config\": null,\n \"create_at\": 0,\n \"create_by\": \"\",\n \"update_at\": 0,\n \"update_by\": \"\",\n \"uuid\": 1717556327704127000\n },\n {\n \"id\": 0,\n \"group_id\": 0,\n \"cate\": \"prometheus\",\n \"datasource_ids\": [\n 0\n ],\n \"cluster\": \"\",\n \"name\": \"大于200G的盘,空间不足了\",\n \"note\": \"\",\n \"prod\": \"metric\",\n \"algorithm\": \"\",\n \"algo_params\": null,\n \"delay\": 0,\n \"severity\": 0,\n \"severities\": [\n 3,\n 2,\n 1\n ],\n \"disabled\": 1,\n \"prom_for_duration\": 60,\n \"prom_ql\": \"\",\n \"rule_config\": {\n \"inhibit\": true,\n \"queries\": [\n {\n \"prom_ql\": \"disk_free/1024/1024/1024 \\u003c 20 and disk_total/1024/1024/1024 \\u003e= 200\",\n \"severity\": 3\n },\n {\n \"prom_ql\": \"disk_free/1024/1024/1024 \\u003c 10 and disk_total/1024/1024/1024 \\u003e= 200\",\n \"severity\": 2\n },\n {\n \"prom_ql\": \"disk_free/1024/1024/1024 \\u003c 2 and disk_total/1024/1024/1024 \\u003e= 200\",\n \"severity\": 1\n }\n ]\n },\n \"prom_eval_interval\": 30,\n \"enable_stime\": \"00:00\",\n \"enable_stimes\": [\n \"00:00\"\n ],\n \"enable_etime\": \"23:59\",\n \"enable_etimes\": [\n \"23:59\"\n ],\n \"enable_days_of_week\": [\n \"0\",\n \"1\",\n \"2\",\n \"3\",\n \"4\",\n \"5\",\n \"6\"\n ],\n \"enable_days_of_weeks\": [\n [\n \"0\",\n \"1\",\n \"2\",\n \"3\",\n \"4\",\n \"5\",\n \"6\"\n ]\n ],\n \"enable_in_bg\": 0,\n \"notify_recovered\": 1,\n \"notify_channels\": [],\n \"notify_groups_obj\": null,\n \"notify_groups\": null,\n \"notify_repeat_step\": 60,\n \"notify_max_number\": 0,\n \"recover_duration\": 0,\n \"callbacks\": [],\n \"runbook_url\": \"\",\n \"append_tags\": [],\n \"annotations\": {},\n \"extra_config\": null,\n \"create_at\": 0,\n \"create_by\": \"\",\n \"update_at\": 0,\n \"update_by\": \"\",\n \"uuid\": 1717556327704616000\n },\n {\n \"id\": 0,\n \"group_id\": 0,\n \"cate\": \"prometheus\",\n \"datasource_ids\": [\n 0\n ],\n \"cluster\": \"\",\n \"name\": \"小于200G的盘,空间不足了\",\n \"note\": \"\",\n \"prod\": \"metric\",\n \"algorithm\": \"\",\n \"algo_params\": null,\n \"delay\": 0,\n \"severity\": 0,\n \"severities\": [\n 2,\n 1,\n 3\n ],\n \"disabled\": 1,\n \"prom_for_duration\": 60,\n \"prom_ql\": \"\",\n \"rule_config\": {\n \"inhibit\": true,\n \"queries\": [\n {\n \"prom_ql\": \"disk_used_percent \\u003e 90 and disk_total/1024/1024/1024 \\u003c 200\",\n \"severity\": 3\n },\n {\n \"prom_ql\": \"disk_used_percent \\u003e 95 and disk_total/1024/1024/1024 \\u003c 200\",\n \"severity\": 2\n },\n {\n \"prom_ql\": \"disk_used_percent \\u003e 99 and disk_total/1024/1024/1024 \\u003c 200\",\n \"severity\": 1\n }\n ]\n },\n \"prom_eval_interval\": 30,\n \"enable_stime\": \"00:00\",\n \"enable_stimes\": [\n \"00:00\"\n ],\n \"enable_etime\": \"23:59\",\n \"enable_etimes\": [\n \"23:59\"\n ],\n \"enable_days_of_week\": [\n \"0\",\n \"1\",\n \"2\",\n \"3\",\n \"4\",\n \"5\",\n \"6\"\n ],\n \"enable_days_of_weeks\": [\n [\n \"0\",\n \"1\",\n \"2\",\n \"3\",\n \"4\",\n \"5\",\n \"6\"\n ]\n ],\n \"enable_in_bg\": 0,\n \"notify_recovered\": 1,\n \"notify_channels\": [],\n \"notify_groups_obj\": null,\n \"notify_groups\": null,\n \"notify_repeat_step\": 60,\n \"notify_max_number\": 0,\n \"recover_duration\": 0,\n \"callbacks\": [],\n \"runbook_url\": \"\",\n \"append_tags\": [],\n \"annotations\": {},\n \"extra_config\": null,\n \"create_at\": 0,\n \"create_by\": \"\",\n \"update_at\": 0,\n \"update_by\": \"\",\n \"uuid\": 1717556327705264000\n }\n]"
},
{
"path": "integrations/Linux/alerts/linux_by_exporter.json",
"content": "[\n {\n \"id\": 0,\n \"group_id\": 0,\n \"cate\": \"prometheus\",\n \"datasource_ids\": [\n 0\n ],\n \"cluster\": \"\",\n \"name\": \"A certain disk is unable to read/write normally\",\n \"note\": \"\",\n \"prod\": \"metric\",\n \"algorithm\": \"\",\n \"algo_params\": null,\n \"delay\": 0,\n \"severity\": 1,\n \"severities\": [\n 1\n ],\n \"disabled\": 1,\n \"prom_for_duration\": 60,\n \"prom_ql\": \"\",\n \"rule_config\": {\n \"algo_params\": null,\n \"inhibit\": false,\n \"prom_ql\": \"\",\n \"queries\": [\n {\n \"prom_ql\": \"(node_filesystem_device_error{mountpoint!~\\\"/var/lib/.*\\\",mountpoint!~\\\"/run.*\\\"}) \\u003e 0\",\n \"severity\": 1\n }\n ],\n \"severity\": 0\n },\n \"prom_eval_interval\": 15,\n \"enable_stime\": \"00:00\",\n \"enable_stimes\": [\n \"00:00\"\n ],\n \"enable_etime\": \"23:59\",\n \"enable_etimes\": [\n \"23:59\"\n ],\n \"enable_days_of_week\": [\n \"1\",\n \"2\",\n \"3\",\n \"4\",\n \"5\",\n \"6\",\n \"0\"\n ],\n \"enable_days_of_weeks\": [\n [\n \"1\",\n \"2\",\n \"3\",\n \"4\",\n \"5\",\n \"6\",\n \"0\"\n ]\n ],\n \"enable_in_bg\": 0,\n \"notify_recovered\": 1,\n \"notify_channels\": [],\n \"notify_groups_obj\": null,\n \"notify_groups\": null,\n \"notify_repeat_step\": 60,\n \"notify_max_number\": 0,\n \"recover_duration\": 0,\n \"callbacks\": [],\n \"runbook_url\": \"\",\n \"append_tags\": [],\n \"annotations\": null,\n \"extra_config\": null,\n \"create_at\": 0,\n \"create_by\": \"\",\n \"update_at\": 0,\n \"update_by\": \"\",\n \"uuid\": 1717556327706838000\n },\n {\n \"id\": 0,\n \"group_id\": 0,\n \"cate\": \"prometheus\",\n \"datasource_ids\": [\n 0\n ],\n \"cluster\": \"\",\n \"name\": \"Disk needs to be cleaned - utilization has reached 92% - node exporter\",\n \"note\": \"\",\n \"prod\": \"metric\",\n \"algorithm\": \"\",\n \"algo_params\": null,\n \"delay\": 0,\n \"severity\": 1,\n \"severities\": [\n 1\n ],\n \"disabled\": 1,\n \"prom_for_duration\": 60,\n \"prom_ql\": \"\",\n \"rule_config\": {\n \"algo_params\": null,\n \"inhibit\": false,\n \"prom_ql\": \"\",\n \"queries\": [\n {\n \"prom_ql\": \"(100 - ((node_filesystem_avail_bytes * 100) / node_filesystem_size_bytes) ) \\u003e 92 \",\n \"severity\": 1\n }\n ],\n \"severity\": 0\n },\n \"prom_eval_interval\": 15,\n \"enable_stime\": \"00:00\",\n \"enable_stimes\": [\n \"00:00\"\n ],\n \"enable_etime\": \"23:59\",\n \"enable_etimes\": [\n \"23:59\"\n ],\n \"enable_days_of_week\": [\n \"1\",\n \"2\",\n \"3\",\n \"4\",\n \"5\",\n \"6\",\n \"0\"\n ],\n \"enable_days_of_weeks\": [\n [\n \"1\",\n \"2\",\n \"3\",\n \"4\",\n \"5\",\n \"6\",\n \"0\"\n ]\n ],\n \"enable_in_bg\": 0,\n \"notify_recovered\": 1,\n \"notify_channels\": [\n \"dingtalk\"\n ],\n \"notify_groups_obj\": null,\n \"notify_groups\": null,\n \"notify_repeat_step\": 60,\n \"notify_max_number\": 0,\n \"recover_duration\": 0,\n \"callbacks\": [],\n \"runbook_url\": \"\",\n \"append_tags\": [],\n \"annotations\": null,\n \"extra_config\": null,\n \"create_at\": 0,\n \"create_by\": \"\",\n \"update_at\": 0,\n \"update_by\": \"\",\n \"uuid\": 1717556327707545000\n },\n {\n \"id\": 0,\n \"group_id\": 0,\n \"cate\": \"prometheus\",\n \"datasource_ids\": [\n 0\n ],\n \"cluster\": \"\",\n \"name\": \"Insufficient computational resources - average load per core of the machine is greater than 10 - node exporter\",\n \"note\": \"\",\n \"prod\": \"metric\",\n \"algorithm\": \"\",\n \"algo_params\": null,\n \"delay\": 0,\n \"severity\": 2,\n \"severities\": [\n 2\n ],\n \"disabled\": 1,\n \"prom_for_duration\": 60,\n \"prom_ql\": \"\",\n \"rule_config\": {\n \"algo_params\": null,\n \"inhibit\": false,\n \"prom_ql\": \"\",\n \"queries\": [\n {\n \"prom_ql\": \"avg (node_load1) by (instance)/count(count(node_cpu_seconds_total) by (cpu,instance)) by (instance) \\u003e10\",\n \"severity\": 2\n }\n ],\n \"severity\": 0\n },\n \"prom_eval_interval\": 15,\n \"enable_stime\": \"00:00\",\n \"enable_stimes\": [\n \"00:00\"\n ],\n \"enable_etime\": \"23:59\",\n \"enable_etimes\": [\n \"23:59\"\n ],\n \"enable_days_of_week\": [\n \"1\",\n \"2\",\n \"3\",\n \"4\",\n \"5\",\n \"6\",\n \"0\"\n ],\n \"enable_days_of_weeks\": [\n [\n \"1\",\n \"2\",\n \"3\",\n \"4\",\n \"5\",\n \"6\",\n \"0\"\n ]\n ],\n \"enable_in_bg\": 0,\n \"notify_recovered\": 1,\n \"notify_channels\": [],\n \"notify_groups_obj\": null,\n \"notify_groups\": null,\n \"notify_repeat_step\": 60,\n \"notify_max_number\": 0,\n \"recover_duration\": 0,\n \"callbacks\": [],\n \"runbook_url\": \"\",\n \"append_tags\": [],\n \"annotations\": null,\n \"extra_config\": null,\n \"create_at\": 0,\n \"create_by\": \"\",\n \"update_at\": 0,\n \"update_by\": \"\",\n \"uuid\": 1717556327708152000\n },\n {\n \"id\": 0,\n \"group_id\": 0,\n \"cate\": \"prometheus\",\n \"datasource_ids\": [\n 0\n ],\n \"cluster\": \"\",\n \"name\": \"Insufficient file handles - usage exceeds 90% - node exporter\",\n \"note\": \"You can increase the file handle limit or expand the capacity\",\n \"prod\": \"metric\",\n \"algorithm\": \"\",\n \"algo_params\": null,\n \"delay\": 0,\n \"severity\": 2,\n \"severities\": [\n 2\n ],\n \"disabled\": 1,\n \"prom_for_duration\": 60,\n \"prom_ql\": \"\",\n \"rule_config\": {\n \"algo_params\": null,\n \"inhibit\": false,\n \"prom_ql\": \"\",\n \"queries\": [\n {\n \"prom_ql\": \"(node_filefd_allocated/node_filefd_maximum*100) \\u003e 90\",\n \"severity\": 2\n }\n ],\n \"severity\": 0\n },\n \"prom_eval_interval\": 15,\n \"enable_stime\": \"00:00\",\n \"enable_stimes\": [\n \"00:00\"\n ],\n \"enable_etime\": \"23:59\",\n \"enable_etimes\": [\n \"23:59\"\n ],\n \"enable_days_of_week\": [\n \"1\",\n \"2\",\n \"3\",\n \"4\",\n \"5\",\n \"6\",\n \"0\"\n ],\n \"enable_days_of_weeks\": [\n [\n \"1\",\n \"2\",\n \"3\",\n \"4\",\n \"5\",\n \"6\",\n \"0\"\n ]\n ],\n \"enable_in_bg\": 0,\n \"notify_recovered\": 1,\n \"notify_channels\": [],\n \"notify_groups_obj\": null,\n \"notify_groups\": null,\n \"notify_repeat_step\": 60,\n \"notify_max_number\": 0,\n \"recover_duration\": 0,\n \"callbacks\": [],\n \"runbook_url\": \"\",\n \"append_tags\": [],\n \"annotations\": null,\n \"extra_config\": null,\n \"create_at\": 0,\n \"create_by\": \"\",\n \"update_at\": 0,\n \"update_by\": \"\",\n \"uuid\": 1717556327708746000\n },\n {\n \"id\": 0,\n \"group_id\": 0,\n \"cate\": \"prometheus\",\n \"datasource_ids\": [\n 0\n ],\n \"cluster\": \"\",\n \"name\": \"Insufficient inode resources - usage exceeds 90% - node exporter\",\n \"note\": \"\",\n \"prod\": \"metric\",\n \"algorithm\": \"\",\n \"algo_params\": null,\n \"delay\": 0,\n \"severity\": 2,\n \"severities\": [\n 2\n ],\n \"disabled\": 1,\n \"prom_for_duration\": 60,\n \"prom_ql\": \"\",\n \"rule_config\": {\n \"algo_params\": null,\n \"inhibit\": false,\n \"prom_ql\": \"\",\n \"queries\": [\n {\n \"prom_ql\": \"(100 - ((node_filesystem_files_free * 100) / node_filesystem_files))\\u003e90\",\n \"severity\": 2\n }\n ],\n \"severity\": 0\n },\n \"prom_eval_interval\": 15,\n \"enable_stime\": \"00:00\",\n \"enable_stimes\": [\n \"00:00\"\n ],\n \"enable_etime\": \"23:59\",\n \"enable_etimes\": [\n \"23:59\"\n ],\n \"enable_days_of_week\": [\n \"1\",\n \"2\",\n \"3\",\n \"4\",\n \"5\",\n \"6\",\n \"0\"\n ],\n \"enable_days_of_weeks\": [\n [\n \"1\",\n \"2\",\n \"3\",\n \"4\",\n \"5\",\n \"6\",\n \"0\"\n ]\n ],\n \"enable_in_bg\": 0,\n \"notify_recovered\": 1,\n \"notify_channels\": [],\n \"notify_groups_obj\": null,\n \"notify_groups\": null,\n \"notify_repeat_step\": 60,\n \"notify_max_number\": 0,\n \"recover_duration\": 0,\n \"callbacks\": [],\n \"runbook_url\": \"\",\n \"append_tags\": [],\n \"annotations\": null,\n \"extra_config\": null,\n \"create_at\": 0,\n \"create_by\": \"\",\n \"update_at\": 0,\n \"update_by\": \"\",\n \"uuid\": 1717556327709386000\n },\n {\n \"id\": 0,\n \"group_id\": 0,\n \"cate\": \"prometheus\",\n \"datasource_ids\": [\n 0\n ],\n \"cluster\": \"\",\n \"name\": \"Insufficient memory resources - utilization is greater than 75% - node exporter\",\n \"note\": \"Expansion or upgrading of configuration is required\",\n \"prod\": \"metric\",\n \"algorithm\": \"\",\n \"algo_params\": null,\n \"delay\": 0,\n \"severity\": 2,\n \"severities\": [\n 2\n ],\n \"disabled\": 1,\n \"prom_for_duration\": 60,\n \"prom_ql\": \"\",\n \"rule_config\": {\n \"algo_params\": null,\n \"inhibit\": false,\n \"prom_ql\": \"\",\n \"queries\": [\n {\n \"prom_ql\": \"(node_memory_MemTotal_bytes - node_memory_MemFree_bytes - (node_memory_Cached_bytes + node_memory_Buffers_bytes))/node_memory_MemTotal_bytes*100 \\u003e 75\",\n \"severity\": 2\n }\n ],\n \"severity\": 0\n },\n \"prom_eval_interval\": 15,\n \"enable_stime\": \"00:00\",\n \"enable_stimes\": [\n \"00:00\"\n ],\n \"enable_etime\": \"23:59\",\n \"enable_etimes\": [\n \"23:59\"\n ],\n \"enable_days_of_week\": [\n \"1\",\n \"2\",\n \"3\",\n \"4\",\n \"5\",\n \"6\",\n \"0\"\n ],\n \"enable_days_of_weeks\": [\n [\n \"1\",\n \"2\",\n \"3\",\n \"4\",\n \"5\",\n \"6\",\n \"0\"\n ]\n ],\n \"enable_in_bg\": 0,\n \"notify_recovered\": 1,\n \"notify_channels\": [\n \"dingtalk\"\n ],\n \"notify_groups_obj\": null,\n \"notify_groups\": null,\n \"notify_repeat_step\": 60,\n \"notify_max_number\": 0,\n \"recover_duration\": 0,\n \"callbacks\": [],\n \"runbook_url\": \"\",\n \"append_tags\": [],\n \"annotations\": null,\n \"extra_config\": null,\n \"create_at\": 0,\n \"create_by\": \"\",\n \"update_at\": 0,\n \"update_by\": \"\",\n \"uuid\": 1717556327709948000\n },\n {\n \"id\": 0,\n \"group_id\": 0,\n \"cate\": \"prometheus\",\n \"datasource_ids\": [\n 0\n ],\n \"cluster\": \"\",\n \"name\": \"Insufficient memory resources - utilization is greater than 95% - node exporter\",\n \"note\": \"\",\n \"prod\": \"metric\",\n \"algorithm\": \"\",\n \"algo_params\": null,\n \"delay\": 0,\n \"severity\": 1,\n \"severities\": [\n 1\n ],\n \"disabled\": 1,\n \"prom_for_duration\": 60,\n \"prom_ql\": \"\",\n \"rule_config\": {\n \"algo_params\": null,\n \"inhibit\": false,\n \"prom_ql\": \"\",\n \"queries\": [\n {\n \"prom_ql\": \"(node_memory_MemTotal_bytes - node_memory_MemFree_bytes - (node_memory_Cached_bytes + node_memory_Buffers_bytes))/node_memory_MemTotal_bytes*100 \\u003e 95\",\n \"severity\": 1\n }\n ],\n \"severity\": 0\n },\n \"prom_eval_interval\": 15,\n \"enable_stime\": \"00:00\",\n \"enable_stimes\": [\n \"00:00\"\n ],\n \"enable_etime\": \"23:59\",\n \"enable_etimes\": [\n \"23:59\"\n ],\n \"enable_days_of_week\": [\n \"1\",\n \"2\",\n \"3\",\n \"4\",\n \"5\",\n \"6\",\n \"0\"\n ],\n \"enable_days_of_weeks\": [\n [\n \"1\",\n \"2\",\n \"3\",\n \"4\",\n \"5\",\n \"6\",\n \"0\"\n ]\n ],\n \"enable_in_bg\": 0,\n \"notify_recovered\": 1,\n \"notify_channels\": [\n \"dingtalk\"\n ],\n \"notify_groups_obj\": null,\n \"notify_groups\": null,\n \"notify_repeat_step\": 60,\n \"notify_max_number\": 0,\n \"recover_duration\": 0,\n \"callbacks\": [],\n \"runbook_url\": \"\",\n \"append_tags\": [],\n \"annotations\": null,\n \"extra_config\": null,\n \"create_at\": 0,\n \"create_by\": \"\",\n \"update_at\": 0,\n \"update_by\": \"\",\n \"uuid\": 1717556327710525000\n },\n {\n \"id\": 0,\n \"group_id\": 0,\n \"cate\": \"prometheus\",\n \"datasource_ids\": [\n 0\n ],\n \"cluster\": \"\",\n \"name\": \"Packet loss in the inbound direction of the network card - node exporter\",\n \"note\": \"\",\n \"prod\": \"metric\",\n \"algorithm\": \"\",\n \"algo_params\": null,\n \"delay\": 0,\n \"severity\": 2,\n \"severities\": [\n 2\n ],\n \"disabled\": 1,\n \"prom_for_duration\": 60,\n \"prom_ql\": \"\",\n \"rule_config\": {\n \"algo_params\": null,\n \"inhibit\": false,\n \"prom_ql\": \"\",\n \"queries\": [\n {\n \"prom_ql\": \"rate(node_network_receive_drop_total{device=~\\\"e.*\\\"}[1m]) \\u003e 3\",\n \"severity\": 2\n }\n ],\n \"severity\": 0\n },\n \"prom_eval_interval\": 15,\n \"enable_stime\": \"00:00\",\n \"enable_stimes\": [\n \"00:00\"\n ],\n \"enable_etime\": \"23:59\",\n \"enable_etimes\": [\n \"23:59\"\n ],\n \"enable_days_of_week\": [\n \"1\",\n \"2\",\n \"3\",\n \"4\",\n \"5\",\n \"6\",\n \"0\"\n ],\n \"enable_days_of_weeks\": [\n [\n \"1\",\n \"2\",\n \"3\",\n \"4\",\n \"5\",\n \"6\",\n \"0\"\n ]\n ],\n \"enable_in_bg\": 0,\n \"notify_recovered\": 1,\n \"notify_channels\": [],\n \"notify_groups_obj\": null,\n \"notify_groups\": null,\n \"notify_repeat_step\": 60,\n \"notify_max_number\": 0,\n \"recover_duration\": 0,\n \"callbacks\": [],\n \"runbook_url\": \"\",\n \"append_tags\": [],\n \"annotations\": null,\n \"extra_config\": null,\n \"create_at\": 0,\n \"create_by\": \"\",\n \"update_at\": 0,\n \"update_by\": \"\",\n \"uuid\": 1717556327711029000\n },\n {\n \"id\": 0,\n \"group_id\": 0,\n \"cate\": \"prometheus\",\n \"datasource_ids\": [\n 0\n ],\n \"cluster\": \"\",\n \"name\": \"Packet loss in the outbound direction of the network card - node exporter\",\n \"note\": \"\",\n \"prod\": \"metric\",\n \"algorithm\": \"\",\n \"algo_params\": null,\n \"delay\": 0,\n \"severity\": 2,\n \"severities\": [\n 2\n ],\n \"disabled\": 1,\n \"prom_for_duration\": 60,\n \"prom_ql\": \"\",\n \"rule_config\": {\n \"algo_params\": null,\n \"inhibit\": false,\n \"prom_ql\": \"\",\n \"queries\": [\n {\n \"prom_ql\": \"rate(node_network_transmit_drop_total{device=~\\\"e.*\\\"}[1m]) \\u003e 3\",\n \"severity\": 2\n }\n ],\n \"severity\": 0\n },\n \"prom_eval_interval\": 15,\n \"enable_stime\": \"00:00\",\n \"enable_stimes\": [\n \"00:00\"\n ],\n \"enable_etime\": \"23:59\",\n \"enable_etimes\": [\n \"23:59\"\n ],\n \"enable_days_of_week\": [\n \"1\",\n \"2\",\n \"3\",\n \"4\",\n \"5\",\n \"6\",\n \"0\"\n ],\n \"enable_days_of_weeks\": [\n [\n \"1\",\n \"2\",\n \"3\",\n \"4\",\n \"5\",\n \"6\",\n \"0\"\n ]\n ],\n \"enable_in_bg\": 0,\n \"notify_recovered\": 1,\n \"notify_channels\": [],\n \"notify_groups_obj\": null,\n \"notify_groups\": null,\n \"notify_repeat_step\": 60,\n \"notify_max_number\": 0,\n \"recover_duration\": 0,\n \"callbacks\": [],\n \"runbook_url\": \"\",\n \"append_tags\": [],\n \"annotations\": null,\n \"extra_config\": null,\n \"create_at\": 0,\n \"create_by\": \"\",\n \"update_at\": 0,\n \"update_by\": \"\",\n \"uuid\": 1717556327711548000\n },\n {\n \"id\": 0,\n \"group_id\": 0,\n \"cate\": \"prometheus\",\n \"datasource_ids\": [\n 0\n ],\n \"cluster\": \"\",\n \"name\": \"System conntrack needs to be adjusted - usage exceeds 80% - node exporter\",\n \"note\": \"\",\n \"prod\": \"metric\",\n \"algorithm\": \"\",\n \"algo_params\": null,\n \"delay\": 0,\n \"severity\": 2,\n \"severities\": [\n 2\n ],\n \"disabled\": 1,\n \"prom_for_duration\": 60,\n \"prom_ql\": \"\",\n \"rule_config\": {\n \"algo_params\": null,\n \"inhibit\": false,\n \"prom_ql\": \"\",\n \"queries\": [\n {\n \"prom_ql\": \"node_nf_conntrack_entries / node_nf_conntrack_entries_limit*100 \\u003e 80\",\n \"severity\": 2\n }\n ],\n \"severity\": 0\n },\n \"prom_eval_interval\": 15,\n \"enable_stime\": \"00:00\",\n \"enable_stimes\": [\n \"00:00\"\n ],\n \"enable_etime\": \"23:59\",\n \"enable_etimes\": [\n \"23:59\"\n ],\n \"enable_days_of_week\": [\n \"1\",\n \"2\",\n \"3\",\n \"4\",\n \"5\",\n \"6\",\n \"0\"\n ],\n \"enable_days_of_weeks\": [\n [\n \"1\",\n \"2\",\n \"3\",\n \"4\",\n \"5\",\n \"6\",\n \"0\"\n ]\n ],\n \"enable_in_bg\": 0,\n \"notify_recovered\": 1,\n \"notify_channels\": [],\n \"notify_groups_obj\": null,\n \"notify_groups\": null,\n \"notify_repeat_step\": 60,\n \"notify_max_number\": 0,\n \"recover_duration\": 0,\n \"callbacks\": [],\n \"runbook_url\": \"\",\n \"append_tags\": [],\n \"annotations\": null,\n \"extra_config\": null,\n \"create_at\": 0,\n \"create_by\": \"\",\n \"update_at\": 0,\n \"update_by\": \"\",\n \"uuid\": 1717556327712073000\n },\n {\n \"id\": 0,\n \"group_id\": 0,\n \"cate\": \"prometheus\",\n \"datasource_ids\": [\n 0\n ],\n \"cluster\": \"\",\n \"name\": \"System experiences OOM - node exporter\",\n \"note\": \"\",\n \"prod\": \"metric\",\n \"algorithm\": \"\",\n \"algo_params\": null,\n \"delay\": 0,\n \"severity\": 2,\n \"severities\": [\n 2\n ],\n \"disabled\": 1,\n \"prom_for_duration\": 60,\n \"prom_ql\": \"\",\n \"rule_config\": {\n \"algo_params\": null,\n \"inhibit\": false,\n \"prom_ql\": \"\",\n \"queries\": [\n {\n \"prom_ql\": \"increase(node_vmstat_oom_kill[1m]) \\u003e 0\",\n \"severity\": 2\n }\n ],\n \"severity\": 0\n },\n \"prom_eval_interval\": 15,\n \"enable_stime\": \"00:00\",\n \"enable_stimes\": [\n \"00:00\"\n ],\n \"enable_etime\": \"23:59\",\n \"enable_etimes\": [\n \"23:59\"\n ],\n \"enable_days_of_week\": [\n \"1\",\n \"2\",\n \"3\",\n \"4\",\n \"5\",\n \"6\",\n \"0\"\n ],\n \"enable_days_of_weeks\": [\n [\n \"1\",\n \"2\",\n \"3\",\n \"4\",\n \"5\",\n \"6\",\n \"0\"\n ]\n ],\n \"enable_in_bg\": 0,\n \"notify_recovered\": 1,\n \"notify_channels\": [],\n \"notify_groups_obj\": null,\n \"notify_groups\": null,\n \"notify_repeat_step\": 60,\n \"notify_max_number\": 0,\n \"recover_duration\": 0,\n \"callbacks\": [],\n \"runbook_url\": \"\",\n \"append_tags\": [],\n \"annotations\": null,\n \"extra_config\": null,\n \"create_at\": 0,\n \"create_by\": \"\",\n \"update_at\": 0,\n \"update_by\": \"\",\n \"uuid\": 1717556327712633000\n },\n {\n \"id\": 0,\n \"group_id\": 0,\n \"cate\": \"prometheus\",\n \"datasource_ids\": [\n 0\n ],\n \"cluster\": \"\",\n \"name\": \"Too many running processes - exceeding 3000 - node exporter\",\n \"note\": \"\",\n \"prod\": \"metric\",\n \"algorithm\": \"\",\n \"algo_params\": null,\n \"delay\": 0,\n \"severity\": 2,\n \"severities\": [\n 2\n ],\n \"disabled\": 1,\n \"prom_for_duration\": 60,\n \"prom_ql\": \"\",\n \"rule_config\": {\n \"algo_params\": null,\n \"inhibit\": false,\n \"prom_ql\": \"\",\n \"queries\": [\n {\n \"prom_ql\": \"node_procs_running \\u003e 3000\",\n \"severity\": 2\n }\n ],\n \"severity\": 0\n },\n \"prom_eval_interval\": 15,\n \"enable_stime\": \"00:00\",\n \"enable_stimes\": [\n \"00:00\"\n ],\n \"enable_etime\": \"23:59\",\n \"enable_etimes\": [\n \"23:59\"\n ],\n \"enable_days_of_week\": [\n \"1\",\n \"2\",\n \"3\",\n \"4\",\n \"5\",\n \"6\",\n \"0\"\n ],\n \"enable_days_of_weeks\": [\n [\n \"1\",\n \"2\",\n \"3\",\n \"4\",\n \"5\",\n \"6\",\n \"0\"\n ]\n ],\n \"enable_in_bg\": 0,\n \"notify_recovered\": 1,\n \"notify_channels\": [],\n \"notify_groups_obj\": null,\n \"notify_groups\": null,\n \"notify_repeat_step\": 60,\n \"notify_max_number\": 0,\n \"recover_duration\": 0,\n \"callbacks\": [],\n \"runbook_url\": \"\",\n \"append_tags\": [],\n \"annotations\": null,\n \"extra_config\": null,\n \"create_at\": 0,\n \"create_by\": \"\",\n \"update_at\": 0,\n \"update_by\": \"\",\n \"uuid\": 1717556327713288000\n }\n]"
},
{
"path": "integrations/Linux/alerts/linux_by_telegraf.json",
"content": "[\n {\n \"id\": 0,\n \"group_id\": 0,\n \"cate\": \"prometheus\",\n \"datasource_ids\": [\n 0\n ],\n \"cluster\": \"\",\n \"name\": \"Address is unreachable by PING, please pay attention - telegraf\",\n \"note\": \"\",\n \"prod\": \"metric\",\n \"algorithm\": \"\",\n \"algo_params\": null,\n \"delay\": 0,\n \"severity\": 1,\n \"severities\": [\n 1\n ],\n \"disabled\": 1,\n \"prom_for_duration\": 60,\n \"prom_ql\": \"\",\n \"rule_config\": {\n \"algo_params\": null,\n \"inhibit\": false,\n \"prom_ql\": \"\",\n \"queries\": [\n {\n \"prom_ql\": \"ping_result_code != 0\",\n \"severity\": 1\n }\n ],\n \"severity\": 0\n },\n \"prom_eval_interval\": 15,\n \"enable_stime\": \"00:00\",\n \"enable_stimes\": [\n \"00:00\"\n ],\n \"enable_etime\": \"23:59\",\n \"enable_etimes\": [\n \"23:59\"\n ],\n \"enable_days_of_week\": [\n \"1\",\n \"2\",\n \"3\",\n \"4\",\n \"5\",\n \"6\",\n \"0\"\n ],\n \"enable_days_of_weeks\": [\n [\n \"1\",\n \"2\",\n \"3\",\n \"4\",\n \"5\",\n \"6\",\n \"0\"\n ]\n ],\n \"enable_in_bg\": 0,\n \"notify_recovered\": 1,\n \"notify_channels\": [\n \"email\",\n \"dingtalk\",\n \"wecom\"\n ],\n \"notify_groups_obj\": null,\n \"notify_groups\": null,\n \"notify_repeat_step\": 60,\n \"notify_max_number\": 0,\n \"recover_duration\": 0,\n \"callbacks\": [],\n \"runbook_url\": \"\",\n \"append_tags\": [],\n \"annotations\": null,\n \"extra_config\": null,\n \"create_at\": 0,\n \"create_by\": \"\",\n \"update_at\": 0,\n \"update_by\": \"\",\n \"uuid\": 1717556327714548000\n },\n {\n \"id\": 0,\n \"group_id\": 0,\n \"cate\": \"prometheus\",\n \"datasource_ids\": [\n 0\n ],\n \"cluster\": \"\",\n \"name\": \"Hard disk - expected to be written full in 4 hours - telegraf\",\n \"note\": \"\",\n \"prod\": \"metric\",\n \"algorithm\": \"\",\n \"algo_params\": null,\n \"delay\": 0,\n \"severity\": 1,\n \"severities\": [\n 1\n ],\n \"disabled\": 1,\n \"prom_for_duration\": 60,\n \"prom_ql\": \"\",\n \"rule_config\": {\n \"algo_params\": null,\n \"inhibit\": false,\n \"prom_ql\": \"\",\n \"queries\": [\n {\n \"prom_ql\": \"predict_linear(disk_free[1h], 4*3600) \\u003c 0\",\n \"severity\": 1\n }\n ],\n \"severity\": 0\n },\n \"prom_eval_interval\": 15,\n \"enable_stime\": \"00:00\",\n \"enable_stimes\": [\n \"00:00\"\n ],\n \"enable_etime\": \"23:59\",\n \"enable_etimes\": [\n \"23:59\"\n ],\n \"enable_days_of_week\": [\n \"1\",\n \"2\",\n \"3\",\n \"4\",\n \"5\",\n \"6\",\n \"0\"\n ],\n \"enable_days_of_weeks\": [\n [\n \"1\",\n \"2\",\n \"3\",\n \"4\",\n \"5\",\n \"6\",\n \"0\"\n ]\n ],\n \"enable_in_bg\": 0,\n \"notify_recovered\": 1,\n \"notify_channels\": [\n \"email\",\n \"dingtalk\",\n \"wecom\"\n ],\n \"notify_groups_obj\": null,\n \"notify_groups\": null,\n \"notify_repeat_step\": 60,\n \"notify_max_number\": 0,\n \"recover_duration\": 0,\n \"callbacks\": [],\n \"runbook_url\": \"\",\n \"append_tags\": [],\n \"annotations\": null,\n \"extra_config\": null,\n \"create_at\": 0,\n \"create_by\": \"\",\n \"update_at\": 0,\n \"update_by\": \"\",\n \"uuid\": 1717556327715253000\n },\n {\n \"id\": 0,\n \"group_id\": 0,\n \"cate\": \"prometheus\",\n \"datasource_ids\": [\n 0\n ],\n \"cluster\": \"\",\n \"name\": \"Hard disk - IO is very busy - telegraf\",\n \"note\": \"\",\n \"prod\": \"metric\",\n \"algorithm\": \"\",\n \"algo_params\": null,\n \"delay\": 0,\n \"severity\": 2,\n \"severities\": [\n 2\n ],\n \"disabled\": 1,\n \"prom_for_duration\": 60,\n \"prom_ql\": \"\",\n \"rule_config\": {\n \"algo_params\": null,\n \"inhibit\": false,\n \"prom_ql\": \"\",\n \"queries\": [\n {\n \"prom_ql\": \"rate(diskio_io_time[1m])/10 \\u003e 99\",\n \"severity\": 2\n }\n ],\n \"severity\": 0\n },\n \"prom_eval_interval\": 15,\n \"enable_stime\": \"00:00\",\n \"enable_stimes\": [\n \"00:00\"\n ],\n \"enable_etime\": \"23:59\",\n \"enable_etimes\": [\n \"23:59\"\n ],\n \"enable_days_of_week\": [\n \"1\",\n \"2\",\n \"3\",\n \"4\",\n \"5\",\n \"6\",\n \"0\"\n ],\n \"enable_days_of_weeks\": [\n [\n \"1\",\n \"2\",\n \"3\",\n \"4\",\n \"5\",\n \"6\",\n \"0\"\n ]\n ],\n \"enable_in_bg\": 0,\n \"notify_recovered\": 1,\n \"notify_channels\": [\n \"email\",\n \"dingtalk\",\n \"wecom\"\n ],\n \"notify_groups_obj\": null,\n \"notify_groups\": null,\n \"notify_repeat_step\": 60,\n \"notify_max_number\": 0,\n \"recover_duration\": 0,\n \"callbacks\": [],\n \"runbook_url\": \"\",\n \"append_tags\": [],\n \"annotations\": null,\n \"extra_config\": null,\n \"create_at\": 0,\n \"create_by\": \"\",\n \"update_at\": 0,\n \"update_by\": \"\",\n \"uuid\": 1717556327715994000\n },\n {\n \"id\": 0,\n \"group_id\": 0,\n \"cate\": \"host\",\n \"datasource_ids\": null,\n \"cluster\": \"\",\n \"name\": \"Lost connection with monitoring target - telegraf\",\n \"note\": \"\",\n \"prod\": \"host\",\n \"algorithm\": \"\",\n \"algo_params\": null,\n \"delay\": 0,\n \"severity\": 0,\n \"severities\": [\n 2\n ],\n \"disabled\": 1,\n \"prom_for_duration\": 0,\n \"prom_ql\": \"\",\n \"rule_config\": {\n \"inhibit\": false,\n \"queries\": [\n {\n \"key\": \"all_hosts\",\n \"op\": \"==\",\n \"values\": []\n }\n ],\n \"triggers\": [\n {\n \"duration\": 60,\n \"severity\": 2,\n \"type\": \"target_miss\"\n }\n ]\n },\n \"prom_eval_interval\": 15,\n \"enable_stime\": \"00:00\",\n \"enable_stimes\": [\n \"00:00\"\n ],\n \"enable_etime\": \"23:59\",\n \"enable_etimes\": [\n \"23:59\"\n ],\n \"enable_days_of_week\": [\n \"1\",\n \"2\",\n \"3\",\n \"4\",\n \"5\",\n \"6\",\n \"0\"\n ],\n \"enable_days_of_weeks\": [\n [\n \"1\",\n \"2\",\n \"3\",\n \"4\",\n \"5\",\n \"6\",\n \"0\"\n ]\n ],\n \"enable_in_bg\": 0,\n \"notify_recovered\": 1,\n \"notify_channels\": [],\n \"notify_groups_obj\": null,\n \"notify_groups\": null,\n \"notify_repeat_step\": 60,\n \"notify_max_number\": 0,\n \"recover_duration\": 0,\n \"callbacks\": [],\n \"runbook_url\": \"\",\n \"append_tags\": [],\n \"annotations\": {},\n \"extra_config\": {\n \"escalation\": {},\n \"notify_aggregation\": {}\n },\n \"create_at\": 0,\n \"create_by\": \"\",\n \"update_at\": 0,\n \"update_by\": \"\",\n \"uuid\": 1717556327717532000\n },\n {\n \"id\": 0,\n \"group_id\": 0,\n \"cate\": \"prometheus\",\n \"datasource_ids\": [\n 0\n ],\n \"cluster\": \"\",\n \"name\": \"Machine load - high CPU, please pay attention - telegraf\",\n \"note\": \"\",\n \"prod\": \"metric\",\n \"algorithm\": \"\",\n \"algo_params\": null,\n \"delay\": 0,\n \"severity\": 3,\n \"severities\": [\n 3\n ],\n \"disabled\": 1,\n \"prom_for_duration\": 60,\n \"prom_ql\": \"\",\n \"rule_config\": {\n \"algo_params\": null,\n \"inhibit\": false,\n \"prom_ql\": \"\",\n \"queries\": [\n {\n \"prom_ql\": \"cpu_usage_idle{cpu=\\\"cpu-total\\\"} \\u003c 25\",\n \"severity\": 3\n }\n ],\n \"severity\": 0\n },\n \"prom_eval_interval\": 15,\n \"enable_stime\": \"00:00\",\n \"enable_stimes\": [\n \"00:00\"\n ],\n \"enable_etime\": \"23:59\",\n \"enable_etimes\": [\n \"23:59\"\n ],\n \"enable_days_of_week\": [\n \"1\",\n \"2\",\n \"3\",\n \"4\",\n \"5\",\n \"6\",\n \"0\"\n ],\n \"enable_days_of_weeks\": [\n [\n \"1\",\n \"2\",\n \"3\",\n \"4\",\n \"5\",\n \"6\",\n \"0\"\n ]\n ],\n \"enable_in_bg\": 0,\n \"notify_recovered\": 1,\n \"notify_channels\": [\n \"email\",\n \"dingtalk\",\n \"wecom\"\n ],\n \"notify_groups_obj\": null,\n \"notify_groups\": null,\n \"notify_repeat_step\": 60,\n \"notify_max_number\": 0,\n \"recover_duration\": 0,\n \"callbacks\": [],\n \"runbook_url\": \"\",\n \"append_tags\": [],\n \"annotations\": null,\n \"extra_config\": null,\n \"create_at\": 0,\n \"create_by\": \"\",\n \"update_at\": 0,\n \"update_by\": \"\",\n \"uuid\": 1717556327718353000\n },\n {\n \"id\": 0,\n \"group_id\": 0,\n \"cate\": \"prometheus\",\n \"datasource_ids\": [\n 0\n ],\n \"cluster\": \"\",\n \"name\": \"Machine load - high memory, please pay attention - telegraf\",\n \"note\": \"\",\n \"prod\": \"metric\",\n \"algorithm\": \"\",\n \"algo_params\": null,\n \"delay\": 0,\n \"severity\": 2,\n \"severities\": [\n 2\n ],\n \"disabled\": 1,\n \"prom_for_duration\": 60,\n \"prom_ql\": \"\",\n \"rule_config\": {\n \"algo_params\": null,\n \"inhibit\": false,\n \"prom_ql\": \"\",\n \"queries\": [\n {\n \"prom_ql\": \"mem_available_percent \\u003c 25\",\n \"severity\": 2\n }\n ],\n \"severity\": 0\n },\n \"prom_eval_interval\": 15,\n \"enable_stime\": \"00:00\",\n \"enable_stimes\": [\n \"00:00\"\n ],\n \"enable_etime\": \"23:59\",\n \"enable_etimes\": [\n \"23:59\"\n ],\n \"enable_days_of_week\": [\n \"1\",\n \"2\",\n \"3\",\n \"4\",\n \"5\",\n \"6\",\n \"0\"\n ],\n \"enable_days_of_weeks\": [\n [\n \"1\",\n \"2\",\n \"3\",\n \"4\",\n \"5\",\n \"6\",\n \"0\"\n ]\n ],\n \"enable_in_bg\": 0,\n \"notify_recovered\": 1,\n \"notify_channels\": [\n \"email\",\n \"dingtalk\",\n \"wecom\"\n ],\n \"notify_groups_obj\": null,\n \"notify_groups\": null,\n \"notify_repeat_step\": 60,\n \"notify_max_number\": 0,\n \"recover_duration\": 0,\n \"callbacks\": [],\n \"runbook_url\": \"\",\n \"append_tags\": [],\n \"annotations\": null,\n \"extra_config\": null,\n \"create_at\": 0,\n \"create_by\": \"\",\n \"update_at\": 0,\n \"update_by\": \"\",\n \"uuid\": 1717556327719248000\n },\n {\n \"id\": 0,\n \"group_id\": 0,\n \"cate\": \"prometheus\",\n \"datasource_ids\": [\n 0\n ],\n \"cluster\": \"\",\n \"name\": \"Network connection - number of TME_WAIT exceeds 20,000 - telegraf\",\n \"note\": \"\",\n \"prod\": \"metric\",\n \"algorithm\": \"\",\n \"algo_params\": null,\n \"delay\": 0,\n \"severity\": 2,\n \"severities\": [\n 2\n ],\n \"disabled\": 1,\n \"prom_for_duration\": 60,\n \"prom_ql\": \"\",\n \"rule_config\": {\n \"algo_params\": null,\n \"inhibit\": false,\n \"prom_ql\": \"\",\n \"queries\": [\n {\n \"prom_ql\": \"netstat_tcp_time_wait \\u003e 20000\",\n \"severity\": 2\n }\n ],\n \"severity\": 0\n },\n \"prom_eval_interval\": 15,\n \"enable_stime\": \"00:00\",\n \"enable_stimes\": [\n \"00:00\"\n ],\n \"enable_etime\": \"23:59\",\n \"enable_etimes\": [\n \"23:59\"\n ],\n \"enable_days_of_week\": [\n \"1\",\n \"2\",\n \"3\",\n \"4\",\n \"5\",\n \"6\",\n \"0\"\n ],\n \"enable_days_of_weeks\": [\n [\n \"1\",\n \"2\",\n \"3\",\n \"4\",\n \"5\",\n \"6\",\n \"0\"\n ]\n ],\n \"enable_in_bg\": 0,\n \"notify_recovered\": 1,\n \"notify_channels\": [\n \"email\",\n \"dingtalk\",\n \"wecom\"\n ],\n \"notify_groups_obj\": null,\n \"notify_groups\": null,\n \"notify_repeat_step\": 60,\n \"notify_max_number\": 0,\n \"recover_duration\": 0,\n \"callbacks\": [],\n \"runbook_url\": \"\",\n \"append_tags\": [],\n \"annotations\": null,\n \"extra_config\": null,\n \"create_at\": 0,\n \"create_by\": \"\",\n \"update_at\": 0,\n \"update_by\": \"\",\n \"uuid\": 1717556327720659000\n },\n {\n \"id\": 0,\n \"group_id\": 0,\n \"cate\": \"prometheus\",\n \"datasource_ids\": [\n 0\n ],\n \"cluster\": \"\",\n \"name\": \"packet loss in the inbound direction - telegraf\",\n \"note\": \"\",\n \"prod\": \"metric\",\n \"algorithm\": \"\",\n \"algo_params\": null,\n \"delay\": 0,\n \"severity\": 3,\n \"severities\": [\n 3\n ],\n \"disabled\": 1,\n \"prom_for_duration\": 60,\n \"prom_ql\": \"\",\n \"rule_config\": {\n \"algo_params\": null,\n \"inhibit\": false,\n \"prom_ql\": \"\",\n \"queries\": [\n {\n \"prom_ql\": \"increase(net_drop_in[1m]) \\u003e 0\",\n \"severity\": 3\n }\n ],\n \"severity\": 0\n },\n \"prom_eval_interval\": 15,\n \"enable_stime\": \"00:00\",\n \"enable_stimes\": [\n \"00:00\"\n ],\n \"enable_etime\": \"23:59\",\n \"enable_etimes\": [\n \"23:59\"\n ],\n \"enable_days_of_week\": [\n \"1\",\n \"2\",\n \"3\",\n \"4\",\n \"5\",\n \"6\",\n \"0\"\n ],\n \"enable_days_of_weeks\": [\n [\n \"1\",\n \"2\",\n \"3\",\n \"4\",\n \"5\",\n \"6\",\n \"0\"\n ]\n ],\n \"enable_in_bg\": 0,\n \"notify_recovered\": 1,\n \"notify_channels\": [\n \"email\",\n \"dingtalk\",\n \"wecom\"\n ],\n \"notify_groups_obj\": null,\n \"notify_groups\": null,\n \"notify_repeat_step\": 60,\n \"notify_max_number\": 0,\n \"recover_duration\": 0,\n \"callbacks\": [],\n \"runbook_url\": \"\",\n \"append_tags\": [],\n \"annotations\": null,\n \"extra_config\": null,\n \"create_at\": 0,\n \"create_by\": \"\",\n \"update_at\": 0,\n \"update_by\": \"\",\n \"uuid\": 1717556327721904000\n },\n {\n \"id\": 0,\n \"group_id\": 0,\n \"cate\": \"prometheus\",\n \"datasource_ids\": [\n 0\n ],\n \"cluster\": \"\",\n \"name\": \"packet loss in the outbound direction - telegraf\",\n \"note\": \"\",\n \"prod\": \"metric\",\n \"algorithm\": \"\",\n \"algo_params\": null,\n \"delay\": 0,\n \"severity\": 3,\n \"severities\": [\n 3\n ],\n \"disabled\": 1,\n \"prom_for_duration\": 60,\n \"prom_ql\": \"\",\n \"rule_config\": {\n \"algo_params\": null,\n \"inhibit\": false,\n \"prom_ql\": \"\",\n \"queries\": [\n {\n \"prom_ql\": \"increase(net_drop_out[1m]) \\u003e 0\",\n \"severity\": 3\n }\n ],\n \"severity\": 0\n },\n \"prom_eval_interval\": 15,\n \"enable_stime\": \"00:00\",\n \"enable_stimes\": [\n \"00:00\"\n ],\n \"enable_etime\": \"23:59\",\n \"enable_etimes\": [\n \"23:59\"\n ],\n \"enable_days_of_week\": [\n \"1\",\n \"2\",\n \"3\",\n \"4\",\n \"5\",\n \"6\",\n \"0\"\n ],\n \"enable_days_of_weeks\": [\n [\n \"1\",\n \"2\",\n \"3\",\n \"4\",\n \"5\",\n \"6\",\n \"0\"\n ]\n ],\n \"enable_in_bg\": 0,\n \"notify_recovered\": 1,\n \"notify_channels\": [\n \"email\",\n \"dingtalk\",\n \"wecom\"\n ],\n \"notify_groups_obj\": null,\n \"notify_groups\": null,\n \"notify_repeat_step\": 60,\n \"notify_max_number\": 0,\n \"recover_duration\": 0,\n \"callbacks\": [],\n \"runbook_url\": \"\",\n \"append_tags\": [],\n \"annotations\": null,\n \"extra_config\": null,\n \"create_at\": 0,\n \"create_by\": \"\",\n \"update_at\": 0,\n \"update_by\": \"\",\n \"uuid\": 1717556327722565000\n },\n {\n \"id\": 0,\n \"group_id\": 0,\n \"cate\": \"prometheus\",\n \"datasource_ids\": [\n 0\n ],\n \"cluster\": \"\",\n \"name\": \"Port detection failed, please pay attention - telegraf\",\n \"note\": \"\",\n \"prod\": \"metric\",\n \"algorithm\": \"\",\n \"algo_params\": null,\n \"delay\": 0,\n \"severity\": 1,\n \"severities\": [\n 1\n ],\n \"disabled\": 1,\n \"prom_for_duration\": 60,\n \"prom_ql\": \"\",\n \"rule_config\": {\n \"algo_params\": null,\n \"inhibit\": false,\n \"prom_ql\": \"\",\n \"queries\": [\n {\n \"prom_ql\": \"net_response_result_code != 0\",\n \"severity\": 1\n }\n ],\n \"severity\": 0\n },\n \"prom_eval_interval\": 15,\n \"enable_stime\": \"00:00\",\n \"enable_stimes\": [\n \"00:00\"\n ],\n \"enable_etime\": \"23:59\",\n \"enable_etimes\": [\n \"23:59\"\n ],\n \"enable_days_of_week\": [\n \"1\",\n \"2\",\n \"3\",\n \"4\",\n \"5\",\n \"6\",\n \"0\"\n ],\n \"enable_days_of_weeks\": [\n [\n \"1\",\n \"2\",\n \"3\",\n \"4\",\n \"5\",\n \"6\",\n \"0\"\n ]\n ],\n \"enable_in_bg\": 0,\n \"notify_recovered\": 1,\n \"notify_channels\": [\n \"email\",\n \"dingtalk\",\n \"wecom\"\n ],\n \"notify_groups_obj\": null,\n \"notify_groups\": null,\n \"notify_repeat_step\": 60,\n \"notify_max_number\": 0,\n \"recover_duration\": 0,\n \"callbacks\": [],\n \"runbook_url\": \"\",\n \"append_tags\": [],\n \"annotations\": null,\n \"extra_config\": null,\n \"create_at\": 0,\n \"create_by\": \"\",\n \"update_at\": 0,\n \"update_by\": \"\",\n \"uuid\": 1717556327723152000\n },\n {\n \"id\": 0,\n \"group_id\": 0,\n \"cate\": \"prometheus\",\n \"datasource_ids\": [\n 0\n ],\n \"cluster\": \"\",\n \"name\": \"process handle limit is too small - telegraf\",\n \"note\": \"\",\n \"prod\": \"metric\",\n \"algorithm\": \"\",\n \"algo_params\": null,\n \"delay\": 0,\n \"severity\": 3,\n \"severities\": [\n 3\n ],\n \"disabled\": 1,\n \"prom_for_duration\": 60,\n \"prom_ql\": \"\",\n \"rule_config\": {\n \"algo_params\": null,\n \"inhibit\": false,\n \"prom_ql\": \"\",\n \"queries\": [\n {\n \"prom_ql\": \"procstat_rlimit_num_fds_soft \\u003c 2048\",\n \"severity\": 3\n }\n ],\n \"severity\": 0\n },\n \"prom_eval_interval\": 15,\n \"enable_stime\": \"00:00\",\n \"enable_stimes\": [\n \"00:00\"\n ],\n \"enable_etime\": \"23:59\",\n \"enable_etimes\": [\n \"23:59\"\n ],\n \"enable_days_of_week\": [\n \"1\",\n \"2\",\n \"3\",\n \"4\",\n \"5\",\n \"6\",\n \"0\"\n ],\n \"enable_days_of_weeks\": [\n [\n \"1\",\n \"2\",\n \"3\",\n \"4\",\n \"5\",\n \"6\",\n \"0\"\n ]\n ],\n \"enable_in_bg\": 0,\n \"notify_recovered\": 1,\n \"notify_channels\": [\n \"email\",\n \"dingtalk\",\n \"wecom\"\n ],\n \"notify_groups_obj\": null,\n \"notify_groups\": null,\n \"notify_repeat_step\": 60,\n \"notify_max_number\": 0,\n \"recover_duration\": 0,\n \"callbacks\": [],\n \"runbook_url\": \"\",\n \"append_tags\": [],\n \"annotations\": null,\n \"extra_config\": null,\n \"create_at\": 0,\n \"create_by\": \"\",\n \"update_at\": 0,\n \"update_by\": \"\",\n \"uuid\": 1717556327723625000\n },\n {\n \"id\": 0,\n \"group_id\": 0,\n \"cate\": \"prometheus\",\n \"datasource_ids\": [\n 0\n ],\n \"cluster\": \"\",\n \"name\": \"Process monitoring - lookup failure - telegraf\",\n \"note\": \"\",\n \"prod\": \"metric\",\n \"algorithm\": \"\",\n \"algo_params\": null,\n \"delay\": 0,\n \"severity\": 1,\n \"severities\": [\n 1\n ],\n \"disabled\": 1,\n \"prom_for_duration\": 60,\n \"prom_ql\": \"\",\n \"rule_config\": {\n \"algo_params\": null,\n \"inhibit\": false,\n \"prom_ql\": \"\",\n \"queries\": [\n {\n \"prom_ql\": \"procstat_lookup_result_code != 0\",\n \"severity\": 1\n }\n ],\n \"severity\": 0\n },\n \"prom_eval_interval\": 15,\n \"enable_stime\": \"00:00\",\n \"enable_stimes\": [\n \"00:00\"\n ],\n \"enable_etime\": \"23:59\",\n \"enable_etimes\": [\n \"23:59\"\n ],\n \"enable_days_of_week\": [\n \"1\",\n \"2\",\n \"3\",\n \"4\",\n \"5\",\n \"6\",\n \"0\"\n ],\n \"enable_days_of_weeks\": [\n [\n \"1\",\n \"2\",\n \"3\",\n \"4\",\n \"5\",\n \"6\",\n \"0\"\n ]\n ],\n \"enable_in_bg\": 0,\n \"notify_recovered\": 1,\n \"notify_channels\": [\n \"email\",\n \"dingtalk\",\n \"wecom\"\n ],\n \"notify_groups_obj\": null,\n \"notify_groups\": null,\n \"notify_repeat_step\": 60,\n \"notify_max_number\": 0,\n \"recover_duration\": 0,\n \"callbacks\": [],\n \"runbook_url\": \"\",\n \"append_tags\": [],\n \"annotations\": null,\n \"extra_config\": null,\n \"create_at\": 0,\n \"create_by\": \"\",\n \"update_at\": 0,\n \"update_by\": \"\",\n \"uuid\": 1717556327724170000\n },\n {\n \"id\": 0,\n \"group_id\": 0,\n \"cate\": \"prometheus\",\n \"datasource_ids\": [\n 0\n ],\n \"cluster\": \"\",\n \"name\": \"there are processes with 0 count, a certain process may have crashed - telegraf\",\n \"note\": \"\",\n \"prod\": \"metric\",\n \"algorithm\": \"\",\n \"algo_params\": null,\n \"delay\": 0,\n \"severity\": 1,\n \"severities\": [\n 1\n ],\n \"disabled\": 1,\n \"prom_for_duration\": 60,\n \"prom_ql\": \"\",\n \"rule_config\": {\n \"algo_params\": null,\n \"inhibit\": false,\n \"prom_ql\": \"\",\n \"queries\": [\n {\n \"prom_ql\": \"procstat_lookup_running == 0\",\n \"severity\": 1\n }\n ],\n \"severity\": 0\n },\n \"prom_eval_interval\": 15,\n \"enable_stime\": \"00:00\",\n \"enable_stimes\": [\n \"00:00\"\n ],\n \"enable_etime\": \"23:59\",\n \"enable_etimes\": [\n \"23:59\"\n ],\n \"enable_days_of_week\": [\n \"1\",\n \"2\",\n \"3\",\n \"4\",\n \"5\",\n \"6\",\n \"0\"\n ],\n \"enable_days_of_weeks\": [\n [\n \"1\",\n \"2\",\n \"3\",\n \"4\",\n \"5\",\n \"6\",\n \"0\"\n ]\n ],\n \"enable_in_bg\": 0,\n \"notify_recovered\": 1,\n \"notify_channels\": [\n \"email\",\n \"dingtalk\",\n \"wecom\"\n ],\n \"notify_groups_obj\": null,\n \"notify_groups\": null,\n \"notify_repeat_step\": 60,\n \"notify_max_number\": 0,\n \"recover_duration\": 0,\n \"callbacks\": [],\n \"runbook_url\": \"\",\n \"append_tags\": [],\n \"annotations\": null,\n \"extra_config\": null,\n \"create_at\": 0,\n \"create_by\": \"\",\n \"update_at\": 0,\n \"update_by\": \"\",\n \"uuid\": 1717556327724727000\n }\n]"
},
{
"path": "integrations/Linux/alerts/常用中文告警规则-采集器Categraf.json",
"content": "[\n {\n \"id\": 0,\n \"group_id\": 0,\n \"cate\": \"prometheus\",\n \"datasource_ids\": [\n 0\n ],\n \"cluster\": \"\",\n \"name\": \"Conntrack表的使用率超过80%\",\n \"note\": \"\",\n \"prod\": \"metric\",\n \"algorithm\": \"\",\n \"algo_params\": null,\n \"delay\": 0,\n \"severity\": 0,\n \"severities\": [\n 2\n ],\n \"disabled\": 1,\n \"prom_for_duration\": 60,\n \"prom_ql\": \"\",\n \"rule_config\": {\n \"queries\": [\n {\n \"prom_ql\": \"conntrack_ip_conntrack_count / ip_conntrack_max \\u003e 0.8\",\n \"severity\": 2\n }\n ]\n },\n \"prom_eval_interval\": 30,\n \"enable_stime\": \"00:00\",\n \"enable_stimes\": [\n \"00:00\"\n ],\n \"enable_etime\": \"00:00\",\n \"enable_etimes\": [\n \"00:00\"\n ],\n \"enable_days_of_week\": [\n \"0\",\n \"1\",\n \"2\",\n \"3\",\n \"4\",\n \"5\",\n \"6\"\n ],\n \"enable_days_of_weeks\": [\n [\n \"0\",\n \"1\",\n \"2\",\n \"3\",\n \"4\",\n \"5\",\n \"6\"\n ]\n ],\n \"enable_in_bg\": 0,\n \"notify_recovered\": 1,\n \"notify_channels\": [],\n \"notify_groups_obj\": null,\n \"notify_groups\": null,\n \"notify_repeat_step\": 60,\n \"notify_max_number\": 0,\n \"recover_duration\": 0,\n \"callbacks\": [],\n \"runbook_url\": \"\",\n \"append_tags\": [],\n \"annotations\": {},\n \"extra_config\": null,\n \"create_at\": 0,\n \"create_by\": \"\",\n \"update_at\": 0,\n \"update_by\": \"\",\n \"uuid\": 1717556327726493000\n },\n {\n \"id\": 0,\n \"group_id\": 0,\n \"cate\": \"prometheus\",\n \"datasource_ids\": [\n 0\n ],\n \"cluster\": \"\",\n \"name\": \"CPU利用率较高\",\n \"note\": \"\",\n \"prod\": \"metric\",\n \"algorithm\": \"\",\n \"algo_params\": null,\n \"delay\": 0,\n \"severity\": 0,\n \"severities\": [\n 3,\n 2,\n 1\n ],\n \"disabled\": 1,\n \"prom_for_duration\": 60,\n \"prom_ql\": \"\",\n \"rule_config\": {\n \"inhibit\": true,\n \"queries\": [\n {\n \"prom_ql\": \"cpu_usage_active\\u003e75\",\n \"severity\": 3\n },\n {\n \"prom_ql\": \"cpu_usage_active\\u003e85\",\n \"severity\": 2\n },\n {\n \"prom_ql\": \"cpu_usage_active\\u003e95\",\n \"severity\": 1\n }\n ]\n },\n \"prom_eval_interval\": 30,\n \"enable_stime\": \"00:00\",\n \"enable_stimes\": [\n \"00:00\"\n ],\n \"enable_etime\": \"23:59\",\n \"enable_etimes\": [\n \"23:59\"\n ],\n \"enable_days_of_week\": [\n \"0\",\n \"1\",\n \"2\",\n \"3\",\n \"4\",\n \"5\",\n \"6\"\n ],\n \"enable_days_of_weeks\": [\n [\n \"0\",\n \"1\",\n \"2\",\n \"3\",\n \"4\",\n \"5\",\n \"6\"\n ]\n ],\n \"enable_in_bg\": 0,\n \"notify_recovered\": 1,\n \"notify_channels\": [],\n \"notify_groups_obj\": null,\n \"notify_groups\": null,\n \"notify_repeat_step\": 60,\n \"notify_max_number\": 0,\n \"recover_duration\": 0,\n \"callbacks\": [],\n \"runbook_url\": \"\",\n \"append_tags\": [],\n \"annotations\": {},\n \"extra_config\": null,\n \"create_at\": 0,\n \"create_by\": \"\",\n \"update_at\": 0,\n \"update_by\": \"\",\n \"uuid\": 1717556327726998000\n },\n {\n \"id\": 0,\n \"group_id\": 0,\n \"cate\": \"prometheus\",\n \"datasource_ids\": [\n 0\n ],\n \"cluster\": \"\",\n \"name\": \"HTTP地址探测失败\",\n \"note\": \"\",\n \"prod\": \"metric\",\n \"algorithm\": \"\",\n \"algo_params\": null,\n \"delay\": 0,\n \"severity\": 2,\n \"severities\": [\n 2\n ],\n \"disabled\": 1,\n \"prom_for_duration\": 60,\n \"prom_ql\": \"\",\n \"rule_config\": {\n \"algo_params\": null,\n \"inhibit\": false,\n \"prom_ql\": \"\",\n \"queries\": [\n {\n \"prom_ql\": \"http_response_result_code != 0\",\n \"severity\": 2\n }\n ],\n \"severity\": 0\n },\n \"prom_eval_interval\": 15,\n \"enable_stime\": \"00:00\",\n \"enable_stimes\": [\n \"00:00\"\n ],\n \"enable_etime\": \"23:59\",\n \"enable_etimes\": [\n \"23:59\"\n ],\n \"enable_days_of_week\": [\n \"1\",\n \"2\",\n \"3\",\n \"4\",\n \"5\",\n \"6\",\n \"0\"\n ],\n \"enable_days_of_weeks\": [\n [\n \"1\",\n \"2\",\n \"3\",\n \"4\",\n \"5\",\n \"6\",\n \"0\"\n ]\n ],\n \"enable_in_bg\": 0,\n \"notify_recovered\": 1,\n \"notify_channels\": [],\n \"notify_groups_obj\": null,\n \"notify_groups\": null,\n \"notify_repeat_step\": 60,\n \"notify_max_number\": 0,\n \"recover_duration\": 0,\n \"callbacks\": [],\n \"runbook_url\": \"\",\n \"append_tags\": [],\n \"annotations\": null,\n \"extra_config\": null,\n \"create_at\": 0,\n \"create_by\": \"\",\n \"update_at\": 0,\n \"update_by\": \"\",\n \"uuid\": 1717556327727426000\n },\n {\n \"id\": 0,\n \"group_id\": 0,\n \"cate\": \"prometheus\",\n \"datasource_ids\": [\n 0\n ],\n \"cluster\": \"\",\n \"name\": \"IO比较繁忙\",\n \"note\": \"\",\n \"prod\": \"metric\",\n \"algorithm\": \"\",\n \"algo_params\": null,\n \"delay\": 0,\n \"severity\": 0,\n \"severities\": [\n 2\n ],\n \"disabled\": 1,\n \"prom_for_duration\": 60,\n \"prom_ql\": \"\",\n \"rule_config\": {\n \"inhibit\": false,\n \"queries\": [\n {\n \"prom_ql\": \"rate(diskio_io_time[1m])/10 \\u003e 99\",\n \"severity\": 2\n }\n ]\n },\n \"prom_eval_interval\": 15,\n \"enable_stime\": \"00:00\",\n \"enable_stimes\": [\n \"00:00\"\n ],\n \"enable_etime\": \"23:59\",\n \"enable_etimes\": [\n \"23:59\"\n ],\n \"enable_days_of_week\": [\n \"1\",\n \"2\",\n \"3\",\n \"4\",\n \"5\",\n \"6\",\n \"0\"\n ],\n \"enable_days_of_weeks\": [\n [\n \"1\",\n \"2\",\n \"3\",\n \"4\",\n \"5\",\n \"6\",\n \"0\"\n ]\n ],\n \"enable_in_bg\": 0,\n \"notify_recovered\": 1,\n \"notify_channels\": [\n \"email\",\n \"dingtalk\",\n \"wecom\"\n ],\n \"notify_groups_obj\": null,\n \"notify_groups\": null,\n \"notify_repeat_step\": 60,\n \"notify_max_number\": 0,\n \"recover_duration\": 0,\n \"callbacks\": [],\n \"runbook_url\": \"\",\n \"append_tags\": [],\n \"annotations\": {},\n \"extra_config\": null,\n \"create_at\": 0,\n \"create_by\": \"\",\n \"update_at\": 0,\n \"update_by\": \"\",\n \"uuid\": 1717556327727909000\n },\n {\n \"id\": 0,\n \"group_id\": 0,\n \"cate\": \"prometheus\",\n \"datasource_ids\": [\n 0\n ],\n \"cluster\": \"\",\n \"name\": \"NTP时间偏移太大\",\n \"note\": \"\",\n \"prod\": \"metric\",\n \"algorithm\": \"\",\n \"algo_params\": null,\n \"delay\": 0,\n \"severity\": 2,\n \"severities\": [\n 2\n ],\n \"disabled\": 1,\n \"prom_for_duration\": 60,\n \"prom_ql\": \"\",\n \"rule_config\": {\n \"algo_params\": null,\n \"inhibit\": false,\n \"prom_ql\": \"\",\n \"queries\": [\n {\n \"prom_ql\": \"ntp_offset_ms \\u003e 1000 or ntp_offset_ms \\u003c -1000\",\n \"severity\": 2\n }\n ],\n \"severity\": 0\n },\n \"prom_eval_interval\": 15,\n \"enable_stime\": \"00:00\",\n \"enable_stimes\": [\n \"00:00\"\n ],\n \"enable_etime\": \"23:59\",\n \"enable_etimes\": [\n \"23:59\"\n ],\n \"enable_days_of_week\": [\n \"1\",\n \"2\",\n \"3\",\n \"4\",\n \"5\",\n \"6\",\n \"0\"\n ],\n \"enable_days_of_weeks\": [\n [\n \"1\",\n \"2\",\n \"3\",\n \"4\",\n \"5\",\n \"6\",\n \"0\"\n ]\n ],\n \"enable_in_bg\": 0,\n \"notify_recovered\": 1,\n \"notify_channels\": [],\n \"notify_groups_obj\": null,\n \"notify_groups\": null,\n \"notify_repeat_step\": 60,\n \"notify_max_number\": 0,\n \"recover_duration\": 0,\n \"callbacks\": [],\n \"runbook_url\": \"\",\n \"append_tags\": [],\n \"annotations\": null,\n \"extra_config\": null,\n \"create_at\": 0,\n \"create_by\": \"\",\n \"update_at\": 0,\n \"update_by\": \"\",\n \"uuid\": 1717556327728333000\n },\n {\n \"id\": 0,\n \"group_id\": 0,\n \"cate\": \"prometheus\",\n \"datasource_ids\": [\n 0\n ],\n \"cluster\": \"\",\n \"name\": \"PING地址探测失败\",\n \"note\": \"\",\n \"prod\": \"metric\",\n \"algorithm\": \"\",\n \"algo_params\": null,\n \"delay\": 0,\n \"severity\": 2,\n \"severities\": [\n 2\n ],\n \"disabled\": 1,\n \"prom_for_duration\": 60,\n \"prom_ql\": \"\",\n \"rule_config\": {\n \"algo_params\": null,\n \"inhibit\": false,\n \"prom_ql\": \"\",\n \"queries\": [\n {\n \"prom_ql\": \"ping_result_code != 0\",\n \"severity\": 2\n }\n ],\n \"severity\": 0\n },\n \"prom_eval_interval\": 15,\n \"enable_stime\": \"00:00\",\n \"enable_stimes\": [\n \"00:00\"\n ],\n \"enable_etime\": \"23:59\",\n \"enable_etimes\": [\n \"23:59\"\n ],\n \"enable_days_of_week\": [\n \"1\",\n \"2\",\n \"3\",\n \"4\",\n \"5\",\n \"6\",\n \"0\"\n ],\n \"enable_days_of_weeks\": [\n [\n \"1\",\n \"2\",\n \"3\",\n \"4\",\n \"5\",\n \"6\",\n \"0\"\n ]\n ],\n \"enable_in_bg\": 0,\n \"notify_recovered\": 1,\n \"notify_channels\": [],\n \"notify_groups_obj\": null,\n \"notify_groups\": null,\n \"notify_repeat_step\": 60,\n \"notify_max_number\": 0,\n \"recover_duration\": 0,\n \"callbacks\": [],\n \"runbook_url\": \"\",\n \"append_tags\": [],\n \"annotations\": null,\n \"extra_config\": null,\n \"create_at\": 0,\n \"create_by\": \"\",\n \"update_at\": 0,\n \"update_by\": \"\",\n \"uuid\": 1717556327728713000\n },\n {\n \"id\": 0,\n \"group_id\": 0,\n \"cate\": \"prometheus\",\n \"datasource_ids\": [\n 0\n ],\n \"cluster\": \"\",\n \"name\": \"TME_WAIT状态的连接超过2万,可能需要关注\",\n \"note\": \"\",\n \"prod\": \"metric\",\n \"algorithm\": \"\",\n \"algo_params\": null,\n \"delay\": 0,\n \"severity\": 0,\n \"severities\": [\n 2\n ],\n \"disabled\": 1,\n \"prom_for_duration\": 60,\n \"prom_ql\": \"\",\n \"rule_config\": {\n \"inhibit\": false,\n \"queries\": [\n {\n \"prom_ql\": \"netstat_tcp_time_wait \\u003e 20000\",\n \"severity\": 2\n }\n ]\n },\n \"prom_eval_interval\": 15,\n \"enable_stime\": \"00:00\",\n \"enable_stimes\": [\n \"00:00\"\n ],\n \"enable_etime\": \"23:59\",\n \"enable_etimes\": [\n \"23:59\"\n ],\n \"enable_days_of_week\": [\n \"1\",\n \"2\",\n \"3\",\n \"4\",\n \"5\",\n \"6\",\n \"0\"\n ],\n \"enable_days_of_weeks\": [\n [\n \"1\",\n \"2\",\n \"3\",\n \"4\",\n \"5\",\n \"6\",\n \"0\"\n ]\n ],\n \"enable_in_bg\": 0,\n \"notify_recovered\": 1,\n \"notify_channels\": [\n \"email\",\n \"dingtalk\",\n \"wecom\"\n ],\n \"notify_groups_obj\": null,\n \"notify_groups\": null,\n \"notify_repeat_step\": 60,\n \"notify_max_number\": 0,\n \"recover_duration\": 0,\n \"callbacks\": [],\n \"runbook_url\": \"\",\n \"append_tags\": [],\n \"annotations\": {},\n \"extra_config\": null,\n \"create_at\": 0,\n \"create_by\": \"\",\n \"update_at\": 0,\n \"update_by\": \"\",\n \"uuid\": 1717556327729188000\n },\n {\n \"id\": 0,\n \"group_id\": 0,\n \"cate\": \"prometheus\",\n \"datasource_ids\": [\n 0\n ],\n \"cluster\": \"\",\n \"name\": \"内存利用率比较高\",\n \"note\": \"\",\n \"prod\": \"metric\",\n \"algorithm\": \"\",\n \"algo_params\": null,\n \"delay\": 0,\n \"severity\": 0,\n \"severities\": [\n 3,\n 2,\n 1\n ],\n \"disabled\": 1,\n \"prom_for_duration\": 60,\n \"prom_ql\": \"\",\n \"rule_config\": {\n \"inhibit\": true,\n \"queries\": [\n {\n \"prom_ql\": \"mem_available_percent \\u003c 25\",\n \"severity\": 3\n },\n {\n \"prom_ql\": \"mem_available_percent \\u003c 15\",\n \"severity\": 2\n },\n {\n \"prom_ql\": \"mem_available_percent \\u003c 5\",\n \"severity\": 1\n }\n ]\n },\n \"prom_eval_interval\": 15,\n \"enable_stime\": \"00:00\",\n \"enable_stimes\": [\n \"00:00\"\n ],\n \"enable_etime\": \"23:59\",\n \"enable_etimes\": [\n \"23:59\"\n ],\n \"enable_days_of_week\": [\n \"1\",\n \"2\",\n \"3\",\n \"4\",\n \"5\",\n \"6\",\n \"0\"\n ],\n \"enable_days_of_weeks\": [\n [\n \"1\",\n \"2\",\n \"3\",\n \"4\",\n \"5\",\n \"6\",\n \"0\"\n ]\n ],\n \"enable_in_bg\": 0,\n \"notify_recovered\": 1,\n \"notify_channels\": [\n \"email\",\n \"dingtalk\",\n \"wecom\"\n ],\n \"notify_groups_obj\": null,\n \"notify_groups\": null,\n \"notify_repeat_step\": 60,\n \"notify_max_number\": 0,\n \"recover_duration\": 0,\n \"callbacks\": [],\n \"runbook_url\": \"\",\n \"append_tags\": [],\n \"annotations\": {},\n \"extra_config\": null,\n \"create_at\": 0,\n \"create_by\": \"\",\n \"update_at\": 0,\n \"update_by\": \"\",\n \"uuid\": 1717556327729533000\n },\n {\n \"id\": 0,\n \"group_id\": 0,\n \"cate\": \"prometheus\",\n \"datasource_ids\": [\n 0\n ],\n \"cluster\": \"\",\n \"name\": \"文件句柄使用率超过90%\",\n \"note\": \"\",\n \"prod\": \"metric\",\n \"algorithm\": \"\",\n \"algo_params\": null,\n \"delay\": 0,\n \"severity\": 0,\n \"severities\": [\n 2\n ],\n \"disabled\": 0,\n \"prom_for_duration\": 60,\n \"prom_ql\": \"\",\n \"rule_config\": {\n \"queries\": [\n {\n \"prom_ql\": \"linux_sysctl_fs_file_nr/linux_sysctl_fs_file_max\\u003e0.9\",\n \"severity\": 2\n }\n ]\n },\n \"prom_eval_interval\": 30,\n \"enable_stime\": \"00:00\",\n \"enable_stimes\": [\n \"00:00\"\n ],\n \"enable_etime\": \"00:00\",\n \"enable_etimes\": [\n \"00:00\"\n ],\n \"enable_days_of_week\": [\n \"0\",\n \"1\",\n \"2\",\n \"3\",\n \"4\",\n \"5\",\n \"6\"\n ],\n \"enable_days_of_weeks\": [\n [\n \"0\",\n \"1\",\n \"2\",\n \"3\",\n \"4\",\n \"5\",\n \"6\"\n ]\n ],\n \"enable_in_bg\": 0,\n \"notify_recovered\": 1,\n \"notify_channels\": [],\n \"notify_groups_obj\": null,\n \"notify_groups\": null,\n \"notify_repeat_step\": 60,\n \"notify_max_number\": 0,\n \"recover_duration\": 0,\n \"callbacks\": [],\n \"runbook_url\": \"\",\n \"append_tags\": [],\n \"annotations\": {},\n \"extra_config\": null,\n \"create_at\": 0,\n \"create_by\": \"\",\n \"update_at\": 0,\n \"update_by\": \"\",\n \"uuid\": 1717556327729938000\n },\n {\n \"id\": 0,\n \"group_id\": 0,\n \"cate\": \"host\",\n \"datasource_ids\": null,\n \"cluster\": \"\",\n \"name\": \"机器监控 - agent失联超过60秒\",\n \"note\": \"\",\n \"prod\": \"host\",\n \"algorithm\": \"\",\n \"algo_params\": null,\n \"delay\": 0,\n \"severity\": 0,\n \"severities\": [\n 2\n ],\n \"disabled\": 1,\n \"prom_for_duration\": 0,\n \"prom_ql\": \"\",\n \"rule_config\": {\n \"inhibit\": false,\n \"queries\": [\n {\n \"key\": \"all_hosts\",\n \"op\": \"==\",\n \"values\": []\n }\n ],\n \"triggers\": [\n {\n \"duration\": 60,\n \"severity\": 2,\n \"type\": \"target_miss\"\n }\n ]\n },\n \"prom_eval_interval\": 15,\n \"enable_stime\": \"00:00\",\n \"enable_stimes\": [\n \"00:00\"\n ],\n \"enable_etime\": \"23:59\",\n \"enable_etimes\": [\n \"23:59\"\n ],\n \"enable_days_of_week\": [\n \"1\",\n \"2\",\n \"3\",\n \"4\",\n \"5\",\n \"6\",\n \"0\"\n ],\n \"enable_days_of_weeks\": [\n [\n \"1\",\n \"2\",\n \"3\",\n \"4\",\n \"5\",\n \"6\",\n \"0\"\n ]\n ],\n \"enable_in_bg\": 0,\n \"notify_recovered\": 1,\n \"notify_channels\": [],\n \"notify_groups_obj\": null,\n \"notify_groups\": null,\n \"notify_repeat_step\": 60,\n \"notify_max_number\": 0,\n \"recover_duration\": 0,\n \"callbacks\": [],\n \"runbook_url\": \"\",\n \"append_tags\": [],\n \"annotations\": {},\n \"extra_config\": null,\n \"create_at\": 0,\n \"create_by\": \"\",\n \"update_at\": 0,\n \"update_by\": \"\",\n \"uuid\": 1717556327730336000\n },\n {\n \"id\": 0,\n \"group_id\": 0,\n \"cate\": \"host\",\n \"datasource_ids\": null,\n \"cluster\": \"\",\n \"name\": \"机器监控 - 时间偏移超过3秒,请注意\",\n \"note\": \"\",\n \"prod\": \"host\",\n \"algorithm\": \"\",\n \"algo_params\": null,\n \"delay\": 0,\n \"severity\": 0,\n \"severities\": [\n 2\n ],\n \"disabled\": 1,\n \"prom_for_duration\": 60,\n \"prom_ql\": \"\",\n \"rule_config\": {\n \"queries\": [\n {\n \"key\": \"all_hosts\",\n \"op\": \"==\",\n \"values\": []\n }\n ],\n \"triggers\": [\n {\n \"duration\": 3000,\n \"severity\": 2,\n \"type\": \"offset\"\n }\n ]\n },\n \"prom_eval_interval\": 30,\n \"enable_stime\": \"00:00\",\n \"enable_stimes\": [\n \"00:00\"\n ],\n \"enable_etime\": \"00:00\",\n \"enable_etimes\": [\n \"00:00\"\n ],\n \"enable_days_of_week\": [\n \"0\",\n \"1\",\n \"2\",\n \"3\",\n \"4\",\n \"5\",\n \"6\"\n ],\n \"enable_days_of_weeks\": [\n [\n \"0\",\n \"1\",\n \"2\",\n \"3\",\n \"4\",\n \"5\",\n \"6\"\n ]\n ],\n \"enable_in_bg\": 0,\n \"notify_recovered\": 1,\n \"notify_channels\": [],\n \"notify_groups_obj\": null,\n \"notify_groups\": null,\n \"notify_repeat_step\": 60,\n \"notify_max_number\": 0,\n \"recover_duration\": 0,\n \"callbacks\": [],\n \"runbook_url\": \"\",\n \"append_tags\": [],\n \"annotations\": {},\n \"extra_config\": null,\n \"create_at\": 0,\n \"create_by\": \"\",\n \"update_at\": 0,\n \"update_by\": \"\",\n \"uuid\": 1717556327730730000\n },\n {\n \"id\": 0,\n \"group_id\": 0,\n \"cate\": \"prometheus\",\n \"datasource_ids\": [\n 0\n ],\n \"cluster\": \"\",\n \"name\": \"每个CPU Core的平均负载任务超过3\",\n \"note\": \"\",\n \"prod\": \"metric\",\n \"algorithm\": \"\",\n \"algo_params\": null,\n \"delay\": 0,\n \"severity\": 0,\n \"severities\": [\n 2\n ],\n \"disabled\": 1,\n \"prom_for_duration\": 60,\n \"prom_ql\": \"\",\n \"rule_config\": {\n \"queries\": [\n {\n \"prom_ql\": \"system_load_norm_1\\u003e3\",\n \"severity\": 2\n }\n ]\n },\n \"prom_eval_interval\": 30,\n \"enable_stime\": \"00:00\",\n \"enable_stimes\": [\n \"00:00\"\n ],\n \"enable_etime\": \"00:00\",\n \"enable_etimes\": [\n \"00:00\"\n ],\n \"enable_days_of_week\": [\n \"0\",\n \"1\",\n \"2\",\n \"3\",\n \"4\",\n \"5\",\n \"6\"\n ],\n \"enable_days_of_weeks\": [\n [\n \"0\",\n \"1\",\n \"2\",\n \"3\",\n \"4\",\n \"5\",\n \"6\"\n ]\n ],\n \"enable_in_bg\": 0,\n \"notify_recovered\": 1,\n \"notify_channels\": [],\n \"notify_groups_obj\": null,\n \"notify_groups\": null,\n \"notify_repeat_step\": 60,\n \"notify_max_number\": 0,\n \"recover_duration\": 0,\n \"callbacks\": [],\n \"runbook_url\": \"\",\n \"append_tags\": [],\n \"annotations\": {},\n \"extra_config\": null,\n \"create_at\": 0,\n \"create_by\": \"\",\n \"update_at\": 0,\n \"update_by\": \"\",\n \"uuid\": 1717556327731150000\n },\n {\n \"id\": 0,\n \"group_id\": 0,\n \"cate\": \"prometheus\",\n \"datasource_ids\": [\n 0\n ],\n \"cluster\": \"\",\n \"name\": \"硬盘监控 - inode使用率超过90%\",\n \"note\": \"\",\n \"prod\": \"metric\",\n \"algorithm\": \"\",\n \"algo_params\": null,\n \"delay\": 0,\n \"severity\": 0,\n \"severities\": [\n 2\n ],\n \"disabled\": 1,\n \"prom_for_duration\": 60,\n \"prom_ql\": \"\",\n \"rule_config\": {\n \"inhibit\": false,\n \"queries\": [\n {\n \"prom_ql\": \"disk_inodes_used/disk_inodes_total \\u003e0.9\",\n \"severity\": 2\n }\n ]\n },\n \"prom_eval_interval\": 15,\n \"enable_stime\": \"00:00\",\n \"enable_stimes\": [\n \"00:00\"\n ],\n \"enable_etime\": \"00:00\",\n \"enable_etimes\": [\n \"00:00\"\n ],\n \"enable_days_of_week\": [\n \"1\",\n \"2\",\n \"3\",\n \"4\",\n \"5\",\n \"6\",\n \"0\"\n ],\n \"enable_days_of_weeks\": [\n [\n \"1\",\n \"2\",\n \"3\",\n \"4\",\n \"5\",\n \"6\",\n \"0\"\n ]\n ],\n \"enable_in_bg\": 0,\n \"notify_recovered\": 1,\n \"notify_channels\": [\n \"email\",\n \"dingtalk\",\n \"wecom\"\n ],\n \"notify_groups_obj\": null,\n \"notify_groups\": null,\n \"notify_repeat_step\": 60,\n \"notify_max_number\": 0,\n \"recover_duration\": 0,\n \"callbacks\": [],\n \"runbook_url\": \"\",\n \"append_tags\": [],\n \"annotations\": {},\n \"extra_config\": null,\n \"create_at\": 0,\n \"create_by\": \"\",\n \"update_at\": 0,\n \"update_by\": \"\",\n \"uuid\": 1717556327731534000\n },\n {\n \"id\": 0,\n \"group_id\": 0,\n \"cate\": \"prometheus\",\n \"datasource_ids\": [\n 0\n ],\n \"cluster\": \"\",\n \"name\": \"硬盘监控 - 大于200G的盘,空间不足了\",\n \"note\": \"\",\n \"prod\": \"metric\",\n \"algorithm\": \"\",\n \"algo_params\": null,\n \"delay\": 0,\n \"severity\": 0,\n \"severities\": [\n 3,\n 2,\n 1\n ],\n \"disabled\": 1,\n \"prom_for_duration\": 60,\n \"prom_ql\": \"\",\n \"rule_config\": {\n \"inhibit\": true,\n \"queries\": [\n {\n \"prom_ql\": \"disk_free/1024/1024/1024 \\u003c 20 and disk_total/1024/1024/1024 \\u003e= 200\",\n \"severity\": 3\n },\n {\n \"prom_ql\": \"disk_free/1024/1024/1024 \\u003c 10 and disk_total/1024/1024/1024 \\u003e= 200\",\n \"severity\": 2\n },\n {\n \"prom_ql\": \"disk_free/1024/1024/1024 \\u003c 2 and disk_total/1024/1024/1024 \\u003e= 200\",\n \"severity\": 1\n }\n ]\n },\n \"prom_eval_interval\": 30,\n \"enable_stime\": \"00:00\",\n \"enable_stimes\": [\n \"00:00\"\n ],\n \"enable_etime\": \"23:59\",\n \"enable_etimes\": [\n \"23:59\"\n ],\n \"enable_days_of_week\": [\n \"0\",\n \"1\",\n \"2\",\n \"3\",\n \"4\",\n \"5\",\n \"6\"\n ],\n \"enable_days_of_weeks\": [\n [\n \"0\",\n \"1\",\n \"2\",\n \"3\",\n \"4\",\n \"5\",\n \"6\"\n ]\n ],\n \"enable_in_bg\": 0,\n \"notify_recovered\": 1,\n \"notify_channels\": [],\n \"notify_groups_obj\": null,\n \"notify_groups\": null,\n \"notify_repeat_step\": 60,\n \"notify_max_number\": 0,\n \"recover_duration\": 0,\n \"callbacks\": [],\n \"runbook_url\": \"\",\n \"append_tags\": [],\n \"annotations\": {},\n \"extra_config\": null,\n \"create_at\": 0,\n \"create_by\": \"\",\n \"update_at\": 0,\n \"update_by\": \"\",\n \"uuid\": 1717556327731912000\n },\n {\n \"id\": 0,\n \"group_id\": 0,\n \"cate\": \"prometheus\",\n \"datasource_ids\": [\n 0\n ],\n \"cluster\": \"\",\n \"name\": \"硬盘监控 - 小于200G的盘,空间不足了\",\n \"note\": \"\",\n \"prod\": \"metric\",\n \"algorithm\": \"\",\n \"algo_params\": null,\n \"delay\": 0,\n \"severity\": 0,\n \"severities\": [\n 3,\n 2,\n 1\n ],\n \"disabled\": 1,\n \"prom_for_duration\": 60,\n \"prom_ql\": \"\",\n \"rule_config\": {\n \"inhibit\": true,\n \"queries\": [\n {\n \"prom_ql\": \"disk_used_percent \\u003e 90 and disk_total/1024/1024/1024 \\u003c 200\",\n \"severity\": 3\n },\n {\n \"prom_ql\": \"disk_used_percent \\u003e 95 and disk_total/1024/1024/1024 \\u003c 200\",\n \"severity\": 2\n },\n {\n \"prom_ql\": \"disk_used_percent \\u003e 99 and disk_total/1024/1024/1024 \\u003c 200\",\n \"severity\": 1\n }\n ]\n },\n \"prom_eval_interval\": 30,\n \"enable_stime\": \"00:00\",\n \"enable_stimes\": [\n \"00:00\"\n ],\n \"enable_etime\": \"23:59\",\n \"enable_etimes\": [\n \"23:59\"\n ],\n \"enable_days_of_week\": [\n \"0\",\n \"1\",\n \"2\",\n \"3\",\n \"4\",\n \"5\",\n \"6\"\n ],\n \"enable_days_of_weeks\": [\n [\n \"0\",\n \"1\",\n \"2\",\n \"3\",\n \"4\",\n \"5\",\n \"6\"\n ]\n ],\n \"enable_in_bg\": 0,\n \"notify_recovered\": 1,\n \"notify_channels\": [],\n \"notify_groups_obj\": null,\n \"notify_groups\": null,\n \"notify_repeat_step\": 60,\n \"notify_max_number\": 0,\n \"recover_duration\": 0,\n \"callbacks\": [],\n \"runbook_url\": \"\",\n \"append_tags\": [],\n \"annotations\": {},\n \"extra_config\": null,\n \"create_at\": 0,\n \"create_by\": \"\",\n \"update_at\": 0,\n \"update_by\": \"\",\n \"uuid\": 1717556327732287000\n },\n {\n \"id\": 0,\n \"group_id\": 0,\n \"cate\": \"prometheus\",\n \"datasource_ids\": [\n 0\n ],\n \"cluster\": \"\",\n \"name\": \"硬盘监控 - 设备有报错\",\n \"note\": \"\",\n \"prod\": \"metric\",\n \"algorithm\": \"\",\n \"algo_params\": null,\n \"delay\": 0,\n \"severity\": 0,\n \"severities\": [\n 2\n ],\n \"disabled\": 1,\n \"prom_for_duration\": 60,\n \"prom_ql\": \"\",\n \"rule_config\": {\n \"queries\": [\n {\n \"prom_ql\": \"disk_device_error\\u003e0\",\n \"severity\": 2\n }\n ]\n },\n \"prom_eval_interval\": 30,\n \"enable_stime\": \"00:00\",\n \"enable_stimes\": [\n \"00:00\"\n ],\n \"enable_etime\": \"00:00\",\n \"enable_etimes\": [\n \"00:00\"\n ],\n \"enable_days_of_week\": [\n \"0\",\n \"1\",\n \"2\",\n \"3\",\n \"4\",\n \"5\",\n \"6\"\n ],\n \"enable_days_of_weeks\": [\n [\n \"0\",\n \"1\",\n \"2\",\n \"3\",\n \"4\",\n \"5\",\n \"6\"\n ]\n ],\n \"enable_in_bg\": 0,\n \"notify_recovered\": 1,\n \"notify_channels\": [],\n \"notify_groups_obj\": null,\n \"notify_groups\": null,\n \"notify_repeat_step\": 60,\n \"notify_max_number\": 0,\n \"recover_duration\": 0,\n \"callbacks\": [],\n \"runbook_url\": \"\",\n \"append_tags\": [],\n \"annotations\": {},\n \"extra_config\": null,\n \"create_at\": 0,\n \"create_by\": \"\",\n \"update_at\": 0,\n \"update_by\": \"\",\n \"uuid\": 1717556327732665000\n },\n {\n \"id\": 0,\n \"group_id\": 0,\n \"cate\": \"prometheus\",\n \"datasource_ids\": [\n 0\n ],\n \"cluster\": \"\",\n \"name\": \"硬盘监控 - 预测硬盘会在未来4小时内写满\",\n \"note\": \"\",\n \"prod\": \"metric\",\n \"algorithm\": \"\",\n \"algo_params\": null,\n \"delay\": 0,\n \"severity\": 0,\n \"severities\": [\n 1\n ],\n \"disabled\": 1,\n \"prom_for_duration\": 60,\n \"prom_ql\": \"\",\n \"rule_config\": {\n \"inhibit\": false,\n \"queries\": [\n {\n \"prom_ql\": \"predict_linear(disk_free[1h], 4*3600) \\u003c 0\",\n \"severity\": 1\n }\n ]\n },\n \"prom_eval_interval\": 15,\n \"enable_stime\": \"00:00\",\n \"enable_stimes\": [\n \"00:00\"\n ],\n \"enable_etime\": \"23:59\",\n \"enable_etimes\": [\n \"23:59\"\n ],\n \"enable_days_of_week\": [\n \"1\",\n \"2\",\n \"3\",\n \"4\",\n \"5\",\n \"6\",\n \"0\"\n ],\n \"enable_days_of_weeks\": [\n [\n \"1\",\n \"2\",\n \"3\",\n \"4\",\n \"5\",\n \"6\",\n \"0\"\n ]\n ],\n \"enable_in_bg\": 0,\n \"notify_recovered\": 1,\n \"notify_channels\": [\n \"email\",\n \"dingtalk\",\n \"wecom\"\n ],\n \"notify_groups_obj\": null,\n \"notify_groups\": null,\n \"notify_repeat_step\": 60,\n \"notify_max_number\": 0,\n \"recover_duration\": 0,\n \"callbacks\": [],\n \"runbook_url\": \"\",\n \"append_tags\": [],\n \"annotations\": {},\n \"extra_config\": null,\n \"create_at\": 0,\n \"create_by\": \"\",\n \"update_at\": 0,\n \"update_by\": \"\",\n \"uuid\": 1717556327733242000\n },\n {\n \"id\": 0,\n \"group_id\": 0,\n \"cate\": \"prometheus\",\n \"datasource_ids\": [\n 0\n ],\n \"cluster\": \"\",\n \"name\": \"系统有OOM产生\",\n \"note\": \"\",\n \"prod\": \"metric\",\n \"algorithm\": \"\",\n \"algo_params\": null,\n \"delay\": 0,\n \"severity\": 0,\n \"severities\": [\n 2\n ],\n \"disabled\": 1,\n \"prom_for_duration\": 0,\n \"prom_ql\": \"\",\n \"rule_config\": {\n \"queries\": [\n {\n \"prom_ql\": \"increase(kernel_vmstat_oom_kill[2m]) > 0\",\n \"severity\": 2\n }\n ]\n },\n \"prom_eval_interval\": 30,\n \"enable_stime\": \"00:00\",\n \"enable_stimes\": [\n \"00:00\"\n ],\n \"enable_etime\": \"00:00\",\n \"enable_etimes\": [\n \"00:00\"\n ],\n \"enable_days_of_week\": [\n \"0\",\n \"1\",\n \"2\",\n \"3\",\n \"4\",\n \"5\",\n \"6\"\n ],\n \"enable_days_of_weeks\": [\n [\n \"0\",\n \"1\",\n \"2\",\n \"3\",\n \"4\",\n \"5\",\n \"6\"\n ]\n ],\n \"enable_in_bg\": 0,\n \"notify_recovered\": 1,\n \"notify_channels\": [],\n \"notify_groups_obj\": null,\n \"notify_groups\": null,\n \"notify_repeat_step\": 60,\n \"notify_max_number\": 0,\n \"recover_duration\": 0,\n \"callbacks\": [],\n \"runbook_url\": \"\",\n \"append_tags\": [],\n \"annotations\": {},\n \"extra_config\": null,\n \"create_at\": 0,\n \"create_by\": \"\",\n \"update_at\": 0,\n \"update_by\": \"\",\n \"uuid\": 1717556327733610000\n },\n {\n \"id\": 0,\n \"group_id\": 0,\n \"cate\": \"prometheus\",\n \"datasource_ids\": [\n 0\n ],\n \"cluster\": \"\",\n \"name\": \"网卡监控 - 入方向有丢包\",\n \"note\": \"\",\n \"prod\": \"metric\",\n \"algorithm\": \"\",\n \"algo_params\": null,\n \"delay\": 0,\n \"severity\": 0,\n \"severities\": [\n 3\n ],\n \"disabled\": 1,\n \"prom_for_duration\": 60,\n \"prom_ql\": \"\",\n \"rule_config\": {\n \"inhibit\": false,\n \"queries\": [\n {\n \"prom_ql\": \"increase(net_drop_in[1m]) \\u003e 0\",\n \"severity\": 3\n }\n ]\n },\n \"prom_eval_interval\": 15,\n \"enable_stime\": \"00:00\",\n \"enable_stimes\": [\n \"00:00\"\n ],\n \"enable_etime\": \"23:59\",\n \"enable_etimes\": [\n \"23:59\"\n ],\n \"enable_days_of_week\": [\n \"1\",\n \"2\",\n \"3\",\n \"4\",\n \"5\",\n \"6\",\n \"0\"\n ],\n \"enable_days_of_weeks\": [\n [\n \"1\",\n \"2\",\n \"3\",\n \"4\",\n \"5\",\n \"6\",\n \"0\"\n ]\n ],\n \"enable_in_bg\": 0,\n \"notify_recovered\": 1,\n \"notify_channels\": [\n \"email\",\n \"dingtalk\",\n \"wecom\"\n ],\n \"notify_groups_obj\": null,\n \"notify_groups\": null,\n \"notify_repeat_step\": 60,\n \"notify_max_number\": 0,\n \"recover_duration\": 0,\n \"callbacks\": [],\n \"runbook_url\": \"\",\n \"append_tags\": [],\n \"annotations\": {},\n \"extra_config\": null,\n \"create_at\": 0,\n \"create_by\": \"\",\n \"update_at\": 0,\n \"update_by\": \"\",\n \"uuid\": 1717556327734000000\n },\n {\n \"id\": 0,\n \"group_id\": 0,\n \"cate\": \"prometheus\",\n \"datasource_ids\": [\n 0\n ],\n \"cluster\": \"\",\n \"name\": \"网卡监控 - 入方向有错包\",\n \"note\": \"\",\n \"prod\": \"metric\",\n \"algorithm\": \"\",\n \"algo_params\": null,\n \"delay\": 0,\n \"severity\": 0,\n \"severities\": [\n 3\n ],\n \"disabled\": 1,\n \"prom_for_duration\": 60,\n \"prom_ql\": \"\",\n \"rule_config\": {\n \"inhibit\": false,\n \"queries\": [\n {\n \"prom_ql\": \"increase(net_err_in[1m]) \\u003e 0\",\n \"severity\": 3\n }\n ]\n },\n \"prom_eval_interval\": 15,\n \"enable_stime\": \"00:00\",\n \"enable_stimes\": [\n \"00:00\"\n ],\n \"enable_etime\": \"23:59\",\n \"enable_etimes\": [\n \"23:59\"\n ],\n \"enable_days_of_week\": [\n \"1\",\n \"2\",\n \"3\",\n \"4\",\n \"5\",\n \"6\",\n \"0\"\n ],\n \"enable_days_of_weeks\": [\n [\n \"1\",\n \"2\",\n \"3\",\n \"4\",\n \"5\",\n \"6\",\n \"0\"\n ]\n ],\n \"enable_in_bg\": 0,\n \"notify_recovered\": 1,\n \"notify_channels\": [\n \"email\",\n \"dingtalk\",\n \"wecom\"\n ],\n \"notify_groups_obj\": null,\n \"notify_groups\": null,\n \"notify_repeat_step\": 60,\n \"notify_max_number\": 0,\n \"recover_duration\": 0,\n \"callbacks\": [],\n \"runbook_url\": \"\",\n \"append_tags\": [],\n \"annotations\": {},\n \"extra_config\": null,\n \"create_at\": 0,\n \"create_by\": \"\",\n \"update_at\": 0,\n \"update_by\": \"\",\n \"uuid\": 1717556327734421000\n },\n {\n \"id\": 0,\n \"group_id\": 0,\n \"cate\": \"prometheus\",\n \"datasource_ids\": [\n 0\n ],\n \"cluster\": \"\",\n \"name\": \"网卡监控 - 出方向有丢包\",\n \"note\": \"\",\n \"prod\": \"metric\",\n \"algorithm\": \"\",\n \"algo_params\": null,\n \"delay\": 0,\n \"severity\": 0,\n \"severities\": [\n 3\n ],\n \"disabled\": 1,\n \"prom_for_duration\": 60,\n \"prom_ql\": \"\",\n \"rule_config\": {\n \"inhibit\": false,\n \"queries\": [\n {\n \"prom_ql\": \"increase(net_drop_out[1m]) \\u003e 0\",\n \"severity\": 3\n }\n ]\n },\n \"prom_eval_interval\": 15,\n \"enable_stime\": \"00:00\",\n \"enable_stimes\": [\n \"00:00\"\n ],\n \"enable_etime\": \"23:59\",\n \"enable_etimes\": [\n \"23:59\"\n ],\n \"enable_days_of_week\": [\n \"1\",\n \"2\",\n \"3\",\n \"4\",\n \"5\",\n \"6\",\n \"0\"\n ],\n \"enable_days_of_weeks\": [\n [\n \"1\",\n \"2\",\n \"3\",\n \"4\",\n \"5\",\n \"6\",\n \"0\"\n ]\n ],\n \"enable_in_bg\": 0,\n \"notify_recovered\": 1,\n \"notify_channels\": [\n \"email\",\n \"dingtalk\",\n \"wecom\"\n ],\n \"notify_groups_obj\": null,\n \"notify_groups\": null,\n \"notify_repeat_step\": 60,\n \"notify_max_number\": 0,\n \"recover_duration\": 0,\n \"callbacks\": [],\n \"runbook_url\": \"\",\n \"append_tags\": [],\n \"annotations\": {},\n \"extra_config\": null,\n \"create_at\": 0,\n \"create_by\": \"\",\n \"update_at\": 0,\n \"update_by\": \"\",\n \"uuid\": 1717556327734847000\n },\n {\n \"id\": 0,\n \"group_id\": 0,\n \"cate\": \"prometheus\",\n \"datasource_ids\": [\n 0\n ],\n \"cluster\": \"\",\n \"name\": \"网卡监控 - 出方向有错包\",\n \"note\": \"\",\n \"prod\": \"metric\",\n \"algorithm\": \"\",\n \"algo_params\": null,\n \"delay\": 0,\n \"severity\": 0,\n \"severities\": [\n 3\n ],\n \"disabled\": 1,\n \"prom_for_duration\": 60,\n \"prom_ql\": \"\",\n \"rule_config\": {\n \"inhibit\": false,\n \"queries\": [\n {\n \"prom_ql\": \"increase(net_err_out[1m]) \\u003e 0\",\n \"severity\": 3\n }\n ]\n },\n \"prom_eval_interval\": 15,\n \"enable_stime\": \"00:00\",\n \"enable_stimes\": [\n \"00:00\"\n ],\n \"enable_etime\": \"23:59\",\n \"enable_etimes\": [\n \"23:59\"\n ],\n \"enable_days_of_week\": [\n \"1\",\n \"2\",\n \"3\",\n \"4\",\n \"5\",\n \"6\",\n \"0\"\n ],\n \"enable_days_of_weeks\": [\n [\n \"1\",\n \"2\",\n \"3\",\n \"4\",\n \"5\",\n \"6\",\n \"0\"\n ]\n ],\n \"enable_in_bg\": 0,\n \"notify_recovered\": 1,\n \"notify_channels\": [\n \"email\",\n \"dingtalk\",\n \"wecom\"\n ],\n \"notify_groups_obj\": null,\n \"notify_groups\": null,\n \"notify_repeat_step\": 60,\n \"notify_max_number\": 0,\n \"recover_duration\": 0,\n \"callbacks\": [],\n \"runbook_url\": \"\",\n \"append_tags\": [],\n \"annotations\": {},\n \"extra_config\": null,\n \"create_at\": 0,\n \"create_by\": \"\",\n \"update_at\": 0,\n \"update_by\": \"\",\n \"uuid\": 1717556327735362000\n },\n {\n \"id\": 0,\n \"group_id\": 0,\n \"cate\": \"prometheus\",\n \"datasource_ids\": [\n 0\n ],\n \"cluster\": \"\",\n \"name\": \"网络地址探活失败\",\n \"note\": \"\",\n \"prod\": \"metric\",\n \"algorithm\": \"\",\n \"algo_params\": null,\n \"delay\": 0,\n \"severity\": 2,\n \"severities\": [\n 2\n ],\n \"disabled\": 1,\n \"prom_for_duration\": 60,\n \"prom_ql\": \"\",\n \"rule_config\": {\n \"algo_params\": null,\n \"inhibit\": false,\n \"prom_ql\": \"\",\n \"queries\": [\n {\n \"prom_ql\": \"net_response_result_code != 0\",\n \"severity\": 2\n }\n ],\n \"severity\": 0\n },\n \"prom_eval_interval\": 15,\n \"enable_stime\": \"00:00\",\n \"enable_stimes\": [\n \"00:00\"\n ],\n \"enable_etime\": \"23:59\",\n \"enable_etimes\": [\n \"23:59\"\n ],\n \"enable_days_of_week\": [\n \"1\",\n \"2\",\n \"3\",\n \"4\",\n \"5\",\n \"6\",\n \"0\"\n ],\n \"enable_days_of_weeks\": [\n [\n \"1\",\n \"2\",\n \"3\",\n \"4\",\n \"5\",\n \"6\",\n \"0\"\n ]\n ],\n \"enable_in_bg\": 0,\n \"notify_recovered\": 1,\n \"notify_channels\": [],\n \"notify_groups_obj\": null,\n \"notify_groups\": null,\n \"notify_repeat_step\": 60,\n \"notify_max_number\": 0,\n \"recover_duration\": 0,\n \"callbacks\": [],\n \"runbook_url\": \"\",\n \"append_tags\": [],\n \"annotations\": null,\n \"extra_config\": null,\n \"create_at\": 0,\n \"create_by\": \"\",\n \"update_at\": 0,\n \"update_by\": \"\",\n \"uuid\": 1717556327735768000\n },\n {\n \"id\": 0,\n \"group_id\": 0,\n \"cate\": \"prometheus\",\n \"datasource_ids\": [\n 0\n ],\n \"cluster\": \"\",\n \"name\": \"进程监控-有进程数为0,某进程可能挂了\",\n \"note\": \"\",\n \"prod\": \"metric\",\n \"algorithm\": \"\",\n \"algo_params\": null,\n \"delay\": 0,\n \"severity\": 1,\n \"severities\": [\n 1\n ],\n \"disabled\": 1,\n \"prom_for_duration\": 60,\n \"prom_ql\": \"\",\n \"rule_config\": {\n \"algo_params\": null,\n \"inhibit\": false,\n \"prom_ql\": \"\",\n \"queries\": [\n {\n \"prom_ql\": \"procstat_lookup_count == 0\",\n \"severity\": 1\n }\n ],\n \"severity\": 0\n },\n \"prom_eval_interval\": 15,\n \"enable_stime\": \"00:00\",\n \"enable_stimes\": [\n \"00:00\"\n ],\n \"enable_etime\": \"23:59\",\n \"enable_etimes\": [\n \"23:59\"\n ],\n \"enable_days_of_week\": [\n \"1\",\n \"2\",\n \"3\",\n \"4\",\n \"5\",\n \"6\",\n \"0\"\n ],\n \"enable_days_of_weeks\": [\n [\n \"1\",\n \"2\",\n \"3\",\n \"4\",\n \"5\",\n \"6\",\n \"0\"\n ]\n ],\n \"enable_in_bg\": 0,\n \"notify_recovered\": 1,\n \"notify_channels\": [\n \"email\",\n \"dingtalk\",\n \"wecom\"\n ],\n \"notify_groups_obj\": null,\n \"notify_groups\": null,\n \"notify_repeat_step\": 60,\n \"notify_max_number\": 0,\n \"recover_duration\": 0,\n \"callbacks\": [],\n \"runbook_url\": \"\",\n \"append_tags\": [],\n \"annotations\": null,\n \"extra_config\": null,\n \"create_at\": 0,\n \"create_by\": \"\",\n \"update_at\": 0,\n \"update_by\": \"\",\n \"uuid\": 1717556327736228000\n },\n {\n \"id\": 0,\n \"group_id\": 0,\n \"cate\": \"prometheus\",\n \"datasource_ids\": [\n 0\n ],\n \"cluster\": \"\",\n \"name\": \"进程监控-进程句柄限制过小\",\n \"note\": \"\",\n \"prod\": \"metric\",\n \"algorithm\": \"\",\n \"algo_params\": null,\n \"delay\": 0,\n \"severity\": 3,\n \"severities\": [\n 3\n ],\n \"disabled\": 1,\n \"prom_for_duration\": 60,\n \"prom_ql\": \"\",\n \"rule_config\": {\n \"algo_params\": null,\n \"inhibit\": false,\n \"prom_ql\": \"\",\n \"queries\": [\n {\n \"prom_ql\": \"procstat_rlimit_num_fds_soft \\u003c 2048\",\n \"severity\": 3\n }\n ],\n \"severity\": 0\n },\n \"prom_eval_interval\": 15,\n \"enable_stime\": \"00:00\",\n \"enable_stimes\": [\n \"00:00\"\n ],\n \"enable_etime\": \"23:59\",\n \"enable_etimes\": [\n \"23:59\"\n ],\n \"enable_days_of_week\": [\n \"1\",\n \"2\",\n \"3\",\n \"4\",\n \"5\",\n \"6\",\n \"0\"\n ],\n \"enable_days_of_weeks\": [\n [\n \"1\",\n \"2\",\n \"3\",\n \"4\",\n \"5\",\n \"6\",\n \"0\"\n ]\n ],\n \"enable_in_bg\": 0,\n \"notify_recovered\": 1,\n \"notify_channels\": [\n \"email\",\n \"dingtalk\",\n \"wecom\"\n ],\n \"notify_groups_obj\": null,\n \"notify_groups\": null,\n \"notify_repeat_step\": 60,\n \"notify_max_number\": 0,\n \"recover_duration\": 0,\n \"callbacks\": [],\n \"runbook_url\": \"\",\n \"append_tags\": [],\n \"annotations\": null,\n \"extra_config\": null,\n \"create_at\": 0,\n \"create_by\": \"\",\n \"update_at\": 0,\n \"update_by\": \"\",\n \"uuid\": 1717556327736656000\n },\n {\n \"id\": 0,\n \"group_id\": 0,\n \"cate\": \"prometheus\",\n \"datasource_ids\": [\n 0\n ],\n \"cluster\": \"\",\n \"name\": \"进程监控-进程总量超过600\",\n \"note\": \"\",\n \"prod\": \"metric\",\n \"algorithm\": \"\",\n \"algo_params\": null,\n \"delay\": 0,\n \"severity\": 0,\n \"severities\": [\n 2\n ],\n \"disabled\": 1,\n \"prom_for_duration\": 60,\n \"prom_ql\": \"\",\n \"rule_config\": {\n \"inhibit\": false,\n \"queries\": [\n {\n \"prom_ql\": \"processes_total \\u003e 600\",\n \"severity\": 2\n }\n ]\n },\n \"prom_eval_interval\": 15,\n \"enable_stime\": \"00:00\",\n \"enable_stimes\": [\n \"00:00\"\n ],\n \"enable_etime\": \"23:59\",\n \"enable_etimes\": [\n \"23:59\"\n ],\n \"enable_days_of_week\": [\n \"1\",\n \"2\",\n \"3\",\n \"4\",\n \"5\",\n \"6\",\n \"0\"\n ],\n \"enable_days_of_weeks\": [\n [\n \"1\",\n \"2\",\n \"3\",\n \"4\",\n \"5\",\n \"6\",\n \"0\"\n ]\n ],\n \"enable_in_bg\": 0,\n \"notify_recovered\": 1,\n \"notify_channels\": [\n \"email\",\n \"dingtalk\",\n \"wecom\"\n ],\n \"notify_groups_obj\": null,\n \"notify_groups\": null,\n \"notify_repeat_step\": 60,\n \"notify_max_number\": 0,\n \"recover_duration\": 0,\n \"callbacks\": [],\n \"runbook_url\": \"\",\n \"append_tags\": [],\n \"annotations\": {},\n \"extra_config\": null,\n \"create_at\": 0,\n \"create_by\": \"\",\n \"update_at\": 0,\n \"update_by\": \"\",\n \"uuid\": 1717556327737117000\n }\n]\n"
},
{
"path": "integrations/Linux/collect/arp_packet/arp_packet.toml",
"content": "# # collect interval\n# interval = 15\n\n[[instances]]\n#eth_device=\"ens192\""
},
{
"path": "integrations/Linux/collect/kernel_vmstat/kernel_vmstat.toml",
"content": "# # collect interval\n# interval = 15\n\n# file: /proc/vmstat\n[white_list]\noom_kill = 1\nnr_free_pages = 0\nnr_alloc_batch = 0\nnr_inactive_anon = 0\nnr_active_anon = 0\nnr_inactive_file = 0\nnr_active_file = 0\nnr_unevictable = 0\nnr_mlock = 0\nnr_anon_pages = 0\nnr_mapped = 0\nnr_file_pages = 0\nnr_dirty = 0\nnr_writeback = 0\nnr_slab_reclaimable = 0\nnr_slab_unreclaimable = 0\nnr_page_table_pages = 0\nnr_kernel_stack = 0\nnr_unstable = 0\nnr_bounce = 0\nnr_vmscan_write = 0\nnr_vmscan_immediate_reclaim = 0\nnr_writeback_temp = 0\nnr_isolated_anon = 0\nnr_isolated_file = 0\nnr_shmem = 0\nnr_dirtied = 0\nnr_written = 0\nnuma_hit = 0\nnuma_miss = 0\nnuma_foreign = 0\nnuma_interleave = 0\nnuma_local = 0\nnuma_other = 0\nworkingset_refault = 0\nworkingset_activate = 0\nworkingset_nodereclaim = 0\nnr_anon_transparent_hugepages = 0\nnr_free_cma = 0\nnr_dirty_threshold = 0\nnr_dirty_background_threshold = 0\npgpgin = 0\npgpgout = 0\npswpin = 0\npswpout = 0\npgalloc_dma = 0\npgalloc_dma32 = 0\npgalloc_normal = 0\npgalloc_movable = 0\npgfree = 0\npgactivate = 0\npgdeactivate = 0\npgfault = 0\npgmajfault = 0\npglazyfreed = 0\npgrefill_dma = 0\npgrefill_dma32 = 0\npgrefill_normal = 0\npgrefill_movable = 0\npgsteal_kswapd_dma = 0\npgsteal_kswapd_dma32 = 0\npgsteal_kswapd_normal = 0\npgsteal_kswapd_movable = 0\npgsteal_direct_dma = 0\npgsteal_direct_dma32 = 0\npgsteal_direct_normal = 0\npgsteal_direct_movable = 0\npgscan_kswapd_dma = 0\npgscan_kswapd_dma32 = 0\npgscan_kswapd_normal = 0\npgscan_kswapd_movable = 0\npgscan_direct_dma = 0\npgscan_direct_dma32 = 0\npgscan_direct_normal = 0\npgscan_direct_movable = 0\npgscan_direct_throttle = 0\nzone_reclaim_failed = 0\npginodesteal = 0\nslabs_scanned = 0\nkswapd_inodesteal = 0\nkswapd_low_wmark_hit_quickly = 0\nkswapd_high_wmark_hit_quickly = 0\npageoutrun = 0\nallocstall = 0\npgrotated = 0\ndrop_pagecache = 0\ndrop_slab = 0\nnuma_pte_updates = 0\nnuma_huge_pte_updates = 0\nnuma_hint_faults = 0\nnuma_hint_faults_local = 0\nnuma_pages_migrated = 0\npgmigrate_success = 0\npgmigrate_fail = 0\ncompact_migrate_scanned = 0\ncompact_free_scanned = 0\ncompact_isolated = 0\ncompact_stall = 0\ncompact_fail = 0\ncompact_success = 0\nhtlb_buddy_alloc_success = 0\nhtlb_buddy_alloc_fail = 0\nunevictable_pgs_culled = 0\nunevictable_pgs_scanned = 0\nunevictable_pgs_rescued = 0\nunevictable_pgs_mlocked = 0\nunevictable_pgs_munlocked = 0\nunevictable_pgs_cleared = 0\nunevictable_pgs_stranded = 0\nthp_fault_alloc = 0\nthp_fault_fallback = 0\nthp_collapse_alloc = 0\nthp_collapse_alloc_failed = 0\nthp_split = 0\nthp_zero_page_alloc = 0\nthp_zero_page_alloc_failed = 0\nballoon_inflate = 0\nballoon_deflate = 0\nballoon_migrate = 0\n"
},
{
"path": "integrations/Linux/collect/netstat/netstat.toml",
"content": "# # collect interval\n# interval = 15\n\ndisable_summary_stats = false\n## if machine has many network connections, use this plugin may exhaust your cpu resource, disable connection stat to avoid this\ndisable_connection_stats = true\n\ntcp_ext = false\nip_ext = false\n"
},
{
"path": "integrations/Linux/collect/ntp/ntp.toml",
"content": "# # collect interval\n# interval = 15\n\n# # ntp servers\n# ntp_servers = [\"ntp.aliyun.com\"]\n\n# # response time out seconds\n# timeout = 5"
},
{
"path": "integrations/Linux/collect/processes/processes.toml",
"content": "# # collect interval\n# interval = 15\n\n# # force use ps command to gather\n# force_ps = false\n\n# # force use /proc to gather\n# force_proc = false"
},
{
"path": "integrations/Linux/dashboards/categraf-detail.json",
"content": "{\n \"name\": \"机器常用指标(如果只想看当前业务组内的机器修改大盘变量 ident 的变量类型为机器标识即可)\",\n \"tags\": \"Categraf\",\n \"ident\": \"\",\n \"uuid\": 1737103014612000,\n \"configs\": {\n \"links\": [\n {\n \"targetBlank\": true,\n \"title\": \"n9e\",\n \"url\": \"https://n9e.github.io/\"\n },\n {\n \"targetBlank\": true,\n \"title\": \"author\",\n \"url\": \"http://flashcat.cloud/\"\n }\n ],\n \"panels\": [\n {\n \"type\": \"stat\",\n \"id\": \"c75ae525-ad39-458a-a7ce-2673b75fb95c\",\n \"layout\": {\n \"h\": 5,\n \"w\": 5,\n \"x\": 0,\n \"y\": 0,\n \"i\": \"507b6468-d429-42c7-b86d-d43ce65d6679\",\n \"isResizable\": true\n },\n \"version\": \"3.1.0\",\n \"datasourceCate\": \"prometheus\",\n \"datasourceValue\": \"${prom}\",\n \"targets\": [\n {\n \"expr\": \"count(last_over_time(system_uptime{ident=~\\\"$ident\\\"}[$__rate_interval]))\",\n \"maxDataPoints\": 480,\n \"refId\": \"A\",\n \"step\": 15,\n \"instant\": false\n }\n ],\n \"transformations\": [\n {\n \"id\": \"organize\",\n \"options\": {}\n }\n ],\n \"name\": \"存活机器数量\",\n \"maxPerRow\": 4,\n \"custom\": {\n \"textMode\": \"value\",\n \"graphMode\": \"area\",\n \"colorMode\": \"background\",\n \"calc\": \"lastNotNull\",\n \"valueField\": \"Value\",\n \"colSpan\": 0,\n \"textSize\": {\n \"value\": null\n },\n \"orientation\": \"auto\"\n },\n \"options\": {\n \"thresholds\": {\n \"steps\": [\n {\n \"color\": \"rgba(44, 157, 61, 1)\",\n \"value\": null,\n \"type\": \"base\"\n }\n ]\n },\n \"valueMappings\": [],\n \"standardOptions\": {\n \"util\": \"none\",\n \"decimals\": 1\n }\n },\n \"overrides\": [\n {\n \"matcher\": {\n \"id\": \"byFrameRefID\"\n },\n \"properties\": {\n \"thresholds\": {\n \"steps\": [\n {\n \"color\": \"#6C53B1\",\n \"value\": null,\n \"type\": \"base\"\n }\n ]\n }\n }\n }\n ]\n },\n {\n \"type\": \"stat\",\n \"id\": \"7a7bd5db-d12e-49f0-92a8-15958e99ee54\",\n \"layout\": {\n \"h\": 5,\n \"w\": 5,\n \"x\": 5,\n \"y\": 0,\n \"i\": \"7a7bd5db-d12e-49f0-92a8-15958e99ee54\",\n \"isResizable\": true\n },\n \"version\": \"3.1.0\",\n \"datasourceCate\": \"prometheus\",\n \"datasourceValue\": \"${prom}\",\n \"targets\": [\n {\n \"expr\": \"system_uptime{ident=~\\\"$ident\\\"}\",\n \"maxDataPoints\": 240,\n \"refId\": \"A\",\n \"instant\": true,\n \"legend\": \"{{ident}}\"\n }\n ],\n \"transformations\": [\n {\n \"id\": \"organize\",\n \"options\": {\n \"renameByName\": {\n \"ident\": \"机器\",\n \"value\": \"启动时长\"\n }\n }\n }\n ],\n \"name\": \"启动时长\",\n \"maxPerRow\": 4,\n \"custom\": {\n \"textMode\": \"valueAndName\",\n \"graphMode\": \"none\",\n \"colorMode\": \"background\",\n \"calc\": \"lastNotNull\",\n \"valueField\": \"Value\",\n \"colSpan\": 0,\n \"textSize\": {},\n \"orientation\": \"auto\"\n },\n \"options\": {\n \"thresholds\": {\n \"steps\": [\n {\n \"color\": \"rgb(44, 157, 61)\",\n \"value\": null,\n \"type\": \"base\"\n }\n ]\n },\n \"standardOptions\": {\n \"util\": \"seconds\",\n \"decimals\": 2\n }\n },\n \"overrides\": [\n {\n \"matcher\": {\n \"id\": \"byFrameRefID\"\n },\n \"properties\": {\n \"thresholds\": {\n \"steps\": [\n {\n \"color\": \"#6C53B1\",\n \"value\": null,\n \"type\": \"base\"\n }\n ]\n }\n }\n }\n ]\n },\n {\n \"type\": \"hexbin\",\n \"id\": \"32298d9a-27ad-4af1-b388-72d454f0371f\",\n \"layout\": {\n \"h\": 5,\n \"w\": 7,\n \"x\": 10,\n \"y\": 0,\n \"i\": \"df545ab2-58d2-4793-8e8d-a0ca7b79a6e9\",\n \"isResizable\": true\n },\n \"version\": \"3.1.0\",\n \"datasourceCate\": \"prometheus\",\n \"datasourceValue\": \"${prom}\",\n \"targets\": [\n {\n \"expr\": \"topk(25, disk_used_percent{ident=~\\\"$ident\\\"})\",\n \"legend\": \"[{{ident}}] {{path}}\",\n \"maxDataPoints\": 240,\n \"refId\": \"A\",\n \"step\": 15,\n \"instant\": true\n }\n ],\n \"transformations\": [\n {\n \"id\": \"organize\",\n \"options\": {}\n }\n ],\n \"name\": \"硬盘使用率(最大的25个)\",\n \"maxPerRow\": 4,\n \"custom\": {\n \"textMode\": \"value\",\n \"calc\": \"lastNotNull\",\n \"valueField\": \"Value\",\n \"colorRange\": [\n \"thresholds\"\n ]\n },\n \"options\": {\n \"thresholds\": {\n \"steps\": [\n {\n \"color\": \"rgba(243, 9, 18, 1)\",\n \"value\": 99,\n \"type\": \"\"\n },\n {\n \"color\": \"rgba(255, 130, 134, 1)\",\n \"value\": 95,\n \"type\": \"\"\n },\n {\n \"color\": \"rgba(255, 174, 57, 1)\",\n \"value\": 80,\n \"type\": \"\"\n },\n {\n \"color\": \"rgb(44, 157, 61)\",\n \"value\": null,\n \"type\": \"base\"\n }\n ]\n },\n \"standardOptions\": {\n \"util\": \"percent\",\n \"decimals\": 1\n }\n }\n },\n {\n \"type\": \"hexbin\",\n \"id\": \"3f57e062-d9df-4eb6-b01d-abd9d7eca4dd\",\n \"layout\": {\n \"h\": 5,\n \"w\": 7,\n \"x\": 17,\n \"y\": 0,\n \"i\": \"b4e16ac1-86f6-4151-884f-f2c996a62c6b\",\n \"isResizable\": true\n },\n \"version\": \"3.1.0\",\n \"datasourceCate\": \"prometheus\",\n \"datasourceValue\": \"${prom}\",\n \"targets\": [\n {\n \"expr\": \"topk(25, disk_inodes_used{ident=~\\\"$ident\\\"}/disk_inodes_total{ident=~\\\"$ident\\\"}*100)\",\n \"legend\": \"[{{ident}}] {{path}}\",\n \"maxDataPoints\": 240,\n \"refId\": \"A\",\n \"step\": 15,\n \"instant\": true\n }\n ],\n \"transformations\": [\n {\n \"id\": \"organize\",\n \"options\": {}\n }\n ],\n \"name\": \"inode 使用率(最大的25个)\",\n \"maxPerRow\": 4,\n \"custom\": {\n \"textMode\": \"value\",\n \"calc\": \"lastNotNull\",\n \"valueField\": \"Value\",\n \"colorRange\": [\n \"thresholds\"\n ]\n },\n \"options\": {\n \"thresholds\": {\n \"steps\": [\n {\n \"color\": \"rgba(243, 9, 18, 1)\",\n \"value\": 99,\n \"type\": \"\"\n },\n {\n \"color\": \"rgba(255, 130, 134, 1)\",\n \"value\": 95,\n \"type\": \"\"\n },\n {\n \"color\": \"rgba(255, 174, 57, 1)\",\n \"value\": 80,\n \"type\": \"\"\n },\n {\n \"color\": \"rgb(44, 157, 61)\",\n \"value\": null,\n \"type\": \"base\"\n }\n ]\n },\n \"standardOptions\": {\n \"util\": \"percent\",\n \"decimals\": 1\n }\n }\n },\n {\n \"type\": \"timeseries\",\n \"id\": \"93b03928-5530-4cf6-b877-793964edd889\",\n \"layout\": {\n \"h\": 5,\n \"w\": 10,\n \"x\": 0,\n \"y\": 5,\n \"i\": \"ae05d971-5884-4d5e-9a0c-1f069358d8c4\",\n \"isResizable\": true\n },\n \"version\": \"3.1.0\",\n \"datasourceCate\": \"prometheus\",\n \"datasourceValue\": \"${prom}\",\n \"targets\": [\n {\n \"expr\": \"100-cpu_usage_idle{ident=~\\\"$ident\\\",cpu=\\\"cpu-total\\\"}\",\n \"legend\": \"{{ident}}\",\n \"maxDataPoints\": 480,\n \"refId\": \"A\",\n \"step\": 15\n }\n ],\n \"transformations\": [\n {\n \"id\": \"organize\",\n \"options\": {}\n }\n ],\n \"name\": \"CPU使用率历史趋势\",\n \"maxPerRow\": 4,\n \"options\": {\n \"tooltip\": {\n \"mode\": \"all\",\n \"sort\": \"desc\"\n },\n \"legend\": {\n \"displayMode\": \"hidden\",\n \"placement\": \"bottom\",\n \"columns\": [\n \"max\",\n \"min\",\n \"avg\",\n \"last\"\n ],\n \"behaviour\": \"showItem\",\n \"selectMode\": \"single\"\n },\n \"standardOptions\": {\n \"util\": \"percent\",\n \"min\": null,\n \"max\": null,\n \"decimals\": 2\n },\n \"thresholds\": {\n \"mode\": \"absolute\",\n \"steps\": [\n {\n \"color\": \"rgba(255, 101, 107, 1)\",\n \"value\": 80,\n \"type\": \"\"\n },\n {\n \"color\": \"#634CD9\",\n \"type\": \"base\",\n \"value\": null\n }\n ]\n },\n \"thresholdsStyle\": {\n \"mode\": \"dashed\"\n }\n },\n \"custom\": {\n \"drawStyle\": \"lines\",\n \"lineInterpolation\": \"smooth\",\n \"spanNulls\": false,\n \"lineWidth\": 2,\n \"fillOpacity\": 0.03,\n \"gradientMode\": \"none\",\n \"stack\": \"off\",\n \"scaleDistribution\": {\n \"type\": \"linear\"\n },\n \"showPoints\": \"none\",\n \"pointSize\": 5\n },\n \"overrides\": [\n {\n \"matcher\": {\n \"id\": \"byFrameRefID\"\n },\n \"properties\": {\n \"rightYAxisDisplay\": \"off\"\n }\n }\n ]\n },\n {\n \"type\": \"timeseries\",\n \"id\": \"e1a7a7a1-a8dc-4408-8ed1-e15354b830c1\",\n \"layout\": {\n \"h\": 5,\n \"w\": 14,\n \"x\": 10,\n \"y\": 5,\n \"i\": \"906aeb9e-bcb7-48da-913e-a4d143403304\",\n \"isResizable\": true\n },\n \"version\": \"3.1.0\",\n \"datasourceCate\": \"prometheus\",\n \"datasourceValue\": \"${prom}\",\n \"targets\": [\n {\n \"expr\": \"rate(diskio_io_time{ident=~\\\"$ident\\\"}[$__rate_interval])/10\",\n \"legend\": \"{{ident}} {{name}}\",\n \"maxDataPoints\": 480,\n \"refId\": \"A\",\n \"step\": 15\n }\n ],\n \"transformations\": [\n {\n \"id\": \"organize\",\n \"options\": {}\n }\n ],\n \"name\": \"IO使用率历史趋势\",\n \"maxPerRow\": 4,\n \"options\": {\n \"tooltip\": {\n \"mode\": \"all\",\n \"sort\": \"desc\"\n },\n \"legend\": {\n \"displayMode\": \"hidden\",\n \"placement\": \"bottom\",\n \"columns\": [\n \"max\",\n \"min\",\n \"avg\",\n \"last\"\n ],\n \"behaviour\": \"showItem\",\n \"selectMode\": \"single\"\n },\n \"standardOptions\": {\n \"util\": \"percent\",\n \"min\": null,\n \"max\": null,\n \"decimals\": 2\n },\n \"thresholds\": {\n \"mode\": \"absolute\",\n \"steps\": [\n {\n \"color\": \"rgba(255, 101, 107, 1)\",\n \"value\": 90,\n \"type\": \"\"\n },\n {\n \"color\": \"#634CD9\",\n \"type\": \"base\",\n \"value\": null\n }\n ]\n },\n \"thresholdsStyle\": {\n \"mode\": \"dashed\"\n }\n },\n \"custom\": {\n \"drawStyle\": \"lines\",\n \"lineInterpolation\": \"smooth\",\n \"spanNulls\": false,\n \"lineWidth\": 2,\n \"fillOpacity\": 0.03,\n \"gradientMode\": \"none\",\n \"stack\": \"off\",\n \"scaleDistribution\": {\n \"type\": \"linear\"\n },\n \"showPoints\": \"none\",\n \"pointSize\": 5\n },\n \"overrides\": [\n {\n \"matcher\": {\n \"id\": \"byFrameRefID\"\n },\n \"properties\": {\n \"rightYAxisDisplay\": \"off\"\n }\n }\n ]\n },\n {\n \"type\": \"timeseries\",\n \"id\": \"b712ac92-1a59-42c0-90f2-270da6c38522\",\n \"layout\": {\n \"h\": 5,\n \"w\": 10,\n \"x\": 0,\n \"y\": 10,\n \"i\": \"e997491a-d932-473e-b739-49d21da30fa1\",\n \"isResizable\": true\n },\n \"version\": \"3.1.0\",\n \"datasourceCate\": \"prometheus\",\n \"datasourceValue\": \"${prom}\",\n \"targets\": [\n {\n \"expr\": \"mem_used_percent{ident=~\\\"$ident\\\"}\",\n \"legend\": \"{{ident}}\",\n \"maxDataPoints\": 480,\n \"refId\": \"A\",\n \"step\": 15\n }\n ],\n \"transformations\": [\n {\n \"id\": \"organize\",\n \"options\": {}\n }\n ],\n \"name\": \"内存使用率历史趋势\",\n \"maxPerRow\": 4,\n \"options\": {\n \"tooltip\": {\n \"mode\": \"all\",\n \"sort\": \"desc\"\n },\n \"legend\": {\n \"displayMode\": \"hidden\",\n \"placement\": \"bottom\",\n \"columns\": [\n \"max\",\n \"min\",\n \"avg\",\n \"last\"\n ],\n \"behaviour\": \"showItem\",\n \"selectMode\": \"single\"\n },\n \"standardOptions\": {\n \"util\": \"percent\",\n \"min\": null,\n \"max\": null,\n \"decimals\": 2\n },\n \"thresholds\": {\n \"mode\": \"absolute\",\n \"steps\": [\n {\n \"color\": \"rgba(255, 101, 107, 1)\",\n \"value\": 80,\n \"type\": \"\"\n },\n {\n \"color\": \"#634CD9\",\n \"type\": \"base\",\n \"value\": null\n }\n ]\n },\n \"thresholdsStyle\": {\n \"mode\": \"dashed\"\n }\n },\n \"custom\": {\n \"drawStyle\": \"lines\",\n \"lineInterpolation\": \"smooth\",\n \"spanNulls\": false,\n \"lineWidth\": 2,\n \"fillOpacity\": 0.03,\n \"gradientMode\": \"none\",\n \"stack\": \"off\",\n \"scaleDistribution\": {\n \"type\": \"linear\"\n },\n \"showPoints\": \"none\",\n \"pointSize\": 5\n },\n \"overrides\": [\n {\n \"matcher\": {\n \"id\": \"byFrameRefID\"\n },\n \"properties\": {\n \"rightYAxisDisplay\": \"off\"\n }\n }\n ]\n },\n {\n \"type\": \"timeseries\",\n \"id\": \"6fe0d316-55ef-4222-9fef-6905a161b889\",\n \"layout\": {\n \"h\": 5,\n \"w\": 7,\n \"x\": 10,\n \"y\": 10,\n \"i\": \"41804f33-8263-43a2-84a9-18d9c06a47f5\",\n \"isResizable\": true\n },\n \"version\": \"3.1.0\",\n \"datasourceCate\": \"prometheus\",\n \"datasourceValue\": \"${prom}\",\n \"targets\": [\n {\n \"expr\": \"(1 - mem_swap_free{ident=~\\\"$ident\\\"} / mem_swap_total{ident=~\\\"$ident\\\"})*100 and mem_swap_total{ident=~\\\"$ident\\\"} > 0\",\n \"legend\": \"{{ident}}\",\n \"maxDataPoints\": 480,\n \"refId\": \"A\",\n \"step\": 15\n }\n ],\n \"transformations\": [\n {\n \"id\": \"organize\",\n \"options\": {}\n }\n ],\n \"name\": \"swap 使用率历史趋势\",\n \"description\": \"如果没有启用 swap,这个图表是 No Data,是符合预期的\",\n \"maxPerRow\": 4,\n \"options\": {\n \"tooltip\": {\n \"mode\": \"all\",\n \"sort\": \"desc\"\n },\n \"legend\": {\n \"displayMode\": \"hidden\",\n \"placement\": \"bottom\",\n \"columns\": [\n \"max\",\n \"min\",\n \"avg\",\n \"last\"\n ],\n \"behaviour\": \"showItem\",\n \"selectMode\": \"single\"\n },\n \"standardOptions\": {\n \"util\": \"percent\",\n \"min\": null,\n \"max\": null,\n \"decimals\": 2\n },\n \"thresholds\": {\n \"mode\": \"absolute\",\n \"steps\": [\n {\n \"color\": \"rgba(255, 101, 107, 1)\",\n \"value\": 80,\n \"type\": \"\"\n },\n {\n \"color\": \"#634CD9\",\n \"type\": \"base\",\n \"value\": null\n }\n ]\n },\n \"thresholdsStyle\": {\n \"mode\": \"dashed\"\n }\n },\n \"custom\": {\n \"drawStyle\": \"lines\",\n \"lineInterpolation\": \"smooth\",\n \"spanNulls\": false,\n \"lineWidth\": 2,\n \"fillOpacity\": 0.03,\n \"gradientMode\": \"none\",\n \"stack\": \"off\",\n \"scaleDistribution\": {\n \"type\": \"linear\"\n },\n \"showPoints\": \"none\",\n \"pointSize\": 5\n },\n \"overrides\": [\n {\n \"matcher\": {\n \"id\": \"byFrameRefID\"\n },\n \"properties\": {\n \"rightYAxisDisplay\": \"off\"\n }\n }\n ]\n },\n {\n \"type\": \"timeseries\",\n \"id\": \"6ff8ac2f-de61-4806-b166-bde46469bc14\",\n \"layout\": {\n \"h\": 5,\n \"w\": 7,\n \"x\": 17,\n \"y\": 10,\n \"i\": \"d83d8821-85c1-4ce7-9f65-2709f27c17b0\",\n \"isResizable\": true\n },\n \"version\": \"3.1.0\",\n \"datasourceCate\": \"prometheus\",\n \"datasourceValue\": \"${prom}\",\n \"targets\": [\n {\n \"expr\": \"rate(kernel_vmstat_oom_kill{ident=~\\\"$ident\\\"}[$__rate_interval])\",\n \"legend\": \"{{ident}}\",\n \"maxDataPoints\": 480,\n \"refId\": \"A\",\n \"step\": 15\n }\n ],\n \"transformations\": [\n {\n \"id\": \"organize\",\n \"options\": {}\n }\n ],\n \"name\": \"每秒OOM次数\",\n \"maxPerRow\": 4,\n \"options\": {\n \"tooltip\": {\n \"mode\": \"all\",\n \"sort\": \"desc\"\n },\n \"legend\": {\n \"displayMode\": \"hidden\",\n \"placement\": \"bottom\",\n \"columns\": [\n \"max\",\n \"min\",\n \"avg\",\n \"last\"\n ],\n \"behaviour\": \"showItem\",\n \"selectMode\": \"single\"\n },\n \"standardOptions\": {\n \"util\": \"none\",\n \"min\": null,\n \"max\": null,\n \"decimals\": 1\n },\n \"thresholds\": {\n \"mode\": \"absolute\",\n \"steps\": [\n {\n \"color\": \"#634CD9\",\n \"value\": null,\n \"type\": \"base\"\n }\n ]\n },\n \"thresholdsStyle\": {\n \"mode\": \"dashed\"\n }\n },\n \"custom\": {\n \"drawStyle\": \"lines\",\n \"lineInterpolation\": \"smooth\",\n \"spanNulls\": false,\n \"lineWidth\": 2,\n \"fillOpacity\": 0.03,\n \"gradientMode\": \"none\",\n \"stack\": \"off\",\n \"scaleDistribution\": {\n \"type\": \"linear\"\n },\n \"showPoints\": \"none\",\n \"pointSize\": 5\n },\n \"overrides\": [\n {\n \"matcher\": {\n \"id\": \"byFrameRefID\"\n },\n \"properties\": {\n \"rightYAxisDisplay\": \"off\"\n }\n }\n ]\n },\n {\n \"collapsed\": true,\n \"id\": \"307152d2-708c-4736-98cf-08b886cbf7f2\",\n \"layout\": {\n \"h\": 1,\n \"w\": 24,\n \"x\": 0,\n \"y\": 15,\n \"i\": \"307152d2-708c-4736-98cf-08b886cbf7f2\",\n \"isResizable\": false\n },\n \"name\": \"网络详情\",\n \"panels\": [],\n \"type\": \"row\"\n },\n {\n \"type\": \"timeseries\",\n \"id\": \"f2ee5d32-737c-4095-b6b7-b15b778ffdb9\",\n \"layout\": {\n \"h\": 5,\n \"w\": 12,\n \"x\": 0,\n \"y\": 16,\n \"i\": \"f2ee5d32-737c-4095-b6b7-b15b778ffdb9\",\n \"isResizable\": true\n },\n \"version\": \"3.1.0\",\n \"datasourceCate\": \"prometheus\",\n \"datasourceValue\": \"${prom}\",\n \"targets\": [\n {\n \"expr\": \"rate(net_bytes_recv{ident=~\\\"$ident\\\"}[$__rate_interval])*8\",\n \"legend\": \"{{ident}} {{interface}}\",\n \"maxDataPoints\": 480,\n \"refId\": \"A\",\n \"step\": 15\n }\n ],\n \"transformations\": [\n {\n \"id\": \"organize\",\n \"options\": {}\n }\n ],\n \"name\": \"网络流量-入向\",\n \"maxPerRow\": 4,\n \"options\": {\n \"tooltip\": {\n \"mode\": \"all\",\n \"sort\": \"desc\"\n },\n \"legend\": {\n \"displayMode\": \"hidden\",\n \"placement\": \"bottom\",\n \"behaviour\": \"showItem\",\n \"selectMode\": \"single\"\n },\n \"standardOptions\": {\n \"util\": \"bitsSecSI\",\n \"decimals\": 2\n },\n \"thresholds\": {\n \"mode\": \"absolute\",\n \"steps\": [\n {\n \"color\": \"#634CD9\",\n \"value\": null,\n \"type\": \"base\"\n }\n ]\n },\n \"thresholdsStyle\": {\n \"mode\": \"dashed\"\n }\n },\n \"custom\": {\n \"drawStyle\": \"lines\",\n \"lineInterpolation\": \"smooth\",\n \"spanNulls\": false,\n \"lineWidth\": 2,\n \"fillOpacity\": 0.03,\n \"gradientMode\": \"none\",\n \"stack\": \"off\",\n \"scaleDistribution\": {\n \"type\": \"linear\"\n },\n \"showPoints\": \"none\",\n \"pointSize\": 5\n },\n \"overrides\": [\n {\n \"matcher\": {\n \"id\": \"byFrameRefID\"\n },\n \"properties\": {\n \"rightYAxisDisplay\": \"noraml\",\n \"standardOptions\": {\n \"util\": \"bitsIEC\"\n }\n }\n }\n ]\n },\n {\n \"type\": \"timeseries\",\n \"id\": \"1ab67f48-ff24-42e5-b532-a1496ae9b2b6\",\n \"layout\": {\n \"h\": 5,\n \"w\": 12,\n \"x\": 12,\n \"y\": 16,\n \"i\": \"5cab201a-9ea9-420b-90aa-48f8e00dccca\",\n \"isResizable\": true\n },\n \"version\": \"3.1.0\",\n \"datasourceCate\": \"prometheus\",\n \"datasourceValue\": \"${prom}\",\n \"targets\": [\n {\n \"expr\": \"rate(net_bytes_sent{ident=~\\\"$ident\\\"}[$__rate_interval])*8\",\n \"legend\": \"{{ident}} {{interface}}\",\n \"maxDataPoints\": 480,\n \"refId\": \"B\",\n \"step\": 15\n }\n ],\n \"transformations\": [\n {\n \"id\": \"organize\",\n \"options\": {}\n }\n ],\n \"name\": \"网络流量-出向\",\n \"maxPerRow\": 4,\n \"options\": {\n \"tooltip\": {\n \"mode\": \"all\",\n \"sort\": \"desc\"\n },\n \"legend\": {\n \"displayMode\": \"hidden\",\n \"placement\": \"bottom\",\n \"behaviour\": \"showItem\",\n \"selectMode\": \"single\"\n },\n \"standardOptions\": {\n \"util\": \"bitsSecSI\",\n \"decimals\": 2\n },\n \"thresholds\": {\n \"mode\": \"absolute\",\n \"steps\": [\n {\n \"color\": \"#634CD9\",\n \"value\": null,\n \"type\": \"base\"\n }\n ]\n },\n \"thresholdsStyle\": {\n \"mode\": \"dashed\"\n }\n },\n \"custom\": {\n \"drawStyle\": \"lines\",\n \"lineInterpolation\": \"smooth\",\n \"spanNulls\": false,\n \"lineWidth\": 2,\n \"fillOpacity\": 0.03,\n \"gradientMode\": \"none\",\n \"stack\": \"off\",\n \"scaleDistribution\": {\n \"type\": \"linear\"\n },\n \"showPoints\": \"none\",\n \"pointSize\": 5\n },\n \"overrides\": [\n {\n \"matcher\": {\n \"id\": \"byFrameRefID\"\n },\n \"properties\": {\n \"rightYAxisDisplay\": \"noraml\",\n \"standardOptions\": {\n \"util\": \"bitsIEC\"\n }\n }\n }\n ]\n },\n {\n \"type\": \"timeseries\",\n \"id\": \"cfb80689-de7b-47fb-9155-052b796dd7f5\",\n \"layout\": {\n \"h\": 5,\n \"w\": 12,\n \"x\": 0,\n \"y\": 21,\n \"i\": \"cfb80689-de7b-47fb-9155-052b796dd7f5\",\n \"isResizable\": true\n },\n \"version\": \"3.1.0\",\n \"datasourceCate\": \"prometheus\",\n \"datasourceValue\": \"${prom}\",\n \"targets\": [\n {\n \"expr\": \"netstat_tcp_tw{ident=~\\\"$ident\\\"}\",\n \"maxDataPoints\": 480,\n \"refId\": \"B\",\n \"step\": 15\n }\n ],\n \"transformations\": [\n {\n \"id\": \"organize\",\n \"options\": {}\n }\n ],\n \"name\": \"Time Wait 状态的连接数\",\n \"description\": \"\",\n \"maxPerRow\": 4,\n \"options\": {\n \"tooltip\": {\n \"mode\": \"all\",\n \"sort\": \"desc\"\n },\n \"legend\": {\n \"displayMode\": \"hidden\",\n \"placement\": \"bottom\",\n \"behaviour\": \"showItem\",\n \"selectMode\": \"single\"\n },\n \"standardOptions\": {\n \"decimals\": 0\n },\n \"thresholds\": {\n \"mode\": \"absolute\",\n \"steps\": [\n {\n \"color\": \"#634CD9\",\n \"value\": null,\n \"type\": \"base\"\n }\n ]\n },\n \"thresholdsStyle\": {\n \"mode\": \"dashed\"\n }\n },\n \"custom\": {\n \"drawStyle\": \"lines\",\n \"lineInterpolation\": \"smooth\",\n \"spanNulls\": false,\n \"lineWidth\": 2,\n \"fillOpacity\": 0.03,\n \"gradientMode\": \"none\",\n \"stack\": \"off\",\n \"scaleDistribution\": {\n \"type\": \"linear\"\n },\n \"showPoints\": \"none\",\n \"pointSize\": 5\n },\n \"overrides\": [\n {\n \"matcher\": {\n \"id\": \"byFrameRefID\"\n },\n \"properties\": {\n \"rightYAxisDisplay\": \"off\"\n }\n }\n ]\n },\n {\n \"type\": \"timeseries\",\n \"id\": \"9634c41c-e124-4d7f-9406-0f86753e8d70\",\n \"layout\": {\n \"h\": 5,\n \"w\": 6,\n \"x\": 12,\n \"y\": 21,\n \"i\": \"9634c41c-e124-4d7f-9406-0f86753e8d70\",\n \"isResizable\": true\n },\n \"version\": \"3.1.0\",\n \"datasourceCate\": \"prometheus\",\n \"datasourceValue\": \"${prom}\",\n \"targets\": [\n {\n \"expr\": \"rate(net_err_in{ident=~\\\"$ident\\\"}[$__rate_interval])\",\n \"legend\": \"{{ident}}-{{interface}}-in\",\n \"maxDataPoints\": 480,\n \"refId\": \"A\",\n \"step\": 15\n },\n {\n \"expr\": \"rate(net_err_out{ident=~\\\"$ident\\\"}[$__rate_interval])\",\n \"legend\": \"{{ident}}-{{interface}}-out\",\n \"maxDataPoints\": 480,\n \"refId\": \"B\",\n \"step\": 15\n }\n ],\n \"transformations\": [\n {\n \"id\": \"organize\",\n \"options\": {}\n }\n ],\n \"name\": \"网络错包\",\n \"maxPerRow\": 4,\n \"options\": {\n \"tooltip\": {\n \"mode\": \"all\",\n \"sort\": \"desc\"\n },\n \"legend\": {\n \"displayMode\": \"hidden\",\n \"placement\": \"bottom\",\n \"behaviour\": \"showItem\",\n \"selectMode\": \"single\"\n },\n \"standardOptions\": {\n \"decimals\": 6\n },\n \"thresholds\": {\n \"mode\": \"absolute\",\n \"steps\": [\n {\n \"color\": \"#634CD9\",\n \"value\": null,\n \"type\": \"base\"\n }\n ]\n },\n \"thresholdsStyle\": {\n \"mode\": \"dashed\"\n }\n },\n \"custom\": {\n \"drawStyle\": \"lines\",\n \"lineInterpolation\": \"smooth\",\n \"spanNulls\": false,\n \"lineWidth\": 2,\n \"fillOpacity\": 0.06,\n \"gradientMode\": \"none\",\n \"stack\": \"off\",\n \"scaleDistribution\": {\n \"type\": \"linear\"\n },\n \"showPoints\": \"none\",\n \"pointSize\": 5\n },\n \"overrides\": [\n {\n \"matcher\": {\n \"id\": \"byFrameRefID\"\n },\n \"properties\": {\n \"rightYAxisDisplay\": \"off\"\n }\n }\n ]\n },\n {\n \"type\": \"timeseries\",\n \"id\": \"4123f4c1-bf8e-400e-b267-8d7f6a92691a\",\n \"layout\": {\n \"h\": 5,\n \"w\": 6,\n \"x\": 18,\n \"y\": 21,\n \"i\": \"4123f4c1-bf8e-400e-b267-8d7f6a92691a\",\n \"isResizable\": true\n },\n \"version\": \"3.1.0\",\n \"datasourceCate\": \"prometheus\",\n \"datasourceValue\": \"${prom}\",\n \"targets\": [\n {\n \"expr\": \"rate(net_drop_in{ident=~\\\"$ident\\\"}[$__rate_interval])\",\n \"legend\": \"{{ident}}-{{interface}}-in\",\n \"maxDataPoints\": 480,\n \"refId\": \"A\",\n \"step\": 15\n },\n {\n \"expr\": \"rate(net_drop_out{ident=~\\\"$ident\\\"}[$__rate_interval])\",\n \"legend\": \"{{ident}}-{{interface}}-out\",\n \"maxDataPoints\": 480,\n \"refId\": \"B\",\n \"step\": 15\n }\n ],\n \"transformations\": [\n {\n \"id\": \"organize\",\n \"options\": {}\n }\n ],\n \"name\": \"网络丢包\",\n \"maxPerRow\": 4,\n \"options\": {\n \"tooltip\": {\n \"mode\": \"all\",\n \"sort\": \"desc\"\n },\n \"legend\": {\n \"displayMode\": \"hidden\",\n \"placement\": \"bottom\",\n \"behaviour\": \"showItem\",\n \"selectMode\": \"single\"\n },\n \"standardOptions\": {\n \"decimals\": 6\n },\n \"thresholds\": {\n \"mode\": \"absolute\",\n \"steps\": [\n {\n \"color\": \"#634CD9\",\n \"value\": null,\n \"type\": \"base\"\n }\n ]\n },\n \"thresholdsStyle\": {\n \"mode\": \"dashed\"\n }\n },\n \"custom\": {\n \"drawStyle\": \"lines\",\n \"lineInterpolation\": \"smooth\",\n \"spanNulls\": false,\n \"lineWidth\": 2,\n \"fillOpacity\": 0.06,\n \"gradientMode\": \"none\",\n \"stack\": \"off\",\n \"scaleDistribution\": {\n \"type\": \"linear\"\n },\n \"showPoints\": \"none\",\n \"pointSize\": 5\n },\n \"overrides\": [\n {\n \"matcher\": {\n \"id\": \"byFrameRefID\"\n },\n \"properties\": {\n \"rightYAxisDisplay\": \"off\"\n }\n }\n ]\n },\n {\n \"collapsed\": true,\n \"id\": \"aabb8263-1a9b-43fb-bee1-6c532f5012a3\",\n \"layout\": {\n \"h\": 1,\n \"w\": 24,\n \"x\": 0,\n \"y\": 26,\n \"i\": \"aabb8263-1a9b-43fb-bee1-6c532f5012a3\",\n \"isResizable\": false\n },\n \"name\": \"其他指标\",\n \"panels\": [],\n \"type\": \"row\"\n },\n {\n \"type\": \"timeseries\",\n \"id\": \"1b4da538-29d4-4c58-b3f4-773fabb8616c\",\n \"layout\": {\n \"h\": 5,\n \"w\": 12,\n \"x\": 0,\n \"y\": 27,\n \"i\": \"1b4da538-29d4-4c58-b3f4-773fabb8616c\",\n \"isResizable\": true\n },\n \"version\": \"3.1.0\",\n \"datasourceCate\": \"prometheus\",\n \"datasourceValue\": \"${prom}\",\n \"targets\": [\n {\n \"expr\": \"disk_device_error{ident=~\\\"$ident\\\"}\",\n \"legend\": \"{{ident}} {{path}}\",\n \"maxDataPoints\": 480,\n \"refId\": \"A\",\n \"step\": 15\n }\n ],\n \"transformations\": [\n {\n \"id\": \"organize\",\n \"options\": {}\n }\n ],\n \"name\": \"硬盘出错,0是正常,非0是异常\",\n \"maxPerRow\": 4,\n \"options\": {\n \"tooltip\": {\n \"mode\": \"all\",\n \"sort\": \"desc\"\n },\n \"legend\": {\n \"displayMode\": \"hidden\",\n \"placement\": \"bottom\",\n \"behaviour\": \"showItem\",\n \"selectMode\": \"single\"\n },\n \"standardOptions\": {\n \"decimals\": 0\n },\n \"thresholds\": {\n \"mode\": \"absolute\",\n \"steps\": [\n {\n \"color\": \"rgba(44, 157, 61, 1)\",\n \"value\": null,\n \"type\": \"base\"\n }\n ]\n },\n \"thresholdsStyle\": {\n \"mode\": \"dashed\"\n }\n },\n \"custom\": {\n \"drawStyle\": \"lines\",\n \"lineInterpolation\": \"smooth\",\n \"spanNulls\": false,\n \"lineWidth\": 2,\n \"fillOpacity\": 0.03,\n \"gradientMode\": \"none\",\n \"stack\": \"off\",\n \"scaleDistribution\": {\n \"type\": \"linear\"\n },\n \"showPoints\": \"none\",\n \"pointSize\": 5\n },\n \"overrides\": [\n {\n \"matcher\": {\n \"id\": \"byFrameRefID\"\n },\n \"properties\": {\n \"rightYAxisDisplay\": \"off\"\n }\n }\n ]\n },\n {\n \"type\": \"timeseries\",\n \"id\": \"0f713e5f-49cf-405a-9922-3b84cded33d4\",\n \"layout\": {\n \"h\": 5,\n \"w\": 12,\n \"x\": 12,\n \"y\": 27,\n \"i\": \"dbfdda49-de73-48ac-a224-b68a1ee61752\",\n \"isResizable\": true\n },\n \"version\": \"3.1.0\",\n \"datasourceCate\": \"prometheus\",\n \"datasourceValue\": \"${prom}\",\n \"targets\": [\n {\n \"expr\": \"100 * conntrack_ip_conntrack_count{ident=~\\\"$ident\\\"} / conntrack_ip_conntrack_max{ident=~\\\"$ident\\\"}\",\n \"legend\": \"ip_conntrack {{ident}}\",\n \"maxDataPoints\": 480,\n \"refId\": \"A\",\n \"step\": 15\n },\n {\n \"__mode__\": \"__query__\",\n \"expr\": \"100 * conntrack_nf_conntrack_count{ident=~\\\"$ident\\\"} / conntrack_nf_conntrack_max{ident=~\\\"$ident\\\"}\",\n \"legend\": \"nf_conntrack {{ident}}\",\n \"maxDataPoints\": 480,\n \"refId\": \"B\",\n \"step\": 15\n }\n ],\n \"transformations\": [\n {\n \"id\": \"organize\",\n \"options\": {}\n }\n ],\n \"name\": \"Conntrack使用率\",\n \"description\": \"`dmesg -T` 有时看到 conntrack table full 的报错,大概率就是 conntrack 限制太小了,需要调整内核参数\",\n \"maxPerRow\": 4,\n \"options\": {\n \"tooltip\": {\n \"mode\": \"all\",\n \"sort\": \"desc\"\n },\n \"legend\": {\n \"displayMode\": \"hidden\",\n \"placement\": \"bottom\",\n \"behaviour\": \"showItem\",\n \"selectMode\": \"single\"\n },\n \"standardOptions\": {\n \"util\": \"percent\",\n \"decimals\": 6\n },\n \"thresholds\": {\n \"mode\": \"absolute\",\n \"steps\": [\n {\n \"color\": \"rgba(44, 157, 61, 1)\",\n \"value\": null,\n \"type\": \"base\"\n }\n ]\n },\n \"thresholdsStyle\": {\n \"mode\": \"dashed\"\n }\n },\n \"custom\": {\n \"drawStyle\": \"lines\",\n \"lineInterpolation\": \"smooth\",\n \"spanNulls\": false,\n \"lineWidth\": 2,\n \"fillOpacity\": 0.03,\n \"gradientMode\": \"none\",\n \"stack\": \"off\",\n \"scaleDistribution\": {\n \"type\": \"linear\"\n },\n \"showPoints\": \"none\",\n \"pointSize\": 5\n },\n \"overrides\": [\n {\n \"matcher\": {\n \"id\": \"byFrameRefID\"\n },\n \"properties\": {\n \"rightYAxisDisplay\": \"off\"\n }\n }\n ]\n },\n {\n \"type\": \"timeseries\",\n \"id\": \"7c90380f-5ab6-4aa5-9070-f604985a0389\",\n \"layout\": {\n \"h\": 5,\n \"w\": 12,\n \"x\": 0,\n \"y\": 32,\n \"i\": \"e7117d7c-b946-49fa-bc49-2afb0d2b3a44\",\n \"isResizable\": true\n },\n \"version\": \"3.1.0\",\n \"datasourceCate\": \"prometheus\",\n \"datasourceValue\": \"${prom}\",\n \"targets\": [\n {\n \"expr\": \"processes_total{ident=~\\\"$ident\\\"}\",\n \"legend\": \"\",\n \"maxDataPoints\": 480,\n \"refId\": \"A\",\n \"step\": 15\n }\n ],\n \"transformations\": [\n {\n \"id\": \"organize\",\n \"options\": {}\n }\n ],\n \"name\": \"Process 总量\",\n \"maxPerRow\": 4,\n \"options\": {\n \"tooltip\": {\n \"mode\": \"all\",\n \"sort\": \"desc\"\n },\n \"legend\": {\n \"displayMode\": \"hidden\",\n \"placement\": \"bottom\",\n \"behaviour\": \"showItem\",\n \"selectMode\": \"single\"\n },\n \"standardOptions\": {\n \"decimals\": 0\n },\n \"thresholds\": {\n \"mode\": \"absolute\",\n \"steps\": [\n {\n \"color\": \"rgba(44, 157, 61, 1)\",\n \"value\": null,\n \"type\": \"base\"\n }\n ]\n },\n \"thresholdsStyle\": {\n \"mode\": \"dashed\"\n }\n },\n \"custom\": {\n \"drawStyle\": \"lines\",\n \"lineInterpolation\": \"smooth\",\n \"spanNulls\": false,\n \"lineWidth\": 2,\n \"fillOpacity\": 0.03,\n \"gradientMode\": \"none\",\n \"stack\": \"off\",\n \"scaleDistribution\": {\n \"type\": \"linear\"\n },\n \"showPoints\": \"none\",\n \"pointSize\": 5\n },\n \"overrides\": [\n {\n \"matcher\": {\n \"id\": \"byFrameRefID\"\n },\n \"properties\": {\n \"rightYAxisDisplay\": \"off\"\n }\n }\n ]\n },\n {\n \"type\": \"timeseries\",\n \"id\": \"3334c222-dd92-49eb-9744-4ce0f59031e4\",\n \"layout\": {\n \"h\": 5,\n \"w\": 12,\n \"x\": 12,\n \"y\": 32,\n \"i\": \"0ecb9f26-4c4d-40d7-9934-5116e3ffa51a\",\n \"isResizable\": true\n },\n \"version\": \"3.1.0\",\n \"datasourceCate\": \"prometheus\",\n \"datasourceValue\": \"${prom}\",\n \"targets\": [\n {\n \"expr\": \"procstat_rlimit_num_fds_hard{ident=~\\\"$ident\\\"}\",\n \"legend\": \"\",\n \"maxDataPoints\": 480,\n \"refId\": \"A\",\n \"step\": 15\n }\n ],\n \"transformations\": [\n {\n \"id\": \"organize\",\n \"options\": {}\n }\n ],\n \"name\": \"进程句柄数限制(低于4096要注意)\",\n \"description\": \"以现在的硬件配置,通常句柄的 ulimit 应该比较大,如果低于 4096,大概率是忘记修改配置了,需要注意。这个数据是 Categraf 的 procstat 插件采集的。\",\n \"maxPerRow\": 4,\n \"options\": {\n \"tooltip\": {\n \"mode\": \"all\",\n \"sort\": \"desc\"\n },\n \"legend\": {\n \"displayMode\": \"hidden\",\n \"placement\": \"bottom\",\n \"behaviour\": \"showItem\",\n \"selectMode\": \"single\"\n },\n \"standardOptions\": {\n \"decimals\": 0\n },\n \"thresholds\": {\n \"mode\": \"absolute\",\n \"steps\": [\n {\n \"color\": \"rgba(44, 157, 61, 1)\",\n \"value\": null,\n \"type\": \"base\"\n }\n ]\n },\n \"thresholdsStyle\": {\n \"mode\": \"dashed\"\n }\n },\n \"custom\": {\n \"drawStyle\": \"lines\",\n \"lineInterpolation\": \"smooth\",\n \"spanNulls\": false,\n \"lineWidth\": 2,\n \"fillOpacity\": 0.03,\n \"gradientMode\": \"none\",\n \"stack\": \"off\",\n \"scaleDistribution\": {\n \"type\": \"linear\"\n },\n \"showPoints\": \"none\",\n \"pointSize\": 5\n },\n \"overrides\": [\n {\n \"matcher\": {\n \"id\": \"byFrameRefID\"\n },\n \"properties\": {\n \"rightYAxisDisplay\": \"off\"\n }\n }\n ]\n },\n {\n \"type\": \"timeseries\",\n \"id\": \"c3ee640f-e654-4fc7-aa2a-0dd8e9de67cb\",\n \"layout\": {\n \"h\": 5,\n \"w\": 12,\n \"x\": 0,\n \"y\": 37,\n \"i\": \"423adbbf-8c23-45ab-b7d5-9a81b72291f1\",\n \"isResizable\": true\n },\n \"version\": \"3.1.0\",\n \"datasourceCate\": \"prometheus\",\n \"datasourceValue\": \"${prom}\",\n \"targets\": [\n {\n \"expr\": \"ntp_offset_ms{ident=~\\\"$ident\\\"}\",\n \"legend\": \"\",\n \"maxDataPoints\": 480,\n \"refId\": \"A\",\n \"step\": 15\n }\n ],\n \"transformations\": [\n {\n \"id\": \"organize\",\n \"options\": {}\n }\n ],\n \"name\": \"NTP时间偏移\",\n \"maxPerRow\": 4,\n \"options\": {\n \"tooltip\": {\n \"mode\": \"all\",\n \"sort\": \"desc\"\n },\n \"legend\": {\n \"displayMode\": \"hidden\",\n \"placement\": \"bottom\",\n \"behaviour\": \"showItem\",\n \"selectMode\": \"single\"\n },\n \"standardOptions\": {\n \"util\": \"milliseconds\",\n \"decimals\": 2\n },\n \"thresholds\": {\n \"mode\": \"absolute\",\n \"steps\": [\n {\n \"color\": \"rgba(44, 157, 61, 1)\",\n \"value\": null,\n \"type\": \"base\"\n }\n ]\n },\n \"thresholdsStyle\": {\n \"mode\": \"dashed\"\n }\n },\n \"custom\": {\n \"drawStyle\": \"lines\",\n \"lineInterpolation\": \"smooth\",\n \"spanNulls\": false,\n \"lineWidth\": 2,\n \"fillOpacity\": 0.03,\n \"gradientMode\": \"none\",\n \"stack\": \"off\",\n \"scaleDistribution\": {\n \"type\": \"linear\"\n },\n \"showPoints\": \"none\",\n \"pointSize\": 5\n },\n \"overrides\": [\n {\n \"matcher\": {\n \"id\": \"byFrameRefID\"\n },\n \"properties\": {\n \"rightYAxisDisplay\": \"off\"\n }\n }\n ]\n },\n {\n \"type\": \"timeseries\",\n \"id\": \"9bb8d5ef-dc4e-419f-8e95-6dbb97b2afb6\",\n \"layout\": {\n \"h\": 5,\n \"w\": 12,\n \"x\": 12,\n \"y\": 37,\n \"i\": \"e97f1934-26e8-4bf3-be21-95307443f146\",\n \"isResizable\": true\n },\n \"version\": \"3.1.0\",\n \"datasourceCate\": \"prometheus\",\n \"datasourceValue\": \"${prom}\",\n \"targets\": [\n {\n \"expr\": \"linux_sysctl_fs_file_nr{ident=~\\\"$ident\\\"}/linux_sysctl_fs_file_max{ident=~\\\"$ident\\\"} * 100\",\n \"legend\": \"\",\n \"maxDataPoints\": 480,\n \"refId\": \"A\",\n \"step\": 15\n }\n ],\n \"transformations\": [\n {\n \"id\": \"organize\",\n \"options\": {}\n }\n ],\n \"name\": \"操作系统文件句柄使用率\",\n \"description\": \"\",\n \"maxPerRow\": 4,\n \"options\": {\n \"tooltip\": {\n \"mode\": \"all\",\n \"sort\": \"desc\"\n },\n \"legend\": {\n \"displayMode\": \"hidden\",\n \"placement\": \"bottom\",\n \"behaviour\": \"showItem\",\n \"selectMode\": \"single\"\n },\n \"standardOptions\": {\n \"util\": \"percent\",\n \"decimals\": 0\n },\n \"thresholds\": {\n \"mode\": \"absolute\",\n \"steps\": [\n {\n \"color\": \"rgba(44, 157, 61, 1)\",\n \"value\": null,\n \"type\": \"base\"\n }\n ]\n },\n \"thresholdsStyle\": {\n \"mode\": \"dashed\"\n }\n },\n \"custom\": {\n \"drawStyle\": \"lines\",\n \"lineInterpolation\": \"smooth\",\n \"spanNulls\": false,\n \"lineWidth\": 2,\n \"fillOpacity\": 0.03,\n \"gradientMode\": \"none\",\n \"stack\": \"off\",\n \"scaleDistribution\": {\n \"type\": \"linear\"\n },\n \"showPoints\": \"none\",\n \"pointSize\": 5\n },\n \"overrides\": [\n {\n \"matcher\": {\n \"id\": \"byFrameRefID\"\n },\n \"properties\": {\n \"rightYAxisDisplay\": \"off\"\n }\n }\n ]\n }\n ],\n \"var\": [\n {\n \"definition\": \"prometheus\",\n \"label\": \"数据源\",\n \"name\": \"prom\",\n \"type\": \"datasource\"\n },\n {\n \"name\": \"ident\",\n \"label\": \"所有机器\",\n \"type\": \"query\",\n \"hide\": false,\n \"multi\": true,\n \"allOption\": true,\n \"datasource\": {\n \"cate\": \"prometheus\",\n \"value\": \"${prom}\"\n },\n \"definition\": \"label_values(system_uptime, ident)\"\n }\n ],\n \"version\": \"3.0.0\"\n }\n}"
},
{
"path": "integrations/Linux/dashboards/categraf-overview.json",
"content": "{\n \"name\": \"机器台账表格视图(使用 Categraf 作为采集器)\",\n \"tags\": \"Categraf\",\n \"ident\": \"\",\n \"uuid\": 1717556327742611000,\n \"configs\": {\n \"links\": [\n {\n \"targetBlank\": true,\n \"title\": \"n9e\",\n \"url\": \"https://n9e.github.io/\"\n },\n {\n \"targetBlank\": true,\n \"title\": \"author\",\n \"url\": \"http://flashcat.cloud/\"\n }\n ],\n \"panels\": [\n {\n \"type\": \"hexbin\",\n \"id\": \"21b8b3ab-26aa-47cb-b814-f310f2d143aa\",\n \"layout\": {\n \"h\": 5,\n \"i\": \"21b8b3ab-26aa-47cb-b814-f310f2d143aa\",\n \"isResizable\": true,\n \"w\": 12,\n \"x\": 0,\n \"y\": 0\n },\n \"version\": \"3.1.0\",\n \"datasourceCate\": \"prometheus\",\n \"datasourceValue\": \"${prom}\",\n \"targets\": [\n {\n \"expr\": \"topk(100, cpu_usage_active{cpu=\\\"cpu-total\\\", ident=~\\\"$ident\\\"})\",\n \"instant\": true,\n \"legend\": \"{{ident}}\",\n \"maxDataPoints\": 480,\n \"refId\": \"A\",\n \"step\": 15\n }\n ],\n \"transformations\": [\n {\n \"id\": \"organize\",\n \"options\": {}\n }\n ],\n \"name\": \"CPU利用率\",\n \"maxPerRow\": 4,\n \"custom\": {\n \"textMode\": \"valueAndName\",\n \"calc\": \"lastNotNull\",\n \"valueField\": \"Value\",\n \"colorRange\": [\n \"thresholds\"\n ],\n \"detailUrl\": \"/components/dashboard/detail?__uuid__=1737103014612000&ident=${__field.labels.ident}\"\n },\n \"options\": {\n \"thresholds\": {\n \"steps\": [\n {\n \"color\": \"#ef3c3c\",\n \"value\": 95,\n \"type\": \"\"\n },\n {\n \"color\": \"#ff656b\",\n \"type\": \"\",\n \"value\": 85\n },\n {\n \"color\": \"#ffae39\",\n \"type\": \"\",\n \"value\": 75\n },\n {\n \"color\": \"#2c9d3d\",\n \"type\": \"base\",\n \"value\": null\n }\n ]\n },\n \"standardOptions\": {\n \"util\": \"percent\",\n \"decimals\": 2\n }\n }\n },\n {\n \"type\": \"hexbin\",\n \"id\": \"86d4a502-21f7-4981-9b38-ed8e696b6f49\",\n \"layout\": {\n \"h\": 5,\n \"i\": \"872b2040-c5b0-43fe-92c7-e37cb77edffc\",\n \"isResizable\": true,\n \"w\": 12,\n \"x\": 12,\n \"y\": 0\n },\n \"version\": \"3.1.0\",\n \"datasourceCate\": \"prometheus\",\n \"datasourceValue\": \"${prom}\",\n \"targets\": [\n {\n \"expr\": \"topk(100, mem_used_percent{ident=~\\\"$ident\\\"})\",\n \"instant\": true,\n \"legend\": \"{{ident}}\",\n \"maxDataPoints\": 480,\n \"refId\": \"A\",\n \"step\": 15\n }\n ],\n \"transformations\": [\n {\n \"id\": \"organize\",\n \"options\": {}\n }\n ],\n \"name\": \"内存利用率\",\n \"maxPerRow\": 4,\n \"custom\": {\n \"textMode\": \"valueAndName\",\n \"calc\": \"lastNotNull\",\n \"valueField\": \"Value\",\n \"colorRange\": [\n \"thresholds\"\n ],\n \"detailUrl\": \"/components/dashboard/detail?__uuid__=1737103014612000&ident=${__field.labels.ident}\"\n },\n \"options\": {\n \"thresholds\": {\n \"steps\": [\n {\n \"color\": \"#ef3c3c\",\n \"value\": 95,\n \"type\": \"\"\n },\n {\n \"color\": \"#ff656b\",\n \"type\": \"\",\n \"value\": 85\n },\n {\n \"color\": \"#ffae39\",\n \"type\": \"\",\n \"value\": 75\n },\n {\n \"color\": \"#2c9d3d\",\n \"type\": \"base\",\n \"value\": null\n }\n ]\n },\n \"standardOptions\": {\n \"util\": \"percent\",\n \"decimals\": 2\n }\n }\n },\n {\n \"type\": \"table\",\n \"id\": \"77bf513a-8504-4d33-9efe-75aaf9abc9e4\",\n \"layout\": {\n \"h\": 11,\n \"i\": \"77bf513a-8504-4d33-9efe-75aaf9abc9e4\",\n \"isResizable\": true,\n \"w\": 24,\n \"x\": 0,\n \"y\": 5\n },\n \"version\": \"3.1.0\",\n \"datasourceCate\": \"prometheus\",\n \"datasourceValue\": \"${prom}\",\n \"targets\": [\n {\n \"expr\": \"avg(cpu_usage_active{cpu=\\\"cpu-total\\\", ident=~\\\"$ident\\\"}) by (ident)\",\n \"legend\": \"CPU使用率\",\n \"maxDataPoints\": 240,\n \"refId\": \"A\"\n },\n {\n \"expr\": \"avg(mem_used_percent{ident=~\\\"$ident\\\"}) by (ident)\",\n \"legend\": \"内存使用率\",\n \"maxDataPoints\": 240,\n \"refId\": \"B\"\n },\n {\n \"expr\": \"avg(mem_total{ident=~\\\"$ident\\\"}) by (ident)\",\n \"legend\": \"总内存\",\n \"maxDataPoints\": 240,\n \"refId\": \"C\"\n },\n {\n \"expr\": \"avg(disk_used_percent{ident=~\\\"$ident\\\",path=\\\"/\\\"}) by (ident)\",\n \"legend\": \"根分区使用率\",\n \"maxDataPoints\": 240,\n \"refId\": \"D\"\n }\n ],\n \"transformations\": [\n {\n \"id\": \"organize\",\n \"options\": {\n \"renameByName\": {\n \"ident\": \"机器\"\n }\n }\n }\n ],\n \"name\": \"机器列表\",\n \"maxPerRow\": 4,\n \"custom\": {\n \"showHeader\": true,\n \"colorMode\": \"background\",\n \"nowrap\": false,\n \"tableLayout\": \"fixed\",\n \"calc\": \"lastNotNull\",\n \"displayMode\": \"labelValuesToRows\",\n \"aggrDimension\": \"ident\",\n \"sortColumn\": \"ident\",\n \"sortOrder\": \"ascend\",\n \"pageLimit\": 500,\n \"linkMode\": \"appendLinkColumn\",\n \"links\": [\n {\n \"targetBlank\": true,\n \"title\": \"详情\",\n \"url\": \"/components/dashboard/detail?__uuid__=1737103014612000&ident=${__field.labels.ident}\"\n }\n ]\n },\n \"options\": {\n \"standardOptions\": {\n \"decimals\": 2\n }\n },\n \"overrides\": [\n {\n \"matcher\": {\n \"id\": \"byFrameRefID\",\n \"value\": \"A\"\n },\n \"properties\": {\n \"standardOptions\": {\n \"util\": \"percent\",\n \"decimals\": 2\n },\n \"valueMappings\": [\n {\n \"match\": {\n \"to\": 65\n },\n \"result\": {\n \"color\": \"#2c9d3d\"\n },\n \"type\": \"range\"\n },\n {\n \"match\": {\n \"to\": 90\n },\n \"result\": {\n \"color\": \"#ff656b\"\n },\n \"type\": \"range\"\n },\n {\n \"match\": {\n \"from\": 90\n },\n \"result\": {\n \"color\": \"#f50505\"\n },\n \"type\": \"range\"\n }\n ]\n }\n },\n {\n \"matcher\": {\n \"id\": \"byFrameRefID\",\n \"value\": \"B\"\n },\n \"properties\": {\n \"standardOptions\": {\n \"util\": \"percent\",\n \"decimals\": 2\n },\n \"valueMappings\": [\n {\n \"match\": {\n \"to\": 65\n },\n \"result\": {\n \"color\": \"#2c9d3d\"\n },\n \"type\": \"range\"\n },\n {\n \"match\": {\n \"to\": 90\n },\n \"result\": {\n \"color\": \"#ff656b\"\n },\n \"type\": \"range\"\n },\n {\n \"match\": {\n \"from\": 90\n },\n \"result\": {\n \"color\": \"#fa0a0a\"\n },\n \"type\": \"range\"\n }\n ]\n },\n \"type\": \"special\"\n },\n {\n \"matcher\": {\n \"id\": \"byFrameRefID\",\n \"value\": \"C\"\n },\n \"properties\": {\n \"standardOptions\": {\n \"decimals\": 2,\n \"util\": \"bytesIEC\"\n },\n \"valueMappings\": []\n },\n \"type\": \"special\"\n },\n {\n \"matcher\": {\n \"id\": \"byFrameRefID\",\n \"value\": \"D\"\n },\n \"properties\": {\n \"standardOptions\": {\n \"decimals\": 2,\n \"util\": \"percent\"\n },\n \"valueMappings\": [\n {\n \"match\": {\n \"to\": 90\n },\n \"result\": {\n \"color\": \"#2c9d3d\"\n },\n \"type\": \"range\"\n },\n {\n \"match\": {\n \"from\": 90\n },\n \"result\": {\n \"color\": \"#ff656b\"\n },\n \"type\": \"range\"\n }\n ]\n },\n \"type\": \"special\"\n }\n ]\n }\n ],\n \"var\": [\n {\n \"name\": \"prom\",\n \"label\": \"数据源\",\n \"type\": \"datasource\",\n \"hide\": false,\n \"definition\": \"prometheus\"\n },\n {\n \"name\": \"ident\",\n \"label\": \"机器\",\n \"type\": \"query\",\n \"hide\": false,\n \"multi\": true,\n \"allOption\": true,\n \"allValue\": \".*\",\n \"datasource\": {\n \"cate\": \"prometheus\",\n \"value\": \"${prom}\"\n },\n \"definition\": \"label_values(system_load1,ident)\"\n }\n ],\n \"version\": \"3.0.0\"\n }\n}"
},
{
"path": "integrations/Linux/dashboards/categraf-processes.json",
"content": "{\n \"name\": \"机器进程数量统计(使用 Categraf 作为采集器)\",\n \"tags\": \"Categraf\",\n \"ident\": \"\",\n \"uuid\": 1717556327738575000,\n \"configs\": {\n \"panels\": [\n {\n \"custom\": {\n \"calc\": \"lastNotNull\",\n \"serieWidth\": 20,\n \"sortOrder\": \"desc\"\n },\n \"datasourceCate\": \"prometheus\",\n \"datasourceValue\": \"${Datasource}\",\n \"id\": \"adc3f1d3-6d0d-4c1e-80ca-5b6d8103bac5\",\n \"layout\": {\n \"h\": 8,\n \"i\": \"adc3f1d3-6d0d-4c1e-80ca-5b6d8103bac5\",\n \"isResizable\": true,\n \"w\": 12,\n \"x\": 0,\n \"y\": 0\n },\n \"name\": \"Running Processes\",\n \"options\": {\n \"standardOptions\": {},\n \"valueMappings\": [\n {\n \"match\": {\n \"from\": 50\n },\n \"result\": {\n \"color\": \"#f10808\"\n },\n \"type\": \"range\"\n }\n ],\n \"thresholds\": {\n \"mode\": \"absolute\",\n \"steps\": [\n {\n \"color\": \"#9470FF\",\n \"type\": \"base\",\n \"value\": null\n }\n ]\n }\n },\n \"targets\": [\n {\n \"expr\": \"processes_running{ident=~\\\"$ident\\\"}\",\n \"instant\": true,\n \"legend\": \"{{ident}}\",\n \"refId\": \"A\"\n }\n ],\n \"transformations\": [\n {\n \"id\": \"organize\",\n \"options\": {}\n }\n ],\n \"type\": \"barGauge\",\n \"version\": \"3.0.0\"\n },\n {\n \"custom\": {\n \"calc\": \"lastNotNull\",\n \"serieWidth\": 20,\n \"sortOrder\": \"desc\"\n },\n \"datasourceCate\": \"prometheus\",\n \"datasourceValue\": \"${Datasource}\",\n \"id\": \"659f5f75-24ca-493c-97cb-3d99abd52172\",\n \"layout\": {\n \"h\": 8,\n \"i\": \"df457bf0-17c8-4d05-a527-cfaf0f2b844c\",\n \"isResizable\": true,\n \"w\": 12,\n \"x\": 12,\n \"y\": 0\n },\n \"name\": \"Total Processes\",\n \"options\": {\n \"standardOptions\": {},\n \"valueMappings\": [\n {\n \"match\": {\n \"from\": 600\n },\n \"result\": {\n \"color\": \"#f10808\"\n },\n \"type\": \"range\"\n }\n ],\n \"thresholds\": {\n \"mode\": \"absolute\",\n \"steps\": [\n {\n \"color\": \"#9470FF\",\n \"type\": \"base\",\n \"value\": null\n }\n ]\n }\n },\n \"targets\": [\n {\n \"expr\": \"processes_total{ident=~\\\"$ident\\\"}\",\n \"instant\": true,\n \"legend\": \"{{ident}}\",\n \"refId\": \"A\"\n }\n ],\n \"transformations\": [\n {\n \"id\": \"organize\",\n \"options\": {}\n }\n ],\n \"type\": \"barGauge\",\n \"version\": \"3.0.0\"\n },\n {\n \"custom\": {\n \"calc\": \"lastNotNull\",\n \"serieWidth\": 20,\n \"sortOrder\": \"desc\"\n },\n \"datasourceCate\": \"prometheus\",\n \"datasourceValue\": \"${Datasource}\",\n \"id\": \"5e849509-1c41-44c7-85ee-d8c0adf7c623\",\n \"layout\": {\n \"h\": 8,\n \"i\": \"62291285-be84-470a-9ccc-53be7a8733fd\",\n \"isResizable\": true,\n \"w\": 12,\n \"x\": 0,\n \"y\": 8\n },\n \"name\": \"Total Threads\",\n \"options\": {\n \"standardOptions\": {},\n \"valueMappings\": [\n {\n \"match\": {\n \"from\": 2000\n },\n \"result\": {\n \"color\": \"#ff8286\"\n },\n \"type\": \"range\"\n },\n {\n \"match\": {\n \"from\": 4000\n },\n \"result\": {\n \"color\": \"#f30909\"\n },\n \"type\": \"range\"\n }\n ],\n \"thresholds\": {\n \"mode\": \"absolute\",\n \"steps\": [\n {\n \"color\": \"#9470FF\",\n \"type\": \"base\",\n \"value\": null\n }\n ]\n }\n },\n \"targets\": [\n {\n \"expr\": \"processes_total_threads{ident=~\\\"$ident\\\"}\",\n \"instant\": true,\n \"legend\": \"{{ident}}\",\n \"refId\": \"A\"\n }\n ],\n \"transformations\": [\n {\n \"id\": \"organize\",\n \"options\": {}\n }\n ],\n \"type\": \"barGauge\",\n \"version\": \"3.0.0\"\n },\n {\n \"custom\": {\n \"calc\": \"lastNotNull\",\n \"colorMode\": \"value\",\n \"columns\": [],\n \"displayMode\": \"labelsOfSeriesToRows\",\n \"showHeader\": true,\n \"sortColumn\": \"value\",\n \"sortOrder\": \"descend\"\n },\n \"datasourceCate\": \"prometheus\",\n \"datasourceValue\": \"${Datasource}\",\n \"id\": \"b2850506-6cdd-48cc-9223-70acff9212b0\",\n \"layout\": {\n \"h\": 8,\n \"i\": \"b2850506-6cdd-48cc-9223-70acff9212b0\",\n \"isResizable\": true,\n \"w\": 12,\n \"x\": 12,\n \"y\": 8\n },\n \"name\": \"SUM by Process state\",\n \"options\": {\n \"standardOptions\": {}\n },\n \"overrides\": [\n {}\n ],\n \"targets\": [\n {\n \"expr\": \"sum({__name__=~\\\"processes_sleeping|processes_dead|processes_paging|processes_total_threads|processes_total|processes_idle|processes_running|processes_zombies|processes_stopped|processes_unknown|processes_blocked\\\", ident=~\\\"$ident\\\"}) by (__name__)\",\n \"instant\": true,\n \"refId\": \"A\"\n }\n ],\n \"transformations\": [\n {\n \"id\": \"organize\",\n \"options\": {}\n }\n ],\n \"type\": \"table\",\n \"version\": \"3.0.0\"\n }\n ],\n \"var\": [\n {\n \"name\": \"Datasource\",\n \"label\": \"数据源\",\n \"type\": \"datasource\",\n \"hide\": false,\n \"definition\": \"prometheus\"\n },\n {\n \"name\": \"ident\",\n \"label\": \"机器\",\n \"type\": \"query\",\n \"hide\": false,\n \"datasource\": {\n \"cate\": \"prometheus\",\n \"value\": \"${Datasource}\"\n },\n \"definition\": \"label_values(processes_running, ident)\",\n \"multi\": true,\n \"allOption\": true\n }\n ],\n \"version\": \"3.0.0\"\n }\n}"
},
{
"path": "integrations/Linux/dashboards/categraf-table-ng.json",
"content": "{\n \"name\": \"Host Table NG\",\n \"tags\": \"Categraf\",\n \"ident\": \"\",\n \"uuid\": 1756720567064000,\n \"configs\": {\n \"var\": [\n {\n \"name\": \"prom\",\n \"label\": \"PROM\",\n \"type\": \"datasource\",\n \"hide\": false,\n \"definition\": \"prometheus\"\n },\n {\n \"name\": \"ident\",\n \"label\": \"机器\",\n \"type\": \"query\",\n \"hide\": false,\n \"datasource\": {\n \"cate\": \"prometheus\",\n \"value\": \"${prom}\"\n },\n \"definition\": \"label_values(mem_free, ident)\",\n \"multi\": true,\n \"allOption\": true\n }\n ],\n \"panels\": [\n {\n \"type\": \"tableNG\",\n \"id\": \"306cab0d-f643-4d86-94d0-248fc05fd8a8\",\n \"layout\": {\n \"h\": 10,\n \"w\": 24,\n \"x\": 0,\n \"y\": 0,\n \"i\": \"306cab0d-f643-4d86-94d0-248fc05fd8a8\",\n \"isResizable\": true\n },\n \"version\": \"3.1.0\",\n \"datasourceCate\": \"prometheus\",\n \"datasourceValue\": \"${prom}\",\n \"targets\": [\n {\n \"refId\": \"A\",\n \"expr\": \"cpu_usage_active{ident=~\\\"$ident\\\"}\",\n \"instant\": true\n },\n {\n \"expr\": \"100 - mem_available_percent{ident=~\\\"$ident\\\"}\",\n \"__mode__\": \"__query__\",\n \"refId\": \"B\",\n \"instant\": true\n },\n {\n \"expr\": \"disk_used_percent{path=\\\"/\\\", ident=~\\\"$ident\\\"}\",\n \"__mode__\": \"__query__\",\n \"refId\": \"C\",\n \"instant\": true\n },\n {\n \"expr\": \"categraf_info{ident=~\\\"$ident\\\"}\",\n \"__mode__\": \"__query__\",\n \"refId\": \"D\",\n \"instant\": true\n }\n ],\n \"transformationsNG\": [\n {\n \"id\": \"joinByField\",\n \"options\": {\n \"mode\": \"outer\",\n \"byField\": \"ident\"\n }\n },\n {\n \"id\": \"organize\",\n \"options\": {\n \"fields\": [\n \"ident\",\n \"__time_0\",\n \"__name___0\",\n \"cpu\",\n \"__value_#A\",\n \"__time_1\",\n \"__value_#B\",\n \"__time_2\",\n \"__name___2\",\n \"device\",\n \"fstype\",\n \"mode\",\n \"path\",\n \"__value_#C\",\n \"__time_3\",\n \"__name___3\",\n \"version\",\n \"__value_#D\"\n ],\n \"renameByName\": {\n \"ident\": \"机器\",\n \"__value_#A\": \"CPU利用率%\",\n \"__value_#B\": \"内存利用率%\",\n \"__value_#C\": \"根分区利用率%\",\n \"version\": \"Categraf Version\"\n },\n \"excludeByName\": {\n \"__time_0\": true,\n \"__name__\": true,\n \"agent_isp\": true,\n \"agent_region\": true,\n \"cpu\": true,\n \"env\": true,\n \"myenv\": true,\n \"__time_1\": true,\n \"__time_2\": true,\n \"__name___2\": true,\n \"device\": true,\n \"fstype\": true,\n \"mode\": true,\n \"path\": true,\n \"__name___0\": true,\n \"__value_#D\": true,\n \"__time_3\": true,\n \"__name___3\": true\n },\n \"indexByName\": {\n \"ident\": 0,\n \"version\": 1,\n \"__time_0\": 2,\n \"__name___0\": 3,\n \"agent_isp\": 4,\n \"agent_region\": 5,\n \"cpu\": 6,\n \"env\": 7,\n \"myenv\": 8,\n \"__value_#A\": 9,\n \"__time_1\": 10,\n \"__value_#B\": 11,\n \"__time_2\": 12,\n \"__name___2\": 13,\n \"device\": 14,\n \"fstype\": 15,\n \"mode\": 16,\n \"path\": 17,\n \"__value_#C\": 18,\n \"__time_3\": 19,\n \"__name___3\": 20,\n \"__value_#D\": 21\n }\n }\n }\n ],\n \"name\": \"机器表格样例\",\n \"maxPerRow\": 4,\n \"custom\": {\n \"showHeader\": true,\n \"filterable\": true,\n \"cellOptions\": {\n \"type\": \"none\",\n \"wrapText\": false\n }\n },\n \"options\": {\n \"links\": [\n {\n \"title\": \"详情\",\n \"url\": \"/components/dashboard/detail?__uuid__=1737103014612000&ident=${ident}&prom=${prom}\",\n \"targetBlank\": true\n }\n ],\n \"standardOptions\": {\n \"decimals\": 2\n }\n },\n \"overrides\": [\n {\n \"matcher\": {\n \"id\": \"byName\",\n \"value\": \"CPU利用率%\"\n },\n \"properties\": {\n \"cellOptions\": {\n \"type\": \"color-background\",\n \"mode\": \"lcd\",\n \"valueDisplayMode\": \"text\"\n },\n \"thresholds\": {\n \"mode\": \"absolute\",\n \"steps\": [\n {\n \"color\": \"rgb(255, 101, 107)\",\n \"value\": 85,\n \"type\": \"\"\n },\n {\n \"color\": \"rgba(236, 210, 69, 1)\",\n \"value\": 70,\n \"type\": \"\"\n },\n {\n \"color\": \"rgb(44, 157, 61)\",\n \"value\": null,\n \"type\": \"base\"\n }\n ]\n },\n \"valueMappings\": [],\n \"standardOptions\": {\n \"util\": \"percent\",\n \"decimals\": 2,\n \"min\": 0,\n \"max\": 100\n }\n }\n },\n {\n \"matcher\": {\n \"id\": \"byName\",\n \"value\": \"内存利用率%\"\n },\n \"properties\": {\n \"cellOptions\": {\n \"type\": \"gauge\",\n \"mode\": \"lcd\",\n \"valueDisplayMode\": \"text\"\n },\n \"thresholds\": {\n \"mode\": \"absolute\",\n \"steps\": [\n {\n \"color\": \"rgb(255, 101, 107)\",\n \"value\": 80,\n \"type\": \"\"\n },\n {\n \"color\": \"rgba(236, 210, 69, 1)\",\n \"value\": 60,\n \"type\": \"\"\n },\n {\n \"color\": \"rgb(44, 157, 61)\",\n \"value\": null,\n \"type\": \"base\"\n }\n ]\n },\n \"standardOptions\": {\n \"util\": \"percent\",\n \"decimals\": 2,\n \"min\": 0,\n \"max\": 100\n }\n }\n },\n {\n \"matcher\": {\n \"id\": \"byName\",\n \"value\": \"根分区利用率%\"\n },\n \"properties\": {\n \"cellOptions\": {\n \"type\": \"gauge\",\n \"mode\": \"basic\",\n \"valueDisplayMode\": \"text\"\n },\n \"thresholds\": {\n \"mode\": \"absolute\",\n \"steps\": [\n {\n \"color\": \"rgb(255, 101, 107)\",\n \"value\": 90,\n \"type\": \"\"\n },\n {\n \"color\": \"rgba(236, 210, 69, 1)\",\n \"value\": 60,\n \"type\": \"\"\n },\n {\n \"color\": \"rgb(44, 157, 61)\",\n \"value\": null,\n \"type\": \"base\"\n }\n ]\n },\n \"standardOptions\": {\n \"util\": \"percent\",\n \"decimals\": 2,\n \"min\": 0,\n \"max\": 100\n }\n }\n }\n ]\n }\n ],\n \"version\": \"3.1.0\"\n }\n}\n"
},
{
"path": "integrations/Linux/dashboards/exporter-detail.json",
"content": "{\n \"name\": \"机器常用指标(使用 NodeExporter 作为采集器)\",\n \"tags\": \"NodeExporter\",\n \"ident\": \"\",\n \"uuid\": 1717556327748611000,\n \"configs\": {\n \"links\": [\n {\n \"targetBlank\": true,\n \"title\": \"n9e\",\n \"url\": \"https://n9e.gitee.io/\"\n },\n {\n \"targetBlank\": true,\n \"title\": \"author\",\n \"url\": \"http://flashcat.cloud/\"\n }\n ],\n \"panels\": [\n {\n \"collapsed\": true,\n \"id\": \"396bf5e2-f204-4349-8e00-fb9d25ed7e79\",\n \"layout\": {\n \"h\": 1,\n \"w\": 24,\n \"x\": 0,\n \"y\": 0,\n \"i\": \"396bf5e2-f204-4349-8e00-fb9d25ed7e79\",\n \"isResizable\": false\n },\n \"name\": \"单机概况\",\n \"type\": \"row\"\n },\n {\n \"type\": \"stat\",\n \"id\": \"534ca690-87e5-4c53-9c8a-d3afe0276bf5\",\n \"layout\": {\n \"h\": 5,\n \"w\": 6,\n \"x\": 0,\n \"y\": 1,\n \"i\": \"534ca690-87e5-4c53-9c8a-d3afe0276bf5\",\n \"isResizable\": true\n },\n \"version\": \"3.1.0\",\n \"datasourceCate\": \"prometheus\",\n \"datasourceValue\": \"${prom}\",\n \"targets\": [\n {\n \"expr\": \"node_time_seconds{instance=~\\\"$node\\\"} - node_boot_time_seconds{instance=~\\\"$node\\\"}\",\n \"maxDataPoints\": 480,\n \"instant\": true,\n \"step\": 15,\n \"legend\": \"{{instance}}\"\n }\n ],\n \"transformations\": [\n {\n \"id\": \"organize\",\n \"options\": {}\n }\n ],\n \"name\": \"启动时长\",\n \"maxPerRow\": 4,\n \"custom\": {\n \"textMode\": \"valueAndName\",\n \"graphMode\": \"none\",\n \"colorMode\": \"background\",\n \"calc\": \"lastNotNull\",\n \"valueField\": \"Value\",\n \"colSpan\": 0,\n \"textSize\": {\n \"title\": null,\n \"value\": null\n },\n \"orientation\": \"auto\"\n },\n \"options\": {\n \"thresholds\": {\n \"steps\": [\n {\n \"color\": \"rgba(148, 112, 255, 1)\",\n \"value\": null,\n \"type\": \"base\"\n }\n ]\n },\n \"valueMappings\": [],\n \"standardOptions\": {\n \"util\": \"seconds\",\n \"decimals\": 1\n }\n },\n \"overrides\": [\n {\n \"matcher\": {\n \"id\": \"byFrameRefID\"\n },\n \"properties\": {\n \"thresholds\": {\n \"steps\": [\n {\n \"color\": \"#6C53B1\",\n \"value\": null,\n \"type\": \"base\"\n }\n ]\n }\n }\n }\n ]\n },\n {\n \"type\": \"stat\",\n \"id\": \"69c96540-965b-4e87-9eb7-c24a0c974474\",\n \"layout\": {\n \"h\": 5,\n \"w\": 6,\n \"x\": 6,\n \"y\": 1,\n \"i\": \"69c96540-965b-4e87-9eb7-c24a0c974474\",\n \"isResizable\": true\n },\n \"version\": \"3.1.0\",\n \"datasourceCate\": \"prometheus\",\n \"datasourceValue\": \"${prom}\",\n \"targets\": [\n {\n \"expr\": \"node_memory_SwapTotal_bytes{instance=~\\\"$node\\\"} - node_memory_SwapFree_bytes{instance=~\\\"$node\\\"}\",\n \"maxDataPoints\": 480,\n \"instant\": true,\n \"step\": 15,\n \"legend\": \"{{instance}}\"\n }\n ],\n \"transformations\": [\n {\n \"id\": \"organize\",\n \"options\": {}\n }\n ],\n \"name\": \"SWAP内存使用\",\n \"description\": \"swap使用过高,会影响系统io性能,如果内存够用但swap使用很高,可以调小swappiness的值\",\n \"maxPerRow\": 4,\n \"custom\": {\n \"textMode\": \"valueAndName\",\n \"graphMode\": \"none\",\n \"colorMode\": \"background\",\n \"calc\": \"lastNotNull\",\n \"valueField\": \"Value\",\n \"colSpan\": 0,\n \"textSize\": {\n \"value\": null\n },\n \"orientation\": \"auto\"\n },\n \"options\": {\n \"thresholds\": {\n \"steps\": [\n {\n \"color\": \"rgba(148, 112, 255, 1)\",\n \"value\": null,\n \"type\": \"base\"\n }\n ]\n },\n \"valueMappings\": [],\n \"standardOptions\": {\n \"util\": \"bytesIEC\",\n \"decimals\": 1\n }\n },\n \"overrides\": [\n {\n \"matcher\": {\n \"id\": \"byFrameRefID\"\n },\n \"properties\": {\n \"thresholds\": {\n \"steps\": [\n {\n \"color\": \"#6C53B1\",\n \"value\": null,\n \"type\": \"base\"\n }\n ]\n }\n }\n }\n ]\n },\n {\n \"type\": \"stat\",\n \"id\": \"84b04d6b-1f97-47b8-86ff-77e6b1af4f1d\",\n \"layout\": {\n \"h\": 5,\n \"w\": 6,\n \"x\": 12,\n \"y\": 1,\n \"i\": \"84b04d6b-1f97-47b8-86ff-77e6b1af4f1d\",\n \"isResizable\": true\n },\n \"version\": \"3.1.0\",\n \"datasourceCate\": \"prometheus\",\n \"datasourceValue\": \"${prom}\",\n \"targets\": [\n {\n \"expr\": \"sum(node_filesystem_device_error{instance=~\\\"$node\\\",mountpoint!~\\\"/var/lib/.*\\\",mountpoint!~\\\"/run.*\\\"}) by (instance)\",\n \"legend\": \"{{instance}}\",\n \"maxDataPoints\": 480,\n \"step\": 15,\n \"instant\": true\n }\n ],\n \"transformations\": [\n {\n \"id\": \"organize\",\n \"options\": {}\n }\n ],\n \"name\": \"写文件错误数总和\",\n \"maxPerRow\": 4,\n \"custom\": {\n \"textMode\": \"valueAndName\",\n \"graphMode\": \"none\",\n \"colorMode\": \"background\",\n \"calc\": \"lastNotNull\",\n \"valueField\": \"Value\",\n \"colSpan\": 0,\n \"textSize\": {\n \"value\": null\n },\n \"orientation\": \"auto\"\n },\n \"options\": {\n \"thresholds\": {\n \"steps\": [\n {\n \"color\": \"rgb(44, 157, 61)\",\n \"value\": null,\n \"type\": \"base\"\n }\n ]\n },\n \"valueMappings\": [\n {\n \"match\": {\n \"from\": 0,\n \"to\": 0\n },\n \"result\": {\n \"color\": \"#369903\"\n },\n \"type\": \"range\"\n },\n {\n \"match\": {\n \"from\": 1,\n \"to\": null\n },\n \"result\": {\n \"color\": \"#f0310f\"\n },\n \"type\": \"range\"\n }\n ],\n \"standardOptions\": {\n \"decimals\": 1\n }\n },\n \"overrides\": [\n {\n \"matcher\": {\n \"id\": \"byFrameRefID\"\n },\n \"properties\": {\n \"thresholds\": {\n \"steps\": [\n {\n \"color\": \"#6C53B1\",\n \"value\": null,\n \"type\": \"base\"\n }\n ]\n }\n }\n }\n ]\n },\n {\n \"type\": \"timeseries\",\n \"id\": \"39715d51-4d18-4185-8584-68a4d44adf2b\",\n \"layout\": {\n \"h\": 5,\n \"w\": 6,\n \"x\": 18,\n \"y\": 1,\n \"i\": \"39715d51-4d18-4185-8584-68a4d44adf2b\",\n \"isResizable\": true\n },\n \"version\": \"3.1.0\",\n \"datasourceCate\": \"prometheus\",\n \"datasourceValue\": \"${prom}\",\n \"targets\": [\n {\n \"expr\": \"rate(node_vmstat_oom_kill{instance=~\\\"$node\\\"}[$__rate_interval])\",\n \"legend\": \"\",\n \"maxDataPoints\": 480,\n \"step\": 15\n }\n ],\n \"transformations\": [\n {\n \"id\": \"organize\",\n \"options\": {}\n }\n ],\n \"name\": \"每秒OOM次数\",\n \"description\": \"大于0,说明有进程内存不够用了,需要考虑扩容或升级配置了\",\n \"maxPerRow\": 4,\n \"options\": {\n \"tooltip\": {\n \"mode\": \"all\",\n \"sort\": \"desc\"\n },\n \"legend\": {\n \"displayMode\": \"hidden\",\n \"placement\": \"bottom\",\n \"behaviour\": \"showItem\",\n \"selectMode\": \"single\"\n },\n \"standardOptions\": {\n \"decimals\": 0\n },\n \"thresholds\": {\n \"mode\": \"absolute\",\n \"steps\": [\n {\n \"color\": \"rgb(44, 157, 61)\",\n \"value\": null,\n \"type\": \"base\"\n },\n {\n \"color\": \"#f90101\",\n \"value\": 1\n }\n ]\n },\n \"thresholdsStyle\": {\n \"mode\": \"dashed\"\n }\n },\n \"custom\": {\n \"drawStyle\": \"lines\",\n \"lineInterpolation\": \"smooth\",\n \"spanNulls\": false,\n \"lineWidth\": 2,\n \"fillOpacity\": 0.3,\n \"gradientMode\": \"opacity\",\n \"stack\": \"off\",\n \"scaleDistribution\": {\n \"type\": \"linear\"\n },\n \"showPoints\": \"none\",\n \"pointSize\": 5\n },\n \"overrides\": [\n {\n \"matcher\": {\n \"id\": \"byFrameRefID\"\n },\n \"properties\": {\n \"rightYAxisDisplay\": \"off\"\n }\n }\n ]\n },\n {\n \"type\": \"hexbin\",\n \"id\": \"981e2271-2c6c-4410-b3fb-73c35049c11a\",\n \"layout\": {\n \"h\": 5,\n \"w\": 8,\n \"x\": 0,\n \"y\": 6,\n \"i\": \"981e2271-2c6c-4410-b3fb-73c35049c11a\",\n \"isResizable\": true\n },\n \"version\": \"3.1.0\",\n \"datasourceCate\": \"prometheus\",\n \"datasourceValue\": \"${prom}\",\n \"targets\": [\n {\n \"expr\": \"topk(25, max(100 - ((node_filesystem_avail_bytes{instance=~\\\"$node\\\",} * 100) / node_filesystem_size_bytes{instance=~\\\"$node\\\"})) by (instance, mountpoint))\",\n \"legend\": \"{{instance}} {{mountpoint}}\",\n \"maxDataPoints\": 480,\n \"step\": 15,\n \"instant\": true\n }\n ],\n \"transformations\": [\n {\n \"id\": \"organize\",\n \"options\": {}\n }\n ],\n \"name\": \"磁盘分区使用率\",\n \"maxPerRow\": 4,\n \"custom\": {\n \"textMode\": \"valueAndName\",\n \"fontBackground\": true,\n \"calc\": \"lastNotNull\",\n \"valueField\": \"Value\",\n \"colorRange\": [\n \"thresholds\"\n ]\n },\n \"options\": {\n \"thresholds\": {\n \"steps\": [\n {\n \"color\": \"rgb(255, 101, 107)\",\n \"value\": 95,\n \"type\": \"\"\n },\n {\n \"color\": \"rgba(230, 198, 39, 1)\",\n \"value\": 75,\n \"type\": \"\"\n },\n {\n \"color\": \"rgb(44, 157, 61)\",\n \"value\": null,\n \"type\": \"base\"\n }\n ]\n },\n \"standardOptions\": {\n \"util\": \"percent\",\n \"decimals\": 1\n }\n }\n },\n {\n \"type\": \"hexbin\",\n \"id\": \"82310aef-8db6-46bf-96a0-fcad68ae7d9e\",\n \"layout\": {\n \"h\": 5,\n \"w\": 8,\n \"x\": 8,\n \"y\": 6,\n \"i\": \"82310aef-8db6-46bf-96a0-fcad68ae7d9e\",\n \"isResizable\": true\n },\n \"version\": \"3.1.0\",\n \"datasourceCate\": \"prometheus\",\n \"datasourceValue\": \"${prom}\",\n \"targets\": [\n {\n \"expr\": \"topk(25, max(100 - ((node_filesystem_files_free{instance=~\\\"$node\\\",mountpoint!~\\\"/var/lib/.*\\\",mountpoint!~\\\"/run/user.*\\\"} * 100) / node_filesystem_files{instance=~\\\"$node\\\",mountpoint!~\\\"/var/lib/.*\\\",mountpoint!~\\\"/run/user.*\\\"})) by (instance, mountpoint))\",\n \"legend\": \"{{instance}} {{mountpoint}}\",\n \"maxDataPoints\": 480,\n \"instant\": true,\n \"step\": 15\n }\n ],\n \"transformations\": [\n {\n \"id\": \"organize\",\n \"options\": {}\n }\n ],\n \"name\": \"inode分区使用率\",\n \"maxPerRow\": 4,\n \"custom\": {\n \"textMode\": \"valueAndName\",\n \"fontBackground\": true,\n \"calc\": \"lastNotNull\",\n \"valueField\": \"Value\",\n \"colorRange\": [\n \"thresholds\"\n ]\n },\n \"options\": {\n \"thresholds\": {\n \"steps\": [\n {\n \"color\": \"rgb(255, 101, 107)\",\n \"value\": 75,\n \"type\": \"\"\n },\n {\n \"color\": \"rgb(44, 157, 61)\",\n \"value\": null,\n \"type\": \"base\"\n }\n ]\n },\n \"standardOptions\": {\n \"util\": \"percent\",\n \"decimals\": 1\n }\n }\n },\n {\n \"type\": \"timeseries\",\n \"id\": \"14caedd8-a1fd-412b-8c50-e35d3df57a2b\",\n \"layout\": {\n \"h\": 5,\n \"w\": 8,\n \"x\": 16,\n \"y\": 6,\n \"i\": \"14caedd8-a1fd-412b-8c50-e35d3df57a2b\",\n \"isResizable\": true\n },\n \"version\": \"3.1.0\",\n \"datasourceCate\": \"prometheus\",\n \"datasourceValue\": \"${prom}\",\n \"targets\": [\n {\n \"expr\": \"node_filefd_allocated{instance=~\\\"$node\\\"}/node_filefd_maximum{instance=~\\\"$node\\\"}*100\",\n \"maxDataPoints\": 480,\n \"instant\": false,\n \"step\": 15,\n \"legend\": \"{{instance}}\"\n }\n ],\n \"transformations\": [\n {\n \"id\": \"organize\",\n \"options\": {}\n }\n ],\n \"name\": \"FD使用率\",\n \"description\": \"如果超过80%,建议把文件描述符的最大个数调大,或者扩容\",\n \"maxPerRow\": 4,\n \"options\": {\n \"tooltip\": {\n \"mode\": \"all\",\n \"sort\": \"none\"\n },\n \"legend\": {\n \"displayMode\": \"hidden\",\n \"placement\": \"bottom\",\n \"behaviour\": \"showItem\",\n \"selectMode\": \"single\"\n },\n \"standardOptions\": {\n \"util\": \"percent\",\n \"decimals\": 2\n },\n \"thresholds\": {\n \"mode\": \"absolute\",\n \"steps\": [\n {\n \"color\": \"rgb(44, 157, 61)\",\n \"value\": null,\n \"type\": \"base\"\n }\n ]\n },\n \"thresholdsStyle\": {\n \"mode\": \"dashed\"\n }\n },\n \"custom\": {\n \"drawStyle\": \"lines\",\n \"lineInterpolation\": \"smooth\",\n \"spanNulls\": false,\n \"lineWidth\": 2,\n \"fillOpacity\": 0.01,\n \"gradientMode\": \"none\",\n \"stack\": \"off\",\n \"scaleDistribution\": {\n \"type\": \"linear\"\n },\n \"showPoints\": \"none\",\n \"pointSize\": 5\n },\n \"overrides\": [\n {\n \"matcher\": {\n \"id\": \"byFrameRefID\"\n },\n \"properties\": {\n \"thresholds\": {\n \"steps\": [\n {\n \"color\": \"#6C53B1\",\n \"value\": null,\n \"type\": \"base\"\n }\n ]\n },\n \"rightYAxisDisplay\": \"off\"\n }\n }\n ]\n },\n {\n \"type\": \"timeseries\",\n \"id\": \"639f4668-fb33-427d-8ec8-4f11127a1bf3\",\n \"layout\": {\n \"h\": 6,\n \"w\": 8,\n \"x\": 0,\n \"y\": 11,\n \"i\": \"639f4668-fb33-427d-8ec8-4f11127a1bf3\",\n \"isResizable\": true\n },\n \"version\": \"3.1.0\",\n \"datasourceCate\": \"prometheus\",\n \"datasourceValue\": \"${prom}\",\n \"targets\": [\n {\n \"expr\": \"avg without (mode,cpu) ( 1 - rate(node_cpu_seconds_total{mode=\\\"idle\\\", instance=~\\\"$node\\\"}[$__rate_interval]) ) * 100\",\n \"maxDataPoints\": 480,\n \"step\": 15,\n \"instant\": false,\n \"legend\": \"{{instance}}\"\n }\n ],\n \"transformations\": [\n {\n \"id\": \"organize\",\n \"options\": {}\n }\n ],\n \"name\": \"CPU使用率\",\n \"description\": \"如果cpu使用率超过50%,可以通过top命令查看机器上是否有异常进程,如果没有异常进程,则说明服务需要扩容或者机器需要升级配置了\",\n \"maxPerRow\": 4,\n \"options\": {\n \"tooltip\": {\n \"mode\": \"all\",\n \"sort\": \"desc\"\n },\n \"legend\": {\n \"displayMode\": \"hidden\",\n \"placement\": \"bottom\",\n \"behaviour\": \"showItem\",\n \"selectMode\": \"single\"\n },\n \"standardOptions\": {\n \"util\": \"percent\",\n \"decimals\": 1\n },\n \"thresholds\": {\n \"mode\": \"absolute\",\n \"steps\": [\n {\n \"color\": \"rgb(44, 157, 61)\",\n \"value\": null,\n \"type\": \"base\"\n }\n ]\n },\n \"thresholdsStyle\": {\n \"mode\": \"dashed\"\n }\n },\n \"custom\": {\n \"drawStyle\": \"lines\",\n \"lineInterpolation\": \"smooth\",\n \"spanNulls\": false,\n \"lineWidth\": 2,\n \"fillOpacity\": 0.01,\n \"gradientMode\": \"none\",\n \"stack\": \"off\",\n \"scaleDistribution\": {\n \"type\": \"linear\"\n },\n \"showPoints\": \"none\",\n \"pointSize\": 5\n },\n \"overrides\": [\n {\n \"matcher\": {\n \"id\": \"byFrameRefID\"\n },\n \"properties\": {\n \"rightYAxisDisplay\": \"off\"\n }\n }\n ]\n },\n {\n \"type\": \"timeseries\",\n \"id\": \"56dc011d-fc1c-4682-a903-1b778cbff9e8\",\n \"layout\": {\n \"h\": 6,\n \"w\": 8,\n \"x\": 8,\n \"y\": 11,\n \"i\": \"56dc011d-fc1c-4682-a903-1b778cbff9e8\",\n \"isResizable\": true\n },\n \"version\": \"3.1.0\",\n \"datasourceCate\": \"prometheus\",\n \"datasourceValue\": \"${prom}\",\n \"targets\": [\n {\n \"expr\": \"(1 - (node_memory_MemAvailable_bytes{instance=~\\\"$node\\\"} / node_memory_MemTotal_bytes{instance=~\\\"$node\\\"})) * 100\",\n \"maxDataPoints\": 480,\n \"step\": 15,\n \"instant\": false,\n \"legend\": \"{{instance}}\"\n }\n ],\n \"transformations\": [\n {\n \"id\": \"organize\",\n \"options\": {}\n }\n ],\n \"name\": \"内存使用率\",\n \"description\": \"如果内存使用率超过50%,则需要扩容或者升级配置了\",\n \"maxPerRow\": 4,\n \"options\": {\n \"tooltip\": {\n \"mode\": \"all\",\n \"sort\": \"desc\"\n },\n \"legend\": {\n \"displayMode\": \"hidden\",\n \"placement\": \"bottom\",\n \"behaviour\": \"showItem\",\n \"selectMode\": \"single\"\n },\n \"standardOptions\": {\n \"util\": \"percent\",\n \"decimals\": 1\n },\n \"thresholds\": {\n \"mode\": \"absolute\",\n \"steps\": [\n {\n \"color\": \"rgb(44, 157, 61)\",\n \"value\": null,\n \"type\": \"base\"\n }\n ]\n },\n \"thresholdsStyle\": {\n \"mode\": \"dashed\"\n }\n },\n \"custom\": {\n \"drawStyle\": \"lines\",\n \"lineInterpolation\": \"smooth\",\n \"spanNulls\": false,\n \"lineWidth\": 2,\n \"fillOpacity\": 0.01,\n \"gradientMode\": \"none\",\n \"stack\": \"off\",\n \"scaleDistribution\": {\n \"type\": \"linear\"\n },\n \"showPoints\": \"none\",\n \"pointSize\": 5\n },\n \"overrides\": [\n {\n \"matcher\": {\n \"id\": \"byFrameRefID\"\n },\n \"properties\": {\n \"thresholds\": {\n \"steps\": [\n {\n \"color\": \"#6C53B1\",\n \"value\": null,\n \"type\": \"base\"\n }\n ]\n },\n \"rightYAxisDisplay\": \"off\"\n }\n }\n ]\n },\n {\n \"type\": \"timeseries\",\n \"id\": \"4a9ea87d-d650-43ff-bf1e-70f44afabace\",\n \"layout\": {\n \"h\": 6,\n \"w\": 8,\n \"x\": 16,\n \"y\": 11,\n \"i\": \"4a9ea87d-d650-43ff-bf1e-70f44afabace\",\n \"isResizable\": true\n },\n \"version\": \"3.1.0\",\n \"datasourceCate\": \"prometheus\",\n \"datasourceValue\": \"${prom}\",\n \"targets\": [\n {\n \"expr\": \"rate(node_disk_io_time_seconds_total{instance=~\\\"$node\\\"}[$__rate_interval]) * 100\",\n \"legend\": \"\",\n \"maxDataPoints\": 480,\n \"step\": 15\n }\n ],\n \"transformations\": [\n {\n \"id\": \"organize\",\n \"options\": {}\n }\n ],\n \"name\": \"IO Util\",\n \"maxPerRow\": 4,\n \"options\": {\n \"tooltip\": {\n \"mode\": \"all\",\n \"sort\": \"desc\"\n },\n \"legend\": {\n \"displayMode\": \"hidden\",\n \"placement\": \"bottom\",\n \"behaviour\": \"showItem\",\n \"selectMode\": \"single\"\n },\n \"standardOptions\": {\n \"util\": \"percent\",\n \"decimals\": 1\n },\n \"thresholds\": {\n \"mode\": \"absolute\",\n \"steps\": [\n {\n \"color\": \"rgb(255, 101, 107)\",\n \"value\": 75,\n \"type\": \"\"\n },\n {\n \"color\": \"rgb(44, 157, 61)\",\n \"value\": null,\n \"type\": \"base\"\n }\n ]\n },\n \"thresholdsStyle\": {\n \"mode\": \"dashed\"\n }\n },\n \"custom\": {\n \"drawStyle\": \"lines\",\n \"lineInterpolation\": \"smooth\",\n \"spanNulls\": false,\n \"lineWidth\": 2,\n \"fillOpacity\": 0.3,\n \"gradientMode\": \"opacity\",\n \"stack\": \"off\",\n \"scaleDistribution\": {\n \"type\": \"linear\"\n },\n \"showPoints\": \"none\",\n \"pointSize\": 5\n },\n \"overrides\": [\n {\n \"matcher\": {\n \"id\": \"byFrameRefID\"\n },\n \"properties\": {\n \"rightYAxisDisplay\": \"off\"\n }\n }\n ]\n },\n {\n \"collapsed\": true,\n \"id\": \"22df4dfe-6f93-4f44-b7ea-254a690922a5\",\n \"layout\": {\n \"h\": 1,\n \"w\": 24,\n \"x\": 0,\n \"y\": 17,\n \"i\": \"22df4dfe-6f93-4f44-b7ea-254a690922a5\",\n \"isResizable\": false\n },\n \"name\": \"系统指标\",\n \"type\": \"row\"\n },\n {\n \"type\": \"timeseries\",\n \"id\": \"7c4fede9-18b6-4a45-9278-76b6f724716e\",\n \"layout\": {\n \"h\": 6,\n \"w\": 6,\n \"x\": 0,\n \"y\": 18,\n \"i\": \"7c4fede9-18b6-4a45-9278-76b6f724716e\",\n \"isResizable\": true\n },\n \"version\": \"3.1.0\",\n \"datasourceCate\": \"prometheus\",\n \"datasourceValue\": \"${prom}\",\n \"targets\": [\n {\n \"expr\": \"node_procs_running{instance=~\\\"$node\\\"}\",\n \"legend\": \"\",\n \"maxDataPoints\": 480,\n \"step\": 15\n }\n ],\n \"transformations\": [\n {\n \"id\": \"organize\",\n \"options\": {}\n }\n ],\n \"name\": \"进程数\",\n \"description\": \"进程数超过2000,可以考虑扩容了\",\n \"maxPerRow\": 4,\n \"options\": {\n \"tooltip\": {\n \"mode\": \"all\",\n \"sort\": \"desc\"\n },\n \"legend\": {\n \"displayMode\": \"hidden\",\n \"placement\": \"bottom\",\n \"behaviour\": \"showItem\",\n \"selectMode\": \"single\"\n },\n \"standardOptions\": {},\n \"thresholds\": {\n \"mode\": \"absolute\",\n \"steps\": [\n {\n \"color\": \"rgb(44, 157, 61)\",\n \"value\": null,\n \"type\": \"base\"\n },\n {\n \"color\": \"#ff0000\",\n \"value\": 2000\n }\n ]\n },\n \"thresholdsStyle\": {\n \"mode\": \"dashed\"\n }\n },\n \"custom\": {\n \"drawStyle\": \"lines\",\n \"lineInterpolation\": \"smooth\",\n \"spanNulls\": false,\n \"lineWidth\": 2,\n \"fillOpacity\": 0.3,\n \"gradientMode\": \"opacity\",\n \"stack\": \"off\",\n \"scaleDistribution\": {\n \"type\": \"linear\"\n },\n \"showPoints\": \"none\",\n \"pointSize\": 5\n },\n \"overrides\": [\n {\n \"matcher\": {\n \"id\": \"byFrameRefID\"\n },\n \"properties\": {\n \"rightYAxisDisplay\": \"off\"\n }\n }\n ]\n },\n {\n \"type\": \"timeseries\",\n \"id\": \"28f96d86-79ed-4564-84c9-8e8c58d66985\",\n \"layout\": {\n \"h\": 6,\n \"w\": 6,\n \"x\": 6,\n \"y\": 18,\n \"i\": \"28f96d86-79ed-4564-84c9-8e8c58d66985\",\n \"isResizable\": true\n },\n \"version\": \"3.1.0\",\n \"datasourceCate\": \"prometheus\",\n \"datasourceValue\": \"${prom}\",\n \"targets\": [\n {\n \"expr\": \"rate(node_intr_total{instance=~\\\"$node\\\"}[$__rate_interval])\",\n \"legend\": \"{{instance}} interrupts\",\n \"maxDataPoints\": 480,\n \"step\": 15\n },\n {\n \"expr\": \"irate(node_context_switches_total{instance=~\\\"$node\\\"}[$__rate_interval])\",\n \"legend\": \"{{instance}} context switches\",\n \"maxDataPoints\": 480,\n \"step\": 15\n }\n ],\n \"transformations\": [\n {\n \"id\": \"organize\",\n \"options\": {}\n }\n ],\n \"name\": \"上下文切换/中断\",\n \"maxPerRow\": 4,\n \"options\": {\n \"tooltip\": {\n \"mode\": \"all\",\n \"sort\": \"desc\"\n },\n \"legend\": {\n \"displayMode\": \"hidden\",\n \"placement\": \"bottom\",\n \"behaviour\": \"showItem\",\n \"selectMode\": \"single\"\n },\n \"standardOptions\": {},\n \"thresholds\": {\n \"mode\": \"absolute\",\n \"steps\": [\n {\n \"color\": \"rgb(44, 157, 61)\",\n \"value\": null,\n \"type\": \"base\"\n }\n ]\n },\n \"thresholdsStyle\": {\n \"mode\": \"dashed\"\n }\n },\n \"custom\": {\n \"drawStyle\": \"lines\",\n \"lineInterpolation\": \"smooth\",\n \"spanNulls\": false,\n \"lineWidth\": 2,\n \"fillOpacity\": 0.3,\n \"gradientMode\": \"opacity\",\n \"stack\": \"off\",\n \"scaleDistribution\": {\n \"type\": \"linear\"\n },\n \"showPoints\": \"none\",\n \"pointSize\": 5\n },\n \"overrides\": [\n {\n \"matcher\": {\n \"id\": \"byFrameRefID\"\n },\n \"properties\": {\n \"rightYAxisDisplay\": \"off\"\n }\n }\n ]\n },\n {\n \"type\": \"timeseries\",\n \"id\": \"1a16c5ad-1a71-4771-9f50-f3dcc4524f71\",\n \"layout\": {\n \"h\": 6,\n \"w\": 6,\n \"x\": 12,\n \"y\": 18,\n \"i\": \"1a16c5ad-1a71-4771-9f50-f3dcc4524f71\",\n \"isResizable\": true\n },\n \"version\": \"3.1.0\",\n \"datasourceCate\": \"prometheus\",\n \"datasourceValue\": \"${prom}\",\n \"targets\": [\n {\n \"expr\": \"node_entropy_available_bits{instance=~\\\"$node\\\"}\",\n \"legend\": \"{{instance}}\",\n \"maxDataPoints\": 480,\n \"step\": 15\n }\n ],\n \"transformations\": [\n {\n \"id\": \"organize\",\n \"options\": {}\n }\n ],\n \"name\": \"熵池大小\",\n \"description\": \"熵池太小 ,程序使用随机函数会阻塞,可以安装 rng-tools 工具增加熵池大小,可参考\\nhttps://codeantenna.com/a/Ab6aMd3NSA \",\n \"maxPerRow\": 4,\n \"options\": {\n \"tooltip\": {\n \"mode\": \"all\",\n \"sort\": \"desc\"\n },\n \"legend\": {\n \"displayMode\": \"hidden\",\n \"placement\": \"bottom\",\n \"behaviour\": \"showItem\",\n \"selectMode\": \"single\"\n },\n \"standardOptions\": {\n \"decimals\": null\n },\n \"thresholds\": {\n \"mode\": \"absolute\",\n \"steps\": [\n {\n \"color\": \"rgb(44, 157, 61)\",\n \"value\": null,\n \"type\": \"base\"\n },\n {\n \"color\": \"#f70202\",\n \"value\": 100\n }\n ]\n },\n \"thresholdsStyle\": {\n \"mode\": \"dashed\"\n }\n },\n \"custom\": {\n \"drawStyle\": \"lines\",\n \"lineInterpolation\": \"smooth\",\n \"spanNulls\": false,\n \"lineWidth\": 2,\n \"fillOpacity\": 0.3,\n \"gradientMode\": \"opacity\",\n \"stack\": \"off\",\n \"scaleDistribution\": {\n \"type\": \"linear\"\n },\n \"showPoints\": \"none\",\n \"pointSize\": 5\n },\n \"overrides\": [\n {\n \"matcher\": {\n \"id\": \"byFrameRefID\"\n },\n \"properties\": {\n \"rightYAxisDisplay\": \"off\"\n }\n }\n ]\n },\n {\n \"type\": \"timeseries\",\n \"id\": \"077b1181-00e2-44ce-9295-7528a8b829d5\",\n \"layout\": {\n \"h\": 6,\n \"w\": 6,\n \"x\": 18,\n \"y\": 18,\n \"i\": \"077b1181-00e2-44ce-9295-7528a8b829d5\",\n \"isResizable\": true\n },\n \"version\": \"3.1.0\",\n \"datasourceCate\": \"prometheus\",\n \"datasourceValue\": \"${prom}\",\n \"targets\": [\n {\n \"expr\": \"node_timex_offset_seconds{instance=~\\\"$node\\\"}\",\n \"legend\": \"{{instance}}\",\n \"maxDataPoints\": 480,\n \"step\": 15\n }\n ],\n \"transformations\": [\n {\n \"id\": \"organize\",\n \"options\": {}\n }\n ],\n \"name\": \"NTP偏移\",\n \"description\": \"\",\n \"maxPerRow\": 4,\n \"options\": {\n \"tooltip\": {\n \"mode\": \"all\",\n \"sort\": \"desc\"\n },\n \"legend\": {\n \"displayMode\": \"hidden\",\n \"placement\": \"bottom\",\n \"behaviour\": \"showItem\",\n \"selectMode\": \"single\"\n },\n \"standardOptions\": {\n \"util\": \"seconds\",\n \"decimals\": 1\n },\n \"thresholds\": {\n \"mode\": \"absolute\",\n \"steps\": [\n {\n \"color\": \"rgb(44, 157, 61)\",\n \"value\": null,\n \"type\": \"base\"\n }\n ]\n },\n \"thresholdsStyle\": {\n \"mode\": \"dashed\"\n }\n },\n \"custom\": {\n \"drawStyle\": \"lines\",\n \"lineInterpolation\": \"smooth\",\n \"spanNulls\": false,\n \"lineWidth\": 2,\n \"fillOpacity\": 0.3,\n \"gradientMode\": \"opacity\",\n \"stack\": \"off\",\n \"scaleDistribution\": {\n \"type\": \"linear\"\n },\n \"showPoints\": \"none\",\n \"pointSize\": 5\n },\n \"overrides\": [\n {\n \"matcher\": {\n \"id\": \"byFrameRefID\"\n },\n \"properties\": {\n \"rightYAxisDisplay\": \"off\"\n }\n }\n ]\n },\n {\n \"collapsed\": true,\n \"id\": \"406a3fd8-52fb-4935-9971-d7a8f37437df\",\n \"layout\": {\n \"h\": 1,\n \"w\": 24,\n \"x\": 0,\n \"y\": 24,\n \"i\": \"406a3fd8-52fb-4935-9971-d7a8f37437df\",\n \"isResizable\": false\n },\n \"name\": \"CPU详情\",\n \"type\": \"row\"\n },\n {\n \"type\": \"timeseries\",\n \"id\": \"28f582ca-dd5c-41a8-8cc8-bcc88f755253\",\n \"layout\": {\n \"h\": 7,\n \"w\": 8,\n \"x\": 0,\n \"y\": 25,\n \"i\": \"28f582ca-dd5c-41a8-8cc8-bcc88f755253\",\n \"isResizable\": true\n },\n \"version\": \"3.1.0\",\n \"datasourceCate\": \"prometheus\",\n \"datasourceValue\": \"${prom}\",\n \"targets\": [\n {\n \"expr\": \" (avg without (cpu, mode)(rate(node_cpu_seconds_total{instance=~\\\"$node\\\",mode=\\\"idle\\\"}[$__rate_interval])))*100\",\n \"legend\": \"\",\n \"maxDataPoints\": 480,\n \"step\": 15\n }\n ],\n \"transformations\": [\n {\n \"id\": \"organize\",\n \"options\": {}\n }\n ],\n \"name\": \"CPU空闲率\",\n \"maxPerRow\": 4,\n \"options\": {\n \"tooltip\": {\n \"mode\": \"all\",\n \"sort\": \"desc\"\n },\n \"legend\": {\n \"displayMode\": \"hidden\",\n \"placement\": \"bottom\",\n \"behaviour\": \"showItem\",\n \"selectMode\": \"single\"\n },\n \"standardOptions\": {\n \"util\": \"percent\",\n \"decimals\": 1\n },\n \"thresholds\": {\n \"mode\": \"absolute\",\n \"steps\": [\n {\n \"color\": \"rgb(44, 157, 61)\",\n \"value\": null,\n \"type\": \"base\"\n },\n {\n \"color\": \"#f90101\",\n \"value\": 10\n }\n ]\n },\n \"thresholdsStyle\": {\n \"mode\": \"dashed\"\n }\n },\n \"custom\": {\n \"drawStyle\": \"lines\",\n \"lineInterpolation\": \"smooth\",\n \"spanNulls\": false,\n \"lineWidth\": 2,\n \"fillOpacity\": 0.3,\n \"gradientMode\": \"opacity\",\n \"stack\": \"off\",\n \"scaleDistribution\": {\n \"type\": \"linear\"\n },\n \"showPoints\": \"none\",\n \"pointSize\": 5\n },\n \"overrides\": [\n {\n \"matcher\": {\n \"id\": \"byFrameRefID\"\n },\n \"properties\": {\n \"rightYAxisDisplay\": \"off\"\n }\n }\n ]\n },\n {\n \"type\": \"timeseries\",\n \"id\": \"bb2b0b33-2f78-428d-8847-d900d0bbdf25\",\n \"layout\": {\n \"h\": 7,\n \"w\": 8,\n \"x\": 8,\n \"y\": 25,\n \"i\": \"bb2b0b33-2f78-428d-8847-d900d0bbdf25\",\n \"isResizable\": true\n },\n \"version\": \"3.1.0\",\n \"datasourceCate\": \"prometheus\",\n \"datasourceValue\": \"${prom}\",\n \"targets\": [\n {\n \"expr\": \" (avg without (cpu)(rate(node_cpu_seconds_total{instance=~\\\"$node\\\",mode!=\\\"idle\\\"}[$__rate_interval])))*100\",\n \"legend\": \"{{instance}} {{mode}}\",\n \"maxDataPoints\": 480,\n \"step\": 15\n }\n ],\n \"transformations\": [\n {\n \"id\": \"organize\",\n \"options\": {}\n }\n ],\n \"name\": \"CPU使用率详情\",\n \"maxPerRow\": 4,\n \"options\": {\n \"tooltip\": {\n \"mode\": \"all\",\n \"sort\": \"desc\"\n },\n \"legend\": {\n \"displayMode\": \"hidden\",\n \"placement\": \"bottom\",\n \"behaviour\": \"showItem\",\n \"selectMode\": \"single\"\n },\n \"standardOptions\": {\n \"util\": \"percent\",\n \"decimals\": 1\n },\n \"thresholds\": {\n \"mode\": \"absolute\",\n \"steps\": [\n {\n \"color\": \"rgb(44, 157, 61)\",\n \"value\": null,\n \"type\": \"base\"\n }\n ]\n },\n \"thresholdsStyle\": {\n \"mode\": \"dashed\"\n }\n },\n \"custom\": {\n \"drawStyle\": \"lines\",\n \"lineInterpolation\": \"smooth\",\n \"spanNulls\": false,\n \"lineWidth\": 2,\n \"fillOpacity\": 0.3,\n \"gradientMode\": \"opacity\",\n \"stack\": \"off\",\n \"scaleDistribution\": {\n \"type\": \"linear\"\n },\n \"showPoints\": \"none\",\n \"pointSize\": 5\n },\n \"overrides\": [\n {\n \"matcher\": {\n \"id\": \"byFrameRefID\"\n },\n \"properties\": {\n \"rightYAxisDisplay\": \"off\"\n }\n }\n ]\n },\n {\n \"type\": \"timeseries\",\n \"id\": \"51e95b78-940e-4e5e-9cf5-7c8515209de0\",\n \"layout\": {\n \"h\": 7,\n \"w\": 8,\n \"x\": 16,\n \"y\": 25,\n \"i\": \"51e95b78-940e-4e5e-9cf5-7c8515209de0\",\n \"isResizable\": true\n },\n \"version\": \"3.1.0\",\n \"datasourceCate\": \"prometheus\",\n \"datasourceValue\": \"${prom}\",\n \"targets\": [\n {\n \"expr\": \"node_load1{instance=~\\\"$node\\\"}\",\n \"legend\": \"{{instance}} load1\",\n \"maxDataPoints\": 480,\n \"step\": 15\n },\n {\n \"expr\": \"node_load5{instance=~\\\"$node\\\"}\",\n \"legend\": \"{{instance}} load5\",\n \"maxDataPoints\": 480,\n \"step\": 15\n },\n {\n \"expr\": \"node_load15{instance=~\\\"$node\\\"}\",\n \"legend\": \"{{instance}} load15\",\n \"maxDataPoints\": 480,\n \"step\": 15\n }\n ],\n \"transformations\": [\n {\n \"id\": \"organize\",\n \"options\": {}\n }\n ],\n \"name\": \"CPU负载\",\n \"maxPerRow\": 4,\n \"options\": {\n \"tooltip\": {\n \"mode\": \"all\",\n \"sort\": \"desc\"\n },\n \"legend\": {\n \"displayMode\": \"hidden\",\n \"placement\": \"bottom\",\n \"behaviour\": \"showItem\",\n \"selectMode\": \"single\"\n },\n \"standardOptions\": {\n \"decimals\": 1\n },\n \"thresholds\": {\n \"mode\": \"absolute\",\n \"steps\": [\n {\n \"color\": \"rgb(44, 157, 61)\",\n \"value\": null,\n \"type\": \"base\"\n }\n ]\n },\n \"thresholdsStyle\": {\n \"mode\": \"dashed\"\n }\n },\n \"custom\": {\n \"drawStyle\": \"lines\",\n \"lineInterpolation\": \"smooth\",\n \"spanNulls\": false,\n \"lineWidth\": 2,\n \"fillOpacity\": 0.3,\n \"gradientMode\": \"opacity\",\n \"stack\": \"off\",\n \"scaleDistribution\": {\n \"type\": \"linear\"\n },\n \"showPoints\": \"none\",\n \"pointSize\": 5\n },\n \"overrides\": [\n {\n \"matcher\": {\n \"id\": \"byFrameRefID\"\n },\n \"properties\": {\n \"rightYAxisDisplay\": \"off\"\n }\n }\n ]\n },\n {\n \"collapsed\": true,\n \"id\": \"f3ab98b2-318b-451b-868e-d967555b7925\",\n \"layout\": {\n \"h\": 1,\n \"w\": 24,\n \"x\": 0,\n \"y\": 32,\n \"i\": \"f3ab98b2-318b-451b-868e-d967555b7925\",\n \"isResizable\": false\n },\n \"name\": \"内存详情\",\n \"type\": \"row\"\n },\n {\n \"type\": \"timeseries\",\n \"id\": \"6b084867-c1a4-4e7f-a0d7-5dd24524f82d\",\n \"layout\": {\n \"h\": 7,\n \"w\": 12,\n \"x\": 0,\n \"y\": 33,\n \"i\": \"6b084867-c1a4-4e7f-a0d7-5dd24524f82d\",\n \"isResizable\": true\n },\n \"version\": \"3.1.0\",\n \"datasourceCate\": \"prometheus\",\n \"datasourceValue\": \"${prom}\",\n \"targets\": [\n {\n \"expr\": \"node_memory_HugePages_Total{instance=~\\\"$node\\\"}\",\n \"legend\": \"\",\n \"maxDataPoints\": 480,\n \"step\": 15\n },\n {\n \"expr\": \"node_memory_Hugepagesize_bytes{instance=~\\\"$node\\\"}\",\n \"legend\": \"\",\n \"maxDataPoints\": 480,\n \"step\": 15\n },\n {\n \"expr\": \"node_memory_HugePages_Surp{instance=~\\\"$node\\\"}\",\n \"legend\": \"\",\n \"maxDataPoints\": 480,\n \"step\": 15\n },\n {\n \"expr\": \"node_memory_HugePages_Free{instance=~\\\"$node\\\"}\",\n \"legend\": \"\",\n \"maxDataPoints\": 480,\n \"step\": 15\n },\n {\n \"expr\": \"node_memory_HugePages_Rsvd{instance=~\\\"$node\\\"}\",\n \"legend\": \"\",\n \"maxDataPoints\": 480,\n \"step\": 15\n },\n {\n \"expr\": \"node_memory_AnonHugePages_bytes{instance=~\\\"$node\\\"}\",\n \"legend\": \"\",\n \"maxDataPoints\": 480,\n \"step\": 15\n },\n {\n \"expr\": \"node_memory_Inactive_file_bytes{instance=~\\\"$node\\\"}\",\n \"legend\": \"\",\n \"maxDataPoints\": 480,\n \"step\": 15\n },\n {\n \"expr\": \"node_memory_Inactive_anon_bytes{instance=~\\\"$node\\\"}\",\n \"legend\": \"\",\n \"maxDataPoints\": 480,\n \"step\": 15\n },\n {\n \"expr\": \"node_memory_Active_file_bytes{instance=~\\\"$node\\\"}\",\n \"legend\": \"\",\n \"maxDataPoints\": 480,\n \"step\": 15\n },\n {\n \"expr\": \"node_memory_Active_anon_bytes{instance=~\\\"$node\\\"}\",\n \"legend\": \"\",\n \"maxDataPoints\": 480,\n \"step\": 15\n },\n {\n \"expr\": \"node_memory_Unevictable_bytes{instance=~\\\"$node\\\"}\",\n \"legend\": \"\",\n \"maxDataPoints\": 480,\n \"step\": 15\n },\n {\n \"expr\": \"node_memory_AnonPages_bytes{instance=~\\\"$node\\\"}\",\n \"legend\": \"\",\n \"maxDataPoints\": 480,\n \"step\": 15\n },\n {\n \"expr\": \"node_memory_Shmem_bytes{instance=~\\\"$node\\\"}\",\n \"legend\": \"\",\n \"maxDataPoints\": 480,\n \"step\": 15\n },\n {\n \"expr\": \"node_memory_Mapped_bytes{instance=~\\\"$node\\\"}\",\n \"legend\": \"\",\n \"maxDataPoints\": 480,\n \"step\": 15\n },\n {\n \"expr\": \"node_memory_Cached_bytes{instance=~\\\"$node\\\"} \",\n \"legend\": \"\",\n \"maxDataPoints\": 480,\n \"step\": 15\n },\n {\n \"expr\": \"node_memory_SwapCached_bytes{instance=~\\\"$node\\\"}\",\n \"legend\": \"\",\n \"maxDataPoints\": 480,\n \"step\": 15\n },\n {\n \"expr\": \"node_memory_Mlocked_bytes{instance=~\\\"$node\\\"}\",\n \"legend\": \"\",\n \"maxDataPoints\": 480,\n \"step\": 15\n },\n {\n \"expr\": \"node_memory_Buffers_bytes{instance=~\\\"$node\\\"}\",\n \"legend\": \"\",\n \"maxDataPoints\": 480,\n \"step\": 15\n }\n ],\n \"transformations\": [\n {\n \"id\": \"organize\",\n \"options\": {}\n }\n ],\n \"name\": \"用户态内存使用\",\n \"description\": \"\",\n \"maxPerRow\": 4,\n \"options\": {\n \"tooltip\": {\n \"mode\": \"single\"\n },\n \"legend\": {\n \"displayMode\": \"table\",\n \"placement\": \"bottom\",\n \"columns\": [\n \"last\"\n ],\n \"behaviour\": \"showItem\",\n \"selectMode\": \"single\",\n \"heightInPercentage\": null\n },\n \"standardOptions\": {\n \"util\": \"bytesIEC\",\n \"decimals\": 1\n },\n \"thresholds\": {\n \"mode\": \"absolute\",\n \"steps\": [\n {\n \"color\": \"rgb(44, 157, 61)\",\n \"value\": null,\n \"type\": \"base\"\n }\n ]\n },\n \"thresholdsStyle\": {\n \"mode\": \"dashed\"\n }\n },\n \"custom\": {\n \"drawStyle\": \"lines\",\n \"lineInterpolation\": \"smooth\",\n \"spanNulls\": false,\n \"lineWidth\": 2,\n \"fillOpacity\": 0.3,\n \"gradientMode\": \"opacity\",\n \"stack\": \"off\",\n \"scaleDistribution\": {\n \"type\": \"linear\"\n },\n \"showPoints\": \"none\",\n \"pointSize\": 5\n },\n \"overrides\": [\n {\n \"matcher\": {\n \"id\": \"byFrameRefID\"\n },\n \"properties\": {\n \"rightYAxisDisplay\": \"off\"\n }\n }\n ]\n },\n {\n \"type\": \"timeseries\",\n \"id\": \"10b1dde7-7cad-4992-be3f-7e8c8aac8c03\",\n \"layout\": {\n \"h\": 7,\n \"w\": 12,\n \"x\": 12,\n \"y\": 33,\n \"i\": \"10b1dde7-7cad-4992-be3f-7e8c8aac8c03\",\n \"isResizable\": true\n },\n \"version\": \"3.1.0\",\n \"datasourceCate\": \"prometheus\",\n \"datasourceValue\": \"${prom}\",\n \"targets\": [\n {\n \"expr\": \"node_memory_Slab_bytes{instance=~\\\"$node\\\"}\",\n \"legend\": \"\",\n \"maxDataPoints\": 480,\n \"step\": 15\n },\n {\n \"expr\": \"node_memory_SReclaimable_bytes{instance=~\\\"$node\\\"}\",\n \"legend\": \"\",\n \"maxDataPoints\": 480,\n \"step\": 15\n },\n {\n \"expr\": \"node_memory_SUnreclaim_bytes{instance=~\\\"$node\\\"}\",\n \"legend\": \"\",\n \"maxDataPoints\": 480,\n \"step\": 15\n },\n {\n \"expr\": \"node_memory_VmallocUsed_bytes{instance=~\\\"$node\\\"}\",\n \"legend\": \"\",\n \"maxDataPoints\": 480,\n \"step\": 15\n },\n {\n \"expr\": \"node_memory_VmallocChunk_bytes{instance=~\\\"$node\\\"}\",\n \"legend\": \"\",\n \"maxDataPoints\": 480,\n \"step\": 15\n },\n {\n \"expr\": \"node_memory_KernelStack_bytes{instance=~\\\"$node\\\"}\",\n \"legend\": \"\",\n \"maxDataPoints\": 480,\n \"step\": 15\n },\n {\n \"expr\": \"node_memory_Bounce_bytes{instance=~\\\"$node\\\"}\",\n \"legend\": \"\",\n \"maxDataPoints\": 480,\n \"step\": 15\n }\n ],\n \"transformations\": [\n {\n \"id\": \"organize\",\n \"options\": {}\n }\n ],\n \"name\": \"内核态内存使用\",\n \"description\": \"\",\n \"maxPerRow\": 4,\n \"options\": {\n \"tooltip\": {\n \"mode\": \"single\"\n },\n \"legend\": {\n \"displayMode\": \"table\",\n \"placement\": \"bottom\",\n \"columns\": [\n \"last\"\n ],\n \"behaviour\": \"showItem\",\n \"selectMode\": \"single\"\n },\n \"standardOptions\": {\n \"util\": \"bytesIEC\",\n \"decimals\": 1\n },\n \"thresholds\": {\n \"mode\": \"absolute\",\n \"steps\": [\n {\n \"color\": \"rgb(44, 157, 61)\",\n \"value\": null,\n \"type\": \"base\"\n }\n ]\n },\n \"thresholdsStyle\": {\n \"mode\": \"dashed\"\n }\n },\n \"custom\": {\n \"drawStyle\": \"lines\",\n \"lineInterpolation\": \"smooth\",\n \"spanNulls\": false,\n \"lineWidth\": 2,\n \"fillOpacity\": 0.3,\n \"gradientMode\": \"opacity\",\n \"stack\": \"off\",\n \"scaleDistribution\": {\n \"type\": \"linear\"\n },\n \"showPoints\": \"none\",\n \"pointSize\": 5\n },\n \"overrides\": [\n {\n \"matcher\": {\n \"id\": \"byFrameRefID\"\n },\n \"properties\": {\n \"rightYAxisDisplay\": \"off\"\n }\n }\n ]\n },\n {\n \"type\": \"timeseries\",\n \"id\": \"ea5480e7-ec20-41e5-a007-74c846fae91a\",\n \"layout\": {\n \"h\": 7,\n \"w\": 12,\n \"x\": 0,\n \"y\": 40,\n \"i\": \"ea5480e7-ec20-41e5-a007-74c846fae91a\",\n \"isResizable\": true\n },\n \"version\": \"3.1.0\",\n \"datasourceCate\": \"prometheus\",\n \"datasourceValue\": \"${prom}\",\n \"targets\": [\n {\n \"expr\": \"node_memory_DirectMap1G_bytes{instance=~\\\"$node\\\"}\",\n \"legend\": \"\",\n \"maxDataPoints\": 480,\n \"step\": 15\n },\n {\n \"expr\": \"node_memory_DirectMap2M_bytes{instance=~\\\"$node\\\"}\",\n \"legend\": \"\",\n \"maxDataPoints\": 480,\n \"step\": 15\n },\n {\n \"expr\": \"node_memory_DirectMap4k_bytes{instance=~\\\"$node\\\"}\",\n \"legend\": \"\",\n \"maxDataPoints\": 480,\n \"step\": 15\n }\n ],\n \"transformations\": [\n {\n \"id\": \"organize\",\n \"options\": {}\n }\n ],\n \"name\": \"TLB效率\",\n \"description\": \"/proc/meminfo中的DirectMap所统计的不是关于内存的使用,而是一个反映TLB效率的指标。TLB(Translation Lookaside Buffer)是位于CPU上的缓存,用于将内存的虚拟地址翻译成物理地址,由于TLB的大小有限,不能缓存的地址就需要访问内存里的page table来进行翻译,速度慢很多。为了尽可能地将地址放进TLB缓存,新的CPU硬件支持比4k更大的页面从而达到减少地址数量的目的, 比如2MB,4MB,甚至1GB的内存页,视不同的硬件而定。”DirectMap4k”表示映射为4kB的内存数量, “DirectMap2M”表示映射为2MB的内存数量,以此类推。所以DirectMap其实是一个反映TLB效率的指标\",\n \"maxPerRow\": 4,\n \"options\": {\n \"tooltip\": {\n \"mode\": \"single\"\n },\n \"legend\": {\n \"displayMode\": \"table\",\n \"placement\": \"bottom\",\n \"columns\": [\n \"last\"\n ],\n \"behaviour\": \"showItem\",\n \"selectMode\": \"single\"\n },\n \"standardOptions\": {\n \"util\": \"bytesIEC\",\n \"decimals\": 1\n },\n \"thresholds\": {\n \"mode\": \"absolute\",\n \"steps\": [\n {\n \"color\": \"rgb(44, 157, 61)\",\n \"value\": null,\n \"type\": \"base\"\n }\n ]\n },\n \"thresholdsStyle\": {\n \"mode\": \"dashed\"\n }\n },\n \"custom\": {\n \"drawStyle\": \"lines\",\n \"lineInterpolation\": \"smooth\",\n \"spanNulls\": false,\n \"lineWidth\": 2,\n \"fillOpacity\": 0.3,\n \"gradientMode\": \"opacity\",\n \"stack\": \"off\",\n \"scaleDistribution\": {\n \"type\": \"linear\"\n },\n \"showPoints\": \"none\",\n \"pointSize\": 5\n },\n \"overrides\": [\n {\n \"matcher\": {\n \"id\": \"byFrameRefID\"\n },\n \"properties\": {\n \"rightYAxisDisplay\": \"off\"\n }\n }\n ]\n },\n {\n \"type\": \"timeseries\",\n \"id\": \"8d31c2aa-38c9-434e-8c93-4cbae4e1bd8d\",\n \"layout\": {\n \"h\": 7,\n \"w\": 12,\n \"x\": 12,\n \"y\": 40,\n \"i\": \"8d31c2aa-38c9-434e-8c93-4cbae4e1bd8d\",\n \"isResizable\": true\n },\n \"version\": \"3.1.0\",\n \"datasourceCate\": \"prometheus\",\n \"datasourceValue\": \"${prom}\",\n \"targets\": [\n {\n \"expr\": \"node_memory_NFS_Unstable_bytes{instance=~\\\"$node\\\"}\",\n \"legend\": \"\",\n \"maxDataPoints\": 480,\n \"step\": 15\n },\n {\n \"expr\": \"node_memory_Writeback_bytes{instance=~\\\"$node\\\"}\",\n \"legend\": \"\",\n \"maxDataPoints\": 480,\n \"step\": 15\n },\n {\n \"expr\": \"node_memory_Dirty_bytes{instance=~\\\"$node\\\"}\",\n \"legend\": \"\",\n \"maxDataPoints\": 480,\n \"step\": 15\n }\n ],\n \"transformations\": [\n {\n \"id\": \"organize\",\n \"options\": {}\n }\n ],\n \"name\": \"dirty page\",\n \"maxPerRow\": 4,\n \"options\": {\n \"tooltip\": {\n \"mode\": \"single\"\n },\n \"legend\": {\n \"displayMode\": \"table\",\n \"placement\": \"bottom\",\n \"columns\": [\n \"last\"\n ],\n \"behaviour\": \"showItem\",\n \"selectMode\": \"single\"\n },\n \"standardOptions\": {\n \"util\": \"bytesIEC\",\n \"decimals\": 1\n },\n \"thresholds\": {\n \"mode\": \"absolute\",\n \"steps\": [\n {\n \"color\": \"rgb(44, 157, 61)\",\n \"value\": null,\n \"type\": \"base\"\n }\n ]\n },\n \"thresholdsStyle\": {\n \"mode\": \"dashed\"\n }\n },\n \"custom\": {\n \"drawStyle\": \"lines\",\n \"lineInterpolation\": \"smooth\",\n \"spanNulls\": false,\n \"lineWidth\": 2,\n \"fillOpacity\": 0.3,\n \"gradientMode\": \"opacity\",\n \"stack\": \"off\",\n \"scaleDistribution\": {\n \"type\": \"linear\"\n },\n \"showPoints\": \"none\",\n \"pointSize\": 5\n },\n \"overrides\": [\n {\n \"matcher\": {\n \"id\": \"byFrameRefID\"\n },\n \"properties\": {\n \"rightYAxisDisplay\": \"off\"\n }\n }\n ]\n },\n {\n \"collapsed\": true,\n \"id\": \"88aeb766-214b-43a9-85f3-9ec6368f0da0\",\n \"layout\": {\n \"h\": 1,\n \"w\": 24,\n \"x\": 0,\n \"y\": 47,\n \"i\": \"88aeb766-214b-43a9-85f3-9ec6368f0da0\",\n \"isResizable\": false\n },\n \"name\": \"磁盘详情\",\n \"type\": \"row\"\n },\n {\n \"type\": \"timeseries\",\n \"id\": \"c06c49fa-60ce-4982-bfe5-1d5012dc4af1\",\n \"layout\": {\n \"h\": 6,\n \"w\": 6,\n \"x\": 0,\n \"y\": 48,\n \"i\": \"c06c49fa-60ce-4982-bfe5-1d5012dc4af1\",\n \"isResizable\": true\n },\n \"version\": \"3.1.0\",\n \"datasourceCate\": \"prometheus\",\n \"datasourceValue\": \"${prom}\",\n \"targets\": [\n {\n \"expr\": \"rate(node_disk_read_time_seconds_total{instance=~\\\"$node\\\"}[$__rate_interval]) / rate(node_disk_reads_completed_total{instance=~\\\"$node\\\"}[$__rate_interval])\\n+\\nrate(node_disk_write_time_seconds_total{instance=~\\\"$node\\\"}[$__rate_interval]) / rate(node_disk_writes_completed_total{instance=~\\\"$node\\\"}[$__rate_interval])\",\n \"legend\": \"\",\n \"maxDataPoints\": 480,\n \"step\": 15\n }\n ],\n \"transformations\": [\n {\n \"id\": \"organize\",\n \"options\": {}\n }\n ],\n \"name\": \"io await\",\n \"maxPerRow\": 4,\n \"options\": {\n \"tooltip\": {\n \"mode\": \"all\",\n \"sort\": \"desc\"\n },\n \"legend\": {\n \"displayMode\": \"hidden\",\n \"placement\": \"bottom\",\n \"behaviour\": \"showItem\",\n \"selectMode\": \"single\"\n },\n \"standardOptions\": {\n \"util\": \"seconds\",\n \"decimals\": 2\n },\n \"thresholds\": {\n \"mode\": \"absolute\",\n \"steps\": [\n {\n \"color\": \"rgb(44, 157, 61)\",\n \"value\": null,\n \"type\": \"base\"\n }\n ]\n },\n \"thresholdsStyle\": {\n \"mode\": \"dashed\"\n }\n },\n \"custom\": {\n \"drawStyle\": \"lines\",\n \"lineInterpolation\": \"smooth\",\n \"spanNulls\": false,\n \"lineWidth\": 2,\n \"fillOpacity\": 0.3,\n \"gradientMode\": \"opacity\",\n \"stack\": \"off\",\n \"scaleDistribution\": {\n \"type\": \"linear\"\n },\n \"showPoints\": \"none\",\n \"pointSize\": 5\n },\n \"overrides\": [\n {\n \"matcher\": {\n \"id\": \"byFrameRefID\"\n },\n \"properties\": {\n \"rightYAxisDisplay\": \"off\"\n }\n }\n ]\n },\n {\n \"type\": \"timeseries\",\n \"id\": \"b516483d-ea9b-4f4c-9fdc-5ac70fe159d2\",\n \"layout\": {\n \"h\": 6,\n \"w\": 6,\n \"x\": 6,\n \"y\": 48,\n \"i\": \"b516483d-ea9b-4f4c-9fdc-5ac70fe159d2\",\n \"isResizable\": true\n },\n \"version\": \"3.1.0\",\n \"datasourceCate\": \"prometheus\",\n \"datasourceValue\": \"${prom}\",\n \"targets\": [\n {\n \"expr\": \"rate(node_disk_read_bytes_total{instance=~\\\"$node\\\"}[$__rate_interval])\",\n \"legend\": \"{{instance}} {{device}}-Read\",\n \"maxDataPoints\": 480,\n \"step\": 15\n },\n {\n \"expr\": \"rate(node_disk_written_bytes_total{instance=~\\\"$node\\\"}[$__rate_interval])\",\n \"legend\": \"{{instance}} {{device}}-Write\",\n \"maxDataPoints\": 480,\n \"step\": 15\n }\n ],\n \"transformations\": [\n {\n \"id\": \"organize\",\n \"options\": {}\n }\n ],\n \"name\": \"每秒读写数据大小\",\n \"maxPerRow\": 4,\n \"options\": {\n \"tooltip\": {\n \"mode\": \"all\",\n \"sort\": \"desc\"\n },\n \"legend\": {\n \"displayMode\": \"hidden\",\n \"placement\": \"bottom\",\n \"behaviour\": \"showItem\",\n \"selectMode\": \"single\"\n },\n \"standardOptions\": {\n \"util\": \"bytesSecIEC\",\n \"decimals\": 1\n },\n \"thresholds\": {\n \"mode\": \"absolute\",\n \"steps\": [\n {\n \"color\": \"rgb(44, 157, 61)\",\n \"value\": null,\n \"type\": \"base\"\n }\n ]\n },\n \"thresholdsStyle\": {\n \"mode\": \"dashed\"\n }\n },\n \"custom\": {\n \"drawStyle\": \"lines\",\n \"lineInterpolation\": \"smooth\",\n \"spanNulls\": false,\n \"lineWidth\": 2,\n \"fillOpacity\": 0.3,\n \"gradientMode\": \"opacity\",\n \"stack\": \"off\",\n \"scaleDistribution\": {\n \"type\": \"linear\"\n },\n \"showPoints\": \"none\",\n \"pointSize\": 5\n },\n \"overrides\": [\n {\n \"matcher\": {\n \"id\": \"byFrameRefID\"\n },\n \"properties\": {\n \"rightYAxisDisplay\": \"off\"\n }\n }\n ]\n },\n {\n \"type\": \"timeseries\",\n \"id\": \"b118aac2-217d-4fb3-881a-7926f0e8078e\",\n \"layout\": {\n \"h\": 6,\n \"w\": 6,\n \"x\": 12,\n \"y\": 48,\n \"i\": \"b118aac2-217d-4fb3-881a-7926f0e8078e\",\n \"isResizable\": true\n },\n \"version\": \"3.1.0\",\n \"datasourceCate\": \"prometheus\",\n \"datasourceValue\": \"${prom}\",\n \"targets\": [\n {\n \"expr\": \"rate(node_disk_reads_completed_total{instance=~\\\"$node\\\"}[$__rate_interval])\",\n \"legend\": \"{{instance}} {{device}} - Reads\",\n \"maxDataPoints\": 480,\n \"step\": 15\n },\n {\n \"expr\": \"rate(node_disk_writes_completed_total{instance=~\\\"$node\\\"}[$__rate_interval])\",\n \"legend\": \"{{instance}} {{device}} - Writes\",\n \"maxDataPoints\": 480,\n \"step\": 15\n },\n {\n \"expr\": \"rate(node_disk_reads_merged_total{instance=~\\\"$node\\\"}[$__rate_interval])\",\n \"legend\": \"{{instance}} {{device}} - Read merged\",\n \"maxDataPoints\": 480,\n \"step\": 15\n },\n {\n \"expr\": \"rate(node_disk_writes_merged_total{instance=~\\\"$node\\\"}[$__rate_interval])\",\n \"legend\": \"{{instance}} {{device}} - Write merged\",\n \"maxDataPoints\": 480,\n \"step\": 15\n }\n ],\n \"transformations\": [\n {\n \"id\": \"organize\",\n \"options\": {}\n }\n ],\n \"name\": \"IO/Merged次数\",\n \"maxPerRow\": 4,\n \"options\": {\n \"tooltip\": {\n \"mode\": \"all\",\n \"sort\": \"desc\"\n },\n \"legend\": {\n \"displayMode\": \"hidden\",\n \"placement\": \"bottom\",\n \"behaviour\": \"showItem\",\n \"selectMode\": \"single\"\n },\n \"standardOptions\": {\n \"util\": \"iops\",\n \"decimals\": 2\n },\n \"thresholds\": {\n \"mode\": \"absolute\",\n \"steps\": [\n {\n \"color\": \"rgb(44, 157, 61)\",\n \"value\": null,\n \"type\": \"base\"\n }\n ]\n },\n \"thresholdsStyle\": {\n \"mode\": \"dashed\"\n }\n },\n \"custom\": {\n \"drawStyle\": \"lines\",\n \"lineInterpolation\": \"smooth\",\n \"spanNulls\": false,\n \"lineWidth\": 2,\n \"fillOpacity\": 0.3,\n \"gradientMode\": \"opacity\",\n \"stack\": \"off\",\n \"scaleDistribution\": {\n \"type\": \"linear\"\n },\n \"showPoints\": \"none\",\n \"pointSize\": 5\n },\n \"overrides\": [\n {\n \"matcher\": {\n \"id\": \"byFrameRefID\"\n },\n \"properties\": {\n \"rightYAxisDisplay\": \"off\"\n }\n }\n ]\n },\n {\n \"type\": \"timeseries\",\n \"id\": \"362bfd2d-2ef2-49a0-b64e-14264495672c\",\n \"layout\": {\n \"h\": 6,\n \"w\": 6,\n \"x\": 18,\n \"y\": 48,\n \"i\": \"362bfd2d-2ef2-49a0-b64e-14264495672c\",\n \"isResizable\": true\n },\n \"version\": \"3.1.0\",\n \"datasourceCate\": \"prometheus\",\n \"datasourceValue\": \"${prom}\",\n \"targets\": [\n {\n \"expr\": \"node_filesystem_readonly{instance=~\\\"$node\\\",device!~'rootfs',device!~\\\"tmpfs\\\",mountpoint!~\\\"/var/lib.*\\\"}\",\n \"legend\": \"{{instance}} {{mountpoint}} - ReadOnly\",\n \"maxDataPoints\": 480,\n \"step\": 15\n }\n ],\n \"transformations\": [\n {\n \"id\": \"organize\",\n \"options\": {}\n }\n ],\n \"name\": \"硬盘 ReadOnly\",\n \"maxPerRow\": 4,\n \"options\": {\n \"tooltip\": {\n \"mode\": \"all\",\n \"sort\": \"desc\"\n },\n \"legend\": {\n \"displayMode\": \"hidden\",\n \"placement\": \"bottom\",\n \"behaviour\": \"showItem\",\n \"selectMode\": \"single\"\n },\n \"standardOptions\": {},\n \"thresholds\": {\n \"mode\": \"absolute\",\n \"steps\": [\n {\n \"color\": \"rgb(44, 157, 61)\",\n \"value\": null,\n \"type\": \"base\"\n }\n ]\n },\n \"thresholdsStyle\": {\n \"mode\": \"dashed\"\n }\n },\n \"custom\": {\n \"drawStyle\": \"lines\",\n \"lineInterpolation\": \"smooth\",\n \"spanNulls\": false,\n \"lineWidth\": 2,\n \"fillOpacity\": 0,\n \"gradientMode\": \"opacity\",\n \"stack\": \"off\",\n \"scaleDistribution\": {\n \"type\": \"linear\"\n },\n \"showPoints\": \"none\",\n \"pointSize\": 5\n },\n \"overrides\": [\n {\n \"matcher\": {\n \"id\": \"byFrameRefID\"\n },\n \"properties\": {\n \"rightYAxisDisplay\": \"off\"\n }\n }\n ]\n },\n {\n \"type\": \"timeseries\",\n \"id\": \"1c19b6ae-95fb-4358-bd01-bb0beec8d619\",\n \"layout\": {\n \"h\": 6,\n \"w\": 12,\n \"x\": 0,\n \"y\": 54,\n \"i\": \"1c19b6ae-95fb-4358-bd01-bb0beec8d619\",\n \"isResizable\": true\n },\n \"version\": \"3.1.0\",\n \"datasourceCate\": \"prometheus\",\n \"datasourceValue\": \"${prom}\",\n \"targets\": [\n {\n \"expr\": \"(rate(node_disk_read_bytes_total{instance=~\\\"$node\\\"}[$__rate_interval]) + rate(node_disk_written_bytes_total{instance=~\\\"$node\\\"}[$__rate_interval]))\\n/\\n(rate(node_disk_reads_completed_total{instance=~\\\"$node\\\"}[$__rate_interval]) + rate(node_disk_writes_completed_total{instance=~\\\"$node\\\"}[$__rate_interval]))\",\n \"legend\": \"\",\n \"maxDataPoints\": 480,\n \"step\": 15\n }\n ],\n \"transformations\": [\n {\n \"id\": \"organize\",\n \"options\": {}\n }\n ],\n \"name\": \"avgrq-sz\",\n \"maxPerRow\": 4,\n \"options\": {\n \"tooltip\": {\n \"mode\": \"all\",\n \"sort\": \"desc\"\n },\n \"legend\": {\n \"displayMode\": \"hidden\",\n \"placement\": \"bottom\",\n \"behaviour\": \"showItem\",\n \"selectMode\": \"single\"\n },\n \"standardOptions\": {\n \"decimals\": 2\n },\n \"thresholds\": {\n \"mode\": \"absolute\",\n \"steps\": [\n {\n \"color\": \"rgb(44, 157, 61)\",\n \"value\": null,\n \"type\": \"base\"\n }\n ]\n },\n \"thresholdsStyle\": {\n \"mode\": \"dashed\"\n }\n },\n \"custom\": {\n \"drawStyle\": \"lines\",\n \"lineInterpolation\": \"smooth\",\n \"spanNulls\": false,\n \"lineWidth\": 2,\n \"fillOpacity\": 0.3,\n \"gradientMode\": \"opacity\",\n \"stack\": \"off\",\n \"scaleDistribution\": {\n \"type\": \"linear\"\n },\n \"showPoints\": \"none\",\n \"pointSize\": 5\n },\n \"overrides\": [\n {\n \"matcher\": {\n \"id\": \"byFrameRefID\"\n },\n \"properties\": {\n \"rightYAxisDisplay\": \"off\"\n }\n }\n ]\n },\n {\n \"type\": \"timeseries\",\n \"id\": \"8da1e948-283d-4e68-990f-8e6c9af22d05\",\n \"layout\": {\n \"h\": 6,\n \"w\": 6,\n \"x\": 12,\n \"y\": 54,\n \"i\": \"8da1e948-283d-4e68-990f-8e6c9af22d05\",\n \"isResizable\": true\n },\n \"version\": \"3.1.0\",\n \"datasourceCate\": \"prometheus\",\n \"datasourceValue\": \"${prom}\",\n \"targets\": [\n {\n \"expr\": \"rate(node_disk_io_time_weighted_seconds_total{instance=~\\\"$node\\\"}[$__rate_interval])\\n\",\n \"legend\": \"\",\n \"maxDataPoints\": 480,\n \"step\": 15\n }\n ],\n \"transformations\": [\n {\n \"id\": \"organize\",\n \"options\": {}\n }\n ],\n \"name\": \"avgqu-sz\",\n \"maxPerRow\": 4,\n \"options\": {\n \"tooltip\": {\n \"mode\": \"all\",\n \"sort\": \"none\"\n },\n \"legend\": {\n \"displayMode\": \"hidden\",\n \"placement\": \"bottom\",\n \"behaviour\": \"showItem\",\n \"selectMode\": \"single\"\n },\n \"standardOptions\": {\n \"decimals\": 2\n },\n \"thresholds\": {\n \"mode\": \"absolute\",\n \"steps\": [\n {\n \"color\": \"rgb(44, 157, 61)\",\n \"value\": null,\n \"type\": \"base\"\n }\n ]\n },\n \"thresholdsStyle\": {\n \"mode\": \"dashed\"\n }\n },\n \"custom\": {\n \"drawStyle\": \"lines\",\n \"lineInterpolation\": \"smooth\",\n \"spanNulls\": false,\n \"lineWidth\": 2,\n \"fillOpacity\": 0.3,\n \"gradientMode\": \"opacity\",\n \"stack\": \"off\",\n \"scaleDistribution\": {\n \"type\": \"linear\"\n },\n \"showPoints\": \"none\",\n \"pointSize\": 5\n },\n \"overrides\": [\n {\n \"matcher\": {\n \"id\": \"byFrameRefID\"\n },\n \"properties\": {\n \"rightYAxisDisplay\": \"off\"\n }\n }\n ]\n },\n {\n \"type\": \"timeseries\",\n \"id\": \"925fc17e-565d-4c16-a8fb-9a6d07d446c6\",\n \"layout\": {\n \"h\": 6,\n \"w\": 6,\n \"x\": 18,\n \"y\": 54,\n \"i\": \"41e3a384-7fdd-4da3-90cf-068f0058fac1\",\n \"isResizable\": true\n },\n \"version\": \"3.1.0\",\n \"datasourceCate\": \"prometheus\",\n \"datasourceValue\": \"${prom}\",\n \"targets\": [\n {\n \"expr\": \"node_filesystem_device_error{instance=~\\\"$node\\\",device!~'rootfs',device!~\\\"tmpfs\\\",mountpoint!~\\\"/var/lib.*\\\"}\",\n \"legend\": \"{{instance}} {{mountpoint}} - Device error\",\n \"maxDataPoints\": 480\n }\n ],\n \"transformations\": [\n {\n \"id\": \"organize\",\n \"options\": {}\n }\n ],\n \"name\": \"硬盘设备错误\",\n \"maxPerRow\": 4,\n \"options\": {\n \"tooltip\": {\n \"mode\": \"all\",\n \"sort\": \"desc\"\n },\n \"legend\": {\n \"displayMode\": \"hidden\",\n \"placement\": \"bottom\",\n \"behaviour\": \"showItem\",\n \"selectMode\": \"single\"\n },\n \"standardOptions\": {},\n \"thresholds\": {\n \"mode\": \"absolute\",\n \"steps\": [\n {\n \"color\": \"rgb(44, 157, 61)\",\n \"value\": null,\n \"type\": \"base\"\n }\n ]\n },\n \"thresholdsStyle\": {\n \"mode\": \"dashed\"\n }\n },\n \"custom\": {\n \"drawStyle\": \"lines\",\n \"lineInterpolation\": \"smooth\",\n \"spanNulls\": false,\n \"lineWidth\": 2,\n \"fillOpacity\": 0,\n \"gradientMode\": \"none\",\n \"stack\": \"off\",\n \"scaleDistribution\": {\n \"type\": \"linear\"\n },\n \"showPoints\": \"none\",\n \"pointSize\": 5\n },\n \"overrides\": [\n {\n \"matcher\": {\n \"id\": \"byFrameRefID\"\n },\n \"properties\": {\n \"rightYAxisDisplay\": \"off\"\n }\n }\n ]\n },\n {\n \"collapsed\": true,\n \"id\": \"8fb70dca-4296-45a6-8dd3-770fc898ee65\",\n \"layout\": {\n \"h\": 1,\n \"w\": 24,\n \"x\": 0,\n \"y\": 60,\n \"i\": \"8fb70dca-4296-45a6-8dd3-770fc898ee65\",\n \"isResizable\": false\n },\n \"name\": \"网络详情\",\n \"type\": \"row\"\n },\n {\n \"type\": \"timeseries\",\n \"id\": \"ae5d7236-c89f-4fb3-ae5c-e70cb03cb168\",\n \"layout\": {\n \"h\": 6,\n \"w\": 6,\n \"x\": 0,\n \"y\": 61,\n \"i\": \"ae5d7236-c89f-4fb3-ae5c-e70cb03cb168\",\n \"isResizable\": true\n },\n \"version\": \"3.1.0\",\n \"datasourceCate\": \"prometheus\",\n \"datasourceValue\": \"${prom}\",\n \"targets\": [\n {\n \"expr\": \"rate(node_network_receive_bytes_total{instance=~\\\"$node\\\",device=~\\\"e.*\\\"}[$__rate_interval])*8\",\n \"legend\": \"{{instance}} {{device}} - in\",\n \"maxDataPoints\": 480,\n \"step\": 15\n },\n {\n \"expr\": \"rate(node_network_transmit_bytes_total{instance=~\\\"$node\\\",device=~\\\"e.*\\\"}[$__rate_interval])*8\",\n \"legend\": \"{{instance}} {{device}} - out\",\n \"maxDataPoints\": 480,\n \"step\": 15\n }\n ],\n \"transformations\": [\n {\n \"id\": \"organize\",\n \"options\": {}\n }\n ],\n \"name\": \"出入流量大小\",\n \"maxPerRow\": 4,\n \"options\": {\n \"tooltip\": {\n \"mode\": \"all\",\n \"sort\": \"desc\"\n },\n \"legend\": {\n \"displayMode\": \"hidden\",\n \"placement\": \"bottom\",\n \"behaviour\": \"showItem\",\n \"selectMode\": \"single\"\n },\n \"standardOptions\": {\n \"util\": \"bitsSecSI\",\n \"decimals\": 2\n },\n \"thresholds\": {\n \"mode\": \"absolute\",\n \"steps\": [\n {\n \"color\": \"rgb(44, 157, 61)\",\n \"value\": null,\n \"type\": \"base\"\n }\n ]\n },\n \"thresholdsStyle\": {\n \"mode\": \"dashed\"\n }\n },\n \"custom\": {\n \"drawStyle\": \"lines\",\n \"lineInterpolation\": \"smooth\",\n \"spanNulls\": false,\n \"lineWidth\": 2,\n \"fillOpacity\": 0.3,\n \"gradientMode\": \"opacity\",\n \"stack\": \"off\",\n \"scaleDistribution\": {\n \"type\": \"linear\"\n },\n \"showPoints\": \"none\",\n \"pointSize\": 5\n },\n \"overrides\": [\n {\n \"matcher\": {\n \"id\": \"byFrameRefID\"\n },\n \"properties\": {\n \"rightYAxisDisplay\": \"off\"\n }\n }\n ]\n },\n {\n \"type\": \"timeseries\",\n \"id\": \"9cc72d79-c0bd-440d-849a-bf8af74a2b6c\",\n \"layout\": {\n \"h\": 6,\n \"w\": 6,\n \"x\": 6,\n \"y\": 61,\n \"i\": \"9cc72d79-c0bd-440d-849a-bf8af74a2b6c\",\n \"isResizable\": true\n },\n \"version\": \"3.1.0\",\n \"datasourceCate\": \"prometheus\",\n \"datasourceValue\": \"${prom}\",\n \"targets\": [\n {\n \"expr\": \"rate(node_network_receive_packets_total{instance=~\\\"$node\\\",device=~\\\"e.*\\\"}[$__rate_interval])\",\n \"legend\": \"{{instance}} {{device}} - in\",\n \"maxDataPoints\": 480,\n \"step\": 15\n },\n {\n \"expr\": \"rate(node_network_transmit_packets_total{instance=~\\\"$node\\\",device=~\\\"e.*\\\"}[$__rate_interval])\",\n \"legend\": \"{{instance}} {{device}} - out\",\n \"maxDataPoints\": 480,\n \"step\": 15\n }\n ],\n \"transformations\": [\n {\n \"id\": \"organize\",\n \"options\": {}\n }\n ],\n \"name\": \"packets\",\n \"maxPerRow\": 4,\n \"options\": {\n \"tooltip\": {\n \"mode\": \"all\",\n \"sort\": \"none\"\n },\n \"legend\": {\n \"displayMode\": \"hidden\",\n \"placement\": \"bottom\",\n \"behaviour\": \"showItem\",\n \"selectMode\": \"single\"\n },\n \"standardOptions\": {\n \"util\": \"packetsSec\",\n \"decimals\": 2\n },\n \"thresholds\": {\n \"mode\": \"absolute\",\n \"steps\": [\n {\n \"color\": \"rgb(44, 157, 61)\",\n \"value\": null,\n \"type\": \"base\"\n }\n ]\n },\n \"thresholdsStyle\": {\n \"mode\": \"dashed\"\n }\n },\n \"custom\": {\n \"drawStyle\": \"lines\",\n \"lineInterpolation\": \"smooth\",\n \"spanNulls\": false,\n \"lineWidth\": 2,\n \"fillOpacity\": 0.3,\n \"gradientMode\": \"opacity\",\n \"stack\": \"off\",\n \"scaleDistribution\": {\n \"type\": \"linear\"\n },\n \"showPoints\": \"none\",\n \"pointSize\": 5\n },\n \"overrides\": [\n {\n \"matcher\": {\n \"id\": \"byFrameRefID\"\n },\n \"properties\": {\n \"rightYAxisDisplay\": \"off\"\n }\n }\n ]\n },\n {\n \"type\": \"timeseries\",\n \"id\": \"8b54d503-daa0-4bea-bb00-d9c723123efd\",\n \"layout\": {\n \"h\": 6,\n \"w\": 6,\n \"x\": 12,\n \"y\": 61,\n \"i\": \"8b54d503-daa0-4bea-bb00-d9c723123efd\",\n \"isResizable\": true\n },\n \"version\": \"3.1.0\",\n \"datasourceCate\": \"prometheus\",\n \"datasourceValue\": \"${prom}\",\n \"targets\": [\n {\n \"expr\": \"rate(node_network_receive_errs_total{instance=~\\\"$node\\\",device=~\\\"e.*\\\"}[$__rate_interval])\",\n \"legend\": \"{{instance}} {{device}} - in\",\n \"maxDataPoints\": 480,\n \"step\": 15\n },\n {\n \"expr\": \"rate(node_network_transmit_errs_total{instance=~\\\"$node\\\",device=~\\\"e.*\\\"}[$__rate_interval])\",\n \"legend\": \"{{instance}} {{device}} - out\",\n \"maxDataPoints\": 480,\n \"step\": 15\n }\n ],\n \"transformations\": [\n {\n \"id\": \"organize\",\n \"options\": {}\n }\n ],\n \"name\": \"error\",\n \"maxPerRow\": 4,\n \"options\": {\n \"tooltip\": {\n \"mode\": \"all\",\n \"sort\": \"none\"\n },\n \"legend\": {\n \"displayMode\": \"hidden\",\n \"placement\": \"bottom\",\n \"behaviour\": \"showItem\",\n \"selectMode\": \"single\"\n },\n \"standardOptions\": {\n \"util\": \"packetsSec\",\n \"decimals\": 2\n },\n \"thresholds\": {\n \"mode\": \"absolute\",\n \"steps\": [\n {\n \"color\": \"rgb(44, 157, 61)\",\n \"value\": null,\n \"type\": \"base\"\n }\n ]\n },\n \"thresholdsStyle\": {\n \"mode\": \"dashed\"\n }\n },\n \"custom\": {\n \"drawStyle\": \"lines\",\n \"lineInterpolation\": \"smooth\",\n \"spanNulls\": false,\n \"lineWidth\": 2,\n \"fillOpacity\": 0.3,\n \"gradientMode\": \"opacity\",\n \"stack\": \"off\",\n \"scaleDistribution\": {\n \"type\": \"linear\"\n },\n \"showPoints\": \"none\",\n \"pointSize\": 5\n },\n \"overrides\": [\n {\n \"matcher\": {\n \"id\": \"byFrameRefID\"\n },\n \"properties\": {\n \"rightYAxisDisplay\": \"off\"\n }\n }\n ]\n },\n {\n \"type\": \"timeseries\",\n \"id\": \"293fc82f-1e25-412b-93cc-f8daceb61bd9\",\n \"layout\": {\n \"h\": 6,\n \"w\": 6,\n \"x\": 18,\n \"y\": 61,\n \"i\": \"293fc82f-1e25-412b-93cc-f8daceb61bd9\",\n \"isResizable\": true\n },\n \"version\": \"3.1.0\",\n \"datasourceCate\": \"prometheus\",\n \"datasourceValue\": \"${prom}\",\n \"targets\": [\n {\n \"expr\": \"rate(node_network_receive_drop_total{instance=~\\\"$node\\\",device=~\\\"e.*\\\"}[$__rate_interval])\",\n \"legend\": \"{{instance}} {{device}} - in\",\n \"maxDataPoints\": 480,\n \"step\": 15\n },\n {\n \"expr\": \"rate(node_network_transmit_drop_total{instance=~\\\"$node\\\",device=~\\\"e.*\\\"}[$__rate_interval])\",\n \"legend\": \"{{instance}} {{device}} - out\",\n \"maxDataPoints\": 480,\n \"step\": 15\n }\n ],\n \"transformations\": [\n {\n \"id\": \"organize\",\n \"options\": {}\n }\n ],\n \"name\": \"drop\",\n \"maxPerRow\": 4,\n \"options\": {\n \"tooltip\": {\n \"mode\": \"all\",\n \"sort\": \"desc\"\n },\n \"legend\": {\n \"displayMode\": \"hidden\",\n \"placement\": \"bottom\",\n \"behaviour\": \"showItem\",\n \"selectMode\": \"single\"\n },\n \"standardOptions\": {\n \"util\": \"packetsSec\",\n \"decimals\": 2\n },\n \"thresholds\": {\n \"mode\": \"absolute\",\n \"steps\": [\n {\n \"color\": \"rgb(44, 157, 61)\",\n \"value\": null,\n \"type\": \"base\"\n }\n ]\n },\n \"thresholdsStyle\": {\n \"mode\": \"dashed\"\n }\n },\n \"custom\": {\n \"drawStyle\": \"lines\",\n \"lineInterpolation\": \"smooth\",\n \"spanNulls\": false,\n \"lineWidth\": 2,\n \"fillOpacity\": 0.3,\n \"gradientMode\": \"opacity\",\n \"stack\": \"off\",\n \"scaleDistribution\": {\n \"type\": \"linear\"\n },\n \"showPoints\": \"none\",\n \"pointSize\": 5\n },\n \"overrides\": [\n {\n \"matcher\": {\n \"id\": \"byFrameRefID\"\n },\n \"properties\": {\n \"rightYAxisDisplay\": \"off\"\n }\n }\n ]\n },\n {\n \"type\": \"timeseries\",\n \"id\": \"8fe595ad-f393-4d1c-a523-888071ca41b9\",\n \"layout\": {\n \"h\": 7,\n \"w\": 8,\n \"x\": 0,\n \"y\": 67,\n \"i\": \"8fe595ad-f393-4d1c-a523-888071ca41b9\",\n \"isResizable\": true\n },\n \"version\": \"3.1.0\",\n \"datasourceCate\": \"prometheus\",\n \"datasourceValue\": \"${prom}\",\n \"targets\": [\n {\n \"expr\": \"100 * node_nf_conntrack_entries{instance=~\\\"$node\\\"} / node_nf_conntrack_entries_limit{instance=~\\\"$node\\\"}\",\n \"legend\": \"\",\n \"maxDataPoints\": 480,\n \"step\": 15\n }\n ],\n \"transformations\": [\n {\n \"id\": \"organize\",\n \"options\": {}\n }\n ],\n \"name\": \"nf_conntrack 使用率\",\n \"maxPerRow\": 4,\n \"options\": {\n \"tooltip\": {\n \"mode\": \"all\",\n \"sort\": \"none\"\n },\n \"legend\": {\n \"displayMode\": \"hidden\",\n \"placement\": \"bottom\",\n \"behaviour\": \"showItem\",\n \"selectMode\": \"single\"\n },\n \"standardOptions\": {\n \"util\": \"percent\",\n \"decimals\": 2\n },\n \"thresholds\": {\n \"mode\": \"absolute\",\n \"steps\": [\n {\n \"color\": \"rgb(44, 157, 61)\",\n \"value\": null,\n \"type\": \"base\"\n }\n ]\n },\n \"thresholdsStyle\": {\n \"mode\": \"dashed\"\n }\n },\n \"custom\": {\n \"drawStyle\": \"lines\",\n \"lineInterpolation\": \"smooth\",\n \"spanNulls\": false,\n \"lineWidth\": 2,\n \"fillOpacity\": 0.3,\n \"gradientMode\": \"opacity\",\n \"stack\": \"off\",\n \"scaleDistribution\": {\n \"type\": \"linear\"\n },\n \"showPoints\": \"none\",\n \"pointSize\": 5\n },\n \"overrides\": [\n {\n \"matcher\": {\n \"id\": \"byFrameRefID\"\n },\n \"properties\": {\n \"rightYAxisDisplay\": \"off\"\n }\n }\n ]\n },\n {\n \"type\": \"timeseries\",\n \"id\": \"64b815bc-b041-40f3-aaf2-21861836ab1d\",\n \"layout\": {\n \"h\": 7,\n \"w\": 8,\n \"x\": 8,\n \"y\": 67,\n \"i\": \"64b815bc-b041-40f3-aaf2-21861836ab1d\",\n \"isResizable\": true\n },\n \"version\": \"3.1.0\",\n \"datasourceCate\": \"prometheus\",\n \"datasourceValue\": \"${prom}\",\n \"targets\": [\n {\n \"expr\": \"node_sockstat_TCP_alloc{instance=~\\\"$node\\\"}\",\n \"legend\": \"\",\n \"maxDataPoints\": 480,\n \"step\": 15\n },\n {\n \"expr\": \"node_sockstat_TCP_inuse{instance=~\\\"$node\\\"}\",\n \"legend\": \"\",\n \"maxDataPoints\": 480,\n \"step\": 15\n },\n {\n \"expr\": \"node_sockstat_TCP_orphan{instance=~\\\"$node\\\"}\",\n \"legend\": \"\",\n \"maxDataPoints\": 480,\n \"step\": 15\n },\n {\n \"expr\": \"node_sockstat_TCP_tw{instance=~\\\"$node\\\"}\",\n \"legend\": \"\",\n \"maxDataPoints\": 480,\n \"step\": 15\n },\n {\n \"expr\": \"node_netstat_Tcp_CurrEstab{instance=~\\\"$node\\\"}\",\n \"legend\": \"\",\n \"maxDataPoints\": 480,\n \"step\": 15\n }\n ],\n \"transformations\": [\n {\n \"id\": \"organize\",\n \"options\": {}\n }\n ],\n \"name\": \"tcp socket stat\",\n \"maxPerRow\": 4,\n \"options\": {\n \"tooltip\": {\n \"mode\": \"all\",\n \"sort\": \"desc\"\n },\n \"legend\": {\n \"displayMode\": \"hidden\",\n \"placement\": \"bottom\",\n \"behaviour\": \"showItem\",\n \"selectMode\": \"single\"\n },\n \"standardOptions\": {},\n \"thresholds\": {\n \"mode\": \"absolute\",\n \"steps\": [\n {\n \"color\": \"rgb(44, 157, 61)\",\n \"value\": null,\n \"type\": \"base\"\n }\n ]\n },\n \"thresholdsStyle\": {\n \"mode\": \"dashed\"\n }\n },\n \"custom\": {\n \"drawStyle\": \"lines\",\n \"lineInterpolation\": \"smooth\",\n \"spanNulls\": false,\n \"lineWidth\": 2,\n \"fillOpacity\": 0.04,\n \"gradientMode\": \"none\",\n \"stack\": \"off\",\n \"scaleDistribution\": {\n \"type\": \"linear\"\n },\n \"showPoints\": \"none\",\n \"pointSize\": 5\n },\n \"overrides\": [\n {\n \"matcher\": {\n \"id\": \"byFrameRefID\"\n },\n \"properties\": {\n \"rightYAxisDisplay\": \"off\"\n }\n }\n ]\n },\n {\n \"type\": \"timeseries\",\n \"id\": \"d089d8a2-dbbf-4dbf-89a8-b463522b1c1d\",\n \"layout\": {\n \"h\": 7,\n \"w\": 8,\n \"x\": 16,\n \"y\": 67,\n \"i\": \"d089d8a2-dbbf-4dbf-89a8-b463522b1c1d\",\n \"isResizable\": true\n },\n \"version\": \"3.1.0\",\n \"datasourceCate\": \"prometheus\",\n \"datasourceValue\": \"${prom}\",\n \"targets\": [\n {\n \"expr\": \"node_sockstat_sockets_used{instance=~\\\"$node\\\"}\",\n \"legend\": \"\",\n \"maxDataPoints\": 480,\n \"step\": 15\n }\n ],\n \"transformations\": [\n {\n \"id\": \"organize\",\n \"options\": {}\n }\n ],\n \"name\": \"socket used\",\n \"maxPerRow\": 4,\n \"options\": {\n \"tooltip\": {\n \"mode\": \"all\",\n \"sort\": \"desc\"\n },\n \"legend\": {\n \"displayMode\": \"hidden\",\n \"placement\": \"bottom\",\n \"behaviour\": \"showItem\",\n \"selectMode\": \"single\"\n },\n \"standardOptions\": {},\n \"thresholds\": {\n \"mode\": \"absolute\",\n \"steps\": [\n {\n \"color\": \"rgb(44, 157, 61)\",\n \"value\": null,\n \"type\": \"base\"\n }\n ]\n },\n \"thresholdsStyle\": {\n \"mode\": \"dashed\"\n }\n },\n \"custom\": {\n \"drawStyle\": \"lines\",\n \"lineInterpolation\": \"smooth\",\n \"spanNulls\": false,\n \"lineWidth\": 2,\n \"fillOpacity\": 0.3,\n \"gradientMode\": \"opacity\",\n \"stack\": \"off\",\n \"scaleDistribution\": {\n \"type\": \"linear\"\n },\n \"showPoints\": \"none\",\n \"pointSize\": 5\n },\n \"overrides\": [\n {\n \"matcher\": {\n \"id\": \"byFrameRefID\"\n },\n \"properties\": {\n \"rightYAxisDisplay\": \"off\"\n }\n }\n ]\n }\n ],\n \"var\": [\n {\n \"name\": \"prom\",\n \"label\": \"时序库\",\n \"type\": \"datasource\",\n \"hide\": false,\n \"definition\": \"prometheus\"\n },\n {\n \"name\": \"node\",\n \"label\": \"机器\",\n \"type\": \"query\",\n \"hide\": false,\n \"multi\": true,\n \"datasource\": {\n \"cate\": \"prometheus\",\n \"value\": \"${prom}\"\n },\n \"definition\": \"label_values(node_uname_info, instance)\",\n \"allOption\": true,\n \"allValue\": \".*\"\n }\n ],\n \"version\": \"3.0.0\"\n }\n}"
},
{
"path": "integrations/Linux/markdown/README.md",
"content": "# Linux\n\nLinux 类别下,包含多个内置插件,比如 cpu、mem、net、netstat、kernel_vmstat 等,这些插件大都是默认是开启的,无需额外配置,可能有额外配置需求的插件如下。\n\n## cpu\n\n统计 CPU 使用率,默认只采集整机的情况,不采集每个 CPU Core 的情况,如果想采集每个 CPU Core 的情况,可以配置如下。\n\n```ini\ncollect_per_cpu = true\n```\n\n## netstat\n\n统计网络连接数,默认配置如下,可根据实际情况调整。\n\n```ini\n# 默认开启了 smmary 统计,类似 ss -s 命令的输出\ndisable_summary_stats = false\n# 默认关闭了所有连接的详细统计,在连接数较多的机器上统计此数据会影响性能\ndisable_connection_stats = true\n# 读取 /proc/net/netstat 的内容,默认关闭了,可以开启,这部分不影响性能\ntcp_ext = false\nip_ext = false\n```\n\n## disk\n\n统计磁盘使用率,默认配置如下,可根据实际情况调整。\n\n```ini\n# 严格指定要采集的挂载点,如果指定了,就只采集指定的挂载点\n# mount_points = [\"/\"]\n\n# 有些 fstype 没必要采集,可以忽略\nignore_fs = [\"tmpfs\", \"devtmpfs\", \"devfs\", \"iso9660\", \"overlay\", \"aufs\", \"squashfs\", \"nsfs\", \"CDFS\", \"fuse.juicefs\"]\n\n# 有些挂载点没必要采集,可以忽略,这里可以配置前缀,符合前缀的挂载点都会被忽略\nignore_mount_points = [\"/boot\", \"/var/lib/kubelet/pods\"]\n```\n\n## kernel_vmstat\n\n统计的信息来自 `/proc/vmstat`,只有高版本内核才支持,这个文件的内容较多,默认配置只采集了 oom_kill 次数,其他指标均未采集,如果你想打开其他采集开关,可以修改 white_list 部分的配置。下面是截取了一部分内容,供参考:\n\n```toml\n[white_list]\noom_kill = 1\nnr_free_pages = 0\nnr_alloc_batch = 0\n...\n```\n\n## arp_package\n\n统计 ARP 包的数量,该插件依赖 cgo,如果需要该插件需要下载 `with-cgo` 的 categraf 发布包。\n\n\n## ntp\n\n监控机器时间偏移量,只需要给出 ntp 服务端地址,Categraf 就会周期性去请求,对比本机时间,得到偏移量,监控指标是 ntp_offset_ms 顾名思义,单位是毫秒,一般这个值不能超过 1000"
},
{
"path": "integrations/Linux/metrics/categraf-base.json",
"content": "[\n {\n \"id\": 0,\n \"uuid\": 1717556327758798000,\n \"collector\": \"Categraf\",\n \"typ\": \"Linux\",\n \"name\": \"CPU Guest 时间占比\",\n \"unit\": \"percent\",\n \"note\": \"CPU 为 Guest OS 运行虚拟 CPU 的时间占比。\\n\\n- 标签 `cpu=\\\"cpu-total\\\"`,表示整机的统计值\\n- 标签 `cpu=\\\"0\\\"`,表示 0 号 CPU 的统计值\",\n \"lang\": \"zh_CN\",\n \"expression\": \"cpu_usage_guest\",\n \"created_at\": 0,\n \"created_by\": \"\",\n \"updated_at\": 0,\n \"updated_by\": \"\",\n \"translation\": [\n {\n \"lang\": \"zh_CN\",\n \"name\": \"CPU Guest 时间占比\",\n \"note\": \"CPU 为 Guest OS 运行虚拟 CPU 的时间占比。\\n\\n- 标签 `cpu=\\\"cpu-total\\\"`,表示整机的统计值\\n- 标签 `cpu=\\\"0\\\"`,表示 0 号 CPU 的统计值\"\n },\n {\n \"lang\": \"en_US\",\n \"name\": \"CPU Guest time ratio\",\n \"note\": \"The proportion of time the CPU spends running the virtual CPU for the Guest OS. \\n \\n-Label ` cpu = \\\"cpu-total\\\" `, indicating the statistical value of the whole machine \\n-Tag ` CPU = \\\"0\\\" `, indicating the statistical value of CPU number 0\"\n }\n ]\n },\n {\n \"id\": 0,\n \"uuid\": 1717556327761258000,\n \"collector\": \"Categraf\",\n \"typ\": \"Linux\",\n \"name\": \"CPU iowait 时间占比\",\n \"unit\": \"percent\",\n \"note\": \"表示 CPU 花费在等待 I/O 操作(输入/输出)完成的时间比例\\n\\n- 标签 `cpu=\\\"cpu-total\\\"`,表示整机的 iowait 占用率\\n- 标签 `cpu=\\\"0\\\"`,表示 0 号 CPU 的 iowait 占用率\",\n \"lang\": \"zh_CN\",\n \"expression\": \"cpu_usage_iowait\",\n \"created_at\": 0,\n \"created_by\": \"\",\n \"updated_at\": 0,\n \"updated_by\": \"\",\n \"translation\": [\n {\n \"lang\": \"zh_CN\",\n \"name\": \"CPU iowait 时间占比\",\n \"note\": \"表示 CPU 花费在等待 I/O 操作(输入/输出)完成的时间比例\\n\\n- 标签 `cpu=\\\"cpu-total\\\"`,表示整机的 iowait 占用率\\n- 标签 `cpu=\\\"0\\\"`,表示 0 号 CPU 的 iowait 占用率\"\n },\n {\n \"lang\": \"en_US\",\n \"name\": \"CPU iowait time ratio\",\n \"note\": \"Represents the proportion of time the CPU spends waiting for I/O operations (input/output) to complete \\n \\n-Tag ` cpu = \\\"cpu-total\\\" `, indicating the iowait occupancy rate of the whole machine \\n-Tag ` CPU = \\\"0\\\" `, indicating iowait usage rate of CPU # 0\"\n }\n ]\n },\n {\n \"id\": 0,\n \"uuid\": 1717556327764051000,\n \"collector\": \"Categraf\",\n \"typ\": \"Linux\",\n \"name\": \"CPU Steal 时间占比\",\n \"unit\": \"percent\",\n \"note\": \"表示虚拟机(Guest OS)CPU 时间被虚拟化管理器(Hypervisor)用于运行其他虚拟机的时间比例。物理机中这个指标值是 0,没有用处;虚拟机中这个指标值长时间大于 10 表示争抢严重。[参考资料](https://mp.weixin.qq.com/s/zlrfMNrDHJVE5lkTVow5zA)\\n\\n- 标签 `cpu=\\\"cpu-total\\\"`,表示整机的统计值\\n- 标签 `cpu=\\\"0\\\"`,表示 0 号 CPU 的统计值\",\n \"lang\": \"zh_CN\",\n \"expression\": \"cpu_usage_steal\",\n \"created_at\": 0,\n \"created_by\": \"\",\n \"updated_at\": 0,\n \"updated_by\": \"\",\n \"translation\": [\n {\n \"lang\": \"zh_CN\",\n \"name\": \"CPU Steal 时间占比\",\n \"note\": \"表示虚拟机(Guest OS)CPU 时间被虚拟化管理器(Hypervisor)用于运行其他虚拟机的时间比例。物理机中这个指标值是 0,没有用处;虚拟机中这个指标值长时间大于 10 表示争抢严重。[参考资料](https://mp.weixin.qq.com/s/zlrfMNrDHJVE5lkTVow5zA)\\n\\n- 标签 `cpu=\\\"cpu-total\\\"`,表示整机的统计值\\n- 标签 `cpu=\\\"0\\\"`,表示 0 号 CPU 的统计值\"\n },\n {\n \"lang\": \"en_US\",\n \"name\": \"CPU Steal time ratio\",\n \"note\": \"Represents the proportion of time that the virtual machine (Guest OS) CPU time is used by the virtualization manager (Hypervisor) to run other virtual machines. The value of this indicator in the physical machine is 0, which is useless; If the value of this indicator in the virtual machine is greater than 10 for a long time, it means that the competition is serious. [Reference] (https://mp.weixin.qq.com/s/zlrfMNrDHJVE5lkTVow5zA) \\n \\n-Label ` cpu = \\\"cpu-total\\\" `, indicating the statistical value of the whole machine \\n-Tag ` CPU = \\\"0\\\" `, indicating the statistical value of CPU number 0\"\n }\n ]\n },\n {\n \"id\": 0,\n \"uuid\": 1717556327766578000,\n \"collector\": \"Categraf\",\n \"typ\": \"Linux\",\n \"name\": \"CPU 低优先级进程的时间占比\",\n \"unit\": \"percent\",\n \"note\": \"在Linux系统中,每个进程都有一个“nice”值,这个值的范围通常是从-20到19。默认的 nice 值为0。负的 nice 值表示高优先级(更快的 CPU 访问),而正的 nice 值表示低优先级(更慢的 CPU 访问)。该指标统计 nice 值为 1-19 的进程的时间占比。\\n\\n- 标签 `cpu=\\\"cpu-total\\\"`,表示整机的统计值\\n- 标签 `cpu=\\\"0\\\"`,表示 0 号 CPU 的统计值\",\n \"lang\": \"zh_CN\",\n \"expression\": \"cpu_usage_nice\",\n \"created_at\": 0,\n \"created_by\": \"\",\n \"updated_at\": 0,\n \"updated_by\": \"\",\n \"translation\": [\n {\n \"lang\": \"zh_CN\",\n \"name\": \"CPU 低优先级进程的时间占比\",\n \"note\": \"在Linux系统中,每个进程都有一个“nice”值,这个值的范围通常是从-20到19。默认的 nice 值为0。负的 nice 值表示高优先级(更快的 CPU 访问),而正的 nice 值表示低优先级(更慢的 CPU 访问)。该指标统计 nice 值为 1-19 的进程的时间占比。\\n\\n- 标签 `cpu=\\\"cpu-total\\\"`,表示整机的统计值\\n- 标签 `cpu=\\\"0\\\"`,表示 0 号 CPU 的统计值\"\n },\n {\n \"lang\": \"en_US\",\n \"name\": \"Time proportion of CPU low-priority processes\",\n \"note\": \"In Linux systems, each process has a \\\"nice\\\" value, which usually ranges from-20 to 19. The default nice value is 0. A negative nice value indicates high priority (faster CPU access), while a positive nice value indicates low priority (slower CPU access). This indicator counts the time proportion of processes with nice values of 1-19. \\n \\n-Tag ` cpu = \\\"cpu-total\\\" `, indicating the statistical value of the whole machine \\n-Tag ` CPU = \\\"0\\\" `, indicating the statistical value of CPU number 0\"\n }\n ]\n },\n {\n \"id\": 0,\n \"uuid\": 1717556327768675000,\n \"collector\": \"Categraf\",\n \"typ\": \"Linux\",\n \"name\": \"CPU 内核态时间占比\",\n \"unit\": \"percent\",\n \"note\": \"表示 CPU 内核态的时间占比\\n\\n- 标签 `cpu=\\\"cpu-total\\\"`,表示整机的统计值\\n- 标签 `cpu=\\\"0\\\"`,表示 0 号 CPU 的统计值\",\n \"lang\": \"zh_CN\",\n \"expression\": \"cpu_usage_system\",\n \"created_at\": 0,\n \"created_by\": \"\",\n \"updated_at\": 0,\n \"updated_by\": \"\",\n \"translation\": [\n {\n \"lang\": \"zh_CN\",\n \"name\": \"CPU 内核态时间占比\",\n \"note\": \"表示 CPU 内核态的时间占比\\n\\n- 标签 `cpu=\\\"cpu-total\\\"`,表示整机的统计值\\n- 标签 `cpu=\\\"0\\\"`,表示 0 号 CPU 的统计值\"\n },\n {\n \"lang\": \"en_US\",\n \"name\": \"CPU core mode time ratio\",\n \"note\": \"Represents the time ratio of CPU core mode \\n \\n-Tag ` cpu = \\\"cpu-total\\\" `, indicating the statistical value of the whole machine \\n-Tag ` CPU = \\\"0\\\" `, indicating the statistical value of CPU number 0\"\n }\n ]\n },\n {\n \"id\": 0,\n \"uuid\": 1717556327770969000,\n \"collector\": \"Categraf\",\n \"typ\": \"Linux\",\n \"name\": \"CPU 利用率\",\n \"unit\": \"percent\",\n \"note\": \"- 标签 `cpu=\\\"cpu-total\\\"`,表示整机的 CPU 利用率\\n- 标签 `cpu=\\\"0\\\"`,表示 0 号 CPU 的单核利用率\",\n \"lang\": \"zh_CN\",\n \"expression\": \"cpu_usage_active\",\n \"created_at\": 0,\n \"created_by\": \"\",\n \"updated_at\": 0,\n \"updated_by\": \"\",\n \"translation\": [\n {\n \"lang\": \"zh_CN\",\n \"name\": \"CPU 利用率\",\n \"note\": \"- 标签 `cpu=\\\"cpu-total\\\"`,表示整机的 CPU 利用率\\n- 标签 `cpu=\\\"0\\\"`,表示 0 号 CPU 的单核利用率\"\n },\n {\n \"lang\": \"en_US\",\n \"name\": \"CPU utilization\",\n \"note\": \"-Tag ` CPU = \\\"CPU-total\\\" `, indicating the CPU utilization of the whole machine \\n-Tag ` CPU = \\\"0\\\" `, indicating single-core utilization of CPU # 0\"\n }\n ]\n },\n {\n \"id\": 0,\n \"uuid\": 1717556327773481000,\n \"collector\": \"Categraf\",\n \"typ\": \"Linux\",\n \"name\": \"CPU 用户态时间占比\",\n \"unit\": \"percent\",\n \"note\": \"表示 CPU 用户态的时间占比\\n\\n\\n- 标签 `cpu=\\\"cpu-total\\\"`,表示整机的统计值\\n- 标签 `cpu=\\\"0\\\"`,表示 0 号 CPU 的统计值\",\n \"lang\": \"zh_CN\",\n \"expression\": \"cpu_usage_user\",\n \"created_at\": 0,\n \"created_by\": \"\",\n \"updated_at\": 0,\n \"updated_by\": \"\",\n \"translation\": [\n {\n \"lang\": \"zh_CN\",\n \"name\": \"CPU 用户态时间占比\",\n \"note\": \"表示 CPU 用户态的时间占比\\n\\n\\n- 标签 `cpu=\\\"cpu-total\\\"`,表示整机的统计值\\n- 标签 `cpu=\\\"0\\\"`,表示 0 号 CPU 的统计值\"\n },\n {\n \"lang\": \"en_US\",\n \"name\": \"CPU user mode time ratio\",\n \"note\": \"Indicates the time ratio of CPU user mode \\n \\n \\n-Tag ` cpu = \\\"cpu-total\\\" `, indicating the statistical value of the whole machine \\n-Tag ` CPU = \\\"0\\\" `, indicating the statistical value of CPU number 0\"\n }\n ]\n },\n {\n \"id\": 0,\n \"uuid\": 1717556327775725000,\n \"collector\": \"Categraf\",\n \"typ\": \"Linux\",\n \"name\": \"CPU 硬中断时间占比\",\n \"unit\": \"percent\",\n \"note\": \"表示 CPU 处理硬中断的时间占比\\n\\n- 标签 `cpu=\\\"cpu-total\\\"`,表示整机的统计值\\n- 标签 `cpu=\\\"0\\\"`,表示 0 号 CPU 的统计值\",\n \"lang\": \"zh_CN\",\n \"expression\": \"cpu_usage_irq\",\n \"created_at\": 0,\n \"created_by\": \"\",\n \"updated_at\": 0,\n \"updated_by\": \"\",\n \"translation\": [\n {\n \"lang\": \"zh_CN\",\n \"name\": \"CPU 硬中断时间占比\",\n \"note\": \"表示 CPU 处理硬中断的时间占比\\n\\n- 标签 `cpu=\\\"cpu-total\\\"`,表示整机的统计值\\n- 标签 `cpu=\\\"0\\\"`,表示 0 号 CPU 的统计值\"\n },\n {\n \"lang\": \"en_US\",\n \"name\": \"CPU hard interrupt time ratio\",\n \"note\": \"Indicates the proportion of time spent by the CPU handling hard interrupts \\n \\n-Tag ` cpu = \\\"cpu-total\\\" `, indicating the statistical value of the whole machine \\n-Tag ` CPU = \\\"0\\\" `, indicating the statistical value of CPU number 0\"\n }\n ]\n },\n {\n \"id\": 0,\n \"uuid\": 1717556327777851000,\n \"collector\": \"Categraf\",\n \"typ\": \"Linux\",\n \"name\": \"CPU 空闲率\",\n \"unit\": \"percent\",\n \"note\": \"- 标签 `cpu=\\\"cpu-total\\\"`,表示整机的 CPU 空闲率\\n- 标签 `cpu=\\\"0\\\"`,表示 0 号 CPU 的单核空闲率\",\n \"lang\": \"zh_CN\",\n \"expression\": \"cpu_usage_idle\",\n \"created_at\": 0,\n \"created_by\": \"\",\n \"updated_at\": 0,\n \"updated_by\": \"\",\n \"translation\": [\n {\n \"lang\": \"zh_CN\",\n \"name\": \"CPU 空闲率\",\n \"note\": \"- 标签 `cpu=\\\"cpu-total\\\"`,表示整机的 CPU 空闲率\\n- 标签 `cpu=\\\"0\\\"`,表示 0 号 CPU 的单核空闲率\"\n },\n {\n \"lang\": \"en_US\",\n \"name\": \"CPU idle rate\",\n \"note\": \"-Tag ` CPU = \\\"CPU-total\\\" `, indicating the CPU idle rate of the whole machine \\n-Tag ` CPU = \\\"0\\\" `, indicating the single core idle rate of CPU # 0\"\n }\n ]\n },\n {\n \"id\": 0,\n \"uuid\": 1717556327780202000,\n \"collector\": \"Categraf\",\n \"typ\": \"Linux\",\n \"name\": \"CPU 软中断时间占比\",\n \"unit\": \"percent\",\n \"note\": \"表示 CPU 处理软中断的时间占比\\n\\n- 标签 `cpu=\\\"cpu-total\\\"`,表示整机的统计值\\n- 标签 `cpu=\\\"0\\\"`,表示 0 号 CPU 的统计值\",\n \"lang\": \"zh_CN\",\n \"expression\": \"cpu_usage_softirq\",\n \"created_at\": 0,\n \"created_by\": \"\",\n \"updated_at\": 0,\n \"updated_by\": \"\",\n \"translation\": [\n {\n \"lang\": \"zh_CN\",\n \"name\": \"CPU 软中断时间占比\",\n \"note\": \"表示 CPU 处理软中断的时间占比\\n\\n- 标签 `cpu=\\\"cpu-total\\\"`,表示整机的统计值\\n- 标签 `cpu=\\\"0\\\"`,表示 0 号 CPU 的统计值\"\n },\n {\n \"lang\": \"en_US\",\n \"name\": \"CPU soft interrupt time ratio\",\n \"note\": \"Indicates the proportion of time the CPU takes to process soft interrupts \\n \\n-Tag ` cpu = \\\"cpu-total\\\" `, indicating the statistical value of the whole machine \\n-Tag ` CPU = \\\"0\\\" `, indicating the statistical value of CPU number 0\"\n }\n ]\n },\n {\n \"id\": 0,\n \"uuid\": 1717556327782194000,\n \"collector\": \"Categraf\",\n \"typ\": \"Linux\",\n \"name\": \"ESTABLISHED 状态的网络链接数\",\n \"unit\": \"none\",\n \"note\": \"\",\n \"lang\": \"zh_CN\",\n \"expression\": \"netstat_tcp_established\",\n \"created_at\": 0,\n \"created_by\": \"\",\n \"updated_at\": 0,\n \"updated_by\": \"\",\n \"translation\": [\n {\n \"lang\": \"zh_CN\",\n \"name\": \"ESTABLISHED 状态的网络链接数\",\n \"note\": \"\"\n },\n {\n \"lang\": \"en_US\",\n \"name\": \"Number of network links with ESTABLISHED status\",\n \"note\": \"\"\n }\n ]\n },\n {\n \"id\": 0,\n \"uuid\": 1717556327784357000,\n \"collector\": \"Categraf\",\n \"typ\": \"Linux\",\n \"name\": \"FIN_WAIT1 状态的网络链接数\",\n \"unit\": \"none\",\n \"note\": \"\",\n \"lang\": \"zh_CN\",\n \"expression\": \"netstat_tcp_fin_wait1\",\n \"created_at\": 0,\n \"created_by\": \"\",\n \"updated_at\": 0,\n \"updated_by\": \"\",\n \"translation\": [\n {\n \"lang\": \"zh_CN\",\n \"name\": \"FIN_WAIT1 状态的网络链接数\",\n \"note\": \"\"\n },\n {\n \"lang\": \"en_US\",\n \"name\": \"Number of network links in FIN _ WAIT1 state\",\n \"note\": \"\"\n }\n ]\n },\n {\n \"id\": 0,\n \"uuid\": 1717556327786336000,\n \"collector\": \"Categraf\",\n \"typ\": \"Linux\",\n \"name\": \"FIN_WAIT2 状态的网络链接数\",\n \"unit\": \"none\",\n \"note\": \"\",\n \"lang\": \"zh_CN\",\n \"expression\": \"netstat_tcp_fin_wait2\",\n \"created_at\": 0,\n \"created_by\": \"\",\n \"updated_at\": 0,\n \"updated_by\": \"\",\n \"translation\": [\n {\n \"lang\": \"zh_CN\",\n \"name\": \"FIN_WAIT2 状态的网络链接数\",\n \"note\": \"\"\n },\n {\n \"lang\": \"en_US\",\n \"name\": \"Number of network links in FIN _ WAIT2 state\",\n \"note\": \"\"\n }\n ]\n },\n {\n \"id\": 0,\n \"uuid\": 1717556327788305000,\n \"collector\": \"Categraf\",\n \"typ\": \"Linux\",\n \"name\": \"IP conntrack 使用率\",\n \"unit\": \"percent\",\n \"note\": \"如果用满了,通常会在系统日志中看到:conntrack table full 这样的报错,可以调整系统最大值解决\",\n \"lang\": \"zh_CN\",\n \"expression\": \"100 * conntrack_ip_conntrack_count / conntrack_ip_conntrack_max\",\n \"created_at\": 0,\n \"created_by\": \"\",\n \"updated_at\": 0,\n \"updated_by\": \"\",\n \"translation\": [\n {\n \"lang\": \"zh_CN\",\n \"name\": \"IP conntrack 使用率\",\n \"note\": \"如果用满了,通常会在系统日志中看到:conntrack table full 这样的报错,可以调整系统最大值解决\"\n },\n {\n \"lang\": \"en_US\",\n \"name\": \"IP conntrack usage\",\n \"note\": \"If it is full, you will usually see errors such as: conntrack table full in the system log. You can adjust the maximum value of the system to solve the problem\"\n }\n ]\n },\n {\n \"id\": 0,\n \"uuid\": 1717556327790390000,\n \"collector\": \"Categraf\",\n \"typ\": \"Linux\",\n \"name\": \"LAST_ACK 状态的网络链接数\",\n \"unit\": \"none\",\n \"note\": \"\",\n \"lang\": \"zh_CN\",\n \"expression\": \"netstat_tcp_last_ack\",\n \"created_at\": 0,\n \"created_by\": \"\",\n \"updated_at\": 0,\n \"updated_by\": \"\",\n \"translation\": [\n {\n \"lang\": \"zh_CN\",\n \"name\": \"LAST_ACK 状态的网络链接数\",\n \"note\": \"\"\n },\n {\n \"lang\": \"en_US\",\n \"name\": \"Number of network links in LAST _ ACK state\",\n \"note\": \"\"\n }\n ]\n },\n {\n \"id\": 0,\n \"uuid\": 1717556327792341000,\n \"collector\": \"Categraf\",\n \"typ\": \"Linux\",\n \"name\": \"LISTEN 状态的网络链接数\",\n \"unit\": \"none\",\n \"note\": \"\",\n \"lang\": \"zh_CN\",\n \"expression\": \"netstat_tcp_listen\",\n \"created_at\": 0,\n \"created_by\": \"\",\n \"updated_at\": 0,\n \"updated_by\": \"\",\n \"translation\": [\n {\n \"lang\": \"zh_CN\",\n \"name\": \"LISTEN 状态的网络链接数\",\n \"note\": \"\"\n },\n {\n \"lang\": \"en_US\",\n \"name\": \"Number of network links in LISTEN status\",\n \"note\": \"\"\n }\n ]\n },\n {\n \"id\": 0,\n \"uuid\": 1717556327794144000,\n \"collector\": \"Categraf\",\n \"typ\": \"Linux\",\n \"name\": \"NF conntrack 使用率\",\n \"unit\": \"percent\",\n \"note\": \"\",\n \"lang\": \"zh_CN\",\n \"expression\": \"100 * conntrack_nf_conntrack_count / conntrack_nf_conntrack_max\",\n \"created_at\": 0,\n \"created_by\": \"\",\n \"updated_at\": 0,\n \"updated_by\": \"\",\n \"translation\": [\n {\n \"lang\": \"zh_CN\",\n \"name\": \"NF conntrack 使用率\",\n \"note\": \"\"\n },\n {\n \"lang\": \"en_US\",\n \"name\": \"NF conntrack usage\",\n \"note\": \"\"\n }\n ]\n },\n {\n \"id\": 0,\n \"uuid\": 1717556327796195000,\n \"collector\": \"Categraf\",\n \"typ\": \"Linux\",\n \"name\": \"1分钟内 OOM 次数统计\",\n \"unit\": \"none\",\n \"note\": \"取自 `/proc/vmstat`,需要较高版本的内核,没记错的话应该是 4.13 以上版本\",\n \"lang\": \"zh_CN\",\n \"expression\": \"increase(kernel_vmstat_oom_kill[1m])\",\n \"created_at\": 0,\n \"created_by\": \"\",\n \"updated_at\": 0,\n \"updated_by\": \"\",\n \"translation\": [\n {\n \"lang\": \"zh_CN\",\n \"name\": \"1分钟内 OOM 次数统计\",\n \"note\": \"取自 `/proc/vmstat`,需要较高版本的内核,没记错的话应该是 4.13 以上版本\"\n },\n {\n \"lang\": \"en_US\",\n \"name\": \"OOM number statistics within 1 minute\",\n \"note\": \"Taken from `/proc/vmstat `, requires a higher version of the kernel, if I remember correctly, it should be 4.13 or above\"\n }\n ]\n },\n {\n \"id\": 0,\n \"uuid\": 1717556327798039000,\n \"collector\": \"Categraf\",\n \"typ\": \"Linux\",\n \"name\": \"SYN_RECV 状态的网络链接数\",\n \"unit\": \"none\",\n \"note\": \"\",\n \"lang\": \"zh_CN\",\n \"expression\": \"netstat_tcp_syn_recv\",\n \"created_at\": 0,\n \"created_by\": \"\",\n \"updated_at\": 0,\n \"updated_by\": \"\",\n \"translation\": [\n {\n \"lang\": \"zh_CN\",\n \"name\": \"SYN_RECV 状态的网络链接数\",\n \"note\": \"\"\n },\n {\n \"lang\": \"en_US\",\n \"name\": \"Number of network links in SYN _ RECV state\",\n \"note\": \"\"\n }\n ]\n },\n {\n \"id\": 0,\n \"uuid\": 1717556327800360000,\n \"collector\": \"Categraf\",\n \"typ\": \"Linux\",\n \"name\": \"SYN_SENT 状态的网络链接数\",\n \"unit\": \"none\",\n \"note\": \"\",\n \"lang\": \"zh_CN\",\n \"expression\": \"netstat_tcp_syn_sent\",\n \"created_at\": 0,\n \"created_by\": \"\",\n \"updated_at\": 0,\n \"updated_by\": \"\",\n \"translation\": [\n {\n \"lang\": \"zh_CN\",\n \"name\": \"SYN_SENT 状态的网络链接数\",\n \"note\": \"\"\n },\n {\n \"lang\": \"en_US\",\n \"name\": \"Number of network links in SYN _ SENT state\",\n \"note\": \"\"\n }\n ]\n },\n {\n \"id\": 0,\n \"uuid\": 1717556327803053000,\n \"collector\": \"Categraf\",\n \"typ\": \"Linux\",\n \"name\": \"TIME_WAIT 状态的网络链接数\",\n \"unit\": \"none\",\n \"note\": \"categraf 配置文件 `conf/input.netstat/netstat.toml` 中 `disable_connection_stats` 默认配置为 true,是因为在网络连接比较多的机器上,获取各个状态的连接数会耗费较多 CPU,所以默认 disable 掉了。\",\n \"lang\": \"zh_CN\",\n \"expression\": \"netstat_tcp_time_wait\",\n \"created_at\": 0,\n \"created_by\": \"\",\n \"updated_at\": 0,\n \"updated_by\": \"\",\n \"translation\": [\n {\n \"lang\": \"zh_CN\",\n \"name\": \"TIME_WAIT 状态的网络链接数\",\n \"note\": \"categraf 配置文件 `conf/input.netstat/netstat.toml` 中 `disable_connection_stats` 默认配置为 true,是因为在网络连接比较多的机器上,获取各个状态的连接数会耗费较多 CPU,所以默认 disable 掉了。\"\n },\n {\n \"lang\": \"en_US\",\n \"name\": \"Number of network links in TIME _ WAIT state\",\n \"note\": \"The default configuration of ` disable _ connection _ stats ` in the categraf configuration file ` conf/input.netstat/netstat.toml ` is true because on machines with many network connections, obtaining the number of connections in each state will consume more CPU, so the default disable is dropped.\"\n }\n ]\n },\n {\n \"id\": 0,\n \"uuid\": 1717556327804777000,\n \"collector\": \"Categraf\",\n \"typ\": \"Linux\",\n \"name\": \"TIME_WAIT 状态的网络链接数(推荐)\",\n \"unit\": \"none\",\n \"note\": \"读取自 `/proc/net/sockstat`。\",\n \"lang\": \"zh_CN\",\n \"expression\": \"netstat_tcp_tw\",\n \"created_at\": 0,\n \"created_by\": \"\",\n \"updated_at\": 0,\n \"updated_by\": \"\",\n \"translation\": [\n {\n \"lang\": \"zh_CN\",\n \"name\": \"TIME_WAIT 状态的网络链接数(推荐)\",\n \"note\": \"读取自 `/proc/net/sockstat`。\"\n },\n {\n \"lang\": \"en_US\",\n \"name\": \"Number of network links in TIME _ WAIT state (recommended)\",\n \"note\": \"Read from `/proc/net/sockstat `.\"\n }\n ]\n },\n {\n \"id\": 0,\n \"uuid\": 1717556327806758000,\n \"collector\": \"Categraf\",\n \"typ\": \"Linux\",\n \"name\": \"交换空间使用率\",\n \"unit\": \"percent\",\n \"note\": \"交换空间使用率。计算原子取自 `/proc/meminfo`。\",\n \"lang\": \"zh_CN\",\n \"expression\": \"(mem_swap_total - mem_swap_free)/mem_swap_total * 100 and mem_swap_total > 0\",\n \"created_at\": 0,\n \"created_by\": \"\",\n \"updated_at\": 0,\n \"updated_by\": \"\",\n \"translation\": [\n {\n \"lang\": \"zh_CN\",\n \"name\": \"交换空间使用率\",\n \"note\": \"交换空间使用率。计算原子取自 `/proc/meminfo`。\"\n },\n {\n \"lang\": \"en_US\",\n \"name\": \"Swap space usage\",\n \"note\": \"Swap space usage. The computational atom is taken from `/proc/meminfo `.\"\n }\n ]\n },\n {\n \"id\": 0,\n \"uuid\": 1717556327808420000,\n \"collector\": \"Categraf\",\n \"typ\": \"Linux\",\n \"name\": \"交换空间使用量\",\n \"unit\": \"bytesIEC\",\n \"note\": \"交换空间使用量。计算原子取自 `/proc/meminfo`。\",\n \"lang\": \"zh_CN\",\n \"expression\": \"mem_swap_total - mem_swap_free\",\n \"created_at\": 0,\n \"created_by\": \"\",\n \"updated_at\": 0,\n \"updated_by\": \"\",\n \"translation\": [\n {\n \"lang\": \"zh_CN\",\n \"name\": \"交换空间使用量\",\n \"note\": \"交换空间使用量。计算原子取自 `/proc/meminfo`。\"\n },\n {\n \"lang\": \"en_US\",\n \"name\": \"Swap space usage\",\n \"note\": \"Swap space usage. The computational atom is taken from `/proc/meminfo `.\"\n }\n ]\n },\n {\n \"id\": 0,\n \"uuid\": 1717556327810258000,\n \"collector\": \"Categraf\",\n \"typ\": \"Linux\",\n \"name\": \"交换空间总量\",\n \"unit\": \"bytesIEC\",\n \"note\": \"交换空间总量。取自 `/proc/meminfo`。\",\n \"lang\": \"zh_CN\",\n \"expression\": \"mem_swap_total\",\n \"created_at\": 0,\n \"created_by\": \"\",\n \"updated_at\": 0,\n \"updated_by\": \"\",\n \"translation\": [\n {\n \"lang\": \"zh_CN\",\n \"name\": \"交换空间总量\",\n \"note\": \"交换空间总量。取自 `/proc/meminfo`。\"\n },\n {\n \"lang\": \"en_US\",\n \"name\": \"Total swap space\",\n \"note\": \"Total amount of swap space. Taken from `/proc/meminfo `.\"\n }\n ]\n },\n {\n \"id\": 0,\n \"uuid\": 1717556327812354000,\n \"collector\": \"Categraf\",\n \"typ\": \"Linux\",\n \"name\": \"交换空间空闲量\",\n \"unit\": \"bytesIEC\",\n \"note\": \"交换空间空闲量。取自 `/proc/meminfo`。\",\n \"lang\": \"zh_CN\",\n \"expression\": \"mem_swap_free\",\n \"created_at\": 0,\n \"created_by\": \"\",\n \"updated_at\": 0,\n \"updated_by\": \"\",\n \"translation\": [\n {\n \"lang\": \"zh_CN\",\n \"name\": \"交换空间空闲量\",\n \"note\": \"交换空间空闲量。取自 `/proc/meminfo`。\"\n },\n {\n \"lang\": \"en_US\",\n \"name\": \"Swap space free amount\",\n \"note\": \"Swap space free amount. Taken from `/proc/meminfo `.\"\n }\n ]\n },\n {\n \"id\": 0,\n \"uuid\": 1717556327814499000,\n \"collector\": \"Categraf\",\n \"typ\": \"Linux\",\n \"name\": \"内存 Buffered 量\",\n \"unit\": \"bytesIEC\",\n \"note\": \"用作缓冲区的内存量。取自 `/proc/meminfo`。\",\n \"lang\": \"zh_CN\",\n \"expression\": \"mem_buffered\",\n \"created_at\": 0,\n \"created_by\": \"\",\n \"updated_at\": 0,\n \"updated_by\": \"\",\n \"translation\": [\n {\n \"lang\": \"zh_CN\",\n \"name\": \"内存 Buffered 量\",\n \"note\": \"用作缓冲区的内存量。取自 `/proc/meminfo`。\"\n },\n {\n \"lang\": \"en_US\",\n \"name\": \"Memory Buffered amount\",\n \"note\": \"The amount of memory used as a buffer. Taken from `/proc/meminfo `.\"\n }\n ]\n },\n {\n \"id\": 0,\n \"uuid\": 1717556327817214000,\n \"collector\": \"Categraf\",\n \"typ\": \"Linux\",\n \"name\": \"内存 Cached 量\",\n \"unit\": \"bytesIEC\",\n \"note\": \"用作文件缓存的内存量。取自 `/proc/meminfo`。\",\n \"lang\": \"zh_CN\",\n \"expression\": \"mem_cached\",\n \"created_at\": 0,\n \"created_by\": \"\",\n \"updated_at\": 0,\n \"updated_by\": \"\",\n \"translation\": [\n {\n \"lang\": \"zh_CN\",\n \"name\": \"内存 Cached 量\",\n \"note\": \"用作文件缓存的内存量。取自 `/proc/meminfo`。\"\n },\n {\n \"lang\": \"en_US\",\n \"name\": \"Memory Cached amount\",\n \"note\": \"The amount of memory used as a file cache. Taken from `/proc/meminfo `.\"\n }\n ]\n },\n {\n \"id\": 0,\n \"uuid\": 1717556327820178000,\n \"collector\": \"Categraf\",\n \"typ\": \"Linux\",\n \"name\": \"内存使用率\",\n \"unit\": \"percent\",\n \"note\": \"内存使用率\",\n \"lang\": \"zh_CN\",\n \"expression\": \"mem_used_percent\",\n \"created_at\": 0,\n \"created_by\": \"\",\n \"updated_at\": 0,\n \"updated_by\": \"\",\n \"translation\": [\n {\n \"lang\": \"zh_CN\",\n \"name\": \"内存使用率\",\n \"note\": \"内存使用率\"\n },\n {\n \"lang\": \"en_US\",\n \"name\": \"Memory usage\",\n \"note\": \"Memory usage\"\n }\n ]\n },\n {\n \"id\": 0,\n \"uuid\": 1717556327823042000,\n \"collector\": \"Categraf\",\n \"typ\": \"Linux\",\n \"name\": \"内存使用率(基于MemAvailable)\",\n \"unit\": \"percent\",\n \"note\": \"内存使用率。基于 MemAvailable 计算更准确,但是老版本的 Linux 不支持。\",\n \"lang\": \"zh_CN\",\n \"expression\": \"100 - mem_available_percent\",\n \"created_at\": 0,\n \"created_by\": \"\",\n \"updated_at\": 0,\n \"updated_by\": \"\",\n \"translation\": [\n {\n \"lang\": \"zh_CN\",\n \"name\": \"内存使用率(基于MemAvailable)\",\n \"note\": \"内存使用率。基于 MemAvailable 计算更准确,但是老版本的 Linux 不支持。\"\n },\n {\n \"lang\": \"en_US\",\n \"name\": \"Memory usage (based on MemAvailable)\",\n \"note\": \"Memory usage. Calculation based on MemAvailable is more accurate, but older versions of Linux do not support it.\"\n }\n ]\n },\n {\n \"id\": 0,\n \"uuid\": 1717556327827697000,\n \"collector\": \"Categraf\",\n \"typ\": \"Linux\",\n \"name\": \"内存使用量\",\n \"unit\": \"bytesIEC\",\n \"note\": \"内存使用量 = Total - Free - Buffered - Cached\",\n \"lang\": \"zh_CN\",\n \"expression\": \"mem_used\",\n \"created_at\": 0,\n \"created_by\": \"\",\n \"updated_at\": 0,\n \"updated_by\": \"\",\n \"translation\": [\n {\n \"lang\": \"zh_CN\",\n \"name\": \"内存使用量\",\n \"note\": \"内存使用量 = Total - Free - Buffered - Cached\"\n },\n {\n \"lang\": \"en_US\",\n \"name\": \"Memory usage\",\n \"note\": \"Memory usage = Total-Free-Buffered-Cached\"\n }\n ]\n },\n {\n \"id\": 0,\n \"uuid\": 1717556327830218000,\n \"collector\": \"Categraf\",\n \"typ\": \"Linux\",\n \"name\": \"内存可用率\",\n \"unit\": \"percent\",\n \"note\": \"可以立即分配给进程的可用内存量除以内存总量。分子分母的值均取自 `/proc/meminfo`。\",\n \"lang\": \"zh_CN\",\n \"expression\": \"mem_available_percent\",\n \"created_at\": 0,\n \"created_by\": \"\",\n \"updated_at\": 0,\n \"updated_by\": \"\",\n \"translation\": [\n {\n \"lang\": \"zh_CN\",\n \"name\": \"内存可用率\",\n \"note\": \"可以立即分配给进程的可用内存量除以内存总量。分子分母的值均取自 `/proc/meminfo`。\"\n },\n {\n \"lang\": \"en_US\",\n \"name\": \"Memory availability\",\n \"note\": \"The amount of available memory that can be immediately allocated to the process divided by the total amount of memory. The values of numerator and denominator are taken from `/proc/meminfo `.\"\n }\n ]\n },\n {\n \"id\": 0,\n \"uuid\": 1717556327832329000,\n \"collector\": \"Categraf\",\n \"typ\": \"Linux\",\n \"name\": \"内存可用量\",\n \"unit\": \"bytesIEC\",\n \"note\": \"可以立即分配给进程的可用内存量。取自 `/proc/meminfo`。\",\n \"lang\": \"zh_CN\",\n \"expression\": \"mem_available\",\n \"created_at\": 0,\n \"created_by\": \"\",\n \"updated_at\": 0,\n \"updated_by\": \"\",\n \"translation\": [\n {\n \"lang\": \"zh_CN\",\n \"name\": \"内存可用量\",\n \"note\": \"可以立即分配给进程的可用内存量。取自 `/proc/meminfo`。\"\n },\n {\n \"lang\": \"en_US\",\n \"name\": \"Memory Availability\",\n \"note\": \"The amount of available memory that can be immediately allocated to a process. Taken from `/proc/meminfo `.\"\n }\n ]\n },\n {\n \"id\": 0,\n \"uuid\": 1717556327834388000,\n \"collector\": \"Categraf\",\n \"typ\": \"Linux\",\n \"name\": \"内存总量\",\n \"unit\": \"bytesIEC\",\n \"note\": \"内存总量。取自 `/proc/meminfo`。\",\n \"lang\": \"zh_CN\",\n \"expression\": \"mem_total\",\n \"created_at\": 0,\n \"created_by\": \"\",\n \"updated_at\": 0,\n \"updated_by\": \"\",\n \"translation\": [\n {\n \"lang\": \"zh_CN\",\n \"name\": \"内存总量\",\n \"note\": \"内存总量。取自 `/proc/meminfo`。\"\n },\n {\n \"lang\": \"en_US\",\n \"name\": \"Total memory\",\n \"note\": \"Total amount of memory. Taken from `/proc/meminfo `.\"\n }\n ]\n },\n {\n \"id\": 0,\n \"uuid\": 1717556327836679000,\n \"collector\": \"Categraf\",\n \"typ\": \"Linux\",\n \"name\": \"内存活跃量\",\n \"unit\": \"bytesIEC\",\n \"note\": \"这个字段表示当前活跃使用的内存总量,即系统最近访问过并且预计很快会再次使用的内存页面。取自 `/proc/meminfo`。\",\n \"lang\": \"zh_CN\",\n \"expression\": \"mem_active\",\n \"created_at\": 0,\n \"created_by\": \"\",\n \"updated_at\": 0,\n \"updated_by\": \"\",\n \"translation\": [\n {\n \"lang\": \"zh_CN\",\n \"name\": \"内存活跃量\",\n \"note\": \"这个字段表示当前活跃使用的内存总量,即系统最近访问过并且预计很快会再次使用的内存页面。取自 `/proc/meminfo`。\"\n },\n {\n \"lang\": \"en_US\",\n \"name\": \"Memory activity\",\n \"note\": \"This field indicates the total amount of memory currently actively used, that is, the memory pages that the system has recently visited and is expected to be used again soon. Taken from `/proc/meminfo `.\"\n }\n ]\n },\n {\n \"id\": 0,\n \"uuid\": 1717556327838968000,\n \"collector\": \"Categraf\",\n \"typ\": \"Linux\",\n \"name\": \"内存空闲量\",\n \"unit\": \"bytesIEC\",\n \"note\": \"未使用的内存量。取自 `/proc/meminfo`。\",\n \"lang\": \"zh_CN\",\n \"expression\": \"mem_free\",\n \"created_at\": 0,\n \"created_by\": \"\",\n \"updated_at\": 0,\n \"updated_by\": \"\",\n \"translation\": [\n {\n \"lang\": \"zh_CN\",\n \"name\": \"内存空闲量\",\n \"note\": \"未使用的内存量。取自 `/proc/meminfo`。\"\n },\n {\n \"lang\": \"en_US\",\n \"name\": \"Free memory amount\",\n \"note\": \"Amount of unused memory. Taken from `/proc/meminfo `.\"\n }\n ]\n },\n {\n \"id\": 0,\n \"uuid\": 1717556327840782000,\n \"collector\": \"Categraf\",\n \"typ\": \"Linux\",\n \"name\": \"内存非活跃量\",\n \"unit\": \"bytesIEC\",\n \"note\": \"在上一采样周期未以某种方式使用的内存量。取自 `/proc/meminfo`。\",\n \"lang\": \"zh_CN\",\n \"expression\": \"mem_inactive\",\n \"created_at\": 0,\n \"created_by\": \"\",\n \"updated_at\": 0,\n \"updated_by\": \"\",\n \"translation\": [\n {\n \"lang\": \"zh_CN\",\n \"name\": \"内存非活跃量\",\n \"note\": \"在上一采样周期未以某种方式使用的内存量。取自 `/proc/meminfo`。\"\n },\n {\n \"lang\": \"en_US\",\n \"name\": \"Memory inactivity\",\n \"note\": \"The amount of memory that was not used in some way in the previous sampling period. Taken from `/proc/meminfo `.\"\n }\n ]\n },\n {\n \"id\": 0,\n \"uuid\": 1717556327842643000,\n \"collector\": \"Categraf\",\n \"typ\": \"Linux\",\n \"name\": \"当前 UDP 连接数\",\n \"unit\": \"none\",\n \"note\": \"\",\n \"lang\": \"zh_CN\",\n \"expression\": \"netstat_udp_socket\",\n \"created_at\": 0,\n \"created_by\": \"\",\n \"updated_at\": 0,\n \"updated_by\": \"\",\n \"translation\": [\n {\n \"lang\": \"zh_CN\",\n \"name\": \"当前 UDP 连接数\",\n \"note\": \"\"\n },\n {\n \"lang\": \"en_US\",\n \"name\": \"Number of current UDP connections\",\n \"note\": \"\"\n }\n ]\n },\n {\n \"id\": 0,\n \"uuid\": 1717556327844493000,\n \"collector\": \"Categraf\",\n \"typ\": \"Linux\",\n \"name\": \"硬盘 inode 使用率\",\n \"unit\": \"percent\",\n \"note\": \"如果存储了很多小文件,需要注意 inode 使用情况。\",\n \"lang\": \"zh_CN\",\n \"expression\": \"disk_inodes_used / disk_inodes_total * 100\",\n \"created_at\": 0,\n \"created_by\": \"\",\n \"updated_at\": 0,\n \"updated_by\": \"\",\n \"translation\": [\n {\n \"lang\": \"zh_CN\",\n \"name\": \"硬盘 inode 使用率\",\n \"note\": \"如果存储了很多小文件,需要注意 inode 使用情况。\"\n },\n {\n \"lang\": \"en_US\",\n \"name\": \"Hard disk inode usage\",\n \"note\": \"If you store a lot of small files, you need to pay attention to inode usage.\"\n }\n ]\n },\n {\n \"id\": 0,\n \"uuid\": 1717556327846749000,\n \"collector\": \"Categraf\",\n \"typ\": \"Linux\",\n \"name\": \"硬盘 inode 使用量\",\n \"unit\": \"none\",\n \"note\": \"如果存储了很多小文件,需要注意 inode 使用情况。\",\n \"lang\": \"zh_CN\",\n \"expression\": \"disk_inodes_used\",\n \"created_at\": 0,\n \"created_by\": \"\",\n \"updated_at\": 0,\n \"updated_by\": \"\",\n \"translation\": [\n {\n \"lang\": \"zh_CN\",\n \"name\": \"硬盘 inode 使用量\",\n \"note\": \"如果存储了很多小文件,需要注意 inode 使用情况。\"\n },\n {\n \"lang\": \"en_US\",\n \"name\": \"Hard disk inode usage\",\n \"note\": \"If you store a lot of small files, you need to pay attention to inode usage.\"\n }\n ]\n },\n {\n \"id\": 0,\n \"uuid\": 1717556327849317000,\n \"collector\": \"Categraf\",\n \"typ\": \"Linux\",\n \"name\": \"硬盘 inode 剩余量\",\n \"unit\": \"none\",\n \"note\": \"如果存储了很多小文件,需要注意 inode 使用情况。\",\n \"lang\": \"zh_CN\",\n \"expression\": \"disk_inodes_free\",\n \"created_at\": 0,\n \"created_by\": \"\",\n \"updated_at\": 0,\n \"updated_by\": \"\",\n \"translation\": [\n {\n \"lang\": \"zh_CN\",\n \"name\": \"硬盘 inode 剩余量\",\n \"note\": \"如果存储了很多小文件,需要注意 inode 使用情况。\"\n },\n {\n \"lang\": \"en_US\",\n \"name\": \"Remaining amount of hard disk inode\",\n \"note\": \"If you store a lot of small files, you need to pay attention to inode usage.\"\n }\n ]\n },\n {\n \"id\": 0,\n \"uuid\": 1717556327851474000,\n \"collector\": \"Categraf\",\n \"typ\": \"Linux\",\n \"name\": \"硬盘 inode 总量\",\n \"unit\": \"none\",\n \"note\": \"如果存储了很多小文件,需要注意 inode 使用情况。\",\n \"lang\": \"zh_CN\",\n \"expression\": \"disk_inodes_total\",\n \"created_at\": 0,\n \"created_by\": \"\",\n \"updated_at\": 0,\n \"updated_by\": \"\",\n \"translation\": [\n {\n \"lang\": \"zh_CN\",\n \"name\": \"硬盘 inode 总量\",\n \"note\": \"如果存储了很多小文件,需要注意 inode 使用情况。\"\n },\n {\n \"lang\": \"en_US\",\n \"name\": \"Total amount of hard disk inode\",\n \"note\": \"If you store a lot of small files, you need to pay attention to inode usage.\"\n }\n ]\n },\n {\n \"id\": 0,\n \"uuid\": 1717556327853833000,\n \"collector\": \"Categraf\",\n \"typ\": \"Linux\",\n \"name\": \"硬盘 IO - 写请求平均耗时\",\n \"unit\": \"milliseconds\",\n \"note\": \"\",\n \"lang\": \"zh_CN\",\n \"expression\": \"irate(diskio_write_time[2m])/irate(diskio_writes[2m])\",\n \"created_at\": 0,\n \"created_by\": \"\",\n \"updated_at\": 0,\n \"updated_by\": \"\",\n \"translation\": [\n {\n \"lang\": \"zh_CN\",\n \"name\": \"硬盘 IO - 写请求平均耗时\",\n \"note\": \"\"\n },\n {\n \"lang\": \"en_US\",\n \"name\": \"Hard disk IO-Write request average time\",\n \"note\": \"\"\n }\n ]\n },\n {\n \"id\": 0,\n \"uuid\": 1717556327856133000,\n \"collector\": \"Categraf\",\n \"typ\": \"Linux\",\n \"name\": \"硬盘 IO - 写请求等待处理的时间\",\n \"unit\": \"milliseconds\",\n \"note\": \"写入请求在磁盘上等待的时间。同时等待的多个写入请求会增加该数字。例如,如果 8 个请求均平均等待 1000 毫秒,则报告 8000。\",\n \"lang\": \"zh_CN\",\n \"expression\": \"diskio_write_time\",\n \"created_at\": 0,\n \"created_by\": \"\",\n \"updated_at\": 0,\n \"updated_by\": \"\",\n \"translation\": [\n {\n \"lang\": \"zh_CN\",\n \"name\": \"硬盘 IO - 写请求等待处理的时间\",\n \"note\": \"写入请求在磁盘上等待的时间。同时等待的多个写入请求会增加该数字。例如,如果 8 个请求均平均等待 1000 毫秒,则报告 8000。\"\n },\n {\n \"lang\": \"en_US\",\n \"name\": \"Hard Drive IO-Time the write request waits to be processed\",\n \"note\": \"The time a write request waits on disk. Multiple write requests waiting simultaneously increase this number. For example, if 8 requests all wait an average of 1000 milliseconds, 8000 is reported.\"\n }\n ]\n },\n {\n \"id\": 0,\n \"uuid\": 1717556327858277000,\n \"collector\": \"Categraf\",\n \"typ\": \"Linux\",\n \"name\": \"硬盘 IO - 加权 IO 处理时间\",\n \"unit\": \"milliseconds\",\n \"note\": \"只要设备在处理 IO,不管同时处理了几个,diskio_io_time 就会递增;同时处理的 IO 数量乘以时间就得到加权的值:diskio_weighted_io_time。\",\n \"lang\": \"zh_CN\",\n \"expression\": \"diskio_weighted_io_time\",\n \"created_at\": 0,\n \"created_by\": \"\",\n \"updated_at\": 0,\n \"updated_by\": \"\",\n \"translation\": [\n {\n \"lang\": \"zh_CN\",\n \"name\": \"硬盘 IO - 加权 IO 处理时间\",\n \"note\": \"只要设备在处理 IO,不管同时处理了几个,diskio_io_time 就会递增;同时处理的 IO 数量乘以时间就得到加权的值:diskio_weighted_io_time。\"\n },\n {\n \"lang\": \"en_US\",\n \"name\": \"Hard Disk IO-Weighted IO Processing Time\",\n \"note\": \"As long as the device is processing IO, no matter how many are processed at the same time, diskio _ IO _ time will be incremented; The number of simultaneously processed IOs is multiplied by time to obtain a weighted value: diskio _ weighted _ IO _ time.\"\n }\n ]\n },\n {\n \"id\": 0,\n \"uuid\": 1717556327860467000,\n \"collector\": \"Categraf\",\n \"typ\": \"Linux\",\n \"name\": \"硬盘 IO - 时间维度 Utilization\",\n \"unit\": \"percent\",\n \"note\": \"在时间维度统计硬盘 IO 时间占比,比如该值是 50%,表示有 50% 的时间是在处理 IO,该值 100%,表示一直在处理 IO,但是注意,现代磁盘设备具备并行处理多个 I/O 请求的能力,所以即便该值是 100%,可能硬盘还是可以接收新的处理请求。\\n\\n比如某人有两只手,最近 1 分钟一直在用单手劳动,从时间维度来看,利用率是 100%,但即便是 100%,再给他更多的活,他也能干,因为他还有一只手可用。\",\n \"lang\": \"zh_CN\",\n \"expression\": \"irate(diskio_io_time[2m])/1000*100\",\n \"created_at\": 0,\n \"created_by\": \"\",\n \"updated_at\": 0,\n \"updated_by\": \"\",\n \"translation\": [\n {\n \"lang\": \"zh_CN\",\n \"name\": \"硬盘 IO - 时间维度 Utilization\",\n \"note\": \"在时间维度统计硬盘 IO 时间占比,比如该值是 50%,表示有 50% 的时间是在处理 IO,该值 100%,表示一直在处理 IO,但是注意,现代磁盘设备具备并行处理多个 I/O 请求的能力,所以即便该值是 100%,可能硬盘还是可以接收新的处理请求。\\n\\n比如某人有两只手,最近 1 分钟一直在用单手劳动,从时间维度来看,利用率是 100%,但即便是 100%,再给他更多的活,他也能干,因为他还有一只手可用。\"\n },\n {\n \"lang\": \"en_US\",\n \"name\": \"Hard Disk IO-Time Dimension Utilization\",\n \"note\": \"Count the proportion of hard disk IO time in the time dimension. For example, if the value is 50%, it means that 50% of the time is processing IO, and if the value is 100%, it means that IO has been processing all the time. However, note that modern disk devices have the ability to process multiple I/O requests in parallel, so even if the value is 100%, the hard disk may still be able to receive new processing requests. \\n \\nFor example, someone has two hands and has been working with one hand in the last minute. From the time dimension, the utilization rate is 100%, but even if it is 100%, he can do it if he is given more work, because he still has one hand available.\"\n }\n ]\n },\n {\n \"id\": 0,\n \"uuid\": 1717556327862401000,\n \"collector\": \"Categraf\",\n \"typ\": \"Linux\",\n \"name\": \"硬盘 IO - 每秒写入字节数量\",\n \"unit\": \"bytesSecIEC\",\n \"note\": \"\",\n \"lang\": \"zh_CN\",\n \"expression\": \"irate(diskio_write_bytes[2m])\",\n \"created_at\": 0,\n \"created_by\": \"\",\n \"updated_at\": 0,\n \"updated_by\": \"\",\n \"translation\": [\n {\n \"lang\": \"zh_CN\",\n \"name\": \"硬盘 IO - 每秒写入字节数量\",\n \"note\": \"\"\n },\n {\n \"lang\": \"en_US\",\n \"name\": \"Hard disk IO-bytes written per second\",\n \"note\": \"\"\n }\n ]\n },\n {\n \"id\": 0,\n \"uuid\": 1717556327864213000,\n \"collector\": \"Categraf\",\n \"typ\": \"Linux\",\n \"name\": \"硬盘 IO - 每秒写次数\",\n \"unit\": \"none\",\n \"note\": \"\",\n \"lang\": \"zh_CN\",\n \"expression\": \"irate(diskio_writes{}[2m])\",\n \"created_at\": 0,\n \"created_by\": \"\",\n \"updated_at\": 0,\n \"updated_by\": \"\",\n \"translation\": [\n {\n \"lang\": \"zh_CN\",\n \"name\": \"硬盘 IO - 每秒写次数\",\n \"note\": \"\"\n },\n {\n \"lang\": \"en_US\",\n \"name\": \"Hard drive IO-writes per second\",\n \"note\": \"\"\n }\n ]\n },\n {\n \"id\": 0,\n \"uuid\": 1717556327866432000,\n \"collector\": \"Categraf\",\n \"typ\": \"Linux\",\n \"name\": \"硬盘 IO - 每秒合并写请求次数\",\n \"unit\": \"none\",\n \"note\": \"相邻的读取和写入可能会为了效率而被合并。因此,在最终交给磁盘之前,两个4K的读取可能会变成一个8K的读取,因此它将被计数(和排队)为仅有一个I/O。这些字段让你知道这种情况发生的频率。\",\n \"lang\": \"zh_CN\",\n \"expression\": \"irate(diskio_merged_writes[2m])\",\n \"created_at\": 0,\n \"created_by\": \"\",\n \"updated_at\": 0,\n \"updated_by\": \"\",\n \"translation\": [\n {\n \"lang\": \"zh_CN\",\n \"name\": \"硬盘 IO - 每秒合并写请求次数\",\n \"note\": \"相邻的读取和写入可能会为了效率而被合并。因此,在最终交给磁盘之前,两个4K的读取可能会变成一个8K的读取,因此它将被计数(和排队)为仅有一个I/O。这些字段让你知道这种情况发生的频率。\"\n },\n {\n \"lang\": \"en_US\",\n \"name\": \"Hard Disk IO-Number of merged write requests per second\",\n \"note\": \"Adjacent reads and writes may be merged for efficiency. So two 4K reads may turn into an 8K read before finally handing it over to disk, so it will be counted (and queued) to have only one I/O. These fields let you know how often this happens.\"\n }\n ]\n },\n {\n \"id\": 0,\n \"uuid\": 1717556327868237000,\n \"collector\": \"Categraf\",\n \"typ\": \"Linux\",\n \"name\": \"硬盘 IO - 每秒合并读请求次数\",\n \"unit\": \"none\",\n \"note\": \"相邻的读取和写入可能会为了效率而被合并。因此,在最终交给磁盘之前,两个4K的读取可能会变成一个8K的读取,因此它将被计数(和排队)为仅有一个I/O。这些字段让你知道这种情况发生的频率。\",\n \"lang\": \"zh_CN\",\n \"expression\": \"irate(diskio_merged_reads[2m])\",\n \"created_at\": 0,\n \"created_by\": \"\",\n \"updated_at\": 0,\n \"updated_by\": \"\",\n \"translation\": [\n {\n \"lang\": \"zh_CN\",\n \"name\": \"硬盘 IO - 每秒合并读请求次数\",\n \"note\": \"相邻的读取和写入可能会为了效率而被合并。因此,在最终交给磁盘之前,两个4K的读取可能会变成一个8K的读取,因此它将被计数(和排队)为仅有一个I/O。这些字段让你知道这种情况发生的频率。\"\n },\n {\n \"lang\": \"en_US\",\n \"name\": \"Hard disk IO-merge read requests per second\",\n \"note\": \"Adjacent reads and writes may be merged for efficiency. So two 4K reads may turn into an 8K read before finally handing it over to disk, so it will be counted (and queued) to have only one I/O. These fields let you know how often this happens.\"\n }\n ]\n },\n {\n \"id\": 0,\n \"uuid\": 1717556327870357000,\n \"collector\": \"Categraf\",\n \"typ\": \"Linux\",\n \"name\": \"硬盘 IO - 每秒读取字节数量\",\n \"unit\": \"bytesSecIEC\",\n \"note\": \"\",\n \"lang\": \"zh_CN\",\n \"expression\": \"irate(diskio_read_bytes[2m])\",\n \"created_at\": 0,\n \"created_by\": \"\",\n \"updated_at\": 0,\n \"updated_by\": \"\",\n \"translation\": [\n {\n \"lang\": \"zh_CN\",\n \"name\": \"硬盘 IO - 每秒读取字节数量\",\n \"note\": \"\"\n },\n {\n \"lang\": \"en_US\",\n \"name\": \"Hard Drive IO-bytes read per second\",\n \"note\": \"\"\n }\n ]\n },\n {\n \"id\": 0,\n \"uuid\": 1717556327872238000,\n \"collector\": \"Categraf\",\n \"typ\": \"Linux\",\n \"name\": \"硬盘 IO - 每秒读次数\",\n \"unit\": \"none\",\n \"note\": \"\",\n \"lang\": \"zh_CN\",\n \"expression\": \"irate(diskio_reads{}[2m])\",\n \"created_at\": 0,\n \"created_by\": \"\",\n \"updated_at\": 0,\n \"updated_by\": \"\",\n \"translation\": [\n {\n \"lang\": \"zh_CN\",\n \"name\": \"硬盘 IO - 每秒读次数\",\n \"note\": \"\"\n },\n {\n \"lang\": \"en_US\",\n \"name\": \"Hard drive IO-Reads per second\",\n \"note\": \"\"\n }\n ]\n },\n {\n \"id\": 0,\n \"uuid\": 1717556327874220000,\n \"collector\": \"Categraf\",\n \"typ\": \"Linux\",\n \"name\": \"硬盘 IO - 硬盘在处理 IO 的时间\",\n \"unit\": \"milliseconds\",\n \"note\": \"硬盘在处理 IO 的时间,单位是毫秒。假设最近 1 秒内有 500 毫秒是在处理 IO,这个值就要加 500,这是一个单调递增的 Counter 值,从操作系统启动之后就会一直涨。实际使用的时候,一般使用该指标计算硬盘 IO UTIL(时间维度的百分比)。\",\n \"lang\": \"zh_CN\",\n \"expression\": \"diskio_io_time\",\n \"created_at\": 0,\n \"created_by\": \"\",\n \"updated_at\": 0,\n \"updated_by\": \"\",\n \"translation\": [\n {\n \"lang\": \"zh_CN\",\n \"name\": \"硬盘 IO - 硬盘在处理 IO 的时间\",\n \"note\": \"硬盘在处理 IO 的时间,单位是毫秒。假设最近 1 秒内有 500 毫秒是在处理 IO,这个值就要加 500,这是一个单调递增的 Counter 值,从操作系统启动之后就会一直涨。实际使用的时候,一般使用该指标计算硬盘 IO UTIL(时间维度的百分比)。\"\n },\n {\n \"lang\": \"en_US\",\n \"name\": \"Hard Disk IO-Time the hard disk takes to process IO\",\n \"note\": \"The time it takes for the hard disk to process IO, in milliseconds. Assuming that 500 milliseconds are processing IO in the last 1 second, this value will be increased by 500. This is a monotonically increasing Counter value, which will continue to rise after the operating system is started. In actual use, this indicator is generally used to calculate the hard disk IO UTIL (percentage of time dimension).\"\n }\n ]\n },\n {\n \"id\": 0,\n \"uuid\": 1717556327876524000,\n \"collector\": \"Categraf\",\n \"typ\": \"Linux\",\n \"name\": \"硬盘 IO - 设备驱动程序正在处理的 IO 数量\",\n \"unit\": \"none\",\n \"note\": \"当前已经分配给设备驱动程序并且尚未完成的请求数量,Gauge 类型。如果 I/O 请求已经进入队列,但是尚未分配给设备驱动程序,则不统计在内。\",\n \"lang\": \"zh_CN\",\n \"expression\": \"diskio_iops_in_progress\",\n \"created_at\": 0,\n \"created_by\": \"\",\n \"updated_at\": 0,\n \"updated_by\": \"\",\n \"translation\": [\n {\n \"lang\": \"zh_CN\",\n \"name\": \"硬盘 IO - 设备驱动程序正在处理的 IO 数量\",\n \"note\": \"当前已经分配给设备驱动程序并且尚未完成的请求数量,Gauge 类型。如果 I/O 请求已经进入队列,但是尚未分配给设备驱动程序,则不统计在内。\"\n },\n {\n \"lang\": \"en_US\",\n \"name\": \"Hard Disk IO-Number of IO being processed by the device driver\",\n \"note\": \"The number of requests that have been currently assigned to the device driver and have not been completed, Gauge type. If I/O requests have entered the queue, but have not been assigned to the device driver, they are not counted.\"\n }\n ]\n },\n {\n \"id\": 0,\n \"uuid\": 1717556327878372000,\n \"collector\": \"Categraf\",\n \"typ\": \"Linux\",\n \"name\": \"硬盘 IO - 读请求平均耗时\",\n \"unit\": \"milliseconds\",\n \"note\": \"\",\n \"lang\": \"zh_CN\",\n \"expression\": \"irate(diskio_read_time[2m])/irate(diskio_reads[2m])\",\n \"created_at\": 0,\n \"created_by\": \"\",\n \"updated_at\": 0,\n \"updated_by\": \"\",\n \"translation\": [\n {\n \"lang\": \"zh_CN\",\n \"name\": \"硬盘 IO - 读请求平均耗时\",\n \"note\": \"\"\n },\n {\n \"lang\": \"en_US\",\n \"name\": \"Hard disk IO-Read request average time\",\n \"note\": \"\"\n }\n ]\n },\n {\n \"id\": 0,\n \"uuid\": 1717556327880512000,\n \"collector\": \"Categraf\",\n \"typ\": \"Linux\",\n \"name\": \"硬盘 IO - 读请求等待处理的时间\",\n \"unit\": \"milliseconds\",\n \"note\": \"读取请求在磁盘上等待的时间。同时等待的多个读取请求会增加该数字。例如,如果 5 个请求均平均等待 100 毫秒,则报告 500。\",\n \"lang\": \"zh_CN\",\n \"expression\": \"diskio_read_time\",\n \"created_at\": 0,\n \"created_by\": \"\",\n \"updated_at\": 0,\n \"updated_by\": \"\",\n \"translation\": [\n {\n \"lang\": \"zh_CN\",\n \"name\": \"硬盘 IO - 读请求等待处理的时间\",\n \"note\": \"读取请求在磁盘上等待的时间。同时等待的多个读取请求会增加该数字。例如,如果 5 个请求均平均等待 100 毫秒,则报告 500。\"\n },\n {\n \"lang\": \"en_US\",\n \"name\": \"Hard Drive IO-Time for read requests to be processed\",\n \"note\": \"The time the read request waits on disk. Multiple read requests waiting simultaneously increase this number. For example, if 5 requests all wait an average of 100 milliseconds, 500 is reported.\"\n }\n ]\n },\n {\n \"id\": 0,\n \"uuid\": 1717556327882423000,\n \"collector\": \"Categraf\",\n \"typ\": \"Linux\",\n \"name\": \"硬盘 IO - 队列深度\",\n \"unit\": \"none\",\n \"note\": \"假设过去 1000 毫秒内有 5000 毫秒的加权等待时间,相当于平均有 5 个 IO 请求在等待,即队列深度为 5。\",\n \"lang\": \"zh_CN\",\n \"expression\": \"irate(diskio_weighted_io_time[1m])/1000\",\n \"created_at\": 0,\n \"created_by\": \"\",\n \"updated_at\": 0,\n \"updated_by\": \"\",\n \"translation\": [\n {\n \"lang\": \"zh_CN\",\n \"name\": \"硬盘 IO - 队列深度\",\n \"note\": \"假设过去 1000 毫秒内有 5000 毫秒的加权等待时间,相当于平均有 5 个 IO 请求在等待,即队列深度为 5。\"\n },\n {\n \"lang\": \"en_US\",\n \"name\": \"Hard Disk IO-Queue Depth\",\n \"note\": \"Assuming that there is a weighted waiting time of 5000 ms in the past 1000 ms, it is equivalent to an average of 5 IO requests waiting, that is, the queue depth is 5.\"\n }\n ]\n },\n {\n \"id\": 0,\n \"uuid\": 1717556327884315000,\n \"collector\": \"Categraf\",\n \"typ\": \"Linux\",\n \"name\": \"硬盘使用率\",\n \"unit\": \"percent\",\n \"note\": \"硬盘空间使用率。\",\n \"lang\": \"zh_CN\",\n \"expression\": \"disk_used_percent\",\n \"created_at\": 0,\n \"created_by\": \"\",\n \"updated_at\": 0,\n \"updated_by\": \"\",\n \"translation\": [\n {\n \"lang\": \"zh_CN\",\n \"name\": \"硬盘使用率\",\n \"note\": \"硬盘空间使用率。\"\n },\n {\n \"lang\": \"en_US\",\n \"name\": \"Hard Drive Usage\",\n \"note\": \"Hard disk space usage.\"\n }\n ]\n },\n {\n \"id\": 0,\n \"uuid\": 1717556327886520000,\n \"collector\": \"Categraf\",\n \"typ\": \"Linux\",\n \"name\": \"硬盘使用量\",\n \"unit\": \"bytesSI\",\n \"note\": \"使用 SI 标准渲染数据,和 df 命令保持一致。\",\n \"lang\": \"zh_CN\",\n \"expression\": \"disk_used\",\n \"created_at\": 0,\n \"created_by\": \"\",\n \"updated_at\": 0,\n \"updated_by\": \"\",\n \"translation\": [\n {\n \"lang\": \"zh_CN\",\n \"name\": \"硬盘使用量\",\n \"note\": \"使用 SI 标准渲染数据,和 df 命令保持一致。\"\n },\n {\n \"lang\": \"en_US\",\n \"name\": \"Hard drive usage\",\n \"note\": \"Use the SI standard to render data, consistent with the df command.\"\n }\n ]\n },\n {\n \"id\": 0,\n \"uuid\": 1717556327888582000,\n \"collector\": \"Categraf\",\n \"typ\": \"Linux\",\n \"name\": \"硬盘信息读取是否出错\",\n \"unit\": \"none\",\n \"note\": \"0 表示正常,没有出错;非 0 表示获取硬盘信息出错了。\",\n \"lang\": \"zh_CN\",\n \"expression\": \"disk_device_error\",\n \"created_at\": 0,\n \"created_by\": \"\",\n \"updated_at\": 0,\n \"updated_by\": \"\",\n \"translation\": [\n {\n \"lang\": \"zh_CN\",\n \"name\": \"硬盘信息读取是否出错\",\n \"note\": \"0 表示正常,没有出错;非 0 表示获取硬盘信息出错了。\"\n },\n {\n \"lang\": \"en_US\",\n \"name\": \"Is there an error in reading hard disk information\",\n \"note\": \"0 means normal, no error; A non-0 indicates an error occurred in obtaining hard disk information.\"\n }\n ]\n },\n {\n \"id\": 0,\n \"uuid\": 1717556327890542000,\n \"collector\": \"Categraf\",\n \"typ\": \"Linux\",\n \"name\": \"硬盘剩余量\",\n \"unit\": \"bytesSI\",\n \"note\": \"使用 SI 标准渲染数据,和 df 命令保持一致。\",\n \"lang\": \"zh_CN\",\n \"expression\": \"disk_free\",\n \"created_at\": 0,\n \"created_by\": \"\",\n \"updated_at\": 0,\n \"updated_by\": \"\",\n \"translation\": [\n {\n \"lang\": \"zh_CN\",\n \"name\": \"硬盘剩余量\",\n \"note\": \"使用 SI 标准渲染数据,和 df 命令保持一致。\"\n },\n {\n \"lang\": \"en_US\",\n \"name\": \"Remaining hard disk\",\n \"note\": \"Use the SI standard to render data, consistent with the df command.\"\n }\n ]\n },\n {\n \"id\": 0,\n \"uuid\": 1717556327892398000,\n \"collector\": \"Categraf\",\n \"typ\": \"Linux\",\n \"name\": \"硬盘总量\",\n \"unit\": \"bytesSI\",\n \"note\": \"使用 SI 标准渲染数据,和 df 命令保持一致。\",\n \"lang\": \"zh_CN\",\n \"expression\": \"disk_total\",\n \"created_at\": 0,\n \"created_by\": \"\",\n \"updated_at\": 0,\n \"updated_by\": \"\",\n \"translation\": [\n {\n \"lang\": \"zh_CN\",\n \"name\": \"硬盘总量\",\n \"note\": \"使用 SI 标准渲染数据,和 df 命令保持一致。\"\n },\n {\n \"lang\": \"en_US\",\n \"name\": \"Total hard disk\",\n \"note\": \"Use the SI standard to render data, consistent with the df command.\"\n }\n ]\n },\n {\n \"id\": 0,\n \"uuid\": 1717556327894251000,\n \"collector\": \"Categraf\",\n \"typ\": \"Linux\",\n \"name\": \"系统 CPU 核数\",\n \"unit\": \"none\",\n \"note\": \"CPU 逻辑核的数量。\",\n \"lang\": \"zh_CN\",\n \"expression\": \"system_n_cpus\",\n \"created_at\": 0,\n \"created_by\": \"\",\n \"updated_at\": 0,\n \"updated_by\": \"\",\n \"translation\": [\n {\n \"lang\": \"zh_CN\",\n \"name\": \"系统 CPU 核数\",\n \"note\": \"CPU 逻辑核的数量。\"\n },\n {\n \"lang\": \"en_US\",\n \"name\": \"Number of CPU cores\",\n \"note\": \"Number of CPU logical cores.\"\n }\n ]\n },\n {\n \"id\": 0,\n \"uuid\": 1717556327896436000,\n \"collector\": \"Categraf\",\n \"typ\": \"Linux\",\n \"name\": \"系统启动时长\",\n \"unit\": \"seconds\",\n \"note\": \"操作系统启动了多久,单位:秒。\",\n \"lang\": \"zh_CN\",\n \"expression\": \"system_uptime\",\n \"created_at\": 0,\n \"created_by\": \"\",\n \"updated_at\": 0,\n \"updated_by\": \"\",\n \"translation\": [\n {\n \"lang\": \"zh_CN\",\n \"name\": \"系统启动时长\",\n \"note\": \"操作系统启动了多久,单位:秒。\"\n },\n {\n \"lang\": \"en_US\",\n \"name\": \"System startup time\",\n \"note\": \"How long has the operating system been booted, in seconds.\"\n }\n ]\n },\n {\n \"id\": 0,\n \"uuid\": 1717556327898386000,\n \"collector\": \"Categraf\",\n \"typ\": \"Linux\",\n \"name\": \"系统平均负载 - 最近 1 分钟\",\n \"unit\": \"none\",\n \"note\": \"取自 `/proc/loadavg`。\",\n \"lang\": \"zh_CN\",\n \"expression\": \"system_load1\",\n \"created_at\": 0,\n \"created_by\": \"\",\n \"updated_at\": 0,\n \"updated_by\": \"\",\n \"translation\": [\n {\n \"lang\": \"zh_CN\",\n \"name\": \"系统平均负载 - 最近 1 分钟\",\n \"note\": \"取自 `/proc/loadavg`。\"\n },\n {\n \"lang\": \"en_US\",\n \"name\": \"System load average-last 1 minute\",\n \"note\": \"Taken from `/proc/loadavg `.\"\n }\n ]\n },\n {\n \"id\": 0,\n \"uuid\": 1717556327900441000,\n \"collector\": \"Categraf\",\n \"typ\": \"Linux\",\n \"name\": \"系统平均负载 - 最近 15 分钟\",\n \"unit\": \"none\",\n \"note\": \"取自 `/proc/loadavg`。\",\n \"lang\": \"zh_CN\",\n \"expression\": \"system_load15\",\n \"created_at\": 0,\n \"created_by\": \"\",\n \"updated_at\": 0,\n \"updated_by\": \"\",\n \"translation\": [\n {\n \"lang\": \"zh_CN\",\n \"name\": \"系统平均负载 - 最近 15 分钟\",\n \"note\": \"取自 `/proc/loadavg`。\"\n },\n {\n \"lang\": \"en_US\",\n \"name\": \"System load average-last 15 minutes\",\n \"note\": \"Taken from `/proc/loadavg `.\"\n }\n ]\n },\n {\n \"id\": 0,\n \"uuid\": 1717556327902331000,\n \"collector\": \"Categraf\",\n \"typ\": \"Linux\",\n \"name\": \"系统平均负载 - 最近 5 分钟\",\n \"unit\": \"none\",\n \"note\": \"取自 `/proc/loadavg`。\",\n \"lang\": \"zh_CN\",\n \"expression\": \"system_load5\",\n \"created_at\": 0,\n \"created_by\": \"\",\n \"updated_at\": 0,\n \"updated_by\": \"\",\n \"translation\": [\n {\n \"lang\": \"zh_CN\",\n \"name\": \"系统平均负载 - 最近 5 分钟\",\n \"note\": \"取自 `/proc/loadavg`。\"\n },\n {\n \"lang\": \"en_US\",\n \"name\": \"System load average-last 5 minutes\",\n \"note\": \"Taken from `/proc/loadavg `.\"\n }\n ]\n },\n {\n \"id\": 0,\n \"uuid\": 1717556327904274000,\n \"collector\": \"Categraf\",\n \"typ\": \"Linux\",\n \"name\": \"系统平均负载(单核) - 最近 1 分钟\",\n \"unit\": \"none\",\n \"note\": \"相当于 `system_load1 / system_n_cpus`\",\n \"lang\": \"zh_CN\",\n \"expression\": \"system_load_norm_1\",\n \"created_at\": 0,\n \"created_by\": \"\",\n \"updated_at\": 0,\n \"updated_by\": \"\",\n \"translation\": [\n {\n \"lang\": \"zh_CN\",\n \"name\": \"系统平均负载(单核) - 最近 1 分钟\",\n \"note\": \"相当于 `system_load1 / system_n_cpus`\"\n },\n {\n \"lang\": \"en_US\",\n \"name\": \"System Load Average (Single Core)-Last 1 Minute\",\n \"note\": \"Equivalent to ` system _ load1/system _ n _ cpus `\"\n }\n ]\n },\n {\n \"id\": 0,\n \"uuid\": 1717556327906176000,\n \"collector\": \"Categraf\",\n \"typ\": \"Linux\",\n \"name\": \"系统平均负载(单核) - 最近 15 分钟\",\n \"unit\": \"none\",\n \"note\": \"相当于 `system_load15 / system_n_cpus`\",\n \"lang\": \"zh_CN\",\n \"expression\": \"system_load_norm_15\",\n \"created_at\": 0,\n \"created_by\": \"\",\n \"updated_at\": 0,\n \"updated_by\": \"\",\n \"translation\": [\n {\n \"lang\": \"zh_CN\",\n \"name\": \"系统平均负载(单核) - 最近 15 分钟\",\n \"note\": \"相当于 `system_load15 / system_n_cpus`\"\n },\n {\n \"lang\": \"en_US\",\n \"name\": \"System Load Average (Single Core)-Last 15 Minutes\",\n \"note\": \"Equivalent to ` system _ load15/system _ n _ cpus `\"\n }\n ]\n },\n {\n \"id\": 0,\n \"uuid\": 1717556327907960000,\n \"collector\": \"Categraf\",\n \"typ\": \"Linux\",\n \"name\": \"系统平均负载(单核) - 最近 5 分钟\",\n \"unit\": \"none\",\n \"note\": \"相当于 `system_load5 / system_n_cpus`\",\n \"lang\": \"zh_CN\",\n \"expression\": \"system_load_norm_5\",\n \"created_at\": 0,\n \"created_by\": \"\",\n \"updated_at\": 0,\n \"updated_by\": \"\",\n \"translation\": [\n {\n \"lang\": \"zh_CN\",\n \"name\": \"系统平均负载(单核) - 最近 5 分钟\",\n \"note\": \"相当于 `system_load5 / system_n_cpus`\"\n },\n {\n \"lang\": \"en_US\",\n \"name\": \"System Load Average (Single Core)-Last 5 Minutes\",\n \"note\": \"Equivalent to ` system _ load5/system _ n _ cpus `\"\n }\n ]\n },\n {\n \"id\": 0,\n \"uuid\": 1717556327909750000,\n \"collector\": \"Categraf\",\n \"typ\": \"Linux\",\n \"name\": \"网卡入方向(接收)每秒丢弃的数据包个数\",\n \"unit\": \"none\",\n \"note\": \"原始指标 net_drop_in 表示操作系统启动之后各个网卡入方向(接收)丢弃的数据包总数。\",\n \"lang\": \"zh_CN\",\n \"expression\": \"irate(net_drop_in[2m])\",\n \"created_at\": 0,\n \"created_by\": \"\",\n \"updated_at\": 0,\n \"updated_by\": \"\",\n \"translation\": [\n {\n \"lang\": \"zh_CN\",\n \"name\": \"网卡入方向(接收)每秒丢弃的数据包个数\",\n \"note\": \"原始指标 net_drop_in 表示操作系统启动之后各个网卡入方向(接收)丢弃的数据包总数。\"\n },\n {\n \"lang\": \"en_US\",\n \"name\": \"Number of packets dropped per second in the incoming direction (receiving) of the network card\",\n \"note\": \"The original indicator net _ drop _ in indicates the total number of packets dropped (received) by each network card after the operating system is started.\"\n }\n ]\n },\n {\n \"id\": 0,\n \"uuid\": 1717556327911515000,\n \"collector\": \"Categraf\",\n \"typ\": \"Linux\",\n \"name\": \"网卡入方向(接收)每秒数据包数\",\n \"unit\": \"none\",\n \"note\": \"原始指标 net_packets_recv 表示操作系统启动之后各个网卡入方向(接收)数据包总数。\",\n \"lang\": \"zh_CN\",\n \"expression\": \"irate(net_packets_recv[2m])\",\n \"created_at\": 0,\n \"created_by\": \"\",\n \"updated_at\": 0,\n \"updated_by\": \"\",\n \"translation\": [\n {\n \"lang\": \"zh_CN\",\n \"name\": \"网卡入方向(接收)每秒数据包数\",\n \"note\": \"原始指标 net_packets_recv 表示操作系统启动之后各个网卡入方向(接收)数据包总数。\"\n },\n {\n \"lang\": \"en_US\",\n \"name\": \"NIC incoming (receiving) packets per second\",\n \"note\": \"The original indicator net _ packets _ recv indicates the total number of incoming (received) data packets by each network card after the operating system is booted.\"\n }\n ]\n },\n {\n \"id\": 0,\n \"uuid\": 1717556327913386000,\n \"collector\": \"Categraf\",\n \"typ\": \"Linux\",\n \"name\": \"网卡入方向(接收)每秒错包数\",\n \"unit\": \"none\",\n \"note\": \"原始指标 net_err_in 表示操作系统启动之后各个网卡入方向(接收)错包总数。\",\n \"lang\": \"zh_CN\",\n \"expression\": \"irate(net_err_in[2m])\",\n \"created_at\": 0,\n \"created_by\": \"\",\n \"updated_at\": 0,\n \"updated_by\": \"\",\n \"translation\": [\n {\n \"lang\": \"zh_CN\",\n \"name\": \"网卡入方向(接收)每秒错包数\",\n \"note\": \"原始指标 net_err_in 表示操作系统启动之后各个网卡入方向(接收)错包总数。\"\n },\n {\n \"lang\": \"en_US\",\n \"name\": \"Number of wrong packets per second in the incoming direction (receiving) of the network card\",\n \"note\": \"The original indicator net _ err _ in indicates the total number of error packets in (received) by each network card after the operating system is started.\"\n }\n ]\n },\n {\n \"id\": 0,\n \"uuid\": 1717556327915259000,\n \"collector\": \"Categraf\",\n \"typ\": \"Linux\",\n \"name\": \"网卡出方向(发送)每秒丢弃的数据包个数\",\n \"unit\": \"none\",\n \"note\": \"原始指标 net_drop_out 表示操作系统启动之后各个网卡出方向(发送)丢弃的数据包总数。\",\n \"lang\": \"zh_CN\",\n \"expression\": \"irate(net_drop_out[2m])\",\n \"created_at\": 0,\n \"created_by\": \"\",\n \"updated_at\": 0,\n \"updated_by\": \"\",\n \"translation\": [\n {\n \"lang\": \"zh_CN\",\n \"name\": \"网卡出方向(发送)每秒丢弃的数据包个数\",\n \"note\": \"原始指标 net_drop_out 表示操作系统启动之后各个网卡出方向(发送)丢弃的数据包总数。\"\n },\n {\n \"lang\": \"en_US\",\n \"name\": \"Number of packets discarded per second in the outbound direction (sending) of the network card\",\n \"note\": \"The original indicator net _ drop _ out indicates the total number of packets discarded (sent) by each network card outbound after the operating system is started.\"\n }\n ]\n },\n {\n \"id\": 0,\n \"uuid\": 1717556327917341000,\n \"collector\": \"Categraf\",\n \"typ\": \"Linux\",\n \"name\": \"网卡出方向(发送)每秒数据包数\",\n \"unit\": \"none\",\n \"note\": \"原始指标 net_packets_sent 表示操作系统启动之后各个网卡出方向(发送)数据包总数。\",\n \"lang\": \"zh_CN\",\n \"expression\": \"irate(net_packets_sent[2m])\",\n \"created_at\": 0,\n \"created_by\": \"\",\n \"updated_at\": 0,\n \"updated_by\": \"\",\n \"translation\": [\n {\n \"lang\": \"zh_CN\",\n \"name\": \"网卡出方向(发送)每秒数据包数\",\n \"note\": \"原始指标 net_packets_sent 表示操作系统启动之后各个网卡出方向(发送)数据包总数。\"\n },\n {\n \"lang\": \"en_US\",\n \"name\": \"Number of packets per second in the outgoing direction (sent) of the network card\",\n \"note\": \"The original indicator net _ packets _ sent indicates the total number of outbound (sent) data packets from each network card after the operating system is started.\"\n }\n ]\n },\n {\n \"id\": 0,\n \"uuid\": 1717556327919292000,\n \"collector\": \"Categraf\",\n \"typ\": \"Linux\",\n \"name\": \"网卡出方向(发送)每秒错包数\",\n \"unit\": \"none\",\n \"note\": \"原始指标 net_err_out 表示操作系统启动之后各个网卡出方向(发送)错包总数。\",\n \"lang\": \"zh_CN\",\n \"expression\": \"irate(net_err_out[2m])\",\n \"created_at\": 0,\n \"created_by\": \"\",\n \"updated_at\": 0,\n \"updated_by\": \"\",\n \"translation\": [\n {\n \"lang\": \"zh_CN\",\n \"name\": \"网卡出方向(发送)每秒错包数\",\n \"note\": \"原始指标 net_err_out 表示操作系统启动之后各个网卡出方向(发送)错包总数。\"\n },\n {\n \"lang\": \"en_US\",\n \"name\": \"Number of wrong packets per second in the outgoing direction (sending) of the network card\",\n \"note\": \"The original indicator net _ errr _ out indicates the total number of error packets sent out by each network card after the operating system is started.\"\n }\n ]\n },\n {\n \"id\": 0,\n \"uuid\": 1717556327921364000,\n \"collector\": \"Categraf\",\n \"typ\": \"Linux\",\n \"name\": \"网卡每秒发送的 bit 量\",\n \"unit\": \"bitsSecIEC\",\n \"note\": \"原始指标 net_bytes_sent 表示操作系统启动之后发送的 byte 总量,因为网卡流量习惯使用 bit 作为单位,所以在表达式中做了换算。\",\n \"lang\": \"zh_CN\",\n \"expression\": \"irate(net_bytes_sent[2m]) * 8\",\n \"created_at\": 0,\n \"created_by\": \"\",\n \"updated_at\": 0,\n \"updated_by\": \"\",\n \"translation\": [\n {\n \"lang\": \"zh_CN\",\n \"name\": \"网卡每秒发送的 bit 量\",\n \"note\": \"原始指标 net_bytes_sent 表示操作系统启动之后发送的 byte 总量,因为网卡流量习惯使用 bit 作为单位,所以在表达式中做了换算。\"\n },\n {\n \"lang\": \"en_US\",\n \"name\": \"The amount of bits sent per second by the network card\",\n \"note\": \"The original indicator net _ bytes _ sent represents the total number of bytes sent after the operating system is started. Because the network card traffic is used to using bits as the unit, it is converted in the expression.\"\n }\n ]\n },\n {\n \"id\": 0,\n \"uuid\": 1717556327923797000,\n \"collector\": \"Categraf\",\n \"typ\": \"Linux\",\n \"name\": \"网卡每秒接收的 bit 量\",\n \"unit\": \"bitsSecIEC\",\n \"note\": \"原始指标 net_bytes_recv 表示操作系统启动之后接收的 byte 总量,因为网卡流量习惯使用 bit 作为单位,所以在表达式中做了换算。\",\n \"lang\": \"zh_CN\",\n \"expression\": \"irate(net_bytes_recv[2m]) * 8\",\n \"created_at\": 0,\n \"created_by\": \"\",\n \"updated_at\": 0,\n \"updated_by\": \"\",\n \"translation\": [\n {\n \"lang\": \"zh_CN\",\n \"name\": \"网卡每秒接收的 bit 量\",\n \"note\": \"原始指标 net_bytes_recv 表示操作系统启动之后接收的 byte 总量,因为网卡流量习惯使用 bit 作为单位,所以在表达式中做了换算。\"\n },\n {\n \"lang\": \"en_US\",\n \"name\": \"The number of bits received by the network card per second\",\n \"note\": \"The original indicator net _ bytes _ recv represents the total number of bytes received after the operating system is started. Because the network card traffic is used to using bits as the unit, it is converted in the expression.\"\n }\n ]\n },\n {\n \"id\": 0,\n \"uuid\": 1717556327925641000,\n \"collector\": \"Categraf\",\n \"typ\": \"Linux\",\n \"name\": \"进程数 - “僵死”状态的进程数\",\n \"unit\": \"none\",\n \"note\": \"处于“僵死”状态的进程数,它是由 Linux 上的 X 状态代码表示的。\",\n \"lang\": \"zh_CN\",\n \"expression\": \"processes_dead\",\n \"created_at\": 0,\n \"created_by\": \"\",\n \"updated_at\": 0,\n \"updated_by\": \"\",\n \"translation\": [\n {\n \"lang\": \"zh_CN\",\n \"name\": \"进程数 - “僵死”状态的进程数\",\n \"note\": \"处于“僵死”状态的进程数,它是由 Linux 上的 X 状态代码表示的。\"\n },\n {\n \"lang\": \"en_US\",\n \"name\": \"Number of processes-Number of processes in the \\\"dead\\\" state\",\n \"note\": \"The number of processes in the \\\"dead\\\" state, which is represented by the X status code on Linux.\"\n }\n ]\n },\n {\n \"id\": 0,\n \"uuid\": 1717556327928108000,\n \"collector\": \"Categraf\",\n \"typ\": \"Linux\",\n \"name\": \"进程数 - “分页”状态的进程数\",\n \"unit\": \"none\",\n \"note\": \"处于“分页”状态的进程数,它是由 Linux 上的 W 状态代码表示的。\",\n \"lang\": \"zh_CN\",\n \"expression\": \"processes_paging\",\n \"created_at\": 0,\n \"created_by\": \"\",\n \"updated_at\": 0,\n \"updated_by\": \"\",\n \"translation\": [\n {\n \"lang\": \"zh_CN\",\n \"name\": \"进程数 - “分页”状态的进程数\",\n \"note\": \"处于“分页”状态的进程数,它是由 Linux 上的 W 状态代码表示的。\"\n },\n {\n \"lang\": \"en_US\",\n \"name\": \"Number of Processes-Number of processes in the \\\"Paging\\\" state\",\n \"note\": \"The number of processes in the \\\"paging\\\" state, which is represented by the W status code on Linux.\"\n }\n ]\n },\n {\n \"id\": 0,\n \"uuid\": 1717556327930025000,\n \"collector\": \"Categraf\",\n \"typ\": \"Linux\",\n \"name\": \"进程数 - 停止的进程数\",\n \"unit\": \"none\",\n \"note\": \"停止的进程数,由 T 状态代码表示。\",\n \"lang\": \"zh_CN\",\n \"expression\": \"processes_stopped\",\n \"created_at\": 0,\n \"created_by\": \"\",\n \"updated_at\": 0,\n \"updated_by\": \"\",\n \"translation\": [\n {\n \"lang\": \"zh_CN\",\n \"name\": \"进程数 - 停止的进程数\",\n \"note\": \"停止的进程数,由 T 状态代码表示。\"\n },\n {\n \"lang\": \"en_US\",\n \"name\": \"Number of Processes-Number of stopped processes\",\n \"note\": \"The number of processes stopped, represented by the T status code.\"\n }\n ]\n },\n {\n \"id\": 0,\n \"uuid\": 1717556327931736000,\n \"collector\": \"Categraf\",\n \"typ\": \"Linux\",\n \"name\": \"进程数 - 僵尸进程数\",\n \"unit\": \"none\",\n \"note\": \"僵尸进程数,由 Z 状态代码表示。\",\n \"lang\": \"zh_CN\",\n \"expression\": \"processes_zombies\",\n \"created_at\": 0,\n \"created_by\": \"\",\n \"updated_at\": 0,\n \"updated_by\": \"\",\n \"translation\": [\n {\n \"lang\": \"zh_CN\",\n \"name\": \"进程数 - 僵尸进程数\",\n \"note\": \"僵尸进程数,由 Z 状态代码表示。\"\n },\n {\n \"lang\": \"en_US\",\n \"name\": \"Number of processes-Number of zombie processes\",\n \"note\": \"Number of zombie processes, represented by the Z status code.\"\n }\n ]\n },\n {\n \"id\": 0,\n \"uuid\": 1717556327933660000,\n \"collector\": \"Categraf\",\n \"typ\": \"Linux\",\n \"name\": \"进程数 - 总数\",\n \"unit\": \"none\",\n \"note\": \"实例上的总进程数。\",\n \"lang\": \"zh_CN\",\n \"expression\": \"processes_total\",\n \"created_at\": 0,\n \"created_by\": \"\",\n \"updated_at\": 0,\n \"updated_by\": \"\",\n \"translation\": [\n {\n \"lang\": \"zh_CN\",\n \"name\": \"进程数 - 总数\",\n \"note\": \"实例上的总进程数。\"\n },\n {\n \"lang\": \"en_US\",\n \"name\": \"Number of processes-total\",\n \"note\": \"The total number of processes on the instance.\"\n }\n ]\n },\n {\n \"id\": 0,\n \"uuid\": 1717556327935470000,\n \"collector\": \"Categraf\",\n \"typ\": \"Linux\",\n \"name\": \"进程数 - 未知状态的进程数\",\n \"unit\": \"none\",\n \"note\": \"未知状态的进程数。\",\n \"lang\": \"zh_CN\",\n \"expression\": \"processes_unknown\",\n \"created_at\": 0,\n \"created_by\": \"\",\n \"updated_at\": 0,\n \"updated_by\": \"\",\n \"translation\": [\n {\n \"lang\": \"zh_CN\",\n \"name\": \"进程数 - 未知状态的进程数\",\n \"note\": \"未知状态的进程数。\"\n },\n {\n \"lang\": \"en_US\",\n \"name\": \"Number of Processes-Number of processes with unknown status\",\n \"note\": \"Number of processes with unknown status.\"\n }\n ]\n },\n {\n \"id\": 0,\n \"uuid\": 1717556327937676000,\n \"collector\": \"Categraf\",\n \"typ\": \"Linux\",\n \"name\": \"进程数 - 正在睡眠的进程数\",\n \"unit\": \"none\",\n \"note\": \"睡眠的进程数,由 S 状态代码表示。\",\n \"lang\": \"zh_CN\",\n \"expression\": \"processes_sleeping\",\n \"created_at\": 0,\n \"created_by\": \"\",\n \"updated_at\": 0,\n \"updated_by\": \"\",\n \"translation\": [\n {\n \"lang\": \"zh_CN\",\n \"name\": \"进程数 - 正在睡眠的进程数\",\n \"note\": \"睡眠的进程数,由 S 状态代码表示。\"\n },\n {\n \"lang\": \"en_US\",\n \"name\": \"Number of processes-Number of processes that are sleeping\",\n \"note\": \"Number of sleeping processes, represented by the S status code.\"\n }\n ]\n },\n {\n \"id\": 0,\n \"uuid\": 1717556327939548000,\n \"collector\": \"Categraf\",\n \"typ\": \"Linux\",\n \"name\": \"进程数 - 正在运行的进程数\",\n \"unit\": \"none\",\n \"note\": \"正在运行的进程数,由 R 状态代码表示。\",\n \"lang\": \"zh_CN\",\n \"expression\": \"processes_running\",\n \"created_at\": 0,\n \"created_by\": \"\",\n \"updated_at\": 0,\n \"updated_by\": \"\",\n \"translation\": [\n {\n \"lang\": \"zh_CN\",\n \"name\": \"进程数 - 正在运行的进程数\",\n \"note\": \"正在运行的进程数,由 R 状态代码表示。\"\n },\n {\n \"lang\": \"en_US\",\n \"name\": \"Number of Processes-Number of processes running\",\n \"note\": \"The number of processes running, represented by the R status code.\"\n }\n ]\n },\n {\n \"id\": 0,\n \"uuid\": 1717556327941412000,\n \"collector\": \"Categraf\",\n \"typ\": \"Linux\",\n \"name\": \"进程数 - 空闲的数量\",\n \"unit\": \"none\",\n \"note\": \"处于空闲状态 (睡眠超过 20 秒) 的进程数。\",\n \"lang\": \"zh_CN\",\n \"expression\": \"processes_idle\",\n \"created_at\": 0,\n \"created_by\": \"\",\n \"updated_at\": 0,\n \"updated_by\": \"\",\n \"translation\": [\n {\n \"lang\": \"zh_CN\",\n \"name\": \"进程数 - 空闲的数量\",\n \"note\": \"处于空闲状态 (睡眠超过 20 秒) 的进程数。\"\n },\n {\n \"lang\": \"en_US\",\n \"name\": \"Number of processes-Number of idle\",\n \"note\": \"Number of processes that are idle (sleeping for more than 20 seconds).\"\n }\n ]\n },\n {\n \"id\": 0,\n \"uuid\": 1717556327943375000,\n \"collector\": \"Categraf\",\n \"typ\": \"Linux\",\n \"name\": \"进程数 - 线程总数\",\n \"unit\": \"none\",\n \"note\": \"组成进程的总线程数。该指标仅适用于 Linux 实例。\",\n \"lang\": \"zh_CN\",\n \"expression\": \"processes_total_threads\",\n \"created_at\": 0,\n \"created_by\": \"\",\n \"updated_at\": 0,\n \"updated_by\": \"\",\n \"translation\": [\n {\n \"lang\": \"zh_CN\",\n \"name\": \"进程数 - 线程总数\",\n \"note\": \"组成进程的总线程数。该指标仅适用于 Linux 实例。\"\n },\n {\n \"lang\": \"en_US\",\n \"name\": \"Number of Processes-Total Threads\",\n \"note\": \"The number of bus threads that make up the process. This metric applies only to Linux instances.\"\n }\n ]\n },\n {\n \"id\": 0,\n \"uuid\": 1717556327945242000,\n \"collector\": \"Categraf\",\n \"typ\": \"Linux\",\n \"name\": \"进程数 - 被阻止的进程数\",\n \"unit\": \"none\",\n \"note\": \"被阻止的进程数量。\",\n \"lang\": \"zh_CN\",\n \"expression\": \"processes_blocked\",\n \"created_at\": 0,\n \"created_by\": \"\",\n \"updated_at\": 0,\n \"updated_by\": \"\",\n \"translation\": [\n {\n \"lang\": \"zh_CN\",\n \"name\": \"进程数 - 被阻止的进程数\",\n \"note\": \"被阻止的进程数量。\"\n },\n {\n \"lang\": \"en_US\",\n \"name\": \"Number of processes-Number of blocked processes\",\n \"note\": \"Number of blocked processes.\"\n }\n ]\n }\n]"
},
{
"path": "integrations/Linux/metrics/exporter-base.json",
"content": "[\n {\n \"id\": 0,\n \"uuid\": 1717556327947680000,\n \"collector\": \"Exporter\",\n \"typ\": \"Linux\",\n \"name\": \"CPU Steal 时间占比(整机平均)\",\n \"unit\": \"percent\",\n \"note\": \"\",\n \"lang\": \"zh_CN\",\n \"expression\": \"avg without (mode,cpu) ( irate(node_cpu_seconds_total{mode=\\\"steal\\\"}[2m]) ) * 100\",\n \"created_at\": 0,\n \"created_by\": \"\",\n \"updated_at\": 0,\n \"updated_by\": \"\",\n \"translation\": [\n {\n \"lang\": \"zh_CN\",\n \"name\": \"CPU Steal 时间占比(整机平均)\",\n \"note\": \"\"\n },\n {\n \"lang\": \"en_US\",\n \"name\": \"CPU Steal time ratio (average of the whole machine)\",\n \"note\": \"\"\n }\n ]\n },\n {\n \"id\": 0,\n \"uuid\": 1717556327949505000,\n \"collector\": \"Exporter\",\n \"typ\": \"Linux\",\n \"name\": \"CPU 内核态时间占比(整机平均)\",\n \"unit\": \"percent\",\n \"note\": \"\",\n \"lang\": \"zh_CN\",\n \"expression\": \"avg without (mode,cpu) ( irate(node_cpu_seconds_total{mode=\\\"system\\\"}[2m]) ) * 100\",\n \"created_at\": 0,\n \"created_by\": \"\",\n \"updated_at\": 0,\n \"updated_by\": \"\",\n \"translation\": [\n {\n \"lang\": \"zh_CN\",\n \"name\": \"CPU 内核态时间占比(整机平均)\",\n \"note\": \"\"\n },\n {\n \"lang\": \"en_US\",\n \"name\": \"CPU core mode time ratio (average of the whole machine)\",\n \"note\": \"\"\n }\n ]\n },\n {\n \"id\": 0,\n \"uuid\": 1717556327951300000,\n \"collector\": \"Exporter\",\n \"typ\": \"Linux\",\n \"name\": \"CPU 利用率(整机平均)\",\n \"unit\": \"percent\",\n \"note\": \"\",\n \"lang\": \"zh_CN\",\n \"expression\": \"avg without (mode,cpu) ( 1 - irate(node_cpu_seconds_total{mode=\\\"idle\\\"}[2m]) ) * 100\",\n \"created_at\": 0,\n \"created_by\": \"\",\n \"updated_at\": 0,\n \"updated_by\": \"\",\n \"translation\": [\n {\n \"lang\": \"zh_CN\",\n \"name\": \"CPU 利用率(整机平均)\",\n \"note\": \"\"\n },\n {\n \"lang\": \"en_US\",\n \"name\": \"CPU utilization (machine average)\",\n \"note\": \"\"\n }\n ]\n },\n {\n \"id\": 0,\n \"uuid\": 1717556327954250000,\n \"collector\": \"Exporter\",\n \"typ\": \"Linux\",\n \"name\": \"CPU 用户态时间占比(整机平均)\",\n \"unit\": \"percent\",\n \"note\": \"\",\n \"lang\": \"zh_CN\",\n \"expression\": \"avg without (mode,cpu) ( irate(node_cpu_seconds_total{mode=\\\"user\\\"}[2m]) ) * 100\",\n \"created_at\": 0,\n \"created_by\": \"\",\n \"updated_at\": 0,\n \"updated_by\": \"\",\n \"translation\": [\n {\n \"lang\": \"zh_CN\",\n \"name\": \"CPU 用户态时间占比(整机平均)\",\n \"note\": \"\"\n },\n {\n \"lang\": \"en_US\",\n \"name\": \"CPU user mode time ratio (average of the whole machine)\",\n \"note\": \"\"\n }\n ]\n },\n {\n \"id\": 0,\n \"uuid\": 1717556327957318000,\n \"collector\": \"Exporter\",\n \"typ\": \"Linux\",\n \"name\": \"CPU 硬中断时间占比(整机平均)\",\n \"unit\": \"percent\",\n \"note\": \"\",\n \"lang\": \"zh_CN\",\n \"expression\": \"avg without (mode,cpu) ( irate(node_cpu_seconds_total{mode=\\\"irq\\\"}[2m]) ) * 100\",\n \"created_at\": 0,\n \"created_by\": \"\",\n \"updated_at\": 0,\n \"updated_by\": \"\",\n \"translation\": [\n {\n \"lang\": \"zh_CN\",\n \"name\": \"CPU 硬中断时间占比(整机平均)\",\n \"note\": \"\"\n },\n {\n \"lang\": \"en_US\",\n \"name\": \"Proportion of CPU hard interrupt time (average of the whole machine)\",\n \"note\": \"\"\n }\n ]\n },\n {\n \"id\": 0,\n \"uuid\": 1717556327959882000,\n \"collector\": \"Exporter\",\n \"typ\": \"Linux\",\n \"name\": \"CPU 空闲率(整机平均)\",\n \"unit\": \"percent\",\n \"note\": \"\",\n \"lang\": \"zh_CN\",\n \"expression\": \"avg without (mode,cpu) ( irate(node_cpu_seconds_total{mode=\\\"idle\\\"}[2m]) ) * 100\",\n \"created_at\": 0,\n \"created_by\": \"\",\n \"updated_at\": 0,\n \"updated_by\": \"\",\n \"translation\": [\n {\n \"lang\": \"zh_CN\",\n \"name\": \"CPU 空闲率(整机平均)\",\n \"note\": \"\"\n },\n {\n \"lang\": \"en_US\",\n \"name\": \"CPU idle rate (overall machine average)\",\n \"note\": \"\"\n }\n ]\n },\n {\n \"id\": 0,\n \"uuid\": 1717556327962946000,\n \"collector\": \"Exporter\",\n \"typ\": \"Linux\",\n \"name\": \"CPU 软中断时间占比(整机平均)\",\n \"unit\": \"percent\",\n \"note\": \"\",\n \"lang\": \"zh_CN\",\n \"expression\": \"avg without (mode,cpu) ( irate(node_cpu_seconds_total{mode=\\\"softirq\\\"}[2m]) ) * 100\",\n \"created_at\": 0,\n \"created_by\": \"\",\n \"updated_at\": 0,\n \"updated_by\": \"\",\n \"translation\": [\n {\n \"lang\": \"zh_CN\",\n \"name\": \"CPU 软中断时间占比(整机平均)\",\n \"note\": \"\"\n },\n {\n \"lang\": \"en_US\",\n \"name\": \"Proportion of CPU soft interrupt time (average of the whole machine)\",\n \"note\": \"\"\n }\n ]\n },\n {\n \"id\": 0,\n \"uuid\": 1717556327965694000,\n \"collector\": \"Exporter\",\n \"typ\": \"Linux\",\n \"name\": \"交换空间使用率\",\n \"unit\": \"percent\",\n \"note\": \"交换空间使用率。计算原子取自 `/proc/meminfo`。\",\n \"lang\": \"zh_CN\",\n \"expression\": \"(node_memory_SwapTotal_bytes - node_memory_SwapFree_bytes)/node_memory_SwapTotal_bytes * 100 and node_memory_SwapTotal_bytes > 0\",\n \"created_at\": 0,\n \"created_by\": \"\",\n \"updated_at\": 0,\n \"updated_by\": \"\",\n \"translation\": [\n {\n \"lang\": \"zh_CN\",\n \"name\": \"交换空间使用率\",\n \"note\": \"交换空间使用率。计算原子取自 `/proc/meminfo`。\"\n },\n {\n \"lang\": \"en_US\",\n \"name\": \"Swap space usage\",\n \"note\": \"Swap space usage. The computational atom is taken from `/proc/meminfo `.\"\n }\n ]\n },\n {\n \"id\": 0,\n \"uuid\": 1717556327968158000,\n \"collector\": \"Exporter\",\n \"typ\": \"Linux\",\n \"name\": \"交换空间总量\",\n \"unit\": \"bytesIEC\",\n \"note\": \"交换空间总量。取自 `/proc/meminfo`。\",\n \"lang\": \"zh_CN\",\n \"expression\": \"node_memory_SwapTotal_bytes\",\n \"created_at\": 0,\n \"created_by\": \"\",\n \"updated_at\": 0,\n \"updated_by\": \"\",\n \"translation\": [\n {\n \"lang\": \"zh_CN\",\n \"name\": \"交换空间总量\",\n \"note\": \"交换空间总量。取自 `/proc/meminfo`。\"\n },\n {\n \"lang\": \"en_US\",\n \"name\": \"Total swap space\",\n \"note\": \"Total amount of swap space. Taken from `/proc/meminfo `.\"\n }\n ]\n },\n {\n \"id\": 0,\n \"uuid\": 1717556327970655000,\n \"collector\": \"Exporter\",\n \"typ\": \"Linux\",\n \"name\": \"交换空间空闲量\",\n \"unit\": \"bytesIEC\",\n \"note\": \"交换空间空闲量。取自 `/proc/meminfo`。\",\n \"lang\": \"zh_CN\",\n \"expression\": \"node_memory_SwapFree_bytes\",\n \"created_at\": 0,\n \"created_by\": \"\",\n \"updated_at\": 0,\n \"updated_by\": \"\",\n \"translation\": [\n {\n \"lang\": \"zh_CN\",\n \"name\": \"交换空间空闲量\",\n \"note\": \"交换空间空闲量。取自 `/proc/meminfo`。\"\n },\n {\n \"lang\": \"en_US\",\n \"name\": \"Swap space free amount\",\n \"note\": \"Exchange space free amount. Taken from `/proc/meminfo `.\"\n }\n ]\n },\n {\n \"id\": 0,\n \"uuid\": 1717556327973281000,\n \"collector\": \"Exporter\",\n \"typ\": \"Linux\",\n \"name\": \"内存 Buffered 量\",\n \"unit\": \"bytesIEC\",\n \"note\": \"用作缓冲区的内存量。取自 `/proc/meminfo`。\",\n \"lang\": \"zh_CN\",\n \"expression\": \"node_memory_Buffers_bytes\",\n \"created_at\": 0,\n \"created_by\": \"\",\n \"updated_at\": 0,\n \"updated_by\": \"\",\n \"translation\": [\n {\n \"lang\": \"zh_CN\",\n \"name\": \"内存 Buffered 量\",\n \"note\": \"用作缓冲区的内存量。取自 `/proc/meminfo`。\"\n },\n {\n \"lang\": \"en_US\",\n \"name\": \"Memory Buffered amount\",\n \"note\": \"The amount of memory used as a buffer. Taken from `/proc/meminfo `.\"\n }\n ]\n },\n {\n \"id\": 0,\n \"uuid\": 1717556327975341000,\n \"collector\": \"Exporter\",\n \"typ\": \"Linux\",\n \"name\": \"内存 Cached 量\",\n \"unit\": \"bytesIEC\",\n \"note\": \"用作文件缓存的内存量。取自 `/proc/meminfo`。\",\n \"lang\": \"zh_CN\",\n \"expression\": \"node_memory_Cached_bytes\",\n \"created_at\": 0,\n \"created_by\": \"\",\n \"updated_at\": 0,\n \"updated_by\": \"\",\n \"translation\": [\n {\n \"lang\": \"zh_CN\",\n \"name\": \"内存 Cached 量\",\n \"note\": \"用作文件缓存的内存量。取自 `/proc/meminfo`。\"\n },\n {\n \"lang\": \"en_US\",\n \"name\": \"Memory Cached amount\",\n \"note\": \"The amount of memory used as file cache. Taken from `/proc/meminfo `.\"\n }\n ]\n },\n {\n \"id\": 0,\n \"uuid\": 1717556327977268000,\n \"collector\": \"Exporter\",\n \"typ\": \"Linux\",\n \"name\": \"内存使用率(基于MemAvailable)\",\n \"unit\": \"percent\",\n \"note\": \"内存使用率。基于 MemAvailable 计算更准确,但是老版本的 Linux 不支持。\",\n \"lang\": \"zh_CN\",\n \"expression\": \"(1 - (node_memory_MemAvailable_bytes{} / node_memory_MemTotal_bytes{})) * 100\",\n \"created_at\": 0,\n \"created_by\": \"\",\n \"updated_at\": 0,\n \"updated_by\": \"\",\n \"translation\": [\n {\n \"lang\": \"zh_CN\",\n \"name\": \"内存使用率(基于MemAvailable)\",\n \"note\": \"内存使用率。基于 MemAvailable 计算更准确,但是老版本的 Linux 不支持。\"\n },\n {\n \"lang\": \"en_US\",\n \"name\": \"Memory usage (based on MemAvailable)\",\n \"note\": \"Memory usage. Calculation based on MemAvailable is more accurate, but older versions of Linux do not support it.\"\n }\n ]\n },\n {\n \"id\": 0,\n \"uuid\": 1717556327979319000,\n \"collector\": \"Exporter\",\n \"typ\": \"Linux\",\n \"name\": \"内存可用量\",\n \"unit\": \"bytesIEC\",\n \"note\": \"可以立即分配给进程的可用内存量。取自 `/proc/meminfo`。\",\n \"lang\": \"zh_CN\",\n \"expression\": \"node_memory_MemAvailable_bytes\",\n \"created_at\": 0,\n \"created_by\": \"\",\n \"updated_at\": 0,\n \"updated_by\": \"\",\n \"translation\": [\n {\n \"lang\": \"zh_CN\",\n \"name\": \"内存可用量\",\n \"note\": \"可以立即分配给进程的可用内存量。取自 `/proc/meminfo`。\"\n },\n {\n \"lang\": \"en_US\",\n \"name\": \"Memory Availability\",\n \"note\": \"The amount of available memory that can be immediately allocated to a process. Taken from `/proc/meminfo `.\"\n }\n ]\n },\n {\n \"id\": 0,\n \"uuid\": 1717556327981865000,\n \"collector\": \"Exporter\",\n \"typ\": \"Linux\",\n \"name\": \"内存总量\",\n \"unit\": \"bytesIEC\",\n \"note\": \"内存总量。取自 `/proc/meminfo`。\",\n \"lang\": \"zh_CN\",\n \"expression\": \"node_memory_MemTotal_bytes\",\n \"created_at\": 0,\n \"created_by\": \"\",\n \"updated_at\": 0,\n \"updated_by\": \"\",\n \"translation\": [\n {\n \"lang\": \"zh_CN\",\n \"name\": \"内存总量\",\n \"note\": \"内存总量。取自 `/proc/meminfo`。\"\n },\n {\n \"lang\": \"en_US\",\n \"name\": \"Total memory\",\n \"note\": \"Total amount of memory. Taken from `/proc/meminfo `.\"\n }\n ]\n },\n {\n \"id\": 0,\n \"uuid\": 1717556327984422000,\n \"collector\": \"Exporter\",\n \"typ\": \"Linux\",\n \"name\": \"内存空闲量\",\n \"unit\": \"bytesIEC\",\n \"note\": \"未使用的内存量。取自 `/proc/meminfo`。\",\n \"lang\": \"zh_CN\",\n \"expression\": \"node_memory_MemFree_bytes\",\n \"created_at\": 0,\n \"created_by\": \"\",\n \"updated_at\": 0,\n \"updated_by\": \"\",\n \"translation\": [\n {\n \"lang\": \"zh_CN\",\n \"name\": \"内存空闲量\",\n \"note\": \"未使用的内存量。取自 `/proc/meminfo`。\"\n },\n {\n \"lang\": \"en_US\",\n \"name\": \"Free memory amount\",\n \"note\": \"Amount of unused memory. Taken from `/proc/meminfo `.\"\n }\n ]\n },\n {\n \"id\": 0,\n \"uuid\": 1717556327986746000,\n \"collector\": \"Exporter\",\n \"typ\": \"Linux\",\n \"name\": \"文件句柄 - 已分配占比\",\n \"unit\": \"percent\",\n \"note\": \"\",\n \"lang\": \"zh_CN\",\n \"expression\": \"node_filefd_allocated / node_filefd_maximum * 100\",\n \"created_at\": 0,\n \"created_by\": \"\",\n \"updated_at\": 0,\n \"updated_by\": \"\",\n \"translation\": [\n {\n \"lang\": \"zh_CN\",\n \"name\": \"文件句柄 - 已分配占比\",\n \"note\": \"\"\n },\n {\n \"lang\": \"en_US\",\n \"name\": \"File handle-allocated proportion\",\n \"note\": \"\"\n }\n ]\n },\n {\n \"id\": 0,\n \"uuid\": 1717556327988887000,\n \"collector\": \"Exporter\",\n \"typ\": \"Linux\",\n \"name\": \"文件句柄 - 已分配量\",\n \"unit\": \"sishort\",\n \"note\": \"\",\n \"lang\": \"zh_CN\",\n \"expression\": \"node_filefd_allocated\",\n \"created_at\": 0,\n \"created_by\": \"\",\n \"updated_at\": 0,\n \"updated_by\": \"\",\n \"translation\": [\n {\n \"lang\": \"zh_CN\",\n \"name\": \"文件句柄 - 已分配量\",\n \"note\": \"\"\n },\n {\n \"lang\": \"en_US\",\n \"name\": \"File Handle-Amount Allocated\",\n \"note\": \"\"\n }\n ]\n },\n {\n \"id\": 0,\n \"uuid\": 1717556327991118000,\n \"collector\": \"Exporter\",\n \"typ\": \"Linux\",\n \"name\": \"文件句柄 - 总可分配量\",\n \"unit\": \"sishort\",\n \"note\": \"\",\n \"lang\": \"zh_CN\",\n \"expression\": \"node_filefd_maximum\",\n \"created_at\": 0,\n \"created_by\": \"\",\n \"updated_at\": 0,\n \"updated_by\": \"\",\n \"translation\": [\n {\n \"lang\": \"zh_CN\",\n \"name\": \"文件句柄 - 总可分配量\",\n \"note\": \"\"\n },\n {\n \"lang\": \"en_US\",\n \"name\": \"File handle-total allocable quantity\",\n \"note\": \"\"\n }\n ]\n },\n {\n \"id\": 0,\n \"uuid\": 1717556327993245000,\n \"collector\": \"Exporter\",\n \"typ\": \"Linux\",\n \"name\": \"硬盘 IO - 时间维度 Utilization\",\n \"unit\": \"percent\",\n \"note\": \"在时间维度统计硬盘 IO 时间占比,比如该值是 50%,表示有 50% 的时间是在处理 IO,该值 100%,表示一直在处理 IO,但是注意,现代磁盘设备具备并行处理多个 I/O 请求的能力,所以即便该值是 100%,可能硬盘还是可以接收新的处理请求。\\n\\n比如某人有两只手,最近 1 分钟一直在用单手劳动,从时间维度来看,利用率是 100%,但即便是 100%,再给他更多的活,他也能干,因为他还有一只手可用。\",\n \"lang\": \"zh_CN\",\n \"expression\": \"irate(node_disk_io_time_seconds_total[2m]) * 100\",\n \"created_at\": 0,\n \"created_by\": \"\",\n \"updated_at\": 0,\n \"updated_by\": \"\",\n \"translation\": [\n {\n \"lang\": \"zh_CN\",\n \"name\": \"硬盘 IO - 时间维度 Utilization\",\n \"note\": \"在时间维度统计硬盘 IO 时间占比,比如该值是 50%,表示有 50% 的时间是在处理 IO,该值 100%,表示一直在处理 IO,但是注意,现代磁盘设备具备并行处理多个 I/O 请求的能力,所以即便该值是 100%,可能硬盘还是可以接收新的处理请求。\\n\\n比如某人有两只手,最近 1 分钟一直在用单手劳动,从时间维度来看,利用率是 100%,但即便是 100%,再给他更多的活,他也能干,因为他还有一只手可用。\"\n },\n {\n \"lang\": \"en_US\",\n \"name\": \"Hard Disk IO-Time Dimension Utilization\",\n \"note\": \"Count the proportion of hard disk IO time in the time dimension. For example, if the value is 50%, it means that 50% of the time is processing IO, and if the value is 100%, it means that IO has been processing all the time. However, note that modern disk devices have the ability to process multiple I/O requests in parallel, so even if the value is 100%, the hard disk may still be able to receive new processing requests. \\n \\nFor example, someone has two hands and has been working with one hand in the last minute. From the time dimension, the utilization rate is 100%, but even if it is 100%, he can do it if he is given more work, because he still has one hand available.\"\n }\n ]\n },\n {\n \"id\": 0,\n \"uuid\": 1717556327995342000,\n \"collector\": \"Exporter\",\n \"typ\": \"Linux\",\n \"name\": \"硬盘 IO - 每秒写入字节数量\",\n \"unit\": \"bytesSecIEC\",\n \"note\": \"\",\n \"lang\": \"zh_CN\",\n \"expression\": \"irate(node_disk_written_bytes_total[2m])\",\n \"created_at\": 0,\n \"created_by\": \"\",\n \"updated_at\": 0,\n \"updated_by\": \"\",\n \"translation\": [\n {\n \"lang\": \"zh_CN\",\n \"name\": \"硬盘 IO - 每秒写入字节数量\",\n \"note\": \"\"\n },\n {\n \"lang\": \"en_US\",\n \"name\": \"Hard disk IO-bytes written per second\",\n \"note\": \"\"\n }\n ]\n },\n {\n \"id\": 0,\n \"uuid\": 1717556327997897000,\n \"collector\": \"Exporter\",\n \"typ\": \"Linux\",\n \"name\": \"硬盘 IO - 每秒写次数\",\n \"unit\": \"none\",\n \"note\": \"每秒写次数\",\n \"lang\": \"zh_CN\",\n \"expression\": \"irate(node_disk_writes_completed_total{}[2m])\",\n \"created_at\": 0,\n \"created_by\": \"\",\n \"updated_at\": 0,\n \"updated_by\": \"\",\n \"translation\": [\n {\n \"lang\": \"zh_CN\",\n \"name\": \"硬盘 IO - 每秒写次数\",\n \"note\": \"每秒写次数\"\n },\n {\n \"lang\": \"en_US\",\n \"name\": \"Hard drive IO-writes per second\",\n \"note\": \"Writes per second\"\n }\n ]\n },\n {\n \"id\": 0,\n \"uuid\": 1717556328000186000,\n \"collector\": \"Exporter\",\n \"typ\": \"Linux\",\n \"name\": \"硬盘 IO - 每秒读取字节数量\",\n \"unit\": \"bytesSecIEC\",\n \"note\": \"\",\n \"lang\": \"zh_CN\",\n \"expression\": \"irate(node_disk_read_bytes_total[2m])\",\n \"created_at\": 0,\n \"created_by\": \"\",\n \"updated_at\": 0,\n \"updated_by\": \"\",\n \"translation\": [\n {\n \"lang\": \"zh_CN\",\n \"name\": \"硬盘 IO - 每秒读取字节数量\",\n \"note\": \"\"\n },\n {\n \"lang\": \"en_US\",\n \"name\": \"Hard Drive IO-bytes read per second\",\n \"note\": \"\"\n }\n ]\n },\n {\n \"id\": 0,\n \"uuid\": 1717556328002202000,\n \"collector\": \"Exporter\",\n \"typ\": \"Linux\",\n \"name\": \"硬盘 IO - 每秒读次数\",\n \"unit\": \"none\",\n \"note\": \"每秒读次数\",\n \"lang\": \"zh_CN\",\n \"expression\": \"irate(node_disk_reads_completed_total{}[2m])\",\n \"created_at\": 0,\n \"created_by\": \"\",\n \"updated_at\": 0,\n \"updated_by\": \"\",\n \"translation\": [\n {\n \"lang\": \"zh_CN\",\n \"name\": \"硬盘 IO - 每秒读次数\",\n \"note\": \"每秒读次数\"\n },\n {\n \"lang\": \"en_US\",\n \"name\": \"Hard drive IO-Reads per second\",\n \"note\": \"Reads per second\"\n }\n ]\n },\n {\n \"id\": 0,\n \"uuid\": 1717556328004428000,\n \"collector\": \"Exporter\",\n \"typ\": \"Linux\",\n \"name\": \"硬盘使用率\",\n \"unit\": \"percent\",\n \"note\": \"硬盘空间使用率。\",\n \"lang\": \"zh_CN\",\n \"expression\": \"100 - ((node_filesystem_avail_bytes{} * 100) / node_filesystem_size_bytes{})\",\n \"created_at\": 0,\n \"created_by\": \"\",\n \"updated_at\": 0,\n \"updated_by\": \"\",\n \"translation\": [\n {\n \"lang\": \"zh_CN\",\n \"name\": \"硬盘使用率\",\n \"note\": \"硬盘空间使用率。\"\n },\n {\n \"lang\": \"en_US\",\n \"name\": \"Hard Drive Usage\",\n \"note\": \"Hard disk space usage.\"\n }\n ]\n },\n {\n \"id\": 0,\n \"uuid\": 1717556328006453000,\n \"collector\": \"Exporter\",\n \"typ\": \"Linux\",\n \"name\": \"硬盘剩余量\",\n \"unit\": \"bytesSI\",\n \"note\": \"使用 SI 标准渲染数据,和 df 命令保持一致。\",\n \"lang\": \"zh_CN\",\n \"expression\": \"node_filesystem_free_bytes\",\n \"created_at\": 0,\n \"created_by\": \"\",\n \"updated_at\": 0,\n \"updated_by\": \"\",\n \"translation\": [\n {\n \"lang\": \"zh_CN\",\n \"name\": \"硬盘剩余量\",\n \"note\": \"使用 SI 标准渲染数据,和 df 命令保持一致。\"\n },\n {\n \"lang\": \"en_US\",\n \"name\": \"Remaining hard disk\",\n \"note\": \"Use the SI standard to render data, consistent with the df command.\"\n }\n ]\n },\n {\n \"id\": 0,\n \"uuid\": 1717556328008355000,\n \"collector\": \"Exporter\",\n \"typ\": \"Linux\",\n \"name\": \"硬盘可用量\",\n \"unit\": \"bytesSI\",\n \"note\": \"使用 SI 标准渲染数据,和 df 命令保持一致。\",\n \"lang\": \"zh_CN\",\n \"expression\": \"node_filesystem_avail_bytes\",\n \"created_at\": 0,\n \"created_by\": \"\",\n \"updated_at\": 0,\n \"updated_by\": \"\",\n \"translation\": [\n {\n \"lang\": \"zh_CN\",\n \"name\": \"硬盘可用量\",\n \"note\": \"使用 SI 标准渲染数据,和 df 命令保持一致。\"\n },\n {\n \"lang\": \"en_US\",\n \"name\": \"Hard Drive Availability\",\n \"note\": \"Use the SI standard to render data, consistent with the df command.\"\n }\n ]\n },\n {\n \"id\": 0,\n \"uuid\": 1717556328010578000,\n \"collector\": \"Exporter\",\n \"typ\": \"Linux\",\n \"name\": \"硬盘总量\",\n \"unit\": \"bytesSI\",\n \"note\": \"使用 SI 标准渲染数据,和 df 命令保持一致。\",\n \"lang\": \"zh_CN\",\n \"expression\": \"node_filesystem_size_bytes\",\n \"created_at\": 0,\n \"created_by\": \"\",\n \"updated_at\": 0,\n \"updated_by\": \"\",\n \"translation\": [\n {\n \"lang\": \"zh_CN\",\n \"name\": \"硬盘总量\",\n \"note\": \"使用 SI 标准渲染数据,和 df 命令保持一致。\"\n },\n {\n \"lang\": \"en_US\",\n \"name\": \"Total hard disk\",\n \"note\": \"Use the SI standard to render data, consistent with the df command.\"\n }\n ]\n },\n {\n \"id\": 0,\n \"uuid\": 1717556328012604000,\n \"collector\": \"Exporter\",\n \"typ\": \"Linux\",\n \"name\": \"系统 CPU 核数\",\n \"unit\": \"none\",\n \"note\": \"CPU 逻辑核的数量。\",\n \"lang\": \"zh_CN\",\n \"expression\": \"count(node_cpu_seconds_total{mode=\\\"idle\\\"}) without (cpu, mode)\",\n \"created_at\": 0,\n \"created_by\": \"\",\n \"updated_at\": 0,\n \"updated_by\": \"\",\n \"translation\": [\n {\n \"lang\": \"zh_CN\",\n \"name\": \"系统 CPU 核数\",\n \"note\": \"CPU 逻辑核的数量。\"\n },\n {\n \"lang\": \"en_US\",\n \"name\": \"Number of CPU cores\",\n \"note\": \"Number of CPU logical cores.\"\n }\n ]\n },\n {\n \"id\": 0,\n \"uuid\": 1717556328014325000,\n \"collector\": \"Exporter\",\n \"typ\": \"Linux\",\n \"name\": \"系统平均负载 - 最近 1 分钟\",\n \"unit\": \"none\",\n \"note\": \"取自 `/proc/loadavg`。\",\n \"lang\": \"zh_CN\",\n \"expression\": \"node_load1\",\n \"created_at\": 0,\n \"created_by\": \"\",\n \"updated_at\": 0,\n \"updated_by\": \"\",\n \"translation\": [\n {\n \"lang\": \"zh_CN\",\n \"name\": \"系统平均负载 - 最近 1 分钟\",\n \"note\": \"取自 `/proc/loadavg`。\"\n },\n {\n \"lang\": \"en_US\",\n \"name\": \"System load average-last 1 minute\",\n \"note\": \"Taken from `/proc/loadavg `.\"\n }\n ]\n },\n {\n \"id\": 0,\n \"uuid\": 1717556328016440000,\n \"collector\": \"Exporter\",\n \"typ\": \"Linux\",\n \"name\": \"系统平均负载 - 最近 15 分钟\",\n \"unit\": \"none\",\n \"note\": \"取自 `/proc/loadavg`。\",\n \"lang\": \"zh_CN\",\n \"expression\": \"node_load15\",\n \"created_at\": 0,\n \"created_by\": \"\",\n \"updated_at\": 0,\n \"updated_by\": \"\",\n \"translation\": [\n {\n \"lang\": \"zh_CN\",\n \"name\": \"系统平均负载 - 最近 15 分钟\",\n \"note\": \"取自 `/proc/loadavg`。\"\n },\n {\n \"lang\": \"en_US\",\n \"name\": \"System load average-last 15 minutes\",\n \"note\": \"Taken from `/proc/loadavg `.\"\n }\n ]\n },\n {\n \"id\": 0,\n \"uuid\": 1717556328018361000,\n \"collector\": \"Exporter\",\n \"typ\": \"Linux\",\n \"name\": \"系统平均负载 - 最近 5 分钟\",\n \"unit\": \"none\",\n \"note\": \"取自 `/proc/loadavg`。\",\n \"lang\": \"zh_CN\",\n \"expression\": \"node_load5\",\n \"created_at\": 0,\n \"created_by\": \"\",\n \"updated_at\": 0,\n \"updated_by\": \"\",\n \"translation\": [\n {\n \"lang\": \"zh_CN\",\n \"name\": \"系统平均负载 - 最近 5 分钟\",\n \"note\": \"取自 `/proc/loadavg`。\"\n },\n {\n \"lang\": \"en_US\",\n \"name\": \"System load average-last 5 minutes\",\n \"note\": \"Taken from `/proc/loadavg `.\"\n }\n ]\n },\n {\n \"id\": 0,\n \"uuid\": 1717556328020507000,\n \"collector\": \"Exporter\",\n \"typ\": \"Linux\",\n \"name\": \"系统平均负载(单核) - 最近 1 分钟\",\n \"unit\": \"none\",\n \"note\": \"\",\n \"lang\": \"zh_CN\",\n \"expression\": \"node_load1 / count(node_cpu_seconds_total{mode=\\\"idle\\\"}) without (cpu, mode)\",\n \"created_at\": 0,\n \"created_by\": \"\",\n \"updated_at\": 0,\n \"updated_by\": \"\",\n \"translation\": [\n {\n \"lang\": \"zh_CN\",\n \"name\": \"系统平均负载(单核) - 最近 1 分钟\",\n \"note\": \"\"\n },\n {\n \"lang\": \"en_US\",\n \"name\": \"System Load Average (Single Core)-Last 1 Minute\",\n \"note\": \"\"\n }\n ]\n },\n {\n \"id\": 0,\n \"uuid\": 1717556328022263000,\n \"collector\": \"Exporter\",\n \"typ\": \"Linux\",\n \"name\": \"系统平均负载(单核) - 最近 15 分钟\",\n \"unit\": \"none\",\n \"note\": \"\",\n \"lang\": \"zh_CN\",\n \"expression\": \"node_load15 / count(node_cpu_seconds_total{mode=\\\"idle\\\"}) without (cpu, mode)\",\n \"created_at\": 0,\n \"created_by\": \"\",\n \"updated_at\": 0,\n \"updated_by\": \"\",\n \"translation\": [\n {\n \"lang\": \"zh_CN\",\n \"name\": \"系统平均负载(单核) - 最近 15 分钟\",\n \"note\": \"\"\n },\n {\n \"lang\": \"en_US\",\n \"name\": \"System Load Average (Single Core)-Last 15 Minutes\",\n \"note\": \"\"\n }\n ]\n },\n {\n \"id\": 0,\n \"uuid\": 1717556328024125000,\n \"collector\": \"Exporter\",\n \"typ\": \"Linux\",\n \"name\": \"系统平均负载(单核) - 最近 5 分钟\",\n \"unit\": \"none\",\n \"note\": \"\",\n \"lang\": \"zh_CN\",\n \"expression\": \"node_load5 / count(node_cpu_seconds_total{mode=\\\"idle\\\"}) without (cpu, mode)\",\n \"created_at\": 0,\n \"created_by\": \"\",\n \"updated_at\": 0,\n \"updated_by\": \"\",\n \"translation\": [\n {\n \"lang\": \"zh_CN\",\n \"name\": \"系统平均负载(单核) - 最近 5 分钟\",\n \"note\": \"\"\n },\n {\n \"lang\": \"en_US\",\n \"name\": \"System Load Average (Single Core)-Last 5 Minutes\",\n \"note\": \"\"\n }\n ]\n },\n {\n \"id\": 0,\n \"uuid\": 1717556328026028000,\n \"collector\": \"Exporter\",\n \"typ\": \"Linux\",\n \"name\": \"网卡入方向(接收)每秒丢弃的数据包个数\",\n \"unit\": \"none\",\n \"note\": \"原始指标 node_network_receive_drop_total 表示操作系统启动之后各个网卡入方向(接收)丢弃的数据包总数。\",\n \"lang\": \"zh_CN\",\n \"expression\": \"irate(node_network_receive_drop_total[2m])\",\n \"created_at\": 0,\n \"created_by\": \"\",\n \"updated_at\": 0,\n \"updated_by\": \"\",\n \"translation\": [\n {\n \"lang\": \"zh_CN\",\n \"name\": \"网卡入方向(接收)每秒丢弃的数据包个数\",\n \"note\": \"原始指标 node_network_receive_drop_total 表示操作系统启动之后各个网卡入方向(接收)丢弃的数据包总数。\"\n },\n {\n \"lang\": \"en_US\",\n \"name\": \"Number of packets dropped per second in the incoming direction (receiving) of the network card\",\n \"note\": \"The original indicator node _ network _ receive _ drop _ total indicates the total number of packets dropped (received) by each network card after the operating system starts.\"\n }\n ]\n },\n {\n \"id\": 0,\n \"uuid\": 1717556328027875000,\n \"collector\": \"Exporter\",\n \"typ\": \"Linux\",\n \"name\": \"网卡入方向(接收)每秒数据包数\",\n \"unit\": \"none\",\n \"note\": \"原始指标 node_network_receive_packets_total 表示操作系统启动之后各个网卡入方向(接收)数据包总数。\",\n \"lang\": \"zh_CN\",\n \"expression\": \"irate(node_network_receive_packets_total[2m])\",\n \"created_at\": 0,\n \"created_by\": \"\",\n \"updated_at\": 0,\n \"updated_by\": \"\",\n \"translation\": [\n {\n \"lang\": \"zh_CN\",\n \"name\": \"网卡入方向(接收)每秒数据包数\",\n \"note\": \"原始指标 node_network_receive_packets_total 表示操作系统启动之后各个网卡入方向(接收)数据包总数。\"\n },\n {\n \"lang\": \"en_US\",\n \"name\": \"NIC incoming (receiving) packets per second\",\n \"note\": \"The original indicator node _ network _ receive _ packets _ total indicates the total number of data packets incoming (received) by each network card after the operating system is booted.\"\n }\n ]\n },\n {\n \"id\": 0,\n \"uuid\": 1717556328029862000,\n \"collector\": \"Exporter\",\n \"typ\": \"Linux\",\n \"name\": \"网卡入方向(接收)每秒错包数\",\n \"unit\": \"none\",\n \"note\": \"原始指标 node_network_receive_errs_total 表示操作系统启动之后各个网卡入方向(接收)错包总数。\",\n \"lang\": \"zh_CN\",\n \"expression\": \"irate(node_network_receive_errs_total[2m])\",\n \"created_at\": 0,\n \"created_by\": \"\",\n \"updated_at\": 0,\n \"updated_by\": \"\",\n \"translation\": [\n {\n \"lang\": \"zh_CN\",\n \"name\": \"网卡入方向(接收)每秒错包数\",\n \"note\": \"原始指标 node_network_receive_errs_total 表示操作系统启动之后各个网卡入方向(接收)错包总数。\"\n },\n {\n \"lang\": \"en_US\",\n \"name\": \"Number of wrong packets per second in the incoming direction (receiving) of the network card\",\n \"note\": \"The original indicator node _ network _ receive _ errs _ total indicates the total number of error packets incoming (received) by each network card after the operating system is started.\"\n }\n ]\n },\n {\n \"id\": 0,\n \"uuid\": 1717556328032074000,\n \"collector\": \"Exporter\",\n \"typ\": \"Linux\",\n \"name\": \"网卡出方向(发送)每秒丢弃的数据包个数\",\n \"unit\": \"none\",\n \"note\": \"原始指标 node_network_transmit_drop_total 表示操作系统启动之后各个网卡出方向(发送)丢弃的数据包总数。\",\n \"lang\": \"zh_CN\",\n \"expression\": \"irate(node_network_transmit_drop_total[2m])\",\n \"created_at\": 0,\n \"created_by\": \"\",\n \"updated_at\": 0,\n \"updated_by\": \"\",\n \"translation\": [\n {\n \"lang\": \"zh_CN\",\n \"name\": \"网卡出方向(发送)每秒丢弃的数据包个数\",\n \"note\": \"原始指标 node_network_transmit_drop_total 表示操作系统启动之后各个网卡出方向(发送)丢弃的数据包总数。\"\n },\n {\n \"lang\": \"en_US\",\n \"name\": \"Number of packets discarded per second in the outbound direction (sending) of the network card\",\n \"note\": \"The original indicator node _ network _ transmit _ drop _ total indicates the total number of packets discarded (sent) by each network card after the operating system starts.\"\n }\n ]\n },\n {\n \"id\": 0,\n \"uuid\": 1717556328033909000,\n \"collector\": \"Exporter\",\n \"typ\": \"Linux\",\n \"name\": \"网卡出方向(发送)每秒数据包数\",\n \"unit\": \"none\",\n \"note\": \"原始指标 node_network_transmit_packets_total 表示操作系统启动之后各个网卡出方向(发送)数据包总数。\",\n \"lang\": \"zh_CN\",\n \"expression\": \"irate(node_network_transmit_packets_total[2m])\",\n \"created_at\": 0,\n \"created_by\": \"\",\n \"updated_at\": 0,\n \"updated_by\": \"\",\n \"translation\": [\n {\n \"lang\": \"zh_CN\",\n \"name\": \"网卡出方向(发送)每秒数据包数\",\n \"note\": \"原始指标 node_network_transmit_packets_total 表示操作系统启动之后各个网卡出方向(发送)数据包总数。\"\n },\n {\n \"lang\": \"en_US\",\n \"name\": \"Number of packets per second in the outgoing direction (sent) of the network card\",\n \"note\": \"The original indicator node _ network _ transmit _ packets _ total indicates the total number of outbound (sent) data packets from each network card after the operating system is started.\"\n }\n ]\n },\n {\n \"id\": 0,\n \"uuid\": 1717556328035721000,\n \"collector\": \"Exporter\",\n \"typ\": \"Linux\",\n \"name\": \"网卡出方向(发送)每秒错包数\",\n \"unit\": \"none\",\n \"note\": \"原始指标 node_network_transmit_errs_total 表示操作系统启动之后各个网卡出方向(发送)错包总数。\",\n \"lang\": \"zh_CN\",\n \"expression\": \"irate(node_network_transmit_errs_total[2m])\",\n \"created_at\": 0,\n \"created_by\": \"\",\n \"updated_at\": 0,\n \"updated_by\": \"\",\n \"translation\": [\n {\n \"lang\": \"zh_CN\",\n \"name\": \"网卡出方向(发送)每秒错包数\",\n \"note\": \"原始指标 node_network_transmit_errs_total 表示操作系统启动之后各个网卡出方向(发送)错包总数。\"\n },\n {\n \"lang\": \"en_US\",\n \"name\": \"Number of wrong packets per second in the outgoing direction (sending) of the network card\",\n \"note\": \"The original indicator node _ network _ transmit _ errs _ total indicates the total number of error packets sent out (sent) by each network card after the operating system is started.\"\n }\n ]\n },\n {\n \"id\": 0,\n \"uuid\": 1717556328037688000,\n \"collector\": \"Exporter\",\n \"typ\": \"Linux\",\n \"name\": \"网卡每秒发送的 bit 量\",\n \"unit\": \"bitsSecIEC\",\n \"note\": \"原始指标 node_network_transmit_bytes_total 表示操作系统启动之后发送的 byte 总量,因为网卡流量习惯使用 bit 作为单位,所以在表达式中做了换算。\",\n \"lang\": \"zh_CN\",\n \"expression\": \"irate(node_network_transmit_bytes_total[2m]) * 8\",\n \"created_at\": 0,\n \"created_by\": \"\",\n \"updated_at\": 0,\n \"updated_by\": \"\",\n \"translation\": [\n {\n \"lang\": \"zh_CN\",\n \"name\": \"网卡每秒发送的 bit 量\",\n \"note\": \"原始指标 node_network_transmit_bytes_total 表示操作系统启动之后发送的 byte 总量,因为网卡流量习惯使用 bit 作为单位,所以在表达式中做了换算。\"\n },\n {\n \"lang\": \"en_US\",\n \"name\": \"The amount of bits sent per second by the network card\",\n \"note\": \"The original indicator node _ network _ transmit _ bytes _ total represents the total number of bytes sent after the operating system starts. Because the network card traffic is used to using bits as a unit, it is converted in the expression.\"\n }\n ]\n },\n {\n \"id\": 0,\n \"uuid\": 1717556328039789000,\n \"collector\": \"Exporter\",\n \"typ\": \"Linux\",\n \"name\": \"网卡每秒接收的 bit 量\",\n \"unit\": \"bitsSecIEC\",\n \"note\": \"原始指标 node_network_receive_bytes_total 表示操作系统启动之后接收的 byte 总量,因为网卡流量习惯使用 bit 作为单位,所以在表达式中做了换算。\",\n \"lang\": \"zh_CN\",\n \"expression\": \"irate(node_network_receive_bytes_total[2m]) * 8\",\n \"created_at\": 0,\n \"created_by\": \"\",\n \"updated_at\": 0,\n \"updated_by\": \"\",\n \"translation\": [\n {\n \"lang\": \"zh_CN\",\n \"name\": \"网卡每秒接收的 bit 量\",\n \"note\": \"原始指标 node_network_receive_bytes_total 表示操作系统启动之后接收的 byte 总量,因为网卡流量习惯使用 bit 作为单位,所以在表达式中做了换算。\"\n },\n {\n \"lang\": \"en_US\",\n \"name\": \"The number of bits received by the network card per second\",\n \"note\": \"The original indicator node _ network _ received _ bytes _ total represents the total number of bytes received after the operating system is started. Because the network card traffic is used to using bits as a unit, it is converted in the expression.\"\n }\n ]\n }\n]"
},
{
"path": "integrations/Logstash/collect/logstash/logstash.toml",
"content": "# # collect interval\n# interval = 15\n\n# Read metrics exposed by Logstash\n[[instances]]\n# # interval = global.interval * interval_times\n# interval_times = 1\n\n# append labels\n# labels = { instance=\"x\" }\n\n## The URL of the exposed Logstash API endpoint.\n# url = \"http://127.0.0.1:9600\"\nurl = \"\"\n\n## Use Logstash 5 single pipeline API, set to true when monitoring\n## Logstash 5.\n# single_pipeline = false\n\n## Enable optional collection components. Can contain\n## \"pipelines\", \"process\", and \"jvm\".\n# collect = [\"pipelines\", \"process\", \"jvm\"]\n\n## Timeout for HTTP requests.\n# timeout = \"5s\"\n\n## Optional HTTP Basic Auth credentials.\n# username = \"username\"\n# password = \"pa$$word\"\n\n## Optional HTTP headers.\n# [inputs.logstash.headers]\n# \"X-Special-Header\" = \"Special-Value\"\n\n## Optional TLS Config\n# use_tls = false\n# tls_min_version = \"1.2\"\n# tls_ca = \"/etc/categraf/ca.pem\"\n# tls_cert = \"/etc/categraf/cert.pem\"\n# tls_key = \"/etc/categraf/key.pem\"\n## Use TLS but skip chain & host verification\n# insecure_skip_verify = true"
},
{
"path": "integrations/Logstash/dashboards/logstash-dash.json",
"content": "{\n \"id\": 0,\n \"group_id\": 0,\n \"name\": \"logstash\",\n \"ident\": \"\",\n \"tags\": \"logging Prometheus\",\n \"create_at\": 0,\n \"create_by\": \"\",\n \"update_at\": 0,\n \"update_by\": \"\",\n \"configs\": {\n \"panels\": [\n {\n \"collapsed\": true,\n \"id\": \"9c88279f-7f15-4527-aa96-7df23cff9562\",\n \"layout\": {\n \"h\": 1,\n \"i\": \"9c88279f-7f15-4527-aa96-7df23cff9562\",\n \"isResizable\": false,\n \"w\": 24,\n \"x\": 0,\n \"y\": 0\n },\n \"name\": \"Events\",\n \"panels\": [],\n \"type\": \"row\"\n },\n {\n \"custom\": {\n \"drawStyle\": \"lines\",\n \"fillOpacity\": 0.3,\n \"gradientMode\": \"opacity\",\n \"lineInterpolation\": \"smooth\",\n \"lineWidth\": 2,\n \"stack\": \"off\"\n },\n \"datasourceCate\": \"prometheus\",\n \"datasourceValue\": \"${datasource}\",\n \"id\": \"a8c3db4a-708d-405f-b788-150537e2c2e4\",\n \"layout\": {\n \"h\": 4,\n \"i\": \"a8c3db4a-708d-405f-b788-150537e2c2e4\",\n \"isResizable\": true,\n \"w\": 12,\n \"x\": 0,\n \"y\": 1\n },\n \"name\": \"Event Received Rate(/s)\",\n \"options\": {\n \"legend\": {\n \"displayMode\": \"hidden\"\n },\n \"standardOptions\": {},\n \"thresholds\": {},\n \"tooltip\": {\n \"mode\": \"all\",\n \"sort\": \"none\"\n }\n },\n \"targets\": [\n {\n \"expr\": \"sum(rate(logstash_events_in[1m])) by (pipeline)\",\n \"legend\": \"{{pipeline}}\",\n \"refId\": \"A\"\n }\n ],\n \"type\": \"timeseries\",\n \"version\": \"2.0.0\"\n },\n {\n \"custom\": {\n \"drawStyle\": \"lines\",\n \"fillOpacity\": 0.3,\n \"gradientMode\": \"opacity\",\n \"lineInterpolation\": \"smooth\",\n \"lineWidth\": 2,\n \"stack\": \"off\"\n },\n \"datasourceCate\": \"prometheus\",\n \"datasourceValue\": \"${datasource}\",\n \"id\": \"34fbd572-c71a-475b-91a9-168df988cec3\",\n \"layout\": {\n \"h\": 4,\n \"i\": \"1e465bd5-c3ed-4f93-8df7-a980299805b4\",\n \"isResizable\": true,\n \"w\": 12,\n \"x\": 12,\n \"y\": 1\n },\n \"name\": \"Event emitted Rate(/s)\",\n \"options\": {\n \"legend\": {\n \"displayMode\": \"hidden\"\n },\n \"standardOptions\": {},\n \"thresholds\": {},\n \"tooltip\": {\n \"mode\": \"all\",\n \"sort\": \"none\"\n }\n },\n \"targets\": [\n {\n \"expr\": \"sum(rate(logstash_events_out[1m])) by (pipeline)\",\n \"legend\": \"output\",\n \"refId\": \"B\"\n }\n ],\n \"type\": \"timeseries\",\n \"version\": \"2.0.0\"\n },\n {\n \"custom\": {\n \"drawStyle\": \"lines\",\n \"fillOpacity\": 0.3,\n \"gradientMode\": \"opacity\",\n \"lineInterpolation\": \"smooth\",\n \"lineWidth\": 2,\n \"stack\": \"off\"\n },\n \"datasourceCate\": \"prometheus\",\n \"datasourceValue\": \"${datasource}\",\n \"id\": \"1bb9f546-bd57-48fd-8221-b8b43687a12a\",\n \"layout\": {\n \"h\": 4,\n \"i\": \"3c350ca9-5fcd-4605-9fee-c9834d7bb3b5\",\n \"isResizable\": true,\n \"w\": 12,\n \"x\": 0,\n \"y\": 5\n },\n \"name\": \"Event queue(ms)\",\n \"options\": {\n \"legend\": {\n \"displayMode\": \"hidden\"\n },\n \"standardOptions\": {},\n \"thresholds\": {},\n \"tooltip\": {\n \"mode\": \"all\",\n \"sort\": \"none\"\n }\n },\n \"targets\": [\n {\n \"expr\": \"(sum(rate(logstash_events_queue_push_duration_in_millis[1m])) by (pipeline))/(count(sum(logstash_events_queue_push_duration_in_millis[1m]) by(ident)))\",\n \"legend\": \"{{pipeline}}\",\n \"refId\": \"A\"\n }\n ],\n \"type\": \"timeseries\",\n \"version\": \"2.0.0\"\n },\n {\n \"custom\": {\n \"drawStyle\": \"lines\",\n \"fillOpacity\": 0.3,\n \"gradientMode\": \"opacity\",\n \"lineInterpolation\": \"smooth\",\n \"lineWidth\": 2,\n \"stack\": \"off\"\n },\n \"datasourceCate\": \"prometheus\",\n \"datasourceValue\": \"${datasource}\",\n \"id\": \"99f557e3-d368-4de1-b065-44e2006f1d21\",\n \"layout\": {\n \"h\": 4,\n \"i\": \"1b808724-fbac-4b9b-b7ce-a5725e30e4f8\",\n \"isResizable\": true,\n \"w\": 12,\n \"x\": 12,\n \"y\": 5\n },\n \"name\": \"Event esp(ms)\",\n \"options\": {\n \"legend\": {\n \"displayMode\": \"hidden\"\n },\n \"standardOptions\": {},\n \"thresholds\": {},\n \"tooltip\": {\n \"mode\": \"all\",\n \"sort\": \"none\"\n }\n },\n \"targets\": [\n {\n \"expr\": \"sum(rate(logstash_events_duration_in_millis[1m] )/rate(logstash_events_out[1m])) by(pipeline)\",\n \"legend\": \"{{pipeline}}\",\n \"refId\": \"A\"\n }\n ],\n \"type\": \"timeseries\",\n \"version\": \"2.0.0\"\n },\n {\n \"collapsed\": true,\n \"id\": \"5f12a28c-9ca4-4f10-aa0c-116dff2193cf\",\n \"layout\": {\n \"h\": 1,\n \"i\": \"5f12a28c-9ca4-4f10-aa0c-116dff2193cf\",\n \"isResizable\": false,\n \"w\": 24,\n \"x\": 0,\n \"y\": 9\n },\n \"name\": \"memory\",\n \"panels\": [],\n \"type\": \"row\"\n },\n {\n \"custom\": {\n \"drawStyle\": \"lines\",\n \"fillOpacity\": 0.3,\n \"gradientMode\": \"opacity\",\n \"lineInterpolation\": \"smooth\",\n \"lineWidth\": 2,\n \"stack\": \"off\"\n },\n \"datasourceCate\": \"prometheus\",\n \"datasourceValue\": \"${datasource}\",\n \"id\": \"57867483-a372-45c9-9cd0-53aa160b57fb\",\n \"layout\": {\n \"h\": 4,\n \"i\": \"f170fe2a-fd1e-49f0-aa7b-0c3ac42894e6\",\n \"isResizable\": true,\n \"w\": 12,\n \"x\": 0,\n \"y\": 10\n },\n \"name\": \"jvm gc count\",\n \"options\": {\n \"legend\": {\n \"displayMode\": \"hidden\"\n },\n \"standardOptions\": {},\n \"thresholds\": {},\n \"tooltip\": {\n \"mode\": \"all\",\n \"sort\": \"none\"\n }\n },\n \"targets\": [\n {\n \"expr\": \"increase(logstash_jvm_gc_collectors_old_collection_count)\",\n \"legend\": \"old gc - {{ident}}\",\n \"refId\": \"A\"\n },\n {\n \"expr\": \"increase(logstash_jvm_gc_collectors_young_collection_count)\",\n \"legend\": \"young gc - {{ident}}\",\n \"refId\": \"B\"\n }\n ],\n \"type\": \"timeseries\",\n \"version\": \"2.0.0\"\n },\n {\n \"custom\": {\n \"drawStyle\": \"lines\",\n \"fillOpacity\": 0.3,\n \"gradientMode\": \"opacity\",\n \"lineInterpolation\": \"smooth\",\n \"lineWidth\": 2,\n \"stack\": \"off\"\n },\n \"datasourceCate\": \"prometheus\",\n \"datasourceValue\": \"${datasource}\",\n \"id\": \"e61be63c-81d6-4aab-a4de-d23ea444d802\",\n \"layout\": {\n \"h\": 4,\n \"i\": \"9ccb2af0-fa05-4a66-814d-53b77e320303\",\n \"isResizable\": true,\n \"w\": 12,\n \"x\": 12,\n \"y\": 10\n },\n \"name\": \"jvm gc time(ms)\",\n \"options\": {\n \"legend\": {\n \"displayMode\": \"hidden\"\n },\n \"standardOptions\": {},\n \"thresholds\": {},\n \"tooltip\": {\n \"mode\": \"all\",\n \"sort\": \"none\"\n }\n },\n \"targets\": [\n {\n \"expr\": \"increase(logstash_jvm_gc_collectors_old_collection_time_in_millis)\",\n \"legend\": \"old gc - {{ident}}\",\n \"refId\": \"A\"\n },\n {\n \"expr\": \"increase(logstash_jvm_gc_collectors_young_collection_time_in_millis)\",\n \"legend\": \"yougn gc - {{ident}}\",\n \"refId\": \"B\"\n }\n ],\n \"type\": \"timeseries\",\n \"version\": \"2.0.0\"\n },\n {\n \"custom\": {\n \"drawStyle\": \"lines\",\n \"fillOpacity\": 0.29,\n \"lineInterpolation\": \"smooth\",\n \"stack\": \"off\"\n },\n \"datasourceCate\": \"prometheus\",\n \"datasourceValue\": \"${datasource}\",\n \"id\": \"86329740-9696-4435-bd28-120107914b40\",\n \"layout\": {\n \"h\": 4,\n \"i\": \"ab5fd3bd-81c8-4f3f-a403-6111dd6fce43\",\n \"isResizable\": true,\n \"w\": 12,\n \"x\": 0,\n \"y\": 14\n },\n \"name\": \"jvm heap \",\n \"options\": {\n \"legend\": {\n \"displayMode\": \"hidden\"\n },\n \"standardOptions\": {},\n \"thresholds\": {},\n \"tooltip\": {\n \"mode\": \"all\",\n \"sort\": \"none\"\n }\n },\n \"targets\": [\n {\n \"expr\": \"logstash_jvm_mem_heap_max_in_bytes\",\n \"legend\": \" max - {{ident}}\",\n \"refId\": \"A\"\n },\n {\n \"expr\": \"logstash_jvm_mem_heap_used_in_bytes\",\n \"legend\": \"used - {{ident}}\",\n \"refId\": \"B\"\n }\n ],\n \"type\": \"timeseries\",\n \"version\": \"2.0.0\"\n },\n {\n \"custom\": {\n \"drawStyle\": \"lines\",\n \"fillOpacity\": 0.29,\n \"lineInterpolation\": \"smooth\",\n \"stack\": \"off\"\n },\n \"datasourceCate\": \"prometheus\",\n \"datasourceValue\": \"${datasource}\",\n \"id\": \"8d82f269-d625-4da9-8dfd-33a0888c396d\",\n \"layout\": {\n \"h\": 4,\n \"i\": \"ced26104-67f8-4537-b564-038d824f3be1\",\n \"isResizable\": true,\n \"w\": 12,\n \"x\": 12,\n \"y\": 14\n },\n \"name\": \"jvm no heap \",\n \"options\": {\n \"legend\": {\n \"displayMode\": \"hidden\"\n },\n \"standardOptions\": {},\n \"thresholds\": {},\n \"tooltip\": {\n \"mode\": \"all\",\n \"sort\": \"none\"\n }\n },\n \"targets\": [\n {\n \"expr\": \"logstash_jvm_mem_non_heap_committed_in_bytes\",\n \"legend\": \"committed - {{ident}}\",\n \"refId\": \"A\"\n },\n {\n \"expr\": \"logstash_jvm_mem_non_heap_used_in_bytes\",\n \"legend\": \"used - {{ident}}\",\n \"refId\": \"B\"\n }\n ],\n \"type\": \"timeseries\",\n \"version\": \"2.0.0\"\n },\n {\n \"collapsed\": false,\n \"id\": \"9ca74da3-b31f-4ac9-ba76-397027da677d\",\n \"layout\": {\n \"h\": 1,\n \"i\": \"9ca74da3-b31f-4ac9-ba76-397027da677d\",\n \"isResizable\": false,\n \"w\": 24,\n \"x\": 0,\n \"y\": 18\n },\n \"name\": \"cpu\",\n \"panels\": [\n {\n \"custom\": {\n \"drawStyle\": \"lines\",\n \"fillOpacity\": 0.29,\n \"lineInterpolation\": \"smooth\",\n \"stack\": \"off\"\n },\n \"datasourceCate\": \"prometheus\",\n \"datasourceValue\": \"${datasource}\",\n \"id\": \"5d507c1a-8043-4abf-9c7a-94e3c9189cc1\",\n \"layout\": {\n \"h\": 4,\n \"i\": \"5fffbff5-cd86-4447-9c54-1f5abdeffa5c\",\n \"isResizable\": true,\n \"w\": 12,\n \"x\": 0,\n \"y\": 19\n },\n \"name\": \"cpu Utilization\",\n \"options\": {\n \"legend\": {\n \"displayMode\": \"hidden\"\n },\n \"standardOptions\": {\n \"util\": \"percent\"\n },\n \"thresholds\": {},\n \"tooltip\": {\n \"mode\": \"all\",\n \"sort\": \"none\"\n }\n },\n \"targets\": [\n {\n \"expr\": \"logstash_process_cpu_percent\",\n \"legend\": \"{{ident}}\",\n \"refId\": \"A\"\n }\n ],\n \"type\": \"timeseries\",\n \"version\": \"2.0.0\"\n },\n {\n \"custom\": {\n \"drawStyle\": \"lines\",\n \"fillOpacity\": 0.29,\n \"lineInterpolation\": \"smooth\",\n \"stack\": \"off\"\n },\n \"datasourceCate\": \"prometheus\",\n \"datasourceValue\": \"${datasource}\",\n \"id\": \"87f9c763-e082-416a-994d-a1ed12d58e05\",\n \"layout\": {\n \"h\": 4,\n \"i\": \"8ad83037-8df6-4f3a-936a-db9c26bc5071\",\n \"isResizable\": true,\n \"w\": 12,\n \"x\": 12,\n \"y\": 19\n },\n \"name\": \"system load\",\n \"options\": {\n \"legend\": {\n \"displayMode\": \"hidden\"\n },\n \"standardOptions\": {},\n \"thresholds\": {},\n \"tooltip\": {\n \"mode\": \"all\",\n \"sort\": \"none\"\n }\n },\n \"targets\": [\n {\n \"expr\": \"logstash_process_cpu_load_average_1m\",\n \"legend\": \"1m - {{ident}}\",\n \"refId\": \"A\"\n },\n {\n \"expr\": \"logstash_process_cpu_load_average_5m\",\n \"legend\": \"5m - {{ident}}\",\n \"refId\": \"B\"\n },\n {\n \"expr\": \"logstash_process_cpu_load_average_15m\",\n \"legend\": \"15m - {{ident}}\",\n \"refId\": \"C\"\n }\n ],\n \"type\": \"timeseries\",\n \"version\": \"2.0.0\"\n }\n ],\n \"type\": \"row\"\n }\n ],\n \"var\": [\n {\n \"definition\": \"prometheus\",\n \"name\": \"datasource\",\n \"type\": \"datasource\"\n },\n {\n \"datasource\": {\n \"cate\": \"prometheus\",\n \"value\": \"${datasource}\"\n },\n \"definition\": \"label_values(logstash_events_in, instance)\",\n \"name\": \"instance\",\n \"type\": \"query\"\n }\n ],\n \"version\": \"3.0.0\"\n },\n \"public\": 0,\n \"public_cate\": 0,\n \"bgids\": null,\n \"built_in\": 0,\n \"hide\": 0,\n \"uuid\": 1717556328044690000\n}"
},
{
"path": "integrations/Logstash/markdown/README.md",
"content": "# logstash\n\nlogstash 监控采集插件,由telegraf改造而来。\n\n## Configuration\n\n请参考配置[示例](https://github.com/flashcatcloud/categraf/blob/main/conf/input.logstash/logstash.toml)\n"
},
{
"path": "integrations/MinIO/alerts/minio_by_categraf.json",
"content": "[\n {\n \"id\": 0,\n \"group_id\": 0,\n \"cate\": \"prometheus\",\n \"datasource_ids\": [\n 0\n ],\n \"cluster\": \"\",\n \"name\": \"DisksOffline\",\n \"note\": \"Disks down in MinIO deployment\",\n \"prod\": \"metric\",\n \"algorithm\": \"\",\n \"algo_params\": null,\n \"delay\": 0,\n \"severity\": 2,\n \"severities\": [\n 2\n ],\n \"disabled\": 1,\n \"prom_for_duration\": 600,\n \"prom_ql\": \"avg_over_time(minio_cluster_disk_offline_total{}[5m]) \\u003e 0\",\n \"rule_config\": {\n \"algo_params\": null,\n \"inhibit\": false,\n \"prom_ql\": \"\",\n \"queries\": [\n {\n \"prom_ql\": \"avg_over_time(minio_cluster_disk_offline_total{}[5m]) \\u003e 0\",\n \"severity\": 2\n }\n ],\n \"severity\": 0\n },\n \"prom_eval_interval\": 15,\n \"enable_stime\": \"00:00\",\n \"enable_stimes\": [\n \"00:00\"\n ],\n \"enable_etime\": \"23:59\",\n \"enable_etimes\": [\n \"23:59\"\n ],\n \"enable_days_of_week\": [\n \"1\",\n \"2\",\n \"3\",\n \"4\",\n \"5\",\n \"6\",\n \"0\"\n ],\n \"enable_days_of_weeks\": [\n [\n \"1\",\n \"2\",\n \"3\",\n \"4\",\n \"5\",\n \"6\",\n \"0\"\n ]\n ],\n \"enable_in_bg\": 0,\n \"notify_recovered\": 1,\n \"notify_channels\": [],\n \"notify_groups_obj\": null,\n \"notify_groups\": null,\n \"notify_repeat_step\": 60,\n \"notify_max_number\": 0,\n \"recover_duration\": 0,\n \"callbacks\": [],\n \"runbook_url\": \"\",\n \"append_tags\": [],\n \"annotations\": null,\n \"extra_config\": null,\n \"create_at\": 0,\n \"create_by\": \"\",\n \"update_at\": 0,\n \"update_by\": \"\",\n \"uuid\": 1717556328048390000\n },\n {\n \"id\": 0,\n \"group_id\": 0,\n \"cate\": \"prometheus\",\n \"datasource_ids\": [\n 0\n ],\n \"cluster\": \"\",\n \"name\": \"NodesOffline\",\n \"note\": \"Node down in MinIO deployment\",\n \"prod\": \"metric\",\n \"algorithm\": \"\",\n \"algo_params\": null,\n \"delay\": 0,\n \"severity\": 2,\n \"severities\": [\n 2\n ],\n \"disabled\": 1,\n \"prom_for_duration\": 600,\n \"prom_ql\": \"avg_over_time(minio_cluster_nodes_offline_total{}[5m]) \\u003e 0\",\n \"rule_config\": {\n \"algo_params\": null,\n \"inhibit\": false,\n \"prom_ql\": \"\",\n \"queries\": [\n {\n \"prom_ql\": \"avg_over_time(minio_cluster_nodes_offline_total{}[5m]) \\u003e 0\",\n \"severity\": 2\n }\n ],\n \"severity\": 0\n },\n \"prom_eval_interval\": 15,\n \"enable_stime\": \"00:00\",\n \"enable_stimes\": [\n \"00:00\"\n ],\n \"enable_etime\": \"23:59\",\n \"enable_etimes\": [\n \"23:59\"\n ],\n \"enable_days_of_week\": [\n \"1\",\n \"2\",\n \"3\",\n \"4\",\n \"5\",\n \"6\",\n \"0\"\n ],\n \"enable_days_of_weeks\": [\n [\n \"1\",\n \"2\",\n \"3\",\n \"4\",\n \"5\",\n \"6\",\n \"0\"\n ]\n ],\n \"enable_in_bg\": 0,\n \"notify_recovered\": 1,\n \"notify_channels\": [],\n \"notify_groups_obj\": null,\n \"notify_groups\": null,\n \"notify_repeat_step\": 60,\n \"notify_max_number\": 0,\n \"recover_duration\": 0,\n \"callbacks\": [],\n \"runbook_url\": \"\",\n \"append_tags\": [],\n \"annotations\": null,\n \"extra_config\": null,\n \"create_at\": 0,\n \"create_by\": \"\",\n \"update_at\": 0,\n \"update_by\": \"\",\n \"uuid\": 1717556328048820000\n }\n]"
},
{
"path": "integrations/MinIO/dashboards/minio_by_categraf.json",
"content": "{\n \"id\": 0,\n \"group_id\": 0,\n \"name\": \"MinIO Dashboard\",\n \"ident\": \"\",\n \"tags\": \"\",\n \"create_at\": 0,\n \"create_by\": \"\",\n \"update_at\": 0,\n \"update_by\": \"\",\n \"configs\": {\n \"links\": [],\n \"panels\": [\n {\n \"custom\": {\n \"calc\": \"lastNotNull\",\n \"textMode\": \"valueAndName\"\n },\n \"datasourceCate\": \"prometheus\",\n \"datasourceValue\": \"${DS_PROMETHEUS}\",\n \"description\": \"\",\n \"id\": \"134b5e6d-63aa-4a43-ae26-13177c3d5184\",\n \"layout\": {\n \"h\": 6,\n \"i\": \"134b5e6d-63aa-4a43-ae26-13177c3d5184\",\n \"isResizable\": true,\n \"w\": 3,\n \"x\": 0,\n \"y\": 0\n },\n \"links\": [],\n \"maxPerRow\": 4,\n \"name\": \"Uptime\",\n \"options\": {\n \"standardOptions\": {\n \"decimals\": 0,\n \"util\": \"seconds\"\n },\n \"thresholds\": {\n \"steps\": [\n {\n \"color\": \"#3FC453\",\n \"type\": \"base\",\n \"value\": null\n }\n ]\n }\n },\n \"targets\": [\n {\n \"expr\": \"time() - max(minio_node_process_starttime_seconds{job=\\\"$scrape_jobs\\\"})\",\n \"legend\": \"{{job}}\",\n \"refId\": \"A\"\n }\n ],\n \"transformations\": [\n {\n \"id\": \"organize\",\n \"options\": {}\n }\n ],\n \"type\": \"gauge\",\n \"version\": \"3.0.0\"\n },\n {\n \"custom\": {\n \"calc\": \"last\",\n \"colSpan\": 1,\n \"colorMode\": \"value\",\n \"graphMode\": \"none\",\n \"textMode\": \"value\",\n \"textSize\": {},\n \"valueField\": \"Value\"\n },\n \"datasourceCate\": \"prometheus\",\n \"datasourceValue\": \"${DS_PROMETHEUS}\",\n \"description\": \"\",\n \"id\": \"ca68e795-0a81-4c24-8e55-e754e0283b70\",\n \"layout\": {\n \"h\": 3,\n \"i\": \"ca68e795-0a81-4c24-8e55-e754e0283b70\",\n \"isResizable\": true,\n \"w\": 3,\n \"x\": 3,\n \"y\": 0\n },\n \"links\": [],\n \"maxPerRow\": 4,\n \"name\": \"Total S3 Traffic Inbound\",\n \"options\": {\n \"standardOptions\": {\n \"util\": \"bytesIEC\"\n },\n \"thresholds\": {\n \"steps\": [\n {\n \"color\": \"#73BF69\",\n \"type\": \"base\",\n \"value\": null\n }\n ]\n },\n \"valueMappings\": [\n {\n \"options\": {\n \"match\": \"null\",\n \"result\": {\n \"text\": \"N/A\"\n }\n },\n \"type\": \"special\"\n }\n ]\n },\n \"targets\": [\n {\n \"expr\": \"sum by (instance) (minio_s3_traffic_received_bytes{job=\\\"$scrape_jobs\\\"})\",\n \"legend\": \"{{instance}}\",\n \"refId\": \"A\"\n }\n ],\n \"transformations\": [\n {\n \"id\": \"organize\",\n \"options\": {}\n }\n ],\n \"type\": \"stat\",\n \"version\": \"3.0.0\"\n },\n {\n \"custom\": {\n \"calc\": \"lastNotNull\",\n \"detailName\": \"详情\",\n \"legengPosition\": \"hidden\"\n },\n \"datasourceCate\": \"prometheus\",\n \"datasourceValue\": \"${DS_PROMETHEUS}\",\n \"description\": \"\",\n \"id\": \"d356fc74-4fce-4764-aff9-bc5590c3753d\",\n \"layout\": {\n \"h\": 6,\n \"i\": \"d356fc74-4fce-4764-aff9-bc5590c3753d\",\n \"isResizable\": true,\n \"w\": 5,\n \"x\": 6,\n \"y\": 0\n },\n \"links\": [],\n \"maxPerRow\": 4,\n \"name\": \"Capacity\",\n \"options\": {\n \"standardOptions\": {\n \"util\": \"bytesIEC\"\n }\n },\n \"targets\": [\n {\n \"expr\": \"topk(1, sum(minio_cluster_capacity_usable_total_bytes{job=\\\"$scrape_jobs\\\"}) by (instance)) - topk(1, sum(minio_cluster_capacity_usable_free_bytes{job=\\\"$scrape_jobs\\\"}) by (instance))\",\n \"legend\": \"Used\",\n \"refId\": \"A\"\n },\n {\n \"expr\": \"topk(1, sum(minio_cluster_capacity_usable_free_bytes{job=\\\"$scrape_jobs\\\"}) by (instance)) \",\n \"legend\": \"Free\",\n \"refId\": \"B\"\n }\n ],\n \"transformations\": [\n {\n \"id\": \"organize\",\n \"options\": {}\n }\n ],\n \"type\": \"pie\",\n \"version\": \"3.0.0\"\n },\n {\n \"custom\": {\n \"drawStyle\": \"lines\",\n \"fillOpacity\": 0.1,\n \"gradientMode\": \"none\",\n \"lineInterpolation\": \"linear\",\n \"lineWidth\": 1,\n \"scaleDistribution\": {\n \"type\": \"linear\"\n },\n \"spanNulls\": false,\n \"stack\": \"off\"\n },\n \"datasourceCate\": \"prometheus\",\n \"datasourceValue\": \"${DS_PROMETHEUS}\",\n \"id\": \"3b618c2c-1394-46f7-b3b2-578201444e30\",\n \"layout\": {\n \"h\": 6,\n \"i\": \"3b618c2c-1394-46f7-b3b2-578201444e30\",\n \"isResizable\": true,\n \"w\": 5,\n \"x\": 11,\n \"y\": 0\n },\n \"links\": [],\n \"maxPerRow\": 4,\n \"name\": \"Data Usage Growth\",\n \"options\": {\n \"legend\": {\n \"displayMode\": \"hidden\"\n },\n \"standardOptions\": {\n \"util\": \"bytesIEC\"\n },\n \"thresholds\": {\n \"steps\": [\n {\n \"color\": \"#73BF69\",\n \"type\": \"base\",\n \"value\": null\n },\n {\n \"color\": \"#F2495C\",\n \"value\": 80\n }\n ]\n },\n \"tooltip\": {\n \"mode\": \"multi\"\n }\n },\n \"targets\": [\n {\n \"expr\": \"max(sum(minio_bucket_usage_total_bytes{job=\\\"$scrape_jobs\\\"}) by (instance,server))\",\n \"legend\": \"Usage\",\n \"refId\": \"A\"\n }\n ],\n \"transformations\": [\n {\n \"id\": \"organize\",\n \"options\": {}\n }\n ],\n \"type\": \"timeseries\",\n \"version\": \"3.0.0\"\n },\n {\n \"custom\": {\n \"baseColor\": \"#9470FF\",\n \"calc\": \"lastNotNull\",\n \"serieWidth\": 20,\n \"sortOrder\": \"desc\"\n },\n \"datasourceCate\": \"prometheus\",\n \"datasourceValue\": \"${DS_PROMETHEUS}\",\n \"id\": \"817686c6-499c-434b-8b9e-ffc7c3a21308\",\n \"layout\": {\n \"h\": 6,\n \"i\": \"817686c6-499c-434b-8b9e-ffc7c3a21308\",\n \"isResizable\": true,\n \"w\": 5,\n \"x\": 16,\n \"y\": 0\n },\n \"links\": [],\n \"maxPerRow\": 4,\n \"name\": \"Object size distribution\",\n \"options\": {\n \"standardOptions\": {\n \"util\": \"seconds\"\n }\n },\n \"targets\": [\n {\n \"expr\": \"max by (range) (sum (minio_bucket_objects_size_distribution{job=\\\"$scrape_jobs\\\"}) by (range))\",\n \"legend\": \"{{range}}\",\n \"refId\": \"A\"\n }\n ],\n \"transformations\": [\n {\n \"id\": \"organize\",\n \"options\": {}\n }\n ],\n \"type\": \"barGauge\",\n \"version\": \"3.0.0\"\n },\n {\n \"custom\": {\n \"calc\": \"last\",\n \"colSpan\": 1,\n \"colorMode\": \"value\",\n \"graphMode\": \"none\",\n \"textMode\": \"value\",\n \"textSize\": {},\n \"valueField\": \"Value\"\n },\n \"datasourceCate\": \"prometheus\",\n \"datasourceValue\": \"${DS_PROMETHEUS}\",\n \"description\": \"\",\n \"id\": \"855e0055-e418-464f-bc3e-04a8a5a1b1b3\",\n \"layout\": {\n \"h\": 3,\n \"i\": \"855e0055-e418-464f-bc3e-04a8a5a1b1b3\",\n \"isResizable\": true,\n \"w\": 3,\n \"x\": 21,\n \"y\": 0\n },\n \"links\": [],\n \"maxPerRow\": 4,\n \"name\": \"Total Open FDs\",\n \"options\": {\n \"standardOptions\": {\n \"util\": \"none\"\n },\n \"thresholds\": {\n \"steps\": [\n {\n \"color\": \"#73BF69\",\n \"type\": \"base\",\n \"value\": null\n },\n {\n \"color\": \"#F2495C\",\n \"value\": 2000\n }\n ]\n },\n \"valueMappings\": [\n {\n \"options\": {\n \"match\": \"null\",\n \"result\": {\n \"text\": \"N/A\"\n }\n },\n \"type\": \"special\"\n }\n ]\n },\n \"targets\": [\n {\n \"expr\": \"sum (minio_node_file_descriptor_open_total{job=\\\"$scrape_jobs\\\"})\",\n \"legend\": \"\",\n \"refId\": \"A\"\n }\n ],\n \"transformations\": [\n {\n \"id\": \"organize\",\n \"options\": {}\n }\n ],\n \"type\": \"stat\",\n \"version\": \"3.0.0\"\n },\n {\n \"custom\": {\n \"calc\": \"last\",\n \"colSpan\": 1,\n \"colorMode\": \"value\",\n \"graphMode\": \"none\",\n \"textMode\": \"value\",\n \"textSize\": {},\n \"valueField\": \"Value\"\n },\n \"datasourceCate\": \"prometheus\",\n \"datasourceValue\": \"${DS_PROMETHEUS}\",\n \"description\": \"\",\n \"id\": \"2cc7d5ac-1508-4067-91a5-1b08c4339f7f\",\n \"layout\": {\n \"h\": 3,\n \"i\": \"2cc7d5ac-1508-4067-91a5-1b08c4339f7f\",\n \"isResizable\": true,\n \"w\": 3,\n \"x\": 3,\n \"y\": 3\n },\n \"links\": [],\n \"maxPerRow\": 4,\n \"name\": \"Total S3 Traffic Outbound\",\n \"options\": {\n \"standardOptions\": {\n \"util\": \"bytesIEC\"\n },\n \"thresholds\": {\n \"steps\": [\n {\n \"color\": \"#73BF69\",\n \"type\": \"base\",\n \"value\": null\n }\n ]\n },\n \"valueMappings\": [\n {\n \"options\": {\n \"match\": \"null\",\n \"result\": {\n \"text\": \"N/A\"\n }\n },\n \"type\": \"special\"\n }\n ]\n },\n \"targets\": [\n {\n \"expr\": \"sum by (instance) (minio_s3_traffic_sent_bytes{job=\\\"$scrape_jobs\\\"})\",\n \"legend\": \"\",\n \"refId\": \"A\"\n }\n ],\n \"transformations\": [\n {\n \"id\": \"organize\",\n \"options\": {}\n }\n ],\n \"type\": \"stat\",\n \"version\": \"3.0.0\"\n },\n {\n \"custom\": {\n \"calc\": \"last\",\n \"colorMode\": \"value\",\n \"textMode\": \"value\",\n \"version\": \"3.0.0\"\n },\n \"datasourceCate\": \"prometheus\",\n \"datasourceValue\": \"${DS_PROMETHEUS}\",\n \"description\": \"\",\n \"id\": \"b7b7d005-b1b3-403e-8cfa-91c561972ef5\",\n \"layout\": {\n \"h\": 3,\n \"i\": \"b7b7d005-b1b3-403e-8cfa-91c561972ef5\",\n \"isResizable\": true,\n \"w\": 3,\n \"x\": 21,\n \"y\": 3\n },\n \"links\": [],\n \"maxPerRow\": 4,\n \"name\": \"Total Goroutines\",\n \"options\": {\n \"legend\": {\n \"displayMode\": \"list\"\n },\n \"standardOptions\": {\n \"util\": \"none\"\n },\n \"thresholds\": {\n \"mode\": \"absolute\",\n \"steps\": [\n {\n \"color\": \"#73BF69\",\n \"type\": \"base\",\n \"value\": null\n },\n {\n \"color\": \"#F2495C\",\n \"value\": 2000\n }\n ],\n \"style\": \"line\"\n },\n \"tooltip\": {\n \"mode\": \"multi\"\n },\n \"valueMappings\": [\n {\n \"options\": {\n \"match\": \"null\",\n \"result\": {\n \"text\": \"N/A\"\n }\n },\n \"type\": \"special\"\n }\n ]\n },\n \"targets\": [\n {\n \"expr\": \"sum without (server,instance) (minio_node_go_routine_total{job=\\\"$scrape_jobs\\\"})\",\n \"legend\": \"\",\n \"refId\": \"A\"\n }\n ],\n \"type\": \"stat\",\n \"version\": \"3.0.0\"\n },\n {\n \"custom\": {\n \"calc\": \"avg\",\n \"colSpan\": 1,\n \"colorMode\": \"value\",\n \"graphMode\": \"none\",\n \"textMode\": \"value\",\n \"textSize\": {},\n \"valueField\": \"Value\"\n },\n \"datasourceCate\": \"prometheus\",\n \"datasourceValue\": \"${DS_PROMETHEUS}\",\n \"description\": \"\",\n \"id\": \"0e22c724-2ae0-4700-a7e5-3f1243a3d896\",\n \"layout\": {\n \"h\": 2,\n \"i\": \"0e22c724-2ae0-4700-a7e5-3f1243a3d896\",\n \"isResizable\": true,\n \"w\": 3,\n \"x\": 0,\n \"y\": 6\n },\n \"links\": [],\n \"maxPerRow\": 4,\n \"name\": \"Total Online Servers\",\n \"options\": {\n \"standardOptions\": {\n \"util\": \"none\"\n },\n \"thresholds\": {\n \"steps\": [\n {\n \"color\": \"#73BF69\",\n \"type\": \"base\",\n \"value\": null\n }\n ]\n },\n \"valueMappings\": [\n {\n \"options\": {\n \"match\": \"null\",\n \"result\": {\n \"text\": \"N/A\"\n }\n },\n \"type\": \"special\"\n }\n ]\n },\n \"targets\": [\n {\n \"expr\": \"minio_cluster_nodes_online_total{job=\\\"$scrape_jobs\\\"}\",\n \"legend\": \"{{job}}\",\n \"refId\": \"A\"\n }\n ],\n \"transformations\": [\n {\n \"id\": \"organize\",\n \"options\": {}\n }\n ],\n \"type\": \"stat\",\n \"version\": \"3.0.0\"\n },\n {\n \"custom\": {\n \"calc\": \"avg\",\n \"colSpan\": 1,\n \"colorMode\": \"value\",\n \"graphMode\": \"none\",\n \"textMode\": \"value\",\n \"textSize\": {},\n \"valueField\": \"Value\"\n },\n \"datasourceCate\": \"prometheus\",\n \"datasourceValue\": \"${DS_PROMETHEUS}\",\n \"description\": \"\",\n \"id\": \"776ecb58-5daf-4d5c-9c5b-774f476de70b\",\n \"layout\": {\n \"h\": 2,\n \"i\": \"776ecb58-5daf-4d5c-9c5b-774f476de70b\",\n \"isResizable\": true,\n \"w\": 3,\n \"x\": 3,\n \"y\": 6\n },\n \"links\": [],\n \"maxPerRow\": 4,\n \"name\": \"Total Online Disks\",\n \"options\": {\n \"standardOptions\": {\n \"util\": \"none\"\n },\n \"thresholds\": {\n \"steps\": [\n {\n \"color\": \"#73BF69\",\n \"type\": \"base\",\n \"value\": null\n },\n {\n \"color\": \"#F2495C\",\n \"value\": 80\n }\n ]\n },\n \"valueMappings\": [\n {\n \"options\": {\n \"match\": \"null\",\n \"result\": {\n \"text\": \"N/A\"\n }\n },\n \"type\": \"special\"\n }\n ]\n },\n \"targets\": [\n {\n \"expr\": \"minio_cluster_disk_online_total{job=\\\"$scrape_jobs\\\"}\",\n \"legend\": \"Total online disks in MinIO Cluster\",\n \"refId\": \"A\"\n }\n ],\n \"transformations\": [\n {\n \"id\": \"organize\",\n \"options\": {}\n }\n ],\n \"type\": \"stat\",\n \"version\": \"3.0.0\"\n },\n {\n \"custom\": {\n \"calc\": \"lastNotNull\",\n \"colorMode\": \"value\",\n \"textMode\": \"value\",\n \"version\": \"3.0.0\"\n },\n \"datasourceCate\": \"prometheus\",\n \"datasourceValue\": \"${DS_PROMETHEUS}\",\n \"id\": \"e9225532-5991-4394-9e4e-8c09879447ba\",\n \"layout\": {\n \"h\": 3,\n \"i\": \"e9225532-5991-4394-9e4e-8c09879447ba\",\n \"isResizable\": true,\n \"w\": 3,\n \"x\": 6,\n \"y\": 6\n },\n \"links\": [],\n \"maxPerRow\": 4,\n \"name\": \"Number of Buckets\",\n \"options\": {\n \"legend\": {\n \"displayMode\": \"list\"\n },\n \"standardOptions\": {\n \"util\": \"none\"\n },\n \"thresholds\": {\n \"mode\": \"absolute\",\n \"steps\": [\n {\n \"color\": \"#73BF69\",\n \"type\": \"base\",\n \"value\": null\n },\n {\n \"color\": \"#E0B400\",\n \"value\": 75000000\n },\n {\n \"color\": \"#C4162A\",\n \"value\": 100000000\n }\n ],\n \"style\": \"line\"\n },\n \"tooltip\": {\n \"mode\": \"multi\"\n },\n \"valueMappings\": [\n {\n \"options\": {\n \"match\": \"null\",\n \"result\": {\n \"text\": \"N/A\"\n }\n },\n \"type\": \"special\"\n }\n ]\n },\n \"targets\": [\n {\n \"expr\": \"count(count by (bucket) (minio_bucket_usage_total_bytes{job=\\\"$scrape_jobs\\\"}))\",\n \"legend\": \"\",\n \"refId\": \"A\"\n }\n ],\n \"type\": \"stat\",\n \"version\": \"3.0.0\"\n },\n {\n \"custom\": {\n \"drawStyle\": \"lines\",\n \"fillOpacity\": 0.3,\n \"gradientMode\": \"opacity\",\n \"lineInterpolation\": \"linear\",\n \"lineWidth\": 2,\n \"stack\": \"off\",\n \"version\": \"3.0.0\"\n },\n \"datasourceCate\": \"prometheus\",\n \"datasourceValue\": \"${DS_PROMETHEUS}\",\n \"id\": \"2ebcc855-1fac-4a1e-baec-6ed398920c77\",\n \"layout\": {\n \"h\": 6,\n \"i\": \"2ebcc855-1fac-4a1e-baec-6ed398920c77\",\n \"isResizable\": true,\n \"w\": 7,\n \"x\": 9,\n \"y\": 6\n },\n \"links\": [],\n \"maxPerRow\": 4,\n \"name\": \"S3 API Data Received Rate \",\n \"options\": {\n \"legend\": {\n \"displayMode\": \"hidden\"\n },\n \"thresholds\": {\n \"steps\": [\n {\n \"color\": \"#634CD9\",\n \"type\": \"base\",\n \"value\": null\n }\n ]\n },\n \"tooltip\": {\n \"mode\": \"all\",\n \"sort\": \"none\"\n }\n },\n \"targets\": [\n {\n \"expr\": \"sum by (server) (rate(minio_s3_traffic_received_bytes{job=\\\"$scrape_jobs\\\"}[5m]))\",\n \"legend\": \"Data Received [{{server}}]\",\n \"refId\": \"A\"\n }\n ],\n \"type\": \"timeseries\",\n \"version\": \"3.0.0\"\n },\n {\n \"custom\": {\n \"drawStyle\": \"lines\",\n \"fillOpacity\": 0.3,\n \"gradientMode\": \"opacity\",\n \"lineInterpolation\": \"linear\",\n \"lineWidth\": 2,\n \"stack\": \"off\",\n \"version\": \"3.0.0\"\n },\n \"datasourceCate\": \"prometheus\",\n \"datasourceValue\": \"${DS_PROMETHEUS}\",\n \"id\": \"6edb8e54-e7ed-4cbe-af77-0bcd985dda95\",\n \"layout\": {\n \"h\": 6,\n \"i\": \"6edb8e54-e7ed-4cbe-af77-0bcd985dda95\",\n \"isResizable\": true,\n \"w\": 8,\n \"x\": 16,\n \"y\": 6\n },\n \"links\": [],\n \"maxPerRow\": 4,\n \"name\": \"S3 API Data Sent Rate \",\n \"options\": {\n \"legend\": {\n \"displayMode\": \"hidden\"\n },\n \"thresholds\": {\n \"steps\": [\n {\n \"color\": \"#634CD9\",\n \"type\": \"base\",\n \"value\": null\n }\n ]\n },\n \"tooltip\": {\n \"mode\": \"all\",\n \"sort\": \"none\"\n }\n },\n \"targets\": [\n {\n \"expr\": \"sum by (server) (rate(minio_s3_traffic_sent_bytes{job=\\\"$scrape_jobs\\\"}[5m]))\",\n \"legend\": \"Data Sent [{{server}}]\",\n \"refId\": \"A\"\n }\n ],\n \"type\": \"timeseries\",\n \"version\": \"3.0.0\"\n },\n {\n \"custom\": {\n \"calc\": \"avg\",\n \"colSpan\": 1,\n \"colorMode\": \"value\",\n \"graphMode\": \"none\",\n \"textMode\": \"value\",\n \"textSize\": {},\n \"valueField\": \"Value\"\n },\n \"datasourceCate\": \"prometheus\",\n \"datasourceValue\": \"${DS_PROMETHEUS}\",\n \"description\": \"\",\n \"id\": \"26be803c-f2b5-40b2-99ce-39240830292e\",\n \"layout\": {\n \"h\": 2,\n \"i\": \"26be803c-f2b5-40b2-99ce-39240830292e\",\n \"isResizable\": true,\n \"w\": 3,\n \"x\": 0,\n \"y\": 8\n },\n \"links\": [],\n \"maxPerRow\": 4,\n \"name\": \"Total Offline Servers\",\n \"options\": {\n \"standardOptions\": {\n \"util\": \"none\"\n },\n \"thresholds\": {\n \"steps\": [\n {\n \"color\": \"#73BF69\",\n \"type\": \"base\",\n \"value\": null\n },\n {\n \"color\": \"#F2495C\",\n \"value\": 80\n }\n ]\n },\n \"valueMappings\": [\n {\n \"options\": {\n \"match\": \"null\",\n \"result\": {\n \"text\": \"N/A\"\n }\n },\n \"type\": \"special\"\n }\n ]\n },\n \"targets\": [\n {\n \"expr\": \"minio_cluster_nodes_offline_total{job=\\\"$scrape_jobs\\\"}\",\n \"legend\": \"\",\n \"refId\": \"A\"\n }\n ],\n \"transformations\": [\n {\n \"id\": \"organize\",\n \"options\": {}\n }\n ],\n \"type\": \"stat\",\n \"version\": \"3.0.0\"\n },\n {\n \"custom\": {\n \"calc\": \"avg\",\n \"colSpan\": 1,\n \"colorMode\": \"value\",\n \"graphMode\": \"none\",\n \"textMode\": \"value\",\n \"textSize\": {},\n \"valueField\": \"Value\"\n },\n \"datasourceCate\": \"prometheus\",\n \"datasourceValue\": \"${DS_PROMETHEUS}\",\n \"description\": \"\",\n \"id\": \"136b9b07-6979-4402-89da-3a79ab8dc732\",\n \"layout\": {\n \"h\": 2,\n \"i\": \"136b9b07-6979-4402-89da-3a79ab8dc732\",\n \"isResizable\": true,\n \"w\": 3,\n \"x\": 3,\n \"y\": 8\n },\n \"links\": [],\n \"maxPerRow\": 4,\n \"name\": \"Total Offline Disks\",\n \"options\": {\n \"standardOptions\": {\n \"util\": \"none\"\n },\n \"thresholds\": {\n \"steps\": [\n {\n \"color\": \"#73BF69\",\n \"type\": \"base\",\n \"value\": null\n },\n {\n \"color\": \"#F2495C\",\n \"value\": 80\n }\n ]\n },\n \"valueMappings\": [\n {\n \"options\": {\n \"match\": \"null\",\n \"result\": {\n \"text\": \"N/A\"\n }\n },\n \"type\": \"special\"\n }\n ]\n },\n \"targets\": [\n {\n \"expr\": \"minio_cluster_disk_offline_total{job=\\\"$scrape_jobs\\\"}\",\n \"legend\": \"\",\n \"refId\": \"A\"\n }\n ],\n \"transformations\": [\n {\n \"id\": \"organize\",\n \"options\": {}\n }\n ],\n \"type\": \"stat\",\n \"version\": \"3.0.0\"\n },\n {\n \"custom\": {\n \"calc\": \"lastNotNull\",\n \"colorMode\": \"value\",\n \"textMode\": \"value\",\n \"version\": \"3.0.0\"\n },\n \"datasourceCate\": \"prometheus\",\n \"datasourceValue\": \"${DS_PROMETHEUS}\",\n \"id\": \"4072f862-84d1-4563-b4cc-7e2219a1da8c\",\n \"layout\": {\n \"h\": 3,\n \"i\": \"4072f862-84d1-4563-b4cc-7e2219a1da8c\",\n \"isResizable\": true,\n \"w\": 3,\n \"x\": 6,\n \"y\": 9\n },\n \"links\": [],\n \"maxPerRow\": 4,\n \"name\": \"Number of Objects\",\n \"options\": {\n \"legend\": {\n \"displayMode\": \"list\"\n },\n \"standardOptions\": {\n \"util\": \"none\"\n },\n \"thresholds\": {\n \"mode\": \"absolute\",\n \"steps\": [\n {\n \"color\": \"#73BF69\",\n \"type\": \"base\",\n \"value\": null\n },\n {\n \"color\": \"#E0B400\",\n \"value\": 75000000\n },\n {\n \"color\": \"#C4162A\",\n \"value\": 100000000\n }\n ],\n \"style\": \"line\"\n },\n \"tooltip\": {\n \"mode\": \"multi\"\n },\n \"valueMappings\": [\n {\n \"options\": {\n \"match\": \"null\",\n \"result\": {\n \"text\": \"N/A\"\n }\n },\n \"type\": \"special\"\n }\n ]\n },\n \"targets\": [\n {\n \"expr\": \"topk(1, sum(minio_bucket_usage_object_total{job=\\\"$scrape_jobs\\\"}) by (instance))\",\n \"legend\": \"\",\n \"refId\": \"A\"\n }\n ],\n \"type\": \"stat\",\n \"version\": \"3.0.0\"\n },\n {\n \"custom\": {\n \"calc\": \"last\",\n \"colSpan\": 1,\n \"colorMode\": \"value\",\n \"graphMode\": \"none\",\n \"textMode\": \"value\",\n \"textSize\": {},\n \"valueField\": \"Value\"\n },\n \"datasourceCate\": \"prometheus\",\n \"datasourceValue\": \"${DS_PROMETHEUS}\",\n \"description\": \"\",\n \"id\": \"9151721f-21e1-49ab-9a95-896fb364d9d2\",\n \"layout\": {\n \"h\": 2,\n \"i\": \"9151721f-21e1-49ab-9a95-896fb364d9d2\",\n \"isResizable\": true,\n \"w\": 3,\n \"x\": 0,\n \"y\": 10\n },\n \"links\": [],\n \"maxPerRow\": 4,\n \"name\": \"Time Since Last Heal Activity\",\n \"options\": {\n \"standardOptions\": {\n \"util\": \"none\"\n },\n \"thresholds\": {\n \"steps\": [\n {\n \"color\": \"#73BF69\",\n \"type\": \"base\",\n \"value\": null\n }\n ]\n },\n \"valueMappings\": []\n },\n \"targets\": [\n {\n \"expr\": \"minio_heal_time_last_activity_nano_seconds{job=\\\"$scrape_jobs\\\"}\",\n \"legend\": \"{{server}}\",\n \"refId\": \"A\"\n }\n ],\n \"transformations\": [\n {\n \"id\": \"organize\",\n \"options\": {}\n }\n ],\n \"type\": \"stat\",\n \"version\": \"3.0.0\"\n },\n {\n \"custom\": {\n \"calc\": \"last\",\n \"colSpan\": 1,\n \"colorMode\": \"value\",\n \"graphMode\": \"none\",\n \"textMode\": \"value\",\n \"textSize\": {},\n \"valueField\": \"Value\"\n },\n \"datasourceCate\": \"prometheus\",\n \"datasourceValue\": \"${DS_PROMETHEUS}\",\n \"description\": \"\",\n \"id\": \"fc40c036-86fc-42c7-9cc6-384c64c0814c\",\n \"layout\": {\n \"h\": 2,\n \"i\": \"fc40c036-86fc-42c7-9cc6-384c64c0814c\",\n \"isResizable\": true,\n \"w\": 3,\n \"x\": 3,\n \"y\": 10\n },\n \"links\": [],\n \"maxPerRow\": 4,\n \"name\": \"Time Since Last Scan Activity\",\n \"options\": {\n \"standardOptions\": {\n \"util\": \"none\"\n },\n \"thresholds\": {\n \"steps\": [\n {\n \"color\": \"#73BF69\",\n \"type\": \"base\",\n \"value\": null\n }\n ]\n },\n \"valueMappings\": []\n },\n \"targets\": [\n {\n \"expr\": \"minio_usage_last_activity_nano_seconds{job=\\\"$scrape_jobs\\\"}\",\n \"legend\": \"{{server}}\",\n \"refId\": \"A\"\n }\n ],\n \"transformations\": [\n {\n \"id\": \"organize\",\n \"options\": {}\n }\n ],\n \"type\": \"stat\",\n \"version\": \"3.0.0\"\n },\n {\n \"custom\": {\n \"drawStyle\": \"lines\",\n \"fillOpacity\": 0.3,\n \"gradientMode\": \"opacity\",\n \"lineInterpolation\": \"linear\",\n \"lineWidth\": 2,\n \"stack\": \"off\",\n \"version\": \"3.0.0\"\n },\n \"datasourceCate\": \"prometheus\",\n \"datasourceValue\": \"${DS_PROMETHEUS}\",\n \"id\": \"b5fe1dc4-833e-4e53-a2cb-98e7ecb8ea7b\",\n \"layout\": {\n \"h\": 10,\n \"i\": \"b5fe1dc4-833e-4e53-a2cb-98e7ecb8ea7b\",\n \"isResizable\": true,\n \"w\": 12,\n \"x\": 0,\n \"y\": 12\n },\n \"links\": [],\n \"maxPerRow\": 4,\n \"name\": \"S3 API Request Rate\",\n \"options\": {\n \"legend\": {\n \"displayMode\": \"hidden\"\n },\n \"thresholds\": {\n \"steps\": [\n {\n \"color\": \"#634CD9\",\n \"type\": \"base\",\n \"value\": null\n }\n ]\n },\n \"tooltip\": {\n \"mode\": \"all\",\n \"sort\": \"none\"\n }\n },\n \"targets\": [\n {\n \"expr\": \"sum by (server,api) (increase(minio_s3_requests_total{job=\\\"$scrape_jobs\\\"}[5m]))\",\n \"legend\": \"{{server,api}}\",\n \"refId\": \"A\"\n }\n ],\n \"type\": \"timeseries\",\n \"version\": \"3.0.0\"\n },\n {\n \"custom\": {\n \"drawStyle\": \"lines\",\n \"fillOpacity\": 0.05,\n \"lineInterpolation\": \"smooth\",\n \"stack\": \"off\",\n \"version\": \"3.0.0\"\n },\n \"datasourceCate\": \"prometheus\",\n \"datasourceValue\": \"${DS_PROMETHEUS}\",\n \"description\": \"Total s3 bytes received per bucket\",\n \"id\": \"761f532d-a867-4c56-8231-6d2ea2f82522\",\n \"layout\": {\n \"h\": 10,\n \"i\": \"761f532d-a867-4c56-8231-6d2ea2f82522\",\n \"isResizable\": true,\n \"w\": 12,\n \"x\": 12,\n \"y\": 12\n },\n \"links\": [],\n \"maxPerRow\": 4,\n \"name\": \"Bucket Traffic Received\",\n \"options\": {\n \"legend\": {\n \"displayMode\": \"list\",\n \"placement\": \"right\"\n },\n \"standardOptions\": {\n \"util\": \"bytesSI\"\n },\n \"thresholds\": {\n \"mode\": \"absolute\",\n \"steps\": [\n {\n \"color\": \"#73BF69\",\n \"type\": \"base\",\n \"value\": null\n },\n {\n \"color\": \"#F2495C\",\n \"value\": 80\n }\n ],\n \"style\": \"off\"\n },\n \"tooltip\": {\n \"mode\": \"multi\"\n },\n \"valueMappings\": []\n },\n \"targets\": [\n {\n \"expr\": \"sum by(bucket) (minio_bucket_traffic_received_bytes{job=\\\"$scrape_jobs\\\"})\",\n \"legend\": \"__auto\",\n \"refId\": \"A\"\n }\n ],\n \"type\": \"timeseries\",\n \"version\": \"3.0.0\"\n },\n {\n \"custom\": {\n \"drawStyle\": \"lines\",\n \"fillOpacity\": 0.05,\n \"lineInterpolation\": \"smooth\",\n \"stack\": \"off\",\n \"version\": \"3.0.0\"\n },\n \"datasourceCate\": \"prometheus\",\n \"datasourceValue\": \"${DS_PROMETHEUS}\",\n \"description\": \"Total s3 bytes sent per bucket\",\n \"id\": \"842bc922-c7c3-4c57-a126-4328d53ee703\",\n \"layout\": {\n \"h\": 10,\n \"i\": \"842bc922-c7c3-4c57-a126-4328d53ee703\",\n \"isResizable\": true,\n \"w\": 12,\n \"x\": 0,\n \"y\": 22\n },\n \"links\": [],\n \"maxPerRow\": 4,\n \"name\": \"Bucket Traffic Sent\",\n \"options\": {\n \"legend\": {\n \"displayMode\": \"list\",\n \"placement\": \"right\"\n },\n \"standardOptions\": {\n \"util\": \"bytesSI\"\n },\n \"thresholds\": {\n \"mode\": \"absolute\",\n \"steps\": [\n {\n \"color\": \"#73BF69\",\n \"type\": \"base\",\n \"value\": null\n },\n {\n \"color\": \"#F2495C\",\n \"value\": 80\n }\n ],\n \"style\": \"off\"\n },\n \"tooltip\": {\n \"mode\": \"multi\"\n },\n \"valueMappings\": []\n },\n \"targets\": [\n {\n \"expr\": \"sum by(bucket) (minio_bucket_traffic_sent_bytes{job=\\\"$scrape_jobs\\\"})\",\n \"legend\": \"__auto\",\n \"refId\": \"A\"\n }\n ],\n \"type\": \"timeseries\",\n \"version\": \"3.0.0\"\n },\n {\n \"custom\": {\n \"drawStyle\": \"lines\",\n \"fillOpacity\": 0.3,\n \"gradientMode\": \"opacity\",\n \"lineInterpolation\": \"linear\",\n \"lineWidth\": 2,\n \"stack\": \"off\",\n \"version\": \"3.0.0\"\n },\n \"datasourceCate\": \"prometheus\",\n \"datasourceValue\": \"${DS_PROMETHEUS}\",\n \"id\": \"59fedaf1-cfab-49a5-80ce-c789fc05cfc0\",\n \"layout\": {\n \"h\": 10,\n \"i\": \"59fedaf1-cfab-49a5-80ce-c789fc05cfc0\",\n \"isResizable\": true,\n \"w\": 12,\n \"x\": 12,\n \"y\": 22\n },\n \"links\": [],\n \"maxPerRow\": 4,\n \"name\": \"S3 API Request 4xx Error Rate\",\n \"options\": {\n \"legend\": {\n \"displayMode\": \"hidden\"\n },\n \"thresholds\": {\n \"steps\": [\n {\n \"color\": \"#634CD9\",\n \"type\": \"base\",\n \"value\": null\n }\n ]\n },\n \"tooltip\": {\n \"mode\": \"all\",\n \"sort\": \"none\"\n }\n },\n \"targets\": [\n {\n \"expr\": \"sum by (server,api) (increase(minio_s3_requests_4xx_errors_total{job=\\\"$scrape_jobs\\\"}[5m]))\",\n \"legend\": \"{{server,api}}\",\n \"refId\": \"A\"\n }\n ],\n \"type\": \"timeseries\",\n \"version\": \"3.0.0\"\n },\n {\n \"custom\": {\n \"drawStyle\": \"lines\",\n \"fillOpacity\": 0.3,\n \"gradientMode\": \"opacity\",\n \"lineInterpolation\": \"linear\",\n \"lineWidth\": 2,\n \"stack\": \"off\",\n \"version\": \"3.0.0\"\n },\n \"datasourceCate\": \"prometheus\",\n \"datasourceValue\": \"${DS_PROMETHEUS}\",\n \"id\": \"7be6161e-0202-48a5-8c44-ea6d92b6046e\",\n \"layout\": {\n \"h\": 10,\n \"i\": \"7be6161e-0202-48a5-8c44-ea6d92b6046e\",\n \"isResizable\": true,\n \"w\": 12,\n \"x\": 0,\n \"y\": 32\n },\n \"links\": [],\n \"maxPerRow\": 4,\n \"name\": \"S3 API Request 5xx Error Rate\",\n \"options\": {\n \"legend\": {\n \"displayMode\": \"hidden\"\n },\n \"thresholds\": {\n \"steps\": [\n {\n \"color\": \"#634CD9\",\n \"type\": \"base\",\n \"value\": null\n }\n ]\n },\n \"tooltip\": {\n \"mode\": \"all\",\n \"sort\": \"none\"\n }\n },\n \"targets\": [\n {\n \"expr\": \"sum by (server,api) (increase(minio_s3_requests_5xx_errors_total{job=\\\"$scrape_jobs\\\"}[5m]))\",\n \"legend\": \"{{server,api}}\",\n \"refId\": \"A\"\n }\n ],\n \"type\": \"timeseries\",\n \"version\": \"3.0.0\"\n },\n {\n \"custom\": {\n \"drawStyle\": \"lines\",\n \"fillOpacity\": 0.3,\n \"gradientMode\": \"opacity\",\n \"lineInterpolation\": \"linear\",\n \"lineWidth\": 2,\n \"stack\": \"off\",\n \"version\": \"3.0.0\"\n },\n \"datasourceCate\": \"prometheus\",\n \"datasourceValue\": \"${DS_PROMETHEUS}\",\n \"id\": \"26ccd336-ccbd-4f84-a79e-aac8fc645295\",\n \"layout\": {\n \"h\": 10,\n \"i\": \"26ccd336-ccbd-4f84-a79e-aac8fc645295\",\n \"isResizable\": true,\n \"w\": 12,\n \"x\": 12,\n \"y\": 32\n },\n \"links\": [],\n \"maxPerRow\": 4,\n \"name\": \"Healing\",\n \"options\": {\n \"legend\": {\n \"displayMode\": \"hidden\"\n },\n \"thresholds\": {\n \"steps\": [\n {\n \"color\": \"#634CD9\",\n \"type\": \"base\",\n \"value\": null\n }\n ]\n },\n \"tooltip\": {\n \"mode\": \"all\",\n \"sort\": \"none\"\n }\n },\n \"targets\": [\n {\n \"expr\": \"sum by (instance) (minio_heal_objects_heal_total{job=\\\"$scrape_jobs\\\"})\",\n \"legend\": \"Objects healed in current self heal run\",\n \"refId\": \"A\"\n },\n {\n \"expr\": \"sum by (instance) (minio_heal_objects_error_total{job=\\\"$scrape_jobs\\\"})\",\n \"legend\": \"Heal errors in current self heal run\",\n \"refId\": \"B\"\n },\n {\n \"expr\": \"sum by (instance) (minio_heal_objects_total{job=\\\"$scrape_jobs\\\"}) \",\n \"legend\": \"Objects scanned in current self heal run\",\n \"refId\": \"C\"\n }\n ],\n \"type\": \"timeseries\",\n \"version\": \"3.0.0\"\n },\n {\n \"custom\": {\n \"drawStyle\": \"lines\",\n \"fillOpacity\": 0.3,\n \"gradientMode\": \"opacity\",\n \"lineInterpolation\": \"linear\",\n \"lineWidth\": 2,\n \"stack\": \"off\",\n \"version\": \"3.0.0\"\n },\n \"datasourceCate\": \"prometheus\",\n \"datasourceValue\": \"${DS_PROMETHEUS}\",\n \"description\": \"Total number of bytes received and sent among all MinIO server instances\",\n \"id\": \"4ded094e-a71a-4104-80c6-eeb8770abf21\",\n \"layout\": {\n \"h\": 9,\n \"i\": \"4ded094e-a71a-4104-80c6-eeb8770abf21\",\n \"isResizable\": true,\n \"w\": 12,\n \"x\": 0,\n \"y\": 42\n },\n \"links\": [],\n \"maxPerRow\": 4,\n \"name\": \"Internode Data Transfer\",\n \"options\": {\n \"legend\": {\n \"displayMode\": \"hidden\"\n },\n \"thresholds\": {\n \"steps\": [\n {\n \"color\": \"#634CD9\",\n \"type\": \"base\",\n \"value\": null\n }\n ]\n },\n \"tooltip\": {\n \"mode\": \"all\",\n \"sort\": \"none\"\n }\n },\n \"targets\": [\n {\n \"expr\": \"rate(minio_inter_node_traffic_sent_bytes{job=\\\"$scrape_jobs\\\"}[5m])\",\n \"legend\": \"Internode Bytes Received [{{server}}]\",\n \"refId\": \"A\"\n },\n {\n \"expr\": \"rate(minio_inter_node_traffic_received_bytes{job=\\\"$scrape_jobs\\\"}[5m])\",\n \"legend\": \"Internode Bytes Sent [{{server}}]\",\n \"refId\": \"B\"\n }\n ],\n \"type\": \"timeseries\",\n \"version\": \"3.0.0\"\n },\n {\n \"custom\": {\n \"drawStyle\": \"lines\",\n \"fillOpacity\": 0.3,\n \"gradientMode\": \"opacity\",\n \"lineInterpolation\": \"linear\",\n \"lineWidth\": 2,\n \"stack\": \"off\",\n \"version\": \"3.0.0\"\n },\n \"datasourceCate\": \"prometheus\",\n \"datasourceValue\": \"${DS_PROMETHEUS}\",\n \"id\": \"e0994406-de33-4de1-9722-dcee647c2f68\",\n \"layout\": {\n \"h\": 9,\n \"i\": \"e0994406-de33-4de1-9722-dcee647c2f68\",\n \"isResizable\": true,\n \"w\": 12,\n \"x\": 12,\n \"y\": 42\n },\n \"links\": [],\n \"maxPerRow\": 4,\n \"name\": \"Node Memory Usage\",\n \"options\": {\n \"legend\": {\n \"displayMode\": \"hidden\"\n },\n \"thresholds\": {\n \"steps\": [\n {\n \"color\": \"#634CD9\",\n \"type\": \"base\",\n \"value\": null\n }\n ]\n },\n \"tooltip\": {\n \"mode\": \"all\",\n \"sort\": \"none\"\n }\n },\n \"targets\": [\n {\n \"expr\": \"minio_node_process_resident_memory_bytes{job=\\\"$scrape_jobs\\\"}\",\n \"legend\": \"Memory Used [{{server}}]\",\n \"refId\": \"A\"\n }\n ],\n \"type\": \"timeseries\",\n \"version\": \"3.0.0\"\n },\n {\n \"custom\": {\n \"drawStyle\": \"lines\",\n \"fillOpacity\": 0.3,\n \"gradientMode\": \"opacity\",\n \"lineInterpolation\": \"linear\",\n \"lineWidth\": 2,\n \"stack\": \"off\",\n \"version\": \"3.0.0\"\n },\n \"datasourceCate\": \"prometheus\",\n \"datasourceValue\": \"${DS_PROMETHEUS}\",\n \"id\": \"fc925e24-3be5-453a-85a0-f281ad60994e\",\n \"layout\": {\n \"h\": 9,\n \"i\": \"fc925e24-3be5-453a-85a0-f281ad60994e\",\n \"isResizable\": true,\n \"w\": 12,\n \"x\": 0,\n \"y\": 51\n },\n \"links\": [],\n \"maxPerRow\": 4,\n \"name\": \"Node CPU Usage\",\n \"options\": {\n \"legend\": {\n \"displayMode\": \"hidden\"\n },\n \"thresholds\": {\n \"steps\": [\n {\n \"color\": \"#634CD9\",\n \"type\": \"base\",\n \"value\": null\n }\n ]\n },\n \"tooltip\": {\n \"mode\": \"all\",\n \"sort\": \"none\"\n }\n },\n \"targets\": [\n {\n \"expr\": \"rate(minio_node_process_cpu_total_seconds{job=\\\"$scrape_jobs\\\"}[5m])\",\n \"legend\": \"CPU Usage Rate [{{server}}]\",\n \"refId\": \"A\"\n }\n ],\n \"type\": \"timeseries\",\n \"version\": \"3.0.0\"\n },\n {\n \"custom\": {\n \"drawStyle\": \"lines\",\n \"fillOpacity\": 0.3,\n \"gradientMode\": \"opacity\",\n \"lineInterpolation\": \"linear\",\n \"lineWidth\": 2,\n \"stack\": \"off\",\n \"version\": \"3.0.0\"\n },\n \"datasourceCate\": \"prometheus\",\n \"datasourceValue\": \"${DS_PROMETHEUS}\",\n \"id\": \"54c9c962-e93e-4429-a376-eda862b2777a\",\n \"layout\": {\n \"h\": 9,\n \"i\": \"54c9c962-e93e-4429-a376-eda862b2777a\",\n \"isResizable\": true,\n \"w\": 12,\n \"x\": 12,\n \"y\": 51\n },\n \"links\": [],\n \"maxPerRow\": 4,\n \"name\": \"Drives Free Inodes\",\n \"options\": {\n \"legend\": {\n \"displayMode\": \"hidden\"\n },\n \"thresholds\": {\n \"steps\": [\n {\n \"color\": \"#634CD9\",\n \"type\": \"base\",\n \"value\": null\n }\n ]\n },\n \"tooltip\": {\n \"mode\": \"all\",\n \"sort\": \"none\"\n }\n },\n \"targets\": [\n {\n \"expr\": \"minio_node_disk_free_inodes{job=\\\"$scrape_jobs\\\"}\",\n \"legend\": \"Free Inodes [{{server}}:{{disk}}]\",\n \"refId\": \"A\"\n }\n ],\n \"type\": \"timeseries\",\n \"version\": \"3.0.0\"\n },\n {\n \"custom\": {\n \"drawStyle\": \"lines\",\n \"fillOpacity\": 0.3,\n \"gradientMode\": \"opacity\",\n \"lineInterpolation\": \"linear\",\n \"lineWidth\": 2,\n \"stack\": \"off\",\n \"version\": \"3.0.0\"\n },\n \"datasourceCate\": \"prometheus\",\n \"datasourceValue\": \"${DS_PROMETHEUS}\",\n \"id\": \"252d4c7b-c38a-4e08-8888-83408e31082c\",\n \"layout\": {\n \"h\": 8,\n \"i\": \"252d4c7b-c38a-4e08-8888-83408e31082c\",\n \"isResizable\": true,\n \"w\": 12,\n \"x\": 0,\n \"y\": 60\n },\n \"links\": [],\n \"maxPerRow\": 4,\n \"name\": \"Drive Used Capacity\",\n \"options\": {\n \"legend\": {\n \"displayMode\": \"hidden\"\n },\n \"thresholds\": {\n \"steps\": [\n {\n \"color\": \"#634CD9\",\n \"type\": \"base\",\n \"value\": null\n }\n ]\n },\n \"tooltip\": {\n \"mode\": \"all\",\n \"sort\": \"none\"\n }\n },\n \"targets\": [\n {\n \"expr\": \"minio_node_disk_used_bytes{job=\\\"$scrape_jobs\\\"}\",\n \"legend\": \"Used Capacity [{{server}}:{{disk}}]\",\n \"refId\": \"A\"\n }\n ],\n \"type\": \"timeseries\",\n \"version\": \"3.0.0\"\n },\n {\n \"custom\": {\n \"drawStyle\": \"lines\",\n \"fillOpacity\": 0.3,\n \"gradientMode\": \"opacity\",\n \"lineInterpolation\": \"linear\",\n \"lineWidth\": 2,\n \"stack\": \"off\",\n \"version\": \"3.0.0\"\n },\n \"datasourceCate\": \"prometheus\",\n \"datasourceValue\": \"${DS_PROMETHEUS}\",\n \"description\": \"\",\n \"id\": \"867a88e9-5317-4a97-9e06-efba95eda8fb\",\n \"layout\": {\n \"h\": 9,\n \"i\": \"867a88e9-5317-4a97-9e06-efba95eda8fb\",\n \"isResizable\": true,\n \"w\": 12,\n \"x\": 12,\n \"y\": 60\n },\n \"links\": [],\n \"maxPerRow\": 4,\n \"name\": \"Node File Descriptors\",\n \"options\": {\n \"legend\": {\n \"displayMode\": \"hidden\"\n },\n \"thresholds\": {\n \"steps\": [\n {\n \"color\": \"#634CD9\",\n \"type\": \"base\",\n \"value\": null\n }\n ]\n },\n \"tooltip\": {\n \"mode\": \"all\",\n \"sort\": \"none\"\n }\n },\n \"targets\": [\n {\n \"expr\": \"minio_node_file_descriptor_open_total{job=\\\"$scrape_jobs\\\"}\",\n \"legend\": \"Open FDs [{{server}}]\",\n \"refId\": \"B\"\n }\n ],\n \"type\": \"timeseries\",\n \"version\": \"3.0.0\"\n },\n {\n \"custom\": {\n \"drawStyle\": \"lines\",\n \"fillOpacity\": 0.3,\n \"gradientMode\": \"opacity\",\n \"lineInterpolation\": \"linear\",\n \"lineWidth\": 2,\n \"stack\": \"off\",\n \"version\": \"3.0.0\"\n },\n \"datasourceCate\": \"prometheus\",\n \"datasourceValue\": \"${DS_PROMETHEUS}\",\n \"description\": \"Number of online disks per MinIO Server\",\n \"id\": \"fc600570-ff7a-46b9-8cc8-1dc78fd81fa0\",\n \"layout\": {\n \"h\": 9,\n \"i\": \"fc600570-ff7a-46b9-8cc8-1dc78fd81fa0\",\n \"isResizable\": true,\n \"w\": 12,\n \"x\": 0,\n \"y\": 68\n },\n \"links\": [],\n \"maxPerRow\": 4,\n \"name\": \"Node Syscalls\",\n \"options\": {\n \"legend\": {\n \"displayMode\": \"hidden\"\n },\n \"thresholds\": {\n \"steps\": [\n {\n \"color\": \"#634CD9\",\n \"type\": \"base\",\n \"value\": null\n }\n ]\n },\n \"tooltip\": {\n \"mode\": \"all\",\n \"sort\": \"none\"\n }\n },\n \"targets\": [\n {\n \"expr\": \"rate(minio_node_syscall_read_total{job=\\\"$scrape_jobs\\\"}[5m])\",\n \"legend\": \"Read Syscalls [{{server}}]\",\n \"refId\": \"A\"\n },\n {\n \"expr\": \"rate(minio_node_syscall_write_total{job=\\\"$scrape_jobs\\\"}[5m])\",\n \"legend\": \"Write Syscalls [{{server}}]\",\n \"refId\": \"B\"\n }\n ],\n \"type\": \"timeseries\",\n \"version\": \"3.0.0\"\n },\n {\n \"custom\": {\n \"drawStyle\": \"lines\",\n \"fillOpacity\": 0.3,\n \"gradientMode\": \"opacity\",\n \"lineInterpolation\": \"linear\",\n \"lineWidth\": 2,\n \"stack\": \"off\",\n \"version\": \"3.0.0\"\n },\n \"datasourceCate\": \"prometheus\",\n \"datasourceValue\": \"${DS_PROMETHEUS}\",\n \"id\": \"83dcd281-30f8-4e36-805f-0f594a7816c2\",\n \"layout\": {\n \"h\": 8,\n \"i\": \"83dcd281-30f8-4e36-805f-0f594a7816c2\",\n \"isResizable\": true,\n \"w\": 12,\n \"x\": 12,\n \"y\": 69\n },\n \"links\": [],\n \"maxPerRow\": 4,\n \"name\": \"Node IO\",\n \"options\": {\n \"legend\": {\n \"displayMode\": \"hidden\"\n },\n \"thresholds\": {\n \"steps\": [\n {\n \"color\": \"#634CD9\",\n \"type\": \"base\",\n \"value\": null\n }\n ]\n },\n \"tooltip\": {\n \"mode\": \"all\",\n \"sort\": \"none\"\n }\n },\n \"targets\": [\n {\n \"expr\": \"rate(minio_node_io_rchar_bytes{job=\\\"$scrape_jobs\\\"}[5m])\",\n \"legend\": \"Node RChar [{{server}}]\",\n \"refId\": \"A\"\n },\n {\n \"expr\": \"rate(minio_node_io_wchar_bytes{job=\\\"$scrape_jobs\\\"}[5m])\",\n \"legend\": \"Node WChar [{{server}}]\",\n \"refId\": \"B\"\n }\n ],\n \"type\": \"timeseries\",\n \"version\": \"3.0.0\"\n }\n ],\n \"var\": [\n {\n \"definition\": \"prometheus\",\n \"name\": \"DS_PROMETHEUS\",\n \"type\": \"datasource\"\n },\n {\n \"allOption\": true,\n \"datasource\": {\n \"cate\": \"prometheus\",\n \"value\": \"${DS_PROMETHEUS}\"\n },\n \"definition\": \"label_values(minio_node_process_starttime_seconds,job)\",\n \"multi\": true,\n \"name\": \"scrape_jobs\",\n \"reg\": \"\",\n \"type\": \"query\"\n }\n ],\n \"version\": \"3.0.0\"\n },\n \"public\": 0,\n \"public_cate\": 0,\n \"bgids\": null,\n \"built_in\": 0,\n \"hide\": 0,\n \"uuid\": 1717556328049983000\n}"
},
{
"path": "integrations/MinIO/dashboards/new-version.json",
"content": "{\n \"name\": \"MinIO Dashboard New Version\",\n \"tags\": \"\",\n \"ident\": \"\",\n \"uuid\": 1755762763066000,\n \"configs\": {\n \"links\": [],\n \"panels\": [\n {\n \"custom\": {\n \"calc\": \"lastNotNull\",\n \"textMode\": \"valueAndName\"\n },\n \"datasourceCate\": \"prometheus\",\n \"datasourceValue\": \"${DS_PROMETHEUS}\",\n \"description\": \"\",\n \"id\": \"134b5e6d-63aa-4a43-ae26-13177c3d5184\",\n \"layout\": {\n \"h\": 6,\n \"i\": \"134b5e6d-63aa-4a43-ae26-13177c3d5184\",\n \"isResizable\": true,\n \"w\": 3,\n \"x\": 0,\n \"y\": 0\n },\n \"links\": [],\n \"maxPerRow\": 4,\n \"name\": \"Uptime\",\n \"options\": {\n \"standardOptions\": {\n \"decimals\": 0,\n \"util\": \"seconds\"\n },\n \"thresholds\": {\n \"steps\": [\n {\n \"color\": \"#3FC453\",\n \"type\": \"base\",\n \"value\": null\n }\n ]\n }\n },\n \"targets\": [\n {\n \"expr\": \"time() - max(minio_node_process_starttime_seconds{job=\\\"$scrape_jobs\\\"})\",\n \"legend\": \"{{job}}\",\n \"refId\": \"A\"\n }\n ],\n \"transformations\": [\n {\n \"id\": \"organize\",\n \"options\": {}\n }\n ],\n \"type\": \"gauge\",\n \"version\": \"3.0.0\"\n },\n {\n \"custom\": {\n \"calc\": \"last\",\n \"colSpan\": 1,\n \"colorMode\": \"value\",\n \"graphMode\": \"none\",\n \"textMode\": \"value\",\n \"textSize\": {},\n \"valueField\": \"Value\"\n },\n \"datasourceCate\": \"prometheus\",\n \"datasourceValue\": \"${DS_PROMETHEUS}\",\n \"description\": \"\",\n \"id\": \"ca68e795-0a81-4c24-8e55-e754e0283b70\",\n \"layout\": {\n \"h\": 3,\n \"i\": \"ca68e795-0a81-4c24-8e55-e754e0283b70\",\n \"isResizable\": true,\n \"w\": 3,\n \"x\": 3,\n \"y\": 0\n },\n \"links\": [],\n \"maxPerRow\": 4,\n \"name\": \"Total S3 Traffic Inbound\",\n \"options\": {\n \"standardOptions\": {\n \"util\": \"bytesIEC\"\n },\n \"thresholds\": {\n \"steps\": [\n {\n \"color\": \"#73BF69\",\n \"type\": \"base\",\n \"value\": null\n }\n ]\n },\n \"valueMappings\": [\n {\n \"options\": {\n \"match\": \"null\",\n \"result\": {\n \"text\": \"N/A\"\n }\n },\n \"type\": \"special\"\n }\n ]\n },\n \"targets\": [\n {\n \"expr\": \"sum by (instance) (minio_s3_traffic_received_bytes{job=\\\"$scrape_jobs\\\"})\",\n \"legend\": \"{{instance}}\",\n \"refId\": \"A\"\n }\n ],\n \"transformations\": [\n {\n \"id\": \"organize\",\n \"options\": {}\n }\n ],\n \"type\": \"stat\",\n \"version\": \"3.0.0\"\n },\n {\n \"custom\": {\n \"calc\": \"lastNotNull\",\n \"detailName\": \"详情\",\n \"legengPosition\": \"hidden\"\n },\n \"datasourceCate\": \"prometheus\",\n \"datasourceValue\": \"${DS_PROMETHEUS}\",\n \"description\": \"\",\n \"id\": \"d356fc74-4fce-4764-aff9-bc5590c3753d\",\n \"layout\": {\n \"h\": 6,\n \"i\": \"d356fc74-4fce-4764-aff9-bc5590c3753d\",\n \"isResizable\": true,\n \"w\": 5,\n \"x\": 6,\n \"y\": 0\n },\n \"links\": [],\n \"maxPerRow\": 4,\n \"name\": \"Capacity\",\n \"options\": {\n \"standardOptions\": {\n \"util\": \"bytesIEC\"\n }\n },\n \"targets\": [\n {\n \"expr\": \"topk(1, sum(minio_cluster_capacity_usable_total_bytes{job=\\\"$scrape_jobs\\\"}) by (instance)) - topk(1, sum(minio_cluster_capacity_usable_free_bytes{job=\\\"$scrape_jobs\\\"}) by (instance))\",\n \"legend\": \"Used\",\n \"refId\": \"A\"\n },\n {\n \"expr\": \"topk(1, sum(minio_cluster_capacity_usable_free_bytes{job=\\\"$scrape_jobs\\\"}) by (instance)) \",\n \"legend\": \"Free\",\n \"refId\": \"B\"\n }\n ],\n \"transformations\": [\n {\n \"id\": \"organize\",\n \"options\": {}\n }\n ],\n \"type\": \"pie\",\n \"version\": \"3.0.0\"\n },\n {\n \"custom\": {\n \"drawStyle\": \"lines\",\n \"fillOpacity\": 0.1,\n \"gradientMode\": \"none\",\n \"lineInterpolation\": \"linear\",\n \"lineWidth\": 1,\n \"scaleDistribution\": {\n \"type\": \"linear\"\n },\n \"spanNulls\": false,\n \"stack\": \"off\"\n },\n \"datasourceCate\": \"prometheus\",\n \"datasourceValue\": \"${DS_PROMETHEUS}\",\n \"id\": \"3b618c2c-1394-46f7-b3b2-578201444e30\",\n \"layout\": {\n \"h\": 6,\n \"i\": \"3b618c2c-1394-46f7-b3b2-578201444e30\",\n \"isResizable\": true,\n \"w\": 5,\n \"x\": 11,\n \"y\": 0\n },\n \"links\": [],\n \"maxPerRow\": 4,\n \"name\": \"Data Usage Growth\",\n \"options\": {\n \"legend\": {\n \"displayMode\": \"hidden\"\n },\n \"standardOptions\": {\n \"util\": \"bytesIEC\"\n },\n \"thresholds\": {\n \"steps\": [\n {\n \"color\": \"#73BF69\",\n \"type\": \"base\",\n \"value\": null\n },\n {\n \"color\": \"#F2495C\",\n \"value\": 80\n }\n ]\n },\n \"tooltip\": {\n \"mode\": \"multi\"\n }\n },\n \"targets\": [\n {\n \"expr\": \"max(sum(minio_bucket_usage_total_bytes{job=\\\"$scrape_jobs\\\"}) by (instance,server))\",\n \"legend\": \"Usage\",\n \"refId\": \"A\"\n }\n ],\n \"transformations\": [\n {\n \"id\": \"organize\",\n \"options\": {}\n }\n ],\n \"type\": \"timeseries\",\n \"version\": \"3.0.0\"\n },\n {\n \"custom\": {\n \"calc\": \"lastNotNull\",\n \"serieWidth\": 20,\n \"sortOrder\": \"desc\"\n },\n \"datasourceCate\": \"prometheus\",\n \"datasourceValue\": \"${DS_PROMETHEUS}\",\n \"id\": \"817686c6-499c-434b-8b9e-ffc7c3a21308\",\n \"layout\": {\n \"h\": 6,\n \"i\": \"817686c6-499c-434b-8b9e-ffc7c3a21308\",\n \"isResizable\": true,\n \"w\": 5,\n \"x\": 16,\n \"y\": 0\n },\n \"links\": [],\n \"maxPerRow\": 4,\n \"name\": \"Object size distribution\",\n \"options\": {\n \"standardOptions\": {\n \"util\": \"seconds\"\n },\n \"thresholds\": {\n \"mode\": \"absolute\",\n \"steps\": [\n {\n \"color\": \"#9470FF\",\n \"type\": \"base\",\n \"value\": null\n }\n ]\n }\n },\n \"targets\": [\n {\n \"expr\": \"max by (range) (sum (minio_bucket_objects_size_distribution{job=\\\"$scrape_jobs\\\"}) by (range))\",\n \"legend\": \"{{range}}\",\n \"refId\": \"A\"\n }\n ],\n \"transformations\": [\n {\n \"id\": \"organize\",\n \"options\": {}\n }\n ],\n \"type\": \"barGauge\",\n \"version\": \"3.0.0\"\n },\n {\n \"custom\": {\n \"calc\": \"last\",\n \"colSpan\": 1,\n \"colorMode\": \"value\",\n \"graphMode\": \"none\",\n \"textMode\": \"value\",\n \"textSize\": {},\n \"valueField\": \"Value\"\n },\n \"datasourceCate\": \"prometheus\",\n \"datasourceValue\": \"${DS_PROMETHEUS}\",\n \"description\": \"\",\n \"id\": \"855e0055-e418-464f-bc3e-04a8a5a1b1b3\",\n \"layout\": {\n \"h\": 3,\n \"i\": \"855e0055-e418-464f-bc3e-04a8a5a1b1b3\",\n \"isResizable\": true,\n \"w\": 3,\n \"x\": 21,\n \"y\": 0\n },\n \"links\": [],\n \"maxPerRow\": 4,\n \"name\": \"Total Open FDs\",\n \"options\": {\n \"standardOptions\": {\n \"util\": \"none\"\n },\n \"thresholds\": {\n \"steps\": [\n {\n \"color\": \"#73BF69\",\n \"type\": \"base\",\n \"value\": null\n },\n {\n \"color\": \"#F2495C\",\n \"value\": 2000\n }\n ]\n },\n \"valueMappings\": [\n {\n \"options\": {\n \"match\": \"null\",\n \"result\": {\n \"text\": \"N/A\"\n }\n },\n \"type\": \"special\"\n }\n ]\n },\n \"targets\": [\n {\n \"expr\": \"sum (minio_node_file_descriptor_open_total{job=\\\"$scrape_jobs\\\"})\",\n \"legend\": \"\",\n \"refId\": \"A\"\n }\n ],\n \"transformations\": [\n {\n \"id\": \"organize\",\n \"options\": {}\n }\n ],\n \"type\": \"stat\",\n \"version\": \"3.0.0\"\n },\n {\n \"custom\": {\n \"calc\": \"last\",\n \"colSpan\": 1,\n \"colorMode\": \"value\",\n \"graphMode\": \"none\",\n \"textMode\": \"value\",\n \"textSize\": {},\n \"valueField\": \"Value\"\n },\n \"datasourceCate\": \"prometheus\",\n \"datasourceValue\": \"${DS_PROMETHEUS}\",\n \"description\": \"\",\n \"id\": \"2cc7d5ac-1508-4067-91a5-1b08c4339f7f\",\n \"layout\": {\n \"h\": 3,\n \"i\": \"2cc7d5ac-1508-4067-91a5-1b08c4339f7f\",\n \"isResizable\": true,\n \"w\": 3,\n \"x\": 3,\n \"y\": 3\n },\n \"links\": [],\n \"maxPerRow\": 4,\n \"name\": \"Total S3 Traffic Outbound\",\n \"options\": {\n \"standardOptions\": {\n \"util\": \"bytesIEC\"\n },\n \"thresholds\": {\n \"steps\": [\n {\n \"color\": \"#73BF69\",\n \"type\": \"base\",\n \"value\": null\n }\n ]\n },\n \"valueMappings\": [\n {\n \"options\": {\n \"match\": \"null\",\n \"result\": {\n \"text\": \"N/A\"\n }\n },\n \"type\": \"special\"\n }\n ]\n },\n \"targets\": [\n {\n \"expr\": \"sum by (instance) (minio_s3_traffic_sent_bytes{job=\\\"$scrape_jobs\\\"})\",\n \"legend\": \"\",\n \"refId\": \"A\"\n }\n ],\n \"transformations\": [\n {\n \"id\": \"organize\",\n \"options\": {}\n }\n ],\n \"type\": \"stat\",\n \"version\": \"3.0.0\"\n },\n {\n \"custom\": {\n \"calc\": \"last\",\n \"colorMode\": \"value\",\n \"textMode\": \"value\",\n \"version\": \"3.0.0\"\n },\n \"datasourceCate\": \"prometheus\",\n \"datasourceValue\": \"${DS_PROMETHEUS}\",\n \"description\": \"\",\n \"id\": \"b7b7d005-b1b3-403e-8cfa-91c561972ef5\",\n \"layout\": {\n \"h\": 3,\n \"i\": \"b7b7d005-b1b3-403e-8cfa-91c561972ef5\",\n \"isResizable\": true,\n \"w\": 3,\n \"x\": 21,\n \"y\": 3\n },\n \"links\": [],\n \"maxPerRow\": 4,\n \"name\": \"Total Goroutines\",\n \"options\": {\n \"legend\": {\n \"displayMode\": \"list\"\n },\n \"standardOptions\": {\n \"util\": \"none\"\n },\n \"thresholds\": {\n \"mode\": \"absolute\",\n \"steps\": [\n {\n \"color\": \"#73BF69\",\n \"type\": \"base\",\n \"value\": null\n },\n {\n \"color\": \"#F2495C\",\n \"value\": 2000\n }\n ],\n \"style\": \"line\"\n },\n \"tooltip\": {\n \"mode\": \"multi\"\n },\n \"valueMappings\": [\n {\n \"options\": {\n \"match\": \"null\",\n \"result\": {\n \"text\": \"N/A\"\n }\n },\n \"type\": \"special\"\n }\n ]\n },\n \"targets\": [\n {\n \"expr\": \"sum without (server,instance) (minio_node_go_routine_total{job=\\\"$scrape_jobs\\\"})\",\n \"legend\": \"\",\n \"refId\": \"A\"\n }\n ],\n \"type\": \"stat\",\n \"version\": \"3.0.0\"\n },\n {\n \"custom\": {\n \"calc\": \"avg\",\n \"colSpan\": 1,\n \"colorMode\": \"value\",\n \"graphMode\": \"none\",\n \"textMode\": \"value\",\n \"textSize\": {},\n \"valueField\": \"Value\"\n },\n \"datasourceCate\": \"prometheus\",\n \"datasourceValue\": \"${DS_PROMETHEUS}\",\n \"description\": \"\",\n \"id\": \"0e22c724-2ae0-4700-a7e5-3f1243a3d896\",\n \"layout\": {\n \"h\": 2,\n \"i\": \"0e22c724-2ae0-4700-a7e5-3f1243a3d896\",\n \"isResizable\": true,\n \"w\": 3,\n \"x\": 0,\n \"y\": 6\n },\n \"links\": [],\n \"maxPerRow\": 4,\n \"name\": \"Total Online Servers\",\n \"options\": {\n \"standardOptions\": {\n \"util\": \"none\"\n },\n \"thresholds\": {\n \"steps\": [\n {\n \"color\": \"#73BF69\",\n \"type\": \"base\",\n \"value\": null\n }\n ]\n },\n \"valueMappings\": [\n {\n \"options\": {\n \"match\": \"null\",\n \"result\": {\n \"text\": \"N/A\"\n }\n },\n \"type\": \"special\"\n }\n ]\n },\n \"targets\": [\n {\n \"expr\": \"minio_cluster_nodes_online_total{job=\\\"$scrape_jobs\\\"}\",\n \"legend\": \"{{job}}\",\n \"refId\": \"A\"\n }\n ],\n \"transformations\": [\n {\n \"id\": \"organize\",\n \"options\": {}\n }\n ],\n \"type\": \"stat\",\n \"version\": \"3.0.0\"\n },\n {\n \"type\": \"stat\",\n \"id\": \"776ecb58-5daf-4d5c-9c5b-774f476de70b\",\n \"layout\": {\n \"h\": 2,\n \"i\": \"776ecb58-5daf-4d5c-9c5b-774f476de70b\",\n \"isResizable\": true,\n \"w\": 3,\n \"x\": 3,\n \"y\": 6\n },\n \"version\": \"3.1.0\",\n \"datasourceCate\": \"prometheus\",\n \"datasourceValue\": \"${DS_PROMETHEUS}\",\n \"targets\": [\n {\n \"expr\": \"minio_cluster_drive_online_total{job=\\\"$scrape_jobs\\\"}\",\n \"legend\": \"Total online drives in MinIO Cluster\",\n \"refId\": \"A\"\n }\n ],\n \"transformations\": [\n {\n \"id\": \"organize\",\n \"options\": {}\n }\n ],\n \"name\": \"Total Online Drives\",\n \"links\": [],\n \"description\": \"\",\n \"maxPerRow\": 4,\n \"custom\": {\n \"textMode\": \"value\",\n \"graphMode\": \"none\",\n \"colorMode\": \"value\",\n \"calc\": \"avg\",\n \"valueField\": \"Value\",\n \"colSpan\": 1,\n \"textSize\": {},\n \"orientation\": \"auto\"\n },\n \"options\": {\n \"thresholds\": {\n \"steps\": [\n {\n \"color\": \"#73BF69\",\n \"value\": null,\n \"type\": \"base\"\n },\n {\n \"color\": \"#F2495C\",\n \"value\": 80\n }\n ]\n },\n \"valueMappings\": [\n {\n \"options\": {\n \"match\": \"null\",\n \"result\": {\n \"text\": \"N/A\"\n }\n },\n \"type\": \"special\"\n }\n ],\n \"standardOptions\": {\n \"util\": \"none\"\n }\n },\n \"overrides\": [\n {\n \"matcher\": {\n \"id\": \"byFrameRefID\"\n },\n \"properties\": {\n \"thresholds\": {\n \"steps\": [\n {\n \"color\": \"#6C53B1\",\n \"value\": null,\n \"type\": \"base\"\n }\n ]\n }\n }\n }\n ]\n },\n {\n \"custom\": {\n \"calc\": \"lastNotNull\",\n \"colorMode\": \"value\",\n \"textMode\": \"value\",\n \"version\": \"3.0.0\"\n },\n \"datasourceCate\": \"prometheus\",\n \"datasourceValue\": \"${DS_PROMETHEUS}\",\n \"id\": \"e9225532-5991-4394-9e4e-8c09879447ba\",\n \"layout\": {\n \"h\": 3,\n \"i\": \"e9225532-5991-4394-9e4e-8c09879447ba\",\n \"isResizable\": true,\n \"w\": 3,\n \"x\": 6,\n \"y\": 6\n },\n \"links\": [],\n \"maxPerRow\": 4,\n \"name\": \"Number of Buckets\",\n \"options\": {\n \"legend\": {\n \"displayMode\": \"list\"\n },\n \"standardOptions\": {\n \"util\": \"none\"\n },\n \"thresholds\": {\n \"mode\": \"absolute\",\n \"steps\": [\n {\n \"color\": \"#73BF69\",\n \"type\": \"base\",\n \"value\": null\n },\n {\n \"color\": \"#E0B400\",\n \"value\": 75000000\n },\n {\n \"color\": \"#C4162A\",\n \"value\": 100000000\n }\n ],\n \"style\": \"line\"\n },\n \"tooltip\": {\n \"mode\": \"multi\"\n },\n \"valueMappings\": [\n {\n \"options\": {\n \"match\": \"null\",\n \"result\": {\n \"text\": \"N/A\"\n }\n },\n \"type\": \"special\"\n }\n ]\n },\n \"targets\": [\n {\n \"expr\": \"count(count by (bucket) (minio_bucket_usage_total_bytes{job=\\\"$scrape_jobs\\\"}))\",\n \"legend\": \"\",\n \"refId\": \"A\"\n }\n ],\n \"type\": \"stat\",\n \"version\": \"3.0.0\"\n },\n {\n \"custom\": {\n \"drawStyle\": \"lines\",\n \"fillOpacity\": 0.3,\n \"gradientMode\": \"opacity\",\n \"lineInterpolation\": \"linear\",\n \"lineWidth\": 2,\n \"stack\": \"off\",\n \"version\": \"3.0.0\"\n },\n \"datasourceCate\": \"prometheus\",\n \"datasourceValue\": \"${DS_PROMETHEUS}\",\n \"id\": \"2ebcc855-1fac-4a1e-baec-6ed398920c77\",\n \"layout\": {\n \"h\": 6,\n \"i\": \"2ebcc855-1fac-4a1e-baec-6ed398920c77\",\n \"isResizable\": true,\n \"w\": 7,\n \"x\": 9,\n \"y\": 6\n },\n \"links\": [],\n \"maxPerRow\": 4,\n \"name\": \"S3 API Data Received Rate \",\n \"options\": {\n \"legend\": {\n \"displayMode\": \"hidden\"\n },\n \"thresholds\": {\n \"steps\": [\n {\n \"color\": \"#634CD9\",\n \"type\": \"base\",\n \"value\": null\n }\n ]\n },\n \"tooltip\": {\n \"mode\": \"all\",\n \"sort\": \"none\"\n }\n },\n \"targets\": [\n {\n \"expr\": \"sum by (server) (rate(minio_s3_traffic_received_bytes{job=\\\"$scrape_jobs\\\"}[5m]))\",\n \"legend\": \"Data Received [{{server}}]\",\n \"refId\": \"A\"\n }\n ],\n \"type\": \"timeseries\",\n \"version\": \"3.0.0\"\n },\n {\n \"custom\": {\n \"drawStyle\": \"lines\",\n \"fillOpacity\": 0.3,\n \"gradientMode\": \"opacity\",\n \"lineInterpolation\": \"linear\",\n \"lineWidth\": 2,\n \"stack\": \"off\",\n \"version\": \"3.0.0\"\n },\n \"datasourceCate\": \"prometheus\",\n \"datasourceValue\": \"${DS_PROMETHEUS}\",\n \"id\": \"6edb8e54-e7ed-4cbe-af77-0bcd985dda95\",\n \"layout\": {\n \"h\": 6,\n \"i\": \"6edb8e54-e7ed-4cbe-af77-0bcd985dda95\",\n \"isResizable\": true,\n \"w\": 8,\n \"x\": 16,\n \"y\": 6\n },\n \"links\": [],\n \"maxPerRow\": 4,\n \"name\": \"S3 API Data Sent Rate \",\n \"options\": {\n \"legend\": {\n \"displayMode\": \"hidden\"\n },\n \"thresholds\": {\n \"steps\": [\n {\n \"color\": \"#634CD9\",\n \"type\": \"base\",\n \"value\": null\n }\n ]\n },\n \"tooltip\": {\n \"mode\": \"all\",\n \"sort\": \"none\"\n }\n },\n \"targets\": [\n {\n \"expr\": \"sum by (server) (rate(minio_s3_traffic_sent_bytes{job=\\\"$scrape_jobs\\\"}[5m]))\",\n \"legend\": \"Data Sent [{{server}}]\",\n \"refId\": \"A\"\n }\n ],\n \"type\": \"timeseries\",\n \"version\": \"3.0.0\"\n },\n {\n \"custom\": {\n \"calc\": \"avg\",\n \"colSpan\": 1,\n \"colorMode\": \"value\",\n \"graphMode\": \"none\",\n \"textMode\": \"value\",\n \"textSize\": {},\n \"valueField\": \"Value\"\n },\n \"datasourceCate\": \"prometheus\",\n \"datasourceValue\": \"${DS_PROMETHEUS}\",\n \"description\": \"\",\n \"id\": \"26be803c-f2b5-40b2-99ce-39240830292e\",\n \"layout\": {\n \"h\": 2,\n \"i\": \"26be803c-f2b5-40b2-99ce-39240830292e\",\n \"isResizable\": true,\n \"w\": 3,\n \"x\": 0,\n \"y\": 8\n },\n \"links\": [],\n \"maxPerRow\": 4,\n \"name\": \"Total Offline Servers\",\n \"options\": {\n \"standardOptions\": {\n \"util\": \"none\"\n },\n \"thresholds\": {\n \"steps\": [\n {\n \"color\": \"#73BF69\",\n \"type\": \"base\",\n \"value\": null\n },\n {\n \"color\": \"#F2495C\",\n \"value\": 80\n }\n ]\n },\n \"valueMappings\": [\n {\n \"options\": {\n \"match\": \"null\",\n \"result\": {\n \"text\": \"N/A\"\n }\n },\n \"type\": \"special\"\n }\n ]\n },\n \"targets\": [\n {\n \"expr\": \"minio_cluster_nodes_offline_total{job=\\\"$scrape_jobs\\\"}\",\n \"legend\": \"\",\n \"refId\": \"A\"\n }\n ],\n \"transformations\": [\n {\n \"id\": \"organize\",\n \"options\": {}\n }\n ],\n \"type\": \"stat\",\n \"version\": \"3.0.0\"\n },\n {\n \"type\": \"stat\",\n \"id\": \"136b9b07-6979-4402-89da-3a79ab8dc732\",\n \"layout\": {\n \"h\": 2,\n \"i\": \"136b9b07-6979-4402-89da-3a79ab8dc732\",\n \"isResizable\": true,\n \"w\": 3,\n \"x\": 3,\n \"y\": 8\n },\n \"version\": \"3.1.0\",\n \"datasourceCate\": \"prometheus\",\n \"datasourceValue\": \"${DS_PROMETHEUS}\",\n \"targets\": [\n {\n \"expr\": \"minio_cluster_drive_offline_total{job=\\\"$scrape_jobs\\\"}\",\n \"legend\": \"\",\n \"refId\": \"A\"\n }\n ],\n \"transformations\": [\n {\n \"id\": \"organize\",\n \"options\": {}\n }\n ],\n \"name\": \"Total Offline Drives\",\n \"links\": [],\n \"description\": \"\",\n \"maxPerRow\": 4,\n \"custom\": {\n \"textMode\": \"value\",\n \"graphMode\": \"none\",\n \"colorMode\": \"value\",\n \"calc\": \"avg\",\n \"valueField\": \"Value\",\n \"colSpan\": 1,\n \"textSize\": {},\n \"orientation\": \"auto\"\n },\n \"options\": {\n \"thresholds\": {\n \"steps\": [\n {\n \"color\": \"#73BF69\",\n \"value\": null,\n \"type\": \"base\"\n },\n {\n \"color\": \"#F2495C\",\n \"value\": 80\n }\n ]\n },\n \"valueMappings\": [\n {\n \"options\": {\n \"match\": \"null\",\n \"result\": {\n \"text\": \"N/A\"\n }\n },\n \"type\": \"special\"\n }\n ],\n \"standardOptions\": {\n \"util\": \"none\"\n }\n },\n \"overrides\": [\n {\n \"matcher\": {\n \"id\": \"byFrameRefID\"\n },\n \"properties\": {\n \"thresholds\": {\n \"steps\": [\n {\n \"color\": \"#6C53B1\",\n \"value\": null,\n \"type\": \"base\"\n }\n ]\n }\n }\n }\n ]\n },\n {\n \"custom\": {\n \"calc\": \"lastNotNull\",\n \"colorMode\": \"value\",\n \"textMode\": \"value\",\n \"version\": \"3.0.0\"\n },\n \"datasourceCate\": \"prometheus\",\n \"datasourceValue\": \"${DS_PROMETHEUS}\",\n \"id\": \"4072f862-84d1-4563-b4cc-7e2219a1da8c\",\n \"layout\": {\n \"h\": 3,\n \"i\": \"4072f862-84d1-4563-b4cc-7e2219a1da8c\",\n \"isResizable\": true,\n \"w\": 3,\n \"x\": 6,\n \"y\": 9\n },\n \"links\": [],\n \"maxPerRow\": 4,\n \"name\": \"Number of Objects\",\n \"options\": {\n \"legend\": {\n \"displayMode\": \"list\"\n },\n \"standardOptions\": {\n \"util\": \"none\"\n },\n \"thresholds\": {\n \"mode\": \"absolute\",\n \"steps\": [\n {\n \"color\": \"#73BF69\",\n \"type\": \"base\",\n \"value\": null\n },\n {\n \"color\": \"#E0B400\",\n \"value\": 75000000\n },\n {\n \"color\": \"#C4162A\",\n \"value\": 100000000\n }\n ],\n \"style\": \"line\"\n },\n \"tooltip\": {\n \"mode\": \"multi\"\n },\n \"valueMappings\": [\n {\n \"options\": {\n \"match\": \"null\",\n \"result\": {\n \"text\": \"N/A\"\n }\n },\n \"type\": \"special\"\n }\n ]\n },\n \"targets\": [\n {\n \"expr\": \"topk(1, sum(minio_bucket_usage_object_total{job=\\\"$scrape_jobs\\\"}) by (instance))\",\n \"legend\": \"\",\n \"refId\": \"A\"\n }\n ],\n \"type\": \"stat\",\n \"version\": \"3.0.0\"\n },\n {\n \"custom\": {\n \"calc\": \"last\",\n \"colSpan\": 1,\n \"colorMode\": \"value\",\n \"graphMode\": \"none\",\n \"textMode\": \"value\",\n \"textSize\": {},\n \"valueField\": \"Value\"\n },\n \"datasourceCate\": \"prometheus\",\n \"datasourceValue\": \"${DS_PROMETHEUS}\",\n \"description\": \"\",\n \"id\": \"9151721f-21e1-49ab-9a95-896fb364d9d2\",\n \"layout\": {\n \"h\": 2,\n \"i\": \"9151721f-21e1-49ab-9a95-896fb364d9d2\",\n \"isResizable\": true,\n \"w\": 3,\n \"x\": 0,\n \"y\": 10\n },\n \"links\": [],\n \"maxPerRow\": 4,\n \"name\": \"Time Since Last Heal Activity\",\n \"options\": {\n \"standardOptions\": {\n \"util\": \"none\"\n },\n \"thresholds\": {\n \"steps\": [\n {\n \"color\": \"#73BF69\",\n \"type\": \"base\",\n \"value\": null\n }\n ]\n },\n \"valueMappings\": []\n },\n \"targets\": [\n {\n \"expr\": \"minio_heal_time_last_activity_nano_seconds{job=\\\"$scrape_jobs\\\"}\",\n \"legend\": \"{{server}}\",\n \"refId\": \"A\"\n }\n ],\n \"transformations\": [\n {\n \"id\": \"organize\",\n \"options\": {}\n }\n ],\n \"type\": \"stat\",\n \"version\": \"3.0.0\"\n },\n {\n \"custom\": {\n \"calc\": \"last\",\n \"colSpan\": 1,\n \"colorMode\": \"value\",\n \"graphMode\": \"none\",\n \"textMode\": \"value\",\n \"textSize\": {},\n \"valueField\": \"Value\"\n },\n \"datasourceCate\": \"prometheus\",\n \"datasourceValue\": \"${DS_PROMETHEUS}\",\n \"description\": \"\",\n \"id\": \"fc40c036-86fc-42c7-9cc6-384c64c0814c\",\n \"layout\": {\n \"h\": 2,\n \"i\": \"fc40c036-86fc-42c7-9cc6-384c64c0814c\",\n \"isResizable\": true,\n \"w\": 3,\n \"x\": 3,\n \"y\": 10\n },\n \"links\": [],\n \"maxPerRow\": 4,\n \"name\": \"Time Since Last Scan Activity\",\n \"options\": {\n \"standardOptions\": {\n \"util\": \"none\"\n },\n \"thresholds\": {\n \"steps\": [\n {\n \"color\": \"#73BF69\",\n \"type\": \"base\",\n \"value\": null\n }\n ]\n },\n \"valueMappings\": []\n },\n \"targets\": [\n {\n \"expr\": \"minio_usage_last_activity_nano_seconds{job=\\\"$scrape_jobs\\\"}\",\n \"legend\": \"{{server}}\",\n \"refId\": \"A\"\n }\n ],\n \"transformations\": [\n {\n \"id\": \"organize\",\n \"options\": {}\n }\n ],\n \"type\": \"stat\",\n \"version\": \"3.0.0\"\n },\n {\n \"custom\": {\n \"drawStyle\": \"lines\",\n \"fillOpacity\": 0.3,\n \"gradientMode\": \"opacity\",\n \"lineInterpolation\": \"linear\",\n \"lineWidth\": 2,\n \"stack\": \"off\",\n \"version\": \"3.0.0\"\n },\n \"datasourceCate\": \"prometheus\",\n \"datasourceValue\": \"${DS_PROMETHEUS}\",\n \"id\": \"b5fe1dc4-833e-4e53-a2cb-98e7ecb8ea7b\",\n \"layout\": {\n \"h\": 10,\n \"i\": \"b5fe1dc4-833e-4e53-a2cb-98e7ecb8ea7b\",\n \"isResizable\": true,\n \"w\": 12,\n \"x\": 0,\n \"y\": 12\n },\n \"links\": [],\n \"maxPerRow\": 4,\n \"name\": \"S3 API Request Rate\",\n \"options\": {\n \"legend\": {\n \"displayMode\": \"hidden\"\n },\n \"thresholds\": {\n \"steps\": [\n {\n \"color\": \"#634CD9\",\n \"type\": \"base\",\n \"value\": null\n }\n ]\n },\n \"tooltip\": {\n \"mode\": \"all\",\n \"sort\": \"none\"\n }\n },\n \"targets\": [\n {\n \"expr\": \"sum by (server,api) (increase(minio_s3_requests_total{job=\\\"$scrape_jobs\\\"}[5m]))\",\n \"legend\": \"{{server,api}}\",\n \"refId\": \"A\"\n }\n ],\n \"type\": \"timeseries\",\n \"version\": \"3.0.0\"\n },\n {\n \"custom\": {\n \"drawStyle\": \"lines\",\n \"fillOpacity\": 0.05,\n \"lineInterpolation\": \"smooth\",\n \"stack\": \"off\",\n \"version\": \"3.0.0\"\n },\n \"datasourceCate\": \"prometheus\",\n \"datasourceValue\": \"${DS_PROMETHEUS}\",\n \"description\": \"Total s3 bytes received per bucket\",\n \"id\": \"761f532d-a867-4c56-8231-6d2ea2f82522\",\n \"layout\": {\n \"h\": 10,\n \"i\": \"761f532d-a867-4c56-8231-6d2ea2f82522\",\n \"isResizable\": true,\n \"w\": 12,\n \"x\": 12,\n \"y\": 12\n },\n \"links\": [],\n \"maxPerRow\": 4,\n \"name\": \"Bucket Traffic Received\",\n \"options\": {\n \"legend\": {\n \"displayMode\": \"list\",\n \"placement\": \"right\"\n },\n \"standardOptions\": {\n \"util\": \"bytesSI\"\n },\n \"thresholds\": {\n \"mode\": \"absolute\",\n \"steps\": [\n {\n \"color\": \"#73BF69\",\n \"type\": \"base\",\n \"value\": null\n },\n {\n \"color\": \"#F2495C\",\n \"value\": 80\n }\n ],\n \"style\": \"off\"\n },\n \"tooltip\": {\n \"mode\": \"multi\"\n },\n \"valueMappings\": []\n },\n \"targets\": [\n {\n \"expr\": \"sum by(bucket) (minio_bucket_traffic_received_bytes{job=\\\"$scrape_jobs\\\"})\",\n \"legend\": \"__auto\",\n \"refId\": \"A\"\n }\n ],\n \"type\": \"timeseries\",\n \"version\": \"3.0.0\"\n },\n {\n \"custom\": {\n \"drawStyle\": \"lines\",\n \"fillOpacity\": 0.05,\n \"lineInterpolation\": \"smooth\",\n \"stack\": \"off\",\n \"version\": \"3.0.0\"\n },\n \"datasourceCate\": \"prometheus\",\n \"datasourceValue\": \"${DS_PROMETHEUS}\",\n \"description\": \"Total s3 bytes sent per bucket\",\n \"id\": \"842bc922-c7c3-4c57-a126-4328d53ee703\",\n \"layout\": {\n \"h\": 10,\n \"i\": \"842bc922-c7c3-4c57-a126-4328d53ee703\",\n \"isResizable\": true,\n \"w\": 12,\n \"x\": 0,\n \"y\": 22\n },\n \"links\": [],\n \"maxPerRow\": 4,\n \"name\": \"Bucket Traffic Sent\",\n \"options\": {\n \"legend\": {\n \"displayMode\": \"list\",\n \"placement\": \"right\"\n },\n \"standardOptions\": {\n \"util\": \"bytesSI\"\n },\n \"thresholds\": {\n \"mode\": \"absolute\",\n \"steps\": [\n {\n \"color\": \"#73BF69\",\n \"type\": \"base\",\n \"value\": null\n },\n {\n \"color\": \"#F2495C\",\n \"value\": 80\n }\n ],\n \"style\": \"off\"\n },\n \"tooltip\": {\n \"mode\": \"multi\"\n },\n \"valueMappings\": []\n },\n \"targets\": [\n {\n \"expr\": \"sum by(bucket) (minio_bucket_traffic_sent_bytes{job=\\\"$scrape_jobs\\\"})\",\n \"legend\": \"__auto\",\n \"refId\": \"A\"\n }\n ],\n \"type\": \"timeseries\",\n \"version\": \"3.0.0\"\n },\n {\n \"custom\": {\n \"drawStyle\": \"lines\",\n \"fillOpacity\": 0.3,\n \"gradientMode\": \"opacity\",\n \"lineInterpolation\": \"linear\",\n \"lineWidth\": 2,\n \"stack\": \"off\",\n \"version\": \"3.0.0\"\n },\n \"datasourceCate\": \"prometheus\",\n \"datasourceValue\": \"${DS_PROMETHEUS}\",\n \"id\": \"59fedaf1-cfab-49a5-80ce-c789fc05cfc0\",\n \"layout\": {\n \"h\": 10,\n \"i\": \"59fedaf1-cfab-49a5-80ce-c789fc05cfc0\",\n \"isResizable\": true,\n \"w\": 12,\n \"x\": 12,\n \"y\": 22\n },\n \"links\": [],\n \"maxPerRow\": 4,\n \"name\": \"S3 API Request 4xx Error Rate\",\n \"options\": {\n \"legend\": {\n \"displayMode\": \"hidden\"\n },\n \"thresholds\": {\n \"steps\": [\n {\n \"color\": \"#634CD9\",\n \"type\": \"base\",\n \"value\": null\n }\n ]\n },\n \"tooltip\": {\n \"mode\": \"all\",\n \"sort\": \"none\"\n }\n },\n \"targets\": [\n {\n \"expr\": \"sum by (server,api) (increase(minio_s3_requests_4xx_errors_total{job=\\\"$scrape_jobs\\\"}[5m]))\",\n \"legend\": \"{{server,api}}\",\n \"refId\": \"A\"\n }\n ],\n \"type\": \"timeseries\",\n \"version\": \"3.0.0\"\n },\n {\n \"custom\": {\n \"drawStyle\": \"lines\",\n \"fillOpacity\": 0.3,\n \"gradientMode\": \"opacity\",\n \"lineInterpolation\": \"linear\",\n \"lineWidth\": 2,\n \"stack\": \"off\",\n \"version\": \"3.0.0\"\n },\n \"datasourceCate\": \"prometheus\",\n \"datasourceValue\": \"${DS_PROMETHEUS}\",\n \"id\": \"7be6161e-0202-48a5-8c44-ea6d92b6046e\",\n \"layout\": {\n \"h\": 10,\n \"i\": \"7be6161e-0202-48a5-8c44-ea6d92b6046e\",\n \"isResizable\": true,\n \"w\": 12,\n \"x\": 0,\n \"y\": 32\n },\n \"links\": [],\n \"maxPerRow\": 4,\n \"name\": \"S3 API Request 5xx Error Rate\",\n \"options\": {\n \"legend\": {\n \"displayMode\": \"hidden\"\n },\n \"thresholds\": {\n \"steps\": [\n {\n \"color\": \"#634CD9\",\n \"type\": \"base\",\n \"value\": null\n }\n ]\n },\n \"tooltip\": {\n \"mode\": \"all\",\n \"sort\": \"none\"\n }\n },\n \"targets\": [\n {\n \"expr\": \"sum by (server,api) (increase(minio_s3_requests_5xx_errors_total{job=\\\"$scrape_jobs\\\"}[5m]))\",\n \"legend\": \"{{server,api}}\",\n \"refId\": \"A\"\n }\n ],\n \"type\": \"timeseries\",\n \"version\": \"3.0.0\"\n },\n {\n \"custom\": {\n \"drawStyle\": \"lines\",\n \"fillOpacity\": 0.3,\n \"gradientMode\": \"opacity\",\n \"lineInterpolation\": \"linear\",\n \"lineWidth\": 2,\n \"stack\": \"off\",\n \"version\": \"3.0.0\"\n },\n \"datasourceCate\": \"prometheus\",\n \"datasourceValue\": \"${DS_PROMETHEUS}\",\n \"id\": \"26ccd336-ccbd-4f84-a79e-aac8fc645295\",\n \"layout\": {\n \"h\": 10,\n \"i\": \"26ccd336-ccbd-4f84-a79e-aac8fc645295\",\n \"isResizable\": true,\n \"w\": 12,\n \"x\": 12,\n \"y\": 32\n },\n \"links\": [],\n \"maxPerRow\": 4,\n \"name\": \"Healing\",\n \"options\": {\n \"legend\": {\n \"displayMode\": \"hidden\"\n },\n \"thresholds\": {\n \"steps\": [\n {\n \"color\": \"#634CD9\",\n \"type\": \"base\",\n \"value\": null\n }\n ]\n },\n \"tooltip\": {\n \"mode\": \"all\",\n \"sort\": \"none\"\n }\n },\n \"targets\": [\n {\n \"expr\": \"sum by (instance) (minio_heal_objects_heal_total{job=\\\"$scrape_jobs\\\"})\",\n \"legend\": \"Objects healed in current self heal run\",\n \"refId\": \"A\"\n },\n {\n \"expr\": \"sum by (instance) (minio_heal_objects_error_total{job=\\\"$scrape_jobs\\\"})\",\n \"legend\": \"Heal errors in current self heal run\",\n \"refId\": \"B\"\n },\n {\n \"expr\": \"sum by (instance) (minio_heal_objects_total{job=\\\"$scrape_jobs\\\"}) \",\n \"legend\": \"Objects scanned in current self heal run\",\n \"refId\": \"C\"\n }\n ],\n \"type\": \"timeseries\",\n \"version\": \"3.0.0\"\n },\n {\n \"custom\": {\n \"drawStyle\": \"lines\",\n \"fillOpacity\": 0.3,\n \"gradientMode\": \"opacity\",\n \"lineInterpolation\": \"linear\",\n \"lineWidth\": 2,\n \"stack\": \"off\",\n \"version\": \"3.0.0\"\n },\n \"datasourceCate\": \"prometheus\",\n \"datasourceValue\": \"${DS_PROMETHEUS}\",\n \"description\": \"Total number of bytes received and sent among all MinIO server instances\",\n \"id\": \"4ded094e-a71a-4104-80c6-eeb8770abf21\",\n \"layout\": {\n \"h\": 9,\n \"i\": \"4ded094e-a71a-4104-80c6-eeb8770abf21\",\n \"isResizable\": true,\n \"w\": 12,\n \"x\": 0,\n \"y\": 42\n },\n \"links\": [],\n \"maxPerRow\": 4,\n \"name\": \"Internode Data Transfer\",\n \"options\": {\n \"legend\": {\n \"displayMode\": \"hidden\"\n },\n \"thresholds\": {\n \"steps\": [\n {\n \"color\": \"#634CD9\",\n \"type\": \"base\",\n \"value\": null\n }\n ]\n },\n \"tooltip\": {\n \"mode\": \"all\",\n \"sort\": \"none\"\n }\n },\n \"targets\": [\n {\n \"expr\": \"rate(minio_inter_node_traffic_sent_bytes{job=\\\"$scrape_jobs\\\"}[5m])\",\n \"legend\": \"Internode Bytes Received [{{server}}]\",\n \"refId\": \"A\"\n },\n {\n \"expr\": \"rate(minio_inter_node_traffic_received_bytes{job=\\\"$scrape_jobs\\\"}[5m])\",\n \"legend\": \"Internode Bytes Sent [{{server}}]\",\n \"refId\": \"B\"\n }\n ],\n \"type\": \"timeseries\",\n \"version\": \"3.0.0\"\n },\n {\n \"custom\": {\n \"drawStyle\": \"lines\",\n \"fillOpacity\": 0.3,\n \"gradientMode\": \"opacity\",\n \"lineInterpolation\": \"linear\",\n \"lineWidth\": 2,\n \"stack\": \"off\",\n \"version\": \"3.0.0\"\n },\n \"datasourceCate\": \"prometheus\",\n \"datasourceValue\": \"${DS_PROMETHEUS}\",\n \"id\": \"e0994406-de33-4de1-9722-dcee647c2f68\",\n \"layout\": {\n \"h\": 9,\n \"i\": \"e0994406-de33-4de1-9722-dcee647c2f68\",\n \"isResizable\": true,\n \"w\": 12,\n \"x\": 12,\n \"y\": 42\n },\n \"links\": [],\n \"maxPerRow\": 4,\n \"name\": \"Node Memory Usage\",\n \"options\": {\n \"legend\": {\n \"displayMode\": \"hidden\"\n },\n \"thresholds\": {\n \"steps\": [\n {\n \"color\": \"#634CD9\",\n \"type\": \"base\",\n \"value\": null\n }\n ]\n },\n \"tooltip\": {\n \"mode\": \"all\",\n \"sort\": \"none\"\n }\n },\n \"targets\": [\n {\n \"expr\": \"minio_node_process_resident_memory_bytes{job=\\\"$scrape_jobs\\\"}\",\n \"legend\": \"Memory Used [{{server}}]\",\n \"refId\": \"A\"\n }\n ],\n \"type\": \"timeseries\",\n \"version\": \"3.0.0\"\n },\n {\n \"custom\": {\n \"drawStyle\": \"lines\",\n \"fillOpacity\": 0.3,\n \"gradientMode\": \"opacity\",\n \"lineInterpolation\": \"linear\",\n \"lineWidth\": 2,\n \"stack\": \"off\",\n \"version\": \"3.0.0\"\n },\n \"datasourceCate\": \"prometheus\",\n \"datasourceValue\": \"${DS_PROMETHEUS}\",\n \"id\": \"fc925e24-3be5-453a-85a0-f281ad60994e\",\n \"layout\": {\n \"h\": 9,\n \"i\": \"fc925e24-3be5-453a-85a0-f281ad60994e\",\n \"isResizable\": true,\n \"w\": 12,\n \"x\": 0,\n \"y\": 51\n },\n \"links\": [],\n \"maxPerRow\": 4,\n \"name\": \"Node CPU Usage\",\n \"options\": {\n \"legend\": {\n \"displayMode\": \"hidden\"\n },\n \"thresholds\": {\n \"steps\": [\n {\n \"color\": \"#634CD9\",\n \"type\": \"base\",\n \"value\": null\n }\n ]\n },\n \"tooltip\": {\n \"mode\": \"all\",\n \"sort\": \"none\"\n }\n },\n \"targets\": [\n {\n \"expr\": \"rate(minio_node_process_cpu_total_seconds{job=\\\"$scrape_jobs\\\"}[5m])\",\n \"legend\": \"CPU Usage Rate [{{server}}]\",\n \"refId\": \"A\"\n }\n ],\n \"type\": \"timeseries\",\n \"version\": \"3.0.0\"\n },\n {\n \"type\": \"timeseries\",\n \"id\": \"54c9c962-e93e-4429-a376-eda862b2777a\",\n \"layout\": {\n \"h\": 9,\n \"i\": \"54c9c962-e93e-4429-a376-eda862b2777a\",\n \"isResizable\": true,\n \"w\": 12,\n \"x\": 12,\n \"y\": 51\n },\n \"version\": \"3.1.0\",\n \"datasourceCate\": \"prometheus\",\n \"datasourceValue\": \"${DS_PROMETHEUS}\",\n \"targets\": [\n {\n \"expr\": \"minio_node_drive_free_inodes{job=\\\"$scrape_jobs\\\"}\",\n \"legend\": \"Free Inodes [{{server}}:{{drive}}]\",\n \"refId\": \"A\"\n }\n ],\n \"transformations\": [\n {\n \"id\": \"organize\",\n \"options\": {}\n }\n ],\n \"name\": \"Drives Free Inodes\",\n \"links\": [],\n \"maxPerRow\": 4,\n \"options\": {\n \"tooltip\": {\n \"mode\": \"all\",\n \"sort\": \"none\"\n },\n \"legend\": {\n \"displayMode\": \"hidden\",\n \"placement\": \"bottom\",\n \"behaviour\": \"showItem\",\n \"selectMode\": \"single\"\n },\n \"standardOptions\": {},\n \"thresholds\": {\n \"mode\": \"absolute\",\n \"steps\": [\n {\n \"color\": \"#634CD9\",\n \"value\": null,\n \"type\": \"base\"\n }\n ]\n },\n \"thresholdsStyle\": {\n \"mode\": \"dashed\"\n }\n },\n \"custom\": {\n \"drawStyle\": \"lines\",\n \"lineInterpolation\": \"linear\",\n \"spanNulls\": false,\n \"lineWidth\": 2,\n \"fillOpacity\": 0.3,\n \"gradientMode\": \"opacity\",\n \"stack\": \"off\",\n \"scaleDistribution\": {\n \"type\": \"linear\"\n },\n \"showPoints\": \"none\",\n \"pointSize\": 5\n },\n \"overrides\": [\n {\n \"matcher\": {\n \"id\": \"byFrameRefID\"\n },\n \"properties\": {\n \"rightYAxisDisplay\": \"off\"\n }\n }\n ]\n },\n {\n \"type\": \"timeseries\",\n \"id\": \"252d4c7b-c38a-4e08-8888-83408e31082c\",\n \"layout\": {\n \"h\": 8,\n \"i\": \"252d4c7b-c38a-4e08-8888-83408e31082c\",\n \"isResizable\": true,\n \"w\": 12,\n \"x\": 0,\n \"y\": 60\n },\n \"version\": \"3.1.0\",\n \"datasourceCate\": \"prometheus\",\n \"datasourceValue\": \"${DS_PROMETHEUS}\",\n \"targets\": [\n {\n \"expr\": \"minio_node_drive_used_bytes{job=\\\"$scrape_jobs\\\"}\",\n \"legend\": \"Used Capacity [{{server}}:{{drive}}]\",\n \"refId\": \"A\"\n }\n ],\n \"transformations\": [\n {\n \"id\": \"organize\",\n \"options\": {}\n }\n ],\n \"name\": \"Drive Used Capacity\",\n \"links\": [],\n \"maxPerRow\": 4,\n \"options\": {\n \"tooltip\": {\n \"mode\": \"all\",\n \"sort\": \"none\"\n },\n \"legend\": {\n \"displayMode\": \"hidden\",\n \"placement\": \"bottom\",\n \"behaviour\": \"showItem\",\n \"selectMode\": \"single\"\n },\n \"standardOptions\": {},\n \"thresholds\": {\n \"mode\": \"absolute\",\n \"steps\": [\n {\n \"color\": \"#634CD9\",\n \"value\": null,\n \"type\": \"base\"\n }\n ]\n },\n \"thresholdsStyle\": {\n \"mode\": \"dashed\"\n }\n },\n \"custom\": {\n \"drawStyle\": \"lines\",\n \"lineInterpolation\": \"linear\",\n \"spanNulls\": false,\n \"lineWidth\": 2,\n \"fillOpacity\": 0.3,\n \"gradientMode\": \"opacity\",\n \"stack\": \"off\",\n \"scaleDistribution\": {\n \"type\": \"linear\"\n },\n \"showPoints\": \"none\",\n \"pointSize\": 5\n },\n \"overrides\": [\n {\n \"matcher\": {\n \"id\": \"byFrameRefID\"\n },\n \"properties\": {\n \"rightYAxisDisplay\": \"off\"\n }\n }\n ]\n },\n {\n \"custom\": {\n \"drawStyle\": \"lines\",\n \"fillOpacity\": 0.3,\n \"gradientMode\": \"opacity\",\n \"lineInterpolation\": \"linear\",\n \"lineWidth\": 2,\n \"stack\": \"off\",\n \"version\": \"3.0.0\"\n },\n \"datasourceCate\": \"prometheus\",\n \"datasourceValue\": \"${DS_PROMETHEUS}\",\n \"description\": \"\",\n \"id\": \"867a88e9-5317-4a97-9e06-efba95eda8fb\",\n \"layout\": {\n \"h\": 9,\n \"i\": \"867a88e9-5317-4a97-9e06-efba95eda8fb\",\n \"isResizable\": true,\n \"w\": 12,\n \"x\": 12,\n \"y\": 60\n },\n \"links\": [],\n \"maxPerRow\": 4,\n \"name\": \"Node File Descriptors\",\n \"options\": {\n \"legend\": {\n \"displayMode\": \"hidden\"\n },\n \"thresholds\": {\n \"steps\": [\n {\n \"color\": \"#634CD9\",\n \"type\": \"base\",\n \"value\": null\n }\n ]\n },\n \"tooltip\": {\n \"mode\": \"all\",\n \"sort\": \"none\"\n }\n },\n \"targets\": [\n {\n \"expr\": \"minio_node_file_descriptor_open_total{job=\\\"$scrape_jobs\\\"}\",\n \"legend\": \"Open FDs [{{server}}]\",\n \"refId\": \"B\"\n }\n ],\n \"type\": \"timeseries\",\n \"version\": \"3.0.0\"\n },\n {\n \"custom\": {\n \"drawStyle\": \"lines\",\n \"fillOpacity\": 0.3,\n \"gradientMode\": \"opacity\",\n \"lineInterpolation\": \"linear\",\n \"lineWidth\": 2,\n \"stack\": \"off\",\n \"version\": \"3.0.0\"\n },\n \"datasourceCate\": \"prometheus\",\n \"datasourceValue\": \"${DS_PROMETHEUS}\",\n \"description\": \"Number of online disks per MinIO Server\",\n \"id\": \"fc600570-ff7a-46b9-8cc8-1dc78fd81fa0\",\n \"layout\": {\n \"h\": 9,\n \"i\": \"fc600570-ff7a-46b9-8cc8-1dc78fd81fa0\",\n \"isResizable\": true,\n \"w\": 12,\n \"x\": 0,\n \"y\": 68\n },\n \"links\": [],\n \"maxPerRow\": 4,\n \"name\": \"Node Syscalls\",\n \"options\": {\n \"legend\": {\n \"displayMode\": \"hidden\"\n },\n \"thresholds\": {\n \"steps\": [\n {\n \"color\": \"#634CD9\",\n \"type\": \"base\",\n \"value\": null\n }\n ]\n },\n \"tooltip\": {\n \"mode\": \"all\",\n \"sort\": \"none\"\n }\n },\n \"targets\": [\n {\n \"expr\": \"rate(minio_node_syscall_read_total{job=\\\"$scrape_jobs\\\"}[5m])\",\n \"legend\": \"Read Syscalls [{{server}}]\",\n \"refId\": \"A\"\n },\n {\n \"expr\": \"rate(minio_node_syscall_write_total{job=\\\"$scrape_jobs\\\"}[5m])\",\n \"legend\": \"Write Syscalls [{{server}}]\",\n \"refId\": \"B\"\n }\n ],\n \"type\": \"timeseries\",\n \"version\": \"3.0.0\"\n },\n {\n \"custom\": {\n \"drawStyle\": \"lines\",\n \"fillOpacity\": 0.3,\n \"gradientMode\": \"opacity\",\n \"lineInterpolation\": \"linear\",\n \"lineWidth\": 2,\n \"stack\": \"off\",\n \"version\": \"3.0.0\"\n },\n \"datasourceCate\": \"prometheus\",\n \"datasourceValue\": \"${DS_PROMETHEUS}\",\n \"id\": \"83dcd281-30f8-4e36-805f-0f594a7816c2\",\n \"layout\": {\n \"h\": 8,\n \"i\": \"83dcd281-30f8-4e36-805f-0f594a7816c2\",\n \"isResizable\": true,\n \"w\": 12,\n \"x\": 12,\n \"y\": 69\n },\n \"links\": [],\n \"maxPerRow\": 4,\n \"name\": \"Node IO\",\n \"options\": {\n \"legend\": {\n \"displayMode\": \"hidden\"\n },\n \"thresholds\": {\n \"steps\": [\n {\n \"color\": \"#634CD9\",\n \"type\": \"base\",\n \"value\": null\n }\n ]\n },\n \"tooltip\": {\n \"mode\": \"all\",\n \"sort\": \"none\"\n }\n },\n \"targets\": [\n {\n \"expr\": \"rate(minio_node_io_rchar_bytes{job=\\\"$scrape_jobs\\\"}[5m])\",\n \"legend\": \"Node RChar [{{server}}]\",\n \"refId\": \"A\"\n },\n {\n \"expr\": \"rate(minio_node_io_wchar_bytes{job=\\\"$scrape_jobs\\\"}[5m])\",\n \"legend\": \"Node WChar [{{server}}]\",\n \"refId\": \"B\"\n }\n ],\n \"type\": \"timeseries\",\n \"version\": \"3.0.0\"\n }\n ],\n \"var\": [\n {\n \"definition\": \"prometheus\",\n \"name\": \"DS_PROMETHEUS\",\n \"type\": \"datasource\"\n },\n {\n \"name\": \"scrape_jobs\",\n \"type\": \"query\",\n \"hide\": false,\n \"datasource\": {\n \"cate\": \"prometheus\",\n \"value\": \"${DS_PROMETHEUS}\"\n },\n \"reg\": \"\",\n \"definition\": \"label_values(minio_node_process_starttime_seconds,job)\",\n \"multi\": false\n }\n ],\n \"version\": \"3.0.0\"\n }\n}"
},
{
"path": "integrations/MinIO/markdown/README.md",
"content": "# MinIO\n\n参考 [使用 Prometheus 采集 MinIO 指标](https://min.io/docs/minio/linux/operations/monitoring/collect-minio-metrics-using-prometheus.html?ref=docs-redirect#minio-metrics-collect-using-prometheus)\n\n开启 MinIO Prometheus 访问;\n\n```bash\n# 启动 MinIO 服务的时候加入下面的变量:\nMINIO_PROMETHEUS_AUTH_TYPE=public\n```\n\n## 采集配置\n\ncategraf 的 `conf/input.prometheus/prometheus.toml`\n\n```toml\n[[instances]]\nurls = [\n \"http://192.168.1.188:9000/minio/v2/metrics/cluster\"\n]\nlabels = {job=\"minio-cluster\"}\n```\n"
},
{
"path": "integrations/MongoDB/alerts/mongo_by_exporter.json",
"content": "[\n {\n \"id\": 0,\n \"group_id\": 0,\n \"cate\": \"prometheus\",\n \"datasource_ids\": [\n 0\n ],\n \"cluster\": \"\",\n \"name\": \"Average MongoDB operation time exceeds 250 seconds - exporter\",\n \"note\": \"\",\n \"prod\": \"metric\",\n \"algorithm\": \"\",\n \"algo_params\": null,\n \"delay\": 0,\n \"severity\": 2,\n \"severities\": [\n 2\n ],\n \"disabled\": 1,\n \"prom_for_duration\": 600,\n \"prom_ql\": \"\",\n \"rule_config\": {\n \"algo_params\": null,\n \"inhibit\": false,\n \"prom_ql\": \"\",\n \"queries\": [\n {\n \"prom_ql\": \"rate(mongodb_mongod_op_latencies_latency_total[5m]) / rate(mongodb_mongod_op_latencies_ops_total[5m]) \\u003e 250000\",\n \"severity\": 2\n }\n ],\n \"severity\": 0\n },\n \"prom_eval_interval\": 15,\n \"enable_stime\": \"00:00\",\n \"enable_stimes\": [\n \"00:00\"\n ],\n \"enable_etime\": \"23:59\",\n \"enable_etimes\": [\n \"23:59\"\n ],\n \"enable_days_of_week\": [\n \"1\",\n \"2\",\n \"3\",\n \"4\",\n \"5\",\n \"6\",\n \"0\"\n ],\n \"enable_days_of_weeks\": [\n [\n \"1\",\n \"2\",\n \"3\",\n \"4\",\n \"5\",\n \"6\",\n \"0\"\n ]\n ],\n \"enable_in_bg\": 0,\n \"notify_recovered\": 1,\n \"notify_channels\": [],\n \"notify_groups_obj\": null,\n \"notify_groups\": null,\n \"notify_repeat_step\": 60,\n \"notify_max_number\": 0,\n \"recover_duration\": 0,\n \"callbacks\": [],\n \"runbook_url\": \"\",\n \"append_tags\": [\n \"alertname=MongoOperationHighLatency\"\n ],\n \"annotations\": null,\n \"extra_config\": null,\n \"create_at\": 0,\n \"create_by\": \"\",\n \"update_at\": 0,\n \"update_by\": \"\",\n \"uuid\": 1717556328060297000\n },\n {\n \"id\": 0,\n \"group_id\": 0,\n \"cate\": \"prometheus\",\n \"datasource_ids\": [\n 0\n ],\n \"cluster\": \"\",\n \"name\": \"Mongo connection number has exceeded 80% - exporter\",\n \"note\": \"\",\n \"prod\": \"metric\",\n \"algorithm\": \"\",\n \"algo_params\": null,\n \"delay\": 0,\n \"severity\": 2,\n \"severities\": [\n 2\n ],\n \"disabled\": 1,\n \"prom_for_duration\": 120,\n \"prom_ql\": \"\",\n \"rule_config\": {\n \"algo_params\": null,\n \"inhibit\": false,\n \"prom_ql\": \"\",\n \"queries\": [\n {\n \"prom_ql\": \"avg by (instance) (mongodb_connections{state=\\\"current\\\"}) / avg by (instance) (mongodb_connections{state=\\\"available\\\"}) * 100 \\u003e 80\",\n \"severity\": 2\n }\n ],\n \"severity\": 0\n },\n \"prom_eval_interval\": 15,\n \"enable_stime\": \"00:00\",\n \"enable_stimes\": [\n \"00:00\"\n ],\n \"enable_etime\": \"23:59\",\n \"enable_etimes\": [\n \"23:59\"\n ],\n \"enable_days_of_week\": [\n \"1\",\n \"2\",\n \"3\",\n \"4\",\n \"5\",\n \"6\",\n \"0\"\n ],\n \"enable_days_of_weeks\": [\n [\n \"1\",\n \"2\",\n \"3\",\n \"4\",\n \"5\",\n \"6\",\n \"0\"\n ]\n ],\n \"enable_in_bg\": 0,\n \"notify_recovered\": 1,\n \"notify_channels\": [],\n \"notify_groups_obj\": null,\n \"notify_groups\": null,\n \"notify_repeat_step\": 60,\n \"notify_max_number\": 0,\n \"recover_duration\": 0,\n \"callbacks\": [],\n \"runbook_url\": \"\",\n \"append_tags\": [\n \"alertname=MongoTooManyConnections(\\u003e80%)\"\n ],\n \"annotations\": null,\n \"extra_config\": null,\n \"create_at\": 0,\n \"create_by\": \"\",\n \"update_at\": 0,\n \"update_by\": \"\",\n \"uuid\": 1717556328060946000\n },\n {\n \"id\": 0,\n \"group_id\": 0,\n \"cate\": \"prometheus\",\n \"datasource_ids\": [\n 0\n ],\n \"cluster\": \"\",\n \"name\": \"Mongo has encountered an Assert error - exporter\",\n \"note\": \"\",\n \"prod\": \"metric\",\n \"algorithm\": \"\",\n \"algo_params\": null,\n \"delay\": 0,\n \"severity\": 3,\n \"severities\": [\n 3\n ],\n \"disabled\": 1,\n \"prom_for_duration\": 1800,\n \"prom_ql\": \"\",\n \"rule_config\": {\n \"algo_params\": null,\n \"inhibit\": false,\n \"prom_ql\": \"\",\n \"queries\": [\n {\n \"prom_ql\": \"rate(mongodb_asserts_total{type=~\\\"regular|message\\\"}[5m]) \\u003e 0\",\n \"severity\": 3\n }\n ],\n \"severity\": 0\n },\n \"prom_eval_interval\": 15,\n \"enable_stime\": \"00:00\",\n \"enable_stimes\": [\n \"00:00\"\n ],\n \"enable_etime\": \"23:59\",\n \"enable_etimes\": [\n \"23:59\"\n ],\n \"enable_days_of_week\": [\n \"1\",\n \"2\",\n \"3\",\n \"4\",\n \"5\",\n \"6\",\n \"0\"\n ],\n \"enable_days_of_weeks\": [\n [\n \"1\",\n \"2\",\n \"3\",\n \"4\",\n \"5\",\n \"6\",\n \"0\"\n ]\n ],\n \"enable_in_bg\": 0,\n \"notify_recovered\": 1,\n \"notify_channels\": [],\n \"notify_groups_obj\": null,\n \"notify_groups\": null,\n \"notify_repeat_step\": 60,\n \"notify_max_number\": 0,\n \"recover_duration\": 0,\n \"callbacks\": [],\n \"runbook_url\": \"\",\n \"append_tags\": [\n \"alertname=MongoAssertsDetected\"\n ],\n \"annotations\": null,\n \"extra_config\": null,\n \"create_at\": 0,\n \"create_by\": \"\",\n \"update_at\": 0,\n \"update_by\": \"\",\n \"uuid\": 1717556328061548000\n },\n {\n \"id\": 0,\n \"group_id\": 0,\n \"cate\": \"prometheus\",\n \"datasource_ids\": [\n 0\n ],\n \"cluster\": \"\",\n \"name\": \"Mongo has encountered cursor timeout - exporter\",\n \"note\": \"\",\n \"prod\": \"metric\",\n \"algorithm\": \"\",\n \"algo_params\": null,\n \"delay\": 0,\n \"severity\": 2,\n \"severities\": [\n 2\n ],\n \"disabled\": 1,\n \"prom_for_duration\": 1800,\n \"prom_ql\": \"\",\n \"rule_config\": {\n \"algo_params\": null,\n \"inhibit\": false,\n \"prom_ql\": \"\",\n \"queries\": [\n {\n \"prom_ql\": \"rate(mongodb_mongod_metrics_cursor_timed_out_total[5m]) \\u003e 0\",\n \"severity\": 2\n }\n ],\n \"severity\": 0\n },\n \"prom_eval_interval\": 15,\n \"enable_stime\": \"00:00\",\n \"enable_stimes\": [\n \"00:00\"\n ],\n \"enable_etime\": \"23:59\",\n \"enable_etimes\": [\n \"23:59\"\n ],\n \"enable_days_of_week\": [\n \"1\",\n \"2\",\n \"3\",\n \"4\",\n \"5\",\n \"6\",\n \"0\"\n ],\n \"enable_days_of_weeks\": [\n [\n \"1\",\n \"2\",\n \"3\",\n \"4\",\n \"5\",\n \"6\",\n \"0\"\n ]\n ],\n \"enable_in_bg\": 0,\n \"notify_recovered\": 1,\n \"notify_channels\": [],\n \"notify_groups_obj\": null,\n \"notify_groups\": null,\n \"notify_repeat_step\": 60,\n \"notify_max_number\": 0,\n \"recover_duration\": 0,\n \"callbacks\": [],\n \"runbook_url\": \"\",\n \"append_tags\": [\n \"alertname=MongoRecurrentCursorTimeout\"\n ],\n \"annotations\": null,\n \"extra_config\": null,\n \"create_at\": 0,\n \"create_by\": \"\",\n \"update_at\": 0,\n \"update_by\": \"\",\n \"uuid\": 1717556328062022000\n },\n {\n \"id\": 0,\n \"group_id\": 0,\n \"cate\": \"prometheus\",\n \"datasource_ids\": [\n 0\n ],\n \"cluster\": \"\",\n \"name\": \"Mongo has encountered page fault interrupt - exporter\",\n \"note\": \"\",\n \"prod\": \"metric\",\n \"algorithm\": \"\",\n \"algo_params\": null,\n \"delay\": 0,\n \"severity\": 2,\n \"severities\": [\n 2\n ],\n \"disabled\": 1,\n \"prom_for_duration\": 1800,\n \"prom_ql\": \"\",\n \"rule_config\": {\n \"algo_params\": null,\n \"inhibit\": false,\n \"prom_ql\": \"\",\n \"queries\": [\n {\n \"prom_ql\": \"rate(mongodb_extra_info_page_faults_total[5m]) \\u003e 0\",\n \"severity\": 2\n }\n ],\n \"severity\": 0\n },\n \"prom_eval_interval\": 15,\n \"enable_stime\": \"00:00\",\n \"enable_stimes\": [\n \"00:00\"\n ],\n \"enable_etime\": \"23:59\",\n \"enable_etimes\": [\n \"23:59\"\n ],\n \"enable_days_of_week\": [\n \"1\",\n \"2\",\n \"3\",\n \"4\",\n \"5\",\n \"6\",\n \"0\"\n ],\n \"enable_days_of_weeks\": [\n [\n \"1\",\n \"2\",\n \"3\",\n \"4\",\n \"5\",\n \"6\",\n \"0\"\n ]\n ],\n \"enable_in_bg\": 0,\n \"notify_recovered\": 1,\n \"notify_channels\": [],\n \"notify_groups_obj\": null,\n \"notify_groups\": null,\n \"notify_repeat_step\": 60,\n \"notify_max_number\": 0,\n \"recover_duration\": 0,\n \"callbacks\": [],\n \"runbook_url\": \"\",\n \"append_tags\": [\n \"alertname=MongoRecurrentMemoryPageFaults\"\n ],\n \"annotations\": null,\n \"extra_config\": null,\n \"create_at\": 0,\n \"create_by\": \"\",\n \"update_at\": 0,\n \"update_by\": \"\",\n \"uuid\": 1717556328062518000\n },\n {\n \"id\": 0,\n \"group_id\": 0,\n \"cate\": \"prometheus\",\n \"datasource_ids\": [\n 0\n ],\n \"cluster\": \"\",\n \"name\": \"Mongo has just restarted, please pay attention - exporter\",\n \"note\": \"\",\n \"prod\": \"metric\",\n \"algorithm\": \"\",\n \"algo_params\": null,\n \"delay\": 0,\n \"severity\": 3,\n \"severities\": [\n 3\n ],\n \"disabled\": 1,\n \"prom_for_duration\": 0,\n \"prom_ql\": \"\",\n \"rule_config\": {\n \"algo_params\": null,\n \"inhibit\": false,\n \"prom_ql\": \"\",\n \"queries\": [\n {\n \"prom_ql\": \"mongodb_instance_uptime_seconds \\u003c 60\",\n \"severity\": 3\n }\n ],\n \"severity\": 0\n },\n \"prom_eval_interval\": 15,\n \"enable_stime\": \"00:00\",\n \"enable_stimes\": [\n \"00:00\"\n ],\n \"enable_etime\": \"23:59\",\n \"enable_etimes\": [\n \"23:59\"\n ],\n \"enable_days_of_week\": [\n \"1\",\n \"2\",\n \"3\",\n \"4\",\n \"5\",\n \"6\",\n \"0\"\n ],\n \"enable_days_of_weeks\": [\n [\n \"1\",\n \"2\",\n \"3\",\n \"4\",\n \"5\",\n \"6\",\n \"0\"\n ]\n ],\n \"enable_in_bg\": 0,\n \"notify_recovered\": 1,\n \"notify_channels\": [],\n \"notify_groups_obj\": null,\n \"notify_groups\": null,\n \"notify_repeat_step\": 60,\n \"notify_max_number\": 0,\n \"recover_duration\": 0,\n \"callbacks\": [],\n \"runbook_url\": \"\",\n \"append_tags\": [\n \"alertname=MongoRestarted\"\n ],\n \"annotations\": null,\n \"extra_config\": null,\n \"create_at\": 0,\n \"create_by\": \"\",\n \"update_at\": 0,\n \"update_by\": \"\",\n \"uuid\": 1717556328063040000\n },\n {\n \"id\": 0,\n \"group_id\": 0,\n \"cate\": \"prometheus\",\n \"datasource_ids\": [\n 0\n ],\n \"cluster\": \"\",\n \"name\": \"Mongo instance has crashed - exporter\",\n \"note\": \"\",\n \"prod\": \"metric\",\n \"algorithm\": \"\",\n \"algo_params\": null,\n \"delay\": 0,\n \"severity\": 1,\n \"severities\": [\n 1\n ],\n \"disabled\": 1,\n \"prom_for_duration\": 0,\n \"prom_ql\": \"\",\n \"rule_config\": {\n \"algo_params\": null,\n \"inhibit\": false,\n \"prom_ql\": \"\",\n \"queries\": [\n {\n \"prom_ql\": \"MongoServerDown\",\n \"severity\": 1\n }\n ],\n \"severity\": 0\n },\n \"prom_eval_interval\": 15,\n \"enable_stime\": \"00:00\",\n \"enable_stimes\": [\n \"00:00\"\n ],\n \"enable_etime\": \"23:59\",\n \"enable_etimes\": [\n \"23:59\"\n ],\n \"enable_days_of_week\": [\n \"1\",\n \"2\",\n \"3\",\n \"4\",\n \"5\",\n \"6\",\n \"0\"\n ],\n \"enable_days_of_weeks\": [\n [\n \"1\",\n \"2\",\n \"3\",\n \"4\",\n \"5\",\n \"6\",\n \"0\"\n ]\n ],\n \"enable_in_bg\": 0,\n \"notify_recovered\": 1,\n \"notify_channels\": [],\n \"notify_groups_obj\": null,\n \"notify_groups\": null,\n \"notify_repeat_step\": 60,\n \"notify_max_number\": 0,\n \"recover_duration\": 0,\n \"callbacks\": [],\n \"runbook_url\": \"\",\n \"append_tags\": [\n \"alertname=MongoServerDown\"\n ],\n \"annotations\": null,\n \"extra_config\": null,\n \"create_at\": 0,\n \"create_by\": \"\",\n \"update_at\": 0,\n \"update_by\": \"\",\n \"uuid\": 1717556328063494000\n },\n {\n \"id\": 0,\n \"group_id\": 0,\n \"cate\": \"prometheus\",\n \"datasource_ids\": [\n 0\n ],\n \"cluster\": \"\",\n \"name\": \"Mongo replica set master-slave delay exceeds 30 seconds - exporter\",\n \"note\": \"\",\n \"prod\": \"metric\",\n \"algorithm\": \"\",\n \"algo_params\": null,\n \"delay\": 0,\n \"severity\": 1,\n \"severities\": [\n 1\n ],\n \"disabled\": 1,\n \"prom_for_duration\": 60,\n \"prom_ql\": \"\",\n \"rule_config\": {\n \"algo_params\": null,\n \"inhibit\": false,\n \"prom_ql\": \"\",\n \"queries\": [\n {\n \"prom_ql\": \"mongodb_mongod_replset_member_replication_lag \\u003e 30\",\n \"severity\": 1\n }\n ],\n \"severity\": 0\n },\n \"prom_eval_interval\": 15,\n \"enable_stime\": \"00:00\",\n \"enable_stimes\": [\n \"00:00\"\n ],\n \"enable_etime\": \"23:59\",\n \"enable_etimes\": [\n \"23:59\"\n ],\n \"enable_days_of_week\": [\n \"1\",\n \"2\",\n \"3\",\n \"4\",\n \"5\",\n \"6\",\n \"0\"\n ],\n \"enable_days_of_weeks\": [\n [\n \"1\",\n \"2\",\n \"3\",\n \"4\",\n \"5\",\n \"6\",\n \"0\"\n ]\n ],\n \"enable_in_bg\": 0,\n \"notify_recovered\": 1,\n \"notify_channels\": [],\n \"notify_groups_obj\": null,\n \"notify_groups\": null,\n \"notify_repeat_step\": 60,\n \"notify_max_number\": 0,\n \"recover_duration\": 0,\n \"callbacks\": [],\n \"runbook_url\": \"\",\n \"append_tags\": [\n \"alertname=MongoSlaveReplicationLag(\\u003e30s)\"\n ],\n \"annotations\": null,\n \"extra_config\": null,\n \"create_at\": 0,\n \"create_by\": \"\",\n \"update_at\": 0,\n \"update_by\": \"\",\n \"uuid\": 1717556328063925000\n }\n]"
},
{
"path": "integrations/MongoDB/collect/mongodb/mongodb.toml",
"content": "[[instances]]\n# log level, enum: panic, fatal, error, warn, warning, info, debug, trace, defaults to info.\nlog_level = \"info\"\n# append some const labels to metrics\n# NOTICE! the instance label is required for dashboards\nlabels = { instance=\"mongo-cluster-01\" }\n\n# mongodb dsn, see https://www.mongodb.com/docs/manual/reference/connection-string/\n# mongodb_uri = \"mongodb://127.0.0.1:27017\"\nmongodb_uri = \"\"\n# if you don't specify the username or password in the mongodb_uri, you can set here. \n# This will overwrite the dsn, it would be helpful when special characters existing in the username or password and you don't want to encode them.\n# NOTICE! this user must be granted enough rights to query needed stats, see ../inputs/mongodb/README.md\nusername = \"username@Bj\"\npassword = \"password@Bj\"\n# if set to true, use the direct connection way\n# direct_connect = true\n\n# collect all means you collect all the metrics, if set, all below enable_xxx flags in this section will be ignored\ncollect_all = true\n# if set to true, collect databases metrics\n# enable_db_stats = true\n# if set to true, collect getDiagnosticData metrics\n# enable_diagnostic_data = true\n# if set to true, collect replSetGetStatus metrics\n# enable_replicaset_status = true\n# if set to true, collect top metrics by admin command\n# enable_top_metrics = true\n# if set to true, collect index metrics. You should specify one of the coll_stats_namespaces and the discovering_mode flags.\n# enable_index_stats = true\n# if set to true, collect collections metrics. You should specify one of the coll_stats_namespaces and the discovering_mode flags.\n# enable_coll_stats = true\n\n# Only get stats for the collections matching this list of namespaces. if none set, discovering_mode will be enabled.\n# Example: db1.col1,db.col1\n# coll_stats_namespaces = []\n# Only get stats for index with the collections matching this list of namespaces.\n# Example: db1.col1,db.col1\n# index_stats_collections = []\n# if set to true, replace -1 to DESC for label key_name of the descending_index metrics\n# enable_override_descending_index = true\n\n# which exposes metrics with 0.1x compatible metric names has been implemented which simplifies migration from the old version to the current version.\n# compatible_mode = true\n\n\n# [[instances]]\n# # interval = global.interval * interval_times\n# interval_times = 1\n\n# log_level = \"error\"\n\n# append some labels to metrics\n# labels = { instance=\"mongo-cluster-02\" }\n# mongodb_uri = \"mongodb://username:password@127.0.0.1:27017\"\n# collect_all = true\n# compatible_mode = true"
},
{
"path": "integrations/MongoDB/dashboards/mongo_by_exporter.json",
"content": "{\n \"name\": \"MongoDB Overview by exporter\",\n \"tags\": \"Prometheus MongoDB\",\n \"ident\": \"\",\n \"configs\": {\n \"panels\": [\n {\n \"collapsed\": true,\n \"id\": \"939298f2-b21f-4e2f-9142-c10946cc4032\",\n \"layout\": {\n \"h\": 1,\n \"i\": \"939298f2-b21f-4e2f-9142-c10946cc4032\",\n \"isResizable\": false,\n \"w\": 24,\n \"x\": 0,\n \"y\": 0\n },\n \"name\": \"Basic Info\",\n \"type\": \"row\"\n },\n {\n \"custom\": {\n \"calc\": \"lastNotNull\",\n \"colSpan\": 1,\n \"colorMode\": \"value\",\n \"textMode\": \"value\",\n \"textSize\": {},\n \"valueField\": \"Value\"\n },\n \"datasourceCate\": \"prometheus\",\n \"datasourceValue\": \"${prom}\",\n \"description\": \"instance count\",\n \"id\": \"91970d24-3f04-4424-a1ed-73e7d28f5706\",\n \"layout\": {\n \"h\": 7,\n \"i\": \"91970d24-3f04-4424-a1ed-73e7d28f5706\",\n \"isResizable\": true,\n \"w\": 6,\n \"x\": 0,\n \"y\": 1\n },\n \"name\": \"Up\",\n \"options\": {\n \"standardOptions\": {\n \"util\": \"none\"\n },\n \"thresholds\": {\n \"steps\": [\n {\n \"color\": \"#634CD9\",\n \"type\": \"base\",\n \"value\": null\n }\n ]\n },\n \"valueMappings\": [\n {\n \"match\": {\n \"from\": 1,\n \"special\": 1\n },\n \"result\": {\n \"color\": \"#53b503\",\n \"text\": \"UP\"\n },\n \"type\": \"special\"\n }\n ]\n },\n \"targets\": [\n {\n \"expr\": \"mongodb_up{instance=\\\"$instance\\\"}\",\n \"refId\": \"A\"\n }\n ],\n \"type\": \"stat\",\n \"version\": \"2.0.0\"\n },\n {\n \"custom\": {\n \"calc\": \"lastNotNull\",\n \"colSpan\": 1,\n \"colorMode\": \"value\",\n \"textMode\": \"value\",\n \"textSize\": {\n \"title\": null\n },\n \"valueField\": \"Value\"\n },\n \"datasourceCate\": \"prometheus\",\n \"datasourceValue\": \"${prom}\",\n \"description\": \"Uptime\",\n \"id\": \"c7b52e8e-b417-4c61-a15e-e2f186fccd67\",\n \"layout\": {\n \"h\": 7,\n \"i\": \"c7b52e8e-b417-4c61-a15e-e2f186fccd67\",\n \"isResizable\": true,\n \"w\": 6,\n \"x\": 6,\n \"y\": 1\n },\n \"name\": \"Uptime\",\n \"options\": {\n \"standardOptions\": {\n \"util\": \"humantimeSeconds\"\n },\n \"thresholds\": {\n \"steps\": [\n {\n \"color\": \"#634CD9\",\n \"type\": \"base\",\n \"value\": null\n }\n ]\n },\n \"valueMappings\": [\n {\n \"match\": {\n \"to\": 1800\n },\n \"result\": {\n \"color\": \"#ec7718\"\n },\n \"type\": \"range\"\n },\n {\n \"match\": {\n \"from\": 1800\n },\n \"result\": {\n \"color\": \"#53b503\"\n },\n \"type\": \"range\"\n }\n ]\n },\n \"targets\": [\n {\n \"expr\": \"mongodb_ss_uptime{instance=\\\"$instance\\\"}\",\n \"refId\": \"A\"\n }\n ],\n \"type\": \"stat\",\n \"version\": \"2.0.0\"\n },\n {\n \"type\": \"timeseries\",\n \"id\": \"8446dded-9e11-4ee9-bdad-769b193ddf3e\",\n \"layout\": {\n \"h\": 7,\n \"i\": \"8446dded-9e11-4ee9-bdad-769b193ddf3e\",\n \"isResizable\": true,\n \"w\": 6,\n \"x\": 12,\n \"y\": 1\n },\n \"version\": \"3.0.0\",\n \"datasourceCate\": \"prometheus\",\n \"datasourceValue\": \"${prom}\",\n \"targets\": [\n {\n \"expr\": \"mongodb_ss_mem_resident{instance='$instance'} * 1024 * 1024\",\n \"legend\": \"{{type}}\",\n \"refId\": \"A\",\n \"maxDataPoints\": 240\n }\n ],\n \"transformations\": [\n {\n \"id\": \"organize\",\n \"options\": {}\n }\n ],\n \"name\": \"Memory\",\n \"description\": \"Memory usage (MiB)\",\n \"maxPerRow\": 4,\n \"options\": {\n \"tooltip\": {\n \"mode\": \"all\",\n \"sort\": \"desc\"\n },\n \"legend\": {\n \"displayMode\": \"hidden\",\n \"heightInPercentage\": 30,\n \"placement\": \"bottom\",\n \"behaviour\": \"showItem\",\n \"selectMode\": \"single\"\n },\n \"standardOptions\": {\n \"util\": \"bytesIEC\"\n },\n \"thresholds\": {\n \"steps\": [\n {\n \"color\": \"#634CD9\",\n \"value\": null,\n \"type\": \"base\"\n }\n ]\n }\n },\n \"custom\": {\n \"drawStyle\": \"lines\",\n \"lineInterpolation\": \"smooth\",\n \"spanNulls\": false,\n \"lineWidth\": 2,\n \"fillOpacity\": 0.3,\n \"gradientMode\": \"opacity\",\n \"stack\": \"off\",\n \"scaleDistribution\": {\n \"type\": \"linear\"\n },\n \"showPoints\": \"none\",\n \"pointSize\": 5\n },\n \"overrides\": [\n {\n \"matcher\": {\n \"id\": \"byFrameRefID\"\n },\n \"properties\": {\n \"rightYAxisDisplay\": \"off\"\n }\n }\n ]\n },\n {\n \"custom\": {\n \"drawStyle\": \"lines\",\n \"fillOpacity\": 0.3,\n \"gradientMode\": \"opacity\",\n \"lineInterpolation\": \"smooth\",\n \"lineWidth\": 2,\n \"scaleDistribution\": {\n \"type\": \"linear\"\n },\n \"spanNulls\": false,\n \"stack\": \"off\"\n },\n \"datasourceCate\": \"prometheus\",\n \"datasourceValue\": \"${prom}\",\n \"description\": \"Page faults indicate that requests are processed from disk either because an index is missing or there is not enough memory for the data set. Consider increasing memory or sharding out.\",\n \"id\": \"3eda28e7-2480-4ddc-b346-89ced1c33034\",\n \"layout\": {\n \"h\": 7,\n \"i\": \"3eda28e7-2480-4ddc-b346-89ced1c33034\",\n \"isResizable\": true,\n \"w\": 6,\n \"x\": 18,\n \"y\": 1\n },\n \"name\": \"Page Faults\",\n \"options\": {\n \"legend\": {\n \"displayMode\": \"hidden\"\n },\n \"standardOptions\": {\n \"decimals\": null,\n \"util\": \"none\"\n },\n \"thresholds\": {\n \"steps\": [\n {\n \"color\": \"#634CD9\",\n \"type\": \"base\",\n \"value\": null\n }\n ]\n },\n \"tooltip\": {\n \"mode\": \"all\",\n \"sort\": \"desc\"\n }\n },\n \"targets\": [\n {\n \"expr\": \"rate(mongodb_ss_extra_info_page_faults{instance=\\\"$instance\\\"}[5m])\",\n \"legend\": \"{{type}}\",\n \"refId\": \"A\"\n }\n ],\n \"type\": \"timeseries\",\n \"version\": \"2.0.0\"\n },\n {\n \"custom\": {\n \"drawStyle\": \"lines\",\n \"fillOpacity\": 0.3,\n \"gradientMode\": \"opacity\",\n \"lineInterpolation\": \"smooth\",\n \"lineWidth\": 2,\n \"scaleDistribution\": {\n \"type\": \"linear\"\n },\n \"spanNulls\": false,\n \"stack\": \"off\"\n },\n \"datasourceCate\": \"prometheus\",\n \"datasourceValue\": \"${prom}\",\n \"description\": \"Network traffic (bytes)\",\n \"id\": \"528d0485-f947-470d-95f3-59eae157ebb6\",\n \"layout\": {\n \"h\": 7,\n \"i\": \"528d0485-f947-470d-95f3-59eae157ebb6\",\n \"isResizable\": true,\n \"w\": 6,\n \"x\": 0,\n \"y\": 8\n },\n \"name\": \"Network I/O\",\n \"options\": {\n \"legend\": {\n \"displayMode\": \"hidden\"\n },\n \"standardOptions\": {\n \"util\": \"bytesSI\"\n },\n \"thresholds\": {\n \"steps\": [\n {\n \"color\": \"#634CD9\",\n \"type\": \"base\",\n \"value\": null\n }\n ]\n },\n \"tooltip\": {\n \"mode\": \"all\",\n \"sort\": \"none\"\n }\n },\n \"targets\": [\n {\n \"expr\": \"rate(mongodb_ss_network_bytesOut{cluster='$cluster'}[5m])\",\n \"legend\": \"bytesOut\",\n \"refId\": \"A\"\n },\n {\n \"expr\": \"rate(mongodb_ss_network_bytesIn{instance='$instance'}[5m])\",\n \"legend\": \"bytesIn\",\n \"refId\": \"B\"\n }\n ],\n \"type\": \"timeseries\",\n \"version\": \"2.0.0\"\n },\n {\n \"custom\": {\n \"drawStyle\": \"lines\",\n \"fillOpacity\": 0.3,\n \"gradientMode\": \"opacity\",\n \"lineInterpolation\": \"smooth\",\n \"lineWidth\": 2,\n \"scaleDistribution\": {\n \"type\": \"linear\"\n },\n \"spanNulls\": false,\n \"stack\": \"off\"\n },\n \"datasourceCate\": \"prometheus\",\n \"datasourceValue\": \"${prom}\",\n \"description\": \"Number of connections Keep in mind the hard limit on the maximum number of connections set by your distribution.\",\n \"id\": \"067e97c3-4e57-447f-a9dc-a49627b6ce18\",\n \"layout\": {\n \"h\": 7,\n \"i\": \"067e97c3-4e57-447f-a9dc-a49627b6ce18\",\n \"isResizable\": true,\n \"w\": 6,\n \"x\": 6,\n \"y\": 8\n },\n \"name\": \"Connections\",\n \"options\": {\n \"legend\": {\n \"displayMode\": \"hidden\"\n },\n \"standardOptions\": {},\n \"thresholds\": {\n \"steps\": [\n {\n \"color\": \"#634CD9\",\n \"type\": \"base\",\n \"value\": null\n }\n ]\n },\n \"tooltip\": {\n \"mode\": \"all\",\n \"sort\": \"none\"\n }\n },\n \"targets\": [\n {\n \"expr\": \"mongodb_ss_connections{instance=\\\"$instance\\\", conn_type=\\\"current\\\"}\",\n \"legend\": \"Connections\",\n \"refId\": \"A\"\n }\n ],\n \"type\": \"timeseries\",\n \"version\": \"2.0.0\"\n },\n {\n \"custom\": {\n \"drawStyle\": \"lines\",\n \"fillOpacity\": 0.3,\n \"gradientMode\": \"opacity\",\n \"lineInterpolation\": \"smooth\",\n \"lineWidth\": 2,\n \"scaleDistribution\": {\n \"type\": \"linear\"\n },\n \"spanNulls\": false,\n \"stack\": \"off\"\n },\n \"datasourceCate\": \"prometheus\",\n \"datasourceValue\": \"${prom}\",\n \"description\": \"Number of assertion errors, Asserts are not important by themselves, but you can correlate spikes with other graphs.\",\n \"id\": \"9e9b7356-cf0e-4e5f-95f5-00258c576bf4\",\n \"layout\": {\n \"h\": 7,\n \"i\": \"9e9b7356-cf0e-4e5f-95f5-00258c576bf4\",\n \"isResizable\": true,\n \"w\": 6,\n \"x\": 12,\n \"y\": 8\n },\n \"name\": \"Assert Events\",\n \"options\": {\n \"legend\": {\n \"displayMode\": \"hidden\"\n },\n \"standardOptions\": {},\n \"thresholds\": {\n \"steps\": [\n {\n \"color\": \"#634CD9\",\n \"type\": \"base\",\n \"value\": null\n }\n ]\n },\n \"tooltip\": {\n \"mode\": \"all\",\n \"sort\": \"none\"\n }\n },\n \"targets\": [\n {\n \"expr\": \"rate(mongodb_ss_asserts{instance=\\\"$instance\\\"}[5m])\",\n \"legend\": \"{{assert_type}}\",\n \"refId\": \"A\"\n }\n ],\n \"type\": \"timeseries\",\n \"version\": \"2.0.0\"\n },\n {\n \"custom\": {\n \"drawStyle\": \"lines\",\n \"fillOpacity\": 0.3,\n \"gradientMode\": \"opacity\",\n \"lineInterpolation\": \"smooth\",\n \"lineWidth\": 2,\n \"scaleDistribution\": {\n \"type\": \"linear\"\n },\n \"spanNulls\": false,\n \"stack\": \"off\"\n },\n \"datasourceCate\": \"prometheus\",\n \"datasourceValue\": \"${prom}\",\n \"description\": \"Number of operations waiting to acquire locks, Any number of queued operations for long periods of time is an indication of possible issues. Find the cause and fix it before requests get stuck in the queue.\",\n \"id\": \"2698f0f8-a76a-499b-99cf-30504f0f4db6\",\n \"layout\": {\n \"h\": 7,\n \"i\": \"2698f0f8-a76a-499b-99cf-30504f0f4db6\",\n \"isResizable\": true,\n \"w\": 6,\n \"x\": 18,\n \"y\": 8\n },\n \"name\": \"Lock Queue\",\n \"options\": {\n \"legend\": {\n \"displayMode\": \"hidden\"\n },\n \"standardOptions\": {},\n \"thresholds\": {\n \"steps\": [\n {\n \"color\": \"#634CD9\",\n \"type\": \"base\",\n \"value\": null\n }\n ]\n },\n \"tooltip\": {\n \"mode\": \"all\",\n \"sort\": \"none\"\n }\n },\n \"targets\": [\n {\n \"expr\": \"mongodb_ss_globalLock_currentQueue{instance=\\\"$instance\\\"}\",\n \"legend\": \"{{count_type}}\",\n \"refId\": \"A\"\n }\n ],\n \"type\": \"timeseries\",\n \"version\": \"2.0.0\"\n },\n {\n \"collapsed\": true,\n \"id\": \"2bdb8cc9-92f4-449e-8f70-a4c470a21604\",\n \"layout\": {\n \"h\": 1,\n \"i\": \"2bdb8cc9-92f4-449e-8f70-a4c470a21604\",\n \"isResizable\": false,\n \"w\": 24,\n \"x\": 0,\n \"y\": 15\n },\n \"name\": \"Operation Info\",\n \"type\": \"row\"\n },\n {\n \"custom\": {\n \"drawStyle\": \"lines\",\n \"fillOpacity\": 0.3,\n \"gradientMode\": \"opacity\",\n \"lineInterpolation\": \"smooth\",\n \"lineWidth\": 2,\n \"scaleDistribution\": {\n \"type\": \"linear\"\n },\n \"spanNulls\": false,\n \"stack\": \"off\"\n },\n \"datasourceCate\": \"prometheus\",\n \"datasourceValue\": \"${prom}\",\n \"description\": \"Number of requests received Shows how many times a command is executed per second on average during the selected interval.\",\n \"id\": \"c2819508-95e7-4c63-aeae-ce19f92469cd\",\n \"layout\": {\n \"h\": 7,\n \"i\": \"c2819508-95e7-4c63-aeae-ce19f92469cd\",\n \"isResizable\": true,\n \"w\": 12,\n \"x\": 0,\n \"y\": 16\n },\n \"name\": \"Command Operations\",\n \"options\": {\n \"legend\": {\n \"displayMode\": \"hidden\"\n },\n \"standardOptions\": {},\n \"thresholds\": {\n \"steps\": [\n {\n \"color\": \"#634CD9\",\n \"type\": \"base\",\n \"value\": null\n }\n ]\n },\n \"tooltip\": {\n \"mode\": \"all\",\n \"sort\": \"desc\"\n }\n },\n \"targets\": [\n {\n \"expr\": \"rate(mongodb_ss_opcounters{instance=\\\"$instance\\\", legacy_op_type!=\\\"command\\\"}[5m])\",\n \"legend\": \"{{legacy_op_type}}\",\n \"refId\": \"A\"\n },\n {\n \"expr\": \"rate(mongodb_ss_opcountersRepl{instance=\\\"$instance\\\", legacy_op_type!~\\\"(command|query|getmore)\\\"}[5m]) or \\nrate(mongodb_ss_opcountersRepl{instance=\\\"$instance\\\", legacy_op_type!~\\\"(command|query|getmore)\\\"}[5m])\",\n \"legend\": \"repl_{{legacy_op_type}}\",\n \"refId\": \"B\"\n },\n {\n \"expr\": \"rate(mongodb_ss_metrics_ttl_deletedDocuments{instance=\\\"$instance\\\"}[5m]) or \\nrate(mongodb_ss_metrics_ttl_deletedDocuments{instance=\\\"$instance\\\"}[5m])\",\n \"legend\": \"ttl_delete\",\n \"refId\": \"C\"\n }\n ],\n \"type\": \"timeseries\",\n \"version\": \"2.0.0\"\n },\n {\n \"type\": \"timeseries\",\n \"id\": \"7030d97a-d69f-4916-a415-ec57503ab1ed\",\n \"layout\": {\n \"h\": 7,\n \"i\": \"7030d97a-d69f-4916-a415-ec57503ab1ed\",\n \"isResizable\": true,\n \"w\": 12,\n \"x\": 12,\n \"y\": 16\n },\n \"version\": \"3.0.0\",\n \"datasourceCate\": \"prometheus\",\n \"datasourceValue\": \"${prom}\",\n \"targets\": [\n {\n \"expr\": \"rate(mongodb_ss_metrics_document{instance=\\\"$instance\\\"}[5m])\",\n \"legend\": \"\",\n \"refId\": \"A\",\n \"maxDataPoints\": 240\n }\n ],\n \"transformations\": [\n {\n \"id\": \"organize\",\n \"options\": {}\n }\n ],\n \"name\": \"Document Operations\",\n \"description\": \"Number of document operations When used in combination with 'Command Operations', this graph can help identify write amplification. For example, when one insert or update command actually inserts or updates hundreds, thousands, or even millions of documents.\",\n \"maxPerRow\": 4,\n \"options\": {\n \"tooltip\": {\n \"mode\": \"all\",\n \"sort\": \"none\"\n },\n \"legend\": {\n \"displayMode\": \"hidden\",\n \"heightInPercentage\": 30,\n \"placement\": \"bottom\",\n \"behaviour\": \"showItem\",\n \"selectMode\": \"single\"\n },\n \"standardOptions\": {},\n \"thresholds\": {\n \"steps\": [\n {\n \"color\": \"#634CD9\",\n \"value\": null,\n \"type\": \"base\"\n }\n ]\n }\n },\n \"custom\": {\n \"drawStyle\": \"lines\",\n \"lineInterpolation\": \"smooth\",\n \"spanNulls\": false,\n \"lineWidth\": 2,\n \"fillOpacity\": 0.3,\n \"gradientMode\": \"opacity\",\n \"stack\": \"off\",\n \"scaleDistribution\": {\n \"type\": \"linear\"\n },\n \"showPoints\": \"none\",\n \"pointSize\": 5\n },\n \"overrides\": [\n {\n \"matcher\": {\n \"id\": \"byFrameRefID\"\n },\n \"properties\": {\n \"rightYAxisDisplay\": \"off\"\n }\n }\n ]\n },\n {\n \"type\": \"timeseries\",\n \"id\": \"1c3b73d5-c25c-449f-995d-26acc9c621e1\",\n \"layout\": {\n \"h\": 7,\n \"i\": \"1c3b73d5-c25c-449f-995d-26acc9c621e1\",\n \"isResizable\": true,\n \"w\": 8,\n \"x\": 0,\n \"y\": 23\n },\n \"version\": \"3.0.0\",\n \"datasourceCate\": \"prometheus\",\n \"datasourceValue\": \"${prom}\",\n \"targets\": [\n {\n \"expr\": \"rate(mongodb_ss_opLatencies_latency{instance='$instance'}[5m]) / rate(mongodb_ss_opLatencies_latency{instance='$instance'}[5m]) / 1000\",\n \"legend\": \"{{op_type}}\",\n \"refId\": \"A\",\n \"maxDataPoints\": 240\n }\n ],\n \"transformations\": [\n {\n \"id\": \"organize\",\n \"options\": {}\n }\n ],\n \"name\": \"Response Time\",\n \"description\": \"Operation detail processing time (milliseconds)\",\n \"maxPerRow\": 4,\n \"options\": {\n \"tooltip\": {\n \"mode\": \"all\",\n \"sort\": \"none\"\n },\n \"legend\": {\n \"displayMode\": \"hidden\",\n \"heightInPercentage\": 30,\n \"placement\": \"bottom\",\n \"behaviour\": \"showItem\",\n \"selectMode\": \"single\"\n },\n \"standardOptions\": {\n \"util\": \"milliseconds\"\n },\n \"thresholds\": {\n \"steps\": [\n {\n \"color\": \"#634CD9\",\n \"value\": null,\n \"type\": \"base\"\n }\n ]\n }\n },\n \"custom\": {\n \"drawStyle\": \"lines\",\n \"lineInterpolation\": \"smooth\",\n \"spanNulls\": false,\n \"lineWidth\": 2,\n \"fillOpacity\": 0.3,\n \"gradientMode\": \"opacity\",\n \"stack\": \"off\",\n \"scaleDistribution\": {\n \"type\": \"linear\"\n },\n \"showPoints\": \"none\",\n \"pointSize\": 5\n },\n \"overrides\": [\n {\n \"matcher\": {\n \"id\": \"byFrameRefID\"\n },\n \"properties\": {\n \"rightYAxisDisplay\": \"off\"\n }\n }\n ]\n },\n {\n \"custom\": {\n \"drawStyle\": \"lines\",\n \"fillOpacity\": 0.3,\n \"gradientMode\": \"opacity\",\n \"lineInterpolation\": \"smooth\",\n \"lineWidth\": 2,\n \"scaleDistribution\": {\n \"type\": \"linear\"\n },\n \"spanNulls\": false,\n \"stack\": \"off\"\n },\n \"datasourceCate\": \"prometheus\",\n \"datasourceValue\": \"${prom}\",\n \"description\": \"\",\n \"id\": \"e642183c-8ba2-4f60-abc6-c65de49e7577\",\n \"layout\": {\n \"h\": 7,\n \"i\": \"e642183c-8ba2-4f60-abc6-c65de49e7577\",\n \"isResizable\": true,\n \"w\": 8,\n \"x\": 8,\n \"y\": 23\n },\n \"name\": \"Query Efficiency\",\n \"options\": {\n \"legend\": {\n \"displayMode\": \"hidden\"\n },\n \"standardOptions\": {\n \"util\": \"percentUnit\"\n },\n \"thresholds\": {\n \"steps\": [\n {\n \"color\": \"#634CD9\",\n \"type\": \"base\",\n \"value\": null\n }\n ]\n },\n \"tooltip\": {\n \"mode\": \"all\",\n \"sort\": \"none\"\n }\n },\n \"targets\": [\n {\n \"expr\": \"sum(increase(mongodb_ss_metrics_queryExecutor_scannedObjects{instance=\\\"$instance\\\"}[5m])) / sum(increase(mongodb_ss_metrics_document{instance=\\\"$instance\\\", doc_op_type=\\\"returned\\\"}[5m]))\",\n \"legend\": \"Document\",\n \"refId\": \"A\"\n },\n {\n \"expr\": \"sum(increase(mongodb_ss_metrics_queryExecutor_scanned{instance=\\\"$instance\\\"}[5m])) / sum(increase(mongodb_ss_metrics_document{instance=\\\"$instance\\\", doc_op_type=\\\"returned\\\"}[5m]))\",\n \"legend\": \"Index\",\n \"refId\": \"B\"\n }\n ],\n \"type\": \"timeseries\",\n \"version\": \"2.0.0\"\n },\n {\n \"custom\": {\n \"drawStyle\": \"lines\",\n \"fillOpacity\": 0.3,\n \"gradientMode\": \"opacity\",\n \"lineInterpolation\": \"smooth\",\n \"lineWidth\": 2,\n \"scaleDistribution\": {\n \"type\": \"linear\"\n },\n \"spanNulls\": false,\n \"stack\": \"off\"\n },\n \"datasourceCate\": \"prometheus\",\n \"datasourceValue\": \"${prom}\",\n \"description\": \"number of cursors Helps identify why connections are increasing. Shows active cursors compared to cursors being automatically killed after 10 minutes due to an application not closing the connection.\",\n \"id\": \"8b5a4f44-3291-4822-ab73-f56be6c62674\",\n \"layout\": {\n \"h\": 7,\n \"i\": \"8b5a4f44-3291-4822-ab73-f56be6c62674\",\n \"isResizable\": true,\n \"w\": 8,\n \"x\": 16,\n \"y\": 23\n },\n \"name\": \"Cursors\",\n \"options\": {\n \"legend\": {\n \"displayMode\": \"hidden\"\n },\n \"standardOptions\": {},\n \"thresholds\": {\n \"steps\": [\n {\n \"color\": \"#634CD9\",\n \"type\": \"base\",\n \"value\": null\n }\n ]\n },\n \"tooltip\": {\n \"mode\": \"all\",\n \"sort\": \"none\"\n }\n },\n \"targets\": [\n {\n \"expr\": \"mongodb_ss_metrics_cursor_open{instance=\\\"$instance\\\"}\",\n \"legend\": \"{{csr_type}}\",\n \"refId\": \"A\"\n }\n ],\n \"type\": \"timeseries\",\n \"version\": \"2.0.0\"\n },\n {\n \"collapsed\": true,\n \"id\": \"06946b19-94b4-4f72-bd87-70f87989257d\",\n \"layout\": {\n \"h\": 1,\n \"i\": \"06946b19-94b4-4f72-bd87-70f87989257d\",\n \"isResizable\": false,\n \"w\": 24,\n \"x\": 0,\n \"y\": 30\n },\n \"name\": \"Cache Info\",\n \"panels\": [],\n \"type\": \"row\"\n },\n {\n \"type\": \"timeseries\",\n \"id\": \"bb0ae571-43a1-430b-8f63-256f6f1ebee6\",\n \"layout\": {\n \"h\": 7,\n \"i\": \"bb0ae571-43a1-430b-8f63-256f6f1ebee6\",\n \"isResizable\": true,\n \"w\": 6,\n \"x\": 0,\n \"y\": 31\n },\n \"version\": \"3.0.0\",\n \"datasourceCate\": \"prometheus\",\n \"datasourceValue\": \"${prom}\",\n \"targets\": [\n {\n \"expr\": \"mongodb_ss_wt_cache_bytes_currently_in_the_cache{instance='$instance'}\",\n \"legend\": \"total\",\n \"refId\": \"A\",\n \"maxDataPoints\": 240\n },\n {\n \"expr\": \"mongodb_ss_wt_cache_tracked_dirty_bytes_in_the_cache{cluster='$cluster'}\",\n \"legend\": \"dirty\",\n \"refId\": \"B\",\n \"maxDataPoints\": 240\n },\n {\n \"expr\": \"mongodb_ss_wt_cache_tracked_bytes_belonging_to_internal_pages_in_the_cache{cluster='$cluster'}\",\n \"legend\": \"internal_pages\",\n \"refId\": \"C\",\n \"maxDataPoints\": 240\n },\n {\n \"expr\": \"mongodb_ss_wt_cache_tracked_bytes_belonging_to_leaf_pages_in_the_cache{cluster='$cluster'}\",\n \"legend\": \"leaf_pages\",\n \"refId\": \"D\",\n \"maxDataPoints\": 240\n }\n ],\n \"transformations\": [\n {\n \"id\": \"organize\",\n \"options\": {}\n }\n ],\n \"name\": \"Cache Size\",\n \"description\": \"cache size (byte)\",\n \"maxPerRow\": 4,\n \"options\": {\n \"tooltip\": {\n \"mode\": \"all\",\n \"sort\": \"none\"\n },\n \"legend\": {\n \"displayMode\": \"hidden\",\n \"heightInPercentage\": 30,\n \"placement\": \"bottom\",\n \"behaviour\": \"showItem\",\n \"selectMode\": \"single\"\n },\n \"standardOptions\": {\n \"util\": \"bytesIEC\"\n },\n \"thresholds\": {\n \"steps\": [\n {\n \"color\": \"#634CD9\",\n \"value\": null,\n \"type\": \"base\"\n }\n ]\n }\n },\n \"custom\": {\n \"drawStyle\": \"lines\",\n \"lineInterpolation\": \"smooth\",\n \"spanNulls\": false,\n \"lineWidth\": 2,\n \"fillOpacity\": 0.3,\n \"gradientMode\": \"opacity\",\n \"stack\": \"off\",\n \"scaleDistribution\": {\n \"type\": \"linear\"\n },\n \"showPoints\": \"none\",\n \"pointSize\": 5\n },\n \"overrides\": [\n {\n \"matcher\": {\n \"id\": \"byFrameRefID\"\n },\n \"properties\": {\n \"rightYAxisDisplay\": \"off\"\n }\n }\n ]\n },\n {\n \"type\": \"timeseries\",\n \"id\": \"f1ffd169-2a1a-42bc-9647-0e6621be0fef\",\n \"layout\": {\n \"h\": 7,\n \"i\": \"f1ffd169-2a1a-42bc-9647-0e6621be0fef\",\n \"isResizable\": true,\n \"w\": 6,\n \"x\": 6,\n \"y\": 31\n },\n \"version\": \"3.0.0\",\n \"datasourceCate\": \"prometheus\",\n \"datasourceValue\": \"${prom}\",\n \"targets\": [\n {\n \"expr\": \"rate(mongodb_ss_wt_cache_bytes_read_into_cache{instance='$instance'}[5m])\",\n \"legend\": \"read\",\n \"refId\": \"A\",\n \"maxDataPoints\": 240\n },\n {\n \"expr\": \"rate(mongodb_ss_wt_cache_bytes_written_from_cache{cluster='$cluster'}[5m])\",\n \"legend\": \"written\",\n \"refId\": \"B\",\n \"maxDataPoints\": 240\n }\n ],\n \"transformations\": [\n {\n \"id\": \"organize\",\n \"options\": {}\n }\n ],\n \"name\": \"Cache I/O\",\n \"description\": \"size of cached data written or read (in bytes)\",\n \"maxPerRow\": 4,\n \"options\": {\n \"tooltip\": {\n \"mode\": \"all\",\n \"sort\": \"none\"\n },\n \"legend\": {\n \"displayMode\": \"hidden\",\n \"heightInPercentage\": 30,\n \"placement\": \"bottom\",\n \"behaviour\": \"showItem\",\n \"selectMode\": \"single\"\n },\n \"standardOptions\": {\n \"util\": \"bytesSI\"\n },\n \"thresholds\": {\n \"steps\": [\n {\n \"color\": \"#634CD9\",\n \"value\": null,\n \"type\": \"base\"\n }\n ]\n }\n },\n \"custom\": {\n \"drawStyle\": \"lines\",\n \"lineInterpolation\": \"smooth\",\n \"spanNulls\": false,\n \"lineWidth\": 2,\n \"fillOpacity\": 0.3,\n \"gradientMode\": \"opacity\",\n \"stack\": \"off\",\n \"scaleDistribution\": {\n \"type\": \"linear\"\n },\n \"showPoints\": \"none\",\n \"pointSize\": 5\n },\n \"overrides\": [\n {\n \"matcher\": {\n \"id\": \"byFrameRefID\"\n },\n \"properties\": {\n \"rightYAxisDisplay\": \"off\"\n }\n }\n ]\n },\n {\n \"type\": \"timeseries\",\n \"id\": \"43ee140d-ae6d-474a-9892-fa4743d7f97e\",\n \"layout\": {\n \"h\": 7,\n \"i\": \"43ee140d-ae6d-474a-9892-fa4743d7f97e\",\n \"isResizable\": true,\n \"w\": 6,\n \"x\": 12,\n \"y\": 31\n },\n \"version\": \"3.0.0\",\n \"datasourceCate\": \"prometheus\",\n \"datasourceValue\": \"${prom}\",\n \"targets\": [\n {\n \"expr\": \"100 * sum(mongodb_ss_wt_cache_tracked_dirty_pages_in_the_cache{instance='$instance'}) / sum(mongodb_ss_wt_cache_pages_currently_held_in_the_cache{instance='$instance'})\",\n \"legend\": \"dirty rate\",\n \"refId\": \"A\",\n \"maxDataPoints\": 240\n }\n ],\n \"transformations\": [\n {\n \"id\": \"organize\",\n \"options\": {}\n }\n ],\n \"name\": \"Cache Dirty Pages Rate\",\n \"description\": \"\",\n \"maxPerRow\": 4,\n \"options\": {\n \"tooltip\": {\n \"mode\": \"all\",\n \"sort\": \"none\"\n },\n \"legend\": {\n \"displayMode\": \"hidden\",\n \"heightInPercentage\": 30,\n \"placement\": \"bottom\",\n \"behaviour\": \"showItem\",\n \"selectMode\": \"single\"\n },\n \"standardOptions\": {\n \"util\": \"percent\"\n },\n \"thresholds\": {\n \"steps\": [\n {\n \"color\": \"#634CD9\",\n \"value\": null,\n \"type\": \"base\"\n }\n ]\n }\n },\n \"custom\": {\n \"drawStyle\": \"lines\",\n \"lineInterpolation\": \"smooth\",\n \"spanNulls\": false,\n \"lineWidth\": 2,\n \"fillOpacity\": 0.3,\n \"gradientMode\": \"opacity\",\n \"stack\": \"off\",\n \"scaleDistribution\": {\n \"type\": \"linear\"\n },\n \"showPoints\": \"none\",\n \"pointSize\": 5\n },\n \"overrides\": [\n {\n \"matcher\": {\n \"id\": \"byFrameRefID\"\n },\n \"properties\": {\n \"rightYAxisDisplay\": \"off\"\n }\n }\n ]\n },\n {\n \"type\": \"timeseries\",\n \"id\": \"1a22c31a-859a-400c-af2a-ae83c308d0f2\",\n \"layout\": {\n \"h\": 7,\n \"i\": \"1a22c31a-859a-400c-af2a-ae83c308d0f2\",\n \"isResizable\": true,\n \"w\": 6,\n \"x\": 18,\n \"y\": 31\n },\n \"version\": \"3.0.0\",\n \"datasourceCate\": \"prometheus\",\n \"datasourceValue\": \"${prom}\",\n \"targets\": [\n {\n \"expr\": \"rate(mongodb_mongod_wiredtiger_cache_evicted_total{instance='$instance'}[5m])\",\n \"legend\": \"evicted pages\",\n \"refId\": \"A\",\n \"maxDataPoints\": 240\n }\n ],\n \"transformations\": [\n {\n \"id\": \"organize\",\n \"options\": {}\n }\n ],\n \"name\": \"Cache Evicted Pages\",\n \"description\": \"\",\n \"maxPerRow\": 4,\n \"options\": {\n \"tooltip\": {\n \"mode\": \"all\",\n \"sort\": \"none\"\n },\n \"legend\": {\n \"displayMode\": \"hidden\",\n \"heightInPercentage\": 30,\n \"placement\": \"bottom\",\n \"behaviour\": \"showItem\",\n \"selectMode\": \"single\"\n },\n \"standardOptions\": {},\n \"thresholds\": {\n \"steps\": [\n {\n \"color\": \"#634CD9\",\n \"value\": null,\n \"type\": \"base\"\n }\n ]\n }\n },\n \"custom\": {\n \"drawStyle\": \"lines\",\n \"lineInterpolation\": \"smooth\",\n \"spanNulls\": false,\n \"lineWidth\": 2,\n \"fillOpacity\": 0.3,\n \"gradientMode\": \"opacity\",\n \"stack\": \"off\",\n \"scaleDistribution\": {\n \"type\": \"linear\"\n },\n \"showPoints\": \"none\",\n \"pointSize\": 5\n },\n \"overrides\": [\n {\n \"matcher\": {\n \"id\": \"byFrameRefID\"\n },\n \"properties\": {\n \"rightYAxisDisplay\": \"off\"\n }\n }\n ]\n },\n {\n \"collapsed\": true,\n \"id\": \"b0016f4a-c565-4276-a08d-bacdf94b6b5a\",\n \"layout\": {\n \"h\": 1,\n \"i\": \"b0016f4a-c565-4276-a08d-bacdf94b6b5a\",\n \"isResizable\": false,\n \"w\": 24,\n \"x\": 0,\n \"y\": 45\n },\n \"name\": \"ReplSet Info\",\n \"type\": \"row\"\n },\n {\n \"custom\": {\n \"calc\": \"lastNotNull\",\n \"colSpan\": 1,\n \"colorMode\": \"value\",\n \"textMode\": \"value\",\n \"textSize\": {},\n \"valueField\": \"Value\"\n },\n \"datasourceCate\": \"prometheus\",\n \"datasourceValue\": \"${prom}\",\n \"description\": \"\",\n \"id\": \"6187ceee-7c25-43f2-be1b-c44ad612ab52\",\n \"layout\": {\n \"h\": 7,\n \"i\": \"6187ceee-7c25-43f2-be1b-c44ad612ab52\",\n \"isResizable\": true,\n \"w\": 12,\n \"x\": 0,\n \"y\": 46\n },\n \"name\": \"Replset Election\",\n \"options\": {\n \"standardOptions\": {\n \"decimals\": 1,\n \"util\": \"seconds\"\n },\n \"thresholds\": {\n \"steps\": [\n {\n \"color\": \"#634CD9\",\n \"type\": \"base\",\n \"value\": null\n }\n ]\n },\n \"valueMappings\": [\n {\n \"match\": {\n \"to\": 1800\n },\n \"result\": {\n \"color\": \"#f24526\"\n },\n \"type\": \"range\"\n },\n {\n \"match\": {\n \"from\": 1800\n },\n \"result\": {\n \"color\": \"#53b503\"\n },\n \"type\": \"range\"\n }\n ]\n },\n \"targets\": [\n {\n \"expr\": \"time() - mongodb_mongod_replset_member_election_date\",\n \"refId\": \"A\"\n }\n ],\n \"type\": \"stat\",\n \"version\": \"2.0.0\"\n },\n {\n \"custom\": {\n \"drawStyle\": \"lines\",\n \"fillOpacity\": 0.3,\n \"gradientMode\": \"opacity\",\n \"lineInterpolation\": \"smooth\",\n \"lineWidth\": 2,\n \"stack\": \"off\"\n },\n \"datasourceCate\": \"prometheus\",\n \"datasourceValue\": \"${prom}\",\n \"description\": \"replica set member master-slave synchronization delay\",\n \"id\": \"f73fd0cd-ecbe-41f0-a2dc-4e02f7eaef1c\",\n \"layout\": {\n \"h\": 7,\n \"i\": \"f73fd0cd-ecbe-41f0-a2dc-4e02f7eaef1c\",\n \"isResizable\": true,\n \"w\": 12,\n \"x\": 12,\n \"y\": 46\n },\n \"name\": \"Replset Lag Seconds\",\n \"options\": {\n \"legend\": {\n \"displayMode\": \"hidden\"\n },\n \"standardOptions\": {\n \"util\": \"seconds\"\n },\n \"thresholds\": {},\n \"tooltip\": {\n \"mode\": \"all\",\n \"sort\": \"none\"\n }\n },\n \"targets\": [\n {\n \"expr\": \"mongodb_mongod_replset_member_replication_lag{instance=\\\"$instance\\\"}\",\n \"legend\": \"lag\",\n \"refId\": \"A\"\n }\n ],\n \"type\": \"timeseries\",\n \"version\": \"2.0.0\"\n }\n ],\n \"var\": [\n {\n \"definition\": \"prometheus\",\n \"name\": \"prom\",\n \"type\": \"datasource\"\n },\n {\n \"datasource\": {\n \"cate\": \"prometheus\",\n \"value\": \"${prom}\"\n },\n \"definition\": \"label_values(mongodb_ss_uptime,instance)\",\n \"name\": \"instance\",\n \"type\": \"query\"\n }\n ],\n \"version\": \"3.0.0\"\n },\n \"uuid\": 1717556328065329000\n}\n"
},
{
"path": "integrations/MongoDB/markdown/README.md",
"content": "# mongodb\n\nmongodb 监控采集插件,由 [mongodb-exporter](https://github.com/percona/mongodb_exporter)封装而来。\n\n## Configuration\n\n配置文件示例:\n\n```toml\n[[instances]]\n# log level, enum: panic, fatal, error, warn, warning, info, debug, trace, defaults to info.\nlog_level = \"info\"\n# append some const labels to metrics\n# NOTICE! the instance label is required for dashboards\nlabels = { instance=\"mongo-cluster-01\" }\n\n# mongodb dsn, see https://www.mongodb.com/docs/manual/reference/connection-string/\n# mongodb_uri = \"mongodb://127.0.0.1:27017\"\nmongodb_uri = \"\"\n# if you don't specify the username or password in the mongodb_uri, you can set here. \n# This will overwrite the dsn, it would be helpful when special characters existing in the username or password and you don't want to encode them.\n# NOTICE! this user must be granted enough rights to query needed stats, see ../inputs/mongodb/README.md\nusername = \"username@Bj\"\npassword = \"password@Bj\"\n# if set to true, use the direct connection way\n# direct_connect = true\n\n# collect all means you collect all the metrics, if set, all below enable_xxx flags in this section will be ignored\ncollect_all = true\n# if set to true, collect databases metrics\n# enable_db_stats = true\n# if set to true, collect getDiagnosticData metrics\n# enable_diagnostic_data = true\n# if set to true, collect replSetGetStatus metrics\n# enable_replicaset_status = true\n# if set to true, collect top metrics by admin command\n# enable_top_metrics = true\n# if set to true, collect index metrics. You should specify one of the coll_stats_namespaces and the discovering_mode flags.\n# enable_index_stats = true\n# if set to true, collect collections metrics. You should specify one of the coll_stats_namespaces and the discovering_mode flags.\n# enable_coll_stats = true\n\n# Only get stats for the collections matching this list of namespaces. if none set, discovering_mode will be enabled.\n# Example: db1.col1,db.col1\n# coll_stats_namespaces = []\n# Only get stats for index with the collections matching this list of namespaces.\n# Example: db1.col1,db.col1\n# index_stats_collections = []\n# if set to true, replace -1 to DESC for label key_name of the descending_index metrics\n# enable_override_descending_index = true\n\n# which exposes metrics with 0.1x compatible metric names has been implemented which simplifies migration from the old version to the current version.\n# compatible_mode = true\n\n\n# [[instances]]\n# # interval = global.interval * interval_times\n# interval_times = 1\n\n# log_level = \"error\"\n\n# append some labels to metrics\n# labels = { instance=\"mongo-cluster-02\" }\n# mongodb_uri = \"mongodb://username:password@127.0.0.1:27017\"\n# collect_all = true\n# compatible_mode = true\n```\n\ncategraf 作为一个 client 连接 MongoDB,需要有足够的权限来收集指标,具体的权限配置请参考[官方文档](https://www.mongodb.com/docs/manual/reference/built-in-roles/#mongodb-authrole-clusterMonitor)。至少具有以下权限才可以:\n\n```json\n{\n \"role\":\"clusterMonitor\",\n \"db\":\"admin\"\n},\n{\n \"role\":\"read\",\n \"db\":\"local\"\n}\n```\n\n授权操作样例:\n\n```shell\nmongo -h xxx -u xxx -p xxx --authenticationDatabase admin\n> use admin\n> db.createUser({user:\"categraf\",pwd:\"categraf\",roles: [{role:\"read\",db:\"local\"},{\"role\":\"clusterMonitor\",\"db\":\"admin\"}]})\n```\n\n"
},
{
"path": "integrations/Mtail/collect/mtail/mtail.toml",
"content": "[[instances]]\n# progs = \"/path/to/prog1\" # prog dir1\n# logs = [\"/path/to/a.log\", \"path/to/b.log\"]\n# override_timezone = \"Asia/Shanghai\"\n# emit_metric_timestamp = \"true\" #string type\n\n# [[instances]]\n# progs = \"/path/to/prog2\" # prog dir2\n# logs = [\"/path/to/logdir/\"]\n# override_timezone = \"Asia/Shanghai\"\n# emit_metric_timestamp = \"true\" # string type\n"
},
{
"path": "integrations/Mtail/markdown/README.md",
"content": "# mtail插件\n\n## 简介\n功能:提取日志内容,转换为监控metrics\n\n+ 输入: 日志\n+ 输出: metrics 按照mtail语法输出, 仅支持counter、gauge、histogram\n+ 处理: 本质是golang的正则提取+表达式计算\n\n## 启动\n编辑mtail.toml文件, 一般每个instance需要指定不同的progs参数(不同的progs文件或者目录),否则指标会相互干扰。\n**注意**: 如果不同instance使用相同progs, 可以通过给每个instance增加labels做区分,\n```\nlabels = { k1=v1 }\n```\n或\n```\n[instances.labels]\nk1=v1\n```\n\n1. conf/inputs.mtail/mtail.toml中指定instance\n```toml\n\n[[instances]]\n## 指定mtail prog的目录\nprogs = \"/path/to/prog1\"\n## 指定mtail要读取的日志\nlogs = [\"/path/to/a.log\", \"path/to/b.log\"] \n## 指定时区\n# override_timezone = \"Asia/Shanghai\" \n## metrics是否带时间戳,注意,这里是\"true\"\n# emit_metric_timestamp = \"true\" \n\n```\n2. 在/path/to/prog1 目录下编写规则文件\n```\ngauge xxx_errors\n/ERROR.*/ {\n xxx_errros++\n}\n```\n\n3. 一个tab中执行 `categraf --test --inputs mtail`,用于测试 \n4. 另一个tab中,\"/path/to/a.log\" 或者 \"path/to/b.log\" 追加一行 ERROR,看看categraf的输出\n5. 测试通过后,启动categraf\n\n### 输入\nlogs参数指定要处理的日志源, 支持模糊匹配, 支持多个log文件。\n\n### 处理规则\n`progs`指定具体的规则文件目录(或文件)\n\n\n## 处理规则与语法\n\n### 处理流程\n```python \nfor line in lines:\n for regex in regexes:\n if match:\n do something\n```\n\n### 语法\n\n``` golang\nexported variable \n\npattern { \n action statements\n} \n\ndef decorator { \n pattern and action statements\n}\n```\n\n#### 定义指标名称\n前面也提过,指标仅支持 counter gauge histogram 三种类型。\n一个🌰\n```mtail\ncounter lines\n/INFO.*/ {\n lines++\n}\n```\n\n注意,定义的名称只支持 C类型的命名方式(字母/数字/下划线),**如果想使用\"-\" 要使用\"as\"导出别名**。例如,\n```mtail\ncounter lines_total as \"line-count\"\n```\n这样获取到的就是line-count这个指标名称了\n\n#### 匹配与计算(pattern/action)\n\n```mtail\nPATTERN {\nACTION\n}\n```\n\n例子\n```mtail\n/foo/ {\n ACTION1\n}\n\nvariable > 0 {\n ACTION2\n}\n\n/foo/ && variable > 0 {\n ACTION3\n}\n```\n支持RE2正则匹配\n```mtail\nconst PREFIX /^\\w+\\W+\\d+ /\n\nPREFIX {\n ACTION1\n}\n\nPREFIX + /foo/ {\n ACTION2\n}\n```\n\n这样,ACTION1 是匹配以小写字符+大写字符+数字+空格的行,ACTION2 是匹配小写字符+大写字符+数字+空格+foo开头的行。\n\n#### 关系运算符\n+ `<` 小于 `<=` 小于等于\n+ `>` 大于 `>=` 大于等于\n+ `==` 相等 `!=` 不等\n+ `=~` 匹配(模糊) `!~` 不匹配(模糊)\n+ `||` 逻辑或 `&&` 逻辑与 `!` 逻辑非\n \n#### 数学运算符\n+ `|` 按位或\n+ `&` 按位与\n+ `^` 按位异或\n+ `+ - * /` 四则运算\n+ `<<` 按位左移\n+ `>>` 按位右移\n+ `**` 指数运算 \n+ `=` 赋值\n+ `++` 自增运算\n+ `--` 自减运算\n+ `+=` 加且赋值\n\n#### 支持else与otherwise\n```mtail\n/foo/ {\nACTION1\n} else {\nACTION2\n}\n```\n支持嵌套\n```mtail\n/foo/ {\n /foo1/ {\n ACTION1\n }\n /foo2/ {\n ACTION2\n }\n otherwise {\n ACTION3\n }\n}\n```\n\n支持命名与非命名提取\n\n```mtail\n/(?P\\S+) (\\S+) \\[\\S+\\] (\\S+) \\(\\S*\\) \\S+ (?P\\d+)/ {\n bytes_total[$operation][$3] += $bytes\n}\n```\n增加常量label \n```mtail\n# test.mtail\n# 定义常量label env\nhidden text env\n# 给label 赋值 这样定义是global范围;\n# 局部添加,则在对应的condition中添加\nenv=\"production\"\ncounter line_total by logfile,env\n/^(?P\\w+\\s+\\d+\\s+\\d+:\\d+:\\d+)/ {\n line_total[getfilename()][env]++\n}\n```\n获取到的metrics中会添加上`env=production`的label 如下:\n```mtail\n# metrics\nline_total{env=\"production\",logfile=\"/path/to/xxxx.log\",prog=\"test.mtail\"} 4 1661165941788\n```\n\n如果要给metrics增加变量label,必须要使用命名提取。例如\n```python\n# 日志内容\n192.168.0.1 GET /foo\n192.168.0.2 GET /bar\n192.168.0.1 POST /bar\n```\n\n``` mtail\n# test.mtail\ncounter my_http_requests_total by log_file, verb \n/^/ +\n/(?P[0-9A-Za-z\\.:-]+) / +\n/(?P[A-Z]+) / +\n/(?P\\S+).*/ +\n/$/ {\n my_http_requests_total[getfilename()][$verb]++\n}\n```\n\n```python\n# metrics\nmy_http_requests_total{logfile=\"xxx.log\",verb=\"GET\",prog=\"test.mtail\"} 4242\nmy_http_requests_total{logfile=\"xxx.log\",verb=\"POST\",prog=\"test.mtail\"} 42\n```\n\n命名提取的变量可以在条件中使用\n```mtail\n/(?P\\d+)/ && $x > 1 {\nnonzero_positives++\n}\n```\n\n#### 时间处理\n不显示处理,则默认使用系统时间\n\n默认emit_metric_timestamp=\"false\" (注意是字符串)\n```\nhttp_latency_bucket{prog=\"histo.mtail\",le=\"1\"} 0\nhttp_latency_bucket{prog=\"histo.mtail\",le=\"2\"} 0\nhttp_latency_bucket{prog=\"histo.mtail\",le=\"4\"} 0\nhttp_latency_bucket{prog=\"histo.mtail\",le=\"8\"} 0\nhttp_latency_bucket{prog=\"histo.mtail\",le=\"+Inf\"} 0\nhttp_latency_sum{prog=\"histo.mtail\"} 0\nhttp_latency_count{prog=\"histo.mtail\"} 0\n```\n\n参数 emit_metric_timestamp=\"true\" (注意是字符串)\n```\nhttp_latency_bucket{prog=\"histo.mtail\",le=\"1\"} 1 1661152917471\nhttp_latency_bucket{prog=\"histo.mtail\",le=\"2\"} 2 1661152917471\nhttp_latency_bucket{prog=\"histo.mtail\",le=\"4\"} 2 1661152917471\nhttp_latency_bucket{prog=\"histo.mtail\",le=\"8\"} 2 1661152917471\nhttp_latency_bucket{prog=\"histo.mtail\",le=\"+Inf\"} 2 1661152917471\nhttp_latency_sum{prog=\"histo.mtail\"} 3 1661152917471\nhttp_latency_count{prog=\"histo.mtail\"} 4 1661152917471\n```\n\n使用日志的时间\n```\nAug 22 15:28:32 GET /api/v1/pods latency=2s code=200\nAug 22 15:28:32 GET /api/v1/pods latency=1s code=200\nAug 22 15:28:32 GET /api/v1/pods latency=0s code=200\n```\n\n```\nhistogram http_latency buckets 1, 2, 4, 8\n/^(?P\\w+\\s+\\d+\\s+\\d+:\\d+:\\d+)/ {\n strptime($date, \"Jan 02 15:04:05\")\n\t/latency=(?P\\d+)/ {\n\t\thttp_latency=$latency\n\t}\n}\n```\n\n日志提取的时间,一定要注意时区问题,有一个参数 `override_timezone` 可以控制时区选择,否则默认使用UTC转换。\n比如我启动时指定 `override_timezone=Asia/Shanghai`, 这个时候日志提取的时间会当做东八区时间 转换为timestamp, 然后再从timestamp转换为各时区时间时 就没有问题了,如图。\n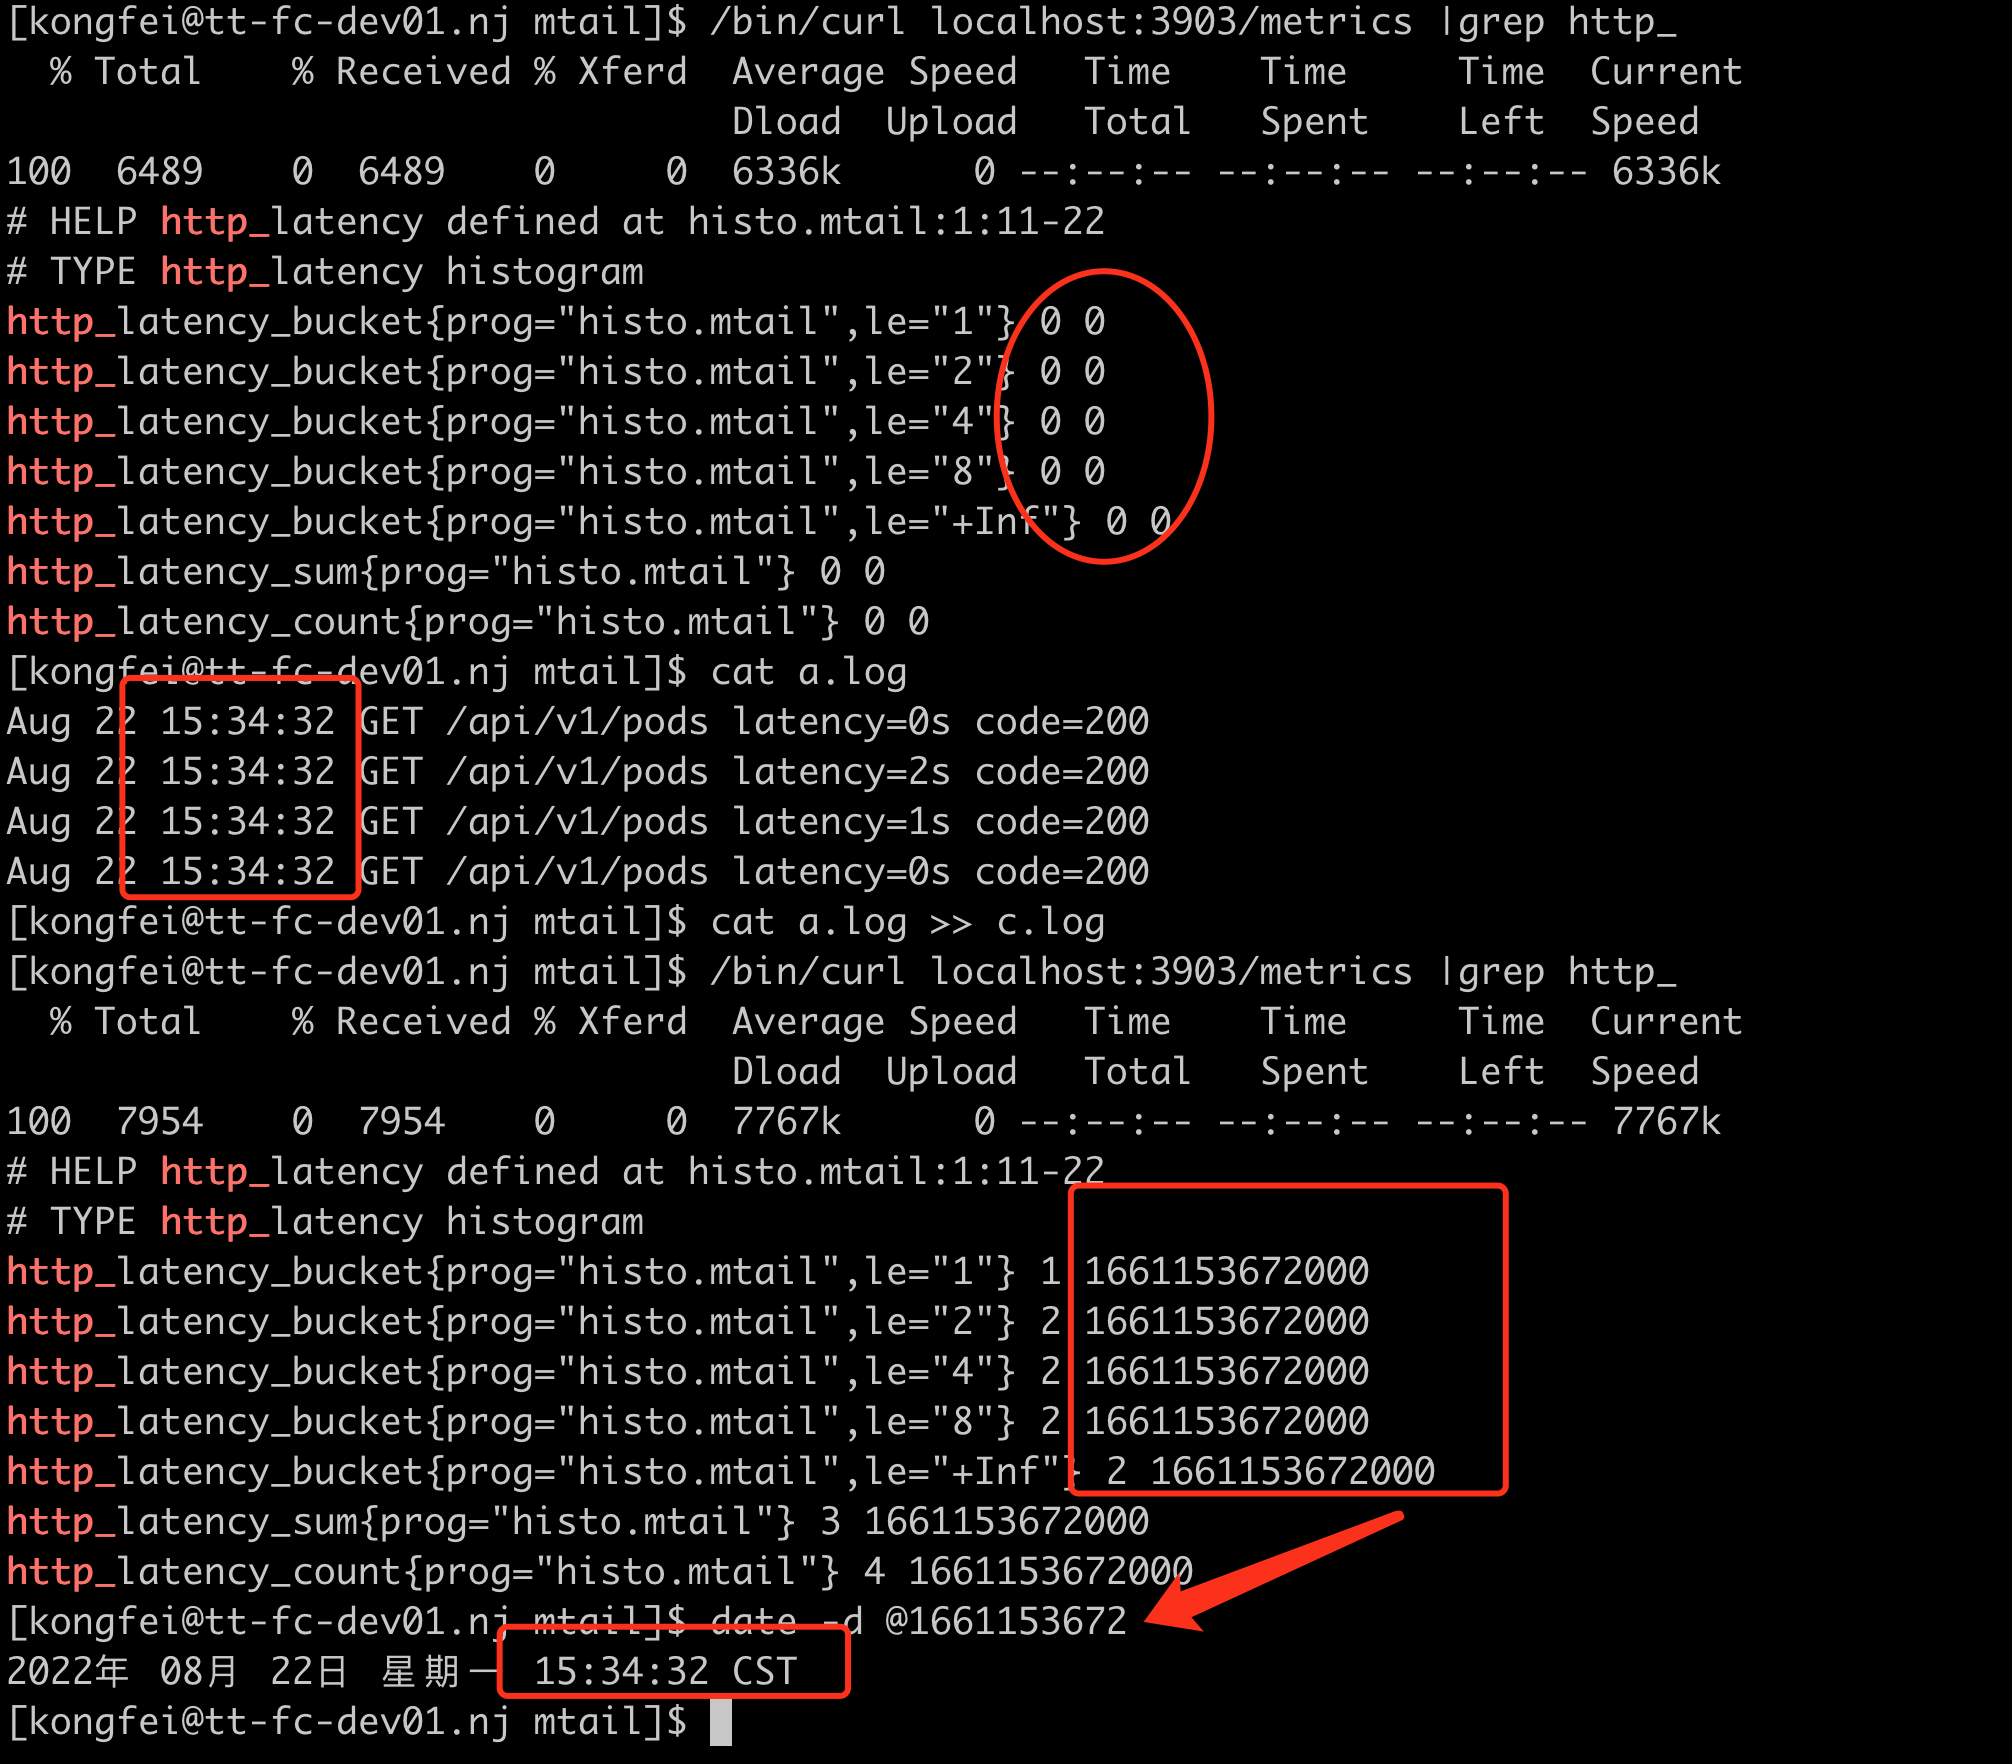\n如果不带 `override_timezone=Asia/Shanghai`, 则默认将`Aug 22 15:34:32` 当做UTC时间,转换为timestamp。 这样再转换为本地时间时,会多了8个小时, 如图。\n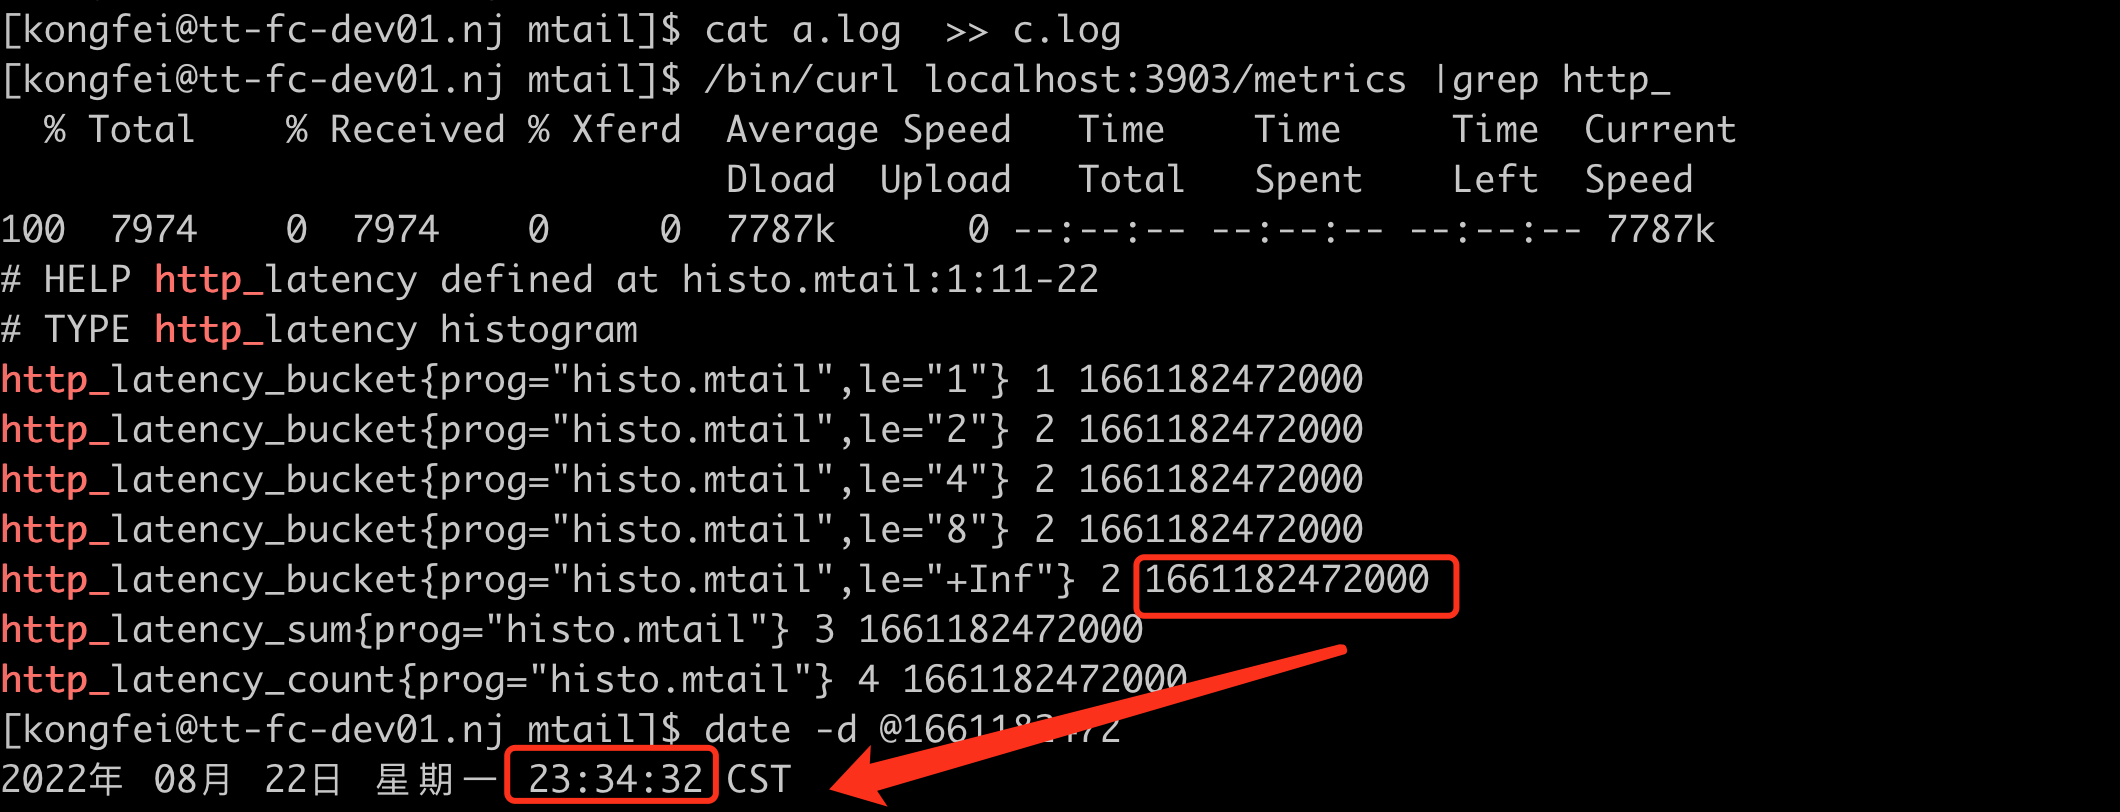\n"
},
{
"path": "integrations/MySQL/alerts/mysql_by_categraf.json",
"content": "[\n {\n \"id\": 0,\n \"group_id\": 0,\n \"cate\": \"prometheus\",\n \"datasource_ids\": [\n 0\n ],\n \"cluster\": \"\",\n \"name\": \"A slow query has occurred in Mysql within the last minute - categraf\",\n \"note\": \"MySQL server mysql has some new slow query\",\n \"prod\": \"metric\",\n \"algorithm\": \"\",\n \"algo_params\": null,\n \"delay\": 0,\n \"severity\": 2,\n \"severities\": [\n 2\n ],\n \"disabled\": 1,\n \"prom_for_duration\": 120,\n \"prom_ql\": \"\",\n \"rule_config\": {\n \"algo_params\": null,\n \"inhibit\": false,\n \"prom_ql\": \"\",\n \"queries\": [\n {\n \"prom_ql\": \"increase(mysql_global_status_slow_queries[1m]) \\u003e 0\",\n \"severity\": 2\n }\n ],\n \"severity\": 0\n },\n \"prom_eval_interval\": 15,\n \"enable_stime\": \"00:00\",\n \"enable_stimes\": [\n \"00:00\"\n ],\n \"enable_etime\": \"23:59\",\n \"enable_etimes\": [\n \"23:59\"\n ],\n \"enable_days_of_week\": [\n \"1\",\n \"2\",\n \"3\",\n \"4\",\n \"5\",\n \"6\",\n \"0\"\n ],\n \"enable_days_of_weeks\": [\n [\n \"1\",\n \"2\",\n \"3\",\n \"4\",\n \"5\",\n \"6\",\n \"0\"\n ]\n ],\n \"enable_in_bg\": 0,\n \"notify_recovered\": 1,\n \"notify_channels\": [],\n \"notify_groups_obj\": null,\n \"notify_groups\": null,\n \"notify_repeat_step\": 60,\n \"notify_max_number\": 0,\n \"recover_duration\": 0,\n \"callbacks\": [],\n \"runbook_url\": \"\",\n \"append_tags\": [\n \"alertname=MysqlSlowQueries\"\n ],\n \"annotations\": null,\n \"extra_config\": null,\n \"create_at\": 0,\n \"create_by\": \"\",\n \"update_at\": 0,\n \"update_by\": \"\",\n \"uuid\": 1717556328072748000\n },\n {\n \"id\": 0,\n \"group_id\": 0,\n \"cate\": \"prometheus\",\n \"datasource_ids\": [\n 0\n ],\n \"cluster\": \"\",\n \"name\": \"More than 60% of the connections in Mysql are in a running state - categraf\",\n \"note\": \"\",\n \"prod\": \"metric\",\n \"algorithm\": \"\",\n \"algo_params\": null,\n \"delay\": 0,\n \"severity\": 2,\n \"severities\": [\n 2\n ],\n \"disabled\": 1,\n \"prom_for_duration\": 120,\n \"prom_ql\": \"\",\n \"rule_config\": {\n \"algo_params\": null,\n \"inhibit\": false,\n \"prom_ql\": \"\",\n \"queries\": [\n {\n \"prom_ql\": \"avg by (instance) (mysql_global_status_threads_running) / avg by (instance) (mysql_global_variables_max_connections) * 100 \\u003e 60\",\n \"severity\": 2\n }\n ],\n \"severity\": 0\n },\n \"prom_eval_interval\": 15,\n \"enable_stime\": \"00:00\",\n \"enable_stimes\": [\n \"00:00\"\n ],\n \"enable_etime\": \"23:59\",\n \"enable_etimes\": [\n \"23:59\"\n ],\n \"enable_days_of_week\": [\n \"1\",\n \"2\",\n \"3\",\n \"4\",\n \"5\",\n \"6\",\n \"0\"\n ],\n \"enable_days_of_weeks\": [\n [\n \"1\",\n \"2\",\n \"3\",\n \"4\",\n \"5\",\n \"6\",\n \"0\"\n ]\n ],\n \"enable_in_bg\": 0,\n \"notify_recovered\": 1,\n \"notify_channels\": [],\n \"notify_groups_obj\": null,\n \"notify_groups\": null,\n \"notify_repeat_step\": 60,\n \"notify_max_number\": 0,\n \"recover_duration\": 0,\n \"callbacks\": [],\n \"runbook_url\": \"\",\n \"append_tags\": [\n \"alertname=MysqlHighThreadsRunning\"\n ],\n \"annotations\": null,\n \"extra_config\": null,\n \"create_at\": 0,\n \"create_by\": \"\",\n \"update_at\": 0,\n \"update_by\": \"\",\n \"uuid\": 1717556328073274000\n },\n {\n \"id\": 0,\n \"group_id\": 0,\n \"cate\": \"prometheus\",\n \"datasource_ids\": [\n 0\n ],\n \"cluster\": \"\",\n \"name\": \"Mysql has just restarted. Please be advised - categraf\",\n \"note\": \"MySQL has just been restarted, less than one minute ago\",\n \"prod\": \"metric\",\n \"algorithm\": \"\",\n \"algo_params\": null,\n \"delay\": 0,\n \"severity\": 3,\n \"severities\": [\n 3\n ],\n \"disabled\": 1,\n \"prom_for_duration\": 0,\n \"prom_ql\": \"\",\n \"rule_config\": {\n \"algo_params\": null,\n \"inhibit\": false,\n \"prom_ql\": \"\",\n \"queries\": [\n {\n \"prom_ql\": \"mysql_global_status_uptime \\u003c 60\",\n \"severity\": 3\n }\n ],\n \"severity\": 0\n },\n \"prom_eval_interval\": 15,\n \"enable_stime\": \"00:00\",\n \"enable_stimes\": [\n \"00:00\"\n ],\n \"enable_etime\": \"23:59\",\n \"enable_etimes\": [\n \"23:59\"\n ],\n \"enable_days_of_week\": [\n \"1\",\n \"2\",\n \"3\",\n \"4\",\n \"5\",\n \"6\",\n \"0\"\n ],\n \"enable_days_of_weeks\": [\n [\n \"1\",\n \"2\",\n \"3\",\n \"4\",\n \"5\",\n \"6\",\n \"0\"\n ]\n ],\n \"enable_in_bg\": 0,\n \"notify_recovered\": 1,\n \"notify_channels\": [],\n \"notify_groups_obj\": null,\n \"notify_groups\": null,\n \"notify_repeat_step\": 60,\n \"notify_max_number\": 0,\n \"recover_duration\": 0,\n \"callbacks\": [],\n \"runbook_url\": \"\",\n \"append_tags\": [\n \"alertname=MysqlRestarted\"\n ],\n \"annotations\": null,\n \"extra_config\": null,\n \"create_at\": 0,\n \"create_by\": \"\",\n \"update_at\": 0,\n \"update_by\": \"\",\n \"uuid\": 1717556328073904000\n },\n {\n \"id\": 0,\n \"group_id\": 0,\n \"cate\": \"prometheus\",\n \"datasource_ids\": [\n 0\n ],\n \"cluster\": \"\",\n \"name\": \"Mysql has opened a large number of file handles. Please be aware - categraf\",\n \"note\": \"More than 80% of MySQL files open\",\n \"prod\": \"metric\",\n \"algorithm\": \"\",\n \"algo_params\": null,\n \"delay\": 0,\n \"severity\": 2,\n \"severities\": [\n 2\n ],\n \"disabled\": 1,\n \"prom_for_duration\": 120,\n \"prom_ql\": \"\",\n \"rule_config\": {\n \"algo_params\": null,\n \"inhibit\": false,\n \"prom_ql\": \"\",\n \"queries\": [\n {\n \"prom_ql\": \"avg by (instance) (mysql_global_status_open_files) / avg by (instance)(mysql_global_variables_open_files_limit) * 100 \\u003e 80\",\n \"severity\": 2\n }\n ],\n \"severity\": 0\n },\n \"prom_eval_interval\": 15,\n \"enable_stime\": \"00:00\",\n \"enable_stimes\": [\n \"00:00\"\n ],\n \"enable_etime\": \"23:59\",\n \"enable_etimes\": [\n \"23:59\"\n ],\n \"enable_days_of_week\": [\n \"1\",\n \"2\",\n \"3\",\n \"4\",\n \"5\",\n \"6\",\n \"0\"\n ],\n \"enable_days_of_weeks\": [\n [\n \"1\",\n \"2\",\n \"3\",\n \"4\",\n \"5\",\n \"6\",\n \"0\"\n ]\n ],\n \"enable_in_bg\": 0,\n \"notify_recovered\": 1,\n \"notify_channels\": [],\n \"notify_groups_obj\": null,\n \"notify_groups\": null,\n \"notify_repeat_step\": 60,\n \"notify_max_number\": 0,\n \"recover_duration\": 0,\n \"callbacks\": [],\n \"runbook_url\": \"\",\n \"append_tags\": [\n \"alertname=MysqlHighOpenFiles\"\n ],\n \"annotations\": null,\n \"extra_config\": null,\n \"create_at\": 0,\n \"create_by\": \"\",\n \"update_at\": 0,\n \"update_by\": \"\",\n \"uuid\": 1717556328074410000\n },\n {\n \"id\": 0,\n \"group_id\": 0,\n \"cate\": \"prometheus\",\n \"datasource_ids\": [\n 0\n ],\n \"cluster\": \"\",\n \"name\": \"Mysql instance has crashed - categraf\",\n \"note\": \"\",\n \"prod\": \"metric\",\n \"algorithm\": \"\",\n \"algo_params\": null,\n \"delay\": 0,\n \"severity\": 1,\n \"severities\": [\n 1\n ],\n \"disabled\": 1,\n \"prom_for_duration\": 0,\n \"prom_ql\": \"\",\n \"rule_config\": {\n \"algo_params\": null,\n \"inhibit\": false,\n \"prom_ql\": \"\",\n \"queries\": [\n {\n \"prom_ql\": \"mysql_up == 0\",\n \"severity\": 1\n }\n ],\n \"severity\": 0\n },\n \"prom_eval_interval\": 15,\n \"enable_stime\": \"00:00\",\n \"enable_stimes\": [\n \"00:00\"\n ],\n \"enable_etime\": \"23:59\",\n \"enable_etimes\": [\n \"23:59\"\n ],\n \"enable_days_of_week\": [\n \"1\",\n \"2\",\n \"3\",\n \"4\",\n \"5\",\n \"6\",\n \"0\"\n ],\n \"enable_days_of_weeks\": [\n [\n \"1\",\n \"2\",\n \"3\",\n \"4\",\n \"5\",\n \"6\",\n \"0\"\n ]\n ],\n \"enable_in_bg\": 0,\n \"notify_recovered\": 1,\n \"notify_channels\": [],\n \"notify_groups_obj\": null,\n \"notify_groups\": null,\n \"notify_repeat_step\": 60,\n \"notify_max_number\": 0,\n \"recover_duration\": 0,\n \"callbacks\": [],\n \"runbook_url\": \"\",\n \"append_tags\": [\n \"alertname=MysqlDown\"\n ],\n \"annotations\": null,\n \"extra_config\": null,\n \"create_at\": 0,\n \"create_by\": \"\",\n \"update_at\": 0,\n \"update_by\": \"\",\n \"uuid\": 1717556328075687000\n },\n {\n \"id\": 0,\n \"group_id\": 0,\n \"cate\": \"prometheus\",\n \"datasource_ids\": [\n 0\n ],\n \"cluster\": \"\",\n \"name\": \"MysqlInnodbLogWaits - categraf\",\n \"note\": \"MySQL innodb log writes stalling\",\n \"prod\": \"metric\",\n \"algorithm\": \"\",\n \"algo_params\": null,\n \"delay\": 0,\n \"severity\": 2,\n \"severities\": [\n 2\n ],\n \"disabled\": 1,\n \"prom_for_duration\": 0,\n \"prom_ql\": \"\",\n \"rule_config\": {\n \"algo_params\": null,\n \"inhibit\": false,\n \"prom_ql\": \"\",\n \"queries\": [\n {\n \"prom_ql\": \"rate(mysql_global_status_innodb_log_waits[15m]) \\u003e 10\",\n \"severity\": 2\n }\n ],\n \"severity\": 0\n },\n \"prom_eval_interval\": 15,\n \"enable_stime\": \"00:00\",\n \"enable_stimes\": [\n \"00:00\"\n ],\n \"enable_etime\": \"23:59\",\n \"enable_etimes\": [\n \"23:59\"\n ],\n \"enable_days_of_week\": [\n \"1\",\n \"2\",\n \"3\",\n \"4\",\n \"5\",\n \"6\",\n \"0\"\n ],\n \"enable_days_of_weeks\": [\n [\n \"1\",\n \"2\",\n \"3\",\n \"4\",\n \"5\",\n \"6\",\n \"0\"\n ]\n ],\n \"enable_in_bg\": 0,\n \"notify_recovered\": 1,\n \"notify_channels\": [],\n \"notify_groups_obj\": null,\n \"notify_groups\": null,\n \"notify_repeat_step\": 60,\n \"notify_max_number\": 0,\n \"recover_duration\": 0,\n \"callbacks\": [],\n \"runbook_url\": \"\",\n \"append_tags\": [\n \"alertname=MysqlInnodbLogWaits\"\n ],\n \"annotations\": null,\n \"extra_config\": null,\n \"create_at\": 0,\n \"create_by\": \"\",\n \"update_at\": 0,\n \"update_by\": \"\",\n \"uuid\": 1717556328076573000\n },\n {\n \"id\": 0,\n \"group_id\": 0,\n \"cate\": \"prometheus\",\n \"datasource_ids\": [\n 0\n ],\n \"cluster\": \"\",\n \"name\": \"MysqlSlaveIoThreadNotRunning - categraf\",\n \"note\": \"MySQL Slave IO thread not running\",\n \"prod\": \"metric\",\n \"algorithm\": \"\",\n \"algo_params\": null,\n \"delay\": 0,\n \"severity\": 1,\n \"severities\": [\n 1\n ],\n \"disabled\": 1,\n \"prom_for_duration\": 0,\n \"prom_ql\": \"\",\n \"rule_config\": {\n \"algo_params\": null,\n \"inhibit\": false,\n \"prom_ql\": \"\",\n \"queries\": [\n {\n \"prom_ql\": \"mysql_slave_status_master_server_id \\u003e 0 and ON (instance) mysql_slave_status_slave_io_running == 0\",\n \"severity\": 1\n }\n ],\n \"severity\": 0\n },\n \"prom_eval_interval\": 15,\n \"enable_stime\": \"00:00\",\n \"enable_stimes\": [\n \"00:00\"\n ],\n \"enable_etime\": \"23:59\",\n \"enable_etimes\": [\n \"23:59\"\n ],\n \"enable_days_of_week\": [\n \"1\",\n \"2\",\n \"3\",\n \"4\",\n \"5\",\n \"6\",\n \"0\"\n ],\n \"enable_days_of_weeks\": [\n [\n \"1\",\n \"2\",\n \"3\",\n \"4\",\n \"5\",\n \"6\",\n \"0\"\n ]\n ],\n \"enable_in_bg\": 0,\n \"notify_recovered\": 1,\n \"notify_channels\": [],\n \"notify_groups_obj\": null,\n \"notify_groups\": null,\n \"notify_repeat_step\": 60,\n \"notify_max_number\": 0,\n \"recover_duration\": 0,\n \"callbacks\": [],\n \"runbook_url\": \"\",\n \"append_tags\": [\n \"alertname=MysqlSlaveIoThreadNotRunning\"\n ],\n \"annotations\": null,\n \"extra_config\": null,\n \"create_at\": 0,\n \"create_by\": \"\",\n \"update_at\": 0,\n \"update_by\": \"\",\n \"uuid\": 1717556328077065000\n },\n {\n \"id\": 0,\n \"group_id\": 0,\n \"cate\": \"prometheus\",\n \"datasource_ids\": [\n 0\n ],\n \"cluster\": \"\",\n \"name\": \"MysqlSlaveReplicationLag - categraf\",\n \"note\": \"\",\n \"prod\": \"metric\",\n \"algorithm\": \"\",\n \"algo_params\": null,\n \"delay\": 0,\n \"severity\": 1,\n \"severities\": [\n 1\n ],\n \"disabled\": 1,\n \"prom_for_duration\": 60,\n \"prom_ql\": \"\",\n \"rule_config\": {\n \"algo_params\": null,\n \"inhibit\": false,\n \"prom_ql\": \"\",\n \"queries\": [\n {\n \"prom_ql\": \"mysql_slave_status_master_server_id \\u003e 0 and ON (instance) (mysql_slave_status_seconds_behind_master - mysql_slave_status_sql_delay) \\u003e 30\",\n \"severity\": 1\n }\n ],\n \"severity\": 0\n },\n \"prom_eval_interval\": 15,\n \"enable_stime\": \"00:00\",\n \"enable_stimes\": [\n \"00:00\"\n ],\n \"enable_etime\": \"23:59\",\n \"enable_etimes\": [\n \"23:59\"\n ],\n \"enable_days_of_week\": [\n \"1\",\n \"2\",\n \"3\",\n \"4\",\n \"5\",\n \"6\",\n \"0\"\n ],\n \"enable_days_of_weeks\": [\n [\n \"1\",\n \"2\",\n \"3\",\n \"4\",\n \"5\",\n \"6\",\n \"0\"\n ]\n ],\n \"enable_in_bg\": 0,\n \"notify_recovered\": 1,\n \"notify_channels\": [],\n \"notify_groups_obj\": null,\n \"notify_groups\": null,\n \"notify_repeat_step\": 60,\n \"notify_max_number\": 0,\n \"recover_duration\": 0,\n \"callbacks\": [],\n \"runbook_url\": \"\",\n \"append_tags\": [\n \"alertname=MysqlSlaveReplicationLag\"\n ],\n \"annotations\": null,\n \"extra_config\": null,\n \"create_at\": 0,\n \"create_by\": \"\",\n \"update_at\": 0,\n \"update_by\": \"\",\n \"uuid\": 1717556328077529000\n },\n {\n \"id\": 0,\n \"group_id\": 0,\n \"cate\": \"prometheus\",\n \"datasource_ids\": [\n 0\n ],\n \"cluster\": \"\",\n \"name\": \"MysqlSlaveSqlThreadNotRunning - categraf\",\n \"note\": \"MySQL Slave SQL thread not running\",\n \"prod\": \"metric\",\n \"algorithm\": \"\",\n \"algo_params\": null,\n \"delay\": 0,\n \"severity\": 1,\n \"severities\": [\n 1\n ],\n \"disabled\": 1,\n \"prom_for_duration\": 0,\n \"prom_ql\": \"\",\n \"rule_config\": {\n \"algo_params\": null,\n \"inhibit\": false,\n \"prom_ql\": \"\",\n \"queries\": [\n {\n \"prom_ql\": \"mysql_slave_status_master_server_id \\u003e 0 and ON (instance) mysql_slave_status_slave_sql_running == 0\",\n \"severity\": 1\n }\n ],\n \"severity\": 0\n },\n \"prom_eval_interval\": 15,\n \"enable_stime\": \"00:00\",\n \"enable_stimes\": [\n \"00:00\"\n ],\n \"enable_etime\": \"23:59\",\n \"enable_etimes\": [\n \"23:59\"\n ],\n \"enable_days_of_week\": [\n \"1\",\n \"2\",\n \"3\",\n \"4\",\n \"5\",\n \"6\",\n \"0\"\n ],\n \"enable_days_of_weeks\": [\n [\n \"1\",\n \"2\",\n \"3\",\n \"4\",\n \"5\",\n \"6\",\n \"0\"\n ]\n ],\n \"enable_in_bg\": 0,\n \"notify_recovered\": 1,\n \"notify_channels\": [],\n \"notify_groups_obj\": null,\n \"notify_groups\": null,\n \"notify_repeat_step\": 60,\n \"notify_max_number\": 0,\n \"recover_duration\": 0,\n \"callbacks\": [],\n \"runbook_url\": \"\",\n \"append_tags\": [\n \"alertname=MysqlSlaveSqlThreadNotRunning\"\n ],\n \"annotations\": null,\n \"extra_config\": null,\n \"create_at\": 0,\n \"create_by\": \"\",\n \"update_at\": 0,\n \"update_by\": \"\",\n \"uuid\": 1717556328078038000\n },\n {\n \"id\": 0,\n \"group_id\": 0,\n \"cate\": \"prometheus\",\n \"datasource_ids\": [\n 0\n ],\n \"cluster\": \"\",\n \"name\": \"The number of connections in Mysql has exceeded 80% - categraf\",\n \"note\": \"More than 80% of MySQL connections are in use\",\n \"prod\": \"metric\",\n \"algorithm\": \"\",\n \"algo_params\": null,\n \"delay\": 0,\n \"severity\": 2,\n \"severities\": [\n 2\n ],\n \"disabled\": 1,\n \"prom_for_duration\": 120,\n \"prom_ql\": \"\",\n \"rule_config\": {\n \"algo_params\": null,\n \"inhibit\": false,\n \"prom_ql\": \"\",\n \"queries\": [\n {\n \"prom_ql\": \"avg by (instance) (mysql_global_status_threads_connected) / avg by (instance) (mysql_global_variables_max_connections) * 100 \\u003e 80\",\n \"severity\": 2\n }\n ],\n \"severity\": 0\n },\n \"prom_eval_interval\": 15,\n \"enable_stime\": \"00:00\",\n \"enable_stimes\": [\n \"00:00\"\n ],\n \"enable_etime\": \"23:59\",\n \"enable_etimes\": [\n \"23:59\"\n ],\n \"enable_days_of_week\": [\n \"1\",\n \"2\",\n \"3\",\n \"4\",\n \"5\",\n \"6\",\n \"0\"\n ],\n \"enable_days_of_weeks\": [\n [\n \"1\",\n \"2\",\n \"3\",\n \"4\",\n \"5\",\n \"6\",\n \"0\"\n ]\n ],\n \"enable_in_bg\": 0,\n \"notify_recovered\": 1,\n \"notify_channels\": [],\n \"notify_groups_obj\": null,\n \"notify_groups\": null,\n \"notify_repeat_step\": 60,\n \"notify_max_number\": 0,\n \"recover_duration\": 0,\n \"callbacks\": [],\n \"runbook_url\": \"\",\n \"append_tags\": [\n \"alertname=MysqlTooManyConnections\"\n ],\n \"annotations\": null,\n \"extra_config\": null,\n \"create_at\": 0,\n \"create_by\": \"\",\n \"update_at\": 0,\n \"update_by\": \"\",\n \"uuid\": 1717556328078545000\n }\n]"
},
{
"path": "integrations/MySQL/alerts/mysql_by_exporter.json",
"content": "[\n {\n \"id\": 0,\n \"group_id\": 0,\n \"cate\": \"prometheus\",\n \"datasource_ids\": [\n 0\n ],\n \"cluster\": \"\",\n \"name\": \"More than 60% of the connections in MySQL are in a running state\",\n \"note\": \"\",\n \"prod\": \"metric\",\n \"algorithm\": \"\",\n \"algo_params\": null,\n \"delay\": 0,\n \"severity\": 2,\n \"severities\": [\n 2\n ],\n \"disabled\": 1,\n \"prom_for_duration\": 120,\n \"prom_ql\": \"\",\n \"rule_config\": {\n \"algo_params\": null,\n \"inhibit\": false,\n \"prom_ql\": \"\",\n \"queries\": [\n {\n \"prom_ql\": \"avg by (instance) (mysql_global_status_threads_running) / avg by (instance) (mysql_global_variables_max_connections) * 100 \\u003e 60\",\n \"severity\": 2\n }\n ],\n \"severity\": 0\n },\n \"prom_eval_interval\": 15,\n \"enable_stime\": \"00:00\",\n \"enable_stimes\": [\n \"00:00\"\n ],\n \"enable_etime\": \"23:59\",\n \"enable_etimes\": [\n \"23:59\"\n ],\n \"enable_days_of_week\": [\n \"1\",\n \"2\",\n \"3\",\n \"4\",\n \"5\",\n \"6\",\n \"0\"\n ],\n \"enable_days_of_weeks\": [\n [\n \"1\",\n \"2\",\n \"3\",\n \"4\",\n \"5\",\n \"6\",\n \"0\"\n ]\n ],\n \"enable_in_bg\": 0,\n \"notify_recovered\": 1,\n \"notify_channels\": [],\n \"notify_groups_obj\": null,\n \"notify_groups\": null,\n \"notify_repeat_step\": 60,\n \"notify_max_number\": 0,\n \"recover_duration\": 0,\n \"callbacks\": [],\n \"runbook_url\": \"\",\n \"append_tags\": [\n \"alertname=MysqlHighThreadsRunning\"\n ],\n \"annotations\": null,\n \"extra_config\": null,\n \"create_at\": 0,\n \"create_by\": \"\",\n \"update_at\": 0,\n \"update_by\": \"\",\n \"uuid\": 1717556328079469000\n },\n {\n \"id\": 0,\n \"group_id\": 0,\n \"cate\": \"prometheus\",\n \"datasource_ids\": [\n 0\n ],\n \"cluster\": \"\",\n \"name\": \"More than 80% of MySQL files open\",\n \"note\": \"More than 80% of MySQL files open\",\n \"prod\": \"metric\",\n \"algorithm\": \"\",\n \"algo_params\": null,\n \"delay\": 0,\n \"severity\": 2,\n \"severities\": [\n 2\n ],\n \"disabled\": 1,\n \"prom_for_duration\": 120,\n \"prom_ql\": \"\",\n \"rule_config\": {\n \"algo_params\": null,\n \"inhibit\": false,\n \"prom_ql\": \"\",\n \"queries\": [\n {\n \"prom_ql\": \"avg by (instance) (mysql_global_status_innodb_num_open_files) / avg by (instance)(mysql_global_variables_open_files_limit) * 100 \\u003e 80\",\n \"severity\": 2\n }\n ],\n \"severity\": 0\n },\n \"prom_eval_interval\": 15,\n \"enable_stime\": \"00:00\",\n \"enable_stimes\": [\n \"00:00\"\n ],\n \"enable_etime\": \"23:59\",\n \"enable_etimes\": [\n \"23:59\"\n ],\n \"enable_days_of_week\": [\n \"1\",\n \"2\",\n \"3\",\n \"4\",\n \"5\",\n \"6\",\n \"0\"\n ],\n \"enable_days_of_weeks\": [\n [\n \"1\",\n \"2\",\n \"3\",\n \"4\",\n \"5\",\n \"6\",\n \"0\"\n ]\n ],\n \"enable_in_bg\": 0,\n \"notify_recovered\": 1,\n \"notify_channels\": [],\n \"notify_groups_obj\": null,\n \"notify_groups\": null,\n \"notify_repeat_step\": 60,\n \"notify_max_number\": 0,\n \"recover_duration\": 0,\n \"callbacks\": [],\n \"runbook_url\": \"\",\n \"append_tags\": [\n \"alertname=MysqlHighOpenFiles\"\n ],\n \"annotations\": null,\n \"extra_config\": null,\n \"create_at\": 0,\n \"create_by\": \"\",\n \"update_at\": 0,\n \"update_by\": \"\",\n \"uuid\": 1717556328079961000\n },\n {\n \"id\": 0,\n \"group_id\": 0,\n \"cate\": \"prometheus\",\n \"datasource_ids\": [\n 0\n ],\n \"cluster\": \"\",\n \"name\": \"MySQL connection count has exceeded 80%\",\n \"note\": \"More than 80% of MySQL connections are in use\",\n \"prod\": \"metric\",\n \"algorithm\": \"\",\n \"algo_params\": null,\n \"delay\": 0,\n \"severity\": 2,\n \"severities\": [\n 2\n ],\n \"disabled\": 1,\n \"prom_for_duration\": 120,\n \"prom_ql\": \"\",\n \"rule_config\": {\n \"algo_params\": null,\n \"inhibit\": false,\n \"prom_ql\": \"\",\n \"queries\": [\n {\n \"prom_ql\": \"avg by (instance) (mysql_global_status_threads_connected) / avg by (instance) (mysql_global_variables_max_connections) * 100 \\u003e 80\",\n \"severity\": 2\n }\n ],\n \"severity\": 0\n },\n \"prom_eval_interval\": 15,\n \"enable_stime\": \"00:00\",\n \"enable_stimes\": [\n \"00:00\"\n ],\n \"enable_etime\": \"23:59\",\n \"enable_etimes\": [\n \"23:59\"\n ],\n \"enable_days_of_week\": [\n \"1\",\n \"2\",\n \"3\",\n \"4\",\n \"5\",\n \"6\",\n \"0\"\n ],\n \"enable_days_of_weeks\": [\n [\n \"1\",\n \"2\",\n \"3\",\n \"4\",\n \"5\",\n \"6\",\n \"0\"\n ]\n ],\n \"enable_in_bg\": 0,\n \"notify_recovered\": 1,\n \"notify_channels\": [],\n \"notify_groups_obj\": null,\n \"notify_groups\": null,\n \"notify_repeat_step\": 60,\n \"notify_max_number\": 0,\n \"recover_duration\": 0,\n \"callbacks\": [],\n \"runbook_url\": \"\",\n \"append_tags\": [\n \"alertname=MysqlTooManyConnections\"\n ],\n \"annotations\": null,\n \"extra_config\": null,\n \"create_at\": 0,\n \"create_by\": \"\",\n \"update_at\": 0,\n \"update_by\": \"\",\n \"uuid\": 1717556328080440000\n },\n {\n \"id\": 0,\n \"group_id\": 0,\n \"cate\": \"prometheus\",\n \"datasource_ids\": [\n 0\n ],\n \"cluster\": \"\",\n \"name\": \"Mysql has just restarted. Please be advised - exporter\",\n \"note\": \"MySQL has just been restarted, less than one minute ago\",\n \"prod\": \"metric\",\n \"algorithm\": \"\",\n \"algo_params\": null,\n \"delay\": 0,\n \"severity\": 3,\n \"severities\": [\n 3\n ],\n \"disabled\": 1,\n \"prom_for_duration\": 0,\n \"prom_ql\": \"\",\n \"rule_config\": {\n \"algo_params\": null,\n \"inhibit\": false,\n \"prom_ql\": \"\",\n \"queries\": [\n {\n \"prom_ql\": \"mysql_global_status_uptime \\u003c 60\",\n \"severity\": 3\n }\n ],\n \"severity\": 0\n },\n \"prom_eval_interval\": 15,\n \"enable_stime\": \"00:00\",\n \"enable_stimes\": [\n \"00:00\"\n ],\n \"enable_etime\": \"23:59\",\n \"enable_etimes\": [\n \"23:59\"\n ],\n \"enable_days_of_week\": [\n \"1\",\n \"2\",\n \"3\",\n \"4\",\n \"5\",\n \"6\",\n \"0\"\n ],\n \"enable_days_of_weeks\": [\n [\n \"1\",\n \"2\",\n \"3\",\n \"4\",\n \"5\",\n \"6\",\n \"0\"\n ]\n ],\n \"enable_in_bg\": 0,\n \"notify_recovered\": 1,\n \"notify_channels\": [],\n \"notify_groups_obj\": null,\n \"notify_groups\": null,\n \"notify_repeat_step\": 60,\n \"notify_max_number\": 0,\n \"recover_duration\": 0,\n \"callbacks\": [],\n \"runbook_url\": \"\",\n \"append_tags\": [\n \"alertname=MysqlRestarted\"\n ],\n \"annotations\": null,\n \"extra_config\": null,\n \"create_at\": 0,\n \"create_by\": \"\",\n \"update_at\": 0,\n \"update_by\": \"\",\n \"uuid\": 1717556328080928000\n },\n {\n \"id\": 0,\n \"group_id\": 0,\n \"cate\": \"prometheus\",\n \"datasource_ids\": [\n 0\n ],\n \"cluster\": \"\",\n \"name\": \"MySQL server mysql has some new slow query\",\n \"note\": \"\",\n \"prod\": \"metric\",\n \"algorithm\": \"\",\n \"algo_params\": null,\n \"delay\": 0,\n \"severity\": 2,\n \"severities\": [\n 2\n ],\n \"disabled\": 1,\n \"prom_for_duration\": 120,\n \"prom_ql\": \"\",\n \"rule_config\": {\n \"algo_params\": null,\n \"inhibit\": false,\n \"prom_ql\": \"\",\n \"queries\": [\n {\n \"prom_ql\": \"increase(mysql_global_status_slow_queries[1m]) \\u003e 0\",\n \"severity\": 2\n }\n ],\n \"severity\": 0\n },\n \"prom_eval_interval\": 15,\n \"enable_stime\": \"00:00\",\n \"enable_stimes\": [\n \"00:00\"\n ],\n \"enable_etime\": \"23:59\",\n \"enable_etimes\": [\n \"23:59\"\n ],\n \"enable_days_of_week\": [\n \"1\",\n \"2\",\n \"3\",\n \"4\",\n \"5\",\n \"6\",\n \"0\"\n ],\n \"enable_days_of_weeks\": [\n [\n \"1\",\n \"2\",\n \"3\",\n \"4\",\n \"5\",\n \"6\",\n \"0\"\n ]\n ],\n \"enable_in_bg\": 0,\n \"notify_recovered\": 1,\n \"notify_channels\": [],\n \"notify_groups_obj\": null,\n \"notify_groups\": null,\n \"notify_repeat_step\": 60,\n \"notify_max_number\": 0,\n \"recover_duration\": 0,\n \"callbacks\": [],\n \"runbook_url\": \"\",\n \"append_tags\": [\n \"alertname=MysqlSlowQueries\"\n ],\n \"annotations\": null,\n \"extra_config\": null,\n \"create_at\": 0,\n \"create_by\": \"\",\n \"update_at\": 0,\n \"update_by\": \"\",\n \"uuid\": 1717556328081375000\n },\n {\n \"id\": 0,\n \"group_id\": 0,\n \"cate\": \"prometheus\",\n \"datasource_ids\": [\n 0\n ],\n \"cluster\": \"\",\n \"name\": \"MysqlInnodbLogWaits - exporter\",\n \"note\": \"MySQL innodb log writes stalling\",\n \"prod\": \"metric\",\n \"algorithm\": \"\",\n \"algo_params\": null,\n \"delay\": 0,\n \"severity\": 2,\n \"severities\": [\n 2\n ],\n \"disabled\": 1,\n \"prom_for_duration\": 0,\n \"prom_ql\": \"\",\n \"rule_config\": {\n \"algo_params\": null,\n \"inhibit\": false,\n \"prom_ql\": \"\",\n \"queries\": [\n {\n \"prom_ql\": \"rate(mysql_global_status_innodb_log_waits[15m]) \\u003e 10\",\n \"severity\": 2\n }\n ],\n \"severity\": 0\n },\n \"prom_eval_interval\": 15,\n \"enable_stime\": \"00:00\",\n \"enable_stimes\": [\n \"00:00\"\n ],\n \"enable_etime\": \"23:59\",\n \"enable_etimes\": [\n \"23:59\"\n ],\n \"enable_days_of_week\": [\n \"1\",\n \"2\",\n \"3\",\n \"4\",\n \"5\",\n \"6\",\n \"0\"\n ],\n \"enable_days_of_weeks\": [\n [\n \"1\",\n \"2\",\n \"3\",\n \"4\",\n \"5\",\n \"6\",\n \"0\"\n ]\n ],\n \"enable_in_bg\": 0,\n \"notify_recovered\": 1,\n \"notify_channels\": [],\n \"notify_groups_obj\": null,\n \"notify_groups\": null,\n \"notify_repeat_step\": 60,\n \"notify_max_number\": 0,\n \"recover_duration\": 0,\n \"callbacks\": [],\n \"runbook_url\": \"\",\n \"append_tags\": [\n \"alertname=MysqlInnodbLogWaits\"\n ],\n \"annotations\": null,\n \"extra_config\": null,\n \"create_at\": 0,\n \"create_by\": \"\",\n \"update_at\": 0,\n \"update_by\": \"\",\n \"uuid\": 1717556328081825000\n },\n {\n \"id\": 0,\n \"group_id\": 0,\n \"cate\": \"prometheus\",\n \"datasource_ids\": [\n 0\n ],\n \"cluster\": \"\",\n \"name\": \"MysqlSlaveIoThreadNotRunning - exporter\",\n \"note\": \"MySQL Slave IO thread not running\",\n \"prod\": \"metric\",\n \"algorithm\": \"\",\n \"algo_params\": null,\n \"delay\": 0,\n \"severity\": 1,\n \"severities\": [\n 1\n ],\n \"disabled\": 1,\n \"prom_for_duration\": 0,\n \"prom_ql\": \"\",\n \"rule_config\": {\n \"algo_params\": null,\n \"inhibit\": false,\n \"prom_ql\": \"\",\n \"queries\": [\n {\n \"prom_ql\": \"mysql_slave_status_master_server_id \\u003e 0 and ON (instance) mysql_slave_status_slave_io_running == 0\",\n \"severity\": 1\n }\n ],\n \"severity\": 0\n },\n \"prom_eval_interval\": 15,\n \"enable_stime\": \"00:00\",\n \"enable_stimes\": [\n \"00:00\"\n ],\n \"enable_etime\": \"23:59\",\n \"enable_etimes\": [\n \"23:59\"\n ],\n \"enable_days_of_week\": [\n \"1\",\n \"2\",\n \"3\",\n \"4\",\n \"5\",\n \"6\",\n \"0\"\n ],\n \"enable_days_of_weeks\": [\n [\n \"1\",\n \"2\",\n \"3\",\n \"4\",\n \"5\",\n \"6\",\n \"0\"\n ]\n ],\n \"enable_in_bg\": 0,\n \"notify_recovered\": 1,\n \"notify_channels\": [],\n \"notify_groups_obj\": null,\n \"notify_groups\": null,\n \"notify_repeat_step\": 60,\n \"notify_max_number\": 0,\n \"recover_duration\": 0,\n \"callbacks\": [],\n \"runbook_url\": \"\",\n \"append_tags\": [\n \"alertname=MysqlSlaveIoThreadNotRunning\"\n ],\n \"annotations\": null,\n \"extra_config\": null,\n \"create_at\": 0,\n \"create_by\": \"\",\n \"update_at\": 0,\n \"update_by\": \"\",\n \"uuid\": 1717556328082227000\n },\n {\n \"id\": 0,\n \"group_id\": 0,\n \"cate\": \"prometheus\",\n \"datasource_ids\": [\n 0\n ],\n \"cluster\": \"\",\n \"name\": \"MysqlSlaveReplicationLag - exporter\",\n \"note\": \"\",\n \"prod\": \"metric\",\n \"algorithm\": \"\",\n \"algo_params\": null,\n \"delay\": 0,\n \"severity\": 1,\n \"severities\": [\n 1\n ],\n \"disabled\": 1,\n \"prom_for_duration\": 60,\n \"prom_ql\": \"\",\n \"rule_config\": {\n \"algo_params\": null,\n \"inhibit\": false,\n \"prom_ql\": \"\",\n \"queries\": [\n {\n \"prom_ql\": \"mysql_slave_status_master_server_id \\u003e 0 and ON (instance) (mysql_slave_status_seconds_behind_master - mysql_slave_status_sql_delay) \\u003e 30\",\n \"severity\": 1\n }\n ],\n \"severity\": 0\n },\n \"prom_eval_interval\": 15,\n \"enable_stime\": \"00:00\",\n \"enable_stimes\": [\n \"00:00\"\n ],\n \"enable_etime\": \"23:59\",\n \"enable_etimes\": [\n \"23:59\"\n ],\n \"enable_days_of_week\": [\n \"1\",\n \"2\",\n \"3\",\n \"4\",\n \"5\",\n \"6\",\n \"0\"\n ],\n \"enable_days_of_weeks\": [\n [\n \"1\",\n \"2\",\n \"3\",\n \"4\",\n \"5\",\n \"6\",\n \"0\"\n ]\n ],\n \"enable_in_bg\": 0,\n \"notify_recovered\": 1,\n \"notify_channels\": [],\n \"notify_groups_obj\": null,\n \"notify_groups\": null,\n \"notify_repeat_step\": 60,\n \"notify_max_number\": 0,\n \"recover_duration\": 0,\n \"callbacks\": [],\n \"runbook_url\": \"\",\n \"append_tags\": [\n \"alertname=MysqlSlaveReplicationLag\"\n ],\n \"annotations\": null,\n \"extra_config\": null,\n \"create_at\": 0,\n \"create_by\": \"\",\n \"update_at\": 0,\n \"update_by\": \"\",\n \"uuid\": 1717556328082623000\n },\n {\n \"id\": 0,\n \"group_id\": 0,\n \"cate\": \"prometheus\",\n \"datasource_ids\": [\n 0\n ],\n \"cluster\": \"\",\n \"name\": \"MysqlSlaveSqlThreadNotRunning - exporter\",\n \"note\": \"MySQL Slave SQL thread not running\",\n \"prod\": \"metric\",\n \"algorithm\": \"\",\n \"algo_params\": null,\n \"delay\": 0,\n \"severity\": 1,\n \"severities\": [\n 1\n ],\n \"disabled\": 1,\n \"prom_for_duration\": 0,\n \"prom_ql\": \"\",\n \"rule_config\": {\n \"algo_params\": null,\n \"inhibit\": false,\n \"prom_ql\": \"\",\n \"queries\": [\n {\n \"prom_ql\": \"mysql_slave_status_master_server_id \\u003e 0 and ON (instance) mysql_slave_status_slave_sql_running == 0\",\n \"severity\": 1\n }\n ],\n \"severity\": 0\n },\n \"prom_eval_interval\": 15,\n \"enable_stime\": \"00:00\",\n \"enable_stimes\": [\n \"00:00\"\n ],\n \"enable_etime\": \"23:59\",\n \"enable_etimes\": [\n \"23:59\"\n ],\n \"enable_days_of_week\": [\n \"1\",\n \"2\",\n \"3\",\n \"4\",\n \"5\",\n \"6\",\n \"0\"\n ],\n \"enable_days_of_weeks\": [\n [\n \"1\",\n \"2\",\n \"3\",\n \"4\",\n \"5\",\n \"6\",\n \"0\"\n ]\n ],\n \"enable_in_bg\": 0,\n \"notify_recovered\": 1,\n \"notify_channels\": [],\n \"notify_groups_obj\": null,\n \"notify_groups\": null,\n \"notify_repeat_step\": 60,\n \"notify_max_number\": 0,\n \"recover_duration\": 0,\n \"callbacks\": [],\n \"runbook_url\": \"\",\n \"append_tags\": [\n \"alertname=MysqlSlaveSqlThreadNotRunning\"\n ],\n \"annotations\": null,\n \"extra_config\": null,\n \"create_at\": 0,\n \"create_by\": \"\",\n \"update_at\": 0,\n \"update_by\": \"\",\n \"uuid\": 1717556328083030000\n },\n {\n \"id\": 0,\n \"group_id\": 0,\n \"cate\": \"prometheus\",\n \"datasource_ids\": [\n 0\n ],\n \"cluster\": \"\",\n \"name\": \"The MySQL instance is down\",\n \"note\": \"\",\n \"prod\": \"metric\",\n \"algorithm\": \"\",\n \"algo_params\": null,\n \"delay\": 0,\n \"severity\": 1,\n \"severities\": [\n 1\n ],\n \"disabled\": 1,\n \"prom_for_duration\": 0,\n \"prom_ql\": \"\",\n \"rule_config\": {\n \"algo_params\": null,\n \"inhibit\": false,\n \"prom_ql\": \"\",\n \"queries\": [\n {\n \"prom_ql\": \"mysql_up == 0\",\n \"severity\": 1\n }\n ],\n \"severity\": 0\n },\n \"prom_eval_interval\": 15,\n \"enable_stime\": \"00:00\",\n \"enable_stimes\": [\n \"00:00\"\n ],\n \"enable_etime\": \"23:59\",\n \"enable_etimes\": [\n \"23:59\"\n ],\n \"enable_days_of_week\": [\n \"1\",\n \"2\",\n \"3\",\n \"4\",\n \"5\",\n \"6\",\n \"0\"\n ],\n \"enable_days_of_weeks\": [\n [\n \"1\",\n \"2\",\n \"3\",\n \"4\",\n \"5\",\n \"6\",\n \"0\"\n ]\n ],\n \"enable_in_bg\": 0,\n \"notify_recovered\": 1,\n \"notify_channels\": [],\n \"notify_groups_obj\": null,\n \"notify_groups\": null,\n \"notify_repeat_step\": 60,\n \"notify_max_number\": 0,\n \"recover_duration\": 0,\n \"callbacks\": [],\n \"runbook_url\": \"\",\n \"append_tags\": [\n \"alertname=MysqlDown\"\n ],\n \"annotations\": null,\n \"extra_config\": null,\n \"create_at\": 0,\n \"create_by\": \"\",\n \"update_at\": 0,\n \"update_by\": \"\",\n \"uuid\": 1717556328083447000\n }\n]"
},
{
"path": "integrations/MySQL/collect/mysql/mysql.toml",
"content": "# # collect interval\n# interval = 15\n\n# [[queries]]\n# measurement = \"users\"\n# metric_fields = [ \"total\" ]\n# label_fields = [ \"service\" ]\n# timeout = \"3s\"\n# request = '''\n# select 'n9e' as service, count(*) as total from n9e_v5.users\n# '''\n\n\n[[instances]]\n# address = \"127.0.0.1:3306\"\n# username = \"root\"\n# password = \"1234\"\n\n# # set tls=custom to enable tls\n# parameters = \"tls=false\"\n\n# extra_status_metrics = true\n# extra_innodb_metrics = false\n# gather_processlist_processes_by_state = false\n# gather_processlist_processes_by_user = false\n# gather_schema_size = true\n# gather_table_size = false\n# gather_system_table_size = false\n# gather_slave_status = true\n\n# # timeout\n# timeout_seconds = 3\n\n# # interval = global.interval * interval_times\n# interval_times = 1\n\n# important! use global unique string to specify instance\n# labels = { instance=\"n9e-10.2.3.4:3306\" }\n\n## Optional TLS Config\n# use_tls = false\n# tls_min_version = \"1.2\"\n# tls_ca = \"/etc/categraf/ca.pem\"\n# tls_cert = \"/etc/categraf/cert.pem\"\n# tls_key = \"/etc/categraf/key.pem\"\n## Use TLS but skip chain & host verification\n# insecure_skip_verify = true\n\n#[[instances.queries]]\n# measurement = \"lock_wait\"\n# metric_fields = [ \"total\" ]\n# timeout = \"3s\"\n# request = '''\n#SELECT count(*) as total FROM information_schema.innodb_trx WHERE trx_state='LOCK WAIT'\n#'''\n\n# [[instances.queries]]\n# measurement = \"users\"\n# metric_fields = [ \"total\" ]\n# label_fields = [ \"service\" ]\n# # field_to_append = \"\"\n# timeout = \"3s\"\n# request = '''\n# select 'n9e' as service, count(*) as total from n9e_v5.users\n# '''\n"
},
{
"path": "integrations/MySQL/dashboards/MySQL-by-address.json",
"content": "{\n \"name\": \"MySQL 仪表盘(使用 address 筛选,用于中心端 Categraf 采集远端多个 mysql 实例的场景)\",\n \"tags\": \"\",\n \"configs\": {\n \"panels\": [\n {\n \"collapsed\": true,\n \"id\": \"dfd77e6d-4e88-4bd9-8c19-74f566920f6c\",\n \"layout\": {\n \"h\": 1,\n \"i\": \"dfd77e6d-4e88-4bd9-8c19-74f566920f6c\",\n \"isResizable\": false,\n \"w\": 24,\n \"x\": 0,\n \"y\": 0\n },\n \"name\": \"Basic Info\",\n \"panels\": [],\n \"type\": \"row\"\n },\n {\n \"custom\": {\n \"alignItems\": \"center\",\n \"bgColor\": \"rgba(0, 0, 0, 0)\",\n \"content\": \")\n# search_exec_substring = \"nginx\"\n\n# # pattern as argument for pgrep (ie, pgrep -f )\n# search_cmdline_substring = \"n9e server\"\n\n# # windows service name\n# search_win_service = \"\"\n\n# # search process with specific user, option with exec_substring or cmdline_substring\n# search_user = \"\"\n\n# # append some labels for series\n# labels = { region=\"cloud\", product=\"n9e\" }\n\n# # interval = global.interval * interval_times\n# interval_times = 1\n\n# # mode to use when calculating CPU usage. can be one of 'solaris' or 'irix'\n# mode = \"irix\"\n\n# sum of threads/fd/io/cpu/mem, min of uptime/limit\ngather_total = true\n\n# will append pid as tag\ngather_per_pid = false\n\n# gather jvm metrics only when jstat is ready\n# gather_more_metrics = [\n# \"threads\",\n# \"fd\",\n# \"io\",\n# \"uptime\",\n# \"cpu\",\n# \"mem\",\n# \"limit\",\n# \"jvm\"\n# ]\n"
},
{
"path": "integrations/Procstat/dashboards/categraf-procstat.json",
"content": "{\n \"name\": \"Procstat\",\n \"tags\": \"Categraf OS\",\n \"ident\": \"\",\n \"uuid\": 1717556328263679000,\n \"configs\": {\n \"panels\": [\n {\n \"type\": \"stat\",\n \"id\": \"be9aac6c-4401-4c61-8c43-574cf314ffef\",\n \"layout\": {\n \"h\": 4,\n \"i\": \"be9aac6c-4401-4c61-8c43-574cf314ffef\",\n \"isResizable\": true,\n \"w\": 5,\n \"x\": 0,\n \"y\": 0\n },\n \"version\": \"3.1.0\",\n \"datasourceCate\": \"prometheus\",\n \"datasourceValue\": \"${Datasource}\",\n \"targets\": [\n {\n \"expr\": \"procstat_lookup_count{ident=~\\\"$ident\\\", search_string=~\\\"$search_string\\\"}\",\n \"instant\": true,\n \"legend\": \"{{ident}} {{search_string}}\",\n \"refId\": \"A\",\n \"maxDataPoints\": 240\n }\n ],\n \"transformations\": [\n {\n \"id\": \"organize\",\n \"options\": {}\n }\n ],\n \"name\": \"Proc Count Now\",\n \"maxPerRow\": 4,\n \"custom\": {\n \"textMode\": \"valueAndName\",\n \"graphMode\": \"none\",\n \"colorMode\": \"background\",\n \"calc\": \"lastNotNull\",\n \"valueField\": \"Value\",\n \"colSpan\": 0,\n \"textSize\": {},\n \"orientation\": \"auto\"\n },\n \"options\": {\n \"thresholds\": {\n \"steps\": [\n {\n \"color\": \"#634CD9\",\n \"value\": null,\n \"type\": \"base\"\n }\n ]\n },\n \"standardOptions\": {}\n },\n \"overrides\": [\n {\n \"matcher\": {\n \"id\": \"byFrameRefID\"\n },\n \"properties\": {\n \"thresholds\": {\n \"steps\": [\n {\n \"color\": \"#6C53B1\",\n \"value\": null,\n \"type\": \"base\"\n }\n ]\n }\n }\n }\n ]\n },\n {\n \"custom\": {\n \"calc\": \"lastNotNull\",\n \"colorMode\": \"background\",\n \"columns\": [\n \"ident\",\n \"search_string\",\n \"value\"\n ],\n \"displayMode\": \"labelsOfSeriesToRows\",\n \"showHeader\": true,\n \"sortColumn\": \"ident\",\n \"sortOrder\": \"ascend\",\n \"tableLayout\": \"fixed\",\n \"nowrap\": false\n },\n \"datasourceCate\": \"prometheus\",\n \"datasourceValue\": \"${Datasource}\",\n \"id\": \"da621e2c-ae2b-4375-9a66-2bec7832490b\",\n \"layout\": {\n \"h\": 4,\n \"i\": \"79db82d9-5f46-4c45-bb9f-c23f94d99e0a\",\n \"isResizable\": true,\n \"w\": 9,\n \"x\": 5,\n \"y\": 0\n },\n \"name\": \"Proc Count Table\",\n \"options\": {\n \"standardOptions\": {},\n \"valueMappings\": [\n {\n \"match\": {\n \"special\": 0\n },\n \"result\": {\n \"color\": \"#fa0c0c\"\n },\n \"type\": \"special\"\n },\n {\n \"match\": {\n \"from\": 1\n },\n \"result\": {\n \"color\": \"#2c9d3d\"\n },\n \"type\": \"range\"\n }\n ]\n },\n \"overrides\": [\n {}\n ],\n \"targets\": [\n {\n \"expr\": \"procstat_lookup_count{ident=~\\\"$ident\\\", search_string=~\\\"$search_string\\\"}\",\n \"instant\": true,\n \"legend\": \"{{ident}} {{search_string}}\",\n \"refId\": \"A\"\n }\n ],\n \"transformations\": [\n {\n \"id\": \"organize\",\n \"options\": {}\n }\n ],\n \"type\": \"table\",\n \"version\": \"3.0.0\"\n },\n {\n \"type\": \"timeseries\",\n \"id\": \"881c04fd-8804-432e-9b34-b4761590de20\",\n \"layout\": {\n \"h\": 4,\n \"i\": \"24b55362-d900-43c0-98d5-f2e994bf22a6\",\n \"isResizable\": true,\n \"w\": 10,\n \"x\": 14,\n \"y\": 0\n },\n \"version\": \"3.1.0\",\n \"datasourceCate\": \"prometheus\",\n \"datasourceValue\": \"${Datasource}\",\n \"targets\": [\n {\n \"expr\": \"procstat_lookup_count{ident=~\\\"$ident\\\", search_string=~\\\"$search_string\\\"}\",\n \"instant\": false,\n \"legend\": \"{{ident}} {{search_string}}\",\n \"refId\": \"A\",\n \"maxDataPoints\": 240\n }\n ],\n \"transformations\": [\n {\n \"id\": \"organize\",\n \"options\": {}\n }\n ],\n \"name\": \"Proc Count Trend\",\n \"maxPerRow\": 4,\n \"options\": {\n \"tooltip\": {\n \"mode\": \"all\",\n \"sort\": \"desc\"\n },\n \"legend\": {\n \"displayMode\": \"hidden\",\n \"placement\": \"bottom\",\n \"behaviour\": \"showItem\",\n \"selectMode\": \"single\"\n },\n \"standardOptions\": {},\n \"thresholds\": {\n \"mode\": \"absolute\",\n \"steps\": [\n {\n \"color\": \"#634CD9\",\n \"value\": null,\n \"type\": \"base\"\n }\n ]\n },\n \"thresholdsStyle\": {\n \"mode\": \"dashed\"\n }\n },\n \"custom\": {\n \"drawStyle\": \"lines\",\n \"lineInterpolation\": \"smooth\",\n \"spanNulls\": false,\n \"lineWidth\": 2,\n \"fillOpacity\": 0.3,\n \"gradientMode\": \"opacity\",\n \"stack\": \"off\",\n \"scaleDistribution\": {\n \"type\": \"linear\"\n },\n \"showPoints\": \"none\",\n \"pointSize\": 5\n },\n \"overrides\": [\n {\n \"matcher\": {\n \"id\": \"byFrameRefID\"\n },\n \"properties\": {\n \"rightYAxisDisplay\": \"off\"\n }\n }\n ]\n },\n {\n \"type\": \"stat\",\n \"id\": \"ffeb0fc6-ee02-4fdd-a8e3-ec2b9db9c23c\",\n \"layout\": {\n \"h\": 4,\n \"i\": \"acd6e7b5-99f5-4d9b-9124-8072c14e5fea\",\n \"isResizable\": true,\n \"w\": 5,\n \"x\": 0,\n \"y\": 4\n },\n \"version\": \"3.1.0\",\n \"datasourceCate\": \"prometheus\",\n \"datasourceValue\": \"${Datasource}\",\n \"targets\": [\n {\n \"expr\": \"procstat_uptime_minimum{ident=~\\\"$ident\\\", search_string=~\\\"$search_string\\\"}\",\n \"instant\": true,\n \"legend\": \"{{ident}} {{search_string}}\",\n \"refId\": \"A\",\n \"maxDataPoints\": 240\n }\n ],\n \"transformations\": [\n {\n \"id\": \"organize\",\n \"options\": {}\n }\n ],\n \"name\": \"Proc Uptime\",\n \"maxPerRow\": 4,\n \"custom\": {\n \"textMode\": \"valueAndName\",\n \"graphMode\": \"none\",\n \"colorMode\": \"value\",\n \"calc\": \"lastNotNull\",\n \"valueField\": \"Value\",\n \"colSpan\": 0,\n \"textSize\": {},\n \"orientation\": \"auto\"\n },\n \"options\": {\n \"thresholds\": {\n \"steps\": [\n {\n \"color\": \"#2c9d3d\",\n \"value\": null,\n \"type\": \"base\"\n }\n ]\n },\n \"standardOptions\": {\n \"util\": \"seconds\",\n \"decimals\": 2\n }\n },\n \"overrides\": [\n {\n \"matcher\": {\n \"id\": \"byFrameRefID\"\n },\n \"properties\": {\n \"thresholds\": {\n \"steps\": [\n {\n \"color\": \"#6C53B1\",\n \"value\": null,\n \"type\": \"base\"\n }\n ]\n }\n }\n }\n ]\n },\n {\n \"type\": \"timeseries\",\n \"id\": \"c642a30a-da86-402c-87bf-c2f98616bf95\",\n \"layout\": {\n \"h\": 4,\n \"i\": \"c642a30a-da86-402c-87bf-c2f98616bf95\",\n \"isResizable\": true,\n \"w\": 9,\n \"x\": 5,\n \"y\": 4\n },\n \"version\": \"3.1.0\",\n \"datasourceCate\": \"prometheus\",\n \"datasourceValue\": \"${Datasource}\",\n \"targets\": [\n {\n \"expr\": \"procstat_cpu_usage_total{ident=~\\\"$ident\\\", search_string=~\\\"$search_string\\\"}\",\n \"refId\": \"A\",\n \"maxDataPoints\": 240\n }\n ],\n \"transformations\": [\n {\n \"id\": \"organize\",\n \"options\": {}\n }\n ],\n \"name\": \"CPU Util\",\n \"maxPerRow\": 4,\n \"options\": {\n \"tooltip\": {\n \"mode\": \"all\",\n \"sort\": \"desc\"\n },\n \"legend\": {\n \"displayMode\": \"hidden\",\n \"placement\": \"bottom\",\n \"behaviour\": \"showItem\",\n \"selectMode\": \"single\"\n },\n \"standardOptions\": {\n \"util\": \"percent\",\n \"decimals\": 2\n },\n \"thresholds\": {\n \"mode\": \"absolute\",\n \"steps\": [\n {\n \"color\": \"#634CD9\",\n \"value\": null,\n \"type\": \"base\"\n }\n ]\n },\n \"thresholdsStyle\": {\n \"mode\": \"dashed\"\n }\n },\n \"custom\": {\n \"drawStyle\": \"lines\",\n \"lineInterpolation\": \"smooth\",\n \"spanNulls\": false,\n \"lineWidth\": 2,\n \"fillOpacity\": 0.3,\n \"gradientMode\": \"opacity\",\n \"stack\": \"off\",\n \"scaleDistribution\": {\n \"type\": \"linear\"\n },\n \"showPoints\": \"none\",\n \"pointSize\": 5\n },\n \"overrides\": [\n {\n \"matcher\": {\n \"id\": \"byFrameRefID\"\n },\n \"properties\": {\n \"rightYAxisDisplay\": \"off\"\n }\n }\n ]\n },\n {\n \"type\": \"timeseries\",\n \"id\": \"cbc2444e-49c7-45e1-b64e-cd1282b5a419\",\n \"layout\": {\n \"h\": 4,\n \"i\": \"198846a2-4794-4ba9-9c2d-137bce22f266\",\n \"isResizable\": true,\n \"w\": 10,\n \"x\": 14,\n \"y\": 4\n },\n \"version\": \"3.1.0\",\n \"datasourceCate\": \"prometheus\",\n \"datasourceValue\": \"${Datasource}\",\n \"targets\": [\n {\n \"expr\": \"procstat_mem_usage_total{ident=~\\\"$ident\\\", search_string=~\\\"$search_string\\\"}\",\n \"refId\": \"A\",\n \"maxDataPoints\": 240\n }\n ],\n \"transformations\": [\n {\n \"id\": \"organize\",\n \"options\": {}\n }\n ],\n \"name\": \"Mem Util\",\n \"maxPerRow\": 4,\n \"options\": {\n \"tooltip\": {\n \"mode\": \"all\",\n \"sort\": \"desc\"\n },\n \"legend\": {\n \"displayMode\": \"hidden\",\n \"placement\": \"bottom\",\n \"behaviour\": \"showItem\",\n \"selectMode\": \"single\"\n },\n \"standardOptions\": {\n \"util\": \"percent\",\n \"decimals\": 2\n },\n \"thresholds\": {\n \"mode\": \"absolute\",\n \"steps\": [\n {\n \"color\": \"#634CD9\",\n \"value\": null,\n \"type\": \"base\"\n }\n ]\n },\n \"thresholdsStyle\": {\n \"mode\": \"dashed\"\n }\n },\n \"custom\": {\n \"drawStyle\": \"lines\",\n \"lineInterpolation\": \"smooth\",\n \"spanNulls\": false,\n \"lineWidth\": 2,\n \"fillOpacity\": 0.3,\n \"gradientMode\": \"opacity\",\n \"stack\": \"off\",\n \"scaleDistribution\": {\n \"type\": \"linear\"\n },\n \"showPoints\": \"none\",\n \"pointSize\": 5\n },\n \"overrides\": [\n {\n \"matcher\": {\n \"id\": \"byFrameRefID\"\n },\n \"properties\": {\n \"rightYAxisDisplay\": \"off\"\n }\n }\n ]\n },\n {\n \"type\": \"timeseries\",\n \"id\": \"d2bff162-5801-4d85-94d7-d63145d5b935\",\n \"layout\": {\n \"h\": 4,\n \"i\": \"a208e192-cf74-468b-9bcb-cb81c8d78d24\",\n \"isResizable\": true,\n \"w\": 12,\n \"x\": 0,\n \"y\": 8\n },\n \"version\": \"3.1.0\",\n \"datasourceCate\": \"prometheus\",\n \"datasourceValue\": \"${Datasource}\",\n \"targets\": [\n {\n \"expr\": \"procstat_num_fds_total{ident=~\\\"$ident\\\", search_string=~\\\"$search_string\\\"}/procstat_rlimit_num_fds_soft_minimum{ident=~\\\"$ident\\\", search_string=~\\\"$search_string\\\"}*100\",\n \"refId\": \"A\",\n \"maxDataPoints\": 240\n }\n ],\n \"transformations\": [\n {\n \"id\": \"organize\",\n \"options\": {}\n }\n ],\n \"name\": \"FD soft Util\",\n \"maxPerRow\": 4,\n \"options\": {\n \"tooltip\": {\n \"mode\": \"all\",\n \"sort\": \"desc\"\n },\n \"legend\": {\n \"displayMode\": \"hidden\",\n \"placement\": \"bottom\",\n \"behaviour\": \"showItem\",\n \"selectMode\": \"single\"\n },\n \"standardOptions\": {\n \"util\": \"percent\",\n \"decimals\": 2\n },\n \"thresholds\": {\n \"mode\": \"absolute\",\n \"steps\": [\n {\n \"color\": \"#634CD9\",\n \"value\": null,\n \"type\": \"base\"\n }\n ]\n },\n \"thresholdsStyle\": {\n \"mode\": \"dashed\"\n }\n },\n \"custom\": {\n \"drawStyle\": \"lines\",\n \"lineInterpolation\": \"smooth\",\n \"spanNulls\": false,\n \"lineWidth\": 2,\n \"fillOpacity\": 0.3,\n \"gradientMode\": \"opacity\",\n \"stack\": \"off\",\n \"scaleDistribution\": {\n \"type\": \"linear\"\n },\n \"showPoints\": \"none\",\n \"pointSize\": 5\n },\n \"overrides\": [\n {\n \"matcher\": {\n \"id\": \"byFrameRefID\"\n },\n \"properties\": {\n \"rightYAxisDisplay\": \"off\"\n }\n }\n ]\n },\n {\n \"type\": \"timeseries\",\n \"id\": \"46a71143-84b5-4dde-87db-2f0403df6519\",\n \"layout\": {\n \"h\": 4,\n \"i\": \"22dfb5e4-1d17-4e06-a9b4-b25cb33d1c20\",\n \"isResizable\": true,\n \"w\": 12,\n \"x\": 12,\n \"y\": 8\n },\n \"version\": \"3.1.0\",\n \"datasourceCate\": \"prometheus\",\n \"datasourceValue\": \"${Datasource}\",\n \"targets\": [\n {\n \"expr\": \"procstat_num_fds_total{ident=~\\\"$ident\\\", search_string=~\\\"$search_string\\\"}/procstat_rlimit_num_fds_hard_minimum{ident=~\\\"$ident\\\", search_string=~\\\"$search_string\\\"}*100\",\n \"refId\": \"A\",\n \"maxDataPoints\": 240\n }\n ],\n \"transformations\": [\n {\n \"id\": \"organize\",\n \"options\": {}\n }\n ],\n \"name\": \"FD hard Util\",\n \"maxPerRow\": 4,\n \"options\": {\n \"tooltip\": {\n \"mode\": \"all\",\n \"sort\": \"none\"\n },\n \"legend\": {\n \"displayMode\": \"hidden\",\n \"placement\": \"bottom\",\n \"behaviour\": \"showItem\",\n \"selectMode\": \"single\"\n },\n \"standardOptions\": {\n \"util\": \"percent\",\n \"decimals\": 2\n },\n \"thresholds\": {\n \"mode\": \"absolute\",\n \"steps\": [\n {\n \"color\": \"#634CD9\",\n \"value\": null,\n \"type\": \"base\"\n }\n ]\n },\n \"thresholdsStyle\": {\n \"mode\": \"dashed\"\n }\n },\n \"custom\": {\n \"drawStyle\": \"lines\",\n \"lineInterpolation\": \"smooth\",\n \"spanNulls\": false,\n \"lineWidth\": 2,\n \"fillOpacity\": 0.3,\n \"gradientMode\": \"opacity\",\n \"stack\": \"off\",\n \"scaleDistribution\": {\n \"type\": \"linear\"\n },\n \"showPoints\": \"none\",\n \"pointSize\": 5\n },\n \"overrides\": [\n {\n \"matcher\": {\n \"id\": \"byFrameRefID\"\n },\n \"properties\": {\n \"rightYAxisDisplay\": \"off\"\n }\n }\n ]\n },\n {\n \"type\": \"timeseries\",\n \"id\": \"3dda4eb5-a27f-4d54-9547-ae8f0ac9bb96\",\n \"layout\": {\n \"h\": 4,\n \"i\": \"3dda4eb5-a27f-4d54-9547-ae8f0ac9bb96\",\n \"isResizable\": true,\n \"w\": 12,\n \"x\": 0,\n \"y\": 12\n },\n \"version\": \"3.1.0\",\n \"datasourceCate\": \"prometheus\",\n \"datasourceValue\": \"${Datasource}\",\n \"targets\": [\n {\n \"expr\": \"rate(procstat_read_bytes_total{ident=~\\\"$ident\\\", search_string=~\\\"$search_string\\\"}[$__rate_interval])\",\n \"refId\": \"A\",\n \"maxDataPoints\": 240,\n \"step\": 15\n }\n ],\n \"transformations\": [\n {\n \"id\": \"organize\",\n \"options\": {}\n }\n ],\n \"name\": \"Read bytes\",\n \"maxPerRow\": 4,\n \"options\": {\n \"tooltip\": {\n \"mode\": \"all\",\n \"sort\": \"desc\"\n },\n \"legend\": {\n \"displayMode\": \"hidden\",\n \"placement\": \"bottom\",\n \"behaviour\": \"showItem\",\n \"selectMode\": \"single\"\n },\n \"standardOptions\": {\n \"util\": \"bytesIEC\",\n \"decimals\": 1\n },\n \"thresholds\": {\n \"mode\": \"absolute\",\n \"steps\": [\n {\n \"color\": \"#634CD9\",\n \"value\": null,\n \"type\": \"base\"\n }\n ]\n },\n \"thresholdsStyle\": {\n \"mode\": \"dashed\"\n }\n },\n \"custom\": {\n \"drawStyle\": \"lines\",\n \"lineInterpolation\": \"smooth\",\n \"spanNulls\": false,\n \"lineWidth\": 2,\n \"fillOpacity\": 0.3,\n \"gradientMode\": \"opacity\",\n \"stack\": \"off\",\n \"scaleDistribution\": {\n \"type\": \"linear\"\n },\n \"showPoints\": \"none\",\n \"pointSize\": 5\n },\n \"overrides\": [\n {\n \"matcher\": {\n \"id\": \"byFrameRefID\"\n },\n \"properties\": {\n \"rightYAxisDisplay\": \"off\"\n }\n }\n ]\n },\n {\n \"type\": \"timeseries\",\n \"id\": \"c97403f4-618d-4037-8ea7-5deb32eb8d56\",\n \"layout\": {\n \"h\": 4,\n \"i\": \"ae0dc449-8263-4f38-8c52-d50b3cb3f1b4\",\n \"isResizable\": true,\n \"w\": 12,\n \"x\": 12,\n \"y\": 12\n },\n \"version\": \"3.1.0\",\n \"datasourceCate\": \"prometheus\",\n \"datasourceValue\": \"${Datasource}\",\n \"targets\": [\n {\n \"expr\": \"rate(procstat_write_bytes_total{ident=~\\\"$ident\\\", search_string=~\\\"$search_string\\\"}[$__rate_interval])\",\n \"refId\": \"A\",\n \"maxDataPoints\": 240,\n \"step\": 15\n }\n ],\n \"transformations\": [\n {\n \"id\": \"organize\",\n \"options\": {}\n }\n ],\n \"name\": \"Write bytes\",\n \"maxPerRow\": 4,\n \"options\": {\n \"tooltip\": {\n \"mode\": \"all\",\n \"sort\": \"desc\"\n },\n \"legend\": {\n \"displayMode\": \"hidden\",\n \"placement\": \"bottom\",\n \"behaviour\": \"showItem\",\n \"selectMode\": \"single\"\n },\n \"standardOptions\": {\n \"util\": \"bytesIEC\",\n \"decimals\": 1\n },\n \"thresholds\": {\n \"mode\": \"absolute\",\n \"steps\": [\n {\n \"color\": \"#634CD9\",\n \"value\": null,\n \"type\": \"base\"\n }\n ]\n },\n \"thresholdsStyle\": {\n \"mode\": \"dashed\"\n }\n },\n \"custom\": {\n \"drawStyle\": \"lines\",\n \"lineInterpolation\": \"smooth\",\n \"spanNulls\": false,\n \"lineWidth\": 2,\n \"fillOpacity\": 0.3,\n \"gradientMode\": \"opacity\",\n \"stack\": \"off\",\n \"scaleDistribution\": {\n \"type\": \"linear\"\n },\n \"showPoints\": \"none\",\n \"pointSize\": 5\n },\n \"overrides\": [\n {\n \"matcher\": {\n \"id\": \"byFrameRefID\"\n },\n \"properties\": {\n \"rightYAxisDisplay\": \"off\"\n }\n }\n ]\n }\n ],\n \"var\": [\n {\n \"definition\": \"prometheus\",\n \"name\": \"Datasource\",\n \"type\": \"datasource\"\n },\n {\n \"allOption\": true,\n \"datasource\": {\n \"cate\": \"prometheus\",\n \"value\": \"${Datasource}\"\n },\n \"definition\": \"label_values(system_load_norm_1, ident)\",\n \"label\": \"Host\",\n \"multi\": true,\n \"name\": \"ident\",\n \"type\": \"query\"\n },\n {\n \"allOption\": true,\n \"datasource\": {\n \"cate\": \"prometheus\",\n \"value\": \"${Datasource}\"\n },\n \"definition\": \"label_values(procstat_lookup_count{ident=~\\\"$ident\\\"}, search_string)\",\n \"label\": \"Proc\",\n \"multi\": true,\n \"name\": \"search_string\",\n \"type\": \"query\"\n }\n ],\n \"version\": \"3.0.0\"\n }\n}"
},
{
"path": "integrations/Procstat/markdown/readme.md",
"content": "# 进程监控\n\n使用 categraf procstat 插件。\n\n## 配置文件\n\n位置:categraf 的 `conf/input.procstat/procstat.toml`\n\n样例配置:\n\n```toml\n[[instances]]\n# # executable name (ie, pgrep )\nsearch_exec_substring = \"nginx\"\n\n# # pattern as argument for pgrep (ie, pgrep -f )\n# search_cmdline_substring = \"n9e server\"\n\n# # windows service name\n# search_win_service = \"\"\n\n# # search process with specific user, option with exec_substring or cmdline_substring\n# search_user = \"\"\n\n# # append some labels for series\n# labels = { region=\"cloud\", product=\"n9e\" }\n\n# # interval = global.interval * interval_times\n# interval_times = 1\n\n# # mode to use when calculating CPU usage. can be one of 'solaris' or 'irix'\n# mode = \"irix\"\n\n# sum of threads/fd/io/cpu/mem, min of uptime/limit\ngather_total = true\n\n# will append pid as tag\ngather_per_pid = false\n\n# gather jvm metrics only when jstat is ready\n# gather_more_metrics = [\n# \"threads\",\n# \"fd\",\n# \"io\",\n# \"uptime\",\n# \"cpu\",\n# \"mem\",\n# \"limit\",\n# \"jvm\"\n# ]\n```\n\n机器上有很多进程,要监控进程是否存活以及进程的资源占用,首先得告诉 categraf,要监控的进程是啥。所以,本插件一开始的几个配置,就是做进程过滤的,用来告诉 categraf 要监控的进程是哪些。\n\n- search_exec_substring 配置一个查询字符串,相当于执行 `pgrep `\n- search_cmdline_substring 配置一个查询字符串,相当于执行 `pgrep -f `\n- search_win_service 配置一个 windows 服务名,相当于执行 `sc query `\n\n上例默认是采集 nginx。默认只会采集一个指标:procstat_lookup_count,表示通过这些过滤条件,查询到的进程的数量。那显然,如果 `procstat_lookup_count <= 0` 就说明进程不存在了。\n\n## CPU 利用率计算\n\n在计算 CPU 利用率的时候有两种模式:irix(默认)、solaris。如果是 irix 模式,CPU 利用率会出现大于 100% 的情况,如果是 solaris 模式,会考虑 CPU 核数,所以 CPU 利用率不会大于 100%。\n\n## 采集更多指标\n\n`gather_more_metrics` 默认没有打开,即不会采集进程资源利用情况。如果想要采集,就打开 `gather_more_metrics` 这个配置即可。其中最为特殊的是 `jvm`,如果想要采集 jvm 指标,需要先安装好 jstat,然后再打开 `jvm` 这个配置。\n\n## gather_total\n\n比如进程名字是 mysql 的进程,同时可能运行了多个,我们想知道这个机器上的所有 mysql 的进程占用的总的 cpu、mem、fd 等,就设置 gather_total = true,当然,对于 uptime 和 limit 的采集,gather_total 的时候是取的多个进程的最小值。\n\n## gather_per_pid\n\n还是拿 mysql 举例,一个机器上可能同时运行了多个,我们可能想知道每个 mysql 进程的资源占用情况,此时就要启用 gather_per_pid 的配置,设置为 true,此时会采集每个进程的资源占用情况,并附上 pid 作为标签来区分\n"
},
{
"path": "integrations/Procstat/metrics/categraf.json",
"content": "[\n {\n \"id\": 0,\n \"uuid\": 1717556328266104000,\n \"collector\": \"Categraf\",\n \"typ\": \"Procstat\",\n \"name\": \"进程 CPU 利用率(单进程)\",\n \"unit\": \"percent\",\n \"note\": \"[文档](https://github.com/flashcatcloud/categraf/blob/main/inputs/procstat/README.md)\\n\\nCPU 利用率有两个模式,一个是 solaris,一个是 irix,默认是 irix,irix 模式下,CPU 利用率可能会超过 100%,solaris 会考虑 CPU 核数,solaris 模式的 CPU 利用率不会超过 100%。\",\n \"lang\": \"zh_CN\",\n \"expression\": \"procstat_cpu_usage\",\n \"created_at\": 0,\n \"created_by\": \"\",\n \"updated_at\": 0,\n \"updated_by\": \"\",\n \"translation\": [\n {\n \"lang\": \"zh_CN\",\n \"name\": \"进程 CPU 利用率(单进程)\",\n \"note\": \"[文档](https://github.com/flashcatcloud/categraf/blob/main/inputs/procstat/README.md)\\n\\nCPU 利用率有两个模式,一个是 solaris,一个是 irix,默认是 irix,irix 模式下,CPU 利用率可能会超过 100%,solaris 会考虑 CPU 核数,solaris 模式的 CPU 利用率不会超过 100%。\"\n },\n {\n \"lang\": \"en_US\",\n \"name\": \"Process CPU utilization (single process)\",\n \"note\": \"[Documentation] (https://github.com/flashcatcloud/categraf/blob/main/inputs/procstat/README.md) \\n \\nThere are two modes of CPU utilization, one is solaris and the other is irix. The default is irix. In irix mode, the CPU utilization may exceed 100%. solaris will consider the number of CPU cores, and the CPU utilization in solaris mode will not exceed 100%.\"\n }\n ]\n },\n {\n \"id\": 0,\n \"uuid\": 1717556328268566000,\n \"collector\": \"Categraf\",\n \"typ\": \"Procstat\",\n \"name\": \"进程 CPU 总利用率(匹配到的所有进程加和)\",\n \"unit\": \"percent\",\n \"note\": \"[文档](https://github.com/flashcatcloud/categraf/blob/main/inputs/procstat/README.md)\\n\\nCPU 利用率有两个模式,一个是 solaris,一个是 irix,默认是 irix,irix 模式下,CPU 利用率可能会超过 100%,solaris 会考虑 CPU 核数,solaris 模式的 CPU 利用率不会超过 100%。\",\n \"lang\": \"zh_CN\",\n \"expression\": \"procstat_cpu_usage_total\",\n \"created_at\": 0,\n \"created_by\": \"\",\n \"updated_at\": 0,\n \"updated_by\": \"\",\n \"translation\": [\n {\n \"lang\": \"zh_CN\",\n \"name\": \"进程 CPU 总利用率(匹配到的所有进程加和)\",\n \"note\": \"[文档](https://github.com/flashcatcloud/categraf/blob/main/inputs/procstat/README.md)\\n\\nCPU 利用率有两个模式,一个是 solaris,一个是 irix,默认是 irix,irix 模式下,CPU 利用率可能会超过 100%,solaris 会考虑 CPU 核数,solaris 模式的 CPU 利用率不会超过 100%。\"\n },\n {\n \"lang\": \"en_US\",\n \"name\": \"Total process CPU utilization (sum of all processes matched to)\",\n \"note\": \"[Documentation] (https://github.com/flashcatcloud/categraf/blob/main/inputs/procstat/README.md) \\n \\nThere are two modes of CPU utilization, one is solaris and the other is irix. The default is irix. In irix mode, the CPU utilization may exceed 100%. solaris will consider the number of CPU cores, and the CPU utilization in solaris mode will not exceed 100%.\"\n }\n ]\n },\n {\n \"id\": 0,\n \"uuid\": 1717556328270644000,\n \"collector\": \"Categraf\",\n \"typ\": \"Procstat\",\n \"name\": \"进程 IO 每秒写入字节总数(匹配到的所有进程加和)\",\n \"unit\": \"bytesSecIEC\",\n \"note\": \"[文档](https://github.com/flashcatcloud/categraf/blob/main/inputs/procstat/README.md)\",\n \"lang\": \"zh_CN\",\n \"expression\": \"irate(procstat_write_bytes_total[3m])\",\n \"created_at\": 0,\n \"created_by\": \"\",\n \"updated_at\": 0,\n \"updated_by\": \"\",\n \"translation\": [\n {\n \"lang\": \"zh_CN\",\n \"name\": \"进程 IO 每秒写入字节总数(匹配到的所有进程加和)\",\n \"note\": \"[文档](https://github.com/flashcatcloud/categraf/blob/main/inputs/procstat/README.md)\"\n },\n {\n \"lang\": \"en_US\",\n \"name\": \"Total number of bytes written per second by process IO (sum of all processes matched to)\",\n \"note\": \"[Documentation] (https://github.com/flashcatcloud/categraf/blob/main/inputs/procstat/README.md)\"\n }\n ]\n },\n {\n \"id\": 0,\n \"uuid\": 1717556328272873000,\n \"collector\": \"Categraf\",\n \"typ\": \"Procstat\",\n \"name\": \"进程 IO 每秒写入字节数(单进程)\",\n \"unit\": \"bytesSecIEC\",\n \"note\": \"[文档](https://github.com/flashcatcloud/categraf/blob/main/inputs/procstat/README.md)\",\n \"lang\": \"zh_CN\",\n \"expression\": \"irate(procstat_write_bytes[3m])\",\n \"created_at\": 0,\n \"created_by\": \"\",\n \"updated_at\": 0,\n \"updated_by\": \"\",\n \"translation\": [\n {\n \"lang\": \"zh_CN\",\n \"name\": \"进程 IO 每秒写入字节数(单进程)\",\n \"note\": \"[文档](https://github.com/flashcatcloud/categraf/blob/main/inputs/procstat/README.md)\"\n },\n {\n \"lang\": \"en_US\",\n \"name\": \"Number of bytes written per second by process IO (single process)\",\n \"note\": \"[Documentation] (https://github.com/flashcatcloud/categraf/blob/main/inputs/procstat/README.md)\"\n }\n ]\n },\n {\n \"id\": 0,\n \"uuid\": 1717556328274907000,\n \"collector\": \"Categraf\",\n \"typ\": \"Procstat\",\n \"name\": \"进程 IO 每秒写入次数总数(匹配到的所有进程加和)\",\n \"unit\": \"sishort\",\n \"note\": \"[文档](https://github.com/flashcatcloud/categraf/blob/main/inputs/procstat/README.md)\",\n \"lang\": \"zh_CN\",\n \"expression\": \"irate(procstat_write_count_total[3m])\",\n \"created_at\": 0,\n \"created_by\": \"\",\n \"updated_at\": 0,\n \"updated_by\": \"\",\n \"translation\": [\n {\n \"lang\": \"zh_CN\",\n \"name\": \"进程 IO 每秒写入次数总数(匹配到的所有进程加和)\",\n \"note\": \"[文档](https://github.com/flashcatcloud/categraf/blob/main/inputs/procstat/README.md)\"\n },\n {\n \"lang\": \"en_US\",\n \"name\": \"Total number of process IO writes per second (sum of all processes matched to)\",\n \"note\": \"[Documentation] (https://github.com/flashcatcloud/categraf/blob/main/inputs/procstat/README.md)\"\n }\n ]\n },\n {\n \"id\": 0,\n \"uuid\": 1717556328277039000,\n \"collector\": \"Categraf\",\n \"typ\": \"Procstat\",\n \"name\": \"进程 IO 每秒写入次数(单进程)\",\n \"unit\": \"sishort\",\n \"note\": \"[文档](https://github.com/flashcatcloud/categraf/blob/main/inputs/procstat/README.md)\",\n \"lang\": \"zh_CN\",\n \"expression\": \"irate(procstat_write_count[3m])\",\n \"created_at\": 0,\n \"created_by\": \"\",\n \"updated_at\": 0,\n \"updated_by\": \"\",\n \"translation\": [\n {\n \"lang\": \"zh_CN\",\n \"name\": \"进程 IO 每秒写入次数(单进程)\",\n \"note\": \"[文档](https://github.com/flashcatcloud/categraf/blob/main/inputs/procstat/README.md)\"\n },\n {\n \"lang\": \"en_US\",\n \"name\": \"Process IO writes per second (single process)\",\n \"note\": \"[Documentation] (https://github.com/flashcatcloud/categraf/blob/main/inputs/procstat/README.md)\"\n }\n ]\n },\n {\n \"id\": 0,\n \"uuid\": 1717556328278789000,\n \"collector\": \"Categraf\",\n \"typ\": \"Procstat\",\n \"name\": \"进程 IO 每秒读取字节总数(匹配到的所有进程加和)\",\n \"unit\": \"bytesSecIEC\",\n \"note\": \"[文档](https://github.com/flashcatcloud/categraf/blob/main/inputs/procstat/README.md)\",\n \"lang\": \"zh_CN\",\n \"expression\": \"irate(procstat_read_bytes_total[3m])\",\n \"created_at\": 0,\n \"created_by\": \"\",\n \"updated_at\": 0,\n \"updated_by\": \"\",\n \"translation\": [\n {\n \"lang\": \"zh_CN\",\n \"name\": \"进程 IO 每秒读取字节总数(匹配到的所有进程加和)\",\n \"note\": \"[文档](https://github.com/flashcatcloud/categraf/blob/main/inputs/procstat/README.md)\"\n },\n {\n \"lang\": \"en_US\",\n \"name\": \"Total number of bytes read per second by process IO (sum of all processes matched to)\",\n \"note\": \"[Documentation] (https://github.com/flashcatcloud/categraf/blob/main/inputs/procstat/README.md)\"\n }\n ]\n },\n {\n \"id\": 0,\n \"uuid\": 1717556328280740000,\n \"collector\": \"Categraf\",\n \"typ\": \"Procstat\",\n \"name\": \"进程 IO 每秒读取字节数(单进程)\",\n \"unit\": \"bytesSecIEC\",\n \"note\": \"[文档](https://github.com/flashcatcloud/categraf/blob/main/inputs/procstat/README.md)\",\n \"lang\": \"zh_CN\",\n \"expression\": \"irate(procstat_read_bytes[3m])\",\n \"created_at\": 0,\n \"created_by\": \"\",\n \"updated_at\": 0,\n \"updated_by\": \"\",\n \"translation\": [\n {\n \"lang\": \"zh_CN\",\n \"name\": \"进程 IO 每秒读取字节数(单进程)\",\n \"note\": \"[文档](https://github.com/flashcatcloud/categraf/blob/main/inputs/procstat/README.md)\"\n },\n {\n \"lang\": \"en_US\",\n \"name\": \"Process IO reads bytes per second (single process)\",\n \"note\": \"[Documentation] (https://github.com/flashcatcloud/categraf/blob/main/inputs/procstat/README.md)\"\n }\n ]\n },\n {\n \"id\": 0,\n \"uuid\": 1717556328282919000,\n \"collector\": \"Categraf\",\n \"typ\": \"Procstat\",\n \"name\": \"进程 IO 每秒读取次数总数(匹配到的所有进程加和)\",\n \"unit\": \"sishort\",\n \"note\": \"[文档](https://github.com/flashcatcloud/categraf/blob/main/inputs/procstat/README.md)\",\n \"lang\": \"zh_CN\",\n \"expression\": \"irate(procstat_read_count_total[3m])\",\n \"created_at\": 0,\n \"created_by\": \"\",\n \"updated_at\": 0,\n \"updated_by\": \"\",\n \"translation\": [\n {\n \"lang\": \"zh_CN\",\n \"name\": \"进程 IO 每秒读取次数总数(匹配到的所有进程加和)\",\n \"note\": \"[文档](https://github.com/flashcatcloud/categraf/blob/main/inputs/procstat/README.md)\"\n },\n {\n \"lang\": \"en_US\",\n \"name\": \"Total number of process IO reads per second (sum of all processes matched to)\",\n \"note\": \"[Documentation] (https://github.com/flashcatcloud/categraf/blob/main/inputs/procstat/README.md)\"\n }\n ]\n },\n {\n \"id\": 0,\n \"uuid\": 1717556328285199000,\n \"collector\": \"Categraf\",\n \"typ\": \"Procstat\",\n \"name\": \"进程 IO 每秒读取次数(单进程)\",\n \"unit\": \"sishort\",\n \"note\": \"[文档](https://github.com/flashcatcloud/categraf/blob/main/inputs/procstat/README.md)\",\n \"lang\": \"zh_CN\",\n \"expression\": \"irate(procstat_read_count[3m])\",\n \"created_at\": 0,\n \"created_by\": \"\",\n \"updated_at\": 0,\n \"updated_by\": \"\",\n \"translation\": [\n {\n \"lang\": \"zh_CN\",\n \"name\": \"进程 IO 每秒读取次数(单进程)\",\n \"note\": \"[文档](https://github.com/flashcatcloud/categraf/blob/main/inputs/procstat/README.md)\"\n },\n {\n \"lang\": \"en_US\",\n \"name\": \"Process IO reads per second (single process)\",\n \"note\": \"[Documentation] (https://github.com/flashcatcloud/categraf/blob/main/inputs/procstat/README.md)\"\n }\n ]\n },\n {\n \"id\": 0,\n \"uuid\": 1717556328287298000,\n \"collector\": \"Categraf\",\n \"typ\": \"Procstat\",\n \"name\": \"进程 Memory 利用率(单进程)\",\n \"unit\": \"percent\",\n \"note\": \"[文档](https://github.com/flashcatcloud/categraf/blob/main/inputs/procstat/README.md)\",\n \"lang\": \"zh_CN\",\n \"expression\": \"procstat_mem_usage\",\n \"created_at\": 0,\n \"created_by\": \"\",\n \"updated_at\": 0,\n \"updated_by\": \"\",\n \"translation\": [\n {\n \"lang\": \"zh_CN\",\n \"name\": \"进程 Memory 利用率(单进程)\",\n \"note\": \"[文档](https://github.com/flashcatcloud/categraf/blob/main/inputs/procstat/README.md)\"\n },\n {\n \"lang\": \"en_US\",\n \"name\": \"Process Memory utilization (single process)\",\n \"note\": \"[Documentation] (https://github.com/flashcatcloud/categraf/blob/main/inputs/procstat/README.md)\"\n }\n ]\n },\n {\n \"id\": 0,\n \"uuid\": 1717556328289271000,\n \"collector\": \"Categraf\",\n \"typ\": \"Procstat\",\n \"name\": \"进程 Memory 总利用率(匹配到的所有进程加和)\",\n \"unit\": \"percent\",\n \"note\": \"[文档](https://github.com/flashcatcloud/categraf/blob/main/inputs/procstat/README.md)\",\n \"lang\": \"zh_CN\",\n \"expression\": \"procstat_mem_usage_total\",\n \"created_at\": 0,\n \"created_by\": \"\",\n \"updated_at\": 0,\n \"updated_by\": \"\",\n \"translation\": [\n {\n \"lang\": \"zh_CN\",\n \"name\": \"进程 Memory 总利用率(匹配到的所有进程加和)\",\n \"note\": \"[文档](https://github.com/flashcatcloud/categraf/blob/main/inputs/procstat/README.md)\"\n },\n {\n \"lang\": \"en_US\",\n \"name\": \"Process Memory Total utilization (sum of all processes matched to)\",\n \"note\": \"[Documentation] (https://github.com/flashcatcloud/categraf/blob/main/inputs/procstat/README.md)\"\n }\n ]\n },\n {\n \"id\": 0,\n \"uuid\": 1717556328291283000,\n \"collector\": \"Categraf\",\n \"typ\": \"Procstat\",\n \"name\": \"进程 rlimit fd 软限制数量(匹配到的所有进程中的最小值)\",\n \"unit\": \"none\",\n \"note\": \"[文档](https://github.com/flashcatcloud/categraf/blob/main/inputs/procstat/README.md)\",\n \"lang\": \"zh_CN\",\n \"expression\": \"procstat_rlimit_num_fds_soft_minimum\",\n \"created_at\": 0,\n \"created_by\": \"\",\n \"updated_at\": 0,\n \"updated_by\": \"\",\n \"translation\": [\n {\n \"lang\": \"zh_CN\",\n \"name\": \"进程 rlimit fd 软限制数量(匹配到的所有进程中的最小值)\",\n \"note\": \"[文档](https://github.com/flashcatcloud/categraf/blob/main/inputs/procstat/README.md)\"\n },\n {\n \"lang\": \"en_US\",\n \"name\": \"Process rlimit fd Number of soft limits (minimum of all processes matched to)\",\n \"note\": \"[Documentation] (https://github.com/flashcatcloud/categraf/blob/main/inputs/procstat/README.md)\"\n }\n ]\n },\n {\n \"id\": 0,\n \"uuid\": 1717556328293536000,\n \"collector\": \"Categraf\",\n \"typ\": \"Procstat\",\n \"name\": \"进程 rlimit fd 软限制数量(单进程)\",\n \"unit\": \"none\",\n \"note\": \"[文档](https://github.com/flashcatcloud/categraf/blob/main/inputs/procstat/README.md)\",\n \"lang\": \"zh_CN\",\n \"expression\": \"procstat_rlimit_num_fds_soft\",\n \"created_at\": 0,\n \"created_by\": \"\",\n \"updated_at\": 0,\n \"updated_by\": \"\",\n \"translation\": [\n {\n \"lang\": \"zh_CN\",\n \"name\": \"进程 rlimit fd 软限制数量(单进程)\",\n \"note\": \"[文档](https://github.com/flashcatcloud/categraf/blob/main/inputs/procstat/README.md)\"\n },\n {\n \"lang\": \"en_US\",\n \"name\": \"Process rlimit fd Number of soft limits (single process)\",\n \"note\": \"[Documentation] (https://github.com/flashcatcloud/categraf/blob/main/inputs/procstat/README.md)\"\n }\n ]\n },\n {\n \"id\": 0,\n \"uuid\": 1717556328295723000,\n \"collector\": \"Categraf\",\n \"typ\": \"Procstat\",\n \"name\": \"进程启动时长(匹配到的所有进程的最小值)\",\n \"unit\": \"seconds\",\n \"note\": \"启动了多久\",\n \"lang\": \"zh_CN\",\n \"expression\": \"procstat_uptime_minimum\",\n \"created_at\": 0,\n \"created_by\": \"\",\n \"updated_at\": 0,\n \"updated_by\": \"\",\n \"translation\": [\n {\n \"lang\": \"zh_CN\",\n \"name\": \"进程启动时长(匹配到的所有进程的最小值)\",\n \"note\": \"启动了多久\"\n },\n {\n \"lang\": \"en_US\",\n \"name\": \"Process start time (minimum of all processes matched to)\",\n \"note\": \"How long has it started\"\n }\n ]\n },\n {\n \"id\": 0,\n \"uuid\": 1717556328297802000,\n \"collector\": \"Categraf\",\n \"typ\": \"Procstat\",\n \"name\": \"进程启动时长(单进程)\",\n \"unit\": \"seconds\",\n \"note\": \"启动了多久\",\n \"lang\": \"zh_CN\",\n \"expression\": \"procstat_uptime\",\n \"created_at\": 0,\n \"created_by\": \"\",\n \"updated_at\": 0,\n \"updated_by\": \"\",\n \"translation\": [\n {\n \"lang\": \"zh_CN\",\n \"name\": \"进程启动时长(单进程)\",\n \"note\": \"启动了多久\"\n },\n {\n \"lang\": \"en_US\",\n \"name\": \"Process startup time (single process)\",\n \"note\": \"How long has it started\"\n }\n ]\n },\n {\n \"id\": 0,\n \"uuid\": 1717556328299836000,\n \"collector\": \"Categraf\",\n \"typ\": \"Procstat\",\n \"name\": \"进程数量(根据匹配条件查到的进程数量)\",\n \"unit\": \"none\",\n \"note\": \"[文档](https://github.com/flashcatcloud/categraf/blob/main/inputs/procstat/README.md)\",\n \"lang\": \"zh_CN\",\n \"expression\": \"procstat_lookup_count\",\n \"created_at\": 0,\n \"created_by\": \"\",\n \"updated_at\": 0,\n \"updated_by\": \"\",\n \"translation\": [\n {\n \"lang\": \"zh_CN\",\n \"name\": \"进程数量(根据匹配条件查到的进程数量)\",\n \"note\": \"[文档](https://github.com/flashcatcloud/categraf/blob/main/inputs/procstat/README.md)\"\n },\n {\n \"lang\": \"en_US\",\n \"name\": \"Number of processes (the number of processes found according to matching conditions)\",\n \"note\": \"[Documentation] (https://github.com/flashcatcloud/categraf/blob/main/inputs/procstat/README.md)\"\n }\n ]\n },\n {\n \"id\": 0,\n \"uuid\": 1717556328301689000,\n \"collector\": \"Categraf\",\n \"typ\": \"Procstat\",\n \"name\": \"进程文件句柄总打开数(匹配到的所有进程加和)\",\n \"unit\": \"none\",\n \"note\": \"[文档](https://github.com/flashcatcloud/categraf/blob/main/inputs/procstat/README.md)\",\n \"lang\": \"zh_CN\",\n \"expression\": \"procstat_num_fds_total\",\n \"created_at\": 0,\n \"created_by\": \"\",\n \"updated_at\": 0,\n \"updated_by\": \"\",\n \"translation\": [\n {\n \"lang\": \"zh_CN\",\n \"name\": \"进程文件句柄总打开数(匹配到的所有进程加和)\",\n \"note\": \"[文档](https://github.com/flashcatcloud/categraf/blob/main/inputs/procstat/README.md)\"\n },\n {\n \"lang\": \"en_US\",\n \"name\": \"Total number of process file handles open (sum of all processes matched to)\",\n \"note\": \"[Documentation] (https://github.com/flashcatcloud/categraf/blob/main/inputs/procstat/README.md)\"\n }\n ]\n },\n {\n \"id\": 0,\n \"uuid\": 1717556328303570000,\n \"collector\": \"Categraf\",\n \"typ\": \"Procstat\",\n \"name\": \"进程文件句柄打开数(单进程)\",\n \"unit\": \"none\",\n \"note\": \"[文档](https://github.com/flashcatcloud/categraf/blob/main/inputs/procstat/README.md)\",\n \"lang\": \"zh_CN\",\n \"expression\": \"procstat_num_fds\",\n \"created_at\": 0,\n \"created_by\": \"\",\n \"updated_at\": 0,\n \"updated_by\": \"\",\n \"translation\": [\n {\n \"lang\": \"zh_CN\",\n \"name\": \"进程文件句柄打开数(单进程)\",\n \"note\": \"[文档](https://github.com/flashcatcloud/categraf/blob/main/inputs/procstat/README.md)\"\n },\n {\n \"lang\": \"en_US\",\n \"name\": \"Number of process file handle openings (single process)\",\n \"note\": \"[Documentation] (https://github.com/flashcatcloud/categraf/blob/main/inputs/procstat/README.md)\"\n }\n ]\n },\n {\n \"id\": 0,\n \"uuid\": 1717556328305425000,\n \"collector\": \"Categraf\",\n \"typ\": \"Procstat\",\n \"name\": \"进程线程总数(匹配到的所有进程加和)\",\n \"unit\": \"none\",\n \"note\": \"[文档](https://github.com/flashcatcloud/categraf/blob/main/inputs/procstat/README.md)\",\n \"lang\": \"zh_CN\",\n \"expression\": \"procstat_num_threads_total\",\n \"created_at\": 0,\n \"created_by\": \"\",\n \"updated_at\": 0,\n \"updated_by\": \"\",\n \"translation\": [\n {\n \"lang\": \"zh_CN\",\n \"name\": \"进程线程总数(匹配到的所有进程加和)\",\n \"note\": \"[文档](https://github.com/flashcatcloud/categraf/blob/main/inputs/procstat/README.md)\"\n },\n {\n \"lang\": \"en_US\",\n \"name\": \"Total number of process threads (sum of all processes matched to)\",\n \"note\": \"[Documentation] (https://github.com/flashcatcloud/categraf/blob/main/inputs/procstat/README.md)\"\n }\n ]\n },\n {\n \"id\": 0,\n \"uuid\": 1717556328307331000,\n \"collector\": \"Categraf\",\n \"typ\": \"Procstat\",\n \"name\": \"进程线程数(单进程)\",\n \"unit\": \"none\",\n \"note\": \"[文档](https://github.com/flashcatcloud/categraf/blob/main/inputs/procstat/README.md)\",\n \"lang\": \"zh_CN\",\n \"expression\": \"procstat_num_threads\",\n \"created_at\": 0,\n \"created_by\": \"\",\n \"updated_at\": 0,\n \"updated_by\": \"\",\n \"translation\": [\n {\n \"lang\": \"zh_CN\",\n \"name\": \"进程线程数(单进程)\",\n \"note\": \"[文档](https://github.com/flashcatcloud/categraf/blob/main/inputs/procstat/README.md)\"\n },\n {\n \"lang\": \"en_US\",\n \"name\": \"Number of process threads (single process)\",\n \"note\": \"[Documentation] (https://github.com/flashcatcloud/categraf/blob/main/inputs/procstat/README.md)\"\n }\n ]\n }\n]"
},
{
"path": "integrations/Prometheus/collect/prometheus/prometheus.toml",
"content": "# # collect interval\n# interval = 15\n\n[[instances]]\nurls = [\n# \"http://localhost:19000/metrics\"\n]\n\nurl_label_key = \"instance\"\nurl_label_value = \"{{.Host}}\"\n\n## Scrape Services available in Consul Catalog\n# [instances.consul]\n# enabled = false\n# agent = \"http://localhost:8500\"\n# query_interval = \"5m\"\n\n# [[instances.consul.query]]\n# name = \"a service name\"\n# tag = \"a service tag\"\n# url = 'http://{{if ne .ServiceAddress \"\"}}{{.ServiceAddress}}{{else}}{{.Address}}{{end}}:{{.ServicePort}}/{{with .ServiceMeta.metrics_path}}{{.}}{{else}}metrics{{end}}'\n# [instances.consul.query.tags]\n# host = \"{{.Node}}\"\n\n# bearer_token_string = \"\"\n\n# e.g. /run/secrets/kubernetes.io/serviceaccount/token\n# bearer_token_file = \"\"\n\n# # basic auth\n# username = \"\"\n# password = \"\"\n\n# headers = [\"X-From\", \"categraf\"]\n\n# # interval = global.interval * interval_times\n# interval_times = 1\n\n# labels = {}\n\n# support glob\n# ignore_metrics = [ \"go_*\" ]\n\n# support glob\n# ignore_label_keys = []\n\n# timeout for every url\n# timeout = \"3s\"\n\n## Optional TLS Config\n# use_tls = false\n# tls_min_version = \"1.2\"\n# tls_ca = \"/etc/categraf/ca.pem\"\n# tls_cert = \"/etc/categraf/cert.pem\"\n# tls_key = \"/etc/categraf/key.pem\"\n## Use TLS but skip chain & host verification\n# insecure_skip_verify = true\n"
},
{
"path": "integrations/Prometheus/markdown/README.md",
"content": "# prometheus\n\nprometheus 插件的作用,就是抓取 `/metrics` 接口的数据,上报给服务端。通过,各类 exporter 会暴露 `/metrics` 接口数据,越来越多的开源组件也会内置 prometheus SDK,吐出 prometheus 格式的监控数据,比如 rabbitmq 插件,其 README 中就有介绍。\n\n这个插件 fork 自 telegraf/prometheus,做了一些删减改造,仍然支持通过 consul 做服务发现,管理所有的目标地址,删掉了 Kubernetes 部分,Kubernetes 部分准备放到其他插件里实现。\n\n增加了两个配置:url_label_key 和 url_label_value。为了标识监控数据是从哪个 scrape url 拉取的,会为监控数据附一个标签来标识这个 url,默认的标签 KEY 是用 instance,当然,也可以改成别的,不过不建议。url_label_value 是标签值,支持 go template 语法,如果为空,就是整个 url 的内容,也可以通过模板变量只取一部分,比如 `http://localhost:9104/metrics`,只想取 IP 和端口部分,就可以写成:\n\n```ini\nurl_label_value = \"{{.Host}}\"\n```\n\n如果 HTTP scheme 部分和 `/metrics` Path 部分都想取,可以这么写:\n\n```ini\nurl_label_value = \"{{.Scheme}}://{{.Host}}{{.Path}}\"\n```\n\n相关变量是用这个方法生成的,供大家参考:\n\n```go\nfunc (ul *UrlLabel) GenerateLabel(u *url.URL) (string, string, error) {\n\tif ul.LabelValue == \"\" {\n\t\treturn ul.LabelKey, u.String(), nil\n\t}\n\n\tdict := map[string]string{\n\t\t\"Scheme\": u.Scheme,\n\t\t\"Host\": u.Host,\n\t\t\"Hostname\": u.Hostname(),\n\t\t\"Port\": u.Port(),\n\t\t\"Path\": u.Path,\n\t\t\"Query\": u.RawQuery,\n\t\t\"Fragment\": u.Fragment,\n\t}\n\n\tvar buffer bytes.Buffer\n\terr := ul.LabelValueTpl.Execute(&buffer, dict)\n\tif err != nil {\n\t\treturn \"\", \"\", err\n\t}\n\n\treturn ul.LabelKey, buffer.String(), nil\n}\n```"
},
{
"path": "integrations/RabbitMQ/alerts/alerts.json",
"content": "[\n {\n \"id\": 0,\n \"group_id\": 0,\n \"cate\": \"prometheus\",\n \"datasource_ids\": [\n 0\n ],\n \"cluster\": \"\",\n \"name\": \"[RabbitMQ] Cluster Operator Unavailable Replicas\",\n \"note\": \"There are kube_pod_names that are either running but not yet available or kube_pod_names that still have not been created.\",\n \"prod\": \"metric\",\n \"algorithm\": \"\",\n \"algo_params\": null,\n \"delay\": 0,\n \"severity\": 2,\n \"severities\": [\n 2\n ],\n \"disabled\": 1,\n \"prom_for_duration\": 300,\n \"prom_ql\": \"\",\n \"rule_config\": {\n \"algo_params\": null,\n \"inhibit\": false,\n \"prom_ql\": \"\",\n \"queries\": [\n {\n \"prom_ql\": \"kube_deployment_status_replicas_unavailable \\u003e 0\\n\",\n \"severity\": 2\n }\n ],\n \"severity\": 0\n },\n \"prom_eval_interval\": 15,\n \"enable_stime\": \"00:00\",\n \"enable_stimes\": [\n \"00:00\"\n ],\n \"enable_etime\": \"23:59\",\n \"enable_etimes\": [\n \"23:59\"\n ],\n \"enable_days_of_week\": [\n \"1\",\n \"2\",\n \"3\",\n \"4\",\n \"5\",\n \"6\",\n \"0\"\n ],\n \"enable_days_of_weeks\": [\n [\n \"1\",\n \"2\",\n \"3\",\n \"4\",\n \"5\",\n \"6\",\n \"0\"\n ]\n ],\n \"enable_in_bg\": 0,\n \"notify_recovered\": 1,\n \"notify_channels\": [],\n \"notify_groups_obj\": null,\n \"notify_groups\": null,\n \"notify_repeat_step\": 60,\n \"notify_max_number\": 0,\n \"recover_duration\": 0,\n \"callbacks\": [],\n \"runbook_url\": \"\",\n \"append_tags\": [],\n \"annotations\": null,\n \"extra_config\": null,\n \"create_at\": 0,\n \"create_by\": \"\",\n \"update_at\": 0,\n \"update_by\": \"\",\n \"uuid\": 1717556328314217000\n },\n {\n \"id\": 0,\n \"group_id\": 0,\n \"cate\": \"prometheus\",\n \"datasource_ids\": [\n 0\n ],\n \"cluster\": \"\",\n \"name\": \"[RabbitMQ] Container Restarts\",\n \"note\": \"Over the last 10 minutes a rabbitmq container was restarted\",\n \"prod\": \"metric\",\n \"algorithm\": \"\",\n \"algo_params\": null,\n \"delay\": 0,\n \"severity\": 2,\n \"severities\": [\n 2\n ],\n \"disabled\": 1,\n \"prom_for_duration\": 300,\n \"prom_ql\": \"\",\n \"rule_config\": {\n \"algo_params\": null,\n \"inhibit\": false,\n \"prom_ql\": \"\",\n \"queries\": [\n {\n \"prom_ql\": \"increase(kube__container_status_restarts_total[10m]) \\u003e= 1\\n\",\n \"severity\": 2\n }\n ],\n \"severity\": 0\n },\n \"prom_eval_interval\": 15,\n \"enable_stime\": \"00:00\",\n \"enable_stimes\": [\n \"00:00\"\n ],\n \"enable_etime\": \"23:59\",\n \"enable_etimes\": [\n \"23:59\"\n ],\n \"enable_days_of_week\": [\n \"1\",\n \"2\",\n \"3\",\n \"4\",\n \"5\",\n \"6\",\n \"0\"\n ],\n \"enable_days_of_weeks\": [\n [\n \"1\",\n \"2\",\n \"3\",\n \"4\",\n \"5\",\n \"6\",\n \"0\"\n ]\n ],\n \"enable_in_bg\": 0,\n \"notify_recovered\": 1,\n \"notify_channels\": [],\n \"notify_groups_obj\": null,\n \"notify_groups\": null,\n \"notify_repeat_step\": 60,\n \"notify_max_number\": 0,\n \"recover_duration\": 0,\n \"callbacks\": [],\n \"runbook_url\": \"\",\n \"append_tags\": [],\n \"annotations\": null,\n \"extra_config\": null,\n \"create_at\": 0,\n \"create_by\": \"\",\n \"update_at\": 0,\n \"update_by\": \"\",\n \"uuid\": 1717556328315028000\n },\n {\n \"id\": 0,\n \"group_id\": 0,\n \"cate\": \"prometheus\",\n \"datasource_ids\": [\n 0\n ],\n \"cluster\": \"\",\n \"name\": \"[RabbitMQ] File Descriptors Near Limit\",\n \"note\": \"The file descriptors are near to the limit\",\n \"prod\": \"metric\",\n \"algorithm\": \"\",\n \"algo_params\": null,\n \"delay\": 0,\n \"severity\": 2,\n \"severities\": [\n 2\n ],\n \"disabled\": 1,\n \"prom_for_duration\": 600,\n \"prom_ql\": \"\",\n \"rule_config\": {\n \"algo_params\": null,\n \"inhibit\": false,\n \"prom_ql\": \"\",\n \"queries\": [\n {\n \"prom_ql\": \"sum (max_over_time(rabbitmq_process_open_fds[5m]))/sum (rabbitmq_process_max_tcp_sockets)\\u003e 0.8\\n\",\n \"severity\": 2\n }\n ],\n \"severity\": 0\n },\n \"prom_eval_interval\": 15,\n \"enable_stime\": \"00:00\",\n \"enable_stimes\": [\n \"00:00\"\n ],\n \"enable_etime\": \"23:59\",\n \"enable_etimes\": [\n \"23:59\"\n ],\n \"enable_days_of_week\": [\n \"1\",\n \"2\",\n \"3\",\n \"4\",\n \"5\",\n \"6\",\n \"0\"\n ],\n \"enable_days_of_weeks\": [\n [\n \"1\",\n \"2\",\n \"3\",\n \"4\",\n \"5\",\n \"6\",\n \"0\"\n ]\n ],\n \"enable_in_bg\": 0,\n \"notify_recovered\": 1,\n \"notify_channels\": [],\n \"notify_groups_obj\": null,\n \"notify_groups\": null,\n \"notify_repeat_step\": 60,\n \"notify_max_number\": 0,\n \"recover_duration\": 0,\n \"callbacks\": [],\n \"runbook_url\": \"\",\n \"append_tags\": [],\n \"annotations\": null,\n \"extra_config\": null,\n \"create_at\": 0,\n \"create_by\": \"\",\n \"update_at\": 0,\n \"update_by\": \"\",\n \"uuid\": 1717556328315753000\n },\n {\n \"id\": 0,\n \"group_id\": 0,\n \"cate\": \"prometheus\",\n \"datasource_ids\": [\n 0\n ],\n \"cluster\": \"\",\n \"name\": \"[RabbitMQ] High Connection Churn\",\n \"note\": \"There are a high connection churn\",\n \"prod\": \"metric\",\n \"algorithm\": \"\",\n \"algo_params\": null,\n \"delay\": 0,\n \"severity\": 2,\n \"severities\": [\n 2\n ],\n \"disabled\": 1,\n \"prom_for_duration\": 600,\n \"prom_ql\": \"\",\n \"rule_config\": {\n \"algo_params\": null,\n \"inhibit\": false,\n \"prom_ql\": \"\",\n \"queries\": [\n {\n \"prom_ql\": \"( sum(rate(rabbitmq_connections_closed_total[5m]) ) + sum(rate(rabbitmq_connections_opened_total[5m]) ) )/sum (rabbitmq_connections) \\u003e 0.1 unless sum (rabbitmq_connections) \\u003c 100\\n\",\n \"severity\": 2\n }\n ],\n \"severity\": 0\n },\n \"prom_eval_interval\": 15,\n \"enable_stime\": \"00:00\",\n \"enable_stimes\": [\n \"00:00\"\n ],\n \"enable_etime\": \"23:59\",\n \"enable_etimes\": [\n \"23:59\"\n ],\n \"enable_days_of_week\": [\n \"1\",\n \"2\",\n \"3\",\n \"4\",\n \"5\",\n \"6\",\n \"0\"\n ],\n \"enable_days_of_weeks\": [\n [\n \"1\",\n \"2\",\n \"3\",\n \"4\",\n \"5\",\n \"6\",\n \"0\"\n ]\n ],\n \"enable_in_bg\": 0,\n \"notify_recovered\": 1,\n \"notify_channels\": [],\n \"notify_groups_obj\": null,\n \"notify_groups\": null,\n \"notify_repeat_step\": 60,\n \"notify_max_number\": 0,\n \"recover_duration\": 0,\n \"callbacks\": [],\n \"runbook_url\": \"\",\n \"append_tags\": [],\n \"annotations\": null,\n \"extra_config\": null,\n \"create_at\": 0,\n \"create_by\": \"\",\n \"update_at\": 0,\n \"update_by\": \"\",\n \"uuid\": 1717556328316400000\n },\n {\n \"id\": 0,\n \"group_id\": 0,\n \"cate\": \"prometheus\",\n \"datasource_ids\": [\n 0\n ],\n \"cluster\": \"\",\n \"name\": \"[RabbitMQ] Insufficient Established Erlang Distribution Links\",\n \"note\": \"Insufficient established erlang distribution links\",\n \"prod\": \"metric\",\n \"algorithm\": \"\",\n \"algo_params\": null,\n \"delay\": 0,\n \"severity\": 2,\n \"severities\": [\n 2\n ],\n \"disabled\": 1,\n \"prom_for_duration\": 600,\n \"prom_ql\": \"\",\n \"rule_config\": {\n \"algo_params\": null,\n \"inhibit\": false,\n \"prom_ql\": \"\",\n \"queries\": [\n {\n \"prom_ql\": \"count (erlang_vm_dist_node_state) == 3\\u003c count (rabbitmq_build_info ) *(count (rabbitmq_build_info - 1 ))\\n\",\n \"severity\": 2\n }\n ],\n \"severity\": 0\n },\n \"prom_eval_interval\": 15,\n \"enable_stime\": \"00:00\",\n \"enable_stimes\": [\n \"00:00\"\n ],\n \"enable_etime\": \"23:59\",\n \"enable_etimes\": [\n \"23:59\"\n ],\n \"enable_days_of_week\": [\n \"1\",\n \"2\",\n \"3\",\n \"4\",\n \"5\",\n \"6\",\n \"0\"\n ],\n \"enable_days_of_weeks\": [\n [\n \"1\",\n \"2\",\n \"3\",\n \"4\",\n \"5\",\n \"6\",\n \"0\"\n ]\n ],\n \"enable_in_bg\": 0,\n \"notify_recovered\": 1,\n \"notify_channels\": [],\n \"notify_groups_obj\": null,\n \"notify_groups\": null,\n \"notify_repeat_step\": 60,\n \"notify_max_number\": 0,\n \"recover_duration\": 0,\n \"callbacks\": [],\n \"runbook_url\": \"\",\n \"append_tags\": [],\n \"annotations\": null,\n \"extra_config\": null,\n \"create_at\": 0,\n \"create_by\": \"\",\n \"update_at\": 0,\n \"update_by\": \"\",\n \"uuid\": 1717556328316947000\n },\n {\n \"id\": 0,\n \"group_id\": 0,\n \"cate\": \"prometheus\",\n \"datasource_ids\": [\n 0\n ],\n \"cluster\": \"\",\n \"name\": \"[RabbitMQ] Low Disk Watermark Predicted\",\n \"note\": \"The predicted free disk space in 24 hours from now is low\",\n \"prod\": \"metric\",\n \"algorithm\": \"\",\n \"algo_params\": null,\n \"delay\": 0,\n \"severity\": 2,\n \"severities\": [\n 2\n ],\n \"disabled\": 1,\n \"prom_for_duration\": 3600,\n \"prom_ql\": \"\",\n \"rule_config\": {\n \"algo_params\": null,\n \"inhibit\": false,\n \"prom_ql\": \"\",\n \"queries\": [\n {\n \"prom_ql\": \"( predict_linear(rabbitmq_disk_space_available_bytes[24h], 60*60*24) \\u003c rabbitmq_disk_space_available_limit_bytes )and( count_over_time(rabbitmq_disk_space_available_limit_bytes[2h] offset 22h) \\u003e 0)\\n\",\n \"severity\": 2\n }\n ],\n \"severity\": 0\n },\n \"prom_eval_interval\": 15,\n \"enable_stime\": \"00:00\",\n \"enable_stimes\": [\n \"00:00\"\n ],\n \"enable_etime\": \"23:59\",\n \"enable_etimes\": [\n \"23:59\"\n ],\n \"enable_days_of_week\": [\n \"1\",\n \"2\",\n \"3\",\n \"4\",\n \"5\",\n \"6\",\n \"0\"\n ],\n \"enable_days_of_weeks\": [\n [\n \"1\",\n \"2\",\n \"3\",\n \"4\",\n \"5\",\n \"6\",\n \"0\"\n ]\n ],\n \"enable_in_bg\": 0,\n \"notify_recovered\": 1,\n \"notify_channels\": [],\n \"notify_groups_obj\": null,\n \"notify_groups\": null,\n \"notify_repeat_step\": 60,\n \"notify_max_number\": 0,\n \"recover_duration\": 0,\n \"callbacks\": [],\n \"runbook_url\": \"\",\n \"append_tags\": [],\n \"annotations\": null,\n \"extra_config\": null,\n \"create_at\": 0,\n \"create_by\": \"\",\n \"update_at\": 0,\n \"update_by\": \"\",\n \"uuid\": 1717556328317379000\n },\n {\n \"id\": 0,\n \"group_id\": 0,\n \"cate\": \"prometheus\",\n \"datasource_ids\": [\n 0\n ],\n \"cluster\": \"\",\n \"name\": \"[RabbitMQ] No MajorityOfNodesReady\",\n \"note\": \"There are so many nodes not ready\",\n \"prod\": \"metric\",\n \"algorithm\": \"\",\n \"algo_params\": null,\n \"delay\": 0,\n \"severity\": 2,\n \"severities\": [\n 2\n ],\n \"disabled\": 1,\n \"prom_for_duration\": 300,\n \"prom_ql\": \"\",\n \"rule_config\": {\n \"algo_params\": null,\n \"inhibit\": false,\n \"prom_ql\": \"\",\n \"queries\": [\n {\n \"prom_ql\": \"kube_statefulset_status_replicas_ready\\u003c=kube_statefulset_replicas/ 2 unless kube_statefulset_replicas== 0\\n\",\n \"severity\": 2\n }\n ],\n \"severity\": 0\n },\n \"prom_eval_interval\": 15,\n \"enable_stime\": \"00:00\",\n \"enable_stimes\": [\n \"00:00\"\n ],\n \"enable_etime\": \"23:59\",\n \"enable_etimes\": [\n \"23:59\"\n ],\n \"enable_days_of_week\": [\n \"1\",\n \"2\",\n \"3\",\n \"4\",\n \"5\",\n \"6\",\n \"0\"\n ],\n \"enable_days_of_weeks\": [\n [\n \"1\",\n \"2\",\n \"3\",\n \"4\",\n \"5\",\n \"6\",\n \"0\"\n ]\n ],\n \"enable_in_bg\": 0,\n \"notify_recovered\": 1,\n \"notify_channels\": [],\n \"notify_groups_obj\": null,\n \"notify_groups\": null,\n \"notify_repeat_step\": 60,\n \"notify_max_number\": 0,\n \"recover_duration\": 0,\n \"callbacks\": [],\n \"runbook_url\": \"\",\n \"append_tags\": [],\n \"annotations\": null,\n \"extra_config\": null,\n \"create_at\": 0,\n \"create_by\": \"\",\n \"update_at\": 0,\n \"update_by\": \"\",\n \"uuid\": 1717556328317808000\n },\n {\n \"id\": 0,\n \"group_id\": 0,\n \"cate\": \"prometheus\",\n \"datasource_ids\": [\n 0\n ],\n \"cluster\": \"\",\n \"name\": \"[RabbitMQ] Persistent Volume Missing\",\n \"note\": \"There is at least one pvc not bound\",\n \"prod\": \"metric\",\n \"algorithm\": \"\",\n \"algo_params\": null,\n \"delay\": 0,\n \"severity\": 1,\n \"severities\": [\n 1\n ],\n \"disabled\": 1,\n \"prom_for_duration\": 600,\n \"prom_ql\": \"\",\n \"rule_config\": {\n \"algo_params\": null,\n \"inhibit\": false,\n \"prom_ql\": \"\",\n \"queries\": [\n {\n \"prom_ql\": \"kube_persistentvolumeclaim_status_phase{phase=\\\"Bound\\\"} == 0\\n\",\n \"severity\": 1\n }\n ],\n \"severity\": 0\n },\n \"prom_eval_interval\": 15,\n \"enable_stime\": \"00:00\",\n \"enable_stimes\": [\n \"00:00\"\n ],\n \"enable_etime\": \"23:59\",\n \"enable_etimes\": [\n \"23:59\"\n ],\n \"enable_days_of_week\": [\n \"1\",\n \"2\",\n \"3\",\n \"4\",\n \"5\",\n \"6\",\n \"0\"\n ],\n \"enable_days_of_weeks\": [\n [\n \"1\",\n \"2\",\n \"3\",\n \"4\",\n \"5\",\n \"6\",\n \"0\"\n ]\n ],\n \"enable_in_bg\": 0,\n \"notify_recovered\": 1,\n \"notify_channels\": [],\n \"notify_groups_obj\": null,\n \"notify_groups\": null,\n \"notify_repeat_step\": 60,\n \"notify_max_number\": 0,\n \"recover_duration\": 0,\n \"callbacks\": [],\n \"runbook_url\": \"\",\n \"append_tags\": [],\n \"annotations\": null,\n \"extra_config\": null,\n \"create_at\": 0,\n \"create_by\": \"\",\n \"update_at\": 0,\n \"update_by\": \"\",\n \"uuid\": 1717556328318244000\n },\n {\n \"id\": 0,\n \"group_id\": 0,\n \"cate\": \"prometheus\",\n \"datasource_ids\": [\n 0\n ],\n \"cluster\": \"\",\n \"name\": \"[RabbitMQ] TCP Sockets Near Limit\",\n \"note\": \"The TCP sockets are near to the limit\",\n \"prod\": \"metric\",\n \"algorithm\": \"\",\n \"algo_params\": null,\n \"delay\": 0,\n \"severity\": 2,\n \"severities\": [\n 2\n ],\n \"disabled\": 1,\n \"prom_for_duration\": 600,\n \"prom_ql\": \"\",\n \"rule_config\": {\n \"algo_params\": null,\n \"inhibit\": false,\n \"prom_ql\": \"\",\n \"queries\": [\n {\n \"prom_ql\": \"sum (max_over_time(rabbitmq_process_open_tcp_sockets[5m]))/sum (rabbitmq_process_max_tcp_sockets)\\u003e 0.8\\n\",\n \"severity\": 2\n }\n ],\n \"severity\": 0\n },\n \"prom_eval_interval\": 15,\n \"enable_stime\": \"00:00\",\n \"enable_stimes\": [\n \"00:00\"\n ],\n \"enable_etime\": \"23:59\",\n \"enable_etimes\": [\n \"23:59\"\n ],\n \"enable_days_of_week\": [\n \"1\",\n \"2\",\n \"3\",\n \"4\",\n \"5\",\n \"6\",\n \"0\"\n ],\n \"enable_days_of_weeks\": [\n [\n \"1\",\n \"2\",\n \"3\",\n \"4\",\n \"5\",\n \"6\",\n \"0\"\n ]\n ],\n \"enable_in_bg\": 0,\n \"notify_recovered\": 1,\n \"notify_channels\": [],\n \"notify_groups_obj\": null,\n \"notify_groups\": null,\n \"notify_repeat_step\": 60,\n \"notify_max_number\": 0,\n \"recover_duration\": 0,\n \"callbacks\": [],\n \"runbook_url\": \"\",\n \"append_tags\": [],\n \"annotations\": null,\n \"extra_config\": null,\n \"create_at\": 0,\n \"create_by\": \"\",\n \"update_at\": 0,\n \"update_by\": \"\",\n \"uuid\": 1717556328318775000\n },\n {\n \"id\": 0,\n \"group_id\": 0,\n \"cate\": \"prometheus\",\n \"datasource_ids\": [\n 0\n ],\n \"cluster\": \"\",\n \"name\": \"[RabbitMQ] Unroutable Messages\",\n \"note\": \"There were unroutable message within the last 5 minutes in RabbitMQ cluster\",\n \"prod\": \"metric\",\n \"algorithm\": \"\",\n \"algo_params\": null,\n \"delay\": 0,\n \"severity\": 2,\n \"severities\": [\n 2\n ],\n \"disabled\": 1,\n \"prom_for_duration\": 300,\n \"prom_ql\": \"\",\n \"rule_config\": {\n \"algo_params\": null,\n \"inhibit\": false,\n \"prom_ql\": \"\",\n \"queries\": [\n {\n \"prom_ql\": \"sum (increase(rabbitmq_channel_messages_unroutable_dropped_total[5m])) \\u003e= 1 or sum (increase(rabbitmq_channel_messages_unroutable_returned_total[5m])) \\u003e= 1\\n\",\n \"severity\": 2\n }\n ],\n \"severity\": 0\n },\n \"prom_eval_interval\": 15,\n \"enable_stime\": \"00:00\",\n \"enable_stimes\": [\n \"00:00\"\n ],\n \"enable_etime\": \"23:59\",\n \"enable_etimes\": [\n \"23:59\"\n ],\n \"enable_days_of_week\": [\n \"1\",\n \"2\",\n \"3\",\n \"4\",\n \"5\",\n \"6\",\n \"0\"\n ],\n \"enable_days_of_weeks\": [\n [\n \"1\",\n \"2\",\n \"3\",\n \"4\",\n \"5\",\n \"6\",\n \"0\"\n ]\n ],\n \"enable_in_bg\": 0,\n \"notify_recovered\": 1,\n \"notify_channels\": [],\n \"notify_groups_obj\": null,\n \"notify_groups\": null,\n \"notify_repeat_step\": 60,\n \"notify_max_number\": 0,\n \"recover_duration\": 0,\n \"callbacks\": [],\n \"runbook_url\": \"\",\n \"append_tags\": [],\n \"annotations\": null,\n \"extra_config\": null,\n \"create_at\": 0,\n \"create_by\": \"\",\n \"update_at\": 0,\n \"update_by\": \"\",\n \"uuid\": 1717556328321515000\n }\n]"
},
{
"path": "integrations/RabbitMQ/collect/rabbitmq/rabbitmq.toml",
"content": "# As of 3.8.0, RabbitMQ ships with built-in Prometheus & Grafana support.\n# Support for Prometheus metric collector ships in the rabbitmq_prometheus plugin.\n# The plugin exposes all RabbitMQ metrics on a dedicated TCP port, in Prometheus text format.\n#\n# enable prometheus plugin:\n# `rabbitmq-plugins enable rabbitmq_prometheus`\n# `curl http://localhost:15692/metrics`\n# \n# then use categraf prometheus plugin scrape http://localhost:15692/metrics instead of this rabbitmq plugin\n\n# # collect interval\n# interval = 15\n\n[[instances]]\n# # Management Plugin url\n# url = \"http://localhost:15672\"\n# username = \"guest\"\n# password = \"guest\"\n\n## Optional TLS Config\n# use_tls = false\n# tls_min_version = \"1.2\"\n# tls_ca = \"/etc/categraf/ca.pem\"\n# tls_cert = \"/etc/categraf/cert.pem\"\n# tls_key = \"/etc/categraf/key.pem\"\n## Use TLS but skip chain & host verification\n# insecure_skip_verify = true\n\n## Optional request timeouts\n##\n## ResponseHeaderTimeout, if non-zero, specifies the amount of time to wait\n## for a server's response headers after fully writing the request.\n# header_timeout = \"3s\"\n##\n## client_timeout specifies a time limit for requests made by this client.\n## Includes connection time, any redirects, and reading the response body.\n# client_timeout = \"4s\"\n\n## A list of nodes to gather as the rabbitmq_node measurement. If not\n## specified, metrics for all nodes are gathered.\n# nodes = [\"rabbit@node1\", \"rabbit@node2\"]\n\n## A list of exchanges to gather as the rabbitmq_exchange measurement. If not\n## specified, metrics for all exchanges are gathered.\n# exchanges = [\"categraf\"]\n\n## Metrics to include and exclude. Globs accepted.\n## Note that an empty array for both will include all metrics\n## Currently the following metrics are supported: \"exchange\", \"federation\", \"node\", \"overview\", \"queue\"\n# metric_include = []\n# metric_exclude = []\n\n## Queues to include and exclude. Globs accepted.\n## Note that an empty array for both will include all queues\n# queue_name_include = []\n# queue_name_exclude = []\n\n## Federation upstreams to include and exclude specified as an array of glob\n## pattern strings. Federation links can also be limited by the queue and\n## exchange filters.\n# federation_upstream_include = []\n# federation_upstream_exclude = []\n\n# # interval = global.interval * interval_times\n# interval_times = 1\n\n# important! use global unique string to specify instance\n# labels = { instance=\"rabbitmq-001\" }"
},
{
"path": "integrations/RabbitMQ/dashboards/rabbitmq_CN_v3.8_gt.json",
"content": "{\n \"id\": 0,\n \"group_id\": 0,\n \"name\": \"RabbitMQ 3.8+ 中文版\",\n \"ident\": \"\",\n \"tags\": \"\",\n \"create_at\": 0,\n \"create_by\": \"\",\n \"update_at\": 0,\n \"update_by\": \"\",\n \"configs\": {\n \"panels\": [\n {\n \"collapsed\": true,\n \"id\": \"4466a232-248d-45a8-bf4d-05d5139c7346\",\n \"layout\": {\n \"h\": 1,\n \"i\": \"4466a232-248d-45a8-bf4d-05d5139c7346\",\n \"w\": 24,\n \"x\": 0,\n \"y\": 0\n },\n \"name\": \"Overview\",\n \"type\": \"row\"\n },\n {\n \"custom\": {\n \"calc\": \"lastNotNull\",\n \"colSpan\": 1,\n \"colorMode\": \"background\",\n \"textMode\": \"valueAndName\",\n \"textSize\": {}\n },\n \"datasourceCate\": \"prometheus\",\n \"datasourceValue\": \"${prom}\",\n \"description\": \"队列中已准备好被消费但尚未被消费者获取的消息总数。建议监控阈值:>1000时警告(可能消费能力不足),>10000时严重(需检查消费者状态)。该指标用于评估消息积压情况,若持续增长需排查消费者处理能力或网络延迟问题。\",\n \"id\": \"a20b5d06-4343-457a-89f2-33a52c4dec04\",\n \"layout\": {\n \"h\": 3,\n \"i\": \"a20b5d06-4343-457a-89f2-33a52c4dec04\",\n \"w\": 7,\n \"x\": 0,\n \"y\": 1\n },\n \"name\": \"待处理消息数\",\n \"options\": {\n \"standardOptions\": {},\n \"valueMappings\": [\n {\n \"match\": {\n \"from\": 10000\n },\n \"result\": {\n \"color\": \"#4a90e2\"\n },\n \"type\": \"range\"\n },\n {\n \"match\": {\n \"from\": 100000\n },\n \"result\": {\n \"color\": \"#f50a0a\"\n },\n \"type\": \"range\"\n },\n {\n \"match\": {\n \"to\": 9999\n },\n \"result\": {\n \"color\": \"#417505\"\n },\n \"type\": \"range\"\n }\n ]\n },\n \"targets\": [\n {\n \"expr\": \"sum(rabbitmq_queue_messages_ready * on(instance) group_left(rabbitmq_cluster) rabbitmq_identity_info{rabbitmq_cluster=\\\"$rabbitmq_cluster\\\"})\",\n \"refId\": \"A\"\n }\n ],\n \"type\": \"stat\",\n \"version\": \"2.0.0\"\n },\n {\n \"custom\": {\n \"calc\": \"lastNotNull\",\n \"colSpan\": 1,\n \"colorMode\": \"background\",\n \"textMode\": \"valueAndName\",\n \"textSize\": {}\n },\n \"datasourceCate\": \"prometheus\",\n \"datasourceValue\": \"${prom}\",\n \"description\": \"消息队列每秒接收的新消息数量。建议监控阈值:持续低于预期值时警告(可能生产者异常),突发高峰时需关注消费者处理能力。该指标反映系统写入负载,异常波动可能影响整体吞吐量。\",\n \"id\": \"893409b0-4ca0-450b-a0c9-f48eddf0e243\",\n \"layout\": {\n \"h\": 3,\n \"i\": \"893409b0-4ca0-450b-a0c9-f48eddf0e243\",\n \"w\": 5,\n \"x\": 7,\n \"y\": 1\n },\n \"name\": \"每秒接收消息数\",\n \"options\": {\n \"standardOptions\": {},\n \"valueMappings\": [\n {\n \"match\": {\n \"from\": 50\n },\n \"result\": {\n \"color\": \"#417505\"\n },\n \"type\": \"range\"\n }\n ]\n },\n \"targets\": [\n {\n \"expr\": \"sum(rate(rabbitmq_channel_messages_published_total[60s]) * on(instance) group_left(rabbitmq_cluster) rabbitmq_identity_info{rabbitmq_cluster=\\\"$rabbitmq_cluster\\\"})\",\n \"refId\": \"A\"\n }\n ],\n \"type\": \"stat\",\n \"version\": \"2.0.0\"\n },\n {\n \"custom\": {\n \"calc\": \"lastNotNull\",\n \"colSpan\": 1,\n \"colorMode\": \"background\",\n \"textMode\": \"valueAndName\",\n \"textSize\": {}\n },\n \"datasourceCate\": \"prometheus\",\n \"datasourceValue\": \"${prom}\",\n \"description\": \"当前连接到消息队列并正在发布消息的生产者数量。建议监控阈值:突降为0时告警(可能生产者故障),异常激增时需关注资源竞争。该指标反映系统写入端的稳定性,适用于容量规划与异常检测场景。\",\n \"id\": \"d596e7f0-5095-420e-bc38-674001dcf5f4\",\n \"layout\": {\n \"h\": 3,\n \"i\": \"d596e7f0-5095-420e-bc38-674001dcf5f4\",\n \"w\": 4,\n \"x\": 12,\n \"y\": 1\n },\n \"name\": \"活跃生产者数量\",\n \"options\": {\n \"standardOptions\": {},\n \"valueMappings\": [\n {\n \"match\": {\n \"from\": 10\n },\n \"result\": {\n \"color\": \"#417505\"\n },\n \"type\": \"range\"\n }\n ]\n },\n \"targets\": [\n {\n \"expr\": \"sum(rabbitmq_channels * on(instance) group_left(rabbitmq_cluster) rabbitmq_identity_info{rabbitmq_cluster=\\\"$rabbitmq_cluster\\\"}) - sum(rabbitmq_channel_consumers * on(instance) group_left(rabbitmq_cluster) rabbitmq_identity_info{rabbitmq_cluster=\\\"$rabbitmq_cluster\\\"})\",\n \"refId\": \"A\"\n }\n ],\n \"type\": \"stat\",\n \"version\": \"2.0.0\"\n },\n {\n \"custom\": {\n \"calc\": \"lastNotNull\",\n \"colSpan\": 1,\n \"colorMode\": \"background\",\n \"textMode\": \"valueAndName\",\n \"textSize\": {}\n },\n \"datasourceCate\": \"prometheus\",\n \"datasourceValue\": \"${prom}\",\n \"description\":\"当前与消息队列系统建立的客户端连接总数(包括生产者、消费者和管理工具)。建议监控阈值:突降至0时告警(可能网络隔离),异常高峰时需检查资源限制或DDoS攻击。该指标反映系统整体访问压力,是容量评估和故障排查的关键指标之一。\",\n \"id\": \"9f6d7dee-666d-4e1b-90d0-129b2e5ba085\",\n \"layout\": {\n \"h\": 3,\n \"i\": \"9f6d7dee-666d-4e1b-90d0-129b2e5ba085\",\n \"w\": 4,\n \"x\": 16,\n \"y\": 1\n },\n \"name\": \"活跃连接数\",\n \"options\": {\n \"standardOptions\": {},\n \"valueMappings\": [\n {\n \"match\": {\n \"from\": 10\n },\n \"result\": {\n \"color\": \"#417505\"\n },\n \"type\": \"range\"\n }\n ]\n },\n \"targets\": [\n {\n \"expr\": \"sum(rabbitmq_connections * on(instance) group_left(rabbitmq_cluster) rabbitmq_identity_info{rabbitmq_cluster=\\\"$rabbitmq_cluster\\\"})\",\n \"refId\": \"A\"\n }\n ],\n \"type\": \"stat\",\n \"version\": \"2.0.0\"\n },\n {\n \"custom\": {\n \"calc\": \"lastNotNull\",\n \"colSpan\": 1,\n \"colorMode\": \"background\",\n \"textMode\": \"valueAndName\",\n \"textSize\": {}\n },\n \"datasourceCate\": \"prometheus\",\n \"datasourceValue\": \"${prom}\",\n \"description\": \"当前消息队列系统中存在的队列(或主题)总数。建议监控阈值:突增:可能因配置错误导致自动创建大量队列(需检查自动化策略)突降:可能误删除或系统元数据故障持续增长:需关注资源消耗(如内存/文件句柄)\",\n \"id\": \"910eae0f-2b78-4d10-a780-8f997f6e96cb\",\n \"layout\": {\n \"h\": 3,\n \"i\": \"910eae0f-2b78-4d10-a780-8f997f6e96cb\",\n \"w\": 4,\n \"x\": 20,\n \"y\": 1\n },\n \"name\": \"队列数量\",\n \"options\": {\n \"standardOptions\": {},\n \"valueMappings\": [\n {\n \"match\": {\n \"from\": 10\n },\n \"result\": {\n \"color\": \"#417505\"\n },\n \"type\": \"range\"\n }\n ]\n },\n \"targets\": [\n {\n \"expr\": \"sum(rabbitmq_queues * on(instance) group_left(rabbitmq_cluster) rabbitmq_identity_info{rabbitmq_cluster=\\\"$rabbitmq_cluster\\\"})\",\n \"refId\": \"A\"\n }\n ],\n \"type\": \"stat\",\n \"version\": \"2.0.0\"\n },\n {\n \"custom\": {\n \"calc\": \"lastNotNull\",\n \"colSpan\": 1,\n \"colorMode\": \"background\",\n \"textMode\": \"valueAndName\",\n \"textSize\": {}\n },\n \"datasourceCate\": \"prometheus\",\n \"datasourceValue\": \"${prom}\",\n \"description\": \"当前已被消费者接收但尚未明确确认(ACK)的消息总数。该指标直接反映系统的消息处理可靠性和消费者健康状态。\",\n \"id\": \"2e8cd60f-51b0-46b2-8c0f-bf55604d340d\",\n \"layout\": {\n \"h\": 3,\n \"i\": \"2e8cd60f-51b0-46b2-8c0f-bf55604d340d\",\n \"w\": 7,\n \"x\": 0,\n \"y\": 2\n },\n \"name\": \"未确认消息数\",\n \"options\": {\n \"standardOptions\": {},\n \"valueMappings\": [\n {\n \"match\": {\n \"to\": 99\n },\n \"result\": {\n \"color\": \"#417505\"\n },\n \"type\": \"range\"\n },\n {\n \"match\": {\n \"from\": 100\n },\n \"result\": {\n \"color\": \"#4a90e2\"\n },\n \"type\": \"range\"\n },\n {\n \"match\": {\n \"from\": 500\n },\n \"result\": {\n \"color\": \"#d0021b\"\n },\n \"type\": \"range\"\n }\n ]\n },\n \"targets\": [\n {\n \"expr\": \"sum(rabbitmq_queue_messages_unacked * on(instance) group_left(rabbitmq_cluster) rabbitmq_identity_info{rabbitmq_cluster=\\\"$rabbitmq_cluster\\\"})\",\n \"refId\": \"A\"\n }\n ],\n \"type\": \"stat\",\n \"version\": \"2.0.0\"\n },\n {\n \"custom\": {\n \"calc\": \"lastNotNull\",\n \"colSpan\": 1,\n \"colorMode\": \"background\",\n \"textMode\": \"valueAndName\",\n \"textSize\": {}\n },\n \"datasourceCate\": \"prometheus\",\n \"datasourceValue\": \"${prom}\",\n \"description\": \"成功投递给消费者的消息数量。该指标反映系统的实时吞吐能力,是衡量消费者处理效率和服务端性能的关键指标。\",\n \"id\": \"4b242c1e-85d5-48b3-8cce-b467209245ec\",\n \"layout\": {\n \"h\": 3,\n \"i\": \"4b242c1e-85d5-48b3-8cce-b467209245ec\",\n \"w\": 5,\n \"x\": 7,\n \"y\": 2\n },\n \"name\": \"出站消息速率(消息/秒)\",\n \"options\": {\n \"standardOptions\": {},\n \"valueMappings\": [\n {\n \"match\": {\n \"from\": 50\n },\n \"result\": {\n \"color\": \"#417505\"\n },\n \"type\": \"range\"\n }\n ]\n },\n \"targets\": [\n {\n \"expr\": \"sum(rate(rabbitmq_channel_messages_redelivered_total[60s]) * on(instance) group_left(rabbitmq_cluster) rabbitmq_identity_info{rabbitmq_cluster=\\\"$rabbitmq_cluster\\\"}) +\\nsum(rate(rabbitmq_channel_messages_delivered_total[60s]) * on(instance) group_left(rabbitmq_cluster) rabbitmq_identity_info{rabbitmq_cluster=\\\"$rabbitmq_cluster\\\"}) +\\nsum(rate(rabbitmq_channel_messages_delivered_ack_total[60s]) * on(instance) group_left(rabbitmq_cluster) rabbitmq_identity_info{rabbitmq_cluster=\\\"$rabbitmq_cluster\\\"}) +\\nsum(rate(rabbitmq_channel_get_total[60s]) * on(instance) group_left(rabbitmq_cluster) rabbitmq_identity_info{rabbitmq_cluster=\\\"$rabbitmq_cluster\\\"}) +\\nsum(rate(rabbitmq_channel_get_ack_total[60s]) * on(instance) group_left(rabbitmq_cluster) rabbitmq_identity_info{rabbitmq_cluster=\\\"$rabbitmq_cluster\\\"})\",\n \"refId\": \"A\"\n }\n ],\n \"type\": \"stat\",\n \"version\": \"2.0.0\"\n },\n {\n \"custom\": {\n \"calc\": \"lastNotNull\",\n \"colSpan\": 1,\n \"colorMode\": \"background\",\n \"textMode\": \"valueAndName\",\n \"textSize\": {}\n },\n \"datasourceCate\": \"prometheus\",\n \"datasourceValue\": \"${prom}\",\n \"id\": \"b87b1c6b-644a-42f4-915a-bd6857540f70\",\n \"layout\": {\n \"h\": 3,\n \"i\": \"b87b1c6b-644a-42f4-915a-bd6857540f70\",\n \"w\": 4,\n \"x\": 12,\n \"y\": 2\n },\n \"name\": \"消息消费者\",\n \"options\": {\n \"standardOptions\": {},\n \"valueMappings\": [\n {\n \"match\": {\n \"from\": 10\n },\n \"result\": {\n \"color\": \"#417505\"\n },\n \"type\": \"range\"\n }\n ]\n },\n \"targets\": [\n {\n \"expr\": \"sum(rabbitmq_channel_consumers * on(instance) group_left(rabbitmq_cluster) rabbitmq_identity_info{rabbitmq_cluster=\\\"$rabbitmq_cluster\\\"})\",\n \"refId\": \"A\"\n }\n ],\n \"type\": \"stat\",\n \"version\": \"2.0.0\"\n },\n {\n \"custom\": {\n \"calc\": \"lastNotNull\",\n \"colSpan\": 1,\n \"colorMode\": \"background\",\n \"textMode\": \"valueAndName\",\n \"textSize\": {}\n },\n \"datasourceCate\": \"prometheus\",\n \"datasourceValue\": \"${prom}\",\n \"description\": \"在消息队列(如 RabbitMQ)中,通道是客户端与服务器之间的轻量级虚拟连接,用于高效传输消息。多个通道可以共享同一个 TCP 连接,减少资源消耗并提高并发性能。\",\n \"id\": \"65103bcf-fb21-488d-a06b-7b0ea130ca4d\",\n \"layout\": {\n \"h\": 3,\n \"i\": \"65103bcf-fb21-488d-a06b-7b0ea130ca4d\",\n \"w\": 4,\n \"x\": 16,\n \"y\": 2\n },\n \"name\": \"消息通道\",\n \"options\": {\n \"standardOptions\": {},\n \"valueMappings\": [\n {\n \"match\": {\n \"from\": 10\n },\n \"result\": {\n \"color\": \"#417505\"\n },\n \"type\": \"range\"\n }\n ]\n },\n \"targets\": [\n {\n \"expr\": \"sum(rabbitmq_channels * on(instance) group_left(rabbitmq_cluster) rabbitmq_identity_info{rabbitmq_cluster=\\\"$rabbitmq_cluster\\\"})\",\n \"refId\": \"A\"\n }\n ],\n \"type\": \"stat\",\n \"version\": \"2.0.0\"\n },\n {\n \"custom\": {\n \"calc\": \"lastNotNull\",\n \"colSpan\": 1,\n \"colorMode\": \"background\",\n \"textMode\": \"valueAndName\",\n \"textSize\": {}\n },\n \"datasourceCate\": \"prometheus\",\n \"datasourceValue\": \"${prom}\",\n \"id\": \"c6454712-e265-4387-ae86-9ac865af46f2\",\n \"layout\": {\n \"h\": 3,\n \"i\": \"c6454712-e265-4387-ae86-9ac865af46f2\",\n \"w\": 4,\n \"x\": 20,\n \"y\": 2\n },\n \"name\": \"Nodes\",\n \"options\": {\n \"standardOptions\": {},\n \"valueMappings\": [\n {\n \"match\": {\n \"from\": 3,\n \"to\": null\n },\n \"result\": {\n \"color\": \"#417505\"\n },\n \"type\": \"range\"\n },\n {\n \"match\": {\n \"from\": 8\n },\n \"result\": {\n \"color\": \"#e70909\"\n },\n \"type\": \"range\"\n }\n ]\n },\n \"targets\": [\n {\n \"expr\": \"sum(rabbitmq_build_info * on(instance) group_left(rabbitmq_cluster) rabbitmq_identity_info{rabbitmq_cluster=\\\"$rabbitmq_cluster\\\"})\",\n \"refId\": \"A\"\n }\n ],\n \"type\": \"stat\",\n \"version\": \"2.0.0\"\n },\n {\n \"collapsed\": true,\n \"id\": \"1712a96f-bcde-4d33-90b6-e2eba20527b9\",\n \"layout\": {\n \"h\": 1,\n \"i\": \"1712a96f-bcde-4d33-90b6-e2eba20527b9\",\n \"w\": 24,\n \"x\": 0,\n \"y\": 5\n },\n \"name\": \"Nodes\",\n \"type\": \"row\"\n },\n {\n \"custom\": {\n \"calc\": \"lastNotNull\",\n \"columns\": [\n \"rabbitmq_cluster\",\n \"rabbitmq_node\",\n \"rabbitmq_version\",\n \"erlang_version\"\n ],\n \"displayMode\": \"labelsOfSeriesToRows\",\n \"showHeader\": true\n },\n \"datasourceCate\": \"prometheus\",\n \"datasourceValue\": \"${prom}\",\n \"id\": \"1b3fdea0-1921-48ae-b11f-31cc27f816b0\",\n \"layout\": {\n \"h\": 3,\n \"i\": \"1b3fdea0-1921-48ae-b11f-31cc27f816b0\",\n \"w\": 24,\n \"x\": 0,\n \"y\": 6\n },\n \"name\": \"nodes\",\n \"options\": {\n \"standardOptions\": {}\n },\n \"overrides\": [\n {}\n ],\n \"targets\": [\n {\n \"expr\": \"rabbitmq_build_info * on(instance) group_left(rabbitmq_cluster, rabbitmq_node) rabbitmq_identity_info{rabbitmq_cluster=\\\"$rabbitmq_cluster\\\"}\",\n \"refId\": \"A\"\n }\n ],\n \"type\": \"table\",\n \"version\": \"2.0.0\"\n },\n {\n \"custom\": {\n \"drawStyle\": \"lines\",\n \"fillOpacity\": 0.3,\n \"gradientMode\": \"opacity\",\n \"lineInterpolation\": \"smooth\",\n \"lineWidth\": 2,\n \"stack\": \"off\"\n },\n \"datasourceCate\": \"prometheus\",\n \"datasourceValue\": \"${prom}\",\n \"description\": \"RabbitMQ 在内存压力下会主动阻塞消息发布者(Publisher),以避免内存耗尽导致服务崩溃。此指标表示当前剩余可用内存距离触发阻塞机制的阈值。\",\n \"id\": \"b91068ed-0914-4a8d-91dd-9ffb3b692516\",\n \"layout\": {\n \"h\": 7,\n \"i\": \"b91068ed-0914-4a8d-91dd-9ffb3b692516\",\n \"w\": 8,\n \"x\": 0,\n \"y\": 7\n },\n \"name\": \"发布者阻塞阈值(剩余可用内存)\",\n \"options\": {\n \"legend\": {\n \"displayMode\": \"hidden\"\n },\n \"standardOptions\": {\n \"decimals\": 1\n },\n \"thresholds\": {},\n \"tooltip\": {\n \"mode\": \"all\",\n \"sort\": \"none\"\n }\n },\n \"targets\": [\n {\n \"expr\": \"(rabbitmq_resident_memory_limit_bytes * on(instance) group_left(rabbitmq_cluster, rabbitmq_node) rabbitmq_identity_info{rabbitmq_cluster=\\\"$rabbitmq_cluster\\\"}) -\\n(rabbitmq_process_resident_memory_bytes * on(instance) group_left(rabbitmq_cluster, rabbitmq_node) rabbitmq_identity_info{rabbitmq_cluster=\\\"$rabbitmq_cluster\\\"})\",\n \"refId\": \"A\"\n }\n ],\n \"type\": \"timeseries\",\n \"version\": \"2.0.0\"\n },\n {\n \"custom\": {\n \"drawStyle\": \"lines\",\n \"fillOpacity\": 0.3,\n \"gradientMode\": \"opacity\",\n \"lineInterpolation\": \"smooth\",\n \"lineWidth\": 2,\n \"stack\": \"off\"\n },\n \"datasourceCate\": \"prometheus\",\n \"datasourceValue\": \"${prom}\",\n \"description\": \"RabbitMQ 在磁盘空间不足时会主动阻塞消息发布者(Publisher),以防止因磁盘写满导致服务崩溃。此指标表示当前剩余可用磁盘空间距离触发阻塞机制的阈值。\",\n \"id\": \"a74ca489-6101-49bc-9560-4cde368bc47e\",\n \"layout\": {\n \"h\": 7,\n \"i\": \"a74ca489-6101-49bc-9560-4cde368bc47e\",\n \"w\": 8,\n \"x\": 8,\n \"y\": 7\n },\n \"name\": \"发布者阻塞阈值(剩余可用磁盘空间)\",\n \"options\": {\n \"legend\": {\n \"displayMode\": \"hidden\"\n },\n \"standardOptions\": {\n \"decimals\": 1\n },\n \"thresholds\": {},\n \"tooltip\": {\n \"mode\": \"all\",\n \"sort\": \"none\"\n }\n },\n \"targets\": [\n {\n \"expr\": \"rabbitmq_disk_space_available_bytes * on(instance) group_left(rabbitmq_cluster, rabbitmq_node) rabbitmq_identity_info{rabbitmq_cluster=\\\"$rabbitmq_cluster\\\"}\",\n \"refId\": \"A\"\n }\n ],\n \"type\": \"timeseries\",\n \"version\": \"2.0.0\"\n },\n {\n \"custom\": {\n \"drawStyle\": \"lines\",\n \"fillOpacity\": 0.3,\n \"gradientMode\": \"opacity\",\n \"lineInterpolation\": \"smooth\",\n \"lineWidth\": 2,\n \"stack\": \"off\"\n },\n \"datasourceCate\": \"prometheus\",\n \"datasourceValue\": \"${prom}\",\n \"description\": \"RabbitMQ 依赖文件描述符(File Descriptors)来管理网络连接、队列、通道等资源。此指标表示当前系统剩余可用的文件描述符数量,若不足可能导致新连接被拒绝或服务异常。\",\n \"id\": \"100ed9ae-2b84-4f2b-82b2-0444dd28deed\",\n \"layout\": {\n \"h\": 3,\n \"i\": \"100ed9ae-2b84-4f2b-82b2-0444dd28deed\",\n \"w\": 8,\n \"x\": 16,\n \"y\": 7\n },\n \"name\": \"可用文件句柄数\",\n \"options\": {\n \"legend\": {\n \"displayMode\": \"hidden\"\n },\n \"standardOptions\": {},\n \"thresholds\": {},\n \"tooltip\": {\n \"mode\": \"all\",\n \"sort\": \"none\"\n }\n },\n \"targets\": [\n {\n \"expr\": \"(rabbitmq_process_max_fds * on(instance) group_left(rabbitmq_cluster, rabbitmq_node) rabbitmq_identity_info{rabbitmq_cluster=\\\"$rabbitmq_cluster\\\"}) -\\n(rabbitmq_process_open_fds * on(instance) group_left(rabbitmq_cluster, rabbitmq_node) rabbitmq_identity_info{rabbitmq_cluster=\\\"$rabbitmq_cluster\\\"})\",\n \"refId\": \"A\"\n }\n ],\n \"type\": \"timeseries\",\n \"version\": \"2.0.0\"\n },\n {\n \"custom\": {\n \"drawStyle\": \"lines\",\n \"fillOpacity\": 0.3,\n \"gradientMode\": \"opacity\",\n \"lineInterpolation\": \"smooth\",\n \"lineWidth\": 2,\n \"stack\": \"off\"\n },\n \"datasourceCate\": \"prometheus\",\n \"datasourceValue\": \"${prom}\",\n \"description\": \"RabbitMQ 使用TCP套接字处理客户端连接(如AMQP、MQTT、STOMP等协议)。此指标表示当前可用的TCP套接字资源数量,若不足可能导致新连接被拒绝。\",\n \"id\": \"a4859891-2538-47fc-946b-7ae3aa507c51\",\n \"layout\": {\n \"h\": 3,\n \"i\": \"a4859891-2538-47fc-946b-7ae3aa507c51\",\n \"w\": 8,\n \"x\": 16,\n \"y\": 8\n },\n \"name\": \"可用TCP套接字数\",\n \"options\": {\n \"legend\": {\n \"displayMode\": \"hidden\"\n },\n \"standardOptions\": {},\n \"thresholds\": {},\n \"tooltip\": {\n \"mode\": \"all\",\n \"sort\": \"none\"\n }\n },\n \"targets\": [\n {\n \"expr\": \"(rabbitmq_process_max_tcp_sockets * on(instance) group_left(rabbitmq_cluster, rabbitmq_node) rabbitmq_identity_info{rabbitmq_cluster=\\\"$rabbitmq_cluster\\\"}) -\\n(rabbitmq_process_open_tcp_sockets * on(instance) group_left(rabbitmq_cluster, rabbitmq_node) rabbitmq_identity_info{rabbitmq_cluster=\\\"$rabbitmq_cluster\\\"})\",\n \"refId\": \"A\"\n }\n ],\n \"type\": \"timeseries\",\n \"version\": \"2.0.0\"\n },\n {\n \"collapsed\": true,\n \"id\": \"fec98a71-0615-4782-bf8d-960529e243f9\",\n \"layout\": {\n \"h\": 1,\n \"i\": \"fec98a71-0615-4782-bf8d-960529e243f9\",\n \"w\": 24,\n \"x\": 0,\n \"y\": 14\n },\n \"name\": \"QUEUED MESSAGES\",\n \"type\": \"row\"\n },\n {\n \"custom\": {\n \"drawStyle\": \"lines\",\n \"fillOpacity\": 0.3,\n \"gradientMode\": \"opacity\",\n \"lineInterpolation\": \"smooth\",\n \"lineWidth\": 2,\n \"stack\": \"off\"\n },\n \"datasourceCate\": \"prometheus\",\n \"datasourceValue\": \"${prom}\",\n \"description\": \"表示队列中已准备好但尚未被消费者接收的消息数量。此指标反映消费者的处理能力,若持续增长可能表明消费者处理速度不足或存在阻塞。\",\n \"id\": \"145dc75a-d3b8-491f-9ba6-6da787c8e265\",\n \"layout\": {\n \"h\": 3,\n \"i\": \"145dc75a-d3b8-491f-9ba6-6da787c8e265\",\n \"w\": 12,\n \"x\": 0,\n \"y\": 15\n },\n \"name\": \"待消费消息数\",\n \"options\": {\n \"legend\": {\n \"displayMode\": \"hidden\"\n },\n \"standardOptions\": {},\n \"thresholds\": {},\n \"tooltip\": {\n \"mode\": \"all\",\n \"sort\": \"none\"\n }\n },\n \"targets\": [\n {\n \"expr\": \"sum(rabbitmq_queue_messages_ready * on(instance) group_left(rabbitmq_cluster, rabbitmq_node) rabbitmq_identity_info{rabbitmq_cluster=\\\"$rabbitmq_cluster\\\"}) by(rabbitmq_node)\",\n \"refId\": \"A\"\n }\n ],\n \"type\": \"timeseries\",\n \"version\": \"2.0.0\"\n },\n {\n \"custom\": {\n \"drawStyle\": \"lines\",\n \"fillOpacity\": 0.3,\n \"gradientMode\": \"opacity\",\n \"lineInterpolation\": \"smooth\",\n \"lineWidth\": 2,\n \"stack\": \"off\"\n },\n \"datasourceCate\": \"prometheus\",\n \"datasourceValue\": \"${prom}\",\n \"description\": \"表示已被消费者接收但尚未收到确认(ACK/NACK)的消息数量。此指标反映消费者的处理效率,若持续增长可能表明消费者处理延迟或存在故障。\",\n \"id\": \"a6ca328a-8b19-488e-a70d-74372f994901\",\n \"layout\": {\n \"h\": 3,\n \"i\": \"a6ca328a-8b19-488e-a70d-74372f994901\",\n \"w\": 12,\n \"x\": 12,\n \"y\": 15\n },\n \"name\": \"待确认消息数\",\n \"options\": {\n \"legend\": {\n \"displayMode\": \"hidden\"\n },\n \"standardOptions\": {},\n \"thresholds\": {},\n \"tooltip\": {\n \"mode\": \"all\",\n \"sort\": \"none\"\n }\n },\n \"targets\": [\n {\n \"expr\": \"sum(rabbitmq_queue_messages_unacked * on(instance) group_left(rabbitmq_cluster, rabbitmq_node) rabbitmq_identity_info{rabbitmq_cluster=\\\"$rabbitmq_cluster\\\"}) by(rabbitmq_node)\",\n \"refId\": \"A\"\n }\n ],\n \"type\": \"timeseries\",\n \"version\": \"2.0.0\"\n },\n {\n \"collapsed\": true,\n \"id\": \"500c51ed-a0d6-41d9-903f-d000e289dc2b\",\n \"layout\": {\n \"h\": 1,\n \"i\": \"500c51ed-a0d6-41d9-903f-d000e289dc2b\",\n \"w\": 24,\n \"x\": 0,\n \"y\": 18\n },\n \"name\": \"INCOMING MESSAGES\",\n \"type\": \"row\"\n },\n {\n \"custom\": {\n \"drawStyle\": \"lines\",\n \"fillOpacity\": 0.3,\n \"gradientMode\": \"opacity\",\n \"lineInterpolation\": \"smooth\",\n \"lineWidth\": 2,\n \"stack\": \"off\"\n },\n \"datasourceCate\": \"prometheus\",\n \"datasourceValue\": \"${prom}\",\n \"description\": \"表示生产者每秒向队列或交换机发布的消息数量。此指标反映系统的写入负载,突增可能影响消息积压或处理延迟。\",\n \"id\": \"ef4352a4-c281-4596-b89e-d79a565ca112\",\n \"layout\": {\n \"h\": 3,\n \"i\": \"ef4352a4-c281-4596-b89e-d79a565ca112\",\n \"w\": 12,\n \"x\": 0,\n \"y\": 19\n },\n \"name\": \"每秒发布消息数\",\n \"options\": {\n \"legend\": {\n \"displayMode\": \"hidden\"\n },\n \"standardOptions\": {},\n \"thresholds\": {},\n \"tooltip\": {\n \"mode\": \"all\",\n \"sort\": \"none\"\n }\n },\n \"targets\": [\n {\n \"expr\": \"sum(rate(rabbitmq_channel_messages_published_total[60s]) * on(instance) group_left(rabbitmq_cluster, rabbitmq_node) rabbitmq_identity_info{rabbitmq_cluster=\\\"$rabbitmq_cluster\\\"}) by(rabbitmq_node)\",\n \"refId\": \"A\"\n }\n ],\n \"type\": \"timeseries\",\n \"version\": \"2.0.0\"\n },\n {\n \"custom\": {\n \"drawStyle\": \"lines\",\n \"fillOpacity\": 0.3,\n \"gradientMode\": \"opacity\",\n \"lineInterpolation\": \"smooth\",\n \"lineWidth\": 2,\n \"stack\": \"off\"\n },\n \"datasourceCate\": \"prometheus\",\n \"datasourceValue\": \"${prom}\",\n \"description\": \"表示服务器每秒向生产者发送的发布确认(Publisher Confirm)数量。此指标反映消息持久化或路由完成的效率,高确认速率通常表明系统处理能力良好。\",\n \"id\": \"f0932549-d4a7-4eb1-a86e-35eb49569f29\",\n \"layout\": {\n \"h\": 3,\n \"i\": \"f0932549-d4a7-4eb1-a86e-35eb49569f29\",\n \"w\": 12,\n \"x\": 12,\n \"y\": 19\n },\n \"name\": \"每秒确认发布的消息数\",\n \"options\": {\n \"legend\": {\n \"displayMode\": \"hidden\"\n },\n \"standardOptions\": {},\n \"thresholds\": {},\n \"tooltip\": {\n \"mode\": \"all\",\n \"sort\": \"none\"\n }\n },\n \"targets\": [\n {\n \"expr\": \"sum(rate(rabbitmq_channel_messages_confirmed_total[60s]) * on(instance) group_left(rabbitmq_cluster, rabbitmq_node) rabbitmq_identity_info{rabbitmq_cluster=\\\"$rabbitmq_cluster\\\"}) by(rabbitmq_node)\",\n \"refId\": \"A\"\n }\n ],\n \"type\": \"timeseries\",\n \"version\": \"2.0.0\"\n },\n {\n \"custom\": {\n \"drawStyle\": \"lines\",\n \"fillOpacity\": 0.3,\n \"gradientMode\": \"opacity\",\n \"lineInterpolation\": \"smooth\",\n \"lineWidth\": 2,\n \"stack\": \"off\"\n },\n \"datasourceCate\": \"prometheus\",\n \"datasourceValue\": \"${prom}\",\n \"description\": \"表示交换机每秒成功路由到目标队列的消息数量。此指标反映消息分发的效率,若数值低于发布速率,可能存在路由键不匹配或队列未绑定等问题。\",\n \"id\": \"f47766cb-3cdb-4f67-896f-77af421ff404\",\n \"layout\": {\n \"h\": 3,\n \"i\": \"f47766cb-3cdb-4f67-896f-77af421ff404\",\n \"w\": 12,\n \"x\": 0,\n \"y\": 20\n },\n \"name\": \"每秒路由到队列的消息数\",\n \"options\": {\n \"legend\": {\n \"displayMode\": \"hidden\"\n },\n \"standardOptions\": {},\n \"thresholds\": {},\n \"tooltip\": {\n \"mode\": \"all\",\n \"sort\": \"none\"\n }\n },\n \"targets\": [\n {\n \"expr\": \"sum(rate(rabbitmq_queue_messages_published_total[60s]) * on(instance) group_left(rabbitmq_cluster, rabbitmq_node) rabbitmq_identity_info{rabbitmq_cluster=\\\"$rabbitmq_cluster\\\"}) by(rabbitmq_node)\",\n \"refId\": \"A\"\n }\n ],\n \"type\": \"timeseries\",\n \"version\": \"2.0.0\"\n },\n {\n \"custom\": {\n \"drawStyle\": \"lines\",\n \"fillOpacity\": 0.3,\n \"gradientMode\": \"opacity\",\n \"lineInterpolation\": \"smooth\",\n \"lineWidth\": 2,\n \"stack\": \"off\"\n },\n \"datasourceCate\": \"prometheus\",\n \"datasourceValue\": \"${prom}\",\n \"description\": \"表示服务器每秒未能向生产者发送确认(Publisher Confirm)的消息数量。此指标反映消息持久化或路由的潜在问题,持续较高的数值可能表明性能瓶颈或故障。\",\n \"id\": \"644302ba-3c99-4787-8023-93770b0a9e6c\",\n \"layout\": {\n \"h\": 3,\n \"i\": \"644302ba-3c99-4787-8023-93770b0a9e6c\",\n \"w\": 12,\n \"x\": 12,\n \"y\": 20\n },\n \"name\": \"每秒未确认发布的消息数\",\n \"options\": {\n \"legend\": {\n \"displayMode\": \"hidden\"\n },\n \"standardOptions\": {},\n \"thresholds\": {},\n \"tooltip\": {\n \"mode\": \"all\",\n \"sort\": \"none\"\n }\n },\n \"targets\": [\n {\n \"expr\": \"sum(rate(rabbitmq_channel_messages_unconfirmed[60s]) * on(instance) group_left(rabbitmq_cluster, rabbitmq_node) rabbitmq_identity_info{rabbitmq_cluster=\\\"$rabbitmq_cluster\\\"}) by(rabbitmq_node)\",\n \"refId\": \"A\"\n }\n ],\n \"type\": \"timeseries\",\n \"version\": \"2.0.0\"\n },\n {\n \"custom\": {\n \"drawStyle\": \"lines\",\n \"fillOpacity\": 0.3,\n \"gradientMode\": \"opacity\",\n \"lineInterpolation\": \"smooth\",\n \"lineWidth\": 2,\n \"stack\": \"off\"\n },\n \"datasourceCate\": \"prometheus\",\n \"datasourceValue\": \"${prom}\",\n \"description\": \"表示交换机因无法匹配任何绑定队列而每秒丢弃的消息数量。此指标反映路由键配置错误或消费者缺失问题,需检查交换机和队列的绑定关系。\",\n \"id\": \"0a3eadfd-d84c-4070-9527-b4c62fc20787\",\n \"layout\": {\n \"h\": 3,\n \"i\": \"0a3eadfd-d84c-4070-9527-b4c62fc20787\",\n \"w\": 12,\n \"x\": 0,\n \"y\": 21\n },\n \"name\": \"每秒丢弃的不可路由消息数\",\n \"options\": {\n \"legend\": {\n \"displayMode\": \"hidden\"\n },\n \"standardOptions\": {},\n \"thresholds\": {},\n \"tooltip\": {\n \"mode\": \"all\",\n \"sort\": \"none\"\n }\n },\n \"targets\": [\n {\n \"expr\": \"sum(rate(rabbitmq_channel_messages_unroutable_dropped_total[60s]) * on(instance) group_left(rabbitmq_cluster, rabbitmq_node) rabbitmq_identity_info{rabbitmq_cluster=\\\"$rabbitmq_cluster\\\"}) by(rabbitmq_node)\",\n \"refId\": \"A\"\n }\n ],\n \"type\": \"timeseries\",\n \"version\": \"2.0.0\"\n },\n {\n \"custom\": {\n \"drawStyle\": \"lines\",\n \"fillOpacity\": 0.3,\n \"gradientMode\": \"opacity\",\n \"lineInterpolation\": \"smooth\",\n \"lineWidth\": 2,\n \"stack\": \"off\"\n },\n \"datasourceCate\": \"prometheus\",\n \"datasourceValue\": \"${prom}\",\n \"description\": \"表示因无法路由到任何队列(且启用了 mandatory 标志)而每秒被退回给生产者的消息数量。此指标反映路由配置错误或消费者缺失,需检查交换机的绑定规则和生产者的错误处理逻辑。\",\n \"id\": \"a14e8796-9614-4204-b5b8-5d1a47f356d8\",\n \"layout\": {\n \"h\": 3,\n \"i\": \"a14e8796-9614-4204-b5b8-5d1a47f356d8\",\n \"w\": 12,\n \"x\": 12,\n \"y\": 21\n },\n \"name\": \"每秒回退给生产者的不可路由消息数\",\n \"options\": {\n \"legend\": {\n \"displayMode\": \"hidden\"\n },\n \"standardOptions\": {},\n \"thresholds\": {},\n \"tooltip\": {\n \"mode\": \"all\",\n \"sort\": \"none\"\n }\n },\n \"targets\": [\n {\n \"expr\": \"sum(rate(rabbitmq_channel_messages_unroutable_returned_total[60s]) * on(instance) group_left(rabbitmq_cluster, rabbitmq_node) rabbitmq_identity_info{rabbitmq_cluster=\\\"$rabbitmq_cluster\\\"}) by(rabbitmq_node)\",\n \"refId\": \"A\"\n }\n ],\n \"type\": \"timeseries\",\n \"version\": \"2.0.0\"\n },\n {\n \"collapsed\": true,\n \"id\": \"2405258c-c08f-4e49-960a-5c9a12b29f12\",\n \"layout\": {\n \"h\": 1,\n \"i\": \"2405258c-c08f-4e49-960a-5c9a12b29f12\",\n \"w\": 24,\n \"x\": 0,\n \"y\": 24\n },\n \"name\": \"OUTGOING MESSAGES\",\n \"type\": \"row\"\n },\n {\n \"custom\": {\n \"drawStyle\": \"lines\",\n \"fillOpacity\": 0.3,\n \"gradientMode\": \"opacity\",\n \"lineInterpolation\": \"smooth\",\n \"lineWidth\": 2,\n \"stack\": \"off\"\n },\n \"datasourceCate\": \"prometheus\",\n \"datasourceValue\": \"${prom}\",\n \"description\": \"表示消费者每秒成功接收的消息数量。此指标反映系统的实时吞吐量,若数值低于预期,可能因消费者处理能力不足、网络延迟或队列积压导致,需优化消费者性能或扩容。\",\n \"id\": \"be0f1872-172c-4bc3-a901-4b645ebf5abe\",\n \"layout\": {\n \"h\": 3,\n \"i\": \"be0f1872-172c-4bc3-a901-4b645ebf5abe\",\n \"w\": 12,\n \"x\": 0,\n \"y\": 25\n },\n \"name\": \"每秒投递的消息数\",\n \"options\": {\n \"legend\": {\n \"displayMode\": \"hidden\"\n },\n \"standardOptions\": {},\n \"thresholds\": {},\n \"tooltip\": {\n \"mode\": \"all\",\n \"sort\": \"none\"\n }\n },\n \"targets\": [\n {\n \"expr\": \"sum(\\n (rate(rabbitmq_channel_messages_delivered_total[60s]) * on(instance) group_left(rabbitmq_cluster, rabbitmq_node) rabbitmq_identity_info{rabbitmq_cluster=\\\"$rabbitmq_cluster\\\"}) +\\n (rate(rabbitmq_channel_messages_delivered_ack_total[60s]) * on(instance) group_left(rabbitmq_cluster, rabbitmq_node) rabbitmq_identity_info{rabbitmq_cluster=\\\"$rabbitmq_cluster\\\"})\\n) by(rabbitmq_node)\",\n \"refId\": \"A\"\n }\n ],\n \"type\": \"timeseries\",\n \"version\": \"2.0.0\"\n },\n {\n \"custom\": {\n \"drawStyle\": \"lines\",\n \"fillOpacity\": 0.3,\n \"gradientMode\": \"opacity\",\n \"lineInterpolation\": \"smooth\",\n \"lineWidth\": 2,\n \"stack\": \"off\"\n },\n \"datasourceCate\": \"prometheus\",\n \"datasourceValue\": \"${prom}\",\n \"description\": \"表示因消费者未确认(NACK或超时)而每秒重新投递到队列的消息数量。此指标反映消费者处理异常或性能瓶颈,高频重投递可能需优化消费者逻辑或调整超时参数。\",\n \"id\": \"eff794ca-e844-4a12-b230-690aadefa53f\",\n \"layout\": {\n \"h\": 3,\n \"i\": \"eff794ca-e844-4a12-b230-690aadefa53f\",\n \"w\": 12,\n \"x\": 12,\n \"y\": 25\n },\n \"name\": \"每秒重投递的消息数\",\n \"options\": {\n \"legend\": {\n \"displayMode\": \"hidden\"\n },\n \"standardOptions\": {},\n \"thresholds\": {},\n \"tooltip\": {\n \"mode\": \"all\",\n \"sort\": \"none\"\n }\n },\n \"targets\": [\n {\n \"expr\": \"sum(rate(rabbitmq_channel_messages_redelivered_total[60s]) * on(instance) group_left(rabbitmq_cluster, rabbitmq_node) rabbitmq_identity_info{rabbitmq_cluster=\\\"$rabbitmq_cluster\\\"}) by(rabbitmq_node)\",\n \"refId\": \"A\"\n }\n ],\n \"type\": \"timeseries\",\n \"version\": \"2.0.0\"\n },\n {\n \"custom\": {\n \"drawStyle\": \"lines\",\n \"fillOpacity\": 0.3,\n \"gradientMode\": \"opacity\",\n \"lineInterpolation\": \"smooth\",\n \"lineWidth\": 2,\n \"stack\": \"off\"\n },\n \"datasourceCate\": \"prometheus\",\n \"datasourceValue\": \"${prom}\",\n \"description\": \"示消费者在手动确认(manual acknowledgment)模式下每秒接收的消息数量。此指标反映消费者处理消息的效率,若数值偏低可能因业务逻辑复杂或确认延迟导致,需优化处理逻辑或调整确认策略。\",\n \"id\": \"2ed4be63-4fe9-462f-bc2f-967319bc3626\",\n \"layout\": {\n \"h\": 3,\n \"i\": \"2ed4be63-4fe9-462f-bc2f-967319bc3626\",\n \"w\": 12,\n \"x\": 0,\n \"y\": 26\n },\n \"name\": \"每秒手动确认投递的消息数\",\n \"options\": {\n \"legend\": {\n \"displayMode\": \"hidden\"\n },\n \"standardOptions\": {},\n \"thresholds\": {},\n \"tooltip\": {\n \"mode\": \"all\",\n \"sort\": \"none\"\n }\n },\n \"targets\": [\n {\n \"expr\": \"sum(rate(rabbitmq_channel_messages_delivered_ack_total[60s]) * on(instance) group_left(rabbitmq_cluster, rabbitmq_node) rabbitmq_identity_info{rabbitmq_cluster=\\\"$rabbitmq_cluster\\\"}) by(rabbitmq_node)\",\n \"refId\": \"A\"\n }\n ],\n \"type\": \"timeseries\",\n \"version\": \"2.0.0\"\n },\n {\n \"custom\": {\n \"drawStyle\": \"lines\",\n \"fillOpacity\": 0.3,\n \"gradientMode\": \"opacity\",\n \"lineInterpolation\": \"smooth\",\n \"lineWidth\": 2,\n \"stack\": \"off\"\n },\n \"datasourceCate\": \"prometheus\",\n \"datasourceValue\": \"${prom}\",\n \"description\": \"表示消费者在自动确认(auto acknowledgment)模式下每秒接收的消息数量。此指标反映系统在无需手动确认情况下的消息处理能力,若数值异常可能因消费者处理速度不足或消息积压导致,需关注消费者性能或调整并发设置。\",\n \"id\": \"116c44e0-c8e1-4f02-8eae-2140997e2280\",\n \"layout\": {\n \"h\": 3,\n \"i\": \"116c44e0-c8e1-4f02-8eae-2140997e2280\",\n \"w\": 12,\n \"x\": 12,\n \"y\": 26\n },\n \"name\": \"每秒自动确认投递的消息数\",\n \"options\": {\n \"legend\": {\n \"displayMode\": \"hidden\"\n },\n \"standardOptions\": {},\n \"thresholds\": {},\n \"tooltip\": {\n \"mode\": \"all\",\n \"sort\": \"none\"\n }\n },\n \"targets\": [\n {\n \"expr\": \"sum(rate(rabbitmq_channel_messages_delivered_total[60s]) * on(instance) group_left(rabbitmq_cluster, rabbitmq_node) rabbitmq_identity_info{rabbitmq_cluster=\\\"$rabbitmq_cluster\\\"}) by(rabbitmq_node)\",\n \"refId\": \"A\"\n }\n ],\n \"type\": \"timeseries\",\n \"version\": \"2.0.0\"\n },\n {\n \"custom\": {\n \"drawStyle\": \"lines\",\n \"fillOpacity\": 0.3,\n \"gradientMode\": \"opacity\",\n \"lineInterpolation\": \"smooth\",\n \"lineWidth\": 2,\n \"stack\": \"off\"\n },\n \"datasourceCate\": \"prometheus\",\n \"datasourceValue\": \"${prom}\",\n \"description\": \"表示消费者每秒成功确认(acknowledged)的消息数量。此指标反映消费者处理消息的完成效率,若数值偏低可能因业务处理延迟、网络问题或确认机制异常导致,需检查消费者性能或确认逻辑是否合理。\",\n \"id\": \"a1184534-3226-4c9a-ba6c-6d5258998518\",\n \"layout\": {\n \"h\": 3,\n \"i\": \"a1184534-3226-4c9a-ba6c-6d5258998518\",\n \"w\": 12,\n \"x\": 0,\n \"y\": 27\n },\n \"name\": \"每秒确认的消息数\",\n \"options\": {\n \"legend\": {\n \"displayMode\": \"hidden\"\n },\n \"standardOptions\": {},\n \"thresholds\": {},\n \"tooltip\": {\n \"mode\": \"all\",\n \"sort\": \"none\"\n }\n },\n \"targets\": [\n {\n \"expr\": \"sum(rate(rabbitmq_channel_messages_acked_total[60s]) * on(instance) group_left(rabbitmq_cluster, rabbitmq_node) rabbitmq_identity_info{rabbitmq_cluster=\\\"$rabbitmq_cluster\\\"}) by(rabbitmq_node)\",\n \"refId\": \"A\"\n }\n ],\n \"type\": \"timeseries\",\n \"version\": \"2.0.0\"\n },\n {\n \"custom\": {\n \"drawStyle\": \"lines\",\n \"fillOpacity\": 0.3,\n \"gradientMode\": \"opacity\",\n \"lineInterpolation\": \"smooth\",\n \"lineWidth\": 2,\n \"stack\": \"off\"\n },\n \"datasourceCate\": \"prometheus\",\n \"datasourceValue\": \"${prom}\",\n \"description\": \"表示消费者在自动确认(auto acknowledgment)模式下每秒执行的轮询(polling)操作次数。此指标反映消费者从队列获取消息的频率,若数值异常可能因消费者处理能力不足或网络延迟导致,需优化轮询间隔或提升消费者性能。\",\n \"id\": \"2f34e8c7-e7fb-4695-afce-034a10081437\",\n \"layout\": {\n \"h\": 3,\n \"i\": \"2f34e8c7-e7fb-4695-afce-034a10081437\",\n \"w\": 12,\n \"x\": 12,\n \"y\": 27\n },\n \"name\": \"每秒自动确认模式下的轮询操作数\",\n \"options\": {\n \"legend\": {\n \"displayMode\": \"hidden\"\n },\n \"standardOptions\": {},\n \"thresholds\": {},\n \"tooltip\": {\n \"mode\": \"all\",\n \"sort\": \"none\"\n }\n },\n \"targets\": [\n {\n \"expr\": \"sum(rate(rabbitmq_channel_get_total[60s]) * on(instance) group_left(rabbitmq_cluster, rabbitmq_node) rabbitmq_identity_info{rabbitmq_cluster=\\\"$rabbitmq_cluster\\\"}) by(rabbitmq_node)\",\n \"refId\": \"A\"\n }\n ],\n \"type\": \"timeseries\",\n \"version\": \"2.0.0\"\n },\n {\n \"custom\": {\n \"drawStyle\": \"lines\",\n \"fillOpacity\": 0.3,\n \"gradientMode\": \"opacity\",\n \"lineInterpolation\": \"smooth\",\n \"lineWidth\": 2,\n \"stack\": \"off\"\n },\n \"datasourceCate\": \"prometheus\",\n \"datasourceValue\": \"${prom}\",\n \"description\": \"表示消费者每秒执行轮询(polling)操作但未获取到任何消息的次数。此指标反映队列的空闲程度或消费者轮询效率,若数值过高可能因队列消息不足或轮询间隔不合理导致,需调整消费者轮询策略或检查生产者消息生成情况。\",\n \"id\": \"c7b1f4b8-5069-480f-a1f7-1c85dbc389c1\",\n \"layout\": {\n \"h\": 3,\n \"i\": \"c7b1f4b8-5069-480f-a1f7-1c85dbc389c1\",\n \"w\": 12,\n \"x\": 0,\n \"y\": 28\n },\n \"name\": \"每秒无结果的轮询操作数\",\n \"options\": {\n \"legend\": {\n \"displayMode\": \"hidden\"\n },\n \"standardOptions\": {},\n \"thresholds\": {},\n \"tooltip\": {\n \"mode\": \"all\",\n \"sort\": \"none\"\n }\n },\n \"targets\": [\n {\n \"expr\": \"sum(rate(rabbitmq_channel_get_empty_total[60s]) * on(instance) group_left(rabbitmq_cluster, rabbitmq_node) rabbitmq_identity_info{rabbitmq_cluster=\\\"$rabbitmq_cluster\\\"}) by(rabbitmq_node)\",\n \"refId\": \"A\"\n }\n ],\n \"type\": \"timeseries\",\n \"version\": \"2.0.0\"\n },\n {\n \"custom\": {\n \"drawStyle\": \"lines\",\n \"fillOpacity\": 0.3,\n \"gradientMode\": \"opacity\",\n \"lineInterpolation\": \"smooth\",\n \"lineWidth\": 2,\n \"stack\": \"off\"\n },\n \"datasourceCate\": \"prometheus\",\n \"datasourceValue\": \"${prom}\",\n \"description\": \"表示消费者在手动确认(manual acknowledgment)模式下每秒执行的轮询(polling)操作次数。此指标反映消费者从队列获取消息并需显式确认(ACK/NACK)的处理频率,若数值异常可能因消费者处理延迟或消息积压导致,需优化确认逻辑或调整并发处理能力。\",\n \"id\": \"4c2f60db-3cb4-4926-944c-022cf876eec2\",\n \"layout\": {\n \"h\": 3,\n \"i\": \"4c2f60db-3cb4-4926-944c-022cf876eec2\",\n \"w\": 12,\n \"x\": 12,\n \"y\": 28\n },\n \"name\": \"每秒手动确认模式下的轮询操作数\",\n \"options\": {\n \"legend\": {\n \"displayMode\": \"hidden\"\n },\n \"standardOptions\": {},\n \"thresholds\": {},\n \"tooltip\": {\n \"mode\": \"all\",\n \"sort\": \"none\"\n }\n },\n \"targets\": [\n {\n \"expr\": \"sum(rate(rabbitmq_channel_get_ack_total[60s]) * on(instance) group_left(rabbitmq_cluster, rabbitmq_node) rabbitmq_identity_info{rabbitmq_cluster=\\\"$rabbitmq_cluster\\\"}) by(rabbitmq_node)\",\n \"refId\": \"A\"\n }\n ],\n \"type\": \"timeseries\",\n \"version\": \"2.0.0\"\n },\n {\n \"collapsed\": true,\n \"id\": \"b6aa6f06-924f-4575-b4e0-d116ab744ea1\",\n \"layout\": {\n \"h\": 1,\n \"i\": \"b6aa6f06-924f-4575-b4e0-d116ab744ea1\",\n \"w\": 24,\n \"x\": 0,\n \"y\": 31\n },\n \"name\": \"QUEUES\",\n \"type\": \"row\"\n },\n {\n \"custom\": {\n \"drawStyle\": \"lines\",\n \"fillOpacity\": 0.3,\n \"gradientMode\": \"opacity\",\n \"lineInterpolation\": \"smooth\",\n \"lineWidth\": 2,\n \"stack\": \"off\"\n },\n \"datasourceCate\": \"prometheus\",\n \"datasourceValue\": \"${prom}\",\n \"description\": \"表示当前 RabbitMQ 集群或节点上存在的队列总数量。此指标反映系统整体负载和资源占用情况,若数值过高可能增加管理复杂度或影响性能,需结合队列消息数、消费者数量等指标评估是否需要合并或清理闲置队列。\",\n \"id\": \"c26434ca-065f-4088-81c6-ef8f0cbca552\",\n \"layout\": {\n \"h\": 3,\n \"i\": \"c26434ca-065f-4088-81c6-ef8f0cbca552\",\n \"w\": 12,\n \"x\": 0,\n \"y\": 32\n },\n \"name\": \"队列总数\",\n \"options\": {\n \"legend\": {\n \"displayMode\": \"hidden\"\n },\n \"standardOptions\": {},\n \"thresholds\": {},\n \"tooltip\": {\n \"mode\": \"all\",\n \"sort\": \"none\"\n }\n },\n \"targets\": [\n {\n \"expr\": \"rabbitmq_queues * on(instance) group_left(rabbitmq_cluster, rabbitmq_node) rabbitmq_identity_info{rabbitmq_cluster=\\\"$rabbitmq_cluster\\\"}\",\n \"refId\": \"A\"\n }\n ],\n \"type\": \"timeseries\",\n \"version\": \"2.0.0\"\n },\n {\n \"custom\": {\n \"drawStyle\": \"lines\",\n \"fillOpacity\": 0,\n \"lineInterpolation\": \"smooth\",\n \"stack\": \"off\"\n },\n \"datasourceCate\": \"prometheus\",\n \"datasourceValue\": \"${prom}\",\n \"description\": \"表示每秒在 RabbitMQ 上创建(声明)的新队列数量。此指标反映应用程序动态管理队列的活跃程度,若数值过高可能因频繁创建/删除队列导致资源开销增加,需检查是否存在不必要的临时队列或优化队列生命周期管理。\",\n \"id\": \"ff021951-7991-4c3e-a667-8cd11e5c444c\",\n \"layout\": {\n \"h\": 3,\n \"i\": \"ff021951-7991-4c3e-a667-8cd11e5c444c\",\n \"w\": 4,\n \"x\": 12,\n \"y\": 32\n },\n \"name\": \"每秒队列声明数\",\n \"options\": {\n \"legend\": {\n \"displayMode\": \"hidden\"\n },\n \"standardOptions\": {},\n \"thresholds\": {},\n \"tooltip\": {\n \"mode\": \"all\",\n \"sort\": \"none\"\n }\n },\n \"targets\": [\n {\n \"expr\": \"sum(rate(rabbitmq_queues_declared_total[60s]) * on(instance) group_left(rabbitmq_cluster, rabbitmq_node) rabbitmq_identity_info{rabbitmq_cluster=\\\"$rabbitmq_cluster\\\"}) by(rabbitmq_node)\",\n \"refId\": \"A\"\n }\n ],\n \"type\": \"timeseries\",\n \"version\": \"2.0.0\"\n },\n {\n \"custom\": {\n \"drawStyle\": \"lines\",\n \"fillOpacity\": 0,\n \"lineInterpolation\": \"smooth\",\n \"stack\": \"off\"\n },\n \"datasourceCate\": \"prometheus\",\n \"datasourceValue\": \"${prom}\",\n \"description\": \"表示每秒在 RabbitMQ 中新创建的队列数量。此指标反映系统处理新队列请求的频率,数值异常高可能表明应用程序存在频繁创建队列的行为,需结合业务逻辑判断是否合理,避免因过多队列导致资源浪费或性能下降。\",\n \"id\": \"00bbb4fc-5cdf-4b29-a440-ff4da4325a0c\",\n \"layout\": {\n \"h\": 3,\n \"i\": \"00bbb4fc-5cdf-4b29-a440-ff4da4325a0c\",\n \"w\": 4,\n \"x\": 16,\n \"y\": 32\n },\n \"name\": \"每秒队列创建数\",\n \"options\": {\n \"legend\": {\n \"displayMode\": \"hidden\"\n },\n \"standardOptions\": {},\n \"thresholds\": {},\n \"tooltip\": {\n \"mode\": \"all\",\n \"sort\": \"none\"\n }\n },\n \"targets\": [\n {\n \"expr\": \"sum(rate(rabbitmq_queues_created_total[60s]) * on(instance) group_left(rabbitmq_cluster, rabbitmq_node) rabbitmq_identity_info{rabbitmq_cluster=\\\"$rabbitmq_cluster\\\"}) by(rabbitmq_node)\",\n \"refId\": \"A\"\n }\n ],\n \"type\": \"timeseries\",\n \"version\": \"2.0.0\"\n },\n {\n \"custom\": {\n \"drawStyle\": \"lines\",\n \"fillOpacity\": 0,\n \"lineInterpolation\": \"smooth\",\n \"stack\": \"off\"\n },\n \"datasourceCate\": \"prometheus\",\n \"datasourceValue\": \"${prom}\",\n \"description\": \"表示每秒在 RabbitMQ 中被删除的队列数量。此指标反映系统清理或回收队列资源的频率。若数值异常高,可能表明应用程序存在频繁创建后立即删除队列的行为,需检查是否存在资源管理不当或临时队列滥用的情况,以避免不必要的性能开销。\",\n \"id\": \"f802e41d-14fe-4193-a5cf-c31957b146f7\",\n \"layout\": {\n \"h\": 3,\n \"i\": \"f802e41d-14fe-4193-a5cf-c31957b146f7\",\n \"w\": 4,\n \"x\": 20,\n \"y\": 32\n },\n \"name\": \"每秒队列删除数\",\n \"options\": {\n \"legend\": {\n \"displayMode\": \"hidden\"\n },\n \"standardOptions\": {},\n \"thresholds\": {},\n \"tooltip\": {\n \"mode\": \"all\",\n \"sort\": \"none\"\n }\n },\n \"targets\": [\n {\n \"expr\": \"sum(rate(rabbitmq_queues_deleted_total[60s]) * on(instance) group_left(rabbitmq_cluster, rabbitmq_node) rabbitmq_identity_info{rabbitmq_cluster=\\\"$rabbitmq_cluster\\\"}) by(rabbitmq_node)\",\n \"refId\": \"A\"\n }\n ],\n \"type\": \"timeseries\",\n \"version\": \"2.0.0\"\n },\n {\n \"collapsed\": true,\n \"id\": \"5c7acadf-f9ff-4db9-a284-a206be245733\",\n \"layout\": {\n \"h\": 1,\n \"i\": \"5c7acadf-f9ff-4db9-a284-a206be245733\",\n \"w\": 24,\n \"x\": 0,\n \"y\": 35\n },\n \"name\": \"CHANNELS\",\n \"type\": \"row\"\n },\n {\n \"custom\": {\n \"drawStyle\": \"lines\",\n \"fillOpacity\": 0.3,\n \"gradientMode\": \"opacity\",\n \"lineInterpolation\": \"smooth\",\n \"lineWidth\": 2,\n \"stack\": \"off\"\n },\n \"datasourceCate\": \"prometheus\",\n \"datasourceValue\": \"${prom}\",\n \"description\": \"表示当前 RabbitMQ 中所有活跃的 AMQP 通道数量。通道是客户端与服务器通信的轻量级连接,每个连接可以包含多个通道。此指标反映系统当前的并发通信负载,数值过高可能增加服务器资源消耗,需结合连接数监控以避免性能瓶颈或内存泄漏问题。\",\n \"id\": \"362c622f-3fd8-4bdd-8dce-7ebf335f42f9\",\n \"layout\": {\n \"h\": 3,\n \"i\": \"362c622f-3fd8-4bdd-8dce-7ebf335f42f9\",\n \"w\": 12,\n \"x\": 0,\n \"y\": 36\n },\n \"name\": \"通道总数\",\n \"options\": {\n \"legend\": {\n \"displayMode\": \"hidden\"\n },\n \"standardOptions\": {},\n \"thresholds\": {},\n \"tooltip\": {\n \"mode\": \"all\",\n \"sort\": \"none\"\n }\n },\n \"targets\": [\n {\n \"expr\": \"rabbitmq_channels * on(instance) group_left(rabbitmq_cluster, rabbitmq_node) rabbitmq_identity_info{rabbitmq_cluster=\\\"$rabbitmq_cluster\\\"}\",\n \"refId\": \"A\"\n }\n ],\n \"type\": \"timeseries\",\n \"version\": \"2.0.0\"\n },\n {\n \"custom\": {\n \"drawStyle\": \"lines\",\n \"fillOpacity\": 0,\n \"lineInterpolation\": \"smooth\",\n \"stack\": \"off\"\n },\n \"datasourceCate\": \"prometheus\",\n \"datasourceValue\": \"${prom}\",\n \"description\": \"表示每秒在 RabbitMQ 中新创建的 AMQP 通道数量。通道用于客户端与服务器之间的高效通信,但过多频繁创建可能导致资源消耗增加。若此指标异常升高,可能表明应用程序存在短生命周期通道滥用或连接管理不当,需优化以避免性能下降或内存压力。\",\n \"id\": \"3a1a643b-8e2a-4ed1-8621-e5fae3ebc7c2\",\n \"layout\": {\n \"h\": 3,\n \"i\": \"3a1a643b-8e2a-4ed1-8621-e5fae3ebc7c2\",\n \"w\": 6,\n \"x\": 12,\n \"y\": 36\n },\n \"name\": \"每秒通道创建数\",\n \"options\": {\n \"legend\": {\n \"displayMode\": \"hidden\"\n },\n \"standardOptions\": {},\n \"thresholds\": {},\n \"tooltip\": {\n \"mode\": \"all\",\n \"sort\": \"none\"\n }\n },\n \"targets\": [\n {\n \"expr\": \"sum(rate(rabbitmq_channels_opened_total[60s]) * on(instance) group_left(rabbitmq_cluster, rabbitmq_node) rabbitmq_identity_info{rabbitmq_cluster=\\\"$rabbitmq_cluster\\\"}) by(rabbitmq_node)\",\n \"refId\": \"A\"\n }\n ],\n \"type\": \"timeseries\",\n \"version\": \"2.0.0\"\n },\n {\n \"custom\": {\n \"drawStyle\": \"lines\",\n \"fillOpacity\": 0,\n \"lineInterpolation\": \"smooth\",\n \"stack\": \"off\"\n },\n \"datasourceCate\": \"prometheus\",\n \"datasourceValue\": \"${prom}\",\n \"description\": \"表示每秒在 RabbitMQ 中被关闭的 AMQP 通道数量。通道关闭是正常通信结束或异常中断的结果。若此指标与通道创建速率(Channels opened/s)长期不匹配,可能反映连接泄漏、客户端未正确释放资源或频繁重连问题,需结合错误日志排查潜在隐患。\",\n \"id\": \"01f1771a-dd54-45e5-aa1d-b6ee2111c53b\",\n \"layout\": {\n \"h\": 3,\n \"i\": \"01f1771a-dd54-45e5-aa1d-b6ee2111c53b\",\n \"w\": 6,\n \"x\": 18,\n \"y\": 36\n },\n \"name\": \"每秒通道关闭数\",\n \"options\": {\n \"legend\": {\n \"displayMode\": \"hidden\"\n },\n \"standardOptions\": {},\n \"thresholds\": {},\n \"tooltip\": {\n \"mode\": \"all\",\n \"sort\": \"none\"\n }\n },\n \"targets\": [\n {\n \"expr\": \"sum(rate(rabbitmq_channels_closed_total[60s]) * on(instance) group_left(rabbitmq_cluster, rabbitmq_node) rabbitmq_identity_info{rabbitmq_cluster=\\\"$rabbitmq_cluster\\\"}) by(rabbitmq_node)\",\n \"refId\": \"A\"\n }\n ],\n \"type\": \"timeseries\",\n \"version\": \"2.0.0\"\n },\n {\n \"collapsed\": true,\n \"id\": \"419f22e8-08cc-4d91-8bc9-7c1055368146\",\n \"layout\": {\n \"h\": 1,\n \"i\": \"419f22e8-08cc-4d91-8bc9-7c1055368146\",\n \"w\": 24,\n \"x\": 0,\n \"y\": 39\n },\n \"name\": \"CONNECTIONS\",\n \"type\": \"row\"\n },\n {\n \"custom\": {\n \"drawStyle\": \"lines\",\n \"fillOpacity\": 0,\n \"lineInterpolation\": \"smooth\",\n \"stack\": \"off\"\n },\n \"datasourceCate\": \"prometheus\",\n \"datasourceValue\": \"${prom}\",\n \"description\": \"表示每秒在 RabbitMQ 中被关闭的客户端连接数量。连接关闭可能是正常终止(如客户端主动断开)或异常中断(如网络问题、心跳超时)。若此指标突增或与连接创建速率(Connections opened/s)不匹配,可能表明客户端存在异常重连、资源未释放或服务端主动断开(如流量限制、认证失败等),需结合日志分析具体原因。\",\n \"id\": \"c14fd6f4-d3de-4811-82c6-2b20c9146e89\",\n \"layout\": {\n \"h\": 3,\n \"i\": \"c14fd6f4-d3de-4811-82c6-2b20c9146e89\",\n \"w\": 6,\n \"x\": 18,\n \"y\": 40\n },\n \"name\": \"每秒连接关闭数\",\n \"options\": {\n \"legend\": {\n \"displayMode\": \"hidden\"\n },\n \"standardOptions\": {},\n \"thresholds\": {},\n \"tooltip\": {\n \"mode\": \"all\",\n \"sort\": \"none\"\n }\n },\n \"targets\": [\n {\n \"expr\": \"sum(rate(rabbitmq_connections_closed_total[60s]) * on(instance) group_left(rabbitmq_cluster, rabbitmq_node) rabbitmq_identity_info{rabbitmq_cluster=\\\"$rabbitmq_cluster\\\"}) by(rabbitmq_node)\",\n \"refId\": \"A\"\n }\n ],\n \"type\": \"timeseries\",\n \"version\": \"2.0.0\"\n },\n {\n \"custom\": {\n \"drawStyle\": \"lines\",\n \"fillOpacity\": 0.3,\n \"gradientMode\": \"opacity\",\n \"lineInterpolation\": \"smooth\",\n \"lineWidth\": 2,\n \"stack\": \"off\"\n },\n \"datasourceCate\": \"prometheus\",\n \"datasourceValue\": \"${prom}\",\n \"description\": \"表示 RabbitMQ 当前维护的所有客户端 TCP 连接数量。该指标直接反映系统负载和资源占用情况。若数值异常高(接近系统限制),可能导致文件描述符耗尽、内存压力增大或性能下降,需检查客户端连接池配置或是否存在连接泄漏问题。正常情况下应与业务流量趋势一致。\",\n \"id\": \"1d06679b-c603-4cbf-85a7-7c8f4594258f\",\n \"layout\": {\n \"h\": 3,\n \"i\": \"1d06679b-c603-4cbf-85a7-7c8f4594258f\",\n \"w\": 12,\n \"x\": 0,\n \"y\": 40\n },\n \"name\": \"当前活跃连接总数\",\n \"options\": {\n \"legend\": {\n \"displayMode\": \"hidden\"\n },\n \"standardOptions\": {},\n \"thresholds\": {},\n \"tooltip\": {\n \"mode\": \"all\",\n \"sort\": \"none\"\n }\n },\n \"targets\": [\n {\n \"expr\": \"rabbitmq_connections * on(instance) group_left(rabbitmq_cluster, rabbitmq_node) rabbitmq_identity_info{rabbitmq_cluster=\\\"$rabbitmq_cluster\\\"}\",\n \"refId\": \"A\"\n }\n ],\n \"type\": \"timeseries\",\n \"version\": \"2.0.0\"\n },\n {\n \"custom\": {\n \"drawStyle\": \"lines\",\n \"fillOpacity\": 0,\n \"lineInterpolation\": \"smooth\",\n \"stack\": \"off\"\n },\n \"datasourceCate\": \"prometheus\",\n \"datasourceValue\": \"${prom}\",\n \"description\": \"表示每秒在 RabbitMQ 中新建立的客户端连接数量。该指标反映客户端连接请求的活跃程度。若数值突增,可能因客户端频繁重连(如配置错误、网络抖动)或突发流量导致,需结合连接关闭速率(Connections closed/s)分析是否存在异常短连接。长期过高可能增加服务端负载,需优化客户端连接复用策略。\",\n \"id\": \"8c91f7fe-79e9-454a-9dd3-6f214a29e1eb\",\n \"layout\": {\n \"h\": 3,\n \"i\": \"8c91f7fe-79e9-454a-9dd3-6f214a29e1eb\",\n \"w\": 6,\n \"x\": 12,\n \"y\": 40\n },\n \"name\": \"每秒新建连接数\",\n \"options\": {\n \"legend\": {\n \"displayMode\": \"hidden\"\n },\n \"standardOptions\": {},\n \"thresholds\": {},\n \"tooltip\": {\n \"mode\": \"all\",\n \"sort\": \"none\"\n }\n },\n \"targets\": [\n {\n \"expr\": \"sum(rate(rabbitmq_connections_opened_total[60s]) * on(instance) group_left(rabbitmq_cluster, rabbitmq_node) rabbitmq_identity_info{rabbitmq_cluster=\\\"$rabbitmq_cluster\\\"}) by(rabbitmq_node)\",\n \"refId\": \"A\"\n }\n ],\n \"type\": \"timeseries\",\n \"version\": \"2.0.0\"\n }\n ],\n \"var\": [\n {\n \"name\": \"prom\",\n \"type\": \"datasource\",\n \"hide\": false,\n \"definition\": \"prometheus\",\n \"defaultValue\": 1\n },\n {\n \"datasource\": {\n \"cate\": \"prometheus\",\n \"value\": \"${prom}\"\n },\n \"definition\": \"label_values(rabbitmq_identity_info, rabbitmq_cluster)\",\n \"name\": \"rabbitmq_cluster\",\n \"type\": \"query\"\n }\n ],\n \"version\": \"3.0.0\",\n \"graphTooltip\": \"sharedCrosshair\"\n },\n \"public\": 0,\n \"public_cate\": 0,\n \"bgids\": null,\n \"built_in\": 0,\n \"hide\": 0,\n \"uuid\": 1717556328326911000\n}\n"
},
{
"path": "integrations/RabbitMQ/dashboards/rabbitmq_by_categraf.json",
"content": "{\n \"id\": 0,\n \"group_id\": 0,\n \"name\": \"RabbitMQ 3.8\",\n \"ident\": \"\",\n \"tags\": \"\",\n \"create_at\": 0,\n \"create_by\": \"\",\n \"update_at\": 0,\n \"update_by\": \"\",\n \"configs\": {\n \"panels\": [\n {\n \"collapsed\": true,\n \"id\": \"4466a232-248d-45a8-bf4d-05d5139c7346\",\n \"layout\": {\n \"h\": 1,\n \"i\": \"4466a232-248d-45a8-bf4d-05d5139c7346\",\n \"w\": 24,\n \"x\": 0,\n \"y\": 0\n },\n \"name\": \"Overview\",\n \"type\": \"row\"\n },\n {\n \"custom\": {\n \"calc\": \"lastNotNull\",\n \"colSpan\": 1,\n \"colorMode\": \"background\",\n \"textMode\": \"valueAndName\",\n \"textSize\": {}\n },\n \"datasourceCate\": \"prometheus\",\n \"datasourceValue\": \"${prom}\",\n \"id\": \"a20b5d06-4343-457a-89f2-33a52c4dec04\",\n \"layout\": {\n \"h\": 3,\n \"i\": \"a20b5d06-4343-457a-89f2-33a52c4dec04\",\n \"w\": 7,\n \"x\": 0,\n \"y\": 1\n },\n \"name\": \"Ready messages\",\n \"options\": {\n \"standardOptions\": {},\n \"valueMappings\": [\n {\n \"match\": {\n \"from\": 10000\n },\n \"result\": {\n \"color\": \"#4a90e2\"\n },\n \"type\": \"range\"\n },\n {\n \"match\": {\n \"from\": 100000\n },\n \"result\": {\n \"color\": \"#f50a0a\"\n },\n \"type\": \"range\"\n },\n {\n \"match\": {\n \"to\": 9999\n },\n \"result\": {\n \"color\": \"#417505\"\n },\n \"type\": \"range\"\n }\n ]\n },\n \"targets\": [\n {\n \"expr\": \"sum(rabbitmq_queue_messages_ready * on(instance) group_left(rabbitmq_cluster) rabbitmq_identity_info{rabbitmq_cluster=\\\"$rabbitmq_cluster\\\"})\",\n \"refId\": \"A\"\n }\n ],\n \"type\": \"stat\",\n \"version\": \"2.0.0\"\n },\n {\n \"custom\": {\n \"calc\": \"lastNotNull\",\n \"colSpan\": 1,\n \"colorMode\": \"background\",\n \"textMode\": \"valueAndName\",\n \"textSize\": {}\n },\n \"datasourceCate\": \"prometheus\",\n \"datasourceValue\": \"${prom}\",\n \"id\": \"893409b0-4ca0-450b-a0c9-f48eddf0e243\",\n \"layout\": {\n \"h\": 3,\n \"i\": \"893409b0-4ca0-450b-a0c9-f48eddf0e243\",\n \"w\": 5,\n \"x\": 7,\n \"y\": 1\n },\n \"name\": \"Incoming messages / s\",\n \"options\": {\n \"standardOptions\": {},\n \"valueMappings\": [\n {\n \"match\": {\n \"from\": 50\n },\n \"result\": {\n \"color\": \"#417505\"\n },\n \"type\": \"range\"\n }\n ]\n },\n \"targets\": [\n {\n \"expr\": \"sum(rate(rabbitmq_channel_messages_published_total[60s]) * on(instance) group_left(rabbitmq_cluster) rabbitmq_identity_info{rabbitmq_cluster=\\\"$rabbitmq_cluster\\\"})\",\n \"refId\": \"A\"\n }\n ],\n \"type\": \"stat\",\n \"version\": \"2.0.0\"\n },\n {\n \"custom\": {\n \"calc\": \"lastNotNull\",\n \"colSpan\": 1,\n \"colorMode\": \"background\",\n \"textMode\": \"valueAndName\",\n \"textSize\": {}\n },\n \"datasourceCate\": \"prometheus\",\n \"datasourceValue\": \"${prom}\",\n \"id\": \"d596e7f0-5095-420e-bc38-674001dcf5f4\",\n \"layout\": {\n \"h\": 3,\n \"i\": \"d596e7f0-5095-420e-bc38-674001dcf5f4\",\n \"w\": 4,\n \"x\": 12,\n \"y\": 1\n },\n \"name\": \"Publishers\",\n \"options\": {\n \"standardOptions\": {},\n \"valueMappings\": [\n {\n \"match\": {\n \"from\": 10\n },\n \"result\": {\n \"color\": \"#417505\"\n },\n \"type\": \"range\"\n }\n ]\n },\n \"targets\": [\n {\n \"expr\": \"sum(rabbitmq_channels * on(instance) group_left(rabbitmq_cluster) rabbitmq_identity_info{rabbitmq_cluster=\\\"$rabbitmq_cluster\\\"}) - sum(rabbitmq_channel_consumers * on(instance) group_left(rabbitmq_cluster) rabbitmq_identity_info{rabbitmq_cluster=\\\"$rabbitmq_cluster\\\"})\",\n \"refId\": \"A\"\n }\n ],\n \"type\": \"stat\",\n \"version\": \"2.0.0\"\n },\n {\n \"custom\": {\n \"calc\": \"lastNotNull\",\n \"colSpan\": 1,\n \"colorMode\": \"background\",\n \"textMode\": \"valueAndName\",\n \"textSize\": {}\n },\n \"datasourceCate\": \"prometheus\",\n \"datasourceValue\": \"${prom}\",\n \"id\": \"9f6d7dee-666d-4e1b-90d0-129b2e5ba085\",\n \"layout\": {\n \"h\": 3,\n \"i\": \"9f6d7dee-666d-4e1b-90d0-129b2e5ba085\",\n \"w\": 4,\n \"x\": 16,\n \"y\": 1\n },\n \"name\": \"Connections\",\n \"options\": {\n \"standardOptions\": {},\n \"valueMappings\": [\n {\n \"match\": {\n \"from\": 10\n },\n \"result\": {\n \"color\": \"#417505\"\n },\n \"type\": \"range\"\n }\n ]\n },\n \"targets\": [\n {\n \"expr\": \"sum(rabbitmq_connections * on(instance) group_left(rabbitmq_cluster) rabbitmq_identity_info{rabbitmq_cluster=\\\"$rabbitmq_cluster\\\"})\",\n \"refId\": \"A\"\n }\n ],\n \"type\": \"stat\",\n \"version\": \"2.0.0\"\n },\n {\n \"custom\": {\n \"calc\": \"lastNotNull\",\n \"colSpan\": 1,\n \"colorMode\": \"background\",\n \"textMode\": \"valueAndName\",\n \"textSize\": {}\n },\n \"datasourceCate\": \"prometheus\",\n \"datasourceValue\": \"${prom}\",\n \"id\": \"910eae0f-2b78-4d10-a780-8f997f6e96cb\",\n \"layout\": {\n \"h\": 3,\n \"i\": \"910eae0f-2b78-4d10-a780-8f997f6e96cb\",\n \"w\": 4,\n \"x\": 20,\n \"y\": 1\n },\n \"name\": \"Queues\",\n \"options\": {\n \"standardOptions\": {},\n \"valueMappings\": [\n {\n \"match\": {\n \"from\": 10\n },\n \"result\": {\n \"color\": \"#417505\"\n },\n \"type\": \"range\"\n }\n ]\n },\n \"targets\": [\n {\n \"expr\": \"sum(rabbitmq_queues * on(instance) group_left(rabbitmq_cluster) rabbitmq_identity_info{rabbitmq_cluster=\\\"$rabbitmq_cluster\\\"})\",\n \"refId\": \"A\"\n }\n ],\n \"type\": \"stat\",\n \"version\": \"2.0.0\"\n },\n {\n \"custom\": {\n \"calc\": \"lastNotNull\",\n \"colSpan\": 1,\n \"colorMode\": \"background\",\n \"textMode\": \"valueAndName\",\n \"textSize\": {}\n },\n \"datasourceCate\": \"prometheus\",\n \"datasourceValue\": \"${prom}\",\n \"id\": \"2e8cd60f-51b0-46b2-8c0f-bf55604d340d\",\n \"layout\": {\n \"h\": 3,\n \"i\": \"2e8cd60f-51b0-46b2-8c0f-bf55604d340d\",\n \"w\": 7,\n \"x\": 0,\n \"y\": 2\n },\n \"name\": \"Unacknowledged messages\",\n \"options\": {\n \"standardOptions\": {},\n \"valueMappings\": [\n {\n \"match\": {\n \"to\": 99\n },\n \"result\": {\n \"color\": \"#417505\"\n },\n \"type\": \"range\"\n },\n {\n \"match\": {\n \"from\": 100\n },\n \"result\": {\n \"color\": \"#4a90e2\"\n },\n \"type\": \"range\"\n },\n {\n \"match\": {\n \"from\": 500\n },\n \"result\": {\n \"color\": \"#d0021b\"\n },\n \"type\": \"range\"\n }\n ]\n },\n \"targets\": [\n {\n \"expr\": \"sum(rabbitmq_queue_messages_unacked * on(instance) group_left(rabbitmq_cluster) rabbitmq_identity_info{rabbitmq_cluster=\\\"$rabbitmq_cluster\\\"})\",\n \"refId\": \"A\"\n }\n ],\n \"type\": \"stat\",\n \"version\": \"2.0.0\"\n },\n {\n \"custom\": {\n \"calc\": \"lastNotNull\",\n \"colSpan\": 1,\n \"colorMode\": \"background\",\n \"textMode\": \"valueAndName\",\n \"textSize\": {}\n },\n \"datasourceCate\": \"prometheus\",\n \"datasourceValue\": \"${prom}\",\n \"id\": \"4b242c1e-85d5-48b3-8cce-b467209245ec\",\n \"layout\": {\n \"h\": 3,\n \"i\": \"4b242c1e-85d5-48b3-8cce-b467209245ec\",\n \"w\": 5,\n \"x\": 7,\n \"y\": 2\n },\n \"name\": \"Outgoing messages / s\",\n \"options\": {\n \"standardOptions\": {},\n \"valueMappings\": [\n {\n \"match\": {\n \"from\": 50\n },\n \"result\": {\n \"color\": \"#417505\"\n },\n \"type\": \"range\"\n }\n ]\n },\n \"targets\": [\n {\n \"expr\": \"sum(rate(rabbitmq_channel_messages_redelivered_total[60s]) * on(instance) group_left(rabbitmq_cluster) rabbitmq_identity_info{rabbitmq_cluster=\\\"$rabbitmq_cluster\\\"}) +\\nsum(rate(rabbitmq_channel_messages_delivered_total[60s]) * on(instance) group_left(rabbitmq_cluster) rabbitmq_identity_info{rabbitmq_cluster=\\\"$rabbitmq_cluster\\\"}) +\\nsum(rate(rabbitmq_channel_messages_delivered_ack_total[60s]) * on(instance) group_left(rabbitmq_cluster) rabbitmq_identity_info{rabbitmq_cluster=\\\"$rabbitmq_cluster\\\"}) +\\nsum(rate(rabbitmq_channel_get_total[60s]) * on(instance) group_left(rabbitmq_cluster) rabbitmq_identity_info{rabbitmq_cluster=\\\"$rabbitmq_cluster\\\"}) +\\nsum(rate(rabbitmq_channel_get_ack_total[60s]) * on(instance) group_left(rabbitmq_cluster) rabbitmq_identity_info{rabbitmq_cluster=\\\"$rabbitmq_cluster\\\"})\",\n \"refId\": \"A\"\n }\n ],\n \"type\": \"stat\",\n \"version\": \"2.0.0\"\n },\n {\n \"custom\": {\n \"calc\": \"lastNotNull\",\n \"colSpan\": 1,\n \"colorMode\": \"background\",\n \"textMode\": \"valueAndName\",\n \"textSize\": {}\n },\n \"datasourceCate\": \"prometheus\",\n \"datasourceValue\": \"${prom}\",\n \"id\": \"b87b1c6b-644a-42f4-915a-bd6857540f70\",\n \"layout\": {\n \"h\": 3,\n \"i\": \"b87b1c6b-644a-42f4-915a-bd6857540f70\",\n \"w\": 4,\n \"x\": 12,\n \"y\": 2\n },\n \"name\": \"Consumers\",\n \"options\": {\n \"standardOptions\": {},\n \"valueMappings\": [\n {\n \"match\": {\n \"from\": 10\n },\n \"result\": {\n \"color\": \"#417505\"\n },\n \"type\": \"range\"\n }\n ]\n },\n \"targets\": [\n {\n \"expr\": \"sum(rabbitmq_channel_consumers * on(instance) group_left(rabbitmq_cluster) rabbitmq_identity_info{rabbitmq_cluster=\\\"$rabbitmq_cluster\\\"})\",\n \"refId\": \"A\"\n }\n ],\n \"type\": \"stat\",\n \"version\": \"2.0.0\"\n },\n {\n \"custom\": {\n \"calc\": \"lastNotNull\",\n \"colSpan\": 1,\n \"colorMode\": \"background\",\n \"textMode\": \"valueAndName\",\n \"textSize\": {}\n },\n \"datasourceCate\": \"prometheus\",\n \"datasourceValue\": \"${prom}\",\n \"id\": \"65103bcf-fb21-488d-a06b-7b0ea130ca4d\",\n \"layout\": {\n \"h\": 3,\n \"i\": \"65103bcf-fb21-488d-a06b-7b0ea130ca4d\",\n \"w\": 4,\n \"x\": 16,\n \"y\": 2\n },\n \"name\": \"Channels\",\n \"options\": {\n \"standardOptions\": {},\n \"valueMappings\": [\n {\n \"match\": {\n \"from\": 10\n },\n \"result\": {\n \"color\": \"#417505\"\n },\n \"type\": \"range\"\n }\n ]\n },\n \"targets\": [\n {\n \"expr\": \"sum(rabbitmq_channels * on(instance) group_left(rabbitmq_cluster) rabbitmq_identity_info{rabbitmq_cluster=\\\"$rabbitmq_cluster\\\"})\",\n \"refId\": \"A\"\n }\n ],\n \"type\": \"stat\",\n \"version\": \"2.0.0\"\n },\n {\n \"custom\": {\n \"calc\": \"lastNotNull\",\n \"colSpan\": 1,\n \"colorMode\": \"background\",\n \"textMode\": \"valueAndName\",\n \"textSize\": {}\n },\n \"datasourceCate\": \"prometheus\",\n \"datasourceValue\": \"${prom}\",\n \"id\": \"c6454712-e265-4387-ae86-9ac865af46f2\",\n \"layout\": {\n \"h\": 3,\n \"i\": \"c6454712-e265-4387-ae86-9ac865af46f2\",\n \"w\": 4,\n \"x\": 20,\n \"y\": 2\n },\n \"name\": \"Nodes\",\n \"options\": {\n \"standardOptions\": {},\n \"valueMappings\": [\n {\n \"match\": {\n \"from\": 3,\n \"to\": null\n },\n \"result\": {\n \"color\": \"#417505\"\n },\n \"type\": \"range\"\n },\n {\n \"match\": {\n \"from\": 8\n },\n \"result\": {\n \"color\": \"#e70909\"\n },\n \"type\": \"range\"\n }\n ]\n },\n \"targets\": [\n {\n \"expr\": \"sum(rabbitmq_build_info * on(instance) group_left(rabbitmq_cluster) rabbitmq_identity_info{rabbitmq_cluster=\\\"$rabbitmq_cluster\\\"})\",\n \"refId\": \"A\"\n }\n ],\n \"type\": \"stat\",\n \"version\": \"2.0.0\"\n },\n {\n \"collapsed\": true,\n \"id\": \"1712a96f-bcde-4d33-90b6-e2eba20527b9\",\n \"layout\": {\n \"h\": 1,\n \"i\": \"1712a96f-bcde-4d33-90b6-e2eba20527b9\",\n \"w\": 24,\n \"x\": 0,\n \"y\": 5\n },\n \"name\": \"Nodes\",\n \"type\": \"row\"\n },\n {\n \"custom\": {\n \"calc\": \"lastNotNull\",\n \"columns\": [\n \"rabbitmq_cluster\",\n \"rabbitmq_node\",\n \"rabbitmq_version\",\n \"erlang_version\"\n ],\n \"displayMode\": \"labelsOfSeriesToRows\",\n \"showHeader\": true\n },\n \"datasourceCate\": \"prometheus\",\n \"datasourceValue\": \"${prom}\",\n \"id\": \"1b3fdea0-1921-48ae-b11f-31cc27f816b0\",\n \"layout\": {\n \"h\": 3,\n \"i\": \"1b3fdea0-1921-48ae-b11f-31cc27f816b0\",\n \"w\": 24,\n \"x\": 0,\n \"y\": 6\n },\n \"name\": \"nodes\",\n \"options\": {\n \"standardOptions\": {}\n },\n \"overrides\": [\n {}\n ],\n \"targets\": [\n {\n \"expr\": \"rabbitmq_build_info * on(instance) group_left(rabbitmq_cluster, rabbitmq_node) rabbitmq_identity_info{rabbitmq_cluster=\\\"$rabbitmq_cluster\\\"}\",\n \"refId\": \"A\"\n }\n ],\n \"type\": \"table\",\n \"version\": \"2.0.0\"\n },\n {\n \"custom\": {\n \"drawStyle\": \"lines\",\n \"fillOpacity\": 0.3,\n \"gradientMode\": \"opacity\",\n \"lineInterpolation\": \"smooth\",\n \"lineWidth\": 2,\n \"stack\": \"off\"\n },\n \"datasourceCate\": \"prometheus\",\n \"datasourceValue\": \"${prom}\",\n \"description\": \"If the value is zero or less, the memory alarm will be triggered and all publishing connections across all cluster nodes will be blocked.\\n\\nThis value can temporarily go negative because the memory alarm is triggered with a slight delay.\\n\\nThe kernel's view of the amount of memory used by the node can differ from what the node itself can observe. This means that this value can be negative for a sustained period of time.\\n\\nBy default nodes use resident set size (RSS) to compute how much memory they use. This strategy can be changed (see the guides below).\\n\\n* [Alarms](https://www.rabbitmq.com/alarms.html)\\n* [Memory Alarms](https://www.rabbitmq.com/memory.html)\\n* [Reasoning About Memory Use](https://www.rabbitmq.com/memory-use.html)\\n* [Blocked Connection Notifications](https://www.rabbitmq.com/connection-blocked.html)\",\n \"id\": \"b91068ed-0914-4a8d-91dd-9ffb3b692516\",\n \"layout\": {\n \"h\": 7,\n \"i\": \"b91068ed-0914-4a8d-91dd-9ffb3b692516\",\n \"w\": 8,\n \"x\": 0,\n \"y\": 7\n },\n \"name\": \"Memory available before publishers blocked\",\n \"options\": {\n \"legend\": {\n \"displayMode\": \"hidden\"\n },\n \"standardOptions\": {\n \"decimals\": 1\n },\n \"thresholds\": {},\n \"tooltip\": {\n \"mode\": \"all\",\n \"sort\": \"none\"\n }\n },\n \"targets\": [\n {\n \"expr\": \"(rabbitmq_resident_memory_limit_bytes * on(instance) group_left(rabbitmq_cluster, rabbitmq_node) rabbitmq_identity_info{rabbitmq_cluster=\\\"$rabbitmq_cluster\\\"}) -\\n(rabbitmq_process_resident_memory_bytes * on(instance) group_left(rabbitmq_cluster, rabbitmq_node) rabbitmq_identity_info{rabbitmq_cluster=\\\"$rabbitmq_cluster\\\"})\",\n \"refId\": \"A\"\n }\n ],\n \"type\": \"timeseries\",\n \"version\": \"2.0.0\"\n },\n {\n \"custom\": {\n \"drawStyle\": \"lines\",\n \"fillOpacity\": 0.3,\n \"gradientMode\": \"opacity\",\n \"lineInterpolation\": \"smooth\",\n \"lineWidth\": 2,\n \"stack\": \"off\"\n },\n \"datasourceCate\": \"prometheus\",\n \"datasourceValue\": \"${prom}\",\n \"description\": \"This metric is reported for the partition where the RabbitMQ data directory is stored.\\n\\nIf the value is zero or less, the disk alarm will be triggered and all publishing connections across all cluster nodes will be blocked.\\n\\nThis value can temporarily go negative because the free disk space alarm is triggered with a slight delay.\\n\\n* [Alarms](https://www.rabbitmq.com/alarms.html)\\n* [Disk Space Alarms](https://www.rabbitmq.com/disk-alarms.html)\\n* [Disk Space](https://www.rabbitmq.com/production-checklist.html#resource-limits-disk-space)\\n* [Persistence Configuration](https://www.rabbitmq.com/persistence-conf.html)\\n* [Blocked Connection Notifications](https://www.rabbitmq.com/connection-blocked.html)\",\n \"id\": \"a74ca489-6101-49bc-9560-4cde368bc47e\",\n \"layout\": {\n \"h\": 7,\n \"i\": \"a74ca489-6101-49bc-9560-4cde368bc47e\",\n \"w\": 8,\n \"x\": 8,\n \"y\": 7\n },\n \"name\": \"Disk space available before publishers blocked\",\n \"options\": {\n \"legend\": {\n \"displayMode\": \"hidden\"\n },\n \"standardOptions\": {\n \"decimals\": 1\n },\n \"thresholds\": {},\n \"tooltip\": {\n \"mode\": \"all\",\n \"sort\": \"none\"\n }\n },\n \"targets\": [\n {\n \"expr\": \"rabbitmq_disk_space_available_bytes * on(instance) group_left(rabbitmq_cluster, rabbitmq_node) rabbitmq_identity_info{rabbitmq_cluster=\\\"$rabbitmq_cluster\\\"}\",\n \"refId\": \"A\"\n }\n ],\n \"type\": \"timeseries\",\n \"version\": \"2.0.0\"\n },\n {\n \"custom\": {\n \"drawStyle\": \"lines\",\n \"fillOpacity\": 0.3,\n \"gradientMode\": \"opacity\",\n \"lineInterpolation\": \"smooth\",\n \"lineWidth\": 2,\n \"stack\": \"off\"\n },\n \"datasourceCate\": \"prometheus\",\n \"datasourceValue\": \"${prom}\",\n \"description\": \"When this value reaches zero, new connections will not be accepted and disk write operations may fail.\\n\\nClient libraries, peer nodes and CLI tools will not be able to connect when the node runs out of available file descriptors.\\n\\n* [Open File Handles Limit](https://www.rabbitmq.com/production-checklist.html#resource-limits-file-handle-limit)\",\n \"id\": \"100ed9ae-2b84-4f2b-82b2-0444dd28deed\",\n \"layout\": {\n \"h\": 3,\n \"i\": \"100ed9ae-2b84-4f2b-82b2-0444dd28deed\",\n \"w\": 8,\n \"x\": 16,\n \"y\": 7\n },\n \"name\": \"File descriptors available\",\n \"options\": {\n \"legend\": {\n \"displayMode\": \"hidden\"\n },\n \"standardOptions\": {},\n \"thresholds\": {},\n \"tooltip\": {\n \"mode\": \"all\",\n \"sort\": \"none\"\n }\n },\n \"targets\": [\n {\n \"expr\": \"(rabbitmq_process_max_fds * on(instance) group_left(rabbitmq_cluster, rabbitmq_node) rabbitmq_identity_info{rabbitmq_cluster=\\\"$rabbitmq_cluster\\\"}) -\\n(rabbitmq_process_open_fds * on(instance) group_left(rabbitmq_cluster, rabbitmq_node) rabbitmq_identity_info{rabbitmq_cluster=\\\"$rabbitmq_cluster\\\"})\",\n \"refId\": \"A\"\n }\n ],\n \"type\": \"timeseries\",\n \"version\": \"2.0.0\"\n },\n {\n \"custom\": {\n \"drawStyle\": \"lines\",\n \"fillOpacity\": 0.3,\n \"gradientMode\": \"opacity\",\n \"lineInterpolation\": \"smooth\",\n \"lineWidth\": 2,\n \"stack\": \"off\"\n },\n \"datasourceCate\": \"prometheus\",\n \"datasourceValue\": \"${prom}\",\n \"description\": \"When this value reaches zero, new connections will not be accepted.\\n\\nClient libraries, peer nodes and CLI tools will not be able to connect when the node runs out of available file descriptors.\\n\\n* [Networking and RabbitMQ](https://www.rabbitmq.com/networking.html)\",\n \"id\": \"a4859891-2538-47fc-946b-7ae3aa507c51\",\n \"layout\": {\n \"h\": 3,\n \"i\": \"a4859891-2538-47fc-946b-7ae3aa507c51\",\n \"w\": 8,\n \"x\": 16,\n \"y\": 8\n },\n \"name\": \"TCP sockets available\",\n \"options\": {\n \"legend\": {\n \"displayMode\": \"hidden\"\n },\n \"standardOptions\": {},\n \"thresholds\": {},\n \"tooltip\": {\n \"mode\": \"all\",\n \"sort\": \"none\"\n }\n },\n \"targets\": [\n {\n \"expr\": \"(rabbitmq_process_max_tcp_sockets * on(instance) group_left(rabbitmq_cluster, rabbitmq_node) rabbitmq_identity_info{rabbitmq_cluster=\\\"$rabbitmq_cluster\\\"}) -\\n(rabbitmq_process_open_tcp_sockets * on(instance) group_left(rabbitmq_cluster, rabbitmq_node) rabbitmq_identity_info{rabbitmq_cluster=\\\"$rabbitmq_cluster\\\"})\",\n \"refId\": \"A\"\n }\n ],\n \"type\": \"timeseries\",\n \"version\": \"2.0.0\"\n },\n {\n \"collapsed\": true,\n \"id\": \"fec98a71-0615-4782-bf8d-960529e243f9\",\n \"layout\": {\n \"h\": 1,\n \"i\": \"fec98a71-0615-4782-bf8d-960529e243f9\",\n \"w\": 24,\n \"x\": 0,\n \"y\": 14\n },\n \"name\": \"QUEUED MESSAGES\",\n \"type\": \"row\"\n },\n {\n \"custom\": {\n \"drawStyle\": \"lines\",\n \"fillOpacity\": 0.3,\n \"gradientMode\": \"opacity\",\n \"lineInterpolation\": \"smooth\",\n \"lineWidth\": 2,\n \"stack\": \"off\"\n },\n \"datasourceCate\": \"prometheus\",\n \"datasourceValue\": \"${prom}\",\n \"description\": \"Total number of ready messages ready to be delivered to consumers.\\n\\nAim to keep this value as low as possible. RabbitMQ behaves best when messages are flowing through it. It's OK for publishers to occasionally outpace consumers, but the expectation is that consumers will eventually process all ready messages.\\n\\nIf this metric keeps increasing, your system will eventually run out of memory and/or disk space. Consider using TTL or Queue Length Limit to prevent unbounded message growth.\\n\\n* [Queues](https://www.rabbitmq.com/queues.html)\\n* [Consumers](https://www.rabbitmq.com/consumers.html)\\n* [Queue Length Limit](https://www.rabbitmq.com/maxlength.html)\\n* [Time-To-Live and Expiration](https://www.rabbitmq.com/ttl.html)\",\n \"id\": \"145dc75a-d3b8-491f-9ba6-6da787c8e265\",\n \"layout\": {\n \"h\": 3,\n \"i\": \"145dc75a-d3b8-491f-9ba6-6da787c8e265\",\n \"w\": 12,\n \"x\": 0,\n \"y\": 15\n },\n \"name\": \"Messages ready to be delivered to consumers\",\n \"options\": {\n \"legend\": {\n \"displayMode\": \"hidden\"\n },\n \"standardOptions\": {},\n \"thresholds\": {},\n \"tooltip\": {\n \"mode\": \"all\",\n \"sort\": \"none\"\n }\n },\n \"targets\": [\n {\n \"expr\": \"sum(rabbitmq_queue_messages_ready * on(instance) group_left(rabbitmq_cluster, rabbitmq_node) rabbitmq_identity_info{rabbitmq_cluster=\\\"$rabbitmq_cluster\\\"}) by(rabbitmq_node)\",\n \"refId\": \"A\"\n }\n ],\n \"type\": \"timeseries\",\n \"version\": \"2.0.0\"\n },\n {\n \"custom\": {\n \"drawStyle\": \"lines\",\n \"fillOpacity\": 0.3,\n \"gradientMode\": \"opacity\",\n \"lineInterpolation\": \"smooth\",\n \"lineWidth\": 2,\n \"stack\": \"off\"\n },\n \"datasourceCate\": \"prometheus\",\n \"datasourceValue\": \"${prom}\",\n \"description\": \"The total number of messages that are either in-flight to consumers, currently being processed by consumers or simply waiting for the consumer acknowledgements to be processed by the queue. Until the queue processes the message acknowledgement, the message will remain unacknowledged.\\n\\n* [Queues](https://www.rabbitmq.com/queues.html)\\n* [Confirms and Acknowledgements](https://www.rabbitmq.com/confirms.html)\\n* [Consumer Prefetch](https://www.rabbitmq.com/consumer-prefetch.html)\",\n \"id\": \"a6ca328a-8b19-488e-a70d-74372f994901\",\n \"layout\": {\n \"h\": 3,\n \"i\": \"a6ca328a-8b19-488e-a70d-74372f994901\",\n \"w\": 12,\n \"x\": 12,\n \"y\": 15\n },\n \"name\": \"Messages pending consumer acknowledgement\",\n \"options\": {\n \"legend\": {\n \"displayMode\": \"hidden\"\n },\n \"standardOptions\": {},\n \"thresholds\": {},\n \"tooltip\": {\n \"mode\": \"all\",\n \"sort\": \"none\"\n }\n },\n \"targets\": [\n {\n \"expr\": \"sum(rabbitmq_queue_messages_unacked * on(instance) group_left(rabbitmq_cluster, rabbitmq_node) rabbitmq_identity_info{rabbitmq_cluster=\\\"$rabbitmq_cluster\\\"}) by(rabbitmq_node)\",\n \"refId\": \"A\"\n }\n ],\n \"type\": \"timeseries\",\n \"version\": \"2.0.0\"\n },\n {\n \"collapsed\": true,\n \"id\": \"500c51ed-a0d6-41d9-903f-d000e289dc2b\",\n \"layout\": {\n \"h\": 1,\n \"i\": \"500c51ed-a0d6-41d9-903f-d000e289dc2b\",\n \"w\": 24,\n \"x\": 0,\n \"y\": 18\n },\n \"name\": \"INCOMING MESSAGES\",\n \"type\": \"row\"\n },\n {\n \"custom\": {\n \"drawStyle\": \"lines\",\n \"fillOpacity\": 0.3,\n \"gradientMode\": \"opacity\",\n \"lineInterpolation\": \"smooth\",\n \"lineWidth\": 2,\n \"stack\": \"off\"\n },\n \"datasourceCate\": \"prometheus\",\n \"datasourceValue\": \"${prom}\",\n \"description\": \"The incoming message rate before any routing rules are applied.\\n\\nIf this value is lower than the number of messages published to queues, it may indicate that some messages are delivered to more than one queue.\\n\\nIf this value is higher than the number of messages published to queues, messages cannot be routed and will either be dropped or returned to publishers.\\n\\n* [Publishers](https://www.rabbitmq.com/publishers.html)\",\n \"id\": \"ef4352a4-c281-4596-b89e-d79a565ca112\",\n \"layout\": {\n \"h\": 3,\n \"i\": \"ef4352a4-c281-4596-b89e-d79a565ca112\",\n \"w\": 12,\n \"x\": 0,\n \"y\": 19\n },\n \"name\": \"Messages published / s\",\n \"options\": {\n \"legend\": {\n \"displayMode\": \"hidden\"\n },\n \"standardOptions\": {},\n \"thresholds\": {},\n \"tooltip\": {\n \"mode\": \"all\",\n \"sort\": \"none\"\n }\n },\n \"targets\": [\n {\n \"expr\": \"sum(rate(rabbitmq_channel_messages_published_total[60s]) * on(instance) group_left(rabbitmq_cluster, rabbitmq_node) rabbitmq_identity_info{rabbitmq_cluster=\\\"$rabbitmq_cluster\\\"}) by(rabbitmq_node)\",\n \"refId\": \"A\"\n }\n ],\n \"type\": \"timeseries\",\n \"version\": \"2.0.0\"\n },\n {\n \"custom\": {\n \"drawStyle\": \"lines\",\n \"fillOpacity\": 0.3,\n \"gradientMode\": \"opacity\",\n \"lineInterpolation\": \"smooth\",\n \"lineWidth\": 2,\n \"stack\": \"off\"\n },\n \"datasourceCate\": \"prometheus\",\n \"datasourceValue\": \"${prom}\",\n \"description\": \"The rate of messages confirmed by the broker to publishers. Publishers must opt-in to receive message confirmations.\\n\\nIf this metric is consistently at zero it may suggest that publisher confirms are not used by clients. The safety of published messages is likely to be at risk.\\n\\n* [Publisher Confirms](https://www.rabbitmq.com/confirms.html#publisher-confirms)\\n* [Publisher Confirms and Data Safety](https://www.rabbitmq.com/publishers.html#data-safety)\\n* [When Will Published Messages Be Confirmed by the Broker?](https://www.rabbitmq.com/confirms.html#when-publishes-are-confirmed)\",\n \"id\": \"f0932549-d4a7-4eb1-a86e-35eb49569f29\",\n \"layout\": {\n \"h\": 3,\n \"i\": \"f0932549-d4a7-4eb1-a86e-35eb49569f29\",\n \"w\": 12,\n \"x\": 12,\n \"y\": 19\n },\n \"name\": \"Messages confirmed to publishers / s\",\n \"options\": {\n \"legend\": {\n \"displayMode\": \"hidden\"\n },\n \"standardOptions\": {},\n \"thresholds\": {},\n \"tooltip\": {\n \"mode\": \"all\",\n \"sort\": \"none\"\n }\n },\n \"targets\": [\n {\n \"expr\": \"sum(rate(rabbitmq_channel_messages_confirmed_total[60s]) * on(instance) group_left(rabbitmq_cluster, rabbitmq_node) rabbitmq_identity_info{rabbitmq_cluster=\\\"$rabbitmq_cluster\\\"}) by(rabbitmq_node)\",\n \"refId\": \"A\"\n }\n ],\n \"type\": \"timeseries\",\n \"version\": \"2.0.0\"\n },\n {\n \"custom\": {\n \"drawStyle\": \"lines\",\n \"fillOpacity\": 0.3,\n \"gradientMode\": \"opacity\",\n \"lineInterpolation\": \"smooth\",\n \"lineWidth\": 2,\n \"stack\": \"off\"\n },\n \"datasourceCate\": \"prometheus\",\n \"datasourceValue\": \"${prom}\",\n \"description\": \"The rate of messages received from publishers and successfully routed to the master queue replicas.\\n\\n* [Queues](https://www.rabbitmq.com/queues.html)\\n* [Publishers](https://www.rabbitmq.com/publishers.html)\",\n \"id\": \"f47766cb-3cdb-4f67-896f-77af421ff404\",\n \"layout\": {\n \"h\": 3,\n \"i\": \"f47766cb-3cdb-4f67-896f-77af421ff404\",\n \"w\": 12,\n \"x\": 0,\n \"y\": 20\n },\n \"name\": \"Messages routed to queues / s\",\n \"options\": {\n \"legend\": {\n \"displayMode\": \"hidden\"\n },\n \"standardOptions\": {},\n \"thresholds\": {},\n \"tooltip\": {\n \"mode\": \"all\",\n \"sort\": \"none\"\n }\n },\n \"targets\": [\n {\n \"expr\": \"sum(rate(rabbitmq_queue_messages_published_total[60s]) * on(instance) group_left(rabbitmq_cluster, rabbitmq_node) rabbitmq_identity_info{rabbitmq_cluster=\\\"$rabbitmq_cluster\\\"}) by(rabbitmq_node)\",\n \"refId\": \"A\"\n }\n ],\n \"type\": \"timeseries\",\n \"version\": \"2.0.0\"\n },\n {\n \"custom\": {\n \"drawStyle\": \"lines\",\n \"fillOpacity\": 0.3,\n \"gradientMode\": \"opacity\",\n \"lineInterpolation\": \"smooth\",\n \"lineWidth\": 2,\n \"stack\": \"off\"\n },\n \"datasourceCate\": \"prometheus\",\n \"datasourceValue\": \"${prom}\",\n \"description\": \"The rate of messages received from publishers that have publisher confirms enabled and the broker has not confirmed yet.\\n\\n* [Publishers](https://www.rabbitmq.com/publishers.html)\\n* [Confirms and Acknowledgements](https://www.rabbitmq.com/confirms.html)\\n* [When Will Published Messages Be Confirmed by the Broker?](https://www.rabbitmq.com/confirms.html#when-publishes-are-confirmed)\",\n \"id\": \"644302ba-3c99-4787-8023-93770b0a9e6c\",\n \"layout\": {\n \"h\": 3,\n \"i\": \"644302ba-3c99-4787-8023-93770b0a9e6c\",\n \"w\": 12,\n \"x\": 12,\n \"y\": 20\n },\n \"name\": \"Messages unconfirmed to publishers / s\",\n \"options\": {\n \"legend\": {\n \"displayMode\": \"hidden\"\n },\n \"standardOptions\": {},\n \"thresholds\": {},\n \"tooltip\": {\n \"mode\": \"all\",\n \"sort\": \"none\"\n }\n },\n \"targets\": [\n {\n \"expr\": \"sum(rate(rabbitmq_channel_messages_unconfirmed[60s]) * on(instance) group_left(rabbitmq_cluster, rabbitmq_node) rabbitmq_identity_info{rabbitmq_cluster=\\\"$rabbitmq_cluster\\\"}) by(rabbitmq_node)\",\n \"refId\": \"A\"\n }\n ],\n \"type\": \"timeseries\",\n \"version\": \"2.0.0\"\n },\n {\n \"custom\": {\n \"drawStyle\": \"lines\",\n \"fillOpacity\": 0.3,\n \"gradientMode\": \"opacity\",\n \"lineInterpolation\": \"smooth\",\n \"lineWidth\": 2,\n \"stack\": \"off\"\n },\n \"datasourceCate\": \"prometheus\",\n \"datasourceValue\": \"${prom}\",\n \"description\": \"The rate of messages that cannot be routed and are dropped. \\n\\nAny value above zero means message loss and likely suggests a routing problem on the publisher end.\\n\\n* [Unroutable Message Handling](https://www.rabbitmq.com/publishers.html#unroutable)\",\n \"id\": \"0a3eadfd-d84c-4070-9527-b4c62fc20787\",\n \"layout\": {\n \"h\": 3,\n \"i\": \"0a3eadfd-d84c-4070-9527-b4c62fc20787\",\n \"w\": 12,\n \"x\": 0,\n \"y\": 21\n },\n \"name\": \"Unroutable messages dropped / s\",\n \"options\": {\n \"legend\": {\n \"displayMode\": \"hidden\"\n },\n \"standardOptions\": {},\n \"thresholds\": {},\n \"tooltip\": {\n \"mode\": \"all\",\n \"sort\": \"none\"\n }\n },\n \"targets\": [\n {\n \"expr\": \"sum(rate(rabbitmq_channel_messages_unroutable_dropped_total[60s]) * on(instance) group_left(rabbitmq_cluster, rabbitmq_node) rabbitmq_identity_info{rabbitmq_cluster=\\\"$rabbitmq_cluster\\\"}) by(rabbitmq_node)\",\n \"refId\": \"A\"\n }\n ],\n \"type\": \"timeseries\",\n \"version\": \"2.0.0\"\n },\n {\n \"custom\": {\n \"drawStyle\": \"lines\",\n \"fillOpacity\": 0.3,\n \"gradientMode\": \"opacity\",\n \"lineInterpolation\": \"smooth\",\n \"lineWidth\": 2,\n \"stack\": \"off\"\n },\n \"datasourceCate\": \"prometheus\",\n \"datasourceValue\": \"${prom}\",\n \"description\": \"The rate of messages that cannot be routed and are returned back to publishers.\\n\\nSustained values above zero may indicate a routing problem on the publisher end.\\n\\n* [Unroutable Message Handling](https://www.rabbitmq.com/publishers.html#unroutable)\\n* [When Will Published Messages Be Confirmed by the Broker?](https://www.rabbitmq.com/confirms.html#when-publishes-are-confirmed)\",\n \"id\": \"a14e8796-9614-4204-b5b8-5d1a47f356d8\",\n \"layout\": {\n \"h\": 3,\n \"i\": \"a14e8796-9614-4204-b5b8-5d1a47f356d8\",\n \"w\": 12,\n \"x\": 12,\n \"y\": 21\n },\n \"name\": \"Unroutable messages returned to publishers / s\",\n \"options\": {\n \"legend\": {\n \"displayMode\": \"hidden\"\n },\n \"standardOptions\": {},\n \"thresholds\": {},\n \"tooltip\": {\n \"mode\": \"all\",\n \"sort\": \"none\"\n }\n },\n \"targets\": [\n {\n \"expr\": \"sum(rate(rabbitmq_channel_messages_unroutable_returned_total[60s]) * on(instance) group_left(rabbitmq_cluster, rabbitmq_node) rabbitmq_identity_info{rabbitmq_cluster=\\\"$rabbitmq_cluster\\\"}) by(rabbitmq_node)\",\n \"refId\": \"A\"\n }\n ],\n \"type\": \"timeseries\",\n \"version\": \"2.0.0\"\n },\n {\n \"collapsed\": true,\n \"id\": \"2405258c-c08f-4e49-960a-5c9a12b29f12\",\n \"layout\": {\n \"h\": 1,\n \"i\": \"2405258c-c08f-4e49-960a-5c9a12b29f12\",\n \"w\": 24,\n \"x\": 0,\n \"y\": 24\n },\n \"name\": \"OUTGOING MESSAGES\",\n \"type\": \"row\"\n },\n {\n \"custom\": {\n \"drawStyle\": \"lines\",\n \"fillOpacity\": 0.3,\n \"gradientMode\": \"opacity\",\n \"lineInterpolation\": \"smooth\",\n \"lineWidth\": 2,\n \"stack\": \"off\"\n },\n \"datasourceCate\": \"prometheus\",\n \"datasourceValue\": \"${prom}\",\n \"description\": \"The rate of messages delivered to consumers. It includes messages that have been redelivered.\\n\\nThis metric does not include messages that have been fetched by consumers using `basic.get` (consumed by polling).\\n\\n* [Consumers](https://www.rabbitmq.com/consumers.html)\",\n \"id\": \"be0f1872-172c-4bc3-a901-4b645ebf5abe\",\n \"layout\": {\n \"h\": 3,\n \"i\": \"be0f1872-172c-4bc3-a901-4b645ebf5abe\",\n \"w\": 12,\n \"x\": 0,\n \"y\": 25\n },\n \"name\": \"Messages delivered / s\",\n \"options\": {\n \"legend\": {\n \"displayMode\": \"hidden\"\n },\n \"standardOptions\": {},\n \"thresholds\": {},\n \"tooltip\": {\n \"mode\": \"all\",\n \"sort\": \"none\"\n }\n },\n \"targets\": [\n {\n \"expr\": \"sum(\\n (rate(rabbitmq_channel_messages_delivered_total[60s]) * on(instance) group_left(rabbitmq_cluster, rabbitmq_node) rabbitmq_identity_info{rabbitmq_cluster=\\\"$rabbitmq_cluster\\\"}) +\\n (rate(rabbitmq_channel_messages_delivered_ack_total[60s]) * on(instance) group_left(rabbitmq_cluster, rabbitmq_node) rabbitmq_identity_info{rabbitmq_cluster=\\\"$rabbitmq_cluster\\\"})\\n) by(rabbitmq_node)\",\n \"refId\": \"A\"\n }\n ],\n \"type\": \"timeseries\",\n \"version\": \"2.0.0\"\n },\n {\n \"custom\": {\n \"drawStyle\": \"lines\",\n \"fillOpacity\": 0.3,\n \"gradientMode\": \"opacity\",\n \"lineInterpolation\": \"smooth\",\n \"lineWidth\": 2,\n \"stack\": \"off\"\n },\n \"datasourceCate\": \"prometheus\",\n \"datasourceValue\": \"${prom}\",\n \"description\": \"The rate of messages that have been redelivered to consumers. It includes messages that have been requeued automatically and redelivered due to channel exceptions or connection closures.\\n\\nHaving some redeliveries is expected, but if this metric is consistently non-zero, it is worth investigating why.\\n\\n* [Negative Acknowledgement and Requeuing of Deliveries](https://www.rabbitmq.com/confirms.html#consumer-nacks-requeue)\\n* [Consumers](https://www.rabbitmq.com/consumers.html)\",\n \"id\": \"eff794ca-e844-4a12-b230-690aadefa53f\",\n \"layout\": {\n \"h\": 3,\n \"i\": \"eff794ca-e844-4a12-b230-690aadefa53f\",\n \"w\": 12,\n \"x\": 12,\n \"y\": 25\n },\n \"name\": \"Messages redelivered / s\",\n \"options\": {\n \"legend\": {\n \"displayMode\": \"hidden\"\n },\n \"standardOptions\": {},\n \"thresholds\": {},\n \"tooltip\": {\n \"mode\": \"all\",\n \"sort\": \"none\"\n }\n },\n \"targets\": [\n {\n \"expr\": \"sum(rate(rabbitmq_channel_messages_redelivered_total[60s]) * on(instance) group_left(rabbitmq_cluster, rabbitmq_node) rabbitmq_identity_info{rabbitmq_cluster=\\\"$rabbitmq_cluster\\\"}) by(rabbitmq_node)\",\n \"refId\": \"A\"\n }\n ],\n \"type\": \"timeseries\",\n \"version\": \"2.0.0\"\n },\n {\n \"custom\": {\n \"drawStyle\": \"lines\",\n \"fillOpacity\": 0.3,\n \"gradientMode\": \"opacity\",\n \"lineInterpolation\": \"smooth\",\n \"lineWidth\": 2,\n \"stack\": \"off\"\n },\n \"datasourceCate\": \"prometheus\",\n \"datasourceValue\": \"${prom}\",\n \"description\": \"The rate of message deliveries to consumers that use manual acknowledgement mode.\\n\\nWhen this mode is used, RabbitMQ waits for consumers to acknowledge messages before more messages can be delivered.\\n\\nThis is the safest way of consuming messages.\\n\\n* [Consumer Acknowledgements](https://www.rabbitmq.com/confirms.html)\\n* [Consumer Prefetch](https://www.rabbitmq.com/consumer-prefetch.html)\\n* [Consumer Acknowledgement Modes, Prefetch and Throughput](https://www.rabbitmq.com/confirms.html#channel-qos-prefetch-throughput)\\n* [Consumers](https://www.rabbitmq.com/consumers.html)\",\n \"id\": \"2ed4be63-4fe9-462f-bc2f-967319bc3626\",\n \"layout\": {\n \"h\": 3,\n \"i\": \"2ed4be63-4fe9-462f-bc2f-967319bc3626\",\n \"w\": 12,\n \"x\": 0,\n \"y\": 26\n },\n \"name\": \"Messages delivered with manual ack / s\",\n \"options\": {\n \"legend\": {\n \"displayMode\": \"hidden\"\n },\n \"standardOptions\": {},\n \"thresholds\": {},\n \"tooltip\": {\n \"mode\": \"all\",\n \"sort\": \"none\"\n }\n },\n \"targets\": [\n {\n \"expr\": \"sum(rate(rabbitmq_channel_messages_delivered_ack_total[60s]) * on(instance) group_left(rabbitmq_cluster, rabbitmq_node) rabbitmq_identity_info{rabbitmq_cluster=\\\"$rabbitmq_cluster\\\"}) by(rabbitmq_node)\",\n \"refId\": \"A\"\n }\n ],\n \"type\": \"timeseries\",\n \"version\": \"2.0.0\"\n },\n {\n \"custom\": {\n \"drawStyle\": \"lines\",\n \"fillOpacity\": 0.3,\n \"gradientMode\": \"opacity\",\n \"lineInterpolation\": \"smooth\",\n \"lineWidth\": 2,\n \"stack\": \"off\"\n },\n \"datasourceCate\": \"prometheus\",\n \"datasourceValue\": \"${prom}\",\n \"description\": \"The rate of message deliveries to consumers that use automatic acknowledgement mode.\\n\\nWhen this mode is used, RabbitMQ does not wait for consumers to acknowledge message deliveries.\\n\\nThis mode is fire-and-forget and does not offer any delivery safety guarantees. It tends to provide higher throughput and it may lead to consumer overload and higher consumer memory usage.\\n\\n* [Consumer Acknowledgement Modes, Prefetch and Throughput](https://www.rabbitmq.com/confirms.html#channel-qos-prefetch-throughput)\\n* [Consumers](https://www.rabbitmq.com/consumers.html)\",\n \"id\": \"116c44e0-c8e1-4f02-8eae-2140997e2280\",\n \"layout\": {\n \"h\": 3,\n \"i\": \"116c44e0-c8e1-4f02-8eae-2140997e2280\",\n \"w\": 12,\n \"x\": 12,\n \"y\": 26\n },\n \"name\": \"Messages delivered auto ack / s\",\n \"options\": {\n \"legend\": {\n \"displayMode\": \"hidden\"\n },\n \"standardOptions\": {},\n \"thresholds\": {},\n \"tooltip\": {\n \"mode\": \"all\",\n \"sort\": \"none\"\n }\n },\n \"targets\": [\n {\n \"expr\": \"sum(rate(rabbitmq_channel_messages_delivered_total[60s]) * on(instance) group_left(rabbitmq_cluster, rabbitmq_node) rabbitmq_identity_info{rabbitmq_cluster=\\\"$rabbitmq_cluster\\\"}) by(rabbitmq_node)\",\n \"refId\": \"A\"\n }\n ],\n \"type\": \"timeseries\",\n \"version\": \"2.0.0\"\n },\n {\n \"custom\": {\n \"drawStyle\": \"lines\",\n \"fillOpacity\": 0.3,\n \"gradientMode\": \"opacity\",\n \"lineInterpolation\": \"smooth\",\n \"lineWidth\": 2,\n \"stack\": \"off\"\n },\n \"datasourceCate\": \"prometheus\",\n \"datasourceValue\": \"${prom}\",\n \"description\": \"The rate of message acknowledgements coming from consumers that use manual acknowledgement mode.\\n\\n* [Consumer Acknowledgements](https://www.rabbitmq.com/confirms.html)\\n* [Consumer Prefetch](https://www.rabbitmq.com/consumer-prefetch.html)\\n* [Consumer Acknowledgement Modes, Prefetch and Throughput](https://www.rabbitmq.com/confirms.html#channel-qos-prefetch-throughput)\\n* [Consumers](https://www.rabbitmq.com/consumers.html)\",\n \"id\": \"a1184534-3226-4c9a-ba6c-6d5258998518\",\n \"layout\": {\n \"h\": 3,\n \"i\": \"a1184534-3226-4c9a-ba6c-6d5258998518\",\n \"w\": 12,\n \"x\": 0,\n \"y\": 27\n },\n \"name\": \"Messages acknowledged / s\",\n \"options\": {\n \"legend\": {\n \"displayMode\": \"hidden\"\n },\n \"standardOptions\": {},\n \"thresholds\": {},\n \"tooltip\": {\n \"mode\": \"all\",\n \"sort\": \"none\"\n }\n },\n \"targets\": [\n {\n \"expr\": \"sum(rate(rabbitmq_channel_messages_acked_total[60s]) * on(instance) group_left(rabbitmq_cluster, rabbitmq_node) rabbitmq_identity_info{rabbitmq_cluster=\\\"$rabbitmq_cluster\\\"}) by(rabbitmq_node)\",\n \"refId\": \"A\"\n }\n ],\n \"type\": \"timeseries\",\n \"version\": \"2.0.0\"\n },\n {\n \"custom\": {\n \"drawStyle\": \"lines\",\n \"fillOpacity\": 0.3,\n \"gradientMode\": \"opacity\",\n \"lineInterpolation\": \"smooth\",\n \"lineWidth\": 2,\n \"stack\": \"off\"\n },\n \"datasourceCate\": \"prometheus\",\n \"datasourceValue\": \"${prom}\",\n \"description\": \"The rate of messages delivered to polling consumers that use automatic acknowledgement mode.\\n\\nThe use of polling consumers is highly inefficient and therefore strongly discouraged.\\n\\n* [Fetching individual messages](https://www.rabbitmq.com/consumers.html#fetching)\\n* [Consumers](https://www.rabbitmq.com/consumers.html)\",\n \"id\": \"2f34e8c7-e7fb-4695-afce-034a10081437\",\n \"layout\": {\n \"h\": 3,\n \"i\": \"2f34e8c7-e7fb-4695-afce-034a10081437\",\n \"w\": 12,\n \"x\": 12,\n \"y\": 27\n },\n \"name\": \"Polling operations with auto ack / s\",\n \"options\": {\n \"legend\": {\n \"displayMode\": \"hidden\"\n },\n \"standardOptions\": {},\n \"thresholds\": {},\n \"tooltip\": {\n \"mode\": \"all\",\n \"sort\": \"none\"\n }\n },\n \"targets\": [\n {\n \"expr\": \"sum(rate(rabbitmq_channel_get_total[60s]) * on(instance) group_left(rabbitmq_cluster, rabbitmq_node) rabbitmq_identity_info{rabbitmq_cluster=\\\"$rabbitmq_cluster\\\"}) by(rabbitmq_node)\",\n \"refId\": \"A\"\n }\n ],\n \"type\": \"timeseries\",\n \"version\": \"2.0.0\"\n },\n {\n \"custom\": {\n \"drawStyle\": \"lines\",\n \"fillOpacity\": 0.3,\n \"gradientMode\": \"opacity\",\n \"lineInterpolation\": \"smooth\",\n \"lineWidth\": 2,\n \"stack\": \"off\"\n },\n \"datasourceCate\": \"prometheus\",\n \"datasourceValue\": \"${prom}\",\n \"description\": \"The rate of polling consumer operations that yield no result.\\n\\nAny value above zero means that RabbitMQ resources are wasted by polling consumers.\\n\\nCompare this metric to the other polling consumer metrics to see the inefficiency rate.\\n\\nThe use of polling consumers is highly inefficient and therefore strongly discouraged.\\n\\n* [Fetching individual messages](https://www.rabbitmq.com/consumers.html#fetching)\\n* [Consumers](https://www.rabbitmq.com/consumers.html)\",\n \"id\": \"c7b1f4b8-5069-480f-a1f7-1c85dbc389c1\",\n \"layout\": {\n \"h\": 3,\n \"i\": \"c7b1f4b8-5069-480f-a1f7-1c85dbc389c1\",\n \"w\": 12,\n \"x\": 0,\n \"y\": 28\n },\n \"name\": \"Polling operations that yield no result / s\",\n \"options\": {\n \"legend\": {\n \"displayMode\": \"hidden\"\n },\n \"standardOptions\": {},\n \"thresholds\": {},\n \"tooltip\": {\n \"mode\": \"all\",\n \"sort\": \"none\"\n }\n },\n \"targets\": [\n {\n \"expr\": \"sum(rate(rabbitmq_channel_get_empty_total[60s]) * on(instance) group_left(rabbitmq_cluster, rabbitmq_node) rabbitmq_identity_info{rabbitmq_cluster=\\\"$rabbitmq_cluster\\\"}) by(rabbitmq_node)\",\n \"refId\": \"A\"\n }\n ],\n \"type\": \"timeseries\",\n \"version\": \"2.0.0\"\n },\n {\n \"custom\": {\n \"drawStyle\": \"lines\",\n \"fillOpacity\": 0.3,\n \"gradientMode\": \"opacity\",\n \"lineInterpolation\": \"smooth\",\n \"lineWidth\": 2,\n \"stack\": \"off\"\n },\n \"datasourceCate\": \"prometheus\",\n \"datasourceValue\": \"${prom}\",\n \"description\": \"The rate of messages delivered to polling consumers that use manual acknowledgement mode.\\n\\nThe use of polling consumers is highly inefficient and therefore strongly discouraged.\\n\\n* [Fetching individual messages](https://www.rabbitmq.com/consumers.html#fetching)\\n* [Consumers](https://www.rabbitmq.com/consumers.html)\",\n \"id\": \"4c2f60db-3cb4-4926-944c-022cf876eec2\",\n \"layout\": {\n \"h\": 3,\n \"i\": \"4c2f60db-3cb4-4926-944c-022cf876eec2\",\n \"w\": 12,\n \"x\": 12,\n \"y\": 28\n },\n \"name\": \"Polling operations with manual ack / s\",\n \"options\": {\n \"legend\": {\n \"displayMode\": \"hidden\"\n },\n \"standardOptions\": {},\n \"thresholds\": {},\n \"tooltip\": {\n \"mode\": \"all\",\n \"sort\": \"none\"\n }\n },\n \"targets\": [\n {\n \"expr\": \"sum(rate(rabbitmq_channel_get_ack_total[60s]) * on(instance) group_left(rabbitmq_cluster, rabbitmq_node) rabbitmq_identity_info{rabbitmq_cluster=\\\"$rabbitmq_cluster\\\"}) by(rabbitmq_node)\",\n \"refId\": \"A\"\n }\n ],\n \"type\": \"timeseries\",\n \"version\": \"2.0.0\"\n },\n {\n \"collapsed\": true,\n \"id\": \"b6aa6f06-924f-4575-b4e0-d116ab744ea1\",\n \"layout\": {\n \"h\": 1,\n \"i\": \"b6aa6f06-924f-4575-b4e0-d116ab744ea1\",\n \"w\": 24,\n \"x\": 0,\n \"y\": 31\n },\n \"name\": \"QUEUES\",\n \"type\": \"row\"\n },\n {\n \"custom\": {\n \"drawStyle\": \"lines\",\n \"fillOpacity\": 0.3,\n \"gradientMode\": \"opacity\",\n \"lineInterpolation\": \"smooth\",\n \"lineWidth\": 2,\n \"stack\": \"off\"\n },\n \"datasourceCate\": \"prometheus\",\n \"datasourceValue\": \"${prom}\",\n \"description\": \"Total number of queue masters per node. \\n\\nThis metric makes it easy to see sub-optimal queue distribution in a cluster.\\n\\n* [Queue Masters, Data Locality](https://www.rabbitmq.com/ha.html#master-migration-data-locality)\\n* [Queues](https://www.rabbitmq.com/queues.html)\",\n \"id\": \"c26434ca-065f-4088-81c6-ef8f0cbca552\",\n \"layout\": {\n \"h\": 3,\n \"i\": \"c26434ca-065f-4088-81c6-ef8f0cbca552\",\n \"w\": 12,\n \"x\": 0,\n \"y\": 32\n },\n \"name\": \"Total queues\",\n \"options\": {\n \"legend\": {\n \"displayMode\": \"hidden\"\n },\n \"standardOptions\": {},\n \"thresholds\": {},\n \"tooltip\": {\n \"mode\": \"all\",\n \"sort\": \"none\"\n }\n },\n \"targets\": [\n {\n \"expr\": \"rabbitmq_queues * on(instance) group_left(rabbitmq_cluster, rabbitmq_node) rabbitmq_identity_info{rabbitmq_cluster=\\\"$rabbitmq_cluster\\\"}\",\n \"refId\": \"A\"\n }\n ],\n \"type\": \"timeseries\",\n \"version\": \"2.0.0\"\n },\n {\n \"custom\": {\n \"drawStyle\": \"lines\",\n \"fillOpacity\": 0,\n \"lineInterpolation\": \"smooth\",\n \"stack\": \"off\"\n },\n \"datasourceCate\": \"prometheus\",\n \"datasourceValue\": \"${prom}\",\n \"description\": \"The rate of queue declarations performed by clients.\\n\\nLow sustained values above zero are to be expected. High rates may be indicative of queue churn or high rates of connection recovery. Confirm connection recovery rates by using the _Connections opened_ metric.\\n\\n* [Queues](https://www.rabbitmq.com/queues.html)\",\n \"id\": \"ff021951-7991-4c3e-a667-8cd11e5c444c\",\n \"layout\": {\n \"h\": 3,\n \"i\": \"ff021951-7991-4c3e-a667-8cd11e5c444c\",\n \"w\": 4,\n \"x\": 12,\n \"y\": 32\n },\n \"name\": \"Queues declared / s\",\n \"options\": {\n \"legend\": {\n \"displayMode\": \"hidden\"\n },\n \"standardOptions\": {},\n \"thresholds\": {},\n \"tooltip\": {\n \"mode\": \"all\",\n \"sort\": \"none\"\n }\n },\n \"targets\": [\n {\n \"expr\": \"sum(rate(rabbitmq_queues_declared_total[60s]) * on(instance) group_left(rabbitmq_cluster, rabbitmq_node) rabbitmq_identity_info{rabbitmq_cluster=\\\"$rabbitmq_cluster\\\"}) by(rabbitmq_node)\",\n \"refId\": \"A\"\n }\n ],\n \"type\": \"timeseries\",\n \"version\": \"2.0.0\"\n },\n {\n \"custom\": {\n \"drawStyle\": \"lines\",\n \"fillOpacity\": 0,\n \"lineInterpolation\": \"smooth\",\n \"stack\": \"off\"\n },\n \"datasourceCate\": \"prometheus\",\n \"datasourceValue\": \"${prom}\",\n \"description\": \"The rate of new queues created (as opposed to redeclarations).\\n\\nLow sustained values above zero are to be expected. High rates may be indicative of queue churn or high rates of connection recovery. Confirm connection recovery rates by using the _Connections opened_ metric.\\n\\n* [Queues](https://www.rabbitmq.com/queues.html)\",\n \"id\": \"00bbb4fc-5cdf-4b29-a440-ff4da4325a0c\",\n \"layout\": {\n \"h\": 3,\n \"i\": \"00bbb4fc-5cdf-4b29-a440-ff4da4325a0c\",\n \"w\": 4,\n \"x\": 16,\n \"y\": 32\n },\n \"name\": \"Queues created / s\",\n \"options\": {\n \"legend\": {\n \"displayMode\": \"hidden\"\n },\n \"standardOptions\": {},\n \"thresholds\": {},\n \"tooltip\": {\n \"mode\": \"all\",\n \"sort\": \"none\"\n }\n },\n \"targets\": [\n {\n \"expr\": \"sum(rate(rabbitmq_queues_created_total[60s]) * on(instance) group_left(rabbitmq_cluster, rabbitmq_node) rabbitmq_identity_info{rabbitmq_cluster=\\\"$rabbitmq_cluster\\\"}) by(rabbitmq_node)\",\n \"refId\": \"A\"\n }\n ],\n \"type\": \"timeseries\",\n \"version\": \"2.0.0\"\n },\n {\n \"custom\": {\n \"drawStyle\": \"lines\",\n \"fillOpacity\": 0,\n \"lineInterpolation\": \"smooth\",\n \"stack\": \"off\"\n },\n \"datasourceCate\": \"prometheus\",\n \"datasourceValue\": \"${prom}\",\n \"description\": \"The rate of queues deleted.\\n\\nLow sustained values above zero are to be expected. High rates may be indicative of queue churn or high rates of connection recovery. Confirm connection recovery rates by using the _Connections opened_ metric.\\n\\n* [Queues](https://www.rabbitmq.com/queues.html)\",\n \"id\": \"f802e41d-14fe-4193-a5cf-c31957b146f7\",\n \"layout\": {\n \"h\": 3,\n \"i\": \"f802e41d-14fe-4193-a5cf-c31957b146f7\",\n \"w\": 4,\n \"x\": 20,\n \"y\": 32\n },\n \"name\": \"Queues deleted / s\",\n \"options\": {\n \"legend\": {\n \"displayMode\": \"hidden\"\n },\n \"standardOptions\": {},\n \"thresholds\": {},\n \"tooltip\": {\n \"mode\": \"all\",\n \"sort\": \"none\"\n }\n },\n \"targets\": [\n {\n \"expr\": \"sum(rate(rabbitmq_queues_deleted_total[60s]) * on(instance) group_left(rabbitmq_cluster, rabbitmq_node) rabbitmq_identity_info{rabbitmq_cluster=\\\"$rabbitmq_cluster\\\"}) by(rabbitmq_node)\",\n \"refId\": \"A\"\n }\n ],\n \"type\": \"timeseries\",\n \"version\": \"2.0.0\"\n },\n {\n \"collapsed\": true,\n \"id\": \"5c7acadf-f9ff-4db9-a284-a206be245733\",\n \"layout\": {\n \"h\": 1,\n \"i\": \"5c7acadf-f9ff-4db9-a284-a206be245733\",\n \"w\": 24,\n \"x\": 0,\n \"y\": 35\n },\n \"name\": \"CHANNELS\",\n \"type\": \"row\"\n },\n {\n \"custom\": {\n \"drawStyle\": \"lines\",\n \"fillOpacity\": 0.3,\n \"gradientMode\": \"opacity\",\n \"lineInterpolation\": \"smooth\",\n \"lineWidth\": 2,\n \"stack\": \"off\"\n },\n \"datasourceCate\": \"prometheus\",\n \"datasourceValue\": \"${prom}\",\n \"description\": \"Total number of channels on all currently opened connections.\\n\\nIf this metric grows monotonically it is highly likely a channel leak in one of the applications. Confirm channel leaks by using the _Channels opened_ and _Channels closed_ metrics.\\n\\n* [Channel Leak](https://www.rabbitmq.com/channels.html#channel-leaks)\\n* [Channels](https://www.rabbitmq.com/channels.html)\",\n \"id\": \"362c622f-3fd8-4bdd-8dce-7ebf335f42f9\",\n \"layout\": {\n \"h\": 3,\n \"i\": \"362c622f-3fd8-4bdd-8dce-7ebf335f42f9\",\n \"w\": 12,\n \"x\": 0,\n \"y\": 36\n },\n \"name\": \"Total channels\",\n \"options\": {\n \"legend\": {\n \"displayMode\": \"hidden\"\n },\n \"standardOptions\": {},\n \"thresholds\": {},\n \"tooltip\": {\n \"mode\": \"all\",\n \"sort\": \"none\"\n }\n },\n \"targets\": [\n {\n \"expr\": \"rabbitmq_channels * on(instance) group_left(rabbitmq_cluster, rabbitmq_node) rabbitmq_identity_info{rabbitmq_cluster=\\\"$rabbitmq_cluster\\\"}\",\n \"refId\": \"A\"\n }\n ],\n \"type\": \"timeseries\",\n \"version\": \"2.0.0\"\n },\n {\n \"custom\": {\n \"drawStyle\": \"lines\",\n \"fillOpacity\": 0,\n \"lineInterpolation\": \"smooth\",\n \"stack\": \"off\"\n },\n \"datasourceCate\": \"prometheus\",\n \"datasourceValue\": \"${prom}\",\n \"description\": \"The rate of new channels opened by applications across all connections. Channels are expected to be long-lived.\\n\\nLow sustained values above zero are to be expected. High rates may be indicative of channel churn or mass connection recovery. Confirm connection recovery rates by using the _Connections opened_ metric.\\n\\n* [High Channel Churn](https://www.rabbitmq.com/channels.html#high-channel-churn)\\n* [Channels](https://www.rabbitmq.com/channels.html)\",\n \"id\": \"3a1a643b-8e2a-4ed1-8621-e5fae3ebc7c2\",\n \"layout\": {\n \"h\": 3,\n \"i\": \"3a1a643b-8e2a-4ed1-8621-e5fae3ebc7c2\",\n \"w\": 6,\n \"x\": 12,\n \"y\": 36\n },\n \"name\": \"Channels opened / s\",\n \"options\": {\n \"legend\": {\n \"displayMode\": \"hidden\"\n },\n \"standardOptions\": {},\n \"thresholds\": {},\n \"tooltip\": {\n \"mode\": \"all\",\n \"sort\": \"none\"\n }\n },\n \"targets\": [\n {\n \"expr\": \"sum(rate(rabbitmq_channels_opened_total[60s]) * on(instance) group_left(rabbitmq_cluster, rabbitmq_node) rabbitmq_identity_info{rabbitmq_cluster=\\\"$rabbitmq_cluster\\\"}) by(rabbitmq_node)\",\n \"refId\": \"A\"\n }\n ],\n \"type\": \"timeseries\",\n \"version\": \"2.0.0\"\n },\n {\n \"custom\": {\n \"drawStyle\": \"lines\",\n \"fillOpacity\": 0,\n \"lineInterpolation\": \"smooth\",\n \"stack\": \"off\"\n },\n \"datasourceCate\": \"prometheus\",\n \"datasourceValue\": \"${prom}\",\n \"description\": \"The rate of channels closed by applications across all connections. Channels are expected to be long-lived.\\n\\nLow sustained values above zero are to be expected. High rates may be indicative of channel churn or mass connection recovery. Confirm connection recovery rates by using the _Connections opened_ metric.\\n\\n* [High Channel Churn](https://www.rabbitmq.com/channels.html#high-channel-churn)\\n* [Channels](https://www.rabbitmq.com/channels.html)\",\n \"id\": \"01f1771a-dd54-45e5-aa1d-b6ee2111c53b\",\n \"layout\": {\n \"h\": 3,\n \"i\": \"01f1771a-dd54-45e5-aa1d-b6ee2111c53b\",\n \"w\": 6,\n \"x\": 18,\n \"y\": 36\n },\n \"name\": \"Channels closed / s\",\n \"options\": {\n \"legend\": {\n \"displayMode\": \"hidden\"\n },\n \"standardOptions\": {},\n \"thresholds\": {},\n \"tooltip\": {\n \"mode\": \"all\",\n \"sort\": \"none\"\n }\n },\n \"targets\": [\n {\n \"expr\": \"sum(rate(rabbitmq_channels_closed_total[60s]) * on(instance) group_left(rabbitmq_cluster, rabbitmq_node) rabbitmq_identity_info{rabbitmq_cluster=\\\"$rabbitmq_cluster\\\"}) by(rabbitmq_node)\",\n \"refId\": \"A\"\n }\n ],\n \"type\": \"timeseries\",\n \"version\": \"2.0.0\"\n },\n {\n \"collapsed\": true,\n \"id\": \"419f22e8-08cc-4d91-8bc9-7c1055368146\",\n \"layout\": {\n \"h\": 1,\n \"i\": \"419f22e8-08cc-4d91-8bc9-7c1055368146\",\n \"w\": 24,\n \"x\": 0,\n \"y\": 39\n },\n \"name\": \"CONNECTIONS\",\n \"type\": \"row\"\n },\n {\n \"custom\": {\n \"drawStyle\": \"lines\",\n \"fillOpacity\": 0,\n \"lineInterpolation\": \"smooth\",\n \"stack\": \"off\"\n },\n \"datasourceCate\": \"prometheus\",\n \"datasourceValue\": \"${prom}\",\n \"description\": \"The rate of connections closed. Connections are expected to be long-lived.\\n\\nLow sustained values above zero are to be expected. High rates may be indicative of connection churn or mass connection recovery.\\n\\n* [Connections](https://www.rabbitmq.com/connections.html)\",\n \"id\": \"c14fd6f4-d3de-4811-82c6-2b20c9146e89\",\n \"layout\": {\n \"h\": 3,\n \"i\": \"c14fd6f4-d3de-4811-82c6-2b20c9146e89\",\n \"w\": 6,\n \"x\": 18,\n \"y\": 40\n },\n \"name\": \"Connections closed / s\",\n \"options\": {\n \"legend\": {\n \"displayMode\": \"hidden\"\n },\n \"standardOptions\": {},\n \"thresholds\": {},\n \"tooltip\": {\n \"mode\": \"all\",\n \"sort\": \"none\"\n }\n },\n \"targets\": [\n {\n \"expr\": \"sum(rate(rabbitmq_connections_closed_total[60s]) * on(instance) group_left(rabbitmq_cluster, rabbitmq_node) rabbitmq_identity_info{rabbitmq_cluster=\\\"$rabbitmq_cluster\\\"}) by(rabbitmq_node)\",\n \"refId\": \"A\"\n }\n ],\n \"type\": \"timeseries\",\n \"version\": \"2.0.0\"\n },\n {\n \"custom\": {\n \"drawStyle\": \"lines\",\n \"fillOpacity\": 0.3,\n \"gradientMode\": \"opacity\",\n \"lineInterpolation\": \"smooth\",\n \"lineWidth\": 2,\n \"stack\": \"off\"\n },\n \"datasourceCate\": \"prometheus\",\n \"datasourceValue\": \"${prom}\",\n \"description\": \"Total number of client connections.\\n\\nIf this metric grows monotonically it is highly likely a connection leak in one of the applications. Confirm connection leaks by using the _Connections opened_ and _Connections closed_ metrics.\\n\\n* [Connection Leak](https://www.rabbitmq.com/connections.html#monitoring)\\n* [Connections](https://www.rabbitmq.com/connections.html)\",\n \"id\": \"1d06679b-c603-4cbf-85a7-7c8f4594258f\",\n \"layout\": {\n \"h\": 3,\n \"i\": \"1d06679b-c603-4cbf-85a7-7c8f4594258f\",\n \"w\": 12,\n \"x\": 0,\n \"y\": 40\n },\n \"name\": \"Total connections\",\n \"options\": {\n \"legend\": {\n \"displayMode\": \"hidden\"\n },\n \"standardOptions\": {},\n \"thresholds\": {},\n \"tooltip\": {\n \"mode\": \"all\",\n \"sort\": \"none\"\n }\n },\n \"targets\": [\n {\n \"expr\": \"rabbitmq_connections * on(instance) group_left(rabbitmq_cluster, rabbitmq_node) rabbitmq_identity_info{rabbitmq_cluster=\\\"$rabbitmq_cluster\\\"}\",\n \"refId\": \"A\"\n }\n ],\n \"type\": \"timeseries\",\n \"version\": \"2.0.0\"\n },\n {\n \"custom\": {\n \"drawStyle\": \"lines\",\n \"fillOpacity\": 0,\n \"lineInterpolation\": \"smooth\",\n \"stack\": \"off\"\n },\n \"datasourceCate\": \"prometheus\",\n \"datasourceValue\": \"${prom}\",\n \"description\": \"The rate of new connections opened by clients. Connections are expected to be long-lived.\\n\\nLow sustained values above zero are to be expected. High rates may be indicative of connection churn or mass connection recovery.\\n\\n* [Connection Leak](https://www.rabbitmq.com/connections.html#monitoring)\\n* [Connections](https://www.rabbitmq.com/connections.html)\",\n \"id\": \"8c91f7fe-79e9-454a-9dd3-6f214a29e1eb\",\n \"layout\": {\n \"h\": 3,\n \"i\": \"8c91f7fe-79e9-454a-9dd3-6f214a29e1eb\",\n \"w\": 6,\n \"x\": 12,\n \"y\": 40\n },\n \"name\": \"Connections opened / s\",\n \"options\": {\n \"legend\": {\n \"displayMode\": \"hidden\"\n },\n \"standardOptions\": {},\n \"thresholds\": {},\n \"tooltip\": {\n \"mode\": \"all\",\n \"sort\": \"none\"\n }\n },\n \"targets\": [\n {\n \"expr\": \"sum(rate(rabbitmq_connections_opened_total[60s]) * on(instance) group_left(rabbitmq_cluster, rabbitmq_node) rabbitmq_identity_info{rabbitmq_cluster=\\\"$rabbitmq_cluster\\\"}) by(rabbitmq_node)\",\n \"refId\": \"A\"\n }\n ],\n \"type\": \"timeseries\",\n \"version\": \"2.0.0\"\n }\n ],\n \"var\": [\n {\n \"definition\": \"prometheus\",\n \"name\": \"prom\",\n \"type\": \"datasource\"\n },\n {\n \"datasource\": {\n \"cate\": \"prometheus\",\n \"value\": \"${prom}\"\n },\n \"definition\": \"label_values(rabbitmq_identity_info, rabbitmq_cluster)\",\n \"name\": \"rabbitmq_cluster\",\n \"type\": \"query\"\n }\n ],\n \"version\": \"3.0.0\"\n },\n \"public\": 0,\n \"public_cate\": 0,\n \"bgids\": null,\n \"built_in\": 0,\n \"hide\": 0,\n \"uuid\": 1717556328323134000\n}"
},
{
"path": "integrations/RabbitMQ/dashboards/rabbitmq_v3.8_gt.json",
"content": "{\n \"id\": 0,\n \"group_id\": 0,\n \"name\": \"RabbitMQ 3.8+\",\n \"ident\": \"\",\n \"tags\": \"\",\n \"create_at\": 0,\n \"create_by\": \"\",\n \"update_at\": 0,\n \"update_by\": \"\",\n \"configs\": {\n \"panels\": [\n {\n \"collapsed\": true,\n \"id\": \"4466a232-248d-45a8-bf4d-05d5139c7346\",\n \"layout\": {\n \"h\": 1,\n \"i\": \"4466a232-248d-45a8-bf4d-05d5139c7346\",\n \"w\": 24,\n \"x\": 0,\n \"y\": 0\n },\n \"name\": \"Overview\",\n \"type\": \"row\"\n },\n {\n \"custom\": {\n \"calc\": \"lastNotNull\",\n \"colSpan\": 1,\n \"colorMode\": \"background\",\n \"textMode\": \"valueAndName\",\n \"textSize\": {}\n },\n \"datasourceCate\": \"prometheus\",\n \"datasourceValue\": \"${prom}\",\n \"id\": \"a20b5d06-4343-457a-89f2-33a52c4dec04\",\n \"layout\": {\n \"h\": 3,\n \"i\": \"a20b5d06-4343-457a-89f2-33a52c4dec04\",\n \"w\": 7,\n \"x\": 0,\n \"y\": 1\n },\n \"name\": \"Ready messages\",\n \"options\": {\n \"standardOptions\": {},\n \"valueMappings\": [\n {\n \"match\": {\n \"from\": 10000\n },\n \"result\": {\n \"color\": \"#4a90e2\"\n },\n \"type\": \"range\"\n },\n {\n \"match\": {\n \"from\": 100000\n },\n \"result\": {\n \"color\": \"#f50a0a\"\n },\n \"type\": \"range\"\n },\n {\n \"match\": {\n \"to\": 9999\n },\n \"result\": {\n \"color\": \"#417505\"\n },\n \"type\": \"range\"\n }\n ]\n },\n \"targets\": [\n {\n \"expr\": \"sum(rabbitmq_queue_messages_ready * on(instance) group_left(rabbitmq_cluster) rabbitmq_identity_info{rabbitmq_cluster=\\\"$rabbitmq_cluster\\\"})\",\n \"refId\": \"A\"\n }\n ],\n \"type\": \"stat\",\n \"version\": \"2.0.0\"\n },\n {\n \"custom\": {\n \"calc\": \"lastNotNull\",\n \"colSpan\": 1,\n \"colorMode\": \"background\",\n \"textMode\": \"valueAndName\",\n \"textSize\": {}\n },\n \"datasourceCate\": \"prometheus\",\n \"datasourceValue\": \"${prom}\",\n \"id\": \"893409b0-4ca0-450b-a0c9-f48eddf0e243\",\n \"layout\": {\n \"h\": 3,\n \"i\": \"893409b0-4ca0-450b-a0c9-f48eddf0e243\",\n \"w\": 5,\n \"x\": 7,\n \"y\": 1\n },\n \"name\": \"Incoming messages / s\",\n \"options\": {\n \"standardOptions\": {},\n \"valueMappings\": [\n {\n \"match\": {\n \"from\": 50\n },\n \"result\": {\n \"color\": \"#417505\"\n },\n \"type\": \"range\"\n }\n ]\n },\n \"targets\": [\n {\n \"expr\": \"sum(rate(rabbitmq_channel_messages_published_total[60s]) * on(instance) group_left(rabbitmq_cluster) rabbitmq_identity_info{rabbitmq_cluster=\\\"$rabbitmq_cluster\\\"})\",\n \"refId\": \"A\"\n }\n ],\n \"type\": \"stat\",\n \"version\": \"2.0.0\"\n },\n {\n \"custom\": {\n \"calc\": \"lastNotNull\",\n \"colSpan\": 1,\n \"colorMode\": \"background\",\n \"textMode\": \"valueAndName\",\n \"textSize\": {}\n },\n \"datasourceCate\": \"prometheus\",\n \"datasourceValue\": \"${prom}\",\n \"id\": \"d596e7f0-5095-420e-bc38-674001dcf5f4\",\n \"layout\": {\n \"h\": 3,\n \"i\": \"d596e7f0-5095-420e-bc38-674001dcf5f4\",\n \"w\": 4,\n \"x\": 12,\n \"y\": 1\n },\n \"name\": \"Publishers\",\n \"options\": {\n \"standardOptions\": {},\n \"valueMappings\": [\n {\n \"match\": {\n \"from\": 10\n },\n \"result\": {\n \"color\": \"#417505\"\n },\n \"type\": \"range\"\n }\n ]\n },\n \"targets\": [\n {\n \"expr\": \"sum(rabbitmq_channels * on(instance) group_left(rabbitmq_cluster) rabbitmq_identity_info{rabbitmq_cluster=\\\"$rabbitmq_cluster\\\"}) - sum(rabbitmq_channel_consumers * on(instance) group_left(rabbitmq_cluster) rabbitmq_identity_info{rabbitmq_cluster=\\\"$rabbitmq_cluster\\\"})\",\n \"refId\": \"A\"\n }\n ],\n \"type\": \"stat\",\n \"version\": \"2.0.0\"\n },\n {\n \"custom\": {\n \"calc\": \"lastNotNull\",\n \"colSpan\": 1,\n \"colorMode\": \"background\",\n \"textMode\": \"valueAndName\",\n \"textSize\": {}\n },\n \"datasourceCate\": \"prometheus\",\n \"datasourceValue\": \"${prom}\",\n \"id\": \"9f6d7dee-666d-4e1b-90d0-129b2e5ba085\",\n \"layout\": {\n \"h\": 3,\n \"i\": \"9f6d7dee-666d-4e1b-90d0-129b2e5ba085\",\n \"w\": 4,\n \"x\": 16,\n \"y\": 1\n },\n \"name\": \"Connections\",\n \"options\": {\n \"standardOptions\": {},\n \"valueMappings\": [\n {\n \"match\": {\n \"from\": 10\n },\n \"result\": {\n \"color\": \"#417505\"\n },\n \"type\": \"range\"\n }\n ]\n },\n \"targets\": [\n {\n \"expr\": \"sum(rabbitmq_connections * on(instance) group_left(rabbitmq_cluster) rabbitmq_identity_info{rabbitmq_cluster=\\\"$rabbitmq_cluster\\\"})\",\n \"refId\": \"A\"\n }\n ],\n \"type\": \"stat\",\n \"version\": \"2.0.0\"\n },\n {\n \"custom\": {\n \"calc\": \"lastNotNull\",\n \"colSpan\": 1,\n \"colorMode\": \"background\",\n \"textMode\": \"valueAndName\",\n \"textSize\": {}\n },\n \"datasourceCate\": \"prometheus\",\n \"datasourceValue\": \"${prom}\",\n \"id\": \"910eae0f-2b78-4d10-a780-8f997f6e96cb\",\n \"layout\": {\n \"h\": 3,\n \"i\": \"910eae0f-2b78-4d10-a780-8f997f6e96cb\",\n \"w\": 4,\n \"x\": 20,\n \"y\": 1\n },\n \"name\": \"Queues\",\n \"options\": {\n \"standardOptions\": {},\n \"valueMappings\": [\n {\n \"match\": {\n \"from\": 10\n },\n \"result\": {\n \"color\": \"#417505\"\n },\n \"type\": \"range\"\n }\n ]\n },\n \"targets\": [\n {\n \"expr\": \"sum(rabbitmq_queues * on(instance) group_left(rabbitmq_cluster) rabbitmq_identity_info{rabbitmq_cluster=\\\"$rabbitmq_cluster\\\"})\",\n \"refId\": \"A\"\n }\n ],\n \"type\": \"stat\",\n \"version\": \"2.0.0\"\n },\n {\n \"custom\": {\n \"calc\": \"lastNotNull\",\n \"colSpan\": 1,\n \"colorMode\": \"background\",\n \"textMode\": \"valueAndName\",\n \"textSize\": {}\n },\n \"datasourceCate\": \"prometheus\",\n \"datasourceValue\": \"${prom}\",\n \"id\": \"2e8cd60f-51b0-46b2-8c0f-bf55604d340d\",\n \"layout\": {\n \"h\": 3,\n \"i\": \"2e8cd60f-51b0-46b2-8c0f-bf55604d340d\",\n \"w\": 7,\n \"x\": 0,\n \"y\": 2\n },\n \"name\": \"Unacknowledged messages\",\n \"options\": {\n \"standardOptions\": {},\n \"valueMappings\": [\n {\n \"match\": {\n \"to\": 99\n },\n \"result\": {\n \"color\": \"#417505\"\n },\n \"type\": \"range\"\n },\n {\n \"match\": {\n \"from\": 100\n },\n \"result\": {\n \"color\": \"#4a90e2\"\n },\n \"type\": \"range\"\n },\n {\n \"match\": {\n \"from\": 500\n },\n \"result\": {\n \"color\": \"#d0021b\"\n },\n \"type\": \"range\"\n }\n ]\n },\n \"targets\": [\n {\n \"expr\": \"sum(rabbitmq_queue_messages_unacked * on(instance) group_left(rabbitmq_cluster) rabbitmq_identity_info{rabbitmq_cluster=\\\"$rabbitmq_cluster\\\"})\",\n \"refId\": \"A\"\n }\n ],\n \"type\": \"stat\",\n \"version\": \"2.0.0\"\n },\n {\n \"custom\": {\n \"calc\": \"lastNotNull\",\n \"colSpan\": 1,\n \"colorMode\": \"background\",\n \"textMode\": \"valueAndName\",\n \"textSize\": {}\n },\n \"datasourceCate\": \"prometheus\",\n \"datasourceValue\": \"${prom}\",\n \"id\": \"4b242c1e-85d5-48b3-8cce-b467209245ec\",\n \"layout\": {\n \"h\": 3,\n \"i\": \"4b242c1e-85d5-48b3-8cce-b467209245ec\",\n \"w\": 5,\n \"x\": 7,\n \"y\": 2\n },\n \"name\": \"Outgoing messages / s\",\n \"options\": {\n \"standardOptions\": {},\n \"valueMappings\": [\n {\n \"match\": {\n \"from\": 50\n },\n \"result\": {\n \"color\": \"#417505\"\n },\n \"type\": \"range\"\n }\n ]\n },\n \"targets\": [\n {\n \"expr\": \"sum(rate(rabbitmq_channel_messages_redelivered_total[60s]) * on(instance) group_left(rabbitmq_cluster) rabbitmq_identity_info{rabbitmq_cluster=\\\"$rabbitmq_cluster\\\"}) +\\nsum(rate(rabbitmq_channel_messages_delivered_total[60s]) * on(instance) group_left(rabbitmq_cluster) rabbitmq_identity_info{rabbitmq_cluster=\\\"$rabbitmq_cluster\\\"}) +\\nsum(rate(rabbitmq_channel_messages_delivered_ack_total[60s]) * on(instance) group_left(rabbitmq_cluster) rabbitmq_identity_info{rabbitmq_cluster=\\\"$rabbitmq_cluster\\\"}) +\\nsum(rate(rabbitmq_channel_get_total[60s]) * on(instance) group_left(rabbitmq_cluster) rabbitmq_identity_info{rabbitmq_cluster=\\\"$rabbitmq_cluster\\\"}) +\\nsum(rate(rabbitmq_channel_get_ack_total[60s]) * on(instance) group_left(rabbitmq_cluster) rabbitmq_identity_info{rabbitmq_cluster=\\\"$rabbitmq_cluster\\\"})\",\n \"refId\": \"A\"\n }\n ],\n \"type\": \"stat\",\n \"version\": \"2.0.0\"\n },\n {\n \"custom\": {\n \"calc\": \"lastNotNull\",\n \"colSpan\": 1,\n \"colorMode\": \"background\",\n \"textMode\": \"valueAndName\",\n \"textSize\": {}\n },\n \"datasourceCate\": \"prometheus\",\n \"datasourceValue\": \"${prom}\",\n \"id\": \"b87b1c6b-644a-42f4-915a-bd6857540f70\",\n \"layout\": {\n \"h\": 3,\n \"i\": \"b87b1c6b-644a-42f4-915a-bd6857540f70\",\n \"w\": 4,\n \"x\": 12,\n \"y\": 2\n },\n \"name\": \"Consumers\",\n \"options\": {\n \"standardOptions\": {},\n \"valueMappings\": [\n {\n \"match\": {\n \"from\": 10\n },\n \"result\": {\n \"color\": \"#417505\"\n },\n \"type\": \"range\"\n }\n ]\n },\n \"targets\": [\n {\n \"expr\": \"sum(rabbitmq_channel_consumers * on(instance) group_left(rabbitmq_cluster) rabbitmq_identity_info{rabbitmq_cluster=\\\"$rabbitmq_cluster\\\"})\",\n \"refId\": \"A\"\n }\n ],\n \"type\": \"stat\",\n \"version\": \"2.0.0\"\n },\n {\n \"custom\": {\n \"calc\": \"lastNotNull\",\n \"colSpan\": 1,\n \"colorMode\": \"background\",\n \"textMode\": \"valueAndName\",\n \"textSize\": {}\n },\n \"datasourceCate\": \"prometheus\",\n \"datasourceValue\": \"${prom}\",\n \"id\": \"65103bcf-fb21-488d-a06b-7b0ea130ca4d\",\n \"layout\": {\n \"h\": 3,\n \"i\": \"65103bcf-fb21-488d-a06b-7b0ea130ca4d\",\n \"w\": 4,\n \"x\": 16,\n \"y\": 2\n },\n \"name\": \"Channels\",\n \"options\": {\n \"standardOptions\": {},\n \"valueMappings\": [\n {\n \"match\": {\n \"from\": 10\n },\n \"result\": {\n \"color\": \"#417505\"\n },\n \"type\": \"range\"\n }\n ]\n },\n \"targets\": [\n {\n \"expr\": \"sum(rabbitmq_channels * on(instance) group_left(rabbitmq_cluster) rabbitmq_identity_info{rabbitmq_cluster=\\\"$rabbitmq_cluster\\\"})\",\n \"refId\": \"A\"\n }\n ],\n \"type\": \"stat\",\n \"version\": \"2.0.0\"\n },\n {\n \"custom\": {\n \"calc\": \"lastNotNull\",\n \"colSpan\": 1,\n \"colorMode\": \"background\",\n \"textMode\": \"valueAndName\",\n \"textSize\": {}\n },\n \"datasourceCate\": \"prometheus\",\n \"datasourceValue\": \"${prom}\",\n \"id\": \"c6454712-e265-4387-ae86-9ac865af46f2\",\n \"layout\": {\n \"h\": 3,\n \"i\": \"c6454712-e265-4387-ae86-9ac865af46f2\",\n \"w\": 4,\n \"x\": 20,\n \"y\": 2\n },\n \"name\": \"Nodes\",\n \"options\": {\n \"standardOptions\": {},\n \"valueMappings\": [\n {\n \"match\": {\n \"from\": 3,\n \"to\": null\n },\n \"result\": {\n \"color\": \"#417505\"\n },\n \"type\": \"range\"\n },\n {\n \"match\": {\n \"from\": 8\n },\n \"result\": {\n \"color\": \"#e70909\"\n },\n \"type\": \"range\"\n }\n ]\n },\n \"targets\": [\n {\n \"expr\": \"sum(rabbitmq_build_info * on(instance) group_left(rabbitmq_cluster) rabbitmq_identity_info{rabbitmq_cluster=\\\"$rabbitmq_cluster\\\"})\",\n \"refId\": \"A\"\n }\n ],\n \"type\": \"stat\",\n \"version\": \"2.0.0\"\n },\n {\n \"collapsed\": true,\n \"id\": \"1712a96f-bcde-4d33-90b6-e2eba20527b9\",\n \"layout\": {\n \"h\": 1,\n \"i\": \"1712a96f-bcde-4d33-90b6-e2eba20527b9\",\n \"w\": 24,\n \"x\": 0,\n \"y\": 5\n },\n \"name\": \"Nodes\",\n \"type\": \"row\"\n },\n {\n \"custom\": {\n \"calc\": \"lastNotNull\",\n \"columns\": [\n \"rabbitmq_cluster\",\n \"rabbitmq_node\",\n \"rabbitmq_version\",\n \"erlang_version\"\n ],\n \"displayMode\": \"labelsOfSeriesToRows\",\n \"showHeader\": true\n },\n \"datasourceCate\": \"prometheus\",\n \"datasourceValue\": \"${prom}\",\n \"id\": \"1b3fdea0-1921-48ae-b11f-31cc27f816b0\",\n \"layout\": {\n \"h\": 3,\n \"i\": \"1b3fdea0-1921-48ae-b11f-31cc27f816b0\",\n \"w\": 24,\n \"x\": 0,\n \"y\": 6\n },\n \"name\": \"nodes\",\n \"options\": {\n \"standardOptions\": {}\n },\n \"overrides\": [\n {}\n ],\n \"targets\": [\n {\n \"expr\": \"rabbitmq_build_info * on(instance) group_left(rabbitmq_cluster, rabbitmq_node) rabbitmq_identity_info{rabbitmq_cluster=\\\"$rabbitmq_cluster\\\"}\",\n \"refId\": \"A\"\n }\n ],\n \"type\": \"table\",\n \"version\": \"2.0.0\"\n },\n {\n \"custom\": {\n \"drawStyle\": \"lines\",\n \"fillOpacity\": 0.3,\n \"gradientMode\": \"opacity\",\n \"lineInterpolation\": \"smooth\",\n \"lineWidth\": 2,\n \"stack\": \"off\"\n },\n \"datasourceCate\": \"prometheus\",\n \"datasourceValue\": \"${prom}\",\n \"description\": \"If the value is zero or less, the memory alarm will be triggered and all publishing connections across all cluster nodes will be blocked.\\n\\nThis value can temporarily go negative because the memory alarm is triggered with a slight delay.\\n\\nThe kernel's view of the amount of memory used by the node can differ from what the node itself can observe. This means that this value can be negative for a sustained period of time.\\n\\nBy default nodes use resident set size (RSS) to compute how much memory they use. This strategy can be changed (see the guides below).\\n\\n* [Alarms](https://www.rabbitmq.com/alarms.html)\\n* [Memory Alarms](https://www.rabbitmq.com/memory.html)\\n* [Reasoning About Memory Use](https://www.rabbitmq.com/memory-use.html)\\n* [Blocked Connection Notifications](https://www.rabbitmq.com/connection-blocked.html)\",\n \"id\": \"b91068ed-0914-4a8d-91dd-9ffb3b692516\",\n \"layout\": {\n \"h\": 7,\n \"i\": \"b91068ed-0914-4a8d-91dd-9ffb3b692516\",\n \"w\": 8,\n \"x\": 0,\n \"y\": 7\n },\n \"name\": \"Memory available before publishers blocked\",\n \"options\": {\n \"legend\": {\n \"displayMode\": \"hidden\"\n },\n \"standardOptions\": {\n \"decimals\": 1\n },\n \"thresholds\": {},\n \"tooltip\": {\n \"mode\": \"all\",\n \"sort\": \"none\"\n }\n },\n \"targets\": [\n {\n \"expr\": \"(rabbitmq_resident_memory_limit_bytes * on(instance) group_left(rabbitmq_cluster, rabbitmq_node) rabbitmq_identity_info{rabbitmq_cluster=\\\"$rabbitmq_cluster\\\"}) -\\n(rabbitmq_process_resident_memory_bytes * on(instance) group_left(rabbitmq_cluster, rabbitmq_node) rabbitmq_identity_info{rabbitmq_cluster=\\\"$rabbitmq_cluster\\\"})\",\n \"refId\": \"A\"\n }\n ],\n \"type\": \"timeseries\",\n \"version\": \"2.0.0\"\n },\n {\n \"custom\": {\n \"drawStyle\": \"lines\",\n \"fillOpacity\": 0.3,\n \"gradientMode\": \"opacity\",\n \"lineInterpolation\": \"smooth\",\n \"lineWidth\": 2,\n \"stack\": \"off\"\n },\n \"datasourceCate\": \"prometheus\",\n \"datasourceValue\": \"${prom}\",\n \"description\": \"This metric is reported for the partition where the RabbitMQ data directory is stored.\\n\\nIf the value is zero or less, the disk alarm will be triggered and all publishing connections across all cluster nodes will be blocked.\\n\\nThis value can temporarily go negative because the free disk space alarm is triggered with a slight delay.\\n\\n* [Alarms](https://www.rabbitmq.com/alarms.html)\\n* [Disk Space Alarms](https://www.rabbitmq.com/disk-alarms.html)\\n* [Disk Space](https://www.rabbitmq.com/production-checklist.html#resource-limits-disk-space)\\n* [Persistence Configuration](https://www.rabbitmq.com/persistence-conf.html)\\n* [Blocked Connection Notifications](https://www.rabbitmq.com/connection-blocked.html)\",\n \"id\": \"a74ca489-6101-49bc-9560-4cde368bc47e\",\n \"layout\": {\n \"h\": 7,\n \"i\": \"a74ca489-6101-49bc-9560-4cde368bc47e\",\n \"w\": 8,\n \"x\": 8,\n \"y\": 7\n },\n \"name\": \"Disk space available before publishers blocked\",\n \"options\": {\n \"legend\": {\n \"displayMode\": \"hidden\"\n },\n \"standardOptions\": {\n \"decimals\": 1\n },\n \"thresholds\": {},\n \"tooltip\": {\n \"mode\": \"all\",\n \"sort\": \"none\"\n }\n },\n \"targets\": [\n {\n \"expr\": \"rabbitmq_disk_space_available_bytes * on(instance) group_left(rabbitmq_cluster, rabbitmq_node) rabbitmq_identity_info{rabbitmq_cluster=\\\"$rabbitmq_cluster\\\"}\",\n \"refId\": \"A\"\n }\n ],\n \"type\": \"timeseries\",\n \"version\": \"2.0.0\"\n },\n {\n \"custom\": {\n \"drawStyle\": \"lines\",\n \"fillOpacity\": 0.3,\n \"gradientMode\": \"opacity\",\n \"lineInterpolation\": \"smooth\",\n \"lineWidth\": 2,\n \"stack\": \"off\"\n },\n \"datasourceCate\": \"prometheus\",\n \"datasourceValue\": \"${prom}\",\n \"description\": \"When this value reaches zero, new connections will not be accepted and disk write operations may fail.\\n\\nClient libraries, peer nodes and CLI tools will not be able to connect when the node runs out of available file descriptors.\\n\\n* [Open File Handles Limit](https://www.rabbitmq.com/production-checklist.html#resource-limits-file-handle-limit)\",\n \"id\": \"100ed9ae-2b84-4f2b-82b2-0444dd28deed\",\n \"layout\": {\n \"h\": 3,\n \"i\": \"100ed9ae-2b84-4f2b-82b2-0444dd28deed\",\n \"w\": 8,\n \"x\": 16,\n \"y\": 7\n },\n \"name\": \"File descriptors available\",\n \"options\": {\n \"legend\": {\n \"displayMode\": \"hidden\"\n },\n \"standardOptions\": {},\n \"thresholds\": {},\n \"tooltip\": {\n \"mode\": \"all\",\n \"sort\": \"none\"\n }\n },\n \"targets\": [\n {\n \"expr\": \"(rabbitmq_process_max_fds * on(instance) group_left(rabbitmq_cluster, rabbitmq_node) rabbitmq_identity_info{rabbitmq_cluster=\\\"$rabbitmq_cluster\\\"}) -\\n(rabbitmq_process_open_fds * on(instance) group_left(rabbitmq_cluster, rabbitmq_node) rabbitmq_identity_info{rabbitmq_cluster=\\\"$rabbitmq_cluster\\\"})\",\n \"refId\": \"A\"\n }\n ],\n \"type\": \"timeseries\",\n \"version\": \"2.0.0\"\n },\n {\n \"custom\": {\n \"drawStyle\": \"lines\",\n \"fillOpacity\": 0.3,\n \"gradientMode\": \"opacity\",\n \"lineInterpolation\": \"smooth\",\n \"lineWidth\": 2,\n \"stack\": \"off\"\n },\n \"datasourceCate\": \"prometheus\",\n \"datasourceValue\": \"${prom}\",\n \"description\": \"When this value reaches zero, new connections will not be accepted.\\n\\nClient libraries, peer nodes and CLI tools will not be able to connect when the node runs out of available file descriptors.\\n\\n* [Networking and RabbitMQ](https://www.rabbitmq.com/networking.html)\",\n \"id\": \"a4859891-2538-47fc-946b-7ae3aa507c51\",\n \"layout\": {\n \"h\": 3,\n \"i\": \"a4859891-2538-47fc-946b-7ae3aa507c51\",\n \"w\": 8,\n \"x\": 16,\n \"y\": 8\n },\n \"name\": \"TCP sockets available\",\n \"options\": {\n \"legend\": {\n \"displayMode\": \"hidden\"\n },\n \"standardOptions\": {},\n \"thresholds\": {},\n \"tooltip\": {\n \"mode\": \"all\",\n \"sort\": \"none\"\n }\n },\n \"targets\": [\n {\n \"expr\": \"(rabbitmq_process_max_tcp_sockets * on(instance) group_left(rabbitmq_cluster, rabbitmq_node) rabbitmq_identity_info{rabbitmq_cluster=\\\"$rabbitmq_cluster\\\"}) -\\n(rabbitmq_process_open_tcp_sockets * on(instance) group_left(rabbitmq_cluster, rabbitmq_node) rabbitmq_identity_info{rabbitmq_cluster=\\\"$rabbitmq_cluster\\\"})\",\n \"refId\": \"A\"\n }\n ],\n \"type\": \"timeseries\",\n \"version\": \"2.0.0\"\n },\n {\n \"collapsed\": true,\n \"id\": \"fec98a71-0615-4782-bf8d-960529e243f9\",\n \"layout\": {\n \"h\": 1,\n \"i\": \"fec98a71-0615-4782-bf8d-960529e243f9\",\n \"w\": 24,\n \"x\": 0,\n \"y\": 14\n },\n \"name\": \"QUEUED MESSAGES\",\n \"type\": \"row\"\n },\n {\n \"custom\": {\n \"drawStyle\": \"lines\",\n \"fillOpacity\": 0.3,\n \"gradientMode\": \"opacity\",\n \"lineInterpolation\": \"smooth\",\n \"lineWidth\": 2,\n \"stack\": \"off\"\n },\n \"datasourceCate\": \"prometheus\",\n \"datasourceValue\": \"${prom}\",\n \"description\": \"Total number of ready messages ready to be delivered to consumers.\\n\\nAim to keep this value as low as possible. RabbitMQ behaves best when messages are flowing through it. It's OK for publishers to occasionally outpace consumers, but the expectation is that consumers will eventually process all ready messages.\\n\\nIf this metric keeps increasing, your system will eventually run out of memory and/or disk space. Consider using TTL or Queue Length Limit to prevent unbounded message growth.\\n\\n* [Queues](https://www.rabbitmq.com/queues.html)\\n* [Consumers](https://www.rabbitmq.com/consumers.html)\\n* [Queue Length Limit](https://www.rabbitmq.com/maxlength.html)\\n* [Time-To-Live and Expiration](https://www.rabbitmq.com/ttl.html)\",\n \"id\": \"145dc75a-d3b8-491f-9ba6-6da787c8e265\",\n \"layout\": {\n \"h\": 3,\n \"i\": \"145dc75a-d3b8-491f-9ba6-6da787c8e265\",\n \"w\": 12,\n \"x\": 0,\n \"y\": 15\n },\n \"name\": \"Messages ready to be delivered to consumers\",\n \"options\": {\n \"legend\": {\n \"displayMode\": \"hidden\"\n },\n \"standardOptions\": {},\n \"thresholds\": {},\n \"tooltip\": {\n \"mode\": \"all\",\n \"sort\": \"none\"\n }\n },\n \"targets\": [\n {\n \"expr\": \"sum(rabbitmq_queue_messages_ready * on(instance) group_left(rabbitmq_cluster, rabbitmq_node) rabbitmq_identity_info{rabbitmq_cluster=\\\"$rabbitmq_cluster\\\"}) by(rabbitmq_node)\",\n \"refId\": \"A\"\n }\n ],\n \"type\": \"timeseries\",\n \"version\": \"2.0.0\"\n },\n {\n \"custom\": {\n \"drawStyle\": \"lines\",\n \"fillOpacity\": 0.3,\n \"gradientMode\": \"opacity\",\n \"lineInterpolation\": \"smooth\",\n \"lineWidth\": 2,\n \"stack\": \"off\"\n },\n \"datasourceCate\": \"prometheus\",\n \"datasourceValue\": \"${prom}\",\n \"description\": \"The total number of messages that are either in-flight to consumers, currently being processed by consumers or simply waiting for the consumer acknowledgements to be processed by the queue. Until the queue processes the message acknowledgement, the message will remain unacknowledged.\\n\\n* [Queues](https://www.rabbitmq.com/queues.html)\\n* [Confirms and Acknowledgements](https://www.rabbitmq.com/confirms.html)\\n* [Consumer Prefetch](https://www.rabbitmq.com/consumer-prefetch.html)\",\n \"id\": \"a6ca328a-8b19-488e-a70d-74372f994901\",\n \"layout\": {\n \"h\": 3,\n \"i\": \"a6ca328a-8b19-488e-a70d-74372f994901\",\n \"w\": 12,\n \"x\": 12,\n \"y\": 15\n },\n \"name\": \"Messages pending consumer acknowledgement\",\n \"options\": {\n \"legend\": {\n \"displayMode\": \"hidden\"\n },\n \"standardOptions\": {},\n \"thresholds\": {},\n \"tooltip\": {\n \"mode\": \"all\",\n \"sort\": \"none\"\n }\n },\n \"targets\": [\n {\n \"expr\": \"sum(rabbitmq_queue_messages_unacked * on(instance) group_left(rabbitmq_cluster, rabbitmq_node) rabbitmq_identity_info{rabbitmq_cluster=\\\"$rabbitmq_cluster\\\"}) by(rabbitmq_node)\",\n \"refId\": \"A\"\n }\n ],\n \"type\": \"timeseries\",\n \"version\": \"2.0.0\"\n },\n {\n \"collapsed\": true,\n \"id\": \"500c51ed-a0d6-41d9-903f-d000e289dc2b\",\n \"layout\": {\n \"h\": 1,\n \"i\": \"500c51ed-a0d6-41d9-903f-d000e289dc2b\",\n \"w\": 24,\n \"x\": 0,\n \"y\": 18\n },\n \"name\": \"INCOMING MESSAGES\",\n \"type\": \"row\"\n },\n {\n \"custom\": {\n \"drawStyle\": \"lines\",\n \"fillOpacity\": 0.3,\n \"gradientMode\": \"opacity\",\n \"lineInterpolation\": \"smooth\",\n \"lineWidth\": 2,\n \"stack\": \"off\"\n },\n \"datasourceCate\": \"prometheus\",\n \"datasourceValue\": \"${prom}\",\n \"description\": \"The incoming message rate before any routing rules are applied.\\n\\nIf this value is lower than the number of messages published to queues, it may indicate that some messages are delivered to more than one queue.\\n\\nIf this value is higher than the number of messages published to queues, messages cannot be routed and will either be dropped or returned to publishers.\\n\\n* [Publishers](https://www.rabbitmq.com/publishers.html)\",\n \"id\": \"ef4352a4-c281-4596-b89e-d79a565ca112\",\n \"layout\": {\n \"h\": 3,\n \"i\": \"ef4352a4-c281-4596-b89e-d79a565ca112\",\n \"w\": 12,\n \"x\": 0,\n \"y\": 19\n },\n \"name\": \"Messages published / s\",\n \"options\": {\n \"legend\": {\n \"displayMode\": \"hidden\"\n },\n \"standardOptions\": {},\n \"thresholds\": {},\n \"tooltip\": {\n \"mode\": \"all\",\n \"sort\": \"none\"\n }\n },\n \"targets\": [\n {\n \"expr\": \"sum(rate(rabbitmq_channel_messages_published_total[60s]) * on(instance) group_left(rabbitmq_cluster, rabbitmq_node) rabbitmq_identity_info{rabbitmq_cluster=\\\"$rabbitmq_cluster\\\"}) by(rabbitmq_node)\",\n \"refId\": \"A\"\n }\n ],\n \"type\": \"timeseries\",\n \"version\": \"2.0.0\"\n },\n {\n \"custom\": {\n \"drawStyle\": \"lines\",\n \"fillOpacity\": 0.3,\n \"gradientMode\": \"opacity\",\n \"lineInterpolation\": \"smooth\",\n \"lineWidth\": 2,\n \"stack\": \"off\"\n },\n \"datasourceCate\": \"prometheus\",\n \"datasourceValue\": \"${prom}\",\n \"description\": \"The rate of messages confirmed by the broker to publishers. Publishers must opt-in to receive message confirmations.\\n\\nIf this metric is consistently at zero it may suggest that publisher confirms are not used by clients. The safety of published messages is likely to be at risk.\\n\\n* [Publisher Confirms](https://www.rabbitmq.com/confirms.html#publisher-confirms)\\n* [Publisher Confirms and Data Safety](https://www.rabbitmq.com/publishers.html#data-safety)\\n* [When Will Published Messages Be Confirmed by the Broker?](https://www.rabbitmq.com/confirms.html#when-publishes-are-confirmed)\",\n \"id\": \"f0932549-d4a7-4eb1-a86e-35eb49569f29\",\n \"layout\": {\n \"h\": 3,\n \"i\": \"f0932549-d4a7-4eb1-a86e-35eb49569f29\",\n \"w\": 12,\n \"x\": 12,\n \"y\": 19\n },\n \"name\": \"Messages confirmed to publishers / s\",\n \"options\": {\n \"legend\": {\n \"displayMode\": \"hidden\"\n },\n \"standardOptions\": {},\n \"thresholds\": {},\n \"tooltip\": {\n \"mode\": \"all\",\n \"sort\": \"none\"\n }\n },\n \"targets\": [\n {\n \"expr\": \"sum(rate(rabbitmq_channel_messages_confirmed_total[60s]) * on(instance) group_left(rabbitmq_cluster, rabbitmq_node) rabbitmq_identity_info{rabbitmq_cluster=\\\"$rabbitmq_cluster\\\"}) by(rabbitmq_node)\",\n \"refId\": \"A\"\n }\n ],\n \"type\": \"timeseries\",\n \"version\": \"2.0.0\"\n },\n {\n \"custom\": {\n \"drawStyle\": \"lines\",\n \"fillOpacity\": 0.3,\n \"gradientMode\": \"opacity\",\n \"lineInterpolation\": \"smooth\",\n \"lineWidth\": 2,\n \"stack\": \"off\"\n },\n \"datasourceCate\": \"prometheus\",\n \"datasourceValue\": \"${prom}\",\n \"description\": \"The rate of messages received from publishers and successfully routed to the master queue replicas.\\n\\n* [Queues](https://www.rabbitmq.com/queues.html)\\n* [Publishers](https://www.rabbitmq.com/publishers.html)\",\n \"id\": \"f47766cb-3cdb-4f67-896f-77af421ff404\",\n \"layout\": {\n \"h\": 3,\n \"i\": \"f47766cb-3cdb-4f67-896f-77af421ff404\",\n \"w\": 12,\n \"x\": 0,\n \"y\": 20\n },\n \"name\": \"Messages routed to queues / s\",\n \"options\": {\n \"legend\": {\n \"displayMode\": \"hidden\"\n },\n \"standardOptions\": {},\n \"thresholds\": {},\n \"tooltip\": {\n \"mode\": \"all\",\n \"sort\": \"none\"\n }\n },\n \"targets\": [\n {\n \"expr\": \"sum(rate(rabbitmq_queue_messages_published_total[60s]) * on(instance) group_left(rabbitmq_cluster, rabbitmq_node) rabbitmq_identity_info{rabbitmq_cluster=\\\"$rabbitmq_cluster\\\"}) by(rabbitmq_node)\",\n \"refId\": \"A\"\n }\n ],\n \"type\": \"timeseries\",\n \"version\": \"2.0.0\"\n },\n {\n \"custom\": {\n \"drawStyle\": \"lines\",\n \"fillOpacity\": 0.3,\n \"gradientMode\": \"opacity\",\n \"lineInterpolation\": \"smooth\",\n \"lineWidth\": 2,\n \"stack\": \"off\"\n },\n \"datasourceCate\": \"prometheus\",\n \"datasourceValue\": \"${prom}\",\n \"description\": \"The rate of messages received from publishers that have publisher confirms enabled and the broker has not confirmed yet.\\n\\n* [Publishers](https://www.rabbitmq.com/publishers.html)\\n* [Confirms and Acknowledgements](https://www.rabbitmq.com/confirms.html)\\n* [When Will Published Messages Be Confirmed by the Broker?](https://www.rabbitmq.com/confirms.html#when-publishes-are-confirmed)\",\n \"id\": \"644302ba-3c99-4787-8023-93770b0a9e6c\",\n \"layout\": {\n \"h\": 3,\n \"i\": \"644302ba-3c99-4787-8023-93770b0a9e6c\",\n \"w\": 12,\n \"x\": 12,\n \"y\": 20\n },\n \"name\": \"Messages unconfirmed to publishers / s\",\n \"options\": {\n \"legend\": {\n \"displayMode\": \"hidden\"\n },\n \"standardOptions\": {},\n \"thresholds\": {},\n \"tooltip\": {\n \"mode\": \"all\",\n \"sort\": \"none\"\n }\n },\n \"targets\": [\n {\n \"expr\": \"sum(rate(rabbitmq_channel_messages_unconfirmed[60s]) * on(instance) group_left(rabbitmq_cluster, rabbitmq_node) rabbitmq_identity_info{rabbitmq_cluster=\\\"$rabbitmq_cluster\\\"}) by(rabbitmq_node)\",\n \"refId\": \"A\"\n }\n ],\n \"type\": \"timeseries\",\n \"version\": \"2.0.0\"\n },\n {\n \"custom\": {\n \"drawStyle\": \"lines\",\n \"fillOpacity\": 0.3,\n \"gradientMode\": \"opacity\",\n \"lineInterpolation\": \"smooth\",\n \"lineWidth\": 2,\n \"stack\": \"off\"\n },\n \"datasourceCate\": \"prometheus\",\n \"datasourceValue\": \"${prom}\",\n \"description\": \"The rate of messages that cannot be routed and are dropped. \\n\\nAny value above zero means message loss and likely suggests a routing problem on the publisher end.\\n\\n* [Unroutable Message Handling](https://www.rabbitmq.com/publishers.html#unroutable)\",\n \"id\": \"0a3eadfd-d84c-4070-9527-b4c62fc20787\",\n \"layout\": {\n \"h\": 3,\n \"i\": \"0a3eadfd-d84c-4070-9527-b4c62fc20787\",\n \"w\": 12,\n \"x\": 0,\n \"y\": 21\n },\n \"name\": \"Unroutable messages dropped / s\",\n \"options\": {\n \"legend\": {\n \"displayMode\": \"hidden\"\n },\n \"standardOptions\": {},\n \"thresholds\": {},\n \"tooltip\": {\n \"mode\": \"all\",\n \"sort\": \"none\"\n }\n },\n \"targets\": [\n {\n \"expr\": \"sum(rate(rabbitmq_channel_messages_unroutable_dropped_total[60s]) * on(instance) group_left(rabbitmq_cluster, rabbitmq_node) rabbitmq_identity_info{rabbitmq_cluster=\\\"$rabbitmq_cluster\\\"}) by(rabbitmq_node)\",\n \"refId\": \"A\"\n }\n ],\n \"type\": \"timeseries\",\n \"version\": \"2.0.0\"\n },\n {\n \"custom\": {\n \"drawStyle\": \"lines\",\n \"fillOpacity\": 0.3,\n \"gradientMode\": \"opacity\",\n \"lineInterpolation\": \"smooth\",\n \"lineWidth\": 2,\n \"stack\": \"off\"\n },\n \"datasourceCate\": \"prometheus\",\n \"datasourceValue\": \"${prom}\",\n \"description\": \"The rate of messages that cannot be routed and are returned back to publishers.\\n\\nSustained values above zero may indicate a routing problem on the publisher end.\\n\\n* [Unroutable Message Handling](https://www.rabbitmq.com/publishers.html#unroutable)\\n* [When Will Published Messages Be Confirmed by the Broker?](https://www.rabbitmq.com/confirms.html#when-publishes-are-confirmed)\",\n \"id\": \"a14e8796-9614-4204-b5b8-5d1a47f356d8\",\n \"layout\": {\n \"h\": 3,\n \"i\": \"a14e8796-9614-4204-b5b8-5d1a47f356d8\",\n \"w\": 12,\n \"x\": 12,\n \"y\": 21\n },\n \"name\": \"Unroutable messages returned to publishers / s\",\n \"options\": {\n \"legend\": {\n \"displayMode\": \"hidden\"\n },\n \"standardOptions\": {},\n \"thresholds\": {},\n \"tooltip\": {\n \"mode\": \"all\",\n \"sort\": \"none\"\n }\n },\n \"targets\": [\n {\n \"expr\": \"sum(rate(rabbitmq_channel_messages_unroutable_returned_total[60s]) * on(instance) group_left(rabbitmq_cluster, rabbitmq_node) rabbitmq_identity_info{rabbitmq_cluster=\\\"$rabbitmq_cluster\\\"}) by(rabbitmq_node)\",\n \"refId\": \"A\"\n }\n ],\n \"type\": \"timeseries\",\n \"version\": \"2.0.0\"\n },\n {\n \"collapsed\": true,\n \"id\": \"2405258c-c08f-4e49-960a-5c9a12b29f12\",\n \"layout\": {\n \"h\": 1,\n \"i\": \"2405258c-c08f-4e49-960a-5c9a12b29f12\",\n \"w\": 24,\n \"x\": 0,\n \"y\": 24\n },\n \"name\": \"OUTGOING MESSAGES\",\n \"type\": \"row\"\n },\n {\n \"custom\": {\n \"drawStyle\": \"lines\",\n \"fillOpacity\": 0.3,\n \"gradientMode\": \"opacity\",\n \"lineInterpolation\": \"smooth\",\n \"lineWidth\": 2,\n \"stack\": \"off\"\n },\n \"datasourceCate\": \"prometheus\",\n \"datasourceValue\": \"${prom}\",\n \"description\": \"The rate of messages delivered to consumers. It includes messages that have been redelivered.\\n\\nThis metric does not include messages that have been fetched by consumers using `basic.get` (consumed by polling).\\n\\n* [Consumers](https://www.rabbitmq.com/consumers.html)\",\n \"id\": \"be0f1872-172c-4bc3-a901-4b645ebf5abe\",\n \"layout\": {\n \"h\": 3,\n \"i\": \"be0f1872-172c-4bc3-a901-4b645ebf5abe\",\n \"w\": 12,\n \"x\": 0,\n \"y\": 25\n },\n \"name\": \"Messages delivered / s\",\n \"options\": {\n \"legend\": {\n \"displayMode\": \"hidden\"\n },\n \"standardOptions\": {},\n \"thresholds\": {},\n \"tooltip\": {\n \"mode\": \"all\",\n \"sort\": \"none\"\n }\n },\n \"targets\": [\n {\n \"expr\": \"sum(\\n (rate(rabbitmq_channel_messages_delivered_total[60s]) * on(instance) group_left(rabbitmq_cluster, rabbitmq_node) rabbitmq_identity_info{rabbitmq_cluster=\\\"$rabbitmq_cluster\\\"}) +\\n (rate(rabbitmq_channel_messages_delivered_ack_total[60s]) * on(instance) group_left(rabbitmq_cluster, rabbitmq_node) rabbitmq_identity_info{rabbitmq_cluster=\\\"$rabbitmq_cluster\\\"})\\n) by(rabbitmq_node)\",\n \"refId\": \"A\"\n }\n ],\n \"type\": \"timeseries\",\n \"version\": \"2.0.0\"\n },\n {\n \"custom\": {\n \"drawStyle\": \"lines\",\n \"fillOpacity\": 0.3,\n \"gradientMode\": \"opacity\",\n \"lineInterpolation\": \"smooth\",\n \"lineWidth\": 2,\n \"stack\": \"off\"\n },\n \"datasourceCate\": \"prometheus\",\n \"datasourceValue\": \"${prom}\",\n \"description\": \"The rate of messages that have been redelivered to consumers. It includes messages that have been requeued automatically and redelivered due to channel exceptions or connection closures.\\n\\nHaving some redeliveries is expected, but if this metric is consistently non-zero, it is worth investigating why.\\n\\n* [Negative Acknowledgement and Requeuing of Deliveries](https://www.rabbitmq.com/confirms.html#consumer-nacks-requeue)\\n* [Consumers](https://www.rabbitmq.com/consumers.html)\",\n \"id\": \"eff794ca-e844-4a12-b230-690aadefa53f\",\n \"layout\": {\n \"h\": 3,\n \"i\": \"eff794ca-e844-4a12-b230-690aadefa53f\",\n \"w\": 12,\n \"x\": 12,\n \"y\": 25\n },\n \"name\": \"Messages redelivered / s\",\n \"options\": {\n \"legend\": {\n \"displayMode\": \"hidden\"\n },\n \"standardOptions\": {},\n \"thresholds\": {},\n \"tooltip\": {\n \"mode\": \"all\",\n \"sort\": \"none\"\n }\n },\n \"targets\": [\n {\n \"expr\": \"sum(rate(rabbitmq_channel_messages_redelivered_total[60s]) * on(instance) group_left(rabbitmq_cluster, rabbitmq_node) rabbitmq_identity_info{rabbitmq_cluster=\\\"$rabbitmq_cluster\\\"}) by(rabbitmq_node)\",\n \"refId\": \"A\"\n }\n ],\n \"type\": \"timeseries\",\n \"version\": \"2.0.0\"\n },\n {\n \"custom\": {\n \"drawStyle\": \"lines\",\n \"fillOpacity\": 0.3,\n \"gradientMode\": \"opacity\",\n \"lineInterpolation\": \"smooth\",\n \"lineWidth\": 2,\n \"stack\": \"off\"\n },\n \"datasourceCate\": \"prometheus\",\n \"datasourceValue\": \"${prom}\",\n \"description\": \"The rate of message deliveries to consumers that use manual acknowledgement mode.\\n\\nWhen this mode is used, RabbitMQ waits for consumers to acknowledge messages before more messages can be delivered.\\n\\nThis is the safest way of consuming messages.\\n\\n* [Consumer Acknowledgements](https://www.rabbitmq.com/confirms.html)\\n* [Consumer Prefetch](https://www.rabbitmq.com/consumer-prefetch.html)\\n* [Consumer Acknowledgement Modes, Prefetch and Throughput](https://www.rabbitmq.com/confirms.html#channel-qos-prefetch-throughput)\\n* [Consumers](https://www.rabbitmq.com/consumers.html)\",\n \"id\": \"2ed4be63-4fe9-462f-bc2f-967319bc3626\",\n \"layout\": {\n \"h\": 3,\n \"i\": \"2ed4be63-4fe9-462f-bc2f-967319bc3626\",\n \"w\": 12,\n \"x\": 0,\n \"y\": 26\n },\n \"name\": \"Messages delivered with manual ack / s\",\n \"options\": {\n \"legend\": {\n \"displayMode\": \"hidden\"\n },\n \"standardOptions\": {},\n \"thresholds\": {},\n \"tooltip\": {\n \"mode\": \"all\",\n \"sort\": \"none\"\n }\n },\n \"targets\": [\n {\n \"expr\": \"sum(rate(rabbitmq_channel_messages_delivered_ack_total[60s]) * on(instance) group_left(rabbitmq_cluster, rabbitmq_node) rabbitmq_identity_info{rabbitmq_cluster=\\\"$rabbitmq_cluster\\\"}) by(rabbitmq_node)\",\n \"refId\": \"A\"\n }\n ],\n \"type\": \"timeseries\",\n \"version\": \"2.0.0\"\n },\n {\n \"custom\": {\n \"drawStyle\": \"lines\",\n \"fillOpacity\": 0.3,\n \"gradientMode\": \"opacity\",\n \"lineInterpolation\": \"smooth\",\n \"lineWidth\": 2,\n \"stack\": \"off\"\n },\n \"datasourceCate\": \"prometheus\",\n \"datasourceValue\": \"${prom}\",\n \"description\": \"The rate of message deliveries to consumers that use automatic acknowledgement mode.\\n\\nWhen this mode is used, RabbitMQ does not wait for consumers to acknowledge message deliveries.\\n\\nThis mode is fire-and-forget and does not offer any delivery safety guarantees. It tends to provide higher throughput and it may lead to consumer overload and higher consumer memory usage.\\n\\n* [Consumer Acknowledgement Modes, Prefetch and Throughput](https://www.rabbitmq.com/confirms.html#channel-qos-prefetch-throughput)\\n* [Consumers](https://www.rabbitmq.com/consumers.html)\",\n \"id\": \"116c44e0-c8e1-4f02-8eae-2140997e2280\",\n \"layout\": {\n \"h\": 3,\n \"i\": \"116c44e0-c8e1-4f02-8eae-2140997e2280\",\n \"w\": 12,\n \"x\": 12,\n \"y\": 26\n },\n \"name\": \"Messages delivered auto ack / s\",\n \"options\": {\n \"legend\": {\n \"displayMode\": \"hidden\"\n },\n \"standardOptions\": {},\n \"thresholds\": {},\n \"tooltip\": {\n \"mode\": \"all\",\n \"sort\": \"none\"\n }\n },\n \"targets\": [\n {\n \"expr\": \"sum(rate(rabbitmq_channel_messages_delivered_total[60s]) * on(instance) group_left(rabbitmq_cluster, rabbitmq_node) rabbitmq_identity_info{rabbitmq_cluster=\\\"$rabbitmq_cluster\\\"}) by(rabbitmq_node)\",\n \"refId\": \"A\"\n }\n ],\n \"type\": \"timeseries\",\n \"version\": \"2.0.0\"\n },\n {\n \"custom\": {\n \"drawStyle\": \"lines\",\n \"fillOpacity\": 0.3,\n \"gradientMode\": \"opacity\",\n \"lineInterpolation\": \"smooth\",\n \"lineWidth\": 2,\n \"stack\": \"off\"\n },\n \"datasourceCate\": \"prometheus\",\n \"datasourceValue\": \"${prom}\",\n \"description\": \"The rate of message acknowledgements coming from consumers that use manual acknowledgement mode.\\n\\n* [Consumer Acknowledgements](https://www.rabbitmq.com/confirms.html)\\n* [Consumer Prefetch](https://www.rabbitmq.com/consumer-prefetch.html)\\n* [Consumer Acknowledgement Modes, Prefetch and Throughput](https://www.rabbitmq.com/confirms.html#channel-qos-prefetch-throughput)\\n* [Consumers](https://www.rabbitmq.com/consumers.html)\",\n \"id\": \"a1184534-3226-4c9a-ba6c-6d5258998518\",\n \"layout\": {\n \"h\": 3,\n \"i\": \"a1184534-3226-4c9a-ba6c-6d5258998518\",\n \"w\": 12,\n \"x\": 0,\n \"y\": 27\n },\n \"name\": \"Messages acknowledged / s\",\n \"options\": {\n \"legend\": {\n \"displayMode\": \"hidden\"\n },\n \"standardOptions\": {},\n \"thresholds\": {},\n \"tooltip\": {\n \"mode\": \"all\",\n \"sort\": \"none\"\n }\n },\n \"targets\": [\n {\n \"expr\": \"sum(rate(rabbitmq_channel_messages_acked_total[60s]) * on(instance) group_left(rabbitmq_cluster, rabbitmq_node) rabbitmq_identity_info{rabbitmq_cluster=\\\"$rabbitmq_cluster\\\"}) by(rabbitmq_node)\",\n \"refId\": \"A\"\n }\n ],\n \"type\": \"timeseries\",\n \"version\": \"2.0.0\"\n },\n {\n \"custom\": {\n \"drawStyle\": \"lines\",\n \"fillOpacity\": 0.3,\n \"gradientMode\": \"opacity\",\n \"lineInterpolation\": \"smooth\",\n \"lineWidth\": 2,\n \"stack\": \"off\"\n },\n \"datasourceCate\": \"prometheus\",\n \"datasourceValue\": \"${prom}\",\n \"description\": \"The rate of messages delivered to polling consumers that use automatic acknowledgement mode.\\n\\nThe use of polling consumers is highly inefficient and therefore strongly discouraged.\\n\\n* [Fetching individual messages](https://www.rabbitmq.com/consumers.html#fetching)\\n* [Consumers](https://www.rabbitmq.com/consumers.html)\",\n \"id\": \"2f34e8c7-e7fb-4695-afce-034a10081437\",\n \"layout\": {\n \"h\": 3,\n \"i\": \"2f34e8c7-e7fb-4695-afce-034a10081437\",\n \"w\": 12,\n \"x\": 12,\n \"y\": 27\n },\n \"name\": \"Polling operations with auto ack / s\",\n \"options\": {\n \"legend\": {\n \"displayMode\": \"hidden\"\n },\n \"standardOptions\": {},\n \"thresholds\": {},\n \"tooltip\": {\n \"mode\": \"all\",\n \"sort\": \"none\"\n }\n },\n \"targets\": [\n {\n \"expr\": \"sum(rate(rabbitmq_channel_get_total[60s]) * on(instance) group_left(rabbitmq_cluster, rabbitmq_node) rabbitmq_identity_info{rabbitmq_cluster=\\\"$rabbitmq_cluster\\\"}) by(rabbitmq_node)\",\n \"refId\": \"A\"\n }\n ],\n \"type\": \"timeseries\",\n \"version\": \"2.0.0\"\n },\n {\n \"custom\": {\n \"drawStyle\": \"lines\",\n \"fillOpacity\": 0.3,\n \"gradientMode\": \"opacity\",\n \"lineInterpolation\": \"smooth\",\n \"lineWidth\": 2,\n \"stack\": \"off\"\n },\n \"datasourceCate\": \"prometheus\",\n \"datasourceValue\": \"${prom}\",\n \"description\": \"The rate of polling consumer operations that yield no result.\\n\\nAny value above zero means that RabbitMQ resources are wasted by polling consumers.\\n\\nCompare this metric to the other polling consumer metrics to see the inefficiency rate.\\n\\nThe use of polling consumers is highly inefficient and therefore strongly discouraged.\\n\\n* [Fetching individual messages](https://www.rabbitmq.com/consumers.html#fetching)\\n* [Consumers](https://www.rabbitmq.com/consumers.html)\",\n \"id\": \"c7b1f4b8-5069-480f-a1f7-1c85dbc389c1\",\n \"layout\": {\n \"h\": 3,\n \"i\": \"c7b1f4b8-5069-480f-a1f7-1c85dbc389c1\",\n \"w\": 12,\n \"x\": 0,\n \"y\": 28\n },\n \"name\": \"Polling operations that yield no result / s\",\n \"options\": {\n \"legend\": {\n \"displayMode\": \"hidden\"\n },\n \"standardOptions\": {},\n \"thresholds\": {},\n \"tooltip\": {\n \"mode\": \"all\",\n \"sort\": \"none\"\n }\n },\n \"targets\": [\n {\n \"expr\": \"sum(rate(rabbitmq_channel_get_empty_total[60s]) * on(instance) group_left(rabbitmq_cluster, rabbitmq_node) rabbitmq_identity_info{rabbitmq_cluster=\\\"$rabbitmq_cluster\\\"}) by(rabbitmq_node)\",\n \"refId\": \"A\"\n }\n ],\n \"type\": \"timeseries\",\n \"version\": \"2.0.0\"\n },\n {\n \"custom\": {\n \"drawStyle\": \"lines\",\n \"fillOpacity\": 0.3,\n \"gradientMode\": \"opacity\",\n \"lineInterpolation\": \"smooth\",\n \"lineWidth\": 2,\n \"stack\": \"off\"\n },\n \"datasourceCate\": \"prometheus\",\n \"datasourceValue\": \"${prom}\",\n \"description\": \"The rate of messages delivered to polling consumers that use manual acknowledgement mode.\\n\\nThe use of polling consumers is highly inefficient and therefore strongly discouraged.\\n\\n* [Fetching individual messages](https://www.rabbitmq.com/consumers.html#fetching)\\n* [Consumers](https://www.rabbitmq.com/consumers.html)\",\n \"id\": \"4c2f60db-3cb4-4926-944c-022cf876eec2\",\n \"layout\": {\n \"h\": 3,\n \"i\": \"4c2f60db-3cb4-4926-944c-022cf876eec2\",\n \"w\": 12,\n \"x\": 12,\n \"y\": 28\n },\n \"name\": \"Polling operations with manual ack / s\",\n \"options\": {\n \"legend\": {\n \"displayMode\": \"hidden\"\n },\n \"standardOptions\": {},\n \"thresholds\": {},\n \"tooltip\": {\n \"mode\": \"all\",\n \"sort\": \"none\"\n }\n },\n \"targets\": [\n {\n \"expr\": \"sum(rate(rabbitmq_channel_get_ack_total[60s]) * on(instance) group_left(rabbitmq_cluster, rabbitmq_node) rabbitmq_identity_info{rabbitmq_cluster=\\\"$rabbitmq_cluster\\\"}) by(rabbitmq_node)\",\n \"refId\": \"A\"\n }\n ],\n \"type\": \"timeseries\",\n \"version\": \"2.0.0\"\n },\n {\n \"collapsed\": true,\n \"id\": \"b6aa6f06-924f-4575-b4e0-d116ab744ea1\",\n \"layout\": {\n \"h\": 1,\n \"i\": \"b6aa6f06-924f-4575-b4e0-d116ab744ea1\",\n \"w\": 24,\n \"x\": 0,\n \"y\": 31\n },\n \"name\": \"QUEUES\",\n \"type\": \"row\"\n },\n {\n \"custom\": {\n \"drawStyle\": \"lines\",\n \"fillOpacity\": 0.3,\n \"gradientMode\": \"opacity\",\n \"lineInterpolation\": \"smooth\",\n \"lineWidth\": 2,\n \"stack\": \"off\"\n },\n \"datasourceCate\": \"prometheus\",\n \"datasourceValue\": \"${prom}\",\n \"description\": \"Total number of queue masters per node. \\n\\nThis metric makes it easy to see sub-optimal queue distribution in a cluster.\\n\\n* [Queue Masters, Data Locality](https://www.rabbitmq.com/ha.html#master-migration-data-locality)\\n* [Queues](https://www.rabbitmq.com/queues.html)\",\n \"id\": \"c26434ca-065f-4088-81c6-ef8f0cbca552\",\n \"layout\": {\n \"h\": 3,\n \"i\": \"c26434ca-065f-4088-81c6-ef8f0cbca552\",\n \"w\": 12,\n \"x\": 0,\n \"y\": 32\n },\n \"name\": \"Total queues\",\n \"options\": {\n \"legend\": {\n \"displayMode\": \"hidden\"\n },\n \"standardOptions\": {},\n \"thresholds\": {},\n \"tooltip\": {\n \"mode\": \"all\",\n \"sort\": \"none\"\n }\n },\n \"targets\": [\n {\n \"expr\": \"rabbitmq_queues * on(instance) group_left(rabbitmq_cluster, rabbitmq_node) rabbitmq_identity_info{rabbitmq_cluster=\\\"$rabbitmq_cluster\\\"}\",\n \"refId\": \"A\"\n }\n ],\n \"type\": \"timeseries\",\n \"version\": \"2.0.0\"\n },\n {\n \"custom\": {\n \"drawStyle\": \"lines\",\n \"fillOpacity\": 0,\n \"lineInterpolation\": \"smooth\",\n \"stack\": \"off\"\n },\n \"datasourceCate\": \"prometheus\",\n \"datasourceValue\": \"${prom}\",\n \"description\": \"The rate of queue declarations performed by clients.\\n\\nLow sustained values above zero are to be expected. High rates may be indicative of queue churn or high rates of connection recovery. Confirm connection recovery rates by using the _Connections opened_ metric.\\n\\n* [Queues](https://www.rabbitmq.com/queues.html)\",\n \"id\": \"ff021951-7991-4c3e-a667-8cd11e5c444c\",\n \"layout\": {\n \"h\": 3,\n \"i\": \"ff021951-7991-4c3e-a667-8cd11e5c444c\",\n \"w\": 4,\n \"x\": 12,\n \"y\": 32\n },\n \"name\": \"Queues declared / s\",\n \"options\": {\n \"legend\": {\n \"displayMode\": \"hidden\"\n },\n \"standardOptions\": {},\n \"thresholds\": {},\n \"tooltip\": {\n \"mode\": \"all\",\n \"sort\": \"none\"\n }\n },\n \"targets\": [\n {\n \"expr\": \"sum(rate(rabbitmq_queues_declared_total[60s]) * on(instance) group_left(rabbitmq_cluster, rabbitmq_node) rabbitmq_identity_info{rabbitmq_cluster=\\\"$rabbitmq_cluster\\\"}) by(rabbitmq_node)\",\n \"refId\": \"A\"\n }\n ],\n \"type\": \"timeseries\",\n \"version\": \"2.0.0\"\n },\n {\n \"custom\": {\n \"drawStyle\": \"lines\",\n \"fillOpacity\": 0,\n \"lineInterpolation\": \"smooth\",\n \"stack\": \"off\"\n },\n \"datasourceCate\": \"prometheus\",\n \"datasourceValue\": \"${prom}\",\n \"description\": \"The rate of new queues created (as opposed to redeclarations).\\n\\nLow sustained values above zero are to be expected. High rates may be indicative of queue churn or high rates of connection recovery. Confirm connection recovery rates by using the _Connections opened_ metric.\\n\\n* [Queues](https://www.rabbitmq.com/queues.html)\",\n \"id\": \"00bbb4fc-5cdf-4b29-a440-ff4da4325a0c\",\n \"layout\": {\n \"h\": 3,\n \"i\": \"00bbb4fc-5cdf-4b29-a440-ff4da4325a0c\",\n \"w\": 4,\n \"x\": 16,\n \"y\": 32\n },\n \"name\": \"Queues created / s\",\n \"options\": {\n \"legend\": {\n \"displayMode\": \"hidden\"\n },\n \"standardOptions\": {},\n \"thresholds\": {},\n \"tooltip\": {\n \"mode\": \"all\",\n \"sort\": \"none\"\n }\n },\n \"targets\": [\n {\n \"expr\": \"sum(rate(rabbitmq_queues_created_total[60s]) * on(instance) group_left(rabbitmq_cluster, rabbitmq_node) rabbitmq_identity_info{rabbitmq_cluster=\\\"$rabbitmq_cluster\\\"}) by(rabbitmq_node)\",\n \"refId\": \"A\"\n }\n ],\n \"type\": \"timeseries\",\n \"version\": \"2.0.0\"\n },\n {\n \"custom\": {\n \"drawStyle\": \"lines\",\n \"fillOpacity\": 0,\n \"lineInterpolation\": \"smooth\",\n \"stack\": \"off\"\n },\n \"datasourceCate\": \"prometheus\",\n \"datasourceValue\": \"${prom}\",\n \"description\": \"The rate of queues deleted.\\n\\nLow sustained values above zero are to be expected. High rates may be indicative of queue churn or high rates of connection recovery. Confirm connection recovery rates by using the _Connections opened_ metric.\\n\\n* [Queues](https://www.rabbitmq.com/queues.html)\",\n \"id\": \"f802e41d-14fe-4193-a5cf-c31957b146f7\",\n \"layout\": {\n \"h\": 3,\n \"i\": \"f802e41d-14fe-4193-a5cf-c31957b146f7\",\n \"w\": 4,\n \"x\": 20,\n \"y\": 32\n },\n \"name\": \"Queues deleted / s\",\n \"options\": {\n \"legend\": {\n \"displayMode\": \"hidden\"\n },\n \"standardOptions\": {},\n \"thresholds\": {},\n \"tooltip\": {\n \"mode\": \"all\",\n \"sort\": \"none\"\n }\n },\n \"targets\": [\n {\n \"expr\": \"sum(rate(rabbitmq_queues_deleted_total[60s]) * on(instance) group_left(rabbitmq_cluster, rabbitmq_node) rabbitmq_identity_info{rabbitmq_cluster=\\\"$rabbitmq_cluster\\\"}) by(rabbitmq_node)\",\n \"refId\": \"A\"\n }\n ],\n \"type\": \"timeseries\",\n \"version\": \"2.0.0\"\n },\n {\n \"collapsed\": true,\n \"id\": \"5c7acadf-f9ff-4db9-a284-a206be245733\",\n \"layout\": {\n \"h\": 1,\n \"i\": \"5c7acadf-f9ff-4db9-a284-a206be245733\",\n \"w\": 24,\n \"x\": 0,\n \"y\": 35\n },\n \"name\": \"CHANNELS\",\n \"type\": \"row\"\n },\n {\n \"custom\": {\n \"drawStyle\": \"lines\",\n \"fillOpacity\": 0.3,\n \"gradientMode\": \"opacity\",\n \"lineInterpolation\": \"smooth\",\n \"lineWidth\": 2,\n \"stack\": \"off\"\n },\n \"datasourceCate\": \"prometheus\",\n \"datasourceValue\": \"${prom}\",\n \"description\": \"Total number of channels on all currently opened connections.\\n\\nIf this metric grows monotonically it is highly likely a channel leak in one of the applications. Confirm channel leaks by using the _Channels opened_ and _Channels closed_ metrics.\\n\\n* [Channel Leak](https://www.rabbitmq.com/channels.html#channel-leaks)\\n* [Channels](https://www.rabbitmq.com/channels.html)\",\n \"id\": \"362c622f-3fd8-4bdd-8dce-7ebf335f42f9\",\n \"layout\": {\n \"h\": 3,\n \"i\": \"362c622f-3fd8-4bdd-8dce-7ebf335f42f9\",\n \"w\": 12,\n \"x\": 0,\n \"y\": 36\n },\n \"name\": \"Total channels\",\n \"options\": {\n \"legend\": {\n \"displayMode\": \"hidden\"\n },\n \"standardOptions\": {},\n \"thresholds\": {},\n \"tooltip\": {\n \"mode\": \"all\",\n \"sort\": \"none\"\n }\n },\n \"targets\": [\n {\n \"expr\": \"rabbitmq_channels * on(instance) group_left(rabbitmq_cluster, rabbitmq_node) rabbitmq_identity_info{rabbitmq_cluster=\\\"$rabbitmq_cluster\\\"}\",\n \"refId\": \"A\"\n }\n ],\n \"type\": \"timeseries\",\n \"version\": \"2.0.0\"\n },\n {\n \"custom\": {\n \"drawStyle\": \"lines\",\n \"fillOpacity\": 0,\n \"lineInterpolation\": \"smooth\",\n \"stack\": \"off\"\n },\n \"datasourceCate\": \"prometheus\",\n \"datasourceValue\": \"${prom}\",\n \"description\": \"The rate of new channels opened by applications across all connections. Channels are expected to be long-lived.\\n\\nLow sustained values above zero are to be expected. High rates may be indicative of channel churn or mass connection recovery. Confirm connection recovery rates by using the _Connections opened_ metric.\\n\\n* [High Channel Churn](https://www.rabbitmq.com/channels.html#high-channel-churn)\\n* [Channels](https://www.rabbitmq.com/channels.html)\",\n \"id\": \"3a1a643b-8e2a-4ed1-8621-e5fae3ebc7c2\",\n \"layout\": {\n \"h\": 3,\n \"i\": \"3a1a643b-8e2a-4ed1-8621-e5fae3ebc7c2\",\n \"w\": 6,\n \"x\": 12,\n \"y\": 36\n },\n \"name\": \"Channels opened / s\",\n \"options\": {\n \"legend\": {\n \"displayMode\": \"hidden\"\n },\n \"standardOptions\": {},\n \"thresholds\": {},\n \"tooltip\": {\n \"mode\": \"all\",\n \"sort\": \"none\"\n }\n },\n \"targets\": [\n {\n \"expr\": \"sum(rate(rabbitmq_channels_opened_total[60s]) * on(instance) group_left(rabbitmq_cluster, rabbitmq_node) rabbitmq_identity_info{rabbitmq_cluster=\\\"$rabbitmq_cluster\\\"}) by(rabbitmq_node)\",\n \"refId\": \"A\"\n }\n ],\n \"type\": \"timeseries\",\n \"version\": \"2.0.0\"\n },\n {\n \"custom\": {\n \"drawStyle\": \"lines\",\n \"fillOpacity\": 0,\n \"lineInterpolation\": \"smooth\",\n \"stack\": \"off\"\n },\n \"datasourceCate\": \"prometheus\",\n \"datasourceValue\": \"${prom}\",\n \"description\": \"The rate of channels closed by applications across all connections. Channels are expected to be long-lived.\\n\\nLow sustained values above zero are to be expected. High rates may be indicative of channel churn or mass connection recovery. Confirm connection recovery rates by using the _Connections opened_ metric.\\n\\n* [High Channel Churn](https://www.rabbitmq.com/channels.html#high-channel-churn)\\n* [Channels](https://www.rabbitmq.com/channels.html)\",\n \"id\": \"01f1771a-dd54-45e5-aa1d-b6ee2111c53b\",\n \"layout\": {\n \"h\": 3,\n \"i\": \"01f1771a-dd54-45e5-aa1d-b6ee2111c53b\",\n \"w\": 6,\n \"x\": 18,\n \"y\": 36\n },\n \"name\": \"Channels closed / s\",\n \"options\": {\n \"legend\": {\n \"displayMode\": \"hidden\"\n },\n \"standardOptions\": {},\n \"thresholds\": {},\n \"tooltip\": {\n \"mode\": \"all\",\n \"sort\": \"none\"\n }\n },\n \"targets\": [\n {\n \"expr\": \"sum(rate(rabbitmq_channels_closed_total[60s]) * on(instance) group_left(rabbitmq_cluster, rabbitmq_node) rabbitmq_identity_info{rabbitmq_cluster=\\\"$rabbitmq_cluster\\\"}) by(rabbitmq_node)\",\n \"refId\": \"A\"\n }\n ],\n \"type\": \"timeseries\",\n \"version\": \"2.0.0\"\n },\n {\n \"collapsed\": true,\n \"id\": \"419f22e8-08cc-4d91-8bc9-7c1055368146\",\n \"layout\": {\n \"h\": 1,\n \"i\": \"419f22e8-08cc-4d91-8bc9-7c1055368146\",\n \"w\": 24,\n \"x\": 0,\n \"y\": 39\n },\n \"name\": \"CONNECTIONS\",\n \"type\": \"row\"\n },\n {\n \"custom\": {\n \"drawStyle\": \"lines\",\n \"fillOpacity\": 0,\n \"lineInterpolation\": \"smooth\",\n \"stack\": \"off\"\n },\n \"datasourceCate\": \"prometheus\",\n \"datasourceValue\": \"${prom}\",\n \"description\": \"The rate of connections closed. Connections are expected to be long-lived.\\n\\nLow sustained values above zero are to be expected. High rates may be indicative of connection churn or mass connection recovery.\\n\\n* [Connections](https://www.rabbitmq.com/connections.html)\",\n \"id\": \"c14fd6f4-d3de-4811-82c6-2b20c9146e89\",\n \"layout\": {\n \"h\": 3,\n \"i\": \"c14fd6f4-d3de-4811-82c6-2b20c9146e89\",\n \"w\": 6,\n \"x\": 18,\n \"y\": 40\n },\n \"name\": \"Connections closed / s\",\n \"options\": {\n \"legend\": {\n \"displayMode\": \"hidden\"\n },\n \"standardOptions\": {},\n \"thresholds\": {},\n \"tooltip\": {\n \"mode\": \"all\",\n \"sort\": \"none\"\n }\n },\n \"targets\": [\n {\n \"expr\": \"sum(rate(rabbitmq_connections_closed_total[60s]) * on(instance) group_left(rabbitmq_cluster, rabbitmq_node) rabbitmq_identity_info{rabbitmq_cluster=\\\"$rabbitmq_cluster\\\"}) by(rabbitmq_node)\",\n \"refId\": \"A\"\n }\n ],\n \"type\": \"timeseries\",\n \"version\": \"2.0.0\"\n },\n {\n \"custom\": {\n \"drawStyle\": \"lines\",\n \"fillOpacity\": 0.3,\n \"gradientMode\": \"opacity\",\n \"lineInterpolation\": \"smooth\",\n \"lineWidth\": 2,\n \"stack\": \"off\"\n },\n \"datasourceCate\": \"prometheus\",\n \"datasourceValue\": \"${prom}\",\n \"description\": \"Total number of client connections.\\n\\nIf this metric grows monotonically it is highly likely a connection leak in one of the applications. Confirm connection leaks by using the _Connections opened_ and _Connections closed_ metrics.\\n\\n* [Connection Leak](https://www.rabbitmq.com/connections.html#monitoring)\\n* [Connections](https://www.rabbitmq.com/connections.html)\",\n \"id\": \"1d06679b-c603-4cbf-85a7-7c8f4594258f\",\n \"layout\": {\n \"h\": 3,\n \"i\": \"1d06679b-c603-4cbf-85a7-7c8f4594258f\",\n \"w\": 12,\n \"x\": 0,\n \"y\": 40\n },\n \"name\": \"Total connections\",\n \"options\": {\n \"legend\": {\n \"displayMode\": \"hidden\"\n },\n \"standardOptions\": {},\n \"thresholds\": {},\n \"tooltip\": {\n \"mode\": \"all\",\n \"sort\": \"none\"\n }\n },\n \"targets\": [\n {\n \"expr\": \"rabbitmq_connections * on(instance) group_left(rabbitmq_cluster, rabbitmq_node) rabbitmq_identity_info{rabbitmq_cluster=\\\"$rabbitmq_cluster\\\"}\",\n \"refId\": \"A\"\n }\n ],\n \"type\": \"timeseries\",\n \"version\": \"2.0.0\"\n },\n {\n \"custom\": {\n \"drawStyle\": \"lines\",\n \"fillOpacity\": 0,\n \"lineInterpolation\": \"smooth\",\n \"stack\": \"off\"\n },\n \"datasourceCate\": \"prometheus\",\n \"datasourceValue\": \"${prom}\",\n \"description\": \"The rate of new connections opened by clients. Connections are expected to be long-lived.\\n\\nLow sustained values above zero are to be expected. High rates may be indicative of connection churn or mass connection recovery.\\n\\n* [Connection Leak](https://www.rabbitmq.com/connections.html#monitoring)\\n* [Connections](https://www.rabbitmq.com/connections.html)\",\n \"id\": \"8c91f7fe-79e9-454a-9dd3-6f214a29e1eb\",\n \"layout\": {\n \"h\": 3,\n \"i\": \"8c91f7fe-79e9-454a-9dd3-6f214a29e1eb\",\n \"w\": 6,\n \"x\": 12,\n \"y\": 40\n },\n \"name\": \"Connections opened / s\",\n \"options\": {\n \"legend\": {\n \"displayMode\": \"hidden\"\n },\n \"standardOptions\": {},\n \"thresholds\": {},\n \"tooltip\": {\n \"mode\": \"all\",\n \"sort\": \"none\"\n }\n },\n \"targets\": [\n {\n \"expr\": \"sum(rate(rabbitmq_connections_opened_total[60s]) * on(instance) group_left(rabbitmq_cluster, rabbitmq_node) rabbitmq_identity_info{rabbitmq_cluster=\\\"$rabbitmq_cluster\\\"}) by(rabbitmq_node)\",\n \"refId\": \"A\"\n }\n ],\n \"type\": \"timeseries\",\n \"version\": \"2.0.0\"\n }\n ],\n \"var\": [\n {\n \"definition\": \"prometheus\",\n \"name\": \"prom\",\n \"type\": \"datasource\"\n },\n {\n \"datasource\": {\n \"cate\": \"prometheus\",\n \"value\": \"${prom}\"\n },\n \"definition\": \"label_values(rabbitmq_identity_info, rabbitmq_cluster)\",\n \"name\": \"rabbitmq_cluster\",\n \"type\": \"query\"\n }\n ],\n \"version\": \"3.0.0\"\n },\n \"public\": 0,\n \"public_cate\": 0,\n \"bgids\": null,\n \"built_in\": 0,\n \"hide\": 0,\n \"uuid\": 1717556328326982000\n}"
},
{
"path": "integrations/RabbitMQ/dashboards/rabbitmq_v3.8_lt.json",
"content": "{\n \"id\": 0,\n \"group_id\": 0,\n \"name\": \"RabbitMQ 3.8-\",\n \"ident\": \"\",\n \"tags\": \"\",\n \"create_at\": 0,\n \"create_by\": \"\",\n \"update_at\": 0,\n \"update_by\": \"\",\n \"configs\": {\n \"panels\": [\n {\n \"collapsed\": true,\n \"id\": \"e83c8286-1579-43d9-bbaa-f4ebfd81ff03\",\n \"layout\": {\n \"h\": 1,\n \"i\": \"e83c8286-1579-43d9-bbaa-f4ebfd81ff03\",\n \"isResizable\": false,\n \"w\": 24,\n \"x\": 0,\n \"y\": 0\n },\n \"name\": \"Overview\",\n \"panels\": [],\n \"type\": \"row\"\n },\n {\n \"custom\": {\n \"calc\": \"lastNotNull\",\n \"colSpan\": 1,\n \"colorMode\": \"background\",\n \"textMode\": \"valueAndName\",\n \"textSize\": {},\n \"valueField\": \"Value\"\n },\n \"datasourceCate\": \"prometheus\",\n \"datasourceValue\": \"${datasource}\",\n \"id\": \"9c1c09a9-65b9-468f-9fe8-4a7abe16ce60\",\n \"layout\": {\n \"h\": 3,\n \"i\": \"9c1c09a9-65b9-468f-9fe8-4a7abe16ce60\",\n \"isResizable\": true,\n \"w\": 7,\n \"x\": 0,\n \"y\": 1\n },\n \"name\": \"Ready messages\",\n \"options\": {\n \"standardOptions\": {},\n \"thresholds\": {\n \"steps\": [\n {\n \"color\": \"#634CD9\",\n \"type\": \"base\",\n \"value\": null\n }\n ]\n },\n \"valueMappings\": [\n {\n \"match\": {\n \"from\": 10000\n },\n \"result\": {\n \"color\": \"#4a90e2\"\n },\n \"type\": \"range\"\n },\n {\n \"match\": {\n \"from\": 100000\n },\n \"result\": {\n \"color\": \"#f50a0a\"\n },\n \"type\": \"range\"\n },\n {\n \"match\": {\n \"to\": 9999\n },\n \"result\": {\n \"color\": \"#417505\"\n },\n \"type\": \"range\"\n }\n ]\n },\n \"targets\": [\n {\n \"expr\": \"sum(rabbitmq_queue_messages_ready )\",\n \"refId\": \"A\"\n }\n ],\n \"type\": \"stat\",\n \"version\": \"2.0.0\"\n },\n {\n \"custom\": {\n \"calc\": \"lastNotNull\",\n \"colSpan\": 1,\n \"colorMode\": \"background\",\n \"textMode\": \"valueAndName\",\n \"textSize\": {},\n \"valueField\": \"Value\"\n },\n \"datasourceCate\": \"prometheus\",\n \"datasourceValue\": \"${datasource}\",\n \"id\": \"751ca66f-8275-411d-9bfe-e1cf967d90fe\",\n \"layout\": {\n \"h\": 3,\n \"i\": \"751ca66f-8275-411d-9bfe-e1cf967d90fe\",\n \"isResizable\": true,\n \"w\": 5,\n \"x\": 7,\n \"y\": 1\n },\n \"name\": \"Incoming messages / s\",\n \"options\": {\n \"standardOptions\": {},\n \"thresholds\": {\n \"steps\": [\n {\n \"color\": \"#634CD9\",\n \"type\": \"base\",\n \"value\": null\n }\n ]\n },\n \"valueMappings\": [\n {\n \"match\": {\n \"from\": 50\n },\n \"result\": {\n \"color\": \"#417505\"\n },\n \"type\": \"range\"\n }\n ]\n },\n \"targets\": [\n {\n \"expr\": \"sum(rate(rabbitmq_queue_messages_publish{ident=\\\"$rabbitmq_cluster\\\"}[60s]))\",\n \"refId\": \"A\"\n }\n ],\n \"type\": \"stat\",\n \"version\": \"2.0.0\"\n },\n {\n \"custom\": {\n \"calc\": \"lastNotNull\",\n \"colSpan\": 1,\n \"colorMode\": \"background\",\n \"textMode\": \"valueAndName\",\n \"textSize\": {},\n \"valueField\": \"Value\"\n },\n \"datasourceCate\": \"prometheus\",\n \"datasourceValue\": \"${datasource}\",\n \"id\": \"3fb62e0e-0c28-4226-91ca-83405e0ca91f\",\n \"layout\": {\n \"h\": 3,\n \"i\": \"3fb62e0e-0c28-4226-91ca-83405e0ca91f\",\n \"isResizable\": true,\n \"w\": 4,\n \"x\": 12,\n \"y\": 1\n },\n \"name\": \"Publishers\",\n \"options\": {\n \"standardOptions\": {},\n \"thresholds\": {\n \"steps\": [\n {\n \"color\": \"#634CD9\",\n \"type\": \"base\",\n \"value\": null\n }\n ]\n },\n \"valueMappings\": [\n {\n \"match\": {\n \"from\": 10\n },\n \"result\": {\n \"color\": \"#417505\"\n },\n \"type\": \"range\"\n }\n ]\n },\n \"targets\": [\n {\n \"expr\": \"sum(rabbitmq_overview_channels{ident=\\\"$rabbitmq_cluster\\\"}) - sum(rabbitmq_overview_consumers{ident=\\\"$rabbitmq_cluster\\\"})\",\n \"refId\": \"A\"\n }\n ],\n \"type\": \"stat\",\n \"version\": \"2.0.0\"\n },\n {\n \"custom\": {\n \"calc\": \"lastNotNull\",\n \"colSpan\": 1,\n \"colorMode\": \"background\",\n \"textMode\": \"valueAndName\",\n \"textSize\": {},\n \"valueField\": \"Value\"\n },\n \"datasourceCate\": \"prometheus\",\n \"datasourceValue\": \"${datasource}\",\n \"id\": \"dba4f405-ad01-45bb-96cf-c7d066fa101b\",\n \"layout\": {\n \"h\": 3,\n \"i\": \"dba4f405-ad01-45bb-96cf-c7d066fa101b\",\n \"isResizable\": true,\n \"w\": 4,\n \"x\": 16,\n \"y\": 1\n },\n \"name\": \"Connections\",\n \"options\": {\n \"standardOptions\": {},\n \"thresholds\": {\n \"steps\": [\n {\n \"color\": \"#634CD9\",\n \"type\": \"base\",\n \"value\": null\n }\n ]\n },\n \"valueMappings\": [\n {\n \"match\": {\n \"from\": 10\n },\n \"result\": {\n \"color\": \"#417505\"\n },\n \"type\": \"range\"\n }\n ]\n },\n \"targets\": [\n {\n \"expr\": \"sum(rabbitmq_overview_connections{ident=\\\"$rabbitmq_cluster\\\"})\",\n \"refId\": \"A\"\n }\n ],\n \"type\": \"stat\",\n \"version\": \"2.0.0\"\n },\n {\n \"custom\": {\n \"calc\": \"lastNotNull\",\n \"colSpan\": 1,\n \"colorMode\": \"background\",\n \"textMode\": \"valueAndName\",\n \"textSize\": {},\n \"valueField\": \"Value\"\n },\n \"datasourceCate\": \"prometheus\",\n \"datasourceValue\": \"${datasource}\",\n \"id\": \"a44a473f-6c7d-4e48-aaca-e4becef11051\",\n \"layout\": {\n \"h\": 3,\n \"i\": \"a44a473f-6c7d-4e48-aaca-e4becef11051\",\n \"isResizable\": true,\n \"w\": 4,\n \"x\": 20,\n \"y\": 1\n },\n \"name\": \"Queues\",\n \"options\": {\n \"standardOptions\": {},\n \"thresholds\": {\n \"steps\": [\n {\n \"color\": \"#634CD9\",\n \"type\": \"base\",\n \"value\": null\n }\n ]\n },\n \"valueMappings\": [\n {\n \"match\": {\n \"from\": 10\n },\n \"result\": {\n \"color\": \"#417505\"\n },\n \"type\": \"range\"\n }\n ]\n },\n \"targets\": [\n {\n \"expr\": \"sum(rabbitmq_overview_queues {ident=\\\"$rabbitmq_cluster\\\"})\",\n \"refId\": \"A\"\n }\n ],\n \"type\": \"stat\",\n \"version\": \"2.0.0\"\n },\n {\n \"custom\": {\n \"calc\": \"lastNotNull\",\n \"colSpan\": 1,\n \"colorMode\": \"background\",\n \"textMode\": \"valueAndName\",\n \"textSize\": {},\n \"valueField\": \"Value\"\n },\n \"datasourceCate\": \"prometheus\",\n \"datasourceValue\": \"${datasource}\",\n \"id\": \"7e3281c6-98a5-467d-8871-3ca634cf7bb8\",\n \"layout\": {\n \"h\": 3,\n \"i\": \"7e3281c6-98a5-467d-8871-3ca634cf7bb8\",\n \"isResizable\": true,\n \"w\": 7,\n \"x\": 0,\n \"y\": 4\n },\n \"name\": \"Unacknowledged messages\",\n \"options\": {\n \"standardOptions\": {},\n \"thresholds\": {\n \"steps\": [\n {\n \"color\": \"#634CD9\",\n \"type\": \"base\",\n \"value\": null\n }\n ]\n },\n \"valueMappings\": [\n {\n \"match\": {\n \"to\": 99\n },\n \"result\": {\n \"color\": \"#417505\"\n },\n \"type\": \"range\"\n },\n {\n \"match\": {\n \"from\": 100\n },\n \"result\": {\n \"color\": \"#4a90e2\"\n },\n \"type\": \"range\"\n },\n {\n \"match\": {\n \"from\": 500\n },\n \"result\": {\n \"color\": \"#d0021b\"\n },\n \"type\": \"range\"\n }\n ]\n },\n \"targets\": [\n {\n \"expr\": \"sum(rabbitmq_queue_messages_unack {ident=\\\"$rabbitmq_cluster\\\"})\",\n \"refId\": \"A\"\n }\n ],\n \"type\": \"stat\",\n \"version\": \"2.0.0\"\n },\n {\n \"custom\": {\n \"calc\": \"lastNotNull\",\n \"colSpan\": 1,\n \"colorMode\": \"background\",\n \"textMode\": \"valueAndName\",\n \"textSize\": {},\n \"valueField\": \"Value\"\n },\n \"datasourceCate\": \"prometheus\",\n \"datasourceValue\": \"${datasource}\",\n \"id\": \"94d400cb-5a67-4533-9c67-655ca9471466\",\n \"layout\": {\n \"h\": 3,\n \"i\": \"94d400cb-5a67-4533-9c67-655ca9471466\",\n \"isResizable\": true,\n \"w\": 5,\n \"x\": 7,\n \"y\": 4\n },\n \"name\": \"Outgoing messages / s\",\n \"options\": {\n \"standardOptions\": {},\n \"thresholds\": {\n \"steps\": [\n {\n \"color\": \"#634CD9\",\n \"type\": \"base\",\n \"value\": null\n }\n ]\n },\n \"valueMappings\": [\n {\n \"match\": {\n \"from\": 50\n },\n \"result\": {\n \"color\": \"#417505\"\n },\n \"type\": \"range\"\n }\n ]\n },\n \"targets\": [\n {\n \"expr\": \"sum(rate(rabbitmq_overview_messages_redelivered{ident=\\\"$rabbitmq_cluster\\\"}[60s]) )+\\nsum(rate(rabbitmq_overview_messages_delivered{ident=\\\"$rabbitmq_cluster\\\"}[60s]) )\",\n \"refId\": \"A\"\n }\n ],\n \"type\": \"stat\",\n \"version\": \"2.0.0\"\n },\n {\n \"custom\": {\n \"calc\": \"lastNotNull\",\n \"colSpan\": 1,\n \"colorMode\": \"background\",\n \"textMode\": \"valueAndName\",\n \"textSize\": {},\n \"valueField\": \"Value\"\n },\n \"datasourceCate\": \"prometheus\",\n \"datasourceValue\": \"${datasource}\",\n \"id\": \"d89d49d8-6b75-49f0-b0c9-4d65e1705bfa\",\n \"layout\": {\n \"h\": 3,\n \"i\": \"d89d49d8-6b75-49f0-b0c9-4d65e1705bfa\",\n \"isResizable\": true,\n \"w\": 4,\n \"x\": 12,\n \"y\": 4\n },\n \"name\": \"Consumers\",\n \"options\": {\n \"standardOptions\": {},\n \"thresholds\": {\n \"steps\": [\n {\n \"color\": \"#634CD9\",\n \"type\": \"base\",\n \"value\": null\n }\n ]\n },\n \"valueMappings\": [\n {\n \"match\": {\n \"from\": 10\n },\n \"result\": {\n \"color\": \"#417505\"\n },\n \"type\": \"range\"\n }\n ]\n },\n \"targets\": [\n {\n \"expr\": \"sum(rabbitmq_overview_consumers{ident=\\\"$rabbitmq_cluster\\\"})\",\n \"refId\": \"A\"\n }\n ],\n \"type\": \"stat\",\n \"version\": \"2.0.0\"\n },\n {\n \"custom\": {\n \"calc\": \"lastNotNull\",\n \"colSpan\": 1,\n \"colorMode\": \"background\",\n \"textMode\": \"valueAndName\",\n \"textSize\": {},\n \"valueField\": \"Value\"\n },\n \"datasourceCate\": \"prometheus\",\n \"datasourceValue\": \"${datasource}\",\n \"id\": \"c5523db6-56c7-4d5b-bae4-73fd4fa02074\",\n \"layout\": {\n \"h\": 3,\n \"i\": \"c5523db6-56c7-4d5b-bae4-73fd4fa02074\",\n \"isResizable\": true,\n \"w\": 4,\n \"x\": 16,\n \"y\": 4\n },\n \"name\": \"Channels\",\n \"options\": {\n \"standardOptions\": {},\n \"thresholds\": {\n \"steps\": [\n {\n \"color\": \"#634CD9\",\n \"type\": \"base\",\n \"value\": null\n }\n ]\n },\n \"valueMappings\": [\n {\n \"match\": {\n \"from\": 10\n },\n \"result\": {\n \"color\": \"#417505\"\n },\n \"type\": \"range\"\n }\n ]\n },\n \"targets\": [\n {\n \"expr\": \"sum(rabbitmq_overview_channels{ident=\\\"$rabbitmq_cluster\\\"})\",\n \"refId\": \"A\"\n }\n ],\n \"type\": \"stat\",\n \"version\": \"2.0.0\"\n },\n {\n \"custom\": {\n \"calc\": \"lastNotNull\",\n \"colSpan\": 1,\n \"colorMode\": \"background\",\n \"textMode\": \"valueAndName\",\n \"textSize\": {},\n \"valueField\": \"Value\"\n },\n \"datasourceCate\": \"prometheus\",\n \"datasourceValue\": \"${datasource}\",\n \"id\": \"aefb7825-2a50-42ed-8f45-d10a87161563\",\n \"layout\": {\n \"h\": 3,\n \"i\": \"aefb7825-2a50-42ed-8f45-d10a87161563\",\n \"isResizable\": true,\n \"w\": 4,\n \"x\": 20,\n \"y\": 4\n },\n \"name\": \"Nodes\",\n \"options\": {\n \"standardOptions\": {},\n \"thresholds\": {\n \"steps\": [\n {\n \"color\": \"#634CD9\",\n \"type\": \"base\",\n \"value\": null\n }\n ]\n },\n \"valueMappings\": [\n {\n \"match\": {\n \"from\": 3,\n \"to\": null\n },\n \"result\": {\n \"color\": \"#417505\"\n },\n \"type\": \"range\"\n },\n {\n \"match\": {\n \"from\": 8\n },\n \"result\": {\n \"color\": \"#e70909\"\n },\n \"type\": \"range\"\n }\n ]\n },\n \"targets\": [\n {\n \"expr\": \"count(rabbitmq_node_uptime{ident=\\\"$rabbitmq_cluster\\\"})\",\n \"refId\": \"A\"\n }\n ],\n \"type\": \"stat\",\n \"version\": \"2.0.0\"\n },\n {\n \"collapsed\": true,\n \"id\": \"90aabc6f-94a3-4093-819d-f7339839fd3b\",\n \"layout\": {\n \"h\": 1,\n \"i\": \"90aabc6f-94a3-4093-819d-f7339839fd3b\",\n \"isResizable\": false,\n \"w\": 24,\n \"x\": 0,\n \"y\": 7\n },\n \"name\": \"Nodes\",\n \"type\": \"row\"\n },\n {\n \"custom\": {\n \"calc\": \"lastNotNull\",\n \"colorMode\": \"value\",\n \"columns\": [\n \"ident\",\n \"node\",\n \"region\",\n \"url\"\n ],\n \"displayMode\": \"labelsOfSeriesToRows\",\n \"showHeader\": true\n },\n \"datasourceCate\": \"prometheus\",\n \"datasourceValue\": \"${datasource}\",\n \"id\": \"1c67db00-88d5-41df-a17a-bd122bfcb1ff\",\n \"layout\": {\n \"h\": 3,\n \"i\": \"1c67db00-88d5-41df-a17a-bd122bfcb1ff\",\n \"isResizable\": true,\n \"w\": 24,\n \"x\": 0,\n \"y\": 8\n },\n \"name\": \"nodes\",\n \"options\": {\n \"standardOptions\": {}\n },\n \"overrides\": [\n {}\n ],\n \"targets\": [\n {\n \"expr\": \"rabbitmq_node_uptime{ident=\\\"$rabbitmq_cluster\\\"}\",\n \"refId\": \"A\"\n }\n ],\n \"type\": \"table\",\n \"version\": \"2.0.0\"\n },\n {\n \"custom\": {\n \"drawStyle\": \"lines\",\n \"fillOpacity\": 0.3,\n \"gradientMode\": \"opacity\",\n \"lineInterpolation\": \"smooth\",\n \"lineWidth\": 2,\n \"scaleDistribution\": {\n \"type\": \"linear\"\n },\n \"stack\": \"off\"\n },\n \"datasourceCate\": \"prometheus\",\n \"datasourceValue\": \"${datasource}\",\n \"description\": \"If the value is zero or less, the memory alarm will be triggered and all publishing connections across all cluster nodes will be blocked.\\n\\nThis value can temporarily go negative because the memory alarm is triggered with a slight delay.\\n\\nThe kernel's view of the amount of memory used by the node can differ from what the node itself can observe. This means that this value can be negative for a sustained period of time.\\n\\nBy default nodes use resident set size (RSS) to compute how much memory they use. This strategy can be changed (see the guides below).\\n\\n* [Alarms](https://www.rabbitmq.com/alarms.html)\\n* [Memory Alarms](https://www.rabbitmq.com/memory.html)\\n* [Reasoning About Memory Use](https://www.rabbitmq.com/memory-use.html)\\n* [Blocked Connection Notifications](https://www.rabbitmq.com/connection-blocked.html)\",\n \"id\": \"ad20de77-8f3a-46d7-bab9-adcb8150e916\",\n \"layout\": {\n \"h\": 7,\n \"i\": \"ad20de77-8f3a-46d7-bab9-adcb8150e916\",\n \"isResizable\": true,\n \"w\": 8,\n \"x\": 0,\n \"y\": 11\n },\n \"name\": \"Memory available before publishers blocked\",\n \"options\": {\n \"legend\": {\n \"displayMode\": \"hidden\"\n },\n \"standardOptions\": {\n \"decimals\": 1\n },\n \"thresholds\": {\n \"steps\": [\n {\n \"color\": \"#634CD9\",\n \"type\": \"base\",\n \"value\": null\n }\n ]\n },\n \"tooltip\": {\n \"mode\": \"all\",\n \"sort\": \"none\"\n }\n },\n \"targets\": [\n {\n \"expr\": \"rabbitmq_node_mem_limit{ident=\\\"$rabbitmq_cluster\\\"} - rabbitmq_node_mem_total{ident=\\\"$rabbitmq_cluster\\\"}\",\n \"refId\": \"A\"\n }\n ],\n \"type\": \"timeseries\",\n \"version\": \"2.0.0\"\n },\n {\n \"custom\": {\n \"drawStyle\": \"lines\",\n \"fillOpacity\": 0.3,\n \"gradientMode\": \"opacity\",\n \"lineInterpolation\": \"smooth\",\n \"lineWidth\": 2,\n \"scaleDistribution\": {\n \"type\": \"linear\"\n },\n \"stack\": \"off\"\n },\n \"datasourceCate\": \"prometheus\",\n \"datasourceValue\": \"${datasource}\",\n \"description\": \"This metric is reported for the partition where the RabbitMQ data directory is stored.\\n\\nIf the value is zero or less, the disk alarm will be triggered and all publishing connections across all cluster nodes will be blocked.\\n\\nThis value can temporarily go negative because the free disk space alarm is triggered with a slight delay.\\n\\n* [Alarms](https://www.rabbitmq.com/alarms.html)\\n* [Disk Space Alarms](https://www.rabbitmq.com/disk-alarms.html)\\n* [Disk Space](https://www.rabbitmq.com/production-checklist.html#resource-limits-disk-space)\\n* [Persistence Configuration](https://www.rabbitmq.com/persistence-conf.html)\\n* [Blocked Connection Notifications](https://www.rabbitmq.com/connection-blocked.html)\",\n \"id\": \"12ca67d1-3953-4095-a706-e27bbd8cf5e1\",\n \"layout\": {\n \"h\": 7,\n \"i\": \"12ca67d1-3953-4095-a706-e27bbd8cf5e1\",\n \"isResizable\": true,\n \"w\": 8,\n \"x\": 8,\n \"y\": 11\n },\n \"name\": \"Disk space available before publishers blocked\",\n \"options\": {\n \"legend\": {\n \"displayMode\": \"hidden\"\n },\n \"standardOptions\": {\n \"decimals\": 1\n },\n \"thresholds\": {\n \"steps\": [\n {\n \"color\": \"#634CD9\",\n \"type\": \"base\",\n \"value\": null\n }\n ]\n },\n \"tooltip\": {\n \"mode\": \"all\",\n \"sort\": \"none\"\n }\n },\n \"targets\": [\n {\n \"expr\": \"rabbitmq_node_disk_free{ident=\\\"$rabbitmq_cluster\\\"}\",\n \"refId\": \"A\"\n }\n ],\n \"type\": \"timeseries\",\n \"version\": \"2.0.0\"\n },\n {\n \"custom\": {\n \"drawStyle\": \"lines\",\n \"fillOpacity\": 0.3,\n \"gradientMode\": \"opacity\",\n \"lineInterpolation\": \"smooth\",\n \"lineWidth\": 2,\n \"scaleDistribution\": {\n \"type\": \"linear\"\n },\n \"stack\": \"off\"\n },\n \"datasourceCate\": \"prometheus\",\n \"datasourceValue\": \"${datasource}\",\n \"description\": \"When this value reaches zero, new connections will not be accepted and disk write operations may fail.\\n\\nClient libraries, peer nodes and CLI tools will not be able to connect when the node runs out of available file descriptors.\\n\\n* [Open File Handles Limit](https://www.rabbitmq.com/production-checklist.html#resource-limits-file-handle-limit)\",\n \"id\": \"0f26721e-42ff-4bb5-8124-ed1d9bafaeff\",\n \"layout\": {\n \"h\": 3,\n \"i\": \"0f26721e-42ff-4bb5-8124-ed1d9bafaeff\",\n \"isResizable\": true,\n \"w\": 8,\n \"x\": 16,\n \"y\": 11\n },\n \"name\": \"File descriptors available\",\n \"options\": {\n \"legend\": {\n \"displayMode\": \"hidden\"\n },\n \"standardOptions\": {},\n \"thresholds\": {\n \"steps\": [\n {\n \"color\": \"#634CD9\",\n \"type\": \"base\",\n \"value\": null\n }\n ]\n },\n \"tooltip\": {\n \"mode\": \"all\",\n \"sort\": \"none\"\n }\n },\n \"targets\": [\n {\n \"expr\": \"(rabbitmq_node_fd_total {ident=\\\"$rabbitmq_cluster\\\"}) -\\n(rabbitmq_node_fd_used{ident=\\\"$rabbitmq_cluster\\\"})\",\n \"refId\": \"A\"\n }\n ],\n \"type\": \"timeseries\",\n \"version\": \"2.0.0\"\n },\n {\n \"custom\": {\n \"drawStyle\": \"lines\",\n \"fillOpacity\": 0.3,\n \"gradientMode\": \"opacity\",\n \"lineInterpolation\": \"smooth\",\n \"lineWidth\": 2,\n \"scaleDistribution\": {\n \"type\": \"linear\"\n },\n \"stack\": \"off\"\n },\n \"datasourceCate\": \"prometheus\",\n \"datasourceValue\": \"${datasource}\",\n \"description\": \"When this value reaches zero, new connections will not be accepted.\\n\\nClient libraries, peer nodes and CLI tools will not be able to connect when the node runs out of available file descriptors.\\n\\n* [Networking and RabbitMQ](https://www.rabbitmq.com/networking.html)\",\n \"id\": \"b4d6c2dc-413a-43d8-bb53-d084233ce984\",\n \"layout\": {\n \"h\": 3,\n \"i\": \"b4d6c2dc-413a-43d8-bb53-d084233ce984\",\n \"isResizable\": true,\n \"w\": 8,\n \"x\": 16,\n \"y\": 14\n },\n \"name\": \"TCP sockets available\",\n \"options\": {\n \"legend\": {\n \"displayMode\": \"hidden\"\n },\n \"standardOptions\": {},\n \"thresholds\": {\n \"steps\": [\n {\n \"color\": \"#634CD9\",\n \"type\": \"base\",\n \"value\": null\n }\n ]\n },\n \"tooltip\": {\n \"mode\": \"all\",\n \"sort\": \"none\"\n }\n },\n \"targets\": [\n {\n \"expr\": \"(rabbitmq_node_sockets_total {ident=\\\"$rabbitmq_cluster\\\"}) -\\n(rabbitmq_node_sockets_used{ident=\\\"$rabbitmq_cluster\\\"})\",\n \"refId\": \"A\"\n }\n ],\n \"type\": \"timeseries\",\n \"version\": \"2.0.0\"\n },\n {\n \"collapsed\": true,\n \"id\": \"566edc72-b5c4-4e91-95a5-05c01b5a4fbf\",\n \"layout\": {\n \"h\": 1,\n \"i\": \"566edc72-b5c4-4e91-95a5-05c01b5a4fbf\",\n \"isResizable\": false,\n \"w\": 24,\n \"x\": 0,\n \"y\": 18\n },\n \"name\": \"QUEUED MESSAGES\",\n \"type\": \"row\"\n },\n {\n \"custom\": {\n \"drawStyle\": \"lines\",\n \"fillOpacity\": 0.3,\n \"gradientMode\": \"opacity\",\n \"lineInterpolation\": \"smooth\",\n \"lineWidth\": 2,\n \"scaleDistribution\": {\n \"type\": \"linear\"\n },\n \"stack\": \"off\"\n },\n \"datasourceCate\": \"prometheus\",\n \"datasourceValue\": \"${datasource}\",\n \"description\": \"Total number of ready messages ready to be delivered to consumers.\\n\\nAim to keep this value as low as possible. RabbitMQ behaves best when messages are flowing through it. It's OK for publishers to occasionally outpace consumers, but the expectation is that consumers will eventually process all ready messages.\\n\\nIf this metric keeps increasing, your system will eventually run out of memory and/or disk space. Consider using TTL or Queue Length Limit to prevent unbounded message growth.\\n\\n* [Queues](https://www.rabbitmq.com/queues.html)\\n* [Consumers](https://www.rabbitmq.com/consumers.html)\\n* [Queue Length Limit](https://www.rabbitmq.com/maxlength.html)\\n* [Time-To-Live and Expiration](https://www.rabbitmq.com/ttl.html)\",\n \"id\": \"e8880d5b-4ed2-4f0d-a23d-03bfe4094eb8\",\n \"layout\": {\n \"h\": 3,\n \"i\": \"e8880d5b-4ed2-4f0d-a23d-03bfe4094eb8\",\n \"isResizable\": true,\n \"w\": 12,\n \"x\": 0,\n \"y\": 19\n },\n \"name\": \"Messages ready to be delivered to consumers\",\n \"options\": {\n \"legend\": {\n \"displayMode\": \"hidden\"\n },\n \"standardOptions\": {},\n \"thresholds\": {\n \"steps\": [\n {\n \"color\": \"#634CD9\",\n \"type\": \"base\",\n \"value\": null\n }\n ]\n },\n \"tooltip\": {\n \"mode\": \"all\",\n \"sort\": \"none\"\n }\n },\n \"targets\": [\n {\n \"expr\": \"sum(rabbitmq_queue_messages_ready {ident=\\\"$rabbitmq_cluster\\\"}) by(node)\",\n \"refId\": \"A\"\n }\n ],\n \"type\": \"timeseries\",\n \"version\": \"2.0.0\"\n },\n {\n \"custom\": {\n \"drawStyle\": \"lines\",\n \"fillOpacity\": 0.3,\n \"gradientMode\": \"opacity\",\n \"lineInterpolation\": \"smooth\",\n \"lineWidth\": 2,\n \"scaleDistribution\": {\n \"type\": \"linear\"\n },\n \"stack\": \"off\"\n },\n \"datasourceCate\": \"prometheus\",\n \"datasourceValue\": \"${datasource}\",\n \"description\": \"The total number of messages that are either in-flight to consumers, currently being processed by consumers or simply waiting for the consumer acknowledgements to be processed by the queue. Until the queue processes the message acknowledgement, the message will remain unacknowledged.\\n\\n* [Queues](https://www.rabbitmq.com/queues.html)\\n* [Confirms and Acknowledgements](https://www.rabbitmq.com/confirms.html)\\n* [Consumer Prefetch](https://www.rabbitmq.com/consumer-prefetch.html)\",\n \"id\": \"e48c24d4-fcee-437e-bbe7-3f61ad29cf12\",\n \"layout\": {\n \"h\": 3,\n \"i\": \"e48c24d4-fcee-437e-bbe7-3f61ad29cf12\",\n \"isResizable\": true,\n \"w\": 12,\n \"x\": 12,\n \"y\": 19\n },\n \"name\": \"Messages pending consumer acknowledgement\",\n \"options\": {\n \"legend\": {\n \"displayMode\": \"hidden\"\n },\n \"standardOptions\": {},\n \"thresholds\": {\n \"steps\": [\n {\n \"color\": \"#634CD9\",\n \"type\": \"base\",\n \"value\": null\n }\n ]\n },\n \"tooltip\": {\n \"mode\": \"all\",\n \"sort\": \"none\"\n }\n },\n \"targets\": [\n {\n \"expr\": \"sum(rabbitmq_queue_messages_unack {ident=\\\"$rabbitmq_cluster\\\"}) by(node)\",\n \"refId\": \"A\"\n }\n ],\n \"type\": \"timeseries\",\n \"version\": \"2.0.0\"\n },\n {\n \"collapsed\": true,\n \"id\": \"b38c82fc-188e-47e8-97a9-30a9ab630bca\",\n \"layout\": {\n \"h\": 1,\n \"i\": \"b38c82fc-188e-47e8-97a9-30a9ab630bca\",\n \"isResizable\": false,\n \"w\": 24,\n \"x\": 0,\n \"y\": 22\n },\n \"name\": \"INCOMING MESSAGES\",\n \"type\": \"row\"\n },\n {\n \"custom\": {\n \"drawStyle\": \"lines\",\n \"fillOpacity\": 0.3,\n \"gradientMode\": \"opacity\",\n \"lineInterpolation\": \"smooth\",\n \"lineWidth\": 2,\n \"scaleDistribution\": {\n \"type\": \"linear\"\n },\n \"stack\": \"off\"\n },\n \"datasourceCate\": \"prometheus\",\n \"datasourceValue\": \"${datasource}\",\n \"description\": \"The incoming message rate before any routing rules are applied.\\n\\nIf this value is lower than the number of messages published to queues, it may indicate that some messages are delivered to more than one queue.\\n\\nIf this value is higher than the number of messages published to queues, messages cannot be routed and will either be dropped or returned to publishers.\\n\\n* [Publishers](https://www.rabbitmq.com/publishers.html)\",\n \"id\": \"2cc48e5a-3cf3-4707-8d7b-718528dffdac\",\n \"layout\": {\n \"h\": 3,\n \"i\": \"2cc48e5a-3cf3-4707-8d7b-718528dffdac\",\n \"isResizable\": true,\n \"w\": 12,\n \"x\": 0,\n \"y\": 23\n },\n \"name\": \"Messages published / s\",\n \"options\": {\n \"legend\": {\n \"displayMode\": \"hidden\"\n },\n \"standardOptions\": {},\n \"thresholds\": {\n \"steps\": [\n {\n \"color\": \"#634CD9\",\n \"type\": \"base\",\n \"value\": null\n }\n ]\n },\n \"tooltip\": {\n \"mode\": \"all\",\n \"sort\": \"none\"\n }\n },\n \"targets\": [\n {\n \"expr\": \"sum(rate(rabbitmq_queue_messages_publish{ident=\\\"$rabbitmq_cluster\\\"}[60s]) )by(node)\",\n \"refId\": \"A\"\n }\n ],\n \"type\": \"timeseries\",\n \"version\": \"2.0.0\"\n },\n {\n \"custom\": {\n \"drawStyle\": \"lines\",\n \"fillOpacity\": 0.3,\n \"gradientMode\": \"opacity\",\n \"lineInterpolation\": \"smooth\",\n \"lineWidth\": 2,\n \"scaleDistribution\": {\n \"type\": \"linear\"\n },\n \"stack\": \"off\"\n },\n \"datasourceCate\": \"prometheus\",\n \"datasourceValue\": \"${datasource}\",\n \"description\": \"The rate of messages confirmed by the broker to publishers. Publishers must opt-in to receive message confirmations.\\n\\nIf this metric is consistently at zero it may suggest that publisher confirms are not used by clients. The safety of published messages is likely to be at risk.\\n\\n* [Publisher Confirms](https://www.rabbitmq.com/confirms.html#publisher-confirms)\\n* [Publisher Confirms and Data Safety](https://www.rabbitmq.com/publishers.html#data-safety)\\n* [When Will Published Messages Be Confirmed by the Broker?](https://www.rabbitmq.com/confirms.html#when-publishes-are-confirmed)\",\n \"id\": \"ab889d4e-8523-47c5-8513-2bdd8c4176eb\",\n \"layout\": {\n \"h\": 3,\n \"i\": \"ab889d4e-8523-47c5-8513-2bdd8c4176eb\",\n \"isResizable\": true,\n \"w\": 12,\n \"x\": 12,\n \"y\": 23\n },\n \"name\": \"Messages confirmed to publishers / s\",\n \"options\": {\n \"legend\": {\n \"displayMode\": \"hidden\"\n },\n \"standardOptions\": {},\n \"thresholds\": {\n \"steps\": [\n {\n \"color\": \"#634CD9\",\n \"type\": \"base\",\n \"value\": null\n }\n ]\n },\n \"tooltip\": {\n \"mode\": \"all\",\n \"sort\": \"none\"\n }\n },\n \"targets\": [\n {\n \"expr\": \"sum(rate(rabbitmq_queue_messages_publish{ident=\\\"$rabbitmq_cluster\\\"}[60s])) by(node)\",\n \"refId\": \"A\"\n }\n ],\n \"type\": \"timeseries\",\n \"version\": \"2.0.0\"\n },\n {\n \"custom\": {\n \"drawStyle\": \"lines\",\n \"fillOpacity\": 0.3,\n \"gradientMode\": \"opacity\",\n \"lineInterpolation\": \"smooth\",\n \"lineWidth\": 2,\n \"scaleDistribution\": {\n \"type\": \"linear\"\n },\n \"stack\": \"off\"\n },\n \"datasourceCate\": \"prometheus\",\n \"datasourceValue\": \"${datasource}\",\n \"description\": \"The rate of messages received from publishers and successfully routed to the master queue replicas.\\n\\n* [Queues](https://www.rabbitmq.com/queues.html)\\n* [Publishers](https://www.rabbitmq.com/publishers.html)\",\n \"id\": \"770a9c4e-111e-4129-ad3a-08f9aca80628\",\n \"layout\": {\n \"h\": 3,\n \"i\": \"770a9c4e-111e-4129-ad3a-08f9aca80628\",\n \"isResizable\": true,\n \"w\": 12,\n \"x\": 0,\n \"y\": 26\n },\n \"name\": \"Messages routed to queues / s\",\n \"options\": {\n \"legend\": {\n \"displayMode\": \"hidden\"\n },\n \"standardOptions\": {},\n \"thresholds\": {\n \"steps\": [\n {\n \"color\": \"#634CD9\",\n \"type\": \"base\",\n \"value\": null\n }\n ]\n },\n \"tooltip\": {\n \"mode\": \"all\",\n \"sort\": \"none\"\n }\n },\n \"targets\": [\n {\n \"expr\": \"sum(rate(rabbitmq_queue_messages_publish{ident=\\\"$rabbitmq_cluster\\\"}[60s])) by(node)\",\n \"refId\": \"A\"\n }\n ],\n \"type\": \"timeseries\",\n \"version\": \"2.0.0\"\n },\n {\n \"custom\": {\n \"drawStyle\": \"lines\",\n \"fillOpacity\": 0.3,\n \"gradientMode\": \"opacity\",\n \"lineInterpolation\": \"smooth\",\n \"lineWidth\": 2,\n \"scaleDistribution\": {\n \"type\": \"linear\"\n },\n \"stack\": \"off\"\n },\n \"datasourceCate\": \"prometheus\",\n \"datasourceValue\": \"${datasource}\",\n \"description\": \"The rate of messages received from publishers that have publisher confirms enabled and the broker has not confirmed yet.\\n\\n* [Publishers](https://www.rabbitmq.com/publishers.html)\\n* [Confirms and Acknowledgements](https://www.rabbitmq.com/confirms.html)\\n* [When Will Published Messages Be Confirmed by the Broker?](https://www.rabbitmq.com/confirms.html#when-publishes-are-confirmed)\",\n \"id\": \"f942bdc4-1b89-48f9-84ad-6ff1448f9764\",\n \"layout\": {\n \"h\": 3,\n \"i\": \"f942bdc4-1b89-48f9-84ad-6ff1448f9764\",\n \"isResizable\": true,\n \"w\": 12,\n \"x\": 12,\n \"y\": 26\n },\n \"name\": \"Messages unconfirmed to publishers / s\",\n \"options\": {\n \"legend\": {\n \"displayMode\": \"hidden\"\n },\n \"standardOptions\": {},\n \"thresholds\": {\n \"steps\": [\n {\n \"color\": \"#634CD9\",\n \"type\": \"base\",\n \"value\": null\n }\n ]\n },\n \"tooltip\": {\n \"mode\": \"all\",\n \"sort\": \"none\"\n }\n },\n \"targets\": [\n {\n \"expr\": \"sum(rate(rabbitmq_queue_messages_unack{ident=\\\"$rabbitmq_cluster\\\"}[60s])) by(node)\",\n \"refId\": \"A\"\n }\n ],\n \"type\": \"timeseries\",\n \"version\": \"2.0.0\"\n },\n {\n \"custom\": {\n \"drawStyle\": \"lines\",\n \"fillOpacity\": 0.3,\n \"gradientMode\": \"opacity\",\n \"lineInterpolation\": \"smooth\",\n \"lineWidth\": 2,\n \"scaleDistribution\": {\n \"type\": \"linear\"\n },\n \"stack\": \"off\"\n },\n \"datasourceCate\": \"prometheus\",\n \"datasourceValue\": \"${datasource}\",\n \"description\": \"The rate of messages that cannot be routed and are dropped. \\n\\nAny value above zero means message loss and likely suggests a routing problem on the publisher end.\\n\\n* [Unroutable Message Handling](https://www.rabbitmq.com/publishers.html#unroutable)\",\n \"id\": \"893a01fa-9310-4f8b-a321-ea65a73bc74f\",\n \"layout\": {\n \"h\": 3,\n \"i\": \"893a01fa-9310-4f8b-a321-ea65a73bc74f\",\n \"isResizable\": true,\n \"w\": 12,\n \"x\": 0,\n \"y\": 29\n },\n \"name\": \"Unroutable messages dropped / s\",\n \"options\": {\n \"legend\": {\n \"displayMode\": \"hidden\"\n },\n \"standardOptions\": {},\n \"thresholds\": {\n \"steps\": [\n {\n \"color\": \"#634CD9\",\n \"type\": \"base\",\n \"value\": null\n }\n ]\n },\n \"tooltip\": {\n \"mode\": \"all\",\n \"sort\": \"none\"\n }\n },\n \"targets\": [\n {\n \"expr\": \"sum(rate(rabbitmq_overview_return_unroutable{ident=\\\"$rabbitmq_cluster\\\"}[60s])) by (ident)\",\n \"refId\": \"A\"\n }\n ],\n \"type\": \"timeseries\",\n \"version\": \"2.0.0\"\n },\n {\n \"collapsed\": true,\n \"id\": \"8e0ab8be-7b82-4757-bc9c-8b4a5d940c63\",\n \"layout\": {\n \"h\": 1,\n \"i\": \"8e0ab8be-7b82-4757-bc9c-8b4a5d940c63\",\n \"isResizable\": false,\n \"w\": 24,\n \"x\": 0,\n \"y\": 32\n },\n \"name\": \"OUTGOING MESSAGES\",\n \"type\": \"row\"\n },\n {\n \"custom\": {\n \"drawStyle\": \"lines\",\n \"fillOpacity\": 0.3,\n \"gradientMode\": \"opacity\",\n \"lineInterpolation\": \"smooth\",\n \"lineWidth\": 2,\n \"scaleDistribution\": {\n \"type\": \"linear\"\n },\n \"stack\": \"off\"\n },\n \"datasourceCate\": \"prometheus\",\n \"datasourceValue\": \"${datasource}\",\n \"description\": \"The rate of messages delivered to consumers. It includes messages that have been redelivered.\\n\\nThis metric does not include messages that have been fetched by consumers using `basic.get` (consumed by polling).\\n\\n* [Consumers](https://www.rabbitmq.com/consumers.html)\",\n \"id\": \"104ae6cf-c39b-449b-8241-e2ff1bfa17d0\",\n \"layout\": {\n \"h\": 3,\n \"i\": \"104ae6cf-c39b-449b-8241-e2ff1bfa17d0\",\n \"isResizable\": true,\n \"w\": 12,\n \"x\": 0,\n \"y\": 33\n },\n \"name\": \"Messages delivered / s\",\n \"options\": {\n \"legend\": {\n \"displayMode\": \"hidden\"\n },\n \"standardOptions\": {},\n \"thresholds\": {\n \"steps\": [\n {\n \"color\": \"#634CD9\",\n \"type\": \"base\",\n \"value\": null\n }\n ]\n },\n \"tooltip\": {\n \"mode\": \"all\",\n \"sort\": \"none\"\n }\n },\n \"targets\": [\n {\n \"expr\": \"sum(\\n (rate(rabbitmq_queue_messages_deliver{ident=\\\"$rabbitmq_cluster\\\"}[60s]) ) \\n) by(node)\",\n \"refId\": \"A\"\n }\n ],\n \"type\": \"timeseries\",\n \"version\": \"2.0.0\"\n },\n {\n \"custom\": {\n \"drawStyle\": \"lines\",\n \"fillOpacity\": 0.3,\n \"gradientMode\": \"opacity\",\n \"lineInterpolation\": \"smooth\",\n \"lineWidth\": 2,\n \"scaleDistribution\": {\n \"type\": \"linear\"\n },\n \"stack\": \"off\"\n },\n \"datasourceCate\": \"prometheus\",\n \"datasourceValue\": \"${datasource}\",\n \"description\": \"The rate of messages that have been redelivered to consumers. It includes messages that have been requeued automatically and redelivered due to channel exceptions or connection closures.\\n\\nHaving some redeliveries is expected, but if this metric is consistently non-zero, it is worth investigating why.\\n\\n* [Negative Acknowledgement and Requeuing of Deliveries](https://www.rabbitmq.com/confirms.html#consumer-nacks-requeue)\\n* [Consumers](https://www.rabbitmq.com/consumers.html)\",\n \"id\": \"bb0db7aa-e816-43a7-97a3-2798ab9fa04f\",\n \"layout\": {\n \"h\": 3,\n \"i\": \"bb0db7aa-e816-43a7-97a3-2798ab9fa04f\",\n \"isResizable\": true,\n \"w\": 12,\n \"x\": 12,\n \"y\": 33\n },\n \"name\": \"Messages redelivered / s\",\n \"options\": {\n \"legend\": {\n \"displayMode\": \"hidden\"\n },\n \"standardOptions\": {},\n \"thresholds\": {\n \"steps\": [\n {\n \"color\": \"#634CD9\",\n \"type\": \"base\",\n \"value\": null\n }\n ]\n },\n \"tooltip\": {\n \"mode\": \"all\",\n \"sort\": \"none\"\n }\n },\n \"targets\": [\n {\n \"expr\": \"sum(rate(rabbitmq_queue_messages_redeliver{ident=\\\"$rabbitmq_cluster\\\"}[60s])) by(node)\",\n \"refId\": \"A\"\n }\n ],\n \"type\": \"timeseries\",\n \"version\": \"2.0.0\"\n },\n {\n \"custom\": {\n \"drawStyle\": \"lines\",\n \"fillOpacity\": 0.3,\n \"gradientMode\": \"opacity\",\n \"lineInterpolation\": \"smooth\",\n \"lineWidth\": 2,\n \"scaleDistribution\": {\n \"type\": \"linear\"\n },\n \"stack\": \"off\"\n },\n \"datasourceCate\": \"prometheus\",\n \"datasourceValue\": \"${datasource}\",\n \"description\": \"The rate of message deliveries to consumers that use manual acknowledgement mode.\\n\\nWhen this mode is used, RabbitMQ waits for consumers to acknowledge messages before more messages can be delivered.\\n\\nThis is the safest way of consuming messages.\\n\\n* [Consumer Acknowledgements](https://www.rabbitmq.com/confirms.html)\\n* [Consumer Prefetch](https://www.rabbitmq.com/consumer-prefetch.html)\\n* [Consumer Acknowledgement Modes, Prefetch and Throughput](https://www.rabbitmq.com/confirms.html#channel-qos-prefetch-throughput)\\n* [Consumers](https://www.rabbitmq.com/consumers.html)\",\n \"id\": \"63128d34-dfc3-4ff1-932f-2c533203d8c4\",\n \"layout\": {\n \"h\": 3,\n \"i\": \"63128d34-dfc3-4ff1-932f-2c533203d8c4\",\n \"isResizable\": true,\n \"w\": 12,\n \"x\": 0,\n \"y\": 36\n },\n \"name\": \"Messages delivered with ack / s\",\n \"options\": {\n \"legend\": {\n \"displayMode\": \"hidden\"\n },\n \"standardOptions\": {},\n \"thresholds\": {\n \"steps\": [\n {\n \"color\": \"#634CD9\",\n \"type\": \"base\",\n \"value\": null\n }\n ]\n },\n \"tooltip\": {\n \"mode\": \"all\",\n \"sort\": \"none\"\n }\n },\n \"targets\": [\n {\n \"expr\": \"sum(rate(rabbitmq_queue_messages_ack{ident=\\\"$rabbitmq_cluster\\\"}[60s]) ) by(node)\",\n \"refId\": \"A\"\n }\n ],\n \"type\": \"timeseries\",\n \"version\": \"2.0.0\"\n },\n {\n \"custom\": {\n \"drawStyle\": \"lines\",\n \"fillOpacity\": 0.3,\n \"gradientMode\": \"opacity\",\n \"lineInterpolation\": \"smooth\",\n \"lineWidth\": 2,\n \"scaleDistribution\": {\n \"type\": \"linear\"\n },\n \"stack\": \"off\"\n },\n \"datasourceCate\": \"prometheus\",\n \"datasourceValue\": \"${datasource}\",\n \"description\": \"The rate of message acknowledgements coming from consumers that use manual acknowledgement mode.\\n\\n* [Consumer Acknowledgements](https://www.rabbitmq.com/confirms.html)\\n* [Consumer Prefetch](https://www.rabbitmq.com/consumer-prefetch.html)\\n* [Consumer Acknowledgement Modes, Prefetch and Throughput](https://www.rabbitmq.com/confirms.html#channel-qos-prefetch-throughput)\\n* [Consumers](https://www.rabbitmq.com/consumers.html)\",\n \"id\": \"43c7aaf9-1a12-4d51-bc9a-1ae9c74b5852\",\n \"layout\": {\n \"h\": 3,\n \"i\": \"43c7aaf9-1a12-4d51-bc9a-1ae9c74b5852\",\n \"isResizable\": true,\n \"w\": 12,\n \"x\": 12,\n \"y\": 36\n },\n \"name\": \"Messages acknowledged / s\",\n \"options\": {\n \"legend\": {\n \"displayMode\": \"hidden\"\n },\n \"standardOptions\": {},\n \"thresholds\": {\n \"steps\": [\n {\n \"color\": \"#634CD9\",\n \"type\": \"base\",\n \"value\": null\n }\n ]\n },\n \"tooltip\": {\n \"mode\": \"all\",\n \"sort\": \"none\"\n }\n },\n \"targets\": [\n {\n \"expr\": \"sum(rate(rabbitmq_queue_messages_ack{ident=\\\"$rabbitmq_cluster\\\"}[60s])) by(node)\",\n \"refId\": \"A\"\n }\n ],\n \"type\": \"timeseries\",\n \"version\": \"2.0.0\"\n },\n {\n \"collapsed\": true,\n \"id\": \"a4135c37-c958-47e9-b5c9-74862d1325fa\",\n \"layout\": {\n \"h\": 1,\n \"i\": \"a4135c37-c958-47e9-b5c9-74862d1325fa\",\n \"isResizable\": false,\n \"w\": 24,\n \"x\": 0,\n \"y\": 39\n },\n \"name\": \"QUEUES\",\n \"type\": \"row\"\n },\n {\n \"custom\": {\n \"drawStyle\": \"lines\",\n \"fillOpacity\": 0.3,\n \"gradientMode\": \"opacity\",\n \"lineInterpolation\": \"smooth\",\n \"lineWidth\": 2,\n \"scaleDistribution\": {\n \"type\": \"linear\"\n },\n \"stack\": \"off\"\n },\n \"datasourceCate\": \"prometheus\",\n \"datasourceValue\": \"${datasource}\",\n \"description\": \"Total number of queue masters per node. \\n\\nThis metric makes it easy to see sub-optimal queue distribution in a cluster.\\n\\n* [Queue Masters, Data Locality](https://www.rabbitmq.com/ha.html#master-migration-data-locality)\\n* [Queues](https://www.rabbitmq.com/queues.html)\",\n \"id\": \"982f2841-be7a-488a-92d1-22c75551ed46\",\n \"layout\": {\n \"h\": 3,\n \"i\": \"982f2841-be7a-488a-92d1-22c75551ed46\",\n \"isResizable\": true,\n \"w\": 12,\n \"x\": 0,\n \"y\": 40\n },\n \"name\": \"Total queues\",\n \"options\": {\n \"legend\": {\n \"displayMode\": \"hidden\"\n },\n \"standardOptions\": {},\n \"thresholds\": {\n \"steps\": [\n {\n \"color\": \"#634CD9\",\n \"type\": \"base\",\n \"value\": null\n }\n ]\n },\n \"tooltip\": {\n \"mode\": \"all\",\n \"sort\": \"none\"\n }\n },\n \"targets\": [\n {\n \"expr\": \"rabbitmq_overview_queues {ident=\\\"$rabbitmq_cluster\\\"}\",\n \"refId\": \"A\"\n }\n ],\n \"type\": \"timeseries\",\n \"version\": \"2.0.0\"\n },\n {\n \"collapsed\": true,\n \"id\": \"2ac43291-3149-4c9a-8812-a9087e682f9c\",\n \"layout\": {\n \"h\": 1,\n \"i\": \"2ac43291-3149-4c9a-8812-a9087e682f9c\",\n \"isResizable\": false,\n \"w\": 24,\n \"x\": 0,\n \"y\": 43\n },\n \"name\": \"CHANNELS\",\n \"type\": \"row\"\n },\n {\n \"custom\": {\n \"drawStyle\": \"lines\",\n \"fillOpacity\": 0.3,\n \"gradientMode\": \"opacity\",\n \"lineInterpolation\": \"smooth\",\n \"lineWidth\": 2,\n \"scaleDistribution\": {\n \"type\": \"linear\"\n },\n \"stack\": \"off\"\n },\n \"datasourceCate\": \"prometheus\",\n \"datasourceValue\": \"${datasource}\",\n \"description\": \"Total number of channels on all currently opened connections.\\n\\nIf this metric grows monotonically it is highly likely a channel leak in one of the applications. Confirm channel leaks by using the _Channels opened_ and _Channels closed_ metrics.\\n\\n* [Channel Leak](https://www.rabbitmq.com/channels.html#channel-leaks)\\n* [Channels](https://www.rabbitmq.com/channels.html)\",\n \"id\": \"0146d1d3-d08b-46b8-b392-e1daa3da23b4\",\n \"layout\": {\n \"h\": 3,\n \"i\": \"0146d1d3-d08b-46b8-b392-e1daa3da23b4\",\n \"isResizable\": true,\n \"w\": 12,\n \"x\": 0,\n \"y\": 44\n },\n \"name\": \"Total channels\",\n \"options\": {\n \"legend\": {\n \"displayMode\": \"hidden\"\n },\n \"standardOptions\": {},\n \"thresholds\": {\n \"steps\": [\n {\n \"color\": \"#634CD9\",\n \"type\": \"base\",\n \"value\": null\n }\n ]\n },\n \"tooltip\": {\n \"mode\": \"all\",\n \"sort\": \"none\"\n }\n },\n \"targets\": [\n {\n \"expr\": \"rabbitmq_overview_channels{ident=\\\"$rabbitmq_cluster\\\"}\",\n \"refId\": \"A\"\n }\n ],\n \"type\": \"timeseries\",\n \"version\": \"2.0.0\"\n },\n {\n \"collapsed\": true,\n \"id\": \"a559739f-e971-4929-b84f-e64522b19ea5\",\n \"layout\": {\n \"h\": 1,\n \"i\": \"a559739f-e971-4929-b84f-e64522b19ea5\",\n \"isResizable\": false,\n \"w\": 24,\n \"x\": 0,\n \"y\": 47\n },\n \"name\": \"CONNECTIONS\",\n \"type\": \"row\"\n },\n {\n \"custom\": {\n \"drawStyle\": \"lines\",\n \"fillOpacity\": 0.3,\n \"gradientMode\": \"opacity\",\n \"lineInterpolation\": \"smooth\",\n \"lineWidth\": 2,\n \"scaleDistribution\": {\n \"type\": \"linear\"\n },\n \"stack\": \"off\"\n },\n \"datasourceCate\": \"prometheus\",\n \"datasourceValue\": \"${datasource}\",\n \"description\": \"Total number of client connections.\\n\\nIf this metric grows monotonically it is highly likely a connection leak in one of the applications. Confirm connection leaks by using the _Connections opened_ and _Connections closed_ metrics.\\n\\n* [Connection Leak](https://www.rabbitmq.com/connections.html#monitoring)\\n* [Connections](https://www.rabbitmq.com/connections.html)\",\n \"id\": \"a64f0f0d-2814-4626-845c-6c09e1de1d51\",\n \"layout\": {\n \"h\": 3,\n \"i\": \"a64f0f0d-2814-4626-845c-6c09e1de1d51\",\n \"isResizable\": true,\n \"w\": 12,\n \"x\": 0,\n \"y\": 48\n },\n \"name\": \"Total connections\",\n \"options\": {\n \"legend\": {\n \"displayMode\": \"hidden\"\n },\n \"standardOptions\": {},\n \"thresholds\": {\n \"steps\": [\n {\n \"color\": \"#634CD9\",\n \"type\": \"base\",\n \"value\": null\n }\n ]\n },\n \"tooltip\": {\n \"mode\": \"all\",\n \"sort\": \"none\"\n }\n },\n \"targets\": [\n {\n \"expr\": \"rabbitmq_overview_connections {ident=\\\"$rabbitmq_cluster\\\"}\",\n \"refId\": \"A\"\n }\n ],\n \"type\": \"timeseries\",\n \"version\": \"2.0.0\"\n }\n ],\n \"var\": [\n {\n \"definition\": \"prometheus\",\n \"name\": \"datasource\",\n \"type\": \"datasource\"\n },\n {\n \"datasource\": {\n \"cate\": \"prometheus\",\n \"value\": \"${datasource}\"\n },\n \"definition\": \"label_values(rabbitmq_node_uptime, ident)\",\n \"name\": \"rabbitmq_cluster\",\n \"type\": \"query\"\n }\n ],\n \"version\": \"3.0.0\"\n },\n \"public\": 0,\n \"public_cate\": 0,\n \"bgids\": null,\n \"built_in\": 0,\n \"hide\": 0,\n \"uuid\": 1717556328330392000\n}"
},
{
"path": "integrations/RabbitMQ/markdown/README.md",
"content": "# RabbitMQ\n\n高版本(3.8以上版本)的 RabbitMQ,已经内置支持了暴露 Prometheus 协议的监控数据。所以,直接使用 categraf 的 prometheus 插件即可采集。开启 RabbitMQ Prometheus 访问:\n\n```bash\nrabbitmq-plugins enable rabbitmq_prometheus\n```\n\n启用成功的话,rabbitmq 默认会在 15692 端口起监听,访问 `http://localhost:15692/metrics` 即可看到符合 prometheus 协议的监控数据。\n\n如果低于 3.8 的版本,还是需要使用 categraf 的 rabbitmq 插件来采集监控数据。\n"
},
{
"path": "integrations/Redis/alerts/redis_by_categraf.json",
"content": "[\n {\n \"id\": 0,\n \"group_id\": 0,\n \"cate\": \"prometheus\",\n \"datasource_ids\": [\n 0\n ],\n \"cluster\": \"\",\n \"name\": \"High Redis eviction rate\",\n \"note\": \"\",\n \"prod\": \"metric\",\n \"algorithm\": \"\",\n \"algo_params\": null,\n \"delay\": 0,\n \"severity\": 2,\n \"severities\": [\n 2\n ],\n \"disabled\": 1,\n \"prom_for_duration\": 60,\n \"prom_ql\": \"\",\n \"rule_config\": {\n \"algo_params\": null,\n \"inhibit\": false,\n \"prom_ql\": \"\",\n \"queries\": [\n {\n \"prom_ql\": \"(sum(rate(redis_evicted_keys[5m])) / sum(redis_keyspace_keys)) \\u003e 0.1\",\n \"severity\": 2\n }\n ],\n \"severity\": 0\n },\n \"prom_eval_interval\": 15,\n \"enable_stime\": \"00:00\",\n \"enable_stimes\": [\n \"00:00\"\n ],\n \"enable_etime\": \"23:59\",\n \"enable_etimes\": [\n \"23:59\"\n ],\n \"enable_days_of_week\": [\n \"1\",\n \"2\",\n \"3\",\n \"4\",\n \"5\",\n \"6\",\n \"0\"\n ],\n \"enable_days_of_weeks\": [\n [\n \"1\",\n \"2\",\n \"3\",\n \"4\",\n \"5\",\n \"6\",\n \"0\"\n ]\n ],\n \"enable_in_bg\": 0,\n \"notify_recovered\": 1,\n \"notify_channels\": [],\n \"notify_groups_obj\": null,\n \"notify_groups\": null,\n \"notify_repeat_step\": 60,\n \"notify_max_number\": 0,\n \"recover_duration\": 0,\n \"callbacks\": [],\n \"runbook_url\": \"\",\n \"append_tags\": [\n \"alertname=RedisHighKeysEvictionRatio\"\n ],\n \"annotations\": null,\n \"extra_config\": null,\n \"create_at\": 0,\n \"create_by\": \"\",\n \"update_at\": 0,\n \"update_by\": \"\",\n \"uuid\": 1717556328335595000\n },\n {\n \"id\": 0,\n \"group_id\": 0,\n \"cate\": \"prometheus\",\n \"datasource_ids\": [\n 0\n ],\n \"cluster\": \"\",\n \"name\": \"High Redis memory usage rate\",\n \"note\": \"\",\n \"prod\": \"metric\",\n \"algorithm\": \"\",\n \"algo_params\": null,\n \"delay\": 0,\n \"severity\": 2,\n \"severities\": [\n 2\n ],\n \"disabled\": 1,\n \"prom_for_duration\": 60,\n \"prom_ql\": \"\",\n \"rule_config\": {\n \"algo_params\": null,\n \"inhibit\": false,\n \"prom_ql\": \"\",\n \"queries\": [\n {\n \"prom_ql\": \"redis_maxmemory \\u003e 0 and (redis_used_memory / redis_maxmemory) \\u003e 0.85\",\n \"severity\": 2\n }\n ],\n \"severity\": 0\n },\n \"prom_eval_interval\": 15,\n \"enable_stime\": \"00:00\",\n \"enable_stimes\": [\n \"00:00\"\n ],\n \"enable_etime\": \"23:59\",\n \"enable_etimes\": [\n \"23:59\"\n ],\n \"enable_days_of_week\": [\n \"1\",\n \"2\",\n \"3\",\n \"4\",\n \"5\",\n \"6\",\n \"0\"\n ],\n \"enable_days_of_weeks\": [\n [\n \"1\",\n \"2\",\n \"3\",\n \"4\",\n \"5\",\n \"6\",\n \"0\"\n ]\n ],\n \"enable_in_bg\": 0,\n \"notify_recovered\": 1,\n \"notify_channels\": [],\n \"notify_groups_obj\": null,\n \"notify_groups\": null,\n \"notify_repeat_step\": 60,\n \"notify_max_number\": 0,\n \"recover_duration\": 0,\n \"callbacks\": [],\n \"runbook_url\": \"\",\n \"append_tags\": [\n \"alertname=RedisHighMemoryUsage\"\n ],\n \"annotations\": null,\n \"extra_config\": null,\n \"create_at\": 0,\n \"create_by\": \"\",\n \"update_at\": 0,\n \"update_by\": \"\",\n \"uuid\": 1717556328337406000\n },\n {\n \"id\": 0,\n \"group_id\": 0,\n \"cate\": \"prometheus\",\n \"datasource_ids\": [\n 0\n ],\n \"cluster\": \"\",\n \"name\": \"High Redis Ping latency (above 100 milliseconds)\",\n \"note\": \"\",\n \"prod\": \"metric\",\n \"algorithm\": \"\",\n \"algo_params\": null,\n \"delay\": 0,\n \"severity\": 2,\n \"severities\": [\n 2\n ],\n \"disabled\": 1,\n \"prom_for_duration\": 60,\n \"prom_ql\": \"\",\n \"rule_config\": {\n \"algo_params\": null,\n \"inhibit\": false,\n \"prom_ql\": \"\",\n \"queries\": [\n {\n \"prom_ql\": \"redis_ping_use_seconds \\u003e 0.1\",\n \"severity\": 2\n }\n ],\n \"severity\": 0\n },\n \"prom_eval_interval\": 15,\n \"enable_stime\": \"00:00\",\n \"enable_stimes\": [\n \"00:00\"\n ],\n \"enable_etime\": \"23:59\",\n \"enable_etimes\": [\n \"23:59\"\n ],\n \"enable_days_of_week\": [\n \"1\",\n \"2\",\n \"3\",\n \"4\",\n \"5\",\n \"6\",\n \"0\"\n ],\n \"enable_days_of_weeks\": [\n [\n \"1\",\n \"2\",\n \"3\",\n \"4\",\n \"5\",\n \"6\",\n \"0\"\n ]\n ],\n \"enable_in_bg\": 0,\n \"notify_recovered\": 1,\n \"notify_channels\": [],\n \"notify_groups_obj\": null,\n \"notify_groups\": null,\n \"notify_repeat_step\": 60,\n \"notify_max_number\": 0,\n \"recover_duration\": 0,\n \"callbacks\": [],\n \"runbook_url\": \"\",\n \"append_tags\": [\n \"alertname=HighPingLatency\"\n ],\n \"annotations\": null,\n \"extra_config\": null,\n \"create_at\": 0,\n \"create_by\": \"\",\n \"update_at\": 0,\n \"update_by\": \"\",\n \"uuid\": 1717556328338174000\n },\n {\n \"id\": 0,\n \"group_id\": 0,\n \"cate\": \"prometheus\",\n \"datasource_ids\": [\n 0\n ],\n \"cluster\": \"\",\n \"name\": \"Low Redis hit rate\",\n \"note\": \"\",\n \"prod\": \"metric\",\n \"algorithm\": \"\",\n \"algo_params\": null,\n \"delay\": 0,\n \"severity\": 2,\n \"severities\": [\n 2\n ],\n \"disabled\": 1,\n \"prom_for_duration\": 60,\n \"prom_ql\": \"\",\n \"rule_config\": {\n \"algo_params\": null,\n \"inhibit\": false,\n \"prom_ql\": \"\",\n \"queries\": [\n {\n \"prom_ql\": \"rate(redis_keyspace_hits[5m])\\n/\\n(rate(redis_keyspace_misses[5m]) + rate(redis_keyspace_hits[5m]))\\n\\u003c 0.9\",\n \"severity\": 2\n }\n ],\n \"severity\": 0\n },\n \"prom_eval_interval\": 15,\n \"enable_stime\": \"00:00\",\n \"enable_stimes\": [\n \"00:00\"\n ],\n \"enable_etime\": \"23:59\",\n \"enable_etimes\": [\n \"23:59\"\n ],\n \"enable_days_of_week\": [\n \"1\",\n \"2\",\n \"3\",\n \"4\",\n \"5\",\n \"6\",\n \"0\"\n ],\n \"enable_days_of_weeks\": [\n [\n \"1\",\n \"2\",\n \"3\",\n \"4\",\n \"5\",\n \"6\",\n \"0\"\n ]\n ],\n \"enable_in_bg\": 0,\n \"notify_recovered\": 1,\n \"notify_channels\": [],\n \"notify_groups_obj\": null,\n \"notify_groups\": null,\n \"notify_repeat_step\": 60,\n \"notify_max_number\": 0,\n \"recover_duration\": 0,\n \"callbacks\": [],\n \"runbook_url\": \"\",\n \"append_tags\": [\n \"alertname=RedisLowHitRatio\"\n ],\n \"annotations\": null,\n \"extra_config\": null,\n \"create_at\": 0,\n \"create_by\": \"\",\n \"update_at\": 0,\n \"update_by\": \"\",\n \"uuid\": 1717556328339001000\n },\n {\n \"id\": 0,\n \"group_id\": 0,\n \"cate\": \"prometheus\",\n \"datasource_ids\": [\n 0\n ],\n \"cluster\": \"\",\n \"name\": \"Redis connection refused\",\n \"note\": \"\",\n \"prod\": \"metric\",\n \"algorithm\": \"\",\n \"algo_params\": null,\n \"delay\": 0,\n \"severity\": 2,\n \"severities\": [\n 2\n ],\n \"disabled\": 1,\n \"prom_for_duration\": 0,\n \"prom_ql\": \"\",\n \"rule_config\": {\n \"algo_params\": null,\n \"inhibit\": false,\n \"prom_ql\": \"\",\n \"queries\": [\n {\n \"prom_ql\": \"(rate(redis_rejected_connections[5m])) \\u003e 0\",\n \"severity\": 2\n }\n ],\n \"severity\": 0\n },\n \"prom_eval_interval\": 15,\n \"enable_stime\": \"00:00\",\n \"enable_stimes\": [\n \"00:00\"\n ],\n \"enable_etime\": \"23:59\",\n \"enable_etimes\": [\n \"23:59\"\n ],\n \"enable_days_of_week\": [\n \"1\",\n \"2\",\n \"3\",\n \"4\",\n \"5\",\n \"6\",\n \"0\"\n ],\n \"enable_days_of_weeks\": [\n [\n \"1\",\n \"2\",\n \"3\",\n \"4\",\n \"5\",\n \"6\",\n \"0\"\n ]\n ],\n \"enable_in_bg\": 0,\n \"notify_recovered\": 1,\n \"notify_channels\": [],\n \"notify_groups_obj\": null,\n \"notify_groups\": null,\n \"notify_repeat_step\": 60,\n \"notify_max_number\": 0,\n \"recover_duration\": 0,\n \"callbacks\": [],\n \"runbook_url\": \"\",\n \"append_tags\": [\n \"alertname=RedisRejectedConnHigh\"\n ],\n \"annotations\": null,\n \"extra_config\": null,\n \"create_at\": 0,\n \"create_by\": \"\",\n \"update_at\": 0,\n \"update_by\": \"\",\n \"uuid\": 1717556328339447000\n },\n {\n \"id\": 0,\n \"group_id\": 0,\n \"cate\": \"prometheus\",\n \"datasource_ids\": [\n 0\n ],\n \"cluster\": \"\",\n \"name\": \"Redis has just been restarted, please be aware\",\n \"note\": \"\",\n \"prod\": \"metric\",\n \"algorithm\": \"\",\n \"algo_params\": null,\n \"delay\": 0,\n \"severity\": 3,\n \"severities\": [\n 3\n ],\n \"disabled\": 1,\n \"prom_for_duration\": 0,\n \"prom_ql\": \"\",\n \"rule_config\": {\n \"algo_params\": null,\n \"inhibit\": false,\n \"prom_ql\": \"\",\n \"queries\": [\n {\n \"prom_ql\": \"redis_uptime_in_seconds \\u003c 600\",\n \"severity\": 3\n }\n ],\n \"severity\": 0\n },\n \"prom_eval_interval\": 15,\n \"enable_stime\": \"00:00\",\n \"enable_stimes\": [\n \"00:00\"\n ],\n \"enable_etime\": \"23:59\",\n \"enable_etimes\": [\n \"23:59\"\n ],\n \"enable_days_of_week\": [\n \"1\",\n \"2\",\n \"3\",\n \"4\",\n \"5\",\n \"6\",\n \"0\"\n ],\n \"enable_days_of_weeks\": [\n [\n \"1\",\n \"2\",\n \"3\",\n \"4\",\n \"5\",\n \"6\",\n \"0\"\n ]\n ],\n \"enable_in_bg\": 0,\n \"notify_recovered\": 1,\n \"notify_channels\": [],\n \"notify_groups_obj\": null,\n \"notify_groups\": null,\n \"notify_repeat_step\": 60,\n \"notify_max_number\": 0,\n \"recover_duration\": 0,\n \"callbacks\": [],\n \"runbook_url\": \"\",\n \"append_tags\": [\n \"alertname=RedisLowUptime\"\n ],\n \"annotations\": null,\n \"extra_config\": null,\n \"create_at\": 0,\n \"create_by\": \"\",\n \"update_at\": 0,\n \"update_by\": \"\",\n \"uuid\": 1717556328339909000\n }\n]"
},
{
"path": "integrations/Redis/alerts/redis_by_exporter.json",
"content": "[\n {\n \"id\": 0,\n \"group_id\": 0,\n \"cate\": \"prometheus\",\n \"datasource_ids\": [\n 0\n ],\n \"cluster\": \"\",\n \"name\": \"High Redis client connection count - exporter\",\n \"note\": \"\",\n \"prod\": \"metric\",\n \"algorithm\": \"\",\n \"algo_params\": null,\n \"delay\": 0,\n \"severity\": 2,\n \"severities\": [\n 2\n ],\n \"disabled\": 1,\n \"prom_for_duration\": 60,\n \"prom_ql\": \"\",\n \"rule_config\": {\n \"algo_params\": null,\n \"inhibit\": false,\n \"prom_ql\": \"\",\n \"queries\": [\n {\n \"prom_ql\": \"(redis_connected_clients / redis_config_maxclients) \\u003e 0.85\",\n \"severity\": 2\n }\n ],\n \"severity\": 0\n },\n \"prom_eval_interval\": 15,\n \"enable_stime\": \"00:00\",\n \"enable_stimes\": [\n \"00:00\"\n ],\n \"enable_etime\": \"23:59\",\n \"enable_etimes\": [\n \"23:59\"\n ],\n \"enable_days_of_week\": [\n \"1\",\n \"2\",\n \"3\",\n \"4\",\n \"5\",\n \"6\",\n \"0\"\n ],\n \"enable_days_of_weeks\": [\n [\n \"1\",\n \"2\",\n \"3\",\n \"4\",\n \"5\",\n \"6\",\n \"0\"\n ]\n ],\n \"enable_in_bg\": 0,\n \"notify_recovered\": 1,\n \"notify_channels\": [],\n \"notify_groups_obj\": null,\n \"notify_groups\": null,\n \"notify_repeat_step\": 60,\n \"notify_max_number\": 0,\n \"recover_duration\": 0,\n \"callbacks\": [],\n \"runbook_url\": \"\",\n \"append_tags\": [\n \"alertname=RedisHighClientsUsage\"\n ],\n \"annotations\": null,\n \"extra_config\": null,\n \"create_at\": 0,\n \"create_by\": \"\",\n \"update_at\": 0,\n \"update_by\": \"\",\n \"uuid\": 1717556328342758000\n },\n {\n \"id\": 0,\n \"group_id\": 0,\n \"cate\": \"prometheus\",\n \"datasource_ids\": [\n 0\n ],\n \"cluster\": \"\",\n \"name\": \"High Redis eviction rate - exporter\",\n \"note\": \"\",\n \"prod\": \"metric\",\n \"algorithm\": \"\",\n \"algo_params\": null,\n \"delay\": 0,\n \"severity\": 2,\n \"severities\": [\n 2\n ],\n \"disabled\": 1,\n \"prom_for_duration\": 60,\n \"prom_ql\": \"\",\n \"rule_config\": {\n \"algo_params\": null,\n \"inhibit\": false,\n \"prom_ql\": \"\",\n \"queries\": [\n {\n \"prom_ql\": \"(sum(rate(redis_evicted_keys_total[5m])) / sum(redis_db_keys)) \\u003e 0.1\",\n \"severity\": 2\n }\n ],\n \"severity\": 0\n },\n \"prom_eval_interval\": 15,\n \"enable_stime\": \"00:00\",\n \"enable_stimes\": [\n \"00:00\"\n ],\n \"enable_etime\": \"23:59\",\n \"enable_etimes\": [\n \"23:59\"\n ],\n \"enable_days_of_week\": [\n \"1\",\n \"2\",\n \"3\",\n \"4\",\n \"5\",\n \"6\",\n \"0\"\n ],\n \"enable_days_of_weeks\": [\n [\n \"1\",\n \"2\",\n \"3\",\n \"4\",\n \"5\",\n \"6\",\n \"0\"\n ]\n ],\n \"enable_in_bg\": 0,\n \"notify_recovered\": 1,\n \"notify_channels\": [],\n \"notify_groups_obj\": null,\n \"notify_groups\": null,\n \"notify_repeat_step\": 60,\n \"notify_max_number\": 0,\n \"recover_duration\": 0,\n \"callbacks\": [],\n \"runbook_url\": \"\",\n \"append_tags\": [\n \"alertname=RedisHighKeysEvictionRatio\"\n ],\n \"annotations\": null,\n \"extra_config\": null,\n \"create_at\": 0,\n \"create_by\": \"\",\n \"update_at\": 0,\n \"update_by\": \"\",\n \"uuid\": 1717556328349758000\n },\n {\n \"id\": 0,\n \"group_id\": 0,\n \"cate\": \"prometheus\",\n \"datasource_ids\": [\n 0\n ],\n \"cluster\": \"\",\n \"name\": \"High Redis latency - exporter\",\n \"note\": \"\",\n \"prod\": \"metric\",\n \"algorithm\": \"\",\n \"algo_params\": null,\n \"delay\": 0,\n \"severity\": 2,\n \"severities\": [\n 2\n ],\n \"disabled\": 1,\n \"prom_for_duration\": 60,\n \"prom_ql\": \"\",\n \"rule_config\": {\n \"algo_params\": null,\n \"inhibit\": false,\n \"prom_ql\": \"\",\n \"queries\": [\n {\n \"prom_ql\": \"sum(rate(redis_commands_duration_seconds_total[5m])) / sum(rate(redis_commands_processed_total[5m])) \\u003e 0.25\",\n \"severity\": 2\n }\n ],\n \"severity\": 0\n },\n \"prom_eval_interval\": 15,\n \"enable_stime\": \"00:00\",\n \"enable_stimes\": [\n \"00:00\"\n ],\n \"enable_etime\": \"23:59\",\n \"enable_etimes\": [\n \"23:59\"\n ],\n \"enable_days_of_week\": [\n \"1\",\n \"2\",\n \"3\",\n \"4\",\n \"5\",\n \"6\",\n \"0\"\n ],\n \"enable_days_of_weeks\": [\n [\n \"1\",\n \"2\",\n \"3\",\n \"4\",\n \"5\",\n \"6\",\n \"0\"\n ]\n ],\n \"enable_in_bg\": 0,\n \"notify_recovered\": 1,\n \"notify_channels\": [],\n \"notify_groups_obj\": null,\n \"notify_groups\": null,\n \"notify_repeat_step\": 60,\n \"notify_max_number\": 0,\n \"recover_duration\": 0,\n \"callbacks\": [],\n \"runbook_url\": \"\",\n \"append_tags\": [\n \"alertname=RedisHighResponseTime\"\n ],\n \"annotations\": null,\n \"extra_config\": null,\n \"create_at\": 0,\n \"create_by\": \"\",\n \"update_at\": 0,\n \"update_by\": \"\",\n \"uuid\": 1717556328350541000\n },\n {\n \"id\": 0,\n \"group_id\": 0,\n \"cate\": \"prometheus\",\n \"datasource_ids\": [\n 0\n ],\n \"cluster\": \"\",\n \"name\": \"High Redis memory usage rate - exporter\",\n \"note\": \"\",\n \"prod\": \"metric\",\n \"algorithm\": \"\",\n \"algo_params\": null,\n \"delay\": 0,\n \"severity\": 2,\n \"severities\": [\n 2\n ],\n \"disabled\": 1,\n \"prom_for_duration\": 60,\n \"prom_ql\": \"\",\n \"rule_config\": {\n \"algo_params\": null,\n \"inhibit\": false,\n \"prom_ql\": \"\",\n \"queries\": [\n {\n \"prom_ql\": \"redis_memory_max_bytes \\u003e 0 and (redis_memory_used_bytes / redis_memory_max_bytes) \\u003e 0.85\",\n \"severity\": 2\n }\n ],\n \"severity\": 0\n },\n \"prom_eval_interval\": 15,\n \"enable_stime\": \"00:00\",\n \"enable_stimes\": [\n \"00:00\"\n ],\n \"enable_etime\": \"23:59\",\n \"enable_etimes\": [\n \"23:59\"\n ],\n \"enable_days_of_week\": [\n \"1\",\n \"2\",\n \"3\",\n \"4\",\n \"5\",\n \"6\",\n \"0\"\n ],\n \"enable_days_of_weeks\": [\n [\n \"1\",\n \"2\",\n \"3\",\n \"4\",\n \"5\",\n \"6\",\n \"0\"\n ]\n ],\n \"enable_in_bg\": 0,\n \"notify_recovered\": 1,\n \"notify_channels\": [],\n \"notify_groups_obj\": null,\n \"notify_groups\": null,\n \"notify_repeat_step\": 60,\n \"notify_max_number\": 0,\n \"recover_duration\": 0,\n \"callbacks\": [],\n \"runbook_url\": \"\",\n \"append_tags\": [\n \"alertname=RedisHighMemoryUsage\"\n ],\n \"annotations\": null,\n \"extra_config\": null,\n \"create_at\": 0,\n \"create_by\": \"\",\n \"update_at\": 0,\n \"update_by\": \"\",\n \"uuid\": 1717556328352303000\n },\n {\n \"id\": 0,\n \"group_id\": 0,\n \"cate\": \"prometheus\",\n \"datasource_ids\": [\n 0\n ],\n \"cluster\": \"\",\n \"name\": \"Low Redis hit rate - exporter\",\n \"note\": \"\",\n \"prod\": \"metric\",\n \"algorithm\": \"\",\n \"algo_params\": null,\n \"delay\": 0,\n \"severity\": 2,\n \"severities\": [\n 2\n ],\n \"disabled\": 1,\n \"prom_for_duration\": 60,\n \"prom_ql\": \"\",\n \"rule_config\": {\n \"algo_params\": null,\n \"inhibit\": false,\n \"prom_ql\": \"\",\n \"queries\": [\n {\n \"prom_ql\": \"rate(redis_keyspace_hits_total[5m])\\n/\\n(rate(redis_keyspace_misses_total[5m]) + rate(redis_keyspace_hits_total[5m]))\\n\\u003c 0.9\",\n \"severity\": 2\n }\n ],\n \"severity\": 0\n },\n \"prom_eval_interval\": 15,\n \"enable_stime\": \"00:00\",\n \"enable_stimes\": [\n \"00:00\"\n ],\n \"enable_etime\": \"23:59\",\n \"enable_etimes\": [\n \"23:59\"\n ],\n \"enable_days_of_week\": [\n \"1\",\n \"2\",\n \"3\",\n \"4\",\n \"5\",\n \"6\",\n \"0\"\n ],\n \"enable_days_of_weeks\": [\n [\n \"1\",\n \"2\",\n \"3\",\n \"4\",\n \"5\",\n \"6\",\n \"0\"\n ]\n ],\n \"enable_in_bg\": 0,\n \"notify_recovered\": 1,\n \"notify_channels\": [],\n \"notify_groups_obj\": null,\n \"notify_groups\": null,\n \"notify_repeat_step\": 60,\n \"notify_max_number\": 0,\n \"recover_duration\": 0,\n \"callbacks\": [],\n \"runbook_url\": \"\",\n \"append_tags\": [\n \"alertname=RedisLowHitRatio\"\n ],\n \"annotations\": null,\n \"extra_config\": null,\n \"create_at\": 0,\n \"create_by\": \"\",\n \"update_at\": 0,\n \"update_by\": \"\",\n \"uuid\": 1717556328353276000\n },\n {\n \"id\": 0,\n \"group_id\": 0,\n \"cate\": \"prometheus\",\n \"datasource_ids\": [\n 0\n ],\n \"cluster\": \"\",\n \"name\": \"Redis connection refused - exporter\",\n \"note\": \"\",\n \"prod\": \"metric\",\n \"algorithm\": \"\",\n \"algo_params\": null,\n \"delay\": 0,\n \"severity\": 2,\n \"severities\": [\n 2\n ],\n \"disabled\": 1,\n \"prom_for_duration\": 0,\n \"prom_ql\": \"\",\n \"rule_config\": {\n \"algo_params\": null,\n \"inhibit\": false,\n \"prom_ql\": \"\",\n \"queries\": [\n {\n \"prom_ql\": \"(rate(redis_rejected_connections_total[5m])) \\u003e 0\",\n \"severity\": 2\n }\n ],\n \"severity\": 0\n },\n \"prom_eval_interval\": 15,\n \"enable_stime\": \"00:00\",\n \"enable_stimes\": [\n \"00:00\"\n ],\n \"enable_etime\": \"23:59\",\n \"enable_etimes\": [\n \"23:59\"\n ],\n \"enable_days_of_week\": [\n \"1\",\n \"2\",\n \"3\",\n \"4\",\n \"5\",\n \"6\",\n \"0\"\n ],\n \"enable_days_of_weeks\": [\n [\n \"1\",\n \"2\",\n \"3\",\n \"4\",\n \"5\",\n \"6\",\n \"0\"\n ]\n ],\n \"enable_in_bg\": 0,\n \"notify_recovered\": 1,\n \"notify_channels\": [],\n \"notify_groups_obj\": null,\n \"notify_groups\": null,\n \"notify_repeat_step\": 60,\n \"notify_max_number\": 0,\n \"recover_duration\": 0,\n \"callbacks\": [],\n \"runbook_url\": \"\",\n \"append_tags\": [\n \"alertname=RedisRejectedConnHigh\"\n ],\n \"annotations\": null,\n \"extra_config\": null,\n \"create_at\": 0,\n \"create_by\": \"\",\n \"update_at\": 0,\n \"update_by\": \"\",\n \"uuid\": 1717556328353766000\n },\n {\n \"id\": 0,\n \"group_id\": 0,\n \"cate\": \"prometheus\",\n \"datasource_ids\": [\n 0\n ],\n \"cluster\": \"\",\n \"name\": \"Redis has just been restarted, please be aware - exporter\",\n \"note\": \"\",\n \"prod\": \"metric\",\n \"algorithm\": \"\",\n \"algo_params\": null,\n \"delay\": 0,\n \"severity\": 3,\n \"severities\": [\n 3\n ],\n \"disabled\": 1,\n \"prom_for_duration\": 0,\n \"prom_ql\": \"\",\n \"rule_config\": {\n \"algo_params\": null,\n \"inhibit\": false,\n \"prom_ql\": \"\",\n \"queries\": [\n {\n \"prom_ql\": \"redis_uptime_in_seconds \\u003c 600\",\n \"severity\": 3\n }\n ],\n \"severity\": 0\n },\n \"prom_eval_interval\": 15,\n \"enable_stime\": \"00:00\",\n \"enable_stimes\": [\n \"00:00\"\n ],\n \"enable_etime\": \"23:59\",\n \"enable_etimes\": [\n \"23:59\"\n ],\n \"enable_days_of_week\": [\n \"1\",\n \"2\",\n \"3\",\n \"4\",\n \"5\",\n \"6\",\n \"0\"\n ],\n \"enable_days_of_weeks\": [\n [\n \"1\",\n \"2\",\n \"3\",\n \"4\",\n \"5\",\n \"6\",\n \"0\"\n ]\n ],\n \"enable_in_bg\": 0,\n \"notify_recovered\": 1,\n \"notify_channels\": [],\n \"notify_groups_obj\": null,\n \"notify_groups\": null,\n \"notify_repeat_step\": 60,\n \"notify_max_number\": 0,\n \"recover_duration\": 0,\n \"callbacks\": [],\n \"runbook_url\": \"\",\n \"append_tags\": [\n \"alertname=RedisLowUptime\"\n ],\n \"annotations\": null,\n \"extra_config\": null,\n \"create_at\": 0,\n \"create_by\": \"\",\n \"update_at\": 0,\n \"update_by\": \"\",\n \"uuid\": 1717556328354294000\n }\n]"
},
{
"path": "integrations/Redis/collect/redis/redis.toml",
"content": "# # collect interval\n# interval = 15\n\n[[instances]]\n# address = \"127.0.0.1:6379\"\n# username = \"\"\n# password = \"\"\n# pool_size = 2\n\n# # Optional. Specify redis commands to retrieve values\n# commands = [\n# {command = [\"get\", \"sample-key1\"], metric = \"custom_metric_name1\"},\n# {command = [\"get\", \"sample-key2\"], metric = \"custom_metric_name2\"}\n# ]\n\n# # interval = global.interval * interval_times\n# interval_times = 1\n\n# important! use global unique string to specify instance\n# labels = { instance=\"n9e-10.2.3.4:6379\" }\n\n## Optional TLS Config\n# use_tls = false\n# tls_min_version = \"1.2\"\n# tls_ca = \"/etc/categraf/ca.pem\"\n# tls_cert = \"/etc/categraf/cert.pem\"\n# tls_key = \"/etc/categraf/key.pem\"\n## Use TLS but skip chain & host verification\n# insecure_skip_verify = true\n"
},
{
"path": "integrations/Redis/collect/redis_sentinel/redis_sentinel.toml",
"content": "# # collect interval\n# interval = 15\n\n[[instances]]\n# [protocol://][:password]@address[:port]\n# e.g. servers = [\"tcp://localhost:26379\"]\nservers = []\n\n# # interval = global.interval * interval_times\n# interval_times = 1\n# add some dimension data by labels\n# labels = {}\n\n## Optional TLS Config\n# use_tls = false\n# tls_min_version = \"1.2\"\n# tls_ca = \"/etc/categraf/ca.pem\"\n# tls_cert = \"/etc/categraf/cert.pem\"\n# tls_key = \"/etc/categraf/key.pem\"\n## Use TLS but skip chain & host verification\n# insecure_skip_verify = true\n"
},
{
"path": "integrations/Redis/dashboards/FilterByAddress.json",
"content": "{\n \"name\": \"Redis by address\",\n \"tags\": \"Redis Categraf\",\n \"configs\": {\n \"panels\": [\n {\n \"collapsed\": true,\n \"id\": \"2ecb82c6-4d1a-41b5-8cdc-0284db16bd54\",\n \"layout\": {\n \"h\": 1,\n \"i\": \"2ecb82c6-4d1a-41b5-8cdc-0284db16bd54\",\n \"isResizable\": false,\n \"w\": 24,\n \"x\": 0,\n \"y\": 0\n },\n \"name\": \"Basic Info\",\n \"type\": \"row\"\n },\n {\n \"custom\": {\n \"alignItems\": \"center\",\n \"bgColor\": \"rgba(0, 0, 0, 0)\",\n \"content\": \" --format=brief \n```\n\nThis plugin supports _smartmontools_ version 5.41 and above, but v. 5.41 and\nv. 5.42 might require setting `nocheck`, see the comment in the sample\nconfiguration. Also, NVMe capabilities were introduced in version 6.5.\n\nTo enable SMART on a storage device run:\n\n```sh\nsmartctl -s on \n```\n\n## NVMe vendor specific attributes\n\nFor NVMe disk type, plugin can use command line utility `nvme-cli`. It has a\nfeature to easy access a vendor specific attributes. This plugin supports\nnmve-cli version 1.5 and above (). In\ncase of `nvme-cli` absence NVMe vendor specific metrics will not be obtained.\n\nVendor specific SMART metrics for NVMe disks may be reported from the following\n`nvme` command:\n\n```sh\nnvme smart-log-add \n```\n\nNote that vendor plugins for `nvme-cli` could require different naming\nconvention and report format.\n\nTo see installed plugin extensions, depended on the nvme-cli version, look at\nthe bottom of:\n\n```sh\nnvme help\n```\n\nTo gather disk vendor id (vid) `id-ctrl` could be used:\n\n```sh\nnvme id-ctrl \n```\n\nAssociation between a vid and company can be found there:\n.\n\nDevices affiliation to being NVMe or non NVMe will be determined thanks to:\n\n```sh\nsmartctl --scan\n```\n\nand:\n\n```sh\nsmartctl --scan -d nvme\n```\n\n\n## Configuration\n\n```toml @示例\n# Read metrics from storage devices supporting S.M.A.R.T.\n[[instances]]\n## Optionally specify the path to the smartctl executable\n# path_smartctl = \"/usr/bin/smartctl\"\n\n## Optionally specify the path to the nvme-cli executable\n# path_nvme = \"/usr/bin/nvme\"\n\n## Optionally specify if vendor specific attributes should be propagated for NVMe disk case\n## [\"auto-on\"] - automatically find and enable additional vendor specific disk info\n## [\"vendor1\", \"vendor2\", ...] - e.g. \"Intel\" enable additional Intel specific disk info\n# enable_extensions = [\"auto-on\"]\n\n## On most platforms used cli utilities requires root access.\n## Setting 'use_sudo' to true will make use of sudo to run smartctl or nvme-cli.\n## Sudo must be configured to allow the categraf user to run smartctl or nvme-cli\n## Sudo must be configured to allow the categraf user to run smartctl or nvme-cli\n## without a password.\nuse_sudo = true\n\n## Skip checking disks in this power mode. Defaults to\n## \"standby\" to not wake up disks that have stopped rotating.\n## See --nocheck in the man pages for smartctl.\n## smartctl version 5.41 and 5.42 have faulty detection of\n## power mode and might require changing this value to\n## \"never\" depending on your disks.\n# nocheck = \"standby\"\n\n## Gather all returned S.M.A.R.T. attribute metrics and the detailed\n## information from each drive into the 'smart_attribute' measurement.\nattributes = true\n\n## Optionally specify devices to exclude from reporting if disks auto-discovery is performed.\n# excludes = [ \"/dev/pass6\" ]\n\n## Optionally specify devices and device type, if unset\n## a scan (smartctl --scan and smartctl --scan -d nvme) for S.M.A.R.T. devices will be done\n## and all found will be included except for the excluded in excludes.\n# devices = [ \"/dev/ada0 -d atacam\", \"/dev/nvme0\"]\n# devices = [\"dev/nvme0 -d nvme\", \"/dev/nvme0\"]\n\n## Timeout for the cli command to complete.\ntimeout = \"30s\"\n\n## Optionally call smartctl and nvme-cli with a specific concurrency policy.\n## By default, smartctl and nvme-cli are called in separate threads (goroutines) to gather disk attributes.\n## Some devices (e.g. disks in RAID arrays) may have access limitations that require sequential reading of\n## SMART data - one individual array drive at the time. In such case please set this configuration option\n## to \"sequential\" to get readings for all drives.\n## valid options: concurrent, sequential\n# read_method = \"concurrent\"\n```\n\n## Permissions\n采集需要sudo权限\n\n## Metrics\n\n- smart_device:\n - tags:\n - capacity\n - device\n - enabled\n - model\n - serial_no\n - wwn\n - fields:\n - exit_status\n - health_ok\n - media_wearout_indicator\n - percent_lifetime_remain\n - read_error_rate\n - seek_error\n - temp_c\n - udma_crc_errors\n - wear_leveling_count\n\n- smart_attribute:\n - tags:\n - capacity\n - device\n - enabled\n - fail\n - flags\n - id\n - model\n - name\n - serial_no\n - wwn\n - fields:\n - exit_status\n - threshold\n - value\n - worst\n - critical_warning\n - temperature_celsius\n - available_spare\n - available_spare_threshold\n - percentage_used\n - data_units_read\n - data_units_written\n - host_read_commands\n - host_write_commands\n - controller_busy_time\n - power_cycle_count\n - power_on_hours\n - unsafe_shutdowns\n - media_and_data_integrity_errors\n - error_information_log_entries\n - warning_temperature_time\n - critical_temperature_time\n - program_fail_count\n - erase_fail_count\n - wear_leveling_count\n - end_to_end_error_detection_count\n - crc_error_count\n - media_wear_percentage\n - host_reads\n - timed_workload_timer\n - thermal_throttle_status\n - retry_buffer_overflow_count\n - pll_lock_loss_count\n\n### Flags\n\nThe interpretation of the tag `flags` is:\n\n- `K` auto-keep\n- `C` event count\n- `R` error rate\n- `S` speed/performance\n- `O` updated online\n- `P` prefailure warning\n\n### Exit Status\n\nThe `exit_status` field captures the exit status of the used cli utilities\ncommand which is defined by a bitmask. For the interpretation of the bitmask see\nthe man page for smartctl or nvme-cli.\n\n## Device Names\n\nDevice names, e.g., `/dev/sda`, are _not persistent_, and may be\nsubject to change across reboots or system changes. Instead, you can use the\n_World Wide Name_ (WWN) or serial number to identify devices. On Linux block\ndevices can be referenced by the WWN in the following location:\n`/dev/disk/by-id/`.\n\n## Troubleshooting\n\nIf you expect to see more SMART metrics than this plugin shows, be sure to use a\nproper version of smartctl or nvme-cli utility which has the functionality to\ngather desired data. Also, check your device capability because not every SMART\nmetrics are mandatory. For example the number of temperature sensors depends on\nthe device specification.\n\nIf this plugin is not working as expected for your SMART enabled device,\nplease run these commands and include the output in a bug report:\n\nFor non NVMe devices (from smartctl version >= 7.0 this will also return NVMe\ndevices by default):\n\n```sh\nsmartctl --scan\n```\n\nFor NVMe devices:\n\n```sh\nsmartctl --scan -d nvme\n```\n\nRun the following command replacing your configuration setting for NOCHECK and\nthe DEVICE (name of the device could be taken from the previous command):\n\n```sh\nsmartctl --info --health --attributes --tolerance=verypermissive --nocheck NOCHECK --format=brief -d DEVICE\n```\n\nIf you try to gather vendor specific metrics, please provide this command\nand replace vendor and device to match your case:\n\n```sh\nnvme VENDOR smart-log-add DEVICE\n```\n\nIf you have specified devices array in configuration file, and categraf only\nshows data from one device, you should change the plugin configuration to\nsequentially gather disk attributes instead of collecting it in separate threads\n(goroutines). To do this find in plugin configuration read_method and change it\nto sequential:\n\n```toml\n ## Optionally call smartctl and nvme-cli with a specific concurrency policy.\n ## By default, smartctl and nvme-cli are called in separate threads (goroutines) to gather disk attributes.\n ## Some devices (e.g. disks in RAID arrays) may have access limitations that require sequential reading of\n ## SMART data - one individual array drive at the time. In such case please set this configuration option\n ## to \"sequential\" to get readings for all drives.\n ## valid options: concurrent, sequential\n read_method = \"sequential\"\n```\n\n## Example Output\n\n```text\nsmart_device_health_ok agent_hostname=1.2.3.4 device=nvme0 model=INTEL_SSDPE2KX040T8 serial_no=PHLJ830200CH4P0DGN 1\nsmart_device_temp_c agent_hostname=1.2.3.4 device=nvme0 model=INTEL_SSDPE2KX040T8 serial_no=PHLJ830200CH4P0DGN 53\nsmart_attribute_program_fail_count agent_hostname=1.2.3.4 device=nvme0 model= name=Program_Fail_Count serial_no=PHLJ830200CH4P0DGN 0\nsmart_attribute_erase_fail_count agent_hostname=1.2.3.4 device=nvme0 model= name=Erase_Fail_Count serial_no=PHLJ830200CH4P0DGN 0\nsmart_attribute_wear_leveling_count agent_hostname=1.2.3.4 device=nvme0 model= name=Wear_Leveling_Count serial_no=PHLJ830200CH4P0DGN 34360328200\n```\n"
},
{
"path": "integrations/SNMP/collect/snmp/Cisco.toml",
"content": "[[instances]]\n\nagents = [\"udp://127.0.0.1\"]\n\ntimeout = \"5s\"\n\nversion = 2\n\n## Path to mib files\n## Used by the gosmi translator.\n## To add paths when translating with netsnmp, use the MIBDIRS environment variable\n##path = [\"/usr/share/snmp/DCN\"]\n##translator = \"gosmi\"\n\ncommunity = \"public\"\n\nagent_host_tag = \"DCN\"\n\nretries = 3\n\nmax_repetitions = 100\n\n##运行时间\n[[instances.field]]\noid = \"1.3.6.1.2.1.1.3.0\"\nname = \"sys_uptime\"\nconversion = \"float(2)\"\n\n[[instances.field]]\noid = \"1.3.6.1.4.1.6339.100.1.11.10.0\"\nname = \"cpu_usage\"\n\n[[instances.field]]\noid = \"1.3.6.1.4.1.6339.100.1.11.6.0\"\nname = \"mem_max\"\n\n[[instances.field]]\noid = \"1.3.6.1.4.1.6339.100.1.11.7.0\"\nname = \"mem_use\"\n\n#端口总和\n[[instances.field]]\nname = \"TotalPorts\"\noid = \"1.3.6.1.4.1.6339.100.3.1.0\"\n\n##设备名称\n[[instances.field]]\noid = \"1.3.6.1.2.1.1.5.0\"\nname = \"sys_name\"\nis_tag = true\n\n##产品型号\n[[instances.field]]\nname = \"sys_pm\"\noid = \"1.3.6.1.4.1.6339.100.25.1.1.1.0\"\nis_tag = true\n\n#本机IP\n[[instances.field]]\nname = \"LocalIP\"\noid = \"1.3.6.1.2.1.4.20.1.1\"\nis_tag = true\n\n#接口表信息\n[[instances.table]]\nname = \"interface\"\ninherit_tags = [\"sys_name\",\"sys_pm\",\"LocalIP\"]\n\n#各个端口\n[[instances.table.field]]\nname = \"ifDescr\"\noid = \"1.3.6.1.2.1.2.2.1.2\"\nis_tag = true\n\n[[instances.table.field]]\nname = \"ifSpeed\"\noid = \"1.3.6.1.2.1.2.2.1.5\"\nconversion = \"float(6)\"\n#is_tag = true\n\n[[instances.table.field]]\nname = \"ifOperStatus\"\noid = \"1.3.6.1.2.1.2.2.1.8\"\n#is_tag = true\n\n[[instances.table.field]]\nname = \"ifOutOctets\"\noid = \"1.3.6.1.2.1.2.2.1.16\"\n\n[[instances.table.field]]\nname = \"ifInOctets\"\noid = \"1.3.6.1.2.1.2.2.1.10\"\n\n\n#聚合状态\n#oid = \"1.3.6.1.4.1.6339.100.14.2.1.4.1.1.*\"\n\n#聚合端口\n#oid = \"1.3.6.1.4.1.6339.100.14.3.1.2\"\n\n\n\n\n\n\n\n"
},
{
"path": "integrations/SNMP/collect/snmp/snmp.toml",
"content": "# Retrieves SNMP values from remote agents\n[[instances]]\n## Agent addresses to retrieve values from.\n## format: agents = [\":\"]\n## scheme: optional, either udp, udp4, udp6, tcp, tcp4, tcp6.\n## default is udp\n## port: optional\n## example: agents = [\"udp://127.0.0.1:161\"]\n## agents = [\"tcp://127.0.0.1:161\"]\n## agents = [\"udp4://v4only-snmp-agent\"]\n#agents = [\"udp://127.0.0.1:161\"]\nagents = [\n #\n]\n\n## Timeout for each request.\n# timeout = \"5s\"\n\n## SNMP version; can be 1, 2, or 3.\n# version = 2\n\n## Unconnected UDP socket\n## When true, SNMP responses are accepted from any address not just\n## the requested address. This can be useful when gathering from\n## redundant/failover systems.\n# unconnected_udp_socket = false\n\n## Path to mib files\n## Used by the gosmi translator.\n## To add paths when translating with netsnmp, use the MIBDIRS environment variable\n# path = [\"/usr/share/snmp/mibs\"]\n\n## SNMP community string.\n# community = \"public\"\n\n## Agent host tag\n# agent_host_tag = \"agent_host\"\n\n## Number of retries to attempt.\n# retries = 3\n\n## The GETBULK max-repetitions parameter.\n# max_repetitions = 10\n\n## SNMPv3 authentication and encryption options.\n##\n## Security Name.\n# sec_name = \"myuser\"\n## Authentication protocol; one of \"MD5\", \"SHA\", \"SHA224\", \"SHA256\", \"SHA384\", \"SHA512\" or \"\".\n# auth_protocol = \"MD5\"\n## Authentication password.\n# auth_password = \"pass\"\n## Security Level; one of \"noAuthNoPriv\", \"authNoPriv\", or \"authPriv\".\n# sec_level = \"authNoPriv\"\n## Context Name.\n# context_name = \"\"\n## Privacy protocol used for encrypted messages; one of \"DES\", \"AES\", \"AES192\", \"AES192C\", \"AES256\", \"AES256C\", or \"\".\n### Protocols \"AES192\", \"AES192\", \"AES256\", and \"AES256C\" require the underlying net-snmp tools\n### to be compiled with --enable-blumenthal-aes (http://www.net-snmp.org/docs/INSTALL.html)\n# priv_protocol = \"\"\n## Privacy password used for encrypted messages.\n# priv_password = \"\"\n\n## Add fields and tables defining the variables you wish to collect. This\n## example collects the system uptime and interface variables. Reference the\n## full plugin documentation for configuration details.\n\n#[[instances.field]]\n#oid = \"RFC1213-MIB::sysUpTime.0\"\n#name = \"uptime\"\n\n#[[instances.field]]\n#oid = \"RFC1213-MIB::sysName.0\"\n#name = \"source\"\n#is_tag = true\n# filters = [\"A:ifIndex:^2$\",\"B:ifOperStatus:1\", \"C:ifDescr:^eno*\"]\n# filters_expression = \"(A && B) || C\"\n\n#[[instances.table]]\n#oid = \"IF-MIB::ifTable\"\n#name = \"interface\"\n#inherit_tags = [\"source\"]\n\n#[[instances.table.field]]\n#oid = \"IF-MIB::ifDescr\"\n#name = \"ifDescr\"\n#is_tag = true\n"
},
{
"path": "integrations/SNMP/collect/snmp/snmp.toml.example",
"content": "# Retrieves SNMP values from remote agents\n[[instances]]\n## Agent addresses to retrieve values from.\n## format: agents = [\":\"]\n## scheme: optional, either udp, udp4, udp6, tcp, tcp4, tcp6.\n## default is udp\n## port: optional\n## example: agents = [\"udp://127.0.0.1:161\"]\n## agents = [\"tcp://127.0.0.1:161\"]\n## agents = [\"udp4://v4only-snmp-agent\"]\n#agents = [\"udp://127.0.0.1:161\"]\n# metrics_pass = [\"*2$\"]\nagents = [\n# \"udp://10.206.0.16:161\",\n]\n\n## Timeout for each request.\n timeout = \"5s\"\n\n## SNMP version; can be 1, 2, or 3.\n version = 2\n\n## Unconnected UDP socket\n## When true, SNMP responses are accepted from any address not just\n## the requested address. This can be useful when gathering from\n## redundant/failover systems.\n# unconnected_udp_socket = false\n\n## Path to mib files\n## Used by the gosmi translator.\n## To add paths when translating with netsnmp, use the MIBDIRS environment variable\n# path = [\"/usr/share/snmp/mibs\"]\n\n## SNMP community string.\n community = \"public\"\n\n## Agent host tag\n agent_host_tag = \"agent_hostname\"\n\n## Number of retries to attempt.\n retries = 3\n\n## The GETBULK max-repetitions parameter.\n# max_repetitions = 10\n\n## SNMPv3 authentication and encryption options.\n##\n## Security Name.\n# sec_name = \"myuser\"\n## Authentication protocol; one of \"MD5\", \"SHA\", \"SHA224\", \"SHA256\", \"SHA384\", \"SHA512\" or \"\".\n# auth_protocol = \"MD5\"\n## Authentication password.\n# auth_password = \"pass\"\n## Security Level; one of \"noAuthNoPriv\", \"authNoPriv\", or \"authPriv\".\n# sec_level = \"authNoPriv\"\n## Context Name.\n# context_name = \"\"\n## Privacy protocol used for encrypted messages; one of \"DES\", \"AES\", \"AES192\", \"AES192C\", \"AES256\", \"AES256C\", or \"\".\n### Protocols \"AES192\", \"AES192\", \"AES256\", and \"AES256C\" require the underlying net-snmp tools\n### to be compiled with --enable-blumenthal-aes (http://www.net-snmp.org/docs/INSTALL.html)\n# priv_protocol = \"\"\n## Privacy password used for encrypted messages.\n# priv_password = \"\"\n\n## Add fields and tables defining the variables you wish to collect. This\n## example collects the system uptime and interface variables. Reference the\n## full plugin documentation for configuration details.\n\n [[instances.field]]\n #oid = \"RFC1213-MIB::sysUpTime.0\"\n oid = \".1.3.6.1.2.1.1.3.0\"\n name = \"uptime\"\n\n [[instances.field]]\n oid = \".1.3.6.1.4.1.2021.11.9.0\" # %\n #oid = \"UCD-SNMP-MIB::ssCpuUser.0\"\n name = \"cpu_user\"\n\n [[instances.field]]\n oid = \".1.3.6.1.4.1.2021.11.10.0\" # %\n name = \"cpu_sys\"\n \n [[instances.field]]\n oid = \"1.3.6.1.4.1.2021.11.11.0\" # %\n name = \"cpu_idle\"\n\n [[instances.field]]\n oid = \".1.3.6.1.2.1.25.2.2.0\" \n name = \"mem_total\"\n\n [[instances.field]]\n oid = \".1.3.6.1.4.1.2021.4.11.0\"\n name = \"mem_free\"\n\n [[instances.field]]\n oid = \".1.3.6.1.4.1.2021.4.13.0\"\n name = \"mem_shared\"\n\n [[instances.field]]\n oid = \".1.3.6.1.4.1.2021.4.14.0\"\n name = \"mem_buffer\"\n\n [[instances.field]]\n oid = \".1.3.6.1.4.1.2021.4.15.0\"\n name = \"mem_cached\"\n\n [[instances.field]]\n oid = \".1.3.6.1.4.1.2021.10.1.3.1\"\n name = \"cpu_load1\"\n\n [[instances.field]]\n oid = \".1.3.6.1.4.1.2021.10.1.3.2\"\n name = \"cpu_load5\"\n\n [[instances.field]]\n oid = \".1.3.6.1.4.1.2021.10.1.3.3\"\n name = \"cpu_load15\"\n\n # network\n [[instances.table]]\n oid = \"IF-MIB::ifTable\"\n name = \"interface\"\n inherit_tags = [\"source\"]\n index_as_tag = true\n include_filter = [\"ifIndex:2\",\"ifIndex:4\"]\n\n [[instances.table.field]]\n oid = \"IF-MIB::ifDescr\"\n name = \"ifDescr\"\n is_tag = true\n [[instances.table.field]]\n oid = \"IF-MIB::ifPhysAddress\"\n name = \"ifPhysAddress\"\n is_tag = true\n"
},
{
"path": "integrations/SNMP/dashboards/dashboards.json",
"content": "{\n \"id\": 0,\n \"group_id\": 0,\n \"name\": \"SNMP Stats\",\n \"ident\": \"\",\n \"tags\": \"\",\n \"create_at\": 0,\n \"create_by\": \"\",\n \"update_at\": 0,\n \"update_by\": \"\",\n \"configs\": {\n \"links\": [],\n \"panels\": [\n {\n \"custom\": {\n \"calc\": \"lastNotNull\",\n \"colSpan\": 1,\n \"colorMode\": \"value\",\n \"graphMode\": \"none\",\n \"textMode\": \"value\",\n \"textSize\": {},\n \"valueField\": \"Value\"\n },\n \"datasourceCate\": \"prometheus\",\n \"datasourceValue\": \"${datasource}\",\n \"description\": \"系统启动时间,timetick转换为秒,大盘自动转换为时 天 周 月……\",\n \"id\": \"d5e905cf-da22-48be-9fca-1f92695ca730\",\n \"layout\": {\n \"h\": 3,\n \"i\": \"d5e905cf-da22-48be-9fca-1f92695ca730\",\n \"isResizable\": true,\n \"w\": 8,\n \"x\": 0,\n \"y\": 0\n },\n \"links\": [],\n \"maxPerRow\": 4,\n \"name\": \"Uptime\",\n \"options\": {\n \"standardOptions\": {\n \"util\": \"seconds\"\n },\n \"thresholds\": {\n \"steps\": [\n {\n \"color\": \"#634CD9\",\n \"type\": \"base\",\n \"value\": null\n }\n ]\n }\n },\n \"targets\": [\n {\n \"expr\": \"snmp_uptime /100\",\n \"legend\": \"In\",\n \"maxDataPoints\": 240,\n \"refId\": \"A\"\n }\n ],\n \"transformations\": [\n {\n \"id\": \"organize\",\n \"options\": {}\n }\n ],\n \"type\": \"stat\",\n \"version\": \"3.0.0\"\n },\n {\n \"custom\": {\n \"calc\": \"lastNotNull\",\n \"colSpan\": 1,\n \"colorMode\": \"value\",\n \"graphMode\": \"none\",\n \"textMode\": \"value\",\n \"textSize\": {},\n \"valueField\": \"Value\"\n },\n \"datasourceCate\": \"prometheus\",\n \"datasourceValue\": \"${datasource}\",\n \"description\": \"端口每秒最大出流量 单位是bit,大盘自动转换\",\n \"id\": \"26ae7fc1-230e-451e-9415-ea93ae8b2abb\",\n \"layout\": {\n \"h\": 3,\n \"i\": \"26ae7fc1-230e-451e-9415-ea93ae8b2abb\",\n \"isResizable\": true,\n \"w\": 8,\n \"x\": 8,\n \"y\": 0\n },\n \"links\": [],\n \"maxPerRow\": 4,\n \"name\": \"Max Out (Current)\",\n \"options\": {\n \"standardOptions\": {},\n \"thresholds\": {\n \"steps\": [\n {\n \"color\": \"#634CD9\",\n \"type\": \"base\",\n \"value\": null\n }\n ]\n }\n },\n \"targets\": [\n {\n \"expr\": \"max(irate(snmp_interface_ifOutOctets[5m]))\",\n \"legend\": \"Out\",\n \"refId\": \"A\"\n }\n ],\n \"transformations\": [\n {\n \"id\": \"organize\",\n \"options\": {}\n }\n ],\n \"type\": \"stat\",\n \"version\": \"3.0.0\"\n },\n {\n \"custom\": {\n \"calc\": \"lastNotNull\",\n \"colSpan\": 1,\n \"colorMode\": \"value\",\n \"graphMode\": \"none\",\n \"textMode\": \"value\",\n \"textSize\": {},\n \"valueField\": \"Value\"\n },\n \"datasourceCate\": \"prometheus\",\n \"datasourceValue\": \"${datasource}\",\n \"description\": \"端口每秒最大入流量\",\n \"id\": \"c5496f39-e194-401c-888c-556292e39254\",\n \"layout\": {\n \"h\": 3,\n \"i\": \"c5496f39-e194-401c-888c-556292e39254\",\n \"isResizable\": true,\n \"w\": 8,\n \"x\": 16,\n \"y\": 0\n },\n \"links\": [],\n \"maxPerRow\": 4,\n \"name\": \"Max In (Current)\",\n \"options\": {\n \"standardOptions\": {},\n \"thresholds\": {\n \"steps\": [\n {\n \"color\": \"#634CD9\",\n \"type\": \"base\",\n \"value\": null\n }\n ]\n }\n },\n \"targets\": [\n {\n \"expr\": \"max(irate(snmp_interface_ifInOctets[5m]))\",\n \"legend\": \"In\",\n \"refId\": \"A\"\n }\n ],\n \"transformations\": [\n {\n \"id\": \"organize\",\n \"options\": {}\n }\n ],\n \"type\": \"stat\",\n \"version\": \"3.0.0\"\n },\n {\n \"custom\": {\n \"calc\": \"lastNotNull\",\n \"colSpan\": 1,\n \"colorMode\": \"value\",\n \"graphMode\": \"none\",\n \"textMode\": \"value\",\n \"textSize\": {},\n \"valueField\": \"Value\"\n },\n \"datasourceCate\": \"prometheus\",\n \"datasourceValue\": \"${datasource}\",\n \"description\": \"\",\n \"id\": \"d755c99d-a323-41e6-8117-6bc006bef8b7\",\n \"layout\": {\n \"h\": 3,\n \"i\": \"bd2cd5b0-50ac-42d7-b29d-ea89ceb015a7\",\n \"isResizable\": true,\n \"w\": 8,\n \"x\": 0,\n \"y\": 3\n },\n \"links\": [],\n \"maxPerRow\": 4,\n \"name\": \"CPU 使用率 %\",\n \"options\": {\n \"standardOptions\": {},\n \"thresholds\": {\n \"steps\": [\n {\n \"color\": \"#634CD9\",\n \"type\": \"base\",\n \"value\": null\n }\n ]\n }\n },\n \"targets\": [\n {\n \"expr\": \"snmp_sys_cpu_usage\",\n \"legend\": \"Out\",\n \"refId\": \"A\"\n }\n ],\n \"transformations\": [\n {\n \"id\": \"organize\",\n \"options\": {}\n }\n ],\n \"type\": \"stat\",\n \"version\": \"3.0.0\"\n },\n {\n \"custom\": {\n \"calc\": \"lastNotNull\",\n \"colSpan\": 1,\n \"colorMode\": \"value\",\n \"graphMode\": \"none\",\n \"textMode\": \"value\",\n \"textSize\": {},\n \"valueField\": \"Value\"\n },\n \"datasourceCate\": \"prometheus\",\n \"datasourceValue\": \"${datasource}\",\n \"description\": \"内存使用率 \",\n \"id\": \"c3991b49-1ad8-4f63-87b8-d41bbf729833\",\n \"layout\": {\n \"h\": 3,\n \"i\": \"109aad94-79bd-4aec-b8ac-db73cb6601a8\",\n \"isResizable\": true,\n \"w\": 8,\n \"x\": 8,\n \"y\": 3\n },\n \"links\": [],\n \"maxPerRow\": 4,\n \"name\": \"内存使用率 %\",\n \"options\": {\n \"standardOptions\": {},\n \"thresholds\": {\n \"steps\": [\n {\n \"color\": \"#634CD9\",\n \"type\": \"base\",\n \"value\": null\n }\n ]\n }\n },\n \"targets\": [\n {\n \"expr\": \"snmp_sys_mem_usage\",\n \"legend\": \"mem_usage\",\n \"refId\": \"A\"\n }\n ],\n \"transformations\": [\n {\n \"id\": \"organize\",\n \"options\": {}\n }\n ],\n \"type\": \"stat\",\n \"version\": \"3.0.0\"\n },\n {\n \"custom\": {\n \"calc\": \"lastNotNull\",\n \"colSpan\": 1,\n \"colorMode\": \"value\",\n \"graphMode\": \"none\",\n \"textMode\": \"value\",\n \"textSize\": {},\n \"valueField\": \"Value\"\n },\n \"datasourceCate\": \"prometheus\",\n \"datasourceValue\": \"${datasource}\",\n \"description\": \"当前并发连接数\",\n \"id\": \"024c8f3e-b632-4177-9a71-396d81ede19e\",\n \"layout\": {\n \"h\": 3,\n \"i\": \"55c508d9-acaa-4bd2-a473-7b6176a5a44a\",\n \"isResizable\": true,\n \"w\": 8,\n \"x\": 16,\n \"y\": 3\n },\n \"links\": [],\n \"maxPerRow\": 4,\n \"name\": \"并发连接数(当前)\",\n \"options\": {\n \"standardOptions\": {},\n \"thresholds\": {\n \"steps\": [\n {\n \"color\": \"#634CD9\",\n \"type\": \"base\",\n \"value\": null\n }\n ]\n }\n },\n \"targets\": [\n {\n \"expr\": \"snmp_sys_mem_usage\",\n \"legend\": \"mem_usage\",\n \"refId\": \"A\"\n }\n ],\n \"transformations\": [\n {\n \"id\": \"organize\",\n \"options\": {}\n }\n ],\n \"type\": \"stat\",\n \"version\": \"3.0.0\"\n },\n {\n \"custom\": {\n \"calc\": \"lastNotNull\",\n \"colSpan\": 1,\n \"colorMode\": \"value\",\n \"graphMode\": \"none\",\n \"textMode\": \"value\",\n \"textSize\": {},\n \"valueField\": \"Value\"\n },\n \"datasourceCate\": \"prometheus\",\n \"datasourceValue\": \"${datasource}\",\n \"description\": \"最近10分钟平均每秒新建连接数\",\n \"id\": \"49e0453c-328c-4499-9097-a6bb52d92ad1\",\n \"layout\": {\n \"h\": 3,\n \"i\": \"c7ddd2b8-5803-4de0-a8e7-3466020684e9\",\n \"isResizable\": true,\n \"w\": 8,\n \"x\": 0,\n \"y\": 6\n },\n \"links\": [],\n \"maxPerRow\": 4,\n \"name\": \"每秒新建连接数\",\n \"options\": {\n \"standardOptions\": {},\n \"thresholds\": {\n \"steps\": [\n {\n \"color\": \"#634CD9\",\n \"type\": \"base\",\n \"value\": null\n }\n ]\n }\n },\n \"targets\": [\n {\n \"expr\": \"snmp_sys_session_rate\",\n \"legend\": \"mem_usage\",\n \"refId\": \"A\"\n }\n ],\n \"transformations\": [\n {\n \"id\": \"organize\",\n \"options\": {}\n }\n ],\n \"type\": \"stat\",\n \"version\": \"3.0.0\"\n },\n {\n \"custom\": {\n \"calc\": \"lastNotNull\",\n \"colSpan\": 1,\n \"colorMode\": \"value\",\n \"graphMode\": \"none\",\n \"textMode\": \"value\",\n \"textSize\": {},\n \"valueField\": \"Value\"\n },\n \"datasourceCate\": \"prometheus\",\n \"datasourceValue\": \"${datasource}\",\n \"description\": \"最近1分钟总计出流量\",\n \"id\": \"ad0d02bb-9eb0-47d8-8529-1ce66150e4f9\",\n \"layout\": {\n \"h\": 3,\n \"i\": \"ad0d02bb-9eb0-47d8-8529-1ce66150e4f9\",\n \"isResizable\": true,\n \"w\": 8,\n \"x\": 8,\n \"y\": 6\n },\n \"links\": [],\n \"maxPerRow\": 4,\n \"name\": \"Total Out\",\n \"options\": {\n \"standardOptions\": {},\n \"thresholds\": {\n \"steps\": [\n {\n \"color\": \"#634CD9\",\n \"type\": \"base\",\n \"value\": null\n }\n ]\n }\n },\n \"targets\": [\n {\n \"expr\": \"max(delta(snmp_interface_ifOutOctets[1m]))\",\n \"legend\": \"Out\",\n \"refId\": \"A\"\n }\n ],\n \"transformations\": [\n {\n \"id\": \"organize\",\n \"options\": {}\n }\n ],\n \"type\": \"stat\",\n \"version\": \"3.0.0\"\n },\n {\n \"custom\": {\n \"calc\": \"lastNotNull\",\n \"colSpan\": 1,\n \"colorMode\": \"value\",\n \"graphMode\": \"none\",\n \"textMode\": \"value\",\n \"textSize\": {},\n \"valueField\": \"Value\"\n },\n \"datasourceCate\": \"prometheus\",\n \"datasourceValue\": \"${datasource}\",\n \"description\": \"最近1分钟总计入流量\",\n \"id\": \"616de58a-70a7-4c0b-b0f2-5151b9f0e9c5\",\n \"layout\": {\n \"h\": 3,\n \"i\": \"616de58a-70a7-4c0b-b0f2-5151b9f0e9c5\",\n \"isResizable\": true,\n \"w\": 8,\n \"x\": 16,\n \"y\": 6\n },\n \"links\": [],\n \"maxPerRow\": 4,\n \"name\": \"Total In\",\n \"options\": {\n \"standardOptions\": {},\n \"thresholds\": {\n \"steps\": [\n {\n \"color\": \"#634CD9\",\n \"type\": \"base\",\n \"value\": null\n }\n ]\n }\n },\n \"targets\": [\n {\n \"expr\": \"max(delta(snmp_interface_ifInOctets[1m]))\",\n \"legend\": \"In\",\n \"refId\": \"A\"\n }\n ],\n \"transformations\": [\n {\n \"id\": \"organize\",\n \"options\": {}\n }\n ],\n \"type\": \"stat\",\n \"version\": \"3.0.0\"\n },\n {\n \"custom\": {\n \"calc\": \"lastNotNull\",\n \"colSpan\": 1,\n \"colorMode\": \"value\",\n \"graphMode\": \"none\",\n \"textMode\": \"value\",\n \"textSize\": {},\n \"valueField\": \"Value\"\n },\n \"datasourceCate\": \"prometheus\",\n \"datasourceValue\": \"${datasource}\",\n \"description\": \"入方向1m内丢包数\",\n \"id\": \"fcdf91de-394f-4d9c-abb9-d750583ce6cf\",\n \"layout\": {\n \"h\": 3,\n \"i\": \"da757839-0fc0-4d1b-b486-7070aa3d70f8\",\n \"isResizable\": true,\n \"w\": 8,\n \"x\": 0,\n \"y\": 9\n },\n \"links\": [],\n \"maxPerRow\": 4,\n \"name\": \"Drop Packets (In)\",\n \"options\": {\n \"standardOptions\": {},\n \"thresholds\": {\n \"steps\": [\n {\n \"color\": \"#634CD9\",\n \"type\": \"base\",\n \"value\": null\n }\n ]\n }\n },\n \"targets\": [\n {\n \"expr\": \"sum(irate(snmp_interface_ifInDiscards[1m]))\",\n \"legend\": \"In\",\n \"refId\": \"A\"\n }\n ],\n \"transformations\": [\n {\n \"id\": \"organize\",\n \"options\": {}\n }\n ],\n \"type\": \"stat\",\n \"version\": \"3.0.0\"\n },\n {\n \"custom\": {\n \"calc\": \"lastNotNull\",\n \"colSpan\": 1,\n \"colorMode\": \"value\",\n \"graphMode\": \"none\",\n \"textMode\": \"value\",\n \"textSize\": {},\n \"valueField\": \"Value\"\n },\n \"datasourceCate\": \"prometheus\",\n \"datasourceValue\": \"${datasource}\",\n \"description\": \"出方向1m的丢包数\",\n \"id\": \"b5d3c6de-6512-40d2-b167-a1e00bfaa795\",\n \"layout\": {\n \"h\": 3,\n \"i\": \"ab9b1070-a81a-4a30-9dcd-7071dfafcdc6\",\n \"isResizable\": true,\n \"w\": 8,\n \"x\": 8,\n \"y\": 9\n },\n \"links\": [],\n \"maxPerRow\": 4,\n \"name\": \"Drop Packets (Out)\",\n \"options\": {\n \"standardOptions\": {},\n \"thresholds\": {\n \"steps\": [\n {\n \"color\": \"#634CD9\",\n \"type\": \"base\",\n \"value\": null\n }\n ]\n }\n },\n \"targets\": [\n {\n \"expr\": \"sum(irate(snmp_interface_ifOutDiscards[1m]))\",\n \"legend\": \"In\",\n \"refId\": \"A\"\n }\n ],\n \"transformations\": [\n {\n \"id\": \"organize\",\n \"options\": {}\n }\n ],\n \"type\": \"stat\",\n \"version\": \"3.0.0\"\n },\n {\n \"custom\": {\n \"baseColor\": \"#9470FF\",\n \"calc\": \"lastNotNull\",\n \"serieWidth\": 20,\n \"sortOrder\": \"desc\"\n },\n \"datasourceCate\": \"prometheus\",\n \"datasourceValue\": \"${datasource}\",\n \"description\": \"Max: 10MB \\nRed Status: 9MB\",\n \"id\": \"a925c635-0ff8-4984-a8b0-ca99948960f0\",\n \"layout\": {\n \"h\": 9,\n \"i\": \"a925c635-0ff8-4984-a8b0-ca99948960f0\",\n \"isResizable\": true,\n \"w\": 12,\n \"x\": 0,\n \"y\": 12\n },\n \"links\": [],\n \"maxPerRow\": 4,\n \"name\": \"Out (Current)\",\n \"options\": {\n \"standardOptions\": {}\n },\n \"targets\": [\n {\n \"expr\": \"irate(snmp_interface_ifOutOctets[5m])\",\n \"legend\": \"{{ifDescr}}( {{ifIndex}})\",\n \"refId\": \"B\"\n }\n ],\n \"transformations\": [\n {\n \"id\": \"organize\",\n \"options\": {}\n }\n ],\n \"type\": \"barGauge\",\n \"version\": \"3.0.0\"\n },\n {\n \"custom\": {\n \"baseColor\": \"#9470FF\",\n \"calc\": \"lastNotNull\",\n \"serieWidth\": 20,\n \"sortOrder\": \"desc\"\n },\n \"datasourceCate\": \"prometheus\",\n \"datasourceValue\": \"${datasource}\",\n \"description\": \"Max: 10MB \\nRed Status: 9MB\",\n \"id\": \"86345d37-977a-44e0-96ca-e46fe388b529\",\n \"layout\": {\n \"h\": 9,\n \"i\": \"86345d37-977a-44e0-96ca-e46fe388b529\",\n \"isResizable\": true,\n \"w\": 12,\n \"x\": 12,\n \"y\": 12\n },\n \"links\": [],\n \"maxPerRow\": 4,\n \"name\": \"In (Current)\",\n \"options\": {\n \"standardOptions\": {}\n },\n \"targets\": [\n {\n \"expr\": \"irate(snmp_interface_ifInOctets[5m])\",\n \"legend\": \"{{ifDescr}}({{ifIndex}})\",\n \"refId\": \"B\"\n }\n ],\n \"transformations\": [\n {\n \"id\": \"organize\",\n \"options\": {}\n }\n ],\n \"type\": \"barGauge\",\n \"version\": \"3.0.0\"\n },\n {\n \"custom\": {\n \"drawStyle\": \"lines\",\n \"fillOpacity\": 0.5,\n \"gradientMode\": \"none\",\n \"lineInterpolation\": \"linear\",\n \"lineWidth\": 1,\n \"scaleDistribution\": {\n \"type\": \"linear\"\n },\n \"spanNulls\": false,\n \"stack\": \"off\"\n },\n \"datasourceCate\": \"prometheus\",\n \"datasourceValue\": \"${datasource}\",\n \"id\": \"4bd4c3ad-e00f-4eac-89fc-6b146f36d922\",\n \"layout\": {\n \"h\": 10,\n \"i\": \"4bd4c3ad-e00f-4eac-89fc-6b146f36d922\",\n \"isResizable\": true,\n \"w\": 24,\n \"x\": 0,\n \"y\": 21\n },\n \"links\": [],\n \"maxPerRow\": 4,\n \"name\": \"Out / In\",\n \"options\": {\n \"legend\": {\n \"displayMode\": \"hidden\"\n },\n \"standardOptions\": {},\n \"thresholds\": {\n \"steps\": [\n {\n \"color\": \"#634CD9\",\n \"type\": \"base\",\n \"value\": null\n }\n ]\n },\n \"tooltip\": {\n \"mode\": \"all\",\n \"sort\": \"none\"\n }\n },\n \"targets\": [\n {\n \"expr\": \"irate(snmp_interface_ifOutOctets[5m])\",\n \"legend\": \"Out: {{ifDescr}} \",\n \"refId\": \"A\"\n },\n {\n \"expr\": \"-irate(snmp_interface_ifInOctets[5m])\",\n \"legend\": \"In: {{ifDescr}} \",\n \"refId\": \"B\"\n }\n ],\n \"transformations\": [\n {\n \"id\": \"organize\",\n \"options\": {}\n }\n ],\n \"type\": \"timeseries\",\n \"version\": \"3.0.0\"\n },\n {\n \"custom\": {\n \"calc\": \"lastNotNull\",\n \"colorMode\": \"value\",\n \"columns\": [\n \"shop\",\n \"role\",\n \"ifIndex\",\n \"value\"\n ],\n \"displayMode\": \"labelsOfSeriesToRows\",\n \"showHeader\": true,\n \"sortColumn\": \"ifDescr\",\n \"sortOrder\": \"ascend\"\n },\n \"datasourceCate\": \"prometheus\",\n \"datasourceValue\": \"${datasource}\",\n \"id\": \"b663d53d-41a9-4e28-a60e-6ced1b9d46ce\",\n \"layout\": {\n \"h\": 10,\n \"i\": \"b663d53d-41a9-4e28-a60e-6ced1b9d46ce\",\n \"isResizable\": true,\n \"w\": 24,\n \"x\": 0,\n \"y\": 31\n },\n \"links\": [],\n \"maxPerRow\": 4,\n \"name\": \"Interface Status\",\n \"options\": {\n \"standardOptions\": {},\n \"valueMappings\": [\n {\n \"match\": {\n \"special\": 1\n },\n \"result\": {\n \"color\": \"#3fc453\",\n \"text\": \"UP\"\n },\n \"type\": \"special\"\n },\n {\n \"match\": {\n \"special\": 2\n },\n \"result\": {\n \"color\": \"#ce4f52\",\n \"text\": \"DOWN\"\n },\n \"type\": \"special\"\n },\n {\n \"match\": {\n \"special\": 3\n },\n \"result\": {\n \"color\": \"#9470ff\",\n \"text\": \"TESTING\"\n },\n \"type\": \"special\"\n },\n {\n \"match\": {\n \"special\": 4\n },\n \"result\": {\n \"color\": \"#000000\",\n \"text\": \"UNKNOWN\"\n },\n \"type\": \"special\"\n },\n {\n \"match\": {\n \"special\": 5\n },\n \"result\": {\n \"color\": \"#ffae39\",\n \"text\": \"DORMANT\"\n },\n \"type\": \"special\"\n },\n {\n \"match\": {\n \"special\": 6\n },\n \"result\": {\n \"color\": \"#e6c627\",\n \"text\": \"NotPresent\"\n },\n \"type\": \"special\"\n },\n {\n \"match\": {\n \"special\": 7\n },\n \"result\": {\n \"color\": \"#ff8286\",\n \"text\": \"LowerLayerDown\"\n },\n \"type\": \"special\"\n }\n ]\n },\n \"overrides\": [\n {}\n ],\n \"targets\": [\n {\n \"expr\": \"snmp_interface_ifOperStatus\",\n \"legend\": \"out\",\n \"refId\": \"A\"\n }\n ],\n \"transformations\": [\n {\n \"id\": \"organize\",\n \"options\": {}\n }\n ],\n \"type\": \"table\",\n \"version\": \"3.0.0\"\n }\n ],\n \"var\": [\n {\n \"defaultValue\": \"\",\n \"definition\": \"prometheus\",\n \"hide\": false,\n \"label\": \"datasource\",\n \"name\": \"datasource\",\n \"type\": \"datasource\"\n }\n ],\n \"version\": \"3.0.0\"\n },\n \"public\": 0,\n \"public_cate\": 0,\n \"bgids\": null,\n \"built_in\": 0,\n \"hide\": 0,\n \"uuid\": 1717556328367142000\n}"
},
{
"path": "integrations/SNMP/dashboards/switch branch.json",
"content": "{\n \"id\": 0,\n \"group_id\": 0,\n \"name\": \"各个接入交换机\",\n \"ident\": \"h\",\n \"tags\": \"\",\n \"create_at\": 0,\n \"create_by\": \"\",\n \"update_at\": 0,\n \"update_by\": \"\",\n \"configs\": {\n \"graphTooltip\": \"default\",\n \"graphZoom\": \"default\",\n \"links\": [],\n \"panels\": [\n {\n \"custom\": {\n \"aggrDimension\": [\n \"sys_name\",\n \"sys_pm\",\n \"LocalIP\"\n ],\n \"calc\": \"lastNotNull\",\n \"colorMode\": \"background\",\n \"displayMode\": \"labelValuesToRows\",\n \"linkMode\": \"appendLinkColumn\",\n \"showHeader\": true,\n \"sortColumn\": \"sys_name\",\n \"sortOrder\": \"ascend\"\n },\n \"datasourceCate\": \"prometheus\",\n \"datasourceValue\": \"${jieru}\",\n \"id\": \"4f20d79f-8092-43eb-8298-7492b8fc7b4a\",\n \"layout\": {\n \"h\": 3,\n \"i\": \"4f20d79f-8092-43eb-8298-7492b8fc7b4a\",\n \"isResizable\": true,\n \"w\": 13,\n \"x\": 0,\n \"y\": 0\n },\n \"maxPerRow\": 4,\n \"name\": \"设备基本信息\",\n \"options\": {\n \"standardOptions\": {}\n },\n \"overrides\": [\n {\n \"matcher\": {\n \"id\": \"byFrameRefID\",\n \"value\": \"A\"\n },\n \"properties\": {\n \"standardOptions\": {\n \"util\": \"humantimeSeconds\"\n },\n \"valueMappings\": [\n {\n \"match\": {\n \"to\": 86400\n },\n \"result\": {\n \"color\": \"rgba(250, 6, 6, 1)\"\n },\n \"type\": \"range\"\n },\n {\n \"match\": {\n \"to\": 2592000\n },\n \"result\": {\n \"color\": \"rgba(230, 198, 39, 1)\"\n },\n \"type\": \"range\"\n },\n {\n \"match\": {\n \"from\": 2592000\n },\n \"result\": {\n \"color\": \"rgba(63, 196, 83, 1)\"\n },\n \"type\": \"range\"\n }\n ]\n }\n }\n ],\n \"targets\": [\n {\n \"expr\": \"snmp_sys_uptime\",\n \"instant\": false,\n \"legend\": \"设备在线\",\n \"maxDataPoints\": 240,\n \"refId\": \"A\"\n }\n ],\n \"transformations\": [\n {\n \"id\": \"organize\",\n \"options\": {\n \"excludeByName\": {\n \"ifDescr\": false\n },\n \"indexByName\": {\n \"ifDescr\": 0\n },\n \"renameByName\": {\n \"LocalIP\": \"管理IP地址\",\n \"ifDescr\": \"\",\n \"sys_name\": \"设备名称\",\n \"sys_pm\": \"设备型号\"\n }\n }\n }\n ],\n \"type\": \"table\",\n \"version\": \"3.0.0\"\n },\n {\n \"custom\": {\n \"calc\": \"lastNotNull\",\n \"colSpan\": 1,\n \"colorMode\": \"value\",\n \"graphMode\": \"none\",\n \"textMode\": \"valueAndName\",\n \"textSize\": {\n \"title\": 24,\n \"value\": 24\n },\n \"valueField\": \"Value\"\n },\n \"datasourceCate\": \"prometheus\",\n \"datasourceValue\": \"${jieru}\",\n \"id\": \"1ce09285-bf26-4518-acbd-26db4e1292a2\",\n \"layout\": {\n \"h\": 4,\n \"i\": \"1ce09285-bf26-4518-acbd-26db4e1292a2\",\n \"isResizable\": true,\n \"w\": 4,\n \"x\": 13,\n \"y\": 0\n },\n \"maxPerRow\": 4,\n \"name\": \"Panel Title\",\n \"options\": {\n \"standardOptions\": {},\n \"thresholds\": {\n \"steps\": [\n {\n \"color\": \"#634CD9\",\n \"type\": \"base\",\n \"value\": null\n }\n ]\n },\n \"valueMappings\": []\n },\n \"targets\": [\n {\n \"expr\": \"snmp_TotalPorts\",\n \"legend\": \"设备端口数\",\n \"maxDataPoints\": 240,\n \"refId\": \"A\"\n }\n ],\n \"transformations\": [\n {\n \"id\": \"organize\",\n \"options\": {}\n }\n ],\n \"type\": \"stat\",\n \"version\": \"3.0.0\"\n },\n {\n \"custom\": {\n \"calc\": \"lastNotNull\",\n \"textMode\": \"valueAndName\",\n \"valueField\": \"Value\"\n },\n \"datasourceCate\": \"prometheus\",\n \"datasourceValue\": \"${jieru}\",\n \"id\": \"b0a707e6-2059-4158-8e44-ee19db45e12e\",\n \"layout\": {\n \"h\": 4,\n \"i\": \"b0a707e6-2059-4158-8e44-ee19db45e12e\",\n \"isResizable\": true,\n \"w\": 7,\n \"x\": 17,\n \"y\": 0\n },\n \"maxPerRow\": 4,\n \"name\": \"设备资源占用\",\n \"options\": {\n \"standardOptions\": {\n \"decimals\": 0\n },\n \"thresholds\": {\n \"steps\": [\n {\n \"color\": \"#3FC453\",\n \"type\": \"base\",\n \"value\": null\n },\n {\n \"color\": \"#FF9919\",\n \"value\": 60\n },\n {\n \"color\": \"#FF656B\",\n \"value\": 80\n }\n ]\n }\n },\n \"targets\": [\n {\n \"expr\": \"snmp_cpu_usage\",\n \"legend\": \"CPU使用率\",\n \"maxDataPoints\": 240,\n \"refId\": \"A\"\n },\n {\n \"expr\": \"snmp_mem_use / snmp_mem_max*100\",\n \"legend\": \"内存使用率\",\n \"maxDataPoints\": 240,\n \"refId\": \"B\"\n }\n ],\n \"transformations\": [\n {\n \"id\": \"organize\",\n \"options\": {}\n }\n ],\n \"type\": \"gauge\",\n \"version\": \"3.0.0\"\n },\n {\n \"custom\": {\n \"aggrDimension\": [\n \"ifDescr\"\n ],\n \"calc\": \"lastNotNull\",\n \"colorMode\": \"background\",\n \"displayMode\": \"labelValuesToRows\",\n \"linkMode\": \"appendLinkColumn\",\n \"showHeader\": true,\n \"sortColumn\": \"A\",\n \"sortOrder\": \"descend\"\n },\n \"datasourceCate\": \"prometheus\",\n \"datasourceValue\": \"${jieru}\",\n \"id\": \"89d8708e-051d-4bc6-b846-17ade266c77b\",\n \"layout\": {\n \"h\": 11,\n \"i\": \"89d8708e-051d-4bc6-b846-17ade266c77b\",\n \"isResizable\": true,\n \"w\": 13,\n \"x\": 0,\n \"y\": 3\n },\n \"maxPerRow\": 4,\n \"name\": \"设备端口状态\",\n \"options\": {\n \"standardOptions\": {}\n },\n \"overrides\": [\n {\n \"matcher\": {\n \"id\": \"byFrameRefID\",\n \"value\": \"C\"\n },\n \"properties\": {\n \"valueMappings\": [\n {\n \"match\": {\n \"special\": 1,\n \"to\": 1\n },\n \"result\": {\n \"color\": \"rgba(63, 196, 83, 1)\",\n \"text\": \"UP\"\n },\n \"type\": \"special\"\n },\n {\n \"match\": {\n \"special\": 2\n },\n \"result\": {\n \"color\": \"#000000\",\n \"text\": \"DOWN\"\n },\n \"type\": \"special\"\n }\n ]\n }\n },\n {\n \"matcher\": {\n \"id\": \"byFrameRefID\",\n \"value\": \"B\"\n },\n \"properties\": {\n \"standardOptions\": {\n \"util\": \"none\"\n },\n \"valueMappings\": [\n {\n \"match\": {\n \"special\": 1000\n },\n \"result\": {\n \"color\": \"rgba(108, 155, 248, 1)\",\n \"text\": \"千兆\"\n },\n \"type\": \"special\"\n },\n {\n \"match\": {\n \"special\": 0\n },\n \"result\": {\n \"color\": \"#000000\",\n \"text\": \"无连接\"\n },\n \"type\": \"special\"\n },\n {\n \"match\": {\n \"special\": 100\n },\n \"result\": {\n \"color\": \"rgba(18, 238, 51, 1)\",\n \"text\": \"百兆\"\n },\n \"type\": \"special\"\n },\n {\n \"match\": {\n \"special\": 200\n },\n \"result\": {\n \"color\": \"rgba(33, 112, 44, 1)\",\n \"text\": \"接入汇聚\"\n },\n \"type\": \"special\"\n },\n {\n \"match\": {\n \"special\": 2000\n },\n \"result\": {\n \"color\": \"rgba(4, 62, 175, 1)\",\n \"text\": \"核心堆叠\"\n },\n \"type\": \"special\"\n }\n ]\n },\n \"type\": \"special\"\n }\n ],\n \"targets\": [\n {\n \"expr\": \"snmp_interface_ifSpeed\",\n \"legend\": \"端口速率\",\n \"maxDataPoints\": 240,\n \"refId\": \"B\"\n },\n {\n \"expr\": \"snmp_interface_ifOperStatus\",\n \"legend\": \"端口状态\",\n \"maxDataPoints\": 240,\n \"refId\": \"C\"\n }\n ],\n \"transformations\": [\n {\n \"id\": \"organize\",\n \"options\": {\n \"renameByName\": {\n \"DCN\": \"IP地址\",\n \"ifDescr\": \"端口名称\",\n \"ifSpeed\": \"端口速率\",\n \"sysname\": \"设备名称\"\n }\n }\n }\n ],\n \"type\": \"table\",\n \"version\": \"3.0.0\"\n },\n {\n \"custom\": {\n \"calc\": \"lastNotNull\",\n \"colorDomainAuto\": true,\n \"colorRange\": [\n \"#83c898\",\n \"#c2c2c2\",\n \"#fc653f\"\n ],\n \"fontBackground\": false,\n \"reverseColorOrder\": false,\n \"textMode\": \"value\",\n \"valueField\": \"ifDescr\"\n },\n \"datasourceCate\": \"prometheus\",\n \"datasourceValue\": \"${jieru}\",\n \"id\": \"2307e3b9-af4c-4ffa-aae2-987d7c010f00\",\n \"layout\": {\n \"h\": 10,\n \"i\": \"2307e3b9-af4c-4ffa-aae2-987d7c010f00\",\n \"isResizable\": true,\n \"w\": 11,\n \"x\": 13,\n \"y\": 4\n },\n \"maxPerRow\": 4,\n \"name\": \"端口状态\",\n \"options\": {\n \"standardOptions\": {},\n \"thresholds\": {\n \"steps\": [\n {\n \"color\": \"#634CD9\",\n \"type\": \"base\",\n \"value\": null\n }\n ]\n }\n },\n \"targets\": [\n {\n \"expr\": \"snmp_interface_ifOperStatus\",\n \"legend\": \"{{LocalIP}}\",\n \"maxDataPoints\": 240,\n \"refId\": \"A\"\n }\n ],\n \"transformations\": [\n {\n \"id\": \"organize\",\n \"options\": {}\n }\n ],\n \"type\": \"hexbin\",\n \"version\": \"3.0.0\"\n },\n {\n \"custom\": {\n \"barMaxWidth\": null,\n \"calc\": \"lastNotNull\",\n \"colorField\": \"__name__\",\n \"xAxisField\": \"ifDescr\",\n \"yAxisField\": \"Value\"\n },\n \"datasourceCate\": \"prometheus\",\n \"datasourceValue\": \"${jieru}\",\n \"id\": \"7178cb95-1023-483e-bc27-8dffe6749524\",\n \"layout\": {\n \"h\": 6,\n \"i\": \"7178cb95-1023-483e-bc27-8dffe6749524\",\n \"isResizable\": true,\n \"w\": 24,\n \"x\": 0,\n \"y\": 14\n },\n \"maxPerRow\": 4,\n \"name\": \"各个端口流量汇总\",\n \"options\": {\n \"standardOptions\": {\n \"util\": \"bytesSI\"\n }\n },\n \"targets\": [\n {\n \"expr\": \"snmp_interface_ifInOctets\",\n \"legend\": \"端口IN流量\",\n \"maxDataPoints\": 240,\n \"refId\": \"A\"\n },\n {\n \"expr\": \"snmp_interface_ifOutOctets\",\n \"legend\": \"端口OUT流量\",\n \"maxDataPoints\": 240,\n \"refId\": \"B\"\n }\n ],\n \"transformations\": [\n {\n \"id\": \"organize\",\n \"options\": {}\n }\n ],\n \"type\": \"barchart\",\n \"version\": \"3.0.0\"\n },\n {\n \"custom\": {\n \"drawStyle\": \"lines\",\n \"fillOpacity\": 0.75,\n \"gradientMode\": \"opacity\",\n \"lineInterpolation\": \"smooth\",\n \"lineWidth\": 2,\n \"scaleDistribution\": {\n \"type\": \"linear\"\n },\n \"spanNulls\": true,\n \"stack\": \"off\"\n },\n \"datasourceCate\": \"prometheus\",\n \"datasourceValue\": \"${jieru}\",\n \"id\": \"ccb183c2-8918-464f-beda-511dac02390d\",\n \"layout\": {\n \"h\": 8,\n \"i\": \"ccb183c2-8918-464f-beda-511dac02390d\",\n \"isResizable\": true,\n \"w\": 24,\n \"x\": 0,\n \"y\": 20\n },\n \"maxPerRow\": 4,\n \"name\": \"核心堆叠口流量汇总\",\n \"options\": {\n \"legend\": {\n \"behaviour\": \"showItem\",\n \"displayMode\": \"hidden\"\n },\n \"standardOptions\": {\n \"util\": \"bytesSI\"\n },\n \"thresholds\": {\n \"steps\": [\n {\n \"color\": \"#634CD9\",\n \"type\": \"base\",\n \"value\": null\n }\n ]\n },\n \"tooltip\": {\n \"mode\": \"all\",\n \"sort\": \"none\"\n }\n },\n \"overrides\": [\n {\n \"matcher\": {\n \"id\": \"byFrameRefID\"\n },\n \"properties\": {\n \"rightYAxisDisplay\": \"off\",\n \"standardOptions\": {\n \"util\": \"none\"\n }\n }\n }\n ],\n \"targets\": [\n {\n \"expr\": \"irate(snmp_interface_ifInOctets{ifDescr=~\\\"Vlan256\\\"}[5m])\",\n \"legend\": \"INT\",\n \"maxDataPoints\": 240,\n \"refId\": \"A\",\n \"time\": {\n \"end\": \"now\",\n \"start\": \"now-6h\"\n }\n },\n {\n \"expr\": \"-irate(snmp_interface_ifOutOctets{ ifDescr=~\\\"Vlan256\\\"}[5m])\",\n \"legend\": \"OUT\",\n \"maxDataPoints\": 240,\n \"refId\": \"B\",\n \"time\": {\n \"end\": \"now\",\n \"start\": \"now-6h\"\n }\n }\n ],\n \"transformations\": [\n {\n \"id\": \"organize\",\n \"options\": {}\n }\n ],\n \"type\": \"timeseries\",\n \"version\": \"3.0.0\"\n }\n ],\n \"var\": [\n {\n \"defaultValue\": \"\",\n \"definition\": \"prometheus\",\n \"label\": \"数据源\",\n \"name\": \"jieru\",\n \"type\": \"datasource\"\n },\n {\n \"allOption\": true,\n \"allValue\": \"\",\n \"datasource\": {\n \"cate\": \"prometheus\",\n \"value\": \"${jieru}\"\n },\n \"definition\": \"label_values(LocalIP)\",\n \"label\": \"ip地址\",\n \"multi\": true,\n \"name\": \"ipadd\",\n \"reg\": \"\",\n \"type\": \"query\"\n },\n {\n \"allOption\": true,\n \"datasource\": {\n \"cate\": \"prometheus\",\n \"value\": \"${jieru}\"\n },\n \"definition\": \"label_values(sys_name)\",\n \"label\": \"设备名称\",\n \"multi\": true,\n \"name\": \"sys_name\",\n \"type\": \"query\"\n }\n ],\n \"version\": \"3.0.0\"\n },\n \"public\": 0,\n \"public_cate\": 0,\n \"bgids\": null,\n \"built_in\": 0,\n \"hide\": 0,\n \"uuid\": 1717556328371021000\n}"
},
{
"path": "integrations/SNMP/dashboards/switch main.json",
"content": "{\n \"id\": 0,\n \"group_id\": 0,\n \"name\": \"网络交换机监控大盘\",\n \"ident\": \"\",\n \"tags\": \"\",\n \"create_at\": 0,\n \"create_by\": \"\",\n \"update_at\": 0,\n \"update_by\": \"\",\n \"configs\": {\n \"graphTooltip\": \"default\",\n \"graphZoom\": \"default\",\n \"links\": [],\n \"panels\": [\n {\n \"custom\": {\n \"calc\": \"lastNotNull\",\n \"colSpan\": 8,\n \"colorMode\": \"value\",\n \"graphMode\": \"none\",\n \"textMode\": \"valueAndName\",\n \"textSize\": {\n \"title\": 20,\n \"value\": 20\n },\n \"valueField\": \"Value\"\n },\n \"datasourceCate\": \"prometheus\",\n \"datasourceValue\": 1,\n \"id\": \"190d574b-502d-482f-8b6f-981730dba70e\",\n \"layout\": {\n \"h\": 4,\n \"i\": \"190d574b-502d-482f-8b6f-981730dba70e\",\n \"isResizable\": true,\n \"w\": 4,\n \"x\": 0,\n \"y\": 0\n },\n \"maxPerRow\": 4,\n \"name\": \"设备数量\",\n \"options\": {\n \"standardOptions\": {\n \"util\": \"none\"\n },\n \"thresholds\": {\n \"steps\": [\n {\n \"color\": \"rgba(99, 76, 217, 1)\",\n \"type\": \"base\",\n \"value\": null\n }\n ]\n },\n \"valueMappings\": []\n },\n \"targets\": [\n {\n \"expr\": \"count(snmp_sys_uptime)\",\n \"instant\": false,\n \"legend\": \"设备在线\",\n \"maxDataPoints\": 20,\n \"refId\": \"A\"\n }\n ],\n \"transformations\": [\n {\n \"id\": \"organize\",\n \"options\": {}\n }\n ],\n \"type\": \"stat\",\n \"version\": \"3.0.0\"\n },\n {\n \"custom\": {\n \"aggrDimension\": [\n \"sys_name\",\n \"LocalIP\",\n \"sys_pm\"\n ],\n \"calc\": \"lastNotNull\",\n \"colorMode\": \"background\",\n \"displayMode\": \"labelValuesToRows\",\n \"linkMode\": \"appendLinkColumn\",\n \"links\": [\n {\n \"title\": \"详情\",\n \"url\": \"http://182.182.61.13:17000/dashboards/h?ipadd=${__field.labels.LocalIP}\\u0026jieru=1\"\n }\n ],\n \"showHeader\": true\n },\n \"datasourceCate\": \"prometheus\",\n \"datasourceValue\": 1,\n \"id\": \"8b107213-6d65-4877-b3e2-31435bb8758c\",\n \"layout\": {\n \"h\": 14,\n \"i\": \"8b107213-6d65-4877-b3e2-31435bb8758c\",\n \"isResizable\": true,\n \"w\": 24,\n \"x\": 0,\n \"y\": 4\n },\n \"maxPerRow\": 4,\n \"name\": \"设备概览\",\n \"options\": {\n \"standardOptions\": {},\n \"valueMappings\": []\n },\n \"overrides\": [\n {\n \"matcher\": {\n \"id\": \"byFrameRefID\",\n \"value\": \"A\"\n },\n \"properties\": {\n \"standardOptions\": {\n \"util\": \"percent\"\n },\n \"valueMappings\": [\n {\n \"match\": {\n \"to\": 20\n },\n \"result\": {\n \"color\": \"rgba(63, 196, 83, 1)\"\n },\n \"type\": \"range\"\n },\n {\n \"match\": {\n \"to\": 50\n },\n \"result\": {\n \"color\": \"rgba(230, 198, 39, 1)\"\n },\n \"type\": \"range\"\n },\n {\n \"match\": {\n \"to\": 100\n },\n \"result\": {\n \"color\": \"rgba(252, 4, 4, 1)\"\n },\n \"type\": \"range\"\n }\n ]\n }\n },\n {\n \"matcher\": {\n \"id\": \"byFrameRefID\",\n \"value\": \"B\"\n },\n \"properties\": {\n \"standardOptions\": {\n \"decimals\": 0,\n \"util\": \"percentUnit\"\n },\n \"valueMappings\": [\n {\n \"match\": {\n \"to\": 0.6\n },\n \"result\": {\n \"color\": \"rgba(63, 196, 83, 1)\"\n },\n \"type\": \"range\"\n },\n {\n \"match\": {\n \"to\": 0.8\n },\n \"result\": {\n \"color\": \"rgba(230, 198, 39, 1)\"\n },\n \"type\": \"range\"\n },\n {\n \"match\": {\n \"from\": 0.8,\n \"to\": 1\n },\n \"result\": {\n \"color\": \"rgba(253, 0, 0, 1)\"\n },\n \"type\": \"range\"\n }\n ]\n },\n \"type\": \"special\"\n },\n {\n \"matcher\": {\n \"id\": \"byFrameRefID\",\n \"value\": \"C\"\n },\n \"properties\": {\n \"standardOptions\": {\n \"util\": \"humantimeSeconds\"\n },\n \"valueMappings\": [\n {\n \"match\": {\n \"to\": 86400\n },\n \"result\": {\n \"color\": \"rgba(250, 4, 4, 1)\"\n },\n \"type\": \"range\"\n },\n {\n \"match\": {\n \"to\": 2592000\n },\n \"result\": {\n \"color\": \"rgba(230, 198, 39, 1)\"\n },\n \"type\": \"range\"\n },\n {\n \"match\": {\n \"from\": 2592000\n },\n \"result\": {\n \"color\": \"rgba(63, 196, 83, 1)\"\n },\n \"type\": \"range\"\n }\n ]\n },\n \"type\": \"special\"\n }\n ],\n \"targets\": [\n {\n \"expr\": \"snmp_cpu_usage\",\n \"legend\": \"CPU使用率\",\n \"maxDataPoints\": 240,\n \"refId\": \"A\"\n },\n {\n \"expr\": \"snmp_mem_use/snmp_mem_max\",\n \"legend\": \"内存使用率\",\n \"maxDataPoints\": 240,\n \"refId\": \"B\"\n },\n {\n \"expr\": \"snmp_sys_uptime\",\n \"legend\": \"开机时间\",\n \"maxDataPoints\": 240,\n \"refId\": \"C\"\n }\n ],\n \"transformations\": [\n {\n \"id\": \"organize\",\n \"options\": {\n \"renameByName\": {\n \"DCN\": \"IP地址\",\n \"LocalIP\": \"IP地址\",\n \"sys_name\": \"设备名称\",\n \"sys_pm\": \"设备型号\",\n \"sysname\": \"设备名称\"\n }\n }\n }\n ],\n \"type\": \"table\",\n \"version\": \"3.0.0\"\n }\n ],\n \"var\": [],\n \"version\": \"3.0.0\"\n },\n \"public\": 0,\n \"public_cate\": 0,\n \"bgids\": null,\n \"built_in\": 0,\n \"hide\": 0,\n \"uuid\": 1717556328376415000\n}"
},
{
"path": "integrations/SNMP/markdown/README.md",
"content": "# snmp\n\n> 监控网络设备,主要是通过 SNMP 协议,Categraf、Telegraf、Datadog-Agent、snmp_exporter 都提供了这个能力。\n\nCategraf 从 v0.2.13 版本开始把 Telegraf 的 snmp 插件集成了进来,推荐大家采用这个插件来监控网络设备。这个插件的核心逻辑是:要采集什么指标,直接配置对应的 oid 即可,而且可以把一些 oid 采集到的数据当做时序数据的标签,非常非常灵活。\n\n当然,弊端也有,因为 SNMP 体系里有大量的私有 oid,比如不同的设备获取 CPU、内存利用率的 oid 都不一样,这就需要为不同的型号的设备采用不同的配置,维护起来比较麻烦,需要大量的积累。这里我倡议大家把不同的设备型号的采集配置积累到 [这里](https://github.com/flashcatcloud/categraf/tree/main/inputs/snmp),每个型号一个文件夹,长期积累下来,那将是利人利己的好事。不知道如何提 PR 的可以联系我们。\n\n另外,也不用太悲观,针对网络设备而言,大部分监控数据的采集都是通用 oid 就可以搞定的,举个例子:\n\n```toml\ninterval = 120\n\n[[instances]]\nagents = [\"udp://172.30.15.189:161\"]\n\ninterval_times = 1\ntimeout = \"5s\"\nversion = 2\ncommunity = \"public\"\nagent_host_tag = \"switch_ip\"\nretries = 1\n\n[[instances.field]]\noid = \"RFC1213-MIB::sysUpTime.0\"\nname = \"uptime\"\n\n[[instances.field]]\noid = \"RFC1213-MIB::sysName.0\"\nname = \"source\"\nis_tag = true\n\n[[instances.table]]\noid = \"IF-MIB::ifTable\"\nname = \"interface\"\ninherit_tags = [\"source\"]\n\n[[instances.table.field]]\noid = \"IF-MIB::ifDescr\"\nname = \"ifDescr\"\nis_tag = true\n\n```\n\n上面的样例是 v2 版本的配置,如果是 v3 版本,校验方式举例:\n\n```toml\nversion = 3\nsec_name = \"managev3user\"\nauth_protocol = \"SHA\"\nauth_password = \"example.Demo.c0m\"\n```\n\n另外,snmp 的采集,建议大家部署单独的 Categraf 来做,因为不同监控对象采集频率可能不同,比如边缘交换机,我们 5min 采集一次就够了,核心交换机可以配置的频繁一些,比如 60s 或者 120s。\n\n> 注意:如果采集的过于频繁,有些老款的交换机可能会被打挂,或者被限流,被限流的结果就是图上看到的是断点。\n\n## 扩展阅读\n\n- [SNMP(简单网络管理协议)简介](https://flashcat.cloud/blog/snmp-introduction/)\n- [SNMP命令相关参数介绍](https://flashcat.cloud/blog/snmp-command-arguments/)\n- [通过 Categraf SNMP 插件采集监控数据](https://flashcat.cloud/blog/snmp-metrics-collect-by-categraf/)\n\n## 排错\n\n要想通过 categraf 采集到 snmp 数据,首先要保证 categraf 所在的机器能够连通网络设备,可以通过 snmpget 命令来做测试:\n\n```bash\nsnmpget -v2c -c public 172.30.15.189 RFC1213-MIB::sysUpTime.0\n```\n\n如果 snmpget 都跑不通,就得先解决这个问题,比如是 snmpd 没有启动,或者防火墙限制了 snmp 的访问,还是 snmpget 命令没有安装,等等。这些问题,gpt 和 google 都可以解决,这里不再赘述。\n"
},
{
"path": "integrations/SQLServer/collect/sqlserver/sqlserver.toml",
"content": "# # collect interval\n# interval = 15\n\n[[instances]]\n\n## Specify instances to monitor with a list of connection strings.\n## All connection parameters are optional.\n## By default, the host is localhost, listening on default port, TCP 1433.\n## for Windows, the user is the currently running AD user (SSO).\n## See https://github.com/denisenkom/go-mssqldb for detailed connection\n## parameters, in particular, tls connections can be created like so:\n## \"encrypt=true;certificate=;hostNameInCertificate=\"\n# servers = [\"Server=server.xxx.com;Port=1433;User Id=monitor;Password=xxxxxx;app name=categraf;log=1;\"]\n# servers = [ ]\n\n## Authentication method\n## valid methods: \"connection_string\", \"AAD\"\n# auth_method = \"connection_string\"\n\n## \"database_type\" enables a specific set of queries depending on the database type. If specified, it replaces azuredb = true/false and query_version = 2\n## In the config file, the sql server plugin section should be repeated each with a set of servers for a specific database_type.\n## Possible values for database_type are - \"SQLServer\" or \"AzureSQLDB\" or \"AzureSQLManagedInstance\" or \"AzureSQLPool\"\n\ndatabase_type = \"SQLServer\"\n\n## A list of queries to include. If not specified, all the below listed queries are used.\ninclude_query = []\n\n## A list of queries to explicitly ignore.\nexclude_query = [\"SQLServerAvailabilityReplicaStates\", \"SQLServerDatabaseReplicaStates\"]\n\n## Queries enabled by default for database_type = \"SQLServer\" are -\n## SQLServerPerformanceCounters, SQLServerWaitStatsCategorized, SQLServerDatabaseIO, SQLServerProperties, SQLServerMemoryClerks,\n## SQLServerSchedulers, SQLServerRequests, SQLServerVolumeSpace, SQLServerCpu, SQLServerAvailabilityReplicaStates, SQLServerDatabaseReplicaStates,\n## SQLServerRecentBackups\n\n\n\n## Following are old config settings\n## You may use them only if you are using the earlier flavor of queries, however it is recommended to use\n## the new mechanism of identifying the database_type there by use it's corresponding queries\n\n## Optional parameter, setting this to 2 will use a new version\n## of the collection queries that break compatibility with the original\n## dashboards.\n## Version 2 - is compatible from SQL Server 2012 and later versions and also for SQL Azure DB\n# query_version = 2\n\n## Toggling this to true will emit an additional metric called \"sqlserver_telegraf_health\".\n## This metric tracks the count of attempted queries and successful queries for each SQL instance specified in \"servers\".\n## The purpose of this metric is to assist with identifying and diagnosing any connectivity or query issues.\n## This setting/metric is optional and is disabled by default.\n# health_metric = false\n\n## Possible queries across different versions of the collectors\n## Queries enabled by default for specific Database Type\n\n## database_type = SQLServer by default collects the following queries\n## - SQLServerPerformanceCounters\n## - SQLServerWaitStatsCategorized\n## - SQLServerDatabaseIO\n## - SQLServerProperties\n## - SQLServerMemoryClerks\n## - SQLServerSchedulers\n## - SQLServerRequests\n## - SQLServerVolumeSpace\n## - SQLServerCpu\n## - SQLServerRecentBackups\n## and following as optional (if mentioned in the include_query list)\n## - SQLServerAvailabilityReplicaStates\n## - SQLServerDatabaseReplicaStates\n\n## Version 2 by default collects the following queries\n## Version 2 is being deprecated, please consider using database_type.\n## - PerformanceCounters\n## - WaitStatsCategorized\n## - DatabaseIO\n## - ServerProperties\n## - MemoryClerk\n## - Schedulers\n## - SqlRequests\n## - VolumeSpace\n## - Cpu\n\n## Version 1 by default collects the following queries\n## Version 1 is deprecated, please consider using database_type.\n## - PerformanceCounters\n## - WaitStatsCategorized\n## - CPUHistory\n## - DatabaseIO\n## - DatabaseSize\n## - DatabaseStats\n## - DatabaseProperties\n## - MemoryClerk\n## - VolumeSpace\n## - PerformanceMetrics"
},
{
"path": "integrations/SQLServer/dashboards/sqlserver.json",
"content": "{\n \"id\": 0,\n \"group_id\": 0,\n \"name\": \"SQLServer\",\n \"ident\": \"\",\n \"tags\": \"\",\n \"create_at\": 0,\n \"create_by\": \"\",\n \"update_at\": 0,\n \"update_by\": \"\",\n \"configs\": {\n \"links\": [],\n \"panels\": [\n {\n \"custom\": {\n \"aggrDimension\": [],\n \"calc\": \"lastNotNull\",\n \"colorMode\": \"background\",\n \"displayMode\": \"labelValuesToRows\",\n \"linkMode\": \"appendLinkColumn\",\n \"showHeader\": true\n },\n \"datasourceCate\": \"prometheus\",\n \"datasourceValue\": \"${datasource}\",\n \"id\": \"28f81145-c0d2-49bc-9b6c-28e969c25537\",\n \"layout\": {\n \"h\": 3,\n \"i\": \"28f81145-c0d2-49bc-9b6c-28e969c25537\",\n \"isResizable\": true,\n \"w\": 24,\n \"x\": 0,\n \"y\": 0\n },\n \"maxPerRow\": 4,\n \"name\": \"Server resource overview\",\n \"options\": {\n \"standardOptions\": {}\n },\n \"overrides\": [\n {\n \"matcher\": {\n \"id\": \"byFrameRefID\",\n \"value\": \"F\"\n },\n \"properties\": {\n \"standardOptions\": {\n \"util\": \"seconds\"\n },\n \"valueMappings\": [\n {\n \"match\": {\n \"from\": 0,\n \"special\": 0,\n \"to\": 100\n },\n \"result\": {\n \"color\": \"#ff9919\"\n },\n \"type\": \"range\"\n },\n {\n \"match\": {\n \"from\": 100\n },\n \"result\": {\n \"color\": \"#3fc453\"\n },\n \"type\": \"range\"\n }\n ]\n }\n },\n {\n \"matcher\": {\n \"id\": \"byFrameRefID\",\n \"value\": \"D\"\n },\n \"properties\": {\n \"standardOptions\": {\n \"util\": \"none\"\n }\n },\n \"type\": \"special\"\n },\n {\n \"matcher\": {\n \"id\": \"byFrameRefID\",\n \"value\": \"H\"\n },\n \"properties\": {\n \"standardOptions\": {\n \"util\": \"bytesSecSI\"\n }\n },\n \"type\": \"special\"\n },\n {\n \"matcher\": {\n \"id\": \"byFrameRefID\",\n \"value\": \"B\"\n },\n \"properties\": {\n \"standardOptions\": {\n \"util\": \"bytesIEC\"\n },\n \"valueMappings\": [\n {\n \"match\": {\n \"from\": 102400000,\n \"textValue\": \"200\",\n \"to\": null\n },\n \"result\": {\n \"color\": \"#2c9d3d\"\n },\n \"type\": \"range\"\n },\n {\n \"match\": {\n \"from\": 0,\n \"to\": 100000000\n },\n \"result\": {\n \"color\": \"#ffae39\"\n },\n \"type\": \"range\"\n }\n ]\n },\n \"type\": \"special\"\n },\n {\n \"matcher\": {\n \"id\": \"byFrameRefID\",\n \"value\": \"G\"\n },\n \"properties\": {\n \"standardOptions\": {},\n \"valueMappings\": [\n {\n \"match\": {\n \"special\": 0\n },\n \"result\": {\n \"color\": \"#3fc453\"\n },\n \"type\": \"special\"\n }\n ]\n },\n \"type\": \"special\"\n },\n {\n \"matcher\": {\n \"id\": \"byFrameRefID\",\n \"value\": \"I\"\n },\n \"properties\": {\n \"standardOptions\": {},\n \"valueMappings\": [\n {\n \"match\": {\n \"special\": 0\n },\n \"result\": {\n \"color\": \"#3fc453\"\n },\n \"type\": \"special\"\n },\n {\n \"match\": {\n \"from\": 1\n },\n \"result\": {\n \"color\": \"#ff9919\"\n },\n \"type\": \"range\"\n }\n ]\n },\n \"type\": \"special\"\n }\n ],\n \"targets\": [\n {\n \"expr\": \"sqlserver_performance_value{counter=\\\"Total Server Memory (KB)\\\",serverName=\\\"$instance\\\"}\",\n \"legend\": \"Total RAM\",\n \"maxDataPoints\": 240,\n \"refId\": \"A\"\n },\n {\n \"expr\": \"sqlserver_performance_value{counter=\\\"Total Server Memory (KB)\\\",serverName=\\\"$instance\\\"}-sqlserver_performance_value{counter=\\\"Used memory (KB)\\\",serverName=\\\"$instance\\\"}\",\n \"legend\": \"RAM available\",\n \"maxDataPoints\": 240,\n \"refId\": \"B\"\n },\n {\n \"expr\": \"sqlserver_performance_value{counter=\\\"Free Space in tempdb (KB)\\\",serverName=\\\"$instance\\\"}\",\n \"legend\": \"Pagefile available size\",\n \"maxDataPoints\": 240,\n \"refId\": \"C\"\n },\n {\n \"expr\": \"sqlserver_performance_value{counter=\\\"Page life expectancy\\\",serverName=\\\"$instance\\\"}\",\n \"legend\": \"Total page faults\",\n \"maxDataPoints\": 240,\n \"refId\": \"D\"\n },\n {\n \"expr\": \"sqlserver_performance_value{counter=\\\"Batch Requests/sec\\\",serverName=\\\"$instance\\\"}\",\n \"legend\": \"Batch reqs /sec\",\n \"maxDataPoints\": 240,\n \"refId\": \"E\"\n },\n {\n \"expr\": \"sqlserver_performance_value{counter=\\\"Page life expectancy\\\",serverName=\\\"$instance\\\"}\",\n \"legend\": \"Page life expectancy(sec)\",\n \"maxDataPoints\": 240,\n \"refId\": \"F\"\n },\n {\n \"expr\": \"sqlserver_performance_value{counter=\\\"Number of Deadlocks/sec\\\",serverName=\\\"$instance\\\"}\",\n \"legend\": \"Deadlocks\",\n \"maxDataPoints\": 240,\n \"refId\": \"G\"\n },\n {\n \"expr\": \"sqlserver_performance_value{counter=\\\"Errors/sec\\\",serverName=\\\"$instance\\\"}\",\n \"legend\": \"User errors /sec\",\n \"maxDataPoints\": 240,\n \"refId\": \"H\"\n },\n {\n \"expr\": \"mssql_kill_connection_errors{job=~\\\"$Job\\\"}-0\",\n \"legend\": \"Kill conn errors /sec\",\n \"maxDataPoints\": 240,\n \"refId\": \"I\"\n },\n {\n \"expr\": \"sqlserver_cpu_system_idle_cpu{serverName=\\\"$instance\\\"}\",\n \"legend\": \"sqlserver_cpu_system_idle\",\n \"maxDataPoints\": 240,\n \"refId\": \"K\"\n },\n {\n \"expr\": \"sqlserver_up{serverName=\\\"$instance\\\"}\",\n \"legend\": \"sqlserver_up\",\n \"maxDataPoints\": 240,\n \"refId\": \"L\"\n }\n ],\n \"transformations\": [\n {\n \"id\": \"organize\",\n \"options\": {}\n }\n ],\n \"type\": \"table\",\n \"version\": \"3.0.0\"\n },\n {\n \"collapsed\": true,\n \"id\": \"77467d35-8002-4211-a95d-ed6278567ab4\",\n \"layout\": {\n \"h\": 1,\n \"i\": \"77467d35-8002-4211-a95d-ed6278567ab4\",\n \"isResizable\": false,\n \"w\": 24,\n \"x\": 0,\n \"y\": 3\n },\n \"name\": \"Summary\",\n \"panels\": [],\n \"type\": \"row\",\n \"version\": \"3.0.0\"\n },\n {\n \"custom\": {\n \"drawStyle\": \"lines\",\n \"fillOpacity\": 0,\n \"gradientMode\": \"none\",\n \"lineInterpolation\": \"smooth\",\n \"lineWidth\": 1,\n \"scaleDistribution\": {\n \"type\": \"linear\"\n },\n \"spanNulls\": false,\n \"stack\": \"off\"\n },\n \"datasourceCate\": \"prometheus\",\n \"datasourceValue\": \"${datasource}\",\n \"id\": \"f8795e89-0e61-43ec-9c05-90424bf7eb60\",\n \"layout\": {\n \"h\": 7,\n \"i\": \"f8795e89-0e61-43ec-9c05-90424bf7eb60\",\n \"isResizable\": true,\n \"w\": 7,\n \"x\": 0,\n \"y\": 4\n },\n \"links\": [],\n \"maxPerRow\": 4,\n \"name\": \"当前数据库连接\",\n \"options\": {\n \"legend\": {\n \"behaviour\": \"showItem\",\n \"displayMode\": \"table\"\n },\n \"standardOptions\": {},\n \"thresholds\": {\n \"steps\": [\n {\n \"color\": \"#634CD9\",\n \"type\": \"base\",\n \"value\": null\n }\n ]\n },\n \"tooltip\": {\n \"mode\": \"all\",\n \"sort\": \"none\"\n }\n },\n \"overrides\": [\n {\n \"matcher\": {\n \"id\": \"byFrameRefID\"\n },\n \"properties\": {\n \"rightYAxisDisplay\": \"off\"\n }\n }\n ],\n \"targets\": [\n {\n \"expr\": \"sqlserver_performance_value{counter=\\\"Logical Connections\\\",serverName=\\\"$instance\\\"}\",\n \"legend\": \"{{sql_instance}} \",\n \"maxDataPoints\": 240,\n \"refId\": \"A\"\n }\n ],\n \"transformations\": [\n {\n \"id\": \"organize\",\n \"options\": {}\n }\n ],\n \"type\": \"timeseries\",\n \"version\": \"3.0.0\"\n },\n {\n \"custom\": {\n \"drawStyle\": \"lines\",\n \"fillOpacity\": 0,\n \"gradientMode\": \"none\",\n \"lineInterpolation\": \"linear\",\n \"lineWidth\": 1,\n \"scaleDistribution\": {\n \"type\": \"linear\"\n },\n \"spanNulls\": false,\n \"stack\": \"off\"\n },\n \"datasourceCate\": \"prometheus\",\n \"datasourceValue\": \"${datasource}\",\n \"id\": \"9247c782-4abf-4423-84ba-6453d5491e23\",\n \"layout\": {\n \"h\": 7,\n \"i\": \"9247c782-4abf-4423-84ba-6453d5491e23\",\n \"isResizable\": true,\n \"w\": 9,\n \"x\": 7,\n \"y\": 4\n },\n \"links\": [],\n \"maxPerRow\": 4,\n \"name\": \"DB Log growth since last restart\",\n \"options\": {\n \"legend\": {\n \"behaviour\": \"showItem\",\n \"columns\": [\n \"last\"\n ],\n \"displayMode\": \"list\",\n \"placement\": \"right\"\n },\n \"standardOptions\": {},\n \"thresholds\": {\n \"steps\": [\n {\n \"color\": \"#634CD9\",\n \"type\": \"base\",\n \"value\": null\n }\n ]\n },\n \"tooltip\": {\n \"mode\": \"all\",\n \"sort\": \"none\"\n }\n },\n \"overrides\": [\n {\n \"matcher\": {\n \"id\": \"byFrameRefID\"\n },\n \"properties\": {\n \"rightYAxisDisplay\": \"off\"\n }\n }\n ],\n \"targets\": [\n {\n \"expr\": \"sqlserver_performance_value{counter=\\\"Log Growths\\\",serverName=\\\"$instance\\\"}\",\n \"legend\": \"{{instance}}\",\n \"maxDataPoints\": 240,\n \"refId\": \"A\"\n }\n ],\n \"transformations\": [\n {\n \"id\": \"organize\",\n \"options\": {}\n }\n ],\n \"type\": \"timeseries\",\n \"version\": \"3.0.0\"\n },\n {\n \"custom\": {\n \"drawStyle\": \"lines\",\n \"fillOpacity\": 0,\n \"gradientMode\": \"none\",\n \"lineInterpolation\": \"linear\",\n \"lineWidth\": 1,\n \"scaleDistribution\": {\n \"type\": \"linear\"\n },\n \"spanNulls\": false,\n \"stack\": \"off\"\n },\n \"datasourceCate\": \"prometheus\",\n \"datasourceValue\": \"${datasource}\",\n \"id\": \"47686441-a9d6-4ede-8901-5d05ce3ef8b8\",\n \"layout\": {\n \"h\": 7,\n \"i\": \"47686441-a9d6-4ede-8901-5d05ce3ef8b8\",\n \"isResizable\": true,\n \"w\": 8,\n \"x\": 16,\n \"y\": 4\n },\n \"links\": [],\n \"maxPerRow\": 4,\n \"name\": \"Number of Deadlocks/sec\",\n \"options\": {\n \"legend\": {\n \"behaviour\": \"showItem\",\n \"columns\": [\n \"last\"\n ],\n \"displayMode\": \"list\",\n \"placement\": \"right\"\n },\n \"standardOptions\": {\n \"util\": \"milliseconds\"\n },\n \"thresholds\": {\n \"steps\": [\n {\n \"color\": \"#634CD9\",\n \"type\": \"base\",\n \"value\": null\n }\n ]\n },\n \"tooltip\": {\n \"mode\": \"all\",\n \"sort\": \"none\"\n }\n },\n \"overrides\": [\n {\n \"matcher\": {\n \"id\": \"byFrameRefID\"\n },\n \"properties\": {\n \"rightYAxisDisplay\": \"off\"\n }\n }\n ],\n \"targets\": [\n {\n \"expr\": \"sqlserver_performance_value{counter=\\\"Number of Deadlocks/sec\\\",serverName=\\\"$instance\\\"}\",\n \"legend\": \"Number of Deadlocks/sec\",\n \"maxDataPoints\": 240,\n \"refId\": \"C\"\n }\n ],\n \"transformations\": [\n {\n \"id\": \"organize\",\n \"options\": {}\n }\n ],\n \"type\": \"timeseries\",\n \"version\": \"3.0.0\"\n },\n {\n \"custom\": {\n \"baseColor\": \"#9470FF\",\n \"calc\": \"lastNotNull\",\n \"serieWidth\": 20,\n \"sortOrder\": \"desc\"\n },\n \"datasourceCate\": \"prometheus\",\n \"datasourceValue\": \"${datasource}\",\n \"id\": \"de76a102-cf5e-40b6-9e2d-833446b48ec2\",\n \"layout\": {\n \"h\": 7,\n \"i\": \"28d8f090-b9c1-4bf9-a2ff-fa4f1d3da661\",\n \"isResizable\": true,\n \"w\": 7,\n \"x\": 0,\n \"y\": 11\n },\n \"links\": [],\n \"maxPerRow\": 4,\n \"name\": \"硬盘空闲空间\",\n \"options\": {\n \"standardOptions\": {}\n },\n \"targets\": [\n {\n \"expr\": \"sqlserver_volume_space_available_space_bytes{serverName=\\\"$instance\\\"}\",\n \"instant\": true,\n \"legend\": \"硬盘空闲空间\",\n \"maxDataPoints\": 240,\n \"refId\": \"A\"\n }\n ],\n \"transformations\": [\n {\n \"id\": \"organize\",\n \"options\": {}\n }\n ],\n \"type\": \"barGauge\",\n \"version\": \"3.0.0\"\n },\n {\n \"custom\": {\n \"drawStyle\": \"lines\",\n \"fillOpacity\": 0,\n \"gradientMode\": \"none\",\n \"lineInterpolation\": \"linear\",\n \"lineWidth\": 1,\n \"scaleDistribution\": {\n \"type\": \"linear\"\n },\n \"spanNulls\": false,\n \"stack\": \"off\"\n },\n \"datasourceCate\": \"prometheus\",\n \"datasourceValue\": \"${datasource}\",\n \"id\": \"9f7ac94a-cc31-4a9b-a242-3ef3daaccd9e\",\n \"layout\": {\n \"h\": 7,\n \"i\": \"db5406f3-7877-42b5-a5d8-23d02be39d4f\",\n \"isResizable\": true,\n \"w\": 9,\n \"x\": 7,\n \"y\": 11\n },\n \"links\": [],\n \"maxPerRow\": 4,\n \"name\": \"CPU\",\n \"options\": {\n \"legend\": {\n \"behaviour\": \"showItem\",\n \"columns\": [\n \"last\"\n ],\n \"displayMode\": \"list\",\n \"placement\": \"right\"\n },\n \"standardOptions\": {},\n \"thresholds\": {\n \"steps\": [\n {\n \"color\": \"#634CD9\",\n \"type\": \"base\",\n \"value\": null\n }\n ]\n },\n \"tooltip\": {\n \"mode\": \"all\",\n \"sort\": \"none\"\n }\n },\n \"overrides\": [\n {\n \"matcher\": {\n \"id\": \"byFrameRefID\"\n },\n \"properties\": {\n \"rightYAxisDisplay\": \"off\"\n }\n }\n ],\n \"targets\": [\n {\n \"expr\": \"sqlserver_cpu_sqlserver_process_cpu{serverName=\\\"$instance\\\"}\",\n \"legend\": \"CPU\",\n \"maxDataPoints\": 240,\n \"refId\": \"A\"\n }\n ],\n \"transformations\": [\n {\n \"id\": \"organize\",\n \"options\": {}\n }\n ],\n \"type\": \"timeseries\",\n \"version\": \"3.0.0\"\n },\n {\n \"custom\": {\n \"drawStyle\": \"lines\",\n \"fillOpacity\": 0,\n \"gradientMode\": \"none\",\n \"lineInterpolation\": \"linear\",\n \"lineWidth\": 1,\n \"scaleDistribution\": {\n \"type\": \"linear\"\n },\n \"spanNulls\": false,\n \"stack\": \"off\"\n },\n \"datasourceCate\": \"prometheus\",\n \"datasourceValue\": \"${datasource}\",\n \"id\": \"875eba8d-b99d-462d-99e9-00bd9682e713\",\n \"layout\": {\n \"h\": 7,\n \"i\": \"92d37458-9b5a-4f61-8779-9e5f23e98d27\",\n \"isResizable\": true,\n \"w\": 8,\n \"x\": 16,\n \"y\": 11\n },\n \"links\": [],\n \"maxPerRow\": 4,\n \"name\": \"Total wait time of I/O stall\",\n \"options\": {\n \"legend\": {\n \"behaviour\": \"showItem\",\n \"columns\": [\n \"last\"\n ],\n \"displayMode\": \"list\",\n \"placement\": \"right\"\n },\n \"standardOptions\": {\n \"util\": \"milliseconds\"\n },\n \"thresholds\": {\n \"steps\": [\n {\n \"color\": \"#634CD9\",\n \"type\": \"base\",\n \"value\": null\n }\n ]\n },\n \"tooltip\": {\n \"mode\": \"all\",\n \"sort\": \"none\"\n }\n },\n \"overrides\": [\n {\n \"matcher\": {\n \"id\": \"byFrameRefID\"\n },\n \"properties\": {\n \"rightYAxisDisplay\": \"off\"\n }\n }\n ],\n \"targets\": [\n {\n \"expr\": \"sqlserver_database_io_read_latency_ms{serverName=\\\"$instance\\\",database_name=\\\"h3cloud\\\"}\",\n \"instant\": false,\n \"legend\": \"io_read_latency_ms\",\n \"maxDataPoints\": 240,\n \"refId\": \"A\",\n \"time\": {\n \"end\": \"now\",\n \"start\": \"now-1h\"\n }\n }\n ],\n \"transformations\": [\n {\n \"id\": \"organize\",\n \"options\": {}\n }\n ],\n \"type\": \"timeseries\",\n \"version\": \"3.0.0\"\n },\n {\n \"collapsed\": true,\n \"id\": \"bb996a6d-ddec-46c3-8c64-dd2a57a13fd4\",\n \"layout\": {\n \"h\": 1,\n \"i\": \"bb996a6d-ddec-46c3-8c64-dd2a57a13fd4\",\n \"isResizable\": false,\n \"w\": 24,\n \"x\": 0,\n \"y\": 18\n },\n \"name\": \"Database I/O wait of stall detailed\",\n \"panels\": [],\n \"type\": \"row\",\n \"version\": \"3.0.0\"\n },\n {\n \"custom\": {\n \"drawStyle\": \"lines\",\n \"fillOpacity\": 0,\n \"gradientMode\": \"none\",\n \"lineInterpolation\": \"linear\",\n \"lineWidth\": 1,\n \"scaleDistribution\": {\n \"type\": \"linear\"\n },\n \"spanNulls\": false,\n \"stack\": \"off\"\n },\n \"datasourceCate\": \"prometheus\",\n \"datasourceValue\": \"${datasource}\",\n \"description\": \"\",\n \"id\": \"9c5037d4-563c-412f-b4e9-103d90ecc62d\",\n \"layout\": {\n \"h\": 8,\n \"i\": \"9c5037d4-563c-412f-b4e9-103d90ecc62d\",\n \"isResizable\": true,\n \"w\": 24,\n \"x\": 0,\n \"y\": 19\n },\n \"links\": [],\n \"maxPerRow\": 3,\n \"name\": \"Database wait by I/O stall \",\n \"options\": {\n \"legend\": {\n \"behaviour\": \"showItem\",\n \"columns\": [\n \"last\"\n ],\n \"displayMode\": \"list\",\n \"placement\": \"right\"\n },\n \"standardOptions\": {\n \"util\": \"milliseconds\"\n },\n \"thresholds\": {\n \"steps\": [\n {\n \"color\": \"#634CD9\",\n \"type\": \"base\",\n \"value\": null\n }\n ]\n },\n \"tooltip\": {\n \"mode\": \"all\",\n \"sort\": \"none\"\n }\n },\n \"overrides\": [\n {\n \"matcher\": {\n \"id\": \"byFrameRefID\"\n },\n \"properties\": {\n \"rightYAxisDisplay\": \"off\"\n }\n }\n ],\n \"repeat\": \"database\",\n \"targets\": [\n {\n \"expr\": \"sqlserver_database_io_rg_write_stall_ms{serverName=\\\"$instance\\\"}+sqlserver_database_io_rg_read_stall_ms{serverName=\\\"$instance\\\"}\",\n \"legend\": \"{{database_name}}\",\n \"maxDataPoints\": 240,\n \"refId\": \"A\"\n }\n ],\n \"transformations\": [\n {\n \"id\": \"organize\",\n \"options\": {}\n }\n ],\n \"type\": \"timeseries\",\n \"version\": \"3.0.0\"\n }\n ],\n \"var\": [\n {\n \"definition\": \"prometheus\",\n \"label\": \"DS_PROMETHEUS\",\n \"name\": \"datasource\",\n \"type\": \"datasource\"\n },\n {\n \"datasource\": {\n \"cate\": \"prometheus\",\n \"value\": \"${datasource}\"\n },\n \"definition\": \"label_values(sqlserver_up,sql_instance)\",\n \"name\": \"instance\",\n \"type\": \"query\"\n }\n ],\n \"version\": \"3.0.0\"\n },\n \"public\": 0,\n \"public_cate\": 0,\n \"bgids\": null,\n \"built_in\": 0,\n \"hide\": 0,\n \"uuid\": 1717556328380733000\n}"
},
{
"path": "integrations/SQLServer/markdown/README.md",
"content": "# sqlserver\n\nforked from telegraf/sqlserver. 这个插件的作用是获取sqlserver的监控指标,这里去掉了Azure相关部分监控,只保留了本地部署sqlserver情况。\n\n# 使用\n按照下面方法创建监控账号,用于读取监控数据\nUSE master;\n\nCREATE LOGIN [categraf] WITH PASSWORD = N'mystrongpassword';\n\nGRANT VIEW SERVER STATE TO [categraf];\n\nGRANT VIEW ANY DEFINITION TO [categraf];\nData Source=10.19.1.1;Initial Catalog=hc;User ID=sa;Password=mystrongpassword;"
},
{
"path": "integrations/SpringBoot/alerts/alerts.json",
"content": "[\n {\n \"id\": 0,\n \"group_id\": 0,\n \"cate\": \"prometheus\",\n \"datasource_ids\": [\n 0\n ],\n \"cluster\": \"\",\n \"name\": \"springboot HEAP内存使用率大于20%\",\n \"note\": \"\",\n \"prod\": \"metric\",\n \"algorithm\": \"\",\n \"algo_params\": null,\n \"delay\": 0,\n \"severity\": 0,\n \"severities\": [\n 2\n ],\n \"disabled\": 0,\n \"prom_for_duration\": 60,\n \"prom_ql\": \"\",\n \"rule_config\": {\n \"queries\": [\n {\n \"prom_ql\": \"sum(jvm_memory_used_bytes{instance=~\\\".+\\\", area=\\\"heap\\\"})*100/sum(jvm_memory_max_bytes{instance=~\\\".+\\\", area=\\\"heap\\\"}) \\u003e20\",\n \"severity\": 2\n }\n ]\n },\n \"prom_eval_interval\": 30,\n \"enable_stime\": \"00:00\",\n \"enable_stimes\": [\n \"00:00\"\n ],\n \"enable_etime\": \"23:59\",\n \"enable_etimes\": [\n \"23:59\"\n ],\n \"enable_days_of_week\": [\n \"0\",\n \"1\",\n \"2\",\n \"3\",\n \"4\",\n \"5\",\n \"6\"\n ],\n \"enable_days_of_weeks\": [\n [\n \"0\",\n \"1\",\n \"2\",\n \"3\",\n \"4\",\n \"5\",\n \"6\"\n ]\n ],\n \"enable_in_bg\": 0,\n \"notify_recovered\": 1,\n \"notify_channels\": [],\n \"notify_groups_obj\": null,\n \"notify_groups\": null,\n \"notify_repeat_step\": 60,\n \"notify_max_number\": 0,\n \"recover_duration\": 0,\n \"callbacks\": [],\n \"runbook_url\": \"\",\n \"append_tags\": [],\n \"annotations\": {},\n \"extra_config\": null,\n \"create_at\": 0,\n \"create_by\": \"\",\n \"update_at\": 0,\n \"update_by\": \"\",\n \"uuid\": 1717556328389228000\n },\n {\n \"id\": 0,\n \"group_id\": 0,\n \"cate\": \"prometheus\",\n \"datasource_ids\": [\n 0\n ],\n \"cluster\": \"\",\n \"name\": \"springboot HTTP请求延迟大于10s\",\n \"note\": \"\",\n \"prod\": \"metric\",\n \"algorithm\": \"\",\n \"algo_params\": null,\n \"delay\": 0,\n \"severity\": 0,\n \"severities\": [\n 2\n ],\n \"disabled\": 0,\n \"prom_for_duration\": 60,\n \"prom_ql\": \"\",\n \"rule_config\": {\n \"queries\": [\n {\n \"prom_ql\": \"max(http_server_requests_seconds_max{instance=~\\\".+\\\", status!~\\\"5..\\\"}) \\u003e 10\",\n \"severity\": 2\n }\n ]\n },\n \"prom_eval_interval\": 30,\n \"enable_stime\": \"00:00\",\n \"enable_stimes\": [\n \"00:00\"\n ],\n \"enable_etime\": \"23:59\",\n \"enable_etimes\": [\n \"23:59\"\n ],\n \"enable_days_of_week\": [\n \"0\",\n \"1\",\n \"2\",\n \"3\",\n \"4\",\n \"5\",\n \"6\"\n ],\n \"enable_days_of_weeks\": [\n [\n \"0\",\n \"1\",\n \"2\",\n \"3\",\n \"4\",\n \"5\",\n \"6\"\n ]\n ],\n \"enable_in_bg\": 0,\n \"notify_recovered\": 1,\n \"notify_channels\": [],\n \"notify_groups_obj\": null,\n \"notify_groups\": null,\n \"notify_repeat_step\": 60,\n \"notify_max_number\": 0,\n \"recover_duration\": 0,\n \"callbacks\": [],\n \"runbook_url\": \"\",\n \"append_tags\": [],\n \"annotations\": {},\n \"extra_config\": null,\n \"create_at\": 0,\n \"create_by\": \"\",\n \"update_at\": 0,\n \"update_by\": \"\",\n \"uuid\": 1717556328389834000\n },\n {\n \"id\": 0,\n \"group_id\": 0,\n \"cate\": \"prometheus\",\n \"datasource_ids\": [\n 0\n ],\n \"cluster\": \"\",\n \"name\": \"springboot HTTP错误数\",\n \"note\": \"\",\n \"prod\": \"metric\",\n \"algorithm\": \"\",\n \"algo_params\": null,\n \"delay\": 0,\n \"severity\": 0,\n \"severities\": [\n 2\n ],\n \"disabled\": 0,\n \"prom_for_duration\": 60,\n \"prom_ql\": \"\",\n \"rule_config\": {\n \"queries\": [\n {\n \"prom_ql\": \"sum(rate(http_server_requests_seconds_count{instance=~\\\".+\\\", status=~\\\"5.+\\\"}[1m])) != 0\",\n \"severity\": 2\n }\n ]\n },\n \"prom_eval_interval\": 30,\n \"enable_stime\": \"00:00\",\n \"enable_stimes\": [\n \"00:00\"\n ],\n \"enable_etime\": \"23:59\",\n \"enable_etimes\": [\n \"23:59\"\n ],\n \"enable_days_of_week\": [\n \"0\",\n \"1\",\n \"2\",\n \"3\",\n \"4\",\n \"5\",\n \"6\"\n ],\n \"enable_days_of_weeks\": [\n [\n \"0\",\n \"1\",\n \"2\",\n \"3\",\n \"4\",\n \"5\",\n \"6\"\n ]\n ],\n \"enable_in_bg\": 0,\n \"notify_recovered\": 1,\n \"notify_channels\": [],\n \"notify_groups_obj\": null,\n \"notify_groups\": null,\n \"notify_repeat_step\": 60,\n \"notify_max_number\": 0,\n \"recover_duration\": 0,\n \"callbacks\": [],\n \"runbook_url\": \"\",\n \"append_tags\": [],\n \"annotations\": {},\n \"extra_config\": null,\n \"create_at\": 0,\n \"create_by\": \"\",\n \"update_at\": 0,\n \"update_by\": \"\",\n \"uuid\": 1717556328390482000\n },\n {\n \"id\": 0,\n \"group_id\": 0,\n \"cate\": \"prometheus\",\n \"datasource_ids\": [\n 0\n ],\n \"cluster\": \"\",\n \"name\": \"springboot NOHEAP内存使用率大于30%\",\n \"note\": \"\",\n \"prod\": \"metric\",\n \"algorithm\": \"\",\n \"algo_params\": null,\n \"delay\": 0,\n \"severity\": 0,\n \"severities\": [\n 2\n ],\n \"disabled\": 0,\n \"prom_for_duration\": 60,\n \"prom_ql\": \"\",\n \"rule_config\": {\n \"queries\": [\n {\n \"prom_ql\": \"sum(jvm_memory_used_bytes{instance=~\\\".+\\\", area=\\\"nonheap\\\"})*100/sum(jvm_memory_max_bytes{instance=~\\\".+\\\", area=\\\"nonheap\\\"}) \\u003e 30\",\n \"severity\": 2\n }\n ]\n },\n \"prom_eval_interval\": 30,\n \"enable_stime\": \"00:00\",\n \"enable_stimes\": [\n \"00:00\"\n ],\n \"enable_etime\": \"23:59\",\n \"enable_etimes\": [\n \"23:59\"\n ],\n \"enable_days_of_week\": [\n \"0\",\n \"1\",\n \"2\",\n \"3\",\n \"4\",\n \"5\",\n \"6\"\n ],\n \"enable_days_of_weeks\": [\n [\n \"0\",\n \"1\",\n \"2\",\n \"3\",\n \"4\",\n \"5\",\n \"6\"\n ]\n ],\n \"enable_in_bg\": 0,\n \"notify_recovered\": 1,\n \"notify_channels\": [],\n \"notify_groups_obj\": null,\n \"notify_groups\": null,\n \"notify_repeat_step\": 60,\n \"notify_max_number\": 0,\n \"recover_duration\": 0,\n \"callbacks\": [],\n \"runbook_url\": \"\",\n \"append_tags\": [],\n \"annotations\": {},\n \"extra_config\": null,\n \"create_at\": 0,\n \"create_by\": \"\",\n \"update_at\": 0,\n \"update_by\": \"\",\n \"uuid\": 1717556328391132000\n },\n {\n \"id\": 0,\n \"group_id\": 0,\n \"cate\": \"prometheus\",\n \"datasource_ids\": [\n 0\n ],\n \"cluster\": \"\",\n \"name\": \"springboot 事件错误数\",\n \"note\": \"\",\n \"prod\": \"metric\",\n \"algorithm\": \"\",\n \"algo_params\": null,\n \"delay\": 0,\n \"severity\": 0,\n \"severities\": [\n 2\n ],\n \"disabled\": 0,\n \"prom_for_duration\": 60,\n \"prom_ql\": \"\",\n \"rule_config\": {\n \"queries\": [\n {\n \"prom_ql\": \"increase(logback_events_total{instance=\\\"$instance\\\"}[1m]) \\u003e 0\",\n \"severity\": 2\n }\n ]\n },\n \"prom_eval_interval\": 30,\n \"enable_stime\": \"00:00\",\n \"enable_stimes\": [\n \"00:00\"\n ],\n \"enable_etime\": \"23:59\",\n \"enable_etimes\": [\n \"23:59\"\n ],\n \"enable_days_of_week\": [\n \"0\",\n \"1\",\n \"2\",\n \"3\",\n \"4\",\n \"5\",\n \"6\"\n ],\n \"enable_days_of_weeks\": [\n [\n \"0\",\n \"1\",\n \"2\",\n \"3\",\n \"4\",\n \"5\",\n \"6\"\n ]\n ],\n \"enable_in_bg\": 0,\n \"notify_recovered\": 1,\n \"notify_channels\": [],\n \"notify_groups_obj\": null,\n \"notify_groups\": null,\n \"notify_repeat_step\": 60,\n \"notify_max_number\": 0,\n \"recover_duration\": 0,\n \"callbacks\": [],\n \"runbook_url\": \"\",\n \"append_tags\": [],\n \"annotations\": {},\n \"extra_config\": null,\n \"create_at\": 0,\n \"create_by\": \"\",\n \"update_at\": 0,\n \"update_by\": \"\",\n \"uuid\": 1717556328391712000\n }\n]"
},
{
"path": "integrations/SpringBoot/dashboards/JVM(Actuator)withapplicationname.json",
"content": "{\n \"id\": 0,\n \"group_id\": 0,\n \"name\": \"JVM (Actuator) with application name\",\n \"ident\": \"\",\n \"tags\": \"\",\n \"create_at\": 0,\n \"create_by\": \"\",\n \"update_at\": 0,\n \"update_by\": \"\",\n \"configs\": {\n \"links\": [],\n \"panels\": [\n {\n \"collapsed\": true,\n \"id\": \"98ba9b06-9d1e-44b9-a626-f4e704cc39ac\",\n \"layout\": {\n \"h\": 1,\n \"i\": \"98ba9b06-9d1e-44b9-a626-f4e704cc39ac\",\n \"isResizable\": false,\n \"w\": 24,\n \"x\": 0,\n \"y\": 0\n },\n \"name\": \"Quick Facts\",\n \"panels\": [],\n \"type\": \"row\",\n \"version\": \"3.0.0\"\n },\n {\n \"custom\": {\n \"calc\": \"lastNotNull\",\n \"colSpan\": 1,\n \"colorMode\": \"value\",\n \"graphMode\": \"none\",\n \"textMode\": \"value\",\n \"textSize\": {},\n \"valueField\": \"Value\"\n },\n \"datasourceCate\": \"prometheus\",\n \"datasourceValue\": \"${datasource}\",\n \"id\": \"c325f6ba-bca2-42f1-a518-1d3077b54a54\",\n \"layout\": {\n \"h\": 3,\n \"i\": \"c325f6ba-bca2-42f1-a518-1d3077b54a54\",\n \"isResizable\": true,\n \"w\": 6,\n \"x\": 0,\n \"y\": 1\n },\n \"links\": [],\n \"maxPerRow\": 4,\n \"name\": \"Start time\",\n \"options\": {\n \"standardOptions\": {\n \"util\": \"datetimeMilliseconds\"\n },\n \"thresholds\": {\n \"steps\": [\n {\n \"color\": \"#634CD9\",\n \"type\": \"base\",\n \"value\": null\n }\n ]\n }\n },\n \"targets\": [\n {\n \"expr\": \"process_start_time_seconds{instance=\\\"$instance\\\"}*1000\",\n \"legend\": \"\",\n \"refId\": \"A\"\n }\n ],\n \"transformations\": [\n {\n \"id\": \"organize\",\n \"options\": {}\n }\n ],\n \"type\": \"stat\",\n \"version\": \"3.0.0\"\n },\n {\n \"custom\": {\n \"calc\": \"lastNotNull\",\n \"colSpan\": 1,\n \"colorMode\": \"value\",\n \"graphMode\": \"none\",\n \"textMode\": \"value\",\n \"textSize\": {},\n \"valueField\": \"Value\"\n },\n \"datasourceCate\": \"prometheus\",\n \"datasourceValue\": \"${datasource}\",\n \"id\": \"03627849-92c0-4a5c-9558-738dc6bd6186\",\n \"layout\": {\n \"h\": 3,\n \"i\": \"03627849-92c0-4a5c-9558-738dc6bd6186\",\n \"isResizable\": true,\n \"w\": 6,\n \"x\": 12,\n \"y\": 1\n },\n \"links\": [],\n \"maxPerRow\": 4,\n \"name\": \"Heap used\",\n \"options\": {\n \"standardOptions\": {\n \"util\": \"percent\"\n },\n \"thresholds\": {\n \"steps\": [\n {\n \"color\": \"#634CD9\",\n \"type\": \"base\",\n \"value\": null\n }\n ]\n }\n },\n \"targets\": [\n {\n \"expr\": \"sum(jvm_memory_used_bytes{instance=\\\"$instance\\\", area=\\\"heap\\\"})*100/sum(jvm_memory_max_bytes{instance=\\\"$instance\\\", area=\\\"heap\\\"})\",\n \"legend\": \"\",\n \"refId\": \"A\"\n }\n ],\n \"transformations\": [\n {\n \"id\": \"organize\",\n \"options\": {}\n }\n ],\n \"type\": \"stat\",\n \"version\": \"3.0.0\"\n },\n {\n \"custom\": {\n \"calc\": \"lastNotNull\",\n \"colSpan\": 1,\n \"colorMode\": \"value\",\n \"graphMode\": \"none\",\n \"textMode\": \"value\",\n \"textSize\": {},\n \"valueField\": \"Value\"\n },\n \"datasourceCate\": \"prometheus\",\n \"datasourceValue\": \"${datasource}\",\n \"id\": \"4e85e1c3-9623-4e1c-bbb2-a4824455c5b3\",\n \"layout\": {\n \"h\": 3,\n \"i\": \"4e85e1c3-9623-4e1c-bbb2-a4824455c5b3\",\n \"isResizable\": true,\n \"w\": 6,\n \"x\": 18,\n \"y\": 1\n },\n \"links\": [],\n \"maxPerRow\": 4,\n \"name\": \"Non-Heap used\",\n \"options\": {\n \"standardOptions\": {\n \"util\": \"percent\"\n },\n \"thresholds\": {\n \"steps\": [\n {\n \"color\": \"#634CD9\",\n \"type\": \"base\",\n \"value\": null\n }\n ]\n }\n },\n \"targets\": [\n {\n \"expr\": \"sum(jvm_memory_used_bytes{instance=\\\"$instance\\\", area=\\\"nonheap\\\"})*100/sum(jvm_memory_max_bytes{instance=\\\"$instance\\\", area=\\\"nonheap\\\"})\",\n \"legend\": \"\",\n \"refId\": \"A\"\n }\n ],\n \"transformations\": [\n {\n \"id\": \"organize\",\n \"options\": {}\n }\n ],\n \"type\": \"stat\",\n \"version\": \"3.0.0\"\n },\n {\n \"custom\": {\n \"calc\": \"lastNotNull\",\n \"colSpan\": 1,\n \"colorMode\": \"value\",\n \"graphMode\": \"none\",\n \"textMode\": \"value\",\n \"textSize\": {},\n \"valueField\": \"Value\"\n },\n \"datasourceCate\": \"prometheus\",\n \"datasourceValue\": \"${datasource}\",\n \"id\": \"95bc69c0-0b29-4dc5-8404-c0ca0741918f\",\n \"layout\": {\n \"h\": 3,\n \"i\": \"95bc69c0-0b29-4dc5-8404-c0ca0741918f\",\n \"isResizable\": true,\n \"w\": 6,\n \"x\": 6,\n \"y\": 2\n },\n \"links\": [],\n \"maxPerRow\": 4,\n \"name\": \"Uptime\",\n \"options\": {\n \"standardOptions\": {\n \"util\": \"humantimeSeconds\"\n },\n \"thresholds\": {\n \"steps\": [\n {\n \"color\": \"#634CD9\",\n \"type\": \"base\",\n \"value\": null\n }\n ]\n }\n },\n \"targets\": [\n {\n \"expr\": \"process_uptime_seconds{instance=\\\"$instance\\\"}\",\n \"legend\": \"\",\n \"refId\": \"A\"\n }\n ],\n \"transformations\": [\n {\n \"id\": \"organize\",\n \"options\": {}\n }\n ],\n \"type\": \"stat\",\n \"version\": \"3.0.0\"\n },\n {\n \"collapsed\": true,\n \"id\": \"abe6c0c1-8b88-450a-908f-0f51cc973761\",\n \"layout\": {\n \"h\": 1,\n \"i\": \"abe6c0c1-8b88-450a-908f-0f51cc973761\",\n \"isResizable\": false,\n \"w\": 24,\n \"x\": 0,\n \"y\": 5\n },\n \"name\": \"I/O Overview\",\n \"panels\": [],\n \"type\": \"row\",\n \"version\": \"3.0.0\"\n },\n {\n \"custom\": {\n \"drawStyle\": \"lines\",\n \"fillOpacity\": 0.3,\n \"gradientMode\": \"opacity\",\n \"lineInterpolation\": \"linear\",\n \"lineWidth\": 2,\n \"scaleDistribution\": {\n \"type\": \"linear\"\n },\n \"spanNulls\": false,\n \"stack\": \"off\"\n },\n \"datasourceCate\": \"prometheus\",\n \"datasourceValue\": \"${datasource}\",\n \"id\": \"4d5bedf5-2b3c-425b-a4be-b5e7f36300af\",\n \"layout\": {\n \"h\": 7,\n \"i\": \"4d5bedf5-2b3c-425b-a4be-b5e7f36300af\",\n \"isResizable\": true,\n \"w\": 6,\n \"x\": 0,\n \"y\": 6\n },\n \"links\": [],\n \"maxPerRow\": 4,\n \"name\": \"Rate\",\n \"options\": {\n \"legend\": {\n \"behaviour\": \"showItem\",\n \"displayMode\": \"hidden\"\n },\n \"standardOptions\": {},\n \"thresholds\": {\n \"steps\": [\n {\n \"color\": \"#634CD9\",\n \"type\": \"base\",\n \"value\": null\n }\n ]\n },\n \"tooltip\": {\n \"mode\": \"all\",\n \"sort\": \"none\"\n }\n },\n \"overrides\": [\n {\n \"matcher\": {\n \"id\": \"byFrameRefID\"\n },\n \"properties\": {\n \"rightYAxisDisplay\": \"off\"\n }\n }\n ],\n \"targets\": [\n {\n \"expr\": \"sum(rate(http_server_requests_seconds_count{instance=\\\"$instance\\\"}[5m]))\",\n \"legend\": \"HTTP\",\n \"refId\": \"A\"\n }\n ],\n \"transformations\": [\n {\n \"id\": \"organize\",\n \"options\": {}\n }\n ],\n \"type\": \"timeseries\",\n \"version\": \"3.0.0\"\n },\n {\n \"custom\": {\n \"drawStyle\": \"lines\",\n \"fillOpacity\": 0.3,\n \"gradientMode\": \"opacity\",\n \"lineInterpolation\": \"linear\",\n \"lineWidth\": 2,\n \"scaleDistribution\": {\n \"type\": \"linear\"\n },\n \"spanNulls\": false,\n \"stack\": \"off\"\n },\n \"datasourceCate\": \"prometheus\",\n \"datasourceValue\": \"${datasource}\",\n \"id\": \"68f7255b-6637-4967-906d-a6d4c9a61d88\",\n \"layout\": {\n \"h\": 7,\n \"i\": \"68f7255b-6637-4967-906d-a6d4c9a61d88\",\n \"isResizable\": true,\n \"w\": 6,\n \"x\": 6,\n \"y\": 6\n },\n \"links\": [],\n \"maxPerRow\": 4,\n \"name\": \"Errors\",\n \"options\": {\n \"legend\": {\n \"displayMode\": \"hidden\"\n },\n \"standardOptions\": {},\n \"thresholds\": {\n \"steps\": [\n {\n \"color\": \"#634CD9\",\n \"type\": \"base\",\n \"value\": null\n }\n ]\n },\n \"tooltip\": {\n \"mode\": \"all\",\n \"sort\": \"none\"\n }\n },\n \"targets\": [\n {\n \"expr\": \"sum(rate(http_server_requests_seconds_count{instance=\\\"$instance\\\", status=~\\\"5..\\\"}[1m]))\",\n \"legend\": \"HTTP - 5xx\",\n \"refId\": \"A\"\n }\n ],\n \"transformations\": [\n {\n \"id\": \"organize\",\n \"options\": {}\n }\n ],\n \"type\": \"timeseries\",\n \"version\": \"3.0.0\"\n },\n {\n \"custom\": {\n \"drawStyle\": \"lines\",\n \"fillOpacity\": 0.3,\n \"gradientMode\": \"opacity\",\n \"lineInterpolation\": \"linear\",\n \"lineWidth\": 2,\n \"scaleDistribution\": {\n \"type\": \"linear\"\n },\n \"spanNulls\": false,\n \"stack\": \"off\"\n },\n \"datasourceCate\": \"prometheus\",\n \"datasourceValue\": \"${datasource}\",\n \"id\": \"07d11fe1-7005-420f-bbfc-16f304294ef7\",\n \"layout\": {\n \"h\": 7,\n \"i\": \"07d11fe1-7005-420f-bbfc-16f304294ef7\",\n \"isResizable\": true,\n \"w\": 6,\n \"x\": 12,\n \"y\": 6\n },\n \"links\": [],\n \"maxPerRow\": 4,\n \"name\": \"Duration\",\n \"options\": {\n \"legend\": {\n \"displayMode\": \"hidden\"\n },\n \"standardOptions\": {},\n \"thresholds\": {\n \"steps\": [\n {\n \"color\": \"#634CD9\",\n \"type\": \"base\",\n \"value\": null\n }\n ]\n },\n \"tooltip\": {\n \"mode\": \"all\",\n \"sort\": \"none\"\n }\n },\n \"targets\": [\n {\n \"expr\": \"sum(rate(http_server_requests_seconds_sum{instance=\\\"$instance\\\", status!~\\\"5..\\\"}[1m]))/sum(rate(http_server_requests_seconds_count{instance=\\\"$instance\\\", status!~\\\"5..\\\"}[1m]))\",\n \"legend\": \"HTTP - AVG\",\n \"refId\": \"A\"\n },\n {\n \"expr\": \"max(http_server_requests_seconds_max{instance=\\\"$instance\\\", status!~\\\"5..\\\"})\",\n \"legend\": \"HTTP - MAX\",\n \"refId\": \"B\"\n }\n ],\n \"transformations\": [\n {\n \"id\": \"organize\",\n \"options\": {}\n }\n ],\n \"type\": \"timeseries\",\n \"version\": \"3.0.0\"\n },\n {\n \"custom\": {\n \"drawStyle\": \"lines\",\n \"fillOpacity\": 0.3,\n \"gradientMode\": \"opacity\",\n \"lineInterpolation\": \"linear\",\n \"lineWidth\": 2,\n \"scaleDistribution\": {\n \"type\": \"linear\"\n },\n \"spanNulls\": false,\n \"stack\": \"off\"\n },\n \"datasourceCate\": \"prometheus\",\n \"datasourceValue\": \"${datasource}\",\n \"description\": \"\",\n \"id\": \"caf07cdd-42e4-427b-b511-ee967246330a\",\n \"layout\": {\n \"h\": 7,\n \"i\": \"caf07cdd-42e4-427b-b511-ee967246330a\",\n \"isResizable\": true,\n \"w\": 6,\n \"x\": 18,\n \"y\": 6\n },\n \"links\": [],\n \"maxPerRow\": 4,\n \"name\": \"Utilisation\",\n \"options\": {\n \"legend\": {\n \"displayMode\": \"hidden\"\n },\n \"standardOptions\": {},\n \"thresholds\": {\n \"steps\": [\n {\n \"color\": \"#634CD9\",\n \"type\": \"base\",\n \"value\": null\n }\n ]\n },\n \"tooltip\": {\n \"mode\": \"all\",\n \"sort\": \"none\"\n }\n },\n \"targets\": [\n {\n \"expr\": \"tomcat_threads_busy{instance=\\\"$instance\\\"} or tomcat_threads_busy_threads{instance=\\\"$instance\\\"}\",\n \"legend\": \"TOMCAT - BSY\",\n \"refId\": \"A\"\n },\n {\n \"expr\": \"tomcat_threads_current{instance=\\\"$instance\\\"} or tomcat_threads_current_threads{instance=\\\"$instance\\\"}\",\n \"legend\": \"TOMCAT - CUR\",\n \"refId\": \"B\"\n },\n {\n \"expr\": \"tomcat_threads_config_max{instance=\\\"$instance\\\"} or tomcat_threads_config_max_threads{instance=\\\"$instance\\\"}\",\n \"legend\": \"TOMCAT - MAX\",\n \"refId\": \"C\"\n },\n {\n \"expr\": \"jetty_threads_busy{instance=\\\"$instance\\\"}\",\n \"legend\": \"JETTY - BSY\",\n \"refId\": \"D\"\n },\n {\n \"expr\": \"jetty_threads_current{instance=\\\"$instance\\\"}\",\n \"legend\": \"JETTY - CUR\",\n \"refId\": \"E\"\n },\n {\n \"expr\": \"jetty_threads_config_max{instance=\\\"$instance\\\"}\",\n \"legend\": \"JETTY - MAX\",\n \"refId\": \"F\"\n }\n ],\n \"transformations\": [\n {\n \"id\": \"organize\",\n \"options\": {}\n }\n ],\n \"type\": \"timeseries\",\n \"version\": \"3.0.0\"\n },\n {\n \"collapsed\": true,\n \"id\": \"83e3307c-b862-471b-a14f-9f88c8b67dbf\",\n \"layout\": {\n \"h\": 1,\n \"i\": \"83e3307c-b862-471b-a14f-9f88c8b67dbf\",\n \"isResizable\": false,\n \"w\": 24,\n \"x\": 0,\n \"y\": 13\n },\n \"name\": \"JVM Memory\",\n \"panels\": [],\n \"type\": \"row\",\n \"version\": \"3.0.0\"\n },\n {\n \"custom\": {\n \"drawStyle\": \"lines\",\n \"fillOpacity\": 0.3,\n \"gradientMode\": \"opacity\",\n \"lineInterpolation\": \"linear\",\n \"lineWidth\": 2,\n \"scaleDistribution\": {\n \"type\": \"linear\"\n },\n \"spanNulls\": false,\n \"stack\": \"off\"\n },\n \"datasourceCate\": \"prometheus\",\n \"datasourceValue\": \"${datasource}\",\n \"id\": \"1aeab3d4-de80-4795-ae7e-57c9b085a074\",\n \"layout\": {\n \"h\": 7,\n \"i\": \"1aeab3d4-de80-4795-ae7e-57c9b085a074\",\n \"isResizable\": true,\n \"w\": 6,\n \"x\": 0,\n \"y\": 14\n },\n \"links\": [],\n \"maxPerRow\": 4,\n \"name\": \"JVM Heap\",\n \"options\": {\n \"legend\": {\n \"displayMode\": \"hidden\"\n },\n \"standardOptions\": {},\n \"thresholds\": {\n \"steps\": [\n {\n \"color\": \"#634CD9\",\n \"type\": \"base\",\n \"value\": null\n }\n ]\n },\n \"tooltip\": {\n \"mode\": \"all\",\n \"sort\": \"none\"\n }\n },\n \"targets\": [\n {\n \"expr\": \"sum(jvm_memory_used_bytes{instance=\\\"$instance\\\", area=\\\"heap\\\"})\",\n \"legend\": \"used\",\n \"refId\": \"A\"\n },\n {\n \"expr\": \"sum(jvm_memory_committed_bytes{instance=\\\"$instance\\\", area=\\\"heap\\\"})\",\n \"legend\": \"committed\",\n \"refId\": \"B\"\n },\n {\n \"expr\": \"sum(jvm_memory_max_bytes{instance=\\\"$instance\\\", area=\\\"heap\\\"})\",\n \"legend\": \"max\",\n \"refId\": \"C\"\n }\n ],\n \"transformations\": [\n {\n \"id\": \"organize\",\n \"options\": {}\n }\n ],\n \"type\": \"timeseries\",\n \"version\": \"3.0.0\"\n },\n {\n \"custom\": {\n \"drawStyle\": \"lines\",\n \"fillOpacity\": 0.3,\n \"gradientMode\": \"opacity\",\n \"lineInterpolation\": \"linear\",\n \"lineWidth\": 2,\n \"scaleDistribution\": {\n \"type\": \"linear\"\n },\n \"spanNulls\": false,\n \"stack\": \"off\"\n },\n \"datasourceCate\": \"prometheus\",\n \"datasourceValue\": \"${datasource}\",\n \"id\": \"dd9a63b6-9a33-416f-8dbe-dbbae1ff3fed\",\n \"layout\": {\n \"h\": 7,\n \"i\": \"dd9a63b6-9a33-416f-8dbe-dbbae1ff3fed\",\n \"isResizable\": true,\n \"w\": 6,\n \"x\": 6,\n \"y\": 14\n },\n \"links\": [],\n \"maxPerRow\": 4,\n \"name\": \"JVM Non-Heap\",\n \"options\": {\n \"legend\": {\n \"displayMode\": \"hidden\"\n },\n \"standardOptions\": {},\n \"thresholds\": {\n \"steps\": [\n {\n \"color\": \"#634CD9\",\n \"type\": \"base\",\n \"value\": null\n }\n ]\n },\n \"tooltip\": {\n \"mode\": \"all\",\n \"sort\": \"none\"\n }\n },\n \"targets\": [\n {\n \"expr\": \"sum(jvm_memory_used_bytes{instance=\\\"$instance\\\", area=\\\"nonheap\\\"})\",\n \"legend\": \"used\",\n \"refId\": \"A\"\n },\n {\n \"expr\": \"sum(jvm_memory_committed_bytes{instance=\\\"$instance\\\", area=\\\"nonheap\\\"})\",\n \"legend\": \"committed\",\n \"refId\": \"B\"\n },\n {\n \"expr\": \"sum(jvm_memory_max_bytes{instance=\\\"$instance\\\", area=\\\"nonheap\\\"})\",\n \"legend\": \"max\",\n \"refId\": \"C\"\n }\n ],\n \"transformations\": [\n {\n \"id\": \"organize\",\n \"options\": {}\n }\n ],\n \"type\": \"timeseries\",\n \"version\": \"3.0.0\"\n },\n {\n \"custom\": {\n \"drawStyle\": \"lines\",\n \"fillOpacity\": 0.3,\n \"gradientMode\": \"opacity\",\n \"lineInterpolation\": \"linear\",\n \"lineWidth\": 2,\n \"scaleDistribution\": {\n \"type\": \"linear\"\n },\n \"spanNulls\": false,\n \"stack\": \"off\"\n },\n \"datasourceCate\": \"prometheus\",\n \"datasourceValue\": \"${datasource}\",\n \"id\": \"df058502-188f-4711-b1da-3240a39cb35b\",\n \"layout\": {\n \"h\": 7,\n \"i\": \"df058502-188f-4711-b1da-3240a39cb35b\",\n \"isResizable\": true,\n \"w\": 6,\n \"x\": 12,\n \"y\": 14\n },\n \"links\": [],\n \"maxPerRow\": 4,\n \"name\": \"JVM Total\",\n \"options\": {\n \"legend\": {\n \"displayMode\": \"hidden\"\n },\n \"standardOptions\": {},\n \"thresholds\": {\n \"steps\": [\n {\n \"color\": \"#634CD9\",\n \"type\": \"base\",\n \"value\": null\n }\n ]\n },\n \"tooltip\": {\n \"mode\": \"all\",\n \"sort\": \"none\"\n }\n },\n \"targets\": [\n {\n \"expr\": \"sum(jvm_memory_used_bytes{instance=\\\"$instance\\\"})\",\n \"legend\": \"used\",\n \"refId\": \"A\"\n },\n {\n \"expr\": \"sum(jvm_memory_committed_bytes{instance=\\\"$instance\\\"})\",\n \"legend\": \"committed\",\n \"refId\": \"B\"\n },\n {\n \"expr\": \"sum(jvm_memory_max_bytes{instance=\\\"$instance\\\"})\",\n \"legend\": \"max\",\n \"refId\": \"C\"\n },\n {\n \"expr\": \"process_memory_rss_bytes{instance=\\\"$instance\\\"}\",\n \"legend\": \"rss\",\n \"refId\": \"E\"\n },\n {\n \"expr\": \"process_memory_pss_bytes{instance=\\\"$instance\\\"}\",\n \"legend\": \"pss\",\n \"refId\": \"F\"\n },\n {\n \"expr\": \"process_memory_swap_bytes{instance=\\\"$instance\\\"}\",\n \"legend\": \"swap\",\n \"refId\": \"G\"\n },\n {\n \"expr\": \"process_memory_swappss_bytes{instance=\\\"$instance\\\"}\",\n \"legend\": \"swappss\",\n \"refId\": \"H\"\n },\n {\n \"expr\": \"process_memory_pss_bytes{instance=\\\"$instance\\\"} + process_memory_swap_bytes{instance=\\\"$instance\\\"}\",\n \"legend\": \"phys (pss+swap)\",\n \"refId\": \"I\"\n }\n ],\n \"transformations\": [\n {\n \"id\": \"organize\",\n \"options\": {}\n }\n ],\n \"type\": \"timeseries\",\n \"version\": \"3.0.0\"\n },\n {\n \"custom\": {\n \"drawStyle\": \"lines\",\n \"fillOpacity\": 0.3,\n \"gradientMode\": \"opacity\",\n \"lineInterpolation\": \"linear\",\n \"lineWidth\": 2,\n \"scaleDistribution\": {\n \"type\": \"linear\"\n },\n \"spanNulls\": false,\n \"stack\": \"off\"\n },\n \"datasourceCate\": \"prometheus\",\n \"datasourceValue\": \"${datasource}\",\n \"id\": \"1607d97f-074a-457c-90f2-c6ccbf5ffef3\",\n \"layout\": {\n \"h\": 7,\n \"i\": \"1607d97f-074a-457c-90f2-c6ccbf5ffef3\",\n \"isResizable\": true,\n \"w\": 6,\n \"x\": 18,\n \"y\": 14\n },\n \"links\": [],\n \"maxPerRow\": 4,\n \"name\": \"JVM Native Memory\",\n \"options\": {\n \"legend\": {\n \"displayMode\": \"hidden\"\n },\n \"standardOptions\": {},\n \"thresholds\": {\n \"steps\": [\n {\n \"color\": \"#634CD9\",\n \"type\": \"base\",\n \"value\": null\n }\n ]\n },\n \"tooltip\": {\n \"mode\": \"all\",\n \"sort\": \"none\"\n }\n },\n \"targets\": [\n {\n \"expr\": \"(process_memory_pss_bytes{instance=\\\"$instance\\\"} + process_memory_swap_bytes{instance=\\\"$instance\\\"} - on(instance) sum(jvm_memory_committed_bytes{instance=\\\"$instance\\\"}) by(instance)) \\u003e= 0\",\n \"legend\": \"native\",\n \"refId\": \"A\"\n }\n ],\n \"transformations\": [\n {\n \"id\": \"organize\",\n \"options\": {}\n }\n ],\n \"type\": \"timeseries\",\n \"version\": \"3.0.0\"\n },\n {\n \"collapsed\": true,\n \"id\": \"ea05f925-19aa-4ba4-8daa-4133e939c5fb\",\n \"layout\": {\n \"h\": 1,\n \"i\": \"ea05f925-19aa-4ba4-8daa-4133e939c5fb\",\n \"isResizable\": false,\n \"w\": 24,\n \"x\": 0,\n \"y\": 21\n },\n \"name\": \"JVM Misc\",\n \"panels\": [],\n \"type\": \"row\",\n \"version\": \"3.0.0\"\n },\n {\n \"custom\": {\n \"drawStyle\": \"lines\",\n \"fillOpacity\": 0.3,\n \"gradientMode\": \"opacity\",\n \"lineInterpolation\": \"linear\",\n \"lineWidth\": 2,\n \"scaleDistribution\": {\n \"type\": \"linear\"\n },\n \"spanNulls\": false,\n \"stack\": \"off\"\n },\n \"datasourceCate\": \"prometheus\",\n \"datasourceValue\": \"${datasource}\",\n \"id\": \"8e65b992-ea8b-40b0-b201-23c8e54436a5\",\n \"layout\": {\n \"h\": 7,\n \"i\": \"8e65b992-ea8b-40b0-b201-23c8e54436a5\",\n \"isResizable\": true,\n \"w\": 6,\n \"x\": 0,\n \"y\": 22\n },\n \"links\": [],\n \"maxPerRow\": 4,\n \"name\": \"CPU\",\n \"options\": {\n \"legend\": {\n \"displayMode\": \"hidden\"\n },\n \"standardOptions\": {},\n \"thresholds\": {\n \"steps\": [\n {\n \"color\": \"#634CD9\",\n \"type\": \"base\",\n \"value\": null\n }\n ]\n },\n \"tooltip\": {\n \"mode\": \"all\",\n \"sort\": \"none\"\n }\n },\n \"targets\": [\n {\n \"expr\": \"system_cpu_usage{instance=\\\"$instance\\\"}\",\n \"legend\": \"system\",\n \"refId\": \"A\"\n },\n {\n \"expr\": \"process_cpu_usage{instance=\\\"$instance\\\"}\",\n \"legend\": \"process\",\n \"refId\": \"B\"\n },\n {\n \"expr\": \"avg_over_time(process_cpu_usage{instance=\\\"$instance\\\"}[1h])\",\n \"legend\": \"process-1h\",\n \"refId\": \"C\"\n }\n ],\n \"transformations\": [\n {\n \"id\": \"organize\",\n \"options\": {}\n }\n ],\n \"type\": \"timeseries\",\n \"version\": \"3.0.0\"\n },\n {\n \"custom\": {\n \"drawStyle\": \"lines\",\n \"fillOpacity\": 0.3,\n \"gradientMode\": \"opacity\",\n \"lineInterpolation\": \"linear\",\n \"lineWidth\": 2,\n \"scaleDistribution\": {\n \"type\": \"linear\"\n },\n \"spanNulls\": false,\n \"stack\": \"off\"\n },\n \"datasourceCate\": \"prometheus\",\n \"datasourceValue\": \"${datasource}\",\n \"id\": \"c8db3f1c-b857-473b-be1a-4d4d5b1d7618\",\n \"layout\": {\n \"h\": 7,\n \"i\": \"c8db3f1c-b857-473b-be1a-4d4d5b1d7618\",\n \"isResizable\": true,\n \"w\": 6,\n \"x\": 6,\n \"y\": 22\n },\n \"links\": [],\n \"maxPerRow\": 4,\n \"name\": \"File Descriptors\",\n \"options\": {\n \"legend\": {\n \"displayMode\": \"hidden\"\n },\n \"standardOptions\": {},\n \"thresholds\": {\n \"steps\": [\n {\n \"color\": \"#634CD9\",\n \"type\": \"base\",\n \"value\": null\n }\n ]\n },\n \"tooltip\": {\n \"mode\": \"all\",\n \"sort\": \"none\"\n }\n },\n \"targets\": [\n {\n \"expr\": \"process_open_fds{instance=\\\"$instance\\\"}\",\n \"legend\": \"open\",\n \"refId\": \"A\"\n },\n {\n \"expr\": \"process_max_fds{instance=\\\"$instance\\\"}\",\n \"legend\": \"max\",\n \"refId\": \"B\"\n },\n {\n \"expr\": \"process_files_open{instance=\\\"$instance\\\"} or process_files_open_files{instance=\\\"$instance\\\"}\",\n \"legend\": \"open\",\n \"refId\": \"C\"\n },\n {\n \"expr\": \"process_files_max{instance=\\\"$instance\\\"} or process_files_max_files{instance=\\\"$instance\\\"}\",\n \"legend\": \"max\",\n \"refId\": \"D\"\n }\n ],\n \"transformations\": [\n {\n \"id\": \"organize\",\n \"options\": {}\n }\n ],\n \"type\": \"timeseries\",\n \"version\": \"3.0.0\"\n },\n {\n \"custom\": {\n \"drawStyle\": \"lines\",\n \"fillOpacity\": 0.3,\n \"gradientMode\": \"opacity\",\n \"lineInterpolation\": \"linear\",\n \"lineWidth\": 2,\n \"scaleDistribution\": {\n \"type\": \"linear\"\n },\n \"spanNulls\": false,\n \"stack\": \"off\"\n },\n \"datasourceCate\": \"prometheus\",\n \"datasourceValue\": \"${datasource}\",\n \"id\": \"d1e449d5-31e3-4df9-a69a-c22edab3a44e\",\n \"layout\": {\n \"h\": 7,\n \"i\": \"d1e449d5-31e3-4df9-a69a-c22edab3a44e\",\n \"isResizable\": true,\n \"w\": 6,\n \"x\": 12,\n \"y\": 22\n },\n \"links\": [],\n \"maxPerRow\": 4,\n \"name\": \"Threads\",\n \"options\": {\n \"legend\": {\n \"displayMode\": \"hidden\"\n },\n \"standardOptions\": {},\n \"thresholds\": {\n \"steps\": [\n {\n \"color\": \"#634CD9\",\n \"type\": \"base\",\n \"value\": null\n }\n ]\n },\n \"tooltip\": {\n \"mode\": \"all\",\n \"sort\": \"none\"\n }\n },\n \"targets\": [\n {\n \"expr\": \"jvm_threads_live{instance=\\\"$instance\\\"} or jvm_threads_live_threads{instance=\\\"$instance\\\"}\",\n \"legend\": \"live\",\n \"refId\": \"A\"\n },\n {\n \"expr\": \"jvm_threads_daemon{instance=\\\"$instance\\\"} or jvm_threads_daemon_threads{instance=\\\"$instance\\\"}\",\n \"legend\": \"daemon\",\n \"refId\": \"B\"\n },\n {\n \"expr\": \"jvm_threads_peak{instance=\\\"$instance\\\"} or jvm_threads_peak_threads{instance=\\\"$instance\\\"}\",\n \"legend\": \"peak\",\n \"refId\": \"C\"\n },\n {\n \"expr\": \"process_threads{instance=\\\"$instance\\\"}\",\n \"legend\": \"process\",\n \"refId\": \"D\"\n }\n ],\n \"transformations\": [\n {\n \"id\": \"organize\",\n \"options\": {}\n }\n ],\n \"type\": \"timeseries\",\n \"version\": \"3.0.0\"\n },\n {\n \"custom\": {\n \"drawStyle\": \"lines\",\n \"fillOpacity\": 0.3,\n \"gradientMode\": \"opacity\",\n \"lineInterpolation\": \"linear\",\n \"lineWidth\": 2,\n \"scaleDistribution\": {\n \"type\": \"linear\"\n },\n \"spanNulls\": false,\n \"stack\": \"off\"\n },\n \"datasourceCate\": \"prometheus\",\n \"datasourceValue\": \"${datasource}\",\n \"id\": \"3b8ef3a3-f687-4cf9-8348-da9e60bfa0f5\",\n \"layout\": {\n \"h\": 7,\n \"i\": \"3b8ef3a3-f687-4cf9-8348-da9e60bfa0f5\",\n \"isResizable\": true,\n \"w\": 6,\n \"x\": 18,\n \"y\": 22\n },\n \"links\": [],\n \"maxPerRow\": 4,\n \"name\": \"Thread States\",\n \"options\": {\n \"legend\": {\n \"displayMode\": \"hidden\"\n },\n \"standardOptions\": {},\n \"thresholds\": {\n \"steps\": [\n {\n \"color\": \"#634CD9\",\n \"type\": \"base\",\n \"value\": null\n }\n ]\n },\n \"tooltip\": {\n \"mode\": \"all\",\n \"sort\": \"none\"\n }\n },\n \"targets\": [\n {\n \"expr\": \"jvm_threads_states_threads{instance=\\\"$instance\\\"}\",\n \"legend\": \"{{state}}\",\n \"refId\": \"A\"\n }\n ],\n \"transformations\": [\n {\n \"id\": \"organize\",\n \"options\": {}\n }\n ],\n \"type\": \"timeseries\",\n \"version\": \"3.0.0\"\n },\n {\n \"custom\": {\n \"drawStyle\": \"lines\",\n \"fillOpacity\": 0.3,\n \"gradientMode\": \"opacity\",\n \"lineInterpolation\": \"linear\",\n \"lineWidth\": 2,\n \"scaleDistribution\": {\n \"type\": \"linear\"\n },\n \"spanNulls\": false,\n \"stack\": \"off\"\n },\n \"datasourceCate\": \"prometheus\",\n \"datasourceValue\": \"${datasource}\",\n \"id\": \"2e02407c-9beb-460a-bca8-9b4dfd2e3a37\",\n \"layout\": {\n \"h\": 8,\n \"i\": \"2e02407c-9beb-460a-bca8-9b4dfd2e3a37\",\n \"isResizable\": true,\n \"w\": 24,\n \"x\": 0,\n \"y\": 29\n },\n \"links\": [],\n \"maxPerRow\": 4,\n \"name\": \"Log Events (1m)\",\n \"options\": {\n \"legend\": {\n \"behaviour\": \"showItem\",\n \"displayMode\": \"hidden\"\n },\n \"standardOptions\": {},\n \"thresholds\": {\n \"steps\": [\n {\n \"color\": \"#634CD9\",\n \"type\": \"base\",\n \"value\": null\n }\n ]\n },\n \"tooltip\": {\n \"mode\": \"all\",\n \"sort\": \"none\"\n }\n },\n \"overrides\": [\n {\n \"matcher\": {\n \"id\": \"byFrameRefID\"\n },\n \"properties\": {\n \"rightYAxisDisplay\": \"off\"\n }\n }\n ],\n \"targets\": [\n {\n \"expr\": \"increase(logback_events_total{instance=\\\"$instance\\\"}[5m])\",\n \"legend\": \"{{level}}\",\n \"refId\": \"A\"\n }\n ],\n \"transformations\": [\n {\n \"id\": \"organize\",\n \"options\": {}\n }\n ],\n \"type\": \"timeseries\",\n \"version\": \"3.0.0\"\n },\n {\n \"collapsed\": true,\n \"id\": \"84242a2f-64ec-4b71-8a9e-5441eb3ac271\",\n \"layout\": {\n \"h\": 1,\n \"i\": \"84242a2f-64ec-4b71-8a9e-5441eb3ac271\",\n \"isResizable\": false,\n \"w\": 24,\n \"x\": 0,\n \"y\": 37\n },\n \"name\": \"JVM Memory Pools (Heap)\",\n \"panels\": [],\n \"type\": \"row\",\n \"version\": \"3.0.0\"\n },\n {\n \"custom\": {\n \"drawStyle\": \"lines\",\n \"fillOpacity\": 0.3,\n \"gradientMode\": \"opacity\",\n \"lineInterpolation\": \"linear\",\n \"lineWidth\": 2,\n \"scaleDistribution\": {\n \"type\": \"linear\"\n },\n \"spanNulls\": false,\n \"stack\": \"off\"\n },\n \"datasourceCate\": \"prometheus\",\n \"datasourceValue\": \"${datasource}\",\n \"id\": \"22a3c8aa-4452-46c9-9439-4a5c524ab79e\",\n \"layout\": {\n \"h\": 8,\n \"i\": \"22a3c8aa-4452-46c9-9439-4a5c524ab79e\",\n \"isResizable\": true,\n \"w\": 24,\n \"x\": 0,\n \"y\": 38\n },\n \"links\": [],\n \"maxPerRow\": 3,\n \"name\": \"$jvm_memory_pool_heap\",\n \"options\": {\n \"legend\": {\n \"displayMode\": \"hidden\"\n },\n \"standardOptions\": {},\n \"thresholds\": {\n \"steps\": [\n {\n \"color\": \"#634CD9\",\n \"type\": \"base\",\n \"value\": null\n }\n ]\n },\n \"tooltip\": {\n \"mode\": \"all\",\n \"sort\": \"none\"\n }\n },\n \"repeat\": \"jvm_memory_pool_heap\",\n \"targets\": [\n {\n \"expr\": \"jvm_memory_used_bytes{instance=\\\"$instance\\\", id=\\\"$jvm_memory_pool_heap\\\"}\",\n \"legend\": \"used\",\n \"refId\": \"A\"\n },\n {\n \"expr\": \"jvm_memory_committed_bytes{instance=\\\"$instance\\\", id=\\\"$jvm_memory_pool_heap\\\"}\",\n \"legend\": \"commited\",\n \"refId\": \"B\"\n },\n {\n \"expr\": \"jvm_memory_max_bytes{instance=\\\"$instance\\\", id=\\\"$jvm_memory_pool_heap\\\"}\",\n \"legend\": \"max\",\n \"refId\": \"C\"\n }\n ],\n \"transformations\": [\n {\n \"id\": \"organize\",\n \"options\": {}\n }\n ],\n \"type\": \"timeseries\",\n \"version\": \"3.0.0\"\n },\n {\n \"collapsed\": true,\n \"id\": \"5b6abe6d-7496-454c-9ab9-fcb7f068f626\",\n \"layout\": {\n \"h\": 1,\n \"i\": \"5b6abe6d-7496-454c-9ab9-fcb7f068f626\",\n \"isResizable\": false,\n \"w\": 24,\n \"x\": 0,\n \"y\": 102\n },\n \"name\": \"JVM Memory Pools (Non-Heap)\",\n \"panels\": [],\n \"type\": \"row\",\n \"version\": \"3.0.0\"\n },\n {\n \"custom\": {\n \"drawStyle\": \"lines\",\n \"fillOpacity\": 0.3,\n \"gradientMode\": \"opacity\",\n \"lineInterpolation\": \"linear\",\n \"lineWidth\": 2,\n \"scaleDistribution\": {\n \"type\": \"linear\"\n },\n \"spanNulls\": false,\n \"stack\": \"off\"\n },\n \"datasourceCate\": \"prometheus\",\n \"datasourceValue\": \"${datasource}\",\n \"id\": \"6ebac55a-4d88-4f3e-8414-5df8e27d3d60\",\n \"layout\": {\n \"h\": 7,\n \"i\": \"6ebac55a-4d88-4f3e-8414-5df8e27d3d60\",\n \"isResizable\": true,\n \"w\": 24,\n \"x\": 0,\n \"y\": 103\n },\n \"links\": [],\n \"maxPerRow\": 3,\n \"name\": \"$jvm_memory_pool_nonheap\",\n \"options\": {\n \"legend\": {\n \"displayMode\": \"hidden\"\n },\n \"standardOptions\": {},\n \"thresholds\": {\n \"steps\": [\n {\n \"color\": \"#634CD9\",\n \"type\": \"base\",\n \"value\": null\n }\n ]\n },\n \"tooltip\": {\n \"mode\": \"all\",\n \"sort\": \"none\"\n }\n },\n \"repeat\": \"jvm_memory_pool_nonheap\",\n \"targets\": [\n {\n \"expr\": \"jvm_memory_used_bytes{instance=\\\"$instance\\\", id=\\\"$jvm_memory_pool_nonheap\\\"}\",\n \"legend\": \"used\",\n \"refId\": \"A\"\n },\n {\n \"expr\": \"jvm_memory_committed_bytes{instance=\\\"$instance\\\", id=\\\"$jvm_memory_pool_nonheap\\\"}\",\n \"legend\": \"commited\",\n \"refId\": \"B\"\n },\n {\n \"expr\": \"jvm_memory_max_bytes{instance=\\\"$instance\\\", id=\\\"$jvm_memory_pool_nonheap\\\"}\",\n \"legend\": \"max\",\n \"refId\": \"C\"\n }\n ],\n \"transformations\": [\n {\n \"id\": \"organize\",\n \"options\": {}\n }\n ],\n \"type\": \"timeseries\",\n \"version\": \"3.0.0\"\n },\n {\n \"collapsed\": true,\n \"id\": \"ec6d25b8-cfe1-42c0-afc4-c32886432636\",\n \"layout\": {\n \"h\": 1,\n \"i\": \"ec6d25b8-cfe1-42c0-afc4-c32886432636\",\n \"isResizable\": false,\n \"w\": 24,\n \"x\": 0,\n \"y\": 152\n },\n \"name\": \"Garbage Collection\",\n \"panels\": [],\n \"type\": \"row\",\n \"version\": \"3.0.0\"\n },\n {\n \"custom\": {\n \"drawStyle\": \"lines\",\n \"fillOpacity\": 0.3,\n \"gradientMode\": \"opacity\",\n \"lineInterpolation\": \"linear\",\n \"lineWidth\": 2,\n \"scaleDistribution\": {\n \"type\": \"linear\"\n },\n \"spanNulls\": false,\n \"stack\": \"off\"\n },\n \"datasourceCate\": \"prometheus\",\n \"datasourceValue\": \"${datasource}\",\n \"id\": \"adf56723-9689-4202-a7dd-1d9d844a5e66\",\n \"layout\": {\n \"h\": 7,\n \"i\": \"adf56723-9689-4202-a7dd-1d9d844a5e66\",\n \"isResizable\": true,\n \"w\": 8,\n \"x\": 0,\n \"y\": 153\n },\n \"links\": [],\n \"maxPerRow\": 4,\n \"name\": \"Collections\",\n \"options\": {\n \"legend\": {\n \"behaviour\": \"showItem\",\n \"displayMode\": \"hidden\"\n },\n \"standardOptions\": {},\n \"thresholds\": {\n \"steps\": [\n {\n \"color\": \"#634CD9\",\n \"type\": \"base\",\n \"value\": null\n }\n ]\n },\n \"tooltip\": {\n \"mode\": \"all\",\n \"sort\": \"none\"\n }\n },\n \"overrides\": [\n {\n \"matcher\": {\n \"id\": \"byFrameRefID\"\n },\n \"properties\": {\n \"rightYAxisDisplay\": \"off\"\n }\n }\n ],\n \"targets\": [\n {\n \"expr\": \"rate(jvm_gc_pause_seconds_count{instance=\\\"$instance\\\"}[5m])\",\n \"legend\": \"{{action}} ({{cause}})\",\n \"refId\": \"A\"\n }\n ],\n \"transformations\": [\n {\n \"id\": \"organize\",\n \"options\": {}\n }\n ],\n \"type\": \"timeseries\",\n \"version\": \"3.0.0\"\n },\n {\n \"custom\": {\n \"drawStyle\": \"lines\",\n \"fillOpacity\": 0.3,\n \"gradientMode\": \"opacity\",\n \"lineInterpolation\": \"linear\",\n \"lineWidth\": 2,\n \"scaleDistribution\": {\n \"type\": \"linear\"\n },\n \"spanNulls\": false,\n \"stack\": \"off\"\n },\n \"datasourceCate\": \"prometheus\",\n \"datasourceValue\": \"${datasource}\",\n \"id\": \"7caea97e-1cfb-45c6-892f-fe89377bd8fa\",\n \"layout\": {\n \"h\": 7,\n \"i\": \"7caea97e-1cfb-45c6-892f-fe89377bd8fa\",\n \"isResizable\": true,\n \"w\": 8,\n \"x\": 8,\n \"y\": 153\n },\n \"links\": [],\n \"maxPerRow\": 4,\n \"name\": \"Pause Durations\",\n \"options\": {\n \"legend\": {\n \"behaviour\": \"showItem\",\n \"displayMode\": \"hidden\"\n },\n \"standardOptions\": {},\n \"thresholds\": {\n \"steps\": [\n {\n \"color\": \"#634CD9\",\n \"type\": \"base\",\n \"value\": null\n }\n ]\n },\n \"tooltip\": {\n \"mode\": \"all\",\n \"sort\": \"none\"\n }\n },\n \"overrides\": [\n {\n \"matcher\": {\n \"id\": \"byFrameRefID\"\n },\n \"properties\": {\n \"rightYAxisDisplay\": \"off\"\n }\n }\n ],\n \"targets\": [\n {\n \"expr\": \"rate(jvm_gc_pause_seconds_sum{instance=\\\"$instance\\\"}[5m])/rate(jvm_gc_pause_seconds_count{instance=\\\"$instance\\\"}[5m])\",\n \"legend\": \"avg {{action}} ({{cause}})\",\n \"refId\": \"A\"\n },\n {\n \"expr\": \"jvm_gc_pause_seconds_max{instance=\\\"$instance\\\"}\",\n \"legend\": \"max {{action}} ({{cause}})\",\n \"refId\": \"B\"\n }\n ],\n \"transformations\": [\n {\n \"id\": \"organize\",\n \"options\": {}\n }\n ],\n \"type\": \"timeseries\",\n \"version\": \"3.0.0\"\n },\n {\n \"custom\": {\n \"drawStyle\": \"lines\",\n \"fillOpacity\": 0.3,\n \"gradientMode\": \"opacity\",\n \"lineInterpolation\": \"linear\",\n \"lineWidth\": 2,\n \"scaleDistribution\": {\n \"type\": \"linear\"\n },\n \"spanNulls\": false,\n \"stack\": \"off\"\n },\n \"datasourceCate\": \"prometheus\",\n \"datasourceValue\": \"${datasource}\",\n \"id\": \"00223434-f6e0-4c53-8562-38bcb46948f4\",\n \"layout\": {\n \"h\": 7,\n \"i\": \"00223434-f6e0-4c53-8562-38bcb46948f4\",\n \"isResizable\": true,\n \"w\": 8,\n \"x\": 16,\n \"y\": 153\n },\n \"links\": [],\n \"maxPerRow\": 4,\n \"name\": \"Allocated/Promoted\",\n \"options\": {\n \"legend\": {\n \"behaviour\": \"showItem\",\n \"displayMode\": \"hidden\"\n },\n \"standardOptions\": {},\n \"thresholds\": {\n \"steps\": [\n {\n \"color\": \"#634CD9\",\n \"type\": \"base\",\n \"value\": null\n }\n ]\n },\n \"tooltip\": {\n \"mode\": \"all\",\n \"sort\": \"none\"\n }\n },\n \"overrides\": [\n {\n \"matcher\": {\n \"id\": \"byFrameRefID\"\n },\n \"properties\": {\n \"rightYAxisDisplay\": \"off\"\n }\n }\n ],\n \"targets\": [\n {\n \"expr\": \"rate(jvm_gc_memory_allocated_bytes_total{instance=\\\"$instance\\\"}[5m])\",\n \"legend\": \"allocated\",\n \"refId\": \"A\"\n },\n {\n \"expr\": \"rate(jvm_gc_memory_promoted_bytes_total{instance=\\\"$instance\\\"}[1m])\",\n \"legend\": \"promoted\",\n \"refId\": \"B\"\n }\n ],\n \"transformations\": [\n {\n \"id\": \"organize\",\n \"options\": {}\n }\n ],\n \"type\": \"timeseries\",\n \"version\": \"3.0.0\"\n },\n {\n \"collapsed\": true,\n \"id\": \"a199f2f8-136c-44f4-aea5-da20e0e479fb\",\n \"layout\": {\n \"h\": 1,\n \"i\": \"a199f2f8-136c-44f4-aea5-da20e0e479fb\",\n \"isResizable\": false,\n \"w\": 24,\n \"x\": 0,\n \"y\": 160\n },\n \"name\": \"Classloading\",\n \"panels\": [],\n \"type\": \"row\",\n \"version\": \"3.0.0\"\n },\n {\n \"custom\": {\n \"drawStyle\": \"lines\",\n \"fillOpacity\": 0.3,\n \"gradientMode\": \"opacity\",\n \"lineInterpolation\": \"linear\",\n \"lineWidth\": 2,\n \"scaleDistribution\": {\n \"type\": \"linear\"\n },\n \"spanNulls\": false,\n \"stack\": \"off\"\n },\n \"datasourceCate\": \"prometheus\",\n \"datasourceValue\": \"${datasource}\",\n \"id\": \"903e6501-6f64-4860-a12a-4e07a7424ef8\",\n \"layout\": {\n \"h\": 7,\n \"i\": \"903e6501-6f64-4860-a12a-4e07a7424ef8\",\n \"isResizable\": true,\n \"w\": 12,\n \"x\": 0,\n \"y\": 161\n },\n \"links\": [],\n \"maxPerRow\": 4,\n \"name\": \"Classes loaded\",\n \"options\": {\n \"legend\": {\n \"displayMode\": \"hidden\"\n },\n \"standardOptions\": {},\n \"thresholds\": {\n \"steps\": [\n {\n \"color\": \"#634CD9\",\n \"type\": \"base\",\n \"value\": null\n }\n ]\n },\n \"tooltip\": {\n \"mode\": \"all\",\n \"sort\": \"none\"\n }\n },\n \"targets\": [\n {\n \"expr\": \"jvm_classes_loaded{instance=\\\"$instance\\\"} or jvm_classes_loaded_classes{instance=\\\"$instance\\\"}\",\n \"legend\": \"loaded\",\n \"refId\": \"A\"\n }\n ],\n \"transformations\": [\n {\n \"id\": \"organize\",\n \"options\": {}\n }\n ],\n \"type\": \"timeseries\",\n \"version\": \"3.0.0\"\n },\n {\n \"custom\": {\n \"drawStyle\": \"lines\",\n \"fillOpacity\": 0.3,\n \"gradientMode\": \"opacity\",\n \"lineInterpolation\": \"linear\",\n \"lineWidth\": 2,\n \"scaleDistribution\": {\n \"type\": \"linear\"\n },\n \"spanNulls\": false,\n \"stack\": \"off\"\n },\n \"datasourceCate\": \"prometheus\",\n \"datasourceValue\": \"${datasource}\",\n \"id\": \"dc21d536-f4c0-48c0-99f1-eef82b30e979\",\n \"layout\": {\n \"h\": 7,\n \"i\": \"dc21d536-f4c0-48c0-99f1-eef82b30e979\",\n \"isResizable\": true,\n \"w\": 12,\n \"x\": 12,\n \"y\": 161\n },\n \"links\": [],\n \"maxPerRow\": 4,\n \"name\": \"Class delta (5m)\",\n \"options\": {\n \"legend\": {\n \"displayMode\": \"hidden\"\n },\n \"standardOptions\": {},\n \"thresholds\": {\n \"steps\": [\n {\n \"color\": \"#634CD9\",\n \"type\": \"base\",\n \"value\": null\n }\n ]\n },\n \"tooltip\": {\n \"mode\": \"all\",\n \"sort\": \"none\"\n }\n },\n \"targets\": [\n {\n \"expr\": \"delta(jvm_classes_loaded{application=\\\"$application\\\",instance=\\\"$instance\\\"}[5m]) or delta(jvm_classes_loaded_classes{application=\\\"$application\\\",instance=\\\"$instance\\\"}[5m])\",\n \"legend\": \"delta\",\n \"refId\": \"A\"\n }\n ],\n \"transformations\": [\n {\n \"id\": \"organize\",\n \"options\": {}\n }\n ],\n \"type\": \"timeseries\",\n \"version\": \"3.0.0\"\n },\n {\n \"collapsed\": true,\n \"id\": \"6c164737-84da-4d51-911b-38e207bef57e\",\n \"layout\": {\n \"h\": 1,\n \"i\": \"6c164737-84da-4d51-911b-38e207bef57e\",\n \"isResizable\": false,\n \"w\": 24,\n \"x\": 0,\n \"y\": 168\n },\n \"name\": \"Buffer Pools\",\n \"panels\": [],\n \"type\": \"row\",\n \"version\": \"3.0.0\"\n },\n {\n \"custom\": {\n \"drawStyle\": \"lines\",\n \"fillOpacity\": 0.3,\n \"gradientMode\": \"opacity\",\n \"lineInterpolation\": \"linear\",\n \"lineWidth\": 2,\n \"scaleDistribution\": {\n \"type\": \"linear\"\n },\n \"spanNulls\": false,\n \"stack\": \"off\"\n },\n \"datasourceCate\": \"prometheus\",\n \"datasourceValue\": \"${datasource}\",\n \"id\": \"9ac2c14e-9871-4b84-a5cb-976f8dfe6c19\",\n \"layout\": {\n \"h\": 7,\n \"i\": \"9ac2c14e-9871-4b84-a5cb-976f8dfe6c19\",\n \"isResizable\": true,\n \"w\": 6,\n \"x\": 0,\n \"y\": 169\n },\n \"links\": [],\n \"maxPerRow\": 4,\n \"name\": \"Direct Buffers\",\n \"options\": {\n \"legend\": {\n \"displayMode\": \"hidden\"\n },\n \"standardOptions\": {},\n \"thresholds\": {\n \"steps\": [\n {\n \"color\": \"#634CD9\",\n \"type\": \"base\",\n \"value\": null\n }\n ]\n },\n \"tooltip\": {\n \"mode\": \"all\",\n \"sort\": \"none\"\n }\n },\n \"targets\": [\n {\n \"expr\": \"jvm_buffer_memory_used_bytes{instance=\\\"$instance\\\", id=\\\"direct\\\"}\",\n \"legend\": \"used\",\n \"refId\": \"A\"\n },\n {\n \"expr\": \"jvm_buffer_total_capacity_bytes{instance=\\\"$instance\\\", id=\\\"direct\\\"}\",\n \"legend\": \"capacity\",\n \"refId\": \"B\"\n }\n ],\n \"transformations\": [\n {\n \"id\": \"organize\",\n \"options\": {}\n }\n ],\n \"type\": \"timeseries\",\n \"version\": \"3.0.0\"\n },\n {\n \"custom\": {\n \"drawStyle\": \"lines\",\n \"fillOpacity\": 0.3,\n \"gradientMode\": \"opacity\",\n \"lineInterpolation\": \"linear\",\n \"lineWidth\": 2,\n \"scaleDistribution\": {\n \"type\": \"linear\"\n },\n \"spanNulls\": false,\n \"stack\": \"off\"\n },\n \"datasourceCate\": \"prometheus\",\n \"datasourceValue\": \"${datasource}\",\n \"id\": \"f38df099-4559-4239-b283-21bd3949c81d\",\n \"layout\": {\n \"h\": 7,\n \"i\": \"f38df099-4559-4239-b283-21bd3949c81d\",\n \"isResizable\": true,\n \"w\": 6,\n \"x\": 6,\n \"y\": 169\n },\n \"links\": [],\n \"maxPerRow\": 4,\n \"name\": \"Direct Buffers\",\n \"options\": {\n \"legend\": {\n \"displayMode\": \"hidden\"\n },\n \"standardOptions\": {},\n \"thresholds\": {\n \"steps\": [\n {\n \"color\": \"#634CD9\",\n \"type\": \"base\",\n \"value\": null\n }\n ]\n },\n \"tooltip\": {\n \"mode\": \"all\",\n \"sort\": \"none\"\n }\n },\n \"targets\": [\n {\n \"expr\": \"jvm_buffer_count{instance=\\\"$instance\\\", id=\\\"direct\\\"} or jvm_buffer_count_buffers{instance=\\\"$instance\\\", id=\\\"direct\\\"}\",\n \"legend\": \"count\",\n \"refId\": \"A\"\n }\n ],\n \"transformations\": [\n {\n \"id\": \"organize\",\n \"options\": {}\n }\n ],\n \"type\": \"timeseries\",\n \"version\": \"3.0.0\"\n },\n {\n \"custom\": {\n \"drawStyle\": \"lines\",\n \"fillOpacity\": 0.3,\n \"gradientMode\": \"opacity\",\n \"lineInterpolation\": \"linear\",\n \"lineWidth\": 2,\n \"scaleDistribution\": {\n \"type\": \"linear\"\n },\n \"spanNulls\": false,\n \"stack\": \"off\"\n },\n \"datasourceCate\": \"prometheus\",\n \"datasourceValue\": \"${datasource}\",\n \"id\": \"ef8f0a38-f98e-428c-a601-186dccafd2c1\",\n \"layout\": {\n \"h\": 7,\n \"i\": \"ef8f0a38-f98e-428c-a601-186dccafd2c1\",\n \"isResizable\": true,\n \"w\": 6,\n \"x\": 12,\n \"y\": 169\n },\n \"links\": [],\n \"maxPerRow\": 4,\n \"name\": \"Mapped Buffers\",\n \"options\": {\n \"legend\": {\n \"displayMode\": \"hidden\"\n },\n \"standardOptions\": {},\n \"thresholds\": {\n \"steps\": [\n {\n \"color\": \"#634CD9\",\n \"type\": \"base\",\n \"value\": null\n }\n ]\n },\n \"tooltip\": {\n \"mode\": \"all\",\n \"sort\": \"none\"\n }\n },\n \"targets\": [\n {\n \"expr\": \"jvm_buffer_memory_used_bytes{instance=\\\"$instance\\\", id=\\\"mapped\\\"}\",\n \"legend\": \"used\",\n \"refId\": \"A\"\n },\n {\n \"expr\": \"jvm_buffer_total_capacity_bytes{instance=\\\"$instance\\\", id=\\\"mapped\\\"}\",\n \"legend\": \"capacity\",\n \"refId\": \"B\"\n }\n ],\n \"transformations\": [\n {\n \"id\": \"organize\",\n \"options\": {}\n }\n ],\n \"type\": \"timeseries\",\n \"version\": \"3.0.0\"\n },\n {\n \"custom\": {\n \"drawStyle\": \"lines\",\n \"fillOpacity\": 0.3,\n \"gradientMode\": \"opacity\",\n \"lineInterpolation\": \"linear\",\n \"lineWidth\": 2,\n \"scaleDistribution\": {\n \"type\": \"linear\"\n },\n \"spanNulls\": false,\n \"stack\": \"off\"\n },\n \"datasourceCate\": \"prometheus\",\n \"datasourceValue\": \"${datasource}\",\n \"id\": \"3abe8423-f8fd-44b8-8321-1753943d4e9c\",\n \"layout\": {\n \"h\": 7,\n \"i\": \"3abe8423-f8fd-44b8-8321-1753943d4e9c\",\n \"isResizable\": true,\n \"w\": 6,\n \"x\": 18,\n \"y\": 169\n },\n \"links\": [],\n \"maxPerRow\": 4,\n \"name\": \"Mapped Buffers\",\n \"options\": {\n \"legend\": {\n \"displayMode\": \"hidden\"\n },\n \"standardOptions\": {},\n \"thresholds\": {\n \"steps\": [\n {\n \"color\": \"#634CD9\",\n \"type\": \"base\",\n \"value\": null\n }\n ]\n },\n \"tooltip\": {\n \"mode\": \"all\",\n \"sort\": \"none\"\n }\n },\n \"targets\": [\n {\n \"expr\": \"jvm_buffer_count{instance=\\\"$instance\\\", id=\\\"mapped\\\"} or jvm_buffer_count_buffers{instance=\\\"$instance\\\", id=\\\"mapped\\\"}\",\n \"legend\": \"count\",\n \"refId\": \"A\"\n }\n ],\n \"transformations\": [\n {\n \"id\": \"organize\",\n \"options\": {}\n }\n ],\n \"type\": \"timeseries\",\n \"version\": \"3.0.0\"\n }\n ],\n \"var\": [\n {\n \"definition\": \"prometheus\",\n \"label\": \"datasource\",\n \"name\": \"datasource\",\n \"type\": \"datasource\"\n },\n {\n \"datasource\": {\n \"cate\": \"prometheus\",\n \"value\": \"${datasource}\"\n },\n \"definition\": \"label_values(jvm_memory_used_bytes, application)\",\n \"multi\": false,\n \"name\": \"application\",\n \"reg\": \"\",\n \"type\": \"query\"\n },\n {\n \"datasource\": {\n \"cate\": \"prometheus\",\n \"value\": \"${datasource}\"\n },\n \"definition\": \"label_values(jvm_memory_used_bytes{application=\\\"$application\\\", }, instance)\",\n \"multi\": false,\n \"name\": \"instance\",\n \"reg\": \"\",\n \"type\": \"query\"\n },\n {\n \"datasource\": {\n \"cate\": \"prometheus\",\n \"value\": \"${datasource}\"\n },\n \"definition\": \"label_values(jvm_memory_used_bytes{application=\\\"$application\\\",instance=\\\"$instance\\\",area=\\\"heap\\\", },id)\",\n \"multi\": false,\n \"name\": \"jvm_memory_pool_heap\",\n \"reg\": \"\",\n \"type\": \"query\"\n },\n {\n \"datasource\": {\n \"cate\": \"prometheus\",\n \"value\": \"${datasource}\"\n },\n \"definition\": \"label_values(jvm_memory_used_bytes{application=\\\"$application\\\",instance=\\\"$instance\\\",area=\\\"nonheap\\\"}, id)\",\n \"multi\": false,\n \"name\": \"jvm_memory_pool_nonheap\",\n \"reg\": \"\",\n \"type\": \"query\"\n }\n ],\n \"version\": \"3.0.0\"\n },\n \"public\": 0,\n \"public_cate\": 0,\n \"bgids\": null,\n \"built_in\": 0,\n \"hide\": 0,\n \"uuid\": 1717556328396955000\n}"
},
{
"path": "integrations/SpringBoot/dashboards/JVM.json",
"content": "{\n \"name\": \"JVM仪表盘\",\n \"tags\": \"Actuator\",\n \"configs\": {\n \"links\": [],\n \"panels\": [\n {\n \"collapsed\": true,\n \"id\": \"98ba9b06-9d1e-44b9-a626-f4e704cc39ac\",\n \"layout\": {\n \"h\": 1,\n \"i\": \"98ba9b06-9d1e-44b9-a626-f4e704cc39ac\",\n \"isResizable\": false,\n \"w\": 24,\n \"x\": 0,\n \"y\": 0\n },\n \"name\": \"Quick Facts\",\n \"panels\": [],\n \"type\": \"row\",\n \"version\": \"3.0.0\"\n },\n {\n \"custom\": {\n \"calc\": \"lastNotNull\",\n \"colSpan\": 2,\n \"colorMode\": \"value\",\n \"graphMode\": \"none\",\n \"textMode\": \"valueAndName\",\n \"textSize\": {},\n \"valueField\": \"Value\"\n },\n \"datasourceCate\": \"prometheus\",\n \"datasourceValue\": \"${datasource}\",\n \"id\": \"c325f6ba-bca2-42f1-a518-1d3077b54a54\",\n \"layout\": {\n \"h\": 4,\n \"i\": \"c325f6ba-bca2-42f1-a518-1d3077b54a54\",\n \"isResizable\": true,\n \"w\": 6,\n \"x\": 0,\n \"y\": 1\n },\n \"links\": [],\n \"maxPerRow\": 4,\n \"name\": \"Start time\",\n \"options\": {\n \"standardOptions\": {\n \"util\": \"datetimeMilliseconds\"\n },\n \"thresholds\": {\n \"steps\": [\n {\n \"color\": \"#634CD9\",\n \"type\": \"base\",\n \"value\": null\n }\n ]\n }\n },\n \"targets\": [\n {\n \"expr\": \"process_start_time_seconds{ident=~\\\"$instance\\\"}*1000\",\n \"legend\": \"{{ident}}\",\n \"maxDataPoints\": 240,\n \"refId\": \"A\"\n }\n ],\n \"transformations\": [\n {\n \"id\": \"organize\",\n \"options\": {}\n }\n ],\n \"type\": \"stat\",\n \"version\": \"3.0.0\"\n },\n {\n \"custom\": {\n \"calc\": \"lastNotNull\",\n \"colSpan\": 2,\n \"colorMode\": \"value\",\n \"graphMode\": \"none\",\n \"textMode\": \"valueAndName\",\n \"textSize\": {},\n \"valueField\": \"Value\"\n },\n \"datasourceCate\": \"prometheus\",\n \"datasourceValue\": \"${datasource}\",\n \"id\": \"95bc69c0-0b29-4dc5-8404-c0ca0741918f\",\n \"layout\": {\n \"h\": 4,\n \"i\": \"95bc69c0-0b29-4dc5-8404-c0ca0741918f\",\n \"isResizable\": true,\n \"w\": 6,\n \"x\": 6,\n \"y\": 1\n },\n \"links\": [],\n \"maxPerRow\": 4,\n \"name\": \"Uptime\",\n \"options\": {\n \"standardOptions\": {\n \"util\": \"humantimeSeconds\"\n },\n \"thresholds\": {\n \"steps\": [\n {\n \"color\": \"#634CD9\",\n \"type\": \"base\",\n \"value\": null\n }\n ]\n }\n },\n \"targets\": [\n {\n \"expr\": \"process_uptime_seconds{ident=~\\\"$instance\\\"}\",\n \"legend\": \"{{ident}}\",\n \"maxDataPoints\": 240,\n \"refId\": \"A\"\n }\n ],\n \"transformations\": [\n {\n \"id\": \"organize\",\n \"options\": {}\n }\n ],\n \"type\": \"stat\",\n \"version\": \"3.0.0\"\n },\n {\n \"custom\": {\n \"calc\": \"lastNotNull\",\n \"colSpan\": 2,\n \"colorMode\": \"value\",\n \"graphMode\": \"none\",\n \"textMode\": \"valueAndName\",\n \"textSize\": {},\n \"valueField\": \"Value\"\n },\n \"datasourceCate\": \"prometheus\",\n \"datasourceValue\": \"${datasource}\",\n \"id\": \"03627849-92c0-4a5c-9558-738dc6bd6186\",\n \"layout\": {\n \"h\": 4,\n \"i\": \"03627849-92c0-4a5c-9558-738dc6bd6186\",\n \"isResizable\": true,\n \"w\": 6,\n \"x\": 12,\n \"y\": 1\n },\n \"links\": [],\n \"maxPerRow\": 4,\n \"name\": \"Heap used\",\n \"options\": {\n \"standardOptions\": {\n \"decimals\": 2,\n \"util\": \"percent\"\n },\n \"thresholds\": {\n \"steps\": [\n {\n \"color\": \"#634CD9\",\n \"type\": \"base\",\n \"value\": null\n }\n ]\n }\n },\n \"targets\": [\n {\n \"expr\": \"sum(jvm_memory_used_bytes{ident=~\\\"$instance\\\", area=\\\"heap\\\"}) by(ident)/on(ident)(sum(jvm_memory_max_bytes{ident=~\\\"$instance\\\", area=\\\"heap\\\"}) by(ident)) * 100\",\n \"legend\": \"{{ident}}\",\n \"maxDataPoints\": 240,\n \"refId\": \"A\"\n }\n ],\n \"transformations\": [\n {\n \"id\": \"organize\",\n \"options\": {}\n }\n ],\n \"type\": \"stat\",\n \"version\": \"3.0.0\"\n },\n {\n \"custom\": {\n \"calc\": \"lastNotNull\",\n \"colSpan\": 2,\n \"colorMode\": \"value\",\n \"graphMode\": \"none\",\n \"textMode\": \"valueAndName\",\n \"textSize\": {},\n \"valueField\": \"Value\"\n },\n \"datasourceCate\": \"prometheus\",\n \"datasourceValue\": \"${datasource}\",\n \"id\": \"4e85e1c3-9623-4e1c-bbb2-a4824455c5b3\",\n \"layout\": {\n \"h\": 4,\n \"i\": \"4e85e1c3-9623-4e1c-bbb2-a4824455c5b3\",\n \"isResizable\": true,\n \"w\": 6,\n \"x\": 18,\n \"y\": 1\n },\n \"links\": [],\n \"maxPerRow\": 4,\n \"name\": \"Non-Heap used\",\n \"options\": {\n \"standardOptions\": {\n \"decimals\": 2,\n \"util\": \"percent\"\n },\n \"thresholds\": {\n \"steps\": [\n {\n \"color\": \"#634CD9\",\n \"type\": \"base\",\n \"value\": null\n }\n ]\n }\n },\n \"targets\": [\n {\n \"expr\": \"sum(jvm_memory_used_bytes{ident=~\\\"$instance\\\", area=\\\"nonheap\\\"})by(ident)/on(ident)(sum(jvm_memory_max_bytes{ident=~\\\"$instance\\\", area=\\\"nonheap\\\"})by(ident))*100\",\n \"legend\": \"\",\n \"maxDataPoints\": 240,\n \"refId\": \"A\"\n }\n ],\n \"transformations\": [\n {\n \"id\": \"organize\",\n \"options\": {}\n }\n ],\n \"type\": \"stat\",\n \"version\": \"3.0.0\"\n },\n {\n \"collapsed\": true,\n \"id\": \"abe6c0c1-8b88-450a-908f-0f51cc973761\",\n \"layout\": {\n \"h\": 1,\n \"i\": \"abe6c0c1-8b88-450a-908f-0f51cc973761\",\n \"isResizable\": false,\n \"w\": 24,\n \"x\": 0,\n \"y\": 5\n },\n \"name\": \"I/O Overview\",\n \"panels\": [],\n \"type\": \"row\",\n \"version\": \"3.0.0\"\n },\n {\n \"custom\": {\n \"drawStyle\": \"lines\",\n \"fillOpacity\": 0.5,\n \"gradientMode\": \"none\",\n \"lineInterpolation\": \"linear\",\n \"lineWidth\": 1,\n \"scaleDistribution\": {\n \"type\": \"linear\"\n },\n \"spanNulls\": false,\n \"stack\": \"off\"\n },\n \"datasourceCate\": \"prometheus\",\n \"datasourceValue\": \"${datasource}\",\n \"id\": \"4d5bedf5-2b3c-425b-a4be-b5e7f36300af\",\n \"layout\": {\n \"h\": 7,\n \"i\": \"4d5bedf5-2b3c-425b-a4be-b5e7f36300af\",\n \"isResizable\": true,\n \"w\": 6,\n \"x\": 0,\n \"y\": 6\n },\n \"links\": [],\n \"maxPerRow\": 4,\n \"name\": \"Rate\",\n \"options\": {\n \"legend\": {\n \"behaviour\": \"showItem\",\n \"displayMode\": \"hidden\"\n },\n \"standardOptions\": {},\n \"thresholds\": {\n \"steps\": [\n {\n \"color\": \"#634CD9\",\n \"type\": \"base\",\n \"value\": null\n }\n ]\n },\n \"tooltip\": {\n \"mode\": \"all\",\n \"sort\": \"none\"\n }\n },\n \"overrides\": [\n {\n \"matcher\": {\n \"id\": \"byFrameRefID\"\n },\n \"properties\": {\n \"rightYAxisDisplay\": \"off\"\n }\n }\n ],\n \"targets\": [\n {\n \"expr\": \"sum(rate(http_server_requests_seconds_count{ident=~\\\"$instance\\\"}[1m])) by (ident)\",\n \"legend\": \"{{ident}}-HTTP\",\n \"maxDataPoints\": 240,\n \"refId\": \"A\"\n }\n ],\n \"transformations\": [\n {\n \"id\": \"organize\",\n \"options\": {}\n }\n ],\n \"type\": \"timeseries\",\n \"version\": \"3.0.0\"\n },\n {\n \"custom\": {\n \"drawStyle\": \"lines\",\n \"fillOpacity\": 0.5,\n \"gradientMode\": \"none\",\n \"lineInterpolation\": \"linear\",\n \"lineWidth\": 1,\n \"scaleDistribution\": {\n \"type\": \"linear\"\n },\n \"spanNulls\": false,\n \"stack\": \"off\"\n },\n \"datasourceCate\": \"prometheus\",\n \"datasourceValue\": \"${datasource}\",\n \"id\": \"68f7255b-6637-4967-906d-a6d4c9a61d88\",\n \"layout\": {\n \"h\": 7,\n \"i\": \"68f7255b-6637-4967-906d-a6d4c9a61d88\",\n \"isResizable\": true,\n \"w\": 6,\n \"x\": 6,\n \"y\": 6\n },\n \"links\": [],\n \"maxPerRow\": 4,\n \"name\": \"Errors\",\n \"options\": {\n \"legend\": {\n \"behaviour\": \"showItem\",\n \"displayMode\": \"hidden\"\n },\n \"standardOptions\": {},\n \"thresholds\": {\n \"steps\": [\n {\n \"color\": \"#634CD9\",\n \"type\": \"base\",\n \"value\": null\n }\n ]\n },\n \"tooltip\": {\n \"mode\": \"all\",\n \"sort\": \"none\"\n }\n },\n \"overrides\": [\n {\n \"matcher\": {\n \"id\": \"byFrameRefID\"\n },\n \"properties\": {\n \"rightYAxisDisplay\": \"off\"\n }\n }\n ],\n \"targets\": [\n {\n \"expr\": \"sum(rate(http_server_requests_seconds_count{ident=~\\\"$instance\\\", status=~\\\"5..\\\"}[1m])) by (ident)\",\n \"legend\": \"{{ident}}-HTTP - 5xx\",\n \"maxDataPoints\": 240,\n \"refId\": \"A\"\n }\n ],\n \"transformations\": [\n {\n \"id\": \"organize\",\n \"options\": {}\n }\n ],\n \"type\": \"timeseries\",\n \"version\": \"3.0.0\"\n },\n {\n \"custom\": {\n \"drawStyle\": \"lines\",\n \"fillOpacity\": 0.5,\n \"gradientMode\": \"none\",\n \"lineInterpolation\": \"linear\",\n \"lineWidth\": 1,\n \"pointSize\": 5,\n \"scaleDistribution\": {\n \"type\": \"linear\"\n },\n \"showPoints\": \"none\",\n \"spanNulls\": false,\n \"stack\": \"off\"\n },\n \"datasourceCate\": \"prometheus\",\n \"datasourceValue\": \"${datasource}\",\n \"id\": \"07d11fe1-7005-420f-bbfc-16f304294ef7\",\n \"layout\": {\n \"h\": 7,\n \"i\": \"07d11fe1-7005-420f-bbfc-16f304294ef7\",\n \"isResizable\": true,\n \"w\": 6,\n \"x\": 12,\n \"y\": 6\n },\n \"links\": [],\n \"maxPerRow\": 4,\n \"name\": \"Duration\",\n \"options\": {\n \"legend\": {\n \"behaviour\": \"showItem\",\n \"displayMode\": \"hidden\",\n \"heightInPercentage\": 30,\n \"placement\": \"bottom\"\n },\n \"standardOptions\": {\n \"decimals\": 2,\n \"util\": \"none\"\n },\n \"thresholds\": {\n \"steps\": [\n {\n \"color\": \"#634CD9\",\n \"type\": \"base\",\n \"value\": null\n }\n ]\n },\n \"tooltip\": {\n \"mode\": \"all\",\n \"sort\": \"none\"\n }\n },\n \"overrides\": [\n {\n \"matcher\": {\n \"id\": \"byFrameRefID\"\n },\n \"properties\": {\n \"rightYAxisDisplay\": \"off\"\n }\n }\n ],\n \"targets\": [\n {\n \"expr\": \"sum(http_server_requests_seconds_sum{ident=~\\\"$instance\\\", status!~\\\"5..\\\"}[1m]) by(ident)/on(ident)(sum(http_server_requests_seconds_count{ident=~\\\"$instance\\\", status!~\\\"5..\\\"}[1m]) by(ident))\",\n \"legend\": \"{{ident}}-HTTP - AVG\",\n \"maxDataPoints\": 240,\n \"refId\": \"A\"\n },\n {\n \"expr\": \"max(http_server_requests_seconds_max{ident=~\\\"$instance\\\", status!~\\\"5..\\\"}) by (ident)\",\n \"hide\": false,\n \"legend\": \"{{ident}}-HTTP - MAX\",\n \"maxDataPoints\": 240,\n \"refId\": \"B\"\n }\n ],\n \"transformations\": [\n {\n \"id\": \"organize\",\n \"options\": {}\n }\n ],\n \"type\": \"timeseries\",\n \"version\": \"3.0.0\"\n },\n {\n \"custom\": {\n \"drawStyle\": \"lines\",\n \"fillOpacity\": 0.5,\n \"gradientMode\": \"none\",\n \"lineInterpolation\": \"linear\",\n \"lineWidth\": 1,\n \"scaleDistribution\": {\n \"type\": \"linear\"\n },\n \"spanNulls\": false,\n \"stack\": \"off\"\n },\n \"datasourceCate\": \"prometheus\",\n \"datasourceValue\": \"${datasource}\",\n \"description\": \"\",\n \"id\": \"caf07cdd-42e4-427b-b511-ee967246330a\",\n \"layout\": {\n \"h\": 7,\n \"i\": \"caf07cdd-42e4-427b-b511-ee967246330a\",\n \"isResizable\": true,\n \"w\": 6,\n \"x\": 18,\n \"y\": 6\n },\n \"links\": [],\n \"maxPerRow\": 4,\n \"name\": \"Utilisation\",\n \"options\": {\n \"legend\": {\n \"behaviour\": \"showItem\",\n \"displayMode\": \"hidden\"\n },\n \"standardOptions\": {},\n \"thresholds\": {\n \"steps\": [\n {\n \"color\": \"#634CD9\",\n \"type\": \"base\",\n \"value\": null\n }\n ]\n },\n \"tooltip\": {\n \"mode\": \"all\",\n \"sort\": \"none\"\n }\n },\n \"overrides\": [\n {\n \"matcher\": {\n \"id\": \"byFrameRefID\"\n },\n \"properties\": {\n \"rightYAxisDisplay\": \"off\"\n }\n }\n ],\n \"targets\": [\n {\n \"expr\": \"tomcat_threads_busy{ident=~\\\"$instance\\\"} or tomcat_threads_busy_threads{ident=~\\\"$instance\\\"}\",\n \"legend\": \"{{ident}}-TOMCAT - BSY\",\n \"maxDataPoints\": 240,\n \"refId\": \"A\"\n },\n {\n \"expr\": \"tomcat_threads_current{ident=~\\\"$instance\\\"} or tomcat_threads_current_threads{ident=~\\\"$instance\\\"}\",\n \"legend\": \"{{ident}}-TOMCAT - CUR\",\n \"maxDataPoints\": 240,\n \"refId\": \"B\"\n },\n {\n \"expr\": \"tomcat_threads_config_max{ident=~\\\"$instance\\\"} or tomcat_threads_config_max_threads{ident=~\\\"$instance\\\"}\",\n \"legend\": \"{{ident}}-TOMCAT - MAX\",\n \"maxDataPoints\": 240,\n \"refId\": \"C\"\n },\n {\n \"expr\": \"jetty_threads_busy{ident=~\\\"$instance\\\"}\",\n \"legend\": \"{{ident}}-JETTY - BSY\",\n \"maxDataPoints\": 240,\n \"refId\": \"D\"\n },\n {\n \"expr\": \"jetty_threads_current{ident=~\\\"$instance\\\"}\",\n \"legend\": \"{{ident}}-JETTY - CUR\",\n \"maxDataPoints\": 240,\n \"refId\": \"E\"\n },\n {\n \"expr\": \"jetty_threads_config_max{ident=~\\\"$instance\\\"}\",\n \"legend\": \"{{ident}}-JETTY - MAX\",\n \"maxDataPoints\": 240,\n \"refId\": \"F\"\n }\n ],\n \"transformations\": [\n {\n \"id\": \"organize\",\n \"options\": {}\n }\n ],\n \"type\": \"timeseries\",\n \"version\": \"3.0.0\"\n },\n {\n \"collapsed\": true,\n \"id\": \"83e3307c-b862-471b-a14f-9f88c8b67dbf\",\n \"layout\": {\n \"h\": 1,\n \"i\": \"83e3307c-b862-471b-a14f-9f88c8b67dbf\",\n \"isResizable\": false,\n \"w\": 24,\n \"x\": 0,\n \"y\": 13\n },\n \"name\": \"JVM Memory\",\n \"panels\": [],\n \"type\": \"row\",\n \"version\": \"3.0.0\"\n },\n {\n \"custom\": {\n \"drawStyle\": \"lines\",\n \"fillOpacity\": 0,\n \"gradientMode\": \"none\",\n \"lineInterpolation\": \"smooth\",\n \"lineWidth\": 1,\n \"scaleDistribution\": {\n \"type\": \"linear\"\n },\n \"spanNulls\": false,\n \"stack\": \"off\"\n },\n \"datasourceCate\": \"prometheus\",\n \"datasourceValue\": \"${datasource}\",\n \"id\": \"1aeab3d4-de80-4795-ae7e-57c9b085a074\",\n \"layout\": {\n \"h\": 7,\n \"i\": \"1aeab3d4-de80-4795-ae7e-57c9b085a074\",\n \"isResizable\": true,\n \"w\": 6,\n \"x\": 0,\n \"y\": 14\n },\n \"links\": [],\n \"maxPerRow\": 4,\n \"name\": \"JVM Heap\",\n \"options\": {\n \"legend\": {\n \"behaviour\": \"showItem\",\n \"displayMode\": \"hidden\"\n },\n \"standardOptions\": {\n \"decimals\": 2,\n \"util\": \"bytesIEC\"\n },\n \"thresholds\": {\n \"steps\": [\n {\n \"color\": \"#634CD9\",\n \"type\": \"base\",\n \"value\": null\n }\n ]\n },\n \"tooltip\": {\n \"mode\": \"all\",\n \"sort\": \"none\"\n }\n },\n \"overrides\": [\n {\n \"matcher\": {\n \"id\": \"byFrameRefID\"\n },\n \"properties\": {\n \"rightYAxisDisplay\": \"off\",\n \"standardOptions\": {\n \"decimals\": null\n }\n }\n }\n ],\n \"targets\": [\n {\n \"expr\": \"sum(jvm_memory_used_bytes{ident=~\\\"$instance\\\", area=\\\"heap\\\"}) by (ident)\",\n \"legend\": \"{{ident}}-used\",\n \"maxDataPoints\": 240,\n \"refId\": \"A\"\n },\n {\n \"expr\": \"sum(jvm_memory_committed_bytes{ident=~\\\"$instance\\\", area=\\\"heap\\\"}) by (ident)\",\n \"legend\": \"{{ident}}-committed\",\n \"maxDataPoints\": 240,\n \"refId\": \"B\"\n },\n {\n \"expr\": \"sum(jvm_memory_max_bytes{ident=~\\\"$instance\\\", area=\\\"heap\\\"}) by (ident)\",\n \"legend\": \"{{ident}}-max\",\n \"maxDataPoints\": 240,\n \"refId\": \"C\"\n }\n ],\n \"transformations\": [\n {\n \"id\": \"organize\",\n \"options\": {}\n }\n ],\n \"type\": \"timeseries\",\n \"version\": \"3.0.0\"\n },\n {\n \"custom\": {\n \"drawStyle\": \"lines\",\n \"fillOpacity\": 0,\n \"gradientMode\": \"none\",\n \"lineInterpolation\": \"linear\",\n \"lineWidth\": 1,\n \"scaleDistribution\": {\n \"type\": \"linear\"\n },\n \"spanNulls\": false,\n \"stack\": \"off\"\n },\n \"datasourceCate\": \"prometheus\",\n \"datasourceValue\": \"${datasource}\",\n \"id\": \"dd9a63b6-9a33-416f-8dbe-dbbae1ff3fed\",\n \"layout\": {\n \"h\": 7,\n \"i\": \"dd9a63b6-9a33-416f-8dbe-dbbae1ff3fed\",\n \"isResizable\": true,\n \"w\": 6,\n \"x\": 6,\n \"y\": 14\n },\n \"links\": [],\n \"maxPerRow\": 4,\n \"name\": \"JVM Non-Heap\",\n \"options\": {\n \"legend\": {\n \"behaviour\": \"showItem\",\n \"displayMode\": \"hidden\"\n },\n \"standardOptions\": {\n \"decimals\": 2,\n \"util\": \"bytesIEC\"\n },\n \"thresholds\": {\n \"steps\": [\n {\n \"color\": \"#634CD9\",\n \"type\": \"base\",\n \"value\": null\n }\n ]\n },\n \"tooltip\": {\n \"mode\": \"all\",\n \"sort\": \"none\"\n },\n \"valueMappings\": []\n },\n \"overrides\": [\n {\n \"matcher\": {\n \"id\": \"byFrameRefID\"\n },\n \"properties\": {\n \"rightYAxisDisplay\": \"off\"\n }\n }\n ],\n \"targets\": [\n {\n \"expr\": \"sum(jvm_memory_used_bytes{ident=~\\\"$instance\\\", area=\\\"nonheap\\\"}) by (ident)\",\n \"legend\": \"{{ident}}-used\",\n \"maxDataPoints\": 240,\n \"refId\": \"A\"\n },\n {\n \"expr\": \"sum(jvm_memory_committed_bytes{ident=~\\\"$instance\\\", area=\\\"nonheap\\\"}) by (ident)\",\n \"legend\": \"{{ident}}-committed\",\n \"maxDataPoints\": 240,\n \"refId\": \"B\"\n },\n {\n \"expr\": \"sum(jvm_memory_max_bytes{ident=~\\\"$instance\\\", area=\\\"nonheap\\\"}) by (ident)\",\n \"legend\": \"{{ident}}-max\",\n \"maxDataPoints\": 240,\n \"refId\": \"C\"\n }\n ],\n \"transformations\": [\n {\n \"id\": \"organize\",\n \"options\": {}\n }\n ],\n \"type\": \"timeseries\",\n \"version\": \"3.0.0\"\n },\n {\n \"custom\": {\n \"drawStyle\": \"lines\",\n \"fillOpacity\": 0.5,\n \"gradientMode\": \"none\",\n \"lineInterpolation\": \"linear\",\n \"lineWidth\": 1,\n \"scaleDistribution\": {\n \"type\": \"linear\"\n },\n \"spanNulls\": false,\n \"stack\": \"off\"\n },\n \"datasourceCate\": \"prometheus\",\n \"datasourceValue\": \"${datasource}\",\n \"id\": \"df058502-188f-4711-b1da-3240a39cb35b\",\n \"layout\": {\n \"h\": 7,\n \"i\": \"df058502-188f-4711-b1da-3240a39cb35b\",\n \"isResizable\": true,\n \"w\": 6,\n \"x\": 12,\n \"y\": 14\n },\n \"links\": [],\n \"maxPerRow\": 4,\n \"name\": \"JVM Total\",\n \"options\": {\n \"legend\": {\n \"behaviour\": \"showItem\",\n \"displayMode\": \"hidden\"\n },\n \"standardOptions\": {},\n \"thresholds\": {\n \"steps\": [\n {\n \"color\": \"#634CD9\",\n \"type\": \"base\",\n \"value\": null\n }\n ]\n },\n \"tooltip\": {\n \"mode\": \"all\",\n \"sort\": \"none\"\n }\n },\n \"overrides\": [\n {\n \"matcher\": {\n \"id\": \"byFrameRefID\"\n },\n \"properties\": {\n \"rightYAxisDisplay\": \"off\"\n }\n }\n ],\n \"targets\": [\n {\n \"expr\": \"sum(jvm_memory_used_bytes{ident=\\\"$instance\\\"})\",\n \"legend\": \"used\",\n \"refId\": \"A\"\n },\n {\n \"expr\": \"sum(jvm_memory_committed_bytes{ident=\\\"$instance\\\"})\",\n \"legend\": \"committed\",\n \"refId\": \"B\"\n },\n {\n \"expr\": \"sum(jvm_memory_max_bytes{ident=\\\"$instance\\\"})\",\n \"legend\": \"max\",\n \"refId\": \"C\"\n },\n {\n \"expr\": \"process_memory_rss_bytes{ident=\\\"$instance\\\"}\",\n \"legend\": \"rss\",\n \"refId\": \"E\"\n },\n {\n \"expr\": \"process_memory_pss_bytes{ident=\\\"$instance\\\"}\",\n \"legend\": \"pss\",\n \"refId\": \"F\"\n },\n {\n \"expr\": \"process_memory_swap_bytes{ident=\\\"$instance\\\"}\",\n \"legend\": \"swap\",\n \"refId\": \"G\"\n },\n {\n \"expr\": \"process_memory_swappss_bytes{ident=\\\"$instance\\\"}\",\n \"legend\": \"swappss\",\n \"refId\": \"H\"\n },\n {\n \"expr\": \"process_memory_pss_bytes{ident=\\\"$instance\\\"} + process_memory_swap_bytes{ident=\\\"$instance\\\"}\",\n \"legend\": \"phys (pss+swap)\",\n \"refId\": \"I\"\n }\n ],\n \"transformations\": [\n {\n \"id\": \"organize\",\n \"options\": {}\n }\n ],\n \"type\": \"timeseries\",\n \"version\": \"3.0.0\"\n },\n {\n \"custom\": {\n \"drawStyle\": \"lines\",\n \"fillOpacity\": 0.5,\n \"gradientMode\": \"none\",\n \"lineInterpolation\": \"linear\",\n \"lineWidth\": 1,\n \"scaleDistribution\": {\n \"type\": \"linear\"\n },\n \"spanNulls\": false,\n \"stack\": \"off\"\n },\n \"datasourceCate\": \"prometheus\",\n \"datasourceValue\": \"${datasource}\",\n \"id\": \"1607d97f-074a-457c-90f2-c6ccbf5ffef3\",\n \"layout\": {\n \"h\": 7,\n \"i\": \"1607d97f-074a-457c-90f2-c6ccbf5ffef3\",\n \"isResizable\": true,\n \"w\": 6,\n \"x\": 18,\n \"y\": 14\n },\n \"links\": [],\n \"maxPerRow\": 4,\n \"name\": \"JVM Native Memory\",\n \"options\": {\n \"legend\": {\n \"behaviour\": \"showItem\",\n \"displayMode\": \"hidden\"\n },\n \"standardOptions\": {},\n \"thresholds\": {\n \"steps\": [\n {\n \"color\": \"#634CD9\",\n \"type\": \"base\",\n \"value\": null\n }\n ]\n },\n \"tooltip\": {\n \"mode\": \"all\",\n \"sort\": \"none\"\n }\n },\n \"overrides\": [\n {\n \"matcher\": {\n \"id\": \"byFrameRefID\"\n },\n \"properties\": {\n \"rightYAxisDisplay\": \"off\"\n }\n }\n ],\n \"targets\": [\n {\n \"expr\": \"(process_memory_pss_bytes{ident=\\\"$instance\\\"} + process_memory_swap_bytes{ident=\\\"$instance\\\"} - on(instance) sum(jvm_memory_committed_bytes{ident=\\\"$instance\\\"}) by(instance)) >= 0\",\n \"legend\": \"native\",\n \"refId\": \"A\"\n }\n ],\n \"transformations\": [\n {\n \"id\": \"organize\",\n \"options\": {}\n }\n ],\n \"type\": \"timeseries\",\n \"version\": \"3.0.0\"\n },\n {\n \"collapsed\": true,\n \"id\": \"ea05f925-19aa-4ba4-8daa-4133e939c5fb\",\n \"layout\": {\n \"h\": 1,\n \"i\": \"ea05f925-19aa-4ba4-8daa-4133e939c5fb\",\n \"isResizable\": false,\n \"w\": 24,\n \"x\": 0,\n \"y\": 28\n },\n \"name\": \"JVM Misc\",\n \"panels\": [],\n \"type\": \"row\",\n \"version\": \"3.0.0\"\n },\n {\n \"custom\": {\n \"drawStyle\": \"lines\",\n \"fillOpacity\": 0.5,\n \"gradientMode\": \"none\",\n \"lineInterpolation\": \"linear\",\n \"lineWidth\": 1,\n \"scaleDistribution\": {\n \"type\": \"linear\"\n },\n \"spanNulls\": false,\n \"stack\": \"off\"\n },\n \"datasourceCate\": \"prometheus\",\n \"datasourceValue\": \"${datasource}\",\n \"id\": \"8e65b992-ea8b-40b0-b201-23c8e54436a5\",\n \"layout\": {\n \"h\": 7,\n \"i\": \"8e65b992-ea8b-40b0-b201-23c8e54436a5\",\n \"isResizable\": true,\n \"w\": 6,\n \"x\": 0,\n \"y\": 29\n },\n \"links\": [],\n \"maxPerRow\": 4,\n \"name\": \"CPU\",\n \"options\": {\n \"legend\": {\n \"behaviour\": \"showItem\",\n \"displayMode\": \"hidden\"\n },\n \"standardOptions\": {},\n \"thresholds\": {\n \"steps\": [\n {\n \"color\": \"#634CD9\",\n \"type\": \"base\",\n \"value\": null\n }\n ]\n },\n \"tooltip\": {\n \"mode\": \"all\",\n \"sort\": \"none\"\n }\n },\n \"overrides\": [\n {\n \"matcher\": {\n \"id\": \"byFrameRefID\"\n },\n \"properties\": {\n \"rightYAxisDisplay\": \"off\"\n }\n }\n ],\n \"targets\": [\n {\n \"expr\": \"system_cpu_usage{ident=\\\"$instance\\\"}\",\n \"legend\": \"system\",\n \"refId\": \"A\"\n },\n {\n \"expr\": \"process_cpu_usage{ident=\\\"$instance\\\"}\",\n \"legend\": \"process\",\n \"refId\": \"B\"\n },\n {\n \"expr\": \"avg_over_time(process_cpu_usage{ident=\\\"$instance\\\"}[1h])\",\n \"legend\": \"process-1h\",\n \"refId\": \"C\"\n }\n ],\n \"transformations\": [\n {\n \"id\": \"organize\",\n \"options\": {}\n }\n ],\n \"type\": \"timeseries\",\n \"version\": \"3.0.0\"\n },\n {\n \"custom\": {\n \"drawStyle\": \"lines\",\n \"fillOpacity\": 0.5,\n \"gradientMode\": \"none\",\n \"lineInterpolation\": \"linear\",\n \"lineWidth\": 1,\n \"scaleDistribution\": {\n \"type\": \"linear\"\n },\n \"spanNulls\": false,\n \"stack\": \"off\"\n },\n \"datasourceCate\": \"prometheus\",\n \"datasourceValue\": \"${datasource}\",\n \"id\": \"c8db3f1c-b857-473b-be1a-4d4d5b1d7618\",\n \"layout\": {\n \"h\": 7,\n \"i\": \"c8db3f1c-b857-473b-be1a-4d4d5b1d7618\",\n \"isResizable\": true,\n \"w\": 6,\n \"x\": 6,\n \"y\": 29\n },\n \"links\": [],\n \"maxPerRow\": 4,\n \"name\": \"File Descriptors\",\n \"options\": {\n \"legend\": {\n \"behaviour\": \"showItem\",\n \"displayMode\": \"hidden\"\n },\n \"standardOptions\": {},\n \"thresholds\": {\n \"steps\": [\n {\n \"color\": \"#634CD9\",\n \"type\": \"base\",\n \"value\": null\n }\n ]\n },\n \"tooltip\": {\n \"mode\": \"all\",\n \"sort\": \"none\"\n }\n },\n \"overrides\": [\n {\n \"matcher\": {\n \"id\": \"byFrameRefID\"\n },\n \"properties\": {\n \"rightYAxisDisplay\": \"off\"\n }\n }\n ],\n \"targets\": [\n {\n \"expr\": \"process_open_fds{ident=\\\"$instance\\\"}\",\n \"legend\": \"open\",\n \"refId\": \"A\"\n },\n {\n \"expr\": \"process_max_fds{ident=\\\"$instance\\\"}\",\n \"legend\": \"max\",\n \"refId\": \"B\"\n },\n {\n \"expr\": \"process_files_open{ident=\\\"$instance\\\"} or process_files_open_files{ident=\\\"$instance\\\"}\",\n \"legend\": \"open\",\n \"refId\": \"C\"\n },\n {\n \"expr\": \"process_files_max{ident=\\\"$instance\\\"} or process_files_max_files{ident=\\\"$instance\\\"}\",\n \"legend\": \"max\",\n \"refId\": \"D\"\n }\n ],\n \"transformations\": [\n {\n \"id\": \"organize\",\n \"options\": {}\n }\n ],\n \"type\": \"timeseries\",\n \"version\": \"3.0.0\"\n },\n {\n \"custom\": {\n \"drawStyle\": \"lines\",\n \"fillOpacity\": 0.5,\n \"gradientMode\": \"none\",\n \"lineInterpolation\": \"linear\",\n \"lineWidth\": 1,\n \"scaleDistribution\": {\n \"type\": \"linear\"\n },\n \"spanNulls\": false,\n \"stack\": \"off\"\n },\n \"datasourceCate\": \"prometheus\",\n \"datasourceValue\": \"${datasource}\",\n \"id\": \"d1e449d5-31e3-4df9-a69a-c22edab3a44e\",\n \"layout\": {\n \"h\": 7,\n \"i\": \"d1e449d5-31e3-4df9-a69a-c22edab3a44e\",\n \"isResizable\": true,\n \"w\": 6,\n \"x\": 12,\n \"y\": 29\n },\n \"links\": [],\n \"maxPerRow\": 4,\n \"name\": \"Threads\",\n \"options\": {\n \"legend\": {\n \"behaviour\": \"showItem\",\n \"displayMode\": \"hidden\"\n },\n \"standardOptions\": {},\n \"thresholds\": {\n \"steps\": [\n {\n \"color\": \"#634CD9\",\n \"type\": \"base\",\n \"value\": null\n }\n ]\n },\n \"tooltip\": {\n \"mode\": \"all\",\n \"sort\": \"none\"\n }\n },\n \"overrides\": [\n {\n \"matcher\": {\n \"id\": \"byFrameRefID\"\n },\n \"properties\": {\n \"rightYAxisDisplay\": \"off\"\n }\n }\n ],\n \"targets\": [\n {\n \"expr\": \"jvm_threads_live{ident=\\\"$instance\\\"} or jvm_threads_live_threads{ident=\\\"$instance\\\"}\",\n \"legend\": \"live\",\n \"refId\": \"A\"\n },\n {\n \"expr\": \"jvm_threads_daemon{ident=\\\"$instance\\\"} or jvm_threads_daemon_threads{ident=\\\"$instance\\\"}\",\n \"legend\": \"daemon\",\n \"refId\": \"B\"\n },\n {\n \"expr\": \"jvm_threads_peak{ident=\\\"$instance\\\"} or jvm_threads_peak_threads{ident=\\\"$instance\\\"}\",\n \"legend\": \"peak\",\n \"refId\": \"C\"\n },\n {\n \"expr\": \"process_threads{ident=\\\"$instance\\\"}\",\n \"legend\": \"process\",\n \"refId\": \"D\"\n }\n ],\n \"transformations\": [\n {\n \"id\": \"organize\",\n \"options\": {}\n }\n ],\n \"type\": \"timeseries\",\n \"version\": \"3.0.0\"\n },\n {\n \"custom\": {\n \"drawStyle\": \"lines\",\n \"fillOpacity\": 0.5,\n \"gradientMode\": \"none\",\n \"lineInterpolation\": \"linear\",\n \"lineWidth\": 1,\n \"scaleDistribution\": {\n \"type\": \"linear\"\n },\n \"spanNulls\": false,\n \"stack\": \"off\"\n },\n \"datasourceCate\": \"prometheus\",\n \"datasourceValue\": \"${datasource}\",\n \"id\": \"3b8ef3a3-f687-4cf9-8348-da9e60bfa0f5\",\n \"layout\": {\n \"h\": 7,\n \"i\": \"3b8ef3a3-f687-4cf9-8348-da9e60bfa0f5\",\n \"isResizable\": true,\n \"w\": 6,\n \"x\": 18,\n \"y\": 29\n },\n \"links\": [],\n \"maxPerRow\": 4,\n \"name\": \"Thread States\",\n \"options\": {\n \"legend\": {\n \"behaviour\": \"showItem\",\n \"displayMode\": \"hidden\"\n },\n \"standardOptions\": {},\n \"thresholds\": {\n \"steps\": [\n {\n \"color\": \"#634CD9\",\n \"type\": \"base\",\n \"value\": null\n }\n ]\n },\n \"tooltip\": {\n \"mode\": \"all\",\n \"sort\": \"none\"\n }\n },\n \"overrides\": [\n {\n \"matcher\": {\n \"id\": \"byFrameRefID\"\n },\n \"properties\": {\n \"rightYAxisDisplay\": \"off\"\n }\n }\n ],\n \"targets\": [\n {\n \"expr\": \"jvm_threads_states_threads{ident=\\\"$instance\\\"}\",\n \"legend\": \"{{state}}\",\n \"refId\": \"A\"\n }\n ],\n \"transformations\": [\n {\n \"id\": \"organize\",\n \"options\": {}\n }\n ],\n \"type\": \"timeseries\",\n \"version\": \"3.0.0\"\n },\n {\n \"custom\": {\n \"drawStyle\": \"lines\",\n \"fillOpacity\": 0.5,\n \"gradientMode\": \"none\",\n \"lineInterpolation\": \"linear\",\n \"lineWidth\": 1,\n \"scaleDistribution\": {\n \"type\": \"linear\"\n },\n \"spanNulls\": false,\n \"stack\": \"off\"\n },\n \"datasourceCate\": \"prometheus\",\n \"datasourceValue\": \"${datasource}\",\n \"id\": \"2e02407c-9beb-460a-bca8-9b4dfd2e3a37\",\n \"layout\": {\n \"h\": 8,\n \"i\": \"2e02407c-9beb-460a-bca8-9b4dfd2e3a37\",\n \"isResizable\": true,\n \"w\": 24,\n \"x\": 0,\n \"y\": 36\n },\n \"links\": [],\n \"maxPerRow\": 4,\n \"name\": \"Log Events (1m)\",\n \"options\": {\n \"legend\": {\n \"behaviour\": \"showItem\",\n \"displayMode\": \"hidden\"\n },\n \"standardOptions\": {},\n \"thresholds\": {\n \"steps\": [\n {\n \"color\": \"#634CD9\",\n \"type\": \"base\",\n \"value\": null\n }\n ]\n },\n \"tooltip\": {\n \"mode\": \"all\",\n \"sort\": \"none\"\n }\n },\n \"overrides\": [\n {\n \"matcher\": {\n \"id\": \"byFrameRefID\"\n },\n \"properties\": {\n \"rightYAxisDisplay\": \"off\"\n }\n }\n ],\n \"targets\": [\n {\n \"expr\": \"increase(logback_events_total{ident=\\\"$instance\\\"}[1m])\",\n \"legend\": \"{{level}}\",\n \"refId\": \"A\"\n }\n ],\n \"transformations\": [\n {\n \"id\": \"organize\",\n \"options\": {}\n }\n ],\n \"type\": \"timeseries\",\n \"version\": \"3.0.0\"\n },\n {\n \"collapsed\": true,\n \"id\": \"84242a2f-64ec-4b71-8a9e-5441eb3ac271\",\n \"layout\": {\n \"h\": 1,\n \"i\": \"84242a2f-64ec-4b71-8a9e-5441eb3ac271\",\n \"isResizable\": false,\n \"w\": 24,\n \"x\": 0,\n \"y\": 44\n },\n \"name\": \"JVM Memory Pools (Heap)\",\n \"panels\": [],\n \"type\": \"row\",\n \"version\": \"3.0.0\"\n },\n {\n \"custom\": {\n \"drawStyle\": \"lines\",\n \"fillOpacity\": 0.5,\n \"gradientMode\": \"none\",\n \"lineInterpolation\": \"linear\",\n \"lineWidth\": 1,\n \"scaleDistribution\": {\n \"type\": \"linear\"\n },\n \"spanNulls\": false,\n \"stack\": \"off\"\n },\n \"datasourceCate\": \"prometheus\",\n \"datasourceValue\": \"${datasource}\",\n \"id\": \"22a3c8aa-4452-46c9-9439-4a5c524ab79e\",\n \"layout\": {\n \"h\": 8,\n \"i\": \"22a3c8aa-4452-46c9-9439-4a5c524ab79e\",\n \"isResizable\": true,\n \"w\": 24,\n \"x\": 0,\n \"y\": 45\n },\n \"links\": [],\n \"maxPerRow\": 3,\n \"name\": \"$jvm_memory_pool_heap\",\n \"options\": {\n \"legend\": {\n \"behaviour\": \"showItem\",\n \"displayMode\": \"hidden\"\n },\n \"standardOptions\": {},\n \"thresholds\": {\n \"steps\": [\n {\n \"color\": \"#634CD9\",\n \"type\": \"base\",\n \"value\": null\n }\n ]\n },\n \"tooltip\": {\n \"mode\": \"all\",\n \"sort\": \"none\"\n }\n },\n \"overrides\": [\n {\n \"matcher\": {\n \"id\": \"byFrameRefID\"\n },\n \"properties\": {\n \"rightYAxisDisplay\": \"off\"\n }\n }\n ],\n \"repeat\": \"jvm_memory_pool_heap\",\n \"targets\": [\n {\n \"expr\": \"jvm_memory_used_bytes{ident=\\\"$instance\\\", id=\\\"$jvm_memory_pool_heap\\\"}\",\n \"legend\": \"used\",\n \"refId\": \"A\"\n },\n {\n \"expr\": \"jvm_memory_committed_bytes{ident=\\\"$instance\\\", id=\\\"$jvm_memory_pool_heap\\\"}\",\n \"legend\": \"commited\",\n \"refId\": \"B\"\n },\n {\n \"expr\": \"jvm_memory_max_bytes{ident=\\\"$instance\\\", id=\\\"$jvm_memory_pool_heap\\\"}\",\n \"legend\": \"max\",\n \"refId\": \"C\"\n }\n ],\n \"transformations\": [\n {\n \"id\": \"organize\",\n \"options\": {}\n }\n ],\n \"type\": \"timeseries\",\n \"version\": \"3.0.0\"\n },\n {\n \"collapsed\": true,\n \"id\": \"5b6abe6d-7496-454c-9ab9-fcb7f068f626\",\n \"layout\": {\n \"h\": 1,\n \"i\": \"5b6abe6d-7496-454c-9ab9-fcb7f068f626\",\n \"isResizable\": false,\n \"w\": 24,\n \"x\": 0,\n \"y\": 77\n },\n \"name\": \"JVM Memory Pools (Non-Heap)\",\n \"panels\": [],\n \"type\": \"row\",\n \"version\": \"3.0.0\"\n },\n {\n \"custom\": {\n \"drawStyle\": \"lines\",\n \"fillOpacity\": 0.5,\n \"gradientMode\": \"none\",\n \"lineInterpolation\": \"linear\",\n \"lineWidth\": 1,\n \"scaleDistribution\": {\n \"type\": \"linear\"\n },\n \"spanNulls\": false,\n \"stack\": \"off\"\n },\n \"datasourceCate\": \"prometheus\",\n \"datasourceValue\": \"${datasource}\",\n \"id\": \"6ebac55a-4d88-4f3e-8414-5df8e27d3d60\",\n \"layout\": {\n \"h\": 7,\n \"i\": \"6ebac55a-4d88-4f3e-8414-5df8e27d3d60\",\n \"isResizable\": true,\n \"w\": 24,\n \"x\": 0,\n \"y\": 78\n },\n \"links\": [],\n \"maxPerRow\": 3,\n \"name\": \"$jvm_memory_pool_nonheap\",\n \"options\": {\n \"legend\": {\n \"behaviour\": \"showItem\",\n \"displayMode\": \"hidden\"\n },\n \"standardOptions\": {},\n \"thresholds\": {\n \"steps\": [\n {\n \"color\": \"#634CD9\",\n \"type\": \"base\",\n \"value\": null\n }\n ]\n },\n \"tooltip\": {\n \"mode\": \"all\",\n \"sort\": \"none\"\n }\n },\n \"overrides\": [\n {\n \"matcher\": {\n \"id\": \"byFrameRefID\"\n },\n \"properties\": {\n \"rightYAxisDisplay\": \"off\"\n }\n }\n ],\n \"repeat\": \"jvm_memory_pool_nonheap\",\n \"targets\": [\n {\n \"expr\": \"jvm_memory_used_bytes{ident=\\\"$instance\\\", id=\\\"$jvm_memory_pool_nonheap\\\"}\",\n \"legend\": \"used\",\n \"refId\": \"A\"\n },\n {\n \"expr\": \"jvm_memory_committed_bytes{ident=\\\"$instance\\\", id=\\\"$jvm_memory_pool_nonheap\\\"}\",\n \"legend\": \"commited\",\n \"refId\": \"B\"\n },\n {\n \"expr\": \"jvm_memory_max_bytes{ident=\\\"$instance\\\", id=\\\"$jvm_memory_pool_nonheap\\\"}\",\n \"legend\": \"max\",\n \"refId\": \"C\"\n }\n ],\n \"transformations\": [\n {\n \"id\": \"organize\",\n \"options\": {}\n }\n ],\n \"type\": \"timeseries\",\n \"version\": \"3.0.0\"\n },\n {\n \"collapsed\": true,\n \"id\": \"ec6d25b8-cfe1-42c0-afc4-c32886432636\",\n \"layout\": {\n \"h\": 1,\n \"i\": \"ec6d25b8-cfe1-42c0-afc4-c32886432636\",\n \"isResizable\": false,\n \"w\": 24,\n \"x\": 0,\n \"y\": 106\n },\n \"name\": \"Garbage Collection\",\n \"panels\": [],\n \"type\": \"row\",\n \"version\": \"3.0.0\"\n },\n {\n \"custom\": {\n \"drawStyle\": \"lines\",\n \"fillOpacity\": 0.5,\n \"gradientMode\": \"none\",\n \"lineInterpolation\": \"linear\",\n \"lineWidth\": 1,\n \"scaleDistribution\": {\n \"type\": \"linear\"\n },\n \"spanNulls\": false,\n \"stack\": \"off\"\n },\n \"datasourceCate\": \"prometheus\",\n \"datasourceValue\": \"${datasource}\",\n \"id\": \"adf56723-9689-4202-a7dd-1d9d844a5e66\",\n \"layout\": {\n \"h\": 7,\n \"i\": \"adf56723-9689-4202-a7dd-1d9d844a5e66\",\n \"isResizable\": true,\n \"w\": 8,\n \"x\": 0,\n \"y\": 107\n },\n \"links\": [],\n \"maxPerRow\": 4,\n \"name\": \"Collections\",\n \"options\": {\n \"legend\": {\n \"behaviour\": \"showItem\",\n \"displayMode\": \"hidden\"\n },\n \"standardOptions\": {},\n \"thresholds\": {\n \"steps\": [\n {\n \"color\": \"#634CD9\",\n \"type\": \"base\",\n \"value\": null\n }\n ]\n },\n \"tooltip\": {\n \"mode\": \"all\",\n \"sort\": \"none\"\n }\n },\n \"overrides\": [\n {\n \"matcher\": {\n \"id\": \"byFrameRefID\"\n },\n \"properties\": {\n \"rightYAxisDisplay\": \"off\"\n }\n }\n ],\n \"targets\": [\n {\n \"expr\": \"rate(jvm_gc_pause_seconds_count{ident=\\\"$instance\\\"}[1m])\",\n \"legend\": \"{{action}} ({{cause}})\",\n \"refId\": \"A\"\n }\n ],\n \"transformations\": [\n {\n \"id\": \"organize\",\n \"options\": {}\n }\n ],\n \"type\": \"timeseries\",\n \"version\": \"3.0.0\"\n },\n {\n \"custom\": {\n \"drawStyle\": \"lines\",\n \"fillOpacity\": 0.5,\n \"gradientMode\": \"none\",\n \"lineInterpolation\": \"linear\",\n \"lineWidth\": 1,\n \"scaleDistribution\": {\n \"type\": \"linear\"\n },\n \"spanNulls\": false,\n \"stack\": \"off\"\n },\n \"datasourceCate\": \"prometheus\",\n \"datasourceValue\": \"${datasource}\",\n \"id\": \"7caea97e-1cfb-45c6-892f-fe89377bd8fa\",\n \"layout\": {\n \"h\": 7,\n \"i\": \"7caea97e-1cfb-45c6-892f-fe89377bd8fa\",\n \"isResizable\": true,\n \"w\": 8,\n \"x\": 8,\n \"y\": 107\n },\n \"links\": [],\n \"maxPerRow\": 4,\n \"name\": \"Pause Durations\",\n \"options\": {\n \"legend\": {\n \"behaviour\": \"showItem\",\n \"displayMode\": \"hidden\"\n },\n \"standardOptions\": {},\n \"thresholds\": {\n \"steps\": [\n {\n \"color\": \"#634CD9\",\n \"type\": \"base\",\n \"value\": null\n }\n ]\n },\n \"tooltip\": {\n \"mode\": \"all\",\n \"sort\": \"none\"\n }\n },\n \"overrides\": [\n {\n \"matcher\": {\n \"id\": \"byFrameRefID\"\n },\n \"properties\": {\n \"rightYAxisDisplay\": \"off\"\n }\n }\n ],\n \"targets\": [\n {\n \"expr\": \"rate(jvm_gc_pause_seconds_sum{ident=\\\"$instance\\\"}[1m])/rate(jvm_gc_pause_seconds_count{ident=\\\"$instance\\\"}[1m])\",\n \"legend\": \"avg {{action}} ({{cause}})\",\n \"refId\": \"A\"\n },\n {\n \"expr\": \"jvm_gc_pause_seconds_max{ident=\\\"$instance\\\"}\",\n \"legend\": \"max {{action}} ({{cause}})\",\n \"refId\": \"B\"\n }\n ],\n \"transformations\": [\n {\n \"id\": \"organize\",\n \"options\": {}\n }\n ],\n \"type\": \"timeseries\",\n \"version\": \"3.0.0\"\n },\n {\n \"custom\": {\n \"drawStyle\": \"lines\",\n \"fillOpacity\": 0.5,\n \"gradientMode\": \"none\",\n \"lineInterpolation\": \"linear\",\n \"lineWidth\": 1,\n \"scaleDistribution\": {\n \"type\": \"linear\"\n },\n \"spanNulls\": false,\n \"stack\": \"off\"\n },\n \"datasourceCate\": \"prometheus\",\n \"datasourceValue\": \"${datasource}\",\n \"id\": \"00223434-f6e0-4c53-8562-38bcb46948f4\",\n \"layout\": {\n \"h\": 7,\n \"i\": \"00223434-f6e0-4c53-8562-38bcb46948f4\",\n \"isResizable\": true,\n \"w\": 8,\n \"x\": 16,\n \"y\": 107\n },\n \"links\": [],\n \"maxPerRow\": 4,\n \"name\": \"Allocated/Promoted\",\n \"options\": {\n \"legend\": {\n \"behaviour\": \"showItem\",\n \"displayMode\": \"hidden\"\n },\n \"standardOptions\": {},\n \"thresholds\": {\n \"steps\": [\n {\n \"color\": \"#634CD9\",\n \"type\": \"base\",\n \"value\": null\n }\n ]\n },\n \"tooltip\": {\n \"mode\": \"all\",\n \"sort\": \"none\"\n }\n },\n \"overrides\": [\n {\n \"matcher\": {\n \"id\": \"byFrameRefID\"\n },\n \"properties\": {\n \"rightYAxisDisplay\": \"off\"\n }\n }\n ],\n \"targets\": [\n {\n \"expr\": \"rate(jvm_gc_memory_allocated_bytes_total{ident=\\\"$instance\\\"}[1m])\",\n \"legend\": \"allocated\",\n \"refId\": \"A\"\n },\n {\n \"expr\": \"rate(jvm_gc_memory_promoted_bytes_total{ident=\\\"$instance\\\"}[1m])\",\n \"legend\": \"promoted\",\n \"refId\": \"B\"\n }\n ],\n \"transformations\": [\n {\n \"id\": \"organize\",\n \"options\": {}\n }\n ],\n \"type\": \"timeseries\",\n \"version\": \"3.0.0\"\n },\n {\n \"custom\": {\n \"drawStyle\": \"lines\",\n \"fillOpacity\": 0.5,\n \"gradientMode\": \"none\",\n \"lineInterpolation\": \"linear\",\n \"lineWidth\": 1,\n \"scaleDistribution\": {\n \"type\": \"linear\"\n },\n \"spanNulls\": false,\n \"stack\": \"off\"\n },\n \"datasourceCate\": \"prometheus\",\n \"datasourceValue\": \"${datasource}\",\n \"id\": \"fe904abb-6089-453d-8e7e-79e2483ef9c9\",\n \"layout\": {\n \"h\": 7,\n \"i\": \"ea58a286-37cb-48a8-92f6-f09347a04964\",\n \"isResizable\": true,\n \"w\": 8,\n \"x\": 8,\n \"y\": 114\n },\n \"links\": [],\n \"maxPerRow\": 4,\n \"name\": \"Pause Durations\",\n \"options\": {\n \"legend\": {\n \"behaviour\": \"showItem\",\n \"displayMode\": \"hidden\"\n },\n \"standardOptions\": {},\n \"thresholds\": {\n \"steps\": [\n {\n \"color\": \"#634CD9\",\n \"type\": \"base\",\n \"value\": null\n }\n ]\n },\n \"tooltip\": {\n \"mode\": \"all\",\n \"sort\": \"none\"\n }\n },\n \"overrides\": [\n {\n \"matcher\": {\n \"id\": \"byFrameRefID\"\n },\n \"properties\": {\n \"rightYAxisDisplay\": \"off\"\n }\n }\n ],\n \"targets\": [\n {\n \"expr\": \"rate(jvm_gc_pause_seconds_sum{ident=\\\"$instance\\\"}[1m])/rate(jvm_gc_pause_seconds_count{ident=\\\"$instance\\\"}[1m])\",\n \"legend\": \"avg {{action}} ({{cause}})\",\n \"refId\": \"A\"\n },\n {\n \"expr\": \"jvm_gc_pause_seconds_max{ident=\\\"$instance\\\"}\",\n \"legend\": \"max {{action}} ({{cause}})\",\n \"refId\": \"B\"\n }\n ],\n \"transformations\": [\n {\n \"id\": \"organize\",\n \"options\": {}\n }\n ],\n \"type\": \"timeseries\",\n \"version\": \"3.0.0\"\n },\n {\n \"collapsed\": true,\n \"id\": \"a199f2f8-136c-44f4-aea5-da20e0e479fb\",\n \"layout\": {\n \"h\": 1,\n \"i\": \"a199f2f8-136c-44f4-aea5-da20e0e479fb\",\n \"isResizable\": false,\n \"w\": 24,\n \"x\": 0,\n \"y\": 121\n },\n \"name\": \"Classloading\",\n \"panels\": [],\n \"type\": \"row\",\n \"version\": \"3.0.0\"\n },\n {\n \"custom\": {\n \"drawStyle\": \"lines\",\n \"fillOpacity\": 0.5,\n \"gradientMode\": \"none\",\n \"lineInterpolation\": \"linear\",\n \"lineWidth\": 1,\n \"scaleDistribution\": {\n \"type\": \"linear\"\n },\n \"spanNulls\": false,\n \"stack\": \"off\"\n },\n \"datasourceCate\": \"prometheus\",\n \"datasourceValue\": \"${datasource}\",\n \"id\": \"903e6501-6f64-4860-a12a-4e07a7424ef8\",\n \"layout\": {\n \"h\": 7,\n \"i\": \"903e6501-6f64-4860-a12a-4e07a7424ef8\",\n \"isResizable\": true,\n \"w\": 12,\n \"x\": 0,\n \"y\": 122\n },\n \"links\": [],\n \"maxPerRow\": 4,\n \"name\": \"Classes loaded\",\n \"options\": {\n \"legend\": {\n \"behaviour\": \"showItem\",\n \"displayMode\": \"hidden\"\n },\n \"standardOptions\": {},\n \"thresholds\": {\n \"steps\": [\n {\n \"color\": \"#634CD9\",\n \"type\": \"base\",\n \"value\": null\n }\n ]\n },\n \"tooltip\": {\n \"mode\": \"all\",\n \"sort\": \"none\"\n }\n },\n \"overrides\": [\n {\n \"matcher\": {\n \"id\": \"byFrameRefID\"\n },\n \"properties\": {\n \"rightYAxisDisplay\": \"off\"\n }\n }\n ],\n \"targets\": [\n {\n \"expr\": \"jvm_classes_loaded{ident=\\\"$instance\\\"} or jvm_classes_loaded_classes{ident=\\\"$instance\\\"}\",\n \"legend\": \"loaded\",\n \"refId\": \"A\"\n }\n ],\n \"transformations\": [\n {\n \"id\": \"organize\",\n \"options\": {}\n }\n ],\n \"type\": \"timeseries\",\n \"version\": \"3.0.0\"\n },\n {\n \"custom\": {\n \"drawStyle\": \"lines\",\n \"fillOpacity\": 0.5,\n \"gradientMode\": \"none\",\n \"lineInterpolation\": \"linear\",\n \"lineWidth\": 1,\n \"scaleDistribution\": {\n \"type\": \"linear\"\n },\n \"spanNulls\": false,\n \"stack\": \"off\"\n },\n \"datasourceCate\": \"prometheus\",\n \"datasourceValue\": \"${datasource}\",\n \"id\": \"dc21d536-f4c0-48c0-99f1-eef82b30e979\",\n \"layout\": {\n \"h\": 7,\n \"i\": \"dc21d536-f4c0-48c0-99f1-eef82b30e979\",\n \"isResizable\": true,\n \"w\": 12,\n \"x\": 12,\n \"y\": 122\n },\n \"links\": [],\n \"maxPerRow\": 4,\n \"name\": \"Class delta (5m)\",\n \"options\": {\n \"legend\": {\n \"behaviour\": \"showItem\",\n \"displayMode\": \"hidden\"\n },\n \"standardOptions\": {},\n \"thresholds\": {\n \"steps\": [\n {\n \"color\": \"#634CD9\",\n \"type\": \"base\",\n \"value\": null\n }\n ]\n },\n \"tooltip\": {\n \"mode\": \"all\",\n \"sort\": \"none\"\n }\n },\n \"overrides\": [\n {\n \"matcher\": {\n \"id\": \"byFrameRefID\"\n },\n \"properties\": {\n \"rightYAxisDisplay\": \"off\"\n }\n }\n ],\n \"targets\": [\n {\n \"expr\": \"delta(jvm_classes_loaded{application=\\\"$application\\\",ident=\\\"$instance\\\"}[5m]) or delta(jvm_classes_loaded_classes{application=\\\"$application\\\",ident=\\\"$instance\\\"}[5m])\",\n \"legend\": \"delta\",\n \"refId\": \"A\"\n }\n ],\n \"transformations\": [\n {\n \"id\": \"organize\",\n \"options\": {}\n }\n ],\n \"type\": \"timeseries\",\n \"version\": \"3.0.0\"\n },\n {\n \"collapsed\": false,\n \"id\": \"6c164737-84da-4d51-911b-38e207bef57e\",\n \"layout\": {\n \"h\": 1,\n \"i\": \"6c164737-84da-4d51-911b-38e207bef57e\",\n \"isResizable\": false,\n \"w\": 24,\n \"x\": 0,\n \"y\": 129\n },\n \"name\": \"Buffer Pools\",\n \"panels\": [\n {\n \"custom\": {\n \"drawStyle\": \"lines\",\n \"fillOpacity\": 0.5,\n \"gradientMode\": \"none\",\n \"lineInterpolation\": \"linear\",\n \"lineWidth\": 1,\n \"scaleDistribution\": {\n \"type\": \"linear\"\n },\n \"spanNulls\": false,\n \"stack\": \"off\"\n },\n \"datasourceCate\": \"prometheus\",\n \"datasourceValue\": \"${datasource}\",\n \"id\": \"9ac2c14e-9871-4b84-a5cb-976f8dfe6c19\",\n \"layout\": {\n \"h\": 7,\n \"i\": \"9ac2c14e-9871-4b84-a5cb-976f8dfe6c19\",\n \"isResizable\": true,\n \"w\": 6,\n \"x\": 0,\n \"y\": 130\n },\n \"links\": [],\n \"maxPerRow\": 4,\n \"name\": \"Direct Buffers\",\n \"options\": {\n \"legend\": {\n \"behaviour\": \"showItem\",\n \"displayMode\": \"hidden\"\n },\n \"standardOptions\": {},\n \"thresholds\": {\n \"steps\": [\n {\n \"color\": \"#634CD9\",\n \"type\": \"base\",\n \"value\": null\n }\n ]\n },\n \"tooltip\": {\n \"mode\": \"all\",\n \"sort\": \"none\"\n }\n },\n \"overrides\": [\n {\n \"matcher\": {\n \"id\": \"byFrameRefID\"\n },\n \"properties\": {\n \"rightYAxisDisplay\": \"off\"\n }\n }\n ],\n \"targets\": [\n {\n \"expr\": \"jvm_buffer_memory_used_bytes{ident=\\\"$instance\\\", id=\\\"direct\\\"}\",\n \"legend\": \"used\",\n \"refId\": \"A\"\n },\n {\n \"expr\": \"jvm_buffer_total_capacity_bytes{ident=\\\"$instance\\\", id=\\\"direct\\\"}\",\n \"legend\": \"capacity\",\n \"refId\": \"B\"\n }\n ],\n \"transformations\": [\n {\n \"id\": \"organize\",\n \"options\": {}\n }\n ],\n \"type\": \"timeseries\",\n \"version\": \"3.0.0\"\n },\n {\n \"custom\": {\n \"drawStyle\": \"lines\",\n \"fillOpacity\": 0.5,\n \"gradientMode\": \"none\",\n \"lineInterpolation\": \"linear\",\n \"lineWidth\": 1,\n \"scaleDistribution\": {\n \"type\": \"linear\"\n },\n \"spanNulls\": false,\n \"stack\": \"off\"\n },\n \"datasourceCate\": \"prometheus\",\n \"datasourceValue\": \"${datasource}\",\n \"id\": \"f38df099-4559-4239-b283-21bd3949c81d\",\n \"layout\": {\n \"h\": 7,\n \"i\": \"f38df099-4559-4239-b283-21bd3949c81d\",\n \"isResizable\": true,\n \"w\": 6,\n \"x\": 6,\n \"y\": 130\n },\n \"links\": [],\n \"maxPerRow\": 4,\n \"name\": \"Direct Buffers\",\n \"options\": {\n \"legend\": {\n \"behaviour\": \"showItem\",\n \"displayMode\": \"hidden\"\n },\n \"standardOptions\": {},\n \"thresholds\": {\n \"steps\": [\n {\n \"color\": \"#634CD9\",\n \"type\": \"base\",\n \"value\": null\n }\n ]\n },\n \"tooltip\": {\n \"mode\": \"all\",\n \"sort\": \"none\"\n }\n },\n \"overrides\": [\n {\n \"matcher\": {\n \"id\": \"byFrameRefID\"\n },\n \"properties\": {\n \"rightYAxisDisplay\": \"off\"\n }\n }\n ],\n \"targets\": [\n {\n \"expr\": \"jvm_buffer_count{ident=\\\"$instance\\\", id=\\\"direct\\\"} or jvm_buffer_count_buffers{ident=\\\"$instance\\\", id=\\\"direct\\\"}\",\n \"legend\": \"count\",\n \"refId\": \"A\"\n }\n ],\n \"transformations\": [\n {\n \"id\": \"organize\",\n \"options\": {}\n }\n ],\n \"type\": \"timeseries\",\n \"version\": \"3.0.0\"\n },\n {\n \"custom\": {\n \"drawStyle\": \"lines\",\n \"fillOpacity\": 0.5,\n \"gradientMode\": \"none\",\n \"lineInterpolation\": \"linear\",\n \"lineWidth\": 1,\n \"scaleDistribution\": {\n \"type\": \"linear\"\n },\n \"spanNulls\": false,\n \"stack\": \"off\"\n },\n \"datasourceCate\": \"prometheus\",\n \"datasourceValue\": \"${datasource}\",\n \"id\": \"ef8f0a38-f98e-428c-a601-186dccafd2c1\",\n \"layout\": {\n \"h\": 7,\n \"i\": \"ef8f0a38-f98e-428c-a601-186dccafd2c1\",\n \"isResizable\": true,\n \"w\": 6,\n \"x\": 12,\n \"y\": 130\n },\n \"links\": [],\n \"maxPerRow\": 4,\n \"name\": \"Mapped Buffers\",\n \"options\": {\n \"legend\": {\n \"behaviour\": \"showItem\",\n \"displayMode\": \"hidden\"\n },\n \"standardOptions\": {},\n \"thresholds\": {\n \"steps\": [\n {\n \"color\": \"#634CD9\",\n \"type\": \"base\",\n \"value\": null\n }\n ]\n },\n \"tooltip\": {\n \"mode\": \"all\",\n \"sort\": \"none\"\n }\n },\n \"overrides\": [\n {\n \"matcher\": {\n \"id\": \"byFrameRefID\"\n },\n \"properties\": {\n \"rightYAxisDisplay\": \"off\"\n }\n }\n ],\n \"targets\": [\n {\n \"expr\": \"jvm_buffer_memory_used_bytes{ident=\\\"$instance\\\", id=\\\"mapped\\\"}\",\n \"legend\": \"used\",\n \"refId\": \"A\"\n },\n {\n \"expr\": \"jvm_buffer_total_capacity_bytes{ident=\\\"$instance\\\", id=\\\"mapped\\\"}\",\n \"legend\": \"capacity\",\n \"refId\": \"B\"\n }\n ],\n \"transformations\": [\n {\n \"id\": \"organize\",\n \"options\": {}\n }\n ],\n \"type\": \"timeseries\",\n \"version\": \"3.0.0\"\n },\n {\n \"custom\": {\n \"drawStyle\": \"lines\",\n \"fillOpacity\": 0.5,\n \"gradientMode\": \"none\",\n \"lineInterpolation\": \"linear\",\n \"lineWidth\": 1,\n \"scaleDistribution\": {\n \"type\": \"linear\"\n },\n \"spanNulls\": false,\n \"stack\": \"off\"\n },\n \"datasourceCate\": \"prometheus\",\n \"datasourceValue\": \"${datasource}\",\n \"id\": \"3abe8423-f8fd-44b8-8321-1753943d4e9c\",\n \"layout\": {\n \"h\": 7,\n \"i\": \"3abe8423-f8fd-44b8-8321-1753943d4e9c\",\n \"isResizable\": true,\n \"w\": 6,\n \"x\": 18,\n \"y\": 130\n },\n \"links\": [],\n \"maxPerRow\": 4,\n \"name\": \"Mapped Buffers\",\n \"options\": {\n \"legend\": {\n \"behaviour\": \"showItem\",\n \"displayMode\": \"hidden\"\n },\n \"standardOptions\": {},\n \"thresholds\": {\n \"steps\": [\n {\n \"color\": \"#634CD9\",\n \"type\": \"base\",\n \"value\": null\n }\n ]\n },\n \"tooltip\": {\n \"mode\": \"all\",\n \"sort\": \"none\"\n }\n },\n \"overrides\": [\n {\n \"matcher\": {\n \"id\": \"byFrameRefID\"\n },\n \"properties\": {\n \"rightYAxisDisplay\": \"off\"\n }\n }\n ],\n \"targets\": [\n {\n \"expr\": \"jvm_buffer_count{ident=\\\"$instance\\\", id=\\\"mapped\\\"} or jvm_buffer_count_buffers{ident=\\\"$instance\\\", id=\\\"mapped\\\"}\",\n \"legend\": \"count\",\n \"refId\": \"A\"\n }\n ],\n \"transformations\": [\n {\n \"id\": \"organize\",\n \"options\": {}\n }\n ],\n \"type\": \"timeseries\",\n \"version\": \"3.0.0\"\n }\n ],\n \"type\": \"row\",\n \"version\": \"3.0.0\"\n }\n ],\n \"var\": [\n {\n \"definition\": \"prometheus\",\n \"name\": \"datasource\",\n \"type\": \"datasource\"\n },\n {\n \"datasource\": {\n \"cate\": \"prometheus\",\n \"value\": \"${datasource}\"\n },\n \"definition\": \"label_values(jvm_memory_used_bytes, application)\",\n \"multi\": false,\n \"name\": \"application\",\n \"reg\": \"\",\n \"type\": \"query\"\n },\n {\n \"allOption\": true,\n \"datasource\": {\n \"cate\": \"prometheus\",\n \"value\": \"${datasource}\"\n },\n \"definition\": \"label_values(jvm_memory_used_bytes{application=\\\"$application\\\"}, ident)\",\n \"multi\": true,\n \"name\": \"instance\",\n \"reg\": \"\",\n \"type\": \"query\"\n },\n {\n \"datasource\": {\n \"cate\": \"prometheus\",\n \"value\": \"${datasource}\"\n },\n \"definition\": \"label_values(jvm_memory_used_bytes{application=\\\"$application\\\",ident=~\\\"$instance\\\",area=\\\"heap\\\", },id)\",\n \"hide\": false,\n \"multi\": false,\n \"name\": \"jvm_memory_pool_heap\",\n \"reg\": \"\",\n \"type\": \"query\"\n },\n {\n \"datasource\": {\n \"cate\": \"prometheus\",\n \"value\": \"${datasource}\"\n },\n \"definition\": \"label_values(jvm_memory_used_bytes{application=\\\"$application\\\",ident=~\\\"$instance\\\",area=\\\"nonheap\\\"}, id)\",\n \"hide\": false,\n \"multi\": false,\n \"name\": \"jvm_memory_pool_nonheap\",\n \"reg\": \"\",\n \"type\": \"query\"\n }\n ],\n \"version\": \"3.0.0\"\n },\n \"uuid\": 1724670732548038000\n}"
},
{
"path": "integrations/SpringBoot/markdown/README.md",
"content": "# SpringBoot\n\nJava 生态的项目,如果要暴露 metrics 数据,一般可以选择 micrometer,不过 SpringBoot 项目可以直接使用 SpringBoot Actuator 暴露 metrics 数据,Actuator 底层也是使用 micrometer 来实现的,只是使用起来更加简单。\n\n## 应用配置\n\n在 application.properties 中加入如下配置:\n\n```properties\nmanagement.endpoint.metrics.enabled=true\nmanagement.endpoints.web.exposure.include=*\nmanagement.endpoint.prometheus.enabled=true\nmanagement.metrics.export.prometheus.enabled=true\n```\n\n完事启动项目,访问 `http://localhost:8080/actuator/prometheus` 即可看到符合 prometheus 协议的监控数据。\n\n## 采集配置\n\n既然暴露了 Prometheus 协议的监控数据,那通过 categraf prometheus 插件直接采集即可。配置文件是 `conf/input.prometheus/prometheus.toml`。配置样例如下:\n\n```toml\n[[instances]]\nurls = [\n \"http://192.168.11.177:8080/actuator/prometheus\"\n]\n```\n"
},
{
"path": "integrations/Switch_Legacy/collect/switch_legacy/switch_legacy.toml",
"content": "# # collect interval\n# interval = \"300s\"\n\nswitch_id_label = \"ip\"\n\n[mappings]\n\"192.168.88.160\" = \"switch001.bj\"\n\"192.168.88.161\" = \"switch002.bj\"\n\n[[instances]]\n# # interval = global.interval * interval_times\n# interval_times = 1\n\n# use global unique string to specify instance\n# labels = { region=\"beijing\" }\n\nips = [\n# \"172.16.2.1\",\n# \"172.16.4/24\",\n# \"192.168.56.102-192.168.56.120\"\n]\n\ncommunity = \"public\"\n\n# whether use index tag\nindex_tag = false\n\nignore_ifaces = [\"Nu\", \"NU\", \"Vlan\", \"Vl\"]\n\nconcurrency_for_address = 1000\nconcurrency_for_request = 4\n\nping_enable = true\nping_mode_fastping = true\nping_timeout_ms = 300\nping_retries = 4\n\n# true: use gosnmp, false: use snmpwalk\nsnmp_mode_gosnmp = true\nsnmp_timeout_ms = 1000\nsnmp_retries = 5\n\ngather_ping_metrics = true\ngather_flow_metrics = true\ngather_cpu_metrics = true\ngather_mem_metrics = true\ngather_oper_status = false\ngather_pkt = false\ngather_broadcast_pkt = false\ngather_multicast_pkt = false\ngather_discards = false\ngather_errors = false\ngather_unknown_protos = false\ngather_out_qlen = false\n\n# ignore metrics if limit > 0 and collected value > limit\nspeed_limit = 0\npkt_limit = 0\nbroadcast_pkt_limit = 0\nmulticast_pkt_limit = 0\ndiscards_pkt_limit = 0\nerrors_pkt_limit = 0\nunknown_protos_pkt_limit = 0\nout_qlen_pkt_limit = 0\n\n# [[instances.customs]]\n# metric = \"AnyconnectSession\"\n# tags = {}\n# oid = \"1.3.6.1.4.1.9.9.392.1.3.35.0\"\n\n# [[instances.customs]]\n# metric = \"ConnectionStat\"\n# tags = {}\n# oid = \"1.3.6.1.4.1.9.9.147.1.2.2.2.1.5.40.6\"\n\n# [[instances.customs]]\n# metric = \"TempStatus\"\n# tags = {}\n# oid = \"1.3.6.1.4.1.9.9.13.1.3.1.3.1004\"\n"
},
{
"path": "integrations/Switch_Legacy/dashboards/dashboard.json",
"content": "{\n \"id\": 0,\n \"group_id\": 0,\n \"name\": \"网络交换机\",\n \"ident\": \"\",\n \"tags\": \"\",\n \"create_at\": 0,\n \"create_by\": \"\",\n \"update_at\": 0,\n \"update_by\": \"\",\n \"configs\": {\n \"panels\": [\n {\n \"collapsed\": true,\n \"id\": \"1cb95ad2-81f1-4977-9924-4af57a542490\",\n \"layout\": {\n \"h\": 1,\n \"i\": \"1cb95ad2-81f1-4977-9924-4af57a542490\",\n \"isResizable\": false,\n \"w\": 24,\n \"x\": 0,\n \"y\": 0\n },\n \"name\": \"总体概览\",\n \"panels\": [],\n \"type\": \"row\"\n },\n {\n \"custom\": {\n \"calc\": \"lastNotNull\",\n \"colSpan\": 1,\n \"colorMode\": \"value\",\n \"textMode\": \"valueAndName\",\n \"textSize\": {},\n \"valueField\": \"Value\"\n },\n \"datasourceCate\": \"prometheus\",\n \"datasourceValue\": \"${datasource}\",\n \"id\": \"6c851c33-4ea4-4b76-be59-d4c19c5b2844\",\n \"layout\": {\n \"h\": 4,\n \"i\": \"6c851c33-4ea4-4b76-be59-d4c19c5b2844\",\n \"isResizable\": true,\n \"w\": 3,\n \"x\": 0,\n \"y\": 1\n },\n \"name\": \"交换机数目\",\n \"options\": {\n \"standardOptions\": {},\n \"thresholds\": {\n \"steps\": [\n {\n \"color\": \"#634CD9\",\n \"type\": \"base\",\n \"value\": null\n }\n ]\n }\n },\n \"targets\": [\n {\n \"expr\": \"count(switch_legacy_sysUpTime)\",\n \"refId\": \"A\"\n }\n ],\n \"type\": \"stat\",\n \"version\": \"2.0.0\"\n },\n {\n \"custom\": {\n \"baseColor\": \"#FF656B\",\n \"calc\": \"lastNotNull\",\n \"serieWidth\": 20,\n \"sortOrder\": \"desc\"\n },\n \"datasourceCate\": \"prometheus\",\n \"datasourceValue\": \"${datasource}\",\n \"id\": \"23220dc3-ab9a-40f9-b1d3-135bb3bbb734\",\n \"layout\": {\n \"h\": 4,\n \"i\": \"23220dc3-ab9a-40f9-b1d3-135bb3bbb734\",\n \"isResizable\": true,\n \"w\": 8,\n \"x\": 3,\n \"y\": 1\n },\n \"name\": \"CPU使用率排名\",\n \"options\": {\n \"standardOptions\": {}\n },\n \"targets\": [\n {\n \"expr\": \"switch_legacy_cpu_util\",\n \"legend\": \"{{ip}}\",\n \"refId\": \"A\"\n }\n ],\n \"type\": \"barGauge\",\n \"version\": \"2.0.0\"\n },\n {\n \"custom\": {\n \"baseColor\": \"#FF656B\",\n \"calc\": \"lastNotNull\",\n \"serieWidth\": 20,\n \"sortOrder\": \"desc\"\n },\n \"datasourceCate\": \"prometheus\",\n \"datasourceValue\": \"${datasource}\",\n \"id\": \"5bf72a5b-8273-4a40-94f9-8d671b01f16e\",\n \"layout\": {\n \"h\": 4,\n \"i\": \"5bf72a5b-8273-4a40-94f9-8d671b01f16e\",\n \"isResizable\": true,\n \"w\": 13,\n \"x\": 11,\n \"y\": 1\n },\n \"name\": \"网络in流量大于300MB\",\n \"options\": {\n \"standardOptions\": {}\n },\n \"targets\": [\n {\n \"expr\": \"max(switch_legacy_if_in) by(ip)\\u003e300000000\",\n \"legend\": \"{{ip}}\",\n \"refId\": \"A\"\n }\n ],\n \"type\": \"barGauge\",\n \"version\": \"2.0.0\"\n },\n {\n \"custom\": {\n \"calc\": \"lastNotNull\",\n \"donut\": true,\n \"labelWithName\": false,\n \"legengPosition\": \"hidden\"\n },\n \"datasourceCate\": \"prometheus\",\n \"datasourceValue\": \"${datasource}\",\n \"id\": \"bb0b07f1-e193-46ed-bc6e-c40d42e4eb4a\",\n \"layout\": {\n \"h\": 4,\n \"i\": \"43fa2e2d-8c69-4cc0-bb6b-6f359395f5c9\",\n \"isResizable\": true,\n \"w\": 3,\n \"x\": 0,\n \"y\": 5\n },\n \"name\": \"采集耗时\",\n \"targets\": [\n {\n \"expr\": \"switch_legacy_ifstat_use_time_sec\",\n \"legend\": \"{{ip}}\",\n \"refId\": \"A\"\n }\n ],\n \"type\": \"pie\",\n \"version\": \"2.0.0\"\n },\n {\n \"custom\": {\n \"baseColor\": \"#FF656B\",\n \"calc\": \"lastNotNull\",\n \"serieWidth\": 20,\n \"sortOrder\": \"desc\"\n },\n \"datasourceCate\": \"prometheus\",\n \"datasourceValue\": \"${datasource}\",\n \"id\": \"7f36ea1c-fd51-43bf-93ab-2787d630c530\",\n \"layout\": {\n \"h\": 4,\n \"i\": \"7f36ea1c-fd51-43bf-93ab-2787d630c530\",\n \"isResizable\": true,\n \"w\": 8,\n \"x\": 3,\n \"y\": 5\n },\n \"name\": \"内存使用率排名\",\n \"options\": {\n \"standardOptions\": {}\n },\n \"targets\": [\n {\n \"expr\": \"switch_legacy_mem_util\",\n \"legend\": \"{{ip}}\",\n \"refId\": \"A\"\n }\n ],\n \"type\": \"barGauge\",\n \"version\": \"2.0.0\"\n },\n {\n \"custom\": {\n \"baseColor\": \"#FF656B\",\n \"calc\": \"lastNotNull\",\n \"serieWidth\": 20,\n \"sortOrder\": \"desc\"\n },\n \"datasourceCate\": \"prometheus\",\n \"datasourceValue\": \"${datasource}\",\n \"id\": \"6f9ce40e-7927-43b3-a34f-16772bf88b7f\",\n \"layout\": {\n \"h\": 4,\n \"i\": \"3387f6ea-dcca-41a8-ae18-ef3d8a065d94\",\n \"isResizable\": true,\n \"w\": 13,\n \"x\": 11,\n \"y\": 5\n },\n \"name\": \"网络out流量大于300MB\",\n \"options\": {\n \"standardOptions\": {}\n },\n \"targets\": [\n {\n \"expr\": \"max(switch_legacy_if_out) by(ip)\\u003e300000000\",\n \"legend\": \"{{ip}}\",\n \"refId\": \"A\"\n }\n ],\n \"type\": \"barGauge\",\n \"version\": \"2.0.0\"\n },\n {\n \"custom\": {\n \"baseColor\": \"#FF656B\",\n \"calc\": \"lastNotNull\",\n \"serieWidth\": 20,\n \"sortOrder\": \"desc\"\n },\n \"datasourceCate\": \"prometheus\",\n \"datasourceValue\": \"${datasource}\",\n \"id\": \"356fe265-4a02-411d-9b3f-1578146c49a1\",\n \"layout\": {\n \"h\": 4,\n \"i\": \"31b68228-1f52-4ef9-aaa3-f605f490516f\",\n \"isResizable\": true,\n \"w\": 11,\n \"x\": 0,\n \"y\": 9\n },\n \"name\": \"设备运行时长\",\n \"options\": {\n \"standardOptions\": {\n \"util\": \"none\"\n }\n },\n \"targets\": [\n {\n \"expr\": \"switch_legacy_sysUpTime/100/(24*3600)\",\n \"legend\": \"{{ip}}\",\n \"refId\": \"A\"\n }\n ],\n \"type\": \"barGauge\",\n \"version\": \"2.0.0\"\n },\n {\n \"custom\": {\n \"baseColor\": \"#FF656B\",\n \"calc\": \"lastNotNull\",\n \"serieWidth\": 20,\n \"sortOrder\": \"desc\"\n },\n \"datasourceCate\": \"prometheus\",\n \"datasourceValue\": \"${datasource}\",\n \"id\": \"eec57d38-9a9f-4530-a0b5-e524d867759d\",\n \"layout\": {\n \"h\": 4,\n \"i\": \"eec57d38-9a9f-4530-a0b5-e524d867759d\",\n \"isResizable\": true,\n \"w\": 13,\n \"x\": 11,\n \"y\": 9\n },\n \"name\": \"设备温度\",\n \"options\": {\n \"standardOptions\": {}\n },\n \"targets\": [\n {\n \"expr\": \"switch_legacy_TempStatus\",\n \"legend\": \"{{ip}}\",\n \"refId\": \"A\"\n }\n ],\n \"type\": \"barGauge\",\n \"version\": \"2.0.0\"\n },\n {\n \"collapsed\": true,\n \"id\": \"559f99bc-2519-406e-b2b6-8c2e0895bd53\",\n \"layout\": {\n \"h\": 1,\n \"i\": \"559f99bc-2519-406e-b2b6-8c2e0895bd53\",\n \"isResizable\": false,\n \"w\": 24,\n \"x\": 0,\n \"y\": 13\n },\n \"name\": \"单机详情\",\n \"panels\": [],\n \"type\": \"row\"\n },\n {\n \"custom\": {\n \"drawStyle\": \"lines\",\n \"fillOpacity\": 0.3,\n \"gradientMode\": \"opacity\",\n \"lineInterpolation\": \"smooth\",\n \"lineWidth\": 2,\n \"scaleDistribution\": {\n \"type\": \"linear\"\n },\n \"spanNulls\": false,\n \"stack\": \"off\"\n },\n \"datasourceCate\": \"prometheus\",\n \"datasourceValue\": \"${datasource}\",\n \"id\": \"69a26105-9170-4f00-a3c2-0fa866f9d5b8\",\n \"layout\": {\n \"h\": 5,\n \"i\": \"69a26105-9170-4f00-a3c2-0fa866f9d5b8\",\n \"isResizable\": true,\n \"w\": 12,\n \"x\": 0,\n \"y\": 14\n },\n \"name\": \"cpu使用率\",\n \"options\": {\n \"legend\": {\n \"displayMode\": \"hidden\"\n },\n \"standardOptions\": {},\n \"thresholds\": {\n \"steps\": [\n {\n \"color\": \"#634CD9\",\n \"type\": \"base\",\n \"value\": null\n }\n ]\n },\n \"tooltip\": {\n \"mode\": \"single\"\n }\n },\n \"targets\": [\n {\n \"expr\": \"switch_legacy_cpu_util{ip=\\\"$IP\\\"}\",\n \"legend\": \"{{ip}}\",\n \"refId\": \"A\"\n }\n ],\n \"type\": \"timeseries\",\n \"version\": \"2.0.0\"\n },\n {\n \"custom\": {\n \"drawStyle\": \"lines\",\n \"fillOpacity\": 0.3,\n \"gradientMode\": \"opacity\",\n \"lineInterpolation\": \"smooth\",\n \"lineWidth\": 2,\n \"scaleDistribution\": {\n \"type\": \"linear\"\n },\n \"spanNulls\": false,\n \"stack\": \"off\"\n },\n \"datasourceCate\": \"prometheus\",\n \"datasourceValue\": \"${datasource}\",\n \"id\": \"cc38fed9-f224-4684-9541-6a57e543062d\",\n \"layout\": {\n \"h\": 5,\n \"i\": \"b90ba3f4-58ac-4fa1-ac69-f63388536126\",\n \"isResizable\": true,\n \"w\": 12,\n \"x\": 12,\n \"y\": 14\n },\n \"name\": \"网络in流量\",\n \"options\": {\n \"legend\": {\n \"displayMode\": \"hidden\"\n },\n \"standardOptions\": {},\n \"thresholds\": {\n \"steps\": [\n {\n \"color\": \"#634CD9\",\n \"type\": \"base\",\n \"value\": null\n }\n ]\n },\n \"tooltip\": {\n \"mode\": \"all\",\n \"sort\": \"desc\"\n }\n },\n \"targets\": [\n {\n \"expr\": \"switch_legacy_if_in{ip=\\\"$IP\\\"}\\u003e0\",\n \"legend\": \"{{ip}}-{{ifname}}\",\n \"refId\": \"A\"\n }\n ],\n \"type\": \"timeseries\",\n \"version\": \"2.0.0\"\n },\n {\n \"custom\": {\n \"drawStyle\": \"lines\",\n \"fillOpacity\": 0.3,\n \"gradientMode\": \"opacity\",\n \"lineInterpolation\": \"smooth\",\n \"lineWidth\": 2,\n \"scaleDistribution\": {\n \"type\": \"linear\"\n },\n \"spanNulls\": false,\n \"stack\": \"off\"\n },\n \"datasourceCate\": \"prometheus\",\n \"datasourceValue\": \"${datasource}\",\n \"id\": \"1b84f22c-2535-4e16-b884-86e95bed444f\",\n \"layout\": {\n \"h\": 5,\n \"i\": \"0158a0bb-6cb3-4a61-ab32-c4ff470eee8c\",\n \"isResizable\": true,\n \"w\": 12,\n \"x\": 0,\n \"y\": 19\n },\n \"name\": \"内存使用率\",\n \"options\": {\n \"legend\": {\n \"displayMode\": \"hidden\"\n },\n \"standardOptions\": {},\n \"thresholds\": {\n \"steps\": [\n {\n \"color\": \"#634CD9\",\n \"type\": \"base\",\n \"value\": null\n }\n ]\n },\n \"tooltip\": {\n \"mode\": \"single\"\n }\n },\n \"targets\": [\n {\n \"expr\": \"switch_legacy_mem_util{ip=\\\"$IP\\\"}\",\n \"legend\": \"{{ip}}\",\n \"refId\": \"A\"\n }\n ],\n \"type\": \"timeseries\",\n \"version\": \"2.0.0\"\n },\n {\n \"custom\": {\n \"drawStyle\": \"lines\",\n \"fillOpacity\": 0.3,\n \"gradientMode\": \"opacity\",\n \"lineInterpolation\": \"smooth\",\n \"lineWidth\": 2,\n \"scaleDistribution\": {\n \"type\": \"linear\"\n },\n \"spanNulls\": false,\n \"stack\": \"off\"\n },\n \"datasourceCate\": \"prometheus\",\n \"datasourceValue\": \"${datasource}\",\n \"id\": \"2e08574d-0378-45c1-9384-a80559e1df99\",\n \"layout\": {\n \"h\": 5,\n \"i\": \"6d230fe8-9bd8-4c10-8fde-4e34ed3a62e3\",\n \"isResizable\": true,\n \"w\": 12,\n \"x\": 12,\n \"y\": 19\n },\n \"name\": \"网络out流量\",\n \"options\": {\n \"legend\": {\n \"displayMode\": \"hidden\"\n },\n \"standardOptions\": {},\n \"thresholds\": {\n \"steps\": [\n {\n \"color\": \"#634CD9\",\n \"type\": \"base\",\n \"value\": null\n }\n ]\n },\n \"tooltip\": {\n \"mode\": \"all\",\n \"sort\": \"desc\"\n }\n },\n \"targets\": [\n {\n \"expr\": \"switch_legacy_if_out{ip=\\\"$IP\\\"}\\u003e0\",\n \"legend\": \"{{ip}}-{{ifname}}\",\n \"refId\": \"A\"\n }\n ],\n \"type\": \"timeseries\",\n \"version\": \"2.0.0\"\n }\n ],\n \"var\": [\n {\n \"definition\": \"prometheus\",\n \"name\": \"datasource\",\n \"type\": \"datasource\"\n },\n {\n \"datasource\": {\n \"cate\": \"prometheus\",\n \"value\": \"${datasource}\"\n },\n \"definition\": \"label_values(switch_legacy_if_in,ip)\",\n \"multi\": false,\n \"name\": \"IP\",\n \"type\": \"query\"\n },\n {\n \"datasource\": {\n \"cate\": \"prometheus\",\n \"value\": \"${datasource}\"\n },\n \"definition\": \"label_values(switch_legacy_if_in{ip=\\\"$IP\\\"},ifname)\",\n \"name\": \"Interface\",\n \"type\": \"query\"\n }\n ],\n \"version\": \"3.0.0\"\n },\n \"public\": 0,\n \"public_cate\": 0,\n \"bgids\": null,\n \"built_in\": 0,\n \"hide\": 0,\n \"uuid\": 1717556328402091000\n}"
},
{
"path": "integrations/Switch_Legacy/markdown/README.md",
"content": "# switch_legacy\n\n交换机监控插件,fork 自 [https://github.com/gaochao1/swcollector](https://github.com/gaochao1/swcollector) 可以自动探测网络设备型号,获取 CPU、内存使用率,当然,还有各个网口的监控数据,这是通用的 oid\n\n## Configuration\n\n最核心的配置就是指定 IP 列表,有三种写法:\n\n```toml\n[[instances]]\nips = [\n \"172.16.2.1\",\n \"172.16.4/24\",\n \"192.168.56.102-192.168.56.120\"\n]\n```\n\n该插件只支持 SNMP v2c,所以认证信息就是一个 community 字符串\n\n## 唯一标识标签\n\n网络设备的监控数据,默认都会带有 ip 标签,指定监控数据来源于哪个设备,如果想把监控数据当做夜莺里的监控对象,让网络设备自动出现在夜莺的监控对象表格里,只需要把 switch_id_label 设置为 ident 即可,这样一来,网络设备的 IP 信息会作为 ident 标签的值上报,夜莺会自动读取 ident 标签的值入库\n\n## 名称映射\n\n有时,我们看到网络设备的 IP,无法分辨是具体哪个设备,此时可以给 IP 一个映射名称:\n\n```ini\n[mappings]\n\"192.168.88.160\" = \"switch001.bj\"\n\"192.168.88.161\" = \"switch002.bj\"\n```\n\n这样一来,上报的监控数据就不用 IP 做标识了,而是使用 switch001.bj 这样的字符串做标识,更易读一些\n\n## 自定义 oid\n\n`[[instances.customs]]` 部分可以配置多个,表示自定义 oid,默认情况下,该插件采集的都是设备各个网口的监控数据以及CPU和内存的使用率,如果要采集别的 oid,就需要使用这个自定义功能\n"
},
{
"path": "integrations/Systemd/collect/systemd/systemd.toml",
"content": "# # collect interval\n# interval = 15\n\nenable=false # 设置为true 打开采集\n#unit_include=\".+\"\n#unit_exclude=\"\"\nenable_start_time_metrics=true #是否采集service unit的启动时间信息 单位秒\nenable_task_metrics=true # 是否采集service unit task的metrics\nenable_restarts_metrics=true #是否采集service unit重启的次数信息\n"
},
{
"path": "integrations/Systemd/markdown/README.md",
"content": "# systemd 插件\n自 [node_exporter](https://github.com/prometheus/node_exporter/blob/master/collector/systemd_linux.go) fork 并改动\n\n## Configuration\n```toml\nenable=false # 设置为true 打开采集\n#unit_include=\".+\"\n#unit_exclude=\"\"\nenable_start_time_metrics=true #是否采集service unit的启动时间信息 单位秒\nenable_task_metrics=true # 是否采集service unit task的metrics\nenable_restarts_metrics=true #是否采集service unit重启的次数信息\n```\n"
},
{
"path": "integrations/TDEngine/dashboards/tasokeeper3.x.json",
"content": "{\n \"id\": 0,\n \"group_id\": 0,\n \"name\": \"TaosKeeper 3.x Prometheus Dashboard\",\n \"ident\": \"\",\n \"tags\": \"\",\n \"create_at\": 0,\n \"create_by\": \"\",\n \"update_at\": 0,\n \"update_by\": \"\",\n \"configs\": {\n \"links\": [],\n \"panels\": [\n {\n \"custom\": {\n \"calc\": \"last\",\n \"colorMode\": \"value\",\n \"textMode\": \"value\",\n \"version\": \"2.0.0\"\n },\n \"datasourceCate\": \"prometheus\",\n \"datasourceValue\": \"${datasource}\",\n \"id\": \"85aad21e-601f-4279-b1da-5b2675a17c58\",\n \"layout\": {\n \"h\": 4,\n \"i\": \"85aad21e-601f-4279-b1da-5b2675a17c58\",\n \"w\": 3,\n \"x\": 0,\n \"y\": 4\n },\n \"links\": [],\n \"maxPerRow\": 4,\n \"name\": \"First EP\",\n \"options\": {\n \"legend\": {\n \"displayMode\": \"list\"\n },\n \"standardOptions\": {\n \"util\": \"none\"\n },\n \"thresholds\": {\n \"mode\": \"absolute\",\n \"steps\": [\n {\n \"color\": \"#73BF69\",\n \"type\": \"base\",\n \"value\": null\n }\n ],\n \"style\": \"line\"\n },\n \"tooltip\": {\n \"mode\": \"multi\"\n },\n \"valueMappings\": []\n },\n \"targets\": [\n {\n \"expr\": \"taos_cluster_info_first_ep{cluster=\\\"$cluster\\\"}\",\n \"legend\": \"\",\n \"refId\": \"A\"\n }\n ],\n \"type\": \"stat\",\n \"version\": \"2.0.0\"\n },\n {\n \"custom\": {\n \"calc\": \"lastNotNull\",\n \"colorMode\": \"value\",\n \"textMode\": \"value\",\n \"version\": \"2.0.0\"\n },\n \"datasourceCate\": \"prometheus\",\n \"datasourceValue\": \"${datasource}\",\n \"id\": \"2f75b3a1-4105-42fd-a060-dfc88b871e6e\",\n \"layout\": {\n \"h\": 4,\n \"i\": \"2f75b3a1-4105-42fd-a060-dfc88b871e6e\",\n \"w\": 3,\n \"x\": 3,\n \"y\": 4\n },\n \"links\": [],\n \"maxPerRow\": 4,\n \"name\": \"Version\",\n \"options\": {\n \"legend\": {\n \"displayMode\": \"list\"\n },\n \"standardOptions\": {\n \"util\": \"seconds\"\n },\n \"thresholds\": {\n \"mode\": \"absolute\",\n \"steps\": [\n {\n \"color\": \"#73BF69\",\n \"type\": \"base\",\n \"value\": null\n }\n ],\n \"style\": \"line\"\n },\n \"tooltip\": {\n \"mode\": \"multi\"\n },\n \"valueMappings\": []\n },\n \"targets\": [\n {\n \"expr\": \"taos_cluster_info_version{cluster=\\\"$cluster\\\"}\",\n \"legend\": \"\",\n \"refId\": \"A\"\n }\n ],\n \"type\": \"stat\",\n \"version\": \"2.0.0\"\n },\n {\n \"custom\": {\n \"calc\": \"lastNotNull\",\n \"colorMode\": \"value\",\n \"textMode\": \"value\",\n \"version\": \"2.0.0\"\n },\n \"datasourceCate\": \"prometheus\",\n \"datasourceValue\": \"${datasource}\",\n \"description\": \"MNode 被选举后经过的时长\",\n \"id\": \"a1f5853b-ee1a-44a8-aaa5-a432204eaaa2\",\n \"layout\": {\n \"h\": 4,\n \"i\": \"a1f5853b-ee1a-44a8-aaa5-a432204eaaa2\",\n \"w\": 3,\n \"x\": 6,\n \"y\": 4\n },\n \"links\": [],\n \"maxPerRow\": 4,\n \"name\": \"Master Uptime\",\n \"options\": {\n \"legend\": {\n \"displayMode\": \"list\"\n },\n \"standardOptions\": {\n \"util\": \"seconds\"\n },\n \"thresholds\": {\n \"mode\": \"absolute\",\n \"steps\": [\n {\n \"color\": \"#73BF69\",\n \"type\": \"base\",\n \"value\": null\n }\n ],\n \"style\": \"line\"\n },\n \"tooltip\": {\n \"mode\": \"multi\"\n },\n \"valueMappings\": []\n },\n \"targets\": [\n {\n \"expr\": \"taos_cluster_info_master_uptime{cluster=\\\"$cluster\\\"}\",\n \"legend\": \"\",\n \"refId\": \"A\"\n }\n ],\n \"type\": \"stat\",\n \"version\": \"2.0.0\"\n },\n {\n \"custom\": {\n \"calc\": \"lastNotNull\",\n \"colorMode\": \"value\",\n \"textMode\": \"value\",\n \"version\": \"2.0.0\"\n },\n \"datasourceCate\": \"prometheus\",\n \"datasourceValue\": \"${datasource}\",\n \"description\": \"企业版授权到期时间\",\n \"id\": \"d40bdb61-9c8e-4646-8632-9048e339b009\",\n \"layout\": {\n \"h\": 4,\n \"i\": \"d40bdb61-9c8e-4646-8632-9048e339b009\",\n \"w\": 3,\n \"x\": 9,\n \"y\": 4\n },\n \"links\": [],\n \"maxPerRow\": 4,\n \"name\": \"Expire Time\",\n \"options\": {\n \"legend\": {\n \"displayMode\": \"list\"\n },\n \"standardOptions\": {\n \"util\": \"seconds\"\n },\n \"thresholds\": {\n \"mode\": \"absolute\",\n \"steps\": [\n {\n \"color\": \"#73BF69\",\n \"type\": \"base\",\n \"value\": null\n }\n ],\n \"style\": \"line\"\n },\n \"tooltip\": {\n \"mode\": \"multi\"\n },\n \"valueMappings\": []\n },\n \"targets\": [\n {\n \"expr\": \"taos_grants_info_expire_time{cluster=\\\"$cluster\\\"}\",\n \"legend\": \"\",\n \"refId\": \"A\"\n }\n ],\n \"type\": \"stat\",\n \"version\": \"2.0.0\"\n },\n {\n \"custom\": {\n \"calc\": \"last\",\n \"version\": \"2.0.0\"\n },\n \"datasourceCate\": \"prometheus\",\n \"datasourceValue\": \"${datasource}\",\n \"description\": \"企业版授权已用测点数\",\n \"id\": \"f91206a8-8a02-4bd9-84f1-683a4b6eee7a\",\n \"layout\": {\n \"h\": 4,\n \"i\": \"f91206a8-8a02-4bd9-84f1-683a4b6eee7a\",\n \"w\": 4,\n \"x\": 12,\n \"y\": 4\n },\n \"links\": [],\n \"maxPerRow\": 4,\n \"name\": \"Used Measuring Points\",\n \"options\": {\n \"legend\": {\n \"displayMode\": \"list\"\n },\n \"standardOptions\": {\n \"util\": \"none\"\n },\n \"thresholds\": {\n \"mode\": \"absolute\",\n \"steps\": [\n {\n \"color\": \"#73BF69\",\n \"type\": \"base\",\n \"value\": null\n }\n ],\n \"style\": \"line\"\n },\n \"tooltip\": {\n \"mode\": \"multi\"\n },\n \"valueMappings\": []\n },\n \"targets\": [\n {\n \"expr\": \"taos_dnodes_info_disk_engine\",\n \"legend\": \"used\",\n \"refId\": \"A\"\n },\n {\n \"expr\": \"taos_dnodes_info_disk_total\",\n \"legend\": \"total\",\n \"refId\": \"B\"\n }\n ],\n \"type\": \"barGauge\",\n \"version\": \"2.0.0\"\n },\n {\n \"custom\": {\n \"calc\": \"lastNotNull\",\n \"colorMode\": \"value\",\n \"textMode\": \"value\",\n \"version\": \"2.0.0\"\n },\n \"datasourceCate\": \"prometheus\",\n \"datasourceValue\": \"${datasource}\",\n \"description\": \"数据库个数\",\n \"id\": \"db696656-c586-42b1-a38d-030b187ef338\",\n \"layout\": {\n \"h\": 4,\n \"i\": \"db696656-c586-42b1-a38d-030b187ef338\",\n \"w\": 2,\n \"x\": 16,\n \"y\": 4\n },\n \"links\": [],\n \"maxPerRow\": 4,\n \"name\": \"Databases\",\n \"options\": {\n \"legend\": {\n \"displayMode\": \"list\"\n },\n \"standardOptions\": {\n \"util\": \"none\"\n },\n \"thresholds\": {\n \"mode\": \"absolute\",\n \"steps\": [\n {\n \"color\": \"#73BF69\",\n \"type\": \"base\",\n \"value\": null\n },\n {\n \"color\": \"#F2495C\",\n \"value\": 80\n }\n ],\n \"style\": \"line\"\n },\n \"tooltip\": {\n \"mode\": \"multi\"\n },\n \"valueMappings\": []\n },\n \"targets\": [\n {\n \"expr\": \"count(taos_vgroups_info_status{cluster=\\\"$cluster\\\"})\",\n \"legend\": \"databases\",\n \"refId\": \"A\"\n }\n ],\n \"type\": \"stat\",\n \"version\": \"2.0.0\"\n },\n {\n \"custom\": {\n \"calc\": \"lastNotNull\",\n \"colorMode\": \"value\",\n \"textMode\": \"value\",\n \"version\": \"2.0.0\"\n },\n \"datasourceCate\": \"prometheus\",\n \"datasourceValue\": \"${datasource}\",\n \"description\": \"所有数据库的表数量之和\",\n \"id\": \"9080b0e0-6f30-4d3b-b675-535664804635\",\n \"layout\": {\n \"h\": 4,\n \"i\": \"9080b0e0-6f30-4d3b-b675-535664804635\",\n \"w\": 3,\n \"x\": 18,\n \"y\": 4\n },\n \"links\": [],\n \"maxPerRow\": 4,\n \"name\": \"Tables\",\n \"options\": {\n \"legend\": {\n \"displayMode\": \"list\"\n },\n \"standardOptions\": {\n \"util\": \"none\"\n },\n \"thresholds\": {\n \"mode\": \"absolute\",\n \"steps\": [\n {\n \"color\": \"#73BF69\",\n \"type\": \"base\",\n \"value\": null\n }\n ],\n \"style\": \"line\"\n },\n \"tooltip\": {\n \"mode\": \"multi\"\n },\n \"valueMappings\": []\n },\n \"targets\": [\n {\n \"expr\": \"sum(taos_tables_per_database{cluster=\\\"$cluster\\\"})\",\n \"legend\": \"\",\n \"refId\": \"A\"\n }\n ],\n \"type\": \"stat\",\n \"version\": \"2.0.0\"\n },\n {\n \"custom\": {\n \"calc\": \"lastNotNull\",\n \"version\": \"2.0.0\"\n },\n \"datasourceCate\": \"prometheus\",\n \"datasourceValue\": \"${datasource}\",\n \"description\": \"当前TDengine集群DNode数量,Alive 为存活,Total 为所有\",\n \"id\": \"7148c52d-a2a8-4cc5-9bb5-b598041cf500\",\n \"layout\": {\n \"h\": 4,\n \"i\": \"7148c52d-a2a8-4cc5-9bb5-b598041cf500\",\n \"w\": 6,\n \"x\": 0,\n \"y\": 8\n },\n \"links\": [],\n \"maxPerRow\": 4,\n \"name\": \"DNodes\",\n \"options\": {\n \"legend\": {\n \"displayMode\": \"list\"\n },\n \"standardOptions\": {\n \"util\": \"none\"\n },\n \"thresholds\": {\n \"mode\": \"absolute\",\n \"steps\": [\n {\n \"color\": \"#73BF69\",\n \"type\": \"base\",\n \"value\": null\n }\n ],\n \"style\": \"line\"\n },\n \"tooltip\": {\n \"mode\": \"multi\"\n },\n \"valueMappings\": []\n },\n \"targets\": [\n {\n \"expr\": \"taos_cluster_info_dnodes_total\",\n \"legend\": \"\",\n \"refId\": \"A\"\n }\n ],\n \"type\": \"barGauge\",\n \"version\": \"2.0.0\"\n },\n {\n \"custom\": {\n \"calc\": \"lastNotNull\",\n \"version\": \"2.0.0\"\n },\n \"datasourceCate\": \"prometheus\",\n \"datasourceValue\": \"${datasource}\",\n \"description\": \"当前TDengine集群MNode数量,Alive 为存活,Total 为所有\",\n \"id\": \"bd41d367-c7e0-4f2c-a178-4f6af23965d0\",\n \"layout\": {\n \"h\": 4,\n \"i\": \"bd41d367-c7e0-4f2c-a178-4f6af23965d0\",\n \"w\": 6,\n \"x\": 6,\n \"y\": 8\n },\n \"links\": [],\n \"maxPerRow\": 4,\n \"name\": \"MNodes\",\n \"options\": {\n \"legend\": {\n \"displayMode\": \"list\"\n },\n \"standardOptions\": {\n \"util\": \"none\"\n },\n \"thresholds\": {\n \"mode\": \"absolute\",\n \"steps\": [\n {\n \"color\": \"#73BF69\",\n \"type\": \"base\",\n \"value\": null\n }\n ],\n \"style\": \"line\"\n },\n \"tooltip\": {\n \"mode\": \"multi\"\n },\n \"valueMappings\": []\n },\n \"targets\": [\n {\n \"expr\": \"taos_cluster_info_mnodes_total{cluster=\\\"$cluster\\\"}\",\n \"legend\": \"\",\n \"refId\": \"A\"\n }\n ],\n \"type\": \"barGauge\",\n \"version\": \"2.0.0\"\n },\n {\n \"custom\": {\n \"calc\": \"lastNotNull\",\n \"version\": \"2.0.0\"\n },\n \"datasourceCate\": \"prometheus\",\n \"datasourceValue\": \"${datasource}\",\n \"description\": \"当前TDengine集群 VGroups 数量,Alive 为存活,Total 为所有\",\n \"id\": \"2fea6c74-2963-4815-a584-d2fb5cffe2ba\",\n \"layout\": {\n \"h\": 4,\n \"i\": \"2fea6c74-2963-4815-a584-d2fb5cffe2ba\",\n \"w\": 6,\n \"x\": 12,\n \"y\": 8\n },\n \"links\": [],\n \"maxPerRow\": 4,\n \"name\": \"VGroups\",\n \"options\": {\n \"legend\": {\n \"displayMode\": \"list\"\n },\n \"standardOptions\": {\n \"util\": \"none\"\n },\n \"thresholds\": {\n \"mode\": \"absolute\",\n \"steps\": [\n {\n \"color\": \"#73BF69\",\n \"type\": \"base\",\n \"value\": null\n }\n ],\n \"style\": \"line\"\n },\n \"tooltip\": {\n \"mode\": \"multi\"\n },\n \"valueMappings\": []\n },\n \"targets\": [\n {\n \"expr\": \"count(count(taos_vgroups_info_status{cluster=\\\"$cluster\\\"}) by (vgroup_id))\",\n \"legend\": \"\",\n \"refId\": \"A\"\n }\n ],\n \"type\": \"barGauge\",\n \"version\": \"2.0.0\"\n },\n {\n \"custom\": {\n \"calc\": \"lastNotNull\",\n \"version\": \"2.0.0\"\n },\n \"datasourceCate\": \"prometheus\",\n \"datasourceValue\": \"${datasource}\",\n \"description\": \"当前TDengine集群 VNodes 数量,Alive 为存活,Total 为所有\",\n \"id\": \"537931bd-6979-4eba-a5d4-9958109ff81f\",\n \"layout\": {\n \"h\": 4,\n \"i\": \"537931bd-6979-4eba-a5d4-9958109ff81f\",\n \"w\": 6,\n \"x\": 18,\n \"y\": 8\n },\n \"links\": [],\n \"maxPerRow\": 4,\n \"name\": \"VNodes\",\n \"options\": {\n \"legend\": {\n \"displayMode\": \"list\"\n },\n \"standardOptions\": {\n \"util\": \"none\"\n },\n \"thresholds\": {\n \"mode\": \"absolute\",\n \"steps\": [\n {\n \"color\": \"#73BF69\",\n \"type\": \"base\",\n \"value\": null\n }\n ],\n \"style\": \"line\"\n },\n \"tooltip\": {\n \"mode\": \"multi\"\n },\n \"valueMappings\": []\n },\n \"targets\": [\n {\n \"expr\": \"sum(taos_vgroups_info_online_vnodes{cluster=\\\"$cluster\\\"})\",\n \"legend\": \"\",\n \"refId\": \"A\"\n }\n ],\n \"type\": \"barGauge\",\n \"version\": \"2.0.0\"\n },\n {\n \"custom\": {\n \"drawStyle\": \"lines\",\n \"fillOpacity\": 0.3,\n \"gradientMode\": \"opacity\",\n \"lineInterpolation\": \"linear\",\n \"lineWidth\": 2,\n \"stack\": \"off\",\n \"version\": \"2.0.0\"\n },\n \"datasourceCate\": \"prometheus\",\n \"datasourceValue\": \"${datasource}\",\n \"id\": \"37d26059-acdd-4d15-a135-266d0155ff81\",\n \"layout\": {\n \"h\": 6,\n \"i\": \"37d26059-acdd-4d15-a135-266d0155ff81\",\n \"w\": 6,\n \"x\": 0,\n \"y\": 12\n },\n \"links\": [],\n \"maxPerRow\": 4,\n \"name\": \"DNodes Alive Percent\",\n \"options\": {\n \"legend\": {\n \"displayMode\": \"hidden\"\n },\n \"thresholds\": {\n \"steps\": [\n {\n \"color\": \"#634CD9\",\n \"type\": \"base\",\n \"value\": null\n }\n ]\n },\n \"tooltip\": {\n \"mode\": \"all\",\n \"sort\": \"none\"\n }\n },\n \"targets\": [\n {\n \"expr\": \"taos_cluster_info_dnodes_alive / taos_cluster_info_dnodes_total\",\n \"legend\": \"\",\n \"refId\": \"A\"\n }\n ],\n \"type\": \"timeseries\",\n \"version\": \"2.0.0\"\n },\n {\n \"custom\": {\n \"drawStyle\": \"lines\",\n \"fillOpacity\": 0.3,\n \"gradientMode\": \"opacity\",\n \"lineInterpolation\": \"linear\",\n \"lineWidth\": 2,\n \"stack\": \"off\",\n \"version\": \"2.0.0\"\n },\n \"datasourceCate\": \"prometheus\",\n \"datasourceValue\": \"${datasource}\",\n \"id\": \"c109ddac-bb23-406a-b1a9-30ebf13b0c8c\",\n \"layout\": {\n \"h\": 6,\n \"i\": \"c109ddac-bb23-406a-b1a9-30ebf13b0c8c\",\n \"w\": 6,\n \"x\": 6,\n \"y\": 12\n },\n \"links\": [],\n \"maxPerRow\": 4,\n \"name\": \"MNodes Alive Percent\",\n \"options\": {\n \"legend\": {\n \"displayMode\": \"hidden\"\n },\n \"thresholds\": {\n \"steps\": [\n {\n \"color\": \"#634CD9\",\n \"type\": \"base\",\n \"value\": null\n }\n ]\n },\n \"tooltip\": {\n \"mode\": \"all\",\n \"sort\": \"none\"\n }\n },\n \"targets\": [\n {\n \"expr\": \"taos_cluster_info_mnodes_alive / taos_cluster_info_mnodes_total\",\n \"legend\": \"\",\n \"refId\": \"A\"\n }\n ],\n \"type\": \"timeseries\",\n \"version\": \"2.0.0\"\n },\n {\n \"custom\": {\n \"drawStyle\": \"lines\",\n \"fillOpacity\": 0.3,\n \"gradientMode\": \"opacity\",\n \"lineInterpolation\": \"linear\",\n \"lineWidth\": 2,\n \"stack\": \"off\",\n \"version\": \"2.0.0\"\n },\n \"datasourceCate\": \"prometheus\",\n \"datasourceValue\": \"${datasource}\",\n \"id\": \"d6837203-415f-4f58-8892-79a3eff8ce8b\",\n \"layout\": {\n \"h\": 6,\n \"i\": \"d6837203-415f-4f58-8892-79a3eff8ce8b\",\n \"w\": 6,\n \"x\": 12,\n \"y\": 12\n },\n \"links\": [],\n \"maxPerRow\": 4,\n \"name\": \"VGroups Alive Percent\",\n \"options\": {\n \"legend\": {\n \"displayMode\": \"hidden\"\n },\n \"thresholds\": {\n \"steps\": [\n {\n \"color\": \"#634CD9\",\n \"type\": \"base\",\n \"value\": null\n }\n ]\n },\n \"tooltip\": {\n \"mode\": \"all\",\n \"sort\": \"none\"\n }\n },\n \"targets\": [\n {\n \"expr\": \"taos_cluster_info_vgroups_alive / taos_cluster_info_vgroups_total\",\n \"legend\": \"\",\n \"refId\": \"A\"\n }\n ],\n \"type\": \"timeseries\",\n \"version\": \"2.0.0\"\n },\n {\n \"custom\": {\n \"drawStyle\": \"lines\",\n \"fillOpacity\": 0.3,\n \"gradientMode\": \"opacity\",\n \"lineInterpolation\": \"linear\",\n \"lineWidth\": 2,\n \"stack\": \"off\",\n \"version\": \"2.0.0\"\n },\n \"datasourceCate\": \"prometheus\",\n \"datasourceValue\": \"${datasource}\",\n \"id\": \"a54710e4-73b4-49c4-99d4-6a50a411823d\",\n \"layout\": {\n \"h\": 6,\n \"i\": \"a54710e4-73b4-49c4-99d4-6a50a411823d\",\n \"w\": 6,\n \"x\": 18,\n \"y\": 12\n },\n \"links\": [],\n \"maxPerRow\": 4,\n \"name\": \"VNodes Alive Percent\",\n \"options\": {\n \"legend\": {\n \"displayMode\": \"hidden\"\n },\n \"thresholds\": {\n \"steps\": [\n {\n \"color\": \"#634CD9\",\n \"type\": \"base\",\n \"value\": null\n }\n ]\n },\n \"tooltip\": {\n \"mode\": \"all\",\n \"sort\": \"none\"\n }\n },\n \"targets\": [\n {\n \"expr\": \"taos_cluster_info_vnodes_alive / taos_cluster_info_vnodes_total\",\n \"legend\": \"\",\n \"refId\": \"A\"\n }\n ],\n \"type\": \"timeseries\",\n \"version\": \"2.0.0\"\n },\n {\n \"custom\": {\n \"drawStyle\": \"lines\",\n \"fillOpacity\": 0.3,\n \"gradientMode\": \"opacity\",\n \"lineInterpolation\": \"linear\",\n \"lineWidth\": 2,\n \"stack\": \"off\",\n \"version\": \"2.0.0\"\n },\n \"datasourceCate\": \"prometheus\",\n \"datasourceValue\": \"${datasource}\",\n \"id\": \"59ec36a1-b3ac-4db1-9c54-0e63e5ecb2c1\",\n \"layout\": {\n \"h\": 6,\n \"i\": \"59ec36a1-b3ac-4db1-9c54-0e63e5ecb2c1\",\n \"w\": 6,\n \"x\": 0,\n \"y\": 18\n },\n \"links\": [],\n \"maxPerRow\": 4,\n \"name\": \"Measuring Points Used Percent Alert\",\n \"options\": {\n \"legend\": {\n \"displayMode\": \"hidden\"\n },\n \"thresholds\": {\n \"steps\": [\n {\n \"color\": \"#634CD9\",\n \"type\": \"base\",\n \"value\": null\n }\n ]\n },\n \"tooltip\": {\n \"mode\": \"all\",\n \"sort\": \"none\"\n }\n },\n \"targets\": [\n {\n \"expr\": \"taos_grants_info_timeseries_used / taos_grants_info_timeseries_total {cluster=\\\"$cluster\\\"}\",\n \"legend\": \"percent\",\n \"refId\": \"A\"\n }\n ],\n \"type\": \"timeseries\",\n \"version\": \"2.0.0\"\n },\n {\n \"custom\": {\n \"drawStyle\": \"lines\",\n \"fillOpacity\": 0.3,\n \"gradientMode\": \"opacity\",\n \"lineInterpolation\": \"linear\",\n \"lineWidth\": 2,\n \"stack\": \"off\",\n \"version\": \"2.0.0\"\n },\n \"datasourceCate\": \"prometheus\",\n \"datasourceValue\": \"${datasource}\",\n \"id\": \"57d3394a-9382-413f-9d25-7693e7090989\",\n \"layout\": {\n \"h\": 6,\n \"i\": \"57d3394a-9382-413f-9d25-7693e7090989\",\n \"w\": 6,\n \"x\": 6,\n \"y\": 18\n },\n \"links\": [],\n \"maxPerRow\": 4,\n \"name\": \"Grants Expire Time\",\n \"options\": {\n \"legend\": {\n \"displayMode\": \"hidden\"\n },\n \"thresholds\": {\n \"steps\": [\n {\n \"color\": \"#634CD9\",\n \"type\": \"base\",\n \"value\": null\n }\n ]\n },\n \"tooltip\": {\n \"mode\": \"all\",\n \"sort\": \"none\"\n }\n },\n \"targets\": [\n {\n \"expr\": \"taos_grants_info_expire_time\",\n \"legend\": \"\",\n \"refId\": \"A\"\n }\n ],\n \"type\": \"timeseries\",\n \"version\": \"2.0.0\"\n },\n {\n \"custom\": {\n \"drawStyle\": \"lines\",\n \"fillOpacity\": 0.3,\n \"gradientMode\": \"opacity\",\n \"lineInterpolation\": \"linear\",\n \"lineWidth\": 2,\n \"stack\": \"off\",\n \"version\": \"2.0.0\"\n },\n \"datasourceCate\": \"prometheus\",\n \"datasourceValue\": \"${datasource}\",\n \"description\": \"错误率(每秒错误数)\",\n \"id\": \"63a3dcea-93d8-435e-a207-653ee4502c20\",\n \"layout\": {\n \"h\": 6,\n \"i\": \"63a3dcea-93d8-435e-a207-653ee4502c20\",\n \"w\": 6,\n \"x\": 12,\n \"y\": 18\n },\n \"links\": [],\n \"maxPerRow\": 4,\n \"name\": \"Error Rate\",\n \"options\": {\n \"legend\": {\n \"displayMode\": \"hidden\"\n },\n \"thresholds\": {\n \"steps\": [\n {\n \"color\": \"#634CD9\",\n \"type\": \"base\",\n \"value\": null\n }\n ]\n },\n \"tooltip\": {\n \"mode\": \"all\",\n \"sort\": \"none\"\n }\n },\n \"targets\": [\n {\n \"expr\": \"deriv(taos_dnodes_info_errors{cluster=\\\"$cluster\\\"}[1m])\",\n \"legend\": \"\",\n \"refId\": \"A\"\n }\n ],\n \"type\": \"timeseries\",\n \"version\": \"2.0.0\"\n },\n {\n \"custom\": {\n \"calc\": \"lastNotNull\",\n \"colorMode\": \"value\",\n \"textMode\": \"value\",\n \"version\": \"2.0.0\"\n },\n \"datasourceCate\": \"prometheus\",\n \"datasourceValue\": \"${datasource}\",\n \"id\": \"0010cd3a-1a0f-4f9c-9b21-438adf761750\",\n \"layout\": {\n \"h\": 6,\n \"i\": \"0010cd3a-1a0f-4f9c-9b21-438adf761750\",\n \"w\": 4,\n \"x\": 0,\n \"y\": 25\n },\n \"links\": [],\n \"maxPerRow\": 4,\n \"name\": \"DNodes Lifetime\",\n \"options\": {\n \"legend\": {\n \"displayMode\": \"list\"\n },\n \"standardOptions\": {\n \"util\": \"seconds\"\n },\n \"thresholds\": {\n \"mode\": \"absolute\",\n \"steps\": [\n {\n \"color\": \"#73BF69\",\n \"type\": \"base\",\n \"value\": null\n }\n ],\n \"style\": \"line\"\n },\n \"tooltip\": {\n \"mode\": \"multi\"\n },\n \"valueMappings\": []\n },\n \"targets\": [\n {\n \"expr\": \"taos_dnodes_info_uptime{cluster=\\\"$cluster\\\"}\",\n \"legend\": \"{{dnode_ep}}\",\n \"refId\": \"A\"\n }\n ],\n \"type\": \"stat\",\n \"version\": \"2.0.0\"\n },\n {\n \"custom\": {\n \"drawStyle\": \"lines\",\n \"fillOpacity\": 0.3,\n \"gradientMode\": \"opacity\",\n \"lineInterpolation\": \"linear\",\n \"lineWidth\": 2,\n \"stack\": \"off\",\n \"version\": \"2.0.0\"\n },\n \"datasourceCate\": \"prometheus\",\n \"datasourceValue\": \"${datasource}\",\n \"id\": \"29d21947-4661-4893-b907-5e7363787a10\",\n \"layout\": {\n \"h\": 6,\n \"i\": \"29d21947-4661-4893-b907-5e7363787a10\",\n \"w\": 10,\n \"x\": 4,\n \"y\": 25\n },\n \"links\": [],\n \"maxPerRow\": 4,\n \"name\": \"DNodes Number\",\n \"options\": {\n \"legend\": {\n \"displayMode\": \"hidden\"\n },\n \"thresholds\": {\n \"steps\": [\n {\n \"color\": \"#634CD9\",\n \"type\": \"base\",\n \"value\": null\n }\n ]\n },\n \"tooltip\": {\n \"mode\": \"all\",\n \"sort\": \"none\"\n }\n },\n \"targets\": [\n {\n \"expr\": \"taos_cluster_info_dnodes_total{cluster=\\\"$cluster\\\"}\",\n \"legend\": \"total\",\n \"refId\": \"A\"\n },\n {\n \"expr\": \"taos_cluster_info_dnodes_alive{cluster=\\\"$cluster\\\"}\",\n \"legend\": \"alive\",\n \"refId\": \"B\"\n }\n ],\n \"type\": \"timeseries\",\n \"version\": \"2.0.0\"\n },\n {\n \"custom\": {\n \"drawStyle\": \"lines\",\n \"fillOpacity\": 0.3,\n \"gradientMode\": \"opacity\",\n \"lineInterpolation\": \"linear\",\n \"lineWidth\": 2,\n \"stack\": \"off\",\n \"version\": \"2.0.0\"\n },\n \"datasourceCate\": \"prometheus\",\n \"datasourceValue\": \"${datasource}\",\n \"id\": \"eb3dbe22-6550-4937-9848-897bd7c8ff22\",\n \"layout\": {\n \"h\": 6,\n \"i\": \"eb3dbe22-6550-4937-9848-897bd7c8ff22\",\n \"w\": 10,\n \"x\": 14,\n \"y\": 25\n },\n \"links\": [],\n \"maxPerRow\": 4,\n \"name\": \"MNodes Number\",\n \"options\": {\n \"legend\": {\n \"displayMode\": \"hidden\"\n },\n \"thresholds\": {\n \"steps\": [\n {\n \"color\": \"#634CD9\",\n \"type\": \"base\",\n \"value\": null\n }\n ]\n },\n \"tooltip\": {\n \"mode\": \"all\",\n \"sort\": \"none\"\n }\n },\n \"targets\": [\n {\n \"expr\": \"taos_cluster_info_mnodes_total{cluster=\\\"$cluster\\\"}\",\n \"legend\": \"total\",\n \"refId\": \"A\"\n },\n {\n \"expr\": \"taos_cluster_info_mnodes_alive{cluster=\\\"$cluster\\\"}\",\n \"legend\": \"alive\",\n \"refId\": \"B\"\n }\n ],\n \"type\": \"timeseries\",\n \"version\": \"2.0.0\"\n }\n ],\n \"var\": [\n {\n \"definition\": \"prometheus\",\n \"name\": \"datasource\",\n \"type\": \"datasource\"\n },\n {\n \"allOption\": false,\n \"datasource\": {\n \"cate\": \"prometheus\",\n \"value\": \"${datasource}\"\n },\n \"definition\": \"label_values(taos_dn_cpu_taosd, cluster)\",\n \"multi\": false,\n \"name\": \"cluster\",\n \"reg\": \"\",\n \"type\": \"query\"\n },\n {\n \"allOption\": false,\n \"datasource\": {\n \"cate\": \"prometheus\",\n \"value\": \"${datasource}\"\n },\n \"definition\": \"label_values(taos_dn_cpu_taosd{cluster=\\\"$cluster\\\"}, fqdn)\",\n \"multi\": false,\n \"name\": \"fqdn\",\n \"reg\": \"\",\n \"type\": \"query\"\n },\n {\n \"allOption\": false,\n \"datasource\": {\n \"cate\": \"prometheus\",\n \"value\": \"${datasource}\"\n },\n \"definition\": \"label_values(taos_dn_cpu_taosd{cluster=\\\"$cluster\\\"}, dnodeid)\",\n \"multi\": false,\n \"name\": \"dnodeid\",\n \"reg\": \"\",\n \"type\": \"query\"\n },\n {\n \"allOption\": true,\n \"datasource\": {\n \"cate\": \"prometheus\",\n \"value\": \"${datasource}\"\n },\n \"definition\": \"label_values(taos_vgroups_info_status{cluster=\\\"$cluster\\\"}, database_name)\",\n \"multi\": true,\n \"name\": \"database\",\n \"reg\": \"\",\n \"type\": \"query\"\n },\n {\n \"allOption\": false,\n \"datasource\": {\n \"cate\": \"prometheus\",\n \"value\": \"${datasource}\"\n },\n \"definition\": \"label_values(taos_cluster_info_first_ep{cluster=\\\"$cluster\\\"}, value)\",\n \"multi\": false,\n \"name\": \"firstEp\",\n \"reg\": \"\",\n \"type\": \"query\"\n },\n {\n \"allOption\": false,\n \"datasource\": {\n \"cate\": \"prometheus\",\n \"value\": \"${datasource}\"\n },\n \"definition\": \"label_values(taos_cluster_info_version{cluster=\\\"$cluster\\\"}, value)\",\n \"multi\": false,\n \"name\": \"version\",\n \"reg\": \"\",\n \"type\": \"query\"\n }\n ],\n \"version\": \"3.0.0\"\n },\n \"public\": 0,\n \"public_cate\": 0,\n \"bgids\": null,\n \"built_in\": 0,\n \"hide\": 0,\n \"uuid\": 1717556328408805000\n}"
},
{
"path": "integrations/TDEngine/markdown/README.md",
"content": "# TDEngine\n\nTDEngine 也可以暴露 Prometheus 的监控数据,具体启用方法如下:\n\nTODO\n\n## 采集配置\n\n既然暴露了 Prometheus 协议的监控数据,那通过 categraf prometheus 插件直接采集即可。配置文件是 `conf/input.prometheus/prometheus.toml`。配置样例如下:\n\n```toml\n[[instances]]\nurls = [\n \"http://192.168.11.177:8080/xxxx\"\n]\n```\n"
},
{
"path": "integrations/TiDB/alerts/tidb-alerts.json",
"content": "[\n {\n \"id\": 0,\n \"group_id\": 0,\n \"cate\": \"prometheus\",\n \"datasource_ids\": [\n 7\n ],\n \"cluster\": \"\",\n \"name\": \"TiDB-CPU 使用率大于 80%\",\n \"note\": \"TiDB(中控)\",\n \"prod\": \"metric\",\n \"algorithm\": \"\",\n \"algo_params\": null,\n \"delay\": 0,\n \"severity\": 0,\n \"severities\": [\n 2\n ],\n \"disabled\": 1,\n \"prom_for_duration\": 60,\n \"prom_ql\": \"\",\n \"rule_config\": {\n \"queries\": [\n {\n \"prom_ql\": \"avg(irate(node_cpu_seconds_total{mode=\\\"idle\\\"}[5m])) by(instance) * 100 \\u003c= 20\",\n \"severity\": 2\n }\n ]\n },\n \"prom_eval_interval\": 30,\n \"enable_stime\": \"00:00\",\n \"enable_stimes\": [\n \"00:00\"\n ],\n \"enable_etime\": \"23:59\",\n \"enable_etimes\": [\n \"23:59\"\n ],\n \"enable_days_of_week\": [\n \"0\",\n \"1\",\n \"2\",\n \"3\",\n \"4\",\n \"5\",\n \"6\"\n ],\n \"enable_days_of_weeks\": [\n [\n \"0\",\n \"1\",\n \"2\",\n \"3\",\n \"4\",\n \"5\",\n \"6\"\n ]\n ],\n \"enable_in_bg\": 0,\n \"notify_recovered\": 1,\n \"notify_channels\": [\n \"nvwa\"\n ],\n \"notify_groups_obj\": null,\n \"notify_groups\": null,\n \"notify_repeat_step\": 60,\n \"notify_max_number\": 0,\n \"recover_duration\": 0,\n \"callbacks\": [],\n \"runbook_url\": \"\",\n \"append_tags\": [],\n \"annotations\": {},\n \"extra_config\": null,\n \"create_at\": 0,\n \"create_by\": \"\",\n \"update_at\": 0,\n \"update_by\": \"\",\n \"uuid\": 1717556328412826000\n },\n {\n \"id\": 0,\n \"group_id\": 0,\n \"cate\": \"prometheus\",\n \"datasource_ids\": [\n 7\n ],\n \"cluster\": \"\",\n \"name\": \"TiDB-Node_exporter_is_down\",\n \"note\": \"TiDB(中控)\",\n \"prod\": \"metric\",\n \"algorithm\": \"\",\n \"algo_params\": null,\n \"delay\": 0,\n \"severity\": 0,\n \"severities\": [\n 1\n ],\n \"disabled\": 1,\n \"prom_for_duration\": 60,\n \"prom_ql\": \"\",\n \"rule_config\": {\n \"queries\": [\n {\n \"prom_ql\": \"probe_success{group=\\\"node_exporter\\\"} == 0\",\n \"severity\": 1\n }\n ]\n },\n \"prom_eval_interval\": 30,\n \"enable_stime\": \"00:00\",\n \"enable_stimes\": [\n \"00:00\"\n ],\n \"enable_etime\": \"23:59\",\n \"enable_etimes\": [\n \"23:59\"\n ],\n \"enable_days_of_week\": [\n \"0\",\n \"1\",\n \"2\",\n \"3\",\n \"4\",\n \"5\",\n \"6\"\n ],\n \"enable_days_of_weeks\": [\n [\n \"0\",\n \"1\",\n \"2\",\n \"3\",\n \"4\",\n \"5\",\n \"6\"\n ]\n ],\n \"enable_in_bg\": 0,\n \"notify_recovered\": 1,\n \"notify_channels\": [\n \"nvwa\"\n ],\n \"notify_groups_obj\": null,\n \"notify_groups\": null,\n \"notify_repeat_step\": 1,\n \"notify_max_number\": 0,\n \"recover_duration\": 0,\n \"callbacks\": [],\n \"runbook_url\": \"\",\n \"append_tags\": [],\n \"annotations\": {},\n \"extra_config\": null,\n \"create_at\": 0,\n \"create_by\": \"\",\n \"update_at\": 0,\n \"update_by\": \"\",\n \"uuid\": 1717556328413298000\n },\n {\n \"id\": 0,\n \"group_id\": 0,\n \"cate\": \"prometheus\",\n \"datasource_ids\": [\n 7\n ],\n \"cluster\": \"\",\n \"name\": \"TiDB-PD 写盘延迟大于 1s ,leader 写盘慢会导致 leader 切换\",\n \"note\": \"TiDB(中控)\",\n \"prod\": \"metric\",\n \"algorithm\": \"\",\n \"algo_params\": null,\n \"delay\": 0,\n \"severity\": 0,\n \"severities\": [\n 3\n ],\n \"disabled\": 1,\n \"prom_for_duration\": 60,\n \"prom_ql\": \"\",\n \"rule_config\": {\n \"queries\": [\n {\n \"prom_ql\": \"histogram_quantile(0.99, sum(rate(etcd_disk_wal_fsync_duration_seconds_bucket[1m])) by (instance,job,le) ) \\u003e 1\",\n \"severity\": 3\n }\n ]\n },\n \"prom_eval_interval\": 30,\n \"enable_stime\": \"00:00\",\n \"enable_stimes\": [\n \"00:00\"\n ],\n \"enable_etime\": \"23:59\",\n \"enable_etimes\": [\n \"23:59\"\n ],\n \"enable_days_of_week\": [\n \"0\",\n \"1\",\n \"2\",\n \"3\",\n \"4\",\n \"5\",\n \"6\"\n ],\n \"enable_days_of_weeks\": [\n [\n \"0\",\n \"1\",\n \"2\",\n \"3\",\n \"4\",\n \"5\",\n \"6\"\n ]\n ],\n \"enable_in_bg\": 0,\n \"notify_recovered\": 1,\n \"notify_channels\": [\n \"nvwa\"\n ],\n \"notify_groups_obj\": null,\n \"notify_groups\": null,\n \"notify_repeat_step\": 60,\n \"notify_max_number\": 0,\n \"recover_duration\": 0,\n \"callbacks\": [],\n \"runbook_url\": \"\",\n \"append_tags\": [],\n \"annotations\": {},\n \"extra_config\": null,\n \"create_at\": 0,\n \"create_by\": \"\",\n \"update_at\": 0,\n \"update_by\": \"\",\n \"uuid\": 1717556328413731000\n },\n {\n \"id\": 0,\n \"group_id\": 0,\n \"cate\": \"prometheus\",\n \"datasource_ids\": [\n 7\n ],\n \"cluster\": \"\",\n \"name\": \"TiDB-PD 无 leader \",\n \"note\": \"TiDB(中控)\",\n \"prod\": \"metric\",\n \"algorithm\": \"\",\n \"algo_params\": null,\n \"delay\": 0,\n \"severity\": 0,\n \"severities\": [\n 1\n ],\n \"disabled\": 1,\n \"prom_for_duration\": 60,\n \"prom_ql\": \"\",\n \"rule_config\": {\n \"queries\": [\n {\n \"prom_ql\": \"sum(etcd_server_is_leader) !=1\",\n \"severity\": 1\n }\n ]\n },\n \"prom_eval_interval\": 30,\n \"enable_stime\": \"00:00\",\n \"enable_stimes\": [\n \"00:00\"\n ],\n \"enable_etime\": \"23:59\",\n \"enable_etimes\": [\n \"23:59\"\n ],\n \"enable_days_of_week\": [\n \"0\",\n \"1\",\n \"2\",\n \"3\",\n \"4\",\n \"5\",\n \"6\"\n ],\n \"enable_days_of_weeks\": [\n [\n \"0\",\n \"1\",\n \"2\",\n \"3\",\n \"4\",\n \"5\",\n \"6\"\n ]\n ],\n \"enable_in_bg\": 0,\n \"notify_recovered\": 1,\n \"notify_channels\": [\n \"nvwa\"\n ],\n \"notify_groups_obj\": null,\n \"notify_groups\": null,\n \"notify_repeat_step\": 60,\n \"notify_max_number\": 0,\n \"recover_duration\": 0,\n \"callbacks\": [],\n \"runbook_url\": \"\",\n \"append_tags\": [],\n \"annotations\": {\n \"描述\": \"集群不可用,可能 pd 多数派故障,需要分析日志查看无法选举 leader 的原因。\"\n },\n \"extra_config\": null,\n \"create_at\": 0,\n \"create_by\": \"\",\n \"update_at\": 0,\n \"update_by\": \"\",\n \"uuid\": 1717556328414240000\n },\n {\n \"id\": 0,\n \"group_id\": 0,\n \"cate\": \"prometheus\",\n \"datasource_ids\": [\n 7\n ],\n \"cluster\": \"\",\n \"name\": \"TiDB-PD 节点之间网络延迟大于 1s\",\n \"note\": \"TiDB(中控)\",\n \"prod\": \"metric\",\n \"algorithm\": \"\",\n \"algo_params\": null,\n \"delay\": 0,\n \"severity\": 0,\n \"severities\": [\n 3\n ],\n \"disabled\": 1,\n \"prom_for_duration\": 60,\n \"prom_ql\": \"\",\n \"rule_config\": {\n \"queries\": [\n {\n \"prom_ql\": \"histogram_quantile(0.99, sum(rate(etcd_network_peer_round_trip_time_seconds_bucket[1m])) by (To,instance,job,le) ) \\u003e 1\",\n \"severity\": 3\n }\n ]\n },\n \"prom_eval_interval\": 30,\n \"enable_stime\": \"00:00\",\n \"enable_stimes\": [\n \"00:00\"\n ],\n \"enable_etime\": \"23:59\",\n \"enable_etimes\": [\n \"23:59\"\n ],\n \"enable_days_of_week\": [\n \"0\",\n \"1\",\n \"2\",\n \"3\",\n \"4\",\n \"5\",\n \"6\"\n ],\n \"enable_days_of_weeks\": [\n [\n \"0\",\n \"1\",\n \"2\",\n \"3\",\n \"4\",\n \"5\",\n \"6\"\n ]\n ],\n \"enable_in_bg\": 0,\n \"notify_recovered\": 1,\n \"notify_channels\": [\n \"nvwa\"\n ],\n \"notify_groups_obj\": null,\n \"notify_groups\": null,\n \"notify_repeat_step\": 60,\n \"notify_max_number\": 0,\n \"recover_duration\": 0,\n \"callbacks\": [],\n \"runbook_url\": \"\",\n \"append_tags\": [],\n \"annotations\": {},\n \"extra_config\": null,\n \"create_at\": 0,\n \"create_by\": \"\",\n \"update_at\": 0,\n \"update_by\": \"\",\n \"uuid\": 1717556328414657000\n },\n {\n \"id\": 0,\n \"group_id\": 0,\n \"cate\": \"prometheus\",\n \"datasource_ids\": [\n 7\n ],\n \"cluster\": \"\",\n \"name\": \"TiDB-TCP 连接数大于 50000 \",\n \"note\": \"TiDB(中控)\",\n \"prod\": \"metric\",\n \"algorithm\": \"\",\n \"algo_params\": null,\n \"delay\": 0,\n \"severity\": 0,\n \"severities\": [\n 2\n ],\n \"disabled\": 1,\n \"prom_for_duration\": 60,\n \"prom_ql\": \"\",\n \"rule_config\": {\n \"queries\": [\n {\n \"prom_ql\": \"node_netstat_Tcp_CurrEstab \\u003e 50000\",\n \"severity\": 2\n }\n ]\n },\n \"prom_eval_interval\": 30,\n \"enable_stime\": \"00:00\",\n \"enable_stimes\": [\n \"00:00\"\n ],\n \"enable_etime\": \"23:59\",\n \"enable_etimes\": [\n \"23:59\"\n ],\n \"enable_days_of_week\": [\n \"0\",\n \"1\",\n \"2\",\n \"3\",\n \"4\",\n \"5\",\n \"6\"\n ],\n \"enable_days_of_weeks\": [\n [\n \"0\",\n \"1\",\n \"2\",\n \"3\",\n \"4\",\n \"5\",\n \"6\"\n ]\n ],\n \"enable_in_bg\": 0,\n \"notify_recovered\": 1,\n \"notify_channels\": [\n \"nvwa\"\n ],\n \"notify_groups_obj\": null,\n \"notify_groups\": null,\n \"notify_repeat_step\": 60,\n \"notify_max_number\": 0,\n \"recover_duration\": 0,\n \"callbacks\": [],\n \"runbook_url\": \"\",\n \"append_tags\": [],\n \"annotations\": {\n \"描述\": \"通常有连接泄露,需分析主要是与哪个对象的连接。\"\n },\n \"extra_config\": null,\n \"create_at\": 0,\n \"create_by\": \"\",\n \"update_at\": 0,\n \"update_by\": \"\",\n \"uuid\": 1717556328415098000\n },\n {\n \"id\": 0,\n \"group_id\": 0,\n \"cate\": \"prometheus\",\n \"datasource_ids\": [\n 7\n ],\n \"cluster\": \"\",\n \"name\": \"TiDB-TiDB_server_is_down\",\n \"note\": \"TiDB(中控)\",\n \"prod\": \"metric\",\n \"algorithm\": \"\",\n \"algo_params\": null,\n \"delay\": 0,\n \"severity\": 0,\n \"severities\": [\n 1\n ],\n \"disabled\": 1,\n \"prom_for_duration\": 60,\n \"prom_ql\": \"\",\n \"rule_config\": {\n \"queries\": [\n {\n \"prom_ql\": \"probe_success{group=\\\"tidb\\\"} == 0\",\n \"severity\": 1\n }\n ]\n },\n \"prom_eval_interval\": 30,\n \"enable_stime\": \"00:00\",\n \"enable_stimes\": [\n \"00:00\"\n ],\n \"enable_etime\": \"23:59\",\n \"enable_etimes\": [\n \"23:59\"\n ],\n \"enable_days_of_week\": [\n \"0\",\n \"1\",\n \"2\",\n \"3\",\n \"4\",\n \"5\",\n \"6\"\n ],\n \"enable_days_of_weeks\": [\n [\n \"0\",\n \"1\",\n \"2\",\n \"3\",\n \"4\",\n \"5\",\n \"6\"\n ]\n ],\n \"enable_in_bg\": 0,\n \"notify_recovered\": 1,\n \"notify_channels\": [\n \"nvwa\"\n ],\n \"notify_groups_obj\": null,\n \"notify_groups\": null,\n \"notify_repeat_step\": 60,\n \"notify_max_number\": 0,\n \"recover_duration\": 0,\n \"callbacks\": [],\n \"runbook_url\": \"\",\n \"append_tags\": [],\n \"annotations\": {},\n \"extra_config\": null,\n \"create_at\": 0,\n \"create_by\": \"\",\n \"update_at\": 0,\n \"update_by\": \"\",\n \"uuid\": 1717556328415532000\n },\n {\n \"id\": 0,\n \"group_id\": 0,\n \"cate\": \"prometheus\",\n \"datasource_ids\": [\n 7\n ],\n \"cluster\": \"\",\n \"name\": \"TiDB-blackbox_is_down\",\n \"note\": \"TiDB(中控)\",\n \"prod\": \"metric\",\n \"algorithm\": \"\",\n \"algo_params\": null,\n \"delay\": 0,\n \"severity\": 0,\n \"severities\": [\n 1\n ],\n \"disabled\": 1,\n \"prom_for_duration\": 60,\n \"prom_ql\": \"\",\n \"rule_config\": {\n \"queries\": [\n {\n \"prom_ql\": \"probe_success{group=\\\"blackbox_exporter\\\"} == 0\",\n \"severity\": 1\n }\n ]\n },\n \"prom_eval_interval\": 30,\n \"enable_stime\": \"00:00\",\n \"enable_stimes\": [\n \"00:00\"\n ],\n \"enable_etime\": \"23:59\",\n \"enable_etimes\": [\n \"23:59\"\n ],\n \"enable_days_of_week\": [\n \"0\",\n \"1\",\n \"2\",\n \"3\",\n \"4\",\n \"5\",\n \"6\"\n ],\n \"enable_days_of_weeks\": [\n [\n \"0\",\n \"1\",\n \"2\",\n \"3\",\n \"4\",\n \"5\",\n \"6\"\n ]\n ],\n \"enable_in_bg\": 0,\n \"notify_recovered\": 1,\n \"notify_channels\": [\n \"nvwa\"\n ],\n \"notify_groups_obj\": null,\n \"notify_groups\": null,\n \"notify_repeat_step\": 60,\n \"notify_max_number\": 0,\n \"recover_duration\": 0,\n \"callbacks\": [],\n \"runbook_url\": \"\",\n \"append_tags\": [],\n \"annotations\": {},\n \"extra_config\": null,\n \"create_at\": 0,\n \"create_by\": \"\",\n \"update_at\": 0,\n \"update_by\": \"\",\n \"uuid\": 1717556328416073000\n },\n {\n \"id\": 0,\n \"group_id\": 0,\n \"cate\": \"prometheus\",\n \"datasource_ids\": [\n 7\n ],\n \"cluster\": \"\",\n \"name\": \"TiDB-drainer_server_is_down\",\n \"note\": \"TiDB(中控)\",\n \"prod\": \"metric\",\n \"algorithm\": \"\",\n \"algo_params\": null,\n \"delay\": 0,\n \"severity\": 0,\n \"severities\": [\n 1\n ],\n \"disabled\": 1,\n \"prom_for_duration\": 60,\n \"prom_ql\": \"\",\n \"rule_config\": {\n \"queries\": [\n {\n \"prom_ql\": \"probe_success{group=\\\"drainer\\\"} == 0\",\n \"severity\": 1\n }\n ]\n },\n \"prom_eval_interval\": 30,\n \"enable_stime\": \"00:00\",\n \"enable_stimes\": [\n \"00:00\"\n ],\n \"enable_etime\": \"23:59\",\n \"enable_etimes\": [\n \"23:59\"\n ],\n \"enable_days_of_week\": [\n \"0\",\n \"1\",\n \"2\",\n \"3\",\n \"4\",\n \"5\",\n \"6\"\n ],\n \"enable_days_of_weeks\": [\n [\n \"0\",\n \"1\",\n \"2\",\n \"3\",\n \"4\",\n \"5\",\n \"6\"\n ]\n ],\n \"enable_in_bg\": 0,\n \"notify_recovered\": 1,\n \"notify_channels\": [\n \"nvwa\"\n ],\n \"notify_groups_obj\": null,\n \"notify_groups\": null,\n \"notify_repeat_step\": 60,\n \"notify_max_number\": 0,\n \"recover_duration\": 0,\n \"callbacks\": [],\n \"runbook_url\": \"\",\n \"append_tags\": [],\n \"annotations\": {},\n \"extra_config\": null,\n \"create_at\": 0,\n \"create_by\": \"\",\n \"update_at\": 0,\n \"update_by\": \"\",\n \"uuid\": 1717556328416479000\n },\n {\n \"id\": 0,\n \"group_id\": 0,\n \"cate\": \"prometheus\",\n \"datasource_ids\": [\n 7\n ],\n \"cluster\": \"\",\n \"name\": \"TiDB-grafana_is_down\",\n \"note\": \"TiDB(中控)\",\n \"prod\": \"metric\",\n \"algorithm\": \"\",\n \"algo_params\": null,\n \"delay\": 0,\n \"severity\": 0,\n \"severities\": [\n 1\n ],\n \"disabled\": 1,\n \"prom_for_duration\": 60,\n \"prom_ql\": \"\",\n \"rule_config\": {\n \"queries\": [\n {\n \"prom_ql\": \"probe_success{group=\\\"grafana\\\"} == 0\",\n \"severity\": 1\n }\n ]\n },\n \"prom_eval_interval\": 30,\n \"enable_stime\": \"00:00\",\n \"enable_stimes\": [\n \"00:00\"\n ],\n \"enable_etime\": \"23:59\",\n \"enable_etimes\": [\n \"23:59\"\n ],\n \"enable_days_of_week\": [\n \"0\",\n \"1\",\n \"2\",\n \"3\",\n \"4\",\n \"5\",\n \"6\"\n ],\n \"enable_days_of_weeks\": [\n [\n \"0\",\n \"1\",\n \"2\",\n \"3\",\n \"4\",\n \"5\",\n \"6\"\n ]\n ],\n \"enable_in_bg\": 0,\n \"notify_recovered\": 1,\n \"notify_channels\": [\n \"nvwa\"\n ],\n \"notify_groups_obj\": null,\n \"notify_groups\": null,\n \"notify_repeat_step\": 60,\n \"notify_max_number\": 0,\n \"recover_duration\": 0,\n \"callbacks\": [],\n \"runbook_url\": \"\",\n \"append_tags\": [],\n \"annotations\": {},\n \"extra_config\": null,\n \"create_at\": 0,\n \"create_by\": \"\",\n \"update_at\": 0,\n \"update_by\": \"\",\n \"uuid\": 1717556328416917000\n },\n {\n \"id\": 0,\n \"group_id\": 0,\n \"cate\": \"prometheus\",\n \"datasource_ids\": [\n 7\n ],\n \"cluster\": \"\",\n \"name\": \"TiDB-pd_server_is_down\",\n \"note\": \"TiDB(中控)\",\n \"prod\": \"metric\",\n \"algorithm\": \"\",\n \"algo_params\": null,\n \"delay\": 0,\n \"severity\": 0,\n \"severities\": [\n 1\n ],\n \"disabled\": 1,\n \"prom_for_duration\": 60,\n \"prom_ql\": \"\",\n \"rule_config\": {\n \"queries\": [\n {\n \"prom_ql\": \"probe_success{group=\\\"pd\\\"} == 0\",\n \"severity\": 1\n }\n ]\n },\n \"prom_eval_interval\": 30,\n \"enable_stime\": \"00:00\",\n \"enable_stimes\": [\n \"00:00\"\n ],\n \"enable_etime\": \"23:59\",\n \"enable_etimes\": [\n \"23:59\"\n ],\n \"enable_days_of_week\": [\n \"0\",\n \"1\",\n \"2\",\n \"3\",\n \"4\",\n \"5\",\n \"6\"\n ],\n \"enable_days_of_weeks\": [\n [\n \"0\",\n \"1\",\n \"2\",\n \"3\",\n \"4\",\n \"5\",\n \"6\"\n ]\n ],\n \"enable_in_bg\": 0,\n \"notify_recovered\": 1,\n \"notify_channels\": [\n \"nvwa\"\n ],\n \"notify_groups_obj\": null,\n \"notify_groups\": null,\n \"notify_repeat_step\": 60,\n \"notify_max_number\": 0,\n \"recover_duration\": 0,\n \"callbacks\": [],\n \"runbook_url\": \"\",\n \"append_tags\": [],\n \"annotations\": {},\n \"extra_config\": null,\n \"create_at\": 0,\n \"create_by\": \"\",\n \"update_at\": 0,\n \"update_by\": \"\",\n \"uuid\": 1717556328417394000\n },\n {\n \"id\": 0,\n \"group_id\": 0,\n \"cate\": \"prometheus\",\n \"datasource_ids\": [\n 7\n ],\n \"cluster\": \"\",\n \"name\": \"TiDB-pump_server_is_down\",\n \"note\": \"TiDB(中控)\",\n \"prod\": \"metric\",\n \"algorithm\": \"\",\n \"algo_params\": null,\n \"delay\": 0,\n \"severity\": 0,\n \"severities\": [\n 1\n ],\n \"disabled\": 1,\n \"prom_for_duration\": 60,\n \"prom_ql\": \"\",\n \"rule_config\": {\n \"queries\": [\n {\n \"prom_ql\": \"probe_success{group=\\\"pump\\\"} == 0\",\n \"severity\": 1\n }\n ]\n },\n \"prom_eval_interval\": 30,\n \"enable_stime\": \"00:00\",\n \"enable_stimes\": [\n \"00:00\"\n ],\n \"enable_etime\": \"23:59\",\n \"enable_etimes\": [\n \"23:59\"\n ],\n \"enable_days_of_week\": [\n \"0\",\n \"1\",\n \"2\",\n \"3\",\n \"4\",\n \"5\",\n \"6\"\n ],\n \"enable_days_of_weeks\": [\n [\n \"0\",\n \"1\",\n \"2\",\n \"3\",\n \"4\",\n \"5\",\n \"6\"\n ]\n ],\n \"enable_in_bg\": 0,\n \"notify_recovered\": 1,\n \"notify_channels\": [\n \"nvwa\"\n ],\n \"notify_groups_obj\": null,\n \"notify_groups\": null,\n \"notify_repeat_step\": 60,\n \"notify_max_number\": 0,\n \"recover_duration\": 0,\n \"callbacks\": [],\n \"runbook_url\": \"\",\n \"append_tags\": [],\n \"annotations\": {},\n \"extra_config\": null,\n \"create_at\": 0,\n \"create_by\": \"\",\n \"update_at\": 0,\n \"update_by\": \"\",\n \"uuid\": 1717556328417841000\n },\n {\n \"id\": 0,\n \"group_id\": 0,\n \"cate\": \"prometheus\",\n \"datasource_ids\": [\n 7\n ],\n \"cluster\": \"\",\n \"name\": \"TiDB-tidb CPU 使用率超过可用 CPU的 80%\",\n \"note\": \"TiDB(中控)\",\n \"prod\": \"metric\",\n \"algorithm\": \"\",\n \"algo_params\": null,\n \"delay\": 0,\n \"severity\": 0,\n \"severities\": [\n 2\n ],\n \"disabled\": 1,\n \"prom_for_duration\": 60,\n \"prom_ql\": \"\",\n \"rule_config\": {\n \"queries\": [\n {\n \"prom_ql\": \"rate(process_cpu_seconds_total{job=\\\"tidb\\\"}[1m]) \\u003e tidb_server_maxprocs{job=\\\"tidb\\\"} * 0.8\",\n \"severity\": 2\n }\n ]\n },\n \"prom_eval_interval\": 30,\n \"enable_stime\": \"00:00\",\n \"enable_stimes\": [\n \"00:00\"\n ],\n \"enable_etime\": \"23:59\",\n \"enable_etimes\": [\n \"23:59\"\n ],\n \"enable_days_of_week\": [\n \"0\",\n \"1\",\n \"2\",\n \"3\",\n \"4\",\n \"5\",\n \"6\"\n ],\n \"enable_days_of_weeks\": [\n [\n \"0\",\n \"1\",\n \"2\",\n \"3\",\n \"4\",\n \"5\",\n \"6\"\n ]\n ],\n \"enable_in_bg\": 0,\n \"notify_recovered\": 1,\n \"notify_channels\": [\n \"nvwa\"\n ],\n \"notify_groups_obj\": null,\n \"notify_groups\": null,\n \"notify_repeat_step\": 60,\n \"notify_max_number\": 0,\n \"recover_duration\": 0,\n \"callbacks\": [],\n \"runbook_url\": \"\",\n \"append_tags\": [],\n \"annotations\": {},\n \"extra_config\": null,\n \"create_at\": 0,\n \"create_by\": \"\",\n \"update_at\": 0,\n \"update_by\": \"\",\n \"uuid\": 1717556328418304000\n },\n {\n \"id\": 0,\n \"group_id\": 0,\n \"cate\": \"prometheus\",\n \"datasource_ids\": [\n 7\n ],\n \"cluster\": \"\",\n \"name\": \"TiDB-tidb 最近 15 分钟加载 schema 出现错误\",\n \"note\": \"TiDB(中控)\",\n \"prod\": \"metric\",\n \"algorithm\": \"\",\n \"algo_params\": null,\n \"delay\": 0,\n \"severity\": 0,\n \"severities\": [\n 1\n ],\n \"disabled\": 1,\n \"prom_for_duration\": 60,\n \"prom_ql\": \"\",\n \"rule_config\": {\n \"queries\": [\n {\n \"prom_ql\": \"increase(tidb_session_schema_lease_error_total{type=\\\"outdated\\\"}[15m]) \\u003e 0\",\n \"severity\": 1\n }\n ]\n },\n \"prom_eval_interval\": 30,\n \"enable_stime\": \"00:00\",\n \"enable_stimes\": [\n \"00:00\"\n ],\n \"enable_etime\": \"23:59\",\n \"enable_etimes\": [\n \"23:59\"\n ],\n \"enable_days_of_week\": [\n \"0\",\n \"1\",\n \"2\",\n \"3\",\n \"4\",\n \"5\",\n \"6\"\n ],\n \"enable_days_of_weeks\": [\n [\n \"0\",\n \"1\",\n \"2\",\n \"3\",\n \"4\",\n \"5\",\n \"6\"\n ]\n ],\n \"enable_in_bg\": 0,\n \"notify_recovered\": 1,\n \"notify_channels\": [\n \"nvwa\"\n ],\n \"notify_groups_obj\": null,\n \"notify_groups\": null,\n \"notify_repeat_step\": 60,\n \"notify_max_number\": 0,\n \"recover_duration\": 0,\n \"callbacks\": [],\n \"runbook_url\": \"\",\n \"append_tags\": [],\n \"annotations\": {},\n \"extra_config\": null,\n \"create_at\": 0,\n \"create_by\": \"\",\n \"update_at\": 0,\n \"update_by\": \"\",\n \"uuid\": 1717556328418783000\n },\n {\n \"id\": 0,\n \"group_id\": 0,\n \"cate\": \"prometheus\",\n \"datasource_ids\": [\n 7\n ],\n \"cluster\": \"\",\n \"name\": \"TiDB-tidb 最近五分钟出现跳过 binlog\",\n \"note\": \"TiDB(中控)\",\n \"prod\": \"metric\",\n \"algorithm\": \"\",\n \"algo_params\": null,\n \"delay\": 0,\n \"severity\": 0,\n \"severities\": [\n 2\n ],\n \"disabled\": 1,\n \"prom_for_duration\": 60,\n \"prom_ql\": \"\",\n \"rule_config\": {\n \"queries\": [\n {\n \"prom_ql\": \"increase( tidb_server_critical_error_total[5m] ) \\u003e 0\",\n \"severity\": 2\n }\n ]\n },\n \"prom_eval_interval\": 30,\n \"enable_stime\": \"00:00\",\n \"enable_stimes\": [\n \"00:00\"\n ],\n \"enable_etime\": \"23:59\",\n \"enable_etimes\": [\n \"23:59\"\n ],\n \"enable_days_of_week\": [\n \"0\",\n \"1\",\n \"2\",\n \"3\",\n \"4\",\n \"5\",\n \"6\"\n ],\n \"enable_days_of_weeks\": [\n [\n \"0\",\n \"1\",\n \"2\",\n \"3\",\n \"4\",\n \"5\",\n \"6\"\n ]\n ],\n \"enable_in_bg\": 0,\n \"notify_recovered\": 1,\n \"notify_channels\": [\n \"nvwa\"\n ],\n \"notify_groups_obj\": null,\n \"notify_groups\": null,\n \"notify_repeat_step\": 60,\n \"notify_max_number\": 0,\n \"recover_duration\": 0,\n \"callbacks\": [],\n \"runbook_url\": \"\",\n \"append_tags\": [],\n \"annotations\": {},\n \"extra_config\": null,\n \"create_at\": 0,\n \"create_by\": \"\",\n \"update_at\": 0,\n \"update_by\": \"\",\n \"uuid\": 1717556328419214000\n },\n {\n \"id\": 0,\n \"group_id\": 0,\n \"cate\": \"prometheus\",\n \"datasource_ids\": [\n 7\n ],\n \"cluster\": \"\",\n \"name\": \"TiDB-tidb 最近十分钟加载 schema 失败大于 10 次\",\n \"note\": \"TiDB(中控)\",\n \"prod\": \"metric\",\n \"algorithm\": \"\",\n \"algo_params\": null,\n \"delay\": 0,\n \"severity\": 0,\n \"severities\": [\n 1\n ],\n \"disabled\": 1,\n \"prom_for_duration\": 60,\n \"prom_ql\": \"\",\n \"rule_config\": {\n \"queries\": [\n {\n \"prom_ql\": \"increase( tidb_domain_load_schema_total{type=\\\"failed\\\"}[10m] ) \\u003e 10\",\n \"severity\": 1\n }\n ]\n },\n \"prom_eval_interval\": 30,\n \"enable_stime\": \"00:00\",\n \"enable_stimes\": [\n \"00:00\"\n ],\n \"enable_etime\": \"23:59\",\n \"enable_etimes\": [\n \"23:59\"\n ],\n \"enable_days_of_week\": [\n \"0\",\n \"1\",\n \"2\",\n \"3\",\n \"4\",\n \"5\",\n \"6\"\n ],\n \"enable_days_of_weeks\": [\n [\n \"0\",\n \"1\",\n \"2\",\n \"3\",\n \"4\",\n \"5\",\n \"6\"\n ]\n ],\n \"enable_in_bg\": 0,\n \"notify_recovered\": 1,\n \"notify_channels\": [\n \"nvwa\"\n ],\n \"notify_groups_obj\": null,\n \"notify_groups\": null,\n \"notify_repeat_step\": 60,\n \"notify_max_number\": 0,\n \"recover_duration\": 0,\n \"callbacks\": [],\n \"runbook_url\": \"\",\n \"append_tags\": [],\n \"annotations\": {},\n \"extra_config\": null,\n \"create_at\": 0,\n \"create_by\": \"\",\n \"update_at\": 0,\n \"update_by\": \"\",\n \"uuid\": 1717556328419672000\n },\n {\n \"id\": 0,\n \"group_id\": 0,\n \"cate\": \"prometheus\",\n \"datasource_ids\": [\n 7\n ],\n \"cluster\": \"\",\n \"name\": \"TiDB-tiflash_server_is_down\",\n \"note\": \"TiDB(中控)\",\n \"prod\": \"metric\",\n \"algorithm\": \"\",\n \"algo_params\": null,\n \"delay\": 0,\n \"severity\": 0,\n \"severities\": [\n 1\n ],\n \"disabled\": 1,\n \"prom_for_duration\": 60,\n \"prom_ql\": \"\",\n \"rule_config\": {\n \"queries\": [\n {\n \"prom_ql\": \"probe_success{group=\\\"tiflash\\\"} == 0\",\n \"severity\": 1\n }\n ]\n },\n \"prom_eval_interval\": 30,\n \"enable_stime\": \"00:00\",\n \"enable_stimes\": [\n \"00:00\"\n ],\n \"enable_etime\": \"23:59\",\n \"enable_etimes\": [\n \"23:59\"\n ],\n \"enable_days_of_week\": [\n \"0\",\n \"1\",\n \"2\",\n \"3\",\n \"4\",\n \"5\",\n \"6\"\n ],\n \"enable_days_of_weeks\": [\n [\n \"0\",\n \"1\",\n \"2\",\n \"3\",\n \"4\",\n \"5\",\n \"6\"\n ]\n ],\n \"enable_in_bg\": 0,\n \"notify_recovered\": 1,\n \"notify_channels\": [\n \"nvwa\"\n ],\n \"notify_groups_obj\": null,\n \"notify_groups\": null,\n \"notify_repeat_step\": 60,\n \"notify_max_number\": 0,\n \"recover_duration\": 0,\n \"callbacks\": [],\n \"runbook_url\": \"\",\n \"append_tags\": [],\n \"annotations\": {},\n \"extra_config\": null,\n \"create_at\": 0,\n \"create_by\": \"\",\n \"update_at\": 0,\n \"update_by\": \"\",\n \"uuid\": 1717556328420192000\n },\n {\n \"id\": 0,\n \"group_id\": 0,\n \"cate\": \"prometheus\",\n \"datasource_ids\": [\n 7\n ],\n \"cluster\": \"\",\n \"name\": \"TiDB-tikv 5分钟内内存增长大于 5G\",\n \"note\": \"TiDB(中控)\",\n \"prod\": \"metric\",\n \"algorithm\": \"\",\n \"algo_params\": null,\n \"delay\": 0,\n \"severity\": 0,\n \"severities\": [\n 3\n ],\n \"disabled\": 1,\n \"prom_for_duration\": 60,\n \"prom_ql\": \"\",\n \"rule_config\": {\n \"queries\": [\n {\n \"prom_ql\": \"process_resident_memory_bytes{job=~\\\"tikv\\\",instance=~\\\".*\\\"} - (process_resident_memory_bytes{job=~\\\"tikv\\\",instance=~\\\".*\\\"} offset 5m) \\u003e 5*1024*1024*1024\",\n \"severity\": 3\n }\n ]\n },\n \"prom_eval_interval\": 30,\n \"enable_stime\": \"00:00\",\n \"enable_stimes\": [\n \"00:00\"\n ],\n \"enable_etime\": \"23:59\",\n \"enable_etimes\": [\n \"23:59\"\n ],\n \"enable_days_of_week\": [\n \"0\",\n \"1\",\n \"2\",\n \"3\",\n \"4\",\n \"5\",\n \"6\"\n ],\n \"enable_days_of_weeks\": [\n [\n \"0\",\n \"1\",\n \"2\",\n \"3\",\n \"4\",\n \"5\",\n \"6\"\n ]\n ],\n \"enable_in_bg\": 0,\n \"notify_recovered\": 1,\n \"notify_channels\": [\n \"nvwa\"\n ],\n \"notify_groups_obj\": null,\n \"notify_groups\": null,\n \"notify_repeat_step\": 60,\n \"notify_max_number\": 0,\n \"recover_duration\": 0,\n \"callbacks\": [],\n \"runbook_url\": \"\",\n \"append_tags\": [],\n \"annotations\": {\n \"描述\": \"通常 tikv 实例刚启动时会触发。或者有较复杂的计算 offload 到 tikv 上导致短暂的内存升高,需要分析具体 SQL 语句。\"\n },\n \"extra_config\": null,\n \"create_at\": 0,\n \"create_by\": \"\",\n \"update_at\": 0,\n \"update_by\": \"\",\n \"uuid\": 1717556328420743000\n },\n {\n \"id\": 0,\n \"group_id\": 0,\n \"cate\": \"prometheus\",\n \"datasource_ids\": [\n 7\n ],\n \"cluster\": \"\",\n \"name\": \"TiDB-tikv 发生重启\",\n \"note\": \"TiDB(中控)\",\n \"prod\": \"metric\",\n \"algorithm\": \"\",\n \"algo_params\": null,\n \"delay\": 0,\n \"severity\": 0,\n \"severities\": [\n 1\n ],\n \"disabled\": 1,\n \"prom_for_duration\": 60,\n \"prom_ql\": \"\",\n \"rule_config\": {\n \"queries\": [\n {\n \"prom_ql\": \"changes(process_start_time_seconds{job=\\\"tikv\\\"}[5m]) \\u003e 0\",\n \"severity\": 1\n }\n ]\n },\n \"prom_eval_interval\": 30,\n \"enable_stime\": \"00:00\",\n \"enable_stimes\": [\n \"00:00\"\n ],\n \"enable_etime\": \"23:59\",\n \"enable_etimes\": [\n \"23:59\"\n ],\n \"enable_days_of_week\": [\n \"0\",\n \"1\",\n \"2\",\n \"3\",\n \"4\",\n \"5\",\n \"6\"\n ],\n \"enable_days_of_weeks\": [\n [\n \"0\",\n \"1\",\n \"2\",\n \"3\",\n \"4\",\n \"5\",\n \"6\"\n ]\n ],\n \"enable_in_bg\": 0,\n \"notify_recovered\": 1,\n \"notify_channels\": [\n \"nvwa\"\n ],\n \"notify_groups_obj\": null,\n \"notify_groups\": null,\n \"notify_repeat_step\": 60,\n \"notify_max_number\": 0,\n \"recover_duration\": 0,\n \"callbacks\": [],\n \"runbook_url\": \"\",\n \"append_tags\": [],\n \"annotations\": {},\n \"extra_config\": null,\n \"create_at\": 0,\n \"create_by\": \"\",\n \"update_at\": 0,\n \"update_by\": \"\",\n \"uuid\": 1717556328421448000\n },\n {\n \"id\": 0,\n \"group_id\": 0,\n \"cate\": \"prometheus\",\n \"datasource_ids\": [\n 7\n ],\n \"cluster\": \"\",\n \"name\": \"TiDB-tikv 可用空间低于 20%\",\n \"note\": \"TiDB(中控)\",\n \"prod\": \"metric\",\n \"algorithm\": \"\",\n \"algo_params\": null,\n \"delay\": 0,\n \"severity\": 0,\n \"severities\": [\n 2\n ],\n \"disabled\": 1,\n \"prom_for_duration\": 60,\n \"prom_ql\": \"\",\n \"rule_config\": {\n \"queries\": [\n {\n \"prom_ql\": \"sum(tikv_store_size_bytes{type=\\\"available\\\"}) by (instance) / sum(tikv_store_size_bytes{type=\\\"capacity\\\"}) by (instance) \\u003c 0.2\",\n \"severity\": 2\n }\n ]\n },\n \"prom_eval_interval\": 30,\n \"enable_stime\": \"00:00\",\n \"enable_stimes\": [\n \"00:00\"\n ],\n \"enable_etime\": \"23:59\",\n \"enable_etimes\": [\n \"23:59\"\n ],\n \"enable_days_of_week\": [\n \"0\",\n \"1\",\n \"2\",\n \"3\",\n \"4\",\n \"5\",\n \"6\"\n ],\n \"enable_days_of_weeks\": [\n [\n \"0\",\n \"1\",\n \"2\",\n \"3\",\n \"4\",\n \"5\",\n \"6\"\n ]\n ],\n \"enable_in_bg\": 0,\n \"notify_recovered\": 1,\n \"notify_channels\": [\n \"nvwa\"\n ],\n \"notify_groups_obj\": null,\n \"notify_groups\": null,\n \"notify_repeat_step\": 60,\n \"notify_max_number\": 0,\n \"recover_duration\": 0,\n \"callbacks\": [],\n \"runbook_url\": \"\",\n \"append_tags\": [],\n \"annotations\": {\n \"描述\": \"需要检查 tikv 是否有删除数据但空间未释放的问题,如果是正常的空间使用,则需要扩容 tikv 节点。\"\n },\n \"extra_config\": null,\n \"create_at\": 0,\n \"create_by\": \"\",\n \"update_at\": 0,\n \"update_by\": \"\",\n \"uuid\": 1717556328422047000\n },\n {\n \"id\": 0,\n \"group_id\": 0,\n \"cate\": \"prometheus\",\n \"datasource_ids\": [\n 7\n ],\n \"cluster\": \"\",\n \"name\": \"TiDB-tikv_server_is_down\",\n \"note\": \"TiDB(中控)\",\n \"prod\": \"metric\",\n \"algorithm\": \"\",\n \"algo_params\": null,\n \"delay\": 0,\n \"severity\": 0,\n \"severities\": [\n 1\n ],\n \"disabled\": 1,\n \"prom_for_duration\": 60,\n \"prom_ql\": \"\",\n \"rule_config\": {\n \"queries\": [\n {\n \"prom_ql\": \"probe_success{group=\\\"tikv\\\"} == 0\",\n \"severity\": 1\n }\n ]\n },\n \"prom_eval_interval\": 30,\n \"enable_stime\": \"00:00\",\n \"enable_stimes\": [\n \"00:00\"\n ],\n \"enable_etime\": \"23:59\",\n \"enable_etimes\": [\n \"23:59\"\n ],\n \"enable_days_of_week\": [\n \"0\",\n \"1\",\n \"2\",\n \"3\",\n \"4\",\n \"5\",\n \"6\"\n ],\n \"enable_days_of_weeks\": [\n [\n \"0\",\n \"1\",\n \"2\",\n \"3\",\n \"4\",\n \"5\",\n \"6\"\n ]\n ],\n \"enable_in_bg\": 0,\n \"notify_recovered\": 1,\n \"notify_channels\": [\n \"nvwa\"\n ],\n \"notify_groups_obj\": null,\n \"notify_groups\": null,\n \"notify_repeat_step\": 60,\n \"notify_max_number\": 0,\n \"recover_duration\": 0,\n \"callbacks\": [],\n \"runbook_url\": \"\",\n \"append_tags\": [],\n \"annotations\": {},\n \"extra_config\": null,\n \"create_at\": 0,\n \"create_by\": \"\",\n \"update_at\": 0,\n \"update_by\": \"\",\n \"uuid\": 1717556328422549000\n },\n {\n \"id\": 0,\n \"group_id\": 0,\n \"cate\": \"prometheus\",\n \"datasource_ids\": [\n 7\n ],\n \"cluster\": \"\",\n \"name\": \"TiDB-内存使用大于 80%\",\n \"note\": \"TiDB(中控)\",\n \"prod\": \"metric\",\n \"algorithm\": \"\",\n \"algo_params\": null,\n \"delay\": 0,\n \"severity\": 0,\n \"severities\": [\n 2\n ],\n \"disabled\": 1,\n \"prom_for_duration\": 60,\n \"prom_ql\": \"\",\n \"rule_config\": {\n \"queries\": [\n {\n \"prom_ql\": \"(((node_memory_MemTotal_bytes-node_memory_MemFree_bytes-node_memory_Cached_bytes)/(node_memory_MemTotal_bytes)*100)) \\u003e= 80\",\n \"severity\": 2\n }\n ]\n },\n \"prom_eval_interval\": 30,\n \"enable_stime\": \"00:00\",\n \"enable_stimes\": [\n \"00:00\"\n ],\n \"enable_etime\": \"23:59\",\n \"enable_etimes\": [\n \"23:59\"\n ],\n \"enable_days_of_week\": [\n \"0\",\n \"1\",\n \"2\",\n \"3\",\n \"4\",\n \"5\",\n \"6\"\n ],\n \"enable_days_of_weeks\": [\n [\n \"0\",\n \"1\",\n \"2\",\n \"3\",\n \"4\",\n \"5\",\n \"6\"\n ]\n ],\n \"enable_in_bg\": 0,\n \"notify_recovered\": 1,\n \"notify_channels\": [\n \"nvwa\"\n ],\n \"notify_groups_obj\": null,\n \"notify_groups\": null,\n \"notify_repeat_step\": 60,\n \"notify_max_number\": 0,\n \"recover_duration\": 0,\n \"callbacks\": [],\n \"runbook_url\": \"\",\n \"append_tags\": [],\n \"annotations\": {},\n \"extra_config\": null,\n \"create_at\": 0,\n \"create_by\": \"\",\n \"update_at\": 0,\n \"update_by\": \"\",\n \"uuid\": 1717556328423070000\n },\n {\n \"id\": 0,\n \"group_id\": 0,\n \"cate\": \"prometheus\",\n \"datasource_ids\": [\n 7\n ],\n \"cluster\": \"\",\n \"name\": \"TiDB-挂载点状态变为只读\",\n \"note\": \"TiDB(中控)\",\n \"prod\": \"metric\",\n \"algorithm\": \"\",\n \"algo_params\": null,\n \"delay\": 0,\n \"severity\": 0,\n \"severities\": [\n 1\n ],\n \"disabled\": 1,\n \"prom_for_duration\": 60,\n \"prom_ql\": \"\",\n \"rule_config\": {\n \"queries\": [\n {\n \"prom_ql\": \"node_filesystem_readonly{fstype=~\\\"(ext.|xfs)\\\"} == 1\",\n \"severity\": 1\n }\n ]\n },\n \"prom_eval_interval\": 30,\n \"enable_stime\": \"00:00\",\n \"enable_stimes\": [\n \"00:00\"\n ],\n \"enable_etime\": \"23:59\",\n \"enable_etimes\": [\n \"23:59\"\n ],\n \"enable_days_of_week\": [\n \"0\",\n \"1\",\n \"2\",\n \"3\",\n \"4\",\n \"5\",\n \"6\"\n ],\n \"enable_days_of_weeks\": [\n [\n \"0\",\n \"1\",\n \"2\",\n \"3\",\n \"4\",\n \"5\",\n \"6\"\n ]\n ],\n \"enable_in_bg\": 0,\n \"notify_recovered\": 1,\n \"notify_channels\": [\n \"nvwa\"\n ],\n \"notify_groups_obj\": null,\n \"notify_groups\": null,\n \"notify_repeat_step\": 60,\n \"notify_max_number\": 0,\n \"recover_duration\": 0,\n \"callbacks\": [],\n \"runbook_url\": \"\",\n \"append_tags\": [],\n \"annotations\": {},\n \"extra_config\": null,\n \"create_at\": 0,\n \"create_by\": \"\",\n \"update_at\": 0,\n \"update_by\": \"\",\n \"uuid\": 1717556328423515000\n },\n {\n \"id\": 0,\n \"group_id\": 0,\n \"cate\": \"prometheus\",\n \"datasource_ids\": [\n 7\n ],\n \"cluster\": \"\",\n \"name\": \"TiDB-文件系统 inode 使用率大于 80%\",\n \"note\": \"TiDB(中控)\",\n \"prod\": \"metric\",\n \"algorithm\": \"\",\n \"algo_params\": null,\n \"delay\": 0,\n \"severity\": 0,\n \"severities\": [\n 1\n ],\n \"disabled\": 1,\n \"prom_for_duration\": 60,\n \"prom_ql\": \"\",\n \"rule_config\": {\n \"queries\": [\n {\n \"prom_ql\": \"node_filesystem_files_free{fstype=~\\\"(ext.|xfs)\\\"} / node_filesystem_files{fstype=~\\\"(ext.|xfs)\\\"} * 100 \\u003c 20\",\n \"severity\": 1\n }\n ]\n },\n \"prom_eval_interval\": 30,\n \"enable_stime\": \"00:00\",\n \"enable_stimes\": [\n \"00:00\"\n ],\n \"enable_etime\": \"23:59\",\n \"enable_etimes\": [\n \"23:59\"\n ],\n \"enable_days_of_week\": [\n \"0\",\n \"1\",\n \"2\",\n \"3\",\n \"4\",\n \"5\",\n \"6\"\n ],\n \"enable_days_of_weeks\": [\n [\n \"0\",\n \"1\",\n \"2\",\n \"3\",\n \"4\",\n \"5\",\n \"6\"\n ]\n ],\n \"enable_in_bg\": 0,\n \"notify_recovered\": 1,\n \"notify_channels\": [\n \"nvwa\"\n ],\n \"notify_groups_obj\": null,\n \"notify_groups\": null,\n \"notify_repeat_step\": 60,\n \"notify_max_number\": 0,\n \"recover_duration\": 0,\n \"callbacks\": [],\n \"runbook_url\": \"\",\n \"append_tags\": [],\n \"annotations\": {},\n \"extra_config\": null,\n \"create_at\": 0,\n \"create_by\": \"\",\n \"update_at\": 0,\n \"update_by\": \"\",\n \"uuid\": 1717556328423963000\n },\n {\n \"id\": 0,\n \"group_id\": 0,\n \"cate\": \"prometheus\",\n \"datasource_ids\": [\n 7\n ],\n \"cluster\": \"\",\n \"name\": \"TiDB-磁盘使用率大于 80%\",\n \"note\": \"TiDB(中控)\",\n \"prod\": \"metric\",\n \"algorithm\": \"\",\n \"algo_params\": null,\n \"delay\": 0,\n \"severity\": 0,\n \"severities\": [\n 1\n ],\n \"disabled\": 1,\n \"prom_for_duration\": 60,\n \"prom_ql\": \"\",\n \"rule_config\": {\n \"queries\": [\n {\n \"prom_ql\": \"node_filesystem_avail_bytes{fstype=~\\\"(ext.|xfs)\\\", mountpoint!~\\\"/boot\\\"} / node_filesystem_size_bytes{fstype=~\\\"(ext.|xfs)\\\", mountpoint!~\\\"/boot\\\"} * 100 \\u003c= 20\",\n \"severity\": 1\n }\n ]\n },\n \"prom_eval_interval\": 30,\n \"enable_stime\": \"00:00\",\n \"enable_stimes\": [\n \"00:00\"\n ],\n \"enable_etime\": \"23:59\",\n \"enable_etimes\": [\n \"23:59\"\n ],\n \"enable_days_of_week\": [\n \"0\",\n \"1\",\n \"2\",\n \"3\",\n \"4\",\n \"5\",\n \"6\"\n ],\n \"enable_days_of_weeks\": [\n [\n \"0\",\n \"1\",\n \"2\",\n \"3\",\n \"4\",\n \"5\",\n \"6\"\n ]\n ],\n \"enable_in_bg\": 0,\n \"notify_recovered\": 1,\n \"notify_channels\": [\n \"nvwa\"\n ],\n \"notify_groups_obj\": null,\n \"notify_groups\": null,\n \"notify_repeat_step\": 60,\n \"notify_max_number\": 0,\n \"recover_duration\": 0,\n \"callbacks\": [],\n \"runbook_url\": \"\",\n \"append_tags\": [],\n \"annotations\": {},\n \"extra_config\": null,\n \"create_at\": 0,\n \"create_by\": \"\",\n \"update_at\": 0,\n \"update_by\": \"\",\n \"uuid\": 1717556328424400000\n },\n {\n \"id\": 0,\n \"group_id\": 0,\n \"cate\": \"prometheus\",\n \"datasource_ids\": [\n 7\n ],\n \"cluster\": \"\",\n \"name\": \"TiDB-网卡-入向有丢包\",\n \"note\": \"TiDB(中控)\",\n \"prod\": \"metric\",\n \"algorithm\": \"\",\n \"algo_params\": null,\n \"delay\": 0,\n \"severity\": 0,\n \"severities\": [\n 2\n ],\n \"disabled\": 1,\n \"prom_for_duration\": 60,\n \"prom_ql\": \"\",\n \"rule_config\": {\n \"queries\": [\n {\n \"prom_ql\": \"increase(net_drop_in[1m]) \\u003e 0\",\n \"severity\": 2\n }\n ]\n },\n \"prom_eval_interval\": 30,\n \"enable_stime\": \"00:00\",\n \"enable_stimes\": [\n \"00:00\"\n ],\n \"enable_etime\": \"23:59\",\n \"enable_etimes\": [\n \"23:59\"\n ],\n \"enable_days_of_week\": [\n \"0\",\n \"1\",\n \"2\",\n \"3\",\n \"4\",\n \"5\",\n \"6\"\n ],\n \"enable_days_of_weeks\": [\n [\n \"0\",\n \"1\",\n \"2\",\n \"3\",\n \"4\",\n \"5\",\n \"6\"\n ]\n ],\n \"enable_in_bg\": 0,\n \"notify_recovered\": 1,\n \"notify_channels\": [\n \"nvwa\"\n ],\n \"notify_groups_obj\": null,\n \"notify_groups\": null,\n \"notify_repeat_step\": 60,\n \"notify_max_number\": 0,\n \"recover_duration\": 0,\n \"callbacks\": [],\n \"runbook_url\": \"\",\n \"append_tags\": [],\n \"annotations\": {},\n \"extra_config\": null,\n \"create_at\": 0,\n \"create_by\": \"\",\n \"update_at\": 0,\n \"update_by\": \"\",\n \"uuid\": 1717556328424820000\n },\n {\n \"id\": 0,\n \"group_id\": 0,\n \"cate\": \"prometheus\",\n \"datasource_ids\": [\n 7\n ],\n \"cluster\": \"\",\n \"name\": \"TiDB-网卡-出向有丢包\",\n \"note\": \"TiDB(中控)\",\n \"prod\": \"metric\",\n \"algorithm\": \"\",\n \"algo_params\": null,\n \"delay\": 0,\n \"severity\": 0,\n \"severities\": [\n 2\n ],\n \"disabled\": 1,\n \"prom_for_duration\": 60,\n \"prom_ql\": \"\",\n \"rule_config\": {\n \"queries\": [\n {\n \"prom_ql\": \"increase(net_drop_out[1m]) \\u003e 0\",\n \"severity\": 2\n }\n ]\n },\n \"prom_eval_interval\": 30,\n \"enable_stime\": \"00:00\",\n \"enable_stimes\": [\n \"00:00\"\n ],\n \"enable_etime\": \"23:59\",\n \"enable_etimes\": [\n \"23:59\"\n ],\n \"enable_days_of_week\": [\n \"0\",\n \"1\",\n \"2\",\n \"3\",\n \"4\",\n \"5\",\n \"6\"\n ],\n \"enable_days_of_weeks\": [\n [\n \"0\",\n \"1\",\n \"2\",\n \"3\",\n \"4\",\n \"5\",\n \"6\"\n ]\n ],\n \"enable_in_bg\": 0,\n \"notify_recovered\": 1,\n \"notify_channels\": [\n \"nvwa\"\n ],\n \"notify_groups_obj\": null,\n \"notify_groups\": null,\n \"notify_repeat_step\": 60,\n \"notify_max_number\": 0,\n \"recover_duration\": 0,\n \"callbacks\": [],\n \"runbook_url\": \"\",\n \"append_tags\": [],\n \"annotations\": {},\n \"extra_config\": null,\n \"create_at\": 0,\n \"create_by\": \"\",\n \"update_at\": 0,\n \"update_by\": \"\",\n \"uuid\": 1717556328425282000\n },\n {\n \"id\": 0,\n \"group_id\": 0,\n \"cate\": \"prometheus\",\n \"datasource_ids\": [\n 7\n ],\n \"cluster\": \"\",\n \"name\": \"TiDB-集群中出现状态为 down 的 tikv 数量大于 0\",\n \"note\": \"TiDB(中控)\",\n \"prod\": \"metric\",\n \"algorithm\": \"\",\n \"algo_params\": null,\n \"delay\": 0,\n \"severity\": 0,\n \"severities\": [\n 1\n ],\n \"disabled\": 1,\n \"prom_for_duration\": 60,\n \"prom_ql\": \"\",\n \"rule_config\": {\n \"queries\": [\n {\n \"prom_ql\": \"(sum(pd_cluster_status{type=\\\"store_down_count\\\"}) by (instance) \\u003e 0) and (sum(etcd_server_is_leader) by (instance) \\u003e 0)\",\n \"severity\": 1\n }\n ]\n },\n \"prom_eval_interval\": 30,\n \"enable_stime\": \"00:00\",\n \"enable_stimes\": [\n \"00:00\"\n ],\n \"enable_etime\": \"23:59\",\n \"enable_etimes\": [\n \"23:59\"\n ],\n \"enable_days_of_week\": [\n \"0\",\n \"1\",\n \"2\",\n \"3\",\n \"4\",\n \"5\",\n \"6\"\n ],\n \"enable_days_of_weeks\": [\n [\n \"0\",\n \"1\",\n \"2\",\n \"3\",\n \"4\",\n \"5\",\n \"6\"\n ]\n ],\n \"enable_in_bg\": 0,\n \"notify_recovered\": 1,\n \"notify_channels\": [\n \"nvwa\"\n ],\n \"notify_groups_obj\": null,\n \"notify_groups\": null,\n \"notify_repeat_step\": 60,\n \"notify_max_number\": 0,\n \"recover_duration\": 0,\n \"callbacks\": [],\n \"runbook_url\": \"\",\n \"append_tags\": [],\n \"annotations\": {},\n \"extra_config\": null,\n \"create_at\": 0,\n \"create_by\": \"\",\n \"update_at\": 0,\n \"update_by\": \"\",\n \"uuid\": 1717556328425803000\n }\n]"
},
{
"path": "integrations/TiDB/dashboards/tidb-dashboard.json",
"content": "{\n \"id\": 0,\n \"group_id\": 0,\n \"name\": \"tidb-Overview\",\n \"ident\": \"\",\n \"tags\": \"\",\n \"create_at\": 0,\n \"create_by\": \"\",\n \"update_at\": 0,\n \"update_by\": \"\",\n \"configs\": {\n \"links\": [\n {\n \"targetBlank\": true,\n \"title\": \"慢sql监控\",\n \"url\": \"\"\n },\n {\n \"targetBlank\": true,\n \"title\": \"详细指标-DBA\",\n \"url\": \"\"\n }\n ],\n \"panels\": [\n {\n \"collapsed\": true,\n \"datasourceCate\": \"prometheus\",\n \"datasourceValue\": \"${tidb_datasource}\",\n \"id\": \"535636fd-2f92-484c-9e23-42118801f7c9\",\n \"layout\": {\n \"h\": 1,\n \"i\": \"535636fd-2f92-484c-9e23-42118801f7c9\",\n \"isResizable\": false,\n \"w\": 24,\n \"x\": 0,\n \"y\": 0\n },\n \"name\": \"Services Status\",\n \"panels\": [],\n \"type\": \"row\",\n \"version\": \"3.0.0\"\n },\n {\n \"custom\": {\n \"calc\": \"lastNotNull\",\n \"colorDomain\": [\n 1,\n 99999999999\n ],\n \"colorDomainAuto\": false,\n \"colorRange\": [\n \"#83c898\",\n \"#c2c2c2\",\n \"#fc653f\"\n ],\n \"reverseColorOrder\": false,\n \"textMode\": \"valueAndName\"\n },\n \"datasourceCate\": \"prometheus\",\n \"datasourceValue\": \"${tidb_datasource}\",\n \"id\": \"d18288fc-3f6d-4520-b112-ede7948b3c0f\",\n \"layout\": {\n \"h\": 6,\n \"i\": \"d18288fc-3f6d-4520-b112-ede7948b3c0f\",\n \"isResizable\": true,\n \"w\": 12,\n \"x\": 0,\n \"y\": 1\n },\n \"links\": [],\n \"name\": \"Service Up\",\n \"options\": {\n \"standardOptions\": {}\n },\n \"targets\": [\n {\n \"expr\": \"\\ncount(probe_success{k8s_cluster=\\\"$k8s_cluster\\\", tidb_cluster=\\\"$tidb_cluster\\\", group=\\\"tidb\\\"} == 1)\",\n \"legend\": \"TiDB\",\n \"refId\": \"A\"\n },\n {\n \"expr\": \"\\ncount(probe_success{k8s_cluster=\\\"$k8s_cluster\\\", tidb_cluster=\\\"$tidb_cluster\\\", group=\\\"pd\\\"} == 1)\",\n \"legend\": \"PD\",\n \"refId\": \"B\"\n },\n {\n \"expr\": \"\\ncount(probe_success{k8s_cluster=\\\"$k8s_cluster\\\", tidb_cluster=\\\"$tidb_cluster\\\", group=\\\"tikv\\\"} == 1)\",\n \"legend\": \"TiKV\",\n \"refId\": \"C\"\n },\n {\n \"expr\": \"\\ncount(probe_success{k8s_cluster=\\\"$k8s_cluster\\\", tidb_cluster=\\\"$tidb_cluster\\\", group=\\\"tiflash\\\"} == 1)\",\n \"legend\": \"TiFlash\",\n \"refId\": \"D\"\n },\n {\n \"expr\": \"\\ncount(probe_success{k8s_cluster=\\\"$k8s_cluster\\\", tidb_cluster=\\\"$tidb_cluster\\\", group=\\\"pump\\\"} == 1)\",\n \"legend\": \"Pump\",\n \"refId\": \"E\"\n },\n {\n \"expr\": \"\\ncount(probe_success{k8s_cluster=\\\"$k8s_cluster\\\", tidb_cluster=\\\"$tidb_cluster\\\", group=\\\"drainer\\\"} == 1)\",\n \"legend\": \"Drainer\",\n \"refId\": \"F\"\n },\n {\n \"expr\": \"\\ncount(probe_success{k8s_cluster=\\\"$k8s_cluster\\\", tidb_cluster=\\\"$tidb_cluster\\\", group=\\\"kafka\\\"} == 1)\",\n \"legend\": \"Kafka\",\n \"refId\": \"G\"\n },\n {\n \"expr\": \"\\ncount(probe_success{k8s_cluster=\\\"$k8s_cluster\\\", tidb_cluster=\\\"$tidb_cluster\\\", group=\\\"zookeeper\\\"} == 1)\",\n \"legend\": \"Zookeeper\",\n \"refId\": \"H\"\n },\n {\n \"expr\": \"\\ncount(probe_success{k8s_cluster=\\\"$k8s_cluster\\\", tidb_cluster=\\\"$tidb_cluster\\\", group=\\\"node_exporter\\\"} == 1)\",\n \"legend\": \"Node_exporter\",\n \"refId\": \"I\"\n },\n {\n \"expr\": \"\\ncount(probe_success{k8s_cluster=\\\"$k8s_cluster\\\", tidb_cluster=\\\"$tidb_cluster\\\", group=\\\"blackbox_exporter\\\"} == 1)\",\n \"legend\": \"Blackbox_exporter\",\n \"refId\": \"J\"\n },\n {\n \"expr\": \"\\ncount(probe_success{k8s_cluster=\\\"$k8s_cluster\\\", tidb_cluster=\\\"$tidb_cluster\\\", group=\\\"grafana\\\"} == 1)\",\n \"legend\": \"Grafana\",\n \"refId\": \"K\"\n },\n {\n \"expr\": \"\\ncount(probe_success{k8s_cluster=\\\"$k8s_cluster\\\", tidb_cluster=\\\"$tidb_cluster\\\", job=\\\"blackbox_exporter_http\\\"} == 1)\",\n \"legend\": \"Pushgateway\",\n \"refId\": \"L\"\n },\n {\n \"expr\": \"\\ncount(probe_success{k8s_cluster=\\\"$k8s_cluster\\\", tidb_cluster=\\\"$tidb_cluster\\\", group=\\\"kafka_exporter\\\"} == 1)\",\n \"legend\": \"Kafka_exporter\",\n \"refId\": \"M\"\n }\n ],\n \"transformations\": [\n {\n \"id\": \"organize\",\n \"options\": {}\n }\n ],\n \"type\": \"hexbin\",\n \"version\": \"3.0.0\"\n },\n {\n \"custom\": {\n \"calc\": \"lastNotNull\",\n \"colorDomain\": [\n 1,\n 20\n ],\n \"colorDomainAuto\": false,\n \"colorRange\": [\n \"#ffeda0\",\n \"#fc4e2a\",\n \"#800026\"\n ],\n \"reverseColorOrder\": false,\n \"textMode\": \"valueAndName\"\n },\n \"datasourceCate\": \"prometheus\",\n \"datasourceValue\": \"${tidb_datasource}\",\n \"id\": \"955bd169-0b3c-4476-939e-89302e74097a\",\n \"layout\": {\n \"h\": 6,\n \"i\": \"955bd169-0b3c-4476-939e-89302e74097a\",\n \"isResizable\": true,\n \"w\": 12,\n \"x\": 12,\n \"y\": 1\n },\n \"links\": [],\n \"name\": \"Service Down\",\n \"options\": {\n \"standardOptions\": {}\n },\n \"targets\": [\n {\n \"expr\": \"\\ncount(probe_success{k8s_cluster=\\\"$k8s_cluster\\\", tidb_cluster=\\\"$tidb_cluster\\\", group=\\\"tidb\\\"} == 0)\",\n \"legend\": \"TiDB\",\n \"refId\": \"A\"\n },\n {\n \"expr\": \"\\ncount(probe_success{k8s_cluster=\\\"$k8s_cluster\\\", tidb_cluster=\\\"$tidb_cluster\\\", group=\\\"pd\\\"} == 0)\",\n \"legend\": \"PD\",\n \"refId\": \"B\"\n },\n {\n \"expr\": \"\\ncount(probe_success{k8s_cluster=\\\"$k8s_cluster\\\", tidb_cluster=\\\"$tidb_cluster\\\", group=\\\"tikv\\\"} == 0)\",\n \"legend\": \"TiKV\",\n \"refId\": \"C\"\n },\n {\n \"expr\": \"\\ncount(probe_success{k8s_cluster=\\\"$k8s_cluster\\\", tidb_cluster=\\\"$tidb_cluster\\\", group=\\\"tiflash\\\"} == 0)\",\n \"legend\": \"TiFlash\",\n \"refId\": \"D\"\n },\n {\n \"expr\": \"\\ncount(probe_success{k8s_cluster=\\\"$k8s_cluster\\\", tidb_cluster=\\\"$tidb_cluster\\\", group=\\\"pump\\\"} == 0)\",\n \"legend\": \"Pump\",\n \"refId\": \"E\"\n },\n {\n \"expr\": \"\\ncount(probe_success{k8s_cluster=\\\"$k8s_cluster\\\", tidb_cluster=\\\"$tidb_cluster\\\", group=\\\"drainer\\\"} == 0)\",\n \"legend\": \"Drainer\",\n \"refId\": \"F\"\n },\n {\n \"expr\": \"\\ncount(probe_success{k8s_cluster=\\\"$k8s_cluster\\\", tidb_cluster=\\\"$tidb_cluster\\\", group=\\\"kafka\\\"} == 0)\",\n \"legend\": \"Kafka\",\n \"refId\": \"G\"\n },\n {\n \"expr\": \"\\ncount(probe_success{k8s_cluster=\\\"$k8s_cluster\\\", tidb_cluster=\\\"$tidb_cluster\\\", group=\\\"zookeeper\\\"} == 0)\",\n \"legend\": \"Zookeeper\",\n \"refId\": \"H\"\n },\n {\n \"expr\": \"\\ncount(probe_success{k8s_cluster=\\\"$k8s_cluster\\\", tidb_cluster=\\\"$tidb_cluster\\\", group=\\\"node_exporter\\\"} == 0)\",\n \"legend\": \"Node_exporter\",\n \"refId\": \"I\"\n },\n {\n \"expr\": \"\\ncount(probe_success{k8s_cluster=\\\"$k8s_cluster\\\", tidb_cluster=\\\"$tidb_cluster\\\", group=\\\"blackbox_exporter\\\"} == 0)\",\n \"legend\": \"Blackbox_exporter\",\n \"refId\": \"J\"\n },\n {\n \"expr\": \"\\ncount(probe_success{k8s_cluster=\\\"$k8s_cluster\\\", tidb_cluster=\\\"$tidb_cluster\\\", group=\\\"grafana\\\"} == 0)\",\n \"legend\": \"Grafana\",\n \"refId\": \"K\"\n },\n {\n \"expr\": \"\\ncount(probe_success{k8s_cluster=\\\"$k8s_cluster\\\", tidb_cluster=\\\"$tidb_cluster\\\", job=\\\"blackbox_exporter_http\\\"} == 0)\",\n \"legend\": \"Pushgateway\",\n \"refId\": \"L\"\n },\n {\n \"expr\": \"\\ncount(probe_success{k8s_cluster=\\\"$k8s_cluster\\\", tidb_cluster=\\\"$tidb_cluster\\\", group=\\\"kafka_exporter\\\"} == 0)\",\n \"legend\": \"Kafka_exporter\",\n \"refId\": \"M\"\n }\n ],\n \"transformations\": [\n {\n \"id\": \"organize\",\n \"options\": {}\n }\n ],\n \"type\": \"hexbin\",\n \"version\": \"3.0.0\"\n },\n {\n \"custom\": {\n \"drawStyle\": \"lines\",\n \"fillOpacity\": 0,\n \"gradientMode\": \"none\",\n \"lineInterpolation\": \"linear\",\n \"lineWidth\": 2,\n \"scaleDistribution\": {\n \"type\": \"linear\"\n },\n \"spanNulls\": false,\n \"stack\": \"off\"\n },\n \"datasourceCate\": \"prometheus\",\n \"datasourceValue\": \"${tidb_datasource}\",\n \"description\": \"uptime since last restart\",\n \"id\": \"057219ac-0441-4e0e-b65a-a358f72fcf51\",\n \"layout\": {\n \"h\": 6,\n \"i\": \"057219ac-0441-4e0e-b65a-a358f72fcf51\",\n \"isResizable\": true,\n \"w\": 12,\n \"x\": 0,\n \"y\": 7\n },\n \"links\": [],\n \"name\": \"Uptime\",\n \"options\": {\n \"legend\": {\n \"displayMode\": \"hidden\"\n },\n \"standardOptions\": {\n \"util\": \"humantimeSeconds\"\n },\n \"thresholds\": {\n \"steps\": [\n {\n \"color\": \"#634CD9\",\n \"type\": \"base\",\n \"value\": null\n }\n ]\n },\n \"tooltip\": {\n \"mode\": \"all\",\n \"sort\": \"none\"\n }\n },\n \"targets\": [\n {\n \"expr\": \"(time() - process_start_time_seconds{k8s_cluster=\\\"$k8s_cluster\\\", tidb_cluster=\\\"$tidb_cluster\\\",job=~\\\".*pd.*\\\"})\",\n \"legend\": \"{{job}}-{{instance}}\",\n \"refId\": \"A\"\n },\n {\n \"expr\": \"(time() - process_start_time_seconds{k8s_cluster=\\\"$k8s_cluster\\\", tidb_cluster=\\\"$tidb_cluster\\\", job=\\\"tidb\\\"})\",\n \"legend\": \"{{job}}-{{instance}}\",\n \"refId\": \"B\"\n },\n {\n \"expr\": \"(time() - process_start_time_seconds{k8s_cluster=\\\"$k8s_cluster\\\", tidb_cluster=\\\"$tidb_cluster\\\", job=~\\\".*tikv\\\"})\",\n \"legend\": \"{{job}}-{{instance}}\",\n \"refId\": \"C\"\n },\n {\n \"expr\": \"tiflash_system_asynchronous_metric_Uptime{k8s_cluster=\\\"$k8s_cluster\\\", tidb_cluster=\\\"$tidb_cluster\\\"}\",\n \"legend\": \"tiflash-{{instance}}\",\n \"refId\": \"D\"\n },\n {\n \"expr\": \"(time() - process_start_time_seconds{k8s_cluster=\\\"$k8s_cluster\\\", tidb_cluster=\\\"$tidb_cluster\\\", job=\\\"ticdc\\\"})\",\n \"legend\": \"{{job}}-{{instance}}\",\n \"refId\": \"E\"\n }\n ],\n \"transformations\": [\n {\n \"id\": \"organize\",\n \"options\": {}\n }\n ],\n \"type\": \"timeseries\",\n \"version\": \"3.0.0\"\n },\n {\n \"custom\": {\n \"calc\": \"lastNotNull\",\n \"colorDomain\": [\n -1,\n 1\n ],\n \"colorDomainAuto\": false,\n \"colorRange\": [\n \"#83c898\",\n \"#c2c2c2\",\n \"#fc653f\"\n ],\n \"reverseColorOrder\": false,\n \"textMode\": \"valueAndName\"\n },\n \"datasourceCate\": \"prometheus\",\n \"datasourceValue\": \"${tidb_datasource}\",\n \"id\": \"e4af8eb3-f52d-434e-a6cc-83359b36d5a2\",\n \"layout\": {\n \"h\": 6,\n \"i\": \"e4af8eb3-f52d-434e-a6cc-83359b36d5a2\",\n \"isResizable\": true,\n \"w\": 12,\n \"x\": 12,\n \"y\": 7\n },\n \"links\": [],\n \"name\": \"Abnormal stores\",\n \"options\": {\n \"standardOptions\": {}\n },\n \"targets\": [\n {\n \"expr\": \"sum(pd_cluster_status{k8s_cluster=\\\"$k8s_cluster\\\", tidb_cluster=\\\"$tidb_cluster\\\", instance=\\\"$pd_instance\\\", type=\\\"store_disconnected_count\\\"})\",\n \"legend\": \"Disconnect Stores\",\n \"refId\": \"B\"\n },\n {\n \"expr\": \"sum(pd_cluster_status{k8s_cluster=\\\"$k8s_cluster\\\", tidb_cluster=\\\"$tidb_cluster\\\", instance=\\\"$pd_instance\\\", type=\\\"store_unhealth_count\\\"})\",\n \"legend\": \"Unhealth Stores\",\n \"refId\": \"C\"\n },\n {\n \"expr\": \"sum(pd_cluster_status{k8s_cluster=\\\"$k8s_cluster\\\", tidb_cluster=\\\"$tidb_cluster\\\", instance=\\\"$pd_instance\\\", type=\\\"store_low_space_count\\\"})\",\n \"legend\": \"LowSpace Stores\",\n \"refId\": \"D\"\n },\n {\n \"expr\": \"sum(pd_cluster_status{k8s_cluster=\\\"$k8s_cluster\\\", tidb_cluster=\\\"$tidb_cluster\\\", instance=\\\"$pd_instance\\\", type=\\\"store_down_count\\\"})\",\n \"legend\": \"Down Stores\",\n \"refId\": \"E\"\n },\n {\n \"expr\": \"sum(pd_cluster_status{k8s_cluster=\\\"$k8s_cluster\\\", tidb_cluster=\\\"$tidb_cluster\\\", instance=\\\"$pd_instance\\\", type=\\\"store_offline_count\\\"})\",\n \"legend\": \"Offline Stores\",\n \"refId\": \"F\"\n },\n {\n \"expr\": \"sum(pd_cluster_status{k8s_cluster=\\\"$k8s_cluster\\\", tidb_cluster=\\\"$tidb_cluster\\\", instance=\\\"$pd_instance\\\", type=\\\"store_tombstone_count\\\"})\",\n \"legend\": \"Tombstone Stores\",\n \"refId\": \"G\"\n }\n ],\n \"transformations\": [\n {\n \"id\": \"organize\",\n \"options\": {}\n }\n ],\n \"type\": \"hexbin\",\n \"version\": \"3.0.0\"\n },\n {\n \"collapsed\": true,\n \"datasourceCate\": \"prometheus\",\n \"datasourceValue\": \"${tidb_datasource}\",\n \"id\": \"3ed49e8a-c1f5-4e5a-ac01-c8ae1c734cc7\",\n \"layout\": {\n \"h\": 1,\n \"i\": \"3ed49e8a-c1f5-4e5a-ac01-c8ae1c734cc7\",\n \"isResizable\": false,\n \"w\": 24,\n \"x\": 0,\n \"y\": 73\n },\n \"name\": \"PD\",\n \"panels\": [],\n \"type\": \"row\",\n \"version\": \"3.0.0\"\n },\n {\n \"custom\": {\n \"calc\": \"lastNotNull\",\n \"colSpan\": 1,\n \"colorMode\": \"value\",\n \"textMode\": \"value\",\n \"textSize\": {},\n \"valueField\": \"Value\"\n },\n \"datasourceCate\": \"prometheus\",\n \"datasourceValue\": \"${tidb_datasource}\",\n \"id\": \"0e14ace8-401d-4215-bf15-09a7abf00414\",\n \"layout\": {\n \"h\": 7,\n \"i\": \"0e14ace8-401d-4215-bf15-09a7abf00414\",\n \"isResizable\": true,\n \"w\": 5,\n \"x\": 0,\n \"y\": 74\n },\n \"links\": [],\n \"name\": \"PD role\",\n \"options\": {\n \"standardOptions\": {},\n \"thresholds\": {\n \"steps\": [\n {\n \"color\": \"#634CD9\",\n \"type\": \"base\",\n \"value\": null\n }\n ]\n },\n \"valueMappings\": [\n {\n \"match\": {\n \"special\": 1\n },\n \"result\": {\n \"color\": \"#3fc453\",\n \"text\": \"Leader\"\n },\n \"type\": \"special\"\n },\n {\n \"match\": {\n \"special\": 0\n },\n \"result\": {\n \"color\": \"#ce4f52\",\n \"text\": \"Follower\"\n },\n \"type\": \"special\"\n }\n ]\n },\n \"targets\": [\n {\n \"expr\": \"pd_tso_role{k8s_cluster=\\\"$k8s_cluster\\\", tidb_cluster=\\\"$tidb_cluster\\\", instance=\\\"$pd_instance\\\", dc=\\\"global\\\"}\",\n \"refId\": \"A\"\n }\n ],\n \"transformations\": [\n {\n \"id\": \"organize\",\n \"options\": {}\n }\n ],\n \"type\": \"stat\",\n \"version\": \"3.0.0\"\n },\n {\n \"custom\": {\n \"calc\": \"lastNotNull\",\n \"colSpan\": 1,\n \"colorMode\": \"value\",\n \"textMode\": \"value\",\n \"textSize\": {},\n \"valueField\": \"Value\"\n },\n \"datasourceCate\": \"prometheus\",\n \"datasourceValue\": \"${tidb_datasource}\",\n \"id\": \"ef1dc81d-83c2-49f9-b44c-d97fdb320753\",\n \"layout\": {\n \"h\": 7,\n \"i\": \"ef1dc81d-83c2-49f9-b44c-d97fdb320753\",\n \"isResizable\": true,\n \"w\": 5,\n \"x\": 5,\n \"y\": 74\n },\n \"links\": [],\n \"name\": \"Storage capacity\",\n \"options\": {\n \"standardOptions\": {\n \"util\": \"bytesSI\"\n },\n \"thresholds\": {\n \"steps\": [\n {\n \"color\": \"#634CD9\",\n \"type\": \"base\",\n \"value\": null\n }\n ]\n },\n \"valueMappings\": [\n {\n \"match\": {\n \"from\": 0,\n \"to\": 1000000000000000000\n },\n \"result\": {\n \"color\": \"#3fc453\"\n },\n \"type\": \"range\"\n }\n ]\n },\n \"targets\": [\n {\n \"expr\": \"pd_cluster_status{k8s_cluster=\\\"$k8s_cluster\\\", tidb_cluster=\\\"$tidb_cluster\\\", instance=\\\"$pd_instance\\\",type=\\\"storage_capacity\\\"}\",\n \"legend\": \"\",\n \"refId\": \"A\"\n }\n ],\n \"transformations\": [\n {\n \"id\": \"organize\",\n \"options\": {}\n }\n ],\n \"type\": \"stat\",\n \"version\": \"3.0.0\"\n },\n {\n \"custom\": {\n \"calc\": \"lastNotNull\",\n \"colSpan\": 1,\n \"colorMode\": \"value\",\n \"textMode\": \"value\",\n \"textSize\": {},\n \"valueField\": \"Value\"\n },\n \"datasourceCate\": \"prometheus\",\n \"datasourceValue\": \"${tidb_datasource}\",\n \"id\": \"d8955955-37ac-485e-935c-cac66800f436\",\n \"layout\": {\n \"h\": 7,\n \"i\": \"d8955955-37ac-485e-935c-cac66800f436\",\n \"isResizable\": true,\n \"w\": 5,\n \"x\": 10,\n \"y\": 74\n },\n \"links\": [],\n \"name\": \"Current storage size\",\n \"options\": {\n \"standardOptions\": {\n \"util\": \"bytesSI\"\n },\n \"thresholds\": {\n \"steps\": [\n {\n \"color\": \"#634CD9\",\n \"type\": \"base\",\n \"value\": null\n }\n ]\n },\n \"valueMappings\": [\n {\n \"match\": {\n \"from\": 0,\n \"to\": 1000000000000000000\n },\n \"result\": {\n \"color\": \"#3fc453\"\n },\n \"type\": \"range\"\n }\n ]\n },\n \"targets\": [\n {\n \"expr\": \"pd_cluster_status{k8s_cluster=\\\"$k8s_cluster\\\", tidb_cluster=\\\"$tidb_cluster\\\", instance=\\\"$pd_instance\\\",type=\\\"storage_size\\\"}\",\n \"legend\": \"\",\n \"refId\": \"A\"\n }\n ],\n \"transformations\": [\n {\n \"id\": \"organize\",\n \"options\": {}\n }\n ],\n \"type\": \"stat\",\n \"version\": \"3.0.0\"\n },\n {\n \"custom\": {\n \"calc\": \"lastNotNull\",\n \"colSpan\": 1,\n \"colorMode\": \"value\",\n \"textMode\": \"valueAndName\",\n \"textSize\": {},\n \"valueField\": \"Value\"\n },\n \"datasourceCate\": \"prometheus\",\n \"datasourceValue\": \"${tidb_datasource}\",\n \"description\": \"The current storage size and used ratio of the cluster\",\n \"id\": \"a76f3318-30f7-4c17-949c-91ef452b9d82\",\n \"layout\": {\n \"h\": 7,\n \"i\": \"a76f3318-30f7-4c17-949c-91ef452b9d82\",\n \"isResizable\": true,\n \"w\": 5,\n \"x\": 15,\n \"y\": 74\n },\n \"links\": [],\n \"name\": \"Current storage used\",\n \"options\": {\n \"standardOptions\": {\n \"util\": \"percentUnit\"\n },\n \"thresholds\": {\n \"steps\": [\n {\n \"color\": \"#634CD9\",\n \"type\": \"base\",\n \"value\": null\n }\n ]\n },\n \"valueMappings\": [\n {\n \"match\": {\n \"from\": 0,\n \"to\": 0.7\n },\n \"result\": {\n \"color\": \"#3fc453\"\n },\n \"type\": \"range\"\n },\n {\n \"match\": {\n \"from\": 0.7,\n \"to\": 1\n },\n \"result\": {\n \"color\": \"#ce4f52\"\n },\n \"type\": \"range\"\n }\n ]\n },\n \"targets\": [\n {\n \"expr\": \"sum(pd_cluster_status{k8s_cluster=\\\"$k8s_cluster\\\", tidb_cluster=\\\"$tidb_cluster\\\", instance=\\\"$pd_instance\\\",type=\\\"storage_size\\\"}) / sum(pd_cluster_status{k8s_cluster=\\\"$k8s_cluster\\\", tidb_cluster=\\\"$tidb_cluster\\\", instance=\\\"$pd_instance\\\",type=\\\"storage_capacity\\\"})\",\n \"legend\": \"\",\n \"refId\": \"A\"\n }\n ],\n \"transformations\": [\n {\n \"id\": \"organize\",\n \"options\": {}\n }\n ],\n \"type\": \"stat\",\n \"version\": \"3.0.0\"\n },\n {\n \"custom\": {\n \"calc\": \"lastNotNull\",\n \"colSpan\": 1,\n \"colorMode\": \"value\",\n \"textMode\": \"value\",\n \"textSize\": {},\n \"valueField\": \"Value\"\n },\n \"datasourceCate\": \"prometheus\",\n \"datasourceValue\": \"${tidb_datasource}\",\n \"id\": \"f893916f-dc2f-4e91-a20d-43fc4bf92304\",\n \"layout\": {\n \"h\": 7,\n \"i\": \"f893916f-dc2f-4e91-a20d-43fc4bf92304\",\n \"isResizable\": true,\n \"w\": 4,\n \"x\": 20,\n \"y\": 74\n },\n \"links\": [],\n \"name\": \"Normal stores\",\n \"options\": {\n \"standardOptions\": {\n \"util\": \"none\"\n },\n \"thresholds\": {\n \"steps\": [\n {\n \"color\": \"#634CD9\",\n \"type\": \"base\",\n \"value\": null\n }\n ]\n },\n \"valueMappings\": [\n {\n \"match\": {\n \"special\": 0\n },\n \"result\": {\n \"color\": \"#ce4f52\"\n },\n \"type\": \"special\"\n },\n {\n \"match\": {\n \"from\": 1,\n \"to\": 9999\n },\n \"result\": {\n \"color\": \"#3fc453\",\n \"text\": \"\"\n },\n \"type\": \"range\"\n }\n ]\n },\n \"targets\": [\n {\n \"expr\": \"sum(pd_cluster_status{k8s_cluster=\\\"$k8s_cluster\\\", tidb_cluster=\\\"$tidb_cluster\\\", instance=\\\"$pd_instance\\\", type=\\\"store_up_count\\\"})\",\n \"legend\": \"\",\n \"refId\": \"A\"\n }\n ],\n \"transformations\": [\n {\n \"id\": \"organize\",\n \"options\": {}\n }\n ],\n \"type\": \"stat\",\n \"version\": \"3.0.0\"\n },\n {\n \"custom\": {\n \"drawStyle\": \"lines\",\n \"fillOpacity\": 0.3,\n \"gradientMode\": \"opacity\",\n \"lineInterpolation\": \"linear\",\n \"lineWidth\": 2,\n \"scaleDistribution\": {\n \"type\": \"linear\"\n },\n \"spanNulls\": false,\n \"stack\": \"off\"\n },\n \"datasourceCate\": \"prometheus\",\n \"datasourceValue\": \"${tidb_datasource}\",\n \"id\": \"9181ea69-d2d6-48bd-b137-3dbb7365d1fa\",\n \"layout\": {\n \"h\": 6,\n \"i\": \"9181ea69-d2d6-48bd-b137-3dbb7365d1fa\",\n \"isResizable\": true,\n \"w\": 12,\n \"x\": 0,\n \"y\": 81\n },\n \"links\": [],\n \"name\": \"Region health\",\n \"options\": {\n \"legend\": {\n \"displayMode\": \"hidden\"\n },\n \"standardOptions\": {},\n \"thresholds\": {\n \"steps\": [\n {\n \"color\": \"#634CD9\",\n \"type\": \"base\",\n \"value\": null\n }\n ]\n },\n \"tooltip\": {\n \"mode\": \"all\",\n \"sort\": \"none\"\n }\n },\n \"targets\": [\n {\n \"expr\": \"pd_regions_status{k8s_cluster=\\\"$k8s_cluster\\\", tidb_cluster=\\\"$tidb_cluster\\\", instance=\\\"$pd_instance\\\"}\",\n \"legend\": \"{{type}}\",\n \"refId\": \"A\",\n \"step\": null\n }\n ],\n \"transformations\": [\n {\n \"id\": \"organize\",\n \"options\": {}\n }\n ],\n \"type\": \"timeseries\",\n \"version\": \"3.0.0\"\n },\n {\n \"custom\": {\n \"drawStyle\": \"bars\",\n \"fillOpacity\": 0.3,\n \"gradientMode\": \"opacity\",\n \"lineWidth\": 2,\n \"scaleDistribution\": {\n \"type\": \"linear\"\n },\n \"spanNulls\": false,\n \"stack\": \"noraml\"\n },\n \"datasourceCate\": \"prometheus\",\n \"datasourceValue\": \"${tidb_datasource}\",\n \"description\": \"The current running schedulers\",\n \"id\": \"a7c270f9-fddf-4bce-8a77-ab64dc02f4c6\",\n \"layout\": {\n \"h\": 6,\n \"i\": \"a7c270f9-fddf-4bce-8a77-ab64dc02f4c6\",\n \"isResizable\": true,\n \"w\": 12,\n \"x\": 12,\n \"y\": 81\n },\n \"links\": [],\n \"name\": \"Scheduler is running\",\n \"options\": {\n \"legend\": {\n \"displayMode\": \"hidden\"\n },\n \"standardOptions\": {},\n \"thresholds\": {\n \"steps\": [\n {\n \"color\": \"#634CD9\",\n \"type\": \"base\",\n \"value\": null\n }\n ]\n },\n \"tooltip\": {\n \"mode\": \"all\",\n \"sort\": \"none\"\n }\n },\n \"targets\": [\n {\n \"expr\": \"pd_scheduler_status{k8s_cluster=\\\"$k8s_cluster\\\", tidb_cluster=\\\"$tidb_cluster\\\", type=\\\"allow\\\",instance=\\\"$pd_instance\\\"}\",\n \"legend\": \"{{kind}}\",\n \"refId\": \"A\"\n }\n ],\n \"transformations\": [\n {\n \"id\": \"organize\",\n \"options\": {}\n }\n ],\n \"type\": \"timeseries\",\n \"version\": \"3.0.0\"\n },\n {\n \"custom\": {\n \"drawStyle\": \"lines\",\n \"fillOpacity\": 0,\n \"gradientMode\": \"none\",\n \"lineInterpolation\": \"linear\",\n \"lineWidth\": 2,\n \"scaleDistribution\": {\n \"type\": \"linear\"\n },\n \"spanNulls\": false,\n \"stack\": \"off\"\n },\n \"datasourceCate\": \"prometheus\",\n \"datasourceValue\": \"${tidb_datasource}\",\n \"description\": \"The leader count of each TiKV instance\",\n \"id\": \"94a89a96-4016-450e-8d34-921e6d222e57\",\n \"layout\": {\n \"h\": 6,\n \"i\": \"94a89a96-4016-450e-8d34-921e6d222e57\",\n \"isResizable\": true,\n \"w\": 12,\n \"x\": 0,\n \"y\": 87\n },\n \"links\": [],\n \"name\": \"Store leader count\",\n \"options\": {\n \"legend\": {\n \"displayMode\": \"hidden\"\n },\n \"standardOptions\": {},\n \"thresholds\": {\n \"steps\": [\n {\n \"color\": \"#634CD9\",\n \"type\": \"base\",\n \"value\": null\n }\n ]\n },\n \"tooltip\": {\n \"mode\": \"all\",\n \"sort\": \"none\"\n }\n },\n \"targets\": [\n {\n \"expr\": \"pd_scheduler_store_status{k8s_cluster=\\\"$k8s_cluster\\\", tidb_cluster=\\\"$tidb_cluster\\\", instance=\\\"$pd_instance\\\", type=\\\"leader_count\\\"}\",\n \"legend\": \"{{address}}-store-{{store}}\",\n \"refId\": \"A\"\n }\n ],\n \"transformations\": [\n {\n \"id\": \"organize\",\n \"options\": {}\n }\n ],\n \"type\": \"timeseries\",\n \"version\": \"3.0.0\"\n },\n {\n \"custom\": {\n \"drawStyle\": \"lines\",\n \"fillOpacity\": 0,\n \"gradientMode\": \"none\",\n \"lineInterpolation\": \"linear\",\n \"lineWidth\": 2,\n \"scaleDistribution\": {\n \"type\": \"linear\"\n },\n \"spanNulls\": false,\n \"stack\": \"off\"\n },\n \"datasourceCate\": \"prometheus\",\n \"datasourceValue\": \"${tidb_datasource}\",\n \"description\": \"The Region count of each TiKV instance \\t\",\n \"id\": \"45d762bf-1c78-4462-a021-787cc2ef43a1\",\n \"layout\": {\n \"h\": 6,\n \"i\": \"45d762bf-1c78-4462-a021-787cc2ef43a1\",\n \"isResizable\": true,\n \"w\": 12,\n \"x\": 12,\n \"y\": 87\n },\n \"links\": [],\n \"name\": \"Store Region count\",\n \"options\": {\n \"legend\": {\n \"displayMode\": \"hidden\"\n },\n \"standardOptions\": {},\n \"thresholds\": {\n \"steps\": [\n {\n \"color\": \"#634CD9\",\n \"type\": \"base\",\n \"value\": null\n }\n ]\n },\n \"tooltip\": {\n \"mode\": \"all\",\n \"sort\": \"none\"\n }\n },\n \"targets\": [\n {\n \"expr\": \"pd_scheduler_store_status{k8s_cluster=\\\"$k8s_cluster\\\", tidb_cluster=\\\"$tidb_cluster\\\", instance=\\\"$pd_instance\\\", type=\\\"region_count\\\"}\",\n \"legend\": \"{{address}}-store-{{store}}\",\n \"refId\": \"A\"\n }\n ],\n \"transformations\": [\n {\n \"id\": \"organize\",\n \"options\": {}\n }\n ],\n \"type\": \"timeseries\",\n \"version\": \"3.0.0\"\n },\n {\n \"custom\": {\n \"drawStyle\": \"lines\",\n \"fillOpacity\": 0.3,\n \"gradientMode\": \"opacity\",\n \"lineInterpolation\": \"linear\",\n \"lineWidth\": 2,\n \"scaleDistribution\": {\n \"type\": \"linear\"\n },\n \"spanNulls\": false,\n \"stack\": \"off\"\n },\n \"datasourceCate\": \"prometheus\",\n \"datasourceValue\": \"${tidb_datasource}\",\n \"description\": \"The time consumed of completing each kind of gRPC commands in .99\",\n \"id\": \"be24f158-2662-4640-a699-ca02820448a2\",\n \"layout\": {\n \"h\": 6,\n \"i\": \"be24f158-2662-4640-a699-ca02820448a2\",\n \"isResizable\": true,\n \"w\": 12,\n \"x\": 0,\n \"y\": 93\n },\n \"links\": [],\n \"name\": \"99% Completed commands duration\",\n \"options\": {\n \"legend\": {\n \"displayMode\": \"hidden\"\n },\n \"standardOptions\": {\n \"util\": \"milliseconds\"\n },\n \"thresholds\": {\n \"steps\": [\n {\n \"color\": \"#634CD9\",\n \"type\": \"base\",\n \"value\": null\n }\n ]\n },\n \"tooltip\": {\n \"mode\": \"all\",\n \"sort\": \"desc\"\n }\n },\n \"targets\": [\n {\n \"expr\": \"histogram_quantile(0.99, sum(rate(grpc_server_handling_seconds_bucket{k8s_cluster=\\\"$k8s_cluster\\\", tidb_cluster=\\\"$tidb_cluster\\\", instance=\\\"$pd_instance\\\"}[5m])) by (grpc_method, le))*1000\",\n \"legend\": \"{{grpc_method}}\",\n \"refId\": \"A\"\n }\n ],\n \"transformations\": [\n {\n \"id\": \"organize\",\n \"options\": {}\n }\n ],\n \"type\": \"timeseries\",\n \"version\": \"3.0.0\"\n },\n {\n \"custom\": {\n \"drawStyle\": \"lines\",\n \"fillOpacity\": 0.3,\n \"gradientMode\": \"opacity\",\n \"lineInterpolation\": \"linear\",\n \"lineWidth\": 2,\n \"scaleDistribution\": {\n \"type\": \"linear\"\n },\n \"spanNulls\": false,\n \"stack\": \"off\"\n },\n \"datasourceCate\": \"prometheus\",\n \"datasourceValue\": \"${tidb_datasource}\",\n \"description\": \"The time consumed of handling TiDB requests\",\n \"id\": \"e64e2809-e92c-4765-947e-862cda4e4f03\",\n \"layout\": {\n \"h\": 6,\n \"i\": \"e64e2809-e92c-4765-947e-862cda4e4f03\",\n \"isResizable\": true,\n \"w\": 12,\n \"x\": 12,\n \"y\": 93\n },\n \"links\": [],\n \"name\": \"PD server TSO handle time\",\n \"options\": {\n \"legend\": {\n \"displayMode\": \"hidden\"\n },\n \"standardOptions\": {\n \"util\": \"milliseconds\"\n },\n \"thresholds\": {\n \"steps\": [\n {\n \"color\": \"#634CD9\",\n \"type\": \"base\",\n \"value\": null\n }\n ]\n },\n \"tooltip\": {\n \"mode\": \"all\",\n \"sort\": \"desc\"\n }\n },\n \"targets\": [\n {\n \"expr\": \"histogram_quantile(0.90, sum(rate(pd_server_handle_tso_duration_seconds_bucket{k8s_cluster=\\\"$k8s_cluster\\\", tidb_cluster=\\\"$tidb_cluster\\\"}[30s])) by (type, le))*1000\",\n \"legend\": \"90% tso\",\n \"refId\": \"A\"\n },\n {\n \"expr\": \"histogram_quantile(0.99, sum(rate(pd_server_handle_tso_duration_seconds_bucket{k8s_cluster=\\\"$k8s_cluster\\\", tidb_cluster=\\\"$tidb_cluster\\\"}[30s])) by (type, le))*1000\",\n \"legend\": \"99% tso\",\n \"refId\": \"B\"\n },\n {\n \"expr\": \"histogram_quantile(0.999, sum(rate(pd_server_handle_tso_duration_seconds_bucket{k8s_cluster=\\\"$k8s_cluster\\\", tidb_cluster=\\\"$tidb_cluster\\\"}[30s])) by (type, le))*1000\",\n \"legend\": \"99.9% tso\",\n \"refId\": \"C\"\n },\n {\n \"expr\": \"histogram_quantile(0.99999, sum(rate(pd_server_handle_tso_duration_seconds_bucket{k8s_cluster=\\\"$k8s_cluster\\\", tidb_cluster=\\\"$tidb_cluster\\\"}[30s])) by (type, le))*1000\",\n \"legend\": \"99.999% tso\",\n \"refId\": \"D\"\n }\n ],\n \"transformations\": [\n {\n \"id\": \"organize\",\n \"options\": {}\n }\n ],\n \"type\": \"timeseries\",\n \"version\": \"3.0.0\"\n },\n {\n \"custom\": {\n \"drawStyle\": \"lines\",\n \"fillOpacity\": 0.3,\n \"gradientMode\": \"opacity\",\n \"lineInterpolation\": \"linear\",\n \"lineWidth\": 2,\n \"scaleDistribution\": {\n \"type\": \"linear\"\n },\n \"spanNulls\": false,\n \"stack\": \"off\"\n },\n \"datasourceCate\": \"prometheus\",\n \"datasourceValue\": \"${tidb_datasource}\",\n \"description\": \"PD cpu usage calculated with process cpu running seconds\",\n \"id\": \"9f2e927e-f293-46da-8688-1475343cbd1b\",\n \"layout\": {\n \"h\": 7,\n \"i\": \"9f2e927e-f293-46da-8688-1475343cbd1b\",\n \"isResizable\": true,\n \"w\": 12,\n \"x\": 0,\n \"y\": 99\n },\n \"links\": [],\n \"name\": \"CPU Usage(%)\",\n \"options\": {\n \"legend\": {\n \"displayMode\": \"hidden\"\n },\n \"standardOptions\": {\n \"util\": \"none\"\n },\n \"thresholds\": {\n \"steps\": [\n {\n \"color\": \"#634CD9\",\n \"type\": \"base\",\n \"value\": null\n }\n ]\n },\n \"tooltip\": {\n \"mode\": \"all\",\n \"sort\": \"desc\"\n }\n },\n \"targets\": [\n {\n \"expr\": \"irate(process_cpu_seconds_total{k8s_cluster=\\\"$k8s_cluster\\\", tidb_cluster=\\\"$tidb_cluster\\\",job=~\\\".*pd.*\\\"}[30s])*100\",\n \"legend\": \"{{job}}-{{instance}}\",\n \"refId\": \"A\"\n }\n ],\n \"transformations\": [\n {\n \"id\": \"organize\",\n \"options\": {}\n }\n ],\n \"type\": \"timeseries\",\n \"version\": \"3.0.0\"\n },\n {\n \"custom\": {\n \"drawStyle\": \"lines\",\n \"fillOpacity\": 0.3,\n \"gradientMode\": \"opacity\",\n \"lineInterpolation\": \"linear\",\n \"lineWidth\": 2,\n \"scaleDistribution\": {\n \"type\": \"linear\"\n },\n \"spanNulls\": false,\n \"stack\": \"off\"\n },\n \"datasourceCate\": \"prometheus\",\n \"datasourceValue\": \"${tidb_datasource}\",\n \"description\": \"PD memory usage. \",\n \"id\": \"bae011b2-b545-4314-8083-9436716cd281\",\n \"layout\": {\n \"h\": 7,\n \"i\": \"bae011b2-b545-4314-8083-9436716cd281\",\n \"isResizable\": true,\n \"w\": 12,\n \"x\": 12,\n \"y\": 99\n },\n \"links\": [],\n \"name\": \"Memory Usage\",\n \"options\": {\n \"legend\": {\n \"displayMode\": \"hidden\"\n },\n \"standardOptions\": {\n \"util\": \"bytesIEC\"\n },\n \"thresholds\": {\n \"steps\": [\n {\n \"color\": \"#634CD9\",\n \"type\": \"base\",\n \"value\": null\n }\n ]\n },\n \"tooltip\": {\n \"mode\": \"all\",\n \"sort\": \"desc\"\n }\n },\n \"targets\": [\n {\n \"expr\": \"process_resident_memory_bytes{k8s_cluster=\\\"$k8s_cluster\\\", tidb_cluster=\\\"$tidb_cluster\\\",job=~\\\".*pd.*\\\"}\",\n \"legend\": \"process-{{job}}-{{instance}}\",\n \"refId\": \"A\"\n },\n {\n \"expr\": \"go_memstats_heap_inuse_bytes{k8s_cluster=\\\"$k8s_cluster\\\", tidb_cluster=\\\"$tidb_cluster\\\",job=~\\\".*pd.*\\\"}\",\n \"legend\": \"HeapInuse-{{job}}-{{instance}}\",\n \"refId\": \"C\"\n }\n ],\n \"transformations\": [\n {\n \"id\": \"organize\",\n \"options\": {}\n }\n ],\n \"type\": \"timeseries\",\n \"version\": \"3.0.0\"\n },\n {\n \"collapsed\": true,\n \"datasourceCate\": \"prometheus\",\n \"datasourceValue\": \"${tidb_datasource}\",\n \"id\": \"2f1959a6-654c-48bd-9f78-38865ec7b406\",\n \"layout\": {\n \"h\": 1,\n \"i\": \"2f1959a6-654c-48bd-9f78-38865ec7b406\",\n \"isResizable\": false,\n \"w\": 24,\n \"x\": 0,\n \"y\": 202\n },\n \"name\": \"TiDB\",\n \"panels\": [],\n \"type\": \"row\",\n \"version\": \"3.0.0\"\n },\n {\n \"custom\": {\n \"drawStyle\": \"lines\",\n \"fillOpacity\": 0.3,\n \"gradientMode\": \"opacity\",\n \"lineInterpolation\": \"linear\",\n \"lineWidth\": 2,\n \"scaleDistribution\": {\n \"type\": \"linear\"\n },\n \"spanNulls\": false,\n \"stack\": \"off\"\n },\n \"datasourceCate\": \"prometheus\",\n \"datasourceValue\": \"${tidb_datasource}\",\n \"description\": \"TiDB statement statistics.\\nBold red line on right Y axis for Failed Queries per second\",\n \"id\": \"bc04bd9e-39ed-4969-a969-d2a5d0c731ac\",\n \"layout\": {\n \"h\": 7,\n \"i\": \"bc04bd9e-39ed-4969-a969-d2a5d0c731ac\",\n \"isResizable\": true,\n \"w\": 12,\n \"x\": 0,\n \"y\": 203\n },\n \"links\": [],\n \"name\": \"QPS\",\n \"options\": {\n \"legend\": {\n \"displayMode\": \"hidden\"\n },\n \"standardOptions\": {},\n \"thresholds\": {\n \"steps\": [\n {\n \"color\": \"#634CD9\",\n \"type\": \"base\",\n \"value\": null\n }\n ]\n },\n \"tooltip\": {\n \"mode\": \"all\",\n \"sort\": \"desc\"\n }\n },\n \"targets\": [\n {\n \"expr\": \"sum(rate(tidb_executor_statement_total{k8s_cluster=\\\"$k8s_cluster\\\",instance=~\\\"$tidb_instance\\\",tidb_cluster=\\\"$tidb_cluster\\\"}[1m])) by (type)\",\n \"legend\": \"{{type}}\",\n \"refId\": \"A\"\n },\n {\n \"expr\": \"sum(rate(tidb_executor_statement_total{k8s_cluster=\\\"$k8s_cluster\\\",instance=~\\\"$tidb_instance\\\",tidb_cluster=\\\"$tidb_cluster\\\"}[1m]))\",\n \"legend\": \"Total\",\n \"refId\": \"B\"\n },\n {\n \"expr\": \"sum(rate(tidb_server_execute_error_total{k8s_cluster=\\\"$k8s_cluster\\\",instance=~\\\"$tidb_instance\\\",tidb_cluster=\\\"$tidb_cluster\\\"}[1m])) \",\n \"legend\": \"Failed\",\n \"refId\": \"C\"\n }\n ],\n \"transformations\": [\n {\n \"id\": \"organize\",\n \"options\": {}\n }\n ],\n \"type\": \"timeseries\",\n \"version\": \"3.0.0\"\n },\n {\n \"custom\": {\n \"drawStyle\": \"lines\",\n \"fillOpacity\": 0.3,\n \"gradientMode\": \"opacity\",\n \"lineInterpolation\": \"linear\",\n \"lineWidth\": 2,\n \"scaleDistribution\": {\n \"type\": \"linear\"\n },\n \"spanNulls\": false,\n \"stack\": \"off\"\n },\n \"datasourceCate\": \"prometheus\",\n \"datasourceValue\": \"${tidb_datasource}\",\n \"id\": \"82ef5626-87ac-4577-b888-cc51b038e91f\",\n \"layout\": {\n \"h\": 7,\n \"i\": \"82ef5626-87ac-4577-b888-cc51b038e91f\",\n \"isResizable\": true,\n \"w\": 12,\n \"x\": 12,\n \"y\": 203\n },\n \"links\": [],\n \"name\": \"Duration\",\n \"options\": {\n \"legend\": {\n \"displayMode\": \"hidden\"\n },\n \"standardOptions\": {\n \"util\": \"milliseconds\"\n },\n \"thresholds\": {\n \"steps\": [\n {\n \"color\": \"#634CD9\",\n \"type\": \"base\",\n \"value\": null\n }\n ]\n },\n \"tooltip\": {\n \"mode\": \"all\",\n \"sort\": \"desc\"\n }\n },\n \"targets\": [\n {\n \"expr\": \"histogram_quantile(0.9999, sum(rate(tidb_server_handle_query_duration_seconds_bucket{k8s_cluster=\\\"$k8s_cluster\\\",instance=~\\\"$tidb_instance\\\", tidb_cluster=\\\"$tidb_cluster\\\"}[1m])) by (le))*1000\",\n \"legend\": \"9999\",\n \"refId\": \"A\"\n },\n {\n \"expr\": \"histogram_quantile(0.999, sum(rate(tidb_server_handle_query_duration_seconds_bucket{k8s_cluster=\\\"$k8s_cluster\\\",instance=~\\\"$tidb_instance\\\", tidb_cluster=\\\"$tidb_cluster\\\"}[1m])) by (le))*1000\",\n \"legend\": \"999\",\n \"refId\": \"B\"\n },\n {\n \"expr\": \"histogram_quantile(0.99, sum(rate(tidb_server_handle_query_duration_seconds_bucket{k8s_cluster=\\\"$k8s_cluster\\\",instance=~\\\"$tidb_instance\\\", tidb_cluster=\\\"$tidb_cluster\\\"}[1m])) by (le))*1000\",\n \"legend\": \"99\",\n \"refId\": \"C\"\n },\n {\n \"expr\": \"histogram_quantile(0.95, sum(rate(tidb_server_handle_query_duration_seconds_bucket{k8s_cluster=\\\"$k8s_cluster\\\",instance=~\\\"$tidb_instance\\\", tidb_cluster=\\\"$tidb_cluster\\\"}[1m])) by (le))*1000\",\n \"legend\": \"95\",\n \"refId\": \"D\"\n },\n {\n \"expr\": \"histogram_quantile(0.80, sum(rate(tidb_server_handle_query_duration_seconds_bucket{k8s_cluster=\\\"$k8s_cluster\\\",instance=~\\\"$tidb_instance\\\", tidb_cluster=\\\"$tidb_cluster\\\"}[1m])) by (le))*1000\",\n \"legend\": \"80\",\n \"refId\": \"F\"\n }\n ],\n \"transformations\": [\n {\n \"id\": \"organize\",\n \"options\": {}\n }\n ],\n \"type\": \"timeseries\",\n \"version\": \"3.0.0\"\n },\n {\n \"custom\": {\n \"drawStyle\": \"lines\",\n \"fillOpacity\": 0.3,\n \"gradientMode\": \"opacity\",\n \"lineInterpolation\": \"linear\",\n \"lineWidth\": 2,\n \"scaleDistribution\": {\n \"type\": \"linear\"\n },\n \"spanNulls\": false,\n \"stack\": \"off\"\n },\n \"datasourceCate\": \"prometheus\",\n \"datasourceValue\": \"${tidb_datasource}\",\n \"description\": \"Service Time Per Second, show service time distribution among different SQL types:\\n1. Database time, the total time that the TiDB cluster is processing application requests.\\n2. The service time of different SQL types.\\n\",\n \"id\": \"cf1426f5-85b1-413b-b2d6-a24a693f5609\",\n \"layout\": {\n \"h\": 7,\n \"i\": \"cf1426f5-85b1-413b-b2d6-a24a693f5609\",\n \"isResizable\": true,\n \"w\": 8,\n \"x\": 0,\n \"y\": 210\n },\n \"links\": [],\n \"name\": \"Database Time by SQL Type\",\n \"options\": {\n \"legend\": {\n \"displayMode\": \"hidden\"\n },\n \"standardOptions\": {\n \"util\": \"seconds\"\n },\n \"thresholds\": {\n \"steps\": [\n {\n \"color\": \"#634CD9\",\n \"type\": \"base\",\n \"value\": null\n }\n ]\n },\n \"tooltip\": {\n \"mode\": \"all\",\n \"sort\": \"desc\"\n }\n },\n \"targets\": [\n {\n \"expr\": \"sum(rate(tidb_server_handle_query_duration_seconds_sum{k8s_cluster=\\\"$k8s_cluster\\\",tidb_cluster=\\\"$tidb_cluster\\\",instance=~\\\"$tidb_instance\\\", sql_type!=\\\"internal\\\"}[1m]))\",\n \"legend\": \"database time\",\n \"refId\": \"A\"\n },\n {\n \"expr\": \"sum(rate(tidb_server_handle_query_duration_seconds_sum{k8s_cluster=\\\"$k8s_cluster\\\",tidb_cluster=\\\"$tidb_cluster\\\",instance=~\\\"$tidb_instance\\\", sql_type!=\\\"internal\\\"}[1m])) by (sql_type)\",\n \"legend\": \"{{sql_type}}\",\n \"refId\": \"G\"\n }\n ],\n \"transformations\": [\n {\n \"id\": \"organize\",\n \"options\": {}\n }\n ],\n \"type\": \"timeseries\",\n \"version\": \"3.0.0\"\n },\n {\n \"custom\": {\n \"drawStyle\": \"lines\",\n \"fillOpacity\": 0.3,\n \"gradientMode\": \"opacity\",\n \"lineInterpolation\": \"linear\",\n \"lineWidth\": 2,\n \"scaleDistribution\": {\n \"type\": \"linear\"\n },\n \"spanNulls\": false,\n \"stack\": \"off\"\n },\n \"datasourceCate\": \"prometheus\",\n \"datasourceValue\": \"${tidb_datasource}\",\n \"description\": \"Service Time Per Second, show service time distribution among different SQL phases.\\n1. Database time, the total time that the TiDB cluster is processing application requests.\\n2. The service time of different SQL phases.\\n\",\n \"id\": \"e4b40e12-1cf9-449a-86c6-a9433c1e4dae\",\n \"layout\": {\n \"h\": 7,\n \"i\": \"e4b40e12-1cf9-449a-86c6-a9433c1e4dae\",\n \"isResizable\": true,\n \"w\": 8,\n \"x\": 8,\n \"y\": 210\n },\n \"links\": [],\n \"name\": \"Database Time by SQL Phase\",\n \"options\": {\n \"legend\": {\n \"displayMode\": \"hidden\"\n },\n \"standardOptions\": {\n \"util\": \"seconds\"\n },\n \"thresholds\": {\n \"steps\": [\n {\n \"color\": \"#634CD9\",\n \"type\": \"base\",\n \"value\": null\n }\n ]\n },\n \"tooltip\": {\n \"mode\": \"all\",\n \"sort\": \"desc\"\n }\n },\n \"targets\": [\n {\n \"expr\": \"sum(rate(tidb_server_handle_query_duration_seconds_sum{k8s_cluster=\\\"$k8s_cluster\\\",tidb_cluster=\\\"$tidb_cluster\\\",instance=~\\\"$tidb_instance\\\", sql_type!=\\\"internal\\\"}[1m]))\",\n \"legend\": \"database time\",\n \"refId\": \"A\"\n },\n {\n \"expr\": \"sum(rate(tidb_session_parse_duration_seconds_sum{k8s_cluster=\\\"$k8s_cluster\\\",tidb_cluster=\\\"$tidb_cluster\\\",instance=~\\\"$tidb_instance\\\", sql_type=\\\"general\\\"}[1m]))\",\n \"legend\": \"parse\",\n \"refId\": \"D\"\n },\n {\n \"expr\": \"sum(rate(tidb_session_compile_duration_seconds_sum{k8s_cluster=\\\"$k8s_cluster\\\",tidb_cluster=\\\"$tidb_cluster\\\",instance=~\\\"$tidb_instance\\\", sql_type=\\\"general\\\"}[1m]))\",\n \"legend\": \"compile\",\n \"refId\": \"E\"\n },\n {\n \"expr\": \"sum(rate(tidb_session_execute_duration_seconds_sum{k8s_cluster=\\\"$k8s_cluster\\\",tidb_cluster=\\\"$tidb_cluster\\\",instance=~\\\"$tidb_instance\\\", sql_type=\\\"general\\\"}[1m]))\",\n \"legend\": \"execute\",\n \"refId\": \"F\"\n },\n {\n \"expr\": \"sum(rate(tidb_server_get_token_duration_seconds_sum{k8s_cluster=\\\"$k8s_cluster\\\",tidb_cluster=\\\"$tidb_cluster\\\",instance=~\\\"$tidb_instance\\\"}[1m]))/1000000\",\n \"legend\": \"get token\",\n \"refId\": \"G\"\n }\n ],\n \"transformations\": [\n {\n \"id\": \"organize\",\n \"options\": {}\n }\n ],\n \"type\": \"timeseries\",\n \"version\": \"3.0.0\"\n },\n {\n \"custom\": {\n \"drawStyle\": \"lines\",\n \"fillOpacity\": 0.3,\n \"gradientMode\": \"opacity\",\n \"lineInterpolation\": \"linear\",\n \"lineWidth\": 2,\n \"scaleDistribution\": {\n \"type\": \"linear\"\n },\n \"spanNulls\": false,\n \"stack\": \"off\"\n },\n \"datasourceCate\": \"prometheus\",\n \"datasourceValue\": \"${tidb_datasource}\",\n \"description\": \"Service Time Per Second, show service time distribution among different KV/PD request:\\n1. Execute time, the execute time in SQL Phase\\n2. Service time of different KV/PD request \",\n \"id\": \"e64105a4-56b7-4b74-948e-c2bc8cffdebd\",\n \"layout\": {\n \"h\": 7,\n \"i\": \"e64105a4-56b7-4b74-948e-c2bc8cffdebd\",\n \"isResizable\": true,\n \"w\": 8,\n \"x\": 16,\n \"y\": 210\n },\n \"links\": [],\n \"name\": \"SQL Execute Time Overview\",\n \"options\": {\n \"legend\": {\n \"displayMode\": \"hidden\"\n },\n \"standardOptions\": {\n \"util\": \"seconds\"\n },\n \"thresholds\": {\n \"steps\": [\n {\n \"color\": \"#634CD9\",\n \"type\": \"base\",\n \"value\": null\n }\n ]\n },\n \"tooltip\": {\n \"mode\": \"all\",\n \"sort\": \"desc\"\n }\n },\n \"targets\": [\n {\n \"expr\": \"sum(rate(tidb_tikvclient_request_seconds_sum{k8s_cluster=\\\"$k8s_cluster\\\",tidb_cluster=\\\"$tidb_cluster\\\",instance=~\\\"$tidb_instance\\\", store!=\\\"0\\\"}[1m])) by (type)\",\n \"legend\": \"{{type}}\",\n \"refId\": \"B\"\n },\n {\n \"expr\": \"sum(rate(pd_client_cmd_handle_cmds_duration_seconds_sum{k8s_cluster=\\\"$k8s_cluster\\\",tidb_cluster=\\\"$tidb_cluster\\\",instance=~\\\"$tidb_instance\\\", type=\\\"wait\\\"}[1m]))\",\n \"legend\": \"tso_wait\",\n \"refId\": \"C\"\n },\n {\n \"expr\": \"sum(rate(tidb_session_execute_duration_seconds_sum{k8s_cluster=\\\"$k8s_cluster\\\",tidb_cluster=\\\"$tidb_cluster\\\",instance=~\\\"$tidb_instance\\\", sql_type=\\\"general\\\"}[1m]))\",\n \"legend\": \"execute time\",\n \"refId\": \"F\"\n }\n ],\n \"transformations\": [\n {\n \"id\": \"organize\",\n \"options\": {}\n }\n ],\n \"type\": \"timeseries\",\n \"version\": \"3.0.0\"\n },\n {\n \"custom\": {\n \"drawStyle\": \"lines\",\n \"fillOpacity\": 0.3,\n \"gradientMode\": \"opacity\",\n \"lineInterpolation\": \"linear\",\n \"lineWidth\": 2,\n \"scaleDistribution\": {\n \"type\": \"linear\"\n },\n \"spanNulls\": false,\n \"stack\": \"off\"\n },\n \"datasourceCate\": \"prometheus\",\n \"datasourceValue\": \"${tidb_datasource}\",\n \"description\": \"TiDB current connection counts\",\n \"id\": \"648f51db-4891-42ca-a6aa-ee2cf9976b62\",\n \"layout\": {\n \"h\": 7,\n \"i\": \"648f51db-4891-42ca-a6aa-ee2cf9976b62\",\n \"isResizable\": true,\n \"w\": 12,\n \"x\": 0,\n \"y\": 217\n },\n \"links\": [],\n \"name\": \"Connection Count\",\n \"options\": {\n \"legend\": {\n \"displayMode\": \"hidden\"\n },\n \"standardOptions\": {},\n \"thresholds\": {\n \"steps\": [\n {\n \"color\": \"#634CD9\",\n \"type\": \"base\",\n \"value\": null\n }\n ]\n },\n \"tooltip\": {\n \"mode\": \"all\",\n \"sort\": \"desc\"\n }\n },\n \"targets\": [\n {\n \"expr\": \"tidb_server_connections{k8s_cluster=\\\"$k8s_cluster\\\",tidb_cluster=\\\"$tidb_cluster\\\"}\",\n \"legend\": \"{{instance}}\",\n \"refId\": \"A\"\n },\n {\n \"expr\": \"sum(tidb_server_connections{k8s_cluster=\\\"$k8s_cluster\\\",tidb_cluster=\\\"$tidb_cluster\\\"})\",\n \"legend\": \"total\",\n \"refId\": \"B\"\n },\n {\n \"expr\": \"sum(rate(tidb_server_handle_query_duration_seconds_sum{k8s_cluster=\\\"$k8s_cluster\\\",tidb_cluster=\\\"$tidb_cluster\\\", sql_type!=\\\"internal\\\"}[1m]))\",\n \"legend\": \"active connections\",\n \"refId\": \"C\"\n }\n ],\n \"transformations\": [\n {\n \"id\": \"organize\",\n \"options\": {}\n }\n ],\n \"type\": \"timeseries\",\n \"version\": \"3.0.0\"\n },\n {\n \"custom\": {\n \"drawStyle\": \"lines\",\n \"fillOpacity\": 0.3,\n \"gradientMode\": \"opacity\",\n \"lineInterpolation\": \"linear\",\n \"lineWidth\": 2,\n \"scaleDistribution\": {\n \"type\": \"linear\"\n },\n \"spanNulls\": false,\n \"stack\": \"off\"\n },\n \"datasourceCate\": \"prometheus\",\n \"datasourceValue\": \"${tidb_datasource}\",\n \"description\": \"TiDB slow query statistics with slow query durations and coprocessor waiting/executing durations\",\n \"id\": \"2d1a443c-afbf-4197-b2a8-3b99d8087590\",\n \"layout\": {\n \"h\": 7,\n \"i\": \"2d1a443c-afbf-4197-b2a8-3b99d8087590\",\n \"isResizable\": true,\n \"w\": 12,\n \"x\": 12,\n \"y\": 217\n },\n \"links\": [],\n \"name\": \"Slow query\",\n \"options\": {\n \"legend\": {\n \"displayMode\": \"hidden\"\n },\n \"standardOptions\": {\n \"util\": \"seconds\"\n },\n \"thresholds\": {\n \"steps\": [\n {\n \"color\": \"#634CD9\",\n \"type\": \"base\",\n \"value\": null\n }\n ]\n },\n \"tooltip\": {\n \"mode\": \"all\",\n \"sort\": \"desc\"\n }\n },\n \"targets\": [\n {\n \"expr\": \"histogram_quantile(0.90, sum(rate(tidb_server_slow_query_process_duration_seconds_bucket{k8s_cluster=\\\"$k8s_cluster\\\", tidb_cluster=\\\"$tidb_cluster\\\", instance=~\\\"$tidb_instance\\\"}[1m])) by (le,sql_type))\",\n \"legend\": \"all_proc_{{sql_type}}\",\n \"refId\": \"A\"\n },\n {\n \"expr\": \"histogram_quantile(0.90, sum(rate(tidb_server_slow_query_cop_duration_seconds_bucket{k8s_cluster=\\\"$k8s_cluster\\\", tidb_cluster=\\\"$tidb_cluster\\\", instance=~\\\"$tidb_instance\\\"}[1m])) by (le,sql_type))\",\n \"legend\": \"all_cop_proc_{{sql_type}}\",\n \"refId\": \"B\"\n },\n {\n \"expr\": \"histogram_quantile(0.90, sum(rate(tidb_server_slow_query_wait_duration_seconds_bucket{k8s_cluster=\\\"$k8s_cluster\\\", tidb_cluster=\\\"$tidb_cluster\\\", instance=~\\\"$tidb_instance\\\"}[1m])) by (le,sql_type))\",\n \"legend\": \"all_cop_wait_{{sql_type}}\",\n \"refId\": \"C\"\n }\n ],\n \"transformations\": [\n {\n \"id\": \"organize\",\n \"options\": {}\n }\n ],\n \"type\": \"timeseries\",\n \"version\": \"3.0.0\"\n },\n {\n \"custom\": {\n \"drawStyle\": \"lines\",\n \"fillOpacity\": 0.3,\n \"gradientMode\": \"opacity\",\n \"lineInterpolation\": \"linear\",\n \"lineWidth\": 2,\n \"scaleDistribution\": {\n \"type\": \"linear\"\n },\n \"spanNulls\": false,\n \"stack\": \"off\"\n },\n \"datasourceCate\": \"prometheus\",\n \"datasourceValue\": \"${tidb_datasource}\",\n \"description\": \"TiDB failed query statistics by query type\",\n \"id\": \"4df8dfb9-5151-4cc8-8560-30fb259dcb75\",\n \"layout\": {\n \"h\": 6,\n \"i\": \"4df8dfb9-5151-4cc8-8560-30fb259dcb75\",\n \"isResizable\": true,\n \"w\": 24,\n \"x\": 0,\n \"y\": 224\n },\n \"links\": [],\n \"name\": \"Failed Query OPM\",\n \"options\": {\n \"legend\": {\n \"displayMode\": \"hidden\"\n },\n \"standardOptions\": {},\n \"thresholds\": {\n \"steps\": [\n {\n \"color\": \"#634CD9\",\n \"type\": \"base\",\n \"value\": null\n }\n ]\n },\n \"tooltip\": {\n \"mode\": \"all\",\n \"sort\": \"desc\"\n }\n },\n \"targets\": [\n {\n \"expr\": \"sum(increase(tidb_server_execute_error_total{k8s_cluster=\\\"$k8s_cluster\\\", tidb_cluster=\\\"$tidb_cluster\\\", instance=~\\\"$tidb_instance\\\"}[1m])) by (type, instance)\",\n \"legend\": \" {{type}}-{{instance}}\",\n \"refId\": \"A\"\n }\n ],\n \"transformations\": [\n {\n \"id\": \"organize\",\n \"options\": {}\n }\n ],\n \"type\": \"timeseries\",\n \"version\": \"3.0.0\"\n },\n {\n \"custom\": {\n \"drawStyle\": \"lines\",\n \"fillOpacity\": 0.3,\n \"gradientMode\": \"opacity\",\n \"lineInterpolation\": \"linear\",\n \"lineWidth\": 2,\n \"scaleDistribution\": {\n \"type\": \"linear\"\n },\n \"spanNulls\": false,\n \"stack\": \"off\"\n },\n \"datasourceCate\": \"prometheus\",\n \"datasourceValue\": \"${tidb_datasource}\",\n \"description\": \"TiDB cpu usage calculated with process cpu running seconds\",\n \"id\": \"5bfbc205-53f1-4d1d-9bac-8d685bd7b9a2\",\n \"layout\": {\n \"h\": 7,\n \"i\": \"5bfbc205-53f1-4d1d-9bac-8d685bd7b9a2\",\n \"isResizable\": true,\n \"w\": 12,\n \"x\": 0,\n \"y\": 230\n },\n \"links\": [],\n \"name\": \"CPU Usage(%)\",\n \"options\": {\n \"legend\": {\n \"displayMode\": \"hidden\"\n },\n \"standardOptions\": {},\n \"thresholds\": {\n \"steps\": [\n {\n \"color\": \"#634CD9\",\n \"type\": \"\",\n \"value\": null\n },\n {\n \"color\": \"#634CD9\",\n \"type\": \"base\",\n \"value\": null\n }\n ]\n },\n \"tooltip\": {\n \"mode\": \"all\",\n \"sort\": \"desc\"\n }\n },\n \"targets\": [\n {\n \"expr\": \"irate(process_cpu_seconds_total{k8s_cluster=\\\"$k8s_cluster\\\", tidb_cluster=\\\"$tidb_cluster\\\", instance=~\\\"$tidb_instance\\\", job=\\\"tidb\\\"}[30s])*100\",\n \"legend\": \"{{instance}}\",\n \"refId\": \"A\"\n }\n ],\n \"transformations\": [\n {\n \"id\": \"organize\",\n \"options\": {}\n }\n ],\n \"type\": \"timeseries\",\n \"version\": \"3.0.0\"\n },\n {\n \"custom\": {\n \"drawStyle\": \"lines\",\n \"fillOpacity\": 0.3,\n \"gradientMode\": \"opacity\",\n \"lineInterpolation\": \"linear\",\n \"lineWidth\": 2,\n \"scaleDistribution\": {\n \"type\": \"linear\"\n },\n \"spanNulls\": false,\n \"stack\": \"off\"\n },\n \"datasourceCate\": \"prometheus\",\n \"datasourceValue\": \"${tidb_datasource}\",\n \"id\": \"a4725eba-e15d-4dee-92ac-71dc2d8dba3a\",\n \"layout\": {\n \"h\": 7,\n \"i\": \"a4725eba-e15d-4dee-92ac-71dc2d8dba3a\",\n \"isResizable\": true,\n \"w\": 12,\n \"x\": 12,\n \"y\": 230\n },\n \"links\": [],\n \"name\": \"Memory Usage\",\n \"options\": {\n \"legend\": {\n \"displayMode\": \"hidden\"\n },\n \"standardOptions\": {\n \"util\": \"bytesIEC\"\n },\n \"thresholds\": {\n \"steps\": [\n {\n \"color\": \"#634CD9\",\n \"type\": \"base\",\n \"value\": null\n }\n ]\n },\n \"tooltip\": {\n \"mode\": \"all\",\n \"sort\": \"desc\"\n }\n },\n \"targets\": [\n {\n \"expr\": \"process_resident_memory_bytes{k8s_cluster=\\\"$k8s_cluster\\\", tidb_cluster=\\\"$tidb_cluster\\\",instance=~\\\"$tidb_instance\\\", job=\\\"tidb\\\"}\",\n \"legend\": \"process-{{instance}}\",\n \"refId\": \"A\"\n },\n {\n \"expr\": \"go_memstats_heap_inuse_bytes{k8s_cluster=\\\"$k8s_cluster\\\", tidb_cluster=\\\"$tidb_cluster\\\",instance=~\\\"$tidb_instance\\\", job=\\\"tidb\\\"}\",\n \"legend\": \"HeapInuse-{{instance}}\",\n \"refId\": \"B\"\n }\n ],\n \"transformations\": [\n {\n \"id\": \"organize\",\n \"options\": {}\n }\n ],\n \"type\": \"timeseries\",\n \"version\": \"3.0.0\"\n },\n {\n \"collapsed\": true,\n \"datasourceCate\": \"prometheus\",\n \"datasourceValue\": \"${tidb_datasource}\",\n \"id\": \"d661c0cc-f4f1-45b9-8fd7-69a863d57225\",\n \"layout\": {\n \"h\": 1,\n \"i\": \"d661c0cc-f4f1-45b9-8fd7-69a863d57225\",\n \"isResizable\": false,\n \"w\": 24,\n \"x\": 0,\n \"y\": 271\n },\n \"name\": \"TiKV\",\n \"panels\": [],\n \"type\": \"row\",\n \"version\": \"3.0.0\"\n },\n {\n \"custom\": {\n \"drawStyle\": \"lines\",\n \"fillOpacity\": 0.3,\n \"gradientMode\": \"opacity\",\n \"lineInterpolation\": \"linear\",\n \"lineWidth\": 2,\n \"scaleDistribution\": {\n \"type\": \"linear\"\n },\n \"spanNulls\": false,\n \"stack\": \"off\"\n },\n \"datasourceCate\": \"prometheus\",\n \"datasourceValue\": \"${tidb_datasource}\",\n \"description\": \"tidb avg kv request duration\",\n \"id\": \"babad1cd-29ac-4fe7-8b7b-55ac7ebc2963\",\n \"layout\": {\n \"h\": 8,\n \"i\": \"babad1cd-29ac-4fe7-8b7b-55ac7ebc2963\",\n \"isResizable\": true,\n \"w\": 8,\n \"x\": 0,\n \"y\": 272\n },\n \"links\": [],\n \"name\": \"Avg TiDB KV Request Duration\",\n \"options\": {\n \"legend\": {\n \"displayMode\": \"hidden\"\n },\n \"standardOptions\": {\n \"util\": \"milliseconds\"\n },\n \"thresholds\": {\n \"steps\": [\n {\n \"color\": \"#634CD9\",\n \"type\": \"base\",\n \"value\": null\n }\n ]\n },\n \"tooltip\": {\n \"mode\": \"all\",\n \"sort\": \"desc\"\n }\n },\n \"targets\": [\n {\n \"expr\": \"sum(rate(tidb_tikvclient_request_seconds_sum{k8s_cluster=\\\"$k8s_cluster\\\",tidb_cluster=\\\"$tidb_cluster\\\", store!=\\\"0\\\"}[1m])) by (type)/ sum(rate(tidb_tikvclient_request_seconds_count{k8s_cluster=\\\"$k8s_cluster\\\",tidb_cluster=\\\"$tidb_cluster\\\", store!=\\\"0\\\"}[1m])) by (type)*1000\",\n \"legend\": \"{{type}}\",\n \"refId\": \"C\"\n }\n ],\n \"transformations\": [\n {\n \"id\": \"organize\",\n \"options\": {}\n }\n ],\n \"type\": \"timeseries\",\n \"version\": \"3.0.0\"\n },\n {\n \"custom\": {\n \"drawStyle\": \"lines\",\n \"fillOpacity\": 0.3,\n \"gradientMode\": \"opacity\",\n \"lineInterpolation\": \"linear\",\n \"lineWidth\": 2,\n \"scaleDistribution\": {\n \"type\": \"linear\"\n },\n \"spanNulls\": false,\n \"stack\": \"off\"\n },\n \"datasourceCate\": \"prometheus\",\n \"datasourceValue\": \"${tidb_datasource}\",\n \"description\": \"tikv grpc avg duration\",\n \"id\": \"bd36343a-d3a7-4e46-be96-5e3976741206\",\n \"layout\": {\n \"h\": 8,\n \"i\": \"bd36343a-d3a7-4e46-be96-5e3976741206\",\n \"isResizable\": true,\n \"w\": 8,\n \"x\": 8,\n \"y\": 272\n },\n \"links\": [],\n \"name\": \"Avg TiKV GRPC Duration\",\n \"options\": {\n \"legend\": {\n \"displayMode\": \"hidden\"\n },\n \"standardOptions\": {\n \"util\": \"milliseconds\"\n },\n \"thresholds\": {\n \"steps\": [\n {\n \"color\": \"#634CD9\",\n \"type\": \"base\",\n \"value\": null\n }\n ]\n },\n \"tooltip\": {\n \"mode\": \"all\",\n \"sort\": \"desc\"\n }\n },\n \"targets\": [\n {\n \"expr\": \"sum(rate(tikv_grpc_msg_duration_seconds_sum{k8s_cluster=\\\"$k8s_cluster\\\",tidb_cluster=\\\"$tidb_cluster\\\",instance=~\\\"$tikv_instance\\\", store!=\\\"0\\\"}[1m])) by (type)/ sum(rate(tikv_grpc_msg_duration_seconds_count{k8s_cluster=\\\"$k8s_cluster\\\",tidb_cluster=\\\"$tidb_cluster\\\",instance=~\\\"$tikv_instance\\\", store!=\\\"0\\\"}[1m])) by (type)*1000\",\n \"legend\": \"{{type}}\",\n \"refId\": \"C\"\n }\n ],\n \"transformations\": [\n {\n \"id\": \"organize\",\n \"options\": {}\n }\n ],\n \"type\": \"timeseries\",\n \"version\": \"3.0.0\"\n },\n {\n \"custom\": {\n \"drawStyle\": \"lines\",\n \"fillOpacity\": 0.3,\n \"gradientMode\": \"opacity\",\n \"lineInterpolation\": \"linear\",\n \"lineWidth\": 2,\n \"scaleDistribution\": {\n \"type\": \"linear\"\n },\n \"spanNulls\": false,\n \"stack\": \"off\"\n },\n \"datasourceCate\": \"prometheus\",\n \"datasourceValue\": \"${tidb_datasource}\",\n \"description\": \"The time consumed by processing asynchronous write requests.\\nStorage async write duration = store duration + apply duration\",\n \"id\": \"85d4b493-8bd9-472a-8281-23085cde1f88\",\n \"layout\": {\n \"h\": 8,\n \"i\": \"85d4b493-8bd9-472a-8281-23085cde1f88\",\n \"isResizable\": true,\n \"w\": 8,\n \"x\": 16,\n \"y\": 272\n },\n \"links\": [],\n \"name\": \"Storage Async Write Duration\",\n \"options\": {\n \"legend\": {\n \"displayMode\": \"hidden\"\n },\n \"standardOptions\": {\n \"util\": \"milliseconds\"\n },\n \"thresholds\": {\n \"steps\": [\n {\n \"color\": \"#634CD9\",\n \"type\": \"base\",\n \"value\": null\n }\n ]\n },\n \"tooltip\": {\n \"mode\": \"all\",\n \"sort\": \"desc\"\n }\n },\n \"targets\": [\n {\n \"expr\": \"sum(rate(tikv_storage_engine_async_request_duration_seconds_sum{k8s_cluster=\\\"$k8s_cluster\\\",tidb_cluster=\\\"$tidb_cluster\\\",instance=~\\\"$tikv_instance\\\", type=\\\"write\\\"}[1m])) / sum(rate(tikv_storage_engine_async_request_duration_seconds_count{k8s_cluster=\\\"$k8s_cluster\\\",tidb_cluster=\\\"$tidb_cluster\\\",instance=~\\\"$tikv_instance\\\", type=\\\"write\\\"}[1m]))*1000\",\n \"legend\": \"avg\",\n \"refId\": \"C\"\n },\n {\n \"expr\": \"histogram_quantile(0.99, sum(rate(tikv_storage_engine_async_request_duration_seconds_bucket{k8s_cluster=\\\"$k8s_cluster\\\",tidb_cluster=\\\"$tidb_cluster\\\",instance=~\\\"$tikv_instance\\\", type=\\\"write\\\"}[1m])) by (le))*1000\",\n \"legend\": \"99\",\n \"refId\": \"A\"\n },\n {\n \"expr\": \"histogram_quantile(0.999, sum(rate(tikv_storage_engine_async_request_duration_seconds_bucket{k8s_cluster=\\\"$k8s_cluster\\\",tidb_cluster=\\\"$tidb_cluster\\\",instance=~\\\"$tikv_instance\\\", type=\\\"write\\\"}[1m])) by (le))*1000\",\n \"legend\": \"999\",\n \"refId\": \"B\"\n }\n ],\n \"transformations\": [\n {\n \"id\": \"organize\",\n \"options\": {}\n }\n ],\n \"type\": \"timeseries\",\n \"version\": \"3.0.0\"\n },\n {\n \"custom\": {\n \"drawStyle\": \"lines\",\n \"fillOpacity\": 0.3,\n \"gradientMode\": \"opacity\",\n \"lineInterpolation\": \"linear\",\n \"lineWidth\": 2,\n \"scaleDistribution\": {\n \"type\": \"linear\"\n },\n \"spanNulls\": false,\n \"stack\": \"off\"\n },\n \"datasourceCate\": \"prometheus\",\n \"datasourceValue\": \"${tidb_datasource}\",\n \"description\": \"The CPU utilization of raftstore thread\",\n \"id\": \"03b56519-9926-4aa7-bff5-e1c7c8a576be\",\n \"layout\": {\n \"h\": 7,\n \"i\": \"03b56519-9926-4aa7-bff5-e1c7c8a576be\",\n \"isResizable\": true,\n \"w\": 12,\n \"x\": 0,\n \"y\": 280\n },\n \"links\": [],\n \"name\": \"Raft store CPU(%)\",\n \"options\": {\n \"legend\": {\n \"displayMode\": \"hidden\"\n },\n \"standardOptions\": {},\n \"thresholds\": {\n \"steps\": [\n {\n \"color\": \"#634CD9\",\n \"type\": \"base\",\n \"value\": null\n }\n ]\n },\n \"tooltip\": {\n \"mode\": \"all\",\n \"sort\": \"desc\"\n }\n },\n \"targets\": [\n {\n \"expr\": \"sum(rate(tikv_thread_cpu_seconds_total{k8s_cluster=\\\"$k8s_cluster\\\", tidb_cluster=\\\"$tidb_cluster\\\", instance=~\\\"$tikv_instance\\\", name=~\\\"raftstore_.*\\\"}[1m])) by (instance)*100\",\n \"legend\": \"{{instance}}\",\n \"refId\": \"A\"\n }\n ],\n \"transformations\": [\n {\n \"id\": \"organize\",\n \"options\": {}\n }\n ],\n \"type\": \"timeseries\",\n \"version\": \"3.0.0\"\n },\n {\n \"custom\": {\n \"drawStyle\": \"lines\",\n \"fillOpacity\": 0.3,\n \"gradientMode\": \"opacity\",\n \"lineInterpolation\": \"linear\",\n \"lineWidth\": 2,\n \"scaleDistribution\": {\n \"type\": \"linear\"\n },\n \"spanNulls\": false,\n \"stack\": \"off\"\n },\n \"datasourceCate\": \"prometheus\",\n \"datasourceValue\": \"${tidb_datasource}\",\n \"description\": \"The CPU utilization of the unified read pool\",\n \"id\": \"189a88d9-5aac-4855-a427-45adc353a5fa\",\n \"layout\": {\n \"h\": 7,\n \"i\": \"189a88d9-5aac-4855-a427-45adc353a5fa\",\n \"isResizable\": true,\n \"w\": 12,\n \"x\": 12,\n \"y\": 280\n },\n \"links\": [],\n \"name\": \"Unified read pool CPU(%)\",\n \"options\": {\n \"legend\": {\n \"displayMode\": \"hidden\"\n },\n \"standardOptions\": {},\n \"thresholds\": {\n \"steps\": [\n {\n \"color\": \"#634CD9\",\n \"type\": \"base\",\n \"value\": null\n }\n ]\n },\n \"tooltip\": {\n \"mode\": \"all\",\n \"sort\": \"desc\"\n }\n },\n \"targets\": [\n {\n \"expr\": \"sum(rate(tikv_thread_cpu_seconds_total{k8s_cluster=\\\"$k8s_cluster\\\", tidb_cluster=\\\"$tidb_cluster\\\", instance=~\\\"$tikv_instance\\\", name=~\\\"unified_read_po*\\\"}[1m])) by (instance)*100\",\n \"legend\": \"{{instance}}\",\n \"refId\": \"A\"\n }\n ],\n \"transformations\": [\n {\n \"id\": \"organize\",\n \"options\": {}\n }\n ],\n \"type\": \"timeseries\",\n \"version\": \"3.0.0\"\n },\n {\n \"custom\": {\n \"drawStyle\": \"lines\",\n \"fillOpacity\": 0.3,\n \"gradientMode\": \"opacity\",\n \"lineInterpolation\": \"linear\",\n \"lineWidth\": 2,\n \"scaleDistribution\": {\n \"type\": \"linear\"\n },\n \"spanNulls\": false,\n \"stack\": \"off\"\n },\n \"datasourceCate\": \"prometheus\",\n \"datasourceValue\": \"${tidb_datasource}\",\n \"id\": \"6149705b-aa38-49a7-83b4-430e0ae4e193\",\n \"layout\": {\n \"h\": 8,\n \"i\": \"6149705b-aa38-49a7-83b4-430e0ae4e193\",\n \"isResizable\": true,\n \"w\": 12,\n \"x\": 0,\n \"y\": 287\n },\n \"links\": [],\n \"name\": \"CPU(%)\",\n \"options\": {\n \"legend\": {\n \"displayMode\": \"hidden\"\n },\n \"standardOptions\": {},\n \"thresholds\": {\n \"steps\": [\n {\n \"color\": \"#634CD9\",\n \"type\": \"base\",\n \"value\": null\n }\n ]\n },\n \"tooltip\": {\n \"mode\": \"all\",\n \"sort\": \"desc\"\n }\n },\n \"targets\": [\n {\n \"expr\": \"sum(rate(tikv_thread_cpu_seconds_total{k8s_cluster=\\\"$k8s_cluster\\\", tidb_cluster=\\\"$tidb_cluster\\\",instance=~\\\"$tikv_instance\\\", job=\\\"tikv\\\"}[1m])) by (instance)*100\",\n \"legend\": \"{{instance}}\",\n \"refId\": \"A\"\n }\n ],\n \"transformations\": [\n {\n \"id\": \"organize\",\n \"options\": {}\n }\n ],\n \"type\": \"timeseries\",\n \"version\": \"3.0.0\"\n },\n {\n \"custom\": {\n \"drawStyle\": \"lines\",\n \"fillOpacity\": 0.3,\n \"gradientMode\": \"opacity\",\n \"lineInterpolation\": \"linear\",\n \"lineWidth\": 2,\n \"scaleDistribution\": {\n \"type\": \"linear\"\n },\n \"spanNulls\": false,\n \"stack\": \"off\"\n },\n \"datasourceCate\": \"prometheus\",\n \"datasourceValue\": \"${tidb_datasource}\",\n \"id\": \"80304baf-0534-4799-b093-571ec11c7e5a\",\n \"layout\": {\n \"h\": 8,\n \"i\": \"80304baf-0534-4799-b093-571ec11c7e5a\",\n \"isResizable\": true,\n \"w\": 12,\n \"x\": 12,\n \"y\": 287\n },\n \"links\": [],\n \"name\": \"Memory\",\n \"options\": {\n \"legend\": {\n \"displayMode\": \"hidden\"\n },\n \"standardOptions\": {\n \"util\": \"bytesIEC\"\n },\n \"thresholds\": {\n \"steps\": [\n {\n \"color\": \"#634CD9\",\n \"type\": \"base\",\n \"value\": null\n }\n ]\n },\n \"tooltip\": {\n \"mode\": \"all\",\n \"sort\": \"desc\"\n }\n },\n \"targets\": [\n {\n \"expr\": \"avg(process_resident_memory_bytes{k8s_cluster=\\\"$k8s_cluster\\\", tidb_cluster=\\\"$tidb_cluster\\\",instance=~\\\"$tikv_instance\\\", job=\\\"tikv\\\"}) by (instance)\",\n \"legend\": \"{{instance}}\",\n \"refId\": \"A\"\n }\n ],\n \"transformations\": [\n {\n \"id\": \"organize\",\n \"options\": {}\n }\n ],\n \"type\": \"timeseries\",\n \"version\": \"3.0.0\"\n },\n {\n \"collapsed\": true,\n \"datasourceCate\": \"prometheus\",\n \"datasourceValue\": \"${tidb_datasource}\",\n \"id\": \"74a0ec87-31c6-4f6c-a0b3-912583f276b0\",\n \"layout\": {\n \"h\": 1,\n \"i\": \"74a0ec87-31c6-4f6c-a0b3-912583f276b0\",\n \"isResizable\": false,\n \"w\": 24,\n \"x\": 0,\n \"y\": 318\n },\n \"name\": \"TiFlash\",\n \"panels\": [],\n \"type\": \"row\",\n \"version\": \"3.0.0\"\n },\n {\n \"custom\": {\n \"drawStyle\": \"lines\",\n \"fillOpacity\": 0.3,\n \"gradientMode\": \"opacity\",\n \"lineInterpolation\": \"linear\",\n \"lineWidth\": 2,\n \"scaleDistribution\": {\n \"type\": \"linear\"\n },\n \"spanNulls\": false,\n \"stack\": \"off\"\n },\n \"datasourceCate\": \"prometheus\",\n \"datasourceValue\": \"${tidb_datasource}\",\n \"id\": \"208123c5-6b6f-4b89-9c9e-53439840649f\",\n \"layout\": {\n \"h\": 7,\n \"i\": \"208123c5-6b6f-4b89-9c9e-53439840649f\",\n \"isResizable\": true,\n \"w\": 12,\n \"x\": 0,\n \"y\": 319\n },\n \"links\": [],\n \"name\": \"Request QPS\",\n \"options\": {\n \"legend\": {\n \"displayMode\": \"hidden\"\n },\n \"standardOptions\": {},\n \"thresholds\": {\n \"steps\": [\n {\n \"color\": \"#634CD9\",\n \"type\": \"base\",\n \"value\": null\n }\n ]\n },\n \"tooltip\": {\n \"mode\": \"all\",\n \"sort\": \"desc\"\n }\n },\n \"targets\": [\n {\n \"expr\": \"sum(rate(tiflash_coprocessor_request_count{k8s_cluster=\\\"$k8s_cluster\\\", tidb_cluster=\\\"$tidb_cluster\\\"}[1m])) by (type)\",\n \"legend\": \"{{type}}\",\n \"refId\": \"A\"\n }\n ],\n \"transformations\": [\n {\n \"id\": \"organize\",\n \"options\": {}\n }\n ],\n \"type\": \"timeseries\",\n \"version\": \"3.0.0\"\n },\n {\n \"custom\": {\n \"drawStyle\": \"lines\",\n \"fillOpacity\": 0.3,\n \"gradientMode\": \"opacity\",\n \"lineInterpolation\": \"linear\",\n \"lineWidth\": 2,\n \"scaleDistribution\": {\n \"type\": \"linear\"\n },\n \"spanNulls\": false,\n \"stack\": \"off\"\n },\n \"datasourceCate\": \"prometheus\",\n \"datasourceValue\": \"${tidb_datasource}\",\n \"id\": \"be97f8e3-f2f8-4c6e-bb22-aa06d9364f47\",\n \"layout\": {\n \"h\": 7,\n \"i\": \"be97f8e3-f2f8-4c6e-bb22-aa06d9364f47\",\n \"isResizable\": true,\n \"w\": 12,\n \"x\": 12,\n \"y\": 319\n },\n \"links\": [],\n \"name\": \"Executor QPS\",\n \"options\": {\n \"legend\": {\n \"displayMode\": \"hidden\"\n },\n \"standardOptions\": {},\n \"thresholds\": {\n \"steps\": [\n {\n \"color\": \"#634CD9\",\n \"type\": \"base\",\n \"value\": null\n }\n ]\n },\n \"tooltip\": {\n \"mode\": \"all\",\n \"sort\": \"desc\"\n }\n },\n \"targets\": [\n {\n \"expr\": \"sum(rate(tiflash_coprocessor_executor_count{k8s_cluster=\\\"$k8s_cluster\\\", tidb_cluster=\\\"$tidb_cluster\\\"}[1m])) by (type)\",\n \"legend\": \"{{type}}\",\n \"refId\": \"A\"\n }\n ],\n \"transformations\": [\n {\n \"id\": \"organize\",\n \"options\": {}\n }\n ],\n \"type\": \"timeseries\",\n \"version\": \"3.0.0\"\n },\n {\n \"custom\": {\n \"drawStyle\": \"lines\",\n \"fillOpacity\": 0.3,\n \"gradientMode\": \"opacity\",\n \"lineInterpolation\": \"linear\",\n \"lineWidth\": 2,\n \"scaleDistribution\": {\n \"type\": \"linear\"\n },\n \"spanNulls\": false,\n \"stack\": \"off\"\n },\n \"datasourceCate\": \"prometheus\",\n \"datasourceValue\": \"${tidb_datasource}\",\n \"id\": \"9b1a9996-01f9-45f8-9c33-5eabb4470ddf\",\n \"layout\": {\n \"h\": 7,\n \"i\": \"9b1a9996-01f9-45f8-9c33-5eabb4470ddf\",\n \"isResizable\": true,\n \"w\": 12,\n \"x\": 0,\n \"y\": 326\n },\n \"links\": [],\n \"name\": \"Request Duration\",\n \"options\": {\n \"legend\": {\n \"displayMode\": \"hidden\"\n },\n \"standardOptions\": {\n \"util\": \"seconds\"\n },\n \"thresholds\": {\n \"steps\": [\n {\n \"color\": \"#634CD9\",\n \"type\": \"base\",\n \"value\": null\n }\n ]\n },\n \"tooltip\": {\n \"mode\": \"all\",\n \"sort\": \"desc\"\n }\n },\n \"targets\": [\n {\n \"expr\": \"histogram_quantile(0.999, sum(rate(tiflash_coprocessor_request_duration_seconds_bucket{k8s_cluster=\\\"$k8s_cluster\\\", tidb_cluster=\\\"$tidb_cluster\\\"}[1m])) by (le))\",\n \"legend\": \"999\",\n \"refId\": \"A\"\n },\n {\n \"expr\": \"histogram_quantile(0.99, sum(rate(tiflash_coprocessor_request_duration_seconds_bucket{k8s_cluster=\\\"$k8s_cluster\\\", tidb_cluster=\\\"$tidb_cluster\\\"}[1m])) by (le))\",\n \"legend\": \"99\",\n \"refId\": \"B\"\n },\n {\n \"expr\": \"histogram_quantile(0.95, sum(rate(tiflash_coprocessor_request_duration_seconds_bucket{k8s_cluster=\\\"$k8s_cluster\\\", tidb_cluster=\\\"$tidb_cluster\\\"}[1m])) by (le))\",\n \"legend\": \"95\",\n \"refId\": \"C\"\n },\n {\n \"expr\": \"histogram_quantile(0.80, sum(rate(tiflash_coprocessor_request_duration_seconds_bucket{k8s_cluster=\\\"$k8s_cluster\\\", tidb_cluster=\\\"$tidb_cluster\\\"}[1m])) by (le))\",\n \"legend\": \"80\",\n \"refId\": \"D\"\n }\n ],\n \"transformations\": [\n {\n \"id\": \"organize\",\n \"options\": {}\n }\n ],\n \"type\": \"timeseries\",\n \"version\": \"3.0.0\"\n },\n {\n \"custom\": {\n \"drawStyle\": \"lines\",\n \"fillOpacity\": 0.3,\n \"gradientMode\": \"opacity\",\n \"lineInterpolation\": \"linear\",\n \"lineWidth\": 2,\n \"scaleDistribution\": {\n \"type\": \"linear\"\n },\n \"spanNulls\": false,\n \"stack\": \"off\"\n },\n \"datasourceCate\": \"prometheus\",\n \"datasourceValue\": \"${tidb_datasource}\",\n \"id\": \"ac51b582-b174-40de-8105-674086eca665\",\n \"layout\": {\n \"h\": 7,\n \"i\": \"ac51b582-b174-40de-8105-674086eca665\",\n \"isResizable\": true,\n \"w\": 12,\n \"x\": 12,\n \"y\": 326\n },\n \"links\": [],\n \"name\": \"Error QPS\",\n \"options\": {\n \"legend\": {\n \"displayMode\": \"hidden\"\n },\n \"standardOptions\": {},\n \"thresholds\": {\n \"steps\": [\n {\n \"color\": \"#634CD9\",\n \"type\": \"base\",\n \"value\": null\n }\n ]\n },\n \"tooltip\": {\n \"mode\": \"all\",\n \"sort\": \"desc\"\n }\n },\n \"targets\": [\n {\n \"expr\": \"sum(rate(tiflash_coprocessor_request_error{k8s_cluster=\\\"$k8s_cluster\\\", tidb_cluster=\\\"$tidb_cluster\\\"}[1m])) by (reason)\",\n \"legend\": \"{{reason}}\",\n \"refId\": \"A\"\n }\n ],\n \"transformations\": [\n {\n \"id\": \"organize\",\n \"options\": {}\n }\n ],\n \"type\": \"timeseries\",\n \"version\": \"3.0.0\"\n },\n {\n \"custom\": {\n \"drawStyle\": \"lines\",\n \"fillOpacity\": 0.3,\n \"gradientMode\": \"opacity\",\n \"lineInterpolation\": \"linear\",\n \"lineWidth\": 2,\n \"scaleDistribution\": {\n \"type\": \"linear\"\n },\n \"spanNulls\": false,\n \"stack\": \"off\"\n },\n \"datasourceCate\": \"prometheus\",\n \"datasourceValue\": \"${tidb_datasource}\",\n \"description\": \"TiFlash CPU usage calculated with process CPU running seconds.\",\n \"id\": \"fc9eee95-22d3-4273-8750-4fea4ec7db64\",\n \"layout\": {\n \"h\": 7,\n \"i\": \"fc9eee95-22d3-4273-8750-4fea4ec7db64\",\n \"isResizable\": true,\n \"w\": 12,\n \"x\": 0,\n \"y\": 333\n },\n \"links\": [],\n \"name\": \"CPU Usage(%)\",\n \"options\": {\n \"legend\": {\n \"displayMode\": \"hidden\"\n },\n \"standardOptions\": {},\n \"thresholds\": {\n \"steps\": [\n {\n \"color\": \"#634CD9\",\n \"type\": \"base\",\n \"value\": null\n }\n ]\n },\n \"tooltip\": {\n \"mode\": \"all\",\n \"sort\": \"desc\"\n }\n },\n \"targets\": [\n {\n \"expr\": \"rate(tiflash_proxy_process_cpu_seconds_total{k8s_cluster=\\\"$k8s_cluster\\\", tidb_cluster=\\\"$tidb_cluster\\\", job=\\\"tiflash\\\"}[1m])*100\",\n \"legend\": \"{{instance}}\",\n \"refId\": \"A\"\n }\n ],\n \"transformations\": [\n {\n \"id\": \"organize\",\n \"options\": {}\n }\n ],\n \"type\": \"timeseries\",\n \"version\": \"3.0.0\"\n },\n {\n \"custom\": {\n \"drawStyle\": \"lines\",\n \"fillOpacity\": 0.3,\n \"gradientMode\": \"opacity\",\n \"lineInterpolation\": \"linear\",\n \"lineWidth\": 2,\n \"scaleDistribution\": {\n \"type\": \"linear\"\n },\n \"spanNulls\": false,\n \"stack\": \"off\"\n },\n \"datasourceCate\": \"prometheus\",\n \"datasourceValue\": \"${tidb_datasource}\",\n \"description\": \"The memory usage per TiFlash instance\",\n \"id\": \"5f8b7d63-84a9-44ce-82d7-8499a50f1acf\",\n \"layout\": {\n \"h\": 7,\n \"i\": \"5f8b7d63-84a9-44ce-82d7-8499a50f1acf\",\n \"isResizable\": true,\n \"w\": 12,\n \"x\": 12,\n \"y\": 333\n },\n \"links\": [],\n \"name\": \"Memory\",\n \"options\": {\n \"legend\": {\n \"displayMode\": \"hidden\"\n },\n \"standardOptions\": {\n \"util\": \"bytesIEC\"\n },\n \"thresholds\": {\n \"steps\": [\n {\n \"color\": \"#634CD9\",\n \"type\": \"base\",\n \"value\": null\n }\n ]\n },\n \"tooltip\": {\n \"mode\": \"all\",\n \"sort\": \"desc\"\n }\n },\n \"targets\": [\n {\n \"expr\": \"tiflash_proxy_process_resident_memory_bytes{k8s_cluster=\\\"$k8s_cluster\\\", tidb_cluster=\\\"$tidb_cluster\\\", job=\\\"tiflash\\\"}\",\n \"legend\": \"{{instance}}\",\n \"refId\": \"K\"\n }\n ],\n \"transformations\": [\n {\n \"id\": \"organize\",\n \"options\": {}\n }\n ],\n \"type\": \"timeseries\",\n \"version\": \"3.0.0\"\n },\n {\n \"collapsed\": true,\n \"datasourceCate\": \"prometheus\",\n \"datasourceValue\": \"${tidb_datasource}\",\n \"id\": \"ce791748-16dc-42fc-863e-420676b78a20\",\n \"layout\": {\n \"h\": 1,\n \"i\": \"ce791748-16dc-42fc-863e-420676b78a20\",\n \"isResizable\": false,\n \"w\": 24,\n \"x\": 0,\n \"y\": 361\n },\n \"name\": \"Replication\",\n \"panels\": [],\n \"type\": \"row\",\n \"version\": \"3.0.0\"\n },\n {\n \"custom\": {\n \"drawStyle\": \"lines\",\n \"fillOpacity\": 0.3,\n \"gradientMode\": \"opacity\",\n \"lineInterpolation\": \"linear\",\n \"lineWidth\": 2,\n \"scaleDistribution\": {\n \"type\": \"linear\"\n },\n \"spanNulls\": false,\n \"stack\": \"off\"\n },\n \"datasourceCate\": \"prometheus\",\n \"datasourceValue\": \"${tidb_datasource}\",\n \"id\": \"6bfc7d33-d7e8-4c23-987d-bd90a18f4486\",\n \"layout\": {\n \"h\": 7,\n \"i\": \"6bfc7d33-d7e8-4c23-987d-bd90a18f4486\",\n \"isResizable\": true,\n \"w\": 12,\n \"x\": 0,\n \"y\": 362\n },\n \"links\": [],\n \"name\": \"Drainer Checkpoint TSO\",\n \"options\": {\n \"legend\": {\n \"displayMode\": \"hidden\"\n },\n \"standardOptions\": {\n \"util\": \"datetimeMilliseconds\"\n },\n \"thresholds\": {\n \"steps\": [\n {\n \"color\": \"#634CD9\",\n \"type\": \"base\",\n \"value\": null\n }\n ]\n },\n \"tooltip\": {\n \"mode\": \"all\",\n \"sort\": \"desc\"\n }\n },\n \"targets\": [\n {\n \"expr\": \"binlog_drainer_checkpoint_tso{}\",\n \"legend\": \"drainer-{{instance}}\",\n \"refId\": \"A\"\n },\n {\n \"expr\": \"max(pd_cluster_tso{k8s_cluster=\\\"$k8s_cluster\\\", tidb_cluster=\\\"$tidb_cluster\\\"})\",\n \"legend\": \"approximate current time (s)\",\n \"refId\": \"B\"\n }\n ],\n \"transformations\": [\n {\n \"id\": \"organize\",\n \"options\": {}\n }\n ],\n \"type\": \"timeseries\",\n \"version\": \"3.0.0\"\n },\n {\n \"custom\": {\n \"drawStyle\": \"lines\",\n \"fillOpacity\": 0.3,\n \"gradientMode\": \"opacity\",\n \"lineInterpolation\": \"linear\",\n \"lineWidth\": 2,\n \"scaleDistribution\": {\n \"type\": \"linear\"\n },\n \"spanNulls\": false,\n \"stack\": \"off\"\n },\n \"datasourceCate\": \"prometheus\",\n \"datasourceValue\": \"${tidb_datasource}\",\n \"id\": \"35128ec8-f870-42bb-b2b9-ebb50de5a75d\",\n \"layout\": {\n \"h\": 7,\n \"i\": \"35128ec8-f870-42bb-b2b9-ebb50de5a75d\",\n \"isResizable\": true,\n \"w\": 12,\n \"x\": 12,\n \"y\": 362\n },\n \"links\": [],\n \"name\": \"TiDB Server Skip Binlog Count\",\n \"options\": {\n \"legend\": {\n \"displayMode\": \"hidden\"\n },\n \"standardOptions\": {},\n \"thresholds\": {\n \"steps\": [\n {\n \"color\": \"#634CD9\",\n \"type\": \"base\",\n \"value\": null\n }\n ]\n },\n \"tooltip\": {\n \"mode\": \"all\",\n \"sort\": \"desc\"\n }\n },\n \"targets\": [\n {\n \"expr\": \"tidb_server_critical_error_total\",\n \"legend\": \"{{instance}}\",\n \"refId\": \"A\"\n }\n ],\n \"transformations\": [\n {\n \"id\": \"organize\",\n \"options\": {}\n }\n ],\n \"type\": \"timeseries\",\n \"version\": \"3.0.0\"\n },\n {\n \"custom\": {\n \"drawStyle\": \"lines\",\n \"fillOpacity\": 0.3,\n \"gradientMode\": \"opacity\",\n \"lineInterpolation\": \"linear\",\n \"lineWidth\": 2,\n \"scaleDistribution\": {\n \"type\": \"linear\"\n },\n \"spanNulls\": false,\n \"stack\": \"off\"\n },\n \"datasourceCate\": \"prometheus\",\n \"datasourceValue\": \"${tidb_datasource}\",\n \"description\": \"The checkpoint ts of changefeeds.\",\n \"id\": \"fb2e0749-6d67-44e6-a8ca-756fba222d7d\",\n \"layout\": {\n \"h\": 7,\n \"i\": \"fb2e0749-6d67-44e6-a8ca-756fba222d7d\",\n \"isResizable\": true,\n \"w\": 12,\n \"x\": 0,\n \"y\": 369\n },\n \"links\": [],\n \"name\": \"CDC Changefeed checkpoint\",\n \"options\": {\n \"legend\": {\n \"displayMode\": \"hidden\"\n },\n \"standardOptions\": {\n \"util\": \"datetimeMilliseconds\"\n },\n \"thresholds\": {\n \"steps\": [\n {\n \"color\": \"#634CD9\",\n \"type\": \"base\",\n \"value\": null\n }\n ]\n },\n \"tooltip\": {\n \"mode\": \"all\",\n \"sort\": \"desc\"\n }\n },\n \"targets\": [\n {\n \"expr\": \"max(pd_cluster_tso{k8s_cluster=\\\"$k8s_cluster\\\", tidb_cluster=\\\"$tidb_cluster\\\"})\",\n \"legend\": \"approximate current time (s)\",\n \"refId\": \"A\"\n },\n {\n \"expr\": \"max(ticdc_owner_checkpoint_ts{k8s_cluster=\\\"$k8s_cluster\\\", tidb_cluster=\\\"$tidb_cluster\\\"}) by (changefeed)\",\n \"legend\": \"{{changefeed}}\",\n \"refId\": \"B\"\n },\n {\n \"expr\": \"max(ticdc_processor_checkpoint_ts{k8s_cluster=\\\"$k8s_cluster\\\", tidb_cluster=\\\"$tidb_cluster\\\"}) by (instance, changefeed)\",\n \"legend\": \"{{instance}}-{{changefeed}}\",\n \"refId\": \"C\"\n },\n {\n \"expr\": \"max(ticdc_owner_barrier_ts{k8s_cluster=\\\"$k8s_cluster\\\", tidb_cluster=\\\"$tidb_cluster\\\"}) by (changefeed)\",\n \"legend\": \"{{changefeed}}-barrierTs\",\n \"refId\": \"D\"\n }\n ],\n \"transformations\": [\n {\n \"id\": \"organize\",\n \"options\": {}\n }\n ],\n \"type\": \"timeseries\",\n \"version\": \"3.0.0\"\n },\n {\n \"collapsed\": true,\n \"datasourceCate\": \"prometheus\",\n \"datasourceValue\": \"${tidb_datasource}\",\n \"id\": \"79da928c-64c4-4e1a-86c0-73c7e69bf0a0\",\n \"layout\": {\n \"h\": 1,\n \"i\": \"79da928c-64c4-4e1a-86c0-73c7e69bf0a0\",\n \"isResizable\": false,\n \"w\": 24,\n \"x\": 0,\n \"y\": 390\n },\n \"name\": \"System Info\",\n \"panels\": [],\n \"type\": \"row\",\n \"version\": \"3.0.0\"\n },\n {\n \"custom\": {\n \"calc\": \"lastNotNull\",\n \"colorDomain\": [\n 1,\n 99999999999\n ],\n \"colorDomainAuto\": false,\n \"colorRange\": [\n \"#83c898\",\n \"#c2c2c2\",\n \"#fc653f\"\n ],\n \"reverseColorOrder\": false,\n \"textMode\": \"valueAndName\"\n },\n \"datasourceCate\": \"prometheus\",\n \"datasourceValue\": \"${tidb_datasource}\",\n \"id\": \"b1552049-e2fe-4994-8475-daf6933d092f\",\n \"layout\": {\n \"h\": 5,\n \"i\": \"b1552049-e2fe-4994-8475-daf6933d092f\",\n \"isResizable\": true,\n \"w\": 6,\n \"x\": 0,\n \"y\": 391\n },\n \"links\": [],\n \"name\": \"Vcores\",\n \"options\": {\n \"standardOptions\": {}\n },\n \"targets\": [\n {\n \"expr\": \"count(node_cpu_seconds_total{k8s_cluster=\\\"$k8s_cluster\\\", tidb_cluster=\\\"$tidb_cluster\\\", mode=\\\"user\\\"}) by (instance)\",\n \"legend\": \"{{ instance }}\",\n \"refId\": \"A\"\n }\n ],\n \"transformations\": [\n {\n \"id\": \"organize\",\n \"options\": {}\n }\n ],\n \"type\": \"hexbin\",\n \"version\": \"3.0.0\"\n },\n {\n \"custom\": {\n \"calc\": \"lastNotNull\",\n \"colorDomain\": [\n 1,\n 900000000000000000\n ],\n \"colorDomainAuto\": false,\n \"colorRange\": [\n \"#83c898\",\n \"#c2c2c2\",\n \"#fc653f\"\n ],\n \"reverseColorOrder\": false,\n \"textMode\": \"valueAndName\"\n },\n \"datasourceCate\": \"prometheus\",\n \"datasourceValue\": \"${tidb_datasource}\",\n \"id\": \"5b20c6c9-3985-468c-ac2f-f685a5b3cbad\",\n \"layout\": {\n \"h\": 5,\n \"i\": \"5b20c6c9-3985-468c-ac2f-f685a5b3cbad\",\n \"isResizable\": true,\n \"w\": 6,\n \"x\": 6,\n \"y\": 391\n },\n \"links\": [],\n \"name\": \"Memory\",\n \"options\": {\n \"standardOptions\": {\n \"util\": \"bytesIEC\"\n }\n },\n \"targets\": [\n {\n \"expr\": \"node_memory_MemTotal_bytes{k8s_cluster=\\\"$k8s_cluster\\\", tidb_cluster=\\\"$tidb_cluster\\\"}\",\n \"legend\": \"{{ instance }}\",\n \"refId\": \"A\"\n }\n ],\n \"transformations\": [\n {\n \"id\": \"organize\",\n \"options\": {}\n }\n ],\n \"type\": \"hexbin\",\n \"version\": \"3.0.0\"\n },\n {\n \"custom\": {\n \"drawStyle\": \"lines\",\n \"fillOpacity\": 0.3,\n \"gradientMode\": \"opacity\",\n \"lineInterpolation\": \"linear\",\n \"lineWidth\": 2,\n \"scaleDistribution\": {\n \"type\": \"linear\"\n },\n \"spanNulls\": false,\n \"stack\": \"off\"\n },\n \"datasourceCate\": \"prometheus\",\n \"datasourceValue\": \"${tidb_datasource}\",\n \"id\": \"677c3bf1-d593-445f-8313-b45a99017b8d\",\n \"layout\": {\n \"h\": 5,\n \"i\": \"677c3bf1-d593-445f-8313-b45a99017b8d\",\n \"isResizable\": true,\n \"w\": 12,\n \"x\": 12,\n \"y\": 391\n },\n \"links\": [],\n \"name\": \"CPU Usage(%)\",\n \"options\": {\n \"legend\": {\n \"displayMode\": \"hidden\"\n },\n \"standardOptions\": {},\n \"thresholds\": {\n \"steps\": [\n {\n \"color\": \"#634CD9\",\n \"type\": \"base\",\n \"value\": null\n }\n ]\n },\n \"tooltip\": {\n \"mode\": \"all\",\n \"sort\": \"desc\"\n }\n },\n \"targets\": [\n {\n \"expr\": \"100 - avg by (instance) (irate(node_cpu_seconds_total{k8s_cluster=\\\"$k8s_cluster\\\", tidb_cluster=\\\"$tidb_cluster\\\", mode=\\\"idle\\\"}[1m]) ) * 100\",\n \"legend\": \"{{instance}}\",\n \"refId\": \"A\"\n }\n ],\n \"transformations\": [\n {\n \"id\": \"organize\",\n \"options\": {}\n }\n ],\n \"type\": \"timeseries\",\n \"version\": \"3.0.0\"\n },\n {\n \"custom\": {\n \"drawStyle\": \"lines\",\n \"fillOpacity\": 0.3,\n \"gradientMode\": \"opacity\",\n \"lineInterpolation\": \"linear\",\n \"lineWidth\": 2,\n \"scaleDistribution\": {\n \"type\": \"linear\"\n },\n \"spanNulls\": false,\n \"stack\": \"off\"\n },\n \"datasourceCate\": \"prometheus\",\n \"datasourceValue\": \"${tidb_datasource}\",\n \"id\": \"f7da66ec-80be-4c66-b99b-f0fc38d64e31\",\n \"layout\": {\n \"h\": 5,\n \"i\": \"f7da66ec-80be-4c66-b99b-f0fc38d64e31\",\n \"isResizable\": true,\n \"w\": 12,\n \"x\": 0,\n \"y\": 396\n },\n \"links\": [],\n \"name\": \"Load [1m]\",\n \"options\": {\n \"legend\": {\n \"displayMode\": \"hidden\"\n },\n \"standardOptions\": {},\n \"thresholds\": {\n \"steps\": [\n {\n \"color\": \"#634CD9\",\n \"type\": \"base\",\n \"value\": null\n }\n ]\n },\n \"tooltip\": {\n \"mode\": \"all\",\n \"sort\": \"desc\"\n }\n },\n \"targets\": [\n {\n \"expr\": \"node_load1{k8s_cluster=\\\"$k8s_cluster\\\", tidb_cluster=\\\"$tidb_cluster\\\"}\",\n \"legend\": \"{{instance}}\",\n \"refId\": \"A\"\n }\n ],\n \"transformations\": [\n {\n \"id\": \"organize\",\n \"options\": {}\n }\n ],\n \"type\": \"timeseries\",\n \"version\": \"3.0.0\"\n },\n {\n \"custom\": {\n \"drawStyle\": \"lines\",\n \"fillOpacity\": 0.3,\n \"gradientMode\": \"opacity\",\n \"lineInterpolation\": \"linear\",\n \"lineWidth\": 2,\n \"scaleDistribution\": {\n \"type\": \"linear\"\n },\n \"spanNulls\": false,\n \"stack\": \"off\"\n },\n \"datasourceCate\": \"prometheus\",\n \"datasourceValue\": \"${tidb_datasource}\",\n \"id\": \"d61da9f0-0f8d-4012-b419-275de5d61cc1\",\n \"layout\": {\n \"h\": 5,\n \"i\": \"d61da9f0-0f8d-4012-b419-275de5d61cc1\",\n \"isResizable\": true,\n \"w\": 12,\n \"x\": 12,\n \"y\": 396\n },\n \"links\": [],\n \"name\": \"Memory Available\",\n \"options\": {\n \"legend\": {\n \"displayMode\": \"hidden\"\n },\n \"standardOptions\": {\n \"util\": \"bytesSI\"\n },\n \"thresholds\": {\n \"steps\": [\n {\n \"color\": \"#634CD9\",\n \"type\": \"base\",\n \"value\": null\n }\n ]\n },\n \"tooltip\": {\n \"mode\": \"all\",\n \"sort\": \"desc\"\n }\n },\n \"targets\": [\n {\n \"expr\": \"node_memory_MemAvailable_bytes{k8s_cluster=\\\"$k8s_cluster\\\", tidb_cluster=\\\"$tidb_cluster\\\"}\",\n \"legend\": \"{{ instance }}\",\n \"refId\": \"A\"\n }\n ],\n \"transformations\": [\n {\n \"id\": \"organize\",\n \"options\": {}\n }\n ],\n \"type\": \"timeseries\",\n \"version\": \"3.0.0\"\n },\n {\n \"custom\": {\n \"drawStyle\": \"lines\",\n \"fillOpacity\": 0.3,\n \"gradientMode\": \"opacity\",\n \"lineInterpolation\": \"linear\",\n \"lineWidth\": 2,\n \"scaleDistribution\": {\n \"type\": \"linear\"\n },\n \"spanNulls\": false,\n \"stack\": \"off\"\n },\n \"datasourceCate\": \"prometheus\",\n \"datasourceValue\": \"${tidb_datasource}\",\n \"id\": \"84e5094f-f60f-4fe5-a79f-20ad9f816428\",\n \"layout\": {\n \"h\": 5,\n \"i\": \"84e5094f-f60f-4fe5-a79f-20ad9f816428\",\n \"isResizable\": true,\n \"w\": 12,\n \"x\": 0,\n \"y\": 401\n },\n \"links\": [],\n \"name\": \"Network Traffic\",\n \"options\": {\n \"legend\": {\n \"displayMode\": \"hidden\"\n },\n \"standardOptions\": {\n \"util\": \"bytesIEC\"\n },\n \"thresholds\": {\n \"steps\": [\n {\n \"color\": \"#634CD9\",\n \"type\": \"base\",\n \"value\": null\n }\n ]\n },\n \"tooltip\": {\n \"mode\": \"all\",\n \"sort\": \"desc\"\n }\n },\n \"targets\": [\n {\n \"expr\": \"irate(node_network_receive_bytes_total{k8s_cluster=\\\"$k8s_cluster\\\", tidb_cluster=\\\"$tidb_cluster\\\", device!=\\\"lo\\\"}[5m])\",\n \"legend\": \"Inbound: {{instance}}-{{device}}\",\n \"refId\": \"A\"\n },\n {\n \"expr\": \"irate(node_network_transmit_bytes_total{k8s_cluster=\\\"$k8s_cluster\\\", tidb_cluster=\\\"$tidb_cluster\\\", device!=\\\"lo\\\"}[5m])\",\n \"legend\": \"Outbound: {{instance}}-{{device}}\",\n \"refId\": \"B\"\n }\n ],\n \"transformations\": [\n {\n \"id\": \"organize\",\n \"options\": {}\n }\n ],\n \"type\": \"timeseries\",\n \"version\": \"3.0.0\"\n },\n {\n \"custom\": {\n \"drawStyle\": \"lines\",\n \"fillOpacity\": 0.3,\n \"gradientMode\": \"opacity\",\n \"lineInterpolation\": \"linear\",\n \"lineWidth\": 2,\n \"scaleDistribution\": {\n \"type\": \"linear\"\n },\n \"spanNulls\": false,\n \"stack\": \"off\"\n },\n \"datasourceCate\": \"prometheus\",\n \"datasourceValue\": \"${tidb_datasource}\",\n \"id\": \"f2625015-e8d4-4a63-8bdb-deb99a76c331\",\n \"layout\": {\n \"h\": 5,\n \"i\": \"f2625015-e8d4-4a63-8bdb-deb99a76c331\",\n \"isResizable\": true,\n \"w\": 12,\n \"x\": 12,\n \"y\": 401\n },\n \"links\": [],\n \"name\": \"TCP Retrans\",\n \"options\": {\n \"legend\": {\n \"displayMode\": \"hidden\"\n },\n \"standardOptions\": {},\n \"thresholds\": {\n \"steps\": [\n {\n \"color\": \"#634CD9\",\n \"type\": \"base\",\n \"value\": null\n }\n ]\n },\n \"tooltip\": {\n \"mode\": \"all\",\n \"sort\": \"desc\"\n }\n },\n \"targets\": [\n {\n \"expr\": \"irate(node_netstat_Tcp_RetransSegs{k8s_cluster=\\\"$k8s_cluster\\\", tidb_cluster=\\\"$tidb_cluster\\\"}[1m])\",\n \"legend\": \"{{instance}} - TCPSlowStartRetrans\",\n \"refId\": \"B\"\n }\n ],\n \"transformations\": [\n {\n \"id\": \"organize\",\n \"options\": {}\n }\n ],\n \"type\": \"timeseries\",\n \"version\": \"3.0.0\"\n },\n {\n \"custom\": {\n \"drawStyle\": \"lines\",\n \"fillOpacity\": 0.3,\n \"gradientMode\": \"opacity\",\n \"lineInterpolation\": \"linear\",\n \"lineWidth\": 2,\n \"scaleDistribution\": {\n \"type\": \"linear\"\n },\n \"spanNulls\": false,\n \"stack\": \"off\"\n },\n \"datasourceCate\": \"prometheus\",\n \"datasourceValue\": \"${tidb_datasource}\",\n \"id\": \"3a15cdf1-596a-4329-b909-81dc1eda59fb\",\n \"layout\": {\n \"h\": 7,\n \"i\": \"3a15cdf1-596a-4329-b909-81dc1eda59fb\",\n \"isResizable\": true,\n \"w\": 24,\n \"x\": 0,\n \"y\": 406\n },\n \"links\": [],\n \"name\": \"IO Util(%)\",\n \"options\": {\n \"legend\": {\n \"displayMode\": \"hidden\"\n },\n \"standardOptions\": {},\n \"thresholds\": {\n \"steps\": [\n {\n \"color\": \"#634CD9\",\n \"type\": \"base\",\n \"value\": null\n }\n ]\n },\n \"tooltip\": {\n \"mode\": \"all\",\n \"sort\": \"desc\"\n }\n },\n \"targets\": [\n {\n \"expr\": \"irate(node_disk_io_time_seconds_total{k8s_cluster=\\\"$k8s_cluster\\\", tidb_cluster=\\\"$tidb_cluster\\\"}[1m])*100\",\n \"legend\": \"{{instance}} - {{device}}\",\n \"refId\": \"A\"\n }\n ],\n \"transformations\": [\n {\n \"id\": \"organize\",\n \"options\": {}\n }\n ],\n \"type\": \"timeseries\",\n \"version\": \"3.0.0\"\n }\n ],\n \"var\": [\n {\n \"definition\": \"prometheus\",\n \"hide\": true,\n \"name\": \"tidb_datasource\",\n \"type\": \"datasource\"\n },\n {\n \"datasource\": {\n \"cate\": \"prometheus\",\n \"value\": \"${tidb_datasource}\"\n },\n \"definition\": \"label_values(pd_cluster_status, k8s_cluster)\",\n \"hide\": true,\n \"name\": \"k8s_cluster\",\n \"type\": \"query\"\n },\n {\n \"datasource\": {\n \"cate\": \"prometheus\",\n \"value\": \"${tidb_datasource}\"\n },\n \"definition\": \"label_values(pd_cluster_status{k8s_cluster=\\\"$k8s_cluster\\\"}, tidb_cluster)\",\n \"hide\": true,\n \"multi\": false,\n \"name\": \"tidb_cluster\",\n \"reg\": \"\",\n \"type\": \"query\"\n },\n {\n \"datasource\": {\n \"cate\": \"prometheus\",\n \"value\": \"${tidb_datasource}\"\n },\n \"definition\": \"label_values(pd_cluster_status{k8s_cluster=\\\"$k8s_cluster\\\", tidb_cluster=\\\"$tidb_cluster\\\"}, instance)\",\n \"multi\": false,\n \"name\": \"pd_instance\",\n \"reg\": \"\",\n \"type\": \"query\"\n },\n {\n \"allOption\": true,\n \"datasource\": {\n \"cate\": \"prometheus\",\n \"value\": \"${tidb_datasource}\"\n },\n \"definition\": \"label_values(tidb_server_connections{k8s_cluster=\\\"$k8s_cluster\\\", tidb_cluster=\\\"$tidb_cluster\\\"}, instance)\",\n \"multi\": true,\n \"name\": \"tidb_instance\",\n \"reg\": \"\",\n \"type\": \"query\"\n },\n {\n \"allOption\": true,\n \"datasource\": {\n \"cate\": \"prometheus\",\n \"value\": \"${tidb_datasource}\"\n },\n \"definition\": \"label_values(tikv_engine_size_bytes{k8s_cluster=\\\"$k8s_cluster\\\", tidb_cluster=\\\"$tidb_cluster\\\"}, instance)\",\n \"multi\": true,\n \"name\": \"tikv_instance\",\n \"reg\": \"\",\n \"type\": \"query\"\n }\n ],\n \"version\": \"3.0.0\"\n },\n \"public\": 0,\n \"public_cate\": 0,\n \"bgids\": null,\n \"built_in\": 0,\n \"hide\": 0,\n \"uuid\": 1717556328428617000\n}"
},
{
"path": "integrations/Tomcat/collect/tomcat/tomcat.toml",
"content": "# # collect interval\n# interval = 15\n\n# Gather metrics from the Tomcat server status page.\n[[instances]]\n## URL of the Tomcat server status\n# url = \"http://127.0.0.1:8080/manager/status/all?XML=true\"\nurl = \"\"\n\n## HTTP Basic Auth Credentials\n# username = \"tomcat\"\n# password = \"s3cret\"\n\n## Request timeout\n# timeout = \"5s\"\n\n# # interval = global.interval * interval_times\n# interval_times = 1\n\n# important! use global unique string to specify instance\n# labels = { instance=\"192.168.1.2:8080\", url=\"-\" }\n\n## Optional TLS Config\n# use_tls = false\n# tls_min_version = \"1.2\"\n# tls_ca = \"/etc/categraf/ca.pem\"\n# tls_cert = \"/etc/categraf/cert.pem\"\n# tls_key = \"/etc/categraf/key.pem\"\n## Use TLS but skip chain & host verification\n# insecure_skip_verify = true\n"
},
{
"path": "integrations/Tomcat/dashboards/tomcat_by_categraf.json",
"content": "{\n \"id\": 0,\n \"group_id\": 0,\n \"name\": \"Tomcat - categraf\",\n \"ident\": \"\",\n \"tags\": \"Categraf\",\n \"create_at\": 0,\n \"create_by\": \"\",\n \"update_at\": 0,\n \"update_by\": \"\",\n \"configs\": {\n \"links\": [\n {\n \"targetBlank\": true,\n \"title\": \"n9e\",\n \"url\": \"https://n9e.gitee.io/\"\n }\n ],\n \"panels\": [\n {\n \"collapsed\": true,\n \"id\": \"cdc17d90-17f5-44b8-99a1-94764de61698\",\n \"layout\": {\n \"h\": 1,\n \"i\": \"cdc17d90-17f5-44b8-99a1-94764de61698\",\n \"w\": 24,\n \"x\": 0,\n \"y\": 0\n },\n \"name\": \"connector\",\n \"type\": \"row\"\n },\n {\n \"custom\": {\n \"drawStyle\": \"lines\",\n \"fillOpacity\": 0.3,\n \"gradientMode\": \"opacity\",\n \"lineInterpolation\": \"smooth\",\n \"lineWidth\": 2,\n \"stack\": \"off\"\n },\n \"datasourceCate\": \"prometheus\",\n \"datasourceValue\": \"${prom}\",\n \"id\": \"004b1408-dcfe-40e1-8910-a1f16a574a85\",\n \"layout\": {\n \"h\": 7,\n \"i\": \"004b1408-dcfe-40e1-8910-a1f16a574a85\",\n \"w\": 12,\n \"x\": 0,\n \"y\": 1\n },\n \"name\": \"Traffic Bytes / Second\",\n \"options\": {\n \"legend\": {\n \"displayMode\": \"hidden\"\n },\n \"standardOptions\": {\n \"util\": \"bytesIEC\"\n },\n \"thresholds\": {},\n \"tooltip\": {\n \"mode\": \"all\",\n \"sort\": \"desc\"\n }\n },\n \"targets\": [\n {\n \"expr\": \"rate(tomcat_connector_bytes_sent{instance=\\\"$instance\\\"}[1m])\",\n \"legend\": \"sent\",\n \"refId\": \"A\"\n },\n {\n \"expr\": \"rate(tomcat_connector_bytes_received{instance=\\\"$instance\\\"}[1m])\",\n \"legend\": \"received\",\n \"refId\": \"B\"\n }\n ],\n \"type\": \"timeseries\",\n \"version\": \"2.0.0\"\n },\n {\n \"custom\": {\n \"drawStyle\": \"lines\",\n \"fillOpacity\": 0.3,\n \"gradientMode\": \"opacity\",\n \"lineInterpolation\": \"smooth\",\n \"lineWidth\": 2,\n \"stack\": \"off\"\n },\n \"datasourceCate\": \"prometheus\",\n \"datasourceValue\": \"${prom}\",\n \"id\": \"010aabe0-9b60-4bf3-867e-b5773703090a\",\n \"layout\": {\n \"h\": 7,\n \"i\": \"010aabe0-9b60-4bf3-867e-b5773703090a\",\n \"w\": 12,\n \"x\": 12,\n \"y\": 1\n },\n \"name\": \"Request count / Second\",\n \"options\": {\n \"legend\": {\n \"displayMode\": \"hidden\"\n },\n \"standardOptions\": {},\n \"thresholds\": {},\n \"tooltip\": {\n \"mode\": \"all\",\n \"sort\": \"desc\"\n }\n },\n \"targets\": [\n {\n \"expr\": \"rate(tomcat_connector_request_count{instance=\\\"$instance\\\"}[1m])\",\n \"legend\": \"tomcat_connector_request_count\",\n \"refId\": \"A\"\n },\n {\n \"expr\": \"rate(tomcat_connector_error_count{instance=\\\"$instance\\\"}[1m])\",\n \"legend\": \"tomcat_connector_error_count\",\n \"refId\": \"B\"\n }\n ],\n \"type\": \"timeseries\",\n \"version\": \"2.0.0\"\n },\n {\n \"custom\": {\n \"drawStyle\": \"lines\",\n \"fillOpacity\": 0.3,\n \"gradientMode\": \"opacity\",\n \"lineInterpolation\": \"smooth\",\n \"lineWidth\": 2,\n \"stack\": \"off\"\n },\n \"datasourceCate\": \"prometheus\",\n \"datasourceValue\": \"${prom}\",\n \"description\": \"max_threads: The maximum number of allowed worker threads.\\ncurrent_thread_count: The number of threads managed by the thread pool\\ncurrent_threads_busy: The number of threads that are in use\",\n \"id\": \"40ea7316-46b9-4447-8e45-6b5acb77f0d2\",\n \"layout\": {\n \"h\": 7,\n \"i\": \"40ea7316-46b9-4447-8e45-6b5acb77f0d2\",\n \"w\": 12,\n \"x\": 0,\n \"y\": 3\n },\n \"name\": \"Tread\",\n \"options\": {\n \"legend\": {\n \"displayMode\": \"hidden\"\n },\n \"standardOptions\": {},\n \"thresholds\": {},\n \"tooltip\": {\n \"mode\": \"all\",\n \"sort\": \"desc\"\n }\n },\n \"targets\": [\n {\n \"expr\": \"tomcat_connector_max_threads{instance=\\\"$instance\\\"}\",\n \"legend\": \"max_threads\",\n \"refId\": \"A\"\n },\n {\n \"expr\": \"tomcat_connector_current_thread_count{instance=\\\"$instance\\\"}\",\n \"legend\": \"current_thread_count\",\n \"refId\": \"B\"\n },\n {\n \"expr\": \"tomcat_connector_current_threads_busy{instance=\\\"$instance\\\"}\",\n \"legend\": \"current_threads_busy\",\n \"refId\": \"C\"\n }\n ],\n \"type\": \"timeseries\",\n \"version\": \"2.0.0\"\n },\n {\n \"custom\": {\n \"drawStyle\": \"lines\",\n \"fillOpacity\": 0.3,\n \"gradientMode\": \"opacity\",\n \"lineInterpolation\": \"smooth\",\n \"lineWidth\": 2,\n \"stack\": \"off\"\n },\n \"datasourceCate\": \"prometheus\",\n \"datasourceValue\": \"${prom}\",\n \"id\": \"c99a33ea-53d1-464d-84aa-e7be9e15cfb1\",\n \"layout\": {\n \"h\": 7,\n \"i\": \"c99a33ea-53d1-464d-84aa-e7be9e15cfb1\",\n \"w\": 12,\n \"x\": 12,\n \"y\": 3\n },\n \"name\": \"Processing time\",\n \"options\": {\n \"legend\": {\n \"displayMode\": \"hidden\"\n },\n \"standardOptions\": {},\n \"thresholds\": {},\n \"tooltip\": {\n \"mode\": \"all\",\n \"sort\": \"none\"\n }\n },\n \"targets\": [\n {\n \"expr\": \"rate(tomcat_connector_processing_time{instance=\\\"$instance\\\"}[1m])\",\n \"legend\": \"{{name}}-processing_time\",\n \"refId\": \"A\"\n }\n ],\n \"type\": \"timeseries\",\n \"version\": \"2.0.0\"\n },\n {\n \"collapsed\": true,\n \"id\": \"1cca4a8b-9352-4d15-9488-ae3aee7b17e3\",\n \"layout\": {\n \"h\": 1,\n \"i\": \"1cca4a8b-9352-4d15-9488-ae3aee7b17e3\",\n \"w\": 24,\n \"x\": 0,\n \"y\": 10\n },\n \"name\": \"mem used\",\n \"type\": \"row\"\n },\n {\n \"custom\": {\n \"drawStyle\": \"lines\",\n \"fillOpacity\": 0.3,\n \"gradientMode\": \"opacity\",\n \"lineInterpolation\": \"smooth\",\n \"lineWidth\": 2,\n \"stack\": \"off\"\n },\n \"datasourceCate\": \"prometheus\",\n \"datasourceValue\": \"${prom}\",\n \"id\": \"07059834-fb32-4dfd-88cd-a3bad0203c79\",\n \"layout\": {\n \"h\": 7,\n \"i\": \"07059834-fb32-4dfd-88cd-a3bad0203c79\",\n \"w\": 24,\n \"x\": 0,\n \"y\": 11\n },\n \"name\": \"Mem Used\",\n \"options\": {\n \"legend\": {\n \"displayMode\": \"hidden\"\n },\n \"standardOptions\": {},\n \"thresholds\": {},\n \"tooltip\": {\n \"mode\": \"all\",\n \"sort\": \"desc\"\n }\n },\n \"targets\": [\n {\n \"expr\": \"tomcat_jvm_memory_max{instance=\\\"$instance\\\"}\",\n \"legend\": \"max\",\n \"refId\": \"A\"\n },\n {\n \"expr\": \"tomcat_jvm_memory_total{instance=\\\"$instance\\\"}\",\n \"legend\": \"used\",\n \"refId\": \"B\"\n },\n {\n \"expr\": \"tomcat_jvm_memory_free{instance=\\\"$instance\\\"}\",\n \"legend\": \"free\",\n \"refId\": \"C\"\n }\n ],\n \"type\": \"timeseries\",\n \"version\": \"2.0.0\"\n },\n {\n \"collapsed\": true,\n \"id\": \"6e07a88a-41b4-4fe2-b11f-0f5c8cb95d52\",\n \"layout\": {\n \"h\": 1,\n \"i\": \"6e07a88a-41b4-4fe2-b11f-0f5c8cb95d52\",\n \"w\": 24,\n \"x\": 0,\n \"y\": 18\n },\n \"name\": \"memorypool\",\n \"type\": \"row\"\n },\n {\n \"custom\": {\n \"drawStyle\": \"lines\",\n \"fillOpacity\": 0.3,\n \"gradientMode\": \"opacity\",\n \"lineInterpolation\": \"smooth\",\n \"lineWidth\": 2,\n \"stack\": \"off\"\n },\n \"datasourceCate\": \"prometheus\",\n \"datasourceValue\": \"${prom}\",\n \"id\": \"92d79cd5-7a53-4f29-a42a-34db741e3c62\",\n \"layout\": {\n \"h\": 7,\n \"i\": \"92d79cd5-7a53-4f29-a42a-34db741e3c62\",\n \"w\": 6,\n \"x\": 0,\n \"y\": 19\n },\n \"name\": \"Used\",\n \"options\": {\n \"legend\": {\n \"displayMode\": \"hidden\"\n },\n \"standardOptions\": {\n \"decimals\": 1,\n \"util\": \"bytesIEC\"\n },\n \"thresholds\": {},\n \"tooltip\": {\n \"mode\": \"all\",\n \"sort\": \"desc\"\n }\n },\n \"targets\": [\n {\n \"expr\": \"tomcat_jvm_memorypool_used{instance=\\\"$instance\\\"}\",\n \"legend\": \"{{name}}\",\n \"refId\": \"A\"\n }\n ],\n \"type\": \"timeseries\",\n \"version\": \"2.0.0\"\n },\n {\n \"custom\": {\n \"drawStyle\": \"lines\",\n \"fillOpacity\": 0.3,\n \"gradientMode\": \"opacity\",\n \"lineInterpolation\": \"smooth\",\n \"lineWidth\": 2,\n \"stack\": \"off\"\n },\n \"datasourceCate\": \"prometheus\",\n \"datasourceValue\": \"${prom}\",\n \"id\": \"c6aace01-4b13-45dd-87e2-fd73cc3e5a28\",\n \"layout\": {\n \"h\": 7,\n \"i\": \"c6aace01-4b13-45dd-87e2-fd73cc3e5a28\",\n \"w\": 6,\n \"x\": 6,\n \"y\": 19\n },\n \"name\": \"Max\",\n \"options\": {\n \"legend\": {\n \"displayMode\": \"hidden\"\n },\n \"standardOptions\": {\n \"decimals\": 1,\n \"util\": \"bytesIEC\"\n },\n \"thresholds\": {},\n \"tooltip\": {\n \"mode\": \"all\",\n \"sort\": \"desc\"\n }\n },\n \"targets\": [\n {\n \"expr\": \"tomcat_jvm_memorypool_max{instance=\\\"$instance\\\"}\",\n \"legend\": \"{{name}}\",\n \"refId\": \"A\"\n }\n ],\n \"type\": \"timeseries\",\n \"version\": \"2.0.0\"\n },\n {\n \"custom\": {\n \"drawStyle\": \"lines\",\n \"fillOpacity\": 0.3,\n \"gradientMode\": \"opacity\",\n \"lineInterpolation\": \"smooth\",\n \"lineWidth\": 2,\n \"stack\": \"off\"\n },\n \"datasourceCate\": \"prometheus\",\n \"datasourceValue\": \"${prom}\",\n \"id\": \"8cbc2b26-290e-4d11-a56c-e2f0645179a0\",\n \"layout\": {\n \"h\": 7,\n \"i\": \"8cbc2b26-290e-4d11-a56c-e2f0645179a0\",\n \"w\": 6,\n \"x\": 12,\n \"y\": 19\n },\n \"name\": \"Committed\",\n \"options\": {\n \"legend\": {\n \"displayMode\": \"hidden\"\n },\n \"standardOptions\": {\n \"decimals\": 1,\n \"util\": \"bytesIEC\"\n },\n \"thresholds\": {},\n \"tooltip\": {\n \"mode\": \"all\",\n \"sort\": \"desc\"\n }\n },\n \"targets\": [\n {\n \"expr\": \"tomcat_jvm_memorypool_committed{instance=\\\"$instance\\\"}\",\n \"legend\": \"{{name}}\",\n \"refId\": \"A\"\n }\n ],\n \"type\": \"timeseries\",\n \"version\": \"2.0.0\"\n },\n {\n \"custom\": {\n \"drawStyle\": \"lines\",\n \"fillOpacity\": 0.3,\n \"gradientMode\": \"opacity\",\n \"lineInterpolation\": \"smooth\",\n \"lineWidth\": 2,\n \"stack\": \"off\"\n },\n \"datasourceCate\": \"prometheus\",\n \"datasourceValue\": \"${prom}\",\n \"id\": \"b81e4684-c03b-4ee1-86f2-45c883ace756\",\n \"layout\": {\n \"h\": 7,\n \"i\": \"b81e4684-c03b-4ee1-86f2-45c883ace756\",\n \"w\": 6,\n \"x\": 18,\n \"y\": 19\n },\n \"name\": \"Init\",\n \"options\": {\n \"legend\": {\n \"displayMode\": \"hidden\"\n },\n \"standardOptions\": {\n \"decimals\": 1,\n \"util\": \"bytesIEC\"\n },\n \"thresholds\": {},\n \"tooltip\": {\n \"mode\": \"all\",\n \"sort\": \"desc\"\n }\n },\n \"targets\": [\n {\n \"expr\": \"tomcat_jvm_memorypool_init{instance=\\\"$instance\\\"}\",\n \"legend\": \"{{name}}\",\n \"refId\": \"A\"\n }\n ],\n \"type\": \"timeseries\",\n \"version\": \"2.0.0\"\n }\n ],\n \"var\": [\n {\n \"definition\": \"prometheus\",\n \"name\": \"prom\",\n \"type\": \"datasource\"\n },\n {\n \"datasource\": {\n \"cate\": \"prometheus\",\n \"value\": \"${prom}\"\n },\n \"definition\": \"label_values(tomcat_up, instance)\",\n \"name\": \"instance\",\n \"type\": \"query\"\n }\n ],\n \"version\": \"3.0.0\"\n },\n \"public\": 0,\n \"public_cate\": 0,\n \"bgids\": null,\n \"built_in\": 0,\n \"hide\": 0,\n \"uuid\": 1717556328436213000\n}"
},
{
"path": "integrations/Tomcat/markdown/README.md",
"content": "# tomcat\n\ntomcat 采集器,是读取 tomcat 的管理侧接口 `/manager/status/all` 这个接口需要鉴权。修改 `tomcat-users.xml` ,增加下面的内容:\n\n```xml\n💚{{$event.RuleName}} {{else}}💔{{$event.RuleName}} {{end}}\n---\n{{$time_duration := sub now.Unix $event.FirstTriggerTime }}{{if $event.IsRecovered}}{{$time_duration = sub $event.LastEvalTime $event.FirstTriggerTime }}{{end}}\n- **告警级别**: {{$event.Severity}}级\n{{- if $event.RuleNote}}\n\t- **规则备注**: {{$event.RuleNote}}\n{{- end}}\n{{- if not $event.IsRecovered}}\n- **当次触发时值**: {{$event.TriggerValue}}\n- **当次触发时间**: {{timeformat $event.TriggerTime}}\n- **告警持续时长**: {{humanizeDurationInterface $time_duration}}\n{{- else}}\n{{- if $event.AnnotationsJSON.recovery_value}}\n- **恢复时值**: {{formatDecimal $event.AnnotationsJSON.recovery_value 4}}\n{{- end}}\n- **恢复时间**: {{timeformat $event.LastEvalTime}}\n- **告警持续时长**: {{humanizeDurationInterface $time_duration}}\n{{- end}}\n- **告警事件标签**:\n{{- range $key, $val := $event.TagsMap}}\n{{- if ne $key \"rulename\" }}\n\t- {{$key}}: {{$val}}\n{{- end}}\n{{- end}}\n{{if $event.AnnotationsJSON}}\n- **附加信息**:\n{{- range $key, $val := $event.AnnotationsJSON}}\n\t- {{$key}}: {{$val}}\n{{- end}}\n{{end}}\n[事件详情]({{.domain}}/share/alert-his-events/{{$event.Id}}) | [屏蔽1小时]({{.domain}}/alert-mutes/add?__event_id={{$event.Id}}){{if eq $event.Cate \"prometheus\"}} | [查看曲线]({{.domain}}/metric/explorer?__event_id={{$event.Id}}&mode=graph){{end}}`,\n\tEmail: `\n\t\n\t\n\t\t夜莺告警通知 \n\t\t\n\t\n\t\n\t\n\t\t
\n\t\t\t
\n\t\t\t\t{{$event.RuleName}} \n\t\t\t\t
\n\t\t\t \n\t\n\t\t\t
\n\t\n\t\t\t
\n\t\t\t\t
\n\t\t\t\t\t\n\t\t\t\t\t{{if $event.IsRecovered}}\n\t\t\t\t\t\n\t\t\t\t\t\t级别状态: \n\t\t\t\t\t\tS{{$event.Severity}} Recovered \n\t\t\t\t\t \n\t\t\t\t\t{{else}}\n\t\t\t\t\t\n\t\t\t\t\t\t级别状态: \n\t\t\t\t\t\tS{{$event.Severity}} Triggered \n\t\t\t\t\t \n\t\t\t\t\t{{end}}\n\t\n\t\t\t\t\t\n\t\t\t\t\t\t策略备注: \n\t\t\t\t\t\t{{$event.RuleNote}} \n\t\t\t\t\t \n\t\t\t\t\t\n\t\t\t\t\t\t设备备注: \n\t\t\t\t\t\t{{$event.TargetNote}} \n\t\t\t\t\t \n\t\t\t\t\t{{if not $event.IsRecovered}}\n\t\t\t\t\t\n\t\t\t\t\t\t触发时值: \n\t\t\t\t\t\t{{$event.TriggerValue}} \n\t\t\t\t\t \n\t\t\t\t\t{{end}}\n\t\n\t\t\t\t\t{{if $event.TargetIdent}}\n\t\t\t\t\t\n\t\t\t\t\t\t监控对象: \n\t\t\t\t\t\t{{$event.TargetIdent}} \n\t\t\t\t\t \n\t\t\t\t\t{{end}}\n\t\t\t\t\t\n\t\t\t\t\t\t监控指标: \n\t\t\t\t\t\t{{$event.TagsJSON}} \n\t\t\t\t\t \n\t\n\t\t\t\t\t{{if $event.IsRecovered}}\n\t\t\t\t\t\n\t\t\t\t\t\t恢复时间: \n\t\t\t\t\t\t{{timeformat $event.LastEvalTime}} \n\t\t\t\t\t \n\t\t\t\t\t{{else}}\n\t\t\t\t\t\n\t\t\t\t\t\t触发时间: \n\t\t\t\t\t\t\n\t\t\t\t\t\t\t{{timeformat $event.TriggerTime}}\n\t\t\t\t\t\t \n\t\t\t\t\t \n\t\t\t\t\t{{end}}\n\t\n\t\t\t\t\t\n\t\t\t\t\t\t发送时间: \n\t\t\t\t\t\t\n\t\t\t\t\t\t\t{{timestamp}}\n\t\t\t\t\t\t \n\t\t\t\t\t \n\t\t\t\t\t \n\t\t\t\t
\n\t\n\t\t\t\t
\n\t\n\t\t\t\t
\n\t\t\t
\n\t\t
\n\t
级别状态: {{if $event.IsRecovered}}💚 S{{$event.Severity}} Recovered{{else}}⚠️ S{{$event.Severity}} Triggered{{end}} \n规则标题 : {{$event.RuleName}}{{if $event.RuleNote}} \n规则备注 : {{$event.RuleNote}}{{end}}{{if $event.TargetIdent}} \n监控对象 : {{$event.TargetIdent}}{{end}} \n监控指标 : {{$event.TagsJSON}}{{if not $event.IsRecovered}} \n触发时值 : {{$event.TriggerValue}}{{end}} \n{{if $event.IsRecovered}}恢复时间 : {{timeformat $event.LastEvalTime}}{{else}}首次触发时间 : {{timeformat $event.FirstTriggerTime}}{{end}} \n{{$time_duration := sub now.Unix $event.FirstTriggerTime }}{{if $event.IsRecovered}}{{$time_duration = sub $event.LastEvalTime $event.FirstTriggerTime }}{{end}}距离首次告警 : {{humanizeDurationInterface $time_duration}}\n发送时间 : {{timestamp}}`,\n\tWecom: `**级别状态**: {{if $event.IsRecovered}}💚S{{$event.Severity}} Recovered {{else}}💔S{{$event.Severity}} Triggered {{end}} \n**规则标题**: {{$event.RuleName}}{{if $event.RuleNote}} \n**规则备注**: {{$event.RuleNote}}{{end}}{{if $event.TargetIdent}} \n**监控对象**: {{$event.TargetIdent}}{{end}} \n**监控指标**: {{$event.TagsJSON}} \n{{if $event.AnnotationsJSON}}**附加信息**:{{range $key, $val := $event.AnnotationsJSON}}{{$key}}:{{$val}} {{end}} {{end}}{{if not $event.IsRecovered}}\n**触发时值**: {{$event.TriggerValue}}{{end}} \n{{if $event.IsRecovered}}**恢复时间**: {{timeformat $event.LastEvalTime}}{{else}}**首次触发时间**: {{timeformat $event.FirstTriggerTime}}{{end}} \n{{$time_duration := sub now.Unix $event.FirstTriggerTime }}{{if $event.IsRecovered}}{{$time_duration = sub $event.LastEvalTime $event.FirstTriggerTime }}{{end}}**距离首次告警**: {{humanizeDurationInterface $time_duration}}\n**发送时间**: {{timestamp}} \n[事件详情]({{.domain}}/share/alert-his-events/{{$event.Id}})|[屏蔽1小时]({{.domain}}/alert-mutes/add?__event_id={{$event.Id}}){{if eq $event.Cate \"prometheus\"}}|[查看曲线]({{.domain}}/metric/explorer?__event_id={{$event.Id}}&mode=graph){{end}}`,\n\tLark: `级别状态: S{{$event.Severity}} {{if $event.IsRecovered}}Recovered{{else}}Triggered{{end}} \n规则名称: {{$event.RuleName}}{{if $event.RuleNote}} \n规则备注: {{$event.RuleNote}}{{end}} \n监控指标: {{$event.TagsJSON}}\n{{if $event.IsRecovered}}恢复时间:{{timeformat $event.LastEvalTime}}{{else}}触发时间: {{timeformat $event.TriggerTime}}\n触发时值: {{$event.TriggerValue}}{{end}}\n发送时间: {{timestamp}} \n事件详情: {{.domain}}/share/alert-his-events/{{$event.Id}}\n屏蔽1小时: {{.domain}}/alert-mutes/add?__event_id={{$event.Id}}`,\n\tLarkCard: `{{ if $event.IsRecovered }}\n{{- if ne $event.Cate \"host\"}}\n**告警集群:** {{$event.Cluster}}{{end}} \n**级别状态:** S{{$event.Severity}} Recovered \n**告警名称:** {{$event.RuleName}} \n**事件标签:** {{$event.TagsJSON}} \n**恢复时间:** {{timeformat $event.LastEvalTime}} \n{{$time_duration := sub now.Unix $event.FirstTriggerTime }}{{if $event.IsRecovered}}{{$time_duration = sub $event.LastEvalTime $event.FirstTriggerTime }}{{end}}**持续时长**: {{humanizeDurationInterface $time_duration}} \n**告警描述:** **服务已恢复** \n{{- else }}\n{{- if ne $event.Cate \"host\"}} \n**告警集群:** {{$event.Cluster}}{{end}} \n**级别状态:** S{{$event.Severity}} Triggered \n**告警名称:** {{$event.RuleName}} \n**事件标签:** {{$event.TagsJSON}} \n**触发时间:** {{timeformat $event.TriggerTime}} \n**发送时间:** {{timestamp}} \n**触发时值:** {{$event.TriggerValue}}\n{{$time_duration := sub now.Unix $event.FirstTriggerTime }}{{if $event.IsRecovered}}{{$time_duration = sub $event.LastEvalTime $event.FirstTriggerTime }}{{end}}**持续时长**: {{humanizeDurationInterface $time_duration}} \n{{if $event.RuleNote }}**告警描述:** **{{$event.RuleNote}}**{{end}} \n{{- end -}}\n[事件详情]({{.domain}}/share/alert-his-events/{{$event.Id}})|[屏蔽1小时]({{.domain}}/alert-mutes/add?__event_id={{$event.Id}}){{if eq $event.Cate \"prometheus\"}}|[查看曲线]({{.domain}}/metric/explorer?__event_id={{$event.Id}}&mode=graph){{end}}`,\n\tSlackWebhook: `{{ if $event.IsRecovered }}\n{{- if ne $event.Cate \"host\"}}\n*Alarm cluster:* {{$event.Cluster}}{{end}}\n*Level Status:* S{{$event.Severity}} Recovered\n*Alarm name:* {{$event.RuleName}}\n*Recovery time:* {{timeformat $event.LastEvalTime}}\n{{$time_duration := sub now.Unix $event.FirstTriggerTime }}\n{{if $event.IsRecovered}}{{$time_duration = sub $event.LastEvalTime $event.FirstTriggerTime }}{{end}}\n*Duration*: {{humanizeDurationInterface $time_duration}}\n*Alarm description:* *Service has been restored*\n{{- else }}\n{{- if ne $event.Cate \"host\"}}\n*Alarm cluster:* {{$event.Cluster}}{{end}}\n*Level Status:* S{{$event.Severity}} Triggered\n*Alarm name:* {{$event.RuleName}}\n*Trigger time:* {{timeformat $event.TriggerTime}}\n*Sending time:* {{timestamp}}\n*Trigger time value:* {{$event.TriggerValue}}\n{{$time_duration := sub now.Unix $event.FirstTriggerTime }}\n{{if $event.IsRecovered}}{{$time_duration = sub $event.LastEvalTime $event.FirstTriggerTime }}{{end}}\n*Duration*: {{humanizeDurationInterface $time_duration}}\n{{if $event.RuleNote }}*Alarm description:* *{{$event.RuleNote}}*{{end}}\n{{- end -}}\n\n<{{.domain}}/share/alert-his-events/{{$event.Id}}|Event Details> \n<{{.domain}}/alert-mutes/add?__event_id={{$event.Id}}|Block for 1 hour> \n<{{.domain}}/metric/explorer?__event_id={{$event.Id}}&mode=graph|View Curve>`,\n\tDiscord: `**Level Status**: {{if $event.IsRecovered}}S{{$event.Severity}} Recovered{{else}}S{{$event.Severity}} Triggered{{end}} \n**Rule Title**: {{$event.RuleName}}{{if $event.RuleNote}} \n**Rule Note**: {{$event.RuleNote}}{{end}}{{if $event.TargetIdent}} \n**Monitor Target**: {{$event.TargetIdent}}{{end}} \n**Metrics**: {{$event.TagsJSON}}{{if not $event.IsRecovered}} \n**Trigger Value**: {{$event.TriggerValue}}{{end}} \n{{if $event.IsRecovered}}**Recovery Time**: {{timeformat $event.LastEvalTime}}{{else}}**First Trigger Time**: {{timeformat $event.FirstTriggerTime}}{{end}} \n{{$time_duration := sub now.Unix $event.FirstTriggerTime }}{{if $event.IsRecovered}}{{$time_duration = sub $event.LastEvalTime $event.FirstTriggerTime }}{{end}}**Time Since First Alert**: {{humanizeDurationInterface $time_duration}}\n**Send Time**: {{timestamp}}\n\n[Event Details]({{.domain}}/share/alert-his-events/{{$event.Id}}) | [Silence 1h]({{.domain}}/alert-mutes/add?__event_id={{$event.Id}}) | [View Graph]({{.domain}}/metric/explorer?__event_id={{$event.Id}}&mode=graph)`,\n\n\tMattermostWebhook: `{{ if $event.IsRecovered }}\n{{- if ne $event.Cate \"host\"}}\n**Alarm cluster:** {{$event.Cluster}}{{end}} \n**Level Status:** S{{$event.Severity}} Recovered \n**Alarm name:** {{$event.RuleName}} \n**Recovery time:** {{timeformat $event.LastEvalTime}} \n{{$time_duration := sub now.Unix $event.FirstTriggerTime }}{{if $event.IsRecovered}}{{$time_duration = sub $event.LastEvalTime $event.FirstTriggerTime }}{{end}}**Duration**: {{humanizeDurationInterface $time_duration}} \n**Alarm description:** **Service has been restored** \n{{- else }}\n{{- if ne $event.Cate \"host\"}} \n**Alarm cluster:** {{$event.Cluster}}{{end}} \n**Level Status:** S{{$event.Severity}} Triggered \n**Alarm name:** {{$event.RuleName}} \n**Trigger time:** {{timeformat $event.TriggerTime}} \n**Sending time:** {{timestamp}} \n**Trigger time value:** {{$event.TriggerValue}}\n{{$time_duration := sub now.Unix $event.FirstTriggerTime }}{{if $event.IsRecovered}}{{$time_duration = sub $event.LastEvalTime $event.FirstTriggerTime }}{{end}}**Duration**: {{humanizeDurationInterface $time_duration}} \n{{if $event.RuleNote }}**Alarm description:** **{{$event.RuleNote}}**{{end}} \n{{- end -}}\n[Event Details]({{.domain}}/share/alert-his-events/{{$event.Id}})|[Block for 1 hour]({{.domain}}/alert-mutes/add?__event_id={{$event.Id}})|[View Curve]({{.domain}}/metric/explorer?__event_id={{$event.Id}}&mode=graph)`,\n\n\t// Jira and JSMAlert share the same template format\n\tJira: `Severity: S{{$event.Severity}} {{if $event.IsRecovered}}Recovered{{else}}Triggered{{end}}\nRule Name: {{$event.RuleName}}{{if $event.RuleNote}}\nRule Notes: {{$event.RuleNote}}{{end}}\nMetrics: {{$event.TagsJSON}}\nAnnotations:\n{{- range $key, $val := $event.AnnotationsJSON}}\n{{$key}}: {{$val}}\n{{- end}}\\n{{if $event.IsRecovered}}Recovery Time: {{timeformat $event.LastEvalTime}}{{else}}Trigger Time: {{timeformat $event.TriggerTime}}\nTrigger Value: {{$event.TriggerValue}}{{end}}\nSend Time: {{timestamp}}\nEvent Details: {{.domain}}/share/alert-his-events/{{$event.Id}}\nMute for 1 Hour: {{.domain}}/alert-mutes/add?__event_id={{$event.Id}}`,\n}\n\n// Weight 用于页面元素排序,weight 越大 排序越靠后\nvar MsgTplMap = []MessageTemplate{\n\t{Name: \"Jira\", Ident: Jira, Weight: 18, Content: map[string]string{\"content\": NewTplMap[Jira]}},\n\t{Name: \"JSMAlert\", Ident: JSMAlert, Weight: 17, Content: map[string]string{\"content\": NewTplMap[Jira]}},\n\t{Name: \"Callback\", Ident: \"callback\", Weight: 16, Content: map[string]string{\"content\": \"\"}},\n\t{Name: \"MattermostWebhook\", Ident: MattermostWebhook, Weight: 15, Content: map[string]string{\"content\": NewTplMap[MattermostWebhook]}},\n\t{Name: \"MattermostBot\", Ident: MattermostBot, Weight: 14, Content: map[string]string{\"content\": NewTplMap[MattermostWebhook]}},\n\t{Name: \"SlackWebhook\", Ident: SlackWebhook, Weight: 13, Content: map[string]string{\"content\": NewTplMap[SlackWebhook]}},\n\t{Name: \"SlackBot\", Ident: SlackBot, Weight: 12, Content: map[string]string{\"content\": NewTplMap[SlackWebhook]}},\n\t{Name: \"Discord\", Ident: Discord, Weight: 11, Content: map[string]string{\"content\": NewTplMap[Discord]}},\n\t{Name: \"Aliyun Voice\", Ident: \"ali-voice\", Weight: 10, Content: map[string]string{\"incident\": NewTplMap[\"ali-voice\"]}},\n\t{Name: \"Aliyun SMS\", Ident: \"ali-sms\", Weight: 9, Content: map[string]string{\"incident\": NewTplMap[\"ali-sms\"]}},\n\t{Name: \"Tencent Voice\", Ident: \"tx-voice\", Weight: 8, Content: map[string]string{\"content\": NewTplMap[\"tx-voice\"]}},\n\t{Name: \"Tencent SMS\", Ident: \"tx-sms\", Weight: 7, Content: map[string]string{\"content\": NewTplMap[\"tx-sms\"]}},\n\t{Name: \"Telegram\", Ident: Telegram, Weight: 6, Content: map[string]string{\"content\": NewTplMap[Telegram]}},\n\t{Name: \"LarkCard\", Ident: LarkCard, Weight: 5, Content: map[string]string{\"title\": LarkCardTitle, \"content\": NewTplMap[LarkCard]}},\n\t{Name: \"Lark\", Ident: Lark, Weight: 5, Content: map[string]string{\"content\": NewTplMap[Lark]}},\n\t{Name: \"Feishu\", Ident: Feishu, Weight: 4, Content: map[string]string{\"content\": NewTplMap[Feishu]}},\n\t{Name: \"FeishuCard\", Ident: FeishuCard, Weight: 4, Content: map[string]string{\"title\": FeishuCardTitle, \"content\": NewTplMap[FeishuCard]}},\n\t{Name: \"Wecom\", Ident: Wecom, Weight: 3, Content: map[string]string{\"content\": NewTplMap[Wecom]}},\n\t{Name: \"Dingtalk\", Ident: Dingtalk, Weight: 2, Content: map[string]string{\"title\": NewTplMap[EmailSubject], \"content\": NewTplMap[Dingtalk]}},\n\t{Name: \"Email\", Ident: Email, Weight: 1, Content: map[string]string{\"subject\": NewTplMap[EmailSubject], \"content\": NewTplMap[Email]}},\n}\n\nfunc InitMessageTemplate(ctx *ctx.Context) {\n\tif !ctx.IsCenter {\n\t\treturn\n\t}\n\n\tfor _, tpl := range MsgTplMap {\n\t\tmsgTpl := MessageTemplate{\n\t\t\tName: tpl.Name,\n\t\t\tIdent: tpl.Ident,\n\t\t\tContent: tpl.Content,\n\t\t\tNotifyChannelIdent: tpl.Ident,\n\t\t\tCreateBy: \"system\",\n\t\t\tCreateAt: time.Now().Unix(),\n\t\t\tUpdateBy: \"system\",\n\t\t\tUpdateAt: time.Now().Unix(),\n\t\t\tWeight: tpl.Weight,\n\t\t}\n\n\t\terr := msgTpl.Upsert(ctx, msgTpl.Ident)\n\t\tif err != nil {\n\t\t\tlogger.Warningf(\"failed to upsert msg tpls %v\", err)\n\t\t}\n\t}\n}\n\nfunc (t *MessageTemplate) Upsert(ctx *ctx.Context, ident string) error {\n\ttpl, err := MessageTemplateGet(ctx, \"ident = ?\", ident)\n\tif err != nil {\n\t\treturn errors.WithMessage(err, \"failed to get message tpl\")\n\t}\n\tif tpl == nil {\n\t\treturn Insert(ctx, t)\n\t}\n\n\tif tpl.UpdateBy != \"\" && tpl.UpdateBy != \"system\" {\n\t\treturn nil\n\t}\n\treturn tpl.Update(ctx, *t)\n}\n\nvar GetDefs func(map[string]interface{}) []string\n\nfunc getDefs(renderData map[string]interface{}) []string {\n\treturn []string{\n\t\t\"{{ $events := .events }}\",\n\t\t\"{{ $event := index $events 0 }}\",\n\t\t\"{{ $labels := $event.TagsMap }}\",\n\t\t\"{{ $value := $event.TriggerValue }}\",\n\t}\n}\n\nfunc init() {\n\tGetDefs = getDefs\n}\n\nfunc (t *MessageTemplate) RenderEvent(events []*AlertCurEvent, siteUrl string) map[string]interface{} {\n\tif t == nil {\n\t\treturn nil\n\t}\n\n\trenderData := make(map[string]interface{})\n\trenderData[\"events\"] = events\n\trenderData[\"domain\"] = siteUrl\n\n\t// event 内容渲染到 messageTemplate\n\ttplContent := make(map[string]interface{})\n\tfor key, msgTpl := range t.Content {\n\t\tdefs := GetDefs(renderData)\n\n\t\tvar body bytes.Buffer\n\t\tif t.NotifyChannelIdent == \"email\" {\n\t\t\ttext := strings.Join(append(defs, msgTpl), \"\")\n\t\t\ttpl, err := texttemplate.New(key).Funcs(tplx.TemplateFuncMap).Parse(text)\n\t\t\tif err != nil {\n\t\t\t\tlogger.Errorf(\"failed to parse template: %v\", err)\n\t\t\t\ttplContent[key] = fmt.Sprintf(\"failed to parse template: %v\", err)\n\t\t\t\tcontinue\n\t\t\t}\n\n\t\t\tvar body bytes.Buffer\n\t\t\tif err = tpl.Execute(&body, renderData); err != nil {\n\t\t\t\tlogger.Errorf(\"failed to execute template: %v\", err)\n\t\t\t\ttplContent[key] = fmt.Sprintf(\"failed to execute template: %v\", err)\n\t\t\t\tcontinue\n\t\t\t}\n\t\t\ttplContent[key] = body.String()\n\t\t\tcontinue\n\t\t} else if t.NotifyChannelIdent == \"slackwebhook\" || t.NotifyChannelIdent == \"slackbot\" {\n\t\t\ttext := strings.Join(append(defs, msgTpl), \"\")\n\t\t\ttpl, err := template.New(key).Funcs(tplx.TemplateFuncMap).Parse(text)\n\t\t\tif err != nil {\n\t\t\t\tlogger.Errorf(\"failed to parse template: %v events: %v\", err, events)\n\t\t\t\tcontinue\n\t\t\t}\n\n\t\t\tif err = tpl.Execute(&body, renderData); err != nil {\n\t\t\t\tlogger.Errorf(\"failed to execute template: %v events: %v\", err, events)\n\t\t\t\tcontinue\n\t\t\t}\n\n\t\t\tescaped := strings.ReplaceAll(body.String(), `\"`, `\\\"`)\n\t\t\tescaped = strings.ReplaceAll(escaped, \"\\n\", \"\\\\n\")\n\t\t\tescaped = strings.ReplaceAll(escaped, \"\\r\", \"\\\\r\")\n\t\t\tescaped = strings.ReplaceAll(escaped, \"<\", \"<\")\n\t\t\ttplContent[key] = template.HTML(escaped)\n\t\t\tcontinue\n\t\t}\n\n\t\ttext := strings.Join(append(defs, msgTpl), \"\")\n\t\ttpl, err := template.New(key).Funcs(tplx.TemplateFuncMap).Parse(text)\n\t\tif err != nil {\n\t\t\tlogger.Errorf(\"failed to parse template: %v events: %v\", err, events)\n\t\t\ttplContent[key] = fmt.Sprintf(\"failed to parse template: %v\", err)\n\t\t\tcontinue\n\t\t}\n\n\t\tif err = tpl.Execute(&body, renderData); err != nil {\n\t\t\tlogger.Errorf(\"failed to execute template: %v events: %v\", err, events)\n\t\t\ttplContent[key] = fmt.Sprintf(\"failed to execute template: %v\", err)\n\t\t\tcontinue\n\t\t}\n\n\t\tescaped := strings.ReplaceAll(body.String(), `\"`, `\\\"`)\n\t\tescaped = strings.ReplaceAll(escaped, \"\\n\", \"\\\\n\")\n\t\tescaped = strings.ReplaceAll(escaped, \"\\r\", \"\\\\r\")\n\t\ttplContent[key] = template.HTML(escaped)\n\t}\n\treturn tplContent\n}\n"
},
{
"path": "models/metric_view.go",
"content": "package models\n\nimport (\n\t\"errors\"\n\t\"sort\"\n\t\"strings\"\n\t\"time\"\n\n\t\"github.com/ccfos/nightingale/v6/pkg/ctx\"\n)\n\n// MetricView 在告警聚合视图查看的时候,要存储一些聚合规则\ntype MetricView struct {\n\tId int64 `json:\"id\" gorm:\"primaryKey\"`\n\tName string `json:\"name\"`\n\tCate int `json:\"cate\"`\n\tConfigs string `json:\"configs\"`\n\tCreateAt int64 `json:\"create_at\"`\n\tCreateBy int64 `json:\"create_by\"`\n\tUpdateAt int64 `json:\"update_at\"`\n}\n\nfunc (v *MetricView) TableName() string {\n\treturn \"metric_view\"\n}\n\nfunc (v *MetricView) Verify() error {\n\tv.Name = strings.TrimSpace(v.Name)\n\tif v.Name == \"\" {\n\t\treturn errors.New(\"name is blank\")\n\t}\n\n\tv.Configs = strings.TrimSpace(v.Configs)\n\tif v.Configs == \"\" {\n\t\treturn errors.New(\"configs is blank\")\n\t}\n\n\treturn nil\n}\n\nfunc (v *MetricView) Add(ctx *ctx.Context) error {\n\tif err := v.Verify(); err != nil {\n\t\treturn err\n\t}\n\n\tnow := time.Now().Unix()\n\tv.CreateAt = now\n\tv.UpdateAt = now\n\treturn Insert(ctx, v)\n}\n\nfunc (v *MetricView) Update(ctx *ctx.Context, name, configs string, cate int, createBy int64) error {\n\tif err := v.Verify(); err != nil {\n\t\treturn err\n\t}\n\n\tv.UpdateAt = time.Now().Unix()\n\tv.Name = name\n\tv.Configs = configs\n\tv.Cate = cate\n\n\tif v.CreateBy == 0 {\n\t\tv.CreateBy = createBy\n\t}\n\n\treturn DB(ctx).Model(v).Select(\"name\", \"configs\", \"cate\", \"update_at\", \"create_by\").Updates(v).Error\n}\n\n// MetricViewDel: userid for safe delete\nfunc MetricViewDel(ctx *ctx.Context, ids []int64, createBy ...interface{}) error {\n\tif len(ids) == 0 {\n\t\treturn nil\n\t}\n\n\tif len(createBy) > 0 {\n\t\treturn DB(ctx).Where(\"id in ? and create_by = ?\", ids, createBy[0]).Delete(new(MetricView)).Error\n\t}\n\n\treturn DB(ctx).Where(\"id in ?\", ids).Delete(new(MetricView)).Error\n}\n\nfunc MetricViewGets(ctx *ctx.Context, createBy interface{}) ([]MetricView, error) {\n\tvar lst []MetricView\n\terr := DB(ctx).Where(\"create_by = ? or cate = 0\", createBy).Find(&lst).Error\n\tif err == nil && len(lst) > 1 {\n\t\tsort.Slice(lst, func(i, j int) bool {\n\t\t\tif lst[i].Cate < lst[j].Cate {\n\t\t\t\treturn true\n\t\t\t}\n\n\t\t\tif lst[i].Cate > lst[j].Cate {\n\t\t\t\treturn false\n\t\t\t}\n\n\t\t\treturn lst[i].Name < lst[j].Name\n\t\t})\n\t}\n\treturn lst, err\n}\n\nfunc MetricViewGet(ctx *ctx.Context, where string, args ...interface{}) (*MetricView, error) {\n\tvar lst []*MetricView\n\terr := DB(ctx).Where(where, args...).Find(&lst).Error\n\tif err != nil {\n\t\treturn nil, err\n\t}\n\n\tif len(lst) == 0 {\n\t\treturn nil, nil\n\t}\n\n\treturn lst[0], nil\n}\n"
},
{
"path": "models/migrate/migrate.go",
"content": "package migrate\n\nimport (\n\t\"fmt\"\n\n\t\"github.com/ccfos/nightingale/v6/models\"\n\t\"github.com/ccfos/nightingale/v6/pkg/ormx\"\n\n\timodels \"github.com/flashcatcloud/ibex/src/models\"\n\t\"github.com/toolkits/pkg/logger\"\n\t\"gorm.io/driver/mysql\"\n\t\"gorm.io/gorm\"\n)\n\nfunc Migrate(db *gorm.DB) {\n\tMigrateTables(db)\n\tMigrateEsIndexPatternTable(db)\n}\n\nfunc MigrateIbexTables(db *gorm.DB) {\n\tvar tableOptions string\n\tswitch db.Dialector.(type) {\n\tcase *mysql.Dialector:\n\t\ttableOptions = \"ENGINE=InnoDB DEFAULT CHARSET=utf8mb4\"\n\t}\n\n\tif tableOptions != \"\" {\n\t\tdb = db.Set(\"gorm:table_options\", tableOptions)\n\t}\n\n\tdts := []interface{}{&imodels.TaskMeta{}, &imodels.TaskScheduler{}, &TaskHostDoing{}, &imodels.TaskAction{}}\n\tfor _, dt := range dts {\n\t\terr := db.AutoMigrate(dt)\n\t\tif err != nil {\n\t\t\tlogger.Errorf(\"failed to migrate table:%v %v\", dt, err)\n\t\t}\n\t}\n\n\tfor i := 0; i < 100; i++ {\n\t\ttableName := fmt.Sprintf(\"task_host_%d\", i)\n\t\texists := db.Migrator().HasTable(tableName)\n\t\tif exists {\n\t\t\tcontinue\n\t\t} else {\n\t\t\terr := db.Table(tableName).AutoMigrate(&imodels.TaskHost{})\n\t\t\tif err != nil {\n\t\t\t\tlogger.Errorf(\"failed to migrate table:%s %v\", tableName, err)\n\t\t\t}\n\t\t}\n\t}\n}\n\nfunc isPostgres(db *gorm.DB) bool {\n\tdialect := db.Dialector.Name()\n\treturn dialect == \"postgres\"\n}\nfunc MigrateTables(db *gorm.DB) error {\n\tvar tableOptions string\n\tswitch db.Dialector.(type) {\n\tcase *mysql.Dialector:\n\t\ttableOptions = \"ENGINE=InnoDB DEFAULT CHARSET=utf8mb4\"\n\t}\n\tif tableOptions != \"\" {\n\t\tdb = db.Set(\"gorm:table_options\", tableOptions)\n\t}\n\tdts := []interface{}{&RecordingRule{}, &AlertRule{}, &AlertSubscribe{}, &AlertMute{},\n\t\t&TaskRecord{}, &ChartShare{}, &Target{}, &Configs{}, &Datasource{}, &NotifyTpl{},\n\t\t&Board{}, &BoardBusigroup{}, &Users{}, &SsoConfig{}, &models.BuiltinMetric{},\n\t\t&models.MetricFilter{}, &models.NotificationRecord{}, &models.TargetBusiGroup{},\n\t\t&models.UserToken{}, &models.DashAnnotation{}, MessageTemplate{}, NotifyRule{}, NotifyChannelConfig{}, &EsIndexPatternMigrate{},\n\t\t&models.EventPipeline{}, &models.EventPipelineExecution{}, &models.EmbeddedProduct{}, &models.SourceToken{},\n\t\t&models.SavedView{}, &models.UserViewFavorite{}}\n\n\tif isPostgres(db) {\n\t\tdts = append(dts, &models.PostgresBuiltinComponent{})\n\t\tDropUniqueFiledLimit(db, &models.PostgresBuiltinComponent{}, \"idx_ident\", \"idx_ident\")\n\t} else {\n\t\tdts = append(dts, &models.BuiltinComponent{})\n\t\tDropUniqueFiledLimit(db, &models.BuiltinComponent{}, \"idx_ident\", \"idx_ident\")\n\t}\n\n\tif !db.Migrator().HasColumn(&imodels.TaskSchedulerHealth{}, \"scheduler\") {\n\t\tdts = append(dts, &imodels.TaskSchedulerHealth{})\n\t}\n\n\tasyncDts := []interface{}{&AlertHisEvent{}, &AlertCurEvent{}}\n\tgo func() {\n\t\tdefer func() {\n\t\t\tif r := recover(); r != nil {\n\t\t\t\tlogger.Errorf(\"panic to migrate table: %v\", r)\n\t\t\t}\n\t\t}()\n\n\t\tfor _, dt := range asyncDts {\n\t\t\tif err := db.AutoMigrate(dt); err != nil {\n\t\t\t\tlogger.Errorf(\"failed to migrate table %+v err:%v\", dt, err)\n\t\t\t}\n\t\t}\n\t}()\n\n\tif !db.Migrator().HasTable(&models.BuiltinPayload{}) {\n\t\tif isPostgres(db) {\n\t\t\tdts = append(dts, &models.PostgresBuiltinPayload{})\n\t\t} else {\n\t\t\tdts = append(dts, &models.BuiltinPayload{})\n\t\t}\n\t} else {\n\t\tdts = append(dts, &BuiltinPayloads{})\n\t}\n\n\tfor _, dt := range dts {\n\t\terr := db.AutoMigrate(dt)\n\t\tif err != nil {\n\t\t\tlogger.Errorf(\"failed to migrate table:%v %v\", dt, err)\n\t\t}\n\t}\n\n\tif db.Migrator().HasColumn(&AlertingEngines{}, \"cluster\") {\n\t\terr := db.Migrator().RenameColumn(&AlertingEngines{}, \"cluster\", \"engine_cluster\")\n\t\tif err != nil {\n\t\t\tlogger.Errorf(\"failed to renameColumn table: %v\", err)\n\t\t}\n\t}\n\n\tif db.Migrator().HasColumn(&ChartShare{}, \"dashboard_id\") {\n\t\terr := db.Migrator().DropColumn(&ChartShare{}, \"dashboard_id\")\n\t\tif err != nil {\n\t\t\tlogger.Errorf(\"failed to DropColumn table: %v\", err)\n\t\t}\n\t}\n\tDropUniqueFiledLimit(db, &Configs{}, \"ckey\", \"configs_ckey_key\")\n\t// 删除 builtin_metrics 表的 idx_collector_typ_name 唯一索引\n\tDropUniqueFiledLimit(db, &models.BuiltinMetric{}, \"idx_collector_typ_name\", \"idx_collector_typ_name\")\n\n\treturn nil\n}\n\nfunc DropUniqueFiledLimit(db *gorm.DB, dst interface{}, uniqueFiled string, pgUniqueFiled string) { // UNIQUE KEY (`ckey`)\n\t// 先检查表是否存在,如果不存在则直接返回\n\tif !db.Migrator().HasTable(dst) {\n\t\treturn\n\t}\n\n\tif db.Migrator().HasIndex(dst, uniqueFiled) {\n\t\terr := db.Migrator().DropIndex(dst, uniqueFiled) //mysql DROP INDEX\n\t\tif err != nil {\n\t\t\tlogger.Errorf(\"failed to DropIndex(%s) error: %v\", uniqueFiled, err)\n\t\t}\n\t}\n\tif db.Migrator().HasConstraint(dst, pgUniqueFiled) {\n\t\terr := db.Migrator().DropConstraint(dst, pgUniqueFiled) //pg DROP CONSTRAINT\n\t\tif err != nil {\n\t\t\tlogger.Errorf(\"failed to DropConstraint(%s) error: %v\", pgUniqueFiled, err)\n\t\t}\n\t}\n}\n\nfunc columnHasIndex(db *gorm.DB, dst interface{}, indexColumn string) bool {\n\tindexes, err := db.Migrator().GetIndexes(dst)\n\tif err != nil {\n\t\tlogger.Errorf(\"failed to table getIndexes: %v\", err)\n\t\treturn false\n\t}\n\tfor i := range indexes {\n\t\tfor j := range indexes[i].Columns() {\n\t\t\tif indexes[i].Columns()[j] == indexColumn {\n\t\t\t\treturn true\n\t\t\t}\n\t\t}\n\t}\n\treturn false\n}\n\ntype AlertRule struct {\n\tExtraConfig string `gorm:\"type:text;column:extra_config\"`\n\tCronPattern string `gorm:\"type:varchar(64);column:cron_pattern\"`\n\tTimeZone string `gorm:\"type:varchar(64);column:time_zone;not null;default:''\"`\n\tDatasourceQueries []models.DatasourceQuery `gorm:\"datasource_queries;type:text;serializer:json\"` // datasource queries\n\tNotifyRuleIds []int64 `gorm:\"column:notify_rule_ids;type:varchar(1024)\"`\n\tNotifyVersion int `gorm:\"column:notify_version;type:int;default:0\"`\n\tPipelineConfigs []models.PipelineConfig `gorm:\"column:pipeline_configs;type:text;serializer:json\"`\n}\n\ntype AlertSubscribe struct {\n\tExtraConfig string `gorm:\"type:text;column:extra_config\"` // extra config\n\tSeverities string `gorm:\"column:severities;type:varchar(32);not null;default:''\"`\n\tBusiGroups ormx.JSONArr `gorm:\"column:busi_groups;type:varchar(4096)\"`\n\tNote string `gorm:\"column:note;type:varchar(1024);default:'';comment:note\"`\n\tRuleIds []int64 `gorm:\"column:rule_ids;type:varchar(1024)\"`\n\tNotifyRuleIds []int64 `gorm:\"column:notify_rule_ids;type:varchar(1024)\"`\n\tNotifyVersion int `gorm:\"column:notify_version;type:int;default:0\"`\n}\n\ntype AlertMute struct {\n\tSeverities string `gorm:\"column:severities;type:varchar(32);not null;default:''\"`\n\tTags string `gorm:\"column:tags;type:varchar(4096);default:'[]';comment:json,map,tagkey->regexp|value\"`\n}\n\ntype RecordingRule struct {\n\tQueryConfigs string `gorm:\"type:text;not null;column:query_configs\"` // query_configs\n\tDatasourceIds string `gorm:\"column:datasource_ids;type:varchar(255);default:'';comment:datasource ids\"`\n\tCronPattern string `gorm:\"column:cron_pattern;type:varchar(255);default:'';comment:cron pattern\"`\n\tDatasourceQueries []models.DatasourceQuery `json:\"datasource_queries\" gorm:\"datasource_queries;type:text;serializer:json\"` // datasource queries\n}\n\ntype AlertingEngines struct {\n\tEngineCluster string `gorm:\"column:engine_cluster;type:varchar(128);default:'';comment:n9e engine cluster\"`\n}\n\ntype ChartShare struct {\n\tDatasourceId int64 `gorm:\"column:datasource_id;bigint(20);not null;default:0;comment:datasource id\"`\n}\ntype TaskRecord struct {\n\tEventId int64 `gorm:\"column:event_id;bigint(20);not null;default:0;comment:event id;index:idx_event_id\"`\n}\ntype AlertHisEvent struct {\n\tLastEvalTime int64 `gorm:\"column:last_eval_time;bigint(20);not null;default:0;comment:for time filter;index:idx_last_eval_time\"`\n\tOriginalTags string `gorm:\"column:original_tags;type:text;comment:labels key=val,,k2=v2\"`\n\tNotifyRuleIds []int64 `gorm:\"column:notify_rule_ids;type:text;serializer:json;comment:notify rule ids\"`\n}\n\ntype AlertCurEvent struct {\n\tOriginalTags string `gorm:\"column:original_tags;type:text;comment:labels key=val,,k2=v2\"`\n\tNotifyRuleIds []int64 `gorm:\"column:notify_rule_ids;type:text;serializer:json;comment:notify rule ids\"`\n}\n\ntype Target struct {\n\tHostIp string `gorm:\"column:host_ip;type:varchar(15);default:'';comment:IPv4 string;index:idx_host_ip\"`\n\tAgentVersion string `gorm:\"column:agent_version;type:varchar(255);default:'';comment:agent version;index:idx_agent_version\"`\n\tEngineName string `gorm:\"column:engine_name;type:varchar(255);default:'';comment:engine name;index:idx_engine_name\"`\n\tOS string `gorm:\"column:os;type:varchar(31);default:'';comment:os type;index:idx_os\"`\n\tHostTags []string `gorm:\"column:host_tags;type:text;comment:global labels set in conf file;serializer:json\"`\n}\n\ntype Datasource struct {\n\tIsDefault bool `gorm:\"column:is_default;type:boolean;comment:is default datasource\"`\n\tIdentifier string `gorm:\"column:identifier;type:varchar(255);default:'';comment:identifier\"`\n\tWeight int `gorm:\"column:weight;type:int;default:0;comment:weight for sorting\"`\n}\n\ntype Configs struct {\n\tNote string `gorm:\"column:note;type:varchar(1024);default:'';comment:note\"`\n\tCval string `gorm:\"column:cval;type:text;comment:config value\"`\n\t//mysql tinyint//postgresql smallint\n\tExternal int `gorm:\"column:external;type:int;default:0;comment:0\\\\:built-in 1\\\\:external\"`\n\tEncrypted int `gorm:\"column:encrypted;type:int;default:0;comment:0\\\\:plaintext 1\\\\:ciphertext\"`\n\tCreateAt int64 `gorm:\"column:create_at;type:int;default:0;comment:create_at\"`\n\tCreateBy string `gorm:\"column:create_by;type:varchar(64);default:'';comment:create_by\"`\n\tUpdateAt int64 `gorm:\"column:update_at;type:int;default:0;comment:update_at\"`\n\tUpdateBy string `gorm:\"column:update_by;type:varchar(64);default:'';comment:update_by\"`\n}\n\ntype NotifyTpl struct {\n\tCreateAt int64 `gorm:\"column:create_at;type:int;default:0;comment:create_at\"`\n\tCreateBy string `gorm:\"column:create_by;type:varchar(64);default:'';comment:create_by\"`\n\tUpdateAt int64 `gorm:\"column:update_at;type:int;default:0;comment:update_at\"`\n\tUpdateBy string `gorm:\"column:update_by;type:varchar(64);default:'';comment:update_by\"`\n}\n\ntype Board struct {\n\tPublicCate int `gorm:\"column:public_cate;int;not null;default:0;comment:0 anonymous 1 login 2 busi\"`\n\tNote string `gorm:\"column:note;type:varchar(1024);not null;default:'';comment:note\"`\n}\n\ntype BoardBusigroup struct {\n\tBusiGroupId int64 `gorm:\"column:busi_group_id;bigint(20);not null;default:0;comment:busi group id\"`\n\tBoardId int64 `gorm:\"column:board_id;bigint(20);not null;default:0;comment:board id\"`\n}\n\ntype Users struct {\n\tBelong string `gorm:\"column:belong;type:varchar(16);default:'';comment:belong\"`\n\tLastActiveTime int64 `gorm:\"column:last_active_time;type:int;default:0;comment:last_active_time\"`\n\tPhone string `gorm:\"column:phone;type:varchar(1024);not null;default:''\"`\n}\n\ntype SsoConfig struct {\n\tUpdateAt int64 `gorm:\"column:update_at;type:int;default:0;comment:update_at\"`\n}\n\ntype BuiltinPayloads struct {\n\tUUID int64 `json:\"uuid\" gorm:\"type:bigint;not null;index:idx_uuid;comment:'uuid of payload'\"`\n\tComponentID int64 `json:\"component_id\" gorm:\"type:bigint;index:idx_component,sort:asc;not null;default:0;comment:'component_id of payload'\"`\n\tNote string `json:\"note\" gorm:\"type:varchar(1024);not null;default:'';comment:'note of payload'\"`\n}\n\ntype TaskHostDoing struct {\n\tId int64 `gorm:\"column:id;index;primaryKey:false\"`\n\tHost string `gorm:\"column:host;size:128;not null;index\"`\n\tClock int64 `gorm:\"column:clock;not null;default:0\"`\n\tAction string `gorm:\"column:action;size:16;not null\"`\n\tAlertTriggered bool `gorm:\"-\"`\n}\n\nfunc (TaskHostDoing) TableName() string {\n\treturn \"task_host_doing\"\n}\n\ntype EsIndexPatternMigrate struct {\n\tCrossClusterEnabled int `gorm:\"column:cross_cluster_enabled;type:int;default:0\"`\n\tNote string `gorm:\"column:note;type:varchar(1024);default:''\"`\n}\n\nfunc (EsIndexPatternMigrate) TableName() string {\n\treturn \"es_index_pattern\"\n}\n\ntype DashAnnotation struct {\n\tId int64 `gorm:\"column:id;primaryKey;autoIncrement\"`\n\tDashboardId int64 `gorm:\"column:dashboard_id;not null\"`\n\tPanelId string `gorm:\"column:panel_id;type:varchar(191);not null\"`\n\tTags string `gorm:\"column:tags;type:text\"`\n\tDescription string `gorm:\"column:description;type:text\"`\n\tConfig string `gorm:\"column:config;type:text\"`\n\tTimeStart int64 `gorm:\"column:time_start;not null;default:0\"`\n\tTimeEnd int64 `gorm:\"column:time_end;not null;default:0\"`\n\tCreateAt int64 `gorm:\"column:create_at;not null;default:0\"`\n\tCreateBy string `gorm:\"column:create_by;type:varchar(64);not null;default:''\"`\n\tUpdateAt int64 `gorm:\"column:update_at;not null;default:0\"`\n\tUpdateBy string `gorm:\"column:update_by;type:varchar(64);not null;default:''\"`\n}\n\nfunc (DashAnnotation) TableName() string {\n\treturn \"dash_annotation\"\n}\n\ntype MessageTemplate struct {\n\tID int64 `gorm:\"column:id;primaryKey;autoIncrement\"`\n\tName string `gorm:\"column:name;type:varchar(64);not null\"`\n\tIdent string `gorm:\"column:ident;type:varchar(64);not null\"`\n\tContent map[string]string `gorm:\"column:content;type:text\"`\n\tUserGroupIds []int64 `gorm:\"column:user_group_ids;type:varchar(64)\"`\n\tNotifyChannelIdent string `gorm:\"column:notify_channel_ident;type:varchar(64);not null;default:''\"`\n\tPrivate int `gorm:\"column:private;type:int;not null;default:0\"`\n\tWeight int `gorm:\"column:weight;type:int;not null;default:0\"`\n\tCreateAt int64 `gorm:\"column:create_at;not null;default:0\"`\n\tCreateBy string `gorm:\"column:create_by;type:varchar(64);not null;default:''\"`\n\tUpdateAt int64 `gorm:\"column:update_at;not null;default:0\"`\n\tUpdateBy string `gorm:\"column:update_by;type:varchar(64);not null;default:''\"`\n}\n\nfunc (t *MessageTemplate) TableName() string {\n\treturn \"message_template\"\n}\n\ntype NotifyRule struct {\n\tID int64 `gorm:\"column:id;primaryKey;autoIncrement\"`\n\tName string `gorm:\"column:name;type:varchar(255);not null\"`\n\tDescription string `gorm:\"column:description;type:text\"`\n\tEnable bool `gorm:\"column:enable;not null;default:false\"`\n\tUserGroupIds []int64 `gorm:\"column:user_group_ids;type:varchar(255)\"`\n\tNotifyConfigs []models.NotifyConfig `gorm:\"column:notify_configs;type:text\"`\n\tPipelineConfigs []models.PipelineConfig `gorm:\"column:pipeline_configs;type:text\"`\n\tExtraConfig interface{} `gorm:\"column:extra_config;type:text\"`\n\tCreateAt int64 `gorm:\"column:create_at;not null;default:0\"`\n\tCreateBy string `gorm:\"column:create_by;type:varchar(64);not null;default:''\"`\n\tUpdateAt int64 `gorm:\"column:update_at;not null;default:0\"`\n\tUpdateBy string `gorm:\"column:update_by;type:varchar(64);not null;default:''\"`\n}\n\nfunc (r *NotifyRule) TableName() string {\n\treturn \"notify_rule\"\n}\n\ntype NotifyChannelConfig struct {\n\tID int64 `gorm:\"column:id;primaryKey;autoIncrement\"`\n\tName string `gorm:\"column:name;type:varchar(255);not null\"`\n\tIdent string `gorm:\"column:ident;type:varchar(255);not null\"`\n\tDescription string `gorm:\"column:description;type:text\"`\n\tEnable bool `gorm:\"column:enable;not null;default:false\"`\n\tParamConfig models.NotifyParamConfig `gorm:\"column:param_config;type:text\"`\n\tRequestType string `gorm:\"column:request_type;type:varchar(50);not null\"`\n\tRequestConfig *models.RequestConfig `gorm:\"column:request_config;type:text\"`\n\tWeight int `gorm:\"column:weight;type:int;not null;default:0\"`\n\tCreateAt int64 `gorm:\"column:create_at;not null;default:0\"`\n\tCreateBy string `gorm:\"column:create_by;type:varchar(64);not null;default:''\"`\n\tUpdateAt int64 `gorm:\"column:update_at;not null;default:0\"`\n\tUpdateBy string `gorm:\"column:update_by;type:varchar(64);not null;default:''\"`\n}\n\nfunc (c *NotifyChannelConfig) TableName() string {\n\treturn \"notify_channel\"\n}\n"
},
{
"path": "models/migrate/migrate_es_index_pattern.go",
"content": "package migrate\n\nimport (\n\t\"github.com/toolkits/pkg/logger\"\n\t\"gorm.io/gorm\"\n)\n\ntype EsIndexPattern struct {\n\tId int64 `gorm:\"primaryKey;type:bigint unsigned\"`\n\tDatasourceId int64 `gorm:\"type:bigint not null default '0';uniqueIndex:idx_ds_name\"`\n\tName string `gorm:\"type:varchar(191) not null default '';uniqueIndex:idx_ds_name\"`\n\tTimeField string `gorm:\"type:varchar(128) not null default ''\"`\n\tAllowHideSystemIndices int `gorm:\"type:tinyint(1) not null default 0\"`\n\tFieldsFormat string `gorm:\"type:varchar(4096) not null default ''\"`\n\tCreateAt int64 `gorm:\"type:bigint default '0'\"`\n\tCreateBy string `gorm:\"type:varchar(64) default ''\"`\n\tUpdateAt int64 `gorm:\"type:bigint default '0'\"`\n\tUpdateBy string `gorm:\"type:varchar(64) default ''\"`\n}\n\nfunc MigrateEsIndexPatternTable(db *gorm.DB) error {\n\tdb = db.Set(\"gorm:table_options\", \"CHARSET=utf8mb4\")\n\tif db.Migrator().HasTable(\"es_index_pattern\") {\n\t\treturn nil\n\t}\n\n\terr := db.Table(\"es_index_pattern\").AutoMigrate(&EsIndexPattern{})\n\tif err != nil {\n\t\tlogger.Errorf(\"failed to migrate es index pattern table: %v\", err)\n\t\treturn err\n\t}\n\n\treturn nil\n}\n"
},
{
"path": "models/migrate/migrate_test.go",
"content": "package migrate\n\nimport (\n\t\"fmt\"\n\t\"testing\"\n\n\t\"github.com/ccfos/nightingale/v6/models\"\n\t\"gorm.io/driver/mysql\"\n\t\"gorm.io/gorm\"\n\t\"gorm.io/gorm/schema\"\n)\n\nfunc TestInsertPermPoints(t *testing.T) {\n\tdb, err := gorm.Open(mysql.Open(\"root:1234@tcp(127.0.0.1:3306)/n9e_v6?charset=utf8mb4&parseTime=True&loc=Local&allowNativePasswords=true\"), &gorm.Config{NamingStrategy: schema.NamingStrategy{\n\t\tSingularTable: true,\n\t}})\n\tif err != nil {\n\t\tfmt.Printf(\"failed to connect database: %v\", err)\n\t}\n\n\tvar ops []models.RoleOperation\n\tops = append(ops, models.RoleOperation{\n\t\tRoleName: \"Standard\",\n\t\tOperation: \"/alert-mutes/put\",\n\t})\n\n\tops = append(ops, models.RoleOperation{\n\t\tRoleName: \"Standard\",\n\t\tOperation: \"/log/index-patterns\",\n\t})\n\n\tops = append(ops, models.RoleOperation{\n\t\tRoleName: \"Standard\",\n\t\tOperation: \"/help/variable-configs\",\n\t})\n\n\tops = append(ops, models.RoleOperation{\n\t\tRoleName: \"Standard\",\n\t\tOperation: \"/ibex-settings\",\n\t})\n\n\tdb = db.Debug()\n\tfor _, op := range ops {\n\t\tvar count int64\n\n\t\terr := db.Raw(\"SELECT COUNT(*) FROM role_operation WHERE operation = ? AND role_name = ?\",\n\t\t\top.Operation, op.RoleName).Scan(&count).Error\n\t\tfmt.Printf(\"count: %d\\n\", count)\n\n\t\tif err != nil {\n\t\t\tfmt.Printf(\"check role operation exists failed, %v\", err)\n\t\t\tcontinue\n\t\t}\n\n\t\tif count > 0 {\n\t\t\tcontinue\n\t\t}\n\n\t\terr = db.Create(&op).Error\n\t\tif err != nil {\n\t\t\tfmt.Printf(\"insert role operation failed, %v\", err)\n\t\t}\n\t}\n}\n"
},
{
"path": "models/notification_record.go",
"content": "package models\n\nimport (\n\t\"github.com/ccfos/nightingale/v6/pkg/ctx\"\n\t\"github.com/ccfos/nightingale/v6/pkg/strx\"\n\t\"github.com/toolkits/pkg/logger\"\n)\n\nconst (\n\tNotiStatusSuccess = iota + 1\n\tNotiStatusFailure\n)\n\ntype NotificationRecord struct {\n\tId int64 `json:\"id\" gorm:\"primaryKey;type:bigint;autoIncrement\"`\n\tNotifyRuleID int64 `json:\"notify_rule_id\" gorm:\"type:bigint;comment:notify rule id\"`\n\tEventId int64 `json:\"event_id\" gorm:\"type:bigint;not null;index:idx_evt,priority:1;comment:event history id\"`\n\tSubId int64 `json:\"sub_id\" gorm:\"type:bigint;comment:subscribed rule id\"`\n\tChannel string `json:\"channel\" gorm:\"type:varchar(255);not null;comment:notification channel name\"`\n\tStatus int `json:\"status\" gorm:\"type:int;comment:notification status\"` // 1-成功,2-失败\n\tTarget string `json:\"target\" gorm:\"type:varchar(1024);not null;comment:notification target\"`\n\tDetails string `json:\"details\" gorm:\"type:varchar(2048);default:'';comment:notification other info\"`\n\tCreatedAt int64 `json:\"created_at\" gorm:\"type:bigint;not null;comment:create time\"`\n}\n\nfunc NewNotificationRecord(event *AlertCurEvent, notifyRuleID int64, channel, target string) *NotificationRecord {\n\treturn &NotificationRecord{\n\t\tNotifyRuleID: notifyRuleID,\n\t\tEventId: event.Id,\n\t\tSubId: event.SubRuleId,\n\t\tChannel: channel,\n\t\tStatus: NotiStatusSuccess,\n\t\tTarget: target,\n\t}\n}\n\nfunc (n *NotificationRecord) SetStatus(status int) {\n\tif n == nil {\n\t\treturn\n\t}\n\tn.Status = status\n}\n\nfunc (n *NotificationRecord) SetDetails(details string) {\n\tif n == nil {\n\t\treturn\n\t}\n\tn.Details = details\n}\n\nfunc (n *NotificationRecord) TableName() string {\n\treturn \"notification_record\"\n}\n\nfunc (n *NotificationRecord) Add(ctx *ctx.Context) error {\n\treturn Insert(ctx, n)\n}\n\nfunc (n *NotificationRecord) GetGroupIds(ctx *ctx.Context) (groupIds []int64) {\n\tif n == nil {\n\t\treturn\n\t}\n\n\tif n.SubId > 0 {\n\t\tif sub, err := AlertSubscribeGet(ctx, \"id=?\", n.SubId); err != nil {\n\t\t\tlogger.Errorf(\"AlertSubscribeGet failed, err: %v\", err)\n\t\t} else {\n\t\t\tgroupIds = strx.IdsInt64ForAPI(sub.UserGroupIds, \" \")\n\t\t}\n\t\treturn\n\t}\n\n\tif event, err := AlertHisEventGetById(ctx, n.EventId); err != nil {\n\t\tlogger.Errorf(\"AlertHisEventGetById failed, err: %v\", err)\n\t} else {\n\t\tgroupIds = strx.IdsInt64ForAPI(event.NotifyGroups, \" \")\n\t}\n\treturn\n}\n\nfunc NotificationRecordsGetByEventId(ctx *ctx.Context, eid int64) ([]*NotificationRecord, error) {\n\treturn NotificationRecordsGet(ctx, \"event_id=?\", eid)\n}\n\nfunc NotificationRecordsGet(ctx *ctx.Context, where string, args ...interface{}) ([]*NotificationRecord, error) {\n\tvar lst []*NotificationRecord\n\terr := DB(ctx).Where(where, args...).Find(&lst).Error\n\tif err != nil {\n\t\treturn nil, err\n\t}\n\n\treturn lst, nil\n}\n"
},
{
"path": "models/notify_channel.go",
"content": "package models\n\nimport (\n\t\"bytes\"\n\t\"crypto/hmac\"\n\t\"crypto/sha256\"\n\t\"crypto/tls\"\n\t\"encoding/hex\"\n\t\"encoding/json\"\n\t\"fmt\"\n\t\"html/template\"\n\t\"io\"\n\t\"net\"\n\t\"net/http\"\n\t\"net/url\"\n\t\"os\"\n\t\"os/exec\"\n\t\"path\"\n\t\"regexp\"\n\t\"sort\"\n\t\"strconv\"\n\t\"strings\"\n\t\"time\"\n\t\"unicode/utf8\"\n\n\t\"github.com/ccfos/nightingale/v6/pkg/cmdx\"\n\t\"github.com/ccfos/nightingale/v6/pkg/ctx\"\n\t\"github.com/ccfos/nightingale/v6/pkg/poster\"\n\t\"github.com/ccfos/nightingale/v6/pkg/tplx\"\n\t\"github.com/google/uuid\"\n\n\t\"github.com/pkg/errors\"\n\t\"github.com/toolkits/pkg/file\"\n\t\"github.com/toolkits/pkg/logger\"\n\t\"gopkg.in/gomail.v2\"\n)\n\ntype EmailContext struct {\n\tNotifyRuleId int64\n\tEvents []*AlertCurEvent\n\tMail *gomail.Message\n}\n\n// NotifyChannelConfig 通知媒介\ntype NotifyChannelConfig struct {\n\tID int64 `json:\"id\" gorm:\"primaryKey\"`\n\t// 基础配置\n\tName string `json:\"name\"` // 媒介名称\n\tIdent string `json:\"ident\"` // 媒介类型\n\tDescription string `json:\"description\"` // 媒介描述\n\tEnable bool `json:\"enable\"` // 是否启用\n\n\t// 用户参数配置\n\tParamConfig *NotifyParamConfig `json:\"param_config,omitempty\" gorm:\"serializer:json\"`\n\n\t// 通知请求配置\n\tRequestType string `json:\"request_type\"` // http, stmp, script, flashduty\n\tRequestConfig *RequestConfig `json:\"request_config,omitempty\" gorm:\"serializer:json\"`\n\n\tWeight int `json:\"weight\"` // 权重,根据此字段对内置模板进行排序\n\tCreateAt int64 `json:\"create_at\"`\n\tCreateBy string `json:\"create_by\"`\n\tUpdateAt int64 `json:\"update_at\"`\n\tUpdateBy string `json:\"update_by\"`\n\tUpdateByNickname string `json:\"update_by_nickname\" gorm:\"-\"`\n}\n\nfunc (ncc *NotifyChannelConfig) TableName() string {\n\treturn \"notify_channel\"\n}\n\ntype RequestConfig struct {\n\tHTTPRequestConfig *HTTPRequestConfig `json:\"http_request_config,omitempty\" gorm:\"serializer:json\"`\n\tSMTPRequestConfig *SMTPRequestConfig `json:\"smtp_request_config,omitempty\" gorm:\"serializer:json\"`\n\tScriptRequestConfig *ScriptRequestConfig `json:\"script_request_config,omitempty\" gorm:\"serializer:json\"`\n\tFlashDutyRequestConfig *FlashDutyRequestConfig `json:\"flashduty_request_config,omitempty\" gorm:\"serializer:json\"`\n\tPagerDutyRequestConfig *PagerDutyRequestConfig `json:\"pagerduty_request_config,omitempty\" gorm:\"serializer:json\"`\n}\n\n// NotifyParamConfig 参数配置\ntype NotifyParamConfig struct {\n\tUserInfo *UserInfo `json:\"user_info,omitempty\"`\n\tCustom Params `json:\"custom\"` // 自定义参数配置\n}\n\ntype Params struct {\n\tParams []ParamItem `json:\"params\"`\n}\n\ntype UserInfo struct {\n\tContactKey string `json:\"contact_key\"` // phone, email, dingtalk_robot_token 等\n}\n\n// FlashDutyParam flashduty 类型的参数配置\ntype FlashDutyRequestConfig struct {\n\tProxy string `json:\"proxy\"`\n\tIntegrationUrl string `json:\"integration_url\"`\n\tTimeout int `json:\"timeout\"` // 超时时间(毫秒)\n\tRetryTimes int `json:\"retry_times\"` // 重试次数\n\tRetrySleep int `json:\"retry_sleep\"` // 重试等待时间(毫秒)\n}\n\n// PagerDutyRequestConfig PagerDuty 类型的参数配置\ntype PagerDutyRequestConfig struct {\n\tProxy string `json:\"proxy\"`\n\tApiKey string `json:\"api_key\"` // PagerDuty 账户或用户的 API Key,不是集成的 Integration Key (routing key)\n\tTimeout int `json:\"timeout\"` // 超时时间(毫秒)\n\tRetryTimes int `json:\"retry_times\"` // 重试次数\n\tRetrySleep int `json:\"retry_sleep\"` // 重试等待时间(毫秒)\n}\n\n// ParamItem 自定义参数项\ntype ParamItem struct {\n\tKey string `json:\"key\"` // 参数键名\n\tCName string `json:\"cname\"` // 参数别名\n\tType string `json:\"type\"` // 参数类型,目前支持 string\n}\n\ntype SMTPRequestConfig struct {\n\tHost string `json:\"host\"`\n\tPort int `json:\"port\"`\n\tUsername string `json:\"username\"`\n\tPassword string `json:\"password\"`\n\tFrom string `json:\"from\"`\n\tInsecureSkipVerify bool `json:\"insecure_skip_verify\"`\n\tBatch int `json:\"batch\"`\n}\n\ntype ScriptRequestConfig struct {\n\tScriptType string `json:\"script_type\"` // 脚本类型,目前支持 python, shell\n\tTimeout int `json:\"timeout\"` // 超时时间(毫秒)\n\tScript string `json:\"script\"` // 脚本内容\n\tPath string `json:\"path\"` // 脚本路径\n}\n\n// HTTPRequestConfig 通知请求配置\ntype HTTPRequestConfig struct {\n\tURL string `json:\"url\"`\n\tMethod string `json:\"method\"` // GET, POST, PUT\n\tHeaders map[string]string `json:\"headers\"`\n\tProxy string `json:\"proxy\"`\n\tTimeout int `json:\"timeout\"` // 超时时间(毫秒)\n\tConcurrency int `json:\"concurrency\"` // 并发数\n\tRetryTimes int `json:\"retry_times\"` // 重试次数\n\tRetryInterval int `json:\"retry_interval\"` // 重试间隔(毫秒)\n\tTLS *TLSConfig `json:\"tls,omitempty\"`\n\tRequest RequestDetail `json:\"request\"`\n}\n\n// TLSConfig TLS 配置\ntype TLSConfig struct {\n\tEnable bool `json:\"enable\"`\n\tCertFile string `json:\"cert_file\"`\n\tKeyFile string `json:\"key_file\"`\n\tCAFile string `json:\"ca_file\"`\n\tSkipVerify bool `json:\"skip_verify\"`\n}\n\n// RequestDetail 请求详情配置\ntype RequestDetail struct {\n\tParameters map[string]string `json:\"parameters\"` // URL 参数\n\tForm string `json:\"form\"` // 来源\n\tBody string `json:\"body\"` // 请求体\n}\n\nfunc (ncc *NotifyChannelConfig) SendScript(events []*AlertCurEvent, tpl map[string]interface{}, params map[string]string, sendtos []string) (string, string, error) {\n\tconfig := ncc.RequestConfig.ScriptRequestConfig\n\tif config.Script == \"\" && config.Path == \"\" {\n\t\treturn \"\", \"\", fmt.Errorf(\"script or path is empty\")\n\t}\n\n\tfpath := \".notify_script_\" + strconv.FormatInt(ncc.ID, 10)\n\tif config.Path != \"\" {\n\t\tfpath = config.Path\n\t} else {\n\t\trewrite := true\n\t\tif file.IsExist(fpath) {\n\t\t\toldContent, err := file.ToString(fpath)\n\t\t\tif err != nil {\n\t\t\t\treturn \"\", \"\", fmt.Errorf(\"failed to read script file: %v\", err)\n\t\t\t}\n\n\t\t\tif oldContent == config.Script {\n\t\t\t\trewrite = false\n\t\t\t}\n\t\t}\n\n\t\tif rewrite {\n\t\t\t_, err := file.WriteString(fpath, config.Script)\n\t\t\tif err != nil {\n\t\t\t\treturn \"\", \"\", fmt.Errorf(\"failed to write script file: %v\", err)\n\t\t\t}\n\n\t\t\terr = os.Chmod(fpath, 0777)\n\t\t\tif err != nil {\n\t\t\t\treturn \"\", \"\", fmt.Errorf(\"failed to chmod script file: %v\", err)\n\t\t\t}\n\t\t}\n\n\t\tcur, _ := os.Getwd()\n\t\tfpath = path.Join(cur, fpath)\n\t}\n\n\tcmd := exec.Command(fpath)\n\tcmd.Stdin = bytes.NewReader(getStdinBytes(events, tpl, params, sendtos))\n\n\tvar buf bytes.Buffer\n\tcmd.Stdout = &buf\n\tcmd.Stderr = &buf\n\n\terr, isTimeout := cmdx.RunTimeout(cmd, time.Duration(config.Timeout)*time.Millisecond)\n\tlogger.Infof(\"event_script_notify_result: exec %s output: %s isTimeout: %v err: %v stdin: %s\", fpath, buf.String(), isTimeout, err, string(getStdinBytes(events, tpl, params, sendtos)))\n\n\tres := buf.String()\n\n\t// 截断超出长度的输出\n\tif len(res) > 512 {\n\t\t// 确保在有效的UTF-8字符边界处截断\n\t\tvalidLen := 0\n\t\tfor i := 0; i < 512 && i < len(res); {\n\t\t\t_, size := utf8.DecodeRuneInString(res[i:])\n\t\t\tif i+size > 512 {\n\t\t\t\tbreak\n\t\t\t}\n\t\t\ti += size\n\t\t\tvalidLen = i\n\t\t}\n\t\tres = res[:validLen] + \"...\"\n\t}\n\n\tif isTimeout {\n\t\tif err == nil {\n\t\t\treturn cmd.String(), res, errors.New(\"timeout and killed process\")\n\t\t}\n\n\t\treturn cmd.String(), res, err\n\t}\n\tif err != nil {\n\t\treturn cmd.String(), res, fmt.Errorf(\"failed to execute script: %v\", err)\n\t}\n\n\treturn cmd.String(), res, nil\n}\n\nfunc getStdinBytes(events []*AlertCurEvent, tpl map[string]interface{}, params map[string]string, sendtos []string) []byte {\n\tif len(events) == 0 {\n\t\treturn []byte(\"\")\n\t}\n\n\t// 创建一个 map 来存储所有数据\n\tdata := map[string]interface{}{\n\t\t\"event\": events[0],\n\t\t\"events\": events,\n\t\t\"tpl\": tpl,\n\t\t\"params\": params,\n\t\t\"sendtos\": sendtos,\n\t}\n\n\t// 将数据序列化为 JSON 字节数组\n\tjsonBytes, err := json.Marshal(data)\n\tif err != nil {\n\t\treturn nil\n\t}\n\n\treturn jsonBytes\n}\n\nfunc NotifyChannelStatistics(ctx *ctx.Context) (*Statistics, error) {\n\tif !ctx.IsCenter {\n\t\ts, err := poster.GetByUrls[*Statistics](ctx, \"/v1/n9e/statistic?name=notify_channel\")\n\t\treturn s, err\n\t}\n\n\tsession := DB(ctx).Model(&NotifyChannelConfig{}).Select(\"count(*) as total\", \"max(update_at) as last_updated\").Where(\"enable = ?\", true)\n\n\tvar stats []*Statistics\n\terr := session.Find(&stats).Error\n\tif err != nil {\n\t\treturn nil, err\n\t}\n\n\treturn stats[0], nil\n}\n\nfunc NotifyChannelGetsAll(ctx *ctx.Context) ([]*NotifyChannelConfig, error) {\n\tif !ctx.IsCenter {\n\t\tchannels, err := poster.GetByUrls[[]*NotifyChannelConfig](ctx, \"/v1/n9e/notify-channels\")\n\t\treturn channels, err\n\t}\n\n\tvar channels []*NotifyChannelConfig\n\terr := DB(ctx).Where(\"enable = ?\", true).Find(&channels).Error\n\tif err != nil {\n\t\treturn nil, err\n\t}\n\n\treturn channels, nil\n}\n\nfunc NotifyChannelGets(ctx *ctx.Context, id int64, name, ident string, enabled int) ([]*NotifyChannelConfig, error) {\n\tsession := DB(ctx)\n\n\tif id != 0 {\n\t\tsession = session.Where(\"id = ?\", id)\n\t}\n\n\tif name != \"\" {\n\t\tsession = session.Where(\"name = ?\", name)\n\t}\n\n\tif ident != \"\" {\n\t\tsession = session.Where(\"ident = ?\", ident)\n\t}\n\n\tif enabled != -1 {\n\t\tsession = session.Where(\"enable = ?\", enabled)\n\t}\n\n\tvar channels []*NotifyChannelConfig\n\terr := session.Find(&channels).Error\n\n\treturn channels, err\n}\n\nfunc GetHTTPClient(nc *NotifyChannelConfig) (*http.Client, error) {\n\tif nc.RequestConfig == nil || nc.RequestConfig.HTTPRequestConfig == nil {\n\t\treturn nil, fmt.Errorf(\"%+v http request config not found\", nc)\n\t}\n\n\thttpConfig := nc.RequestConfig.HTTPRequestConfig\n\n\t// 对于 FlashDuty 类型,优先使用 FlashDuty 配置中的超时时间\n\ttimeout := httpConfig.Timeout\n\tif nc.RequestType == \"flashduty\" && nc.RequestConfig.FlashDutyRequestConfig != nil {\n\t\tflashDutyTimeout := nc.RequestConfig.FlashDutyRequestConfig.Timeout\n\t\tif flashDutyTimeout > 0 {\n\t\t\ttimeout = flashDutyTimeout\n\t\t}\n\t}\n\n\tif timeout == 0 {\n\t\ttimeout = 10000 // HTTP 默认 10 秒\n\t}\n\n\tif httpConfig.Concurrency == 0 {\n\t\thttpConfig.Concurrency = 5\n\t}\n\n\tif httpConfig.RetryTimes == 0 {\n\t\thttpConfig.RetryTimes = 3\n\t}\n\tif httpConfig.RetryInterval == 0 {\n\t\thttpConfig.RetryInterval = 100\n\t}\n\n\t// 设置代理\n\tvar proxyFunc func(*http.Request) (*url.URL, error)\n\tproxy := httpConfig.Proxy\n\t// 对于 FlashDuty 类型,优先使用 FlashDuty 配置中的代理\n\tif nc.RequestType == \"flashduty\" && nc.RequestConfig.FlashDutyRequestConfig != nil && nc.RequestConfig.FlashDutyRequestConfig.Proxy != \"\" {\n\t\tproxy = nc.RequestConfig.FlashDutyRequestConfig.Proxy\n\t}\n\t// 对于 PagerDuty 类型,优先使用 PagerDuty 配置中的代理\n\tif nc.RequestType == \"pagerduty\" && nc.RequestConfig.PagerDutyRequestConfig != nil && nc.RequestConfig.PagerDutyRequestConfig.Proxy != \"\" {\n\t\tproxy = nc.RequestConfig.PagerDutyRequestConfig.Proxy\n\t}\n\tif proxy != \"\" {\n\t\tproxyURL, err := url.Parse(proxy)\n\t\tif err != nil {\n\t\t\treturn nil, fmt.Errorf(\"invalid proxy URL: %v\", err)\n\t\t}\n\t\tproxyFunc = http.ProxyURL(proxyURL)\n\t}\n\n\ttlsConfig := &tls.Config{\n\t\tInsecureSkipVerify: httpConfig.TLS != nil && httpConfig.TLS.SkipVerify,\n\t}\n\n\ttransport := &http.Transport{\n\t\tProxy: proxyFunc,\n\t\tTLSClientConfig: tlsConfig,\n\t\tDialContext: (&net.Dialer{\n\t\t\tTimeout: time.Duration(timeout) * time.Millisecond,\n\t\t}).DialContext,\n\t}\n\n\tclient := &http.Client{\n\t\tTransport: transport,\n\t\tTimeout: time.Duration(timeout) * time.Millisecond,\n\t}\n\n\treturn client, nil\n}\n\nfunc (ncc *NotifyChannelConfig) makeHTTPRequest(httpConfig *HTTPRequestConfig, url string, headers map[string]string, parameters map[string]string, body []byte) (*http.Request, error) {\n\treq, err := http.NewRequest(httpConfig.Method, url, bytes.NewBuffer(body))\n\tif err != nil {\n\t\tlogger.Errorf(\"failed to create request: %v\", err)\n\t\treturn nil, err\n\t}\n\n\tquery := req.URL.Query()\n\t// 设置请求头 腾讯云短信、语音特殊处理\n\tif ncc.Ident == \"tx-sms\" || ncc.Ident == \"tx-voice\" {\n\t\theaders = ncc.setTxHeader(headers, body)\n\t\tfor key, value := range headers {\n\t\t\treq.Header.Add(key, value)\n\t\t}\n\t} else if ncc.Ident == \"ali-sms\" || ncc.Ident == \"ali-voice\" {\n\t\treq, err = http.NewRequest(httpConfig.Method, url, nil)\n\t\tif err != nil {\n\t\t\treturn nil, err\n\t\t}\n\n\t\tquery, headers = ncc.getAliQuery(ncc.Ident, query, httpConfig.Request.Parameters[\"AccessKeyId\"], httpConfig.Request.Parameters[\"AccessKeySecret\"], parameters)\n\t\tfor key, value := range headers {\n\t\t\treq.Header.Set(key, value)\n\t\t}\n\t} else {\n\t\tfor key, value := range headers {\n\t\t\treq.Header.Add(key, value)\n\t\t}\n\t}\n\n\tif ncc.Ident != \"ali-sms\" && ncc.Ident != \"ali-voice\" {\n\t\tfor key, value := range parameters {\n\t\t\tquery.Add(key, value)\n\t\t}\n\t}\n\n\treq.URL.RawQuery = query.Encode()\n\t// 记录完整的请求信息\n\tlogger.Debugf(\"URL: %v, Method: %s, Headers: %+v, params: %+v, Body: %s\", req.URL, req.Method, req.Header, query, string(body))\n\n\treturn req, nil\n}\n\nfunc (ncc *NotifyChannelConfig) makeFlashDutyRequest(url string, bodyBytes []byte, flashDutyChannelID int64) (*http.Request, error) {\n\treq, err := http.NewRequest(\"POST\", url, bytes.NewBuffer(bodyBytes))\n\tif err != nil {\n\t\treturn nil, err\n\t}\n\n\t// 设置 URL 参数\n\tquery := req.URL.Query()\n\tif flashDutyChannelID != 0 {\n\t\t// 如果 flashduty 有配置协作空间(channel_id),则传入 channel_id 参数\n\t\tquery.Add(\"channel_id\", strconv.FormatInt(flashDutyChannelID, 10))\n\t}\n\treq.URL.RawQuery = query.Encode()\n\treq.Header.Add(\"Content-Type\", \"application/json\")\n\treturn req, nil\n}\n\nfunc (ncc *NotifyChannelConfig) SendFlashDuty(events []*AlertCurEvent, flashDutyChannelID int64, client *http.Client) (string, error) {\n\t// todo 每一个 channel 批量发送事件\n\tif client == nil {\n\t\treturn \"\", fmt.Errorf(\"http client not found\")\n\t}\n\n\tbody, err := json.Marshal(events)\n\tif err != nil {\n\t\treturn \"\", err\n\t}\n\n\turl := ncc.RequestConfig.FlashDutyRequestConfig.IntegrationUrl\n\n\tretrySleep := time.Second\n\tif ncc.RequestConfig.FlashDutyRequestConfig.RetrySleep > 0 {\n\t\tretrySleep = time.Duration(ncc.RequestConfig.FlashDutyRequestConfig.RetrySleep) * time.Millisecond\n\t}\n\n\tretryTimes := 3\n\tif ncc.RequestConfig.FlashDutyRequestConfig.RetryTimes > 0 {\n\t\tretryTimes = ncc.RequestConfig.FlashDutyRequestConfig.RetryTimes\n\t}\n\n\t// 把最后一次错误保存下来,后面返回,让用户在页面上也可以看到\n\tvar lastErrorMessage string\n\tfor i := 0; i <= retryTimes; i++ {\n\t\treq, err := ncc.makeFlashDutyRequest(url, body, flashDutyChannelID)\n\t\tif err != nil {\n\t\t\tlogger.Errorf(\"send_flashduty: failed to create request. url=%s request_body=%s error=%v\", url, string(body), err)\n\t\t\treturn fmt.Sprintf(\"failed to create request. error: %v\", err), err\n\t\t}\n\n\t\t// 直接使用客户端发送请求,超时时间已经在 client 中设置\n\t\tresp, err := client.Do(req)\n\t\tif err != nil {\n\t\t\tlogger.Errorf(\"send_flashduty: http_call=fail url=%s request_body=%s error=%v times=%d\", url, string(body), err, i+1)\n\t\t\tif i < retryTimes {\n\t\t\t\t// 重试等待时间,后面要放到页面上配置\n\t\t\t\ttime.Sleep(retrySleep)\n\t\t\t}\n\t\t\tlastErrorMessage = err.Error()\n\t\t\tcontinue\n\t\t}\n\n\t\t// 走到这里,说明请求 Flashduty 成功,不管 Flashduty 返回了什么结果,都不判断,仅保存,给用户查看即可\n\t\t// 比如服务端返回 5xx,也不要重试,重试可能会导致服务端数据有问题。告警事件这样的东西,没有那么关键,只要最终能在 UI 上看到调用结果就行\n\t\tvar resBody []byte\n\t\tif resp.Body != nil {\n\t\t\tdefer resp.Body.Close()\n\n\t\t\tresBody, err = io.ReadAll(resp.Body)\n\t\t\tif err != nil {\n\t\t\t\tlogger.Errorf(\"send_flashduty: failed to read response. request_body=%s, error=%v\", string(body), err)\n\t\t\t\tresBody = []byte(\"failed to read response. error: \" + err.Error())\n\t\t\t}\n\t\t}\n\n\t\tlogger.Infof(\"send_flashduty: http_call=succ url=%s request_body=%s response_code=%d response_body=%s times=%d\", url, string(body), resp.StatusCode, string(resBody), i+1)\n\t\treturn fmt.Sprintf(\"status_code:%d, response:%s\", resp.StatusCode, string(resBody)), nil\n\t}\n\n\treturn lastErrorMessage, errors.New(\"failed to send request\")\n}\n\nfunc (ncc *NotifyChannelConfig) SendPagerDuty(events []*AlertCurEvent, routingKey, siteUrl string, client *http.Client) (string, error) {\n\tif client == nil {\n\t\treturn \"\", fmt.Errorf(\"http client not found\")\n\t}\n\tif ncc.RequestConfig == nil || ncc.RequestConfig.PagerDutyRequestConfig == nil {\n\t\treturn \"\", fmt.Errorf(\"pagerduty request config not found\")\n\t}\n\n\tretrySleep := time.Second\n\tif ncc.RequestConfig.PagerDutyRequestConfig.RetrySleep > 0 {\n\t\tretrySleep = time.Duration(ncc.RequestConfig.PagerDutyRequestConfig.RetrySleep) * time.Millisecond\n\t}\n\n\tretryTimes := 3\n\tif ncc.RequestConfig.PagerDutyRequestConfig.RetryTimes > 0 {\n\t\tretryTimes = ncc.RequestConfig.PagerDutyRequestConfig.RetryTimes\n\t}\n\n\tendpoint := \"https://events.pagerduty.com/v2/enqueue\"\n\tvar failedMsgs []string\n\tvar responses []string\n\n\tfor _, event := range events {\n\t\taction := \"trigger\"\n\t\tif event.IsRecovered {\n\t\t\taction = \"resolve\"\n\t\t}\n\n\t\tseverity := \"critical\"\n\t\tswitch event.Severity {\n\t\tcase 2:\n\t\t\tseverity = \"error\"\n\t\tcase 3:\n\t\t\tseverity = \"warning\"\n\t\t}\n\n\t\tjsonBody := map[string]interface{}{\n\t\t\t\"routing_key\": routingKey,\n\t\t\t\"event_action\": action,\n\t\t\t\"dedup_key\": event.Hash,\n\t\t\t\"payload\": map[string]interface{}{\n\t\t\t\t\"summary\": event.RuleName,\n\t\t\t\t\"source\": event.Cluster,\n\t\t\t\t\"severity\": severity,\n\t\t\t\t\"group\": event.GroupName,\n\t\t\t\t\"component\": event.Target,\n\t\t\t\t\"timestamp\": time.Unix(event.TriggerTime, 0).Format(time.RFC3339),\n\t\t\t\t\"custom_details\": map[string]interface{}{\n\t\t\t\t\t\"tags\": event.TagsJSON,\n\t\t\t\t\t\"annotations\": event.AnnotationsJSON,\n\t\t\t\t\t\"cluster\": event.Cluster,\n\t\t\t\t\t\"rule_id\": event.RuleId,\n\t\t\t\t\t\"rule_note\": event.RuleNote,\n\t\t\t\t\t\"rule_prod\": event.RuleProd,\n\t\t\t\t\t\"prom_ql\": event.PromQl,\n\t\t\t\t\t\"target_ident\": event.TargetIdent,\n\t\t\t\t\t\"target_note\": event.TargetNote,\n\t\t\t\t\t\"datasource_id\": event.DatasourceId,\n\t\t\t\t\t\"first_trigger_time\": time.Unix(event.FirstTriggerTime, 0).Format(time.RFC3339),\n\t\t\t\t\t\"prom_for_duration\": event.PromForDuration,\n\t\t\t\t\t\"runbook_url\": event.RunbookUrl,\n\t\t\t\t\t\"notify_cur_number\": event.NotifyCurNumber,\n\t\t\t\t\t\"group_id\": event.GroupId,\n\t\t\t\t\t\"cate\": event.Cate,\n\t\t\t\t},\n\t\t\t},\n\t\t\t\"links\": []map[string]string{\n\t\t\t\t{\"href\": fmt.Sprintf(\"%s/alert-his-events/%d\", siteUrl, event.Id), \"text\": \"Event Detail\"},\n\t\t\t\t{\"href\": fmt.Sprintf(\"%s/alert-mutes/add?__event_id=%d\", siteUrl, event.Id), \"text\": \"Mute this alert\"},\n\t\t\t},\n\t\t}\n\n\t\tbody, err := json.Marshal(jsonBody)\n\t\tif err != nil {\n\t\t\tlogger.Errorf(\"send_pagerduty: failed to marshal request body. error=%v\", err)\n\t\t\tfailedMsgs = append(failedMsgs, fmt.Sprintf(\"event %d marshal error: %v\", event.Id, err))\n\t\t\t// 记录一条空响应占位,方便上层区分事件\n\t\t\tresponses = append(responses, fmt.Sprintf(\"event %d: marshal error: %v\", event.Id, err))\n\t\t\tcontinue\n\t\t}\n\n\t\tvar lastErrorMessage string\n\t\tvar lastRespSummary string\n\t\tattempts := retryTimes + 1\n\t\tfor i := 0; i < attempts; i++ {\n\t\t\treq, err := http.NewRequest(\"POST\", endpoint, bytes.NewReader(body))\n\t\t\tif err != nil {\n\t\t\t\tlogger.Errorf(\"send_pagerduty: failed to create request. url=%s request_body=%s error=%v\", endpoint, string(body), err)\n\t\t\t\tlastErrorMessage = err.Error()\n\t\t\t\tif i < attempts-1 {\n\t\t\t\t\ttime.Sleep(retrySleep)\n\t\t\t\t\tcontinue\n\t\t\t\t}\n\t\t\t\tbreak\n\t\t\t}\n\t\t\treq.Header.Add(\"Content-Type\", \"application/json\")\n\n\t\t\tresp, err := client.Do(req)\n\t\t\tif err != nil {\n\t\t\t\tlogger.Errorf(\"send_pagerduty: http_call=fail url=%s request_body=%s error=%v times=%d\", endpoint, string(body), err, i+1)\n\t\t\t\tlastErrorMessage = err.Error()\n\t\t\t\tif i < attempts-1 {\n\t\t\t\t\ttime.Sleep(retrySleep)\n\t\t\t\t\tcontinue\n\t\t\t\t}\n\t\t\t\tbreak\n\t\t\t}\n\n\t\t\t// 确保关闭 body\n\t\t\tvar resBody []byte\n\t\t\tif resp.Body != nil {\n\t\t\t\tresBody, err = io.ReadAll(resp.Body)\n\t\t\t\tresp.Body.Close()\n\t\t\t\tif err != nil {\n\t\t\t\t\tlogger.Errorf(\"send_pagerduty: failed to read response. request_body=%s, error=%v\", string(body), err)\n\t\t\t\t\tresBody = []byte(\"failed to read response. error: \" + err.Error())\n\t\t\t\t}\n\t\t\t} else {\n\t\t\t\tresBody = []byte(\"\")\n\t\t\t}\n\n\t\t\trespSummary := fmt.Sprintf(\"status_code:%d, response:%s\", resp.StatusCode, string(resBody))\n\t\t\tlastRespSummary = respSummary\n\n\t\t\tlogger.Infof(\"send_pagerduty: http_call=succ url=%s request_body=%s response_code=%d response_body=%s times=%d\", endpoint, string(body), resp.StatusCode, string(resBody), i+1)\n\n\t\t\tif resp.StatusCode == http.StatusOK || resp.StatusCode == http.StatusAccepted {\n\t\t\t\t// 当前事件发送成功\n\t\t\t\tlastErrorMessage = \"\"\n\t\t\t\tbreak\n\t\t\t}\n\n\t\t\tlastErrorMessage = respSummary\n\t\t\tif i < attempts-1 {\n\t\t\t\ttime.Sleep(retrySleep)\n\t\t\t\tcontinue\n\t\t\t}\n\t\t\tbreak\n\t\t}\n\n\t\t// 保存本次事件的响应摘要(无论成功或失败),便于上层记录 traceId 等信息\n\t\tif lastRespSummary == \"\" && lastErrorMessage != \"\" {\n\t\t\tlastRespSummary = lastErrorMessage\n\t\t}\n\t\tresponses = append(responses, fmt.Sprintf(\"event %d: %s\", event.Id, lastRespSummary))\n\n\t\tif lastErrorMessage != \"\" {\n\t\t\tfailedMsgs = append(failedMsgs, fmt.Sprintf(\"event %d: %s\", event.Id, lastErrorMessage))\n\t\t}\n\t}\n\n\t// 将每个 event 的响应摘要返回给上层,便于记录 pagerduty 返回的 traceId 等信息\n\tif len(failedMsgs) > 0 {\n\t\treturn strings.Join(responses, \" | \"), errors.New(strings.Join(failedMsgs, \" | \"))\n\t}\n\treturn strings.Join(responses, \" | \"), nil\n}\n\nfunc (ncc *NotifyChannelConfig) SendHTTP(events []*AlertCurEvent, tpl map[string]interface{}, params map[string]string, sendtos []string, client *http.Client) (string, error) {\n\tif client == nil {\n\t\treturn \"\", fmt.Errorf(\"http client not found\")\n\t}\n\n\tif len(events) == 0 {\n\t\treturn \"\", fmt.Errorf(\"events is empty\")\n\t}\n\n\thttpConfig := ncc.RequestConfig.HTTPRequestConfig\n\n\t// MessageTemplate\n\tfullTpl := make(map[string]interface{})\n\n\tfullTpl[\"sendtos\"] = sendtos // 发送对象\n\tfullTpl[\"params\"] = params // 自定义参数\n\tfullTpl[\"tpl\"] = tpl\n\tfullTpl[\"events\"] = events\n\tfullTpl[\"event\"] = events[0]\n\n\tif len(sendtos) > 0 {\n\t\tfullTpl[\"sendto\"] = sendtos[0]\n\t}\n\n\t// 将 MessageTemplate 与变量配置的信息渲染进 reqBody\n\tbody, err := ncc.parseRequestBody(fullTpl)\n\tif err != nil {\n\t\tlogger.Errorf(\"failed to parse request body: %v, event: %v\", err, events)\n\t\treturn \"\", err\n\t}\n\n\t// 替换 URL Header Parameters 中的变量\n\turl, headers, parameters := ncc.replaceVariables(fullTpl)\n\tlogger.Infof(\"url: %v, headers: %v, parameters: %v\", url, headers, parameters)\n\n\t// 重试机制\n\tvar lastErrorMessage string\n\tfor i := 0; i < httpConfig.RetryTimes; i++ {\n\t\tvar resp *http.Response\n\t\treq, err := ncc.makeHTTPRequest(httpConfig, url, headers, parameters, body)\n\t\tif err != nil {\n\t\t\tlogger.Errorf(\"send_http: failed to create request. url=%s request_body=%s error=%v\", url, string(body), err)\n\t\t\treturn fmt.Sprintf(\"failed to create request. error: %v\", err), err\n\t\t}\n\n\t\tresp, err = client.Do(req)\n\t\tif err != nil {\n\t\t\tlogger.Errorf(\"send_http: failed to send http notify. url=%s request_body=%s error=%v\", url, string(body), err)\n\t\t\tlastErrorMessage = err.Error()\n\t\t\ttime.Sleep(time.Duration(httpConfig.RetryInterval) * time.Millisecond)\n\t\t\tcontinue\n\t\t}\n\t\tdefer resp.Body.Close()\n\n\t\t// 读取响应\n\t\tbody, err := io.ReadAll(resp.Body)\n\t\tlogger.Debugf(\"send http request: %+v, response: %+v, body: %+v\", req, resp, string(body))\n\t\tif err != nil {\n\t\t\tlogger.Errorf(\"send_http: failed to read response. url=%s request_body=%s error=%v\", url, string(body), err)\n\t\t}\n\t\tif resp.StatusCode == http.StatusOK {\n\t\t\treturn fmt.Sprintf(\"status_code:%d, response:%s\", resp.StatusCode, string(body)), nil\n\t\t}\n\n\t\treturn fmt.Sprintf(\"status_code:%d, response:%s\", resp.StatusCode, string(body)), fmt.Errorf(\"failed to send request, status code: %d, body: %s\", resp.StatusCode, string(body))\n\t}\n\n\treturn lastErrorMessage, errors.New(\"all retries failed, last error: \" + lastErrorMessage)\n}\n\n// getAliQuery 获取阿里云API的查询参数和请求头\nfunc (ncc *NotifyChannelConfig) getAliQuery(ident string, query url.Values, ak, sk string, params map[string]string) (url.Values, map[string]string) {\n\t// 获取基础配置\n\thttpConfig := ncc.RequestConfig.HTTPRequestConfig\n\n\thttpMethod := \"POST\"\n\tcanonicalURI := \"/\"\n\n\tvar queryParams map[string]string\n\tif ident == \"ali-sms\" {\n\t\tqueryParams = map[string]string{\n\t\t\t\"PhoneNumbers\": params[\"PhoneNumbers\"],\n\t\t\t\"SignName\": params[\"SignName\"],\n\t\t\t\"TemplateCode\": params[\"TemplateCode\"],\n\t\t\t\"TemplateParam\": params[\"TemplateParam\"],\n\t\t}\n\t} else if ident == \"ali-voice\" {\n\t\tqueryParams = map[string]string{\n\t\t\t\"CalledNumber\": params[\"CalledNumber\"],\n\t\t\t\"TtsCode\": params[\"TtsCode\"],\n\t\t\t\"TtsParam\": params[\"TtsParam\"],\n\t\t\t\"CalledShowNumber\": params[\"CalledShowNumber\"],\n\t\t}\n\t}\n\n\t// 设置基础headers\n\theaders := map[string]string{\n\t\t\"host\": httpConfig.Headers[\"Host\"],\n\t\t\"x-acs-version\": \"2017-05-25\",\n\t\t\"x-acs-date\": time.Now().UTC().Format(\"2006-01-02T15:04:05Z\"),\n\t\t\"x-acs-signature-nonce\": uuid.New().String(),\n\t\t\"x-acs-content-sha256\": fmt.Sprintf(\"%x\", sha256.Sum256([]byte(\"\"))),\n\t}\n\n\t// 根据服务类型设置action\n\tif ncc.Ident == \"ali-sms\" {\n\t\theaders[\"x-acs-action\"] = \"SendSms\"\n\t} else if ncc.Ident == \"ali-voice\" {\n\t\theaders[\"x-acs-action\"] = \"SingleCallByTts\"\n\t}\n\n\t// 计算签名\n\tsignature, signedHeaders := getSignature(sk, httpMethod, canonicalURI, headers, queryParams, \"\")\n\n\t// 添加授权头\n\theaders[\"Authorization\"] = fmt.Sprintf(\"ACS3-HMAC-SHA256 Credential=%s,SignedHeaders=%s,Signature=%s\",\n\t\tak, signedHeaders, signature)\n\n\t// 业务参数\n\tfor k, v := range queryParams {\n\t\tquery.Add(k, v)\n\t}\n\n\tquery.Del(\"AccessKeyId\")\n\tquery.Del(\"AccessKeySecret\")\n\n\treturn query, headers\n}\n\n// getSignature 计算签名\nfunc getSignature(accessKeySecret string, httpMethod, canonicalURI string, headers map[string]string, queryParams map[string]string, body string) (string, string) {\n\t// 1. 构造规范化请求\n\t// 处理查询参数\n\tvar sortedQueryParams []string\n\tfor k, v := range queryParams {\n\t\tsortedQueryParams = append(sortedQueryParams, fmt.Sprintf(\"%s=%s\",\n\t\t\tpercentEncode(k), percentEncode(v)))\n\t}\n\tsort.Strings(sortedQueryParams)\n\tcanonicalQueryString := strings.Join(sortedQueryParams, \"&\")\n\n\t// 处理请求头\n\tvar canonicalHeaders []string\n\tvar signedHeaders []string\n\tfor k, v := range headers {\n\t\tlowerK := strings.ToLower(k)\n\t\tif lowerK == \"host\" || lowerK == \"content-type\" || strings.HasPrefix(lowerK, \"x-acs-\") {\n\t\t\tcanonicalHeaders = append(canonicalHeaders, fmt.Sprintf(\"%s:%s\", lowerK, strings.TrimSpace(v)))\n\t\t\tsignedHeaders = append(signedHeaders, lowerK)\n\t\t}\n\t}\n\tsort.Strings(canonicalHeaders)\n\tsort.Strings(signedHeaders)\n\n\tcanonicalHeadersStr := strings.Join(canonicalHeaders, \"\\n\") + \"\\n\"\n\tsignedHeadersStr := strings.Join(signedHeaders, \";\")\n\n\t// 计算body的hash值\n\th := sha256.New()\n\th.Write([]byte(body))\n\tbodyHash := hex.EncodeToString(h.Sum(nil))\n\n\t// 构造规范化请求\n\tcanonicalRequest := fmt.Sprintf(\"%s\\n%s\\n%s\\n%s\\n%s\\n%s\",\n\t\thttpMethod, canonicalURI, canonicalQueryString, canonicalHeadersStr,\n\t\tsignedHeadersStr, bodyHash)\n\n\t// 2. 构造待签名字符串\n\talgorithm := \"ACS3-HMAC-SHA256\"\n\th = sha256.New()\n\th.Write([]byte(canonicalRequest))\n\tcanonicalRequestHash := hex.EncodeToString(h.Sum(nil))\n\tstringToSign := fmt.Sprintf(\"%s\\n%s\", algorithm, canonicalRequestHash)\n\n\t// 3. 计算签名\n\th = hmac.New(sha256.New, []byte(accessKeySecret))\n\th.Write([]byte(stringToSign))\n\tsignature := hex.EncodeToString(h.Sum(nil))\n\n\treturn signature, signedHeadersStr\n}\n\nfunc percentEncode(str string) string {\n\tencoded := url.QueryEscape(str)\n\tencoded = strings.ReplaceAll(encoded, \"+\", \"%20\")\n\tencoded = strings.ReplaceAll(encoded, \"*\", \"%2A\")\n\tencoded = strings.ReplaceAll(encoded, \"%7E\", \"~\")\n\treturn encoded\n}\n\nfunc (ncc *NotifyChannelConfig) setTxHeader(headers map[string]string, payloadBytes []byte) map[string]string {\n\ttimestamp := time.Now().Unix()\n\n\tauthorization := ncc.getTxSignature(string(payloadBytes), timestamp)\n\theaders[\"X-TC-Timestamp\"] = fmt.Sprintf(\"%d\", timestamp)\n\theaders[\"Authorization\"] = authorization\n\n\treturn headers\n}\n\nfunc (ncc *NotifyChannelConfig) getTxSignature(payloadStr string, timestamp int64) string {\n\thttpConfig := ncc.RequestConfig.HTTPRequestConfig\n\n\tcanonicalHeaders := fmt.Sprintf(\"content-type:application/json\\nhost:%s\\nx-tc-action:%s\\n\",\n\t\thttpConfig.Headers[\"Host\"], strings.ToLower(httpConfig.Headers[\"X-TC-Action\"]))\n\n\thasher := sha256.New()\n\thasher.Write([]byte(payloadStr))\n\thashedRequestPayload := hex.EncodeToString(hasher.Sum(nil))\n\tcanonicalRequest := fmt.Sprintf(\"%s\\n%s\\n%s\\n%s\\n%s\\n%s\",\n\t\thttpConfig.Method,\n\t\t\"/\",\n\t\t\"\",\n\t\tcanonicalHeaders,\n\t\t\"content-type;host;x-tc-action\",\n\t\thashedRequestPayload)\n\n\t// 1. 生成日期\n\tdate := time.Unix(timestamp, 0).UTC().Format(\"2006-01-02\")\n\t// 2. 拼接待签名字符串\n\tcredentialScope := fmt.Sprintf(\"%s/%s/tc3_request\", date, httpConfig.Headers[\"Service\"])\n\thasher = sha256.New()\n\thasher.Write([]byte(canonicalRequest))\n\thashedCanonicalRequest := hex.EncodeToString(hasher.Sum(nil))\n\tstringToSign := fmt.Sprintf(\"TC3-HMAC-SHA256\\n%d\\n%s\\n%s\",\n\t\ttimestamp,\n\t\tcredentialScope,\n\t\thashedCanonicalRequest)\n\t// 3. 计算签名\n\tsecretDate := sign([]byte(\"TC3\"+httpConfig.Headers[\"Secret_Key\"]), date)\n\tsecretService := sign(secretDate, httpConfig.Headers[\"Service\"])\n\tsecretSigning := sign(secretService, \"tc3_request\")\n\tsignature := hex.EncodeToString(sign(secretSigning, stringToSign))\n\t// 4. 组织Authorization\n\tauthorization := fmt.Sprintf(\"TC3-HMAC-SHA256 Credential=%s/%s, SignedHeaders=%s, Signature=%s\",\n\t\thttpConfig.Headers[\"Secret_ID\"], credentialScope, \"content-type;host;x-tc-action\", signature)\n\treturn authorization\n}\n\nfunc sign(key []byte, msg string) []byte {\n\th := hmac.New(sha256.New, key)\n\th.Write([]byte(msg))\n\treturn h.Sum(nil)\n}\n\nfunc (ncc *NotifyChannelConfig) parseRequestBody(bodyTpl map[string]interface{}) ([]byte, error) {\n\tvar defs = []string{\n\t\t\"{{$tpl := .tpl}}\",\n\t\t\"{{$sendto := .sendto}}\",\n\t\t\"{{$sendtos := .sendtos}}\",\n\t\t\"{{$params := .params}}\",\n\t\t\"{{$events := .events}}\",\n\t\t\"{{$event := .event}}\",\n\t}\n\n\ttext := strings.Join(append(defs, ncc.RequestConfig.HTTPRequestConfig.Request.Body), \"\")\n\ttpl, err := template.New(\"requestBody\").Funcs(tplx.TemplateFuncMap).Parse(text)\n\tif err != nil {\n\t\treturn nil, err\n\t}\n\n\tvar body bytes.Buffer\n\terr = tpl.Execute(&body, bodyTpl)\n\treturn body.Bytes(), err\n}\n\nfunc getParsedString(name, tplStr string, tplData map[string]interface{}) string {\n\tvar defs = []string{\n\t\t\"{{$tpl := .tpl}}\",\n\t\t\"{{$sendto := .sendto}}\",\n\t\t\"{{$sendtos := .sendtos}}\",\n\t\t\"{{$params := .params}}\",\n\t\t\"{{$events := .events}}\",\n\t\t\"{{$event := .event}}\",\n\t}\n\n\ttext := strings.Join(append(defs, tplStr), \"\")\n\ttpl, err := template.New(name).Funcs(tplx.TemplateFuncMap).Parse(text)\n\tif err != nil {\n\t\treturn \"\"\n\t}\n\tvar body bytes.Buffer\n\terr = tpl.Execute(&body, tplData)\n\tif err != nil {\n\t\treturn fmt.Sprintf(\"failed to parse template: %v data: %v\", err, tplData)\n\t}\n\n\treturn body.String()\n}\n\nfunc (ncc *NotifyChannelConfig) replaceVariables(tpl map[string]interface{}) (string, map[string]string, map[string]string) {\n\thttpConfig := ncc.RequestConfig.HTTPRequestConfig\n\turl := \"\"\n\theaders := make(map[string]string)\n\tparameters := make(map[string]string)\n\n\tif needsTemplateRendering(httpConfig.URL) {\n\t\tlogger.Infof(\"replace variables url: %s tpl: %+v\", httpConfig.URL, tpl)\n\t\turl = getParsedString(\"url\", httpConfig.URL, tpl)\n\t} else {\n\t\turl = httpConfig.URL\n\t}\n\n\tfor key, value := range httpConfig.Headers {\n\t\tif needsTemplateRendering(value) {\n\t\t\theaders[key] = getParsedString(key, value, tpl)\n\t\t} else {\n\t\t\theaders[key] = value\n\t\t}\n\t}\n\n\tfor key, value := range httpConfig.Request.Parameters {\n\t\tif needsTemplateRendering(value) {\n\t\t\tparameters[key] = getParsedString(key, value, tpl)\n\t\t} else {\n\t\t\tparameters[key] = value\n\t\t}\n\t}\n\n\treturn url, headers, parameters\n}\n\n// needsTemplateRendering 检查字符串是否包含模板语法\nfunc needsTemplateRendering(s string) bool {\n\treturn strings.Contains(s, \"{{\") && strings.Contains(s, \"}}\")\n}\n\nfunc (ncc *NotifyChannelConfig) SendEmail(notifyRuleId int64, events []*AlertCurEvent, tpl map[string]interface{}, sendtos []string, ch chan *EmailContext) {\n\tm := gomail.NewMessage()\n\tm.SetHeader(\"From\", ncc.RequestConfig.SMTPRequestConfig.From)\n\tm.SetHeader(\"To\", sendtos...)\n\tm.SetHeader(\"Subject\", tpl[\"subject\"].(string))\n\tm.SetBody(\"text/html\", tpl[\"content\"].(string))\n\tch <- &EmailContext{notifyRuleId, events, m}\n}\n\nfunc (ncc *NotifyChannelConfig) SendEmailNow(events []*AlertCurEvent, tpl map[string]interface{}, sendtos []string) error {\n\n\td := gomail.NewDialer(ncc.RequestConfig.SMTPRequestConfig.Host, ncc.RequestConfig.SMTPRequestConfig.Port, ncc.RequestConfig.SMTPRequestConfig.Username, ncc.RequestConfig.SMTPRequestConfig.Password)\n\tif ncc.RequestConfig.SMTPRequestConfig.InsecureSkipVerify {\n\t\td.TLSConfig = &tls.Config{InsecureSkipVerify: true}\n\t}\n\ts, err := d.Dial()\n\tif err != nil {\n\t\tlogger.Errorf(\"email_sender: failed to dial: %s\", err)\n\t\treturn err\n\t}\n\n\tm := gomail.NewMessage()\n\tm.SetHeader(\"From\", ncc.RequestConfig.SMTPRequestConfig.From)\n\tm.SetHeader(\"To\", sendtos...)\n\tm.SetHeader(\"Subject\", tpl[\"subject\"].(string))\n\tm.SetBody(\"text/html\", tpl[\"content\"].(string))\n\treturn gomail.Send(s, m)\n}\n\nfunc (ncc *NotifyChannelConfig) Verify() error {\n\tif ncc.Name == \"\" {\n\t\treturn errors.New(\"channel name cannot be empty\")\n\t}\n\n\tif ncc.Ident == \"\" {\n\t\treturn errors.New(\"channel identifier cannot be empty\")\n\t}\n\n\tif !regexp.MustCompile(\"^[a-zA-Z0-9_-]+$\").MatchString(ncc.Ident) {\n\t\treturn fmt.Errorf(\"channel identifier must be ^[a-zA-Z0-9_-]+$, current: %s\", ncc.Ident)\n\t}\n\n\tif ncc.RequestType != \"http\" && ncc.RequestType != \"smtp\" && ncc.RequestType != \"script\" && ncc.RequestType != \"flashduty\" && ncc.RequestType != \"pagerduty\" {\n\t\treturn errors.New(\"invalid request type, must be 'http', 'smtp' or 'script'\")\n\t}\n\n\tif ncc.ParamConfig != nil {\n\t\tfor _, param := range ncc.ParamConfig.Custom.Params {\n\t\t\tif param.Key != \"\" && param.CName == \"\" {\n\t\t\t\treturn errors.New(\"param items must have valid cname\")\n\t\t\t}\n\t\t}\n\t}\n\n\t// 校验 Request 配置\n\tswitch ncc.RequestType {\n\tcase \"http\":\n\t\tif err := ncc.ValidateHTTPRequestConfig(); err != nil {\n\t\t\treturn err\n\t\t}\n\tcase \"smtp\":\n\t\tif err := ncc.ValidateSMTPRequestConfig(); err != nil {\n\t\t\treturn err\n\t\t}\n\tcase \"script\":\n\t\tif err := ncc.ValidateScriptRequestConfig(); err != nil {\n\t\t\treturn err\n\t\t}\n\tcase \"flashduty\":\n\t\tif err := ncc.ValidateFlashDutyRequestConfig(); err != nil {\n\t\t\treturn err\n\t\t}\n\tcase \"pagerduty\":\n\t\tif err := ncc.ValidatePagerDutyRequestConfig(); err != nil {\n\t\t\treturn err\n\t\t}\n\t}\n\n\treturn nil\n}\n\nfunc (ncc *NotifyChannelConfig) ValidateHTTPRequestConfig() error {\n\tif ncc.RequestConfig.HTTPRequestConfig == nil {\n\t\treturn errors.New(\"http request config cannot be nil\")\n\t}\n\treturn ncc.RequestConfig.HTTPRequestConfig.Verify()\n}\n\nfunc (c *HTTPRequestConfig) Verify() error {\n\tif c.URL == \"\" {\n\t\treturn errors.New(\"http request URL cannot be empty\")\n\t}\n\tif c.Method == \"\" {\n\t\treturn errors.New(\"http request method cannot be empty\")\n\t}\n\tif !(c.Method == \"GET\" || c.Method == \"POST\" || c.Method == \"PUT\") {\n\t\treturn errors.New(\"http request method must be GET, POST or PUT\")\n\t}\n\n\treturn nil\n}\n\nfunc (ncc *NotifyChannelConfig) ValidateSMTPRequestConfig() error {\n\tif ncc.RequestConfig.SMTPRequestConfig == nil {\n\t\treturn errors.New(\"smtp request config cannot be nil\")\n\t}\n\treturn ncc.RequestConfig.SMTPRequestConfig.Verify()\n}\n\nfunc (c *SMTPRequestConfig) Verify() error {\n\tif c.Host == \"\" {\n\t\treturn errors.New(\"smtp host cannot be empty\")\n\t}\n\tif c.Port <= 0 {\n\t\treturn errors.New(\"smtp port must be greater than 0\")\n\t}\n\tif c.Username == \"\" {\n\t\treturn errors.New(\"smtp username cannot be empty\")\n\t}\n\tif c.Password == \"\" {\n\t\treturn errors.New(\"smtp password cannot be empty\")\n\t}\n\tif c.From == \"\" {\n\t\treturn errors.New(\"smtp from address cannot be empty\")\n\t}\n\n\treturn nil\n}\n\nfunc (ncc *NotifyChannelConfig) ValidateScriptRequestConfig() error {\n\tif ncc.RequestConfig.ScriptRequestConfig == nil {\n\t\treturn errors.New(\"script request config cannot be nil\")\n\t}\n\tif !(ncc.RequestConfig.ScriptRequestConfig.ScriptType == \"script\" || ncc.RequestConfig.ScriptRequestConfig.ScriptType == \"path\") {\n\t\treturn errors.New(\"script type must be 'script' or 'path'\")\n\t}\n\tif ncc.RequestConfig.ScriptRequestConfig.Script == \"\" && ncc.RequestConfig.ScriptRequestConfig.Path == \"\" {\n\t\treturn errors.New(\"either script content or script path must be provided\")\n\t}\n\n\treturn nil\n}\n\nfunc (ncc *NotifyChannelConfig) ValidateFlashDutyRequestConfig() error {\n\tif ncc.RequestConfig.FlashDutyRequestConfig == nil {\n\t\treturn errors.New(\"flashduty request config cannot be nil\")\n\t}\n\treturn nil\n}\n\nfunc (ncc *NotifyChannelConfig) ValidatePagerDutyRequestConfig() error {\n\tif ncc.RequestConfig.PagerDutyRequestConfig == nil {\n\t\treturn errors.New(\"pagerduty request config cannot be nil\")\n\t}\n\treturn nil\n}\n\nfunc (ncc *NotifyChannelConfig) Update(ctx *ctx.Context, ref NotifyChannelConfig) error {\n\tref.ID = ncc.ID\n\tref.CreateAt = ncc.CreateAt\n\tref.CreateBy = ncc.CreateBy\n\tref.UpdateAt = time.Now().Unix()\n\n\terr := ref.Verify()\n\tif err != nil {\n\t\treturn err\n\t}\n\treturn DB(ctx).Model(ncc).Select(\"*\").Updates(ref).Error\n}\n\nfunc NotifyChannelGet(ctx *ctx.Context, where string, args ...interface{}) (\n\t*NotifyChannelConfig, error) {\n\tlst, err := NotifyChannelsGet(ctx, where, args...)\n\tif err != nil || len(lst) == 0 {\n\t\treturn nil, err\n\t}\n\treturn lst[0], err\n}\n\nfunc NotifyChannelsGet(ctx *ctx.Context, where string, args ...interface{}) (\n\t[]*NotifyChannelConfig, error) {\n\tlst := make([]*NotifyChannelConfig, 0)\n\tsession := DB(ctx)\n\tif where != \"\" && len(args) > 0 {\n\t\tsession = session.Where(where, args...)\n\t}\n\terr := session.Order(\"weight asc\").Find(&lst).Error\n\tif err != nil {\n\t\treturn nil, err\n\t}\n\treturn lst, nil\n}\n\ntype NotiChList []*NotifyChannelConfig\n\nfunc (c NotiChList) GetIdentSet() map[int64]struct{} {\n\tidents := make(map[int64]struct{}, len(c))\n\tfor _, tpl := range c {\n\t\tidents[tpl.ID] = struct{}{}\n\t}\n\treturn idents\n}\n\nfunc (c NotiChList) IfUsed(nr *NotifyRule) bool {\n\tidentSet := c.GetIdentSet()\n\tfor _, nc := range nr.NotifyConfigs {\n\t\tif _, ok := identSet[nc.ChannelID]; ok {\n\t\t\treturn true\n\t\t}\n\t}\n\treturn false\n}\n\n// Weight 用于页面元素排序,weight 越大 排序越靠后\nvar NotiChMap = []*NotifyChannelConfig{\n\t{\n\t\tName: \"PagerDuty\", Ident: \"pagerduty\", RequestType: \"pagerduty\", Weight: 19, Enable: true,\n\t\tRequestConfig: &RequestConfig{\n\t\t\tPagerDutyRequestConfig: &PagerDutyRequestConfig{\n\t\t\t\tApiKey: \"pagerduty api key\",\n\t\t\t\tTimeout: 5000,\n\t\t\t\tRetryTimes: 3,\n\t\t\t},\n\t\t},\n\t},\n\t{\n\t\tName: \"JIRA\", Ident: Jira, RequestType: \"http\", Weight: 18, Enable: true,\n\t\tRequestConfig: &RequestConfig{\n\t\t\tHTTPRequestConfig: &HTTPRequestConfig{\n\t\t\t\tURL: \"https://{JIRA Service Account Email}:{API Token}@api.atlassian.com/ex/jira/{CloudID}/rest/api/3/issue\",\n\t\t\t\tMethod: \"POST\",\n\t\t\t\tHeaders: map[string]string{\"Content-Type\": \"application/json\"},\n\t\t\t\tTimeout: 10000, Concurrency: 5, RetryTimes: 3, RetryInterval: 100,\n\t\t\t\tRequest: RequestDetail{\n\t\t\t\t\tBody: `{\"fields\":{\"project\":{\"key\":\"{{$params.project_key}}\"},\"issuetype\":{\"name\":\"{{if $event.IsRecovered}}Recovery{{else}}Alert{{end}}\"},\"summary\":\"{{$event.RuleName}}\",\"description\":{\"type\":\"doc\",\"version\":1,\"content\":[{\"type\":\"paragraph\",\"content\":[{\"type\":\"text\",\"text\":\"{{$tpl.content}}\"}]}]},\"labels\":[\"{{join $event.TagsJSON \"\\\",\\\"\"}}\", \"eventHash={{$event.Hash}}\"]}}`,\n\t\t\t\t},\n\t\t\t},\n\t\t},\n\t\tParamConfig: &NotifyParamConfig{\n\t\t\tCustom: Params{\n\t\t\t\tParams: []ParamItem{\n\t\t\t\t\t{Key: \"project_key\", CName: \"Project Key\", Type: \"string\"},\n\t\t\t\t},\n\t\t\t},\n\t\t},\n\t},\n\t{\n\t\tName: \"JSM Alert\", Ident: JSMAlert, RequestType: \"http\", Weight: 17, Enable: true,\n\t\tRequestConfig: &RequestConfig{\n\t\t\tHTTPRequestConfig: &HTTPRequestConfig{\n\t\t\t\tURL: `https://api.atlassian.com/jsm/ops/integration/v2/alerts{{if $event.IsRecovered}}/{{$event.Hash}}/close?identifierType=alias{{else}}{{end}}`,\n\t\t\t\tMethod: \"POST\",\n\t\t\t\tHeaders: map[string]string{\"Content-Type\": \"application/json\", \"Authorization\": \"GenieKey {{$params.api_key}}\"},\n\t\t\t\tTimeout: 10000, Concurrency: 5, RetryTimes: 3, RetryInterval: 100,\n\t\t\t\tRequest: RequestDetail{\n\t\t\t\t\tBody: `{{if $event.IsRecovered}}{\"note\":\"{{$tpl.content}}\",\"source\":\"{{$event.Cluster}}\"}{{else}}{\"message\":\"{{$event.RuleName}}\",\"description\":\"{{$tpl.content}}\",\"alias\":\"{{$event.Hash}}\",\"priority\":\"P{{$event.Severity}}\",\"tags\":[{{range $i, $v := $event.TagsJSON}}{{if $i}},{{end}}\"{{$v}}\"{{end}}],\"details\":{{jsonMarshal $event.AnnotationsJSON}},\"entity\":\"{{$event.TargetIdent}}\",\"source\":\"{{$event.Cluster}}\"}{{end}}`,\n\t\t\t\t},\n\t\t\t},\n\t\t},\n\t\tParamConfig: &NotifyParamConfig{\n\t\t\tCustom: Params{\n\t\t\t\tParams: []ParamItem{\n\t\t\t\t\t{Key: \"api_key\", CName: \"API Key\", Type: \"string\"},\n\t\t\t\t},\n\t\t\t},\n\t\t},\n\t},\n\t{\n\t\tName: \"Discord\", Ident: Discord, RequestType: \"http\", Weight: 16, Enable: false,\n\t\tRequestConfig: &RequestConfig{\n\t\t\tHTTPRequestConfig: &HTTPRequestConfig{\n\t\t\t\tURL: \"{{$params.webhook_url}}\",\n\t\t\t\tMethod: \"POST\", Headers: map[string]string{\"Content-Type\": \"application/json\"},\n\t\t\t\tTimeout: 10000, Concurrency: 5, RetryTimes: 3, RetryInterval: 100,\n\t\t\t\tRequest: RequestDetail{\n\t\t\t\t\tBody: `{\"content\": \"{{$tpl.content}}\"}`,\n\t\t\t\t},\n\t\t\t},\n\t\t},\n\t\tParamConfig: &NotifyParamConfig{\n\t\t\tCustom: Params{\n\t\t\t\tParams: []ParamItem{\n\t\t\t\t\t{Key: \"webhook_url\", CName: \"Webhook Url\", Type: \"string\"},\n\t\t\t\t},\n\t\t\t},\n\t\t},\n\t},\n\t{\n\t\tName: \"MattermostWebhook\", Ident: MattermostWebhook, RequestType: \"http\", Weight: 15, Enable: false,\n\t\tRequestConfig: &RequestConfig{\n\t\t\tHTTPRequestConfig: &HTTPRequestConfig{\n\t\t\t\tURL: \"{{$params.webhook_url}}\",\n\t\t\t\tMethod: \"POST\", Headers: map[string]string{\"Content-Type\": \"application/json\"},\n\t\t\t\tTimeout: 10000, Concurrency: 5, RetryTimes: 3, RetryInterval: 100,\n\t\t\t\tRequest: RequestDetail{\n\t\t\t\t\tBody: `{\"text\": \"{{$tpl.content}}\"}`,\n\t\t\t\t},\n\t\t\t},\n\t\t},\n\t\tParamConfig: &NotifyParamConfig{\n\t\t\tCustom: Params{\n\t\t\t\tParams: []ParamItem{\n\t\t\t\t\t{Key: \"webhook_url\", CName: \"Webhook Url\", Type: \"string\"},\n\t\t\t\t\t{Key: \"bot_name\", CName: \"Bot Name\", Type: \"string\"},\n\t\t\t\t},\n\t\t\t},\n\t\t},\n\t},\n\t{\n\t\tName: \"MattermostBot\", Ident: MattermostBot, RequestType: \"http\", Weight: 14, Enable: false,\n\t\tRequestConfig: &RequestConfig{\n\t\t\tHTTPRequestConfig: &HTTPRequestConfig{\n\t\t\t\tURL: \"/api/v4/posts\",\n\t\t\t\tMethod: \"POST\", Headers: map[string]string{\"Content-Type\": \"application/json\", \"Authorization\": \"Bearer \"},\n\t\t\t\tTimeout: 10000, Concurrency: 5, RetryTimes: 3, RetryInterval: 100,\n\t\t\t\tRequest: RequestDetail{\n\t\t\t\t\tBody: `{\"channel_id\": \"{{$params.channel_id}}\", \"message\": \"{{$tpl.content}}\"}`,\n\t\t\t\t},\n\t\t\t},\n\t\t},\n\t\tParamConfig: &NotifyParamConfig{\n\t\t\tCustom: Params{\n\t\t\t\tParams: []ParamItem{\n\t\t\t\t\t{Key: \"channel_id\", CName: \"Channel ID\", Type: \"string\"},\n\t\t\t\t\t{Key: \"channel_name\", CName: \"Channel Name\", Type: \"string\"},\n\t\t\t\t},\n\t\t\t},\n\t\t},\n\t},\n\t{\n\t\tName: \"SlackWebhook\", Ident: SlackWebhook, RequestType: \"http\", Weight: 13, Enable: false,\n\t\tRequestConfig: &RequestConfig{\n\t\t\tHTTPRequestConfig: &HTTPRequestConfig{\n\t\t\t\tURL: \"{{$params.webhook_url}}\",\n\t\t\t\tMethod: \"POST\", Headers: map[string]string{\"Content-Type\": \"application/json\"},\n\t\t\t\tTimeout: 10000, Concurrency: 5, RetryTimes: 3, RetryInterval: 100,\n\t\t\t\tRequest: RequestDetail{\n\t\t\t\t\tBody: `{\"text\": \"{{$tpl.content}}\", \"mrkdwn\": true}`,\n\t\t\t\t},\n\t\t\t},\n\t\t},\n\t\tParamConfig: &NotifyParamConfig{\n\t\t\tCustom: Params{\n\t\t\t\tParams: []ParamItem{\n\t\t\t\t\t{Key: \"webhook_url\", CName: \"Webhook Url\", Type: \"string\"},\n\t\t\t\t\t{Key: \"bot_name\", CName: \"Bot Name\", Type: \"string\"},\n\t\t\t\t},\n\t\t\t},\n\t\t},\n\t},\n\t{\n\t\tName: \"SlackBot\", Ident: SlackBot, RequestType: \"http\", Weight: 12, Enable: false,\n\t\tRequestConfig: &RequestConfig{\n\t\t\tHTTPRequestConfig: &HTTPRequestConfig{\n\t\t\t\tURL: \"https://slack.com/api/chat.postMessage\",\n\t\t\t\tMethod: \"POST\", Headers: map[string]string{\"Content-Type\": \"application/json\", \"Authorization\": \"Bearer \"},\n\t\t\t\tTimeout: 10000, Concurrency: 5, RetryTimes: 3, RetryInterval: 100,\n\t\t\t\tRequest: RequestDetail{\n\t\t\t\t\tBody: `{\"channel\": \"#{{$params.channel}}\", \"text\": \"{{$tpl.content}}\", \"mrkdwn\": true}`,\n\t\t\t\t},\n\t\t\t},\n\t\t},\n\t\tParamConfig: &NotifyParamConfig{\n\t\t\tCustom: Params{\n\t\t\t\tParams: []ParamItem{\n\t\t\t\t\t{Key: \"channel\", CName: \"channel\", Type: \"string\"},\n\t\t\t\t\t{Key: \"channel_name\", CName: \"Channel Name\", Type: \"string\"},\n\t\t\t\t},\n\t\t\t},\n\t\t},\n\t},\n\t{\n\t\tName: \"Tencent SMS\", Ident: \"tx-sms\", RequestType: \"http\", Weight: 11, Enable: true,\n\t\tRequestConfig: &RequestConfig{\n\t\t\tHTTPRequestConfig: &HTTPRequestConfig{\n\t\t\t\tMethod: \"POST\",\n\t\t\t\tURL: \"https://sms.tencentcloudapi.com\",\n\t\t\t\tTimeout: 10000, Concurrency: 5, RetryTimes: 3, RetryInterval: 100,\n\t\t\t\tRequest: RequestDetail{\n\t\t\t\t\tBody: `{\"PhoneNumberSet\":[\"{{ $sendto }}\"],\"SignName\":\"需要改为实际的签名\",\"SmsSdkAppId\":\"需要改为实际的appid\",\"TemplateId\":\"需要改为实际的模板id\",\"TemplateParamSet\":[\"{{$tpl.content}}\"]}`,\n\t\t\t\t},\n\t\t\t\tHeaders: map[string]string{\n\t\t\t\t\t\"Content-Type\": \"application/json\",\n\t\t\t\t\t\"Host\": \"sms.tencentcloudapi.com\",\n\t\t\t\t\t\"X-TC-Action\": \"SendSms\",\n\t\t\t\t\t\"X-TC-Version\": \"2021-01-11\",\n\t\t\t\t\t\"X-TC-Region\": \"需要改为实际的region\",\n\t\t\t\t\t\"Service\": \"sms\",\n\t\t\t\t\t\"Secret_ID\": \"需要改为实际的secret_id\",\n\t\t\t\t\t\"Secret_Key\": \"需要改为实际的secret_key\",\n\t\t\t\t},\n\t\t\t},\n\t\t},\n\t\tParamConfig: &NotifyParamConfig{\n\t\t\tUserInfo: &UserInfo{\n\t\t\t\tContactKey: \"phone\",\n\t\t\t},\n\t\t},\n\t},\n\t{\n\t\tName: \"Tencent Voice\", Ident: \"tx-voice\", RequestType: \"http\", Weight: 10, Enable: true,\n\t\tRequestConfig: &RequestConfig{\n\t\t\tHTTPRequestConfig: &HTTPRequestConfig{\n\t\t\t\tMethod: \"POST\",\n\t\t\t\tURL: \"https://vms.tencentcloudapi.com\",\n\t\t\t\tTimeout: 10000, Concurrency: 5, RetryTimes: 3, RetryInterval: 100,\n\t\t\t\tRequest: RequestDetail{\n\t\t\t\t\tBody: `{\"CalledNumber\":\"+86{{ $sendto }}\",\"TemplateId\":\"需要改为实际的模板id\",\"TemplateParamSet\":[\"{{$tpl.content}}\"],\"VoiceSdkAppid\":\"需要改为实际的appid\"}`,\n\t\t\t\t},\n\t\t\t\tHeaders: map[string]string{\n\t\t\t\t\t\"Content-Type\": \"application/json\",\n\t\t\t\t\t\"Host\": \"vms.tencentcloudapi.com\",\n\t\t\t\t\t\"X-TC-Action\": \"SendTtsVoice\",\n\t\t\t\t\t\"X-TC-Version\": \"2020-09-02\",\n\t\t\t\t\t\"X-TC-Region\": \"ap-beijing\",\n\t\t\t\t\t\"Service\": \"vms\",\n\t\t\t\t\t\"Secret_ID\": \"需要改为实际的secret_id\",\n\t\t\t\t\t\"Secret_Key\": \"需要改为实际的secret_key\",\n\t\t\t\t},\n\t\t\t},\n\t\t},\n\t\tParamConfig: &NotifyParamConfig{\n\t\t\tUserInfo: &UserInfo{\n\t\t\t\tContactKey: \"phone\",\n\t\t\t},\n\t\t},\n\t},\n\t{\n\t\tName: \"Aliyun SMS\", Ident: \"ali-sms\", RequestType: \"http\", Weight: 9, Enable: true,\n\t\tRequestConfig: &RequestConfig{\n\t\t\tHTTPRequestConfig: &HTTPRequestConfig{\n\t\t\t\tMethod: \"POST\",\n\t\t\t\tURL: \"https://dysmsapi.aliyuncs.com\",\n\t\t\t\tTimeout: 10000, Concurrency: 5, RetryTimes: 3, RetryInterval: 100,\n\t\t\t\tRequest: RequestDetail{\n\t\t\t\t\tParameters: map[string]string{\n\t\t\t\t\t\t\"PhoneNumbers\": \"{{ $sendto }}\",\n\t\t\t\t\t\t\"SignName\": \"需要改为实际的签名\",\n\t\t\t\t\t\t\"TemplateCode\": \"需要改为实际的模板id\",\n\t\t\t\t\t\t\"TemplateParam\": `{\"incident\":\"故障{{$tpl.incident}},请及时处理\"}`,\n\t\t\t\t\t\t\"AccessKeyId\": \"需要改为实际的access_key_id\",\n\t\t\t\t\t\t\"AccessKeySecret\": \"需要改为实际的access_key_secret\",\n\t\t\t\t\t},\n\t\t\t\t},\n\t\t\t\tHeaders: map[string]string{\n\t\t\t\t\t\"Content-Type\": \"application/json\",\n\t\t\t\t\t\"Host\": \"dysmsapi.aliyuncs.com\",\n\t\t\t\t},\n\t\t\t},\n\t\t},\n\t\tParamConfig: &NotifyParamConfig{\n\t\t\tUserInfo: &UserInfo{\n\t\t\t\tContactKey: \"phone\",\n\t\t\t},\n\t\t},\n\t},\n\t{\n\t\tName: \"Aliyun Voice\", Ident: \"ali-voice\", RequestType: \"http\", Weight: 8, Enable: true,\n\t\tRequestConfig: &RequestConfig{\n\t\t\tHTTPRequestConfig: &HTTPRequestConfig{\n\t\t\t\tMethod: \"POST\",\n\t\t\t\tURL: \"https://dyvmsapi.aliyuncs.com\",\n\t\t\t\tTimeout: 10000, Concurrency: 5, RetryTimes: 3, RetryInterval: 100,\n\t\t\t\tRequest: RequestDetail{\n\t\t\t\t\tParameters: map[string]string{\n\t\t\t\t\t\t\"TtsCode\": \"需要改为实际的voice_code\",\n\t\t\t\t\t\t\"TtsParam\": `{\"incident\":\"故障{{$tpl.incident}},一键认领请按1\"}`,\n\t\t\t\t\t\t\"CalledNumber\": `{{ $sendto }}`,\n\t\t\t\t\t\t\"CalledShowNumber\": `需要改为实际的show_number, 如果为空则不显示`,\n\t\t\t\t\t\t\"AccessKeyId\": \"需要改为实际的access_key_id\",\n\t\t\t\t\t\t\"AccessKeySecret\": \"需要改为实际的access_key_secret\",\n\t\t\t\t\t},\n\t\t\t\t},\n\t\t\t\tHeaders: map[string]string{\n\t\t\t\t\t\"Content-Type\": \"application/json\",\n\t\t\t\t\t\"Host\": \"dyvmsapi.aliyuncs.com\",\n\t\t\t\t},\n\t\t\t},\n\t\t},\n\t\tParamConfig: &NotifyParamConfig{\n\t\t\tUserInfo: &UserInfo{\n\t\t\t\tContactKey: \"phone\",\n\t\t\t},\n\t\t},\n\t},\n\t{\n\t\tName: \"Telegram\", Ident: Telegram, RequestType: \"http\", Weight: 7, Enable: true,\n\t\tRequestConfig: &RequestConfig{\n\t\t\tHTTPRequestConfig: &HTTPRequestConfig{\n\t\t\t\tURL: \"https://api.telegram.org/bot{{$params.token}}/sendMessage\",\n\t\t\t\tMethod: \"POST\", Headers: map[string]string{\"Content-Type\": \"application/json\"},\n\t\t\t\tTimeout: 10000, Concurrency: 5, RetryTimes: 3, RetryInterval: 100,\n\t\t\t\tRequest: RequestDetail{\n\t\t\t\t\tParameters: map[string]string{\"chat_id\": \"{{$params.chat_id}}\"},\n\t\t\t\t\tBody: `{\"text\":\"{{$tpl.content}}\",\"parse_mode\": \"HTML\"}`,\n\t\t\t\t},\n\t\t\t},\n\t\t},\n\t\tParamConfig: &NotifyParamConfig{\n\t\t\tCustom: Params{\n\t\t\t\tParams: []ParamItem{\n\t\t\t\t\t{Key: \"token\", CName: \"Token\", Type: \"string\"},\n\t\t\t\t\t{Key: \"chat_id\", CName: \"Chat Id\", Type: \"string\"},\n\t\t\t\t\t{Key: \"bot_name\", CName: \"Bot Name\", Type: \"string\"},\n\t\t\t\t},\n\t\t\t},\n\t\t},\n\t},\n\t{\n\t\tName: \"Lark\", Ident: Lark, RequestType: \"http\", Weight: 6, Enable: true,\n\t\tRequestConfig: &RequestConfig{\n\t\t\tHTTPRequestConfig: &HTTPRequestConfig{\n\t\t\t\tURL: \"https://open.larksuite.com/open-apis/bot/v2/hook/{{$params.token}}\",\n\t\t\t\tMethod: \"POST\", Headers: map[string]string{\"Content-Type\": \"application/json\"},\n\t\t\t\tTimeout: 10000, Concurrency: 5, RetryTimes: 3, RetryInterval: 100,\n\t\t\t\tRequest: RequestDetail{\n\t\t\t\t\tBody: `{\"msg_type\": \"text\", \"content\": {\"text\": \"{{$tpl.content}}\"}}`,\n\t\t\t\t},\n\t\t\t},\n\t\t},\n\t\tParamConfig: &NotifyParamConfig{\n\t\t\tCustom: Params{\n\t\t\t\tParams: []ParamItem{\n\t\t\t\t\t{Key: \"token\", CName: \"Token\", Type: \"string\"},\n\t\t\t\t\t{Key: \"bot_name\", CName: \"Bot Name\", Type: \"string\"},\n\t\t\t\t},\n\t\t\t},\n\t\t},\n\t},\n\n\t{\n\t\tName: \"Lark Card\", Ident: LarkCard, RequestType: \"http\", Weight: 6, Enable: true,\n\t\tRequestConfig: &RequestConfig{\n\t\t\tHTTPRequestConfig: &HTTPRequestConfig{\n\t\t\t\tURL: \"https://open.larksuite.com/open-apis/bot/v2/hook/{{$params.token}}\",\n\t\t\t\tMethod: \"POST\", Headers: map[string]string{\"Content-Type\": \"application/json\"},\n\t\t\t\tTimeout: 10000, Concurrency: 5, RetryTimes: 3, RetryInterval: 100,\n\t\t\t\tRequest: RequestDetail{\n\t\t\t\t\tBody: `{\"msg_type\": \"interactive\", \"card\": {\"config\": {\"wide_screen_mode\": true}, \"header\": {\"title\": {\"content\": \"{{$tpl.title}}\", \"tag\": \"plain_text\"}, \"template\": \"{{if $event.IsRecovered}}green{{else}}red{{end}}\"}, \"elements\": [{\"tag\": \"markdown\", \"content\": \"{{$tpl.content}}\"}]}}`,\n\t\t\t\t},\n\t\t\t},\n\t\t},\n\t\tParamConfig: &NotifyParamConfig{\n\t\t\tCustom: Params{\n\t\t\t\tParams: []ParamItem{\n\t\t\t\t\t{Key: \"token\", CName: \"Token\", Type: \"string\"},\n\t\t\t\t\t{Key: \"bot_name\", CName: \"Bot Name\", Type: \"string\"},\n\t\t\t\t},\n\t\t\t},\n\t\t},\n\t},\n\t{\n\t\tName: \"Feishu\", Ident: Feishu, RequestType: \"http\", Weight: 5, Enable: true,\n\t\tRequestConfig: &RequestConfig{\n\t\t\tHTTPRequestConfig: &HTTPRequestConfig{\n\t\t\t\tURL: \"https://open.feishu.cn/open-apis/bot/v2/hook/{{$params.access_token}}\",\n\t\t\t\tMethod: \"POST\", Headers: map[string]string{\"Content-Type\": \"application/json\"},\n\t\t\t\tTimeout: 10000, Concurrency: 5, RetryTimes: 3, RetryInterval: 100,\n\t\t\t\tRequest: RequestDetail{\n\t\t\t\t\tBody: `{\"msg_type\": \"text\", \"content\": {\"text\": \"{{$tpl.content}}\"}}`,\n\t\t\t\t},\n\t\t\t},\n\t\t},\n\t\tParamConfig: &NotifyParamConfig{\n\t\t\tCustom: Params{\n\t\t\t\tParams: []ParamItem{\n\t\t\t\t\t{Key: \"access_token\", CName: \"Access Token\", Type: \"string\"},\n\t\t\t\t\t{Key: \"bot_name\", CName: \"Bot Name\", Type: \"string\"},\n\t\t\t\t},\n\t\t\t},\n\t\t},\n\t},\n\t{\n\t\tName: \"Feishu Card\", Ident: FeishuCard, RequestType: \"http\", Weight: 5, Enable: true,\n\t\tRequestConfig: &RequestConfig{\n\t\t\tHTTPRequestConfig: &HTTPRequestConfig{\n\t\t\t\tURL: \"https://open.feishu.cn/open-apis/bot/v2/hook/{{$params.access_token}}\",\n\t\t\t\tMethod: \"POST\", Headers: map[string]string{\"Content-Type\": \"application/json\"},\n\t\t\t\tTimeout: 10000, Concurrency: 5, RetryTimes: 3, RetryInterval: 100,\n\t\t\t\tRequest: RequestDetail{\n\t\t\t\t\tBody: `{\"msg_type\": \"interactive\", \"card\": {\"config\": {\"wide_screen_mode\": true}, \"header\": {\"title\": {\"content\": \"{{$tpl.title}}\", \"tag\": \"plain_text\"}, \"template\": \"{{if $event.IsRecovered}}green{{else}}red{{end}}\"}, \"elements\": [{\"tag\": \"markdown\", \"content\": \"{{$tpl.content}}\"}]}}`,\n\t\t\t\t},\n\t\t\t},\n\t\t},\n\t\tParamConfig: &NotifyParamConfig{\n\t\t\tCustom: Params{\n\t\t\t\tParams: []ParamItem{\n\t\t\t\t\t{Key: \"access_token\", CName: \"Access Token\", Type: \"string\"},\n\t\t\t\t\t{Key: \"bot_name\", CName: \"Bot Name\", Type: \"string\"},\n\t\t\t\t},\n\t\t\t},\n\t\t},\n\t},\n\t{\n\t\tName: \"Wecom\", Ident: Wecom, RequestType: \"http\", Weight: 4, Enable: true,\n\t\tRequestConfig: &RequestConfig{\n\t\t\tHTTPRequestConfig: &HTTPRequestConfig{\n\t\t\t\tURL: \"https://qyapi.weixin.qq.com/cgi-bin/webhook/send\",\n\t\t\t\tMethod: \"POST\", Headers: map[string]string{\"Content-Type\": \"application/json\"},\n\t\t\t\tTimeout: 10000, Concurrency: 5, RetryTimes: 3, RetryInterval: 100,\n\t\t\t\tRequest: RequestDetail{\n\t\t\t\t\tParameters: map[string]string{\"key\": \"{{$params.key}}\"},\n\t\t\t\t\tBody: `{\"msgtype\": \"markdown\", \"markdown\": {\"content\": \"{{$tpl.content}}\"}}`,\n\t\t\t\t},\n\t\t\t},\n\t\t},\n\t\tParamConfig: &NotifyParamConfig{\n\t\t\tCustom: Params{\n\t\t\t\tParams: []ParamItem{\n\t\t\t\t\t{Key: \"key\", CName: \"Key\", Type: \"string\"},\n\t\t\t\t\t{Key: \"bot_name\", CName: \"Bot Name\", Type: \"string\"},\n\t\t\t\t},\n\t\t\t},\n\t\t},\n\t},\n\t{\n\t\tName: \"Dingtalk\", Ident: Dingtalk, RequestType: \"http\", Weight: 3, Enable: true,\n\t\tRequestConfig: &RequestConfig{\n\t\t\tHTTPRequestConfig: &HTTPRequestConfig{\n\t\t\t\tURL: \"https://oapi.dingtalk.com/robot/send\", Method: \"POST\",\n\t\t\t\tHeaders: map[string]string{\"Content-Type\": \"application/json\"},\n\t\t\t\tTimeout: 10000, Concurrency: 5, RetryTimes: 3, RetryInterval: 100,\n\t\t\t\tRequest: RequestDetail{\n\t\t\t\t\tParameters: map[string]string{\"access_token\": \"{{$params.access_token}}\"},\n\t\t\t\t\tBody: `{\"msgtype\": \"markdown\", \"markdown\": {\"title\": \"{{$tpl.title}}\", \"text\": \"{{$tpl.content}}\\n{{batchContactsAts $sendtos}}\"}, \"at\": {\"atMobiles\": {{batchContactsJsonMarshal $sendtos}} }}`,\n\t\t\t\t},\n\t\t\t},\n\t\t},\n\t\tParamConfig: &NotifyParamConfig{\n\t\t\tCustom: Params{\n\t\t\t\tParams: []ParamItem{\n\t\t\t\t\t{Key: \"access_token\", CName: \"Access Token\", Type: \"string\"},\n\t\t\t\t\t{Key: \"bot_name\", CName: \"Bot Name\", Type: \"string\"},\n\t\t\t\t},\n\t\t\t},\n\t\t},\n\t},\n\t{\n\t\tName: \"Email\", Ident: Email, RequestType: \"smtp\", Weight: 2, Enable: true,\n\t\tRequestConfig: &RequestConfig{\n\t\t\tSMTPRequestConfig: &SMTPRequestConfig{\n\t\t\t\tHost: \"smtp.host\",\n\t\t\t\tPort: 25,\n\t\t\t\tUsername: \"your-username\",\n\t\t\t\tPassword: \"your-password\",\n\t\t\t\tFrom: \"your-email\",\n\t\t\t\tInsecureSkipVerify: true,\n\t\t\t},\n\t\t},\n\t\tParamConfig: &NotifyParamConfig{\n\t\t\tUserInfo: &UserInfo{\n\t\t\t\tContactKey: \"email\",\n\t\t\t},\n\t\t},\n\t},\n\t{\n\t\tName: \"Callback\", Ident: \"callback\", RequestType: \"http\", Weight: 2, Enable: true,\n\t\tRequestConfig: &RequestConfig{\n\t\t\tHTTPRequestConfig: &HTTPRequestConfig{\n\t\t\t\tURL: \"{{$params.callback_url}}\",\n\t\t\t\tMethod: \"POST\", Headers: map[string]string{\"Content-Type\": \"application/json\"},\n\t\t\t\tTimeout: 10000, Concurrency: 5, RetryTimes: 3, RetryInterval: 100,\n\t\t\t\tRequest: RequestDetail{\n\t\t\t\t\tBody: `{{ jsonMarshal $events }}`,\n\t\t\t\t},\n\t\t\t},\n\t\t},\n\t\tParamConfig: &NotifyParamConfig{\n\t\t\tCustom: Params{\n\t\t\t\tParams: []ParamItem{\n\t\t\t\t\t{Key: \"callback_url\", CName: \"Callback Url\", Type: \"string\"},\n\t\t\t\t\t{Key: \"note\", CName: \"Note\", Type: \"string\"},\n\t\t\t\t},\n\t\t\t},\n\t\t},\n\t},\n\t{\n\t\tName: \"FlashDuty\", Ident: \"flashduty\", RequestType: \"flashduty\", Weight: 1, Enable: true,\n\t\tRequestConfig: &RequestConfig{\n\t\t\tHTTPRequestConfig: &HTTPRequestConfig{\n\t\t\t\tTimeout: 10000, Concurrency: 5, RetryTimes: 3, RetryInterval: 100,\n\t\t\t\tHeaders: map[string]string{\n\t\t\t\t\t\"Content-Type\": \"application/json\",\n\t\t\t\t},\n\t\t\t},\n\t\t\tFlashDutyRequestConfig: &FlashDutyRequestConfig{\n\t\t\t\tIntegrationUrl: \"flashduty integration url\",\n\t\t\t\tTimeout: 5000, // 默认5秒超时\n\t\t\t\tRetryTimes: 3, // 默认重试3次\n\t\t\t},\n\t\t},\n\t},\n}\n\nfunc InitNotifyChannel(ctx *ctx.Context) {\n\tif !ctx.IsCenter {\n\t\treturn\n\t}\n\n\tfor _, notiCh := range NotiChMap {\n\t\tnotiCh.CreateBy = \"system\"\n\t\tnotiCh.CreateAt = time.Now().Unix()\n\t\tnotiCh.UpdateBy = \"system\"\n\t\tnotiCh.UpdateAt = time.Now().Unix()\n\t\terr := notiCh.Upsert(ctx)\n\t\tif err != nil {\n\t\t\tlogger.Warningf(\"notify channel init failed to upsert notify channels %v\", err)\n\t\t}\n\t}\n}\n\nfunc (ncc *NotifyChannelConfig) Upsert(ctx *ctx.Context) error {\n\tch, err := NotifyChannelGet(ctx, \"name = ?\", ncc.Name)\n\tif err != nil {\n\t\treturn errors.WithMessage(err, \"notify channel init failed to get message tpl\")\n\t}\n\n\tif ch == nil {\n\t\treturn Insert(ctx, ncc)\n\t}\n\n\tif ch.UpdateBy != \"\" && ch.UpdateBy != \"system\" {\n\t\treturn nil\n\t}\n\treturn ch.Update(ctx, *ncc)\n}\n"
},
{
"path": "models/notify_channel_test.go",
"content": "package models\n\nimport (\n\t\"encoding/json\"\n\t\"net/http\"\n\t\"os\"\n\t\"strings\"\n\t\"testing\"\n\t\"time\"\n)\n\n// 创建测试事件\nvar events = []*AlertCurEvent{\n\t{\n\t\tId: 1,\n\t\tHash: \"test-hash\",\n\t\tRuleName: \"测试规则\",\n\t\tRuleNote: \"这是一个测试告警规则\",\n\t\tSeverity: 3,\n\t\tGroupId: 1,\n\t\tGroupName: \"测试业务组\",\n\t\tTriggerTime: time.Now().Unix(),\n\t\tTriggerValue: \"100\",\n\t\tTagsMap: map[string]string{\n\t\t\t\"host\": \"test-host\",\n\t\t\t\"app\": \"test-app\",\n\t\t\t\"service\": \"test-service\",\n\t\t\t\"env\": \"test\",\n\t\t\t\"instance\": \"127.0.0.1\",\n\t\t},\n\t\tAnnotationsJSON: map[string]string{\n\t\t\t\"summary\": \"测试告警摘要\",\n\t\t\t\"description\": \"这是一个详细的告警描述\",\n\t\t},\n\t\tTarget: &Target{\n\t\t\tIdent: \"test-target\",\n\t\t},\n\t\tNotifyGroupsObj: []*UserGroup{\n\t\t\t{\n\t\t\t\tName: \"运维组\",\n\t\t\t},\n\t\t},\n\t\tFirstTriggerTime: time.Now().Unix() - 3600, // 1小时前首次触发\n\t},\n}\n\nfunc TestSendDingTalkNotification(t *testing.T) {\n\tdata, err := readKeyValueFromJsonFile(\"../.env.json\")\n\tif err != nil {\n\t\tt.Fatalf(\"读取JSON文件失败: %v\", err)\n\t}\n\t// 创建钉钉通知配置\n\tnotifyChannel := &NotifyChannelConfig{\n\t\tRequestType: \"http\",\n\t\tRequestConfig: &RequestConfig{\n\t\t\tHTTPRequestConfig: &HTTPRequestConfig{\n\t\t\t\tMethod: \"POST\",\n\t\t\t\tURL: \"https://oapi.dingtalk.com/robot/send\", // 使用测试服务器的URL\n\t\t\t\tTimeout: 10000,\n\t\t\t\tRequest: RequestDetail{\n\t\t\t\t\tBody: `{\"msgtype\": \"markdown\", \"markdown\": {\"title\": \"{{$tpl.title}}\", \"text\": \"{{$tpl.content}}\\n{{batchContactsAts $sendtos}}\"}, \"at\": {\"atMobiles\": {{batchContactsJsonMarshal $sendtos}} }}`,\n\t\t\t\t\tParameters: map[string]string{\n\t\t\t\t\t\t\"access_token\": \"{{ $params.access_token }}\",\n\t\t\t\t\t},\n\t\t\t\t},\n\t\t\t\tHeaders: map[string]string{\n\t\t\t\t\t\"Content-Type\": \"application/json\",\n\t\t\t\t},\n\t\t\t\tRetryTimes: 2,\n\t\t\t\tRetryInterval: 1,\n\t\t\t},\n\t\t},\n\t\tParamConfig: &NotifyParamConfig{\n\t\t\tCustom: Params{\n\t\t\t\tParams: []ParamItem{\n\t\t\t\t\t{\n\t\t\t\t\t\tKey: \"access_token\",\n\t\t\t\t\t},\n\t\t\t\t},\n\t\t\t},\n\t\t},\n\t}\n\n\t// 创建通知模板\n\ttpl := map[string]interface{}{\n\t\t\"title\": \"测试告警消息\",\n\t\t\"content\": \"测试告警消息\",\n\t}\n\n\t// 创建通知参数\n\tparams := map[string]string{\n\t\t\"access_token\": data[\"DingTalkAccessToken\"],\n\t}\n\n\t// 创建HTTP客户端\n\tclient, err := GetHTTPClient(notifyChannel)\n\tif err != nil {\n\t\tt.Fatalf(\"Failed to create HTTP client: %v\", err)\n\t}\n\n\t// 调用SendHTTP方法\n\tresp, err := notifyChannel.SendHTTP(events, tpl, params, []string{data[\"Phone\"]}, client)\n\tif err != nil {\n\t\tt.Fatalf(\"SendHTTP failed: %v\", err)\n\t}\n\n\t// 验证响应\n\tif !strings.Contains(resp, \"errmsg\") {\n\t\tt.Errorf(\"Response does not contain expected content, got: %s\", resp)\n\t}\n}\n\nfunc TestSendTencentVoiceNotification(t *testing.T) {\n\tdata, err := readKeyValueFromJsonFile(\"../.env.json\")\n\tif err != nil {\n\t\tt.Fatalf(\"读取JSON文件失败: %v\", err)\n\t}\n\n\t// 创建腾讯云语音通知配置\n\tnotifyChannel := &NotifyChannelConfig{\n\t\tRequestType: \"http\",\n\t\tRequestConfig: &RequestConfig{\n\t\t\tHTTPRequestConfig: &HTTPRequestConfig{\n\t\t\t\tMethod: \"POST\",\n\t\t\t\tURL: data[\"TencentVoiceUrl\"], // 使用测试服务器的URL\n\t\t\t\tTimeout: 5,\n\t\t\t\tRequest: RequestDetail{\n\t\t\t\t\tBody: `{\"TemplateId\":\"1475778\",\"CalledNumber\":\"{{ $sendto }}\",\"VoiceSdkAppid\":\"1400655317\",\"TemplateParamSet\":[\"测试\"],\"PlayTimes\":2}`,\n\t\t\t\t},\n\t\t\t\tHeaders: map[string]string{\n\t\t\t\t\t\"Content-Type\": \"application/json\",\n\t\t\t\t\t\"Host\": \"vms.tencentcloudapi.com\",\n\t\t\t\t\t\"X-TC-Action\": \"SendTtsVoice\",\n\t\t\t\t\t\"X-TC-Version\": \"2020-09-02\",\n\t\t\t\t\t\"X-TC-Region\": \"ap-beijing\",\n\t\t\t\t\t\"Service\": \"vms\",\n\t\t\t\t\t\"Secret_ID\": \"test-id\",\n\t\t\t\t\t\"Secret_Key\": \"test-key\",\n\t\t\t\t},\n\t\t\t\tRetryTimes: 2,\n\t\t\t\tRetryInterval: 1,\n\t\t\t},\n\t\t},\n\t\tParamConfig: &NotifyParamConfig{\n\t\t\tUserInfo: &UserInfo{\n\t\t\t\tContactKey: \"phone\",\n\t\t\t},\n\t\t},\n\t}\n\n\t// 创建通知模板\n\ttpl := map[string]interface{}{\n\t\t\"code\": \"123456\",\n\t}\n\n\t// 创建HTTP客户端\n\tclient, err := GetHTTPClient(notifyChannel)\n\tif err != nil {\n\t\tt.Fatalf(\"创建HTTP客户端失败: %v\", err)\n\t}\n\n\t// 调用SendHTTP方法\n\tresp, err := notifyChannel.SendHTTP(events, tpl, map[string]string{}, []string{\"+8618021015257\"}, client)\n\tif err != nil {\n\t\tt.Fatalf(\"SendHTTP失败: %v\", err)\n\t}\n\n\t// 验证响应\n\tif !strings.Contains(resp, \"RequestId\") || !strings.Contains(resp, \"SendStatus\") {\n\t\tt.Errorf(\"响应不包含预期内容,得到: %s\", resp)\n\t}\n}\n\nfunc TestSendTencentSMSNotification(t *testing.T) {\n\tdata, err := readKeyValueFromJsonFile(\"../.env.json\")\n\tif err != nil {\n\t\tt.Fatalf(\"读取JSON文件失败: %v\", err)\n\t}\n\n\t// 创建腾讯云短信通知配置\n\tnotifyChannel := &NotifyChannelConfig{\n\t\tRequestType: \"http\",\n\t\tRequestConfig: &RequestConfig{\n\t\t\tHTTPRequestConfig: &HTTPRequestConfig{\n\t\t\t\tMethod: \"POST\",\n\t\t\t\tURL: data[\"TencentSMSUrl\"], // 使用测试服务器的URL\n\t\t\t\tTimeout: 5,\n\t\t\t\tRequest: RequestDetail{\n\t\t\t\t\tBody: `{\"PhoneNumberSet\":[\"{{ $sendto }}\"],\"SignName\":\"测试签名\",\"SmsSdkAppId\":\"1400000000\",\"TemplateId\":\"1000000\",\"TemplateParamSet\":[\"测试\"]}`,\n\t\t\t\t},\n\t\t\t\tHeaders: map[string]string{\n\t\t\t\t\t\"Content-Type\": \"application/json\",\n\t\t\t\t\t\"Host\": \"sms.tencentcloudapi.com\",\n\t\t\t\t\t\"X-TC-Action\": \"SendSms\",\n\t\t\t\t\t\"X-TC-Version\": \"2021-01-11\",\n\t\t\t\t\t\"X-TC-Region\": \"ap-guangzhou\",\n\t\t\t\t\t\"Service\": \"sms\",\n\t\t\t\t\t\"Secret_ID\": \"test-id\",\n\t\t\t\t\t\"Secret_Key\": \"test-key\",\n\t\t\t\t},\n\t\t\t\tRetryTimes: 2,\n\t\t\t\tRetryInterval: 1,\n\t\t\t},\n\t\t},\n\t\tParamConfig: &NotifyParamConfig{\n\t\t\tUserInfo: &UserInfo{\n\t\t\t\tContactKey: \"phone\",\n\t\t\t},\n\t\t},\n\t}\n\n\t// 创建通知模板\n\ttpl := map[string]interface{}{\n\t\t\"code\": \"123456\",\n\t}\n\n\t// 创建HTTP客户端\n\tclient, err := GetHTTPClient(notifyChannel)\n\tif err != nil {\n\t\tt.Fatalf(\"创建HTTP客户端失败: %v\", err)\n\t}\n\n\t// 调用SendHTTP方法\n\tresp, err := notifyChannel.SendHTTP(events, tpl, map[string]string{}, []string{\"+8618021015257\"}, client)\n\tif err != nil {\n\t\tt.Fatalf(\"SendHTTP失败: %v\", err)\n\t}\n\n\t// 验证响应\n\tif !strings.Contains(resp, \"RequestId\") || !strings.Contains(resp, \"SendStatusSet\") {\n\t\tt.Errorf(\"响应不包含预期内容,得到: %s\", resp)\n\t}\n}\n\nfunc TestSendAliYunVoiceNotification(t *testing.T) {\n\tdata, err := readKeyValueFromJsonFile(\"../.env.json\")\n\tif err != nil {\n\t\tt.Fatalf(\"读取JSON文件失败: %v\", err)\n\t}\n\n\t// 创建阿里云语音通知配置\n\tnotifyChannel := &NotifyChannelConfig{\n\t\tIdent: \"ali-voice\",\n\t\tRequestType: \"http\",\n\t\tRequestConfig: &RequestConfig{\n\t\t\tHTTPRequestConfig: &HTTPRequestConfig{\n\t\t\t\tMethod: \"POST\",\n\t\t\t\tURL: \"http://dyvmsapi.aliyuncs.com\",\n\t\t\t\tTimeout: 10,\n\t\t\t\tRequest: RequestDetail{\n\t\t\t\t\tParameters: map[string]string{\n\t\t\t\t\t\t\"AccessKeyId\": data[\"AccessKeyId\"],\n\t\t\t\t\t\t\"AccessKeySecret\": data[\"AccessKeySecret\"],\n\t\t\t\t\t\t\"TtsCode\": data[\"TtsCode\"],\n\t\t\t\t\t\t\"CalledNumber\": `{{ $sendto }}`,\n\t\t\t\t\t\t\"TtsParam\": `{\"alert_name\":\"test\"}`,\n\t\t\t\t\t},\n\t\t\t\t},\n\t\t\t\tRetryTimes: 2,\n\t\t\t\tRetryInterval: 1,\n\t\t\t},\n\t\t},\n\t\tParamConfig: &NotifyParamConfig{\n\t\t\tUserInfo: &UserInfo{\n\t\t\t\tContactKey: \"phone\",\n\t\t\t},\n\t\t},\n\t}\n\n\t// 创建通知模板\n\ttpl := map[string]interface{}{\n\t\t\"code\": data[\"TtsCode\"],\n\t}\n\n\t// 创建HTTP客户端\n\tclient, err := GetHTTPClient(notifyChannel)\n\tif err != nil {\n\t\tt.Fatalf(\"创建HTTP客户端失败: %v\", err)\n\t}\n\n\t// 调用SendHTTP方法\n\tresp, err := notifyChannel.SendHTTP(events, tpl, map[string]string{}, []string{data[\"Phone\"]}, client)\n\tif err != nil {\n\t\tt.Fatalf(\"SendHTTP失败: %v\", err)\n\t}\n\n\t// 验证响应\n\tif !strings.Contains(resp, \"RequestId\") || !strings.Contains(resp, \"CallId\") {\n\t\tt.Errorf(\"响应不包含预期内容,得到: %s\", resp)\n\t}\n}\n\nfunc TestSendAliYunSMSNotification(t *testing.T) {\n\tdata, err := readKeyValueFromJsonFile(\"../.env.json\")\n\tif err != nil {\n\t\tt.Fatalf(\"读取JSON文件失败: %v\", err)\n\t}\n\n\tnotifyChannel := &NotifyChannelConfig{\n\t\tIdent: \"ali-sms\",\n\t\tRequestType: \"http\",\n\t\tRequestConfig: &RequestConfig{\n\t\t\tHTTPRequestConfig: &HTTPRequestConfig{\n\t\t\t\tMethod: \"POST\",\n\t\t\t\tURL: \"https://dysmsapi.aliyuncs.com\",\n\t\t\t\tTimeout: 10000,\n\t\t\t\tRequest: RequestDetail{\n\t\t\t\t\tParameters: map[string]string{\n\t\t\t\t\t\t\"PhoneNumbers\": \"{{ $sendto }}\",\n\t\t\t\t\t\t\"SignName\": data[\"SignName\"],\n\t\t\t\t\t\t\"TemplateCode\": data[\"TemplateCode\"],\n\t\t\t\t\t\t\"TemplateParam\": `{\"name\":\"text\",\"tag\":\"text\"}`,\n\t\t\t\t\t\t\"AccessKeyId\": data[\"AccessKeyId\"],\n\t\t\t\t\t\t\"AccessKeySecret\": data[\"AccessKeySecret\"],\n\t\t\t\t\t},\n\t\t\t\t},\n\t\t\t\tHeaders: map[string]string{\n\t\t\t\t\t\"Content-Type\": \"application/json\",\n\t\t\t\t},\n\t\t\t\tRetryTimes: 2,\n\t\t\t\tRetryInterval: 1,\n\t\t\t},\n\t\t},\n\t\tParamConfig: &NotifyParamConfig{\n\t\t\tUserInfo: &UserInfo{\n\t\t\t\tContactKey: \"phone\",\n\t\t\t},\n\t\t},\n\t}\n\n\t// 创建通知模板\n\ttpl := map[string]interface{}{\n\t\t\"code\": data[\"TemplateCode\"],\n\t}\n\n\t// 创建HTTP客户端\n\tclient, err := GetHTTPClient(notifyChannel)\n\tif err != nil {\n\t\tt.Fatalf(\"创建HTTP客户端失败: %v\", err)\n\t}\n\n\t// 调用SendHTTP方法\n\tresp, err := notifyChannel.SendHTTP(events, tpl, map[string]string{}, []string{data[\"Phone\"]}, client)\n\tif err != nil {\n\t\tt.Fatalf(\"SendHTTP失败: %v\", err)\n\t}\n\n\t// 验证响应\n\tif !strings.Contains(resp, \"BizId\") || !strings.Contains(resp, \"RequestId\") {\n\t\tt.Errorf(\"响应不包含预期内容,得到: %s\", resp)\n\t}\n}\n\nfunc TestSendFlashDuty(t *testing.T) {\n\tdata, err := readKeyValueFromJsonFile(\"../.env.json\")\n\tif err != nil {\n\t\tt.Fatalf(\"读取JSON文件失败: %v\", err)\n\t}\n\n\t// 创建NotifyChannelConfig对象\n\tnotifyChannel := &NotifyChannelConfig{\n\t\tID: 1,\n\t\tName: \"FlashDuty测试\",\n\t\tIdent: \"flashduty-test\",\n\t\tRequestType: \"flashduty\",\n\t\tRequestConfig: &RequestConfig{\n\t\t\tFlashDutyRequestConfig: &FlashDutyRequestConfig{\n\t\t\t\tIntegrationUrl: data[\"FlashDutyIntegrationUrl\"],\n\t\t\t},\n\t\t},\n\t}\n\n\t// 创建HTTP客户端\n\tclient := &http.Client{\n\t\tTimeout: 5 * time.Second,\n\t}\n\n\t// 调用SendFlashDuty方法\n\tflashDutyChannelID := int64(4344322009498)\n\tresp, err := notifyChannel.SendFlashDuty(events, flashDutyChannelID, client)\n\n\t// 验证结果\n\tif err != nil {\n\t\tt.Errorf(\"SendFlashDuty返回错误: %v\", err)\n\t}\n\n\t// 验证响应内容\n\tif !strings.Contains(resp, \"success\") {\n\t\tt.Errorf(\"响应内容不包含预期的'success'字符串, 得到: %s\", resp)\n\t}\n\n\t// 测试无效的客户端情况\n\t_, err = notifyChannel.SendFlashDuty(events, flashDutyChannelID, nil)\n\tif err == nil || !strings.Contains(err.Error(), \"http client not found\") {\n\t\tt.Errorf(\"预期错误'http client not found',但得到: %v\", err)\n\t}\n\n\t// 测试请求失败的情况\n\tinvalidNotifyChannel := &NotifyChannelConfig{\n\t\tRequestType: \"flashduty\",\n\t\tRequestConfig: &RequestConfig{\n\t\t\tFlashDutyRequestConfig: &FlashDutyRequestConfig{\n\t\t\t\tIntegrationUrl: \"http://invalid-url-that-does-not-exist\",\n\t\t\t},\n\t\t},\n\t}\n\n\t_, err = invalidNotifyChannel.SendFlashDuty(events, flashDutyChannelID, client)\n\tif err == nil {\n\t\tt.Errorf(\"预期请求失败,但未返回错误\")\n\t}\n}\n\n// read key value from json file\nfunc readKeyValueFromJsonFile(filePath string) (map[string]string, error) {\n\tjsonFile, err := os.Open(filePath)\n\tif err != nil {\n\t\treturn nil, err\n\t}\n\tdefer jsonFile.Close()\n\n\tvar data map[string]string\n\terr = json.NewDecoder(jsonFile).Decode(&data)\n\treturn data, err\n}\n"
},
{
"path": "models/notify_config.go",
"content": "package models\n\nimport (\n\t\"fmt\"\n\t\"net/http\"\n\n\t\"github.com/toolkits/pkg/str\"\n)\n\nconst WEBHOOKKEY = \"webhook\"\nconst NOTIFYSCRIPT = \"notify_script\"\nconst NOTIFYCHANNEL = \"notify_channel\"\nconst NOTIFYCONTACT = \"notify_contact\"\nconst SMTP = \"smtp_config\"\nconst IBEX = \"ibex_server\"\n\nvar GlobalCallback = 0\nvar RuleCallback = 1\n\ntype Webhook struct {\n\tType int `json:\"type\"`\n\tEnable bool `json:\"enable\"`\n\tUrl string `json:\"url\"`\n\tBasicAuthUser string `json:\"basic_auth_user\"`\n\tBasicAuthPass string `json:\"basic_auth_pass\"`\n\tTimeout int `json:\"timeout\"`\n\tHeaderMap map[string]string `json:\"headers\"`\n\tHeaders []string `json:\"headers_str\"`\n\tSkipVerify bool `json:\"skip_verify\"`\n\tNote string `json:\"note\"`\n\tRetryCount int `json:\"retry_count\"`\n\tRetryInterval int `json:\"retry_interval\"`\n\tBatch int `json:\"batch\"`\n\n\tClient *http.Client `json:\"-\"`\n}\n\nfunc (w *Webhook) Hash() string {\n\treturn str.MD5(fmt.Sprintf(\"%d_%t_%s_%s_%s_%d_%v_%t_%s_%d_%d_%d\", w.Type, w.Enable, w.Url, w.BasicAuthUser, w.BasicAuthPass, w.Timeout, w.HeaderMap, w.SkipVerify, w.Note, w.RetryCount, w.RetryInterval, w.Batch))\n}\n\ntype NotifyScript struct {\n\tEnable bool `json:\"enable\"`\n\tType int `json:\"type\"` // 0 script 1 path\n\tContent string `json:\"content\"`\n\tTimeout int `json:\"timeout\"`\n}\n\ntype NotifyChannel struct {\n\tName string `json:\"name\"`\n\tIdent string `json:\"ident\"`\n\tHide bool `json:\"hide\"`\n\tBuiltIn bool `json:\"built_in\"`\n}\n\ntype NotifyContact struct {\n\tName string `json:\"name\"`\n\tIdent string `json:\"ident\"`\n\tHide bool `json:\"hide\"`\n\tBuiltIn bool `json:\"built_in\"`\n}\n"
},
{
"path": "models/notify_rule.go",
"content": "package models\n\nimport (\n\t\"crypto/sha256\"\n\t\"encoding/hex\"\n\t\"errors\"\n\t\"fmt\"\n\t\"time\"\n\n\t\"github.com/ccfos/nightingale/v6/pkg/ctx\"\n\t\"github.com/ccfos/nightingale/v6/pkg/poster\"\n)\n\ntype NotifyRule struct {\n\tID int64 `json:\"id\" gorm:\"primarykey\"`\n\tName string `json:\"name\"` // 名称\n\tDescription string `json:\"description\"` // 备注\n\tEnable bool `json:\"enable\"` // 启用状态\n\tUserGroupIds []int64 `json:\"user_group_ids\" gorm:\"serializer:json\"` // 告警组ID\n\n\tPipelineConfigs []PipelineConfig `json:\"pipeline_configs\" gorm:\"serializer:json\"`\n\n\t// 通知配置\n\tNotifyConfigs []NotifyConfig `json:\"notify_configs\" gorm:\"serializer:json\"`\n\tExtraConfig interface{} `json:\"extra_config,omitempty\" gorm:\"serializer:json\"`\n\n\tCreateAt int64 `json:\"create_at\"`\n\tCreateBy string `json:\"create_by\"`\n\tUpdateAt int64 `json:\"update_at\"`\n\tUpdateBy string `json:\"update_by\"`\n\tUpdateByNickname string `json:\"update_by_nickname\" gorm:\"-\"`\n}\n\ntype PipelineConfig struct {\n\tPipelineId int64 `json:\"pipeline_id\"`\n\tEnable bool `json:\"enable\"`\n}\n\nfunc (r *NotifyRule) TableName() string {\n\treturn \"notify_rule\"\n}\n\ntype NotifyConfig struct {\n\tChannelID int64 `json:\"channel_id\"` // 通知媒介(如:阿里云短信)\n\tTemplateID int64 `json:\"template_id\"` // 通知模板\n\tParams map[string]interface{} `json:\"params\"` // 通知参数\n\tType string `json:\"type\"`\n\n\tSeverities []int `json:\"severities\"` // 适用级别(一级告警、二级告警、三级告警)\n\tTimeRanges []TimeRanges `json:\"time_ranges\"` // 适用时段\n\tLabelKeys []TagFilter `json:\"label_keys\"` // 适用标签\n\tAttributes []TagFilter `json:\"attributes\"` // 适用属性\n}\n\nfunc (n *NotifyConfig) Hash() string {\n\thash := sha256.New()\n\thash.Write([]byte(fmt.Sprintf(\"%d%d%v%s%v%v%v%v\", n.ChannelID, n.TemplateID, n.Params, n.Type, n.Severities, n.TimeRanges, n.LabelKeys, n.Attributes)))\n\treturn hex.EncodeToString(hash.Sum(nil))\n}\n\ntype CustomParams struct {\n\tUserIDs []int64 `json:\"user_ids\"`\n\tUserGroupIDs []int64 `json:\"user_group_ids\"`\n\tIDs []int64 `json:\"ids\"`\n}\n\ntype TimeRanges struct {\n\tStart string `json:\"start\"`\n\tEnd string `json:\"end\"`\n\tWeek []int `json:\"week\"`\n}\n\nvar NotifyRuleCache struct {\n}\n\n// 创建 NotifyRule\nfunc CreateNotifyRule(c *ctx.Context, rule *NotifyRule) error {\n\treturn DB(c).Create(rule).Error\n}\n\n// 读取 NotifyRule\nfunc GetNotifyRule(c *ctx.Context, id int64) (*NotifyRule, error) {\n\tvar rule NotifyRule\n\tif err := DB(c).First(&rule, id).Error; err != nil {\n\t\treturn nil, err\n\t}\n\treturn &rule, nil\n}\n\n// 删除 NotifyRule\nfunc DeleteNotifyRule(c *ctx.Context, id int64) error {\n\treturn DB(c).Delete(&NotifyRule{}, id).Error\n}\n\nfunc NotifyRuleStatistics(ctx *ctx.Context) (*Statistics, error) {\n\tif !ctx.IsCenter {\n\t\ts, err := poster.GetByUrls[*Statistics](ctx, \"/v1/n9e/statistic?name=notify_rule\")\n\t\treturn s, err\n\t}\n\n\tsession := DB(ctx).Model(&NotifyRule{}).Select(\"count(*) as total\", \"max(update_at) as last_updated\").Where(\"enable = ?\", true)\n\n\tvar stats []*Statistics\n\terr := session.Find(&stats).Error\n\tif err != nil {\n\t\treturn nil, err\n\t}\n\n\treturn stats[0], nil\n}\n\nfunc NotifyRuleGetsAll(ctx *ctx.Context) ([]*NotifyRule, error) {\n\tif !ctx.IsCenter {\n\t\trules, err := poster.GetByUrls[[]*NotifyRule](ctx, \"/v1/n9e/notify-rules\")\n\t\treturn rules, err\n\t}\n\n\tvar rules []*NotifyRule\n\terr := DB(ctx).Where(\"enable = ?\", true).Find(&rules).Error\n\tif err != nil {\n\t\treturn nil, err\n\t}\n\n\treturn rules, nil\n}\n\nfunc (r *NotifyRule) Verify() error {\n\tif r.Name == \"\" {\n\t\treturn errors.New(\"name cannot be empty\")\n\t}\n\n\t// if len(r.UserGroupIds) == 0 {\n\t// \treturn errors.New(\"user group ids cannot be empty\")\n\t// }\n\n\t// if len(r.NotifyConfigs) == 0 {\n\t// \treturn errors.New(\"notify configs cannot be empty\")\n\t// }\n\n\tfor _, config := range r.NotifyConfigs {\n\t\tif err := config.Verify(); err != nil {\n\t\t\treturn err\n\t\t}\n\t}\n\n\treturn nil\n}\n\nfunc (c *NotifyConfig) Verify() error {\n\tif c.ChannelID <= 0 {\n\t\treturn errors.New(\"invalid channel id\")\n\t}\n\n\tfor _, severity := range c.Severities {\n\t\tif severity < 1 || severity > 3 {\n\t\t\treturn errors.New(\"invalid severity level\")\n\t\t}\n\t}\n\n\tfor _, timeRange := range c.TimeRanges {\n\t\tif err := timeRange.Verify(); err != nil {\n\t\t\treturn err\n\t\t}\n\t}\n\n\tfor _, label := range c.LabelKeys {\n\t\tif err := label.Verify(); err != nil {\n\t\t\treturn err\n\t\t}\n\t}\n\n\treturn nil\n}\n\nfunc (t *TimeRanges) Verify() error {\n\tif t.Start == \"\" {\n\t\treturn errors.New(\"start time cannot be empty\")\n\t}\n\tif t.End == \"\" {\n\t\treturn errors.New(\"end time cannot be empty\")\n\t}\n\n\t// 进一步校验时间格式或检查时间段的合理性\n\n\treturn nil\n}\n\nfunc (r *NotifyRule) Update(ctx *ctx.Context, ref NotifyRule) error {\n\t// ref.FE2DB()\n\n\tref.ID = r.ID\n\tref.CreateAt = r.CreateAt\n\tref.CreateBy = r.CreateBy\n\tref.UpdateAt = time.Now().Unix()\n\n\terr := ref.Verify()\n\tif err != nil {\n\t\treturn err\n\t}\n\n\tdb := DB(ctx).Model(r).Select(\"*\")\n\tif ref.ExtraConfig == nil {\n\t\tdb = db.Omit(\"ExtraConfig\")\n\t}\n\treturn db.Updates(ref).Error\n}\n\nfunc (r *NotifyRule) DB2FE() {\n\tif r.UserGroupIds == nil {\n\t\tr.UserGroupIds = make([]int64, 0)\n\t}\n\tif r.NotifyConfigs == nil {\n\t\tr.NotifyConfigs = make([]NotifyConfig, 0)\n\t}\n}\n\nfunc NotifyRuleGet(ctx *ctx.Context, where string, args ...interface{}) (*NotifyRule, error) {\n\tlst, err := NotifyRulesGet(ctx, where, args...)\n\tif err != nil || len(lst) == 0 {\n\t\treturn nil, err\n\t}\n\treturn lst[0], err\n}\n\nfunc NotifyRulesGet(ctx *ctx.Context, where string, args ...interface{}) ([]*NotifyRule, error) {\n\tlst := make([]*NotifyRule, 0)\n\tsession := DB(ctx)\n\tif where != \"\" && len(args) > 0 {\n\t\tsession = session.Where(where, args...)\n\t}\n\terr := session.Order(\"name asc\").Find(&lst).Error\n\tif err != nil {\n\t\treturn nil, err\n\t}\n\tfor _, r := range lst {\n\t\tr.DB2FE()\n\t}\n\treturn lst, nil\n}\n\ntype NotifyRuleChecker interface {\n\tIfUsed(*NotifyRule) bool\n}\n\nfunc UsedByNotifyRule(ctx *ctx.Context, nrc NotifyRuleChecker) ([]int64, error) {\n\tnotifyRules, err := NotifyRulesGet(ctx, \"\", nil)\n\tif err != nil {\n\t\treturn nil, err\n\t}\n\tids := make([]int64, 0)\n\tfor _, nr := range notifyRules {\n\t\tif nrc.IfUsed(nr) {\n\t\t\tids = append(ids, nr.ID)\n\t\t}\n\t}\n\treturn ids, nil\n}\n"
},
{
"path": "models/notify_tpl.go",
"content": "package models\n\nimport (\n\t\"encoding/json\"\n\t\"fmt\"\n\t\"html/template\"\n\t\"path\"\n\t\"strings\"\n\n\t\"github.com/ccfos/nightingale/v6/pkg/ctx\"\n\t\"github.com/ccfos/nightingale/v6/pkg/poster\"\n\t\"github.com/ccfos/nightingale/v6/pkg/tplx\"\n\n\t\"github.com/pkg/errors\"\n\t\"github.com/toolkits/pkg/file\"\n\t\"github.com/toolkits/pkg/logger\"\n)\n\ntype NotifyTpl struct {\n\tId int64 `json:\"id\"`\n\tName string `json:\"name\"`\n\tChannel string `json:\"channel\"`\n\tContent string `json:\"content\"`\n\tBuiltIn bool `json:\"built_in\" gorm:\"-\"`\n\tCreateAt int64 `json:\"create_at\"`\n\tCreateBy string `json:\"create_by\"`\n\tUpdateAt int64 `json:\"update_at\"`\n\tUpdateBy string `json:\"update_by\"`\n\tUpdateByNickname string `json:\"update_by_nickname\" gorm:\"-\"`\n}\n\nfunc (n *NotifyTpl) TableName() string {\n\treturn \"notify_tpl\"\n}\n\nfunc (n *NotifyTpl) Create(c *ctx.Context) error {\n\treturn Insert(c, n)\n}\n\nfunc (n *NotifyTpl) UpdateContent(c *ctx.Context) error {\n\treturn DB(c).Model(n).Select(\"content\", \"update_at\", \"update_by\").Updates(n).Error\n}\n\nfunc (n *NotifyTpl) Update(c *ctx.Context) error {\n\treturn DB(c).Model(n).Select(\"name\", \"update_at\", \"update_by\").Updates(n).Error\n}\n\nfunc (n *NotifyTpl) CreateIfNotExists(c *ctx.Context, channel string) error {\n\tcount, err := NotifyTplCountByChannel(c, channel)\n\tif err != nil {\n\t\treturn errors.WithMessage(err, \"failed to count notify tpls\")\n\t}\n\n\tif count != 0 {\n\t\treturn nil\n\t}\n\n\terr = n.Create(c)\n\treturn err\n}\n\nfunc (n *NotifyTpl) NotifyTplDelete(ctx *ctx.Context, id int64) error {\n\treturn DB(ctx).Where(\"channel not in (?) and id =? \", DefaultChannels, id).Delete(new(NotifyTpl)).Error\n}\n\nfunc NotifyTplCountByChannel(c *ctx.Context, channel string) (int64, error) {\n\tvar count int64\n\terr := DB(c).Model(&NotifyTpl{}).Where(\"channel=?\", channel).Count(&count).Error\n\treturn count, err\n}\n\nfunc NotifyTplGets(c *ctx.Context) ([]*NotifyTpl, error) {\n\tif !c.IsCenter {\n\t\tlst, err := poster.GetByUrls[[]*NotifyTpl](c, \"/v1/n9e/notify-tpls\")\n\t\treturn lst, err\n\t}\n\n\tvar lst []*NotifyTpl\n\terr := DB(c).Find(&lst).Error\n\treturn lst, err\n}\n\nfunc ListTpls(c *ctx.Context) (map[string]*template.Template, error) {\n\tnotifyTpls, err := NotifyTplGets(c)\n\tif err != nil {\n\t\treturn nil, errors.WithMessage(err, \"failed to get notify tpls\")\n\t}\n\n\ttpls := make(map[string]*template.Template)\n\tfor _, notifyTpl := range notifyTpls {\n\t\tvar defs = []string{\n\t\t\t\"{{$labels := .TagsMap}}\",\n\t\t\t\"{{$value := .TriggerValue}}\",\n\t\t}\n\t\ttext := strings.Join(append(defs, notifyTpl.Content), \"\")\n\t\ttpl, err := template.New(notifyTpl.Channel).Funcs(tplx.TemplateFuncMap).Parse(text)\n\t\tif err != nil {\n\t\t\treturn nil, fmt.Errorf(\"failed to parse tpl:%v %v \", notifyTpl, err)\n\t\t}\n\n\t\ttpls[notifyTpl.Channel] = tpl\n\t}\n\treturn tpls, nil\n}\n\n// get notify by id\nfunc NotifyTplGet(c *ctx.Context, id int64) (*NotifyTpl, error) {\n\tvar tpl NotifyTpl\n\terr := DB(c).Where(\"id=?\", id).First(&tpl).Error\n\treturn &tpl, err\n}\n\nfunc InitNotifyConfig(c *ctx.Context, tplDir string) {\n\tif !c.IsCenter {\n\t\treturn\n\t}\n\n\t// init notify channel\n\tcval, err := ConfigsGet(c, NOTIFYCHANNEL)\n\tif err != nil {\n\t\tlogger.Errorf(\"failed to get notify contact config: %v\", err)\n\t\treturn\n\t}\n\n\tif cval == \"\" {\n\t\tvar notifyChannels []NotifyChannel\n\t\tfor _, channel := range DefaultChannels {\n\t\t\tnotifyChannels = append(notifyChannels, NotifyChannel{Ident: channel, Name: channel, BuiltIn: true})\n\t\t}\n\n\t\tdata, _ := json.Marshal(notifyChannels)\n\t\terr = ConfigsSet(c, NOTIFYCHANNEL, string(data))\n\t\tif err != nil {\n\t\t\tlogger.Errorf(\"failed to set notify contact config: %v\", err)\n\t\t\treturn\n\t\t}\n\t} else {\n\t\tvar channels []NotifyChannel\n\t\terr = json.Unmarshal([]byte(cval), &channels)\n\t\tif err != nil {\n\t\t\tlogger.Errorf(\"failed to unmarshal notify channel config: %v\", err)\n\t\t\treturn\n\t\t}\n\t\tchannelMap := make(map[string]bool)\n\t\tfor _, channel := range channels {\n\t\t\tchannelMap[channel.Ident] = true\n\t\t}\n\n\t\tvar newChannels []NotifyChannel\n\t\tfor _, channel := range DefaultChannels {\n\t\t\tif _, ok := channelMap[channel]; !ok {\n\t\t\t\tnewChannels = append(newChannels, NotifyChannel{Ident: channel, Name: channel, BuiltIn: true})\n\t\t\t}\n\t\t}\n\t\tif len(newChannels) > 0 {\n\t\t\tchannels = append(channels, newChannels...)\n\t\t\tdata, _ := json.Marshal(channels)\n\t\t\terr = ConfigsSet(c, NOTIFYCHANNEL, string(data))\n\t\t\tif err != nil {\n\t\t\t\tlogger.Errorf(\"failed to set notify contact config: %v\", err)\n\t\t\t\treturn\n\t\t\t}\n\t\t}\n\t}\n\n\t// init notify tpl\n\ttplMap := getNotifyTpl(tplDir)\n\tfor channel, content := range tplMap {\n\t\tnotifyTpl := NotifyTpl{\n\t\t\tName: channel,\n\t\t\tChannel: channel,\n\t\t\tContent: content,\n\t\t}\n\n\t\terr := notifyTpl.CreateIfNotExists(c, channel)\n\t\tif err != nil {\n\t\t\tlogger.Warningf(\"failed to create notify tpls %v\", err)\n\t\t}\n\t}\n}\n\nfunc getNotifyTpl(tplDir string) map[string]string {\n\tfilenames, err := file.FilesUnder(tplDir)\n\tif err != nil {\n\t\tlogger.Errorf(\"failed to get tpl files under %s\", tplDir)\n\t\treturn nil\n\t}\n\n\ttplMap := make(map[string]string)\n\tif len(filenames) != 0 {\n\t\tfor i := 0; i < len(filenames); i++ {\n\t\t\tif strings.HasSuffix(filenames[i], \".tpl\") {\n\t\t\t\tname := strings.TrimSuffix(filenames[i], \".tpl\")\n\t\t\t\ttplpath := path.Join(tplDir, filenames[i])\n\t\t\t\tcontent, err := file.ToString(tplpath)\n\t\t\t\tif err != nil {\n\t\t\t\t\tlogger.Errorf(\"failed to read tpl file: %s\", filenames[i])\n\t\t\t\t\tcontinue\n\t\t\t\t}\n\t\t\t\ttplMap[name] = content\n\t\t\t}\n\t\t}\n\t\treturn tplMap\n\t}\n\n\tlogger.Debugf(\"no tpl files under %s, use default tpl\", tplDir)\n\treturn TplMap\n}\n\nvar TplMap = map[string]string{\n\tDingtalk: `#### {{if .IsRecovered}}💚{{.RuleName}} {{else}}💔{{.RuleName}} {{end}}\n---\n{{$time_duration := sub now.Unix .FirstTriggerTime }}{{if .IsRecovered}}{{$time_duration = sub .LastEvalTime .FirstTriggerTime }}{{end}}\n- **告警级别**: {{.Severity}}级\n{{- if .RuleNote}}\n- **规则备注**: {{.RuleNote}}\n{{- end}}\n{{- if not .IsRecovered}}\n- **当次触发时值**: {{.TriggerValue}}\n- **当次触发时间**: {{timeformat .TriggerTime}}\n- **告警持续时长**: {{humanizeDurationInterface $time_duration}}\n{{- else}}\n{{- if .AnnotationsJSON.recovery_value}}\n- **恢复时值**: {{formatDecimal .AnnotationsJSON.recovery_value 4}}\n{{- end}}\n- **恢复时间**: {{timeformat .LastEvalTime}}\n- **告警持续时长**: {{humanizeDurationInterface $time_duration}}\n{{- end}}\n- **告警事件标签**:\n{{- range $key, $val := .TagsMap}}\n{{- if ne $key \"rulename\" }}\n\t- {{$key}}: {{$val}}\n{{- end}}\n{{- end}}\n{{$domain := \"http://请联系管理员修改通知模板将域名替换为实际的域名\" }} \n[事件详情]({{$domain}}/alert-his-events/{{.Id}})|[屏蔽1小时]({{$domain}}/alert-mutes/add?__event_id={{.Id}}){{if eq .Cate \"prometheus\"}}|[查看曲线]({{$domain}}/metric/explorer?__event_id={{.Id}}&mode=graph}}){{end}}`,\n\tEmail: `\n\t\n\t\n\t\t夜莺告警通知 \n\t\t\n\t\n\t\n\t\n\t\t
\n\t\t\t
\n\t\t\t\t{{.RuleName}} \n\t\t\t\t
\n\t\t\t \n\t\n\t\t\t
\n\t\n\t\t\t
\n\t\t\t\t
\n\t\t\t\t\t\n\t\t\t\t\t{{if .IsRecovered}}\n\t\t\t\t\t\n\t\t\t\t\t\t级别状态: \n\t\t\t\t\t\tS{{.Severity}} Recovered \n\t\t\t\t\t \n\t\t\t\t\t{{else}}\n\t\t\t\t\t\n\t\t\t\t\t\t级别状态: \n\t\t\t\t\t\tS{{.Severity}} Triggered \n\t\t\t\t\t \n\t\t\t\t\t{{end}}\n\t\n\t\t\t\t\t\n\t\t\t\t\t\t策略备注: \n\t\t\t\t\t\t{{.RuleNote}} \n\t\t\t\t\t \n\t\t\t\t\t\n\t\t\t\t\t\t设备备注: \n\t\t\t\t\t\t{{.TargetNote}} \n\t\t\t\t\t \n\t\t\t\t\t{{if not .IsRecovered}}\n\t\t\t\t\t\n\t\t\t\t\t\t触发时值: \n\t\t\t\t\t\t{{.TriggerValue}} \n\t\t\t\t\t \n\t\t\t\t\t{{end}}\n\t\n\t\t\t\t\t{{if .TargetIdent}}\n\t\t\t\t\t\n\t\t\t\t\t\t监控对象: \n\t\t\t\t\t\t{{.TargetIdent}} \n\t\t\t\t\t \n\t\t\t\t\t{{end}}\n\t\t\t\t\t\n\t\t\t\t\t\t监控指标: \n\t\t\t\t\t\t{{.TagsJSON}} \n\t\t\t\t\t \n\t\n\t\t\t\t\t{{if .IsRecovered}}\n\t\t\t\t\t\n\t\t\t\t\t\t恢复时间: \n\t\t\t\t\t\t{{timeformat .LastEvalTime}} \n\t\t\t\t\t \n\t\t\t\t\t{{else}}\n\t\t\t\t\t\n\t\t\t\t\t\t触发时间: \n\t\t\t\t\t\t\n\t\t\t\t\t\t\t{{timeformat .TriggerTime}}\n\t\t\t\t\t\t \n\t\t\t\t\t \n\t\t\t\t\t{{end}}\n\t\n\t\t\t\t\t\n\t\t\t\t\t\t发送时间: \n\t\t\t\t\t\t\n\t\t\t\t\t\t\t{{timestamp}}\n\t\t\t\t\t\t \n\t\t\t\t\t \n\t\t\t\t\t \n\t\t\t\t
\n\t\n\t\t\t\t
\n\t\n\t\t\t\t
\n\t\t\t
\n\t\t
\n\t
S{{.Severity}} Recovered {{else}}S{{.Severity}} Triggered {{end}} \n**规则标题**: {{.RuleName}}{{if .RuleNote}} \n**规则备注**: {{.RuleNote}}{{end}}{{if .TargetIdent}} \n**监控对象**: {{.TargetIdent}}{{end}} \n**监控指标**: {{.TagsJSON}}{{if not .IsRecovered}} \n**触发时值**: {{.TriggerValue}}{{end}} \n{{if .IsRecovered}}**恢复时间**: {{timeformat .LastEvalTime}}{{else}}**首次触发时间**: {{timeformat .FirstTriggerTime}}{{end}} \n{{$time_duration := sub now.Unix .FirstTriggerTime }}{{if .IsRecovered}}{{$time_duration = sub .LastEvalTime .FirstTriggerTime }}{{end}}**距离首次告警**: {{humanizeDurationInterface $time_duration}}\n**发送时间**: {{timestamp}}`,\n\tWecom: `**级别状态**: {{if .IsRecovered}}S{{.Severity}} Recovered {{else}}S{{.Severity}} Triggered {{end}} \n**规则标题**: {{.RuleName}}{{if .RuleNote}} \n**规则备注**: {{.RuleNote}}{{end}}{{if .TargetIdent}} \n**监控对象**: {{.TargetIdent}}{{end}} \n**监控指标**: {{.TagsJSON}}{{if not .IsRecovered}} \n**触发时值**: {{.TriggerValue}}{{end}} \n{{if .IsRecovered}}**恢复时间**: {{timeformat .LastEvalTime}}{{else}}**首次触发时间**: {{timeformat .FirstTriggerTime}}{{end}} \n{{$time_duration := sub now.Unix .FirstTriggerTime }}{{if .IsRecovered}}{{$time_duration = sub .LastEvalTime .FirstTriggerTime }}{{end}}**距离首次告警**: {{humanizeDurationInterface $time_duration}}\n**发送时间**: {{timestamp}}\n{{$domain := \"http://请联系管理员修改通知模板将域名替换为实际的域名\" }} \n[事件详情]({{$domain}}/alert-his-events/{{.Id}})|[屏蔽1小时]({{$domain}}/alert-mutes/add?__event_id={{.Id}}){{if eq .Cate \"prometheus\"}}|[查看曲线]({{$domain}}/metric/explorer?__event_id={{.Id}}&mode=graph}}){{end}}`,\n\tLark: `级别状态: S{{.Severity}} {{if .IsRecovered}}Recovered{{else}}Triggered{{end}} \n规则名称: {{.RuleName}}{{if .RuleNote}} \n规则备注: {{.RuleNote}}{{end}} \n监控指标: {{.TagsJSON}}\n{{if .IsRecovered}}恢复时间:{{timeformat .LastEvalTime}}{{else}}触发时间: {{timeformat .TriggerTime}}\n触发时值: {{.TriggerValue}}{{end}}\n发送时间: {{timestamp}}\n{{$domain := \"http://请联系管理员修改通知模板将域名替换为实际的域名\" }} \n事件详情: {{$domain}}/alert-his-events/{{.Id}}\n屏蔽1小时: {{$domain}}/alert-mutes/add?__event_id={{.Id}}`,\n\tLarkCard: `{{ if .IsRecovered }}\n{{- if ne .Cate \"host\"}}\n**告警集群:** {{.Cluster}}{{end}} \n**级别状态:** S{{.Severity}} Recovered \n**告警名称:** {{.RuleName}} \n**恢复时间:** {{timeformat .LastEvalTime}} \n{{$time_duration := sub now.Unix .FirstTriggerTime }}{{if .IsRecovered}}{{$time_duration = sub .LastEvalTime .FirstTriggerTime }}{{end}}**持续时长**: {{humanizeDurationInterface $time_duration}} \n**告警描述:** **服务已恢复** \n{{- else }}\n{{- if ne .Cate \"host\"}} \n**告警集群:** {{.Cluster}}{{end}} \n**级别状态:** S{{.Severity}} Triggered \n**告警名称:** {{.RuleName}} \n**触发时间:** {{timeformat .TriggerTime}} \n**发送时间:** {{timestamp}} \n**触发时值:** {{.TriggerValue}}\n{{$time_duration := sub now.Unix .FirstTriggerTime }}{{if .IsRecovered}}{{$time_duration = sub .LastEvalTime .FirstTriggerTime }}{{end}}**持续时长**: {{humanizeDurationInterface $time_duration}} \n{{if .RuleNote }}**告警描述:** **{{.RuleNote}}**{{end}} \n{{- end -}}\n{{$domain := \"http://请联系管理员修改通知模板将域名替换为实际的域名\" }} \n[事件详情]({{$domain}}/alert-his-events/{{.Id}})|[屏蔽1小时]({{$domain}}/alert-mutes/add?__event_id={{.Id}}){{if eq .Cate \"prometheus\"}}|[查看曲线]({{$domain}}/metric/explorer?__event_id={{.Id}}&mode=graph}}){{end}}`,\n}\n"
},
{
"path": "models/prom_alert_rule.go",
"content": "package models\n\nimport (\n\t\"fmt\"\n\t\"strings\"\n\t\"time\"\n\n\t\"github.com/toolkits/pkg/logger\"\n)\n\ntype PromRule struct {\n\tAlert string `yaml:\"alert,omitempty\" json:\"alert,omitempty\"` // 报警规则的名称\n\tRecord string `yaml:\"record,omitempty\" json:\"record,omitempty\"` // 记录规则的名称\n\tExpr string `yaml:\"expr,omitempty\" json:\"expr,omitempty\"` // PromQL 表达式\n\tFor string `yaml:\"for,omitempty\" json:\"for,omitempty\"` // 告警的等待时间\n\tAnnotations map[string]string `yaml:\"annotations,omitempty\" json:\"annotations,omitempty\"` // 规则的注释信息\n\tLabels map[string]string `yaml:\"labels,omitempty\" json:\"labels,omitempty\"` // 规则的标签信息\n}\n\ntype PromRuleGroup struct {\n\tName string `yaml:\"name\"`\n\tRules []PromRule `yaml:\"rules\"`\n\tInterval string `yaml:\"interval,omitempty\"`\n}\n\nfunc convertInterval(interval string) int {\n\tduration, err := time.ParseDuration(interval)\n\tif err != nil {\n\t\tlogger.Errorf(\"Error parsing interval `%s`, err: %v\", interval, err)\n\t\treturn 60\n\t}\n\n\tif duration.Seconds() == 0 {\n\t\tduration = 60 * time.Second\n\t}\n\n\treturn int(duration.Seconds())\n}\n\nfunc ConvertAlert(rule PromRule, interval string, datasouceQueries []DatasourceQuery, disabled int) AlertRule {\n\tannotations := rule.Annotations\n\tappendTags := []string{}\n\tseverity := 2\n\n\truleName := rule.Alert\n\tif len(rule.Labels) > 0 {\n\t\tfor k, v := range rule.Labels {\n\t\t\tif k != \"severity\" {\n\t\t\t\tappendTags = append(appendTags, fmt.Sprintf(\"%s=%s\", strings.ReplaceAll(k, \" \", \"\"), strings.ReplaceAll(v, \" \", \"\")))\n\t\t\t} else {\n\t\t\t\tswitch v {\n\t\t\t\tcase \"critical\", \"Critical\", \"CRITICAL\", \"error\", \"Error\", \"ERROR\", \"fatal\", \"Fatal\", \"FATAL\", \"page\", \"Page\", \"PAGE\", \"sev1\", \"SEV1\", \"Severity1\", \"severity1\", \"SEVERITY1\":\n\t\t\t\t\tseverity = 1\n\t\t\t\tcase \"warning\", \"Warning\", \"WARNING\", \"warn\", \"Warn\", \"WARN\", \"sev2\", \"SEV2\", \"Severity2\", \"severity2\", \"SEVERITY2\":\n\t\t\t\t\tseverity = 2\n\t\t\t\tcase \"info\", \"Info\", \"INFO\", \"notice\", \"Notice\", \"NOTICE\", \"sev3\", \"SEV3\", \"Severity3\", \"severity3\", \"SEVERITY3\":\n\t\t\t\t\tseverity = 3\n\t\t\t\t}\n\t\t\t\truleName += \"-\" + v\n\t\t\t}\n\t\t}\n\t}\n\n\tar := AlertRule{\n\t\tName: rule.Alert,\n\t\tSeverity: severity,\n\t\tDisabled: disabled,\n\t\tPromForDuration: convertInterval(rule.For),\n\t\tPromQl: rule.Expr,\n\t\tCronPattern: fmt.Sprintf(\"@every %ds\", convertInterval(interval)),\n\t\tEnableInBG: AlertRuleEnableInGlobalBG,\n\t\tNotifyRecovered: AlertRuleNotifyRecovered,\n\t\tNotifyRepeatStep: AlertRuleNotifyRepeatStep60Min,\n\t\tRecoverDuration: AlertRuleRecoverDuration0Sec,\n\t\tAnnotationsJSON: annotations,\n\t\tAppendTagsJSON: appendTags,\n\t\tDatasourceQueries: datasouceQueries,\n\t\tNotifyVersion: 1,\n\t\tNotifyRuleIds: []int64{},\n\t}\n\n\treturn ar\n}\n\nfunc DealPromGroup(promRule []PromRuleGroup, dataSourceQueries []DatasourceQuery, disabled int) []AlertRule {\n\tvar alertRules []AlertRule\n\n\tfor _, group := range promRule {\n\t\tinterval := group.Interval\n\t\tif interval == \"\" {\n\t\t\tinterval = \"60s\"\n\t\t}\n\t\tfor _, rule := range group.Rules {\n\t\t\tif rule.Alert != \"\" {\n\t\t\t\talertRules = append(alertRules,\n\t\t\t\t\tConvertAlert(rule, interval, dataSourceQueries, disabled))\n\t\t\t}\n\t\t}\n\t}\n\n\treturn alertRules\n}\n"
},
{
"path": "models/prom_alert_rule_test.go",
"content": "package models_test\n\nimport (\n\t\"testing\"\n\n\t\"github.com/ccfos/nightingale/v6/models\"\n\t\"gopkg.in/yaml.v2\"\n)\n\nfunc TestConvertAlert(t *testing.T) {\n\tjobMissing := []models.PromRule{}\n\terr := yaml.Unmarshal([]byte(` - alert: PrometheusJobMissing\n expr: absent(up{job=\"prometheus\"})\n for: 1m\n labels:\n severity: warning\n annotations:\n summary: Prometheus job missing (instance {{ $labels.instance }})\n description: \"A Prometheus job has disappeared\\n VALUE = {{ $value }}\\n LABELS = {{ $labels }}\"`), &jobMissing)\n\tif err != nil {\n\t\tt.Errorf(\"Failed to Unmarshal, err: %s\", err)\n\t}\n\tt.Logf(\"jobMissing: %+v\", jobMissing[0])\n\tconvJobMissing := models.ConvertAlert(jobMissing[0], \"30s\", []models.DatasourceQuery{}, 0)\n\tif convJobMissing.PromEvalInterval != 30 {\n\t\tt.Errorf(\"PromEvalInterval is expected to be 30, but got %d\",\n\t\t\tconvJobMissing.PromEvalInterval)\n\t}\n\tif convJobMissing.PromForDuration != 60 {\n\t\tt.Errorf(\"PromForDuration is expected to be 60, but got %d\",\n\t\t\tconvJobMissing.PromForDuration)\n\t}\n\tif convJobMissing.Severity != 2 {\n\t\tt.Errorf(\"Severity is expected to be 2, but got %d\", convJobMissing.Severity)\n\t}\n\n\truleEvaluationSlow := []models.PromRule{}\n\tyaml.Unmarshal([]byte(` - alert: PrometheusRuleEvaluationSlow\n expr: prometheus_rule_group_last_duration_seconds > prometheus_rule_group_interval_seconds\n for: 180s\n labels:\n severity: info\n annotations:\n summary: Prometheus rule evaluation slow (instance {{ $labels.instance }})\n description: \"Prometheus rule evaluation took more time than the scheduled interval. It indicates a slower storage backend access or too complex query.\\n VALUE = {{ $value }}\\n LABELS = {{ $labels }}\"\n`), &ruleEvaluationSlow)\n\tt.Logf(\"ruleEvaluationSlow: %+v\", ruleEvaluationSlow[0])\n\tconvRuleEvaluationSlow := models.ConvertAlert(ruleEvaluationSlow[0], \"1m\", []models.DatasourceQuery{}, 0)\n\tif convRuleEvaluationSlow.PromEvalInterval != 60 {\n\t\tt.Errorf(\"PromEvalInterval is expected to be 60, but got %d\",\n\t\t\tconvJobMissing.PromEvalInterval)\n\t}\n\tif convRuleEvaluationSlow.PromForDuration != 180 {\n\t\tt.Errorf(\"PromForDuration is expected to be 180, but got %d\",\n\t\t\tconvJobMissing.PromForDuration)\n\t}\n\tif convRuleEvaluationSlow.Severity != 3 {\n\t\tt.Errorf(\"Severity is expected to be 3, but got %d\", convJobMissing.Severity)\n\t}\n\n\ttargetMissing := []models.PromRule{}\n\tyaml.Unmarshal([]byte(` - alert: PrometheusTargetMissing\n expr: up == 0\n for: 1.5m\n labels:\n severity: critical\n annotations:\n summary: Prometheus target missing (instance {{ $labels.instance }})\n description: \"A Prometheus target has disappeared. An exporter might be crashed.\\n VALUE = {{ $value }}\\n LABELS = {{ $labels }}\"\n`), &targetMissing)\n\tt.Logf(\"targetMissing: %+v\", targetMissing[0])\n\tconvTargetMissing := models.ConvertAlert(targetMissing[0], \"1h\", []models.DatasourceQuery{}, 0)\n\tif convTargetMissing.PromEvalInterval != 3600 {\n\t\tt.Errorf(\"PromEvalInterval is expected to be 3600, but got %d\",\n\t\t\tconvTargetMissing.PromEvalInterval)\n\t}\n\tif convTargetMissing.PromForDuration != 90 {\n\t\tt.Errorf(\"PromForDuration is expected to be 90, but got %d\",\n\t\t\tconvTargetMissing.PromForDuration)\n\t}\n\tif convTargetMissing.Severity != 1 {\n\t\tt.Errorf(\"Severity is expected to be 1, but got %d\", convTargetMissing.Severity)\n\t}\n}\n"
},
{
"path": "models/recording_rule.go",
"content": "package models\n\nimport (\n\t\"encoding/json\"\n\t\"fmt\"\n\t\"strings\"\n\t\"time\"\n\n\t\"github.com/ccfos/nightingale/v6/pkg/ctx\"\n\t\"github.com/ccfos/nightingale/v6/pkg/poster\"\n\n\t\"github.com/pkg/errors\"\n\t\"github.com/prometheus/common/model\"\n\t\"github.com/toolkits/pkg/logger\"\n)\n\n// A RecordingRule records its vector expression into new timeseries.\ntype RecordingRule struct {\n\tId int64 `json:\"id\" gorm:\"primaryKey\"`\n\tGroupId int64 `json:\"group_id\"` // busi group id\n\tDatasourceIds string `json:\"-\" gorm:\"datasource_ids,omitempty\"`\n\tDatasourceIdsJson []int64 `json:\"datasource_ids\" gorm:\"-\"` // for open source fe\n\tDatasourceQueries []DatasourceQuery `json:\"datasource_queries,omitempty\" gorm:\"serializer:json\"` // datasource queries\n\tCluster string `json:\"cluster\"` // take effect by cluster, separated by space\n\tName string `json:\"name\"` // new metric name\n\tDisabled int `json:\"disabled\"` // 0: enabled, 1: disabled\n\tPromQl string `json:\"prom_ql\"` // just one ql for promql\n\tQueryConfigs string `json:\"-\" gorm:\"query_configs\"` // query_configs\n\tQueryConfigsJson []QueryConfig `json:\"query_configs\" gorm:\"-\"` // query_configs for fe\n\tPromEvalInterval int `json:\"prom_eval_interval\"` // unit:s\n\tCronPattern string `json:\"cron_pattern\"`\n\tAppendTags string `json:\"-\"` // split by space: service=n9e mod=api\n\tAppendTagsJSON []string `json:\"append_tags\" gorm:\"-\"` // for fe\n\tNote string `json:\"note\"` // note\n\tCreateAt int64 `json:\"create_at\"`\n\tCreateBy string `json:\"create_by\"`\n\tUpdateAt int64 `json:\"update_at\"`\n\tUpdateBy string `json:\"update_by\"`\n\tUpdateByNickname string `json:\"update_by_nickname\" gorm:\"-\"`\n}\n\ntype QueryConfig struct {\n\tQueries []Query `json:\"queries\"`\n\tNewMetric string `json:\"new_metric\"`\n\tExp string `json:\"exp\"`\n\tWriteDatasourceId int64 `json:\"write_datasource_id\"`\n\tDelay int `json:\"delay\"`\n\tWritebackEnabled bool `json:\"writeback_enabled\"` // 是否写入与查询数据源相同的数据源\n}\n\ntype Query struct {\n\tDatasourceIds []int64 `json:\"datasource_ids\"`\n\tDatasourceQueries []DatasourceQuery `json:\"datasource_queries\"`\n\tCate string `json:\"cate\"`\n\tConfig interface{} `json:\"config\"`\n}\n\nfunc (re *RecordingRule) TableName() string {\n\treturn \"recording_rule\"\n}\n\nfunc (re *RecordingRule) FE2DB() {\n\tre.AppendTags = strings.Join(re.AppendTagsJSON, \" \")\n\tidsByte, _ := json.Marshal(re.DatasourceIdsJson)\n\tre.DatasourceIds = string(idsByte)\n\n\tqueryConfigsByte, _ := json.Marshal(re.QueryConfigsJson)\n\tre.QueryConfigs = string(queryConfigsByte)\n}\n\nfunc (re *RecordingRule) DB2FE() error {\n\tre.AppendTagsJSON = strings.Fields(re.AppendTags)\n\tjson.Unmarshal([]byte(re.DatasourceIds), &re.DatasourceIdsJson)\n\n\tre.FillDatasourceQueries()\n\n\tjson.Unmarshal([]byte(re.QueryConfigs), &re.QueryConfigsJson)\n\t// 存量数据规则不包含 DatasourceQueries 字段,将 DatasourceIds 转换为 DatasourceQueries 字段\n\tfor i := range re.QueryConfigsJson {\n\t\tfor j := range re.QueryConfigsJson[i].Queries {\n\t\t\tif len(re.QueryConfigsJson[i].Queries[j].DatasourceQueries) == 0 {\n\t\t\t\tvalues := make([]interface{}, 0, len(re.QueryConfigsJson[i].Queries[j].DatasourceIds))\n\t\t\t\tfor _, dsID := range re.QueryConfigsJson[i].Queries[j].DatasourceIds {\n\t\t\t\t\tvalues = append(values, dsID)\n\t\t\t\t}\n\t\t\t\tre.QueryConfigsJson[i].Queries[j].DatasourceQueries = []DatasourceQuery{\n\t\t\t\t\t{\n\t\t\t\t\t\tMatchType: 0,\n\t\t\t\t\t\tOp: \"in\",\n\t\t\t\t\t\tValues: values,\n\t\t\t\t\t},\n\t\t\t\t}\n\t\t\t}\n\t\t}\n\t}\n\n\tif re.CronPattern == \"\" && re.PromEvalInterval != 0 {\n\t\tre.CronPattern = fmt.Sprintf(\"@every %ds\", re.PromEvalInterval)\n\t}\n\n\treturn nil\n}\n\nfunc (re *RecordingRule) FillDatasourceQueries() error {\n\t// 兼容旧逻辑,将 datasourceIds 转换为 datasourceQueries\n\tif len(re.DatasourceQueries) == 0 && len(re.DatasourceIds) != 0 {\n\t\tdatasourceQueries := DatasourceQuery{\n\t\t\tMatchType: 0,\n\t\t\tOp: \"in\",\n\t\t\tValues: make([]interface{}, 0),\n\t\t}\n\n\t\tvar values []int64\n\t\tif re.DatasourceIds != \"\" {\n\t\t\tjson.Unmarshal([]byte(re.DatasourceIds), &values)\n\t\t}\n\n\t\tfor i := range values {\n\t\t\tif values[i] == 0 {\n\t\t\t\t// 0 表示所有数据源\n\t\t\t\tdatasourceQueries.MatchType = 2\n\t\t\t\tbreak\n\t\t\t}\n\t\t\tdatasourceQueries.Values = append(datasourceQueries.Values, values[i])\n\t\t}\n\n\t\tre.DatasourceQueries = []DatasourceQuery{datasourceQueries}\n\t}\n\treturn nil\n}\n\nfunc (re *RecordingRule) Verify() error {\n\tif re.GroupId < 0 {\n\t\treturn fmt.Errorf(\"GroupId(%d) invalid\", re.GroupId)\n\t}\n\n\t//if IsAllDatasource(re.DatasourceIdsJson) {\n\t//\tre.DatasourceIdsJson = []int64{0}\n\t//}\n\n\tif re.PromQl != \"\" && !model.MetricNameRE.MatchString(re.Name) {\n\t\treturn errors.New(\"Name has invalid chreacters\")\n\t}\n\n\tfor _, queryConfig := range re.QueryConfigsJson {\n\t\tif !model.MetricNameRE.MatchString(queryConfig.NewMetric) {\n\t\t\treturn errors.New(\"Metric Name has invalid chreacters\")\n\t\t}\n\t}\n\n\tif re.Name == \"\" && re.PromQl != \"\" {\n\t\treturn errors.New(\"name is blank\")\n\t}\n\n\tif re.PromEvalInterval <= 0 {\n\t\tre.PromEvalInterval = 60\n\t}\n\n\tif re.CronPattern == \"\" {\n\t\tre.CronPattern = \"@every 60s\"\n\t}\n\n\tre.AppendTags = strings.TrimSpace(re.AppendTags)\n\trer := strings.Fields(re.AppendTags)\n\tfor i := 0; i < len(rer); i++ {\n\t\tpair := strings.Split(rer[i], \"=\")\n\t\tif len(pair) != 2 || !model.LabelNameRE.MatchString(pair[0]) {\n\t\t\treturn fmt.Errorf(\"AppendTags(%s) invalid\", rer[i])\n\t\t}\n\t}\n\n\t// Check if query_configs length exceeds TEXT type limit (65535 bytes)\n\tif len(re.QueryConfigs) > 65535 {\n\t\treturn fmt.Errorf(\"query_configs length (%d bytes) exceeds TEXT type limit (65535 bytes), please reduce the configuration size\", len(re.QueryConfigs))\n\t}\n\n\treturn nil\n}\n\nfunc (re *RecordingRule) Add(ctx *ctx.Context) error {\n\tif err := re.Verify(); err != nil {\n\t\treturn err\n\t}\n\n\t// 由于实际场景中会出现name重复的recording rule,所以不需要检查重复\n\t//exists, err := RecordingRuleExists(0, re.GroupId, re.Cluster, re.Name)\n\t//if err != nil {\n\t//\treturn err\n\t//}\n\t//\n\t//if exists {\n\t//\treturn errors.New(\"RecordingRule already exists\")\n\t//}\n\n\tnow := time.Now().Unix()\n\tre.CreateAt = now\n\tre.UpdateAt = now\n\n\treturn Insert(ctx, re)\n}\n\nfunc (re *RecordingRule) Update(ctx *ctx.Context, ref RecordingRule) error {\n\t// 由于实际场景中会出现name重复的recording rule,所以不需要检查重复\n\t//if re.Name != ref.Name {\n\t//\texists, err := RecordingRuleExists(re.Id, re.GroupId, re.Cluster, ref.Name)\n\t//\tif err != nil {\n\t//\t\treturn err\n\t//\t}\n\t//\tif exists {\n\t//\t\treturn errors.New(\"RecordingRule already exists\")\n\t//\t}\n\t//}\n\n\tref.FE2DB()\n\tref.Id = re.Id\n\tref.CreateAt = re.CreateAt\n\tref.CreateBy = re.CreateBy\n\tref.UpdateAt = time.Now().Unix()\n\terr := ref.Verify()\n\tif err != nil {\n\t\treturn err\n\t}\n\treturn DB(ctx).Model(re).Select(\"*\").Updates(ref).Error\n}\n\nfunc (re *RecordingRule) UpdateFieldsMap(ctx *ctx.Context, fields map[string]interface{}) error {\n\treturn DB(ctx).Model(re).Updates(fields).Error\n}\n\nfunc RecordingRuleDels(ctx *ctx.Context, ids []int64, groupId int64) error {\n\tfor i := 0; i < len(ids); i++ {\n\t\tret := DB(ctx).Where(\"id = ? and group_id=?\", ids[i], groupId).Delete(&RecordingRule{})\n\t\tif ret.Error != nil {\n\t\t\treturn ret.Error\n\t\t}\n\t}\n\n\treturn nil\n}\n\n// func RecordingRuleExists(ctx *ctx.Context, id, groupId int64, cluster, name string) (bool, error) {\n// \tsession := DB(ctx).Where(\"id <> ? and group_id = ? and name =? \", id, groupId, name)\n\n// \tvar lst []RecordingRule\n// \terr := session.Find(&lst).Error\n// \tif err != nil {\n// \t\treturn false, err\n// \t}\n// \tif len(lst) == 0 {\n// \t\treturn false, nil\n// \t}\n\n// \t// match cluster\n// \tfor _, r := range lst {\n// \t\tif MatchCluster(r.Cluster, cluster) {\n// \t\t\treturn true, nil\n// \t\t}\n// \t}\n// \treturn false, nil\n// }\n\nfunc RecordingRuleGets(ctx *ctx.Context, groupId int64) ([]RecordingRule, error) {\n\tsession := DB(ctx).Where(\"group_id=?\", groupId).Order(\"name\")\n\n\tvar lst []RecordingRule\n\terr := session.Find(&lst).Error\n\tif err == nil {\n\t\tfor i := 0; i < len(lst); i++ {\n\t\t\tlst[i].DB2FE()\n\t\t}\n\t}\n\n\treturn lst, err\n}\n\nfunc RecordingRuleGetsByBGIds(ctx *ctx.Context, bgids []int64) ([]RecordingRule, error) {\n\tsession := DB(ctx)\n\tif len(bgids) > 0 {\n\t\tsession = session.Where(\"group_id in (?)\", bgids).Order(\"name\")\n\t}\n\n\tvar lst []RecordingRule\n\terr := session.Find(&lst).Error\n\tif err == nil {\n\t\tfor i := 0; i < len(lst); i++ {\n\t\t\tlst[i].DB2FE()\n\t\t}\n\t}\n\n\treturn lst, err\n}\n\nfunc RecordingRuleGet(ctx *ctx.Context, where string, regs ...interface{}) (*RecordingRule, error) {\n\tvar lst []*RecordingRule\n\terr := DB(ctx).Where(where, regs...).Find(&lst).Error\n\tif err != nil {\n\t\treturn nil, err\n\t}\n\n\tif len(lst) == 0 {\n\t\treturn nil, nil\n\t}\n\n\tlst[0].DB2FE()\n\n\treturn lst[0], nil\n}\n\nfunc RecordingRuleGetById(ctx *ctx.Context, id int64) (*RecordingRule, error) {\n\treturn RecordingRuleGet(ctx, \"id=?\", id)\n}\n\nfunc RecordingRuleEnabledGets(ctx *ctx.Context) ([]*RecordingRule, error) {\n\tsession := DB(ctx)\n\n\tvar lst []*RecordingRule\n\terr := session.Where(\"disabled = ?\", 0).Find(&lst).Error\n\tif err != nil {\n\t\treturn lst, err\n\t}\n\n\tfor i := 0; i < len(lst); i++ {\n\t\tlst[i].DB2FE()\n\t}\n\treturn lst, nil\n}\n\nfunc RecordingRuleGetsByCluster(ctx *ctx.Context) ([]*RecordingRule, error) {\n\tif !ctx.IsCenter {\n\t\tlst, err := poster.GetByUrls[[]*RecordingRule](ctx, \"/v1/n9e/recording-rules\")\n\t\tif err != nil {\n\t\t\treturn nil, err\n\t\t}\n\t\tfor i := 0; i < len(lst); i++ {\n\t\t\tlst[i].FE2DB()\n\t\t}\n\t\treturn lst, err\n\t}\n\n\tsession := DB(ctx).Where(\"disabled = ?\", 0)\n\n\tvar lst []*RecordingRule\n\terr := session.Find(&lst).Error\n\tif err != nil {\n\t\treturn lst, err\n\t}\n\n\tif len(lst) == 0 {\n\t\treturn lst, nil\n\t}\n\n\tfor i := 0; i < len(lst); i++ {\n\t\tlst[i].DB2FE()\n\t}\n\treturn lst, nil\n}\n\nfunc RecordingRuleStatistics(ctx *ctx.Context) (*Statistics, error) {\n\tif !ctx.IsCenter {\n\t\ts, err := poster.GetByUrls[*Statistics](ctx, \"/v1/n9e/statistic?name=recording_rule\")\n\t\treturn s, err\n\t}\n\n\tsession := DB(ctx).Model(&RecordingRule{}).Select(\"count(*) as total\", \"max(update_at) as last_updated\")\n\n\tvar stats []*Statistics\n\terr := session.Find(&stats).Error\n\tif err != nil {\n\t\treturn nil, err\n\t}\n\n\treturn stats[0], nil\n}\n\nfunc RecordingRuleUpgradeToV6(ctx *ctx.Context, dsm map[string]Datasource) error {\n\tvar lst []*RecordingRule\n\terr := DB(ctx).Find(&lst).Error\n\tif err != nil {\n\t\treturn err\n\t}\n\n\tfor i := 0; i < len(lst); i++ {\n\t\tvar ids []int64\n\t\tif lst[i].Cluster == \"$all\" {\n\t\t\tids = append(ids, 0)\n\t\t} else {\n\t\t\tclusters := strings.Fields(lst[i].Cluster)\n\t\t\tfor j := 0; j < len(clusters); j++ {\n\t\t\t\tif ds, exists := dsm[clusters[j]]; exists {\n\t\t\t\t\tids = append(ids, ds.Id)\n\t\t\t\t}\n\t\t\t}\n\t\t}\n\n\t\tb, err := json.Marshal(ids)\n\t\tif err != nil {\n\t\t\tcontinue\n\t\t}\n\t\tlst[i].DatasourceIds = string(b)\n\n\t\terr = lst[i].UpdateFieldsMap(ctx, map[string]interface{}{\"datasource_ids\": lst[i].DatasourceIds})\n\t\tif err != nil {\n\t\t\tlogger.Errorf(\"update alert rule:%d datasource ids failed, %v\", lst[i].Id, err)\n\t\t}\n\t}\n\treturn nil\n}\n"
},
{
"path": "models/role.go",
"content": "package models\n\nimport (\n\t\"github.com/ccfos/nightingale/v6/pkg/ctx\"\n\t\"github.com/pkg/errors\"\n)\n\ntype Role struct {\n\tId int64 `json:\"id\" gorm:\"primaryKey\"`\n\tName string `json:\"name\"`\n\tNote string `json:\"note\"`\n}\n\nfunc (Role) TableName() string {\n\treturn \"role\"\n}\n\nfunc RoleGets(ctx *ctx.Context, where string, args ...interface{}) ([]Role, error) {\n\tvar objs []Role\n\terr := DB(ctx).Where(where, args...).Find(&objs).Error\n\tif err != nil {\n\t\treturn nil, errors.WithMessage(err, \"failed to query roles\")\n\t}\n\treturn objs, nil\n}\n\nfunc RoleGetsAll(ctx *ctx.Context) ([]Role, error) {\n\treturn RoleGets(ctx, \"\")\n}\n\n// 增加角色\nfunc (r *Role) Add(ctx *ctx.Context) error {\n\trole, err := RoleGet(ctx, \"name = ?\", r.Name)\n\tif err != nil {\n\t\treturn errors.WithMessage(err, \"failed to query user\")\n\t}\n\n\tif role != nil {\n\t\treturn errors.New(\"role name already exists\")\n\t}\n\n\treturn DB(ctx).Create(r).Error\n}\n\n// 删除角色\nfunc (r *Role) Del(ctx *ctx.Context) error {\n\treturn DB(ctx).Delete(r).Error\n}\n\n// 更新角色\nfunc (ug *Role) Update(ctx *ctx.Context, selectField interface{}, selectFields ...interface{}) error {\n\treturn DB(ctx).Model(ug).Select(selectField, selectFields...).Updates(ug).Error\n}\n\nfunc RoleGet(ctx *ctx.Context, where string, args ...interface{}) (*Role, error) {\n\tvar lst []*Role\n\terr := DB(ctx).Where(where, args...).Find(&lst).Error\n\tif err != nil {\n\t\treturn nil, err\n\t}\n\n\tif len(lst) == 0 {\n\t\treturn nil, nil\n\t}\n\n\treturn lst[0], nil\n}\n\nfunc RoleCount(ctx *ctx.Context, where string, args ...interface{}) (num int64, err error) {\n\treturn Count(DB(ctx).Model(&Role{}).Where(where, args...))\n}\n"
},
{
"path": "models/role_operation.go",
"content": "package models\n\nimport (\n\t\"github.com/ccfos/nightingale/v6/pkg/ctx\"\n\t\"github.com/toolkits/pkg/slice\"\n)\n\ntype RoleOperation struct {\n\tRoleName string\n\tOperation string\n}\n\nfunc (RoleOperation) TableName() string {\n\treturn \"role_operation\"\n}\n\nfunc RoleHasOperation(ctx *ctx.Context, roles []string, operation string) (bool, error) {\n\tif len(roles) == 0 {\n\t\treturn false, nil\n\t}\n\n\treturn Exists(DB(ctx).Model(&RoleOperation{}).Where(\"operation = ? and role_name in ?\", operation, roles))\n}\n\nfunc OperationsOfRole(ctx *ctx.Context, roles []string) ([]string, error) {\n\tsession := DB(ctx).Model(&RoleOperation{}).Select(\"distinct(operation) as operation\")\n\n\tif !slice.ContainsString(roles, AdminRole) {\n\t\tsession = session.Where(\"role_name in ?\", roles)\n\t}\n\n\tvar ret []string\n\terr := session.Pluck(\"operation\", &ret).Error\n\treturn ret, err\n}\n\nfunc RoleOperationBind(ctx *ctx.Context, roleName string, operation []string) error {\n\ttx := DB(ctx).Begin()\n\n\tif err := tx.Where(\"role_name = ?\", roleName).Delete(&RoleOperation{}).Error; err != nil {\n\t\ttx.Rollback()\n\t\treturn err\n\t}\n\n\tif len(operation) == 0 {\n\t\treturn tx.Commit().Error\n\t}\n\n\tvar ops []RoleOperation\n\tfor _, op := range operation {\n\t\tops = append(ops, RoleOperation{\n\t\t\tRoleName: roleName,\n\t\t\tOperation: op,\n\t\t})\n\t}\n\n\tif err := tx.Create(&ops).Error; err != nil {\n\t\ttx.Rollback()\n\t\treturn err\n\t}\n\n\treturn tx.Commit().Error\n}\n"
},
{
"path": "models/saved_view.go",
"content": "package models\n\nimport (\n\t\"errors\"\n\t\"strings\"\n\t\"time\"\n\n\t\"github.com/ccfos/nightingale/v6/pkg/ctx\"\n)\n\nvar (\n\tErrSavedViewNameEmpty = errors.New(\"saved view name is blank\")\n\tErrSavedViewPageEmpty = errors.New(\"saved view page is blank\")\n\tErrSavedViewNotFound = errors.New(\"saved view not found\")\n\tErrSavedViewNameDuplicate = errors.New(\"saved view name already exists in this page\")\n)\n\ntype SavedView struct {\n\tId int64 `json:\"id\" gorm:\"primaryKey;autoIncrement\"`\n\tName string `json:\"name\" gorm:\"type:varchar(255);not null\"`\n\tPage string `json:\"page\" gorm:\"type:varchar(64);not null;index\"`\n\tFilter string `json:\"filter\" gorm:\"type:text\"`\n\tPublicCate int `json:\"public_cate\" gorm:\"default:0\"` // 0: self, 1: team, 2: all\n\tGids []int64 `json:\"gids\" gorm:\"column:gids;type:text;serializer:json\"`\n\tCreateAt int64 `json:\"create_at\" gorm:\"type:bigint;not null;default:0\"`\n\tCreateBy string `json:\"create_by\" gorm:\"type:varchar(64);index\"`\n\tUpdateAt int64 `json:\"update_at\" gorm:\"type:bigint;not null;default:0\"`\n\tUpdateBy string `json:\"update_by\" gorm:\"type:varchar(64)\"`\n\tUpdateByNickname string `json:\"update_by_nickname\" gorm:\"-\"`\n\n\t// 查询时填充的字段\n\tIsFavorite bool `json:\"is_favorite\" gorm:\"-\"`\n}\n\nfunc (SavedView) TableName() string {\n\treturn \"saved_view\"\n}\n\nfunc (sv *SavedView) Verify() error {\n\tsv.Name = strings.TrimSpace(sv.Name)\n\tif sv.Name == \"\" {\n\t\treturn ErrSavedViewNameEmpty\n\t}\n\tif sv.Page == \"\" {\n\t\treturn ErrSavedViewPageEmpty\n\t}\n\treturn nil\n}\n\nfunc SavedViewCheckDuplicateName(c *ctx.Context, page, name string, excludeId int64) error {\n\tvar count int64\n\tsession := DB(c).Model(&SavedView{}).Where(\"page = ? AND name = ? AND public_cate = 2\", page, name)\n\tif excludeId > 0 {\n\t\tsession = session.Where(\"id != ?\", excludeId)\n\t}\n\tif err := session.Count(&count).Error; err != nil {\n\t\treturn err\n\t}\n\tif count > 0 {\n\t\treturn ErrSavedViewNameDuplicate\n\t}\n\treturn nil\n}\n\nfunc SavedViewAdd(c *ctx.Context, sv *SavedView) error {\n\tif err := sv.Verify(); err != nil {\n\t\treturn err\n\t}\n\t// 当 PublicCate 为 all(2) 时,检查同一个 page 下 name 是否重复\n\tif sv.PublicCate == 2 {\n\t\tif err := SavedViewCheckDuplicateName(c, sv.Page, sv.Name, 0); err != nil {\n\t\t\treturn err\n\t\t}\n\t}\n\tnow := time.Now().Unix()\n\tsv.CreateAt = now\n\tsv.UpdateAt = now\n\treturn Insert(c, sv)\n}\n\nfunc SavedViewUpdate(c *ctx.Context, sv *SavedView, username string) error {\n\tif err := sv.Verify(); err != nil {\n\t\treturn err\n\t}\n\t// 当 PublicCate 为 all(2) 时,检查同一个 page 下 name 是否重复(排除自身)\n\tif sv.PublicCate == 2 {\n\t\tif err := SavedViewCheckDuplicateName(c, sv.Page, sv.Name, sv.Id); err != nil {\n\t\t\treturn err\n\t\t}\n\t}\n\tsv.UpdateAt = time.Now().Unix()\n\tsv.UpdateBy = username\n\treturn DB(c).Model(sv).Select(\"name\", \"filter\", \"public_cate\", \"gids\", \"update_at\", \"update_by\").Updates(sv).Error\n}\n\nfunc SavedViewDel(c *ctx.Context, id int64) error {\n\t// 先删除收藏关联\n\tif err := DB(c).Where(\"view_id = ?\", id).Delete(&UserViewFavorite{}).Error; err != nil {\n\t\treturn err\n\t}\n\treturn DB(c).Where(\"id = ?\", id).Delete(&SavedView{}).Error\n}\n\nfunc SavedViewGetById(c *ctx.Context, id int64) (*SavedView, error) {\n\tvar sv SavedView\n\terr := DB(c).Where(\"id = ?\", id).First(&sv).Error\n\tif err != nil {\n\t\treturn nil, err\n\t}\n\treturn &sv, nil\n}\n\nfunc SavedViewGets(c *ctx.Context, page string) ([]SavedView, error) {\n\tvar views []SavedView\n\n\tsession := DB(c).Where(\"page = ?\", page)\n\n\tif err := session.Order(\"update_at DESC\").Find(&views).Error; err != nil {\n\t\treturn nil, err\n\t}\n\n\treturn views, nil\n}\n\nfunc SavedViewFavoriteGetByUserId(c *ctx.Context, userId int64) (map[int64]bool, error) {\n\tvar favorites []UserViewFavorite\n\tif err := DB(c).Where(\"user_id = ?\", userId).Find(&favorites).Error; err != nil {\n\t\treturn nil, err\n\t}\n\n\tresult := make(map[int64]bool)\n\tfor _, f := range favorites {\n\t\tresult[f.ViewId] = true\n\t}\n\treturn result, nil\n}\n\ntype UserViewFavorite struct {\n\tId int64 `json:\"id\" gorm:\"primaryKey;autoIncrement\"`\n\tViewId int64 `json:\"view_id\" gorm:\"index\"`\n\tUserId int64 `json:\"user_id\" gorm:\"index\"`\n\tCreateAt int64 `json:\"create_at\"`\n}\n\nfunc (UserViewFavorite) TableName() string {\n\treturn \"user_view_favorite\"\n}\n\nfunc UserViewFavoriteAdd(c *ctx.Context, viewId, userId int64) error {\n\tvar count int64\n\tif err := DB(c).Model(&SavedView{}).Where(\"id = ?\", viewId).Count(&count).Error; err != nil {\n\t\treturn err\n\t}\n\tif count == 0 {\n\t\treturn ErrSavedViewNotFound\n\t}\n\n\tif err := DB(c).Model(&UserViewFavorite{}).Where(\"view_id = ? AND user_id = ?\", viewId, userId).Count(&count).Error; err != nil {\n\t\treturn err\n\t}\n\tif count > 0 {\n\t\treturn nil // 已收藏,直接返回成功\n\t}\n\n\tfav := &UserViewFavorite{\n\t\tViewId: viewId,\n\t\tUserId: userId,\n\t\tCreateAt: time.Now().Unix(),\n\t}\n\treturn DB(c).Create(fav).Error\n}\n\nfunc UserViewFavoriteDel(c *ctx.Context, viewId, userId int64) error {\n\treturn DB(c).Where(\"view_id = ? AND user_id = ?\", viewId, userId).Delete(&UserViewFavorite{}).Error\n}\n"
},
{
"path": "models/source_token.go",
"content": "package models\n\nimport (\n\t\"time\"\n\n\t\"github.com/ccfos/nightingale/v6/pkg/ctx\"\n)\n\ntype SourceToken struct {\n\tId int64 `json:\"id\" gorm:\"primaryKey\"`\n\tSourceType string `json:\"source_type\" gorm:\"column:source_type;type:varchar(64);not null;default:''\"`\n\tSourceId string `json:\"source_id\" gorm:\"column:source_id;type:varchar(255);not null;default:''\"`\n\tToken string `json:\"token\" gorm:\"column:token;type:varchar(255);not null;default:''\"`\n\tExpireAt int64 `json:\"expire_at\" gorm:\"type:bigint;not null;default:0\"`\n\tCreateAt int64 `json:\"create_at\" gorm:\"type:bigint;not null;default:0\"`\n\tCreateBy string `json:\"create_by\" gorm:\"type:varchar(64);not null;default:''\"`\n}\n\nfunc (SourceToken) TableName() string {\n\treturn \"source_token\"\n}\n\nfunc (st *SourceToken) Add(ctx *ctx.Context) error {\n\treturn Insert(ctx, st)\n}\n\n// GetSourceTokenBySource 根据源类型和源ID获取源令牌\nfunc GetSourceTokenBySource(ctx *ctx.Context, sourceType, sourceId, token string) (*SourceToken, error) {\n\tvar st SourceToken\n\terr := DB(ctx).Where(\"source_type = ? AND source_id = ? AND token = ?\", sourceType, sourceId, token).First(&st).Error\n\tif err != nil {\n\t\treturn nil, err\n\t}\n\treturn &st, nil\n}\n\nfunc (st *SourceToken) IsExpired() bool {\n\tif st.ExpireAt == 0 {\n\t\treturn false // 0 表示永不过期\n\t}\n\treturn time.Now().Unix() > st.ExpireAt\n}\n\nfunc CleanupExpiredTokens(ctx *ctx.Context) (int64, error) {\n\tnow := time.Now().Unix()\n\tresult := DB(ctx).Where(\"expire_at > 0 AND expire_at < ?\", now).Delete(&SourceToken{})\n\treturn result.RowsAffected, result.Error\n}\n"
},
{
"path": "models/sso_config.go",
"content": "package models\n\nimport (\n\t\"time\"\n\n\t\"github.com/ccfos/nightingale/v6/pkg/ctx\"\n)\n\ntype SsoConfig struct {\n\tId int64 `json:\"id\"`\n\tName string `json:\"name\"`\n\tContent string `json:\"content\"`\n\tSettingJson interface{} `json:\"setting\" gorm:\"-\"`\n\tUpdateAt int64 `json:\"update_at\"`\n}\n\nfunc (b *SsoConfig) TableName() string {\n\treturn \"sso_config\"\n}\n\n// get all sso_config\nfunc SsoConfigGets(c *ctx.Context) ([]SsoConfig, error) {\n\tvar lst []SsoConfig\n\terr := DB(c).Find(&lst).Error\n\treturn lst, err\n}\n\n// Query query sso config\nfunc (b *SsoConfig) Query(c *ctx.Context) (SsoConfig, error) {\n\tvar sso SsoConfig\n\terr := DB(c).Model(b).Where(\"name = ?\", b.Name).First(&sso).Error\n\treturn sso, err\n}\n\n// 创建 builtin_cate\nfunc (b *SsoConfig) Create(c *ctx.Context) error {\n\treturn Insert(c, b)\n}\n\nfunc (b *SsoConfig) Update(c *ctx.Context) error {\n\tb.UpdateAt = time.Now().Unix()\n\treturn DB(c).Model(b).Select(\"content\", \"update_at\").Updates(b).Error\n}\n\n// get sso_config last update time\nfunc SsoConfigLastUpdateTime(c *ctx.Context) (int64, error) {\n\tvar lastUpdateTime int64\n\terr := DB(c).Model(&SsoConfig{}).Select(\"max(update_at)\").Row().Scan(&lastUpdateTime)\n\treturn lastUpdateTime, err\n}\n\n// get sso_config count by name\nfunc SsoConfigCountByName(c *ctx.Context, name string) (int64, error) {\n\tvar count int64\n\terr := DB(c).Model(&SsoConfig{}).Where(\"name = ?\", name).Count(&count).Error\n\treturn count, err\n}\n"
},
{
"path": "models/target.go",
"content": "package models\n\nimport (\n\t\"context\"\n\t\"encoding/json\"\n\t\"log\"\n\t\"sort\"\n\t\"strings\"\n\t\"time\"\n\n\t\"github.com/ccfos/nightingale/v6/pkg/ctx\"\n\t\"github.com/ccfos/nightingale/v6/pkg/poster\"\n\t\"github.com/ccfos/nightingale/v6/storage\"\n\t\"golang.org/x/exp/slices\"\n\n\t\"github.com/pkg/errors\"\n\t\"github.com/toolkits/pkg/container/set\"\n\t\"github.com/toolkits/pkg/logger\"\n\t\"github.com/toolkits/pkg/slice\"\n\n\t\"gorm.io/gorm\"\n)\n\ntype TargetDeleteHookFunc func(tx *gorm.DB, idents []string) error\n\ntype Target struct {\n\tId int64 `json:\"id\" gorm:\"primaryKey\"`\n\tGroupId int64 `json:\"group_id\"`\n\tGroupObjs []*BusiGroup `json:\"group_objs\" gorm:\"-\"`\n\tIdent string `json:\"ident\"`\n\tNote string `json:\"note\"`\n\tTags string `json:\"-\"` // user tags\n\tTagsJSON []string `json:\"tags\" gorm:\"-\"`\n\tTagsMap map[string]string `json:\"tags_maps\" gorm:\"-\"` // internal use, append tags to series\n\tUpdateAt int64 `json:\"update_at\"`\n\tHostIp string `json:\"host_ip\"` //ipv4,do not needs range select\n\tAgentVersion string `json:\"agent_version\"`\n\tEngineName string `json:\"engine_name\"`\n\tOS string `json:\"os\" gorm:\"column:os\"`\n\tHostTags []string `json:\"host_tags\" gorm:\"serializer:json\"`\n\n\tBeatTime int64 `json:\"beat_time\" gorm:\"-\"` // 实时心跳时间,从 Redis 获取\n\tUnixTime int64 `json:\"unixtime\" gorm:\"-\"`\n\tOffset int64 `json:\"offset\" gorm:\"-\"`\n\tTargetUp float64 `json:\"target_up\" gorm:\"-\"`\n\tMemUtil float64 `json:\"mem_util\" gorm:\"-\"`\n\tCpuNum int `json:\"cpu_num\" gorm:\"-\"`\n\tCpuUtil float64 `json:\"cpu_util\" gorm:\"-\"`\n\tArch string `json:\"arch\" gorm:\"-\"`\n\tRemoteAddr string `json:\"remote_addr\" gorm:\"-\"`\n\tGroupIds []int64 `json:\"group_ids\" gorm:\"-\"`\n\tGroupNames []string `json:\"group_names\" gorm:\"-\"`\n}\n\nfunc (t *Target) TableName() string {\n\treturn \"target\"\n}\n\nfunc (t *Target) FillGroup(ctx *ctx.Context, cache map[int64]*BusiGroup) error {\n\tvar err error\n\tif len(t.GroupIds) == 0 {\n\t\tt.GroupIds, err = TargetGroupIdsGetByIdent(ctx, t.Ident)\n\t\tif err != nil {\n\t\t\treturn errors.WithMessage(err, \"failed to get target gids\")\n\t\t}\n\t\tt.GroupObjs = make([]*BusiGroup, 0, len(t.GroupIds))\n\t}\n\n\tfor _, gid := range t.GroupIds {\n\t\tbg, has := cache[gid]\n\t\tif has && bg != nil {\n\t\t\tt.GroupObjs = append(t.GroupObjs, bg)\n\t\t\tcontinue\n\t\t}\n\n\t\tbg, err := BusiGroupGetById(ctx, gid)\n\t\tif err != nil {\n\t\t\treturn errors.WithMessage(err, \"failed to get busi group\")\n\t\t}\n\n\t\tif bg == nil {\n\t\t\tcontinue\n\t\t}\n\n\t\tt.GroupObjs = append(t.GroupObjs, bg)\n\t\tcache[gid] = bg\n\t}\n\n\treturn nil\n}\n\nfunc (t *Target) MatchGroupId(gid ...int64) bool {\n\tfor _, tgId := range t.GroupIds {\n\t\tfor _, id := range gid {\n\t\t\tif tgId == id {\n\t\t\t\treturn true\n\t\t\t}\n\t\t}\n\t}\n\treturn false\n}\n\nfunc (t *Target) AfterFind(tx *gorm.DB) (err error) {\n\tt.FillTagsMap()\n\treturn\n}\n\nfunc TargetStatistics(ctx *ctx.Context) (*Statistics, error) {\n\tif !ctx.IsCenter {\n\t\ts, err := poster.GetByUrls[*Statistics](ctx, \"/v1/n9e/statistic?name=target\")\n\t\treturn s, err\n\t}\n\n\tvar stats []*Statistics\n\terr := DB(ctx).Model(&Target{}).Select(\"count(*) as total\", \"max(update_at) as last_updated\").Find(&stats).Error\n\tif err != nil {\n\t\treturn nil, err\n\t}\n\n\treturn stats[0], nil\n}\n\nfunc TargetDel(ctx *ctx.Context, idents []string, deleteHook TargetDeleteHookFunc) error {\n\tif len(idents) == 0 {\n\t\treturn errors.New(\"idents cannot be empty\")\n\t}\n\n\treturn DB(ctx).Transaction(func(tx *gorm.DB) error {\n\t\ttxErr := tx.Where(\"ident in ?\", idents).Delete(new(Target)).Error\n\t\tif txErr != nil {\n\t\t\treturn txErr\n\t\t}\n\t\ttxErr = deleteHook(tx, idents)\n\t\tif txErr != nil {\n\t\t\treturn txErr\n\t\t}\n\t\ttxErr = TargetDeleteBgids(tx, idents)\n\t\tif txErr != nil {\n\t\t\treturn txErr\n\t\t}\n\t\treturn nil\n\t})\n}\n\ntype BuildTargetWhereOption func(session *gorm.DB) *gorm.DB\n\nfunc BuildTargetWhereWithBgids(bgids []int64) BuildTargetWhereOption {\n\treturn func(session *gorm.DB) *gorm.DB {\n\t\tif len(bgids) == 1 && bgids[0] == 0 {\n\t\t\tsession = session.Joins(\"left join target_busi_group on target.ident = \" +\n\t\t\t\t\"target_busi_group.target_ident\").Where(\"target_busi_group.target_ident is null\")\n\t\t} else if len(bgids) > 0 {\n\t\t\tif slices.Contains(bgids, 0) {\n\t\t\t\tsession = session.Joins(\"left join target_busi_group on target.ident = target_busi_group.target_ident\").\n\t\t\t\t\tWhere(\"target_busi_group.target_ident is null OR target_busi_group.group_id in (?)\", bgids)\n\t\t\t} else {\n\t\t\t\tsession = session.Joins(\"join target_busi_group on target.ident = \"+\n\t\t\t\t\t\"target_busi_group.target_ident\").Where(\"target_busi_group.group_id in (?)\", bgids)\n\t\t\t}\n\t\t}\n\t\treturn session\n\t}\n}\n\nfunc BuildTargetWhereWithDsIds(dsIds []int64) BuildTargetWhereOption {\n\treturn func(session *gorm.DB) *gorm.DB {\n\t\tif len(dsIds) > 0 {\n\t\t\tsession = session.Where(\"datasource_id in (?)\", dsIds)\n\t\t}\n\t\treturn session\n\t}\n}\n\nfunc BuildTargetWhereWithHosts(hosts []string) BuildTargetWhereOption {\n\treturn func(session *gorm.DB) *gorm.DB {\n\t\tif len(hosts) > 0 {\n\t\t\tsession = session.Where(\"ident in (?) or host_ip in (?)\", hosts, hosts)\n\t\t}\n\t\treturn session\n\t}\n}\n\nfunc BuildTargetWhereWithIdents(idents []string) BuildTargetWhereOption {\n\treturn func(session *gorm.DB) *gorm.DB {\n\t\tif len(idents) > 0 {\n\t\t\tsession = session.Where(\"ident in (?)\", idents)\n\t\t}\n\t\treturn session\n\t}\n}\n\nfunc BuildTargetWhereExcludeIdents(idents []string) BuildTargetWhereOption {\n\treturn func(session *gorm.DB) *gorm.DB {\n\t\tif len(idents) > 0 {\n\t\t\tsession = session.Where(\"ident not in (?)\", idents)\n\t\t}\n\t\treturn session\n\t}\n}\n\nfunc BuildTargetWhereWithQuery(query string) BuildTargetWhereOption {\n\treturn func(session *gorm.DB) *gorm.DB {\n\t\tif query != \"\" {\n\t\t\tarr := strings.Fields(query)\n\t\t\tfor i := 0; i < len(arr); i++ {\n\t\t\t\tif strings.HasPrefix(arr[i], \"-\") {\n\t\t\t\t\tq := \"%\" + arr[i][1:] + \"%\"\n\t\t\t\t\tsession = session.Where(\"ident not like ? and host_ip not like ? and \"+\n\t\t\t\t\t\t\"note not like ? and tags not like ? and (host_tags not like ? or \"+\n\t\t\t\t\t\t\"host_tags is null) and os not like ?\", q, q, q, q, q, q)\n\t\t\t\t} else {\n\t\t\t\t\tq := \"%\" + arr[i] + \"%\"\n\t\t\t\t\tsession = session.Where(\"ident like ? or host_ip like ? or note like ? or \"+\n\t\t\t\t\t\t\"tags like ? or host_tags like ? or os like ?\", q, q, q, q, q, q)\n\t\t\t\t}\n\t\t\t}\n\t\t}\n\t\treturn session\n\t}\n}\n\nfunc buildTargetWhere(ctx *ctx.Context, options ...BuildTargetWhereOption) *gorm.DB {\n\tsub := DB(ctx).Model(&Target{}).Distinct(\"target.ident\")\n\tfor _, opt := range options {\n\t\tsub = opt(sub)\n\t}\n\treturn DB(ctx).Model(&Target{}).Where(\"ident in (?)\", sub)\n}\n\nfunc TargetTotal(ctx *ctx.Context, options ...BuildTargetWhereOption) (int64, error) {\n\treturn Count(buildTargetWhere(ctx, options...))\n}\n\nfunc TargetGets(ctx *ctx.Context, limit, offset int, order string, desc bool, options ...BuildTargetWhereOption) ([]*Target, error) {\n\tvar lst []*Target\n\n\torder = validateOrderField(order, \"ident\")\n\n\tif desc {\n\t\torder += \" desc\"\n\t} else {\n\t\torder += \" asc\"\n\t}\n\terr := buildTargetWhere(ctx, options...).Order(order).Limit(limit).Offset(offset).Find(&lst).Error\n\tif err == nil {\n\t\tfor i := 0; i < len(lst); i++ {\n\t\t\tlst[i].TagsJSON = strings.Fields(lst[i].Tags)\n\t\t}\n\t}\n\treturn lst, err\n}\n\n// 根据 groupids, tags, hosts 查询 targets\nfunc TargetGetsByFilter(ctx *ctx.Context, query []map[string]interface{}, limit, offset int) ([]*Target, error) {\n\tvar lst []*Target\n\tsession := TargetFilterQueryBuild(ctx, query, limit, offset)\n\terr := session.Order(\"ident\").Find(&lst).Error\n\tcache := make(map[int64]*BusiGroup)\n\tfor i := 0; i < len(lst); i++ {\n\t\tlst[i].TagsJSON = strings.Fields(lst[i].Tags)\n\t\tlst[i].FillGroup(ctx, cache)\n\t}\n\n\treturn lst, err\n}\n\nfunc TargetCountByFilter(ctx *ctx.Context, query []map[string]interface{}) (int64, error) {\n\tsession := TargetFilterQueryBuild(ctx, query, 0, 0)\n\treturn Count(session)\n}\n\nfunc TargetFilterQueryBuild(ctx *ctx.Context, query []map[string]interface{}, limit, offset int) *gorm.DB {\n\tsub := DB(ctx).Model(&Target{}).Distinct(\"target.ident\").Joins(\"left join \" +\n\t\t\"target_busi_group on target.ident = target_busi_group.target_ident\")\n\tfor _, q := range query {\n\t\ttx := DB(ctx).Model(&Target{})\n\t\tfor k, v := range q {\n\t\t\tif strings.Count(k, \"?\") > 1 {\n\t\t\t\ttx = tx.Or(k, v.([]interface{})...)\n\t\t\t} else {\n\t\t\t\ttx = tx.Or(k, v)\n\t\t\t}\n\t\t}\n\t\tsub = sub.Where(tx)\n\t}\n\n\tsession := DB(ctx).Model(&Target{}).Where(\"ident in (?)\", sub)\n\n\tif limit > 0 {\n\t\tsession = session.Limit(limit).Offset(offset)\n\t}\n\n\treturn session\n}\n\nfunc TargetGetsAll(ctx *ctx.Context) ([]*Target, error) {\n\tif !ctx.IsCenter {\n\t\tlst, err := poster.GetByUrls[[]*Target](ctx, \"/v1/n9e/targets\")\n\t\treturn lst, err\n\t}\n\n\tvar lst []*Target\n\terr := DB(ctx).Model(&Target{}).Find(&lst).Error\n\tif err != nil {\n\t\treturn lst, err\n\t}\n\n\ttgs, err := TargetBusiGroupsGetAll(ctx)\n\tif err != nil {\n\t\treturn lst, err\n\t}\n\n\tfor i := 0; i < len(lst); i++ {\n\t\tlst[i].FillTagsMap()\n\t\tlst[i].GroupIds = tgs[lst[i].Ident]\n\t}\n\n\treturn lst, err\n}\n\nfunc TargetUpdateNote(ctx *ctx.Context, idents []string, note string) error {\n\treturn DB(ctx).Model(&Target{}).Where(\"ident in ?\", idents).Updates(map[string]interface{}{\n\t\t\"note\": note,\n\t\t\"update_at\": time.Now().Unix(),\n\t}).Error\n}\n\nfunc TargetUpdateBgid(ctx *ctx.Context, idents []string, bgid int64, clearTags bool) error {\n\tfields := map[string]interface{}{\n\t\t\"group_id\": bgid,\n\t\t\"update_at\": time.Now().Unix(),\n\t}\n\n\tif clearTags {\n\t\tfields[\"tags\"] = \"\"\n\t}\n\n\treturn DB(ctx).Model(&Target{}).Where(\"ident in ?\", idents).Updates(fields).Error\n}\n\nfunc TargetGet(ctx *ctx.Context, where string, args ...interface{}) (*Target, error) {\n\tvar lst []*Target\n\terr := DB(ctx).Where(where, args...).Find(&lst).Error\n\tif err != nil {\n\t\treturn nil, err\n\t}\n\n\tif len(lst) == 0 {\n\t\treturn nil, nil\n\t}\n\n\tlst[0].TagsJSON = strings.Fields(lst[0].Tags)\n\n\treturn lst[0], nil\n}\n\nfunc TargetGetById(ctx *ctx.Context, id int64) (*Target, error) {\n\treturn TargetGet(ctx, \"id = ?\", id)\n}\n\nfunc TargetGetByIdent(ctx *ctx.Context, ident string) (*Target, error) {\n\treturn TargetGet(ctx, \"ident = ?\", ident)\n}\n\nfunc TargetsGetByIdents(ctx *ctx.Context, idents []string) ([]*Target, error) {\n\tvar targets []*Target\n\terr := DB(ctx).Where(\"ident IN ?\", idents).Find(&targets).Error\n\treturn targets, err\n}\n\nfunc TargetsGetIdentsByIdentsAndHostIps(ctx *ctx.Context, idents, hostIps []string) (map[string]string, []string, error) {\n\tinexistence := make(map[string]string)\n\tidentSet := set.NewStringSet()\n\n\t// Query the ident corresponding to idents\n\tif len(idents) > 0 {\n\t\tvar identsFromIdents []string\n\t\terr := DB(ctx).Model(&Target{}).Where(\"ident IN ?\", idents).Pluck(\"ident\", &identsFromIdents).Error\n\t\tif err != nil {\n\t\t\treturn nil, nil, err\n\t\t}\n\n\t\tfor _, ident := range identsFromIdents {\n\t\t\tidentSet.Add(ident)\n\t\t}\n\n\t\tfor _, ident := range idents {\n\t\t\tif !identSet.Exists(ident) {\n\t\t\t\tinexistence[ident] = \"Ident not found\"\n\t\t\t}\n\t\t}\n\t}\n\n\t// Query the hostIp corresponding to idents\n\tif len(hostIps) > 0 {\n\t\tvar hostIpToIdentMap []struct {\n\t\t\tHostIp string\n\t\t\tIdent string\n\t\t}\n\t\terr := DB(ctx).Model(&Target{}).Select(\"host_ip, ident\").Where(\"host_ip IN ?\", hostIps).Scan(&hostIpToIdentMap).Error\n\t\tif err != nil {\n\t\t\treturn nil, nil, err\n\t\t}\n\n\t\thostIpToIdent := set.NewStringSet()\n\t\tfor _, entry := range hostIpToIdentMap {\n\t\t\thostIpToIdent.Add(entry.HostIp)\n\t\t\tidentSet.Add(entry.Ident)\n\t\t}\n\n\t\tfor _, hostIp := range hostIps {\n\t\t\tif !hostIpToIdent.Exists(hostIp) {\n\t\t\t\tinexistence[hostIp] = \"HostIp not found\"\n\t\t\t}\n\t\t}\n\t}\n\n\treturn inexistence, identSet.ToSlice(), nil\n}\n\nfunc TargetsGetIdsByIdentsAndHostIps(ctx *ctx.Context, idents, hostIps []string) (\n\tmap[string]string, []int64, error) {\n\tinexistence := make(map[string]string)\n\tidSet := set.NewInt64Set()\n\n\tif len(idents) > 0 {\n\t\tvar identToIdMap []struct {\n\t\t\tIdent string\n\t\t\tId int64\n\t\t}\n\t\terr := DB(ctx).Model(&Target{}).Select(\"id, ident\").Where(\"ident IN ?\", idents).Scan(&identToIdMap).Error\n\t\tif err != nil {\n\t\t\treturn nil, nil, err\n\t\t}\n\n\t\tidentSet := set.NewStringSet()\n\t\tfor _, entry := range identToIdMap {\n\t\t\tidSet.Add(entry.Id)\n\t\t\tidentSet.Add(entry.Ident)\n\t\t}\n\n\t\tfor _, ident := range idents {\n\t\t\tif !identSet.Exists(ident) {\n\t\t\t\tinexistence[ident] = \"Ident not found\"\n\t\t\t}\n\t\t}\n\t}\n\n\t// Query the hostIp corresponding to idents\n\tif len(hostIps) > 0 {\n\t\tvar hostIpMap []struct {\n\t\t\tHostIp string\n\t\t\tIdent string\n\t\t\tId int64\n\t\t}\n\t\terr := DB(ctx).Model(&Target{}).Select(\"id, host_ip\").Where(\"host_ip IN ?\", hostIps).Scan(&hostIpMap).Error\n\t\tif err != nil {\n\t\t\treturn nil, nil, err\n\t\t}\n\n\t\thostIpSet := set.NewStringSet()\n\t\tfor _, entry := range hostIpMap {\n\t\t\thostIpSet.Add(entry.HostIp)\n\t\t\tidSet.Add(entry.Id)\n\t\t}\n\n\t\tfor _, hostIp := range hostIps {\n\t\t\tif !hostIpSet.Exists(hostIp) {\n\t\t\t\tinexistence[hostIp] = \"HostIp not found\"\n\t\t\t}\n\t\t}\n\t}\n\n\treturn inexistence, idSet.ToSlice(), nil\n}\n\nfunc TargetGetTags(ctx *ctx.Context, idents []string, ignoreHostTag bool, bgLabelKey string) (\n\t[]string, error) {\n\tsession := DB(ctx).Model(new(Target))\n\n\tvar arr []*Target\n\tif len(idents) > 0 {\n\t\tsession = session.Where(\"ident in ?\", idents)\n\t}\n\n\terr := session.Select(\"tags\", \"host_tags\").Find(&arr).Error\n\tif err != nil {\n\t\treturn nil, err\n\t}\n\n\tcnt := len(arr)\n\tif cnt == 0 {\n\t\treturn []string{}, nil\n\t}\n\n\tset := make(map[string]struct{})\n\tfor i := 0; i < cnt; i++ {\n\t\ttags := strings.Fields(arr[i].Tags)\n\t\tfor j := 0; j < len(tags); j++ {\n\t\t\tset[tags[j]] = struct{}{}\n\t\t}\n\n\t\tif !ignoreHostTag {\n\t\t\tfor _, ht := range arr[i].HostTags {\n\t\t\t\tset[ht] = struct{}{}\n\t\t\t}\n\t\t}\n\t}\n\n\tcnt = len(set)\n\tret := make([]string, 0, cnt)\n\tfor key := range set {\n\t\tret = append(ret, key)\n\t}\n\n\tif bgLabelKey != \"\" {\n\t\tsort.Slice(ret, func(i, j int) bool {\n\t\t\tif strings.HasPrefix(ret[i], bgLabelKey) && strings.HasPrefix(ret[j], bgLabelKey) {\n\t\t\t\treturn ret[i] < ret[j]\n\t\t\t}\n\t\t\tif strings.HasPrefix(ret[i], bgLabelKey) {\n\t\t\t\treturn true\n\t\t\t}\n\t\t\tif strings.HasPrefix(ret[j], bgLabelKey) {\n\t\t\t\treturn false\n\t\t\t}\n\t\t\treturn ret[i] < ret[j]\n\t\t})\n\t} else {\n\t\tsort.Strings(ret)\n\t}\n\n\treturn ret, err\n}\n\nfunc (t *Target) AddTags(ctx *ctx.Context, tags []string) error {\n\tfor i := 0; i < len(tags); i++ {\n\t\tif !strings.Contains(t.Tags, tags[i]+\" \") {\n\t\t\tt.Tags += tags[i] + \" \"\n\t\t}\n\t}\n\n\tarr := strings.Fields(t.Tags)\n\tsort.Strings(arr)\n\n\treturn DB(ctx).Model(t).Updates(map[string]interface{}{\n\t\t\"tags\": strings.Join(arr, \" \") + \" \",\n\t\t\"update_at\": time.Now().Unix(),\n\t}).Error\n}\n\nfunc (t *Target) DelTags(ctx *ctx.Context, tags []string) error {\n\tfor _, tag := range tags {\n\t\tt.Tags = strings.ReplaceAll(t.Tags, tag+\" \", \"\")\n\t}\n\n\treturn DB(ctx).Model(t).Updates(map[string]interface{}{\n\t\t\"tags\": t.Tags,\n\t\t\"update_at\": time.Now().Unix(),\n\t}).Error\n}\n\nfunc (t *Target) FillTagsMap() {\n\tt.TagsJSON = strings.Fields(t.Tags)\n\tt.TagsMap = make(map[string]string)\n\tm := make(map[string]string)\n\tallTags := append(t.TagsJSON, t.HostTags...)\n\tfor _, item := range allTags {\n\t\tarr := strings.Split(item, \"=\")\n\t\tif len(arr) != 2 {\n\t\t\tcontinue\n\t\t}\n\t\tm[arr[0]] = arr[1]\n\t}\n\n\tt.TagsMap = m\n}\n\nfunc (t *Target) GetTagsMap() map[string]string {\n\ttagsJSON := strings.Fields(t.Tags)\n\tm := make(map[string]string)\n\tfor _, item := range tagsJSON {\n\t\tif arr := strings.Split(item, \"=\"); len(arr) == 2 {\n\t\t\tm[arr[0]] = arr[1]\n\t\t}\n\t}\n\treturn m\n}\n\nfunc (t *Target) GetHostTagsMap() map[string]string {\n\tm := make(map[string]string)\n\tfor _, item := range t.HostTags {\n\t\tarr := strings.Split(item, \"=\")\n\t\tif len(arr) != 2 {\n\t\t\tcontinue\n\t\t}\n\t\tm[arr[0]] = arr[1]\n\t}\n\treturn m\n}\n\nfunc (t *Target) FillMeta(meta *HostMeta) {\n\tt.MemUtil = meta.MemUtil\n\tt.CpuUtil = meta.CpuUtil\n\tt.CpuNum = meta.CpuNum\n\tt.UnixTime = meta.UnixTime\n\tt.Offset = meta.Offset\n\tt.Arch = meta.Arch\n\tt.RemoteAddr = meta.RemoteAddr\n}\n\n// FetchBeatTimesFromRedis 从 Redis 批量获取心跳时间,返回 ident -> updateTime 的映射\nfunc FetchBeatTimesFromRedis(redis storage.Redis, idents []string) map[string]int64 {\n\tresult := make(map[string]int64, len(idents))\n\tif redis == nil || len(idents) == 0 {\n\t\treturn result\n\t}\n\n\tnum := 0\n\tvar keys []string\n\tfor i := 0; i < len(idents); i++ {\n\t\tkeys = append(keys, WrapIdentUpdateTime(idents[i]))\n\t\tnum++\n\t\tif num == 100 {\n\t\t\tfetchBeatTimeBatch(redis, keys, result)\n\t\t\tkeys = keys[:0]\n\t\t\tnum = 0\n\t\t}\n\t}\n\n\tif len(keys) > 0 {\n\t\tfetchBeatTimeBatch(redis, keys, result)\n\t}\n\n\treturn result\n}\n\nfunc fetchBeatTimeBatch(redis storage.Redis, keys []string, result map[string]int64) {\n\tvals := storage.MGet(context.Background(), redis, keys)\n\tfor _, value := range vals {\n\t\tif value == nil {\n\t\t\tcontinue\n\t\t}\n\t\tvar hut HostUpdateTime\n\t\tif err := json.Unmarshal(value, &hut); err != nil {\n\t\t\tlogger.Warningf(\"failed to unmarshal host update time: %v\", err)\n\t\t\tcontinue\n\t\t}\n\t\tresult[hut.Ident] = hut.UpdateTime\n\t}\n}\n\n// FillTargetsBeatTime 从 Redis 批量获取心跳时间填充 target.BeatTime\nfunc FillTargetsBeatTime(redis storage.Redis, targets []*Target) {\n\tif len(targets) == 0 {\n\t\treturn\n\t}\n\n\tidents := make([]string, len(targets))\n\tfor i, t := range targets {\n\t\tidents[i] = t.Ident\n\t}\n\n\tbeatTimes := FetchBeatTimesFromRedis(redis, idents)\n\tfor _, t := range targets {\n\t\tif ts, ok := beatTimes[t.Ident]; ok {\n\t\t\tt.BeatTime = ts\n\t\t}\n\t}\n}\n\nfunc TargetIdents(ctx *ctx.Context, ids []int64) ([]string, error) {\n\tvar ret []string\n\n\tif len(ids) == 0 {\n\t\treturn ret, nil\n\t}\n\n\terr := DB(ctx).Model(&Target{}).Where(\"id in ?\", ids).Pluck(\"ident\", &ret).Error\n\treturn ret, err\n}\n\nfunc TargetIds(ctx *ctx.Context, idents []string) ([]int64, error) {\n\tvar ret []int64\n\n\tif len(idents) == 0 {\n\t\treturn ret, nil\n\t}\n\n\terr := DB(ctx).Model(&Target{}).Where(\"ident in ?\", idents).Pluck(\"id\", &ret).Error\n\treturn ret, err\n}\n\nfunc IdentsFilter(ctx *ctx.Context, idents []string, where string, args ...interface{}) ([]string, error) {\n\tvar arr []string\n\tif len(idents) == 0 {\n\t\treturn arr, nil\n\t}\n\n\terr := DB(ctx).Model(&Target{}).Where(\"ident in ?\", idents).Where(where, args...).Pluck(\"ident\", &arr).Error\n\treturn arr, err\n}\n\nfunc (m *Target) UpdateFieldsMap(ctx *ctx.Context, fields map[string]interface{}) error {\n\treturn DB(ctx).Model(m).Updates(fields).Error\n}\n\n// 1. 是否可以进行 busi_group 迁移\nfunc CanMigrateBg(ctx *ctx.Context) bool {\n\t// 1.1 检查 target 表是否为空\n\tvar cnt int64\n\tif err := DB(ctx).Model(&Target{}).Count(&cnt).Error; err != nil {\n\t\tlog.Println(\"failed to get target table count, err:\", err)\n\t\treturn false\n\t}\n\tif cnt == 0 {\n\t\tlogger.Debug(\"target table is empty, skip migration.\")\n\t\treturn false\n\t}\n\n\t// 1.2 判断是否已经完成迁移\n\tvar maxGroupId int64\n\tif err := DB(ctx).Model(&Target{}).Select(\"MAX(group_id)\").Scan(&maxGroupId).Error; err != nil {\n\t\tlog.Println(\"failed to get max group_id from target table, err:\", err)\n\t\treturn false\n\t}\n\n\tif maxGroupId == 0 {\n\t\treturn false\n\t}\n\n\treturn true\n}\n\nfunc MigrateBg(ctx *ctx.Context, bgLabelKey string) {\n\terr := DoMigrateBg(ctx, bgLabelKey)\n\tif err != nil {\n\t\tlog.Println(\"failed to migrate bgid, err:\", err)\n\t\treturn\n\t}\n\n\tlog.Println(\"migration bgid has been completed\")\n}\n\nfunc DoMigrateBg(ctx *ctx.Context, bgLabelKey string) error {\n\t// 2. 获取全量 target\n\ttargets, err := TargetGetsAll(ctx)\n\tif err != nil {\n\t\treturn err\n\t}\n\n\t// 3. 获取全量 busi_group\n\tbgs, err := BusiGroupGetAll(ctx)\n\tif err != nil {\n\t\treturn err\n\t}\n\n\tbgById := make(map[int64]*BusiGroup, len(bgs))\n\tfor _, bg := range bgs {\n\t\tbgById[bg.Id] = bg\n\t}\n\n\t// 4. 如果某 busi_group 有 label,将其存至对应的 target tags 中\n\tfor _, t := range targets {\n\t\tif t.GroupId == 0 {\n\t\t\tcontinue\n\t\t}\n\t\t// 4.1 将 group_id 迁移至关联表\n\t\tif err := TargetBindBgids(ctx, []string{t.Ident}, []int64{t.GroupId}, nil); err != nil {\n\t\t\tlogger.Errorf(\"migrate failed to migrate bgid %v to %v, err: %v\", t.GroupId, t.Ident, err)\n\t\t\tcontinue\n\t\t}\n\n\t\t// 4.1.1 将 group_id 迁移至关联表\n\t\tif err := TargetUpdateBgid(ctx, []string{t.Ident}, 0, false); err != nil {\n\t\t\tlogger.Errorf(\"migrate failed to migrate ident group id to 0, ident: %v, err: %v\", t.Ident, err)\n\t\t\tcontinue\n\t\t}\n\n\t\t// 4.2 判断该机器是否需要新增 tag\n\t\tif bg, ok := bgById[t.GroupId]; !ok || bg.LabelEnable == 0 ||\n\t\t\tstrings.Contains(t.Tags, bgLabelKey+\"=\") {\n\t\t\tlogger.Infof(\"migrate ident %v has no bg label tag, skip\", t.Ident)\n\t\t\tcontinue\n\t\t} else {\n\t\t\terr := t.AddTags(ctx, []string{\" \" + bgLabelKey + \"=\" + bg.LabelValue})\n\t\t\tif err != nil {\n\t\t\t\tlogger.Errorf(\"migrate failed to add bg label tag %v to %v, err: %v\", bgLabelKey+\"=\"+bg.LabelValue, t.Ident, err)\n\t\t\t\tcontinue\n\t\t\t}\n\t\t\tlogger.Infof(\"migrate add bg label tag %v to %v\", bgLabelKey+\"=\"+bg.LabelValue, t.Ident)\n\t\t}\n\t}\n\treturn nil\n}\n\n// 返回不存在的 idents\nfunc TargetNoExistIdents(ctx *ctx.Context, idents []string) ([]string, error) {\n\tvar existingIdents []string\n\terr := ctx.DB.Table(\"target\").Where(\"ident in ?\", idents).Pluck(\"ident\", &existingIdents).Error\n\tif err != nil {\n\t\treturn nil, err\n\t}\n\n\tnotExistIdents := slice.SubString(idents, existingIdents)\n\treturn notExistIdents, nil\n}\n"
},
{
"path": "models/target_busi_group.go",
"content": "package models\n\nimport (\n\t\"strings\"\n\t\"time\"\n\n\t\"github.com/ccfos/nightingale/v6/pkg/ctx\"\n\n\t\"gorm.io/gorm\"\n\t\"gorm.io/gorm/clause\"\n)\n\ntype TargetBusiGroup struct {\n\tId int64 `json:\"id\" gorm:\"primaryKey;type:bigint;autoIncrement\"`\n\tTargetIdent string `json:\"target_ident\" gorm:\"type:varchar(191);not null;index:idx_target_group,unique,priority:1\"`\n\tGroupId int64 `json:\"group_id\" gorm:\"type:bigint;not null;index:idx_target_group,unique,priority:2\"`\n\tUpdateAt int64 `json:\"update_at\" gorm:\"type:bigint;not null\"`\n}\n\nfunc (t *TargetBusiGroup) TableName() string {\n\treturn \"target_busi_group\"\n}\n\nfunc (t *TargetBusiGroup) TableOptions() string {\n\treturn \"ENGINE=InnoDB DEFAULT CHARSET=utf8mb4 COLLATE=utf8mb4_general_ci\"\n}\n\nfunc TargetBusiGroupsGetAll(ctx *ctx.Context) (map[string][]int64, error) {\n\tvar lst []*TargetBusiGroup\n\terr := DB(ctx).Find(&lst).Error\n\tif err != nil {\n\t\treturn nil, err\n\t}\n\ttgs := make(map[string][]int64)\n\tfor _, tg := range lst {\n\t\ttgs[tg.TargetIdent] = append(tgs[tg.TargetIdent], tg.GroupId)\n\t}\n\treturn tgs, nil\n}\n\nfunc TargetGroupIdsGetByIdent(ctx *ctx.Context, ident string) ([]int64, error) {\n\tvar lst []*TargetBusiGroup\n\terr := DB(ctx).Where(\"target_ident = ?\", ident).Find(&lst).Error\n\tif err != nil {\n\t\treturn nil, err\n\t}\n\tgroupIds := make([]int64, 0, len(lst))\n\tfor _, tg := range lst {\n\t\tgroupIds = append(groupIds, tg.GroupId)\n\t}\n\treturn groupIds, nil\n}\n\nfunc TargetGroupIdsGetByIdents(ctx *ctx.Context, idents []string) ([]int64, error) {\n\tvar groupIds []int64\n\terr := DB(ctx).Model(&TargetBusiGroup{}).\n\t\tWhere(\"target_ident IN ?\", idents).\n\t\tDistinct().\n\t\tPluck(\"group_id\", &groupIds).\n\t\tError\n\tif err != nil {\n\t\treturn nil, err\n\t}\n\n\treturn groupIds, nil\n}\n\nfunc TargetBindBgids(ctx *ctx.Context, idents []string, bgids []int64, tags []string) error {\n\tlst := make([]TargetBusiGroup, 0, len(bgids)*len(idents))\n\tupdateAt := time.Now().Unix()\n\tfor _, bgid := range bgids {\n\t\tfor _, ident := range idents {\n\t\t\tcur := TargetBusiGroup{\n\t\t\t\tTargetIdent: ident,\n\t\t\t\tGroupId: bgid,\n\t\t\t\tUpdateAt: updateAt,\n\t\t\t}\n\t\t\tlst = append(lst, cur)\n\t\t}\n\t}\n\tvar cl clause.Expression = clause.Insert{Modifier: \"ignore\"}\n\tswitch DB(ctx).Dialector.Name() {\n\tcase \"sqlite\":\n\t\tcl = clause.Insert{Modifier: \"or ignore\"}\n\tcase \"postgres\":\n\t\tcl = clause.OnConflict{DoNothing: true}\n\t}\n\n\treturn DB(ctx).Transaction(func(tx *gorm.DB) error {\n\t\tif err := tx.Clauses(cl).CreateInBatches(&lst, 10).Error; err != nil {\n\t\t\treturn err\n\t\t}\n\t\tif targets, err := TargetsGetByIdents(ctx, idents); err != nil {\n\t\t\treturn err\n\t\t} else if len(tags) > 0 {\n\t\t\tfor _, t := range targets {\n\t\t\t\tif err := t.AddTags(ctx, tags); err != nil {\n\t\t\t\t\treturn err\n\t\t\t\t}\n\t\t\t}\n\t\t}\n\n\t\t// update target.update_at so that syncTargets can detect the change and refresh GroupIds cache\n\t\tif err := tx.Model(&Target{}).Where(\"ident in ?\", idents).Update(\"update_at\", updateAt).Error; err != nil {\n\t\t\treturn err\n\t\t}\n\n\t\treturn nil\n\t})\n}\n\nfunc TargetUnbindBgids(ctx *ctx.Context, idents []string, bgids []int64) error {\n\treturn DB(ctx).Transaction(func(tx *gorm.DB) error {\n\t\tif err := tx.Where(\"target_ident in ? and group_id in ?\",\n\t\t\tidents, bgids).Delete(&TargetBusiGroup{}).Error; err != nil {\n\t\t\treturn err\n\t\t}\n\t\t// update target.update_at so that syncTargets can detect the change and refresh GroupIds cache\n\t\treturn tx.Model(&Target{}).Where(\"ident in ?\", idents).Update(\"update_at\", time.Now().Unix()).Error\n\t})\n}\n\nfunc TargetDeleteBgids(tx *gorm.DB, idents []string) error {\n\treturn tx.Where(\"target_ident in ?\", idents).Delete(&TargetBusiGroup{}).Error\n}\n\nfunc TargetOverrideBgids(ctx *ctx.Context, idents []string, bgids []int64, tags []string) error {\n\treturn DB(ctx).Transaction(func(tx *gorm.DB) error {\n\t\t// 先删除旧的关联\n\t\tif err := tx.Where(\"target_ident IN ?\", idents).Delete(&TargetBusiGroup{}).Error; err != nil {\n\t\t\treturn err\n\t\t}\n\n\t\t// 准备新的关联数据\n\t\tlst := make([]TargetBusiGroup, 0, len(bgids)*len(idents))\n\t\tupdateAt := time.Now().Unix()\n\t\tfor _, ident := range idents {\n\t\t\tfor _, bgid := range bgids {\n\t\t\t\tcur := TargetBusiGroup{\n\t\t\t\t\tTargetIdent: ident,\n\t\t\t\t\tGroupId: bgid,\n\t\t\t\t\tUpdateAt: updateAt,\n\t\t\t\t}\n\t\t\t\tlst = append(lst, cur)\n\t\t\t}\n\t\t}\n\n\t\tif len(lst) == 0 {\n\t\t\treturn nil\n\t\t}\n\n\t\t// 添加新的关联\n\t\tvar cl clause.Expression = clause.Insert{Modifier: \"ignore\"}\n\t\tswitch tx.Dialector.Name() {\n\t\tcase \"sqlite\":\n\t\t\tcl = clause.Insert{Modifier: \"or ignore\"}\n\t\tcase \"postgres\":\n\t\t\tcl = clause.OnConflict{DoNothing: true}\n\t\t}\n\t\tif err := tx.Clauses(cl).CreateInBatches(&lst, 10).Error; err != nil {\n\t\t\treturn err\n\t\t}\n\t\tif len(tags) == 0 {\n\t\t\t// update target.update_at so that syncTargets can detect the change and refresh GroupIds cache\n\t\t\treturn tx.Model(&Target{}).Where(\"ident IN ?\", idents).Update(\"update_at\", updateAt).Error\n\t\t}\n\n\t\treturn tx.Model(Target{}).Where(\"ident IN ?\", idents).Updates(map[string]interface{}{\n\t\t\t\"tags\": strings.Join(tags, \" \") + \" \", \"update_at\": updateAt}).Error\n\t})\n}\n\nfunc SeparateTargetIdents(ctx *ctx.Context, idents []string) (existing, nonExisting []string, err error) {\n\texistingMap := make(map[string]bool)\n\n\t// 查询已存在的 idents 并直接填充 map\n\terr = DB(ctx).Model(&TargetBusiGroup{}).\n\t\tWhere(\"target_ident IN ?\", idents).\n\t\tDistinct().\n\t\tPluck(\"target_ident\", &existing).\n\t\tError\n\tif err != nil {\n\t\treturn nil, nil, err\n\t}\n\n\tfor _, ident := range existing {\n\t\texistingMap[ident] = true\n\t}\n\n\t// 分离不存在的 idents\n\tfor _, ident := range idents {\n\t\tif !existingMap[ident] {\n\t\t\tnonExisting = append(nonExisting, ident)\n\t\t}\n\t}\n\n\treturn\n}\n\nfunc TargetIndentsGetByBgids(ctx *ctx.Context, bgids []int64) ([]string, error) {\n\tvar idents []string\n\terr := DB(ctx).Model(&TargetBusiGroup{}).\n\t\tWhere(\"group_id IN ?\", bgids).\n\t\tDistinct(\"target_ident\").\n\t\tPluck(\"target_ident\", &idents).\n\t\tError\n\treturn idents, err\n}\n"
},
{
"path": "models/task_record.go",
"content": "package models\n\nimport (\n\t\"github.com/ccfos/nightingale/v6/pkg/ctx\"\n\t\"github.com/ccfos/nightingale/v6/pkg/poster\"\n)\n\ntype TaskRecord struct {\n\tId int64 `json:\"id\" gorm:\"primaryKey\"`\n\tEventId int64 `json:\"event_id\"`\n\tGroupId int64 `json:\"group_id\"`\n\tIbexAddress string `json:\"ibex_address\"`\n\tIbexAuthUser string `json:\"ibex_auth_user\"`\n\tIbexAuthPass string `json:\"ibex_auth_pass\"`\n\tTitle string `json:\"title\"`\n\tAccount string `json:\"account\"`\n\tBatch int `json:\"batch\"`\n\tTolerance int `json:\"tolerance\"`\n\tTimeout int `json:\"timeout\"`\n\tPause string `json:\"pause\"`\n\tScript string `json:\"script\"`\n\tArgs string `json:\"args\"`\n\tCreateAt int64 `json:\"create_at\"`\n\tCreateBy string `json:\"create_by\"`\n}\n\nfunc (r *TaskRecord) TableName() string {\n\treturn \"task_record\"\n}\n\n// create task\nfunc (r *TaskRecord) Add(ctx *ctx.Context) error {\n\tif !ctx.IsCenter {\n\t\terr := poster.PostByUrls(ctx, \"/v1/n9e/task-record-add\", r)\n\t\treturn err\n\t}\n\n\treturn Insert(ctx, r)\n}\n\n// list task, filter by group_id, create_by\nfunc TaskRecordTotal(ctx *ctx.Context, bgids []int64, beginTime int64, createBy, query string) (int64, error) {\n\tsession := DB(ctx).Model(&TaskRecord{}).Where(\"create_at > ?\", beginTime)\n\tif len(bgids) > 0 {\n\t\tsession = session.Where(\"group_id in (?)\", bgids)\n\t}\n\n\tif createBy != \"\" {\n\t\tsession = session.Where(\"create_by = ?\", createBy)\n\t}\n\n\tif query != \"\" {\n\t\tsession = session.Where(\"title like ?\", \"%\"+query+\"%\")\n\t}\n\n\treturn Count(session)\n}\n\nfunc TaskRecordGets(ctx *ctx.Context, bgids []int64, beginTime int64, createBy, query string, limit, offset int) ([]*TaskRecord, error) {\n\tsession := DB(ctx).Where(\"create_at > ?\", beginTime).Order(\"create_at desc\").Limit(limit).Offset(offset)\n\tif len(bgids) > 0 {\n\t\tsession = session.Where(\"group_id in (?)\", bgids)\n\t}\n\n\tif createBy != \"\" {\n\t\tsession = session.Where(\"create_by = ?\", createBy)\n\t}\n\n\tif query != \"\" {\n\t\tsession = session.Where(\"title like ?\", \"%\"+query+\"%\")\n\t}\n\n\tvar lst []*TaskRecord\n\terr := session.Find(&lst).Error\n\treturn lst, err\n}\n\n// update is_done field\nfunc (r *TaskRecord) UpdateIsDone(ctx *ctx.Context, isDone int) error {\n\treturn DB(ctx).Model(r).Update(\"is_done\", isDone).Error\n}\n"
},
{
"path": "models/task_tpl.go",
"content": "package models\n\nimport (\n\t\"errors\"\n\t\"fmt\"\n\t\"sort\"\n\t\"strconv\"\n\t\"strings\"\n\t\"time\"\n\n\t\"github.com/ccfos/nightingale/v6/pkg/ctx\"\n\t\"github.com/ccfos/nightingale/v6/pkg/poster\"\n\t\"github.com/toolkits/pkg/str\"\n\t\"gorm.io/gorm\"\n)\n\ntype TaskTpl struct {\n\tId int64 `json:\"id\" gorm:\"primaryKey\"`\n\tGroupId int64 `json:\"group_id\"`\n\tTitle string `json:\"title\"`\n\tBatch int `json:\"batch\"`\n\tTolerance int `json:\"tolerance\"`\n\tTimeout int `json:\"timeout\"`\n\tPause string `json:\"pause\"`\n\tScript string `json:\"script\"`\n\tArgs string `json:\"args\"`\n\tTags string `json:\"-\"`\n\tTagsJSON []string `json:\"tags\" gorm:\"-\"`\n\tAccount string `json:\"account\"`\n\tCreateAt int64 `json:\"create_at\"`\n\tCreateBy string `json:\"create_by\"`\n\tUpdateAt int64 `json:\"update_at\"`\n\tUpdateBy string `json:\"update_by\"`\n\tUpdateByNickname string `json:\"update_by_nickname\" gorm:\"-\"`\n}\n\nfunc (t *TaskTpl) TableName() string {\n\treturn \"task_tpl\"\n}\n\nfunc TaskTplTotal(ctx *ctx.Context, bgids []int64, query string) (int64, error) {\n\tsession := DB(ctx).Model(&TaskTpl{})\n\tif len(bgids) > 0 {\n\t\tsession = session.Where(\"group_id in (?)\", bgids)\n\t}\n\n\tif query == \"\" {\n\t\treturn Count(session)\n\t}\n\n\tarr := strings.Fields(query)\n\tfor i := 0; i < len(arr); i++ {\n\t\targ := \"%\" + arr[i] + \"%\"\n\t\tsession = session.Where(\"title like ? or tags like ?\", arg, arg)\n\t}\n\n\treturn Count(session)\n}\n\nfunc TaskTplStatistics(ctx *ctx.Context) (*Statistics, error) {\n\tif !ctx.IsCenter {\n\t\treturn poster.GetByUrls[*Statistics](ctx, \"/v1/n9e/task-tpl/statistics\")\n\t}\n\n\tsession := DB(ctx).Model(&TaskTpl{}).Select(\"count(*) as total\", \"max(update_at) as last_updated\")\n\n\tvar stats []*Statistics\n\terr := session.Find(&stats).Error\n\tif err != nil {\n\t\treturn nil, err\n\t}\n\n\treturn stats[0], nil\n}\n\nfunc TaskTplGetAll(ctx *ctx.Context) ([]*TaskTpl, error) {\n\tif !ctx.IsCenter {\n\t\treturn poster.GetByUrls[[]*TaskTpl](ctx, \"/v1/n9e/task-tpls\")\n\t}\n\n\tlst := make([]*TaskTpl, 0)\n\terr := DB(ctx).Find(&lst).Error\n\treturn lst, err\n\n}\n\nfunc TaskTplGets(ctx *ctx.Context, bgids []int64, query string, limit, offset int) ([]TaskTpl, error) {\n\tsession := DB(ctx).Order(\"title\").Limit(limit).Offset(offset)\n\tif len(bgids) > 0 {\n\t\tsession = session.Where(\"group_id in (?)\", bgids)\n\t}\n\n\tvar tpls []TaskTpl\n\tif query != \"\" {\n\t\tarr := strings.Fields(query)\n\t\tfor i := 0; i < len(arr); i++ {\n\t\t\targ := \"%\" + arr[i] + \"%\"\n\t\t\tsession = session.Where(\"title like ? or tags like ?\", arg, arg)\n\t\t}\n\t}\n\n\terr := session.Find(&tpls).Error\n\tif err == nil {\n\t\tfor i := 0; i < len(tpls); i++ {\n\t\t\ttpls[i].TagsJSON = strings.Fields(tpls[i].Tags)\n\t\t}\n\t}\n\n\treturn tpls, err\n}\n\nfunc TaskTplGetById(ctx *ctx.Context, id int64) (*TaskTpl, error) {\n\tif !ctx.IsCenter {\n\t\ttpl, err := poster.GetByUrls[*TaskTpl](ctx, \"/v1/n9e/task-tpl/\"+strconv.FormatInt(id, 10))\n\t\treturn tpl, err\n\t}\n\n\treturn TaskTplGet(ctx, \"id = ?\", id)\n}\n\nfunc TaskTplGet(ctx *ctx.Context, where string, args ...interface{}) (*TaskTpl, error) {\n\tvar arr []*TaskTpl\n\terr := DB(ctx).Where(where, args...).Find(&arr).Error\n\tif err != nil {\n\t\treturn nil, err\n\t}\n\n\tif len(arr) == 0 {\n\t\treturn nil, nil\n\t}\n\n\tarr[0].TagsJSON = strings.Fields(arr[0].Tags)\n\n\treturn arr[0], nil\n}\n\nfunc (t *TaskTpl) CleanFields() error {\n\tif t.Batch < 0 {\n\t\treturn errors.New(\"arg(batch) should be nonnegative\")\n\t}\n\n\tif t.Tolerance < 0 {\n\t\treturn errors.New(\"arg(tolerance) should be nonnegative\")\n\t}\n\n\tif t.Timeout < 0 {\n\t\treturn errors.New(\"arg(timeout) should be nonnegative\")\n\t}\n\n\tif t.Timeout == 0 {\n\t\tt.Timeout = 30\n\t}\n\n\tif t.Timeout > 3600*24*5 {\n\t\treturn errors.New(\"arg(timeout) longer than five days\")\n\t}\n\n\tt.Pause = strings.Replace(t.Pause, \",\", \",\", -1)\n\tt.Pause = strings.Replace(t.Pause, \" \", \"\", -1)\n\tt.Args = strings.Replace(t.Args, \",\", \",\", -1)\n\tt.Tags = strings.Replace(t.Tags, \",\", \",\", -1)\n\n\tif t.Title == \"\" {\n\t\treturn errors.New(\"arg(title) is required\")\n\t}\n\n\tif str.Dangerous(t.Title) {\n\t\treturn errors.New(\"arg(title) is dangerous\")\n\t}\n\n\tif t.Script == \"\" {\n\t\treturn errors.New(\"arg(script) is required\")\n\t}\n\tt.Script = strings.Replace(t.Script, \"\\r\\n\", \"\\n\", -1)\n\n\tif str.Dangerous(t.Args) {\n\t\treturn errors.New(\"arg(args) is dangerous\")\n\t}\n\n\tif str.Dangerous(t.Pause) {\n\t\treturn errors.New(\"arg(pause) is dangerous\")\n\t}\n\n\tif str.Dangerous(t.Tags) {\n\t\treturn errors.New(\"arg(tags) is dangerous\")\n\t}\n\n\treturn nil\n}\n\ntype TaskTplHost struct {\n\tId int64 `json:\"id\"`\n\tHost string `json:\"host\"`\n}\n\nfunc (t *TaskTpl) Save(ctx *ctx.Context, hosts []string) error {\n\tif err := t.CleanFields(); err != nil {\n\t\treturn err\n\t}\n\n\tcnt, err := Count(DB(ctx).Model(&TaskTpl{}).Where(\"group_id=? and title=?\", t.GroupId, t.Title))\n\tif err != nil {\n\t\treturn err\n\t}\n\n\tif cnt > 0 {\n\t\treturn fmt.Errorf(\"task template already exists\")\n\t}\n\n\treturn DB(ctx).Transaction(func(tx *gorm.DB) error {\n\t\tif err := tx.Create(t).Error; err != nil {\n\t\t\treturn err\n\t\t}\n\n\t\tfor i := 0; i < len(hosts); i++ {\n\t\t\thost := strings.TrimSpace(hosts[i])\n\t\t\tif host == \"\" {\n\t\t\t\tcontinue\n\t\t\t}\n\n\t\t\ttaskTplHost := TaskTplHost{\n\t\t\t\tId: t.Id,\n\t\t\t\tHost: host,\n\t\t\t}\n\n\t\t\terr := tx.Table(\"task_tpl_host\").Create(&taskTplHost).Error\n\n\t\t\tif err != nil {\n\t\t\t\treturn err\n\t\t\t}\n\t\t}\n\n\t\treturn nil\n\t})\n}\n\nfunc (t *TaskTpl) Hosts(ctx *ctx.Context) ([]string, error) {\n\tvar arr []string\n\terr := DB(ctx).Table(\"task_tpl_host\").Where(\"id=?\", t.Id).Order(\"ii\").Pluck(\"host\", &arr).Error\n\treturn arr, err\n}\n\nfunc (t *TaskTpl) Update(ctx *ctx.Context, hosts []string) error {\n\tif err := t.CleanFields(); err != nil {\n\t\treturn err\n\t}\n\n\tcnt, err := Count(DB(ctx).Model(&TaskTpl{}).Where(\"group_id=? and title=? and id <> ?\", t.GroupId, t.Title, t.Id))\n\tif err != nil {\n\t\treturn err\n\t}\n\n\tif cnt > 0 {\n\t\treturn fmt.Errorf(\"task template already exists\")\n\t}\n\n\treturn DB(ctx).Transaction(func(tx *gorm.DB) error {\n\t\terr := tx.Model(t).Updates(map[string]interface{}{\n\t\t\t\"title\": t.Title,\n\t\t\t\"batch\": t.Batch,\n\t\t\t\"tolerance\": t.Tolerance,\n\t\t\t\"timeout\": t.Timeout,\n\t\t\t\"pause\": t.Pause,\n\t\t\t\"script\": t.Script,\n\t\t\t\"args\": t.Args,\n\t\t\t\"tags\": t.Tags,\n\t\t\t\"account\": t.Account,\n\t\t\t\"update_by\": t.UpdateBy,\n\t\t\t\"update_at\": t.UpdateAt,\n\t\t}).Error\n\n\t\tif err != nil {\n\t\t\treturn err\n\t\t}\n\n\t\tif err = tx.Exec(\"DELETE FROM task_tpl_host WHERE id = ?\", t.Id).Error; err != nil {\n\t\t\treturn err\n\t\t}\n\n\t\tfor i := 0; i < len(hosts); i++ {\n\t\t\thost := strings.TrimSpace(hosts[i])\n\t\t\tif host == \"\" {\n\t\t\t\tcontinue\n\t\t\t}\n\n\t\t\terr := tx.Table(\"task_tpl_host\").Create(map[string]interface{}{\n\t\t\t\t\"id\": t.Id,\n\t\t\t\t\"host\": host,\n\t\t\t}).Error\n\n\t\t\tif err != nil {\n\t\t\t\treturn err\n\t\t\t}\n\t\t}\n\n\t\treturn nil\n\t})\n}\n\nfunc (t *TaskTpl) Del(ctx *ctx.Context) error {\n\treturn DB(ctx).Transaction(func(tx *gorm.DB) error {\n\t\tif err := tx.Exec(\"DELETE FROM task_tpl_host WHERE id=?\", t.Id).Error; err != nil {\n\t\t\treturn err\n\t\t}\n\n\t\tif err := tx.Delete(t).Error; err != nil {\n\t\t\treturn err\n\t\t}\n\n\t\treturn nil\n\t})\n}\n\nfunc (t *TaskTpl) AddTags(ctx *ctx.Context, tags []string, updateBy string) error {\n\tfor i := 0; i < len(tags); i++ {\n\t\tif -1 == strings.Index(t.Tags, tags[i]+\" \") {\n\t\t\tt.Tags += tags[i] + \" \"\n\t\t}\n\t}\n\n\tarr := strings.Fields(t.Tags)\n\tsort.Strings(arr)\n\n\treturn DB(ctx).Model(t).Updates(map[string]interface{}{\n\t\t\"tags\": strings.Join(arr, \" \") + \" \",\n\t\t\"update_by\": updateBy,\n\t\t\"update_at\": time.Now().Unix(),\n\t}).Error\n}\n\nfunc (t *TaskTpl) DelTags(ctx *ctx.Context, tags []string, updateBy string) error {\n\tfor i := 0; i < len(tags); i++ {\n\t\tt.Tags = strings.ReplaceAll(t.Tags, tags[i]+\" \", \"\")\n\t}\n\n\treturn DB(ctx).Model(t).Updates(map[string]interface{}{\n\t\t\"tags\": t.Tags,\n\t\t\"update_by\": updateBy,\n\t\t\"update_at\": time.Now().Unix(),\n\t}).Error\n}\n\nfunc (t *TaskTpl) UpdateGroup(ctx *ctx.Context, groupId int64, updateBy string) error {\n\treturn DB(ctx).Model(t).Updates(map[string]interface{}{\n\t\t\"group_id\": groupId,\n\t\t\"update_by\": updateBy,\n\t\t\"update_at\": time.Now().Unix(),\n\t}).Error\n}\n\ntype TaskForm struct {\n\tTitle string `json:\"title\"`\n\tAccount string `json:\"account\"`\n\tBatch int `json:\"batch\"`\n\tTolerance int `json:\"tolerance\"`\n\tTimeout int `json:\"timeout\"`\n\tPause string `json:\"pause\"`\n\tScript string `json:\"script\"`\n\tArgs string `json:\"args\"`\n\tStdin string `json:\"stdin\"`\n\tAction string `json:\"action\"`\n\tCreator string `json:\"creator\"`\n\tHosts []string `json:\"hosts\"`\n\tAlertTriggered bool `json:\"alert_triggered\"`\n}\n\nfunc (f *TaskForm) Verify() error {\n\tif f.Batch < 0 {\n\t\treturn fmt.Errorf(\"arg(batch) should be nonnegative\")\n\t}\n\n\tif f.Tolerance < 0 {\n\t\treturn fmt.Errorf(\"arg(tolerance) should be nonnegative\")\n\t}\n\n\tif f.Timeout < 0 {\n\t\treturn fmt.Errorf(\"arg(timeout) should be nonnegative\")\n\t}\n\n\tif f.Timeout > 3600*24*5 {\n\t\treturn fmt.Errorf(\"arg(timeout) longer than five days\")\n\t}\n\n\tif f.Timeout == 0 {\n\t\tf.Timeout = 30\n\t}\n\n\tf.Pause = strings.Replace(f.Pause, \",\", \",\", -1)\n\tf.Pause = strings.Replace(f.Pause, \" \", \"\", -1)\n\tf.Args = strings.Replace(f.Args, \",\", \",\", -1)\n\n\tif f.Title == \"\" {\n\t\treturn fmt.Errorf(\"arg(title) is required\")\n\t}\n\n\tif str.Dangerous(f.Title) {\n\t\treturn fmt.Errorf(\"arg(title) is dangerous\")\n\t}\n\n\tif f.Script == \"\" {\n\t\treturn fmt.Errorf(\"arg(script) is required\")\n\t}\n\tf.Script = strings.Replace(f.Script, \"\\r\\n\", \"\\n\", -1)\n\n\tif str.Dangerous(f.Args) {\n\t\treturn fmt.Errorf(\"arg(args) is dangerous\")\n\t}\n\n\tif str.Dangerous(f.Pause) {\n\t\treturn fmt.Errorf(\"arg(pause) is dangerous\")\n\t}\n\n\tif len(f.Hosts) == 0 {\n\t\treturn fmt.Errorf(\"arg(hosts) empty\")\n\t}\n\n\tif f.Action != \"start\" && f.Action != \"pause\" {\n\t\treturn fmt.Errorf(\"arg(action) invalid\")\n\t}\n\n\treturn nil\n}\n\nfunc (f *TaskForm) HandleFH(fh string) {\n\ti := strings.Index(f.Title, \" FH: \")\n\tif i > 0 {\n\t\tf.Title = f.Title[:i]\n\t}\n\tf.Title = f.Title + \" FH: \" + fh\n}\n"
},
{
"path": "models/ts.go",
"content": "package models\n\nimport (\n\t\"bytes\"\n\t\"fmt\"\n\t\"strconv\"\n\n\t\"github.com/prometheus/common/model\"\n)\n\ntype DataResp struct {\n\tRef string `json:\"ref\"`\n\tMetric model.Metric `json:\"metric\"`\n\tLabels string `json:\"-\"`\n\tValues [][]float64 `json:\"values\"`\n\tQuery string `json:\"query\"`\n}\n\nfunc (d *DataResp) String() string {\n\tvar buf bytes.Buffer\n\tbuf.WriteString(fmt.Sprintf(\"Ref: %s \", d.Ref))\n\tbuf.WriteString(fmt.Sprintf(\"Metric: %+v \", d.Metric))\n\tbuf.WriteString(fmt.Sprintf(\"Labels: %s \", d.Labels))\n\tbuf.WriteString(\"Values: \")\n\tfor _, v := range d.Values {\n\t\tbuf.WriteString(\" [\")\n\t\tfor i, ts := range v {\n\t\t\tif i > 0 {\n\t\t\t\tbuf.WriteString(\", \")\n\t\t\t}\n\t\t\tbuf.WriteString(strconv.FormatInt(int64(ts), 10))\n\t\t}\n\t\tbuf.WriteString(\"] \")\n\t}\n\tbuf.WriteString(fmt.Sprintf(\"Query: %s \", d.Query))\n\treturn buf.String()\n}\n\nfunc (d *DataResp) Last() (float64, float64, bool) {\n\tif len(d.Values) == 0 {\n\t\treturn 0, 0, false\n\t}\n\n\tlastValue := d.Values[len(d.Values)-1]\n\tif len(lastValue) != 2 {\n\t\treturn 0, 0, false\n\t}\n\treturn lastValue[0], lastValue[1], true\n}\n\nfunc (d *DataResp) MetricName() string {\n\tmetric := d.Metric[\"__name__\"]\n\treturn string(metric)\n}\n\n// labels 转换为 string\nfunc (d *DataResp) LabelsString() string {\n\tlabels := d.Metric\n\treturn labels.String()\n}\n\ntype RelationKey struct {\n\tLeftKey string `json:\"left_key\"`\n\tRightKey string `json:\"right_key\"`\n\tOP string `json:\"op\"`\n}\n\ntype QueryParam struct {\n\tCate string `json:\"cate\"`\n\tDatasourceId int64 `json:\"datasource_id\"`\n\tQueries []interface{} `json:\"query\"`\n}\n\ntype Series struct {\n\tSeriesStore map[uint64]DataResp `json:\"store\"`\n\tSeriesIndex map[string]map[uint64]struct{} `json:\"index\"`\n}\n"
},
{
"path": "models/user.go",
"content": "package models\n\nimport (\n\t\"encoding/json\"\n\t\"fmt\"\n\t\"os\"\n\t\"reflect\"\n\t\"regexp\"\n\t\"strconv\"\n\t\"strings\"\n\t\"time\"\n\t\"unicode\"\n\n\t\"github.com/ccfos/nightingale/v6/pkg/ctx\"\n\t\"github.com/ccfos/nightingale/v6/pkg/logx\"\n\t\"github.com/ccfos/nightingale/v6/pkg/ormx\"\n\t\"github.com/ccfos/nightingale/v6/pkg/poster\"\n\t\"github.com/ccfos/nightingale/v6/pkg/secu\"\n\t\"github.com/ccfos/nightingale/v6/storage\"\n\t\"github.com/redis/go-redis/v9\"\n\n\t\"github.com/pkg/errors\"\n\t\"github.com/tidwall/gjson\"\n\t\"github.com/toolkits/pkg/logger\"\n\t\"github.com/toolkits/pkg/slice\"\n\t\"github.com/toolkits/pkg/str\"\n\t\"gorm.io/gorm\"\n)\n\nconst (\n\tDingtalk = \"dingtalk\"\n\tWecom = \"wecom\"\n\tFeishu = \"feishu\"\n\tFeishuCard = \"feishucard\"\n\tDiscord = \"discord\"\n\tMattermostWebhook = \"mattermostwebhook\"\n\tMattermostBot = \"mattermostbot\"\n\tSlackWebhook = \"slackwebhook\"\n\tSlackBot = \"slackbot\"\n\tMm = \"mm\"\n\tTelegram = \"telegram\"\n\tEmail = \"email\"\n\tEmailSubject = \"mailsubject\"\n\tLark = \"lark\"\n\tLarkCard = \"larkcard\"\n\tPhone = \"phone\"\n\tJira = \"jira\"\n\tJSMAlert = \"jsm_alert\"\n\n\tDingtalkKey = \"dingtalk_robot_token\"\n\tWecomKey = \"wecom_robot_token\"\n\tFeishuKey = \"feishu_robot_token\"\n\tMmKey = \"mm_webhook_url\"\n\tTelegramKey = \"telegram_robot_token\"\n\tLarkKey = \"lark_robot_token\"\n\tPagerDutyKey = \"pagerduty_key\"\n\n\tDingtalkDomain = \"oapi.dingtalk.com\"\n\tWecomDomain = \"qyapi.weixin.qq.com\"\n\tFeishuDomain = \"open.feishu.cn\"\n\tLarkDomain = \"open.larksuite.com\"\n\n\t// FeishuCardDomain The domain name of the feishu card is the same as the feishu,distinguished by the parameter\n\tFeishuCardDomain = \"open.feishu.cn?card=1\"\n\tLarkCardDomain = \"open.larksuite.com?card=1\"\n\tTelegramDomain = \"api.telegram.org\"\n\tIbexDomain = \"ibex\"\n\tDefaultDomain = \"default\"\n)\n\nvar (\n\tDefaultChannels = []string{Dingtalk, Wecom, Feishu, Mm, Telegram, Email, FeishuCard, Lark, LarkCard}\n\tDefaultContacts = []string{DingtalkKey, WecomKey, FeishuKey, MmKey, TelegramKey, LarkKey}\n)\n\ntype User struct {\n\tId int64 `json:\"id\" gorm:\"primaryKey\"`\n\tUsername string `json:\"username\"`\n\tNickname string `json:\"nickname\"`\n\tPassword string `json:\"-\"`\n\tPhone string `json:\"phone\"`\n\tEmail string `json:\"email\"`\n\tPortrait string `json:\"portrait\"`\n\tRoles string `json:\"-\"` // 这个字段写入数据库\n\tRolesLst []string `json:\"roles\" gorm:\"-\"` // 这个字段和前端交互\n\tTeamsLst []int64 `json:\"-\" gorm:\"-\"` // 这个字段方便映射团队,前端和数据库都不用到\n\tContacts ormx.JSONObj `json:\"contacts\"` // 内容为 map[string]string 结构\n\tMaintainer int `json:\"maintainer\"` // 是否给管理员发消息 0:not send 1:send\n\tCreateAt int64 `json:\"create_at\"`\n\tCreateBy string `json:\"create_by\"`\n\tUpdateAt int64 `json:\"update_at\"`\n\tUpdateBy string `json:\"update_by\"`\n\tBelong string `json:\"belong\"`\n\tAdmin bool `json:\"admin\" gorm:\"-\"` // 方便前端使用\n\tUserGroupsRes []*UserGroupRes `json:\"user_groups\" gorm:\"-\"`\n\tBusiGroupsRes []*BusiGroupRes `json:\"busi_groups\" gorm:\"-\"`\n\tLastActiveTime int64 `json:\"last_active_time\"`\n}\n\ntype UserGroupRes struct {\n\tId int64 `json:\"id\"`\n\tName string `json:\"name\"`\n}\n\ntype BusiGroupRes struct {\n\tId int64 `json:\"id\"`\n\tName string `json:\"name\"`\n}\n\nfunc (u *User) TableName() string {\n\treturn \"users\"\n}\n\nfunc (u *User) String() string {\n\tbs, err := u.Contacts.MarshalJSON()\n\tif err != nil {\n\t\treturn err.Error()\n\t}\n\n\treturn fmt.Sprintf(\"\", u.Id, u.Username, u.Nickname, u.Email, u.Phone, string(bs))\n}\n\nfunc (u *User) IsAdmin() bool {\n\tfor i := 0; i < len(u.RolesLst); i++ {\n\t\tif u.RolesLst[i] == AdminRole {\n\t\t\treturn true\n\t\t}\n\t}\n\treturn false\n}\n\n// has group permission\nfunc (u *User) CheckGroupPermission(ctx *ctx.Context, groupIds []int64) error {\n\tif !u.IsAdmin() {\n\t\tids, err := MyGroupIdsMap(ctx, u.Id)\n\t\tif err != nil {\n\t\t\treturn err\n\t\t}\n\n\t\tfor _, id := range groupIds {\n\t\t\tif _, ok := ids[id]; ok {\n\t\t\t\treturn nil\n\t\t\t}\n\t\t}\n\n\t\treturn errors.New(\"forbidden\")\n\t}\n\treturn nil\n}\n\n// stripInvisibleChars removes invisible Unicode characters from a string\n// This includes zero-width spaces, control characters, and other invisible chars\nfunc stripInvisibleChars(s string) string {\n\treturn strings.Map(func(r rune) rune {\n\t\t// Keep printable characters and common whitespace (space, tab, newline)\n\t\tif unicode.IsPrint(r) || r == ' ' || r == '\\t' || r == '\\n' || r == '\\r' {\n\t\t\treturn r\n\t\t}\n\t\t// Remove invisible characters\n\t\treturn -1\n\t}, s)\n}\n\n// stripInvisibleCharsFromContacts removes invisible characters from Contacts JSON values\nfunc stripInvisibleCharsFromContacts(contacts ormx.JSONObj) ormx.JSONObj {\n\tif len(contacts) == 0 {\n\t\treturn contacts\n\t}\n\n\tvar contactsMap map[string]string\n\tif err := json.Unmarshal(contacts, &contactsMap); err != nil {\n\t\treturn contacts\n\t}\n\n\tfor k, v := range contactsMap {\n\t\tcontactsMap[k] = stripInvisibleChars(v)\n\t}\n\n\tresult, err := json.Marshal(contactsMap)\n\tif err != nil {\n\t\treturn contacts\n\t}\n\n\treturn ormx.JSONObj(result)\n}\n\nfunc (u *User) Verify() error {\n\tu.Username = strings.TrimSpace(u.Username)\n\n\tif u.Username == \"\" {\n\t\treturn errors.New(\"Username is blank\")\n\t}\n\n\tif str.Dangerous(u.Username) {\n\t\treturn errors.New(\"Username has invalid characters\")\n\t}\n\n\tif str.Dangerous(u.Nickname) {\n\t\treturn errors.New(\"Nickname has invalid characters\")\n\t}\n\n\tif u.Phone != \"\" && !str.IsPhone(u.Phone) {\n\t\treturn errors.New(\"Phone invalid\")\n\t}\n\n\tif u.Email != \"\" && !str.IsMail(u.Email) {\n\t\treturn errors.New(\"Email invalid\")\n\t}\n\n\t// Strip invisible characters from Contacts values\n\tu.Contacts = stripInvisibleCharsFromContacts(u.Contacts)\n\n\tif u.Phone != \"\" {\n\t\treturn u.EncryptPhone()\n\t}\n\n\treturn nil\n}\n\nfunc (u *User) UpdateSsoFields(sso string, nickname, phone, email string) []interface{} {\n\tu.UpdateAt = time.Now().Unix()\n\n\tif nickname != \"\" {\n\t\tu.Nickname = nickname\n\t}\n\tif phone != \"\" {\n\t\tu.Phone = phone\n\t}\n\tif email != \"\" {\n\t\tu.Email = email\n\t}\n\tu.UpdateBy = sso\n\tu.Belong = sso\n\n\tupdatedFields := []interface{}{\"nickname\", \"phone\", \"email\", \"update_by\", \"belong\"}\n\treturn updatedFields\n}\n\nfunc (u *User) UpdateSsoFieldsWithRoles(sso string, nickname, phone, email string, roles []string) []interface{} {\n\tupdatedFields := u.UpdateSsoFields(sso, nickname, phone, email)\n\n\tif len(roles) == 0 {\n\t\treturn updatedFields\n\t}\n\n\tu.Roles = strings.Join(roles, \" \")\n\tu.RolesLst = roles\n\n\treturn append(updatedFields, \"roles\")\n}\n\nfunc (u *User) FullSsoFields(sso, username, nickname, phone, email string, defaultRoles []string) {\n\tnow := time.Now().Unix()\n\n\tu.Username = username\n\tu.Password = \"******\"\n\tu.Nickname = nickname\n\tu.Phone = phone\n\tu.Email = email\n\tu.Portrait = \"\"\n\tu.Roles = strings.Join(defaultRoles, \" \")\n\tu.RolesLst = defaultRoles\n\tu.Contacts = []byte(\"{}\")\n\tu.CreateAt = now\n\tu.UpdateAt = now\n\tu.CreateBy = sso\n\tu.UpdateBy = sso\n\tu.Belong = sso\n}\n\nfunc (u *User) FullSsoFieldsWithTeams(sso, username, nickname, phone, email string, defaultRoles []string,\n\tteams []int64) {\n\tu.FullSsoFields(sso, username, nickname, phone, email, defaultRoles)\n\tu.TeamsLst = teams\n}\n\nfunc (u *User) Add(ctx *ctx.Context) error {\n\tuser, err := UserGetByUsername(ctx, u.Username)\n\tif err != nil {\n\t\treturn errors.WithMessage(err, \"failed to query user\")\n\t}\n\n\tif user != nil {\n\t\treturn errors.New(\"Username already exists\")\n\t}\n\n\tnow := time.Now().Unix()\n\tu.CreateAt = now\n\tu.UpdateAt = now\n\treturn Insert(ctx, u)\n}\n\nfunc (u *User) Update(ctx *ctx.Context, selectField interface{}, selectFields ...interface{}) error {\n\tif u.Belong == \"\" {\n\t\tif err := u.Verify(); err != nil {\n\t\t\treturn err\n\t\t}\n\t}\n\n\treturn DB(ctx).Model(u).Select(selectField, selectFields...).Updates(u).Error\n}\n\nfunc (u *User) UpdateAllFields(ctx *ctx.Context) error {\n\tif err := u.Verify(); err != nil {\n\t\treturn err\n\t}\n\n\tu.UpdateAt = time.Now().Unix()\n\treturn DB(ctx).Model(u).Select(\"*\").Updates(u).Error\n}\n\nfunc (u *User) UpdatePassword(ctx *ctx.Context, password, updateBy string) error {\n\treturn DB(ctx).Model(u).Updates(map[string]interface{}{\n\t\t\"password\": password,\n\t\t\"update_at\": time.Now().Unix(),\n\t\t\"update_by\": updateBy,\n\t}).Error\n}\n\nfunc (u *User) AddToUserGroups(ctx *ctx.Context, userGroupIds []int64) error {\n\n\tcount := len(userGroupIds)\n\tfor i := 0; i < count; i++ {\n\t\terr := UserGroupMemberAdd(ctx, userGroupIds[i], u.Id)\n\t\tif err != nil {\n\t\t\treturn err\n\t\t}\n\t}\n\treturn nil\n}\n\nfunc UpdateUserLastActiveTime(ctx *ctx.Context, userId int64, lastActiveTime int64) error {\n\treturn DB(ctx).Model(&User{}).Where(\"id = ?\", userId).Updates(map[string]interface{}{\n\t\t\"last_active_time\": lastActiveTime,\n\t\t\"update_at\": time.Now().Unix(),\n\t}).Error\n}\n\nfunc (u *User) Del(ctx *ctx.Context) error {\n\treturn DB(ctx).Transaction(func(tx *gorm.DB) error {\n\t\tif err := tx.Where(\"user_id=?\", u.Id).Delete(&UserGroupMember{}).Error; err != nil {\n\t\t\treturn err\n\t\t}\n\n\t\tif err := tx.Where(\"id=?\", u.Id).Delete(&User{}).Error; err != nil {\n\t\t\treturn err\n\t\t}\n\n\t\tif err := tx.Where(\"username=?\", u.Username).Delete(&UserToken{}).Error; err != nil {\n\t\t\treturn err\n\t\t}\n\n\t\treturn nil\n\t})\n}\n\nfunc (u *User) ChangePassword(ctx *ctx.Context, oldpass, newpass string) error {\n\t// SSO 用户(ldap/oidc/cas/oauth2/dingtalk等)且未设置本地密码,不支持本地修改密码\n\tif u.Belong != \"\" && u.Password == \"******\" {\n\t\treturn fmt.Errorf(\"SSO user(%s) cannot change password locally, please change password in %s\", u.Username, u.Belong)\n\t}\n\n\t_oldpass, err := CryptoPass(ctx, oldpass)\n\tif err != nil {\n\t\treturn err\n\t}\n\n\t_newpass, err := CryptoPass(ctx, newpass)\n\tif err != nil {\n\t\treturn err\n\t}\n\n\tif u.Password != _oldpass {\n\t\treturn errors.New(\"Incorrect old password\")\n\t}\n\n\treturn u.UpdatePassword(ctx, _newpass, u.Username)\n}\n\nfunc UserGet(ctx *ctx.Context, where string, args ...interface{}) (*User, error) {\n\tvar lst []*User\n\terr := DB(ctx).Where(where, args...).Find(&lst).Error\n\tif err != nil {\n\t\treturn nil, err\n\t}\n\n\tif len(lst) == 0 {\n\t\treturn nil, nil\n\t}\n\n\tlst[0].RolesLst = strings.Fields(lst[0].Roles)\n\tlst[0].Admin = lst[0].IsAdmin()\n\tlst[0].DecryptPhone() // 解密手机号\n\n\treturn lst[0], nil\n}\n\nfunc UsersGet(ctx *ctx.Context, where string, args ...interface{}) ([]*User, error) {\n\tvar lst []*User\n\terr := DB(ctx).Where(where, args...).Find(&lst).Error\n\tif err != nil {\n\t\treturn nil, err\n\t}\n\n\tfor _, user := range lst {\n\t\tuser.RolesLst = strings.Fields(user.Roles)\n\t\tuser.Admin = user.IsAdmin()\n\t\tuser.DecryptPhone() // 解密手机号\n\t}\n\n\treturn lst, nil\n}\n\nfunc UserMapGet(ctx *ctx.Context, where string, args ...interface{}) map[string]*User {\n\tlst, err := UsersGet(ctx, where, args...)\n\tif err != nil {\n\t\tlogger.Errorf(\"UsersGet err: %v\", err)\n\t\treturn nil\n\t}\n\tum := make(map[string]*User, len(lst))\n\tfor _, user := range lst {\n\t\tum[user.Username] = user\n\t}\n\treturn um\n}\n\n// UserNicknameMap returns a deduplicated username -> nickname map.\nfunc UserNicknameMap(ctx *ctx.Context, names []string) map[string]string {\n\tm := make(map[string]string)\n\tif len(names) == 0 {\n\t\treturn m\n\t}\n\tseen := make(map[string]struct{}, len(names))\n\tunique := make([]string, 0, len(names))\n\tfor _, name := range names {\n\t\tif name == \"\" {\n\t\t\tcontinue\n\t\t}\n\t\tif _, ok := seen[name]; ok {\n\t\t\tcontinue\n\t\t}\n\t\tseen[name] = struct{}{}\n\t\tunique = append(unique, name)\n\t}\n\tif len(unique) == 0 {\n\t\treturn m\n\t}\n\tusers := UserMapGet(ctx, \"username in (?)\", unique)\n\tfor username, user := range users {\n\t\tm[username] = user.Nickname\n\t}\n\treturn m\n}\n\n// FillUpdateByNicknames fills the UpdateByNickname field for each element in items\n// by looking up the UpdateBy username. Supports both []T and []*T slices.\nfunc FillUpdateByNicknames[T any](ctx *ctx.Context, items []T) {\n\tif len(items) == 0 {\n\t\treturn\n\t}\n\n\telemType := reflect.TypeOf(items).Elem()\n\tisPtr := elemType.Kind() == reflect.Ptr\n\tif isPtr {\n\t\telemType = elemType.Elem()\n\t}\n\n\tupdateByField, ok1 := elemType.FieldByName(\"UpdateBy\")\n\tnicknameField, ok2 := elemType.FieldByName(\"UpdateByNickname\")\n\tif !ok1 || !ok2 {\n\t\treturn\n\t}\n\n\tnames := make([]string, 0, len(items))\n\tfor i := range items {\n\t\tv := reflect.ValueOf(&items[i]).Elem()\n\t\tif isPtr {\n\t\t\tif v.IsNil() {\n\t\t\t\tcontinue\n\t\t\t}\n\t\t\tv = v.Elem()\n\t\t}\n\t\tnames = append(names, v.FieldByIndex(updateByField.Index).String())\n\t}\n\n\tnm := UserNicknameMap(ctx, names)\n\n\tfor i := range items {\n\t\tv := reflect.ValueOf(&items[i]).Elem()\n\t\tif isPtr {\n\t\t\tif v.IsNil() {\n\t\t\t\tcontinue\n\t\t\t}\n\t\t\tv = v.Elem()\n\t\t}\n\t\tupdateBy := v.FieldByIndex(updateByField.Index).String()\n\t\tv.FieldByIndex(nicknameField.Index).SetString(nm[updateBy])\n\t}\n}\n\nfunc UserGetByUsername(ctx *ctx.Context, username string) (*User, error) {\n\treturn UserGet(ctx, \"username=?\", username)\n}\n\nfunc UserGetById(ctx *ctx.Context, id int64) (*User, error) {\n\treturn UserGet(ctx, \"id=?\", id)\n}\n\nfunc CountAdminUsers(ctx *ctx.Context) (int64, error) {\n\tvar count int64\n\terr := DB(ctx).Model(&User{}).Where(\"roles LIKE ?\", \"%\"+AdminRole+\"%\").Count(&count).Error\n\treturn count, err\n}\n\nfunc UsersGetByGroupIds(ctx *ctx.Context, groupIds []int64) ([]User, error) {\n\tif len(groupIds) == 0 {\n\t\treturn nil, nil\n\t}\n\n\tuserIds, err := GroupsMemberIds(ctx, groupIds)\n\tif err != nil {\n\t\treturn nil, err\n\t}\n\tusers, err := UserGetsByIds(ctx, userIds)\n\tif err != nil {\n\t\treturn nil, err\n\t}\n\treturn users, nil\n}\n\nfunc InitRoot(ctx *ctx.Context) bool {\n\tuser, err := UserGetByUsername(ctx, \"root\")\n\tif err != nil {\n\t\tfmt.Println(\"failed to query user root:\", err)\n\t\tos.Exit(1)\n\t}\n\n\tif user == nil {\n\t\treturn false\n\t}\n\n\tif len(user.Password) > 31 {\n\t\t// already done before\n\t\treturn false\n\t}\n\n\t// 查询用户个数\n\tcount, err := Count(DB(ctx).Model(&User{}))\n\tif err != nil {\n\t\tfmt.Println(\"failed to count user:\", err)\n\t\tos.Exit(1)\n\t}\n\n\tif count == 1 {\n\t\t// 说明数据库只有一个 root 用户,并且 root 用户密码没有加密,需要初始化 salt\n\t\tInitSalt(ctx)\n\t}\n\n\tnewPass, err := CryptoPass(ctx, user.Password)\n\tif err != nil {\n\t\tfmt.Println(\"failed to crypto pass:\", err)\n\t\tos.Exit(1)\n\t}\n\n\terr = DB(ctx).Model(user).Update(\"password\", newPass).Error\n\tif err != nil {\n\t\tfmt.Println(\"failed to update root password:\", err)\n\t\tos.Exit(1)\n\t}\n\n\tfmt.Println(\"root password init done\")\n\treturn true\n}\n\nfunc reachLoginFailCount(ctx *ctx.Context, redisObj storage.Redis, username string, count int64) (bool, error) {\n\tkey := \"/userlogin/errorcount/\" + username\n\tval, err := redisObj.Get(ctx.GetContext(), key).Result()\n\tif err == redis.Nil {\n\t\treturn false, nil\n\t}\n\n\tif err != nil {\n\t\treturn false, err\n\t}\n\n\tc, err := strconv.ParseInt(val, 10, 64)\n\tif err != nil {\n\t\treturn false, err\n\t}\n\n\treturn c >= count, nil\n}\n\nfunc incrLoginFailCount(ctx *ctx.Context, redisObj storage.Redis, username string, seconds int64) {\n\tkey := \"/userlogin/errorcount/\" + username\n\tduration := time.Duration(seconds) * time.Second\n\n\tval, err := redisObj.Get(ctx.GetContext(), key).Result()\n\tif err == redis.Nil {\n\t\tredisObj.Set(ctx.GetContext(), key, \"1\", duration)\n\t\treturn\n\t}\n\n\tif err != nil {\n\t\tlogx.Warningf(ctx.Ctx, \"login_fail_count: failed to get redis value. key:%s, error:%s\", key, err)\n\t\tredisObj.Set(ctx.GetContext(), key, \"1\", duration)\n\t\treturn\n\t}\n\n\tcount, err := strconv.ParseInt(val, 10, 64)\n\tif err != nil {\n\t\tlogx.Warningf(ctx.Ctx, \"login_fail_count: failed to parse int64. key:%s, error:%s\", key, err)\n\t\tredisObj.Set(ctx.GetContext(), key, \"1\", duration)\n\t\treturn\n\t}\n\n\tcount++\n\tredisObj.Set(ctx.GetContext(), key, fmt.Sprintf(\"%d\", count), duration)\n}\n\nfunc PassLogin(ctx *ctx.Context, redis storage.Redis, username, pass string) (*User, error) {\n\t// 300 5 meaning: 300 seconds, 5 times\n\tval, err := ConfigsGet(ctx, \"login_fail_count\")\n\tif err != nil {\n\t\treturn nil, err\n\t}\n\n\tvar (\n\t\tneedCheck = val != \"\" // DB 里有配置,说明启用了这个 feature\n\t\tseconds int64\n\t\tcount int64\n\t)\n\n\tif needCheck {\n\t\tpair := strings.Fields(val)\n\t\tif len(pair) != 2 {\n\t\t\tlogx.Warningf(ctx.Ctx, \"login_fail_count config invalid: %s\", val)\n\t\t\tneedCheck = false\n\t\t} else {\n\t\t\tseconds, err = strconv.ParseInt(pair[0], 10, 64)\n\t\t\tif err != nil {\n\t\t\t\tlogx.Warningf(ctx.Ctx, \"login_fail_count seconds invalid: %s\", pair[0])\n\t\t\t\tneedCheck = false\n\t\t\t}\n\n\t\t\tcount, err = strconv.ParseInt(pair[1], 10, 64)\n\t\t\tif err != nil {\n\t\t\t\tlogx.Warningf(ctx.Ctx, \"login_fail_count count invalid: %s\", pair[1])\n\t\t\t\tneedCheck = false\n\t\t\t}\n\t\t}\n\t}\n\n\tif needCheck {\n\t\treach, err := reachLoginFailCount(ctx, redis, username, count)\n\t\tif err != nil {\n\t\t\treturn nil, err\n\t\t}\n\n\t\tif reach {\n\t\t\treturn nil, fmt.Errorf(\"reach login fail count\")\n\t\t}\n\t}\n\n\tuser, err := UserGetByUsername(ctx, username)\n\tif err != nil {\n\t\treturn nil, err\n\t}\n\n\tif user == nil {\n\t\tif needCheck {\n\t\t\tincrLoginFailCount(ctx, redis, username, seconds)\n\t\t}\n\n\t\treturn nil, fmt.Errorf(\"Username or password invalid\")\n\t}\n\n\tloginPass, err := CryptoPass(ctx, pass)\n\tif err != nil {\n\t\treturn nil, err\n\t}\n\n\tif loginPass != user.Password {\n\t\tif needCheck {\n\t\t\tincrLoginFailCount(ctx, redis, username, seconds)\n\t\t}\n\t\treturn nil, fmt.Errorf(\"Username or password invalid\")\n\t}\n\n\treturn user, nil\n}\n\nfunc UserTotal(ctx *ctx.Context, query string, stime, etime int64) (num int64, err error) {\n\tdb := DB(ctx).Model(&User{})\n\n\tif stime != 0 && etime != 0 {\n\t\tdb = db.Where(\"last_active_time between ? and ?\", stime, etime)\n\t}\n\n\tif query != \"\" {\n\t\tq := \"%\" + query + \"%\"\n\t\tnum, err = Count(db.Where(\"username like ? or nickname like ? or phone like ? or email like ?\", q, q, q, q))\n\t} else {\n\t\tnum, err = Count(db)\n\t}\n\n\tif err != nil {\n\t\treturn num, errors.WithMessage(err, \"failed to count user\")\n\t}\n\n\treturn num, nil\n}\n\nvar (\n\t// 预编译正则表达式,避免重复编译\n\twhitespaceRegex = regexp.MustCompile(`\\s+`)\n\tvalidOrderRegex = regexp.MustCompile(`^[a-zA-Z_][a-zA-Z0-9_]*(\\.[a-zA-Z_][a-zA-Z0-9_]*)?$`)\n)\n\nfunc validateOrderField(order string, defaultField string) string {\n\t// 空值检查\n\tif order == \"\" {\n\t\treturn defaultField\n\t}\n\n\t// 长度检查\n\tif len(order) > 64 {\n\t\tlogger.Warningf(\"SQL injection attempt detected: order field too long (%d chars)\", len(order))\n\t\treturn defaultField\n\t}\n\n\t// 移除所有空白字符\n\torder = whitespaceRegex.ReplaceAllString(order, \"\")\n\tif order == \"\" {\n\t\treturn defaultField\n\t}\n\n\t// 检查危险字符\n\torderLower := strings.ToLower(order)\n\tif strings.ContainsAny(order, \"();,'\\\"` --/*\\\\=+-*/><|&^~\") ||\n\t\tstrings.Contains(orderLower, \"0x\") || strings.Contains(orderLower, \"0b\") {\n\t\tlogger.Warningf(\"SQL injection attempt detected: contains dangerous characters\")\n\t\treturn defaultField\n\t}\n\n\t// 使用正则表达式验证格式:只允许字母开头的字段名,可选择性包含表名\n\tif !validOrderRegex.MatchString(order) {\n\t\tlogger.Warningf(\"SQL injection attempt detected: invalid order field format\")\n\t\treturn defaultField\n\t}\n\n\treturn order\n}\n\nfunc UserGets(ctx *ctx.Context, query string, limit, offset int, stime, etime int64,\n\torder string, desc bool, usernames, phones, emails []string) ([]User, error) {\n\n\tsession := DB(ctx)\n\n\tif stime != 0 && etime != 0 {\n\t\tsession = session.Where(\"last_active_time between ? and ?\", stime, etime)\n\t}\n\n\torder = validateOrderField(order, \"username\")\n\n\tif desc {\n\t\torder = order + \" desc\"\n\t} else {\n\t\torder = order + \" asc\"\n\t}\n\n\tsession = session.Order(order)\n\n\tif len(usernames) > 0 {\n\t\tsession = session.Where(\"username in (?)\", usernames)\n\t}\n\n\tif len(phones) > 0 {\n\t\tsession = session.Where(\"phone in (?)\", phones)\n\t}\n\n\tif len(emails) > 0 {\n\t\tsession = session.Where(\"email in (?)\", emails)\n\t}\n\n\tif query != \"\" {\n\t\tq := \"%\" + query + \"%\"\n\t\tsession = session.Where(\"username like ? or nickname like ? or phone like ? or email like ?\", q, q, q, q)\n\t}\n\n\tvar users []User\n\terr := session.Limit(limit).Offset(offset).Find(&users).Error\n\tif err != nil {\n\t\treturn users, errors.WithMessage(err, \"failed to query user\")\n\t}\n\n\tfor i := range users {\n\t\tusers[i].RolesLst = strings.Fields(users[i].Roles)\n\t\tusers[i].Admin = users[i].IsAdmin()\n\t\tusers[i].Password = \"\"\n\t\tusers[i].DecryptPhone() // 解密手机号\n\n\t\t// query for user group information\n\t\tvar userGroupIDs []int64\n\t\tuserGroupIDs, err = MyGroupIds(ctx, users[i].Id)\n\t\tif err != nil {\n\t\t\treturn users, errors.WithMessage(err, \"failed to query group_ids\")\n\t\t}\n\n\t\tif err = DB(ctx).Table(\"user_group\").Where(\"id IN (?)\", userGroupIDs).\n\t\t\tFind(&users[i].UserGroupsRes).Error; err != nil {\n\t\t\treturn users, errors.WithMessage(err, \"failed to query user_groups\")\n\t\t}\n\n\t\t// query business group information\n\t\tvar busiGroupIDs []int64\n\t\tbusiGroupIDs, err = BusiGroupIds(ctx, userGroupIDs)\n\t\tif err != nil {\n\t\t\treturn users, errors.WithMessage(err, \"failed to query busi_group_id\")\n\t\t}\n\n\t\tif err = DB(ctx).Table(\"busi_group\").Where(\"id IN (?)\", busiGroupIDs).\n\t\t\tFind(&users[i].BusiGroupsRes).Error; err != nil {\n\t\t\treturn users, errors.WithMessage(err, \"failed to query busi_groups\")\n\t\t}\n\t}\n\n\treturn users, nil\n}\n\nfunc UserGetAll(ctx *ctx.Context) ([]*User, error) {\n\tif !ctx.IsCenter {\n\t\tlst, err := poster.GetByUrls[[]*User](ctx, \"/v1/n9e/users\")\n\t\treturn lst, err\n\t}\n\n\tvar lst []*User\n\terr := DB(ctx).Find(&lst).Error\n\tif err == nil {\n\t\tfor i := 0; i < len(lst); i++ {\n\t\t\tlst[i].RolesLst = strings.Fields(lst[i].Roles)\n\t\t\tlst[i].Admin = lst[i].IsAdmin()\n\t\t\tlst[i].DecryptPhone() // 解密手机号\n\t\t}\n\t}\n\treturn lst, err\n}\n\nfunc UserGetsByIds(ctx *ctx.Context, ids []int64) ([]User, error) {\n\tif len(ids) == 0 {\n\t\treturn []User{}, nil\n\t}\n\n\tvar lst []User\n\terr := DB(ctx).Where(\"id in ?\", ids).Order(\"username\").Find(&lst).Error\n\tif err == nil {\n\t\tfor i := 0; i < len(lst); i++ {\n\t\t\tlst[i].RolesLst = strings.Fields(lst[i].Roles)\n\t\t\tlst[i].Admin = lst[i].IsAdmin()\n\t\t\tlst[i].DecryptPhone() // 解密手机号\n\t\t}\n\t}\n\n\treturn lst, err\n}\n\nfunc UserGetsBySso(ctx *ctx.Context, sso string) (map[string]*User, error) {\n\tsession := DB(ctx).Where(\"belong=?\", sso).Order(\"username\")\n\n\tvar users []User\n\terr := session.Find(&users).Error\n\tif err != nil {\n\t\treturn nil, errors.WithMessage(err, \"failed to query user\")\n\t}\n\n\tusersMap := make(map[string]*User, len(users))\n\tfor i, user := range users {\n\t\tusersMap[user.Username] = &users[i]\n\t}\n\n\treturn usersMap, nil\n}\n\nfunc UserDelByIds(ctx *ctx.Context, userIds []int64) error {\n\treturn DB(ctx).Transaction(func(tx *gorm.DB) error {\n\t\tif err := tx.Where(\"user_id in ?\", userIds).Delete(&UserGroupMember{}).Error; err != nil {\n\t\t\treturn err\n\t\t}\n\n\t\tif err := tx.Where(\"id in ?\", userIds).Delete(&User{}).Error; err != nil {\n\t\t\treturn err\n\t\t}\n\n\t\treturn nil\n\t})\n}\n\nfunc (u *User) CanModifyUserGroup(ctx *ctx.Context, ug *UserGroup) (bool, error) {\n\t// 我是管理员,自然可以\n\tif u.IsAdmin() {\n\t\treturn true, nil\n\t}\n\n\t// 我是创建者,自然可以\n\tif ug.CreateBy == u.Username {\n\t\treturn true, nil\n\t}\n\n\t// 我是成员,也可以吧,简单搞\n\tnum, err := UserGroupMemberCount(ctx, \"user_id=? and group_id=?\", u.Id, ug.Id)\n\tif err != nil {\n\t\treturn false, err\n\t}\n\n\treturn num > 0, nil\n}\n\nfunc (u *User) CanDoBusiGroup(ctx *ctx.Context, bg *BusiGroup, permFlag ...string) (bool, error) {\n\tif u.IsAdmin() {\n\t\treturn true, nil\n\t}\n\n\t// 我在任意一个UserGroup里,就有权限\n\tugids, err := UserGroupIdsOfBusiGroup(ctx, bg.Id, permFlag...)\n\tif err != nil {\n\t\treturn false, err\n\t}\n\n\tif len(ugids) == 0 {\n\t\treturn false, nil\n\t}\n\n\tnum, err := UserGroupMemberCount(ctx, \"user_id = ? and group_id in ?\", u.Id, ugids)\n\treturn num > 0, err\n}\n\nfunc (u *User) CheckPerm(ctx *ctx.Context, operation string) (bool, error) {\n\tif u.IsAdmin() {\n\t\treturn true, nil\n\t}\n\n\treturn RoleHasOperation(ctx, u.RolesLst, operation)\n}\n\nfunc UserStatistics(ctx *ctx.Context) (*Statistics, error) {\n\tif !ctx.IsCenter {\n\t\ts, err := poster.GetByUrls[*Statistics](ctx, \"/v1/n9e/statistic?name=user\")\n\t\treturn s, err\n\t}\n\n\tsession := DB(ctx).Model(&User{}).Select(\"count(*) as total\", \"max(update_at) as last_updated\")\n\n\tvar stats []*Statistics\n\terr := session.Find(&stats).Error\n\tif err != nil {\n\t\treturn nil, err\n\t}\n\n\treturn stats[0], nil\n}\n\nfunc (u *User) NopriIdents(ctx *ctx.Context, idents []string) ([]string, error) {\n\tif u.IsAdmin() {\n\t\treturn []string{}, nil\n\t}\n\n\tugids, err := MyGroupIds(ctx, u.Id)\n\tif err != nil {\n\t\treturn []string{}, err\n\t}\n\n\tif len(ugids) == 0 {\n\t\treturn idents, nil\n\t}\n\n\tbgids, err := BusiGroupIds(ctx, ugids, \"rw\")\n\tif err != nil {\n\t\treturn []string{}, err\n\t}\n\n\tif len(bgids) == 0 {\n\t\treturn idents, nil\n\t}\n\n\tvar allowedIdents []string\n\tsub := DB(ctx).Model(&Target{}).Distinct(\"target.ident\").\n\t\tJoins(\"join target_busi_group on target.ident = target_busi_group.target_ident\").\n\t\tWhere(\"target_busi_group.group_id in (?)\", bgids)\n\terr = DB(ctx).Model(&Target{}).Where(\"ident in (?)\", sub).Pluck(\"ident\", &allowedIdents).Error\n\tif err != nil {\n\t\treturn []string{}, err\n\t}\n\n\treturn slice.SubString(idents, allowedIdents), nil\n}\n\n// 我是管理员,返回所有\n// 或者我是成员\nfunc (u *User) BusiGroups(ctx *ctx.Context, limit int, query string, all ...bool) ([]BusiGroup, error) {\n\tsession := DB(ctx).Order(\"name\").Limit(limit)\n\n\tvar lst []BusiGroup\n\tif u.IsAdmin() || (len(all) > 0 && all[0]) {\n\t\terr := session.Where(\"name like ?\", \"%\"+query+\"%\").Find(&lst).Error\n\t\tif err != nil {\n\t\t\treturn lst, err\n\t\t}\n\n\t\tif len(lst) == 0 && len(query) > 0 {\n\t\t\t// 隐藏功能,一般人不告诉,哈哈。query可能是给的ident,所以上面的sql没有查到,当做ident来查一下试试\n\t\t\tvar t *Target\n\t\t\tt, err = TargetGet(ctx, \"ident=?\", query)\n\t\t\tif err != nil {\n\t\t\t\treturn lst, err\n\t\t\t}\n\n\t\t\tif t == nil {\n\t\t\t\treturn lst, nil\n\t\t\t}\n\n\t\t\tt.GroupIds, err = TargetGroupIdsGetByIdent(ctx, t.Ident)\n\t\t\tif err != nil {\n\t\t\t\treturn nil, err\n\t\t\t}\n\t\t\terr = DB(ctx).Order(\"name\").Limit(limit).Where(\"id in ?\", t.GroupIds).Find(&lst).Error\n\t\t}\n\n\t\treturn lst, err\n\t}\n\n\tuserGroupIds, err := MyGroupIds(ctx, u.Id)\n\tif err != nil {\n\t\treturn nil, errors.WithMessage(err, \"failed to get MyGroupIds\")\n\t}\n\n\tbusiGroupIds, err := BusiGroupIds(ctx, userGroupIds)\n\tif err != nil {\n\t\treturn nil, errors.WithMessage(err, \"failed to get BusiGroupIds\")\n\t}\n\n\tif len(busiGroupIds) == 0 {\n\t\treturn lst, nil\n\t}\n\n\terr = session.Where(\"id in ?\", busiGroupIds).Where(\"name like ?\", \"%\"+query+\"%\").Find(&lst).Error\n\tif err != nil {\n\t\treturn nil, err\n\t}\n\n\tif len(lst) == 0 && len(query) > 0 {\n\t\tvar t *Target\n\t\tt, err = TargetGet(ctx, \"ident=?\", query)\n\t\tif err != nil {\n\t\t\treturn lst, err\n\t\t}\n\n\t\tif t == nil {\n\t\t\treturn lst, nil\n\t\t}\n\n\t\tt.GroupIds, err = TargetGroupIdsGetByIdent(ctx, t.Ident)\n\t\tif err != nil {\n\t\t\treturn nil, err\n\t\t}\n\t\tif t != nil && t.MatchGroupId(busiGroupIds...) {\n\t\t\terr = DB(ctx).Order(\"name\").Limit(limit).Where(\"id in ?\", t.GroupIds).Find(&lst).Error\n\t\t}\n\t}\n\n\treturn lst, err\n}\n\nfunc (u *User) UserGroups(ctx *ctx.Context, limit int, query string) ([]UserGroup, error) {\n\tsession := DB(ctx).Order(\"name\").Limit(limit)\n\n\tvar lst []UserGroup\n\tif u.IsAdmin() {\n\t\terr := session.Where(\"name like ?\", \"%\"+query+\"%\").Find(&lst).Error\n\t\tif err != nil {\n\t\t\treturn lst, err\n\t\t}\n\n\t\tvar user *User\n\t\tif len(lst) == 0 && len(query) > 0 {\n\t\t\t// 隐藏功能,一般人不告诉,哈哈。query可能是给的用户名,所以上面的sql没有查到,当做user来查一下试试\n\t\t\tuser, err = UserGetByUsername(ctx, query)\n\t\t\tif user == nil {\n\t\t\t\treturn lst, err\n\t\t\t}\n\t\t\tvar ids []int64\n\t\t\tids, err = MyGroupIds(ctx, user.Id)\n\t\t\tif err != nil || len(ids) == 0 {\n\t\t\t\treturn lst, err\n\t\t\t}\n\t\t\tlst, err = UserGroupGetByIds(ctx, ids)\n\t\t}\n\t\treturn lst, err\n\t}\n\n\tids, err := MyGroupIds(ctx, u.Id)\n\tif err != nil {\n\t\treturn nil, errors.WithMessage(err, \"failed to get MyGroupIds\")\n\t}\n\n\tif len(ids) > 0 {\n\t\tsession = session.Where(\"id in ? or create_by = ?\", ids, u.Username)\n\t} else {\n\t\tsession = session.Where(\"create_by = ?\", u.Username)\n\t}\n\n\tif len(query) > 0 {\n\t\tsession = session.Where(\"name like ?\", \"%\"+query+\"%\")\n\t}\n\n\terr = session.Find(&lst).Error\n\treturn lst, err\n}\n\nfunc (u *User) ExtractToken(key string) (string, bool) {\n\tbs, err := u.Contacts.MarshalJSON()\n\tif err != nil {\n\t\tlogger.Errorf(\"handle_notice: failed to marshal contacts: %v\", err)\n\t\treturn \"\", false\n\t}\n\n\tswitch key {\n\tcase Dingtalk:\n\t\tret := gjson.GetBytes(bs, DingtalkKey)\n\t\treturn ret.String(), ret.Exists()\n\tcase Wecom:\n\t\tret := gjson.GetBytes(bs, WecomKey)\n\t\treturn ret.String(), ret.Exists()\n\tcase Feishu, FeishuCard:\n\t\tret := gjson.GetBytes(bs, FeishuKey)\n\t\treturn ret.String(), ret.Exists()\n\tcase Mm:\n\t\tret := gjson.GetBytes(bs, MmKey)\n\t\treturn ret.String(), ret.Exists()\n\tcase Telegram:\n\t\tret := gjson.GetBytes(bs, TelegramKey)\n\t\treturn ret.String(), ret.Exists()\n\tcase Email:\n\t\treturn u.Email, u.Email != \"\"\n\tcase Lark, LarkCard:\n\t\tret := gjson.GetBytes(bs, LarkKey)\n\t\treturn ret.String(), ret.Exists()\n\tcase Phone:\n\t\treturn u.Phone, u.Phone != \"\"\n\tdefault:\n\t\tret := gjson.GetBytes(bs, key)\n\t\treturn ret.String(), ret.Exists()\n\t}\n}\n\nfunc (u *User) FindSameContact(email, phone string) string {\n\tif u.Email != \"\" && u.Email == email {\n\t\treturn \"email\"\n\t}\n\n\tif u.Phone != \"\" && u.Phone == phone {\n\t\treturn \"phone\"\n\t}\n\n\treturn \"\"\n}\n\n// AddUserAndGroups Add a user and add it to multiple groups in a single transaction\nfunc (u *User) AddUserAndGroups(ctx *ctx.Context, coverTeams bool) error {\n\n\t// Try to add a user\n\tif err := u.Add(ctx); err != nil {\n\t\treturn errors.WithMessage(err, \"failed to add user\")\n\t}\n\n\t// Try to add a group for the user\n\tif err := UserGroupMemberSyncByUser(ctx, u, coverTeams); err != nil {\n\t\treturn errors.WithMessage(err, \"failed to add user to groups\")\n\t}\n\n\treturn nil\n}\n\nfunc (u *User) EncryptPhone() (err error) {\n\t// 从缓存获取手机号加密配置\n\tenabled, publicKey, _, _, loaded := GetPhoneEncryptionConfigFromCache()\n\tif !loaded {\n\t\t// 如果缓存未加载,记录日志但不阻止保存\n\t\tlogger.Infof(\"Phone encryption config cache not loaded, user: %s\", u.Username)\n\t\treturn nil\n\t}\n\n\t// 检查是否启用了手机号加密\n\tif enabled && u.Phone != \"\" {\n\t\t// 检查手机号是否已经加密(避免重复加密)\n\t\tif len(u.Phone) > 4 && u.Phone[:4] == \"enc:\" {\n\t\t\t// 已经加密,跳过\n\t\t\treturn nil\n\t\t}\n\n\t\tencryptedPhone, err := secu.EncryptValue(u.Phone, publicKey)\n\t\tif err != nil {\n\t\t\tlogger.Warningf(\"Failed to encrypt phone: %v, user: %s\", err, u.Username)\n\t\t\treturn nil\n\t\t}\n\n\t\tu.Phone = encryptedPhone\n\t}\n\treturn nil\n}\n\n// DecryptPhone 解密用户手机号(如果已加密)\nfunc (u *User) DecryptPhone() {\n\tif u.Phone == \"\" {\n\t\treturn\n\t}\n\n\t// 检查手机号是否是加密格式(有 \"enc:\" 前缀)\n\tif len(u.Phone) <= 4 || u.Phone[:4] != \"enc:\" {\n\t\t// 不是加密格式,不需要解密\n\t\treturn\n\t}\n\n\t// 从缓存获取手机号加密配置\n\tenabled, _, privateKey, password, loaded := GetPhoneEncryptionConfigFromCache()\n\tif !loaded || !enabled {\n\t\t// 如果缓存未加载或未启用加密,不解密\n\t\treturn\n\t}\n\n\t// 对手机号进行解密\n\tdecryptedPhone, err := secu.Decrypt(u.Phone, privateKey, password)\n\tif err != nil {\n\t\t// 如果解密失败,记录错误但保持原样\n\t\tlogger.Warningf(\"Failed to decrypt phone for user %s: %v\", u.Username, err)\n\t\treturn\n\t}\n\tu.Phone = decryptedPhone\n}\n"
},
{
"path": "models/user_group.go",
"content": "package models\n\nimport (\n\t\"time\"\n\n\t\"github.com/ccfos/nightingale/v6/pkg/ctx\"\n\t\"github.com/ccfos/nightingale/v6/pkg/poster\"\n\n\t\"github.com/pkg/errors\"\n\t\"github.com/toolkits/pkg/str\"\n\t\"gorm.io/gorm\"\n)\n\ntype UserGroup struct {\n\tId int64 `json:\"id\" gorm:\"primaryKey\"`\n\tName string `json:\"name\"`\n\tNote string `json:\"note\"`\n\tCreateAt int64 `json:\"create_at\"`\n\tCreateBy string `json:\"create_by\"`\n\tUpdateAt int64 `json:\"update_at\"`\n\tUpdateBy string `json:\"update_by\"`\n\tUpdateByNickname string `json:\"update_by_nickname\" gorm:\"-\"`\n\tUserIds []int64 `json:\"-\" gorm:\"-\"`\n\tUsers []User `json:\"users\" gorm:\"-\"`\n\tBusiGroups []*BusiGroup `json:\"busi_groups\" gorm:\"-\"`\n}\n\nfunc (ug *UserGroup) TableName() string {\n\treturn \"user_group\"\n}\n\nfunc (ug *UserGroup) Verify() error {\n\tif str.Dangerous(ug.Name) {\n\t\treturn errors.New(\"Name has invalid characters\")\n\t}\n\n\tif str.Dangerous(ug.Note) {\n\t\treturn errors.New(\"Note has invalid characters\")\n\t}\n\n\treturn nil\n}\n\nfunc (ug *UserGroup) Update(ctx *ctx.Context, selectField interface{}, selectFields ...interface{}) error {\n\tif err := ug.Verify(); err != nil {\n\t\treturn err\n\t}\n\n\treturn DB(ctx).Model(ug).Select(selectField, selectFields...).Updates(ug).Error\n}\n\nfunc UserGroupCount(ctx *ctx.Context, where string, args ...interface{}) (num int64, err error) {\n\treturn Count(DB(ctx).Model(&UserGroup{}).Where(where, args...))\n}\n\nfunc (ug *UserGroup) Add(ctx *ctx.Context) error {\n\tif err := ug.Verify(); err != nil {\n\t\treturn err\n\t}\n\n\tnum, err := UserGroupCount(ctx, \"name=?\", ug.Name)\n\tif err != nil {\n\t\treturn errors.WithMessage(err, \"failed to count user-groups\")\n\t}\n\n\tif num > 0 {\n\t\treturn errors.New(\"UserGroup already exists\")\n\t}\n\n\tnow := time.Now().Unix()\n\tug.CreateAt = now\n\tug.UpdateAt = now\n\treturn Insert(ctx, ug)\n}\n\nfunc (ug *UserGroup) Del(ctx *ctx.Context) error {\n\treturn DB(ctx).Transaction(func(tx *gorm.DB) error {\n\t\tif err := tx.Where(\"group_id=?\", ug.Id).Delete(&UserGroupMember{}).Error; err != nil {\n\t\t\treturn err\n\t\t}\n\n\t\tif err := tx.Where(\"id=?\", ug.Id).Delete(&UserGroup{}).Error; err != nil {\n\t\t\treturn err\n\t\t}\n\n\t\treturn nil\n\t})\n}\n\nfunc UserGroupGet(ctx *ctx.Context, where string, args ...interface{}) (*UserGroup, error) {\n\tvar lst []*UserGroup\n\terr := DB(ctx).Where(where, args...).Find(&lst).Error\n\tif err != nil {\n\t\treturn nil, err\n\t}\n\n\tif len(lst) == 0 {\n\t\treturn nil, nil\n\t}\n\n\treturn lst[0], nil\n}\n\nfunc UserGroupGetById(ctx *ctx.Context, id int64) (*UserGroup, error) {\n\treturn UserGroupGet(ctx, \"id = ?\", id)\n}\n\nfunc UserGroupGetByIds(ctx *ctx.Context, ids []int64) ([]UserGroup, error) {\n\tvar lst []UserGroup\n\tif len(ids) == 0 {\n\t\treturn lst, nil\n\t}\n\n\terr := DB(ctx).Where(\"id in ?\", ids).Order(\"name\").Find(&lst).Error\n\treturn lst, err\n}\n\nfunc UserGroupIdAndNameMap(ctx *ctx.Context, ids []int64) (map[int64]string, error) {\n\tlst, err := UserGroupGetByIds(ctx, ids)\n\tif err != nil {\n\t\treturn nil, err\n\t}\n\n\tm := make(map[int64]string)\n\tfor _, ug := range lst {\n\t\tm[ug.Id] = ug.Name\n\t}\n\treturn m, nil\n}\n\nfunc UserGroupGetAll(ctx *ctx.Context) ([]*UserGroup, error) {\n\tif !ctx.IsCenter {\n\t\tlst, err := poster.GetByUrls[[]*UserGroup](ctx, \"/v1/n9e/user-groups\")\n\t\treturn lst, err\n\t}\n\n\tvar lst []*UserGroup\n\terr := DB(ctx).Find(&lst).Error\n\treturn lst, err\n}\n\nfunc (ug *UserGroup) AddMembers(ctx *ctx.Context, userIds []int64) error {\n\tcount := len(userIds)\n\tfor i := 0; i < count; i++ {\n\t\tuser, err := UserGetById(ctx, userIds[i])\n\t\tif err != nil {\n\t\t\treturn err\n\t\t}\n\t\tif user == nil {\n\t\t\tcontinue\n\t\t}\n\t\terr = UserGroupMemberAdd(ctx, ug.Id, user.Id)\n\t\tif err != nil {\n\t\t\treturn err\n\t\t}\n\t}\n\treturn nil\n}\n\nfunc (ug *UserGroup) DelMembers(ctx *ctx.Context, userIds []int64) error {\n\treturn UserGroupMemberDel(ctx, ug.Id, userIds)\n}\n\nfunc UserGroupStatistics(ctx *ctx.Context) (*Statistics, error) {\n\tif !ctx.IsCenter {\n\t\ts, err := poster.GetByUrls[*Statistics](ctx, \"/v1/n9e/statistic?name=user_group\")\n\t\treturn s, err\n\t}\n\n\tsession := DB(ctx).Model(&UserGroup{}).Select(\"count(*) as total\", \"max(update_at) as last_updated\")\n\n\tvar stats []*Statistics\n\terr := session.Find(&stats).Error\n\tif err != nil {\n\t\treturn nil, err\n\t}\n\n\treturn stats[0], nil\n}\n"
},
{
"path": "models/user_group_member.go",
"content": "package models\n\nimport (\n\t\"github.com/ccfos/nightingale/v6/pkg/ctx\"\n\t\"github.com/ccfos/nightingale/v6/pkg/poster\"\n\n\t\"github.com/toolkits/pkg/logger\"\n)\n\ntype UserGroupMember struct {\n\tGroupId int64\n\tUserId int64\n}\n\nfunc (UserGroupMember) TableName() string {\n\treturn \"user_group_member\"\n}\n\nfunc MyGroupIds(ctx *ctx.Context, userId int64) ([]int64, error) {\n\tvar ids []int64\n\terr := DB(ctx).Model(&UserGroupMember{}).Where(\"user_id=?\", userId).Pluck(\"group_id\", &ids).Error\n\treturn ids, err\n}\n\nfunc MyGroupIdsMap(ctx *ctx.Context, userId int64) (map[int64]struct{}, error) {\n\tids, err := MyGroupIds(ctx, userId)\n\tif err != nil {\n\t\treturn nil, err\n\t}\n\n\tres := make(map[int64]struct{}, len(ids))\n\tfor _, id := range ids {\n\t\tres[id] = struct{}{}\n\t}\n\n\treturn res, nil\n}\n\n// my business group ids\nfunc MyBusiGroupIds(ctx *ctx.Context, userId int64) ([]int64, error) {\n\tgroupIds, err := MyGroupIds(ctx, userId)\n\tif err != nil {\n\t\treturn []int64{}, err\n\t}\n\n\treturn BusiGroupIds(ctx, groupIds)\n}\n\nfunc MemberIds(ctx *ctx.Context, groupId int64) ([]int64, error) {\n\tvar ids []int64\n\terr := DB(ctx).Model(&UserGroupMember{}).Where(\"group_id=?\", groupId).Pluck(\"user_id\", &ids).Error\n\treturn ids, err\n}\n\nfunc GroupsMemberIds(ctx *ctx.Context, groupIds []int64) ([]int64, error) {\n\tvar ids []int64\n\terr := DB(ctx).Model(&UserGroupMember{}).Where(\"group_id in ?\", groupIds).Pluck(\"user_id\", &ids).Error\n\treturn ids, err\n}\n\nfunc UserGroupMemberCount(ctx *ctx.Context, where string, args ...interface{}) (int64, error) {\n\treturn Count(DB(ctx).Model(&UserGroupMember{}).Where(where, args...))\n}\n\nfunc UserGroupMemberAdd(ctx *ctx.Context, groupId, userId int64) error {\n\tnum, err := UserGroupMemberCount(ctx, \"user_id=? and group_id=?\", userId, groupId)\n\tif err != nil {\n\t\treturn err\n\t}\n\n\tif num > 0 {\n\t\t// already exists\n\t\treturn nil\n\t}\n\n\tobj := UserGroupMember{\n\t\tGroupId: groupId,\n\t\tUserId: userId,\n\t}\n\n\treturn Insert(ctx, obj)\n}\n\nfunc UserGroupMemberDel(ctx *ctx.Context, groupId int64, userIds []int64) error {\n\tif len(userIds) == 0 {\n\t\treturn nil\n\t}\n\n\treturn DB(ctx).Where(\"group_id = ? and user_id in ?\", groupId, userIds).Delete(&UserGroupMember{}).Error\n}\n\nfunc UserGroupMemberGetAll(ctx *ctx.Context) ([]*UserGroupMember, error) {\n\tif !ctx.IsCenter {\n\t\tlst, err := poster.GetByUrls[[]*UserGroupMember](ctx, \"/v1/n9e/user-group-members\")\n\t\treturn lst, err\n\t}\n\n\tvar lst []*UserGroupMember\n\terr := DB(ctx).Find(&lst).Error\n\treturn lst, err\n}\n\n// UserGroupMemberSync Sync group information, incrementally adding or overwriting deletes\nfunc UserGroupMemberSync(ctx *ctx.Context, ldapGids []int64, userId int64, coverTeams bool) error {\n\tif len(ldapGids) == 0 {\n\t\tif coverTeams {\n\t\t\t// If the user is not in any group, delete all the groups that the user is currently in\n\t\t\treturn DB(ctx).Where(\"user_id = ?\", userId).Delete(&UserGroupMember{}).Error\n\t\t}\n\n\t\treturn nil\n\t}\n\n\t// queries all the groups that the user is currently in\n\tcurGids, err := MyGroupIds(ctx, userId)\n\tif err != nil {\n\t\treturn err\n\t}\n\n\tcurGidsCount := len(curGids)\n\tcurGidSet := slice2Set(curGids) // All the current groups Set\n\ttoInsert := make([]UserGroupMember, 0, curGidsCount) // Will be added\n\n\t// Prepare data for bulk insertion\n\tfor _, gid := range ldapGids {\n\t\tif !curGidSet[gid] {\n\t\t\t// Add only groups where the user does not already exist\n\t\t\ttoInsert = append(toInsert, UserGroupMember{GroupId: gid, UserId: userId})\n\t\t\tcurGidSet[gid] = true\n\t\t}\n\t}\n\n\tif len(toInsert) > 0 {\n\t\terr = DB(ctx).CreateInBatches(toInsert, 10).Error\n\t\tif err != nil {\n\t\t\tlogger.Warningf(\"failed to insert user(%d) group member err: %+v\", userId, err)\n\t\t}\n\t}\n\n\tif !coverTeams || len(curGids) == 0 {\n\t\treturn nil\n\t}\n\n\t// 需要将用户在 ldap 中没有, n9e 中有的团队删除\n\tldapGidSet := slice2Set(ldapGids)\n\ttoDeleteIds := make([]int64, 0, curGidsCount)\n\n\tfor _, gid := range curGids {\n\t\tif !ldapGidSet[gid] {\n\t\t\ttoDeleteIds = append(toDeleteIds, gid)\n\t\t\tldapGidSet[gid] = true\n\t\t}\n\t}\n\n\tif len(toDeleteIds) == 0 {\n\t\treturn nil\n\t}\n\n\treturn DB(ctx).Where(\"user_id = ? AND group_id IN ?\", userId, toDeleteIds).\n\t\tDelete(&UserGroupMember{}).Error\n}\n\nfunc UserGroupMemberSyncByUser(ctx *ctx.Context, user *User, coverTeams bool) error {\n\tif user == nil {\n\t\treturn nil\n\t}\n\n\treturn UserGroupMemberSync(ctx, user.TeamsLst, user.Id, coverTeams)\n}\n\nfunc slice2Set[T comparable](s []T) map[T]bool {\n\tm := make(map[T]bool, len(s))\n\tfor _, item := range s {\n\t\tm[item] = true\n\t}\n\n\treturn m\n}\n"
},
{
"path": "models/user_token.go",
"content": "package models\n\nimport (\n\t\"time\"\n\n\t\"github.com/ccfos/nightingale/v6/pkg/ctx\"\n)\n\ntype UserToken struct {\n\tId int64 `json:\"id\" gorm:\"primaryKey\"`\n\tUsername string `json:\"username\" gorm:\"type:varchar(255); not null; default ''\"`\n\tTokenName string `json:\"token_name\" gorm:\"type:varchar(255); not null; default ''\"`\n\tToken string `json:\"token\" gorm:\"type:varchar(255); not null; default ''\"`\n\tCreateAt int64 `json:\"create_at\" gorm:\"type:bigint; not null; default 0\"`\n\tLastUsed int64 `json:\"last_used\" gorm:\"type:bigint; not null; default 0\"`\n}\n\nfunc (UserToken) TableName() string {\n\treturn \"user_token\"\n}\n\nfunc CountToken(ctx *ctx.Context, username string) (int64, error) {\n\tvar count int64\n\terr := DB(ctx).Model(&UserToken{}).Where(\"username = ?\", username).Count(&count).Error\n\treturn count, err\n}\n\nfunc AddToken(ctx *ctx.Context, username, token, tokenName string) (*UserToken, error) {\n\tnewToken := UserToken{\n\t\tTokenName: tokenName,\n\t\tUsername: username,\n\t\tToken: token,\n\t\tCreateAt: time.Now().Unix(),\n\t}\n\n\terr := Insert(ctx, &newToken)\n\treturn &newToken, err\n}\n\nfunc DeleteToken(ctx *ctx.Context, id int64) error {\n\terr := DB(ctx).Where(\"id = ?\", id).Delete(&UserToken{}).Error\n\treturn err\n}\n\nfunc GetTokensByUsername(ctx *ctx.Context, username string) ([]UserToken, error) {\n\tvar tokens []UserToken\n\terr := DB(ctx).Where(\"username = ?\", username).Find(&tokens).Error\n\treturn tokens, err\n}\n\nfunc UserTokenGetAll(ctx *ctx.Context) ([]*UserToken, error) {\n\tvar lst []*UserToken\n\terr := DB(ctx).Find(&lst).Error\n\treturn lst, err\n}\n\nfunc UserTokenTotal(ctx *ctx.Context) (int64, error) {\n\tvar total int64\n\terr := DB(ctx).Model(&UserToken{}).Count(&total).Error\n\treturn total, err\n}\n\nfunc UserTokenUpdateLastUsedTime(ctx *ctx.Context, token string, lastUsedTime int64) error {\n\treturn DB(ctx).Model(&UserToken{}).Where(\"token = ?\", token).Update(\"last_used\", lastUsedTime).Error\n}\n"
},
{
"path": "models/workflow.go",
"content": "package models\n\n// WorkflowNode 工作流节点\ntype WorkflowNode struct {\n\tID string `json:\"id\"` // 节点唯一ID\n\tName string `json:\"name\"` // 显示名称\n\tType string `json:\"type\"` // 节点类型(对应 Processor typ)\n\tPosition []float64 `json:\"position,omitempty\"` // [x, y] UI位置\n\tConfig interface{} `json:\"config\"` // 节点配置\n\n\t// 执行控制\n\tDisabled bool `json:\"disabled,omitempty\"`\n\tContinueOnFail bool `json:\"continue_on_fail,omitempty\"`\n\tRetryOnFail bool `json:\"retry_on_fail,omitempty\"`\n\tMaxRetries int `json:\"max_retries,omitempty\"`\n\tRetryInterval int `json:\"retry_interval,omitempty\"` // 秒\n}\n\n// Connections 节点连接关系 map[源节点ID]NodeConnections\ntype Connections map[string]NodeConnections\n\n// NodeConnections 单个节点的输出连接\ntype NodeConnections struct {\n\t// Main 输出端口的连接\n\t// Main[outputIndex] = []ConnectionTarget\n\tMain [][]ConnectionTarget `json:\"main\"`\n}\n\n// ConnectionTarget 连接目标\ntype ConnectionTarget struct {\n\tNode string `json:\"node\"` // 目标节点ID\n\tType string `json:\"type\"` // 输入类型,通常是 \"main\"\n\tIndex int `json:\"index\"` // 目标节点的输入端口索引\n}\n\n// InputVariable 输入参数\ntype InputVariable struct {\n\tKey string `json:\"key\"` // 变量名\n\tValue string `json:\"value\"` // 默认值\n\tDescription string `json:\"description,omitempty\"` // 描述\n}\n\n// NodeOutput 节点执行输出\ntype NodeOutput struct {\n\tWfCtx *WorkflowContext `json:\"wf_ctx\"` // 处理后的工作流上下文\n\tMessage string `json:\"message\"` // 处理消息\n\tTerminate bool `json:\"terminate\"` // 是否终止流程\n\tBranchIndex *int `json:\"branch_index,omitempty\"` // 分支索引(条件节点使用)\n\n\t// 流式输出支持\n\tStream bool `json:\"stream,omitempty\"` // 是否流式输出\n\tStreamChan chan *StreamChunk `json:\"-\"` // 流式数据通道(不序列化)\n}\n\n// WorkflowResult 工作流执行结果\ntype WorkflowResult struct {\n\tEvent *AlertCurEvent `json:\"event\"` // 最终事件\n\tStatus string `json:\"status\"` // success, failed, streaming\n\tMessage string `json:\"message\"` // 汇总消息\n\tNodeResults []*NodeExecutionResult `json:\"node_results\"` // 各节点执行结果\n\tErrorNode string `json:\"error_node,omitempty\"`\n\n\t// 流式输出支持\n\tStream bool `json:\"stream,omitempty\"` // 是否流式输出\n\tStreamChan chan *StreamChunk `json:\"-\"` // 流式数据通道(不序列化)\n}\n\n// NodeExecutionResult 节点执行结果\ntype NodeExecutionResult struct {\n\tNodeID string `json:\"node_id\"`\n\tNodeName string `json:\"node_name\"`\n\tNodeType string `json:\"node_type\"`\n\tStatus string `json:\"status\"` // success, failed, skipped\n\tMessage string `json:\"message\"`\n\tStartedAt int64 `json:\"started_at\"`\n\tFinishedAt int64 `json:\"finished_at\"`\n\tDurationMs int64 `json:\"duration_ms\"`\n\tError string `json:\"error,omitempty\"`\n\tBranchIndex *int `json:\"branch_index,omitempty\"` // 条件节点的分支选择\n}\n\n// 触发模式常量\nconst (\n\tTriggerModeEvent = \"event\" // 告警事件触发\n\tTriggerModeAPI = \"api\" // API 触发\n\tTriggerModeCron = \"cron\" // 定时触发(后续支持)\n)\n\nconst (\n\tUseCaseEventPipeline = \"event_pipeline\"\n\tUseCaseEventSummary = \"firemap\"\n)\n\n// WorkflowTriggerContext 工作流触发上下文\ntype WorkflowTriggerContext struct {\n\t// 触发模式\n\tMode string `json:\"mode\"`\n\n\t// 触发者\n\tTriggerBy string `json:\"trigger_by\"`\n\n\t// 请求ID(API/Cron 触发使用)\n\tRequestID string `json:\"request_id\"`\n\n\t// 输入参数覆盖\n\tInputsOverrides map[string]string `json:\"inputs_overrides\"`\n\n\t// 流式输出(API 调用时动态指定)\n\tStream bool `json:\"stream\"`\n\n\t// Cron 相关(后续使用)\n\tCronJobID string `json:\"cron_job_id,omitempty\"`\n\tCronExpr string `json:\"cron_expr,omitempty\"`\n\tScheduledAt int64 `json:\"scheduled_at,omitempty\"`\n}\n\ntype WorkflowContext struct {\n\tEvent *AlertCurEvent `json:\"event\"` // 当前事件\n\tInputs map[string]string `json:\"inputs\"` // 前置输入参数(静态,用户配置)\n\tVars map[string]interface{} `json:\"vars\"` // 节点间传递的数据(动态,运行时产生)\n\tMetadata map[string]string `json:\"metadata\"` // 执行元数据(request_id、start_time 等)\n\tOutput map[string]interface{} `json:\"output,omitempty\"` // 输出结果(非告警场景使用)\n\n\t// 流式输出支持\n\tStream bool `json:\"-\"` // 是否启用流式输出(不序列化)\n\tStreamChan chan *StreamChunk `json:\"-\"` // 流式数据通道(不序列化)\n}\n\n// StreamChunk 类型常量\nconst (\n\tStreamTypeThinking = \"thinking\" // AI 思考过程(ReAct Thought)\n\tStreamTypeToolCall = \"tool_call\" // 工具调用\n\tStreamTypeToolResult = \"tool_result\" // 工具执行结果\n\tStreamTypeText = \"text\" // LLM 文本输出\n\tStreamTypeDone = \"done\" // 完成\n\tStreamTypeError = \"error\" // 错误\n)\n\n// StreamChunk 流式数据块\ntype StreamChunk struct {\n\tType string `json:\"type\"` // thinking / tool_call / tool_result / text / done / error\n\tContent string `json:\"content\"` // 完整内容(累积)\n\tDelta string `json:\"delta,omitempty\"` // 增量内容\n\tNodeID string `json:\"node_id,omitempty\"` // 当前节点 ID\n\tRequestID string `json:\"request_id,omitempty\"` // 请求追踪 ID\n\tMetadata interface{} `json:\"metadata,omitempty\"` // 额外元数据(如工具调用参数)\n\tDone bool `json:\"done\"` // 是否结束\n\tError string `json:\"error,omitempty\"` // 错误信息\n\tTimestamp int64 `json:\"timestamp\"` // 时间戳(毫秒)\n}\n"
},
{
"path": "pkg/aop/log.go",
"content": "package aop\n\nimport (\n\t\"bytes\"\n\t\"compress/gzip\"\n\t\"fmt\"\n\t\"io\"\n\t\"net/http\"\n\t\"os\"\n\t\"strings\"\n\t\"time\"\n\n\t\"github.com/gin-gonic/gin\"\n\t\"github.com/mattn/go-isatty\"\n\t\"github.com/toolkits/pkg/logger\"\n)\n\ntype consoleColorModeValue int\n\nconst (\n\tautoColor consoleColorModeValue = iota\n\tdisableColor\n\tforceColor\n)\n\nvar (\n\tgreen = string([]byte{27, 91, 57, 55, 59, 52, 50, 109})\n\twhite = string([]byte{27, 91, 57, 48, 59, 52, 55, 109})\n\tyellow = string([]byte{27, 91, 57, 48, 59, 52, 51, 109})\n\tred = string([]byte{27, 91, 57, 55, 59, 52, 49, 109})\n\tblue = string([]byte{27, 91, 57, 55, 59, 52, 52, 109})\n\tmagenta = string([]byte{27, 91, 57, 55, 59, 52, 53, 109})\n\tcyan = string([]byte{27, 91, 57, 55, 59, 52, 54, 109})\n\treset = string([]byte{27, 91, 48, 109})\n\tconsoleColorMode = autoColor\n)\n\n// LoggerConfig defines the config for Logger middleware.\ntype LoggerConfig struct {\n\t// Optional. Default value is gin.defaultLogFormatter\n\tFormatter LogFormatter\n\n\t// Output is a writer where logs are written.\n\t// Optional. Default value is gin.DefaultWriter.\n\tOutput io.Writer\n\tPrintAccessLog func() bool\n\tPrintBodyPaths func() map[string]struct{}\n\n\t// SkipPaths is a url path array which logs are not written.\n\t// Optional.\n\tSkipPaths []string\n}\n\nfunc (c *LoggerConfig) ContainsPath(path string) bool {\n\tpath = strings.Split(path, \"?\")[0]\n\t_, exist := c.PrintBodyPaths()[path]\n\treturn exist\n}\n\n// LogFormatter gives the signature of the formatter function passed to LoggerWithFormatter\ntype LogFormatter func(params LogFormatterParams) string\n\n// LogFormatterParams is the structure any formatter will be handed when time to log comes\ntype LogFormatterParams struct {\n\tRequest *http.Request\n\n\t// TimeStamp shows the time after the server returns a response.\n\tTimeStamp time.Time\n\t// StatusCode is HTTP response code.\n\tStatusCode int\n\t// Latency is how much time the server cost to process a certain request.\n\tLatency time.Duration\n\t// ClientIP equals Context's ClientIP method.\n\tClientIP string\n\t// Method is the HTTP method given to the request.\n\tMethod string\n\t// Path is a path the client requests.\n\tPath string\n\t// ErrorMessage is set if error has occurred in processing the request.\n\tErrorMessage string\n\t// isTerm shows whether does gin's output descriptor refers to a terminal.\n\tisTerm bool\n\t// BodySize is the size of the Response Body\n\tBodySize int\n\t// Keys are the keys set on the request's context.\n\tKeys map[string]interface{}\n}\n\n// StatusCodeColor is the ANSI color for appropriately logging http status code to a terminal.\nfunc (p *LogFormatterParams) StatusCodeColor() string {\n\tcode := p.StatusCode\n\n\tswitch {\n\tcase code >= http.StatusOK && code < http.StatusMultipleChoices:\n\t\treturn green\n\tcase code >= http.StatusMultipleChoices && code < http.StatusBadRequest:\n\t\treturn white\n\tcase code >= http.StatusBadRequest && code < http.StatusInternalServerError:\n\t\treturn yellow\n\tdefault:\n\t\treturn red\n\t}\n}\n\n// MethodColor is the ANSI color for appropriately logging http method to a terminal.\nfunc (p *LogFormatterParams) MethodColor() string {\n\tmethod := p.Method\n\n\tswitch method {\n\tcase \"GET\":\n\t\treturn blue\n\tcase \"POST\":\n\t\treturn cyan\n\tcase \"PUT\":\n\t\treturn yellow\n\tcase \"DELETE\":\n\t\treturn red\n\tcase \"PATCH\":\n\t\treturn green\n\tcase \"HEAD\":\n\t\treturn magenta\n\tcase \"OPTIONS\":\n\t\treturn white\n\tdefault:\n\t\treturn reset\n\t}\n}\n\n// ResetColor resets all escape attributes.\nfunc (p *LogFormatterParams) ResetColor() string {\n\treturn reset\n}\n\n// IsOutputColor indicates whether can colors be outputted to the log.\nfunc (p *LogFormatterParams) IsOutputColor() bool {\n\treturn consoleColorMode == forceColor || (consoleColorMode == autoColor && p.isTerm)\n}\n\n// defaultLogFormatter is the default log format function Logger middleware uses.\nvar defaultLogFormatter = func(param LogFormatterParams) string {\n\tvar statusColor, methodColor, resetColor string\n\tif param.IsOutputColor() {\n\t\tstatusColor = param.StatusCodeColor()\n\t\tmethodColor = param.MethodColor()\n\t\tresetColor = param.ResetColor()\n\t}\n\n\tif param.Latency > time.Minute {\n\t\t// Truncate in a golang < 1.8 safe way\n\t\tparam.Latency = param.Latency - param.Latency%time.Second\n\t}\n\treturn fmt.Sprintf(\"[GIN] |%s %3d %s| %13v | %15s |%s %-7s %s %s\\n%s\",\n\t\tstatusColor, param.StatusCode, resetColor,\n\t\tparam.Latency,\n\t\tparam.ClientIP,\n\t\tmethodColor, param.Method, resetColor,\n\t\tparam.Path,\n\t\tparam.ErrorMessage,\n\t)\n}\n\n// DisableConsoleColor disables color output in the console.\nfunc DisableConsoleColor() {\n\tconsoleColorMode = disableColor\n}\n\n// ForceConsoleColor force color output in the console.\nfunc ForceConsoleColor() {\n\tconsoleColorMode = forceColor\n}\n\n// ErrorLogger returns a handlerfunc for any error type.\nfunc ErrorLogger() gin.HandlerFunc {\n\treturn ErrorLoggerT(gin.ErrorTypeAny)\n}\n\n// ErrorLoggerT returns a handlerfunc for a given error type.\nfunc ErrorLoggerT(typ gin.ErrorType) gin.HandlerFunc {\n\treturn func(c *gin.Context) {\n\t\tc.Next()\n\t\terrors := c.Errors.ByType(typ)\n\t\tif len(errors) > 0 {\n\t\t\tc.JSON(-1, errors)\n\t\t}\n\t}\n}\n\n// Logger instances a Logger middleware that will write the logs to gin.DefaultWriter.\n// By default gin.DefaultWriter = os.Stdout.\nfunc Logger(conf ...LoggerConfig) gin.HandlerFunc {\n\tvar configuration LoggerConfig\n\tif len(conf) > 0 {\n\t\tconfiguration = conf[0]\n\t}\n\n\treturn LoggerWithConfig(configuration)\n}\n\n// LoggerWithFormatter instance a Logger middleware with the specified log format function.\nfunc LoggerWithFormatter(f LogFormatter) gin.HandlerFunc {\n\treturn LoggerWithConfig(LoggerConfig{\n\t\tFormatter: f,\n\t})\n}\n\n// LoggerWithWriter instance a Logger middleware with the specified writer buffer.\n// Example: os.Stdout, a file opened in write mode, a socket...\nfunc LoggerWithWriter(out io.Writer, notlogged ...string) gin.HandlerFunc {\n\treturn LoggerWithConfig(LoggerConfig{\n\t\tOutput: out,\n\t\tSkipPaths: notlogged,\n\t})\n}\n\ntype CustomResponseWriter struct {\n\tgin.ResponseWriter\n\tbody *bytes.Buffer\n}\n\nfunc (w CustomResponseWriter) Write(data []byte) (int, error) {\n\tw.body.Write(data)\n\treturn w.ResponseWriter.Write(data)\n}\n\nfunc (w CustomResponseWriter) WriteString(s string) (int, error) {\n\tw.body.WriteString(s)\n\treturn w.ResponseWriter.WriteString(s)\n}\n\nfunc (w CustomResponseWriter) Unwrap() http.ResponseWriter {\n\treturn w.ResponseWriter\n}\n\n// LoggerWithConfig instance a Logger middleware with config.\nfunc LoggerWithConfig(conf LoggerConfig) gin.HandlerFunc {\n\tformatter := conf.Formatter\n\tif formatter == nil {\n\t\tformatter = defaultLogFormatter\n\t}\n\n\tout := conf.Output\n\tif out == nil {\n\t\tout = os.Stdout\n\t}\n\n\tnotlogged := conf.SkipPaths\n\n\tisTerm := true\n\n\tif w, ok := out.(*os.File); !ok || os.Getenv(\"TERM\") == \"dumb\" ||\n\t\t(!isatty.IsTerminal(w.Fd()) && !isatty.IsCygwinTerminal(w.Fd())) {\n\t\tisTerm = false\n\t}\n\n\tvar skip map[string]struct{}\n\n\tif length := len(notlogged); length > 0 {\n\t\tskip = make(map[string]struct{}, length)\n\n\t\tfor _, path := range notlogged {\n\t\t\tskip[path] = struct{}{}\n\t\t}\n\t}\n\n\treturn func(c *gin.Context) {\n\t\tif !conf.PrintAccessLog() {\n\t\t\tc.Next()\n\t\t\treturn\n\t\t}\n\n\t\t// Start timer\n\t\tstart := time.Now()\n\t\tpath := c.Request.URL.Path\n\t\traw := c.Request.URL.RawQuery\n\n\t\tvar (\n\t\t\trdr1 io.ReadCloser\n\t\t\trdr2 io.ReadCloser\n\t\t)\n\n\t\tbodyWriter := &CustomResponseWriter{\n\t\t\tResponseWriter: c.Writer,\n\t\t\tbody: bytes.NewBuffer(nil),\n\t\t}\n\t\tc.Writer = bodyWriter\n\n\t\tif conf.ContainsPath(c.Request.RequestURI) {\n\t\t\tbuf, _ := io.ReadAll(c.Request.Body)\n\t\t\trdr1 = io.NopCloser(bytes.NewBuffer(buf))\n\t\t\trdr2 = io.NopCloser(bytes.NewBuffer(buf))\n\n\t\t\tc.Request.Body = rdr2\n\t\t}\n\n\t\t// Process request\n\t\tc.Next()\n\n\t\t// Log only when path is not being skipped\n\t\tif _, ok := skip[path]; !ok {\n\t\t\tparam := LogFormatterParams{\n\t\t\t\tRequest: c.Request,\n\t\t\t\tisTerm: isTerm,\n\t\t\t\tKeys: c.Keys,\n\t\t\t}\n\n\t\t\t// Stop timer\n\t\t\tparam.TimeStamp = time.Now()\n\t\t\tparam.Latency = param.TimeStamp.Sub(start)\n\n\t\t\tparam.ClientIP = c.ClientIP()\n\t\t\tparam.Method = c.Request.Method\n\t\t\tparam.StatusCode = c.Writer.Status()\n\t\t\tparam.ErrorMessage = c.Errors.ByType(gin.ErrorTypePrivate).String()\n\n\t\t\tparam.BodySize = c.Writer.Size()\n\n\t\t\tif raw != \"\" {\n\t\t\t\tpath = path + \"?\" + raw\n\t\t\t}\n\n\t\t\tparam.Path = path\n\n\t\t\ttraceId := c.GetString(\"trace_id\")\n\t\t\tif traceId != \"\" {\n\t\t\t\tlogger.Infof(\"trace_id=%s %s\", traceId, formatter(param))\n\t\t\t} else {\n\t\t\t\tlogger.Info(formatter(param))\n\t\t\t}\n\t\t\tif conf.ContainsPath(c.Request.RequestURI) {\n\t\t\t\trespBody := readBody(bytes.NewReader(bodyWriter.body.Bytes()), c.Writer.Header().Get(\"Content-Encoding\"))\n\t\t\t\treqBody := readBody(rdr1, c.Request.Header.Get(\"Content-Encoding\"))\n\t\t\t\tif traceId != \"\" {\n\t\t\t\t\tlogger.Debugf(\"trace_id=%s path:%s req body:%s resp:%s\", traceId, path, reqBody, respBody)\n\t\t\t\t} else {\n\t\t\t\t\tlogger.Debugf(\"path:%s req body:%s resp:%s\", path, reqBody, respBody)\n\t\t\t\t}\n\t\t\t}\n\t\t}\n\t}\n}\n\nfunc readBody(reader io.Reader, encoding string) string {\n\tvar bodyBytes []byte\n\tvar err error\n\n\tif encoding == \"gzip\" {\n\t\tgzipReader, err := gzip.NewReader(reader)\n\t\tif err != nil {\n\t\t\treturn fmt.Sprintf(\"failed to create gzip reader: %v\", err)\n\t\t}\n\t\tdefer gzipReader.Close()\n\n\t\tbodyBytes, err = io.ReadAll(gzipReader)\n\t\tif err != nil {\n\t\t\treturn fmt.Sprintf(\"failed to read gzip response body: %v\", err)\n\t\t}\n\t} else {\n\t\tbodyBytes, err = io.ReadAll(reader)\n\t\tif err != nil {\n\t\t\treturn fmt.Sprintf(\"failed to read response body: %v\", err)\n\t\t}\n\t}\n\n\treturn string(bodyBytes)\n}\n"
},
{
"path": "pkg/aop/rec.go",
"content": "package aop\n\n// Copyright 2014 Manu Martinez-Almeida. All rights reserved.\n// Use of this source code is governed by a MIT style\n// license that can be found in the LICENSE file.\n\nimport (\n\t\"bytes\"\n\t\"fmt\"\n\t\"io\"\n\t\"io/ioutil\"\n\t\"log\"\n\t\"net\"\n\t\"net/http\"\n\t\"net/http/httputil\"\n\t\"os\"\n\t\"runtime\"\n\t\"strings\"\n\t\"time\"\n\n\t\"github.com/gin-gonic/gin\"\n\t\"github.com/toolkits/pkg/errorx\"\n\t\"github.com/toolkits/pkg/i18n\"\n)\n\nvar (\n\tdunno = []byte(\"???\")\n\tcenterDot = []byte(\"·\")\n\tdot = []byte(\".\")\n\tslash = []byte(\"/\")\n)\n\n// Recovery returns a middleware that recovers from any panics and writes a 500 if there was one.\nfunc Recovery() gin.HandlerFunc {\n\treturn RecoveryWithWriter(gin.DefaultErrorWriter)\n}\n\n// RecoveryWithWriter returns a middleware for a given writer that recovers from any panics and writes a 500 if there was one.\nfunc RecoveryWithWriter(out io.Writer) gin.HandlerFunc {\n\tvar logger *log.Logger\n\tif out != nil {\n\t\tlogger = log.New(out, \"\\n\\n\\x1b[31m\", log.LstdFlags)\n\t}\n\treturn func(c *gin.Context) {\n\t\tdefer func() {\n\t\t\tif err := recover(); err != nil {\n\t\t\t\t// custom error\n\t\t\t\tif e, ok := err.(errorx.PageError); ok {\n\t\t\t\t\tif e.Code != 200 {\n\t\t\t\t\t\tc.String(e.Code, i18n.Sprintf(c.GetHeader(\"X-Language\"), e.Message))\n\t\t\t\t\t} else {\n\t\t\t\t\t\tc.JSON(e.Code, gin.H{\n\t\t\t\t\t\t\t\"err\": i18n.Sprintf(c.GetHeader(\"X-Language\"), e.Message),\n\t\t\t\t\t\t\t\"request_id\": c.GetString(\"trace_id\"),\n\t\t\t\t\t\t})\n\t\t\t\t\t}\n\t\t\t\t\tc.Abort()\n\t\t\t\t\treturn\n\t\t\t\t}\n\n\t\t\t\t// Check for a broken connection, as it is not really a\n\t\t\t\t// condition that warrants a panic stack trace.\n\t\t\t\tvar brokenPipe bool\n\t\t\t\tif ne, ok := err.(*net.OpError); ok {\n\t\t\t\t\tif se, ok := ne.Err.(*os.SyscallError); ok {\n\t\t\t\t\t\tif strings.Contains(strings.ToLower(se.Error()), \"broken pipe\") || strings.Contains(strings.ToLower(se.Error()), \"connection reset by peer\") {\n\t\t\t\t\t\t\tbrokenPipe = true\n\t\t\t\t\t\t}\n\t\t\t\t\t}\n\t\t\t\t}\n\t\t\t\tif logger != nil {\n\t\t\t\t\tstack := stack(3)\n\t\t\t\t\thttpRequest, _ := httputil.DumpRequest(c.Request, false)\n\t\t\t\t\theaders := strings.Split(string(httpRequest), \"\\r\\n\")\n\t\t\t\t\tfor idx, header := range headers {\n\t\t\t\t\t\tcurrent := strings.Split(header, \":\")\n\t\t\t\t\t\tif current[0] == \"Authorization\" {\n\t\t\t\t\t\t\theaders[idx] = current[0] + \": *\"\n\t\t\t\t\t\t}\n\t\t\t\t\t}\n\t\t\t\t\tif brokenPipe {\n\t\t\t\t\t\tlogger.Printf(\"%s\\n%s%s\", err, string(httpRequest), reset)\n\t\t\t\t\t} else if gin.IsDebugging() {\n\t\t\t\t\t\tlogger.Printf(\"[Recovery] %s panic recovered:\\n%s\\n%s\\n%s%s\",\n\t\t\t\t\t\t\ttimeFormat(time.Now()), strings.Join(headers, \"\\r\\n\"), err, stack, reset)\n\t\t\t\t\t} else {\n\t\t\t\t\t\tlogger.Printf(\"[Recovery] %s panic recovered:\\n%s\\n%s%s\",\n\t\t\t\t\t\t\ttimeFormat(time.Now()), err, stack, reset)\n\t\t\t\t\t}\n\t\t\t\t}\n\n\t\t\t\t// If the connection is dead, we can't write a status to it.\n\t\t\t\tif brokenPipe {\n\t\t\t\t\tc.Error(err.(error)) // nolint: errcheck\n\t\t\t\t\tc.Abort()\n\t\t\t\t} else {\n\t\t\t\t\tc.AbortWithStatus(http.StatusInternalServerError)\n\t\t\t\t}\n\t\t\t}\n\t\t}()\n\t\tc.Next()\n\t}\n}\n\n// stack returns a nicely formatted stack frame, skipping skip frames.\nfunc stack(skip int) []byte {\n\tbuf := new(bytes.Buffer) // the returned data\n\t// As we loop, we open files and read them. These variables record the currently\n\t// loaded file.\n\tvar lines [][]byte\n\tvar lastFile string\n\tfor i := skip; ; i++ { // Skip the expected number of frames\n\t\tpc, file, line, ok := runtime.Caller(i)\n\t\tif !ok {\n\t\t\tbreak\n\t\t}\n\t\t// Print this much at least. If we can't find the source, it won't show.\n\t\tfmt.Fprintf(buf, \"%s:%d (0x%x)\\n\", file, line, pc)\n\t\tif file != lastFile {\n\t\t\tdata, err := ioutil.ReadFile(file)\n\t\t\tif err != nil {\n\t\t\t\tcontinue\n\t\t\t}\n\t\t\tlines = bytes.Split(data, []byte{'\\n'})\n\t\t\tlastFile = file\n\t\t}\n\t\tfmt.Fprintf(buf, \"\\t%s: %s\\n\", function(pc), source(lines, line))\n\t}\n\treturn buf.Bytes()\n}\n\n// source returns a space-trimmed slice of the n'th line.\nfunc source(lines [][]byte, n int) []byte {\n\tn-- // in stack trace, lines are 1-indexed but our array is 0-indexed\n\tif n < 0 || n >= len(lines) {\n\t\treturn dunno\n\t}\n\treturn bytes.TrimSpace(lines[n])\n}\n\n// function returns, if possible, the name of the function containing the PC.\nfunc function(pc uintptr) []byte {\n\tfn := runtime.FuncForPC(pc)\n\tif fn == nil {\n\t\treturn dunno\n\t}\n\tname := []byte(fn.Name())\n\t// The name includes the path name to the package, which is unnecessary\n\t// since the file name is already included. Plus, it has center dots.\n\t// That is, we see\n\t//\truntime/debug.*T·ptrmethod\n\t// and want\n\t//\t*T.ptrmethod\n\t// Also the package path might contains dot (e.g. code.google.com/...),\n\t// so first eliminate the path prefix\n\tif lastSlash := bytes.LastIndex(name, slash); lastSlash >= 0 {\n\t\tname = name[lastSlash+1:]\n\t}\n\tif period := bytes.Index(name, dot); period >= 0 {\n\t\tname = name[period+1:]\n\t}\n\tname = bytes.Replace(name, centerDot, dot, -1)\n\treturn name\n}\n\nfunc timeFormat(t time.Time) string {\n\treturn t.Format(\"2006/01/02 - 15:04:05\")\n}\n"
},
{
"path": "pkg/cas/cas.go",
"content": "package cas\n\nimport (\n\t\"bytes\"\n\t\"context\"\n\t\"crypto/tls\"\n\t\"net/http\"\n\t\"net/url\"\n\t\"strings\"\n\t\"sync\"\n\t\"time\"\n\n\t\"github.com/ccfos/nightingale/v6/storage\"\n\n\t\"github.com/google/uuid\"\n\t\"github.com/toolkits/pkg/cas\"\n\t\"github.com/toolkits/pkg/logger\"\n)\n\ntype Config struct {\n\tEnable bool\n\tRedirectURL string\n\tSsoAddr string\n\tSsoLogoutAddr string\n\tLoginPath string\n\tDisplayName string\n\tCoverAttributes bool\n\tSkipTlsVerify bool\n\tAttributes struct {\n\t\tUserName string\n\t\tNickname string\n\t\tPhone string\n\t\tEmail string\n\t}\n\tDefaultRoles []string\n}\n\ntype SsoClient struct {\n\tEnable bool\n\tConfig Config\n\tSsoAddr string\n\tSsoLogoutAddr string\n\tCallbackAddr string\n\tDisplayName string\n\tAttributes struct {\n\t\tUserName string\n\t\tNickname string\n\t\tPhone string\n\t\tEmail string\n\t}\n\tDefaultRoles []string\n\tCoverAttributes bool\n\tHTTPClient *http.Client\n\tsync.RWMutex\n}\n\nfunc New(cf Config) *SsoClient {\n\tvar cli SsoClient\n\tif !cf.Enable {\n\t\treturn &cli\n\t}\n\n\tcli.Enable = cf.Enable\n\tcli.Config = cf\n\tcli.SsoAddr = cf.SsoAddr\n\tcli.SsoLogoutAddr = cf.SsoLogoutAddr\n\tcli.CallbackAddr = cf.RedirectURL\n\tcli.DisplayName = cf.DisplayName\n\tcli.Attributes.UserName = cf.Attributes.UserName\n\tcli.Attributes.Nickname = cf.Attributes.Nickname\n\tcli.Attributes.Phone = cf.Attributes.Phone\n\tcli.Attributes.Email = cf.Attributes.Email\n\tcli.DefaultRoles = cf.DefaultRoles\n\tcli.CoverAttributes = cf.CoverAttributes\n\n\tif cf.SkipTlsVerify {\n\t\ttransport := &http.Transport{\n\t\t\tTLSClientConfig: &tls.Config{InsecureSkipVerify: true},\n\t\t}\n\n\t\tcli.HTTPClient = &http.Client{Transport: transport}\n\t}\n\n\treturn &cli\n}\n\nfunc (s *SsoClient) Reload(cf Config) {\n\ts.Lock()\n\tdefer s.Unlock()\n\tif !cf.Enable {\n\t\ts.Enable = cf.Enable\n\t\treturn\n\t}\n\n\ts.Enable = cf.Enable\n\ts.Config = cf\n\ts.SsoAddr = cf.SsoAddr\n\ts.SsoLogoutAddr = cf.SsoLogoutAddr\n\ts.CallbackAddr = cf.RedirectURL\n\ts.DisplayName = cf.DisplayName\n\ts.Attributes.UserName = cf.Attributes.UserName\n\ts.Attributes.Nickname = cf.Attributes.Nickname\n\ts.Attributes.Phone = cf.Attributes.Phone\n\ts.Attributes.Email = cf.Attributes.Email\n\ts.DefaultRoles = cf.DefaultRoles\n\ts.CoverAttributes = cf.CoverAttributes\n\n\tif cf.SkipTlsVerify {\n\t\ttransport := &http.Transport{\n\t\t\tTLSClientConfig: &tls.Config{InsecureSkipVerify: true},\n\t\t}\n\n\t\ts.HTTPClient = &http.Client{Transport: transport}\n\t}\n}\n\nfunc (s *SsoClient) GetDisplayName() string {\n\ts.RLock()\n\tdefer s.RUnlock()\n\tif !s.Enable {\n\t\treturn \"\"\n\t}\n\n\treturn s.DisplayName\n}\n\nfunc (s *SsoClient) GetSsoLogoutAddr() string {\n\ts.RLock()\n\tdefer s.RUnlock()\n\tif !s.Enable {\n\t\treturn \"\"\n\t}\n\n\treturn s.SsoLogoutAddr\n}\n\n// Authorize return the cas authorize location and state\nfunc (s *SsoClient) Authorize(redis storage.Redis, redirect string) (string, string, error) {\n\tstate := uuid.New().String()\n\tctx := context.Background()\n\terr := redis.Set(ctx, wrapStateKey(state), redirect, time.Duration(300*time.Second)).Err()\n\tif err != nil {\n\t\treturn \"\", \"\", err\n\t}\n\treturn s.genRedirectURL(state), state, nil\n}\n\nfunc fetchRedirect(ctx context.Context, state string, redis storage.Redis) (string, error) {\n\treturn redis.Get(ctx, wrapStateKey(state)).Result()\n}\n\nfunc deleteRedirect(ctx context.Context, state string, redis storage.Redis) error {\n\treturn redis.Del(ctx, wrapStateKey(state)).Err()\n}\n\nfunc wrapStateKey(key string) string {\n\treturn \"n9e_cas_\" + key\n}\n\nfunc (s *SsoClient) genRedirectURL(state string) string {\n\tvar buf bytes.Buffer\n\ts.RLock()\n\tdefer s.RUnlock()\n\n\tSsoAddr, err := url.Parse(s.Config.SsoAddr)\n\tif err != nil {\n\t\tlogger.Error(err)\n\t\treturn buf.String()\n\t}\n\n\tif s.Config.LoginPath == \"\" {\n\t\tif strings.Contains(s.Config.SsoAddr, \"p3\") {\n\t\t\tSsoAddr.Path += \"/login\"\n\t\t} else {\n\t\t\tSsoAddr.Path += \"/cas/login\"\n\t\t}\n\t} else {\n\t\tSsoAddr.Path += s.Config.LoginPath\n\t}\n\n\tbuf.WriteString(SsoAddr.String())\n\tv := url.Values{\n\t\t\"service\": {s.CallbackAddr},\n\t}\n\tif strings.Contains(s.SsoAddr, \"?\") {\n\t\tbuf.WriteByte('&')\n\t} else {\n\t\tbuf.WriteByte('?')\n\t}\n\tbuf.WriteString(v.Encode())\n\treturn buf.String()\n}\n\ntype CallbackOutput struct {\n\tRedirect string `json:\"redirect\"`\n\tMsg string `json:\"msg\"`\n\tAccessToken string `json:\"accessToken\"`\n\tUsername string `json:\"username\"`\n\tNickname string `json:\"Nickname\"`\n\tPhone string `yaml:\"Phone\"`\n\tEmail string `yaml:\"Email\"`\n}\n\nfunc (s *SsoClient) ValidateServiceTicket(ctx context.Context, ticket, state string, redis storage.Redis) (ret *CallbackOutput, err error) {\n\ts.RLock()\n\tdefer s.RUnlock()\n\n\tcasUrl, err := url.Parse(s.Config.SsoAddr)\n\tif err != nil {\n\t\tlogger.Error(err)\n\t\treturn\n\t}\n\tserviceUrl, err := url.Parse(s.CallbackAddr)\n\tif err != nil {\n\t\tlogger.Error(err)\n\t\treturn\n\t}\n\tresOptions := &cas.RestOptions{\n\t\tCasURL: casUrl,\n\t\tServiceURL: serviceUrl,\n\t}\n\n\tif s.HTTPClient != nil {\n\t\tresOptions.Client = s.HTTPClient\n\t}\n\n\tresCli := cas.NewRestClient(resOptions)\n\tauthRet, err := resCli.ValidateServiceTicket(cas.ServiceTicket(ticket))\n\tif err != nil {\n\t\tlogger.Errorf(\"Ticket Validating Failed: %s\", err)\n\t\treturn\n\t}\n\tret = &CallbackOutput{}\n\n\tret.Username = authRet.User\n\tret.Nickname = authRet.Attributes.Get(s.Attributes.Nickname)\n\tret.Email = authRet.Attributes.Get(s.Attributes.Email)\n\tret.Phone = authRet.Attributes.Get(s.Attributes.Phone)\n\n\tret.Redirect, err = fetchRedirect(ctx, state, redis)\n\tif err != nil {\n\t\tlogger.Debugf(\"get redirect err:%s state:%s\", state, err)\n\t}\n\terr = deleteRedirect(ctx, state, redis)\n\tif err != nil {\n\t\tlogger.Debugf(\"delete redirect err:%s state:%s\", state, err)\n\t}\n\treturn\n}\n"
},
{
"path": "pkg/cfg/cfg.go",
"content": "package cfg\n\nimport (\n\t\"bytes\"\n\t\"fmt\"\n\t\"path\"\n\t\"strings\"\n\n\t\"github.com/koding/multiconfig\"\n\t\"github.com/toolkits/pkg/file\"\n\t\"github.com/toolkits/pkg/runner\"\n)\n\nfunc LoadConfigByDir(configDir string, configPtr interface{}) error {\n\tvar (\n\t\ttBuf []byte\n\t)\n\n\tloaders := []multiconfig.Loader{\n\t\t&multiconfig.TagLoader{},\n\t\t&multiconfig.EnvironmentLoader{},\n\t}\n\n\tif !file.IsExist(configDir) {\n\t\treturn fmt.Errorf(\"config directory: %s not exist. working directory: %s\", configDir, runner.Cwd)\n\t}\n\n\tfiles, err := file.FilesUnder(configDir)\n\tif err != nil {\n\t\treturn fmt.Errorf(\"failed to list files under: %s : %v\", configDir, err)\n\t}\n\n\tfound := false\n\n\ts := NewFileScanner()\n\tfor _, fpath := range files {\n\t\tswitch {\n\t\tcase strings.HasSuffix(fpath, \".toml\"):\n\t\t\tfound = true\n\t\t\ts.Read(path.Join(configDir, fpath))\n\t\t\ttBuf = append(tBuf, s.Data()...)\n\t\t\ttBuf = append(tBuf, []byte(\"\\n\")...)\n\t\tcase strings.HasSuffix(fpath, \".json\"):\n\t\t\tfound = true\n\t\t\tloaders = append(loaders, &multiconfig.JSONLoader{Path: path.Join(configDir, fpath)})\n\t\tcase strings.HasSuffix(fpath, \".yaml\") || strings.HasSuffix(fpath, \".yml\"):\n\t\t\tfound = true\n\t\t\tloaders = append(loaders, &multiconfig.YAMLLoader{Path: path.Join(configDir, fpath)})\n\t\t}\n\t\tif s.Err() != nil {\n\t\t\treturn s.Err()\n\t\t}\n\t}\n\n\tif !found {\n\t\treturn fmt.Errorf(\"fail to found config file, config dir path: %v\", configDir)\n\t}\n\n\tif len(tBuf) != 0 {\n\t\tloaders = append(loaders, &multiconfig.TOMLLoader{Reader: bytes.NewReader(tBuf)})\n\t}\n\n\tm := multiconfig.DefaultLoader{\n\t\tLoader: multiconfig.MultiLoader(loaders...),\n\t\tValidator: multiconfig.MultiValidator(&multiconfig.RequiredValidator{}),\n\t}\n\treturn m.Load(configPtr)\n}\n"
},
{
"path": "pkg/cfg/scan.go",
"content": "package cfg\n\nimport (\n\t\"os\"\n)\n\ntype scanner struct {\n\tdata []byte\n\terr error\n}\n\nfunc NewFileScanner() *scanner {\n\treturn &scanner{}\n}\n\nfunc (s *scanner) Err() error {\n\treturn s.err\n}\n\nfunc (s *scanner) Data() []byte {\n\treturn s.data\n}\n\nfunc (s *scanner) Read(file string) {\n\tif s.err == nil {\n\t\ts.data, s.err = os.ReadFile(file)\n\t}\n}\n"
},
{
"path": "pkg/choice/choice.go",
"content": "// Package choice provides basic functions for working with\n// plugin options that must be one of several values.\npackage choice\n\nimport (\n\t\"fmt\"\n\t\"strings\"\n)\n\n// Contains return true if the choice in the list of choices.\nfunc Contains(choice string, choices []string) bool {\n\tfor _, item := range choices {\n\t\tif item == choice {\n\t\t\treturn true\n\t\t}\n\t}\n\treturn false\n}\n\n// Contains return true if the choice in the list of choices.\nfunc ContainsPrefix(choice string, choices []string) bool {\n\tfor _, item := range choices {\n\t\tif strings.HasPrefix(choice, item) {\n\t\t\treturn true\n\t\t}\n\t}\n\treturn false\n}\n\n// Check returns an error if a choice is not one of\n// the available choices.\nfunc Check(choice string, available []string) error {\n\tif !Contains(choice, available) {\n\t\treturn fmt.Errorf(\"unknown choice %s\", choice)\n\t}\n\treturn nil\n}\n\n// CheckSlice returns an error if the choices is not a subset of\n// available.\nfunc CheckSlice(choices, available []string) error {\n\tfor _, choice := range choices {\n\t\terr := Check(choice, available)\n\t\tif err != nil {\n\t\t\treturn err\n\t\t}\n\t}\n\treturn nil\n}\n"
},
{
"path": "pkg/cmdx/cmd_notwindows.go",
"content": "//go:build !windows\n// +build !windows\n\npackage cmdx\n\nimport (\n\t\"os/exec\"\n\t\"syscall\"\n\t\"time\"\n)\n\nfunc CmdWait(cmd *exec.Cmd, timeout time.Duration) (error, bool) {\n\tvar err error\n\n\tdone := make(chan error)\n\tgo func() {\n\t\tdone <- cmd.Wait()\n\t}()\n\n\tselect {\n\tcase <-time.After(timeout):\n\t\tgo func() {\n\t\t\t<-done // allow goroutine to exit\n\t\t}()\n\n\t\t// IMPORTANT: cmd.SysProcAttr = &syscall.SysProcAttr{Setpgid: true} is necessary before cmd.Start()\n\t\terr = syscall.Kill(-cmd.Process.Pid, syscall.SIGKILL)\n\t\treturn err, true\n\tcase err = <-done:\n\t\treturn err, false\n\t}\n}\n\nfunc CmdStart(cmd *exec.Cmd) error {\n\tcmd.SysProcAttr = &syscall.SysProcAttr{Setpgid: true}\n\treturn cmd.Start()\n}\n"
},
{
"path": "pkg/cmdx/cmd_windows.go",
"content": "//go:build windows\n// +build windows\n\npackage cmdx\n\nimport (\n\t\"os/exec\"\n\t\"syscall\"\n\t\"time\"\n)\n\nfunc CmdWait(cmd *exec.Cmd, timeout time.Duration) (error, bool) {\n\tvar err error\n\n\tdone := make(chan error)\n\tgo func() {\n\t\tdone <- cmd.Wait()\n\t}()\n\n\tselect {\n\tcase <-time.After(timeout):\n\t\tgo func() {\n\t\t\t<-done // allow goroutine to exit\n\t\t}()\n\n\t\terr = cmd.Process.Signal(syscall.SIGKILL)\n\t\treturn err, true\n\tcase err = <-done:\n\t\treturn err, false\n\t}\n}\n\nfunc CmdStart(cmd *exec.Cmd) error {\n\treturn cmd.Start()\n}\n"
},
{
"path": "pkg/cmdx/cmdx.go",
"content": "package cmdx\n\nimport (\n\t\"os/exec\"\n\t\"time\"\n)\n\nfunc RunTimeout(cmd *exec.Cmd, timeout time.Duration) (error, bool) {\n\terr := CmdStart(cmd)\n\tif err != nil {\n\t\treturn err, false\n\t}\n\n\treturn CmdWait(cmd, timeout)\n}\n"
},
{
"path": "pkg/ctx/ctx.go",
"content": "package ctx\n\nimport (\n\t\"context\"\n\n\t\"github.com/ccfos/nightingale/v6/conf\"\n\n\t\"gorm.io/gorm\"\n)\n\ntype Context struct {\n\tDB *gorm.DB\n\tCenterApi conf.CenterApi\n\tCtx context.Context\n\tIsCenter bool\n}\n\nfunc NewContext(ctx context.Context, db *gorm.DB, isCenter bool, centerApis ...conf.CenterApi) *Context {\n\tvar api conf.CenterApi\n\tif len(centerApis) > 0 {\n\t\tapi = centerApis[0]\n\t}\n\n\treturn &Context{\n\t\tCtx: ctx,\n\t\tDB: db,\n\t\tCenterApi: api,\n\t\tIsCenter: isCenter,\n\t}\n}\n\n// set db to Context\nfunc (c *Context) SetDB(db *gorm.DB) {\n\tc.DB = db\n}\n\n// get context from Context\nfunc (c *Context) GetContext() context.Context {\n\treturn c.Ctx\n}\n\n// get db from Context\nfunc (c *Context) GetDB() *gorm.DB {\n\treturn c.DB\n}\n\n// WithContext returns a shallow copy with a different standard context.\n// Useful for carrying per-request values (e.g. traceId) without mutating the global instance.\nfunc (c *Context) WithContext(stdCtx context.Context) *Context {\n\treturn &Context{\n\t\tDB: c.DB,\n\t\tCenterApi: c.CenterApi,\n\t\tCtx: stdCtx,\n\t\tIsCenter: c.IsCenter,\n\t}\n}\n"
},
{
"path": "pkg/dingtalk/dingtalk.go",
"content": "package dingtalk\n\nimport (\n\t\"bytes\"\n\t\"context\"\n\t\"fmt\"\n\t\"net/url\"\n\t\"strings\"\n\t\"sync\"\n\t\"time\"\n\n\tdingtalkUserClient \"github.com/ccfos/nightingale/v6/pkg/dingtalk/user\"\n\t\"github.com/ccfos/nightingale/v6/storage\"\n\n\topenapi \"github.com/alibabacloud-go/darabonba-openapi/v2/client\"\n\t\"github.com/alibabacloud-go/dingtalk/contact_1_0\"\n\tdingtalkoauth2 \"github.com/alibabacloud-go/dingtalk/oauth2_1_0\"\n\tutil \"github.com/alibabacloud-go/tea-utils/v2/service\"\n\t\"github.com/alibabacloud-go/tea/tea\"\n\t\"github.com/google/uuid\"\n\t\"github.com/pkg/errors\"\n\t\"github.com/toolkits/pkg/logger\"\n)\n\nconst defaultAuthURL = \"https://login.dingtalk.com/oauth2/auth\"\nconst SsoTypeName = \"dingtalk\"\n\ntype SsoClient struct {\n\tEnable bool\n\tDingTalkConfig *Config `json:\"-\"`\n\tCtx context.Context\n\tsync.RWMutex\n}\n\ntype Config struct {\n\tEnable bool `json:\"enable\"`\n\tAuthURL string `json:\"auth_url\"`\n\tDisplayName string `json:\"display_name\"`\n\t// CorpId 用于指定用户需要选择的组织, scope包含corpid时该参数存在意义\n\tCorpId string `json:\"corpId\"`\n\tClientID string `json:\"client_id\"`\n\tClientSecret string `json:\"client_secret\"`\n\tRedirectURL string `json:\"redirect_url\"`\n\tUsernameField string `json:\"username_field\"`\n\tEndpoint string `json:\"endpoint\"`\n\tDingTalkAPI string `json:\"dingtalk_api\"`\n\tUseMemberInfo bool `json:\"use_member_info\"` // 是否开启查询用户详情,需要qyapi_get_member权限\n\tProxy string `json:\"proxy\"`\n\tSkipTlsVerify bool `json:\"skip_tls_verify\"`\n\tCoverAttributes bool `json:\"cover_attributes\"`\n\tDefaultRoles []string `json:\"default_roles\"`\n}\n\ntype CallbackOutput struct {\n\tRedirect string `json:\"redirect\"`\n\tMsg string `json:\"msg\"`\n\tAccessToken string `json:\"accessToken\"`\n\tUsername string `json:\"Username\"`\n\tNickname string `json:\"Nickname\"`\n\tPhone string `yaml:\"Phone\"`\n\tEmail string `yaml:\"Email\"`\n}\n\nfunc wrapStateKey(key string) string {\n\treturn \"n9e_dingtalk_oauth_\" + key\n}\n\n// CreateClient\n/**\n * 使用 Token 初始化账号Client\n * @return Client\n * @throws Exception\n */\nfunc (c *Config) CreateClient() (*dingtalkoauth2.Client, error) {\n\n\tconfig := &openapi.Config{}\n\tconfig.Protocol = tea.String(\"https\")\n\tconfig.RegionId = tea.String(\"central\")\n\terr := c.setProxy(config)\n\tif err != nil {\n\t\treturn nil, err\n\t}\n\terr = c.setEndpoint(config, c.Endpoint)\n\tif err != nil {\n\t\treturn nil, err\n\t}\n\tdingTalkOAuthClient, err := dingtalkoauth2.NewClient(config)\n\n\treturn dingTalkOAuthClient, err\n\n}\n\n// ContactClient 联系人\nfunc (c *Config) ContactClient() (*contact_1_0.Client, error) {\n\n\tconfig := &openapi.Config{}\n\t// 请求协议\n\tconfig.Protocol = tea.String(\"https\")\n\tconfig.RegionId = tea.String(\"central\")\n\terr := c.setProxy(config)\n\tif err != nil {\n\t\treturn nil, err\n\t}\n\terr = c.setEndpoint(config, c.Endpoint)\n\tif err != nil {\n\t\treturn nil, err\n\t}\n\tdingTalkContactClient, err := contact_1_0.NewClient(config)\n\treturn dingTalkContactClient, err\n}\n\n// UserClient 用户详情\nfunc (c *Config) UserClient() (*dingtalkUserClient.Client, error) {\n\n\tconfig := &openapi.Config{}\n\t// 请求协议\n\tconfig.Protocol = tea.String(\"https\")\n\tconfig.RegionId = tea.String(\"central\")\n\terr := c.setProxy(config)\n\tif err != nil {\n\t\treturn nil, err\n\t}\n\terr = c.setEndpoint(config, c.DingTalkAPI)\n\tif err != nil {\n\t\treturn nil, err\n\t}\n\tdingTalkUserClient, err := dingtalkUserClient.NewClient(config)\n\treturn dingTalkUserClient, err\n}\n\nfunc (c *Config) setEndpoint(config *openapi.Config, endpoint string) error {\n\n\tif endpoint == \"\" {\n\t\treturn nil\n\t}\n\n\tendpointURL, err := url.Parse(endpoint)\n\tif err != nil {\n\t\treturn err\n\t}\n\n\tswitch endpointURL.Scheme {\n\tcase \"http\":\n\t\tconfig.SetProtocol(\"http\")\n\t\tconfig.Endpoint = tea.String(strings.Replace(endpoint, \"http://\", \"\", 1))\n\tcase \"https\":\n\t\tconfig.SetProtocol(\"https\")\n\t\tconfig.Endpoint = tea.String(strings.Replace(endpoint, \"https://\", \"\", 1))\n\tdefault:\n\t\tconfig.SetProtocol(\"https\")\n\t\tconfig.Endpoint = tea.String(endpoint)\n\t}\n\treturn nil\n}\n\nfunc (c *Config) setProxy(config *openapi.Config) error {\n\t// 解析 代理URL协议:http\\https\n\tproxyURL, err := url.Parse(c.Proxy)\n\tif err != nil {\n\t\treturn err\n\t}\n\tswitch proxyURL.Scheme {\n\tcase \"https\":\n\t\tconfig.SetHttpsProxy(c.Proxy)\n\tdefault:\n\t\tconfig.SetHttpProxy(c.Proxy)\n\t}\n\treturn nil\n}\n\nfunc New(cf Config) *SsoClient {\n\tvar s = &SsoClient{}\n\tif !cf.Enable {\n\t\treturn s\n\t}\n\ts.Reload(cf)\n\treturn s\n}\n\nfunc (s *SsoClient) AuthCodeURL(state string) (string, error) {\n\tvar buf bytes.Buffer\n\tdingTalkOauthAuthURl := defaultAuthURL\n\tif s.DingTalkConfig.AuthURL != \"\" {\n\t\tdingTalkOauthAuthURl = s.DingTalkConfig.AuthURL\n\t}\n\tbuf.WriteString(dingTalkOauthAuthURl)\n\tv := url.Values{\n\t\t\"response_type\": {\"code\"},\n\t\t\"client_id\": {s.DingTalkConfig.ClientID},\n\t}\n\tv.Set(\"redirect_uri\", s.DingTalkConfig.RedirectURL)\n\n\tif s.DingTalkConfig.RedirectURL == \"\" {\n\t\treturn \"\", errors.New(\"DingTalk OAuth RedirectURL is empty\")\n\t}\n\n\tif s.DingTalkConfig.CorpId != \"\" {\n\t\t// Scope 授权范围, 当前只支持两种输入,\n\t\t// openid:授权后可获得用户userid, openid\n\t\t// corpid:授权后可获得用户id和登录过程中用户选择的组织id,空格分隔。注意url编码\n\t\tv.Set(\"scope\", \"openid corpid\")\n\t\t// corpId: 必须设置scope值为openid corpid\n\t\tv.Set(\"corpId\", s.DingTalkConfig.CorpId)\n\t} else {\n\t\tv.Set(\"scope\", \"openid\")\n\t}\n\tv.Set(\"prompt\", \"consent\")\n\tv.Set(\"state\", state)\n\n\tif strings.Contains(dingTalkOauthAuthURl, \"?\") {\n\t\tbuf.WriteByte('&')\n\t} else {\n\t\tbuf.WriteByte('?')\n\t}\n\tbuf.WriteString(v.Encode())\n\n\treturn buf.String(), nil\n\n}\n\nfunc (s *SsoClient) GetUserToken(code string) (string, error) {\n\tauthClient, err := s.DingTalkConfig.CreateClient()\n\tgetUserTokenRequest := &dingtalkoauth2.GetUserTokenRequest{\n\t\tClientId: tea.String(s.DingTalkConfig.ClientID),\n\t\tClientSecret: tea.String(s.DingTalkConfig.ClientSecret),\n\t\tCode: tea.String(code),\n\t\tRefreshToken: tea.String(code),\n\t\tGrantType: tea.String(\"authorization_code\"),\n\t}\n\tresp, err := authClient.GetUserToken(getUserTokenRequest)\n\tif err != nil {\n\t\treturn \"\", errors.New(\"dingTalk sso get token error: \" + err.Error())\n\t}\n\n\ttokenBody := resp.Body\n\taccessToken := tea.StringValue(tokenBody.AccessToken)\n\treturn accessToken, nil\n}\n\nfunc (s *SsoClient) GetAccessToken() (string, error) {\n\tauthClient, err := s.DingTalkConfig.CreateClient()\n\tgetUserTokenRequest := &dingtalkoauth2.GetAccessTokenRequest{\n\t\tAppKey: tea.String(s.DingTalkConfig.ClientID),\n\t\tAppSecret: tea.String(s.DingTalkConfig.ClientSecret),\n\t}\n\tresp, err := authClient.GetAccessToken(getUserTokenRequest)\n\tif err != nil {\n\t\treturn \"\", errors.New(\"dingTalk sso get token error: \" + err.Error())\n\t}\n\n\ttokenBody := resp.Body\n\taccessToken := tea.StringValue(tokenBody.AccessToken)\n\treturn accessToken, nil\n}\n\nfunc (s *SsoClient) Reload(dingTalkConfig Config) {\n\ts.Lock()\n\tdefer s.Unlock()\n\ts.Enable = dingTalkConfig.Enable\n\ts.DingTalkConfig = &dingTalkConfig\n}\n\nfunc (s *SsoClient) GetDisplayName() string {\n\ts.RLock()\n\tdefer s.RUnlock()\n\tif !s.Enable {\n\t\treturn \"\"\n\t}\n\n\treturn s.DingTalkConfig.DisplayName\n}\n\nfunc (s *SsoClient) Authorize(redis storage.Redis, redirect string) (string, error) {\n\tstate := uuid.New().String()\n\tctx := context.Background()\n\n\terr := redis.Set(ctx, wrapStateKey(state), redirect, time.Duration(300*time.Second)).Err()\n\tif err != nil {\n\t\treturn \"\", err\n\t}\n\n\ts.RLock()\n\tdefer s.RUnlock()\n\n\treturn s.AuthCodeURL(state)\n\n}\n\nfunc (s *SsoClient) GetUserInfo(accessToken string, unionid string) (*dingtalkUserClient.GetUserResult, error) {\n\tuserClient, err := s.DingTalkConfig.UserClient()\n\tif err != nil {\n\t\treturn nil, fmt.Errorf(\"CreateClient error: %s\", err)\n\t}\n\tquery := &dingtalkUserClient.GetUserQuery{AccessToken: accessToken}\n\tunionReq := &dingtalkUserClient.GetUnionIdRequest{\n\t\tUnionID: unionid,\n\t}\n\tuid, err := userClient.GetByUnionId(unionReq, query)\n\tif err != nil {\n\t\treturn nil, err\n\t}\n\tif uid.Body == nil {\n\t\treturn nil, errors.Errorf(\"dingTalk get userid fail status code : %d\", tea.Int32Value(uid.StatusCode))\n\t}\n\tif uid.Body.Result == nil {\n\t\treturn nil, errors.Errorf(\"dingTalk get userid body: %s\", uid.Body.String())\n\t}\n\treq := &dingtalkUserClient.GetUserRequest{\n\t\tUserID: tea.StringValue(uid.Body.Result.UserId),\n\t}\n\n\tuserInfo, err := userClient.GetUser(req, query)\n\n\tif userInfo.Body == nil {\n\t\treturn nil, errors.Errorf(\"dingTalk get userinfo status code: %d\", tea.Int32Value(userInfo.StatusCode))\n\t}\n\n\tlogger.Debugf(\"dingTalk get userinfo RequestID %s UserID %s \", tea.StringValue(userInfo.Body.RequestID), req.UserID)\n\n\treturn userInfo.Body.Result, nil\n}\n\nfunc (s *SsoClient) Callback(redis storage.Redis, ctx context.Context, code, state string) (*CallbackOutput, error) {\n\n\tuserAccessToken, err := s.GetUserToken(code)\n\tif err != nil {\n\t\treturn nil, fmt.Errorf(\"dingTalk GetUserToken error: %s\", err)\n\t}\n\t// 获取用户信息\n\tcontactClient, err := s.DingTalkConfig.ContactClient()\n\tif err != nil {\n\t\treturn nil, fmt.Errorf(\"dingTalk New ContactClient error: %s\", err)\n\t}\n\n\tgetUserHeaders := &contact_1_0.GetUserHeaders{}\n\tgetUserHeaders.XAcsDingtalkAccessToken = tea.String(userAccessToken)\n\n\tme, err := contactClient.GetUserWithOptions(tea.String(\"me\"), getUserHeaders, &util.RuntimeOptions{})\n\tif err != nil {\n\t\treturn nil, fmt.Errorf(\"dingTalk GetUser me error: %s\", err)\n\t}\n\n\tredirect := \"\"\n\tif redis != nil {\n\t\tredirect, err = fetchRedirect(redis, ctx, state)\n\t\tif err != nil {\n\t\t\tlogger.Errorf(\"get redirect err:%v code:%s state:%s\", err, code, state)\n\t\t}\n\t}\n\tif redirect == \"\" {\n\t\tredirect = \"/\"\n\t}\n\n\terr = deleteRedirect(redis, ctx, state)\n\tif err != nil {\n\t\tlogger.Errorf(\"delete redirect err:%v code:%s state:%s\", err, code, state)\n\t}\n\n\tvar callbackOutput CallbackOutput\n\tif me.Body == nil {\n\t\treturn nil, fmt.Errorf(\"dingTalk GetUser failed, status code:%d\", me.StatusCode)\n\t}\n\tlogger.Debugf(\"dingTalk get contact %+v\", me)\n\tusername := tea.StringValue(me.Body.Nick)\n\tnickname := tea.StringValue(me.Body.Nick)\n\tphone := tea.StringValue(me.Body.Mobile)\n\temail := tea.StringValue(me.Body.Email)\n\n\tif s.DingTalkConfig.UseMemberInfo {\n\t\tunionID := tea.StringValue(me.Body.UnionId)\n\t\taccessToken, err := dingTalkAccessTokenCacheGet(redis, ctx)\n\t\tif err != nil {\n\t\t\tlogger.Warningf(\"dingTalk get accessToken cache fail %s\", err.Error())\n\t\t}\n\t\tif accessToken == \"\" {\n\t\t\taccessToken, err = s.GetAccessToken()\n\t\t\tif err != nil {\n\t\t\t\treturn nil, err\n\t\t\t}\n\t\t\terr = dingTalkAccessTokenCacheSet(redis, ctx, accessToken)\n\t\t\tif err != nil {\n\t\t\t\tlogger.Warningf(\"dingTalk set accessToken cache fail %s\", err.Error())\n\t\t\t}\n\t\t}\n\n\t\tuser, err := s.GetUserInfo(accessToken, unionID)\n\t\tif err != nil {\n\t\t\treturn nil, err\n\t\t}\n\t\tif user == nil {\n\t\t\treturn nil, fmt.Errorf(\"dingTalk GetUserInfo unionid %s username %s is nil\", unionID, username)\n\t\t}\n\t\tlogger.Debugf(\"dingTalk get user info unionID %s accessToken %s result %+v\", unionID, accessToken, user)\n\t\tusername = tea.StringValue(user.Name)\n\t\tnickname = tea.StringValue(user.Name)\n\t\tphone = tea.StringValue(user.Mobile)\n\t\temail = tea.StringValue(user.Email)\n\t}\n\n\tcallbackOutput.Redirect = redirect\n\n\tswitch s.DingTalkConfig.UsernameField {\n\tcase \"name\":\n\t\tif username == \"\" {\n\t\t\treturn nil, errors.New(\"dingTalk user name is empty\")\n\t\t}\n\t\tcallbackOutput.Username = username\n\tcase \"email\":\n\t\tif email == \"\" {\n\t\t\treturn nil, errors.New(\"dingTalk user email is empty\")\n\t\t}\n\t\tcallbackOutput.Username = email\n\tdefault:\n\t\tif phone == \"\" {\n\t\t\treturn nil, errors.New(\"dingTalk user mobile is empty\")\n\t\t}\n\t\tcallbackOutput.Username = phone\n\t}\n\tcallbackOutput.Nickname = nickname\n\tcallbackOutput.Email = email\n\tcallbackOutput.Phone = phone\n\n\treturn &callbackOutput, nil\n\n}\n\nfunc dingTalkAccessTokenCacheSet(redis storage.Redis, ctx context.Context, accessToken string) error {\n\t// accessToken的有效期为7200秒(2小时),有效期内重复获取会返回相同结果并自动续期,过期后获取会返回新的accessToken\n\t// 不能频繁调用gettoken接口,否则会受到频率拦截。\n\t// 设置accessToken缓存90分钟,比官方少半小时\n\treturn redis.Set(ctx, wrapStateKey(\"dingtalk_access_token\"), accessToken, time.Duration(5400*time.Second)).Err()\n}\n\nfunc dingTalkAccessTokenCacheGet(redis storage.Redis, ctx context.Context) (string, error) {\n\treturn redis.Get(ctx, wrapStateKey(\"dingtalk_access_token\")).Result()\n}\n\nfunc fetchRedirect(redis storage.Redis, ctx context.Context, state string) (string, error) {\n\treturn redis.Get(ctx, wrapStateKey(state)).Result()\n}\n\nfunc deleteRedirect(redis storage.Redis, ctx context.Context, state string) error {\n\treturn redis.Del(ctx, wrapStateKey(state)).Err()\n}\n"
},
{
"path": "pkg/dingtalk/user/client.go",
"content": "package user\n\nimport (\n\topenapi \"github.com/alibabacloud-go/darabonba-openapi/v2/client\"\n\tgatewayclient \"github.com/alibabacloud-go/gateway-dingtalk/client\"\n\topenapiutil \"github.com/alibabacloud-go/openapi-util/service\"\n\tutil \"github.com/alibabacloud-go/tea-utils/v2/service\"\n\t\"github.com/alibabacloud-go/tea/tea\"\n)\n\ntype GetUserQuery struct {\n\tAccessToken string `json:\"access_token\" xml:\"access_token\"`\n}\n\ntype Client struct {\n\topenapi.Client\n}\n\nfunc NewClient(config *openapi.Config) (*Client, error) {\n\tclient := new(Client)\n\terr := client.Init(config)\n\treturn client, err\n}\n\nfunc (client *Client) Init(config *openapi.Config) (err error) {\n\terr = client.Client.Init(config)\n\tif err != nil {\n\t\treturn err\n\t}\n\tgatewayClient, err := gatewayclient.NewClient()\n\tif err != nil {\n\t\treturn err\n\t}\n\n\tclient.Spi = gatewayClient\n\tclient.EndpointRule = tea.String(\"\")\n\tif tea.BoolValue(util.Empty(client.Endpoint)) {\n\t\tclient.Endpoint = tea.String(\"oapi.dingtalk.com\")\n\t}\n\n\treturn nil\n}\n\n// Summary:\n//\n// 获取用户详情信息\n//\n// @param request - GetUserRequest\n//\n// @param query - GetUserQuery\n//\n// @return GetUserResponse\nfunc (client *Client) GetUser(request *GetUserRequest, query *GetUserQuery) (result *GetUserResponse, err error) {\n\truntime := &util.RuntimeOptions{}\n\trealQuery := make(map[string]*string)\n\tif !tea.BoolValue(util.IsUnset(query.AccessToken)) {\n\t\trealQuery[\"access_token\"] = tea.String(query.AccessToken)\n\t}\n\n\treqBody := map[string]interface{}{}\n\tif !tea.BoolValue(util.IsUnset(request.UserID)) {\n\t\treqBody[\"userid\"] = request.UserID\n\t}\n\n\tif !tea.BoolValue(util.IsUnset(request.Language)) {\n\t\treqBody[\"language\"] = request.Language\n\t}\n\n\treq := &openapi.OpenApiRequest{\n\t\tQuery: realQuery,\n\t\tBody: openapiutil.ParseToMap(reqBody),\n\t}\n\tparams := &openapi.Params{\n\t\tAction: tea.String(\"GetUser\"),\n\t\tVersion: tea.String(\"contact_1.0\"),\n\t\tProtocol: tea.String(\"HTTPS\"),\n\t\tPathname: tea.String(\"/topapi/v2/user/get\"),\n\t\tMethod: tea.String(\"POST\"),\n\t\tAuthType: tea.String(\"AK\"),\n\t\tStyle: tea.String(\"ROA\"),\n\t\tReqBodyType: tea.String(\"none\"),\n\t\tBodyType: tea.String(\"json\"),\n\t}\n\tresult = &GetUserResponse{}\n\tbody, err := client.Execute(params, req, runtime)\n\tif err != nil {\n\t\treturn result, err\n\t}\n\terr = tea.Convert(body, &result)\n\treturn result, err\n}\n\ntype GetUserRequest struct {\n\tUserID string `json:\"user_id\" xml:\"user_id\"`\n\tLanguage string `json:\"language\" xml:\"language\"`\n}\n\ntype GetUserResult struct {\n\tAvatarUrl *string `json:\"avatarUrl,omitempty\" xml:\"avatarUrl,omitempty\"`\n\tEmail *string `json:\"email,omitempty\" xml:\"email,omitempty\"`\n\tMobile *string `json:\"mobile,omitempty\" xml:\"mobile,omitempty\"`\n\tName *string `json:\"name,omitempty\" xml:\"name,omitempty\"`\n\tJobNumber *string `json:\"job_number,omitempty\" xml:\"job_number,omitempty\"`\n\tStateCode *string `json:\"stateCode,omitempty\" xml:\"stateCode,omitempty\"`\n\tUnionId *string `json:\"unionid,omitempty\" xml:\"unionid,omitempty\"`\n\tUserId *string `json:\"userid,omitempty\" xml:\"userid,omitempty\"`\n\tVisitor *bool `json:\"visitor,omitempty\" xml:\"visitor,omitempty\"`\n}\n\nfunc (s GetUserResult) String() string {\n\treturn tea.Prettify(s)\n}\n\nfunc (s GetUserResult) GoString() string {\n\treturn s.String()\n}\n\ntype GetUserResponseBody struct {\n\tResult *GetUserResult `json:\"result,omitempty\" xml:\"result,omitempty\"`\n\tRequestID *string `json:\"request_id,omitempty\" xml:\"request_id,omitempty\"`\n\tErrMsg *string `json:\"errmsg,omitempty\" xml:\"errmsg,omitempty\"`\n\tErrCode *int `json:\"errcode,omitempty\" xml:\"errcode,omitempty\"`\n}\n\nfunc (s GetUserResponseBody) String() string {\n\treturn tea.Prettify(s)\n}\n\nfunc (s GetUserResponseBody) GoString() string {\n\treturn s.String()\n}\n\ntype GetUserResponse struct {\n\tHeaders map[string]*string `json:\"headers,omitempty\" xml:\"headers,omitempty\"`\n\tStatusCode *int32 `json:\"statusCode,omitempty\" xml:\"statusCode,omitempty\"`\n\tBody *GetUserResponseBody `json:\"body,omitempty\" xml:\"body,omitempty\"`\n}\n\nfunc (s GetUserResponse) String() string {\n\treturn tea.Prettify(s)\n}\n\nfunc (s GetUserResponse) GoString() string {\n\treturn s.String()\n}\n\n// Summary:\n//\n// 根据unionid获取用户ID\n//\n// @param request - GetUnionIdRequest\n//\n// @param query - GetUserQuery\n//\n// @return GetUserResponse\nfunc (client *Client) GetByUnionId(request *GetUnionIdRequest, query *GetUserQuery) (result *GetUserIDResponse, err error) {\n\truntime := &util.RuntimeOptions{}\n\trealQuery := make(map[string]*string)\n\tif !tea.BoolValue(util.IsUnset(query.AccessToken)) {\n\t\trealQuery[\"access_token\"] = tea.String(query.AccessToken)\n\t}\n\n\treqBody := map[string]interface{}{}\n\tif !tea.BoolValue(util.IsUnset(request.UnionID)) {\n\t\treqBody[\"unionid\"] = request.UnionID\n\t}\n\n\treq := &openapi.OpenApiRequest{\n\t\tQuery: realQuery,\n\t\tBody: openapiutil.ParseToMap(reqBody),\n\t}\n\tparams := &openapi.Params{\n\t\tAction: tea.String(\"GetUserID\"),\n\t\tVersion: tea.String(\"contact_1.0\"),\n\t\tProtocol: tea.String(\"HTTPS\"),\n\t\tPathname: tea.String(\"/topapi/user/getbyunionid\"),\n\t\tMethod: tea.String(\"POST\"),\n\t\tAuthType: tea.String(\"AK\"),\n\t\tStyle: tea.String(\"ROA\"),\n\t\tReqBodyType: tea.String(\"none\"),\n\t\tBodyType: tea.String(\"json\"),\n\t}\n\tresult = &GetUserIDResponse{}\n\tbody, err := client.Execute(params, req, runtime)\n\tif err != nil {\n\t\treturn result, err\n\t}\n\terr = tea.Convert(body, &result)\n\treturn result, err\n}\n\ntype GetUnionIdRequest struct {\n\tUnionID string `json:\"union_id\" xml:\"union_id\"`\n}\n\ntype GetUserIDResult struct {\n\tUserId *string `json:\"userid,omitempty\" xml:\"userid,omitempty\"`\n\tContactType *bool `json:\"contact_type,omitempty\" xml:\"contact_type,omitempty\"`\n}\n\nfunc (s GetUserIDResult) String() string {\n\treturn tea.Prettify(s)\n}\n\nfunc (s GetUserIDResult) GoString() string {\n\treturn s.String()\n}\n\ntype GetUserIDResponseBody struct {\n\tResult *GetUserIDResult `json:\"result,omitempty\" xml:\"result,omitempty\"`\n\tRequestID *string `json:\"request_id,omitempty\" xml:\"request_id,omitempty\"`\n\tErrMsg *string `json:\"errmsg,omitempty\" xml:\"errmsg,omitempty\"`\n\tErrCode *int `json:\"errcode,omitempty\" xml:\"errcode,omitempty\"`\n}\n\nfunc (s GetUserIDResponseBody) String() string {\n\treturn tea.Prettify(s)\n}\n\nfunc (s GetUserIDResponseBody) GoString() string {\n\treturn s.String()\n}\n\ntype GetUserIDResponse struct {\n\tHeaders map[string]*string `json:\"headers,omitempty\" xml:\"headers,omitempty\"`\n\tStatusCode *int32 `json:\"statusCode,omitempty\" xml:\"statusCode,omitempty\"`\n\tBody *GetUserIDResponseBody `json:\"body,omitempty\" xml:\"body,omitempty\"`\n}\n\nfunc (s GetUserIDResponse) String() string {\n\treturn tea.Prettify(s)\n}\n\nfunc (s GetUserIDResponse) GoString() string {\n\treturn s.String()\n}\n"
},
{
"path": "pkg/fasttime/fasttime.go",
"content": "package fasttime\n\nimport (\n\t\"sync/atomic\"\n\t\"time\"\n)\n\nfunc init() {\n\tgo func() {\n\t\tticker := time.NewTicker(time.Second)\n\t\tdefer ticker.Stop()\n\t\tfor tm := range ticker.C {\n\t\t\tt := uint64(tm.Unix())\n\t\t\tatomic.StoreUint64(¤tTimestamp, t)\n\t\t}\n\t}()\n}\n\nvar currentTimestamp = uint64(time.Now().Unix())\n\n// UnixTimestamp returns the current unix timestamp in seconds.\n//\n// It is faster than time.Now().Unix()\nfunc UnixTimestamp() uint64 {\n\treturn atomic.LoadUint64(¤tTimestamp)\n}\n\n// UnixDate returns date from the current unix timestamp.\n//\n// The date is calculated by dividing unix timestamp by (24*3600)\nfunc UnixDate() uint64 {\n\treturn UnixTimestamp() / (24 * 3600)\n}\n\n// UnixHour returns hour from the current unix timestamp.\n//\n// The hour is calculated by dividing unix timestamp by 3600\nfunc UnixHour() uint64 {\n\treturn UnixTimestamp() / 3600\n}\n"
},
{
"path": "pkg/feishu/feishu.go",
"content": "package feishu\n\nimport (\n\t\"bytes\"\n\t\"context\"\n\t\"fmt\"\n\t\"net/url\"\n\t\"strings\"\n\t\"sync\"\n\t\"time\"\n\n\t\"github.com/ccfos/nightingale/v6/storage\"\n\t\"github.com/google/uuid\"\n\t\"github.com/pkg/errors\"\n\t\"github.com/toolkits/pkg/logger\"\n\n\tlark \"github.com/larksuite/oapi-sdk-go/v3\"\n\tlarkcore \"github.com/larksuite/oapi-sdk-go/v3/core\"\n\tlarkauthen \"github.com/larksuite/oapi-sdk-go/v3/service/authen/v1\"\n\tlarkcontact \"github.com/larksuite/oapi-sdk-go/v3/service/contact/v3\"\n)\n\nconst defaultAuthURL = \"https://accounts.feishu.cn/open-apis/authen/v1/authorize\"\nconst SsoTypeName = \"feishu\"\n\ntype SsoClient struct {\n\tEnable bool\n\tFeiShuConfig *Config `json:\"-\"`\n\tCtx context.Context\n\tclient *lark.Client\n\tsync.RWMutex\n}\n\ntype Config struct {\n\tEnable bool `json:\"enable\"`\n\tAuthURL string `json:\"auth_url\"`\n\tDisplayName string `json:\"display_name\"`\n\tAppID string `json:\"app_id\"`\n\tAppSecret string `json:\"app_secret\"`\n\tRedirectURL string `json:\"redirect_url\"`\n\tUsernameField string `json:\"username_field\"` // name, email, phone\n\tFeiShuEndpoint string `json:\"feishu_endpoint\"` // 飞书API端点,默认为 open.feishu.cn\n\tProxy string `json:\"proxy\"`\n\tCoverAttributes bool `json:\"cover_attributes\"`\n\tDefaultRoles []string `json:\"default_roles\"`\n\tDefaultUserGroups []int64 `json:\"default_user_groups\"`\n}\n\ntype CallbackOutput struct {\n\tRedirect string `json:\"redirect\"`\n\tMsg string `json:\"msg\"`\n\tAccessToken string `json:\"accessToken\"`\n\tUsername string `json:\"Username\"`\n\tNickname string `json:\"Nickname\"`\n\tPhone string `yaml:\"Phone\"`\n\tEmail string `yaml:\"Email\"`\n}\n\nfunc wrapStateKey(key string) string {\n\treturn \"n9e_feishu_oauth_\" + key\n}\n\n// createClient 创建飞书SDK客户端(v3版本)\nfunc (c *Config) createClient() (*lark.Client, error) {\n\topts := []lark.ClientOptionFunc{\n\t\tlark.WithLogLevel(larkcore.LogLevelInfo),\n\t\tlark.WithEnableTokenCache(true), // 启用token缓存\n\t}\n\n\tif c.FeiShuEndpoint != \"\" {\n\t\tlark.FeishuBaseUrl = c.FeiShuEndpoint\n\t}\n\n\t// 创建客户端(v3版本)\n\tclient := lark.NewClient(\n\t\tc.AppID,\n\t\tc.AppSecret,\n\t\topts...,\n\t)\n\n\treturn client, nil\n}\n\nfunc New(cf Config) *SsoClient {\n\tvar s = &SsoClient{}\n\tif !cf.Enable {\n\t\treturn s\n\t}\n\ts.Reload(cf)\n\treturn s\n}\n\nfunc (s *SsoClient) AuthCodeURL(state string) (string, error) {\n\tvar buf bytes.Buffer\n\tfeishuAuthURL := defaultAuthURL\n\tif s.FeiShuConfig.AuthURL != \"\" {\n\t\tfeishuAuthURL = s.FeiShuConfig.AuthURL\n\t}\n\tbuf.WriteString(feishuAuthURL)\n\tv := url.Values{\n\t\t\"app_id\": {s.FeiShuConfig.AppID},\n\t\t\"state\": {state},\n\t}\n\tv.Set(\"redirect_uri\", s.FeiShuConfig.RedirectURL)\n\n\tif s.FeiShuConfig.RedirectURL == \"\" {\n\t\treturn \"\", errors.New(\"FeiShu OAuth RedirectURL is empty\")\n\t}\n\n\tif strings.Contains(feishuAuthURL, \"?\") {\n\t\tbuf.WriteByte('&')\n\t} else {\n\t\tbuf.WriteByte('?')\n\t}\n\tbuf.WriteString(v.Encode())\n\n\treturn buf.String(), nil\n}\n\n// GetUserToken 通过授权码获取用户access token和user_id(使用SDK v3)\nfunc (s *SsoClient) GetUserToken(code string) (string, string, error) {\n\tif s.client == nil {\n\t\treturn \"\", \"\", errors.New(\"feishu client is not initialized\")\n\t}\n\n\tctx := context.Background()\n\n\t// 使用SDK v3的authen服务获取access token\n\treq := larkauthen.NewCreateAccessTokenReqBuilder().\n\t\tBody(larkauthen.NewCreateAccessTokenReqBodyBuilder().\n\t\t\tGrantType(\"authorization_code\").\n\t\t\tCode(code).\n\t\t\tBuild()).\n\t\tBuild()\n\n\tresp, err := s.client.Authen.AccessToken.Create(ctx, req)\n\tif err != nil {\n\t\treturn \"\", \"\", fmt.Errorf(\"feishu get access token error: %w\", err)\n\t}\n\n\t// 检查响应\n\tif !resp.Success() {\n\t\treturn \"\", \"\", fmt.Errorf(\"feishu api error: code=%d, msg=%s\", resp.Code, resp.Msg)\n\t}\n\n\tif resp.Data == nil {\n\t\treturn \"\", \"\", errors.New(\"feishu api returned empty data\")\n\t}\n\n\tuserID := \"\"\n\tif resp.Data.UserId != nil {\n\t\tuserID = *resp.Data.UserId\n\t}\n\tif userID == \"\" {\n\t\treturn \"\", \"\", errors.New(\"feishu api returned empty user_id\")\n\t}\n\n\taccessToken := \"\"\n\tif resp.Data.AccessToken != nil {\n\t\taccessToken = *resp.Data.AccessToken\n\t}\n\tif accessToken == \"\" {\n\t\treturn \"\", \"\", errors.New(\"feishu api returned empty access_token\")\n\t}\n\n\treturn accessToken, userID, nil\n}\n\n// GetUserInfo 通过user_id获取用户详细信息(使用SDK v3)\n// 注意:SDK内部会自动管理token,所以不需要传入accessToken\nfunc (s *SsoClient) GetUserInfo(userID string) (*larkcontact.GetUserRespData, error) {\n\tif s.client == nil {\n\t\treturn nil, errors.New(\"feishu client is not initialized\")\n\t}\n\n\tctx := context.Background()\n\n\t// 使用SDK v3的contact服务获取用户详情\n\treq := larkcontact.NewGetUserReqBuilder().\n\t\tUserId(userID).\n\t\tUserIdType(larkcontact.UserIdTypeUserId).\n\t\tBuild()\n\n\tresp, err := s.client.Contact.User.Get(ctx, req)\n\tif err != nil {\n\t\treturn nil, fmt.Errorf(\"feishu get user detail error: %w\", err)\n\t}\n\n\t// 检查响应\n\tif !resp.Success() {\n\t\treturn nil, fmt.Errorf(\"feishu api error: code=%d, msg=%s\", resp.Code, resp.Msg)\n\t}\n\n\tif resp.Data == nil || resp.Data.User == nil {\n\t\treturn nil, errors.New(\"feishu api returned empty user data\")\n\t}\n\n\treturn resp.Data, nil\n}\n\nfunc (s *SsoClient) Reload(feishuConfig Config) {\n\ts.Lock()\n\tdefer s.Unlock()\n\ts.Enable = feishuConfig.Enable\n\ts.FeiShuConfig = &feishuConfig\n\n\t// 重新创建客户端\n\tif feishuConfig.Enable && feishuConfig.AppID != \"\" && feishuConfig.AppSecret != \"\" {\n\t\tclient, err := feishuConfig.createClient()\n\t\tif err != nil {\n\t\t\tlogger.Errorf(\"create feishu client error: %v\", err)\n\t\t} else {\n\t\t\ts.client = client\n\t\t}\n\t}\n}\n\nfunc (s *SsoClient) GetDisplayName() string {\n\ts.RLock()\n\tdefer s.RUnlock()\n\tif !s.Enable {\n\t\treturn \"\"\n\t}\n\n\treturn s.FeiShuConfig.DisplayName\n}\n\nfunc (s *SsoClient) Authorize(redis storage.Redis, redirect string) (string, error) {\n\tstate := uuid.New().String()\n\tctx := context.Background()\n\n\terr := redis.Set(ctx, wrapStateKey(state), redirect, time.Duration(300*time.Second)).Err()\n\tif err != nil {\n\t\treturn \"\", err\n\t}\n\n\ts.RLock()\n\tdefer s.RUnlock()\n\n\treturn s.AuthCodeURL(state)\n}\n\nfunc (s *SsoClient) Callback(redis storage.Redis, ctx context.Context, code, state string) (*CallbackOutput, error) {\n\t// 通过code获取access token和user_id\n\taccessToken, userID, err := s.GetUserToken(code)\n\tif err != nil {\n\t\treturn nil, fmt.Errorf(\"feishu GetUserToken error: %s\", err)\n\t}\n\n\t// 获取用户详细信息\n\tuserData, err := s.GetUserInfo(userID)\n\tif err != nil {\n\t\treturn nil, fmt.Errorf(\"feishu GetUserInfo error: %s\", err)\n\t}\n\n\t// 获取redirect URL\n\tredirect := \"\"\n\tif redis != nil {\n\t\tredirect, err = fetchRedirect(redis, ctx, state)\n\t\tif err != nil {\n\t\t\tlogger.Errorf(\"get redirect err:%v code:%s state:%s\", err, code, state)\n\t\t}\n\t}\n\tif redirect == \"\" {\n\t\tredirect = \"/\"\n\t}\n\n\terr = deleteRedirect(redis, ctx, state)\n\tif err != nil {\n\t\tlogger.Errorf(\"delete redirect err:%v code:%s state:%s\", err, code, state)\n\t}\n\n\tvar callbackOutput CallbackOutput\n\tif userData == nil || userData.User == nil {\n\t\treturn nil, fmt.Errorf(\"feishu GetUserInfo failed, user data is nil\")\n\t}\n\n\tuser := userData.User\n\tlogger.Debugf(\"feishu get user info userID %s result %+v\", userID, user)\n\n\t// 提取用户信息\n\tusername := \"\"\n\tif user.UserId != nil {\n\t\tusername = *user.UserId\n\t}\n\tif username == \"\" {\n\t\treturn nil, errors.New(\"feishu user_id is empty\")\n\t}\n\n\tnickname := \"\"\n\tif user.Name != nil {\n\t\tnickname = *user.Name\n\t}\n\n\tphone := \"\"\n\tif user.Mobile != nil {\n\t\tphone = *user.Mobile\n\t}\n\n\temail := \"\"\n\tif user.Email != nil {\n\t\temail = *user.Email\n\t}\n\n\tif email == \"\" {\n\t\tif user.EnterpriseEmail != nil {\n\t\t\temail = *user.EnterpriseEmail\n\t\t}\n\t}\n\n\tcallbackOutput.Redirect = redirect\n\tcallbackOutput.AccessToken = accessToken\n\n\t// 根据UsernameField配置确定username\n\tswitch s.FeiShuConfig.UsernameField {\n\tcase \"name\":\n\t\tif nickname == \"\" {\n\t\t\treturn nil, errors.New(\"feishu user name is empty\")\n\t\t}\n\t\tcallbackOutput.Username = nickname\n\tcase \"phone\":\n\t\tif phone == \"\" {\n\t\t\treturn nil, errors.New(\"feishu user phone is empty\")\n\t\t}\n\t\tcallbackOutput.Username = phone\n\tdefault:\n\t\tif email == \"\" {\n\t\t\treturn nil, errors.New(\"feishu user email is empty\")\n\t\t}\n\t\tcallbackOutput.Username = email\n\t}\n\n\tcallbackOutput.Nickname = nickname\n\tcallbackOutput.Email = email\n\tcallbackOutput.Phone = phone\n\n\treturn &callbackOutput, nil\n}\n\nfunc fetchRedirect(redis storage.Redis, ctx context.Context, state string) (string, error) {\n\treturn redis.Get(ctx, wrapStateKey(state)).Result()\n}\n\nfunc deleteRedirect(redis storage.Redis, ctx context.Context, state string) error {\n\treturn redis.Del(ctx, wrapStateKey(state)).Err()\n}\n"
},
{
"path": "pkg/flashduty/post.go",
"content": "package flashduty\n\nimport (\n\t\"bytes\"\n\t\"encoding/json\"\n\t\"fmt\"\n\t\"io\"\n\t\"net/http\"\n\t\"net/url\"\n\t\"time\"\n\n\t\"github.com/ccfos/nightingale/v6/center/cconf\"\n\n\t\"github.com/toolkits/pkg/logger\"\n)\n\nvar (\n\tApi string\n\tHeaders map[string]string\n\tTimeout time.Duration\n)\n\nfunc Init(fdConf cconf.FlashDuty) {\n\tApi = fdConf.Api\n\tHeaders = make(map[string]string)\n\tHeaders = fdConf.Headers\n\n\tif fdConf.Timeout == 0 {\n\t\tTimeout = 5 * time.Second\n\t} else {\n\t\tTimeout = fdConf.Timeout * time.Millisecond\n\t}\n}\n\ntype dutyResp[T any] struct {\n\tRequestId string `json:\"request_id\"`\n\tData T `json:\"data\"`\n\tError struct {\n\t\tCode string `json:\"code\"`\n\t\tMessage string `json:\"message\"`\n\t} `json:\"error\"`\n}\ntype TeamInfo struct {\n\tTeamID int64 `json:\"team_id\"`\n\tTeamName string `json:\"team_name\"`\n\tDescription string `json:\"description\"`\n\tCreatedAt int64 `json:\"created_at\"`\n\tUpdatedAt int64 `json:\"updated_at\"`\n\tUpdatedBy int64 `json:\"updated_by\"`\n\tUpdatedByName string `json:\"updated_by_name\"`\n\tCreatorID int64 `json:\"creator_id\"`\n\tRefID string `json:\"ref_id\"`\n\tPersonIDs []int64 `json:\"person_ids\"`\n}\n\ntype Data struct {\n\tP int `json:\"p\"`\n\tLimit int `json:\"limit\"`\n\tTotal int `json:\"total\"`\n\tItems []Item `json:\"items\"`\n}\n\ntype Item struct {\n\tMemberID int `json:\"member_id\"`\n\tMemberName string `json:\"member_name\"`\n\tPhone string `json:\"phone\"`\n\tEmail string `json:\"email\"`\n\tEmailVerified string `json:\"email_verified\"`\n\tRefID string `json:\"ref_id\"`\n}\n\nfunc PostFlashDuty(path string, appKey string, body interface{}) error {\n\t_, err := PostFlashDutyWithResp[Data](path, appKey, body)\n\treturn err\n}\n\nfunc PostFlashDutyWithResp[T any](path string, appKey string, body interface{}) (T, error) {\n\turlParams := url.Values{}\n\turlParams.Add(\"app_key\", appKey)\n\tvar url string\n\tif Api != \"\" {\n\t\turl = fmt.Sprintf(\"%s%s?%s\", Api, path, urlParams.Encode())\n\t} else {\n\t\turl = fmt.Sprintf(\"%s%s?%s\", \"https://api.flashcat.cloud\", path, urlParams.Encode())\n\t}\n\tresponse, code, err := PostJSON(url, Timeout, Headers, body)\n\treq, _ := json.Marshal(body)\n\tlogger.Infof(\"flashduty post: url=%s, req=%s; response=%s, code=%d\", url, string(req), string(response), code)\n\n\tvar resp dutyResp[T]\n\tif err == nil {\n\t\te := json.Unmarshal(response, &resp)\n\t\tif e == nil && resp.Error.Message != \"\" {\n\t\t\terr = fmt.Errorf(\"flashduty post error: %s\", resp.Error.Message)\n\t\t}\n\t}\n\n\treturn resp.Data, err\n}\n\nfunc PostJSON(url string, timeout time.Duration, headers map[string]string, v interface{}, retries ...int) (response []byte, code int, err error) {\n\tvar bs []byte\n\n\tbs, err = json.Marshal(v)\n\tif err != nil {\n\t\treturn\n\t}\n\n\tbf := bytes.NewBuffer(bs)\n\n\tclient := http.Client{\n\t\tTimeout: timeout,\n\t}\n\n\treq, err := http.NewRequest(\"POST\", url, bf)\n\tif err != nil {\n\t\treturn\n\t}\n\treq.Header.Set(\"Content-Type\", \"application/json\")\n\n\tif len(headers) > 0 {\n\t\tfor k, v := range headers {\n\t\t\treq.Header.Set(k, v)\n\t\t}\n\t}\n\n\tvar resp *http.Response\n\n\tif len(retries) > 0 {\n\t\tfor i := 0; i < retries[0]; i++ {\n\t\t\tresp, err = client.Do(req)\n\t\t\tif err == nil {\n\t\t\t\tbreak\n\t\t\t}\n\n\t\t\ttryagain := \"\"\n\t\t\tif i+1 < retries[0] {\n\t\t\t\ttryagain = \" try again\"\n\t\t\t}\n\n\t\t\tlogger.Warningf(\"failed to curl %s error: %s\"+tryagain, url, err)\n\n\t\t\tif i+1 < retries[0] {\n\t\t\t\ttime.Sleep(time.Millisecond * 200)\n\t\t\t}\n\t\t}\n\t} else {\n\t\tresp, err = client.Do(req)\n\t}\n\n\tif err != nil {\n\t\treturn\n\t}\n\n\tcode = resp.StatusCode\n\n\tif resp.Body != nil {\n\t\tdefer resp.Body.Close()\n\t\tresponse, err = io.ReadAll(resp.Body)\n\t}\n\n\treturn\n}\n"
},
{
"path": "pkg/flashduty/sync_user.go",
"content": "package flashduty\n\nimport (\n\t\"errors\"\n\t\"strconv\"\n\t\"strings\"\n\n\t\"github.com/ccfos/nightingale/v6/models\"\n\t\"github.com/ccfos/nightingale/v6/pkg/ctx\"\n\n\t\"github.com/toolkits/pkg/logger\"\n)\n\nfunc SyncUsersChange(ctx *ctx.Context, dbUsers []*models.User) error {\n\tif !ctx.IsCenter {\n\t\treturn nil\n\t}\n\n\tappKey, err := models.ConfigsGetFlashDutyAppKey(ctx)\n\tif err != nil {\n\t\treturn err\n\t}\n\n\treq := make(map[string]interface{})\n\treq[\"limit\"] = 100\n\tuserList, err := PostFlashDutyWithResp[Data](\"/member/list\", appKey, req)\n\tif err != nil {\n\t\treturn err\n\t}\n\n\ttotal := userList.Total\n\titems := []Item{}\n\tfor i := 0; i < total/100+1; i++ {\n\t\treq[\"p\"] = i\n\t\treq[\"limit\"] = 100\n\t\tresp, err := PostFlashDutyWithResp[Data](\"/member/list\", appKey, req)\n\t\tif err != nil {\n\t\t\treturn err\n\t\t}\n\t\titems = append(items, resp.Items...)\n\t}\n\n\tdutyUsers := make(map[int64]*models.User, len(items))\n\tfor i := range items {\n\t\tif items[i].RefID != \"\" {\n\t\t\tid, _ := strconv.ParseInt(items[i].RefID, 10, 64)\n\t\t\tuser := &models.User{\n\t\t\t\tUsername: items[i].MemberName,\n\t\t\t\tEmail: items[i].Email,\n\t\t\t\tPhone: items[i].Phone,\n\t\t\t\tId: id,\n\t\t\t}\n\t\t\tdutyUsers[id] = user\n\t\t}\n\n\t}\n\n\tdbUsersHas := sliceToMap(dbUsers)\n\n\tdelUsers := diffMap(dutyUsers, dbUsersHas)\n\tfdDelUsers(appKey, delUsers)\n\n\taddUsers := diffMap(dbUsersHas, dutyUsers)\n\tif err := fdAddUsers(appKey, addUsers); err != nil {\n\t\treturn err\n\t}\n\tupdateUser(appKey, dbUsersHas, dutyUsers)\n\treturn nil\n}\n\nfunc sliceToMap(dbUsers []*models.User) map[int64]*models.User {\n\tm := make(map[int64]*models.User, len(dbUsers))\n\tfor _, user := range dbUsers {\n\t\tm[user.Id] = user\n\t}\n\treturn m\n}\n\n// in m1 and not in m2\nfunc diffMap(m1, m2 map[int64]*models.User) []models.User {\n\tvar diff []models.User\n\tfor i := range m1 {\n\t\tif _, ok := m2[i]; !ok {\n\t\t\tdiff = append(diff, *m1[i])\n\t\t}\n\t}\n\treturn diff\n}\nfunc updateUser(appKey string, m1, m2 map[int64]*models.User) {\n\tfor i := range m1 {\n\t\tif _, ok := m2[i]; ok {\n\t\t\tif m1[i].Email != m2[i].Email || !PhoneIsSame(m1[i].Phone, m2[i].Phone) || m1[i].Username != m2[i].Username {\n\t\t\t\tvar flashdutyUser User\n\n\t\t\t\tflashdutyUser = User{\n\t\t\t\t\tRefID: strconv.FormatInt(m1[i].Id, 10),\n\t\t\t\t}\n\t\t\t\tflashdutyUser.Updates = Updates{\n\t\t\t\t\tPhone: m1[i].Phone,\n\t\t\t\t\tEmail: m1[i].Email,\n\t\t\t\t\tMemberName: m1[i].Username,\n\t\t\t\t\tRefID: strconv.FormatInt(m1[i].Id, 10),\n\t\t\t\t}\n\t\t\t\terr := flashdutyUser.UpdateMember(appKey)\n\t\t\t\tif err != nil {\n\t\t\t\t\tlogger.Errorf(\"failed to update user: %v\", err)\n\t\t\t\t}\n\t\t\t}\n\t\t}\n\t}\n}\n\nfunc PhoneIsSame(phone1, phone2 string) bool {\n\t// 兼容不同国家/地区前缀,例如 +86、+1、+44 等,以及包含空格或短横线的格式\n\tnormalize := func(p string) string {\n\t\tp = strings.TrimSpace(p)\n\t\tp = strings.ReplaceAll(p, \" \", \"\")\n\t\tp = strings.ReplaceAll(p, \"-\", \"\")\n\t\tp = strings.TrimPrefix(p, \"+\")\n\t\treturn p\n\t}\n\n\tp1 := normalize(phone1)\n\tp2 := normalize(phone2)\n\n\tif p1 == p2 {\n\t\treturn true\n\t}\n\n\t// 如果长度相差不超过 3 且较长的以较短的结尾,则认为是相同号码(忽略最多 3 位国家区号差异)\n\tif len(p1) > len(p2) {\n\t\treturn len(p1)-len(p2) <= 3 && strings.HasSuffix(p1, p2)\n\t}\n\treturn len(p2)-len(p1) <= 3 && strings.HasSuffix(p2, p1)\n}\n\ntype User struct {\n\tEmail string `json:\"email,omitempty\"`\n\tPhone string `json:\"phone,omitempty\"`\n\tMemberName string `json:\"member_name,omitempty\"`\n\tRefID string `json:\"ref_id,omitempty\"`\n\tUpdates Updates `json:\"updates,omitempty\"`\n}\n\ntype Updates struct {\n\tRefID string `json:\"ref_id,omitempty\"`\n\tEmail string `json:\"email,omitempty\"`\n\tPhone string `json:\"phone,omitempty\"`\n\tMemberName string `json:\"member_name,omitempty\"`\n\tCountryCode string `json:\"country_code,omitempty\"`\n}\n\nfunc (user *User) delMember(appKey string) error {\n\tif user.RefID == \"\" {\n\t\treturn errors.New(\"refID must not be empty\")\n\t}\n\tuserDel := &User{RefID: user.RefID}\n\treturn PostFlashDuty(\"/member/delete\", appKey, userDel)\n}\n\nfunc (user *User) UpdateMember(appKey string) error {\n\n\treturn PostFlashDuty(\"/member/info/reset\", appKey, user)\n}\n\ntype Members struct {\n\tUsers []User `json:\"members\"`\n}\n\nfunc (m *Members) addMembers(appKey string) error {\n\tif len(m.Users) == 0 {\n\t\treturn nil\n\t}\n\tvalidUsers := make([]User, 0, len(m.Users))\n\tfor _, user := range m.Users {\n\t\tif user.RefID == \"\" || (user.Phone == \"\" && user.Email == \"\") {\n\t\t\tlogger.Errorf(\"user(%+v) refID must not be none, Email or Phone can not be none\", user)\n\t\t} else {\n\t\t\tvalidUsers = append(validUsers, user)\n\t\t}\n\t}\n\tif len(validUsers) == 0 {\n\t\treturn nil\n\t}\n\tm.Users = validUsers\n\treturn PostFlashDuty(\"/member/invite\", appKey, m)\n}\n\nfunc fdAddUsers(appKey string, users []models.User) error {\n\tfdUsers := usersToFdUsers(users)\n\tmembers := &Members{\n\t\tUsers: fdUsers,\n\t}\n\treturn members.addMembers(appKey)\n}\n\nfunc fdDelUsers(appKey string, users []models.User) {\n\tfdUsers := usersToFdUsers(users)\n\tfor _, fdUser := range fdUsers {\n\t\tif err := fdUser.delMember(appKey); err != nil {\n\t\t\tlogger.Errorf(\"failed to delete user: %v\", err)\n\t\t}\n\t}\n}\n\nfunc usersToFdUsers(users []models.User) []User {\n\tfdUsers := make([]User, 0, len(users))\n\tfor i := range users {\n\t\tfdUsers = append(fdUsers, User{\n\t\t\tRefID: strconv.FormatInt(users[i].Id, 10),\n\t\t\tPhone: users[i].Phone,\n\t\t\tEmail: users[i].Email,\n\t\t\tMemberName: users[i].Username,\n\t\t})\n\n\t}\n\treturn fdUsers\n}\n\nfunc UpdateUser(ctx *ctx.Context, target models.User, email, phone string) {\n\t//contact := target.FindSameContact(email, phone)\n\tif target.Id == 0 {\n\t\tlogger.Errorf(\"user not found: %s\", target.Username)\n\t\treturn\n\t}\n\tif email == \"\" && phone == \"\" {\n\t\tlogger.Errorf(\"email and phone are both empty: %s\", target.Username)\n\t\treturn\n\t}\n\tvar flashdutyUser User\n\trefID := strconv.FormatInt(target.Id, 10)\n\n\tflashdutyUser = User{\n\t\tRefID: refID,\n\t}\n\tflashdutyUser.Updates = Updates{\n\t\tPhone: phone,\n\t\tEmail: email,\n\t\tMemberName: target.Username,\n\t\tRefID: refID,\n\t}\n\tappKey, err := models.ConfigsGetFlashDutyAppKey(ctx)\n\tif err != nil {\n\t\tlogger.Errorf(\"failed to get flashduty app key: %v\", err)\n\t\treturn\n\t}\n\terr = flashdutyUser.UpdateMember(appKey)\n\tif err != nil && strings.Contains(err.Error(), \"no member found\") {\n\t\t// 如果没有找到成员,说明需要新建成员\n\t\tNewUser := &User{\n\t\t\tPhone: phone,\n\t\t\tEmail: email,\n\t\t\tMemberName: target.Username,\n\t\t\tRefID: refID,\n\t\t}\n\t\terr = PostFlashDuty(\"/member/invite\", appKey, NewUser)\n\t\tif err != nil {\n\t\t\tlogger.Errorf(\"failed to update user: %v\", err)\n\t\t}\n\t\treturn\n\n\t}\n\tif err != nil {\n\t\tlogger.Errorf(\"failed to update user: %v\", err)\n\t}\n}\n"
},
{
"path": "pkg/flashduty/sync_user_group.go",
"content": "package flashduty\n\nimport (\n\t\"errors\"\n\t\"strconv\"\n\t\"strings\"\n\n\t\"github.com/ccfos/nightingale/v6/models\"\n\t\"github.com/ccfos/nightingale/v6/pkg/ctx\"\n\n\t\"github.com/toolkits/pkg/logger\"\n)\n\ntype UserGroupSyncer struct {\n\tctx *ctx.Context\n\tug *models.UserGroup\n\tappKey string\n\tteamID int64\n}\n\nfunc NewUserGroupSyncer(ctx *ctx.Context, ug *models.UserGroup) (*UserGroupSyncer, error) {\n\tappKey, err := models.ConfigsGetFlashDutyAppKey(ctx)\n\tif err != nil {\n\t\treturn nil, err\n\t}\n\n\treturn &UserGroupSyncer{\n\t\tctx: ctx,\n\t\tug: ug,\n\t\tappKey: appKey,\n\t}, nil\n}\n\nfunc (ugs *UserGroupSyncer) SyncUGAdd() error {\n\t// 新建团队(无用户仅有团队名称)\n\tfdt := Team{\n\t\tTeamName: ugs.ug.Name,\n\t\tRefID: strconv.FormatInt(ugs.ug.Id, 10),\n\t}\n\terr := fdt.UpdateTeam(ugs.appKey)\n\tif err != nil {\n\t\treturn err\n\t}\n\treturn ugs.syncTeamMember()\n}\n\nfunc (ugs *UserGroupSyncer) SyncUGPut() error {\n\t// 修改为查询 ref_ID\n\trefID := strconv.FormatInt(ugs.ug.Id, 10)\n\tteamID, err := ugs.CheckTeam(refID)\n\t// 如果没有找到团队,说明是新建的团队\n\tugs.teamID = teamID\n\tif err != nil && strings.Contains(err.Error(), \"no team found by ref_id\") {\n\t\temails := make([]string, 0)\n\t\tphones := make([]string, 0)\n\n\t\tfor _, user := range ugs.ug.Users {\n\t\t\tif user.Email != \"\" {\n\t\t\t\temails = append(emails, user.Email)\n\t\t\t} else if user.Phone != \"\" {\n\t\t\t\tphones = append(phones, user.Phone)\n\t\t\t} else {\n\t\t\t\tlogger.Warningf(\"The user %s has no email and phone, and failed to sync to flashduty's team\", user.Username)\n\t\t\t}\n\t\t}\n\t\t//根据 team_id 去更新 duty 中这个团队的信息\n\t\tfdt := Team{\n\t\t\tRefID: refID,\n\t\t\tTeamName: ugs.ug.Name,\n\t\t\tEmails: emails,\n\t\t\tPhones: phones,\n\t\t}\n\t\tif err := fdt.AddTeam(ugs.appKey); err != nil {\n\t\t\treturn err\n\t\t}\n\n\t\tif err := ugs.syncTeamMember(); err != nil {\n\t\t\treturn err\n\t\t}\n\t\treturn nil\n\t}\n\tif err != nil {\n\t\treturn err\n\t}\n\temails := make([]string, 0)\n\tphones := make([]string, 0)\n\n\tfor _, user := range ugs.ug.Users {\n\t\tif user.Email != \"\" {\n\t\t\temails = append(emails, user.Email)\n\t\t} else if user.Phone != \"\" {\n\t\t\tphones = append(phones, user.Phone)\n\t\t} else {\n\t\t\tlogger.Warningf(\"The user %s has no email and phone, and failed to sync to flashduty's team\", user.Username)\n\t\t}\n\t}\n\t//根据 team_id 去更新 duty 中这个团队的信息\n\tfdt := Team{\n\t\tTeamID: teamID,\n\t\tRefID: refID,\n\t\tTeamName: ugs.ug.Name,\n\t\tEmails: emails,\n\t\tPhones: phones,\n\t}\n\n\tif err := fdt.UpdateTeam(ugs.appKey); err != nil {\n\t\treturn err\n\t}\n\tif err := ugs.syncTeamMember(); err != nil {\n\t\treturn err\n\t}\n\treturn nil\n}\n\nfunc (ugs *UserGroupSyncer) SyncUGDel() error {\n\tfdt := Team{\n\t\tRefID: strconv.FormatInt(ugs.ug.Id, 10),\n\t}\n\terr := fdt.DelTeam(ugs.appKey)\n\treturn err\n}\n\nfunc (ugs *UserGroupSyncer) SyncMembersAdd() error {\n\treturn ugs.syncTeamMember()\n}\n\nfunc (ugs *UserGroupSyncer) SyncMembersDel() error {\n\treturn ugs.syncTeamMember()\n}\n\nfunc (ugs *UserGroupSyncer) syncTeamMember() error {\n\tuids, err := models.MemberIds(ugs.ctx, ugs.ug.Id)\n\tif err != nil {\n\t\treturn err\n\t}\n\tusers, err := models.UserGetsByIds(ugs.ctx, uids)\n\tif err != nil {\n\t\treturn err\n\t}\n\n\ttoDutyErr := ugs.addMemberToFDTeam(users)\n\tif toDutyErr != nil {\n\t\tlogger.Warningf(\"failed to sync user group %s %v to flashduty's team: %v\", ugs.ug.Name, users, toDutyErr)\n\t}\n\n\treturn err\n}\n\nfunc (ugs *UserGroupSyncer) addMemberToFDTeam(users []models.User) error {\n\tif err := fdAddUsers(ugs.appKey, users); err != nil {\n\t\treturn err\n\t}\n\n\temails := make([]string, 0)\n\tphones := make([]string, 0)\n\tfor _, user := range users {\n\t\tif user.Email != \"\" {\n\t\t\temails = append(emails, user.Email)\n\t\t} else if user.Phone != \"\" {\n\t\t\tphones = append(phones, user.Phone)\n\t\t} else {\n\t\t\tlogger.Warningf(\"The user %s has no email and phone, and failed to sync to flashduty's team\", user.Username)\n\t\t}\n\t}\n\tteamID := ugs.teamID\n\trefID := strconv.FormatInt(ugs.ug.Id, 10)\n\tvar err error\n\tif teamID == 0 {\n\t\tteamID, err = ugs.CheckTeam(refID)\n\t\tif err != nil {\n\t\t\tlogger.Warningf(\"CheckTeam failed for refID=%v: %v\", refID, err)\n\t\t}\n\t}\n\n\tfdt := Team{\n\t\tTeamID: teamID,\n\t\tTeamName: ugs.ug.Name,\n\t\tEmails: emails,\n\t\tPhones: phones,\n\t\tRefID: refID,\n\t}\n\terr = fdt.UpdateTeam(ugs.appKey)\n\treturn err\n}\n\ntype Team struct {\n\tTeamID int64 `json:\"team_id\"`\n\tTeamName string `json:\"team_name\"`\n\tResetIfNameExist bool `json:\"reset_if_name_exist\"`\n\tDescription string `json:\"description\"`\n\tEmails []string `json:\"emails\"`\n\tPhones []string `json:\"phones\"`\n\tRefID string `json:\"ref_id\"`\n}\n\nfunc (t *Team) AddTeam(appKey string) error {\n\tif t.TeamName == \"\" {\n\t\treturn errors.New(\"team_name must be set\")\n\t}\n\treturn PostFlashDuty(\"/team/upsert\", appKey, t)\n}\n\nfunc (t *Team) UpdateTeam(appKey string) error {\n\tt.ResetIfNameExist = true\n\terr := t.AddTeam(appKey)\n\treturn err\n}\n\nfunc (t *Team) DelTeam(appKey string) error {\n\terr := PostFlashDuty(\"/team/delete\", appKey, t)\n\treturn err\n}\n\nfunc NeedSyncTeam(ctx *ctx.Context) bool {\n\tconfigs, err := models.ConfigsSelectByCkey(ctx, \"flashduty_sync_team\")\n\tif err != nil {\n\t\tlogger.Warningf(\"failed to query flashduty_sync_team: %v\", err)\n\t\treturn false\n\t}\n\n\tif len(configs) == 0 || configs[0].Cval == \"\" {\n\t\treturn false\n\t}\n\n\treturn configs[0].Cval == \"true\"\n}\n\nfunc NeedSyncUser(ctx *ctx.Context) bool {\n\tconfigs, err := models.ConfigsSelectByCkey(ctx, \"flashduty_app_key\")\n\tif err != nil {\n\t\tlogger.Warningf(\"failed to query flashduty_app_key: %v\", err)\n\t\treturn false\n\t}\n\n\tif len(configs) == 0 || configs[0].Cval == \"\" {\n\t\treturn false\n\t}\n\n\treturn true\n}\n\n// CheckTeam 检查ref_id是否存在\nfunc (ugs *UserGroupSyncer) CheckTeam(ref_id string) (int64, error) {\n\t// Construct the request to query the team by name\n\tinfo, err := PostFlashDutyWithResp[TeamInfo](\"/team/info\", ugs.appKey, map[string]interface{}{\n\t\t\"ref_id\": ref_id,\n\t})\n\tif err != nil || info.TeamID == 0 {\n\t\treturn 0, err\n\t}\n\n\treturn info.TeamID, nil\n}\n"
},
{
"path": "pkg/flashduty/sync_user_test.go",
"content": "package flashduty\n\nimport \"testing\"\n\nfunc TestPhoneIsSame(t *testing.T) {\n\ttests := []struct {\n\t\tname string\n\t\tphone1 string\n\t\tphone2 string\n\t\tsame bool\n\t}{\n\t\t{\n\t\t\tname: \"blank\",\n\t\t\tphone1: \"\",\n\t\t\tphone2: \"\",\n\t\t\tsame: true,\n\t\t},\n\t\t{\n\t\t\tname: \"China +86 prefix\",\n\t\t\tphone1: \"+8613812345678\",\n\t\t\tphone2: \"13812345678\",\n\t\t\tsame: true,\n\t\t},\n\t\t{\n\t\t\tname: \"China +86 with spaces and hyphens\",\n\t\t\tphone1: \"+86 138-1234-5678\",\n\t\t\tphone2: \"13812345678\",\n\t\t\tsame: true,\n\t\t},\n\t\t{\n\t\t\tname: \"USA +1 prefix\",\n\t\t\tphone1: \"+1 234-567-8900\",\n\t\t\tphone2: \"2345678900\",\n\t\t\tsame: true,\n\t\t},\n\t\t{\n\t\t\tname: \"UK +44 prefix\",\n\t\t\tphone1: \"+442078765432\",\n\t\t\tphone2: \"2078765432\",\n\t\t\tsame: true,\n\t\t},\n\t\t{\n\t\t\tname: \"India +91 prefix\",\n\t\t\tphone1: \"+919876543210\",\n\t\t\tphone2: \"9876543210\",\n\t\t\tsame: true,\n\t\t},\n\t\t{\n\t\t\tname: \"Germany +49 prefix\",\n\t\t\tphone1: \"+4915123456789\",\n\t\t\tphone2: \"15123456789\",\n\t\t\tsame: true,\n\t\t},\n\t\t{\n\t\t\tname: \"Different numbers\",\n\t\t\tphone1: \"+8613812345678\",\n\t\t\tphone2: \"13812345679\",\n\t\t\tsame: false,\n\t\t},\n\t}\n\n\tfor _, tt := range tests {\n\t\tif got := PhoneIsSame(tt.phone1, tt.phone2); got != tt.same {\n\t\t\tt.Errorf(\"%s: expected %v, got %v\", tt.name, tt.same, got)\n\t\t}\n\t}\n}\n"
},
{
"path": "pkg/ginx/auth.go",
"content": "// Copyright 2014 Manu Martinez-Almeida. All rights reserved.\n// Use of this source code is governed by a MIT style\n// license that can be found in the LICENSE file.\n\npackage ginx\n\nimport (\n\t\"crypto/subtle\"\n\t\"encoding/base64\"\n\t\"net/http\"\n\t\"strconv\"\n\n\t\"github.com/gin-gonic/gin\"\n)\n\n// AuthUserKey is the cookie name for user credential in basic auth.\nconst AuthUserKey = \"user\"\n\n// Accounts defines a key/value for user/pass list of authorized logins.\ntype Accounts []Account\n\ntype Account struct {\n\tUser string\n\tPassword string\n}\n\ntype authPair struct {\n\tvalue string\n\tuser string\n}\n\ntype authPairs []authPair\n\nfunc (a authPairs) searchCredential(authValue string) (string, bool) {\n\tif authValue == \"\" {\n\t\treturn \"\", false\n\t}\n\tfor _, pair := range a {\n\t\tif subtle.ConstantTimeCompare(StringToBytes(pair.value), StringToBytes(authValue)) == 1 {\n\t\t\treturn pair.user, true\n\t\t}\n\t}\n\treturn \"\", false\n}\n\n// BasicAuthForRealm returns a Basic HTTP Authorization middleware. It takes as arguments a map[string]string where\n// the key is the user name and the value is the password, as well as the name of the Realm.\n// If the realm is empty, \"Authorization Required\" will be used by default.\n// (see http://tools.ietf.org/html/rfc2617#section-1.2)\nfunc BasicAuthForRealm(accounts Accounts, realm string) gin.HandlerFunc {\n\tif realm == \"\" {\n\t\trealm = \"Authorization Required\"\n\t}\n\trealm = \"Basic realm=\" + strconv.Quote(realm)\n\tpairs := processAccounts(accounts)\n\treturn func(c *gin.Context) {\n\t\t// Search user in the slice of allowed credentials\n\t\tuser, found := pairs.searchCredential(c.Request.Header.Get(\"Authorization\"))\n\t\tif !found {\n\t\t\t// Credentials doesn't match, we return 401 and abort handlers chain.\n\t\t\tc.Header(\"WWW-Authenticate\", realm)\n\t\t\tc.AbortWithStatus(http.StatusUnauthorized)\n\t\t\treturn\n\t\t}\n\n\t\t// The user credentials was found, set user's id to key AuthUserKey in this context, the user's id can be read later using\n\t\t// c.MustGet(gin.AuthUserKey).\n\t\tc.Set(AuthUserKey, user)\n\t}\n}\n\n// BasicAuth returns a Basic HTTP Authorization middleware. It takes as argument a map[string]string where\n// the key is the user name and the value is the password.\nfunc BasicAuth(accounts Accounts) gin.HandlerFunc {\n\treturn BasicAuthForRealm(accounts, \"\")\n}\n\nfunc processAccounts(accounts Accounts) authPairs {\n\tlength := len(accounts)\n\tassert1(length > 0, \"Empty list of authorized credentials\")\n\tpairs := make(authPairs, 0, length)\n\tfor _, account := range accounts {\n\t\tassert1(account.User != \"\", \"User can not be empty\")\n\t\tvalue := authorizationHeader(account.User, account.Password)\n\t\tpairs = append(pairs, authPair{\n\t\t\tvalue: value,\n\t\t\tuser: account.User,\n\t\t})\n\t}\n\treturn pairs\n}\n\nfunc authorizationHeader(user, password string) string {\n\tbase := user + \":\" + password\n\treturn \"Basic \" + base64.StdEncoding.EncodeToString(StringToBytes(base))\n}\n\nfunc assert1(guard bool, text string) {\n\tif !guard {\n\t\tpanic(text)\n\t}\n}\n"
},
{
"path": "pkg/ginx/bytesconv.go",
"content": "// Copyright 2023 Gin Core Team. All rights reserved.\n// Use of this source code is governed by a MIT style\n// license that can be found in the LICENSE file.\n\n//go:build go1.20\n\npackage ginx\n\nimport (\n\t\"unsafe\"\n)\n\n// StringToBytes converts string to byte slice without a memory allocation.\n// For more details, see https://github.com/golang/go/issues/53003#issuecomment-1140276077.\nfunc StringToBytes(s string) []byte {\n\treturn unsafe.Slice(unsafe.StringData(s), len(s))\n}\n\n// BytesToString converts byte slice to string without a memory allocation.\n// For more details, see https://github.com/golang/go/issues/53003#issuecomment-1140276077.\nfunc BytesToString(b []byte) string {\n\treturn unsafe.String(unsafe.SliceData(b), len(b))\n}\n"
},
{
"path": "pkg/ginx/errorx.go",
"content": "package ginx\n\nimport \"github.com/toolkits/pkg/errorx\"\n\nfunc Bomb(code int, format string, a ...interface{}) {\n\terrorx.Bomb(code, format, a...)\n}\n\nfunc Dangerous(v interface{}, code ...int) {\n\terrorx.Dangerous(v, code...)\n}\n"
},
{
"path": "pkg/ginx/funcs.go",
"content": "package ginx\n\nimport (\n\t\"github.com/gin-gonic/gin\"\n)\n\nfunc Offset(c *gin.Context, limit int, pagenoVarName ...string) int {\n\tif limit <= 0 {\n\t\tlimit = 10\n\t}\n\n\tpageno := \"p\"\n\tif len(pagenoVarName) > 0 {\n\t\tpageno = pagenoVarName[0]\n\t}\n\n\tpage := QueryInt(c, pageno, 1)\n\treturn (page - 1) * limit\n}\n"
},
{
"path": "pkg/ginx/param.go",
"content": "package ginx\n\nimport (\n\t\"net/http\"\n\t\"strconv\"\n\n\t\"github.com/gin-gonic/gin\"\n\t\"github.com/toolkits/pkg/errorx\"\n)\n\nfunc BindJSON(c *gin.Context, ptr interface{}) {\n\terr := c.ShouldBindJSON(ptr)\n\tif err != nil {\n\t\terrorx.Bomb(http.StatusBadRequest, \"json body invalid: %v\", err)\n\t}\n}\n\nfunc UrlParamStr(c *gin.Context, field string) string {\n\tval := c.Param(field)\n\n\tif val == \"\" {\n\t\terrorx.Bomb(http.StatusBadRequest, \"url param[%s] is blank\", field)\n\t}\n\n\treturn val\n}\n\nfunc UrlParamInt64(c *gin.Context, field string) int64 {\n\tstrval := UrlParamStr(c, field)\n\tintval, err := strconv.ParseInt(strval, 10, 64)\n\tif err != nil {\n\t\terrorx.Bomb(http.StatusBadRequest, \"cannot convert %s to int64\", strval)\n\t}\n\n\treturn intval\n}\n\nfunc UrlParamInt(c *gin.Context, field string) int {\n\treturn int(UrlParamInt64(c, field))\n}\n\nfunc QueryStr(c *gin.Context, key string, defaultVal ...string) string {\n\tval := c.Query(key)\n\tif val != \"\" {\n\t\treturn val\n\t}\n\n\tif len(defaultVal) == 0 {\n\t\terrorx.Bomb(http.StatusBadRequest, \"query param[%s] is necessary\", key)\n\t}\n\n\treturn defaultVal[0]\n}\n\nfunc QueryInt(c *gin.Context, key string, defaultVal ...int) int {\n\tstrv := c.Query(key)\n\tif strv != \"\" {\n\t\tintv, err := strconv.Atoi(strv)\n\t\tif err != nil {\n\t\t\terrorx.Bomb(http.StatusBadRequest, \"cannot convert [%s] to int\", strv)\n\t\t}\n\t\treturn intv\n\t}\n\n\tif len(defaultVal) == 0 {\n\t\terrorx.Bomb(http.StatusBadRequest, \"query param[%s] is necessary\", key)\n\t}\n\n\treturn defaultVal[0]\n}\n\nfunc QueryInt64(c *gin.Context, key string, defaultVal ...int64) int64 {\n\tstrv := c.Query(key)\n\tif strv != \"\" {\n\t\tintv, err := strconv.ParseInt(strv, 10, 64)\n\t\tif err != nil {\n\t\t\terrorx.Bomb(http.StatusBadRequest, \"cannot convert [%s] to int64\", strv)\n\t\t}\n\t\treturn intv\n\t}\n\n\tif len(defaultVal) == 0 {\n\t\terrorx.Bomb(http.StatusBadRequest, \"query param[%s] is necessary\", key)\n\t}\n\n\treturn defaultVal[0]\n}\n\nfunc QueryBool(c *gin.Context, key string, defaultVal ...bool) bool {\n\tstrv := c.Query(key)\n\tif strv != \"\" {\n\t\tif strv == \"true\" || strv == \"1\" || strv == \"on\" || strv == \"checked\" || strv == \"yes\" || strv == \"Y\" {\n\t\t\treturn true\n\t\t} else if strv == \"false\" || strv == \"0\" || strv == \"off\" || strv == \"no\" || strv == \"N\" {\n\t\t\treturn false\n\t\t} else {\n\t\t\terrorx.Bomb(http.StatusBadRequest, \"unknown arg[%s] value: %s\", key, strv)\n\t\t}\n\t}\n\n\tif len(defaultVal) == 0 {\n\t\terrorx.Bomb(http.StatusBadRequest, \"arg[%s] is necessary\", key)\n\t}\n\n\treturn defaultVal[0]\n}\n"
},
{
"path": "pkg/ginx/render.go",
"content": "package ginx\n\nimport (\n\t\"github.com/gin-gonic/gin\"\n\t\"github.com/toolkits/pkg/i18n\"\n)\n\ntype Render struct {\n\tcode int\n\tctx *gin.Context\n}\n\nfunc NewRender(c *gin.Context, code ...int) Render {\n\tr := Render{ctx: c}\n\tif len(code) > 0 {\n\t\tr.code = code[0]\n\t} else {\n\t\tr.code = 200\n\t}\n\treturn r\n}\n\nfunc (r Render) Message(v interface{}, a ...interface{}) {\n\trequestId := r.ctx.GetString(\"trace_id\")\n\tif v == nil {\n\t\tif r.code == 200 {\n\t\t\tr.ctx.JSON(r.code, gin.H{\"err\": \"\", \"request_id\": requestId})\n\t\t} else {\n\t\t\tr.ctx.String(r.code, \"\")\n\t\t}\n\t\treturn\n\t}\n\n\tswitch t := v.(type) {\n\tcase string:\n\t\tmsg := i18n.Sprintf(r.ctx.GetHeader(\"X-Language\"), t, a...)\n\t\tif r.code == 200 {\n\t\t\tr.ctx.JSON(r.code, gin.H{\"err\": msg, \"request_id\": requestId})\n\t\t} else {\n\t\t\tr.ctx.String(r.code, msg)\n\t\t}\n\tcase error:\n\t\tmsg := i18n.Sprintf(r.ctx.GetHeader(\"X-Language\"), t.Error(), a...)\n\t\tif r.code == 200 {\n\t\t\tr.ctx.JSON(r.code, gin.H{\"err\": msg, \"request_id\": requestId})\n\t\t} else {\n\t\t\tr.ctx.String(r.code, msg)\n\t\t}\n\t}\n}\n\nfunc (r Render) Data(data interface{}, err interface{}, a ...interface{}) {\n\tif err == nil {\n\t\tr.ctx.JSON(r.code, gin.H{\"dat\": data, \"err\": \"\", \"request_id\": r.ctx.GetString(\"trace_id\")})\n\t\treturn\n\t}\n\n\tr.Message(err, a...)\n}\n\nfunc (r Render) ZeroPage() {\n\tr.Data(gin.H{\n\t\t\"list\": []int{},\n\t\t\"total\": 0,\n\t}, nil)\n}\n"
},
{
"path": "pkg/hash/hash.go",
"content": "package hash\n\nimport (\n\t\"sort\"\n\t\"strings\"\n\n\tprommodel \"github.com/prometheus/common/model\"\n\t\"github.com/spaolacci/murmur3\"\n)\n\nfunc GetHash(m prommodel.Metric, ref string) uint64 {\n\tvar str string\n\tvar strs []string\n\t// get keys from m\n\tfor k, _ := range m {\n\t\tstrs = append(strs, string(k))\n\t}\n\n\t// sort keys use sort\n\tsort.Strings(strs)\n\n\tfor _, k := range strs {\n\t\tstr += \"/\"\n\t\tstr += k\n\t\tstr += \"/\"\n\t\tstr += string(m[prommodel.LabelName(k)])\n\t}\n\tstr += \"/\"\n\tstr += ref\n\n\treturn murmur3.Sum64([]byte(str))\n}\n\nfunc GetTagHash(m prommodel.Metric) uint64 {\n\tvar str string\n\tvar strs []string\n\t// get keys from m\n\tfor k, _ := range m {\n\t\tif k == \"__name__\" {\n\t\t\tcontinue\n\t\t}\n\t\tstrs = append(strs, string(k))\n\t}\n\n\t// sort keys use sort\n\tsort.Strings(strs)\n\n\tfor _, k := range strs {\n\t\tstr += \"/\"\n\t\tstr += k\n\t\tstr += \"/\"\n\t\tstr += string(m[prommodel.LabelName(k)])\n\t}\n\n\treturn murmur3.Sum64([]byte(str))\n}\n\nfunc GetTargetTagHash(m prommodel.Metric, target []string) uint64 {\n\tbuilder := strings.Builder{}\n\tfor _, k := range target {\n\t\tbuilder.WriteString(\"/\")\n\t\tbuilder.WriteString(k)\n\t\tbuilder.WriteString(\"/\")\n\t\tbuilder.WriteString(string(m[prommodel.LabelName(k)]))\n\t}\n\treturn murmur3.Sum64([]byte(builder.String()))\n}\n"
},
{
"path": "pkg/hash/hash_fnv.go",
"content": "/*\nCopyright 2015 The Kubernetes Authors.\n\nLicensed under the Apache License, Version 2.0 (the \"License\");\nyou may not use this file except in compliance with the License.\nYou may obtain a copy of the License at\n\n http://www.apache.org/licenses/LICENSE-2.0\n\nUnless required by applicable law or agreed to in writing, software\ndistributed under the License is distributed on an \"AS IS\" BASIS,\nWITHOUT WARRANTIES OR CONDITIONS OF ANY KIND, either express or implied.\nSee the License for the specific language governing permissions and\nlimitations under the License.\n*/\n\npackage hash\n\nimport (\n\t\"hash\"\n\n\t\"github.com/davecgh/go-spew/spew\"\n)\n\n// DeepHashObject writes specified object to hash using the spew library\n// which follows pointers and prints actual values of the nested objects\n// ensuring the hash does not change when a pointer changes.\nfunc DeepHashObject(hasher hash.Hash, objectToWrite interface{}) {\n\thasher.Reset()\n\tprinter := spew.ConfigState{\n\t\tIndent: \" \",\n\t\tSortKeys: true,\n\t\tDisableMethods: true,\n\t\tSpewKeys: true,\n\t}\n\tprinter.Fprintf(hasher, \"%#v\", objectToWrite)\n}\n"
},
{
"path": "pkg/hash/hash_md5.go",
"content": "package hash\n\nimport (\n\tprommodel \"github.com/prometheus/common/model\"\n\t\"github.com/toolkits/pkg/str\"\n)\n\nfunc GetHash2(m prommodel.Metric, ref string) string {\n\tvar s string\n\tfor k, v := range m {\n\t\ts += \"/\"\n\t\ts += string(k)\n\t\ts += \"/\"\n\t\ts += string(v)\n\t}\n\ts += \"/\"\n\ts += ref\n\treturn str.MD5(s)\n}\n\nfunc GetTagHash2(m prommodel.Metric) string {\n\tvar s string\n\tfor k, v := range m {\n\t\tif k == \"__name__\" {\n\t\t\tcontinue\n\t\t}\n\n\t\ts += \"/\"\n\t\ts += string(k)\n\t\ts += \"/\"\n\t\ts += string(v)\n\t}\n\treturn str.MD5(s)\n}\n"
},
{
"path": "pkg/httpx/httpx.go",
"content": "package httpx\n\nimport (\n\t\"context\"\n\t\"crypto/tls\"\n\t\"fmt\"\n\t\"net/http\"\n\t\"os\"\n\t\"strings\"\n\t\"time\"\n\n\t\"github.com/ccfos/nightingale/v6/pkg/aop\"\n\t\"github.com/ccfos/nightingale/v6/pkg/logx\"\n\t\"github.com/ccfos/nightingale/v6/pkg/version\"\n\n\t\"github.com/gin-contrib/pprof\"\n\t\"github.com/gin-gonic/gin\"\n\t\"github.com/google/uuid\"\n\t\"github.com/prometheus/client_golang/prometheus/promhttp\"\n)\n\ntype Config struct {\n\tHost string\n\tPort int\n\tCertFile string\n\tKeyFile string\n\tPProf bool\n\tPrintAccessLog bool\n\tPrintBody bool\n\tExposeMetrics bool\n\tShutdownTimeout int\n\tMaxContentLength int64\n\tReadTimeout int\n\tWriteTimeout int\n\tIdleTimeout int\n\tJWTAuth JWTAuth\n\tProxyAuth ProxyAuth\n\tShowCaptcha ShowCaptcha\n\tAPIForAgent BasicAuths\n\tAPIForService BasicAuths\n\tRSA RSAConfig\n\tTokenAuth TokenAuth\n}\n\ntype RSAConfig struct {\n\tOpenRSA bool\n\tRSAPublicKey []byte\n\tRSAPublicKeyPath string\n\tRSAPrivateKey []byte\n\tRSAPrivateKeyPath string\n\tRSAPassWord string\n}\n\ntype ShowCaptcha struct {\n\tEnable bool\n}\n\ntype BasicAuths struct {\n\tBasicAuth gin.Accounts\n\tEnable bool\n}\n\ntype ProxyAuth struct {\n\tEnable bool\n\tHeaderUserNameKey string\n\tDefaultRoles []string\n}\n\ntype JWTAuth struct {\n\tSigningKey string\n\tAccessExpired int64\n\tRefreshExpired int64\n\tRedisKeyPrefix string\n\tSingleLogin bool\n}\n\ntype TokenAuth struct {\n\tEnable bool\n\tHeaderUserTokenKey string\n}\n\nfunc GinEngine(mode string, cfg Config, printBodyPaths func() map[string]struct{},\n\tprintAccessLog func() bool) *gin.Engine {\n\tgin.SetMode(mode)\n\n\tloggerMid := aop.Logger(aop.LoggerConfig{PrintAccessLog: printAccessLog,\n\t\tPrintBodyPaths: printBodyPaths})\n\trecoveryMid := aop.Recovery()\n\n\tif strings.ToLower(mode) == \"release\" {\n\t\taop.DisableConsoleColor()\n\t}\n\n\tr := gin.New()\n\n\tr.Use(traceIdMid())\n\n\tr.Use(recoveryMid)\n\n\tr.Use(loggerMid)\n\n\tif cfg.PProf {\n\t\tpprof.Register(r, \"/api/debug/pprof\")\n\t}\n\n\tr.GET(\"/ping\", func(c *gin.Context) {\n\t\tc.String(200, \"pong\")\n\t})\n\n\tr.GET(\"/pid\", func(c *gin.Context) {\n\t\tc.String(200, fmt.Sprintf(\"%d\", os.Getpid()))\n\t})\n\n\tr.GET(\"/ppid\", func(c *gin.Context) {\n\t\tc.String(200, fmt.Sprintf(\"%d\", os.Getppid()))\n\t})\n\n\tr.GET(\"/addr\", func(c *gin.Context) {\n\t\tc.String(200, c.Request.RemoteAddr)\n\t})\n\n\tr.GET(\"/api/n9e/version\", func(c *gin.Context) {\n\t\tc.String(200, version.Version)\n\t})\n\n\tif cfg.ExposeMetrics {\n\t\tr.GET(\"/metrics\", gin.WrapH(promhttp.Handler()))\n\t}\n\n\treturn r\n}\n\nfunc traceIdMid() gin.HandlerFunc {\n\treturn func(c *gin.Context) {\n\t\tid := c.GetHeader(\"X-Trace-Id\")\n\t\tif !isValidTraceId(id) {\n\t\t\tid = uuid.New().String()\n\t\t}\n\t\tc.Set(\"trace_id\", id)\n\t\tctx := logx.NewTraceContext(c.Request.Context(), id)\n\t\tc.Request = c.Request.WithContext(ctx)\n\t\tc.Header(\"X-Trace-Id\", id)\n\t\tc.Next()\n\t}\n}\n\nfunc isValidTraceId(id string) bool {\n\tif id == \"\" || len(id) > 64 {\n\t\treturn false\n\t}\n\tfor _, r := range id {\n\t\tif !((r >= 'a' && r <= 'z') || (r >= 'A' && r <= 'Z') || (r >= '0' && r <= '9') || r == '-' || r == '_') {\n\t\t\treturn false\n\t\t}\n\t}\n\treturn true\n}\n\nfunc Init(cfg Config, handler http.Handler) func() {\n\taddr := fmt.Sprintf(\"%s:%d\", cfg.Host, cfg.Port)\n\tsrv := &http.Server{\n\t\tAddr: addr,\n\t\tHandler: handler,\n\t\tReadTimeout: time.Duration(cfg.ReadTimeout) * time.Second,\n\t\tWriteTimeout: time.Duration(cfg.WriteTimeout) * time.Second,\n\t\tIdleTimeout: time.Duration(cfg.IdleTimeout) * time.Second,\n\t}\n\n\tgo func() {\n\t\tfmt.Println(\"http server listening on:\", addr)\n\n\t\tvar err error\n\t\tif cfg.CertFile != \"\" && cfg.KeyFile != \"\" {\n\t\t\tsrv.TLSConfig = &tls.Config{MinVersion: tls.VersionTLS12}\n\t\t\terr = srv.ListenAndServeTLS(cfg.CertFile, cfg.KeyFile)\n\t\t} else {\n\t\t\terr = srv.ListenAndServe()\n\t\t}\n\t\tif err != nil && err != http.ErrServerClosed {\n\t\t\tpanic(err)\n\t\t}\n\t}()\n\n\treturn func() {\n\t\tctx, cancel := context.WithTimeout(context.Background(), time.Second*time.Duration(cfg.ShutdownTimeout))\n\t\tdefer cancel()\n\n\t\tsrv.SetKeepAlivesEnabled(false)\n\t\tif err := srv.Shutdown(ctx); err != nil {\n\t\t\tfmt.Println(\"cannot shutdown http server:\", err)\n\t\t}\n\n\t\tselect {\n\t\tcase <-ctx.Done():\n\t\t\tfmt.Println(\"http exiting\")\n\t\tdefault:\n\t\t\tfmt.Println(\"http server stopped\")\n\t\t}\n\t}\n}\n"
},
{
"path": "pkg/i18nx/i18n.go",
"content": "package i18nx\n\nimport (\n\t\"encoding/json\"\n\t\"path\"\n\n\t\"github.com/toolkits/pkg/file\"\n\t\"github.com/toolkits/pkg/i18n\"\n\t\"github.com/toolkits/pkg/logger\"\n)\n\nfunc Init(configDir string) {\n\tfilePath := path.Join(configDir, \"i18n.json\")\n\tm := make(map[string]map[string]string)\n\tbuiltInConf := make(map[string]map[string]string)\n\n\tvar content = I18N\n\tvar err error\n\t//use built-in config\n\terr = json.Unmarshal([]byte(content), &builtInConf)\n\tif err != nil {\n\t\tlogger.Errorf(\"parse i18n config file %s fail: %s\\n\", filePath, err)\n\t\treturn\n\t}\n\tif !file.IsExist(filePath) {\n\t\tm = builtInConf\n\t} else {\n\t\t//expand config\n\t\t//prioritize the settings within the expand config options in case of conflicts\n\t\tcontent, err = file.ToTrimString(filePath)\n\t\tif err != nil {\n\t\t\tlogger.Errorf(\"read i18n config file %s fail: %s\\n\", filePath, err)\n\t\t\treturn\n\t\t}\n\t\terr = json.Unmarshal([]byte(content), &m)\n\t\tif err != nil {\n\t\t\tlogger.Errorf(\"parse i18n config file %s fail: %s\\n\", filePath, err)\n\t\t\treturn\n\t\t}\n\t\t// json Example:\n\t\t//{\n\t\t// \"zh\": {\n\t\t// \"username\":\"用户名\"\n\t\t//\t},\n\t\t// \"fr\": {\n\t\t// \"username\":\"nom d'utilisateur\"\n\t\t//\t}\n\t\t//}\n\t\tfor languageKey, languageDict := range builtInConf {\n\t\t\tif _, hasL := m[languageKey]; hasL { //languages\n\t\t\t\tfor k, v := range languageDict {\n\t\t\t\t\tif _, has := m[languageKey][k]; !has {\n\t\t\t\t\t\tm[languageKey][k] = v\n\t\t\t\t\t}\n\t\t\t\t}\n\t\t\t} else {\n\t\t\t\tm[languageKey] = languageDict\n\t\t\t}\n\t\t}\n\t}\n\n\ti18n.DictRegister(m)\n}\n"
},
{
"path": "pkg/i18nx/var.go",
"content": "package i18nx\n\nvar I18N = `{\n \"zh_CN\": {\n \"Username or password invalid\": \"用户名或密码错误\",\n \"incorrect verification code\": \"验证码错误\",\n \"roles empty\": \"角色不能为空\",\n \"Username already exists\": \"此用户名已存在 请使用其他用户名\",\n \"failed to count user-groups\": \"校验数据失败 请重试\",\n \"UserGroup already exists\": \"组名已存在 请使用其他名称\",\n \"members empty\": \"成员不能为空\",\n \"At least one team have rw permission\": \"至少需要有一个团队有读写权限\",\n \"Failed to create BusiGroup(%s)\": \"[%s]创建失败 请重试\",\n \"business group id invalid\": \"业务组 id 不正确\",\n \"idents empty\": \"监控对象不能为空\",\n \"invalid tag(%s)\": \"tag不合法[%s]\",\n \"invalid tagkey(%s): cannot contains . \": \"tagkey[%s]不能包含.\",\n \"invalid tagkey(%s): cannot contains _ \": \"tagkey[%s]不能包含_\",\n \"invalid tagkey(%s)\": \"tagkey不合法[%s]\",\n \"duplicate tagkey(%s)\": \"tagkey(%s)重复了\",\n \"name is empty\": \"名称不能为空\",\n \"Ident duplicate\": \"仪表盘唯一标识已存在\",\n \"No such dashboard\": \"仪表盘不存在\",\n \"Name has invalid characters\": \"名称包含非法字符\",\n \"Name is blank\": \"名称不能为空\",\n \"forbidden\": \"没有权限\",\n \"builtin alerts is empty, file: %s\": \"内置告警模板为空 %s\",\n \"input json is empty\": \"提交内容不能为空\",\n \"fields empty\": \"选择字段不能为空\",\n \"No such AlertRule\": \"无此告警规则\",\n \"GroupId(%d) invalid\": \"业务组id无效\",\n \"No such recording rule\": \"无此记录规则\",\n \"tags is blank\": \"标签不能为空\",\n \"oops... etime(%d) <= btime(%d)\": \"开始时间,不能大于结束时间\",\n \"group_id invalid\": \"业务组无效\",\n \"No such AlertMute\": \"无此屏蔽规则\",\n \"rule_id and tags are both blank\": \"告警规则和标签不能同时为空\",\n \"rule is blank\": \"规则不能为空\",\n \"rule invalid\": \"规则无效 请检查是否正确\",\n \"unsupported field: %s\": \"不支持字段 %s\",\n \"arg(batch) should be nonnegative\": \"batch 不能为负数\",\n \"arg(tolerance) should be nonnegative\": \"tolerance 不能为负数\",\n \"arg(timeout) should be nonnegative\": \"timeout 不能为负数\",\n \"arg(timeout) longer than five days\": \"timeout 时间不能超过5天\",\n \"arg(title) is required\": \"title 为必填项\",\n \"created task.id is zero\": \"任务id为零\",\n \"invalid ibex address: %s\": \"ibex %s 地址无效\",\n \"url path invalid\": \"url非法\",\n \"no such server\": \"无此实例\",\n \"admin role can not be modified\": \"管理员角色不允许修改\",\n \"builtin payload already exists\": \"内置模板已存在\",\n \"This functionality has not been enabled. Please contact the system administrator to activate it.\": \"此功能尚未启用。请联系系统管理员启用\",\n \"targets not exist: %s\": \"有些机器不存在: %s\",\n \"mute is disabled\": \"屏蔽规则已禁用\",\n \"datasource id not match\": \"数据源ID不匹配\",\n \"event trigger time not within mute time range\": \"事件触发时间不在屏蔽时间范围内\",\n \"event trigger time not within periodic mute range\": \"事件触发时间不在周期性屏蔽时间范围内\",\n \"mute time type invalid\": \"屏蔽时间类型无效\",\n \"event severity not match mute severity\": \"事件严重程度与屏蔽严重程度不匹配\",\n \"event tags not match mute tags\": \"事件标签与屏蔽标签不匹配\",\n \"event datasource not match\": \"事件数据源不匹配\",\n \"event rule id not match\": \"事件告警规则ID不匹配\",\n \"event tags not match\": \"事件标签不匹配\",\n \"event group name not match\": \"事件业务组名称不匹配\",\n \"event severity not match\": \"事件严重程度不匹配\",\n \"subscribe notify rule not found: %v\": \"订阅通知规则未找到: %v\",\n \"notify rule send error: %v\": \"通知规则发送错误: %v\",\n \"event match subscribe and notification test ok\": \"事件匹配订阅规则,通知测试成功\",\n \"no notify rules selected\": \"未选择通知规则\",\n \"no notify channels selected\": \"未选择通知渠道\",\n \"no notify groups selected\": \"未选择通知组\",\n \"all users missing notify channel configurations: %v\": \"所有用户缺少通知渠道配置: %v\",\n \"event match subscribe and notify settings ok\": \"事件匹配订阅规则,通知设置正常\",\n \"/loki suffix is miss, please add /loki to the url: %s\": \"缺少/loki后缀,请在URL中添加/loki:%s\",\n\n \"event time not match time filter\": \"事件时间不匹配时间过滤器\",\n \"event severity not match severity filter\": \"事件等级不匹配等级过滤器\",\n \"event tag not match tag filter\": \"事件标签不匹配标签过滤器\",\n \"event attributes not match attributes filter\": \"事件属性不匹配属性过滤器\",\n \"failed to parse tag filter: %v\": \"解析标签过滤器失败: %v\",\n\n \"event is dropped\": \"事件已被丢弃,不会进行通知\",\n \"drop event success\": \"丢弃事件成功\",\n \"drop event failed\": \"丢弃事件失败\",\n \"callback success\": \"回调成功\",\n\n \"Infrastructure\": \"基础设施\",\n \"Host - View\": \"机器 - 查看\",\n \"Host - Modify\": \"机器 - 修改\",\n \"Host - Delete\": \"机器 - 删除\",\n \"Host - Bind Uncategorized\": \"机器 - 绑定未归组机器到某个业务组\",\n\n \"Explorer\": \"数据查询\",\n \"Metrics Explorer\": \"指标查询\",\n \"Quick View\": \"快捷视图\",\n \"Built-in Metric - View\": \"内置指标 - 查看\",\n \"Built-in Metric - Add\": \"内置指标 - 新增\",\n \"Built-in Metric - Modify\": \"内置指标 - 修改\",\n \"Built-in Metric - Delete\": \"内置指标 - 删除\",\n \"Recording Rule - View\": \"记录规则 - 查看\",\n \"Recording Rule - Add\": \"记录规则 - 新增\",\n \"Recording Rule - Modify\": \"记录规则 - 修改\",\n \"Recording Rule - Delete\": \"记录规则 - 删除\",\n \"Logs Explorer\": \"日志查询\",\n \"Index Pattern - View\": \"索引模式 - 查看\",\n \"Index Pattern - Add\": \"索引模式 - 新增\",\n \"Index Pattern - Modify\": \"索引模式 - 修改\",\n \"Index Pattern - Delete\": \"索引模式 - 删除\",\n \"Dashboard - View\": \"仪表盘 - 查看\",\n \"Dashboard - Add\": \"仪表盘 - 新增\",\n \"Dashboard - Modify\": \"仪表盘 - 修改\",\n \"Dashboard - Delete\": \"仪表盘 - 删除\",\n \"Dashboard - View Public\": \"仪表盘 - 查看公开仪表盘\",\n\n \"Alerting\": \"告警\",\n \"Alerting Rule - View\": \"告警规则 - 查看\",\n \"Alerting Rule - Add\": \"告警规则 - 新增\",\n \"Alerting Rule - Modify\": \"告警规则 - 修改\",\n \"Alerting Rule - Delete\": \"告警规则 - 删除\",\n \"Mutting Rule - View\": \"屏蔽规则 - 查看\",\n \"Mutting Rule - Add\": \"屏蔽规则 - 新增\",\n \"Mutting Rule - Modify\": \"屏蔽规则 - 修改\",\n \"Mutting Rule - Delete\": \"屏蔽规则 - 删除\",\n \"Subscribing Rule - View\": \"订阅规则 - 查看\",\n \"Subscribing Rule - Add\": \"订阅规则 - 新增\",\n \"Subscribing Rule - Modify\": \"订阅规则 - 修改\",\n \"Subscribing Rule - Delete\": \"订阅规则 - 删除\",\n \"Self-healing-Script - View\": \"自愈脚本 - 查看\",\n \"Self-healing-Script - Add\": \"自愈脚本 - 新增\",\n \"Self-healing-Script - Modify\": \"自愈脚本 - 修改\",\n \"Self-healing-Script - Delete\": \"自愈脚本 - 删除\",\n \"Self-healing-Job - View\": \"自愈任务 - 查看\",\n \"Self-healing-Job - Add\": \"自愈任务 - 新增\",\n \"Self-healing-Job - Modify\": \"自愈任务 - 修改\",\n \"Active Event - View\": \"活跃事件 - 查看\",\n \"Active Event - Delete\": \"活跃事件 - 删除\",\n \"Historical Event - View\": \"历史事件 - 查看\",\n\n \"Notification\": \"通知\",\n \"Notification Rule - View\": \"通知规则 - 查看\",\n \"Notification Rule - Add\": \"通知规则 - 新增\",\n \"Notification Rule - Modify\": \"通知规则 - 修改\",\n \"Notification Rule - Delete\": \"通知规则 - 删除\",\n \"Media Type - View\": \"通知媒介 - 查看\",\n \"Media Type - Add\": \"通知媒介 - 新增\",\n \"Media Type - Modify\": \"通知媒介 - 修改\",\n \"Media Type - Delete\": \"通知媒介 - 删除\",\n \"Message Template - View\": \"消息模板 - 查看\",\n \"Message Template - Add\": \"消息模板 - 新增\",\n \"Message Template - Modify\": \"消息模板 - 修改\",\n \"Message Template - Delete\": \"消息模板 - 删除\",\n \"Event Pipeline - View\": \"事件管道 - 查看\",\n \"Event Pipeline - Add\": \"事件管道 - 新增\",\n \"Event Pipeline - Modify\": \"事件管道 - 修改\",\n \"Event Pipeline - Delete\": \"事件管道 - 删除\",\n \"Notification Settings - View\": \"老版本通知设置 - 查看\",\n \"Notification Templates - View\": \"老版本消息模板 - 查看\",\n\n \"Integrations\": \"集成中心\",\n \"Data Source - View\": \"数据源 - 查看\",\n \"Component - View\": \"组件 - 查看\",\n \"Component - Add\": \"组件 - 新增\",\n \"Component - Modify\": \"组件 - 修改\",\n \"Component - Delete\": \"组件 - 删除\",\n \"Embedded Product - View\": \"系统集成 - 查看\",\n \"Embedded Product - Add\": \"系统集成 - 新增\",\n \"Embedded Product - Modify\": \"系统集成 - 修改\",\n \"Embedded Product - Delete\": \"系统集成 - 删除\",\n\n \"Organization\": \"人员组织\",\n \"User - View\": \"用户 - 查看\",\n \"User - Add\": \"用户 - 新增\",\n \"User - Modify\": \"用户 - 修改\",\n \"User - Delete\": \"用户 - 删除\",\n \"Team - View\": \"团队 - 查看\",\n \"Team - Add\": \"团队 - 新增\",\n \"Team - Modify\": \"团队 - 修改\",\n \"Team - Delete\": \"团队 - 删除\",\n \"Business Group - View\": \"业务组 - 查看\",\n \"Business Group - Add\": \"业务组 - 新增\",\n \"Business Group - Modify\": \"业务组 - 修改\",\n \"Business Group - Delete\": \"业务组 - 删除\",\n \"Role - View\": \"角色 - 查看\",\n \"Role - Add\": \"角色 - 新增\",\n \"Role - Modify\": \"角色 - 修改\",\n \"Role - Delete\": \"角色 - 删除\",\n\n \"System Settings\": \"系统配置\",\n \"View Site Settings\": \"查看站点设置\",\n \"View Variable Settings\": \"查看变量配置\",\n \"View SSO Settings\": \"查看单点登录配置\",\n \"View Alerting Engines\": \"查看告警引擎列表\",\n \"View Product Version\": \"查看产品版本\",\n\n \"Some alert rules still in the BusiGroup\": \"业务组中仍有告警规则\",\n \"Some alert mutes still in the BusiGroup\": \"业务组中仍有屏蔽规则\",\n \"Some alert subscribes still in the BusiGroup\": \"业务组中仍有订阅规则\",\n \"Some Board still in the BusiGroup\": \"业务组中仍有仪表盘\",\n \"Some targets still in the BusiGroup\": \"业务组中仍有监控对象\",\n \"Some recording rules still in the BusiGroup\": \"业务组中仍有记录规则\",\n \"Some recovery scripts still in the BusiGroup\": \"业务组中仍有自愈脚本\",\n \"Some target busigroups still in the BusiGroup\": \"业务组中仍有监控对象\",\n\n \"saved view not found\": \"保存的视图不存在\",\n \"saved view name is blank\": \"视图名称不能为空\",\n \"saved view page is blank\": \"视图页面不能为空\",\n \"saved view name already exists in this page\": \"该页面下已存在同名的公开视图\",\n\n \"---------zh_CN--------\": \"---------zh_CN--------\"\n },\n \"zh_HK\": {\n \"Username or password invalid\": \"用戶名或密碼錯誤\",\n \"incorrect verification code\": \"驗證碼錯誤\",\n \"roles empty\": \"角色不能為空\",\n \"Username already exists\": \"此用戶名已存在 請使用其他用戶名\",\n \"failed to count user-groups\": \"校驗數據失敗 請重試\",\n \"UserGroup already exists\": \"組名已存在 請使用其他名稱\",\n \"members empty\": \"成員不能為空\",\n \"At least one team have rw permission\": \"至少需要有一個團隊有讀寫權限\",\n \"Failed to create BusiGroup(%s)\": \"[%s]創建失敗 請重試\",\n \"business group id invalid\": \"業務組 id 不正確\",\n \"idents empty\": \"監控對象不能為空\",\n \"invalid tag(%s)\": \"tag不合法[%s]\",\n \"invalid tagkey(%s): cannot contains . \": \"tagkey[%s]不能包含.\",\n \"invalid tagkey(%s): cannot contains _ \": \"tagkey[%s]不能包含_\",\n \"invalid tagkey(%s)\": \"tagkey不合法[%s]\",\n \"duplicate tagkey(%s)\": \"tagkey(%s)重複了\",\n \"name is empty\": \"名稱不能為空\",\n \"Ident duplicate\": \"儀表板唯一標識已存在\",\n \"Name duplicate\": \"儀表板名稱已存在\",\n \"No such dashboard\": \"儀表板不存在\",\n \"Name has invalid characters\": \"名稱包含非法字符\",\n \"Name is blank\": \"名稱不能為空\",\n \"forbidden\": \"沒有權限\",\n \"builtin alerts is empty, file: %s\": \"內置告警模板為空 %s\",\n \"input json is empty\": \"提交內容不能為空\",\n \"fields empty\": \"選擇字段不能為空\",\n \"No such AlertRule\": \"無此告警規則\",\n \"GroupId(%d) invalid\": \"業務組id無效\",\n \"No such recording rule\": \"無此記錄規則\",\n \"tags is blank\": \"標籤不能為空\",\n \"oops... etime(%d) <= btime(%d)\": \"開始時間,不能大於結束時間\",\n \"group_id invalid\": \"業務組無效\",\n \"No such AlertMute\": \"無此屏蔽規則\",\n \"rule_id and tags are both blank\": \"告警規則和標籤不能同時為空\",\n \"rule is blank\": \"規則不能為空\",\n \"rule invalid\": \"規則無效 請檢查是否正確\",\n \"unsupported field: %s\": \"不支持字段 %s\",\n \"arg(batch) should be nonnegative\": \"batch 不能為負數\",\n \"arg(tolerance) should be nonnegative\": \"tolerance 不能為負數\",\n \"arg(timeout) should be nonnegative\": \"timeout 不能為負數\",\n \"arg(timeout) longer than five days\": \"timeout 時間不能超過5天\",\n \"arg(title) is required\": \"title 為必填項\",\n \"created task.id is zero\": \"任務id為零\",\n \"invalid ibex address: %s\": \"ibex %s 地址無效\",\n \"url path invalid\": \"url非法\",\n \"no such server\": \"無此實例\",\n \"admin role can not be modified\": \"管理員角色不允許修改\",\n \"builtin payload already exists\": \"內置模板已存在\",\n \"builtin metric already exists\": \"內置指標已存在\",\n \"AlertRule already exists\": \"告警規則已存在\",\n \"This functionality has not been enabled. Please contact the system administrator to activate it.\": \"此功能尚未啟用。請聯繫系統管理員啟用\",\n \"targets not exist: %s\": \"有些機器不存在: %s\",\n \"mute is disabled\": \"屏蔽規則已禁用\",\n \"datasource id not match\": \"數據源ID不匹配\",\n \"event trigger time not within mute time range\": \"事件觸發時間不在屏蔽時間範圍內\",\n \"event trigger time not within periodic mute range\": \"事件觸發時間不在週期性屏蔽時間範圍內\",\n \"mute time type invalid\": \"屏蔽時間類型無效\",\n \"event severity not match mute severity\": \"事件嚴重程度與屏蔽嚴重程度不匹配\",\n \"event tags not match mute tags\": \"事件標籤與屏蔽標籤不匹配\",\n \"event datasource not match\": \"事件數據源不匹配\",\n \"event rule id not match\": \"事件告警規則ID不匹配\",\n \"event tags not match\": \"事件標籤不匹配\",\n \"event group name not match\": \"事件業務組名稱不匹配\",\n \"event severity not match\": \"事件嚴重程度不匹配\",\n \"subscribe notify rule not found: %v\": \"訂閱通知規則未找到: %v\",\n \"notify rule send error: %v\": \"通知規則發送錯誤: %v\",\n \"event match subscribe and notification test ok\": \"事件匹配訂閱規則,通知測試成功\",\n \"no notify rules selected\": \"未選擇通知規則\",\n \"no notify channels selected\": \"未選擇通知渠道\",\n \"no notify groups selected\": \"未選擇通知組\",\n \"all users missing notify channel configurations: %v\": \"所有用戶缺少通知渠道配置: %v\",\n \"event match subscribe and notify settings ok\": \"事件匹配訂閱規則,通知設置正常\",\n \"/loki suffix is miss, please add /loki to the url: %s\": \"缺少/loki後綴,請在URL中添加/loki:%s\",\n\n \"event time not match time filter\": \"事件時間不匹配時間過濾器\",\n \"event severity not match severity filter\": \"事件等級不匹配等級過濾器\",\n \"event tag not match tag filter\": \"事件標籤不匹配標籤過濾器\",\n \"event attributes not match attributes filter\": \"事件屬性不匹配屬性過濾器\",\n \"failed to parse tag filter: %v\": \"解析標籤過濾器失敗: %v\",\n \"event is dropped\": \"事件已被丟棄,不會進行通知\",\n \"drop event success\": \"丟棄事件成功\",\n \"drop event failed\": \"丟棄事件失敗\",\n \"callback success\": \"回調成功\",\n \n \"Infrastructure\": \"基礎設施\",\n \"Host - View\": \"機器 - 查看\",\n \"Host - Modify\": \"機器 - 修改\",\n \"Host - Delete\": \"機器 - 删除\",\n \"Host - Bind Uncategorized\": \"機器 - 綁定未歸組機器到某個業務組\",\n\n \"Explorer\": \"數據查詢\",\n \"Metrics Explorer\": \"指標查詢\",\n \"Quick View\": \"快捷視圖\",\n \"Built-in Metric - View\": \"內置指標 - 查看\",\n \"Built-in Metric - Add\": \"內置指標 - 新增\",\n \"Built-in Metric - Modify\": \"內置指標 - 修改\",\n \"Built-in Metric - Delete\": \"內置指標 - 删除\",\n \"Recording Rule - View\": \"記錄規則 - 查看\",\n \"Recording Rule - Add\": \"記錄規則 - 新增\",\n \"Recording Rule - Modify\": \"記錄規則 - 修改\",\n \"Recording Rule - Delete\": \"記錄規則 - 删除\",\n \"Logs Explorer\": \"日誌查詢\",\n \"Index Pattern - View\": \"索引模式 - 查看\",\n \"Index Pattern - Add\": \"索引模式 - 新增\",\n \"Index Pattern - Modify\": \"索引模式 - 修改\",\n \"Index Pattern - Delete\": \"索引模式 - 删除\",\n \"Dashboard - View\": \"儀表板 - 查看\",\n \"Dashboard - Add\": \"儀表板 - 新增\",\n \"Dashboard - Modify\": \"儀表板 - 修改\",\n \"Dashboard - Delete\": \"儀表板 - 删除\",\n \"Dashboard - View Public\": \"儀表板 - 查看公開儀表板\",\n\n \"Alerting\": \"告警\",\n \"Alerting Rule - View\": \"告警規則 - 查看\",\n \"Alerting Rule - Add\": \"告警規則 - 新增\",\n \"Alerting Rule - Modify\": \"告警規則 - 修改\",\n \"Alerting Rule - Delete\": \"告警規則 - 删除\",\n \"Mutting Rule - View\": \"屏蔽規則 - 查看\",\n \"Mutting Rule - Add\": \"屏蔽規則 - 新增\",\n \"Mutting Rule - Modify\": \"屏蔽規則 - 修改\",\n \"Mutting Rule - Delete\": \"屏蔽規則 - 删除\",\n \"Subscribing Rule - View\": \"訂閱規則 - 查看\",\n \"Subscribing Rule - Add\": \"訂閱規則 - 新增\",\n \"Subscribing Rule - Modify\": \"訂閱規則 - 修改\",\n \"Subscribing Rule - Delete\": \"訂閱規則 - 删除\",\n \"Self-healing-Script - View\": \"自愈腳本 - 查看\",\n \"Self-healing-Script - Add\": \"自愈腳本 - 新增\",\n \"Self-healing-Script - Modify\": \"自愈腳本 - 修改\",\n \"Self-healing-Script - Delete\": \"自愈腳本 - 删除\",\n \"Self-healing-Job - View\": \"自愈任務 - 查看\",\n \"Self-healing-Job - Add\": \"自愈任務 - 新增\",\n \"Self-healing-Job - Modify\": \"自愈任務 - 修改\",\n \"Active Event - View\": \"活躍事件 - 查看\",\n \"Active Event - Delete\": \"活躍事件 - 删除\",\n \"Historical Event - View\": \"歷史事件 - 查看\",\n\n \"Notification\": \"通知\",\n \"Notification Rule - View\": \"通知規則 - 查看\",\n \"Notification Rule - Add\": \"通知規則 - 新增\",\n \"Notification Rule - Modify\": \"通知規則 - 修改\",\n \"Notification Rule - Delete\": \"通知規則 - 删除\",\n \"Media Type - View\": \"通知媒介 - 查看\",\n \"Media Type - Add\": \"通知媒介 - 新增\",\n \"Media Type - Modify\": \"通知媒介 - 修改\",\n \"Media Type - Delete\": \"通知媒介 - 删除\",\n \"Message Template - View\": \"訊息範本 - 查看\",\n \"Message Template - Add\": \"訊息範本 - 新增\",\n \"Message Template - Modify\": \"訊息範本 - 修改\",\n \"Message Template - Delete\": \"訊息範本 - 删除\",\n \"Event Pipeline - View\": \"事件管線 - 查看\",\n \"Event Pipeline - Add\": \"事件管線 - 新增\",\n \"Event Pipeline - Modify\": \"事件管線 - 修改\",\n \"Event Pipeline - Delete\": \"事件管線 - 删除\",\n \"Notification Settings - View\": \"老版本通知设置 - 查看\",\n \"Notification Templates - View\": \"老版本訊息範本 - 查看\",\n\n \"Integrations\": \"集成中心\",\n \"Data Source - View\": \"資料源 - 查看\",\n \"Component - View\": \"組件 - 查看\",\n \"Component - Add\": \"組件 - 新增\",\n \"Component - Modify\": \"組件 - 修改\",\n \"Component - Delete\": \"組件 - 刪除\",\n \"Embedded Product - View\": \"系統集成 - 查看\",\n \"Embedded Product - Add\": \"系統集成 - 新增\",\n \"Embedded Product - Modify\": \"系統集成 - 修改\",\n \"Embedded Product - Delete\": \"系統集成 - 刪除\",\n\n \"Organization\": \"人員組織\",\n \"User - View\": \"用戶 - 查看\",\n \"User - Add\": \"用戶 - 新增\",\n \"User - Modify\": \"用戶 - 修改\",\n \"User - Delete\": \"用戶 - 刪除\",\n \"Team - View\": \"團隊 - 查看\",\n \"Team - Add\": \"團隊 - 新增\",\n \"Team - Modify\": \"團隊 - 修改\",\n \"Team - Delete\": \"團隊 - 刪除\",\n \"Business Group - View\": \"業務組 - 查看\",\n \"Business Group - Add\": \"業務組 - 新增\",\n \"Business Group - Modify\": \"業務組 - 修改\",\n \"Business Group - Delete\": \"業務組 - 删除\",\n \"Role - View\": \"角色 - 查看\",\n \"Role - Add\": \"角色 - 新增\",\n \"Role - Modify\": \"角色 - 修改\",\n \"Role - Delete\": \"角色 - 删除\",\n\n \"System Settings\": \"系統配置\",\n \"View Site Settings\": \"查看站點設置\",\n \"View Variable Settings\": \"查看變量配置\",\n \"View SSO Settings\": \"查看單點登錄配置\",\n \"View Alerting Engines\": \"查看告警引擎列表\",\n \"View Product Version\": \"查看產品版本\",\n\n \"Some alert rules still in the BusiGroup\": \"業務組中仍有告警規則\",\n \"Some alert mutes still in the BusiGroup\": \"業務組中仍有屏蔽規則\",\n \"Some alert subscribes still in the BusiGroup\": \"業務組中仍有訂閱規則\",\n \"Some Board still in the BusiGroup\": \"業務組中仍有儀表板\",\n \"Some targets still in the BusiGroup\": \"業務組中仍有監控對象\",\n \"Some recording rules still in the BusiGroup\": \"業務組中仍有記錄規則\",\n \"Some recovery scripts still in the BusiGroup\": \"業務組中仍有自愈腳本\",\n \"Some target busigroups still in the BusiGroup\": \"業務組中仍有監控對象\",\n\n \"saved view not found\": \"保存的視圖不存在\",\n \"saved view name is blank\": \"視圖名稱不能為空\",\n \"saved view page is blank\": \"視圖頁面不能為空\",\n \"saved view name already exists in this page\": \"該頁面下已存在同名的公開視圖\",\n\n \"---------zh_HK--------\": \"---------zh_HK--------\"\n },\n \"ja_JP\": {\n \"Username or password invalid\": \"ユーザー名またはパスワードが無効です\",\n \"incorrect verification code\": \"認証コードが正しくありません\",\n \"roles empty\": \"役割を空にすることはできません\",\n \"Username already exists\": \"このユーザー名は既に存在します。別のユーザー名を使用してください\",\n \"failed to count user-groups\": \"データの検証に失敗しました。もう一度お試しください\",\n \"UserGroup already exists\": \"グループ名は既に存在します。別の名前を使用してください\",\n \"members empty\": \"メンバーを空にすることはできません\",\n \"At least one team have rw permission\": \"少なくとも1つのチームに読み書き権限が必要です\",\n \"Failed to create BusiGroup(%s)\": \"[%s]の作成に失敗しました。もう一度お試しください\",\n \"business group id invalid\": \"ビジネスグループIDが正しくありません\",\n \"idents empty\": \"監視対象を空にすることはできません\",\n \"invalid tag(%s)\": \"タグ[%s]が無効です\",\n \"invalid tagkey(%s): cannot contains . \": \"タグキー[%s]にドット(.)を含めることはできません\",\n \"invalid tagkey(%s): cannot contains _ \": \"タグキー[%s]にアンダースコア(_)を含めることはできません\",\n \"invalid tagkey(%s)\": \"タグキー[%s]が無効です\",\n \"duplicate tagkey(%s)\": \"タグキー(%s)が重複しています\",\n \"name is empty\": \"名前を空にすることはできません\",\n \"Ident duplicate\": \"ダッシュボードの一意の識別子が既に存在します\",\n \"No such dashboard\": \"ダッシュボードが存在しません\",\n \"Name has invalid characters\": \"名前に無効な文字が含まれています\",\n \"Name is blank\": \"名前を空白にすることはできません\",\n \"forbidden\": \"権限がありません\",\n \"builtin alerts is empty, file: %s\": \"ビルトインアラートテンプレートが空です %s\",\n \"input json is empty\": \"提出内容を空にすることはできません\",\n \"fields empty\": \"選択フィールドを空にすることはできません\",\n \"No such AlertRule\": \"そのようなアラートルールはありません\",\n \"GroupId(%d) invalid\": \"ビジネスグループIDが無効です\",\n \"No such recording rule\": \"そのような記録ルールはありません\",\n \"tags is blank\": \"タグを空白にすることはできません\",\n \"oops... etime(%d) <= btime(%d)\": \"開始時間は終了時間より大きくすることはできません\",\n \"group_id invalid\": \"ビジネスグループが無効です\",\n \"No such AlertMute\": \"そのようなアラートミュートルールはありません\",\n \"rule_id and tags are both blank\": \"アラートルールとタグを同時に空にすることはできません\",\n \"rule is blank\": \"ルールを空にすることはできません\",\n \"rule invalid\": \"ルールが無効です。正しいかどうか確認してください\",\n \"unsupported field: %s\": \"フィールド %s はサポートされていません\",\n \"arg(batch) should be nonnegative\": \"batchは負の数にできません\",\n \"arg(tolerance) should be nonnegative\": \"toleranceは負の数にできません\",\n \"arg(timeout) should be nonnegative\": \"timeoutは負の数にできません\",\n \"arg(timeout) longer than five days\": \"timeoutは5日を超えることはできません\",\n \"arg(title) is required\": \"titleは必須項目です\",\n \"created task.id is zero\": \"作成されたタスクIDがゼロです\",\n \"invalid ibex address: %s\": \"ibex %s のアドレスが無効です\",\n \"url path invalid\": \"URLパスが無効です\",\n \"no such server\": \"そのようなインスタンスはありません\",\n \"admin role can not be modified\": \"管理者ロールは変更できません\",\n \"builtin payload already exists\": \"ビルトインテンプレートは既に存在します\",\n \"This functionality has not been enabled. Please contact the system administrator to activate it.\": \"この機能はまだ有効になっていません。システム管理者に連絡して有効にしてください\",\n \"targets not exist: %s\": \"いくつかのマシンが存在しません: %s\",\n \"mute is disabled\": \"ミュートルールが無効になっています\",\n \"datasource id not match\": \"データソースIDが一致しません\",\n \"event trigger time not within mute time range\": \"イベントトリガー時間がミュート時間範囲内にありません\",\n \"event trigger time not within periodic mute range\": \"イベントトリガー時間が周期的ミュート時間範囲内にありません\",\n \"mute time type invalid\": \"ミュート時間タイプが無効です\",\n \"event severity not match mute severity\": \"イベントの重要度がミュートの重要度と一致しません\",\n \"event tags not match mute tags\": \"イベントタグがミュートタグと一致しません\",\n \"event datasource not match\": \"イベントデータソースが一致しません\",\n \"event rule id not match\": \"イベントアラートルールIDが一致しません\",\n \"event tags not match\": \"イベントタグが一致しません\",\n \"event group name not match\": \"イベントビジネスグループ名が一致しません\",\n \"event severity not match\": \"イベントの重要度が一致しません\",\n \"subscribe notify rule not found: %v\": \"サブスクライブ通知ルールが見つかりません: %v\",\n \"notify rule send error: %v\": \"通知ルール送信エラー: %v\",\n \"event match subscribe and notification test ok\": \"イベントがサブスクライブルールに一致し、通知テストが成功しました\",\n \"no notify rules selected\": \"通知ルールが選択されていません\",\n \"no notify channels selected\": \"通知チャンネルが選択されていません\",\n \"no notify groups selected\": \"通知グループが選択されていません\",\n \"all users missing notify channel configurations: %v\": \"すべてのユーザーに通知チャンネル設定がありません: %v\",\n \"event match subscribe and notify settings ok\": \"イベントがサブスクライブルールに一致し、通知設定が正常です\",\n \"/loki suffix is miss, please add /loki to the url: %s\": \"/lokiサフィックスがありません。URLに/lokiを追加してください: %s\",\n\n \"event time not match time filter\": \"イベント時間が時間フィルタと一致しません\",\n \"event severity not match severity filter\": \"イベント等級が等級フィルタと一致しません\",\n \"event tag not match tag filter\": \"イベントタグがタグフィルタと一致しません\",\n \"event attributes not match attributes filter\": \"イベント属性が属性フィルタと一致しません\",\n \"failed to parse tag filter: %v\": \"タグフィルタの解析に失敗しました: %v\",\n \"event is dropped\": \"イベントが破棄されました,通知は行われません\",\n \"drop event success\": \"イベント破棄成功\",\n \"drop event failed\": \"イベント破棄失敗\",\n \"callback success\": \"コールバック成功\",\n \n \"Infrastructure\": \"インフラストラクチャ\",\n \"Host - View\": \"機器 - 閲覧\",\n \"Host - Modify\": \"機器 - 修正\",\n \"Host - Delete\": \"機器 - 削除\",\n \"Host - Bind Uncategorized\": \"機器 - グループ未所属の機器をある業務グループにバインドする\",\n\n \"Explorer\": \"データ検索\",\n \"Metrics Explorer\": \"メトリクス エクスプローラー\",\n \"Quick View\": \"クイック ビュー\",\n \"Built-in Metric - View\": \"組み込みメトリクス - 閲覧\",\n \"Built-in Metric - Add\": \"組み込みメトリクス - 追加\",\n \"Built-in Metric - Modify\": \"組み込みメトリクス - 修正\",\n \"Built-in Metric - Delete\": \"組み込みメトリクス - 削除\",\n \"Recording Rule - View\": \"記録ルール - 閲覧\",\n \"Recording Rule - Add\": \"記録ルール - 追加\",\n \"Recording Rule - Modify\": \"記録ルール - 修正\",\n \"Recording Rule - Delete\": \"記録ルール - 削除\",\n \"Logs Explorer\": \"ログ エクスプローラー\",\n \"Index Pattern - View\": \"インデックス パターン - 閲覧\",\n \"Index Pattern - Add\": \"インデックス パターン - 追加\",\n \"Index Pattern - Modify\": \"インデックス パターン - 修正\",\n \"Index Pattern - Delete\": \"インデックス パターン - 削除\",\n \"Dashboard - View\": \"ダッシュボード - 閲覧\",\n \"Dashboard - Add\": \"ダッシュボード - 追加\",\n \"Dashboard - Modify\": \"ダッシュボード - 修正\",\n \"Dashboard - Delete\": \"ダッシュボード - 削除\",\n \"Dashboard - View Public\": \"ダッシュボード - 公開されたダッシュボードを見る\",\n\n \"Alerting\": \"アラート\",\n \"Alerting Rule - View\": \"アラートルール - 閲覧\",\n \"Alerting Rule - Add\": \"アラートルール - 追加\",\n \"Alerting Rule - Modify\": \"アラートルール - 修正\",\n \"Alerting Rule - Delete\": \"アラートルール - 削除\",\n \"Mutting Rule - View\": \"抑制ルール - 閲覧\",\n \"Mutting Rule - Add\": \"抑制ルール - 追加\",\n \"Mutting Rule - Modify\": \"抑制ルール - 修正\",\n \"Mutting Rule - Delete\": \"抑制ルール - 削除\",\n \"Subscribing Rule - View\": \"購読ルール - 閲覧\",\n \"Subscribing Rule - Add\": \"購読ルール - 追加\",\n \"Subscribing Rule - Modify\": \"購読ルール - 修正\",\n \"Subscribing Rule - Delete\": \"購読ルール - 削除\",\n \"Self-healing-Script - View\": \"タスクテンプレート - 閲覧\",\n \"Self-healing-Script - Add\": \"タスクテンプレート - 追加\",\n \"Self-healing-Script - Modify\": \"タスクテンプレート - 修正\",\n \"Self-healing-Script - Delete\": \"タスクテンプレート - 削除\",\n \"Self-healing-Job - View\": \"一時的なタスク - 閲覧\",\n \"Self-healing-Job - Add\": \"一時的なタスク - 追加\",\n \"Self-healing-Job - Modify\": \"一時的なタスク - 修正\",\n \"Active Event - View\": \"アクティブアラート - 閲覧\",\n \"Active Event - Delete\": \"アクティブアラート - 削除\",\n \"Historical Event - View\": \"過去のアラート - 閲覧\",\n\n \"Notification\": \"通知\",\n \"Notification Rule - View\": \"通知ルール - 閲覧\",\n \"Notification Rule - Add\": \"通知ルール - 追加\",\n \"Notification Rule - Modify\": \"通知ルール - 修正\",\n \"Notification Rule - Delete\": \"通知ルール - 削除\",\n \"Media Type - View\": \"通知メディア - 閲覧\",\n \"Media Type - Add\": \"通知メディア - 追加\",\n \"Media Type - Modify\": \"通知メディア - 修正\",\n \"Media Type - Delete\": \"通知メディア - 削除\",\n \"Message Template - View\": \"メッセージテンプレート - 閲覧\",\n \"Message Template - Add\": \"メッセージテンプレート - 追加\",\n \"Message Template - Modify\": \"メッセージテンプレート - 修正\",\n \"Message Template - Delete\": \"メッセージテンプレート - 削除\",\n \"Event Pipeline - View\": \"イベント パイプライン - 閲覧\",\n \"Event Pipeline - Add\": \"イベント パイプライン - 追加\",\n \"Event Pipeline - Modify\": \"イベント パイプライン - 修正\",\n \"Event Pipeline - Delete\": \"イベント パイプライン - 削除\",\n \"Notification Settings - View\": \"旧バージョンの通知設定 - 閲覧\",\n \"Notification Templates - View\": \"旧バージョンのメッセージテンプレート - 閲覧\",\n\n \"Integrations\": \"統合センター\",\n \"Data Source - View\": \"データソース - 閲覧\",\n \"Component - View\": \"コンポーネント - 閲覧\",\n \"Component - Add\": \"コンポーネント - 追加\",\n \"Component - Modify\": \"コンポーネント - 修正\",\n \"Component - Delete\": \"コンポーネント - 削除\",\n \"Embedded Product - View\": \"システム統合 - 閲覧\",\n \"Embedded Product - Add\": \"システム統合 - 追加\",\n \"Embedded Product - Modify\": \"システム統合 - 修正\",\n \"Embedded Product - Delete\": \"システム統合 - 削除\",\n\n \"Organization\": \"組織\",\n \"User - View\": \"ユーザー - 閲覧\",\n \"User - Add\": \"ユーザー - 追加\",\n \"User - Modify\": \"ユーザー - 修正\",\n \"User - Delete\": \"ユーザー - 削除\",\n \"Team - View\": \"チーム - 閲覧\",\n \"Team - Add\": \"チーム - 追加\",\n \"Team - Modify\": \"チーム - 修正\",\n \"Team - Delete\": \"チーム - 削除\",\n \"Business Group - View\": \"業務グループ - 閲覧\",\n \"Business Group - Add\": \"業務グループ - 追加\",\n \"Business Group - Modify\": \"業務グループ - 修正\",\n \"Business Group - Delete\": \"業務グループ - 削除\",\n \"Role - View\": \"役割 - 閲覧\",\n \"Role - Add\": \"役割 - 追加\",\n \"Role - Modify\": \"役割 - 修正\",\n \"Role - Delete\": \"役割 - 削除\",\n\n \"System Settings\": \"システム設定\",\n \"View Site Settings\": \"サイト設定の表示\",\n \"View Variable Settings\": \"変数設定の表示\",\n \"View SSO Settings\": \"シングルサインオン設定の表示\",\n \"View Alerting Engines\": \"アラートエンジンの表示\",\n \"View Product Version\": \"製品のバージョンを見る\",\n\n \"Some alert rules still in the BusiGroup\": \"ビジネスグループにまだアラートルールがあります\",\n \"Some alert mutes still in the BusiGroup\": \"ビジネスグループにまだミュートルールがあります\",\n \"Some alert subscribes still in the BusiGroup\": \"ビジネスグループにまだサブスクライブルールがあります\",\n \"Some Board still in the BusiGroup\": \"ビジネスグループにまだダッシュボードがあります\",\n \"Some targets still in the BusiGroup\": \"ビジネスグループにまだ監視対象があります\",\n \"Some recording rules still in the BusiGroup\": \"ビジネスグループにまだ記録ルールがあります\",\n \"Some recovery scripts still in the BusiGroup\": \"ビジネスグループにまだ自己回復スクリプトがあります\",\n \"Some target busigroups still in the BusiGroup\": \"ビジネスグループにまだ監視対象があります\",\n\n \"saved view not found\": \"保存されたビューが見つかりません\",\n \"saved view name is blank\": \"ビュー名を空にすることはできません\",\n \"saved view page is blank\": \"ビューページを空にすることはできません\",\n \"saved view name already exists in this page\": \"このページには同名の公開ビューが既に存在します\",\n\n \"---------ja_JP--------\": \"---------ja_JP--------\"\n },\n \"ru_RU\": {\n \"Username or password invalid\": \"Неверное имя пользователя или пароль\",\n \"incorrect verification code\": \"Неверный код подтверждения\",\n \"roles empty\": \"Роли не могут быть пустыми\",\n \"Username already exists\": \"Это имя пользователя уже существует. Пожалуйста, используйте другое\",\n \"failed to count user-groups\": \"Ошибка проверки данных. Пожалуйста, повторите попытку\",\n \"UserGroup already exists\": \"Имя группы уже существует. Пожалуйста, используйте другое\",\n \"members empty\": \"Участники не могут быть пустыми\",\n \"At least one team have rw permission\": \"По крайней мере одна команда должна иметь права на чтение и запись\",\n \"Failed to create BusiGroup(%s)\": \"Не удалось создать бизнес-группу [%s]. Пожалуйста, повторите попытку\",\n \"business group id invalid\": \"Неверный идентификатор бизнес-группы\",\n \"idents empty\": \"Объекты мониторинга не могут быть пустыми\",\n \"invalid tag(%s)\": \"Тег [%s] недействителен\",\n \"invalid tagkey(%s): cannot contains . \": \"Ключ тега [%s] не может содержать точку (.)\",\n \"invalid tagkey(%s): cannot contains _ \": \"Ключ тега [%s] не может содержать подчеркивание (_)\",\n \"invalid tagkey(%s)\": \"Ключ тега [%s] недействителен\",\n \"duplicate tagkey(%s)\": \"Ключ тега (%s) дублируется\",\n \"name is empty\": \"Имя не может быть пустым\",\n \"Ident duplicate\": \"Уникальный идентификатор панели мониторинга уже существует\",\n \"No such dashboard\": \"Панель мониторинга не найдена\",\n \"Name has invalid characters\": \"Имя содержит недопустимые символы\",\n \"Name is blank\": \"Имя не может быть пустым\",\n \"forbidden\": \"Нет доступа\",\n \"builtin alerts is empty, file: %s\": \"Встроенный шаблон оповещений пуст %s\",\n \"input json is empty\": \"Предоставленные данные не могут быть пустыми\",\n \"fields empty\": \"Выбранные поля не могут быть пустыми\",\n \"No such AlertRule\": \"Правило оповещения не найдено\",\n \"GroupId(%d) invalid\": \"Неверный идентификатор бизнес-группы\",\n \"No such recording rule\": \"Правило записи не найдено\",\n \"tags is blank\": \"Теги не могут быть пустыми\",\n \"oops... etime(%d) <= btime(%d)\": \"Время начала не может быть позже времени окончания\",\n \"group_id invalid\": \"Бизнес-группа недействительна\",\n \"No such AlertMute\": \"Правило отключения оповещений не найдено\",\n \"rule_id and tags are both blank\": \"Правило оповещения и теги не могут быть пустыми одновременно\",\n \"rule is blank\": \"Правило не может быть пустым\",\n \"rule invalid\": \"Правило недействительно. Проверьте правильность ввода\",\n \"unsupported field: %s\": \"Поле %s не поддерживается\",\n \"arg(batch) should be nonnegative\": \"Параметр 'batch' должен быть неотрицательным\",\n \"arg(tolerance) should be nonnegative\": \"Параметр 'tolerance' должен быть неотрицательным\",\n \"arg(timeout) should be nonnegative\": \"Параметр 'timeout' должен быть неотрицательным\",\n \"arg(timeout) longer than five days\": \"Параметр 'timeout' не может превышать 5 дней\",\n \"arg(title) is required\": \"Параметр 'title' является обязательным\",\n \"created task.id is zero\": \"Идентификатор задачи равен нулю\",\n \"invalid ibex address: %s\": \"Неверный адрес ibex %s\",\n \"url path invalid\": \"Неверный URL-путь\",\n \"no such server\": \"Экземпляр не найден\",\n \"admin role can not be modified\": \"Роль администратора не может быть изменена\",\n \"builtin payload already exists\": \"Встроенный шаблон уже существует\",\n \"This functionality has not been enabled. Please contact the system administrator to activate it.\": \"Эта функция не активирована. Пожалуйста, обратитесь к системному администратору для активации\",\n \"targets not exist: %s\": \"Некоторые машины не существуют: %s\",\n \"mute is disabled\": \"Правило отключения оповещений деактивировано\",\n \"datasource id not match\": \"Идентификатор источника данных не совпадает\",\n \"event trigger time not within mute time range\": \"Время срабатывания события не входит в диапазон времени отключения оповещений\",\n \"event trigger time not within periodic mute range\": \"Время срабатывания события не входит в периодический диапазон отключения оповещений\",\n \"mute time type invalid\": \"Недопустимый тип времени отключения оповещений\",\n \"event severity not match mute severity\": \"Уровень важности события не соответствует уровню важности отключения оповещений\",\n \"event tags not match mute tags\": \"Теги события не соответствуют тегам отключения оповещений\",\n \"event datasource not match\": \"Источник данных события не соответствует\",\n \"event rule id not match\": \"Идентификатор правила оповещения события не соответствует\",\n \"event tags not match\": \"Теги события не соответствуют\",\n \"event group name not match\": \"Название бизнес-группы события не соответствует\",\n \"event severity not match\": \"Уровень важности события не соответствует\",\n \"subscribe notify rule not found: %v\": \"Правило уведомления подписки не найдено: %v\",\n \"notify rule send error: %v\": \"Ошибка отправки правила уведомления: %v\",\n \"event match subscribe and notification test ok\": \"Событие соответствует правилу подписки, тест уведомления успешен\",\n \"no notify rules selected\": \"Правила уведомлений не выбраны\",\n \"no notify channels selected\": \"Каналы уведомлений не выбраны\",\n \"no notify groups selected\": \"Группы уведомлений не выбраны\",\n \"all users missing notify channel configurations: %v\": \"У всех пользователей отсутствуют настройки каналов уведомлений: %v\",\n \"event match subscribe and notify settings ok\": \"Событие соответствует правилу подписки, настройки уведомлений в порядке\",\n \"/loki suffix is miss, please add /loki to the url: %s\": \"Отсутствует суффикс /loki, пожалуйста, добавьте /loki к URL: %s\",\n\n \"event time not match time filter\": \"Время события не соответствует временному фильтру\",\n \"event severity not match severity filter\": \"Уровень события не соответствует фильтру уровня\",\n \"event tag not match tag filter\": \"Теги события не соответствуют фильтру тегов\",\n \"event attributes not match attributes filter\": \"Атрибуты события не соответствуют фильтру атрибутов\",\n \"failed to parse tag filter: %v\": \"Не удалось разобрать фильтр тегов: %v\",\n \"event is dropped\": \"Событие отброшено, уведомление не будет отправлено\",\n \"drop event success\": \"Событие успешно отброшено\",\n \"drop event failed\": \"Не удалось отбросить событие\",\n \"callback success\": \"Обратный вызов успешен\",\n \n \"Infrastructure\": \"Инфраструктура\",\n \"Host - View\": \"Хост - Просмотр\",\n \"Host - Modify\": \"Хост - Изменить\",\n \"Host - Delete\": \"Хост - Удалить\",\n \"Host - Bind Uncategorized\": \"Хост - Привязать неразмеченные хосты к бизнес-группе\",\n\n \"Explorer\": \"Поиск данных\",\n \"Metrics Explorer\": \"Поиск метрик\",\n \"Quick View\": \"Быстрый просмотр\",\n \"Built-in Metric - View\": \"Встроенные метрики - Просмотр\",\n \"Built-in Metric - Add\": \"Встроенные метрики - Добавить\",\n \"Built-in Metric - Modify\": \"Встроенные метрики - Изменить\",\n \"Built-in Metric - Delete\": \"Встроенные метрики - Удалить\",\n \"Recording Rule - View\": \"Правила записи - Просмотр\",\n \"Recording Rule - Add\": \"Правила записи - Добавить\",\n \"Recording Rule - Modify\": \"Правила записи - Изменить\",\n \"Recording Rule - Delete\": \"Правила записи - Удалить\",\n \"Logs Explorer\": \"Поиск логов\",\n \"Index Pattern - View\": \"Шаблоны индексов - Просмотр\",\n \"Index Pattern - Add\": \"Шаблоны индексов - Добавить\",\n \"Index Pattern - Modify\": \"Шаблоны индексов - Изменить\",\n \"Index Pattern - Delete\": \"Шаблоны индексов - Удалить\",\n \"Dashboard - View\": \"Панель мониторинга - Просмотр\",\n \"Dashboard - Add\": \"Панель мониторинга - Добавить\",\n \"Dashboard - Modify\": \"Панель мониторинга - Изменить\",\n \"Dashboard - Delete\": \"Панель мониторинга - Удалить\",\n \"Dashboard - View Public\": \"Панель мониторинга - Просмотр публичных панелей\",\n\n \"Alerting\": \"Оповещения\",\n \"Alerting Rule - View\": \"Правила оповещений - Просмотр\",\n \"Alerting Rule - Add\": \"Правила оповещений - Добавить\",\n \"Alerting Rule - Modify\": \"Правила оповещений - Изменить\",\n \"Alerting Rule - Delete\": \"Правила оповещений - Удалить\",\n \"Mutting Rule - View\": \"Правила отключения оповещений - Просмотр\",\n \"Mutting Rule - Add\": \"Правила отключения оповещений - Добавить\",\n \"Mutting Rule - Modify\": \"Правила отключения оповещений - Изменить\",\n \"Mutting Rule - Delete\": \"Правила отключения оповещений - Удалить\",\n \"Subscribing Rule - View\": \"Правила подписки - Просмотр\",\n \"Subscribing Rule - Add\": \"Правила подписки - Добавить\",\n \"Subscribing Rule - Modify\": \"Правила подписки - Изменить\",\n \"Subscribing Rule - Delete\": \"Правила подписки - Удалить\",\n \"Self-healing-Script - View\": \"Скрипты самоисцеления - Просмотр\",\n \"Self-healing-Script - Add\": \"Скрипты самоисцеления - Добавить\",\n \"Self-healing-Script - Modify\": \"Скрипты самоисцеления - Изменить\",\n \"Self-healing-Script - Delete\": \"Скрипты самоисцеления - Удалить\",\n \"Self-healing-Job - View\": \"Задачи самоисцеления - Просмотр\",\n \"Self-healing-Job - Add\": \"Задачи самоисцеления - Добавить\",\n \"Self-healing-Job - Modify\": \"Задачи самоисцеления - Изменить\",\n \"Active Event - View\": \"Активные события - Просмотр\",\n \"Active Event - Delete\": \"Активные события - Удалить\",\n \"Historical Event - View\": \"Исторические события - Просмотр\",\n\n \"Notification\": \"Уведомления\",\n \"Notification Rule - View\": \"Правила уведомлений - Просмотр\",\n \"Notification Rule - Add\": \"Правила уведомлений - Добавить\",\n \"Notification Rule - Modify\": \"Правила уведомлений - Изменить\",\n \"Notification Rule - Delete\": \"Правила уведомлений - Удалить\",\n \"Media Type - View\": \"Типы уведомлений - Просмотр\",\n \"Media Type - Add\": \"Типы уведомлений - Добавить\",\n \"Media Type - Modify\": \"Типы уведомлений - Изменить\",\n \"Media Type - Delete\": \"Типы уведомлений - Удалить\",\n \"Message Template - View\": \"Шаблоны сообщений - Просмотр\",\n \"Message Template - Add\": \"Шаблоны сообщений - Добавить\",\n \"Message Template - Modify\": \"Шаблоны сообщений - Изменить\",\n \"Message Template - Delete\": \"Шаблоны сообщений - Удалить\",\n \"Event Pipeline - View\": \"Конвейер событий - Просмотр\",\n \"Event Pipeline - Add\": \"Конвейер событий - Добавить\",\n \"Event Pipeline - Modify\": \"Конвейер событий - Изменить\",\n \"Event Pipeline - Delete\": \"Конвейер событий - Удалить\",\n \"Notification Settings - View\": \"Настройки уведомлений (старый вариант) - Просмотр\",\n \"Notification Templates - View\": \"Шаблоны уведомлений (старый вариант) - Просмотр\",\n\n \"Integrations\": \"Центр интеграций\",\n \"Data Source - View\": \"Источники данных - Просмотр\",\n \"Component - View\": \"Компоненты - Просмотр\",\n \"Component - Add\": \"Компоненты - Добавить\",\n \"Component - Modify\": \"Компоненты - Изменить\",\n \"Component - Delete\": \"Компоненты - Удалить\",\n \"Embedded Product - View\": \"Встроенные продукты - Просмотр\",\n \"Embedded Product - Add\": \"Встроенные продукты - Добавить\",\n \"Embedded Product - Modify\": \"Встроенные продукты - Изменить\",\n \"Embedded Product - Delete\": \"Встроенные продукты - Удалить\",\n\n \"Organization\": \"Организация\",\n \"User - View\": \"Пользователи - Просмотр\",\n \"User - Add\": \"Пользователи - Добавить\",\n \"User - Modify\": \"Пользователи - Изменить\",\n \"User - Delete\": \"Пользователи - Удалить\",\n \"Team - View\": \"Команды - Просмотр\",\n \"Team - Add\": \"Команды - Добавить\",\n \"Team - Modify\": \"Команды - Изменить\",\n \"Team - Delete\": \"Команды - Удалить\",\n \"Business Group - View\": \"Бизнес-группы - Просмотр\",\n \"Business Group - Add\": \"Бизнес-группы - Добавить\",\n \"Business Group - Modify\": \"Бизнес-группы - Изменить\",\n \"Business Group - Delete\": \"Бизнес-группы - Удалить\",\n \"Role - View\": \"Роли - Просмотр\",\n \"Role - Add\": \"Роли - Добавить\",\n \"Role - Modify\": \"Роли - Изменить\",\n \"Role - Delete\": \"Роли - Удалить\",\n\n \"System Settings\": \"Настройки системы\",\n \"View Site Settings\": \"Просмотр настроек сайта\",\n \"View Variable Settings\": \"Просмотр переменных\",\n \"View SSO Settings\": \"Просмотр настроек единого входа\",\n \"View Alerting Engines\": \"Просмотр списка алертинг-инженеров\",\n \"View Product Version\": \"Просмотр версии продукта\",\n\n \"Some alert rules still in the BusiGroup\": \"В бизнес-группе еще есть правила оповещений\",\n \"Some alert mutes still in the BusiGroup\": \"В бизнес-группе еще есть правила отключения оповещений\",\n \"Some alert subscribes still in the BusiGroup\": \"В бизнес-группе еще есть правила подписки\",\n \"Some Board still in the BusiGroup\": \"В бизнес-группе еще есть панели мониторинга\",\n \"Some targets still in the BusiGroup\": \"В бизнес-группе еще есть объекты мониторинга\",\n \"Some recording rules still in the BusiGroup\": \"В бизнес-группе еще есть правила записи\",\n \"Some recovery scripts still in the BusiGroup\": \"В бизнес-группе еще есть скрипты самоисцеления\",\n \"Some target busigroups still in the BusiGroup\": \"В бизнес-группе еще есть объекты мониторинга\",\n\n \"saved view not found\": \"Сохраненный вид не найден\",\n \"saved view name is blank\": \"Название вида не может быть пустым\",\n \"saved view page is blank\": \"Страница вида не может быть пустой\",\n \"saved view name already exists in this page\": \"На этой странице уже существует публичный вид с таким названием\",\n\n \"---------ru_RU--------\": \"---------ru_RU--------\"\n }\n}`\n"
},
{
"path": "pkg/ibex/ibex.go",
"content": "package ibex\n\nimport (\n\t\"bytes\"\n\t\"encoding/json\"\n\t\"fmt\"\n\t\"io/ioutil\"\n\t\"net/http\"\n\t\"net/url\"\n\t\"strings\"\n\t\"time\"\n)\n\ntype Ibex struct {\n\taddress string\n\tauthUser string\n\tauthPass string\n\ttimeout time.Duration\n\tmethod string\n\turlPath string\n\tinValue interface{}\n\toutPtr interface{}\n\theaders map[string]string\n\tqueries map[string][]string\n}\n\nfunc New(addr, user, pass string, timeout int64) *Ibex {\n\tif !strings.HasPrefix(addr, \"http\") {\n\t\taddr = \"http://\" + addr\n\t}\n\n\treturn &Ibex{\n\t\taddress: addr,\n\t\tauthUser: user,\n\t\tauthPass: pass,\n\t\ttimeout: time.Duration(timeout) * time.Millisecond,\n\t\theaders: make(map[string]string),\n\t\tqueries: make(map[string][]string),\n\t}\n}\n\nfunc (i *Ibex) In(v interface{}) *Ibex {\n\ti.inValue = v\n\treturn i\n}\n\nfunc (i *Ibex) Out(ptr interface{}) *Ibex {\n\ti.outPtr = ptr\n\treturn i\n}\n\nfunc (i *Ibex) Path(p string) *Ibex {\n\ti.urlPath = p\n\treturn i\n}\n\nfunc (i *Ibex) Method(m string) *Ibex {\n\ti.method = strings.ToUpper(m)\n\treturn i\n}\n\nfunc (i *Ibex) Header(key, value string) *Ibex {\n\ti.headers[key] = value\n\treturn i\n}\n\nfunc (i *Ibex) QueryString(key, value string) *Ibex {\n\tif param, ok := i.queries[key]; ok {\n\t\ti.queries[key] = append(param, value)\n\t} else {\n\t\ti.queries[key] = []string{value}\n\t}\n\treturn i\n}\n\nfunc (i *Ibex) buildUrl() {\n\tvar queries string\n\tif len(i.queries) > 0 {\n\t\tvar buf bytes.Buffer\n\t\tfor k, v := range i.queries {\n\t\t\tfor _, vv := range v {\n\t\t\t\tbuf.WriteString(url.QueryEscape(k))\n\t\t\t\tbuf.WriteByte('=')\n\t\t\t\tbuf.WriteString(url.QueryEscape(vv))\n\t\t\t\tbuf.WriteByte('&')\n\t\t\t}\n\t\t}\n\t\tqueries = buf.String()\n\t\tqueries = queries[0 : len(queries)-1]\n\t}\n\n\tif len(queries) > 0 {\n\t\tif strings.Contains(i.urlPath, \"?\") {\n\t\t\ti.urlPath += \"&\" + queries\n\t\t} else {\n\t\t\ti.urlPath = i.urlPath + \"?\" + queries\n\t\t}\n\t}\n}\n\nfunc (i *Ibex) do() error {\n\ti.buildUrl()\n\n\tvar req *http.Request\n\tvar err error\n\tvar bs []byte\n\n\tif i.inValue != nil {\n\t\tbs, err = json.Marshal(i.inValue)\n\t\tif err != nil {\n\t\t\treturn err\n\t\t}\n\t\treq, err = http.NewRequest(i.method, i.address+i.urlPath, bytes.NewBuffer(bs))\n\t} else {\n\t\treq, err = http.NewRequest(i.method, i.address+i.urlPath, nil)\n\t}\n\n\tif err != nil {\n\t\treturn err\n\t}\n\n\tfor key, value := range i.headers {\n\t\treq.Header.Set(key, value)\n\t}\n\n\tif i.authUser != \"\" {\n\t\treq.SetBasicAuth(i.authUser, i.authPass)\n\t}\n\n\tif i.method != http.MethodGet {\n\t\treq.Header.Set(\"Content-Type\", \"application/json\")\n\t}\n\n\tclient := http.Client{\n\t\tTimeout: i.timeout,\n\t}\n\n\tres, err := client.Do(req)\n\tif err != nil {\n\t\treturn err\n\t}\n\n\tif res.StatusCode != 200 {\n\t\treturn fmt.Errorf(\"url(%s) response code: %v\", i.urlPath, res.StatusCode)\n\t}\n\n\tif res.Body != nil {\n\t\tdefer res.Body.Close()\n\t}\n\n\tpayload, err := ioutil.ReadAll(res.Body)\n\tif err != nil {\n\t\treturn err\n\t}\n\n\treturn json.Unmarshal(payload, i.outPtr)\n}\n\nfunc (i *Ibex) GET() error {\n\ti.Method(http.MethodGet)\n\treturn i.do()\n}\n\nfunc (i *Ibex) POST() error {\n\ti.Method(http.MethodPost)\n\treturn i.do()\n}\n\nfunc (i *Ibex) PUT() error {\n\ti.Method(http.MethodPut)\n\treturn i.do()\n}\n\nfunc (i *Ibex) DELETE() error {\n\ti.Method(http.MethodDelete)\n\treturn i.do()\n}\n\nfunc (i *Ibex) PATCH() error {\n\ti.Method(http.MethodPatch)\n\treturn i.do()\n}\n"
},
{
"path": "pkg/ldapx/ldapx.go",
"content": "package ldapx\n\nimport (\n\t\"crypto/tls\"\n\t\"fmt\"\n\t\"strings\"\n\t\"sync\"\n\t\"time\"\n\n\t\"github.com/ccfos/nightingale/v6/models\"\n\t\"github.com/ccfos/nightingale/v6/pkg/ctx\"\n\n\t\"github.com/go-ldap/ldap/v3\"\n\t\"github.com/pkg/errors\"\n\t\"github.com/toolkits/pkg/container/set\"\n\t\"github.com/toolkits/pkg/logger\"\n)\n\ntype Config struct {\n\tEnable bool\n\tHost string\n\tPort int\n\tBaseDn string\n\tBindUser string\n\tBindPass string\n\tSyncAddUsers bool\n\tSyncDelUsers bool\n\tSyncInterval time.Duration\n\tUserFilter string\n\tAuthFilter string\n\tAttributes LdapAttributes\n\tCoverAttributes bool\n\tCoverTeams bool\n\tTLS bool\n\tStartTLS bool\n\tDefaultRoles []string\n\tDefaultTeams []int64\n\tRoleTeamMapping []RoleTeamMapping\n}\n\ntype SsoClient struct {\n\tEnable bool\n\tHost string\n\tPort int\n\tBaseDn string\n\tBaseDns []string\n\tBindUser string\n\tBindPass string\n\tSyncAdd bool\n\tSyncDel bool\n\tSyncInterval time.Duration\n\tUserFilter string\n\tAuthFilter string\n\tAttributes LdapAttributes\n\tCoverAttributes bool\n\tCoverTeams bool\n\tTLS bool\n\tStartTLS bool\n\tDefaultRoles []string\n\tDefaultTeams []int64\n\tRoleTeamMapping map[string]RoleTeamMapping\n\n\tTicker *time.Ticker\n\tsync.RWMutex\n}\n\ntype LdapAttributes struct {\n\tUsername string\n\tNickname string\n\tPhone string\n\tEmail string\n\tGroup string // User support is “memberOf” by default\n}\n\ntype RoleTeamMapping struct {\n\tDN string\n\tRoles []string\n\tTeams []int64\n}\n\nfunc New(cf Config) *SsoClient {\n\tvar s = &SsoClient{\n\t\tTicker: time.NewTicker(time.Hour * 24),\n\t}\n\n\tif !cf.Enable {\n\t\treturn s\n\t}\n\n\ts.Reload(cf)\n\treturn s\n}\n\nfunc (s *SsoClient) Reload(cf Config) {\n\ts.Lock()\n\tdefer s.Unlock()\n\tif !cf.Enable {\n\t\ts.Enable = cf.Enable\n\t\treturn\n\t}\n\n\ts.Enable = cf.Enable\n\ts.Host = cf.Host\n\ts.Port = cf.Port\n\ts.BaseDn = cf.BaseDn\n\ts.BindUser = cf.BindUser\n\ts.BindPass = cf.BindPass\n\ts.AuthFilter = cf.AuthFilter\n\ts.Attributes = cf.Attributes\n\ts.CoverAttributes = cf.CoverAttributes\n\ts.CoverTeams = cf.CoverTeams\n\ts.TLS = cf.TLS\n\ts.StartTLS = cf.StartTLS\n\ts.DefaultRoles = cf.DefaultRoles\n\ts.DefaultTeams = cf.DefaultTeams\n\ts.SyncAdd = cf.SyncAddUsers\n\ts.SyncDel = cf.SyncDelUsers\n\ts.SyncInterval = cf.SyncInterval\n\ts.SyncDel = cf.SyncDelUsers\n\ts.UserFilter = cf.UserFilter\n\n\t// Needs to be used to pull the group of LDAP to which the user belongs, that is,\n\t// the memberOf property of the user needs to be pulled by default\n\ts.Attributes.Group = \"memberOf\"\n\n\t// Role Mapping and team mapping are configured\n\ts.RoleTeamMapping = make(map[string]RoleTeamMapping, len(cf.RoleTeamMapping))\n\tfor _, mapping := range cf.RoleTeamMapping {\n\t\ts.RoleTeamMapping[mapping.DN] = mapping\n\t}\n\n\tif s.SyncInterval > 0 {\n\t\ts.Ticker.Reset(s.SyncInterval * time.Second)\n\t}\n\n\ts.BaseDns = strings.Split(s.BaseDn, \"|\")\n}\n\nfunc (s *SsoClient) Copy() *SsoClient {\n\ts.RLock()\n\n\tnewRoles := make([]string, len(s.DefaultRoles))\n\tcopy(newRoles, s.DefaultRoles)\n\tnewTeams := make([]int64, len(s.DefaultTeams))\n\tcopy(newTeams, s.DefaultTeams)\n\tlc := *s\n\tlc.DefaultRoles = newRoles\n\tlc.DefaultTeams = newTeams\n\n\ts.RUnlock()\n\n\treturn &lc\n}\n\nfunc (s *SsoClient) LoginCheck(user, pass string) (*ldap.SearchResult, error) {\n\tlc := s.Copy()\n\n\tconn, err := lc.newLdapConn()\n\tif err != nil {\n\t\treturn nil, err\n\t}\n\tdefer conn.Close()\n\n\tsrs, err := lc.ldapReq(conn, lc.AuthFilter, user)\n\tif err != nil {\n\t\treturn nil, fmt.Errorf(\"ldap.error: ldap search fail: %v\", err)\n\t}\n\n\tvar sr *ldap.SearchResult\n\n\tfor i := range srs {\n\t\tif srs[i] == nil || len(srs[i].Entries) == 0 {\n\t\t\tcontinue\n\t\t}\n\n\t\t// 多个 dn 中,账号的唯一性由 LDAP 保证\n\t\tif len(srs[i].Entries) > 1 {\n\t\t\treturn nil, fmt.Errorf(\"ldap.error: search user(%s), multi entries found\", user)\n\t\t}\n\n\t\tsr = srs[i]\n\n\t\tif err := conn.Bind(srs[i].Entries[0].DN, pass); err != nil {\n\t\t\treturn nil, fmt.Errorf(\"username or password invalid\")\n\t\t}\n\n\t\tfor _, info := range srs[i].Entries[0].Attributes {\n\t\t\tlogger.Infof(\"ldap.info: user(%s) info: %+v\", user, info)\n\t\t}\n\n\t\tbreak\n\t}\n\n\tif sr == nil {\n\t\treturn nil, fmt.Errorf(\"username or password invalid\")\n\t}\n\n\treturn sr, nil\n}\n\nfunc (s *SsoClient) newLdapConn() (*ldap.Conn, error) {\n\tvar conn *ldap.Conn\n\tvar err error\n\n\taddr := fmt.Sprintf(\"%s:%d\", s.Host, s.Port)\n\n\tldap.DefaultTimeout = time.Second * 10\n\tif s.TLS {\n\t\tconn, err = ldap.DialTLS(\"tcp\", addr, &tls.Config{InsecureSkipVerify: true})\n\t} else {\n\t\tconn, err = ldap.Dial(\"tcp\", addr)\n\t}\n\n\tif err != nil {\n\t\treturn nil, fmt.Errorf(\"ldap.error: cannot dial ldap(%s): %v\", addr, err)\n\t}\n\n\tconn.SetTimeout(time.Second * 10)\n\n\tif !s.TLS && s.StartTLS {\n\t\tif err := conn.StartTLS(&tls.Config{InsecureSkipVerify: true}); err != nil {\n\t\t\treturn nil, fmt.Errorf(\"ldap.error: conn startTLS fail: %v\", err)\n\t\t}\n\t}\n\n\t// if bindUser is empty, anonymousSearch mode\n\tif s.BindUser != \"\" {\n\t\t// BindSearch mode\n\t\tif err := conn.Bind(s.BindUser, s.BindPass); err != nil {\n\t\t\treturn nil, fmt.Errorf(\"ldap.error: bind ldap fail: %v, use user(%s) to bind\", err, s.BindUser)\n\t\t}\n\t}\n\n\treturn conn, nil\n}\n\nfunc (s *SsoClient) ldapReq(conn *ldap.Conn, filter string, values ...interface{}) ([]*ldap.SearchResult, error) {\n\tsrs := make([]*ldap.SearchResult, 0, len(s.BaseDns))\n\n\tfor i := range s.BaseDns {\n\t\tsearchRequest := ldap.NewSearchRequest(\n\t\t\tstrings.TrimSpace(s.BaseDns[i]), // The base dn to search\n\t\t\tldap.ScopeWholeSubtree, ldap.NeverDerefAliases, 0, 0, false,\n\t\t\tfmt.Sprintf(filter, values...), // The filter to apply\n\t\t\ts.genLdapAttributeSearchList(), // A list attributes to retrieve\n\t\t\tnil,\n\t\t)\n\t\tsr, err := conn.Search(searchRequest)\n\t\tif err != nil {\n\t\t\tlogger.Errorf(\"ldap.error: ldap search fail: %v\", err)\n\t\t\tcontinue\n\t\t}\n\t\tsrs = append(srs, sr)\n\t}\n\n\treturn srs, nil\n}\n\n// GetUserRolesAndTeams Gets the roles and teams of the user\nfunc (s *SsoClient) GetUserRolesAndTeams(entry *ldap.Entry) *RoleTeamMapping {\n\tlc := s.Copy()\n\n\tgroups := entry.GetAttributeValues(lc.Attributes.Group)\n\trolesSet := set.NewStringSet()\n\tteamsSet := set.NewInt64Set()\n\tmapping := lc.RoleTeamMapping\n\n\t// Collect DNs and Groups\n\tdns := append(groups, entry.DN)\n\tfor _, dn := range dns {\n\t\t// adds roles to the given set from the specified dn entry.\n\t\tif rt, exists := mapping[dn]; exists {\n\t\t\tfor _, role := range rt.Roles {\n\t\t\t\trolesSet.Add(role)\n\t\t\t}\n\t\t}\n\t\t// adds teams to the given set from the specified dn entry.\n\t\tif rt, exists := mapping[dn]; exists {\n\t\t\tfor _, team := range rt.Teams {\n\t\t\t\tteamsSet.Add(team)\n\t\t\t}\n\t\t}\n\t}\n\n\t// Convert sets to slices\n\treturn &RoleTeamMapping{\n\t\tDN: entry.DN,\n\t\tRoles: rolesSet.ToSlice(),\n\t\tTeams: teamsSet.ToSlice(),\n\t}\n}\n\nfunc (s *SsoClient) genLdapAttributeSearchList() []string {\n\tvar ldapAttributes []string\n\n\tattrs := s.Attributes\n\n\tif attrs.Username == \"\" {\n\t\tldapAttributes = append(ldapAttributes, \"uid\")\n\t} else {\n\t\tldapAttributes = append(ldapAttributes, attrs.Username)\n\t}\n\n\tif attrs.Nickname != \"\" {\n\t\tldapAttributes = append(ldapAttributes, attrs.Nickname)\n\t}\n\tif attrs.Email != \"\" {\n\t\tldapAttributes = append(ldapAttributes, attrs.Email)\n\t}\n\tif attrs.Phone != \"\" {\n\t\tldapAttributes = append(ldapAttributes, attrs.Phone)\n\t}\n\n\tif attrs.Group != \"\" {\n\t\tldapAttributes = append(ldapAttributes, attrs.Group)\n\t}\n\n\treturn ldapAttributes\n}\n\nfunc LdapLogin(ctx *ctx.Context, username, pass string, defaultRoles []string, defaultTeams []int64, ldap *SsoClient) (*models.User, error) {\n\tsr, err := ldap.LoginCheck(username, pass)\n\tif err != nil {\n\t\treturn nil, err\n\t}\n\n\t// copy attributes from ldap\n\tldap.RLock()\n\tattrs := ldap.Attributes\n\tcoverAttributes := ldap.CoverAttributes\n\tcoverTeams := ldap.CoverTeams\n\tldap.RUnlock()\n\n\tvar nickname, email, phone string\n\tif attrs.Nickname != \"\" {\n\t\tnickname = sr.Entries[0].GetAttributeValue(attrs.Nickname)\n\t}\n\tif attrs.Email != \"\" {\n\t\temail = sr.Entries[0].GetAttributeValue(attrs.Email)\n\t}\n\tif attrs.Phone != \"\" {\n\t\tphone = strings.Replace(sr.Entries[0].GetAttributeValue(attrs.Phone), \" \", \"\", -1)\n\t}\n\n\t// Gets the roles and teams for this entry\n\troleTeamMapping := ldap.GetUserRolesAndTeams(sr.Entries[0])\n\n\tuser, err := models.UserGetByUsername(ctx, username)\n\tif err != nil {\n\t\treturn nil, err\n\t}\n\n\tif user != nil && user.Id > 0 {\n\t\tif coverAttributes {\n\t\t\t// need to override the user's basic properties\n\t\t\tupdatedFields := user.UpdateSsoFieldsWithRoles(\"ldap\", nickname, phone, email, roleTeamMapping.Roles)\n\t\t\tif err = user.Update(ctx, \"update_at\", updatedFields...); err != nil {\n\t\t\t\treturn nil, errors.WithMessage(err, \"failed to update user\")\n\t\t\t}\n\t\t}\n\n\t\tif len(roleTeamMapping.Teams) == 0 {\n\t\t\troleTeamMapping.Teams = defaultTeams\n\t\t}\n\n\t\t// Synchronize group information\n\t\tif err = models.UserGroupMemberSync(ctx, roleTeamMapping.Teams, user.Id, coverTeams); err != nil {\n\t\t\tlogger.Errorf(\"ldap.error: failed to update user(%s) group member err: %+v\", user, err)\n\t\t}\n\t} else {\n\t\tuser = new(models.User)\n\t\tif len(roleTeamMapping.Roles) == 0 {\n\t\t\t// No role mapping is configured, the configured default role is used\n\t\t\troleTeamMapping.Roles = defaultRoles\n\t\t}\n\n\t\tuser.FullSsoFields(\"ldap\", username, nickname, phone, email, roleTeamMapping.Roles)\n\t\tif err = models.DB(ctx).Create(user).Error; err != nil {\n\t\t\treturn nil, errors.WithMessage(err, \"failed to add user\")\n\t\t}\n\n\t\tif len(roleTeamMapping.Teams) == 0 {\n\t\t\tfor _, gid := range defaultTeams {\n\t\t\t\terr = models.UserGroupMemberAdd(ctx, gid, user.Id)\n\t\t\t\tif err != nil {\n\t\t\t\t\tlogger.Errorf(\"user:%v gid:%d UserGroupMemberAdd: %s\", user, gid, err)\n\t\t\t\t}\n\t\t\t}\n\t\t}\n\n\t\tif err = models.UserGroupMemberSync(ctx, roleTeamMapping.Teams, user.Id, false); err != nil {\n\t\t\tlogger.Errorf(\"ldap.error: failed to update user(%s) group member err: %+v\", user, err)\n\t\t}\n\t}\n\n\treturn user, nil\n}\n"
},
{
"path": "pkg/ldapx/user_sync.go",
"content": "package ldapx\n\nimport (\n\t\"fmt\"\n\t\"time\"\n\n\t\"github.com/ccfos/nightingale/v6/dumper\"\n\t\"github.com/ccfos/nightingale/v6/models\"\n\t\"github.com/ccfos/nightingale/v6/pkg/ctx\"\n\n\t\"github.com/toolkits/pkg/logger\"\n)\n\nfunc (s *SsoClient) SyncAddAndDelUsers(ctx *ctx.Context) error {\n\tif !s.Enable || !s.SyncAdd {\n\t\treturn nil\n\t}\n\n\tstart := time.Now()\n\n\tusersFromSso, usersFromDb, err := s.getUsersFromSsoAndDb(ctx)\n\tif err != nil {\n\t\tdumper.PutSyncRecord(\"sso_user\", start.Unix(), -1, -1, \"failed to query users: \"+err.Error())\n\t\treturn err\n\t}\n\n\tusersToBeAdd, usersExists := diffUsers(usersFromDb, usersFromSso)\n\t// Incremental users synchronize both user information and group information\n\tfor _, user := range usersToBeAdd {\n\t\tif err = user.AddUserAndGroups(ctx, s.CoverTeams); err != nil {\n\t\t\tlogger.Warningf(\"failed to sync add user[%v] to db, err: %v\", *user, err)\n\t\t}\n\t}\n\n\t// Existing users synchronize group information only\n\tfor _, user := range usersExists {\n\t\tif err = models.UserGroupMemberSyncByUser(ctx, user, s.CoverTeams); err != nil {\n\t\t\tlogger.Warningf(\"failed to sync add user[%v] to db, err: %v\", *user, err)\n\t\t}\n\t}\n\n\tvar usersToBeDel []*models.User\n\tif s.SyncDel {\n\t\tusersToBeDel, _ = diffUsers(usersFromSso, usersFromDb)\n\t\tif len(usersToBeDel) > 0 {\n\t\t\tdelIds := make([]int64, 0, len(usersToBeDel))\n\t\t\tfor _, user := range usersToBeDel {\n\t\t\t\tdelIds = append(delIds, user.Id)\n\t\t\t}\n\t\t\tif err := models.UserDelByIds(ctx, delIds); err != nil {\n\t\t\t\tlogger.Warningf(\"failed to sync del users[%v] to db, err: %v\", usersToBeDel, err)\n\t\t\t}\n\t\t}\n\t}\n\n\tms := time.Since(start).Milliseconds()\n\tlogger.Infof(\"timer: sync sso users done, cost: %dms, number: %d\", ms, len(usersToBeDel)+len(usersToBeAdd))\n\tdumper.PutSyncRecord(\"sso_user\", start.Unix(), ms, len(usersToBeDel)+len(usersToBeAdd), \"success\")\n\treturn nil\n}\n\nfunc (s *SsoClient) getUsersFromSsoAndDb(ctx *ctx.Context) (usersFromSso, usersFromDb map[string]*models.User, err error) {\n\tusersFromSso, err = s.UserGetAll()\n\tif err != nil {\n\t\treturn nil, nil, err\n\t}\n\n\tusersFromDb, err = models.UserGetsBySso(ctx, \"ldap\")\n\tif err != nil {\n\t\treturn nil, nil, err\n\t}\n\n\treturn\n}\n\nfunc (s *SsoClient) UserGetAll() (map[string]*models.User, error) {\n\tlc := s.Copy()\n\n\tconn, err := lc.newLdapConn()\n\tif err != nil {\n\t\treturn nil, err\n\t}\n\tdefer conn.Close()\n\n\tsrs, err := lc.ldapReq(conn, lc.UserFilter)\n\tif err != nil {\n\t\treturn nil, fmt.Errorf(\"ldap.error: ldap search fail: %v\", err)\n\t}\n\n\tres := make(map[string]*models.User)\n\n\tfor i := range srs {\n\t\tif srs[i] == nil {\n\t\t\tcontinue\n\t\t}\n\t\tfor _, entry := range srs[i].Entries {\n\t\t\tattrs := lc.Attributes\n\t\t\tusername := entry.GetAttributeValue(attrs.Username)\n\t\t\tnickname := entry.GetAttributeValue(attrs.Nickname)\n\t\t\temail := entry.GetAttributeValue(attrs.Email)\n\t\t\tphone := entry.GetAttributeValue(attrs.Phone)\n\n\t\t\t// Gets the roles and teams for this entry\n\t\t\troleTeamMapping := lc.GetUserRolesAndTeams(entry)\n\t\t\tif len(roleTeamMapping.Roles) == 0 {\n\t\t\t\t// No role mapping is configured, the configured default role is used\n\t\t\t\troleTeamMapping.Roles = lc.DefaultRoles\n\t\t\t}\n\t\t\tuser := new(models.User)\n\t\t\tuser.FullSsoFieldsWithTeams(\"ldap\", username, nickname, phone, email, roleTeamMapping.Roles, roleTeamMapping.Teams)\n\n\t\t\tres[entry.GetAttributeValue(attrs.Username)] = user\n\t\t}\n\t}\n\n\treturn res, nil\n}\n\n// newExtraUsers: in newUsers not in base\n// updatedUsers: in newUsers and in base, update the user.TeamsLst data\nfunc diffUsers(base, newUsers map[string]*models.User) (newExtraUsers, updatedUsers []*models.User) {\n\tfor username, user := range newUsers {\n\t\tif baseUser, exist := base[username]; !exist {\n\t\t\tnewExtraUsers = append(newExtraUsers, user)\n\t\t} else {\n\t\t\tif len(baseUser.TeamsLst) == 0 {\n\t\t\t\t// Need to pass on the team message\n\t\t\t\tbaseUser.TeamsLst = user.TeamsLst\n\t\t\t}\n\t\t\tupdatedUsers = append(updatedUsers, baseUser)\n\t\t}\n\t}\n\treturn\n}\n\nfunc (s *SsoClient) SyncDelUsers(ctx *ctx.Context) error {\n\tif !s.Enable || s.SyncAdd || !s.SyncDel {\n\t\treturn nil\n\t}\n\n\tstart := time.Now()\n\n\tusersFromDb, err := models.UserGetsBySso(ctx, \"ldap\")\n\tif err != nil {\n\t\tdumper.PutSyncRecord(\"sso_user\", start.Unix(), -1, -1, \"failed to query users: \"+err.Error())\n\t\treturn err\n\t}\n\n\tdelIds := make([]int64, 0)\n\tfor _, user := range usersFromDb {\n\t\texist, err := s.UserExist(user.Username)\n\t\tif err != nil {\n\t\t\tdumper.PutSyncRecord(\"sso_user\", start.Unix(), -1, -1, \"failed to check whether the user exists: \"+err.Error())\n\t\t} else if !exist {\n\t\t\tdelIds = append(delIds, user.Id)\n\t\t}\n\t}\n\n\tif len(delIds) > 0 {\n\t\tif err := models.UserDelByIds(ctx, delIds); err != nil {\n\t\t\tdumper.PutSyncRecord(\"sso_user\", start.Unix(), -1, -1, \"failed to sync del users: \"+err.Error())\n\t\t\treturn err\n\t\t}\n\t}\n\n\tms := time.Since(start).Milliseconds()\n\tlogger.Infof(\"timer: sync del sso users done, cost: %dms, number: %d\", ms, len(delIds))\n\tdumper.PutSyncRecord(\"sso_user\", start.Unix(), ms, len(delIds), \"success\")\n\treturn nil\n}\n\nfunc (s *SsoClient) UserExist(username string) (bool, error) {\n\tlc := s.Copy()\n\n\tconn, err := lc.newLdapConn()\n\tif err != nil {\n\t\treturn false, err\n\t}\n\tdefer conn.Close()\n\n\tsrs, err := lc.ldapReq(conn, \"(&(%s=%s))\", lc.Attributes.Username, username)\n\tif err != nil {\n\t\treturn false, err\n\t}\n\n\tfor i := range srs {\n\t\tif srs[i] == nil {\n\t\t\tcontinue\n\t\t}\n\n\t\tif len(srs[i].Entries) > 0 {\n\t\t\treturn true, nil\n\t\t}\n\n\t}\n\n\treturn false, nil\n}\n"
},
{
"path": "pkg/loggrep/loggrep.go",
"content": "package loggrep\n\nimport (\n\t\"bufio\"\n\t\"html/template\"\n\t\"io\"\n\t\"os\"\n\t\"path/filepath\"\n\t\"regexp\"\n\t\"sort\"\n\t\"strings\"\n)\n\nconst MaxLogLines = 5000\n\nvar hashPattern = regexp.MustCompile(`^[a-f0-9]{32,64}$`)\nvar idPattern = regexp.MustCompile(`^[1-9]\\d*$`)\nvar traceIdPattern = regexp.MustCompile(`^[a-zA-Z0-9_-]{1,64}$`)\n\n// IsValidHash checks whether s looks like a valid MD5/SHA hex hash.\nfunc IsValidHash(s string) bool {\n\treturn hashPattern.MatchString(s)\n}\n\n// IsValidRuleID checks whether s looks like a valid positive integer rule ID.\nfunc IsValidRuleID(s string) bool {\n\treturn idPattern.MatchString(s)\n}\n\n// IsValidTraceID checks whether s looks like a valid trace ID (alphanumeric, hyphens, underscores).\nfunc IsValidTraceID(s string) bool {\n\treturn traceIdPattern.MatchString(s)\n}\n\ntype EventDetailResp struct {\n\tLogs []string `json:\"logs\"`\n\tInstance string `json:\"instance\"`\n}\n\ntype PageData struct {\n\tHash string\n\tInstance string\n\tLogs []string\n\tTotal int\n}\n\ntype AlertEvalPageData struct {\n\tRuleID string\n\tInstance string\n\tLogs []string\n\tTotal int\n}\n\ntype TraceLogsPageData struct {\n\tTraceID string\n\tInstance string\n\tLogs []string\n\tTotal int\n}\n\n// GrepLogDir searches all log files in logDir for lines containing keyword,\n// sorts them by timestamp descending, and truncates to MaxLogLines.\nfunc GrepLogDir(logDir string, keyword string) ([]string, error) {\n\tlogFiles, err := filepath.Glob(filepath.Join(logDir, \"*.log*\"))\n\tif err != nil {\n\t\treturn nil, err\n\t}\n\n\tvar logs []string\n\tfor _, logFile := range logFiles {\n\t\tlines, err := GrepFile(logFile, keyword)\n\t\tif err != nil {\n\t\t\tcontinue\n\t\t}\n\t\tlogs = append(logs, lines...)\n\t}\n\n\tsort.Slice(logs, func(i, j int) bool {\n\t\treturn logs[i] > logs[j]\n\t})\n\n\tif len(logs) > MaxLogLines {\n\t\tlogs = logs[:MaxLogLines]\n\t}\n\n\treturn logs, nil\n}\n\n// GrepLatestLogFiles searches only the current (non-rotated) log files in logDir\n// (i.e. files matching *.log without any additional suffix like .log.20240101).\nfunc GrepLatestLogFiles(logDir string, keyword string) ([]string, error) {\n\tlogFiles, err := filepath.Glob(filepath.Join(logDir, \"*.log\"))\n\tif err != nil {\n\t\treturn nil, err\n\t}\n\n\tvar logs []string\n\tfor _, logFile := range logFiles {\n\t\tlines, err := GrepFile(logFile, keyword)\n\t\tif err != nil {\n\t\t\tcontinue\n\t\t}\n\t\tlogs = append(logs, lines...)\n\t}\n\n\tsort.Slice(logs, func(i, j int) bool {\n\t\treturn logs[i] > logs[j]\n\t})\n\n\tif len(logs) > MaxLogLines {\n\t\tlogs = logs[:MaxLogLines]\n\t}\n\n\treturn logs, nil\n}\n\n// GrepFile scans a file line by line and returns lines containing the keyword.\nfunc GrepFile(filePath string, keyword string) ([]string, error) {\n\tf, err := os.Open(filePath)\n\tif err != nil {\n\t\treturn nil, err\n\t}\n\tdefer f.Close()\n\n\tvar lines []string\n\tscanner := bufio.NewScanner(f)\n\tscanner.Buffer(make([]byte, 0, 1024*1024), 1024*1024)\n\tfor scanner.Scan() {\n\t\tline := scanner.Text()\n\t\tif strings.Contains(line, keyword) {\n\t\t\tlines = append(lines, line)\n\t\t}\n\t}\n\treturn lines, scanner.Err()\n}\n\n// RenderHTML writes the event detail HTML page to w.\nfunc RenderHTML(w io.Writer, data PageData) error {\n\treturn htmlTpl.Execute(w, data)\n}\n\n// RenderAlertEvalHTML writes the alert eval detail HTML page to w.\nfunc RenderAlertEvalHTML(w io.Writer, data AlertEvalPageData) error {\n\treturn alertEvalHtmlTpl.Execute(w, data)\n}\n\n// RenderTraceLogsHTML writes the trace logs HTML page to w.\nfunc RenderTraceLogsHTML(w io.Writer, data TraceLogsPageData) error {\n\treturn traceLogsHtmlTpl.Execute(w, data)\n}\n\nvar htmlTpl = template.Must(template.New(\"event-detail\").Parse(`\n\n\nEvent Detail - {{.Hash}} \n\n\n\n\n\n{{- if eq .Total 0}}\n
No log lines found for this event hash.
\n{{- else}}\n {{- range $i, $line := .Logs}}\n
{{$i}} {{$line}}
\n {{- end}}\n{{- end}}\n
Trace Logs - {{.TraceID}} \n\n\n\n\n\n{{- if eq .Total 0}}\n
No log lines found for trace ID {{.TraceID}}.
\n{{- else}}\n {{- range $i, $line := .Logs}}\n
{{$i}} {{$line}}
\n {{- end}}\n{{- end}}\n
Alert Eval Detail - Rule {{.RuleID}} \n\n\n\n\n\n{{- if eq .Total 0}}\n
No log lines found for alert rule {{.RuleID}}.
\n{{- else}}\n {{- range $i, $line := .Logs}}\n
{{$i}} {{$line}}
\n {{- end}}\n{{- end}}\n
-\n\t// under the TSDB's data directory and returns the directory as response.\n\tSnapshot(ctx context.Context, skipHead bool) (SnapshotResult, error)\n\t// Rules returns a list of alerting and recording rules that are currently loaded.\n\tRules(ctx context.Context) (RulesResult, error)\n\t// Targets returns an overview of the current state of the Prometheus target discovery.\n\tTargets(ctx context.Context) (TargetsResult, error)\n\t// TargetsMetadata returns metadata about metrics currently scraped by the target.\n\tTargetsMetadata(ctx context.Context, matchTarget string, metric string, limit string) ([]MetricMetadata, error)\n\t// Metadata returns metadata about metrics currently scraped by the metric name.\n\tMetadata(ctx context.Context, metric string, limit string) (map[string][]Metadata, error)\n}\n\n// AlertsResult contains the result from querying the alerts endpoint.\ntype AlertsResult struct {\n\tAlerts []Alert `json:\"alerts\"`\n}\n\n// AlertManagersResult contains the result from querying the alertmanagers endpoint.\ntype AlertManagersResult struct {\n\tActive []AlertManager `json:\"activeAlertManagers\"`\n\tDropped []AlertManager `json:\"droppedAlertManagers\"`\n}\n\n// AlertManager models a configured Alert Manager.\ntype AlertManager struct {\n\tURL string `json:\"url\"`\n}\n\n// ConfigResult contains the result from querying the config endpoint.\ntype ConfigResult struct {\n\tYAML string `json:\"yaml\"`\n}\n\n// FlagsResult contains the result from querying the flag endpoint.\ntype FlagsResult map[string]string\n\n// SnapshotResult contains the result from querying the snapshot endpoint.\ntype SnapshotResult struct {\n\tName string `json:\"name\"`\n}\n\n// RulesResult contains the result from querying the rules endpoint.\ntype RulesResult struct {\n\tGroups []RuleGroup `json:\"groups\"`\n}\n\n// RuleGroup models a rule group that contains a set of recording and alerting rules.\ntype RuleGroup struct {\n\tName string `json:\"name\"`\n\tFile string `json:\"file\"`\n\tInterval float64 `json:\"interval\"`\n\tRules Rules `json:\"rules\"`\n}\n\ntype Rules []interface{}\n\n// AlertingRule models a alerting rule.\ntype AlertingRule struct {\n\tName string `json:\"name\"`\n\tQuery string `json:\"query\"`\n\tDuration float64 `json:\"duration\"`\n\tLabels model.LabelSet `json:\"labels\"`\n\tAnnotations model.LabelSet `json:\"annotations\"`\n\tAlerts []*Alert `json:\"alerts\"`\n\tHealth RuleHealth `json:\"health\"`\n\tLastError string `json:\"lastError,omitempty\"`\n}\n\n// RecordingRule models a recording rule.\ntype RecordingRule struct {\n\tName string `json:\"name\"`\n\tQuery string `json:\"query\"`\n\tLabels model.LabelSet `json:\"labels,omitempty\"`\n\tHealth RuleHealth `json:\"health\"`\n\tLastError string `json:\"lastError,omitempty\"`\n}\n\n// Alert models an active alert.\ntype Alert struct {\n\tActiveAt time.Time `json:\"activeAt\"`\n\tAnnotations model.LabelSet\n\tLabels model.LabelSet\n\tState AlertState\n\tValue string\n}\n\n// TargetsResult contains the result from querying the targets endpoint.\ntype TargetsResult struct {\n\tActive []ActiveTarget `json:\"activeTargets\"`\n\tDropped []DroppedTarget `json:\"droppedTargets\"`\n}\n\n// ActiveTarget models an active Prometheus scrape target.\ntype ActiveTarget struct {\n\tDiscoveredLabels map[string]string `json:\"discoveredLabels\"`\n\tLabels model.LabelSet `json:\"labels\"`\n\tScrapeURL string `json:\"scrapeUrl\"`\n\tLastError string `json:\"lastError\"`\n\tLastScrape time.Time `json:\"lastScrape\"`\n\tHealth HealthStatus `json:\"health\"`\n}\n\n// DroppedTarget models a dropped Prometheus scrape target.\ntype DroppedTarget struct {\n\tDiscoveredLabels map[string]string `json:\"discoveredLabels\"`\n}\n\n// MetricMetadata models the metadata of a metric with its scrape target and name.\ntype MetricMetadata struct {\n\tTarget map[string]string `json:\"target\"`\n\tMetric string `json:\"metric,omitempty\"`\n\tType MetricType `json:\"type\"`\n\tHelp string `json:\"help\"`\n\tUnit string `json:\"unit\"`\n}\n\n// Metadata models the metadata of a metric.\ntype Metadata struct {\n\tType MetricType `json:\"type\"`\n\tHelp string `json:\"help\"`\n\tUnit string `json:\"unit\"`\n}\n\n// queryResult contains result data for a query.\ntype QueryResult struct {\n\tType model.ValueType `json:\"resultType\"`\n\tResult interface{} `json:\"result\"`\n\n\t// The decoded value.\n\tv model.Value\n}\n\nfunc (rg *RuleGroup) UnmarshalJSON(b []byte) error {\n\tv := struct {\n\t\tName string `json:\"name\"`\n\t\tFile string `json:\"file\"`\n\t\tInterval float64 `json:\"interval\"`\n\t\tRules []json.RawMessage `json:\"rules\"`\n\t}{}\n\n\tif err := json.Unmarshal(b, &v); err != nil {\n\t\treturn err\n\t}\n\n\trg.Name = v.Name\n\trg.File = v.File\n\trg.Interval = v.Interval\n\n\tfor _, rule := range v.Rules {\n\t\talertingRule := AlertingRule{}\n\t\tif err := json.Unmarshal(rule, &alertingRule); err == nil {\n\t\t\trg.Rules = append(rg.Rules, alertingRule)\n\t\t\tcontinue\n\t\t}\n\t\trecordingRule := RecordingRule{}\n\t\tif err := json.Unmarshal(rule, &recordingRule); err == nil {\n\t\t\trg.Rules = append(rg.Rules, recordingRule)\n\t\t\tcontinue\n\t\t}\n\t\treturn errors.New(\"failed to decode JSON into an alerting or recording rule\")\n\t}\n\n\treturn nil\n}\n\nfunc (r *AlertingRule) UnmarshalJSON(b []byte) error {\n\tv := struct {\n\t\tType string `json:\"type\"`\n\t}{}\n\tif err := json.Unmarshal(b, &v); err != nil {\n\t\treturn err\n\t}\n\tif v.Type == \"\" {\n\t\treturn errors.New(\"type field not present in rule\")\n\t}\n\tif v.Type != string(RuleTypeAlerting) {\n\t\treturn fmt.Errorf(\"expected rule of type %s but got %s\", string(RuleTypeAlerting), v.Type)\n\t}\n\n\trule := struct {\n\t\tName string `json:\"name\"`\n\t\tQuery string `json:\"query\"`\n\t\tDuration float64 `json:\"duration\"`\n\t\tLabels model.LabelSet `json:\"labels\"`\n\t\tAnnotations model.LabelSet `json:\"annotations\"`\n\t\tAlerts []*Alert `json:\"alerts\"`\n\t\tHealth RuleHealth `json:\"health\"`\n\t\tLastError string `json:\"lastError,omitempty\"`\n\t}{}\n\tif err := json.Unmarshal(b, &rule); err != nil {\n\t\treturn err\n\t}\n\tr.Health = rule.Health\n\tr.Annotations = rule.Annotations\n\tr.Name = rule.Name\n\tr.Query = rule.Query\n\tr.Alerts = rule.Alerts\n\tr.Duration = rule.Duration\n\tr.Labels = rule.Labels\n\tr.LastError = rule.LastError\n\n\treturn nil\n}\n\nfunc (r *RecordingRule) UnmarshalJSON(b []byte) error {\n\tv := struct {\n\t\tType string `json:\"type\"`\n\t}{}\n\tif err := json.Unmarshal(b, &v); err != nil {\n\t\treturn err\n\t}\n\tif v.Type == \"\" {\n\t\treturn errors.New(\"type field not present in rule\")\n\t}\n\tif v.Type != string(RuleTypeRecording) {\n\t\treturn fmt.Errorf(\"expected rule of type %s but got %s\", string(RuleTypeRecording), v.Type)\n\t}\n\n\trule := struct {\n\t\tName string `json:\"name\"`\n\t\tQuery string `json:\"query\"`\n\t\tLabels model.LabelSet `json:\"labels,omitempty\"`\n\t\tHealth RuleHealth `json:\"health\"`\n\t\tLastError string `json:\"lastError,omitempty\"`\n\t}{}\n\tif err := json.Unmarshal(b, &rule); err != nil {\n\t\treturn err\n\t}\n\tr.Health = rule.Health\n\tr.Labels = rule.Labels\n\tr.Name = rule.Name\n\tr.LastError = rule.LastError\n\tr.Query = rule.Query\n\n\treturn nil\n}\n\nfunc (qr *QueryResult) UnmarshalJSON(b []byte) error {\n\tv := struct {\n\t\tType model.ValueType `json:\"resultType\"`\n\t\tResult json.RawMessage `json:\"result\"`\n\t}{}\n\n\terr := json.Unmarshal(b, &v)\n\tif err != nil {\n\t\treturn err\n\t}\n\n\tswitch v.Type {\n\tcase model.ValScalar:\n\t\tvar sv model.Scalar\n\t\terr = json.Unmarshal(v.Result, &sv)\n\t\tqr.v = &sv\n\n\tcase model.ValVector:\n\t\tvar vv model.Vector\n\t\terr = json.Unmarshal(v.Result, &vv)\n\t\tqr.v = vv\n\n\tcase model.ValMatrix:\n\t\tvar mv model.Matrix\n\t\terr = json.Unmarshal(v.Result, &mv)\n\t\tqr.v = mv\n\n\tdefault:\n\t\terr = fmt.Errorf(\"unexpected value type %q\", v.Type)\n\t}\n\treturn err\n}\n\n// NewAPI returns a new API for the client.\n//\n// It is safe to use the returned API from multiple goroutines.\nfunc NewAPI(c api.Client, opt ClientOptions) API {\n\treturn &httpAPI{\n\t\tclient: &apiClientImpl{\n\t\t\tclient: c,\n\t\t\topt: opt,\n\t\t},\n\t}\n}\n\ntype httpAPI struct {\n\tclient apiClient\n}\n\nfunc (h *httpAPI) Alerts(ctx context.Context) (AlertsResult, error) {\n\tu := h.client.URL(epAlerts, nil)\n\n\treq, err := http.NewRequest(http.MethodGet, u.String(), nil)\n\tif err != nil {\n\t\treturn AlertsResult{}, err\n\t}\n\n\t_, body, _, err := h.client.Do(ctx, req)\n\tif err != nil {\n\t\treturn AlertsResult{}, err\n\t}\n\n\tvar res AlertsResult\n\treturn res, json.Unmarshal(body, &res)\n}\n\nfunc (h *httpAPI) AlertManagers(ctx context.Context) (AlertManagersResult, error) {\n\tu := h.client.URL(epAlertManagers, nil)\n\n\treq, err := http.NewRequest(http.MethodGet, u.String(), nil)\n\tif err != nil {\n\t\treturn AlertManagersResult{}, err\n\t}\n\n\t_, body, _, err := h.client.Do(ctx, req)\n\tif err != nil {\n\t\treturn AlertManagersResult{}, err\n\t}\n\n\tvar res AlertManagersResult\n\treturn res, json.Unmarshal(body, &res)\n}\n\nfunc (h *httpAPI) CleanTombstones(ctx context.Context) error {\n\tu := h.client.URL(epCleanTombstones, nil)\n\n\treq, err := http.NewRequest(http.MethodPost, u.String(), nil)\n\tif err != nil {\n\t\treturn err\n\t}\n\n\t_, _, _, err = h.client.Do(ctx, req)\n\treturn err\n}\n\nfunc (h *httpAPI) Config(ctx context.Context) (ConfigResult, error) {\n\tu := h.client.URL(epConfig, nil)\n\n\treq, err := http.NewRequest(http.MethodGet, u.String(), nil)\n\tif err != nil {\n\t\treturn ConfigResult{}, err\n\t}\n\n\t_, body, _, err := h.client.Do(ctx, req)\n\tif err != nil {\n\t\treturn ConfigResult{}, err\n\t}\n\n\tvar res ConfigResult\n\treturn res, json.Unmarshal(body, &res)\n}\n\nfunc (h *httpAPI) DeleteSeries(ctx context.Context, matches []string, startTime time.Time, endTime time.Time) error {\n\tu := h.client.URL(epDeleteSeries, nil)\n\tq := u.Query()\n\n\tfor _, m := range matches {\n\t\tq.Add(\"match[]\", m)\n\t}\n\n\tq.Set(\"start\", formatTime(startTime))\n\tq.Set(\"end\", formatTime(endTime))\n\n\tu.RawQuery = q.Encode()\n\n\treq, err := http.NewRequest(http.MethodPost, u.String(), nil)\n\tif err != nil {\n\t\treturn err\n\t}\n\n\t_, _, _, err = h.client.Do(ctx, req)\n\treturn err\n}\n\nfunc (h *httpAPI) Flags(ctx context.Context) (FlagsResult, error) {\n\tu := h.client.URL(epFlags, nil)\n\n\treq, err := http.NewRequest(http.MethodGet, u.String(), nil)\n\tif err != nil {\n\t\treturn FlagsResult{}, err\n\t}\n\n\t_, body, _, err := h.client.Do(ctx, req)\n\tif err != nil {\n\t\treturn FlagsResult{}, err\n\t}\n\n\tvar res FlagsResult\n\treturn res, json.Unmarshal(body, &res)\n}\n\nfunc (h *httpAPI) LabelNames(ctx context.Context) ([]string, Warnings, error) {\n\tu := h.client.URL(epLabels, nil)\n\treq, err := http.NewRequest(http.MethodGet, u.String(), nil)\n\tif err != nil {\n\t\treturn nil, nil, err\n\t}\n\t_, body, w, err := h.client.Do(ctx, req)\n\tif err != nil {\n\t\treturn nil, w, err\n\t}\n\tvar labelNames []string\n\treturn labelNames, w, json.Unmarshal(body, &labelNames)\n}\n\nfunc (h *httpAPI) LabelValues(ctx context.Context, label string, matches []string) (model.LabelValues, Warnings, error) {\n\tu := h.client.URL(epLabelValues, map[string]string{\"name\": label})\n\tq := u.Query()\n\n\tfor _, m := range matches {\n\t\tq.Add(\"match[]\", m)\n\t}\n\tu.RawQuery = q.Encode()\n\n\treq, err := http.NewRequest(http.MethodGet, u.String(), nil)\n\tif err != nil {\n\t\treturn nil, nil, err\n\t}\n\t_, body, w, err := h.client.Do(ctx, req)\n\tif err != nil {\n\t\treturn nil, w, err\n\t}\n\tvar labelValues model.LabelValues\n\treturn labelValues, w, json.Unmarshal(body, &labelValues)\n}\n\nfunc (h *httpAPI) Query(ctx context.Context, query string, ts time.Time) (model.Value, Warnings, error) {\n\tvar err error\n\tvar warnings Warnings\n\tvar value model.Value\n\tvar statusCode int\n\n\tfor i := 0; i < 1; i++ {\n\t\tvalue, warnings, statusCode, err = h.query(ctx, query, ts)\n\t\tif err == nil {\n\t\t\treturn value, warnings, nil\n\t\t}\n\n\t\t// statusCode 4xx do not retry\n\t\tif statusCode >= 400 && statusCode < 500 {\n\t\t\treturn nil, warnings, err\n\t\t}\n\n\t\ttime.Sleep(100 * time.Millisecond)\n\t}\n\treturn nil, warnings, err\n}\n\nfunc (h *httpAPI) query(ctx context.Context, query string, ts time.Time) (model.Value, Warnings, int, error) {\n\tu := h.client.URL(epQuery, nil)\n\tq := u.Query()\n\n\tq.Set(\"query\", query)\n\tif !ts.IsZero() {\n\t\tq.Set(\"time\", formatTime(ts))\n\t}\n\n\tresp, body, warnings, err := h.client.DoGetFallback(ctx, u, q)\n\tif err != nil {\n\t\treturn nil, warnings, 0, err\n\t}\n\n\tvar qres QueryResult\n\treturn model.Value(qres.v), warnings, resp.StatusCode, json.Unmarshal(body, &qres)\n}\n\nfunc (h *httpAPI) QueryRange(ctx context.Context, query string, r Range) (model.Value, Warnings, error) {\n\tu := h.client.URL(epQueryRange, nil)\n\tq := u.Query()\n\n\tq.Set(\"query\", query)\n\tq.Set(\"start\", formatTime(r.Start))\n\tq.Set(\"end\", formatTime(r.End))\n\tq.Set(\"step\", strconv.FormatFloat(r.Step.Seconds(), 'f', -1, 64))\n\n\t_, body, warnings, err := h.client.DoGetFallback(ctx, u, q)\n\tif err != nil {\n\t\treturn nil, warnings, err\n\t}\n\n\tvar qres QueryResult\n\n\treturn qres.v, warnings, json.Unmarshal(body, &qres)\n}\n\nfunc (h *httpAPI) Series(ctx context.Context, matches []string, startTime time.Time, endTime time.Time) ([]model.LabelSet, Warnings, error) {\n\tu := h.client.URL(epSeries, nil)\n\tq := u.Query()\n\n\tfor _, m := range matches {\n\t\tq.Add(\"match[]\", m)\n\t}\n\n\tq.Set(\"start\", formatTime(startTime))\n\tq.Set(\"end\", formatTime(endTime))\n\n\tu.RawQuery = q.Encode()\n\n\treq, err := http.NewRequest(http.MethodGet, u.String(), nil)\n\tif err != nil {\n\t\treturn nil, nil, err\n\t}\n\n\t_, body, warnings, err := h.client.Do(ctx, req)\n\tif err != nil {\n\t\treturn nil, warnings, err\n\t}\n\n\tvar mset []model.LabelSet\n\treturn mset, warnings, json.Unmarshal(body, &mset)\n}\n\nfunc (h *httpAPI) Snapshot(ctx context.Context, skipHead bool) (SnapshotResult, error) {\n\tu := h.client.URL(epSnapshot, nil)\n\tq := u.Query()\n\n\tq.Set(\"skip_head\", strconv.FormatBool(skipHead))\n\n\tu.RawQuery = q.Encode()\n\n\treq, err := http.NewRequest(http.MethodPost, u.String(), nil)\n\tif err != nil {\n\t\treturn SnapshotResult{}, err\n\t}\n\n\t_, body, _, err := h.client.Do(ctx, req)\n\tif err != nil {\n\t\treturn SnapshotResult{}, err\n\t}\n\n\tvar res SnapshotResult\n\treturn res, json.Unmarshal(body, &res)\n}\n\nfunc (h *httpAPI) Rules(ctx context.Context) (RulesResult, error) {\n\tu := h.client.URL(epRules, nil)\n\n\treq, err := http.NewRequest(http.MethodGet, u.String(), nil)\n\tif err != nil {\n\t\treturn RulesResult{}, err\n\t}\n\n\t_, body, _, err := h.client.Do(ctx, req)\n\tif err != nil {\n\t\treturn RulesResult{}, err\n\t}\n\n\tvar res RulesResult\n\treturn res, json.Unmarshal(body, &res)\n}\n\nfunc (h *httpAPI) Targets(ctx context.Context) (TargetsResult, error) {\n\tu := h.client.URL(epTargets, nil)\n\n\treq, err := http.NewRequest(http.MethodGet, u.String(), nil)\n\tif err != nil {\n\t\treturn TargetsResult{}, err\n\t}\n\n\t_, body, _, err := h.client.Do(ctx, req)\n\tif err != nil {\n\t\treturn TargetsResult{}, err\n\t}\n\n\tvar res TargetsResult\n\treturn res, json.Unmarshal(body, &res)\n}\n\nfunc (h *httpAPI) TargetsMetadata(ctx context.Context, matchTarget string, metric string, limit string) ([]MetricMetadata, error) {\n\tu := h.client.URL(epTargetsMetadata, nil)\n\tq := u.Query()\n\n\tq.Set(\"match_target\", matchTarget)\n\tq.Set(\"metric\", metric)\n\tq.Set(\"limit\", limit)\n\n\tu.RawQuery = q.Encode()\n\n\treq, err := http.NewRequest(http.MethodGet, u.String(), nil)\n\tif err != nil {\n\t\treturn nil, err\n\t}\n\n\t_, body, _, err := h.client.Do(ctx, req)\n\tif err != nil {\n\t\treturn nil, err\n\t}\n\n\tvar res []MetricMetadata\n\treturn res, json.Unmarshal(body, &res)\n}\n\nfunc (h *httpAPI) Metadata(ctx context.Context, metric string, limit string) (map[string][]Metadata, error) {\n\tu := h.client.URL(epMetadata, nil)\n\tq := u.Query()\n\n\tq.Set(\"metric\", metric)\n\tq.Set(\"limit\", limit)\n\n\tu.RawQuery = q.Encode()\n\n\treq, err := http.NewRequest(http.MethodGet, u.String(), nil)\n\tif err != nil {\n\t\treturn nil, err\n\t}\n\n\t_, body, _, err := h.client.Do(ctx, req)\n\tif err != nil {\n\t\treturn nil, err\n\t}\n\n\tvar res map[string][]Metadata\n\treturn res, json.Unmarshal(body, &res)\n}\n\n// Warnings is an array of non critical errors\ntype Warnings []string\n\n// apiClient wraps a regular client and processes successful API responses.\n// Successful also includes responses that errored at the API level.\ntype apiClient interface {\n\tURL(ep string, args map[string]string) *url.URL\n\tDo(context.Context, *http.Request) (*http.Response, []byte, Warnings, error)\n\tDoGetFallback(ctx context.Context, u *url.URL, args url.Values) (*http.Response, []byte, Warnings, error)\n}\n\ntype apiClientImpl struct {\n\tclient api.Client\n\topt ClientOptions\n}\n\ntype apiResponse struct {\n\tStatus string `json:\"status\"`\n\tData json.RawMessage `json:\"data\"`\n\tErrorType ErrorType `json:\"errorType\"`\n\tError string `json:\"error\"`\n\tWarnings []string `json:\"warnings,omitempty\"`\n}\n\nfunc apiError(code int) bool {\n\t// These are the codes that Prometheus sends when it returns an error.\n\treturn code == statusAPIError || code == http.StatusBadRequest\n}\n\nfunc errorTypeAndMsgFor(resp *http.Response) (ErrorType, string) {\n\tswitch resp.StatusCode / 100 {\n\tcase 4:\n\t\treturn ErrClient, fmt.Sprintf(\"client error: %d\", resp.StatusCode)\n\tcase 5:\n\t\treturn ErrServer, fmt.Sprintf(\"server error: %d\", resp.StatusCode)\n\t}\n\treturn ErrBadResponse, fmt.Sprintf(\"bad response code %d\", resp.StatusCode)\n}\n\nfunc (h *apiClientImpl) URL(ep string, args map[string]string) *url.URL {\n\treturn h.client.URL(ep, args)\n}\n\nfunc (h *apiClientImpl) Do(ctx context.Context, req *http.Request) (*http.Response, []byte, Warnings, error) {\n\tif h.opt.BasicAuthUser != \"\" && h.opt.BasicAuthPass != \"\" {\n\t\treq.SetBasicAuth(h.opt.BasicAuthUser, h.opt.BasicAuthPass)\n\t}\n\n\theaderCount := len(h.opt.Headers)\n\tif headerCount > 0 && headerCount%2 == 0 {\n\t\tfor i := 0; i < len(h.opt.Headers); i += 2 {\n\t\t\treq.Header.Add(h.opt.Headers[i], h.opt.Headers[i+1])\n\t\t\tif h.opt.Headers[i] == \"Host\" {\n\t\t\t\treq.Host = h.opt.Headers[i+1]\n\t\t\t}\n\t\t}\n\t}\n\n\tresp, body, err := h.client.Do(ctx, req)\n\tif err != nil {\n\t\treturn resp, body, nil, err\n\t}\n\n\tcode := resp.StatusCode\n\n\tif code/100 != 2 && !apiError(code) {\n\t\terrorType, errorMsg := errorTypeAndMsgFor(resp)\n\t\treturn resp, body, nil, &Error{\n\t\t\tType: errorType,\n\t\t\tMsg: errorMsg,\n\t\t\tDetail: string(body),\n\t\t}\n\t}\n\n\tvar result apiResponse\n\n\tif http.StatusNoContent != code {\n\t\tif jsonErr := json.Unmarshal(body, &result); jsonErr != nil {\n\t\t\treturn resp, body, nil, &Error{\n\t\t\t\tType: ErrBadResponse,\n\t\t\t\tMsg: jsonErr.Error(),\n\t\t\t}\n\t\t}\n\t}\n\n\tif apiError(code) != (result.Status == \"error\") {\n\t\terr = &Error{\n\t\t\tType: ErrBadResponse,\n\t\t\tMsg: \"inconsistent body for response code\",\n\t\t}\n\t}\n\n\tif apiError(code) && result.Status == \"error\" {\n\t\terr = &Error{\n\t\t\tType: result.ErrorType,\n\t\t\tMsg: result.Error,\n\t\t}\n\t}\n\n\treturn resp, []byte(result.Data), result.Warnings, err\n\n}\n\n// DoGetFallback will attempt to do the request as-is, and on a 405 it will fallback to a GET request.\nfunc (h *apiClientImpl) DoGetFallback(ctx context.Context, u *url.URL, args url.Values) (*http.Response, []byte, Warnings, error) {\n\treq, err := http.NewRequest(http.MethodPost, u.String(), strings.NewReader(args.Encode()))\n\tif err != nil {\n\t\treturn nil, nil, nil, err\n\t}\n\treq.Header.Set(\"Content-Type\", \"application/x-www-form-urlencoded\")\n\n\tresp, body, warnings, err := h.Do(ctx, req)\n\tif resp != nil && resp.StatusCode == http.StatusMethodNotAllowed {\n\t\tu.RawQuery = args.Encode()\n\t\treq, err = http.NewRequest(http.MethodGet, u.String(), nil)\n\t\tif err != nil {\n\t\t\treturn nil, nil, warnings, err\n\t\t}\n\n\t} else {\n\t\tif err != nil {\n\t\t\treturn resp, body, warnings, err\n\t\t}\n\t\treturn resp, body, warnings, nil\n\t}\n\treturn h.Do(ctx, req)\n}\n\nfunc formatTime(t time.Time) string {\n\treturn strconv.FormatFloat(float64(t.Unix())+float64(t.Nanosecond())/1e9, 'f', -1, 64)\n}\n"
},
{
"path": "pkg/prom/writer.go",
"content": "package prom\n\nimport (\n\t\"bytes\"\n\t\"context\"\n\t\"fmt\"\n\t\"net/http\"\n\t\"strings\"\n\n\t\"github.com/golang/protobuf/proto\"\n\t\"github.com/golang/snappy\"\n\t\"github.com/prometheus/client_golang/api\"\n\t\"github.com/prometheus/prometheus/prompb\"\n\t\"github.com/toolkits/pkg/logger\"\n)\n\ntype WriterType struct {\n\tOpts ClientOptions\n\tClient api.Client\n}\n\nfunc NewWriter(cli api.Client, opt ClientOptions) WriterType {\n\twriter := WriterType{\n\t\tOpts: opt,\n\t\tClient: cli,\n\t}\n\treturn writer\n}\n\nfunc (w WriterType) Write(items []prompb.TimeSeries, headers ...map[string]string) error {\n\tif len(items) == 0 {\n\t\treturn nil\n\t}\n\n\treq := &prompb.WriteRequest{\n\t\tTimeseries: items,\n\t}\n\n\tdata, err := proto.Marshal(req)\n\tif err != nil {\n\t\tlogger.Warningf(\"marshal prom data to proto got error: %v, data: %+v\", err, items)\n\t\treturn nil\n\t}\n\n\tif err := w.Post(snappy.Encode(nil, data), headers...); err != nil {\n\t\tlogger.Warningf(\"%v post to %s got error: %v\", w.Opts, w.Opts.Url, err)\n\t\tlogger.Debug(\"example timeseries:\", items[0].String())\n\t}\n\treturn err\n}\n\nfunc (w WriterType) Post(req []byte, headers ...map[string]string) error {\n\turls := strings.Split(w.Opts.Url, \",\")\n\tvar err error\n\tvar httpReq *http.Request\n\n\tfor _, url := range urls {\n\t\thttpReq, err = http.NewRequest(\"POST\", url, bytes.NewReader(req))\n\t\tif err != nil {\n\t\t\tlogger.Warningf(\"create remote write:%s request got error: %s\", url, err.Error())\n\t\t\tcontinue\n\t\t}\n\n\t\thttpReq.Header.Add(\"Content-Encoding\", \"snappy\")\n\t\thttpReq.Header.Set(\"Content-Type\", \"application/x-protobuf\")\n\t\thttpReq.Header.Set(\"User-Agent\", \"n9e\")\n\t\thttpReq.Header.Set(\"X-Prometheus-Remote-Write-Version\", \"0.1.0\")\n\n\t\tif len(headers) > 0 {\n\t\t\tfor k, v := range headers[0] {\n\t\t\t\thttpReq.Header.Set(k, v)\n\t\t\t}\n\t\t}\n\n\t\tif w.Opts.BasicAuthUser != \"\" {\n\t\t\thttpReq.SetBasicAuth(w.Opts.BasicAuthUser, w.Opts.BasicAuthPass)\n\t\t}\n\n\t\theaderCount := len(w.Opts.Headers)\n\t\tif headerCount > 0 && headerCount%2 == 0 {\n\t\t\tfor i := 0; i < len(w.Opts.Headers); i += 2 {\n\t\t\t\thttpReq.Header.Add(w.Opts.Headers[i], w.Opts.Headers[i+1])\n\t\t\t\tif w.Opts.Headers[i] == \"Host\" {\n\t\t\t\t\thttpReq.Host = w.Opts.Headers[i+1]\n\t\t\t\t}\n\t\t\t}\n\t\t}\n\n\t\tresp, body, e := w.Client.Do(context.Background(), httpReq)\n\t\tif e != nil {\n\t\t\tlogger.Warningf(\"push data with remote write:%s request got error: %v, response body: %s\", url, e, string(body))\n\t\t\terr = e\n\t\t\tcontinue\n\t\t}\n\n\t\tif resp.StatusCode >= 400 {\n\t\t\terr = fmt.Errorf(\"push data with remote write:%s request got status code: %v, response body: %s\", url, resp.StatusCode, string(body))\n\t\t\tlogger.Warning(err)\n\t\t\tcontinue\n\t\t}\n\n\t\tbreak\n\t}\n\n\treturn err\n}\n"
},
{
"path": "pkg/promql/parser.go",
"content": "package promql\n\nimport (\n\t\"regexp\"\n\t\"strings\"\n\n\t\"github.com/VictoriaMetrics/metricsql\"\n\t\"github.com/prometheus/prometheus/promql/parser\"\n)\n\nfunc SplitBinaryOp(code string) ([]string, error) {\n\tvar lst []string\n\texpr, err := metricsql.Parse(code)\n\n\tif err != nil {\n\t\treturn lst, err\n\t}\n\n\tm := make(map[string]struct{})\n\tParseExpr(expr, false, m)\n\tfor k := range m {\n\t\tlst = append(lst, k)\n\t}\n\n\treturn lst, nil\n}\n\nfunc GetMetric(ql string) (map[string]string, error) {\n\tmetrics := make(map[string]string)\n\texpr, err := parser.ParseExpr(ql)\n\tif err != nil {\n\t\treturn metrics, err\n\t}\n\n\tselectors := parser.ExtractSelectors(expr)\n\tfor i := 0; i < len(selectors); i++ {\n\t\tvar metric string\n\t\tvar labels []string\n\t\tfor j := 0; j < len(selectors[i]); j++ {\n\t\t\tif selectors[i][j].Name == \"__name__\" {\n\t\t\t\tmetric = selectors[i][j].Value\n\t\t\t} else {\n\t\t\t\tlabels = append(labels, selectors[i][j].Name+selectors[i][j].Type.String()+\"\\\"\"+selectors[i][j].Value+\"\\\"\")\n\t\t\t}\n\t\t}\n\n\t\tif len(labels) != 0 {\n\t\t\tmetrics[metric] = metric + \"{\" + strings.Join(labels, \",\") + \"}\"\n\t\t} else {\n\t\t\tmetrics[metric] = metric\n\t\t}\n\t}\n\treturn metrics, nil\n}\n\n// GetLabels 解析PromQL查询并返回其中的所有标签和它们的值。\nfunc GetLabels(ql string) (map[string]string, error) {\n\tlabels := make(map[string]string)\n\n\t// 解析PromQL表达式\n\texpr, err := parser.ParseExpr(ql)\n\tif err != nil {\n\t\treturn labels, err\n\t}\n\n\t// 提取所有的选择器\n\tselectors := parser.ExtractSelectors(expr)\n\tfor _, selector := range selectors {\n\t\tfor _, labelMatcher := range selector {\n\t\t\tif labelMatcher.Name != \"__name__\" {\n\t\t\t\tlabels[labelMatcher.Name] = labelMatcher.Value\n\t\t\t}\n\t\t}\n\t}\n\n\treturn labels, nil\n}\n\nfunc GetLabelsAndMetricName(ql string) (map[string]string, string, error) {\n\tlabels := make(map[string]string)\n\tmetricName := \"\"\n\n\t// 解析PromQL表达式\n\texpr, err := parser.ParseExpr(ql)\n\tif err != nil {\n\t\treturn labels, metricName, err\n\t}\n\n\t// 提取所有的选择器\n\tselectors := parser.ExtractSelectors(expr)\n\tfor _, selector := range selectors {\n\t\tfor _, labelMatcher := range selector {\n\t\t\tif labelMatcher.Name != \"__name__\" {\n\t\t\t\tlabels[labelMatcher.Name] = labelMatcher.Value\n\t\t\t} else {\n\t\t\t\tmetricName = labelMatcher.Value\n\t\t\t}\n\t\t}\n\t}\n\n\treturn labels, metricName, nil\n}\n\ntype Label struct {\n\tName string\n\tValue string\n\tOp string\n}\n\nfunc GetLabelsAndMetricNameWithReplace(ql string, rep string) (map[string]Label, string, error) {\n\tlabels := make(map[string]Label)\n\tmetricName := \"\"\n\n\tql = strings.ReplaceAll(ql, rep, \"____\")\n\tql = removeBrackets(ql)\n\t// 解析PromQL表达式\n\texpr, err := parser.ParseExpr(ql)\n\tif err != nil {\n\t\treturn labels, metricName, err\n\t}\n\n\t// 提取所有的选择器\n\tselectors := parser.ExtractSelectors(expr)\n\tfor _, selector := range selectors {\n\t\tfor _, labelMatcher := range selector {\n\t\t\tlabelMatcher.Value = strings.ReplaceAll(labelMatcher.Value, \"____\", rep)\n\t\t\tif labelMatcher.Name != \"__name__\" {\n\t\t\t\tlabel := Label{\n\t\t\t\t\tName: labelMatcher.Name,\n\t\t\t\t\tValue: labelMatcher.Value,\n\t\t\t\t\tOp: labelMatcher.Type.String(),\n\t\t\t\t}\n\t\t\t\tlabels[labelMatcher.Name] = label\n\t\t\t} else {\n\t\t\t\tif strings.Contains(labelMatcher.Value, \"$\") {\n\t\t\t\t\tcontinue\n\t\t\t\t}\n\t\t\t\tmetricName = labelMatcher.Value\n\t\t\t}\n\t\t}\n\t}\n\n\treturn labels, metricName, nil\n}\n\nfunc GetFirstMetric(ql string) (string, error) {\n\tvar metric string\n\texpr, err := parser.ParseExpr(ql)\n\tif err != nil {\n\t\treturn metric, err\n\t}\n\n\tselectors := parser.ExtractSelectors(expr)\n\tfor i := 0; i < len(selectors); i++ {\n\t\tfor j := 0; j < len(selectors[i]); j++ {\n\t\t\tif selectors[i][j].Name == \"__name__\" {\n\t\t\t\tmetric = selectors[i][j].Value\n\t\t\t\treturn metric, nil\n\t\t\t}\n\t\t}\n\t}\n\treturn metric, nil\n}\n\nfunc removeBrackets(promql string) string {\n\tif strings.Contains(promql, \"_over_time\") || strings.Contains(promql, \"rate\") || strings.Contains(promql, \"increase\") ||\n\t\tstrings.Contains(promql, \"predict_linear\") || strings.Contains(promql, \"resets\") ||\n\t\tstrings.Contains(promql, \"changes\") || strings.Contains(promql, \"holt_winters\") ||\n\t\tstrings.Contains(promql, \"delta\") || strings.Contains(promql, \"deriv\") {\n\t\treturn promql\n\t}\n\n\tif !strings.Contains(promql, \"[\") {\n\t\treturn promql\n\t}\n\n\t// 使用正则表达式匹配 [xx] 形式的内容,xx 可以是任何字符序列\n\tre := regexp.MustCompile(`\\[[^\\]]*\\]`)\n\t// 删除匹配到的内容\n\treturn re.ReplaceAllString(promql, \"\")\n}\n"
},
{
"path": "pkg/promql/perser_test.go",
"content": "package promql\n\nimport (\n\t\"reflect\"\n\t\"testing\"\n)\n\nfunc TestGetMetric(t *testing.T) {\n\ttests := []struct {\n\t\tname string\n\t\tql string\n\t\twant map[string]string\n\t\twantErr error\n\t}{\n\t\t{\n\t\t\tname: \"Valid query with labels\",\n\t\t\tql: \"metric_name{label1=\\\"value1\\\",label2=\\\"value2\\\"}\",\n\t\t\twant: map[string]string{\"metric_name\": \"metric_name{label1=\\\"value1\\\",label2=\\\"value2\\\"}\"},\n\t\t\twantErr: nil,\n\t\t},\n\t}\n\n\tfor _, tt := range tests {\n\t\tt.Run(tt.name, func(t *testing.T) {\n\t\t\tgot, err := GetMetric(tt.ql)\n\t\t\tif err != tt.wantErr && err != nil {\n\t\t\t\tt.Errorf(\"GetMetric() error = %v, wantErr %v ql:%s\", err, tt.wantErr, tt.ql)\n\t\t\t\treturn\n\t\t\t}\n\t\t\tif !reflect.DeepEqual(got, tt.want) {\n\t\t\t\tt.Errorf(\"GetMetric() = %v, want %v\", got, tt.want)\n\t\t\t}\n\t\t})\n\t}\n}\n\nfunc TestGetLabels(t *testing.T) {\n\ttests := []struct {\n\t\tname string\n\t\tql string\n\t\twant map[string]string\n\t\twantErr bool\n\t}{\n\t\t{\n\t\t\tname: \"Valid query with multiple labels\",\n\t\t\tql: \"metric_name{label1=\\\"value1\\\", label2=\\\"value2\\\"} > 3\",\n\t\t\twant: map[string]string{\"label1\": \"value1\", \"label2\": \"value2\"},\n\t\t},\n\t\t{\n\t\t\tname: \"Valid query with multiple labels\",\n\t\t\tql: \"metric_name{label1=\\\"$value1\\\", label2=\\\"$value2\\\"} > 3\",\n\t\t\twant: map[string]string{\"label1\": \"$value1\", \"label2\": \"$value2\"},\n\t\t},\n\t\t{\n\t\t\tname: \"Query without labels\",\n\t\t\tql: \"metric_name\",\n\t\t\twant: map[string]string{},\n\t\t},\n\t}\n\n\tfor _, tt := range tests {\n\t\tt.Run(tt.name, func(t *testing.T) {\n\t\t\tgot, err := GetLabels(tt.ql)\n\t\t\tif (err != nil) != tt.wantErr {\n\t\t\t\tt.Errorf(\"GetLabels() error = %v, wantErr %v\", err, tt.wantErr)\n\t\t\t\treturn\n\t\t\t}\n\n\t\t\tif !reflect.DeepEqual(got, tt.want) {\n\t\t\t\tt.Errorf(\"GetLabels() = %v, want %v ql:%s\", got, tt.want, tt.ql)\n\t\t\t}\n\t\t})\n\t}\n}\n\nfunc TestGetLabelsAndMetricNameWithReplace(t *testing.T) {\n\t// 定义测试案例\n\ttests := []struct {\n\t\tname string\n\t\tql string\n\t\trep string\n\t\texpectedLabels map[string]Label\n\t\texpectedMetricName string\n\t\texpectError bool\n\t}{\n\t\t{\n\t\t\tname: \"正常情况\",\n\t\t\tql: `(snmp_arista_system_cpuuse{ent_descr=\"$ent_descr\"} / 100 > $cpu_high_threshold[1m])`,\n\t\t\trep: \"$\",\n\t\t\texpectedLabels: map[string]Label{\n\t\t\t\t\"ent_descr\": {Name: \"ent_descr\", Value: \"$ent_descr\", Op: \"=\"},\n\t\t\t},\n\t\t\texpectedMetricName: \"snmp_arista_system_cpuuse\",\n\t\t\texpectError: false,\n\t\t},\n\t\t{\n\t\t\tname: \"正常情况\",\n\t\t\tql: `rate(snmp_interface_incoming{agent_host='$agent_host',ifname='$ifname'}[2m]) * 8 / 10^9 > snmp_interface_speed{agent_host='$agent_host',ifname='$ifname'}/ 10^3 * $traffic_in and snmp_interface_speed{agent_host='$agent_host',ifname='$ifname'} > 0`,\n\t\t\trep: \"$\",\n\t\t\texpectedLabels: map[string]Label{\n\t\t\t\t\"agent_host\": {Name: \"agent_host\", Value: \"$agent_host\", Op: \"=\"},\n\t\t\t\t\"ifname\": {Name: \"ifname\", Value: \"$ifname\", Op: \"=\"},\n\t\t\t},\n\t\t\texpectedMetricName: \"snmp_interface_speed\",\n\t\t\texpectError: false,\n\t\t},\n\t\t{\n\t\t\tname: \"正常情况\",\n\t\t\tql: `rate(snmp_interface_incoming{agent_host='$agent_host',ifname='$ifname'}[2m]) * 8 / 10^9 > snmp_interface_speed{agent_host='$agent_host',ifname='$ifname'}/ 10^3 * $traffic_in`,\n\t\t\trep: \"$\",\n\t\t\texpectedLabels: map[string]Label{\n\t\t\t\t\"agent_host\": {Name: \"agent_host\", Value: \"$agent_host\", Op: \"=\"},\n\t\t\t\t\"ifname\": {Name: \"ifname\", Value: \"$ifname\", Op: \"=\"},\n\t\t\t},\n\t\t\texpectedMetricName: \"snmp_interface_speed\",\n\t\t\texpectError: false,\n\t\t},\n\t\t{\n\t\t\tname: \"正常情况\",\n\t\t\tql: `rate(snmp_interface_incoming{agent_host='$agent_host',ifname='$ifname'}[2m]) * 8 / 10^9 > 10`,\n\t\t\trep: \"$\",\n\t\t\texpectedLabels: map[string]Label{\n\t\t\t\t\"agent_host\": {Name: \"agent_host\", Value: \"$agent_host\", Op: \"=\"},\n\t\t\t\t\"ifname\": {Name: \"ifname\", Value: \"$ifname\", Op: \"=\"},\n\t\t\t},\n\t\t\texpectedMetricName: \"snmp_interface_incoming\",\n\t\t\texpectError: false,\n\t\t},\n\t\t{\n\t\t\tname: \"带有替换字符\",\n\t\t\tql: `rate(snmp_interface_outgoing{Role=~'ZRT.*',agent_host='$agent_host',ifname='$ifname'}[2m]) * 8 / 10^9 > snmp_interface_speed{Role=~'ZRT.*',agent_host='$agent_host',ifname='$ifname'}/ 10^3 * $outgoing_warning and snmp_interface_speed{Role=~'ZRT.*',agent_host='$agent_host',ifname='$ifname'} > 0`,\n\t\t\trep: \"$\",\n\t\t\texpectedLabels: map[string]Label{\n\t\t\t\t\"agent_host\": {Name: \"agent_host\", Value: \"$agent_host\", Op: \"=\"},\n\t\t\t\t\"ifname\": {Name: \"ifname\", Value: \"$ifname\", Op: \"=\"},\n\t\t\t\t\"Role\": {Name: \"Role\", Value: \"ZRT.*\", Op: \"=~\"},\n\t\t\t},\n\t\t\texpectedMetricName: \"snmp_interface_speed\",\n\t\t\texpectError: false,\n\t\t},\n\t\t// 更多测试案例...\n\t\t{\n\t\t\tname: \"告警规则支持变量\",\n\t\t\tql: `mem{test1=\"$test1\", test2=\"$test2\", test3=\"test3\"} > $val`,\n\t\t\trep: \"$\",\n\t\t\texpectedLabels: map[string]Label{},\n\t\t\texpectedMetricName: \"snmp_interface_speed\",\n\t\t\texpectError: false,\n\t\t},\n\t}\n\n\t// 运行测试案例\n\tfor _, tc := range tests {\n\t\tt.Run(tc.name, func(t *testing.T) {\n\t\t\tlabels, metricName, err := GetLabelsAndMetricNameWithReplace(tc.ql, tc.rep)\n\n\t\t\tif (err != nil) != tc.expectError {\n\t\t\t\tt.Errorf(\"ql:%s 测试 '%v' 发生错误: %v, 期望的错误状态: %v\", tc.ql, tc.name, err, tc.expectError)\n\t\t\t}\n\n\t\t\tif !reflect.DeepEqual(labels, tc.expectedLabels) {\n\t\t\t\tt.Errorf(\"ql:%s 测试 '%v' 返回的标签不匹配: got %v, want %v\", tc.ql, tc.name, labels, tc.expectedLabels)\n\t\t\t}\n\n\t\t\tif metricName != tc.expectedMetricName {\n\t\t\t\tt.Errorf(\"ql:%s 测试 '%v' 返回的度量名称不匹配: got %s, want %s\", tc.ql, tc.name, metricName, tc.expectedMetricName)\n\t\t\t}\n\t\t})\n\t}\n}\n\nfunc TestSplitBinaryOp(t *testing.T) {\n\ttests := []struct {\n\t\tname string\n\t\tcode string\n\t\twant []string\n\t\twantErr bool\n\t}{\n\t\t{\n\t\t\tname: \"valid binary operation with spaces\",\n\t\t\tcode: \"cpu_usage + memory_usage\",\n\t\t\twant: []string{\"cpu_usage + memory_usage\"},\n\t\t},\n\t\t{\n\t\t\tname: \"12\",\n\t\t\tcode: \"cpu_usage > 0 and memory_usage>0\",\n\t\t\twant: []string{\"cpu_usage\", \"memory_usage\"},\n\t\t},\n\t\t{\n\t\t\tname: \"12\",\n\t\t\tcode: \"cpu_usage +1> 0\",\n\t\t\twant: []string{\"cpu_usage + 1\"},\n\t\t},\n\t\t{\n\t\t\tname: \"valid complex binary operation\",\n\t\t\tcode: \"(cpu_usage + memory_usage) / 2\",\n\t\t\twant: []string{\"(cpu_usage + memory_usage) / 2\"},\n\t\t},\n\t\t{\n\t\t\tname: \"invalid binary operation\",\n\t\t\tcode: \"cpu_usage + \",\n\t\t\twantErr: true,\n\t\t},\n\t}\n\n\tfor _, tt := range tests {\n\t\tt.Run(tt.name, func(t *testing.T) {\n\t\t\tgot, err := SplitBinaryOp(tt.code)\n\t\t\tif (err != nil) != tt.wantErr {\n\t\t\t\tt.Errorf(\"SplitBinaryOp() code:%s error = %v, wantErr %v\", tt.code, err, tt.wantErr)\n\t\t\t\treturn\n\t\t\t}\n\t\t\tif !reflect.DeepEqual(got, tt.want) {\n\t\t\t\tt.Errorf(\"SplitBinaryOp() got = %v, want %v\", got, tt.want)\n\t\t\t}\n\t\t})\n\t}\n}\n"
},
{
"path": "pkg/promql/promql.go",
"content": "package promql\n\nimport (\n\t\"github.com/VictoriaMetrics/metricsql\"\n)\n\n// copy from https://github.com/laixintao/promqlpy/blob/main/go/promql/promql.go\n// ModifierExpr represents MetricsQL modifier such as ` (...)`\ntype ModifierExpr struct {\n\t// Op is modifier operation.\n\tOp string `json:\"op\"`\n\n\t// Args contains modifier args from parens.\n\tArgs []string `json:\"args\"`\n}\n\ntype Expression struct {\n\t// if true, all fields are set\n\t// if false, then it's a normal expression, only `code` is set\n\tIsBinaryOp bool `json:\"is_binary_op\"`\n\n\tLeft *Expression `json:\"left\"`\n\tRight *Expression `json:\"right\"`\n\tOp string `json:\"op\"`\n\t// GroupModifier contains modifier such as \"on\" or \"ignoring\".\n\tGroupModifier ModifierExpr `json:\"group_modifier\"`\n\t// JoinModifier contains modifier such as \"group_left\" or \"group_right\".\n\tJoinModifier ModifierExpr `json:\"join_modifier\"`\n\n\tCode string `json:\"code\"`\n}\n\nvar compareOps = map[string]bool{\n\t\"==\": true,\n\t\"!=\": true,\n\t\">\": true,\n\t\"<\": true,\n\t\">=\": true,\n\t\"<=\": true,\n}\n\nvar logicalOps = map[string]bool{\n\t\"and\": true,\n\t\"or\": true,\n\t\"unless\": true,\n}\n\n// if `mustBeExpression` is true, means that the last level is compareOps\n// or ready.\n// example:\n// (a > 10) > b\n// result: a > 10 is expression, compare to b\nfunc ParseExpr(expr metricsql.Expr, mustBeExpression bool, m map[string]struct{}) *Expression {\n\n\t// I am sure it is a normal expression!\n\tif mustBeExpression {\n\t\treturn &Expression{\n\t\t\tCode: string(expr.AppendString(nil)),\n\t\t\tIsBinaryOp: false,\n\t\t}\n\t}\n\n\tif bop, ok := expr.(*metricsql.BinaryOpExpr); ok {\n\n\t\tif logicalOps[bop.Op] {\n\n\t\t\treturn &Expression{\n\t\t\t\tLeft: ParseExpr(bop.Left, false, m),\n\t\t\t\tRight: ParseExpr(bop.Right, false, m),\n\t\t\t\tGroupModifier: ModifierExpr(bop.GroupModifier),\n\t\t\t\tJoinModifier: ModifierExpr(bop.JoinModifier),\n\t\t\t\tOp: bop.Op,\n\t\t\t\tCode: string(bop.AppendString(nil)),\n\t\t\t\tIsBinaryOp: true,\n\t\t\t}\n\t\t}\n\n\t\tif compareOps[bop.Op] {\n\t\t\tm[string(bop.Left.AppendString(nil))] = struct{}{}\n\n\t\t\treturn &Expression{\n\t\t\t\tLeft: ParseExpr(bop.Left, true, m),\n\t\t\t\tRight: ParseExpr(bop.Right, true, m),\n\t\t\t\tGroupModifier: ModifierExpr(bop.GroupModifier),\n\t\t\t\tJoinModifier: ModifierExpr(bop.JoinModifier),\n\t\t\t\tOp: bop.Op,\n\t\t\t\tCode: string(bop.AppendString(nil)),\n\t\t\t\tIsBinaryOp: true,\n\t\t\t}\n\n\t\t}\n\t}\n\n\tif len(m) == 0 {\n\t\tm[string(expr.AppendString(nil))] = struct{}{}\n\t}\n\n\t// treat +,-,* etc still as normal expression\n\t// default: just return the literal code as it is\n\treturn &Expression{\n\t\tCode: string(expr.AppendString(nil)),\n\t\tIsBinaryOp: false,\n\t}\n}\n"
},
{
"path": "pkg/secu/aes.go",
"content": "package secu\n\nimport (\n\t\"bytes\"\n\t\"crypto/aes\"\n\t\"crypto/cipher\"\n\t\"encoding/base64\"\n\t\"strings\"\n)\n\n// BASE64StdEncode base64编码\nfunc BASE64StdEncode(src []byte) string {\n\treturn base64.StdEncoding.EncodeToString(src)\n}\n\n// BASE64StdDecode base64解码\nfunc BASE64StdDecode(src string) ([]byte, error) {\n\tdst, err := base64.StdEncoding.DecodeString(src)\n\tif err != nil {\n\t\treturn nil, err\n\t}\n\treturn dst, nil\n}\n\nfunc PKCS7Padding(ciphertext []byte, blockSize int) []byte {\n\tpadding := blockSize - len(ciphertext)%blockSize\n\tpadtext := bytes.Repeat([]byte{byte(padding)}, padding)\n\treturn append(ciphertext, padtext...)\n}\n\nfunc PKCS7UnPadding(originData []byte) []byte {\n\tlength := len(originData)\n\tunpadding := int(originData[length-1])\n\treturn originData[:(length - unpadding)]\n}\n\n// AES加密\nfunc AesEncrypt(origData, key []byte) ([]byte, error) {\n\tblock, err := aes.NewCipher(key)\n\tif err != nil {\n\t\treturn nil, err\n\t}\n\t//加密块填充\n\tblockSize := block.BlockSize()\n\tpadOrigData := PKCS7Padding(origData, blockSize)\n\t//初始化CBC加密\n\tblockMode := cipher.NewCBCEncrypter(block, key[:blockSize])\n\tencrypted := make([]byte, len(padOrigData))\n\t//加密\n\tblockMode.CryptBlocks(encrypted, padOrigData)\n\treturn encrypted, nil\n}\n\n// AES解密\nfunc AesDecrypt(encrypted, key []byte) ([]byte, error) {\n\tblock, err := aes.NewCipher(key)\n\tif err != nil {\n\t\treturn nil, err\n\t}\n\tblockSize := block.BlockSize()\n\tblockMode := cipher.NewCBCDecrypter(block, key[:blockSize])\n\torigData := make([]byte, len(encrypted))\n\t//解密\n\tblockMode.CryptBlocks(origData, encrypted)\n\t//去除填充\n\torigData = PKCS7UnPadding(origData)\n\treturn origData, nil\n}\n\n// 针对配置文件属性进行解密处理\nfunc DealWithDecrypt(src string, key string) (string, error) {\n\t//如果是{{cipher}}前缀,则代表是加密过的属性,先解密\n\tif strings.HasPrefix(src, \"{{cipher}}\") {\n\t\tdata := src[10:]\n\t\tdecodeData, err := BASE64StdDecode(data)\n\t\tif err != nil {\n\t\t\treturn src, err\n\t\t}\n\t\t//解密\n\t\torigin, err := AesDecrypt(decodeData, []byte(key))\n\t\tif err != nil {\n\t\t\treturn src, err\n\t\t}\n\t\t//返回明文\n\t\treturn string(origin), nil\n\t} else {\n\t\treturn src, nil\n\t}\n}\n\n// 针对配置文件属性进行加密处理\nfunc DealWithEncrypt(src string, key string) (string, error) {\n\tencrypted, err := AesEncrypt([]byte(src), []byte(key))\n\tif err != nil {\n\t\treturn src, err\n\t}\n\n\tdata := BASE64StdEncode(encrypted)\n\treturn \"{{cipher}}\" + data, nil\n}\n"
},
{
"path": "pkg/secu/rsa.go",
"content": "package secu\n\nimport (\n\t\"crypto/rand\"\n\t\"crypto/rsa\"\n\t\"crypto/x509\"\n\t\"encoding/base64\"\n\t\"encoding/pem\"\n\t\"fmt\"\n\n\t\"github.com/toolkits/pkg/logger\"\n)\n\nfunc Decrypt(cipherText string, privateKeyByte []byte, password string) (decrypted string, err error) {\n\t// 移除 \"enc:\" 前缀(如果存在)\n\tif len(cipherText) > 4 && cipherText[:4] == \"enc:\" {\n\t\tcipherText = cipherText[4:]\n\t}\n\n\tdecodeCipher, _ := base64.StdEncoding.DecodeString(cipherText)\n\t//pem解码\n\tblock, _ := pem.Decode(privateKeyByte)\n\tvar privateKey *rsa.PrivateKey\n\tvar decryptedPrivateKeyBytes []byte\n\tif block == nil {\n\t\treturn \"\", fmt.Errorf(\"private key block is nil\")\n\t}\n\tdecryptedPrivateKeyBytes, err = x509.DecryptPEMBlock(block, []byte(password))\n\tif err == nil {\n\t\tprivateKey, err = x509.ParsePKCS1PrivateKey(decryptedPrivateKeyBytes)\n\t} else if password == \"\" { // has error. retry unencrypted\n\t\tprivateKey, err = x509.ParsePKCS1PrivateKey(block.Bytes)\n\t}\n\tif err != nil {\n\t\tlogger.Error(\"Failed to parse private key:\", err)\n\t\treturn \"\", err\n\t}\n\tdecryptedByte, err := rsa.DecryptPKCS1v15(rand.Reader, privateKey, decodeCipher)\n\tif err != nil {\n\t\tlogger.Error(\"Failed to decrypt data:\", err)\n\t\treturn \"\", err\n\t}\n\treturn string(decryptedByte), err\n}\n\nfunc EncryptValue(value string, publicKeyData []byte) (string, error) {\n\tpublicKeyBlock, _ := pem.Decode(publicKeyData)\n\tparsedPublicKey, err := x509.ParsePKIXPublicKey(publicKeyBlock.Bytes)\n\tif err != nil {\n\t\treturn \"\", fmt.Errorf(\"failed to parse public key: %v\", err)\n\t}\n\tpublicKey, ok := parsedPublicKey.(*rsa.PublicKey)\n\tif !ok {\n\t\treturn \"\", fmt.Errorf(\"failed to assert parsed key as RSA public key\")\n\t}\n\n\tciphertext, err := rsa.EncryptPKCS1v15(rand.Reader, publicKey, []byte(value))\n\tif err != nil {\n\t\treturn \"\", fmt.Errorf(\"failed to encrypt value: %v\", err)\n\t}\n\t// 添加 \"enc:\" 前缀标记这是加密数据\n\treturn \"enc:\" + BASE64StdEncode(ciphertext), nil\n}\n\nfunc GenerateRsaKeyPair(password string) (privateByte, publicByte []byte, err error) {\n\tprivateKey, err := rsa.GenerateKey(rand.Reader, 2048)\n\tif err != nil {\n\t\terr = fmt.Errorf(\"failed to GenerateKey: %v\", err)\n\t\treturn\n\t}\n\tblock := &pem.Block{\n\t\tType: \"RSA PRIVATE KEY\",\n\t\tBytes: x509.MarshalPKCS1PrivateKey(privateKey),\n\t}\n\n\tvar encryptedBlock *pem.Block\n\tif password != \"\" {\n\t\tencryptedBlock, err = x509.EncryptPEMBlock(rand.Reader, block.Type, block.Bytes, []byte(password), x509.PEMCipherAES256)\n\t\tif err != nil {\n\t\t\terr = fmt.Errorf(\"failed to EncryptPEMBlock: %v\", err)\n\t\t\treturn\n\t\t}\n\t} else {\n\t\tencryptedBlock = block\n\t}\n\tprivateByte = pem.EncodeToMemory(encryptedBlock)\n\n\tpublicKey := &privateKey.PublicKey\n\tpublicKeyBytes, err := x509.MarshalPKIXPublicKey(publicKey)\n\tif err != nil {\n\t\terr = fmt.Errorf(\"failed to MarshalPKIXPublicKey: %v\", err)\n\t\treturn\n\t}\n\tblock = &pem.Block{\n\t\tType: \"PUBLIC KEY\",\n\t\tBytes: publicKeyBytes,\n\t}\n\tpublicByte = pem.EncodeToMemory(block)\n\n\treturn\n}\n"
},
{
"path": "pkg/slice/contains.go",
"content": "package slice\n\nfunc HaveIntersection[T comparable](slice1, slice2 []T) bool {\n\telemMap := make(map[T]bool)\n\tfor _, val := range slice1 {\n\t\telemMap[val] = true\n\t}\n\n\tfor _, val := range slice2 {\n\t\tif elemMap[val] {\n\t\t\treturn true\n\t\t}\n\t}\n\treturn false\n}\n"
},
{
"path": "pkg/strx/verify.go",
"content": "package strx\n\nimport (\n\t\"net/http\"\n\t\"regexp\"\n\t\"strconv\"\n\t\"strings\"\n\n\t\"github.com/toolkits/pkg/errorx\"\n)\n\nfunc IsValidURL(url string) bool {\n\tre := regexp.MustCompile(`^https?://[^\\s/$.?#].[^\\s]*$`)\n\treturn re.MatchString(url)\n}\n\nfunc IdsInt64ForAPI(ids string, sep ...string) []int64 {\n\tif ids == \"\" {\n\t\treturn []int64{}\n\t}\n\n\ts := \",\"\n\tif len(sep) > 0 {\n\t\ts = sep[0]\n\t}\n\n\tvar arr []string\n\n\tif s == \" \" {\n\t\tarr = strings.Fields(ids)\n\t} else {\n\t\tarr = strings.Split(ids, s)\n\t}\n\n\tcount := len(arr)\n\tret := make([]int64, 0, count)\n\tfor i := 0; i < count; i++ {\n\t\tif arr[i] != \"\" {\n\t\t\tid, err := strconv.ParseInt(arr[i], 10, 64)\n\t\t\tif err != nil {\n\t\t\t\terrorx.Bomb(http.StatusBadRequest, \"cannot convert %s to int64\", arr[i])\n\t\t\t}\n\n\t\t\tret = append(ret, id)\n\t\t}\n\t}\n\n\treturn ret\n}\n"
},
{
"path": "pkg/tlsx/common.go",
"content": "package tlsx\n\nimport (\n\t\"crypto/tls\"\n\t\"fmt\"\n)\n\nvar tlsVersionMap = map[string]uint16{\n\t\"TLS10\": tls.VersionTLS10,\n\t\"TLS11\": tls.VersionTLS11,\n\t\"TLS12\": tls.VersionTLS12,\n\t\"TLS13\": tls.VersionTLS13,\n}\n\nvar tlsCipherMap = map[string]uint16{\n\t\"TLS_ECDHE_RSA_WITH_CHACHA20_POLY1305\": tls.TLS_ECDHE_RSA_WITH_CHACHA20_POLY1305,\n\t\"TLS_ECDHE_ECDSA_WITH_CHACHA20_POLY1305\": tls.TLS_ECDHE_ECDSA_WITH_CHACHA20_POLY1305,\n\t\"TLS_ECDHE_RSA_WITH_AES_128_GCM_SHA256\": tls.TLS_ECDHE_RSA_WITH_AES_128_GCM_SHA256,\n\t\"TLS_ECDHE_ECDSA_WITH_AES_128_GCM_SHA256\": tls.TLS_ECDHE_ECDSA_WITH_AES_128_GCM_SHA256,\n\t\"TLS_ECDHE_RSA_WITH_AES_256_GCM_SHA384\": tls.TLS_ECDHE_RSA_WITH_AES_256_GCM_SHA384,\n\t\"TLS_ECDHE_ECDSA_WITH_AES_256_GCM_SHA384\": tls.TLS_ECDHE_ECDSA_WITH_AES_256_GCM_SHA384,\n\t\"TLS_ECDHE_RSA_WITH_AES_128_CBC_SHA256\": tls.TLS_ECDHE_RSA_WITH_AES_128_CBC_SHA256,\n\t\"TLS_ECDHE_RSA_WITH_AES_128_CBC_SHA\": tls.TLS_ECDHE_RSA_WITH_AES_128_CBC_SHA,\n\t\"TLS_ECDHE_ECDSA_WITH_AES_128_CBC_SHA256\": tls.TLS_ECDHE_ECDSA_WITH_AES_128_CBC_SHA256,\n\t\"TLS_ECDHE_ECDSA_WITH_AES_128_CBC_SHA\": tls.TLS_ECDHE_ECDSA_WITH_AES_128_CBC_SHA,\n\t\"TLS_ECDHE_RSA_WITH_AES_256_CBC_SHA\": tls.TLS_ECDHE_RSA_WITH_AES_256_CBC_SHA,\n\t\"TLS_ECDHE_ECDSA_WITH_AES_256_CBC_SHA\": tls.TLS_ECDHE_ECDSA_WITH_AES_256_CBC_SHA,\n\t\"TLS_RSA_WITH_AES_128_GCM_SHA256\": tls.TLS_RSA_WITH_AES_128_GCM_SHA256,\n\t\"TLS_RSA_WITH_AES_256_GCM_SHA384\": tls.TLS_RSA_WITH_AES_256_GCM_SHA384,\n\t\"TLS_RSA_WITH_AES_128_CBC_SHA256\": tls.TLS_RSA_WITH_AES_128_CBC_SHA256,\n\t\"TLS_RSA_WITH_AES_128_CBC_SHA\": tls.TLS_RSA_WITH_AES_128_CBC_SHA,\n\t\"TLS_RSA_WITH_AES_256_CBC_SHA\": tls.TLS_RSA_WITH_AES_256_CBC_SHA,\n\t\"TLS_ECDHE_RSA_WITH_3DES_EDE_CBC_SHA\": tls.TLS_ECDHE_RSA_WITH_3DES_EDE_CBC_SHA,\n\t\"TLS_RSA_WITH_3DES_EDE_CBC_SHA\": tls.TLS_RSA_WITH_3DES_EDE_CBC_SHA,\n\t\"TLS_RSA_WITH_RC4_128_SHA\": tls.TLS_RSA_WITH_RC4_128_SHA,\n\t\"TLS_ECDHE_RSA_WITH_RC4_128_SHA\": tls.TLS_ECDHE_RSA_WITH_RC4_128_SHA,\n\t\"TLS_ECDHE_ECDSA_WITH_RC4_128_SHA\": tls.TLS_ECDHE_ECDSA_WITH_RC4_128_SHA,\n\t\"TLS_AES_128_GCM_SHA256\": tls.TLS_AES_128_GCM_SHA256,\n\t\"TLS_AES_256_GCM_SHA384\": tls.TLS_AES_256_GCM_SHA384,\n\t\"TLS_CHACHA20_POLY1305_SHA256\": tls.TLS_CHACHA20_POLY1305_SHA256,\n}\n\n// ParseCiphers returns a `[]uint16` by received `[]string` key that represents ciphers from crypto/tls.\n// If some of ciphers in received list doesn't exists ParseCiphers returns nil with error\nfunc ParseCiphers(ciphers []string) ([]uint16, error) {\n\tsuites := []uint16{}\n\n\tfor _, cipher := range ciphers {\n\t\tv, ok := tlsCipherMap[cipher]\n\t\tif !ok {\n\t\t\treturn nil, fmt.Errorf(\"unsupported cipher %q\", cipher)\n\t\t}\n\t\tsuites = append(suites, v)\n\t}\n\n\treturn suites, nil\n}\n\n// ParseTLSVersion returns a `uint16` by received version string key that represents tls version from crypto/tls.\n// If version isn't supported ParseTLSVersion returns 0 with error\nfunc ParseTLSVersion(version string) (uint16, error) {\n\tif v, ok := tlsVersionMap[version]; ok {\n\t\treturn v, nil\n\t}\n\treturn 0, fmt.Errorf(\"unsupported version %q\", version)\n}\n"
},
{
"path": "pkg/tlsx/config.go",
"content": "package tlsx\n\nimport (\n\t\"crypto/tls\"\n\t\"crypto/x509\"\n\t\"fmt\"\n\t\"os\"\n\t\"strings\"\n\n\t\"github.com/ccfos/nightingale/v6/pkg/choice\"\n)\n\n// ClientConfig represents the standard client TLS config.\ntype ClientConfig struct {\n\tUseTLS bool\n\tTLSCA string\n\tTLSCert string\n\tTLSKey string\n\tTLSKeyPwd string\n\tInsecureSkipVerify bool\n\tServerName string\n\tTLSMinVersion string\n\tTLSMaxVersion string\n}\n\n// ServerConfig represents the standard server TLS config.\ntype ServerConfig struct {\n\tTLSCert string\n\tTLSKey string\n\tTLSKeyPwd string\n\tTLSAllowedCACerts []string\n\tTLSCipherSuites []string\n\tTLSMinVersion string\n\tTLSMaxVersion string\n\tTLSAllowedDNSNames []string\n}\n\n// TLSConfig returns a tls.Config, may be nil without error if TLS is not\n// configured.\nfunc (c *ClientConfig) TLSConfig() (*tls.Config, error) {\n\tif !c.UseTLS {\n\t\treturn nil, nil\n\t}\n\n\ttlsConfig := &tls.Config{\n\t\tInsecureSkipVerify: c.InsecureSkipVerify,\n\t\tRenegotiation: tls.RenegotiateNever,\n\t}\n\n\tif c.TLSCA != \"\" {\n\t\tpool, err := makeCertPool([]string{c.TLSCA})\n\t\tif err != nil {\n\t\t\treturn nil, err\n\t\t}\n\t\ttlsConfig.RootCAs = pool\n\t}\n\n\tif c.TLSCert != \"\" && c.TLSKey != \"\" {\n\t\terr := loadCertificate(tlsConfig, c.TLSCert, c.TLSKey)\n\t\tif err != nil {\n\t\t\treturn nil, err\n\t\t}\n\t}\n\n\tif c.ServerName != \"\" {\n\t\ttlsConfig.ServerName = c.ServerName\n\t}\n\n\tif c.TLSMinVersion == \"1.0\" {\n\t\ttlsConfig.MinVersion = tls.VersionTLS10\n\t} else if c.TLSMinVersion == \"1.1\" {\n\t\ttlsConfig.MinVersion = tls.VersionTLS11\n\t} else if c.TLSMinVersion == \"1.2\" {\n\t\ttlsConfig.MinVersion = tls.VersionTLS12\n\t} else if c.TLSMinVersion == \"1.3\" {\n\t\ttlsConfig.MinVersion = tls.VersionTLS13\n\t}\n\n\tif c.TLSMaxVersion == \"1.0\" {\n\t\ttlsConfig.MaxVersion = tls.VersionTLS10\n\t} else if c.TLSMaxVersion == \"1.1\" {\n\t\ttlsConfig.MaxVersion = tls.VersionTLS11\n\t} else if c.TLSMaxVersion == \"1.2\" {\n\t\ttlsConfig.MaxVersion = tls.VersionTLS12\n\t} else if c.TLSMaxVersion == \"1.3\" {\n\t\ttlsConfig.MaxVersion = tls.VersionTLS13\n\t}\n\n\treturn tlsConfig, nil\n}\n\n// TLSConfig returns a tls.Config, may be nil without error if TLS is not\n// configured.\nfunc (c *ServerConfig) TLSConfig() (*tls.Config, error) {\n\tif c.TLSCert == \"\" && c.TLSKey == \"\" && len(c.TLSAllowedCACerts) == 0 {\n\t\treturn nil, nil\n\t}\n\n\ttlsConfig := &tls.Config{}\n\n\tif len(c.TLSAllowedCACerts) != 0 {\n\t\tpool, err := makeCertPool(c.TLSAllowedCACerts)\n\t\tif err != nil {\n\t\t\treturn nil, err\n\t\t}\n\t\ttlsConfig.ClientCAs = pool\n\t\ttlsConfig.ClientAuth = tls.RequireAndVerifyClientCert\n\t}\n\n\tif c.TLSCert != \"\" && c.TLSKey != \"\" {\n\t\terr := loadCertificate(tlsConfig, c.TLSCert, c.TLSKey)\n\t\tif err != nil {\n\t\t\treturn nil, err\n\t\t}\n\t}\n\n\tif len(c.TLSCipherSuites) != 0 {\n\t\tcipherSuites, err := ParseCiphers(c.TLSCipherSuites)\n\t\tif err != nil {\n\t\t\treturn nil, fmt.Errorf(\n\t\t\t\t\"could not parse server cipher suites %s: %v\", strings.Join(c.TLSCipherSuites, \",\"), err)\n\t\t}\n\t\ttlsConfig.CipherSuites = cipherSuites\n\t}\n\n\tif c.TLSMaxVersion != \"\" {\n\t\tversion, err := ParseTLSVersion(c.TLSMaxVersion)\n\t\tif err != nil {\n\t\t\treturn nil, fmt.Errorf(\n\t\t\t\t\"could not parse tls max version %q: %v\", c.TLSMaxVersion, err)\n\t\t}\n\t\ttlsConfig.MaxVersion = version\n\t}\n\n\tif c.TLSMinVersion != \"\" {\n\t\tversion, err := ParseTLSVersion(c.TLSMinVersion)\n\t\tif err != nil {\n\t\t\treturn nil, fmt.Errorf(\n\t\t\t\t\"could not parse tls min version %q: %v\", c.TLSMinVersion, err)\n\t\t}\n\t\ttlsConfig.MinVersion = version\n\t}\n\n\tif tlsConfig.MinVersion != 0 && tlsConfig.MaxVersion != 0 && tlsConfig.MinVersion > tlsConfig.MaxVersion {\n\t\treturn nil, fmt.Errorf(\n\t\t\t\"tls min version %q can't be greater than tls max version %q\", tlsConfig.MinVersion, tlsConfig.MaxVersion)\n\t}\n\n\t// Since clientAuth is tlsConfig.ClientAuth = tls.RequireAndVerifyClientCert\n\t// there must be certs to validate.\n\tif len(c.TLSAllowedCACerts) > 0 && len(c.TLSAllowedDNSNames) > 0 {\n\t\ttlsConfig.VerifyPeerCertificate = c.verifyPeerCertificate\n\t}\n\n\treturn tlsConfig, nil\n}\n\nfunc makeCertPool(certFiles []string) (*x509.CertPool, error) {\n\tpool := x509.NewCertPool()\n\tfor _, certFile := range certFiles {\n\t\tpem, err := os.ReadFile(certFile)\n\t\tif err != nil {\n\t\t\treturn nil, fmt.Errorf(\n\t\t\t\t\"could not read certificate %q: %v\", certFile, err)\n\t\t}\n\t\tif !pool.AppendCertsFromPEM(pem) {\n\t\t\treturn nil, fmt.Errorf(\n\t\t\t\t\"could not parse any PEM certificates %q: %v\", certFile, err)\n\t\t}\n\t}\n\treturn pool, nil\n}\n\nfunc loadCertificate(config *tls.Config, certFile, keyFile string) error {\n\tcert, err := tls.LoadX509KeyPair(certFile, keyFile)\n\tif err != nil {\n\t\treturn fmt.Errorf(\n\t\t\t\"could not load keypair %s:%s: %v\", certFile, keyFile, err)\n\t}\n\n\tconfig.Certificates = []tls.Certificate{cert}\n\tconfig.BuildNameToCertificate()\n\treturn nil\n}\n\nfunc (c *ServerConfig) verifyPeerCertificate(rawCerts [][]byte, verifiedChains [][]*x509.Certificate) error {\n\t// The certificate chain is client + intermediate + root.\n\t// Let's review the client certificate.\n\tcert, err := x509.ParseCertificate(rawCerts[0])\n\tif err != nil {\n\t\treturn fmt.Errorf(\"could not validate peer certificate: %v\", err)\n\t}\n\n\tfor _, name := range cert.DNSNames {\n\t\tif choice.Contains(name, c.TLSAllowedDNSNames) {\n\t\t\treturn nil\n\t\t}\n\t}\n\n\treturn fmt.Errorf(\"peer certificate not in allowed DNS Name list: %v\", cert.DNSNames)\n}\n"
},
{
"path": "pkg/tplx/conv.go",
"content": "package tplx\n\nimport (\n\t\"fmt\"\n\t\"strconv\"\n)\n\n// ToFloat64 convert interface to float64\nfunc ToFloat64(val interface{}) (float64, error) {\n\tswitch v := val.(type) {\n\tcase string:\n\t\tif f, err := strconv.ParseFloat(v, 64); err == nil {\n\t\t\treturn f, nil\n\t\t}\n\n\t\t// try int\n\t\tif i, err := strconv.ParseInt(v, 0, 64); err == nil {\n\t\t\treturn float64(i), nil\n\t\t}\n\n\t\t// try bool\n\t\tb, err := strconv.ParseBool(v)\n\t\tif err == nil {\n\t\t\tif b {\n\t\t\t\treturn 1, nil\n\t\t\t} else {\n\t\t\t\treturn 0, nil\n\t\t\t}\n\t\t}\n\n\t\tif v == \"Yes\" || v == \"yes\" || v == \"YES\" || v == \"Y\" || v == \"ON\" || v == \"on\" || v == \"On\" || v == \"ok\" || v == \"up\" {\n\t\t\treturn 1, nil\n\t\t}\n\n\t\tif v == \"No\" || v == \"no\" || v == \"NO\" || v == \"N\" || v == \"OFF\" || v == \"off\" || v == \"Off\" || v == \"fail\" || v == \"err\" || v == \"down\" {\n\t\t\treturn 0, nil\n\t\t}\n\n\t\treturn 0, fmt.Errorf(\"unparsable value %v\", v)\n\tcase float64:\n\t\treturn v, nil\n\tcase uint64:\n\t\treturn float64(v), nil\n\tcase uint32:\n\t\treturn float64(v), nil\n\tcase uint16:\n\t\treturn float64(v), nil\n\tcase uint8:\n\t\treturn float64(v), nil\n\tcase uint:\n\t\treturn float64(v), nil\n\tcase int64:\n\t\treturn float64(v), nil\n\tcase int32:\n\t\treturn float64(v), nil\n\tcase int16:\n\t\treturn float64(v), nil\n\tcase int8:\n\t\treturn float64(v), nil\n\tcase bool:\n\t\tif v {\n\t\t\treturn 1, nil\n\t\t} else {\n\t\t\treturn 0, nil\n\t\t}\n\tcase int:\n\t\treturn float64(v), nil\n\tcase float32:\n\t\treturn float64(v), nil\n\tdefault:\n\t\treturn strconv.ParseFloat(fmt.Sprint(v), 64)\n\t}\n}\n"
},
{
"path": "pkg/tplx/fns.go",
"content": "package tplx\n\nimport (\n\t\"encoding/json\"\n\t\"errors\"\n\t\"fmt\"\n\t\"html/template\"\n\t\"math\"\n\t\"net\"\n\t\"net/url\"\n\t\"reflect\"\n\t\"regexp\"\n\t\"sort\"\n\t\"strconv\"\n\t\"strings\"\n\t\"time\"\n\n\t\"github.com/prometheus/common/model\"\n\t\"github.com/prometheus/prometheus/util/strutil\"\n)\n\nvar (\n\terrNaNOrInf = errors.New(\"value is NaN or Inf\")\n)\n\ntype sample struct {\n\tLabels map[string]string\n\tValue float64\n}\n\ntype QueryFunc func(int64, string) model.Value\n\nvar queryFunc QueryFunc\n\n// RegisterQueryFunc 为了避免循环引用,通过外部注入的方式注册 queryFunc\nfunc RegisterQueryFunc(f QueryFunc) {\n\tqueryFunc = f\n}\n\ntype QueryResult []*sample\n\ntype queryResultByLabelSorter struct {\n\tresults QueryResult\n\tby string\n}\n\nfunc (q queryResultByLabelSorter) Len() int {\n\treturn len(q.results)\n}\n\nfunc (q queryResultByLabelSorter) Less(i, j int) bool {\n\treturn q.results[i].Labels[q.by] < q.results[j].Labels[q.by]\n}\n\nfunc (q queryResultByLabelSorter) Swap(i, j int) {\n\tq.results[i], q.results[j] = q.results[j], q.results[i]\n}\n\nfunc Unescaped(str string) interface{} {\n\treturn template.HTML(str)\n}\n\nfunc Urlconvert(str string) interface{} {\n\treturn template.URL(str)\n}\n\nfunc Timeformat(ts int64, pattern ...string) string {\n\tdefp := \"2006-01-02 15:04:05\"\n\tif len(pattern) > 0 {\n\t\tdefp = pattern[0]\n\t}\n\treturn time.Unix(ts, 0).Format(defp)\n}\n\nfunc Timestamp(pattern ...string) string {\n\tdefp := \"2006-01-02 15:04:05\"\n\tif len(pattern) > 0 {\n\t\tdefp = pattern[0]\n\t}\n\treturn time.Now().Format(defp)\n}\n\nfunc Now() time.Time {\n\treturn time.Now()\n}\n\nfunc Args(args ...interface{}) map[string]interface{} {\n\tresult := make(map[string]interface{})\n\tfor i, a := range args {\n\t\tresult[fmt.Sprintf(\"arg%d\", i)] = a\n\t}\n\treturn result\n}\n\nfunc ReReplaceAll(pattern, repl, text string) string {\n\tre := regexp.MustCompile(pattern)\n\treturn re.ReplaceAllString(text, repl)\n}\n\nfunc Humanize(s string) string {\n\tv, err := strconv.ParseFloat(s, 64)\n\tif err != nil {\n\t\treturn s\n\t}\n\tif v == 0 || math.IsNaN(v) || math.IsInf(v, 0) {\n\t\treturn fmt.Sprintf(\"%.2f\", v)\n\t}\n\tif math.Abs(v) >= 1 {\n\t\tprefix := \"\"\n\t\tfor _, p := range []string{\"k\", \"M\", \"G\", \"T\", \"P\", \"E\", \"Z\", \"Y\"} {\n\t\t\tif math.Abs(v) < 1000 {\n\t\t\t\tbreak\n\t\t\t}\n\t\t\tprefix = p\n\t\t\tv /= 1000\n\t\t}\n\t\treturn fmt.Sprintf(\"%.2f%s\", v, prefix)\n\t}\n\tprefix := \"\"\n\tfor _, p := range []string{\"m\", \"u\", \"n\", \"p\", \"f\", \"a\", \"z\", \"y\"} {\n\t\tif math.Abs(v) >= 1 {\n\t\t\tbreak\n\t\t}\n\t\tprefix = p\n\t\tv *= 1000\n\t}\n\treturn fmt.Sprintf(\"%.2f%s\", v, prefix)\n}\n\nfunc Humanize1024(s string) string {\n\tv, err := strconv.ParseFloat(s, 64)\n\tif err != nil {\n\t\treturn s\n\t}\n\tif math.Abs(v) <= 1 || math.IsNaN(v) || math.IsInf(v, 0) {\n\t\treturn fmt.Sprintf(\"%.4g\", v)\n\t}\n\tprefix := \"\"\n\tfor _, p := range []string{\"ki\", \"Mi\", \"Gi\", \"Ti\", \"Pi\", \"Ei\", \"Zi\", \"Yi\"} {\n\t\tif math.Abs(v) < 1024 {\n\t\t\tbreak\n\t\t}\n\t\tprefix = p\n\t\tv /= 1024\n\t}\n\treturn fmt.Sprintf(\"%.4g%s\", v, prefix)\n}\n\nfunc ToString(v interface{}) string {\n\treturn fmt.Sprint(v)\n}\n\nfunc HumanizeDuration(s string) string {\n\tv, err := strconv.ParseFloat(s, 64)\n\tif err != nil {\n\t\treturn s\n\t}\n\treturn HumanizeDurationFloat64(v)\n}\n\nfunc HumanizeDurationInterface(i interface{}) string {\n\tf, err := ToFloat64(i)\n\tif err != nil {\n\t\treturn ToString(i)\n\t}\n\treturn HumanizeDurationFloat64(f)\n}\n\nfunc HumanizeDurationFloat64(v float64) string {\n\tif math.IsNaN(v) || math.IsInf(v, 0) {\n\t\treturn fmt.Sprintf(\"%.4g\", v)\n\t}\n\tif v == 0 {\n\t\treturn fmt.Sprintf(\"%.4gs\", v)\n\t}\n\tif math.Abs(v) >= 1 {\n\t\tsign := \"\"\n\t\tif v < 0 {\n\t\t\tsign = \"-\"\n\t\t\tv = -v\n\t\t}\n\t\tseconds := int64(v) % 60\n\t\tminutes := (int64(v) / 60) % 60\n\t\thours := (int64(v) / 60 / 60) % 24\n\t\tdays := int64(v) / 60 / 60 / 24\n\t\t// For days to minutes, we display seconds as an integer.\n\t\tif days != 0 {\n\t\t\treturn fmt.Sprintf(\"%s%dd %dh %dm %ds\", sign, days, hours, minutes, seconds)\n\t\t}\n\t\tif hours != 0 {\n\t\t\treturn fmt.Sprintf(\"%s%dh %dm %ds\", sign, hours, minutes, seconds)\n\t\t}\n\t\tif minutes != 0 {\n\t\t\treturn fmt.Sprintf(\"%s%dm %ds\", sign, minutes, seconds)\n\t\t}\n\t\t// For seconds, we display 4 significant digits.\n\t\treturn fmt.Sprintf(\"%s%.4gs\", sign, v)\n\t}\n\tprefix := \"\"\n\tfor _, p := range []string{\"m\", \"u\", \"n\", \"p\", \"f\", \"a\", \"z\", \"y\"} {\n\t\tif math.Abs(v) >= 1 {\n\t\t\tbreak\n\t\t}\n\t\tprefix = p\n\t\tv *= 1000\n\t}\n\treturn fmt.Sprintf(\"%.4g%ss\", v, prefix)\n}\n\nfunc HumanizePercentage(s string) string {\n\tv, err := strconv.ParseFloat(s, 64)\n\tif err != nil {\n\t\treturn s\n\t}\n\treturn fmt.Sprintf(\"%.2f%%\", v*100)\n}\n\nfunc HumanizePercentageH(s string) string {\n\tv, err := strconv.ParseFloat(s, 64)\n\tif err != nil {\n\t\treturn s\n\t}\n\treturn fmt.Sprintf(\"%.2f%%\", v)\n}\n\nfunc HumanizeTimestamp(i interface{}) (string, error) {\n\tv, err := convertToFloat(i)\n\tif err != nil {\n\t\treturn \"\", err\n\t}\n\n\ttm, err := floatToTime(v)\n\tswitch {\n\tcase errors.Is(err, errNaNOrInf):\n\t\treturn fmt.Sprintf(\"%.4g\", v), nil\n\tcase err != nil:\n\t\treturn \"\", err\n\t}\n\n\treturn fmt.Sprint(tm), nil\n}\n\n// Add returns the sum of a and b.\nfunc Add(a, b interface{}) (interface{}, error) {\n\tav := reflect.ValueOf(a)\n\tbv := reflect.ValueOf(b)\n\n\tswitch av.Kind() {\n\tcase reflect.Int, reflect.Int8, reflect.Int16, reflect.Int32, reflect.Int64:\n\t\tswitch bv.Kind() {\n\t\tcase reflect.Int, reflect.Int8, reflect.Int16, reflect.Int32, reflect.Int64:\n\t\t\treturn av.Int() + bv.Int(), nil\n\t\tcase reflect.Uint, reflect.Uint8, reflect.Uint16, reflect.Uint32, reflect.Uint64:\n\t\t\treturn av.Int() + int64(bv.Uint()), nil\n\t\tcase reflect.Float32, reflect.Float64:\n\t\t\treturn float64(av.Int()) + bv.Float(), nil\n\t\tdefault:\n\t\t\treturn nil, fmt.Errorf(\"add: unknown type for %q (%T)\", bv, b)\n\t\t}\n\tcase reflect.Uint, reflect.Uint8, reflect.Uint16, reflect.Uint32, reflect.Uint64:\n\t\tswitch bv.Kind() {\n\t\tcase reflect.Int, reflect.Int8, reflect.Int16, reflect.Int32, reflect.Int64:\n\t\t\treturn int64(av.Uint()) + bv.Int(), nil\n\t\tcase reflect.Uint, reflect.Uint8, reflect.Uint16, reflect.Uint32, reflect.Uint64:\n\t\t\treturn av.Uint() + bv.Uint(), nil\n\t\tcase reflect.Float32, reflect.Float64:\n\t\t\treturn float64(av.Uint()) + bv.Float(), nil\n\t\tdefault:\n\t\t\treturn nil, fmt.Errorf(\"add: unknown type for %q (%T)\", bv, b)\n\t\t}\n\tcase reflect.Float32, reflect.Float64:\n\t\tswitch bv.Kind() {\n\t\tcase reflect.Int, reflect.Int8, reflect.Int16, reflect.Int32, reflect.Int64:\n\t\t\treturn av.Float() + float64(bv.Int()), nil\n\t\tcase reflect.Uint, reflect.Uint8, reflect.Uint16, reflect.Uint32, reflect.Uint64:\n\t\t\treturn av.Float() + float64(bv.Uint()), nil\n\t\tcase reflect.Float32, reflect.Float64:\n\t\t\treturn av.Float() + bv.Float(), nil\n\t\tdefault:\n\t\t\treturn nil, fmt.Errorf(\"add: unknown type for %q (%T)\", bv, b)\n\t\t}\n\tdefault:\n\t\treturn nil, fmt.Errorf(\"add: unknown type for %q (%T)\", av, a)\n\t}\n}\n\n// Subtract returns the difference of b from a.\nfunc Subtract(a, b interface{}) (interface{}, error) {\n\tav := reflect.ValueOf(a)\n\tbv := reflect.ValueOf(b)\n\n\tswitch av.Kind() {\n\tcase reflect.Int, reflect.Int8, reflect.Int16, reflect.Int32, reflect.Int64:\n\t\tswitch bv.Kind() {\n\t\tcase reflect.Int, reflect.Int8, reflect.Int16, reflect.Int32, reflect.Int64:\n\t\t\treturn av.Int() - bv.Int(), nil\n\t\tcase reflect.Uint, reflect.Uint8, reflect.Uint16, reflect.Uint32, reflect.Uint64:\n\t\t\treturn av.Int() - int64(bv.Uint()), nil\n\t\tcase reflect.Float32, reflect.Float64:\n\t\t\treturn float64(av.Int()) - bv.Float(), nil\n\t\tdefault:\n\t\t\treturn nil, fmt.Errorf(\"subtract: unknown type for %q (%T)\", bv, b)\n\t\t}\n\tcase reflect.Uint, reflect.Uint8, reflect.Uint16, reflect.Uint32, reflect.Uint64:\n\t\tswitch bv.Kind() {\n\t\tcase reflect.Int, reflect.Int8, reflect.Int16, reflect.Int32, reflect.Int64:\n\t\t\treturn int64(av.Uint()) - bv.Int(), nil\n\t\tcase reflect.Uint, reflect.Uint8, reflect.Uint16, reflect.Uint32, reflect.Uint64:\n\t\t\treturn av.Uint() - bv.Uint(), nil\n\t\tcase reflect.Float32, reflect.Float64:\n\t\t\treturn float64(av.Uint()) - bv.Float(), nil\n\t\tdefault:\n\t\t\treturn nil, fmt.Errorf(\"subtract: unknown type for %q (%T)\", bv, b)\n\t\t}\n\tcase reflect.Float32, reflect.Float64:\n\t\tswitch bv.Kind() {\n\t\tcase reflect.Int, reflect.Int8, reflect.Int16, reflect.Int32, reflect.Int64:\n\t\t\treturn av.Float() - float64(bv.Int()), nil\n\t\tcase reflect.Uint, reflect.Uint8, reflect.Uint16, reflect.Uint32, reflect.Uint64:\n\t\t\treturn av.Float() - float64(bv.Uint()), nil\n\t\tcase reflect.Float32, reflect.Float64:\n\t\t\treturn av.Float() - bv.Float(), nil\n\t\tdefault:\n\t\t\treturn nil, fmt.Errorf(\"subtract: unknown type for %q (%T)\", bv, b)\n\t\t}\n\tdefault:\n\t\treturn nil, fmt.Errorf(\"subtract: unknown type for %q (%T)\", av, a)\n\t}\n}\n\n// Multiply returns the product of a and b.\nfunc Multiply(a, b interface{}) (interface{}, error) {\n\tav := reflect.ValueOf(a)\n\tbv := reflect.ValueOf(b)\n\n\tswitch av.Kind() {\n\tcase reflect.Int, reflect.Int8, reflect.Int16, reflect.Int32, reflect.Int64:\n\t\tswitch bv.Kind() {\n\t\tcase reflect.Int, reflect.Int8, reflect.Int16, reflect.Int32, reflect.Int64:\n\t\t\treturn av.Int() * bv.Int(), nil\n\t\tcase reflect.Uint, reflect.Uint8, reflect.Uint16, reflect.Uint32, reflect.Uint64:\n\t\t\treturn av.Int() * int64(bv.Uint()), nil\n\t\tcase reflect.Float32, reflect.Float64:\n\t\t\treturn float64(av.Int()) * bv.Float(), nil\n\t\tdefault:\n\t\t\treturn nil, fmt.Errorf(\"multiply: unknown type for %q (%T)\", bv, b)\n\t\t}\n\tcase reflect.Uint, reflect.Uint8, reflect.Uint16, reflect.Uint32, reflect.Uint64:\n\t\tswitch bv.Kind() {\n\t\tcase reflect.Int, reflect.Int8, reflect.Int16, reflect.Int32, reflect.Int64:\n\t\t\treturn int64(av.Uint()) * bv.Int(), nil\n\t\tcase reflect.Uint, reflect.Uint8, reflect.Uint16, reflect.Uint32, reflect.Uint64:\n\t\t\treturn av.Uint() * bv.Uint(), nil\n\t\tcase reflect.Float32, reflect.Float64:\n\t\t\treturn float64(av.Uint()) * bv.Float(), nil\n\t\tdefault:\n\t\t\treturn nil, fmt.Errorf(\"multiply: unknown type for %q (%T)\", bv, b)\n\t\t}\n\tcase reflect.Float32, reflect.Float64:\n\t\tswitch bv.Kind() {\n\t\tcase reflect.Int, reflect.Int8, reflect.Int16, reflect.Int32, reflect.Int64:\n\t\t\treturn av.Float() * float64(bv.Int()), nil\n\t\tcase reflect.Uint, reflect.Uint8, reflect.Uint16, reflect.Uint32, reflect.Uint64:\n\t\t\treturn av.Float() * float64(bv.Uint()), nil\n\t\tcase reflect.Float32, reflect.Float64:\n\t\t\treturn av.Float() * bv.Float(), nil\n\t\tdefault:\n\t\t\treturn nil, fmt.Errorf(\"multiply: unknown type for %q (%T)\", bv, b)\n\t\t}\n\tdefault:\n\t\treturn nil, fmt.Errorf(\"multiply: unknown type for %q (%T)\", av, a)\n\t}\n}\n\n// Divide returns the division of b from a.\nfunc Divide(a, b interface{}) (interface{}, error) {\n\tav := reflect.ValueOf(a)\n\tbv := reflect.ValueOf(b)\n\n\tswitch av.Kind() {\n\tcase reflect.Int, reflect.Int8, reflect.Int16, reflect.Int32, reflect.Int64:\n\t\tswitch bv.Kind() {\n\t\tcase reflect.Int, reflect.Int8, reflect.Int16, reflect.Int32, reflect.Int64:\n\t\t\treturn av.Int() / bv.Int(), nil\n\t\tcase reflect.Uint, reflect.Uint8, reflect.Uint16, reflect.Uint32, reflect.Uint64:\n\t\t\treturn av.Int() / int64(bv.Uint()), nil\n\t\tcase reflect.Float32, reflect.Float64:\n\t\t\treturn float64(av.Int()) / bv.Float(), nil\n\t\tdefault:\n\t\t\treturn nil, fmt.Errorf(\"divide: unknown type for %q (%T)\", bv, b)\n\t\t}\n\tcase reflect.Uint, reflect.Uint8, reflect.Uint16, reflect.Uint32, reflect.Uint64:\n\t\tswitch bv.Kind() {\n\t\tcase reflect.Int, reflect.Int8, reflect.Int16, reflect.Int32, reflect.Int64:\n\t\t\treturn int64(av.Uint()) / bv.Int(), nil\n\t\tcase reflect.Uint, reflect.Uint8, reflect.Uint16, reflect.Uint32, reflect.Uint64:\n\t\t\treturn av.Uint() / bv.Uint(), nil\n\t\tcase reflect.Float32, reflect.Float64:\n\t\t\treturn float64(av.Uint()) / bv.Float(), nil\n\t\tdefault:\n\t\t\treturn nil, fmt.Errorf(\"divide: unknown type for %q (%T)\", bv, b)\n\t\t}\n\tcase reflect.Float32, reflect.Float64:\n\t\tswitch bv.Kind() {\n\t\tcase reflect.Int, reflect.Int8, reflect.Int16, reflect.Int32, reflect.Int64:\n\t\t\treturn av.Float() / float64(bv.Int()), nil\n\t\tcase reflect.Uint, reflect.Uint8, reflect.Uint16, reflect.Uint32, reflect.Uint64:\n\t\t\treturn av.Float() / float64(bv.Uint()), nil\n\t\tcase reflect.Float32, reflect.Float64:\n\t\t\treturn av.Float() / bv.Float(), nil\n\t\tdefault:\n\t\t\treturn nil, fmt.Errorf(\"divide: unknown type for %q (%T)\", bv, b)\n\t\t}\n\tdefault:\n\t\treturn nil, fmt.Errorf(\"divide: unknown type for %q (%T)\", av, a)\n\t}\n}\n\nfunc FormatDecimal(s string, n int) string {\n\tnum, err := strconv.ParseFloat(s, 64)\n\tif err != nil {\n\t\treturn s\n\t}\n\n\tformat := fmt.Sprintf(\"%%.%df\", n)\n\treturn fmt.Sprintf(format, num)\n}\n\nfunc First(v QueryResult) (*sample, error) {\n\tif len(v) > 0 {\n\t\treturn v[0], nil\n\t}\n\treturn nil, errors.New(\"first() called on vector with no elements\")\n}\n\nfunc Label(label string, s *sample) string {\n\treturn s.Labels[label]\n}\n\nfunc Value(s *sample) float64 {\n\treturn s.Value\n}\n\nfunc StrValue(s *sample) string {\n\treturn s.Labels[\"__value__\"]\n}\n\nfunc SafeHtml(text string) template.HTML {\n\treturn template.HTML(text)\n}\n\nfunc Match(pattern, s string) (bool, error) {\n\treturn regexp.MatchString(pattern, s)\n}\nfunc Title(s string) string {\n\treturn strings.Title(s)\n}\n\nfunc ToUpper(s string) string {\n\treturn strings.ToUpper(s)\n}\n\nfunc ToLower(s string) string {\n\treturn strings.ToLower(s)\n}\n\nfunc GraphLink(expr string) string {\n\treturn strutil.GraphLinkForExpression(expr)\n}\n\nfunc TableLink(expr string) string {\n\treturn strutil.TableLinkForExpression(expr)\n}\n\nfunc SortByLabel(label string, v QueryResult) QueryResult {\n\tsorter := queryResultByLabelSorter{v[:], label}\n\tsort.Stable(sorter)\n\treturn v\n}\n\nfunc StripPort(hostPort string) string {\n\thost, _, err := net.SplitHostPort(hostPort)\n\tif err != nil {\n\t\treturn hostPort\n\t}\n\treturn host\n}\n\nfunc StripDomain(hostPort string) string {\n\thost, port, err := net.SplitHostPort(hostPort)\n\tif err != nil {\n\t\thost = hostPort\n\t}\n\tip := net.ParseIP(host)\n\tif ip != nil {\n\t\treturn hostPort\n\t}\n\thost = strings.Split(host, \".\")[0]\n\tif port != \"\" {\n\t\treturn net.JoinHostPort(host, port)\n\t}\n\treturn host\n}\n\nfunc ToTime(i interface{}) (*time.Time, error) {\n\tv, err := convertToFloat(i)\n\tif err != nil {\n\t\treturn nil, err\n\t}\n\treturn floatToTime(v)\n}\n\nfunc PathPrefix(externalURL *url.URL) string {\n\treturn externalURL.Path\n}\n\nfunc ExternalURL(externalURL *url.URL) string {\n\treturn externalURL.String()\n}\n\nfunc ParseDuration(d string) (float64, error) {\n\tv, err := model.ParseDuration(d)\n\tif err != nil {\n\t\treturn 0, err\n\t}\n\treturn float64(time.Duration(v)) / float64(time.Second), nil\n}\n\nfunc Printf(format string, value interface{}) string {\n\tvalType := reflect.TypeOf(value).Kind()\n\n\tswitch valType {\n\tcase reflect.String:\n\t\tstrValue := value.(string)\n\t\t// Check if it's a value with unit (contains both digits and non-numeric chars like letters or %)\n\t\tif isValueWithUnit(strValue) {\n\t\t\treturn strValue\n\t\t}\n\t\t// Try converting string to float\n\t\tif floatValue, err := strconv.ParseFloat(strValue, 64); err == nil {\n\t\t\treturn fmt.Sprintf(format, floatValue)\n\t\t}\n\t\treturn fmt.Sprintf(format, value)\n\tcase reflect.Float64, reflect.Float32:\n\t\treturn fmt.Sprintf(format, value)\n\tdefault:\n\t\t// Handle other types as per requirement\n\t\treturn fmt.Sprintf(format, value)\n\t}\n}\n\n// isValueWithUnit checks if a string is a numeric value with unit\n// e.g., \"11.5%\", \"100MB\", \"10a\" returns true\n// e.g., \"11\", \"11.11\", \"-3.14\" returns false\nfunc isValueWithUnit(s string) bool {\n\tif s == \"\" {\n\t\treturn false\n\t}\n\n\thasDigit := false\n\thasUnit := false\n\n\tfor _, r := range s {\n\t\tif r >= '0' && r <= '9' {\n\t\t\thasDigit = true\n\t\t} else if r == '.' || r == '-' || r == '+' {\n\t\t\t// These are valid numeric characters, not units\n\t\t\tcontinue\n\t\t} else {\n\t\t\t// Any other character (letters, %, etc.) is considered a unit\n\t\t\thasUnit = true\n\t\t}\n\t}\n\n\treturn hasDigit && hasUnit\n}\n\nfunc floatToTime(v float64) (*time.Time, error) {\n\tif math.IsNaN(v) || math.IsInf(v, 0) {\n\t\treturn nil, errNaNOrInf\n\t}\n\ttimestamp := v * 1e9\n\tif timestamp > math.MaxInt64 || timestamp < math.MinInt64 {\n\t\treturn nil, fmt.Errorf(\"%v cannot be represented as a nanoseconds timestamp since it overflows int64\", v)\n\t}\n\tt := model.TimeFromUnixNano(int64(timestamp)).Time().UTC()\n\treturn &t, nil\n}\n\nfunc convertToFloat(i interface{}) (float64, error) {\n\tswitch v := i.(type) {\n\tcase float64:\n\t\treturn v, nil\n\tcase string:\n\t\treturn strconv.ParseFloat(v, 64)\n\tcase int:\n\t\treturn float64(v), nil\n\tcase uint:\n\t\treturn float64(v), nil\n\tcase int64:\n\t\treturn float64(v), nil\n\tcase uint64:\n\t\treturn float64(v), nil\n\tdefault:\n\t\treturn 0, fmt.Errorf(\"can't convert %T to float\", v)\n\t}\n}\n\nfunc Query(datasourceID int64, promql string) model.Value {\n\n\tvalue := queryFunc(datasourceID, promql)\n\tif value != nil {\n\t\treturn value\n\t}\n\n\treturn nil\n}\n\n// ConvertToQueryResult 将model.Value转换为queryResult\nfunc ConvertToQueryResult(value model.Value) QueryResult {\n\tif value == nil {\n\t\treturn nil\n\t}\n\n\tvar result QueryResult\n\n\tswitch value.Type() {\n\tcase model.ValVector:\n\t\titems, ok := value.(model.Vector)\n\t\tif !ok {\n\t\t\treturn nil\n\t\t}\n\n\t\tfor _, item := range items {\n\t\t\tif math.IsNaN(float64(item.Value)) {\n\t\t\t\tcontinue\n\t\t\t}\n\n\t\t\tlabels := make(map[string]string)\n\t\t\tfor k, v := range item.Metric {\n\t\t\t\tlabels[string(k)] = string(v)\n\t\t\t}\n\n\t\t\tresult = append(result, &sample{\n\t\t\t\tLabels: labels,\n\t\t\t\tValue: float64(item.Value),\n\t\t\t})\n\t\t}\n\tcase model.ValMatrix:\n\t\titems, ok := value.(model.Matrix)\n\t\tif !ok {\n\t\t\treturn nil\n\t\t}\n\n\t\tfor _, item := range items {\n\t\t\tif len(item.Values) == 0 {\n\t\t\t\tcontinue\n\t\t\t}\n\n\t\t\tlast := item.Values[len(item.Values)-1]\n\t\t\tif math.IsNaN(float64(last.Value)) {\n\t\t\t\tcontinue\n\t\t\t}\n\n\t\t\tlabels := make(map[string]string)\n\t\t\tfor k, v := range item.Metric {\n\t\t\t\tlabels[string(k)] = string(v)\n\t\t\t}\n\n\t\t\tresult = append(result, &sample{\n\t\t\t\tLabels: labels,\n\t\t\t\tValue: float64(last.Value),\n\t\t\t})\n\t\t}\n\tcase model.ValScalar:\n\t\titem, ok := value.(*model.Scalar)\n\t\tif !ok {\n\t\t\treturn nil\n\t\t}\n\n\t\tif math.IsNaN(float64(item.Value)) {\n\t\t\treturn nil\n\t\t}\n\n\t\tresult = append(result, &sample{\n\t\t\tLabels: map[string]string{},\n\t\t\tValue: float64(item.Value),\n\t\t})\n\tdefault:\n\t\treturn nil\n\t}\n\n\treturn result\n}\n\nfunc MappingAndJoin(arr interface{}, prefix, suffix, join string) string {\n\tvar result []string\n\n\tswitch v := arr.(type) {\n\tcase []int:\n\t\tfor _, item := range v {\n\t\t\tresult = append(result, fmt.Sprintf(\"%v\", item))\n\t\t}\n\tcase []string:\n\t\tresult = v\n\tcase []interface{}:\n\t\tfor _, item := range v {\n\t\t\tresult = append(result, fmt.Sprintf(\"%v\", item))\n\t\t}\n\t}\n\n\tvar res []string\n\tfor _, s := range result {\n\t\tif s == \"\" {\n\t\t\tcontinue\n\t\t}\n\t\tres = append(res, prefix+s+suffix)\n\t}\n\n\tif len(res) == 0 {\n\t\treturn \"\"\n\t}\n\n\treturn strings.Join(res, join)\n}\n\nfunc StrMappingAndJoin(str, split, prefix, suffix, join string) string {\n\tarr := strings.Split(str, split)\n\treturn MappingAndJoin(arr, prefix, suffix, join)\n}\n\nfunc Ats(str string) string {\n\tif strings.Contains(str, \",\") {\n\t\tarr := strings.Split(str, \",\")\n\t\treturn MappingAndJoin(arr, \"@\", \"\", \" \")\n\t}\n\n\tif strings.Contains(str, \" \") {\n\t\tarr := strings.Split(str, \" \")\n\t\treturn MappingAndJoin(arr, \"@\", \"\", \" \")\n\t}\n\treturn str\n}\n\n// BatchContactsAts\nfunc BatchContactsAts(arr interface{}) string {\n\treturn MappingAndJoin(arr, \"@\", \"\", \" \")\n}\n\nfunc BatchContactsJsonMarshal(arr interface{}) template.HTML {\n\treturn template.HTML(\"[\" + MappingAndJoin(arr, \"\\\"\", \"\\\"\", \",\") + \"]\")\n}\n\nfunc BatchContactsJoinComma(arr interface{}) string {\n\treturn MappingAndJoin(arr, \"\", \"\", \",\")\n}\n\nfunc BatchContactsAtsInFeishuEmail(arr interface{}) template.HTML {\n\treturn template.HTML(MappingAndJoin(arr, \"  \n
\n


 \n\n如果单机版本的时序数据库(比如 Prometheus) 性能有瓶颈或容灾较差,我们推荐使用 [VictoriaMetrics](https://github.com/VictoriaMetrics/VictoriaMetrics),VictoriaMetrics 架构较为简单,性能优异,易于部署和运维,架构图如上。VictoriaMetrics 更详尽的文档,还请参考其[官网](https://victoriametrics.com/)。\n\n## 夜莺社区\n\n开源项目要更有生命力,离不开开放的治理架构和源源不断的开发者和用户共同参与,我们致力于建立开放、中立的开源治理架构,吸纳更多来自企业、高校等各方面对云原生监控感兴趣、有热情的开发者,一起打造有活力的夜莺开源社区。关于《夜莺开源项目和社区治理架构(草案)》,请查阅 [COMMUNITY GOVERNANCE](./doc/community-governance.md).\n\n**我们欢迎您以各种方式参与到夜莺开源项目和开源社区中来,工作包括不限于**:\n- 补充和完善文档 => [n9e.github.io](https://n9e.github.io/)\n- 分享您在使用夜莺监控过程中的最佳实践和经验心得 => [文章分享](https://flashcat.cloud/docs/content/flashcat-monitor/nightingale/share/)\n- 提交产品建议 =》 [github issue](https://github.com/ccfos/nightingale/issues/new?assignees=&labels=kind%2Ffeature&template=enhancement.md)\n- 提交代码,让夜莺监控更快、更稳、更好用 => [github pull request](https://github.com/ccfos/nightingale/pulls)\n\n**尊重、认可和记录每一位贡献者的工作**是夜莺开源社区的第一指导原则,我们提倡**高效的提问**,这既是对开发者时间的尊重,也是对整个社区知识沉淀的贡献:\n- 提问之前请先查阅 [FAQ](https://www.gitlink.org.cn/ccfos/nightingale/wiki/faq) \n- 我们使用[论坛](https://answer.flashcat.cloud/)进行交流,有问题可以到这里搜索、提问\n\n\n## Who is using Nightingale\n\n您可以通过在 **[Who is Using Nightingale](https://github.com/ccfos/nightingale/issues/897)** 登记您的使用情况,分享您的使用经验。\n\n## Stargazers over time\n[](https://starchart.cc/ccfos/nightingale)\n\n## Contributors\n\n
\n\n如果单机版本的时序数据库(比如 Prometheus) 性能有瓶颈或容灾较差,我们推荐使用 [VictoriaMetrics](https://github.com/VictoriaMetrics/VictoriaMetrics),VictoriaMetrics 架构较为简单,性能优异,易于部署和运维,架构图如上。VictoriaMetrics 更详尽的文档,还请参考其[官网](https://victoriametrics.com/)。\n\n## 夜莺社区\n\n开源项目要更有生命力,离不开开放的治理架构和源源不断的开发者和用户共同参与,我们致力于建立开放、中立的开源治理架构,吸纳更多来自企业、高校等各方面对云原生监控感兴趣、有热情的开发者,一起打造有活力的夜莺开源社区。关于《夜莺开源项目和社区治理架构(草案)》,请查阅 [COMMUNITY GOVERNANCE](./doc/community-governance.md).\n\n**我们欢迎您以各种方式参与到夜莺开源项目和开源社区中来,工作包括不限于**:\n- 补充和完善文档 => [n9e.github.io](https://n9e.github.io/)\n- 分享您在使用夜莺监控过程中的最佳实践和经验心得 => [文章分享](https://flashcat.cloud/docs/content/flashcat-monitor/nightingale/share/)\n- 提交产品建议 =》 [github issue](https://github.com/ccfos/nightingale/issues/new?assignees=&labels=kind%2Ffeature&template=enhancement.md)\n- 提交代码,让夜莺监控更快、更稳、更好用 => [github pull request](https://github.com/ccfos/nightingale/pulls)\n\n**尊重、认可和记录每一位贡献者的工作**是夜莺开源社区的第一指导原则,我们提倡**高效的提问**,这既是对开发者时间的尊重,也是对整个社区知识沉淀的贡献:\n- 提问之前请先查阅 [FAQ](https://www.gitlink.org.cn/ccfos/nightingale/wiki/faq) \n- 我们使用[论坛](https://answer.flashcat.cloud/)进行交流,有问题可以到这里搜索、提问\n\n\n## Who is using Nightingale\n\n您可以通过在 **[Who is Using Nightingale](https://github.com/ccfos/nightingale/issues/897)** 登记您的使用情况,分享您的使用经验。\n\n## Stargazers over time\n[](https://starchart.cc/ccfos/nightingale)\n\n## Contributors\n\n  \n"
},
{
"path": "doc/active-contributors.md",
"content": "## Active Contributors\n\n- [xiaoziv](https://github.com/xiaoziv)\n- [tanxiao1990](https://github.com/tanxiao1990)\n- [bbaobelief](https://github.com/bbaobelief)\n- [freedomkk-qfeng](https://github.com/freedomkk-qfeng)\n- [lsy1990](https://github.com/lsy1990)\n"
},
{
"path": "doc/committers.md",
"content": "## Committers\n\n- [YeningQin](https://github.com/710leo)\n- [FeiKong](https://github.com/kongfei605)\n- [XiaqingDai](https://github.com/jsers)\n"
},
{
"path": "doc/community-governance.md",
"content": "[夜莺监控](https://github.com/ccfos/nightingale \"夜莺监控\")是一款开源云原生监控系统,由滴滴设计开发,2020 年 3 月份开源之后,凭借其优秀的产品设计、灵活性架构和明确清晰的定位,夜莺监控快速发展为国内最活跃的企业级云原生监控方案。[截止当前](具体指2022年8月 \"截止当前\"),在 [Github](https://github.com/ccfos/nightingale \"Github\") 上已经迭代发布了 **70** 多个版本,获得了 **5K** 多个 Star,**80** 多位代码贡献者。快速的迭代,也让夜莺监控的用户群越来越大,涉及各行各业。\n\n更进一步,夜莺监控于 2022 年 5 月 11 日,正式捐赠予中国计算机学会开源发展委员会 [CCF ODC](https://www.ccf.org.cn/kyfzwyh/ \"CCF ODC\"),为 CCF ODC 成立后接受捐赠的第一个开源项目。\n\n开源项目要更有生命力,离不开开放的治理架构和源源不断的开发者共同参与。夜莺监控项目加入 CCF 开源大家庭后,能在计算机学会的支持和带动下,进一步结合云原生、可观测、国产化等多个技术发展的需求,建立开放、中立的开源治理架构,打造更专业、有活力的开发者社区。\n\n**今天,我们郑重发布夜莺监控开源社区治理架构,并公示相关的任命和社区荣誉,期待开源的道路上,一起同行。**\n\n# 夜莺监控开源社区架构\n\n### User|用户\n\n> 欢迎任何个人、公司以及组织,使用夜莺监控,并积极的反馈 bug、提交功能需求、以及相互帮助,我们推荐使用 [Github Issue](https://github.com/ccfos/nightingale/issues \"Github Issue\") 来跟踪 bug 和管理需求。\n\n社区用户,可以通过在 **[Who is Using Nightingale](https://github.com/ccfos/nightingale/issues/897 \"Who is Using Nightingale\")** 登记您的使用情况,并分享您使用夜莺监控的经验,将会自动进入 **[END USERS](https://github.com/ccfos/nightingale/blob/main/doc/end-users.md \"END USERS\")** 文件列表,并获得社区的 **VIP Support**。\n\n### Contributor|贡献者\n\n> 欢迎每一位用户,包括但不限于以下方式参与到夜莺开源社区并做出贡献:\n\n1. 在 [Github Issue](https://github.com/ccfos/nightingale/issues \"Github Issue\") 中积极参与讨论,参与社区活动;\n1. 提交代码补丁;\n1. 翻译、修订、补充和完善[文档](https://n9e.github.io \"文档\");\n1. 分享夜莺监控的使用经验,积极布道;\n1. 提交建议 / 批评;\n\n年度累计向 [CCFOS/NIGHTINGALE](https://github.com/ccfos/nightingale \"CCFOS/NIGHTINGALE\") 提交 **5** 个PR(被合并),或者因为其他贡献被**项目管委会**一致认可,将会自动进入到 **[ACTIVE CONTRIBUTORS](https://github.com/ccfos/nightingale/blob/main/doc/active-contributors.md \"ACTIVE CONTRIBUTORS\")** 列表,并获得夜莺开源社区颁发的证书,享有夜莺开源社区一定的权益和福利。\n\n所有向 [CCFOS/NIGHTINGALE](https://github.com/ccfos/nightingale \"CCFOS/NIGHTINGALE\") 提交过PR(被合并),或者做出过重要贡献的 Contributor,都会被永久记载于 [CONTRIBUTORS](https://github.com/ccfos/nightingale/blob/main/doc/contributors.md \"CONTRIBUTORS\") 列表。\n\n### Committer|提交者\n\n> Committer 是指拥有 [CCFOS/NIGHTINGALE](https://github.com/ccfos/nightingale \"CCFOS/NIGHTINGALE\") 代码仓库写操作权限的贡献者。原则上 Committer 能够自主决策某个代码补丁是否可以合入到夜莺代码仓库,但是项目管委会拥有最终的决策权。\n\nCommitter 承担以下一个或多个职责:\n- 积极回应 Issues;\n- Review PRs;\n- 参加开发者例行会议,积极讨论项目规划和技术方案;\n- 代表夜莺开源社区出席相关技术会议并做演讲;\n\nCommitter 记录并公示于 **[COMMITTERS](https://github.com/ccfos/nightingale/blob/main/doc/committers.md \"COMMITTERS\")** 列表,并获得夜莺开源社区颁发的证书,以及享有夜莺开源社区的各种权益和福利。\n\n\n### PMC|项目管委会\n\n> PMC(项目管委会)作为一个实体,来管理和领导夜莺项目,为整个项目的发展全权负责。项目管委会相关内容记录并公示于文件[PMC](https://github.com/ccfos/nightingale/blob/main/doc/pmc.md \"PMC\").\n\n- 项目管委会成员(PMC Member),从 Contributor 或者 Committer 中选举产生,他们拥有 [CCFOS/NIGHTINGALE](https://github.com/ccfos/nightingale \"CCFOS/NIGHTINGALE\") 代码仓库的写操作权限,拥有 Nightingale 社区相关事务的投票权、以及提名 Committer 候选人的权利。\n- 项目管委会主席(PMC Chair),从项目管委会成员中投票产生。管委会主席是 **[CCF ODC](https://www.ccf.org.cn/kyfzwyh/ \"CCF ODC\")** 和项目管委会之间的沟通桥梁,履行特定的项目管理职责。\n\n## Communication|沟通机制\n1. 我们推荐使用邮件列表来反馈建议(待发布);\n2. 我们推荐使用 [Github Issue](https://github.com/ccfos/nightingale/issues \"Github Issue\") 跟踪 bug 和管理需求;\n3. 我们推荐使用 [Github Milestone](https://github.com/ccfos/nightingale/milestones \"Github Milestone\") 来管理项目进度和规划;\n4. 我们推荐使用腾讯会议来定期召开项目例会(会议 ID 待发布);\n\n## Documentation|文档\n1. 我们推荐使用 [Github Pages](https://n9e.github.io \"Github Pages\") 来沉淀文档;\n2. 我们推荐使用 [Gitlink Wiki](https://www.gitlink.org.cn/ccfos/nightingale/wiki/faq \"Gitlink Wiki\") 来沉淀 FAQ;\n\n\n## Operation|运营机制\n\n1. 我们定期组织用户、贡献者、项目管委会成员之间的沟通会议,讨论项目开发的目标、方案、进度,以及讨论相关需求的合理性、优先级等议题;\n2. 我们定期组织 meetup (线上&线下),创造良好的用户交流分享环境,并沉淀相关内容到文档站点;\n3. 我们定期组织夜莺开发者大会,分享 [best user story](https://n9e.github.io/docs/prologue/share/ \"best user story\")、同步年度开发目标和计划、讨论新技术方向等;\n\n## Philosophy|社区指导原则\n\n>尊重、认可和记录每一位贡献者的工作。\n\n## 关于提问的原则\n\n按照**尊重、认可、记录每一位贡献者的工作**原则,我们提倡**高效的提问**,这既是对开发者时间的尊重,也是对整个社区的知识沉淀的贡献:\n\n1. 提问之前请先查阅 [FAQ](https://www.gitlink.org.cn/ccfos/nightingale/wiki/faq \"FAQ\") ;\n2. 提问之前请先搜索 [Github Issues](https://github.com/ccfos/nightingale/issues \"Github Issue\");\n3. 我们优先推荐通过提交 [Github Issue](https://github.com/ccfos/nightingale/issues \"Github Issue\") 来提问,如果[有问题点击这里](https://github.com/ccfos/nightingale/issues/new?assignees=&labels=kind%2Fbug&template=bug_report.yml \"有问题点击这里\") | [有需求建议点击这里](https://github.com/ccfos/nightingale/issues/new?assignees=&labels=kind%2Ffeature&template=enhancement.md \"有需求建议点击这里\");\n\n"
},
{
"path": "doc/contributors.md",
"content": "## Contributors\n\n\n
\n"
},
{
"path": "doc/active-contributors.md",
"content": "## Active Contributors\n\n- [xiaoziv](https://github.com/xiaoziv)\n- [tanxiao1990](https://github.com/tanxiao1990)\n- [bbaobelief](https://github.com/bbaobelief)\n- [freedomkk-qfeng](https://github.com/freedomkk-qfeng)\n- [lsy1990](https://github.com/lsy1990)\n"
},
{
"path": "doc/committers.md",
"content": "## Committers\n\n- [YeningQin](https://github.com/710leo)\n- [FeiKong](https://github.com/kongfei605)\n- [XiaqingDai](https://github.com/jsers)\n"
},
{
"path": "doc/community-governance.md",
"content": "[夜莺监控](https://github.com/ccfos/nightingale \"夜莺监控\")是一款开源云原生监控系统,由滴滴设计开发,2020 年 3 月份开源之后,凭借其优秀的产品设计、灵活性架构和明确清晰的定位,夜莺监控快速发展为国内最活跃的企业级云原生监控方案。[截止当前](具体指2022年8月 \"截止当前\"),在 [Github](https://github.com/ccfos/nightingale \"Github\") 上已经迭代发布了 **70** 多个版本,获得了 **5K** 多个 Star,**80** 多位代码贡献者。快速的迭代,也让夜莺监控的用户群越来越大,涉及各行各业。\n\n更进一步,夜莺监控于 2022 年 5 月 11 日,正式捐赠予中国计算机学会开源发展委员会 [CCF ODC](https://www.ccf.org.cn/kyfzwyh/ \"CCF ODC\"),为 CCF ODC 成立后接受捐赠的第一个开源项目。\n\n开源项目要更有生命力,离不开开放的治理架构和源源不断的开发者共同参与。夜莺监控项目加入 CCF 开源大家庭后,能在计算机学会的支持和带动下,进一步结合云原生、可观测、国产化等多个技术发展的需求,建立开放、中立的开源治理架构,打造更专业、有活力的开发者社区。\n\n**今天,我们郑重发布夜莺监控开源社区治理架构,并公示相关的任命和社区荣誉,期待开源的道路上,一起同行。**\n\n# 夜莺监控开源社区架构\n\n### User|用户\n\n> 欢迎任何个人、公司以及组织,使用夜莺监控,并积极的反馈 bug、提交功能需求、以及相互帮助,我们推荐使用 [Github Issue](https://github.com/ccfos/nightingale/issues \"Github Issue\") 来跟踪 bug 和管理需求。\n\n社区用户,可以通过在 **[Who is Using Nightingale](https://github.com/ccfos/nightingale/issues/897 \"Who is Using Nightingale\")** 登记您的使用情况,并分享您使用夜莺监控的经验,将会自动进入 **[END USERS](https://github.com/ccfos/nightingale/blob/main/doc/end-users.md \"END USERS\")** 文件列表,并获得社区的 **VIP Support**。\n\n### Contributor|贡献者\n\n> 欢迎每一位用户,包括但不限于以下方式参与到夜莺开源社区并做出贡献:\n\n1. 在 [Github Issue](https://github.com/ccfos/nightingale/issues \"Github Issue\") 中积极参与讨论,参与社区活动;\n1. 提交代码补丁;\n1. 翻译、修订、补充和完善[文档](https://n9e.github.io \"文档\");\n1. 分享夜莺监控的使用经验,积极布道;\n1. 提交建议 / 批评;\n\n年度累计向 [CCFOS/NIGHTINGALE](https://github.com/ccfos/nightingale \"CCFOS/NIGHTINGALE\") 提交 **5** 个PR(被合并),或者因为其他贡献被**项目管委会**一致认可,将会自动进入到 **[ACTIVE CONTRIBUTORS](https://github.com/ccfos/nightingale/blob/main/doc/active-contributors.md \"ACTIVE CONTRIBUTORS\")** 列表,并获得夜莺开源社区颁发的证书,享有夜莺开源社区一定的权益和福利。\n\n所有向 [CCFOS/NIGHTINGALE](https://github.com/ccfos/nightingale \"CCFOS/NIGHTINGALE\") 提交过PR(被合并),或者做出过重要贡献的 Contributor,都会被永久记载于 [CONTRIBUTORS](https://github.com/ccfos/nightingale/blob/main/doc/contributors.md \"CONTRIBUTORS\") 列表。\n\n### Committer|提交者\n\n> Committer 是指拥有 [CCFOS/NIGHTINGALE](https://github.com/ccfos/nightingale \"CCFOS/NIGHTINGALE\") 代码仓库写操作权限的贡献者。原则上 Committer 能够自主决策某个代码补丁是否可以合入到夜莺代码仓库,但是项目管委会拥有最终的决策权。\n\nCommitter 承担以下一个或多个职责:\n- 积极回应 Issues;\n- Review PRs;\n- 参加开发者例行会议,积极讨论项目规划和技术方案;\n- 代表夜莺开源社区出席相关技术会议并做演讲;\n\nCommitter 记录并公示于 **[COMMITTERS](https://github.com/ccfos/nightingale/blob/main/doc/committers.md \"COMMITTERS\")** 列表,并获得夜莺开源社区颁发的证书,以及享有夜莺开源社区的各种权益和福利。\n\n\n### PMC|项目管委会\n\n> PMC(项目管委会)作为一个实体,来管理和领导夜莺项目,为整个项目的发展全权负责。项目管委会相关内容记录并公示于文件[PMC](https://github.com/ccfos/nightingale/blob/main/doc/pmc.md \"PMC\").\n\n- 项目管委会成员(PMC Member),从 Contributor 或者 Committer 中选举产生,他们拥有 [CCFOS/NIGHTINGALE](https://github.com/ccfos/nightingale \"CCFOS/NIGHTINGALE\") 代码仓库的写操作权限,拥有 Nightingale 社区相关事务的投票权、以及提名 Committer 候选人的权利。\n- 项目管委会主席(PMC Chair),从项目管委会成员中投票产生。管委会主席是 **[CCF ODC](https://www.ccf.org.cn/kyfzwyh/ \"CCF ODC\")** 和项目管委会之间的沟通桥梁,履行特定的项目管理职责。\n\n## Communication|沟通机制\n1. 我们推荐使用邮件列表来反馈建议(待发布);\n2. 我们推荐使用 [Github Issue](https://github.com/ccfos/nightingale/issues \"Github Issue\") 跟踪 bug 和管理需求;\n3. 我们推荐使用 [Github Milestone](https://github.com/ccfos/nightingale/milestones \"Github Milestone\") 来管理项目进度和规划;\n4. 我们推荐使用腾讯会议来定期召开项目例会(会议 ID 待发布);\n\n## Documentation|文档\n1. 我们推荐使用 [Github Pages](https://n9e.github.io \"Github Pages\") 来沉淀文档;\n2. 我们推荐使用 [Gitlink Wiki](https://www.gitlink.org.cn/ccfos/nightingale/wiki/faq \"Gitlink Wiki\") 来沉淀 FAQ;\n\n\n## Operation|运营机制\n\n1. 我们定期组织用户、贡献者、项目管委会成员之间的沟通会议,讨论项目开发的目标、方案、进度,以及讨论相关需求的合理性、优先级等议题;\n2. 我们定期组织 meetup (线上&线下),创造良好的用户交流分享环境,并沉淀相关内容到文档站点;\n3. 我们定期组织夜莺开发者大会,分享 [best user story](https://n9e.github.io/docs/prologue/share/ \"best user story\")、同步年度开发目标和计划、讨论新技术方向等;\n\n## Philosophy|社区指导原则\n\n>尊重、认可和记录每一位贡献者的工作。\n\n## 关于提问的原则\n\n按照**尊重、认可、记录每一位贡献者的工作**原则,我们提倡**高效的提问**,这既是对开发者时间的尊重,也是对整个社区的知识沉淀的贡献:\n\n1. 提问之前请先查阅 [FAQ](https://www.gitlink.org.cn/ccfos/nightingale/wiki/faq \"FAQ\") ;\n2. 提问之前请先搜索 [Github Issues](https://github.com/ccfos/nightingale/issues \"Github Issue\");\n3. 我们优先推荐通过提交 [Github Issue](https://github.com/ccfos/nightingale/issues \"Github Issue\") 来提问,如果[有问题点击这里](https://github.com/ccfos/nightingale/issues/new?assignees=&labels=kind%2Fbug&template=bug_report.yml \"有问题点击这里\") | [有需求建议点击这里](https://github.com/ccfos/nightingale/issues/new?assignees=&labels=kind%2Ffeature&template=enhancement.md \"有需求建议点击这里\");\n\n"
},
{
"path": "doc/contributors.md",
"content": "## Contributors\n\n\n