Repository: gecko984/supervenn
Branch: master
Commit: 9eb89d491d6b
Files: 10
Total size: 87.6 KB
Directory structure:
gitextract_yk_3vfu5/
├── .gitignore
├── LICENSE
├── README.md
├── setup.py
├── supervenn/
│ ├── __init__.py
│ ├── _algorithms.py
│ ├── _plots.py
│ └── _utils.py
└── tests/
├── test_algorithms.py
└── test_plots.py
================================================
FILE CONTENTS
================================================
================================================
FILE: .gitignore
================================================
# Byte-compiled / optimized / DLL files
__pycache__/
*.py[cod]
*$py.class
# C extensions
*.so
# Distribution / packaging
.Python
build/
develop-eggs/
dist/
downloads/
eggs/
.eggs/
lib/
lib64/
parts/
sdist/
var/
wheels/
pip-wheel-metadata/
share/python-wheels/
*.egg-info/
.installed.cfg
*.egg
MANIFEST
# PyInstaller
# Usually these files are written by a python script from a template
# before PyInstaller builds the exe, so as to inject date/other infos into it.
*.manifest
*.spec
# Installer logs
pip-log.txt
pip-delete-this-directory.txt
# Unit test / coverage reports
htmlcov/
.tox/
.nox/
.coverage
.coverage.*
.cache
nosetests.xml
coverage.xml
*.cover
*.py,cover
.hypothesis/
.pytest_cache/
# Translations
*.mo
*.pot
# Django stuff:
*.log
local_settings.py
db.sqlite3
db.sqlite3-journal
# Flask stuff:
instance/
.webassets-cache
# Scrapy stuff:
.scrapy
# Sphinx documentation
docs/_build/
# PyBuilder
target/
# Jupyter Notebook
.ipynb_checkpoints
# IPython
profile_default/
ipython_config.py
# pyenv
.python-version
# pipenv
# According to pypa/pipenv#598, it is recommended to include Pipfile.lock in version control.
# However, in case of collaboration, if having platform-specific dependencies or dependencies
# having no cross-platform support, pipenv may install dependencies that don't work, or not
# install all needed dependencies.
#Pipfile.lock
# PEP 582; used by e.g. github.com/David-OConnor/pyflow
__pypackages__/
# Celery stuff
celerybeat-schedule
celerybeat.pid
# SageMath parsed files
*.sage.py
# Environments
.env
.venv
env/
venv/
ENV/
env.bak/
venv.bak/
# Spyder project settings
.spyderproject
.spyproject
# Rope project settings
.ropeproject
# mkdocs documentation
/site
# mypy
.mypy_cache/
.dmypy.json
dmypy.json
# Pyre type checker
.pyre/
# Pycharm
.idea
# Macos
.DS_Store
================================================
FILE: LICENSE
================================================
MIT License
Copyright (c) 2019 Fedor Indukaev
Permission is hereby granted, free of charge, to any person obtaining a copy
of this software and associated documentation files (the "Software"), to deal
in the Software without restriction, including without limitation the rights
to use, copy, modify, merge, publish, distribute, sublicense, and/or sell
copies of the Software, and to permit persons to whom the Software is
furnished to do so, subject to the following conditions:
The above copyright notice and this permission notice shall be included in all
copies or substantial portions of the Software.
THE SOFTWARE IS PROVIDED "AS IS", WITHOUT WARRANTY OF ANY KIND, EXPRESS OR
IMPLIED, INCLUDING BUT NOT LIMITED TO THE WARRANTIES OF MERCHANTABILITY,
FITNESS FOR A PARTICULAR PURPOSE AND NONINFRINGEMENT. IN NO EVENT SHALL THE
AUTHORS OR COPYRIGHT HOLDERS BE LIABLE FOR ANY CLAIM, DAMAGES OR OTHER
LIABILITY, WHETHER IN AN ACTION OF CONTRACT, TORT OR OTHERWISE, ARISING FROM,
OUT OF OR IN CONNECTION WITH THE SOFTWARE OR THE USE OR OTHER DEALINGS IN THE
SOFTWARE.
================================================
FILE: README.md
================================================
[](https://doi.org/10.5281/zenodo.4016732)
# supervenn: precise and easy-to-read multiple sets visualization in Python
### What it is
**supervenn** is a matplotlib-based tool for visualization of any number of intersecting sets. It supports Python
`set`s as inputs natively, but there is a [simple workaround](#use-intersection-sizes-as-inputs-instead-of-sets) to use just intersection sizes.
Note that despite its name, `supervenn` does not produce actual (Euler-)Venn diagrams.
The easiest way to understand how supervenn diagrams work, is to compare some simple examples to their Euler-Venn
counterparts. Top row is Euler-Venn diagrams made with [matplotlib-venn](https://github.com/konstantint/matplotlib-venn)
package, bottom row is supervenn diagrams:
 ### Installation
`pip install supervenn`
### Requirements
Python 2.7 or 3.6+ with `numpy`, `matplotlib` and `pandas`.
### Basic usage
The main entry point is the eponymous `supervenn` function. It takes a list of python `set`s as its first and only
required argument and returns a `SupervennPlot` object.
```python
from supervenn import supervenn
sets = [{1, 2, 3, 4}, {3, 4, 5}, {1, 6, 7, 8}]
supervenn(sets, side_plots=False)
```
### Installation
`pip install supervenn`
### Requirements
Python 2.7 or 3.6+ with `numpy`, `matplotlib` and `pandas`.
### Basic usage
The main entry point is the eponymous `supervenn` function. It takes a list of python `set`s as its first and only
required argument and returns a `SupervennPlot` object.
```python
from supervenn import supervenn
sets = [{1, 2, 3, 4}, {3, 4, 5}, {1, 6, 7, 8}]
supervenn(sets, side_plots=False)
```
 Each row represents a set, the order from bottom to top is the same as in the `sets` list. Overlapping parts correspond
to set intersections.
The numbers at the bottom show the sizes (cardinalities) of all intersections, which we will call **chunks**.
The sizes of sets and their intersections (chunks) are up to proportion, but the order of elements is not preserved,
e.g. the leftmost chunk of size 3 is `{6, 7, 8}`.
A combinatorial optimization algorithms is applied that rearranges the chunks (the columns of the
array plotted) to minimize the number of parts the sets are broken into. In the example above each set is in one piece
( no gaps in rows at all), but it's not always possible, even for three sets:
```python
supervenn([{1, 2}, {2, 3}, {1, 3}], side_plots=False)
```
Each row represents a set, the order from bottom to top is the same as in the `sets` list. Overlapping parts correspond
to set intersections.
The numbers at the bottom show the sizes (cardinalities) of all intersections, which we will call **chunks**.
The sizes of sets and their intersections (chunks) are up to proportion, but the order of elements is not preserved,
e.g. the leftmost chunk of size 3 is `{6, 7, 8}`.
A combinatorial optimization algorithms is applied that rearranges the chunks (the columns of the
array plotted) to minimize the number of parts the sets are broken into. In the example above each set is in one piece
( no gaps in rows at all), but it's not always possible, even for three sets:
```python
supervenn([{1, 2}, {2, 3}, {1, 3}], side_plots=False)
```
 By default, additional *side plots* are also displayed:
```python
supervenn(sets)
```
By default, additional *side plots* are also displayed:
```python
supervenn(sets)
```
 Here, the numbers on the right are the set sizes (cardinalities), and numbers on the top show how many sets does this
intersection make part of. The grey bars represent the same numbers visually.
If you need only one of the two side plots, use `side_plots='top'` or `side_plots='right'`
### Features (how to)
#### Use intersection sizes as inputs instead of sets
(New in 0.5.0). Use the utility function `make_sets_from_chunk_sizes` to produce synthetic sets of integers from your intersection sizes.
Then pass these sets to `supervenn()`:
```python
from supervenn import supervenn, make_sets_from_chunk_sizes
sets, labels = make_sets_from_chunk_sizes(sizes_df) # see below for the structure of sizes_df
supervenn(sets, labels)
```
Intersection sizes `sizes_df` should be a `pandas.DataFrame` with the following structure:
- For `N` sets, it must have `N` boolean (or 0/1) columns and the last column must be integer, so `N+1` columns in total.
- Each row represents a unique intersection (chunk) of the sets. The boolean value in column `set_x` indicate whether
this chunk lies within `set_x`. The integer value represents the size of the chunk.
For example, consider the following dataframe
```
set_1 set_2 set_3 size
0 False True True 1
1 True False False 3
2 True False True 2
3 True True False 1
```
It represents a configuration of three sets such that
- [row 0] there is one element that lies in `set_2` and `set_3` but not in `set_1`,
- [row 1] there are three elements that lie in `set_1` only and not in `set_2` or `set_3`,
- etc two more rows.
#### Add custom set annotations instead of `set_1`, `set_2` etc
Use the `set_annotations` argument to pass a list of annotations. It should be in the same order as the sets. It is
the second positional argument.
```python
sets = [{1, 2, 3, 4}, {3, 4, 5}, {1, 6, 7, 8}]
labels = ['alice', 'bob', 'third party']
supervenn(sets, labels)
```
Here, the numbers on the right are the set sizes (cardinalities), and numbers on the top show how many sets does this
intersection make part of. The grey bars represent the same numbers visually.
If you need only one of the two side plots, use `side_plots='top'` or `side_plots='right'`
### Features (how to)
#### Use intersection sizes as inputs instead of sets
(New in 0.5.0). Use the utility function `make_sets_from_chunk_sizes` to produce synthetic sets of integers from your intersection sizes.
Then pass these sets to `supervenn()`:
```python
from supervenn import supervenn, make_sets_from_chunk_sizes
sets, labels = make_sets_from_chunk_sizes(sizes_df) # see below for the structure of sizes_df
supervenn(sets, labels)
```
Intersection sizes `sizes_df` should be a `pandas.DataFrame` with the following structure:
- For `N` sets, it must have `N` boolean (or 0/1) columns and the last column must be integer, so `N+1` columns in total.
- Each row represents a unique intersection (chunk) of the sets. The boolean value in column `set_x` indicate whether
this chunk lies within `set_x`. The integer value represents the size of the chunk.
For example, consider the following dataframe
```
set_1 set_2 set_3 size
0 False True True 1
1 True False False 3
2 True False True 2
3 True True False 1
```
It represents a configuration of three sets such that
- [row 0] there is one element that lies in `set_2` and `set_3` but not in `set_1`,
- [row 1] there are three elements that lie in `set_1` only and not in `set_2` or `set_3`,
- etc two more rows.
#### Add custom set annotations instead of `set_1`, `set_2` etc
Use the `set_annotations` argument to pass a list of annotations. It should be in the same order as the sets. It is
the second positional argument.
```python
sets = [{1, 2, 3, 4}, {3, 4, 5}, {1, 6, 7, 8}]
labels = ['alice', 'bob', 'third party']
supervenn(sets, labels)
```
 #### Change size and dpi of the plot
Create a new figure and plot into it:
```python
import matplotlib.pyplot as plt
plt.figure(figsize=(16, 8))
supervenn(sets)
```
The `supervenn` function has `figsize` and `dpi` arguments, but they are **deprecated** and will be removed in a future
version. Please don't use them.
#### Plot into an existing axis
Use the `ax` argument:
```python
supervenn(sets, ax=my_axis)
```
#### Access the figure and axes objects of the plot
Use `.figure` and `axes` attributes of the object returned by `supervenn()`. The `axes` attribute is
organized as a dict with descriptive strings for keys: `main`, `top_side_plot`, `right_side_plot`, `unused`.
If `side_plots=False`, the dict has only one key `main`.
#### Save the plot to an image file
```python
import matplotlib.pyplot as plt
supervenn(sets)
plt.savefig('myplot.png')
```
#### Use a different ordering of chunks (columns)
Use the `chunks_ordering` argument. The following options are available:
- `'minimize gaps'`: default, use an optimization algorithm to find an order of columns with fewer
gaps in each row;
- `'size'`: bigger chunks go first;
- `'occurrence'`: chunks that are in more sets go first;
- `'random'`: randomly shuffle the columns.
To reverse the order (e.g. you want smaller chunks to go first), pass `reverse_chunks_order=False` (by default
it's `True`)
#### Reorder the sets (rows) instead of keeping the order as passed into function
Use the `sets_ordering` argument. The following options are available:
- `None`: default - keep the order of sets as passed into function;
- `'minimize gaps'`: use the same algorithm as for chunks to group similar sets closer together. The difference in the
algorithm is that now gaps are minimized in columns instead of rows, and they are weighted by the column widths
(i.e. chunk sizes), as we want to minimize total gap width;
- `'size'`: bigger sets go first;
- `'chunk count'`: sets that contain most chunks go first;
- `'random'`: randomly shuffle the rows.
To reverse the order (e.g. you want smaller sets to go first), pass `reverse_sets_order=False` (by default
it's `True`)
#### Inspect the chunks' contents
`supervenn(sets, ...)` returns a `SupervennPlot` object, which has a `chunks` attribute.
It is a `dict` with `frozenset`s of set indices as keys, and chunks as values. For example,
`my_supervenn_object.chunks[frozenset([0, 2])]` is the chunk with all the items that are in `sets[0]` and
`sets[2]`, but not in any of the other sets.
There is also a `get_chunk(set_indices)` method that is slightly more convenient, because you
can pass a `list` or any other iterable of indices instead of a `frozenset`. For example:
`my_supervenn_object.get_chunk([0, 2])`.
If you have a good idea of a more convenient method of chunks lookup, let me know and I'll
implement it as well.
#### Make the plot prettier if sets and/or chunks are very different in size
Use the `widths_minmax_ratio` argument, with a value between 0.01 and 1. Consider the following example
```python
sets = [set(range(200)), set(range(201)), set(range(203)), set(range(206))]
supervenn(sets, side_plots=False)
```
#### Change size and dpi of the plot
Create a new figure and plot into it:
```python
import matplotlib.pyplot as plt
plt.figure(figsize=(16, 8))
supervenn(sets)
```
The `supervenn` function has `figsize` and `dpi` arguments, but they are **deprecated** and will be removed in a future
version. Please don't use them.
#### Plot into an existing axis
Use the `ax` argument:
```python
supervenn(sets, ax=my_axis)
```
#### Access the figure and axes objects of the plot
Use `.figure` and `axes` attributes of the object returned by `supervenn()`. The `axes` attribute is
organized as a dict with descriptive strings for keys: `main`, `top_side_plot`, `right_side_plot`, `unused`.
If `side_plots=False`, the dict has only one key `main`.
#### Save the plot to an image file
```python
import matplotlib.pyplot as plt
supervenn(sets)
plt.savefig('myplot.png')
```
#### Use a different ordering of chunks (columns)
Use the `chunks_ordering` argument. The following options are available:
- `'minimize gaps'`: default, use an optimization algorithm to find an order of columns with fewer
gaps in each row;
- `'size'`: bigger chunks go first;
- `'occurrence'`: chunks that are in more sets go first;
- `'random'`: randomly shuffle the columns.
To reverse the order (e.g. you want smaller chunks to go first), pass `reverse_chunks_order=False` (by default
it's `True`)
#### Reorder the sets (rows) instead of keeping the order as passed into function
Use the `sets_ordering` argument. The following options are available:
- `None`: default - keep the order of sets as passed into function;
- `'minimize gaps'`: use the same algorithm as for chunks to group similar sets closer together. The difference in the
algorithm is that now gaps are minimized in columns instead of rows, and they are weighted by the column widths
(i.e. chunk sizes), as we want to minimize total gap width;
- `'size'`: bigger sets go first;
- `'chunk count'`: sets that contain most chunks go first;
- `'random'`: randomly shuffle the rows.
To reverse the order (e.g. you want smaller sets to go first), pass `reverse_sets_order=False` (by default
it's `True`)
#### Inspect the chunks' contents
`supervenn(sets, ...)` returns a `SupervennPlot` object, which has a `chunks` attribute.
It is a `dict` with `frozenset`s of set indices as keys, and chunks as values. For example,
`my_supervenn_object.chunks[frozenset([0, 2])]` is the chunk with all the items that are in `sets[0]` and
`sets[2]`, but not in any of the other sets.
There is also a `get_chunk(set_indices)` method that is slightly more convenient, because you
can pass a `list` or any other iterable of indices instead of a `frozenset`. For example:
`my_supervenn_object.get_chunk([0, 2])`.
If you have a good idea of a more convenient method of chunks lookup, let me know and I'll
implement it as well.
#### Make the plot prettier if sets and/or chunks are very different in size
Use the `widths_minmax_ratio` argument, with a value between 0.01 and 1. Consider the following example
```python
sets = [set(range(200)), set(range(201)), set(range(203)), set(range(206))]
supervenn(sets, side_plots=False)
```
 Annotations in the bottom left corner are unreadable.
One solution is to trade exact chunk proportionality for readability. This is done by making small chunks visually
larger. To be exact, a linear function is applied to the chunk sizes, with slope and intercept chosen so that the
smallest chunk size is exactly `widths_minmax_ratio` times the largest chunk size. If the ratio is already greater than
this value, the sizes are left unchanged. Setting `widths_minmax_ratio=1` will result in all chunks being displayed as
same size.
```python
supervenn(sets, side_plots=False, widths_minmax_ratio=0.05)
```
The image now looks clean, but chunks of size 1 to 3 look almost the same.
Annotations in the bottom left corner are unreadable.
One solution is to trade exact chunk proportionality for readability. This is done by making small chunks visually
larger. To be exact, a linear function is applied to the chunk sizes, with slope and intercept chosen so that the
smallest chunk size is exactly `widths_minmax_ratio` times the largest chunk size. If the ratio is already greater than
this value, the sizes are left unchanged. Setting `widths_minmax_ratio=1` will result in all chunks being displayed as
same size.
```python
supervenn(sets, side_plots=False, widths_minmax_ratio=0.05)
```
The image now looks clean, but chunks of size 1 to 3 look almost the same.
 #### Avoid clutter in the X axis annotations
- Use the `min_width_for_annotation` argument to hide annotations for chunks smaller than this value.
```python
supervenn(sets, side_plots=False, min_width_for_annotation=100)
```
#### Avoid clutter in the X axis annotations
- Use the `min_width_for_annotation` argument to hide annotations for chunks smaller than this value.
```python
supervenn(sets, side_plots=False, min_width_for_annotation=100)
```
 - Pass `rotate_col_annotations=True` to print chunk sizes vertically.
- There's also `col_annotations_ys_count` argument, but it is **deprecated** and will be removed in a future version.
#### Change bars appearance in the main plot
Use arguments `bar_height` (default `1`), `bar_alpha` (default `0.6`), `bar_align` (default `edge`)', `color_cycle` (
default is current style's default palette). You can also use styles, for example:
```python
import matplotlib.pyplot as plt
with plt.style.context('bmh'):
supervenn([{1,2,3}, {3,4}])
```
- Pass `rotate_col_annotations=True` to print chunk sizes vertically.
- There's also `col_annotations_ys_count` argument, but it is **deprecated** and will be removed in a future version.
#### Change bars appearance in the main plot
Use arguments `bar_height` (default `1`), `bar_alpha` (default `0.6`), `bar_align` (default `edge`)', `color_cycle` (
default is current style's default palette). You can also use styles, for example:
```python
import matplotlib.pyplot as plt
with plt.style.context('bmh'):
supervenn([{1,2,3}, {3,4}])
```
 #### Change side plots size and color
Use `side_plot_width` (in inches, default 1) and `side_plot_color` (default `'tab:gray'`) arguments.
#### Change axes labels from `SETS`, `ITEMS` to something else
Just use `plt.xlabel` and `plt.ylabel` as usual.
#### Change other parameters
Other arguments can be found in the docstring to the function.
### Algorithm used to minimize gaps
If there are are no more than 8 chunks, the optimal permutation is found with exhaustive search (you can increase this
limit up to 12 using the `max_bruteforce_size` argument). For greater chunk counts, a randomized quasi-greedy algorithm
is applied. The description of the algorithm can be found in the docstring to `supervenn._algorithms` module.
### Less trivial examples:
#### Words with many meanings
```python
letters = {'a', 'r', 'c', 'i', 'z'}
programming_languages = {'python', 'r', 'c', 'c++', 'java', 'julia'}
animals = {'python', 'buffalo', 'turkey', 'cat', 'dog', 'robin'}
geographic_places = {'java', 'buffalo', 'turkey', 'moscow'}
names = {'robin', 'julia', 'alice', 'bob', 'conrad'}
green_things = {'python', 'grass'}
sets = [letters, programming_languages, animals, geographic_places, names, green_things]
labels = ['letters', 'programming languages', 'animals', 'geographic places',
'human names', 'green things']
plt.figure(figsize=(10, 6))
supervenn(sets, labels , sets_ordering='minimize gaps')
```
#### Change side plots size and color
Use `side_plot_width` (in inches, default 1) and `side_plot_color` (default `'tab:gray'`) arguments.
#### Change axes labels from `SETS`, `ITEMS` to something else
Just use `plt.xlabel` and `plt.ylabel` as usual.
#### Change other parameters
Other arguments can be found in the docstring to the function.
### Algorithm used to minimize gaps
If there are are no more than 8 chunks, the optimal permutation is found with exhaustive search (you can increase this
limit up to 12 using the `max_bruteforce_size` argument). For greater chunk counts, a randomized quasi-greedy algorithm
is applied. The description of the algorithm can be found in the docstring to `supervenn._algorithms` module.
### Less trivial examples:
#### Words with many meanings
```python
letters = {'a', 'r', 'c', 'i', 'z'}
programming_languages = {'python', 'r', 'c', 'c++', 'java', 'julia'}
animals = {'python', 'buffalo', 'turkey', 'cat', 'dog', 'robin'}
geographic_places = {'java', 'buffalo', 'turkey', 'moscow'}
names = {'robin', 'julia', 'alice', 'bob', 'conrad'}
green_things = {'python', 'grass'}
sets = [letters, programming_languages, animals, geographic_places, names, green_things]
labels = ['letters', 'programming languages', 'animals', 'geographic places',
'human names', 'green things']
plt.figure(figsize=(10, 6))
supervenn(sets, labels , sets_ordering='minimize gaps')
```
 And this is how the figure would look without the smart column reordering algorithm:
 #### Banana genome compared to 5 other species
[Data courtesy of Jake R Conway, Alexander Lex, Nils Gehlenborg - creators of UpSet](https://github.com/hms-dbmi/UpSetR-paper/blob/master/bananaPlot.R)
Image from [D’Hont, A., Denoeud, F., Aury, J. et al. The banana (Musa acuminata) genome and the evolution of
monocotyledonous plants](https://www.nature.com/articles/nature11241)
Figure from original article (note that it is by no means proportional!):
#### Banana genome compared to 5 other species
[Data courtesy of Jake R Conway, Alexander Lex, Nils Gehlenborg - creators of UpSet](https://github.com/hms-dbmi/UpSetR-paper/blob/master/bananaPlot.R)
Image from [D’Hont, A., Denoeud, F., Aury, J. et al. The banana (Musa acuminata) genome and the evolution of
monocotyledonous plants](https://www.nature.com/articles/nature11241)
Figure from original article (note that it is by no means proportional!):
 Figure made with [UpSetR](https://caleydo.org/tools/upset/)
 Figure made with supervenn (using the `widths_minmax_ratio` argument)
```python
plt.figure(figsize=(20, 10))
supervenn(sets_list, species_names, widths_minmax_ratio=0.1,
sets_ordering='minimize gaps', rotate_col_annotations=True, col_annotations_area_height=1.2)
```
Figure made with supervenn (using the `widths_minmax_ratio` argument)
```python
plt.figure(figsize=(20, 10))
supervenn(sets_list, species_names, widths_minmax_ratio=0.1,
sets_ordering='minimize gaps', rotate_col_annotations=True, col_annotations_area_height=1.2)
```
 For comparison, here's the same data visualized to scale (no `widths_minmax_ratio`, but argument
`min_width_for_annotation` is used instead to avoid column annotations overlap):
```python
plt.figure(figsize=(20, 10))
supervenn(sets_list, species_names, rotate_col_annotations=True,
col_annotations_area_height=1.2, sets_ordering='minimize gaps',
min_width_for_annotation=180)
```
For comparison, here's the same data visualized to scale (no `widths_minmax_ratio`, but argument
`min_width_for_annotation` is used instead to avoid column annotations overlap):
```python
plt.figure(figsize=(20, 10))
supervenn(sets_list, species_names, rotate_col_annotations=True,
col_annotations_area_height=1.2, sets_ordering='minimize gaps',
min_width_for_annotation=180)
```
 It must be noted that `supervenn` produces best results when there is some inherent structure to the sets in question.
This typically means that the number of non-empty intersections is significantly lower than the maximum possible
(which is `2^n_sets - 1`). This is not the case in the present example, as 62 of the 63 intersections are non-empty,
hence the results are not that pretty.
#### Order IDs in requests to a multiple vehicle routing problem solver
This was actually my motivation in creating this package. The team I'm currently working in provides an API that solves
a variation of the Multiple Vehicles Routing Problem. The API solves tasks of the form
"Given 1000 delivery orders each with lat, lon, time window and weight, and 50 vehicles each with capacity and work
shift, distribute the orders between the vehicles and build an optimal route for each vehicle".
A given client can send tens of such requests per day and sometimes it is useful to look at their requests and
understand how they are related to each other in terms of what orders are included in each of the requests. Are they
sending the same task over and over again - a sign that they are not satisfied with routes they get and they might need
our help in using the API? Are they manually editing the routes (a process that results in more requests to our API, with
only the orders from affected routes included)? Or are they solving for several independent order sets and are happy
with each individual result?
We can use `supervenn` with some custom annotations to look at sets of order IDs in each of the client's requests.
Here's an example of an OK but not perfect client's workday:
It must be noted that `supervenn` produces best results when there is some inherent structure to the sets in question.
This typically means that the number of non-empty intersections is significantly lower than the maximum possible
(which is `2^n_sets - 1`). This is not the case in the present example, as 62 of the 63 intersections are non-empty,
hence the results are not that pretty.
#### Order IDs in requests to a multiple vehicle routing problem solver
This was actually my motivation in creating this package. The team I'm currently working in provides an API that solves
a variation of the Multiple Vehicles Routing Problem. The API solves tasks of the form
"Given 1000 delivery orders each with lat, lon, time window and weight, and 50 vehicles each with capacity and work
shift, distribute the orders between the vehicles and build an optimal route for each vehicle".
A given client can send tens of such requests per day and sometimes it is useful to look at their requests and
understand how they are related to each other in terms of what orders are included in each of the requests. Are they
sending the same task over and over again - a sign that they are not satisfied with routes they get and they might need
our help in using the API? Are they manually editing the routes (a process that results in more requests to our API, with
only the orders from affected routes included)? Or are they solving for several independent order sets and are happy
with each individual result?
We can use `supervenn` with some custom annotations to look at sets of order IDs in each of the client's requests.
Here's an example of an OK but not perfect client's workday:
 Rows from bottom to top are requests to our API from earlier to later, represented by their sets of order IDs.
We see that they solved a big task at 10:54, were not satisfied with the result, and applied some manual edits until
11:11. Then in the evening they re-solved the whole task twice over, probably with some change in parameters.
Here's a perfect day:
Rows from bottom to top are requests to our API from earlier to later, represented by their sets of order IDs.
We see that they solved a big task at 10:54, were not satisfied with the result, and applied some manual edits until
11:11. Then in the evening they re-solved the whole task twice over, probably with some change in parameters.
Here's a perfect day:
 They solved three unrelated tasks and were happy with each (no repeated requests, no manual edits; each order is
distributed only once).
And here's a rather extreme example of a client whose scheme of operation involves sending requests to our API every
15-30 minutes to account for live updates on newly created orders and couriers' GPS positions.
They solved three unrelated tasks and were happy with each (no repeated requests, no manual edits; each order is
distributed only once).
And here's a rather extreme example of a client whose scheme of operation involves sending requests to our API every
15-30 minutes to account for live updates on newly created orders and couriers' GPS positions.
 ### Comparison to similar tools
#### [matplotlib-venn](https://github.com/konstantint/matplotlib-venn)
This tool plots area-weighted Venn diagrams with circles for two or three sets. But the problem with circles
is that they are pretty useless even in the case of three sets. For example, if one set is symmetrical difference of the
other two:
```python
from matplotlib_venn import venn3
set_1 = {1, 2, 3, 4}
set_2 = {3, 4, 5}
set_3 = set_1 ^ set_2
venn3([set_1, set_2, set_3], set_colors=['steelblue', 'orange', 'green'], alpha=0.8)
```
### Comparison to similar tools
#### [matplotlib-venn](https://github.com/konstantint/matplotlib-venn)
This tool plots area-weighted Venn diagrams with circles for two or three sets. But the problem with circles
is that they are pretty useless even in the case of three sets. For example, if one set is symmetrical difference of the
other two:
```python
from matplotlib_venn import venn3
set_1 = {1, 2, 3, 4}
set_2 = {3, 4, 5}
set_3 = set_1 ^ set_2
venn3([set_1, set_2, set_3], set_colors=['steelblue', 'orange', 'green'], alpha=0.8)
```
 See all that zeros? This image makes little sense. The `supervenn`'s approach to this problem is to allow the sets to be
broken into separate parts, while trying to minimize the number of such breaks and guaranteeing exact proportionality of
all parts:
See all that zeros? This image makes little sense. The `supervenn`'s approach to this problem is to allow the sets to be
broken into separate parts, while trying to minimize the number of such breaks and guaranteeing exact proportionality of
all parts:
 #### [UpSetR and pyUpSet](https://caleydo.org/tools/upset/)
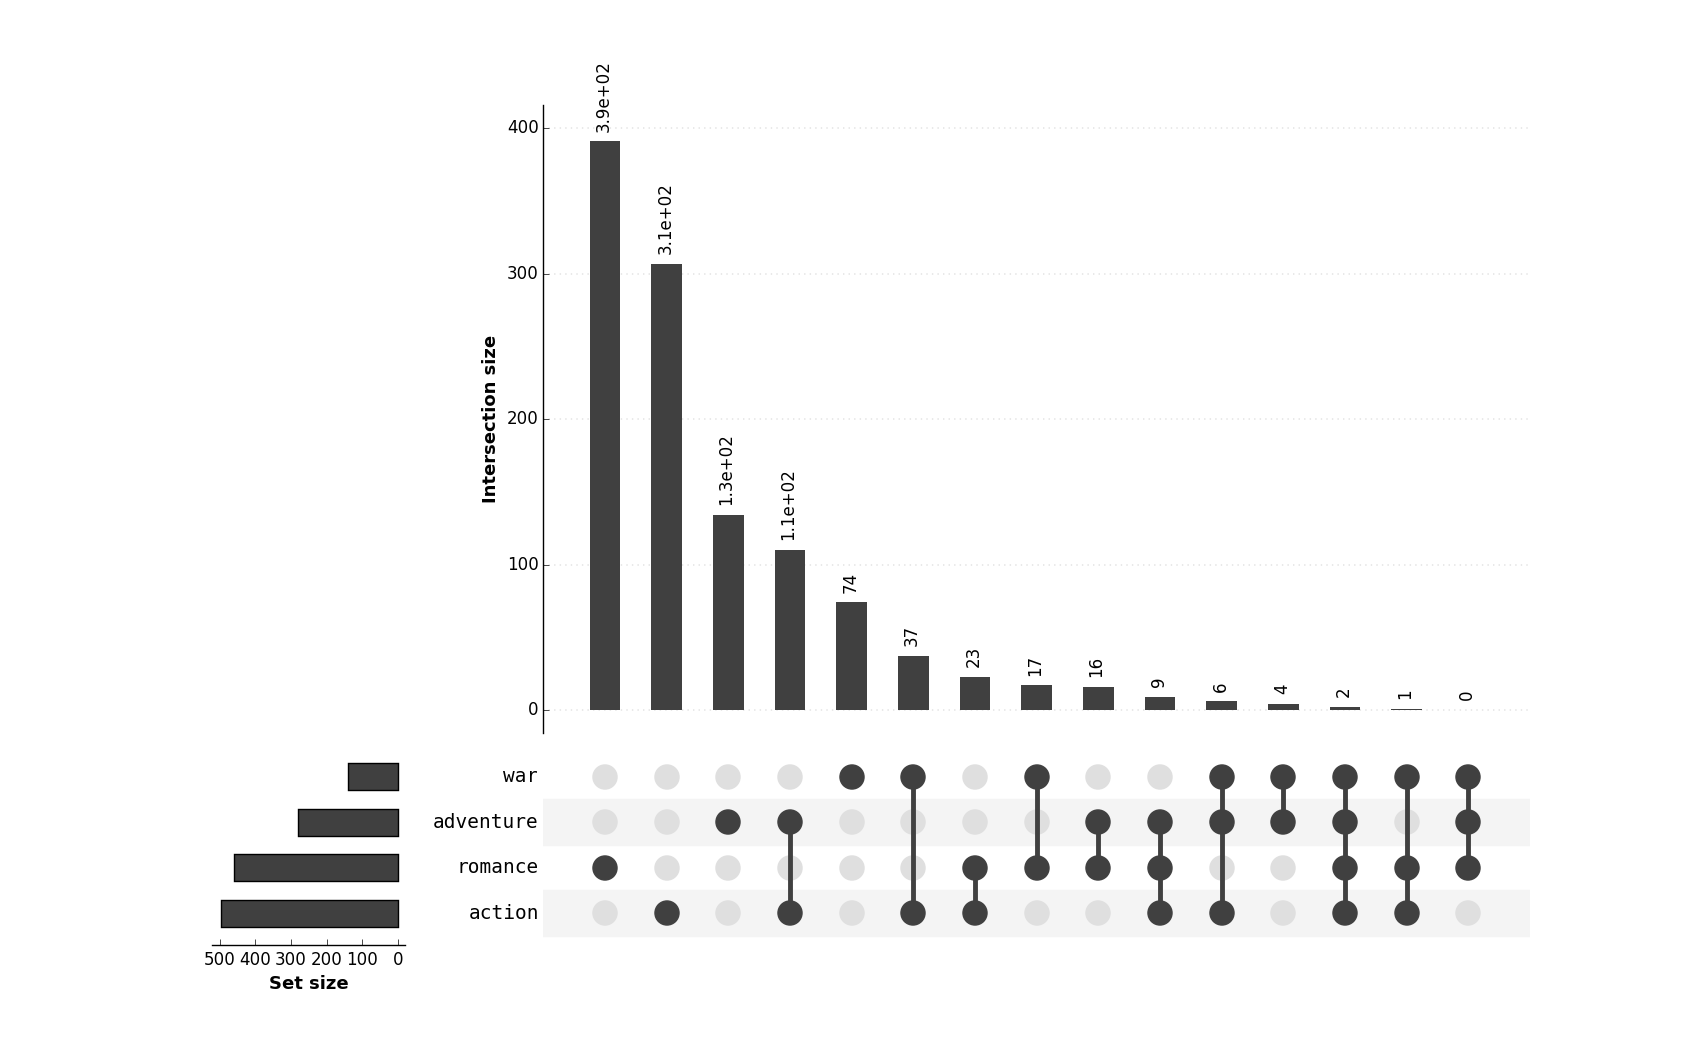 This approach, while very powerful, is less visual, as it displays, so to say only _statistics about_ the sets, not the
sets in flesh.
#### [pyvenn](https://raw.githubusercontent.com/wiki/tctianchi/pyvenn)
This approach, while very powerful, is less visual, as it displays, so to say only _statistics about_ the sets, not the
sets in flesh.
#### [pyvenn](https://raw.githubusercontent.com/wiki/tctianchi/pyvenn)
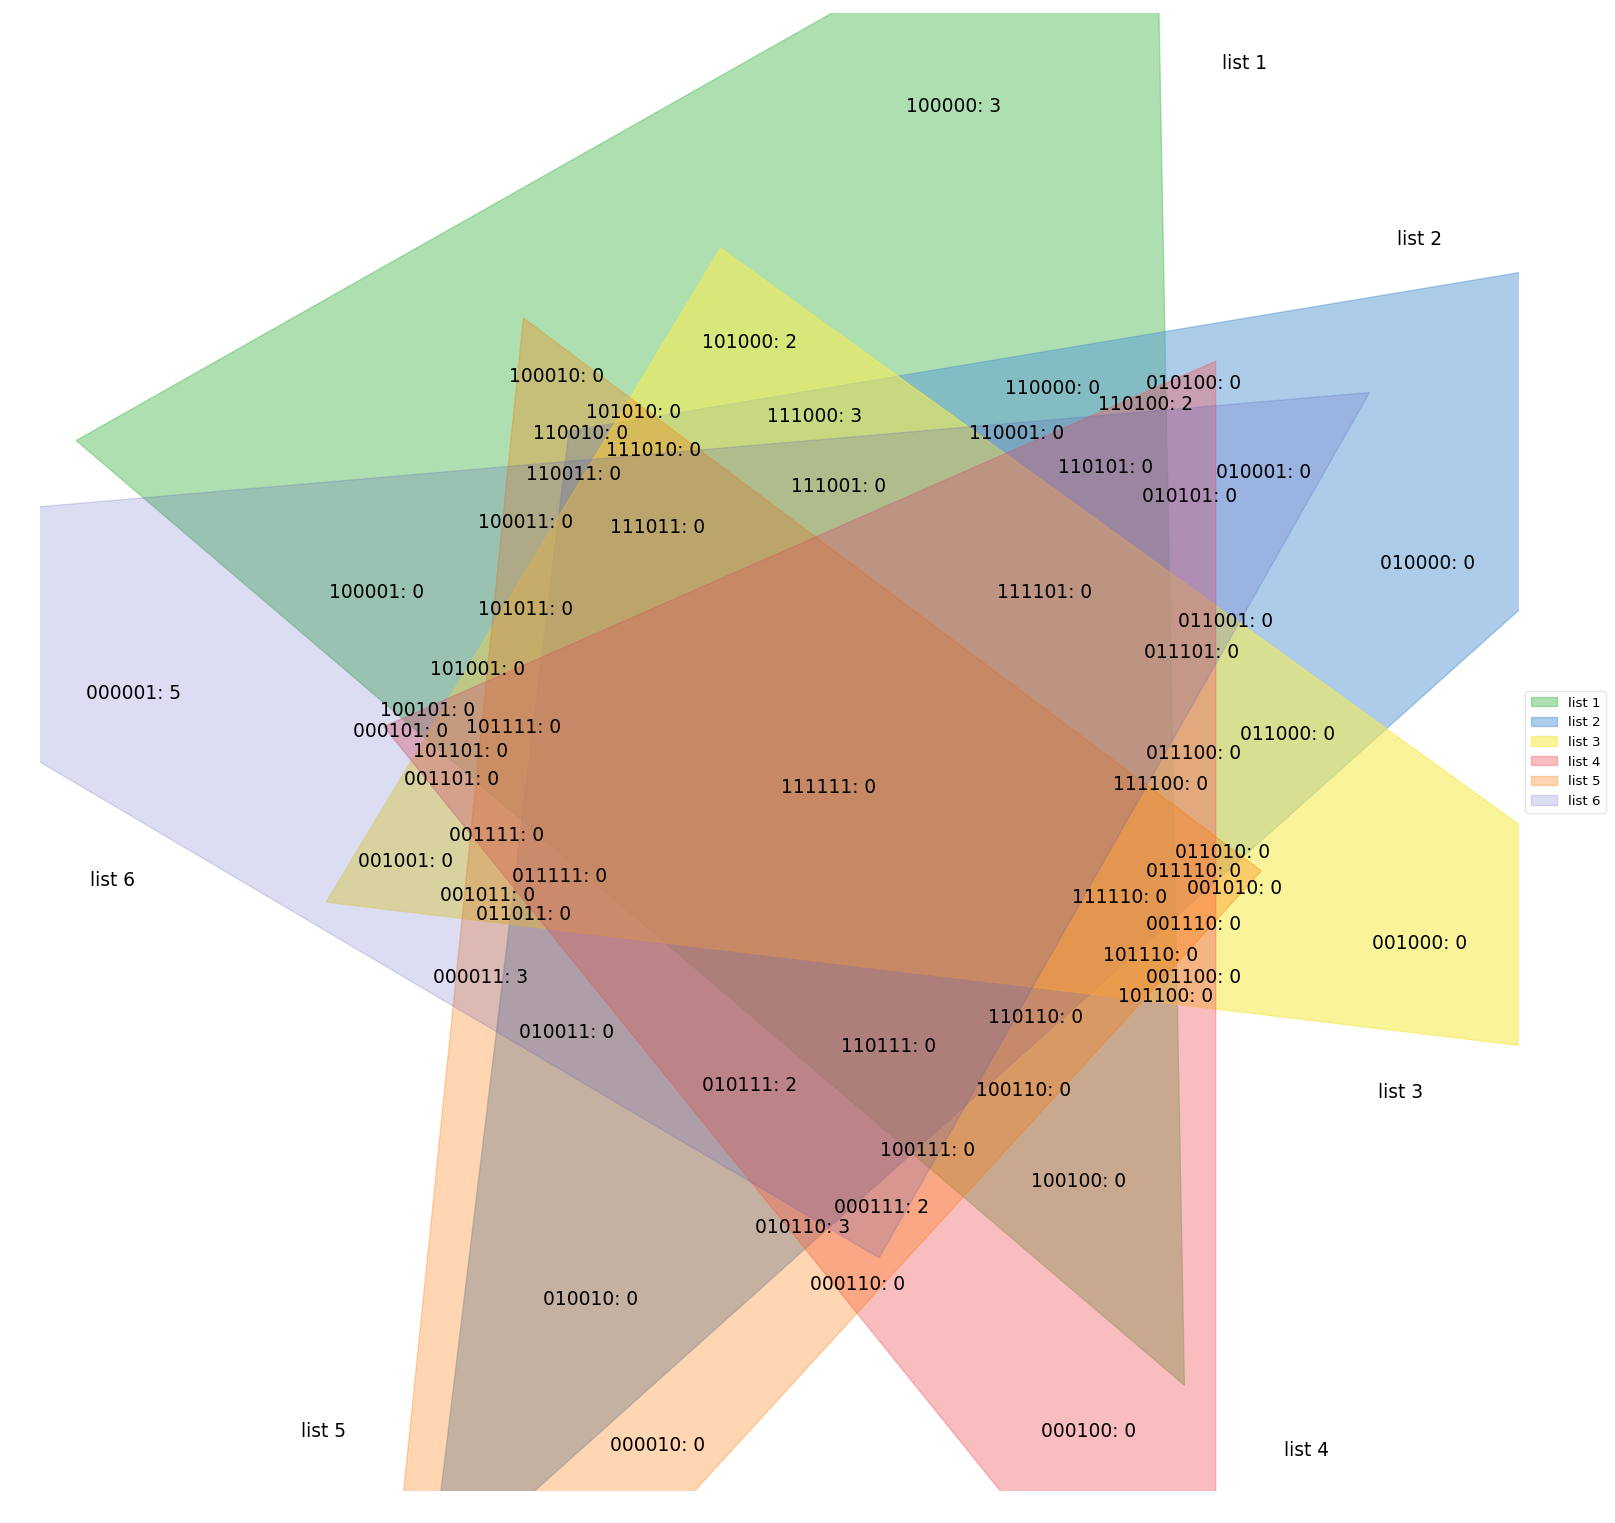 This package produces diagrams for up to 6 sets, but they are not in any way proportional. It just has pre-set images
for every given sets count, your actual sets only affect the labels that are placed on top of the fixed image,
not unlike the banana diagram above.
#### [RainBio](http://www.lesfleursdunormal.fr/static/appliweb/rainbio/index.html) ([article](https://hal.archives-ouvertes.fr/hal-02264217/document))
This approach is quite similar to supervenn. I'll let the reader decide which one does the job better:
##### RainBio:
This package produces diagrams for up to 6 sets, but they are not in any way proportional. It just has pre-set images
for every given sets count, your actual sets only affect the labels that are placed on top of the fixed image,
not unlike the banana diagram above.
#### [RainBio](http://www.lesfleursdunormal.fr/static/appliweb/rainbio/index.html) ([article](https://hal.archives-ouvertes.fr/hal-02264217/document))
This approach is quite similar to supervenn. I'll let the reader decide which one does the job better:
##### RainBio:
 ##### supervenn:
_Thanks to Dr. Bilal Alsallakh for referring me to this work_
#### [Linear Diagram Generator](https://www.cs.kent.ac.uk/people/staff/pjr/linear/index.html?abstractDescription=programming_languages+1%0D%0Aletters+programming_languages+2%0D%0Aprogramming_languages+animals+green_things+1%0D%0Ageographic_places+1%0D%0Aletters+3%0D%0Ahuman_names+3%0D%0Agreen_things+1%0D%0Aprogramming_languages+geographic_places+1%0D%0Aanimals+2%0D%0Aanimals+geographic_places+2%0D%0Aanimals+human_names+1%0D%0Aprogramming_languages+human_names+1%0D%0A&width=700&height=250&guides=lines)
This tool has a similar concept, but only available as a Javascript web app with minimal functionality, and you have to
compute all the intersection sizes yourself. Apparently there is also an columns rearrangement algorithm in place, but
the target function (number of gaps within sets) is higher than in the diagram made with supervenn.
##### supervenn:
_Thanks to Dr. Bilal Alsallakh for referring me to this work_
#### [Linear Diagram Generator](https://www.cs.kent.ac.uk/people/staff/pjr/linear/index.html?abstractDescription=programming_languages+1%0D%0Aletters+programming_languages+2%0D%0Aprogramming_languages+animals+green_things+1%0D%0Ageographic_places+1%0D%0Aletters+3%0D%0Ahuman_names+3%0D%0Agreen_things+1%0D%0Aprogramming_languages+geographic_places+1%0D%0Aanimals+2%0D%0Aanimals+geographic_places+2%0D%0Aanimals+human_names+1%0D%0Aprogramming_languages+human_names+1%0D%0A&width=700&height=250&guides=lines)
This tool has a similar concept, but only available as a Javascript web app with minimal functionality, and you have to
compute all the intersection sizes yourself. Apparently there is also an columns rearrangement algorithm in place, but
the target function (number of gaps within sets) is higher than in the diagram made with supervenn.
 _Thanks to [u/aboutscientific](https://www.reddit.com/user/aboutscientific/) for the link._
### Credits
This package was created and is maintained by [Fedor Indukaev](https://www.linkedin.com/in/fedor-indukaev-4a52961b/).
You can contact me on Gmail and Telegram by the same username as on github.
### How can I help?
- If you like supervenn, you can click the star at the top of the page and tell other people about this tool
- If you have an idea or even an implementation of a algorithm for matrix columns rearrangement, I'll be happy to try
it, as my current algorithm is quite primitive. (The problem in question is almost the traveling salesman problem in
Hamming metric).
- If you are a Python developer, you can help by reviewing the code in any way that is convenient to you.
- If you found a bug or have a feature request, you can submit them via the
[Issues section](https://github.com/gecko984/supervenn/issues).
================================================
FILE: setup.py
================================================
# -*- coding: utf-8 -*-
# python setup.py sdist bdist_wheel
# python2 setup.py sdist bdist_wheel
# twine upload dist/*
import setuptools
with open('README.md') as f:
README = f.read()
setuptools.setup(
author='Fedor Indukaev',
author_email='gecko984@gmail.com',
name='supervenn',
license='MIT',
description='supervenn is a tool for visualization of relations of many sets using matplotlib',
version='0.5.0',
long_description='See https://github.com/gecko984/supervenn/blob/master/README.md',
url='https://github.com/gecko984/supervenn',
packages=setuptools.find_packages(),
install_requires=['numpy', 'matplotlib>=2.2.5', 'pandas'],
classifiers=[
'Development Status :: 3 - Alpha',
'License :: OSI Approved :: MIT License',
'Programming Language :: Python',
'Programming Language :: Python :: 2.7',
'Programming Language :: Python :: 3.6',
'Programming Language :: Python :: 3.7',
'Programming Language :: Python :: 3.8',
'Programming Language :: Python :: 3.9',
'Programming Language :: Python :: 3.10',
'Programming Language :: Python :: 3.11',
'Topic :: Scientific/Engineering :: Visualization',
'Topic :: Scientific/Engineering :: Information Analysis',
'Intended Audience :: Science/Research',
'Intended Audience :: Developers'
]
)
================================================
FILE: supervenn/__init__.py
================================================
from supervenn._algorithms import (
get_chunks_and_composition_array,
get_permutations
)
from supervenn._plots import supervenn
from supervenn._utils import make_sets_from_chunk_sizes
================================================
FILE: supervenn/_algorithms.py
================================================
# -*- coding: utf-8 -*-
"""
supervenn._algorithms
This module implements all the algorithms used to prepare data for plotting.
~~~~~~~~~~~
A semi-formal explanation of what is going on here
==================================================
CHUNKS
Consider a three-way Venn diagram, shown below using squares rather than the usual circles, for obvious reasons.
It is easy to see that the three squares S1, S2, S3 break each other into seven elementary undivided parts, which we
will name :chunks:. The 7 chunks are marked as ch1 - ch7.
*-------S1-------*
| |
| ch1 |
*-----|---------* |
| | ch4 | |
| | | |
| | *-----|------|-----*
| | | ch7 | ch5 | |
S2 | | | | |
| *---|-----|------* |
| | | |
| ch2 | ch6 | S3
*---------|-----* |
| ch3 |
| |
*------------------*
The number 7 is easily derived by the following simple consideration. Each chunk is defined by a unique
subset of {S1, S2, S3}. For example, chunk ch4 is defined by {S1, S2} - it consists of exactly the points that lie
inside S1 and S2, but outside of S3. So the number of chunks is 2^3 - 1, 2^3 being the number of possible subsets of
{S1, S2, S3}, and -1 being for the empty set which has no business being among our chunks.
Note that, depending on how the three squares are positioned, there can be less chunks then 7. For instance, if the
three squares are disjoint, the number of chunks will be 3, as each square will be a chunk in itself.
What is important for us about the chunks, is that they are like the elementary building blocks of our
configuration of squares. In other words, we can represent any of the squares as a disjoint union of some of the
chunks. Also any combination of the squares w.r.t. the set-theoretical operations of intersection, union and
difference can be represented in the same way.
Now let's move from squares on the plane to abstract finite sets. The same line of reasoning leads us to
the conclusion that for N sets S1, ..., SN, there exist at most 2^N - 1 chunks (sets), such that any of the sets
(and any combination of the sets w.r.t union, intersection and difference) can be uniquely represented as the
disjoint union of several of the chunks.
COMPOSITION ARRAY
Suppose we have N sets S1, ..., SN, and we have found the chunks ch1, ... chM. As we said above, each of the sets
can be uniquely represented as a disjoint union of some of the chunks. Suppose we have found such decompositions for
all of the sets.
Now, represent the decompositions as a N x M array of zeros and ones, where the i,j-th item is 1 <=> set S_i
contains chunk ch_j. We'll call this array the :composition array: of our sets.
For example, for the squares above, the composition array will look like this:
ch1 ch2 ch3 ch4 ch5 ch6 ch7
S1 1 0 0 1 1 0 1 -> Square 1 is made up of chunks ch1, ch4, ch5 and ch7
S2 0 1 0 1 0 1 1
S3 0 0 1 0 1 1 1
Note that since chunks are something we've just made up by ourselves, they don't have to be ordered in any
particular way. This means that we can reorder the chunks (= the columns if the composition array) if we
need to.
Most part of the present module is actually about finding a permutations of the columns, that will minimize the
number of gaps between the 1's in all the rows of the array, so that the sets are visually broken into as few parts
as possible.
For the array above, we see that there are 5 total zero-filled gaps between ones: one in the first row, two in the
second, one in the third. But if we find and apply the right permutation of columns, we'll have only one gap between
the 1's in the whole array, highlighted by asterisks below:
ch1 ch4 ch2 ch6 ch7 ch5 ch3
S1 1 1 *0* 1 1 0 0
S2 0 1 1 1 1 0 0
S3 0 0 0 1 1 1 1
When there are few chunks (say, no more than 8) the optimal permutations is easily found in a bruteforce manner by
checking all the possible permutations. But for a greater number of chunks this would take too long. So instead an
approximate greedy algorithm with randomization is used. It is implemented in the run_randomized_greedy_algorithm()
function. The algorithm will be described below.
REORDERING THE ROWS / SETS
Unlike the order of chunks, the order of sets can be relevant in some cases. For example, our sets sets may relate
to different moments in time, and we may deem it important to preserve this temporal structure in the plot. But in
other cases when there is no inherent order to our sets, we might want to reorder the sets (rows of the composition
array) so that similar sets are closer to each other.
This is done by running the same algorithm on the transposed array. But there is an important distinction here: the
chunks are of different size, and it makes more sense to minimize total gap width, instead of just gap count.
To allow that, the run_randomized_greedy_algorithm() function accepts an additional argument named :row_weights:,
and minimizes gap counts weighted with these coefficients. In other words, the minimization target becomes
sum_i(gaps_count_in_row[i] * row_weights[i]) instead of just sum_i(gaps_count_in_row[i]).
DESCRIPTION OF THE ALGORITHM
Recall that our goal is to a find a permutation of columns of a matrix of zeros and ones, so that the row-weighted
sum of gaps counts in rows is as low as possible.
Define similarity of two columns as the sum of row weights for rows where the values are equal in the two columns.
Precompute matrix of similarities of all columns (if arr has N columns, this matrix has shape N x N)
Find two most similar columns C1, C2, initialize two lists [C1,] and [C2,]
Among the remaining N-2 columns, find one that has largest similarity to either of C1 or C2. Append that column to
the corresponding list. E.g. we now have lists [C1, C3] and [C2,]
Among the remaining N-3 columns find one that has largest similarity to the last elemt of either of the lists (in
our example, C3 and C2). Append it to the corresponding list.
Continue until all columns are distributed between in two lists.
Finally, one of the lists is reversed and the other is concatenated to it on the right, which gives the resulting
permutation. This concludes the greedy algorithm.
To mitigate the greediness, the similarity matrix is perturbed by means of adding a random matrix R with
elements {0, noise_value} with a fixed probability of non-zero, and the whole greedy procedure is repeated.
This is done with :seeds: different random matrices, and so :seeds: + 1 permutations are obtained (including the one
produced from the unperturbed similarities matrix). The permutation that yields the smallest value
of count_runs_of_ones_in_rows(arr[:, permutation]) is returned.
"""
from collections import defaultdict
import datetime
from itertools import permutations
import warnings
import numpy as np
HUGE_NUMBER = 1e10 # can fail for weighted! FIXME
DEFAULT_MAX_BRUTEFORCE_SIZE = 8
BRUTEFORCE_SIZE_HARD_LIMIT = 12
DEFAULT_SEEDS = 10000
DEFAULT_NOISE_PROB = 0.0075
DEFAULT_MAX_NOISE = 1.1
def get_total_gaps_in_rows(arr, row_weights=None):
"""
In a numpy.array arr, count how many gaps of zeros are there between contigous runs of non-zero values in each row.
The counts in each row are multiplied by weights given by row_weights array and summed. By default, all row weights
are equal to 1, so the returned value is just the total count of gaps in rows.
:param arr: 2D numpy.array, all that matters is which elements are zero and which are not.
:param row_weights: 1D numpy array with len equal to len(arr), provides weights for each row.
:return: weighted sum of number of gaps in rows.
"""
if row_weights is None:
row_weights = np.ones(len(arr), dtype=int)
if len(arr) != len(row_weights):
raise ValueError('len(row_weights) == {} != {} == len(arr)'.format(len(row_weights), len(arr)))
arr = arr.astype(bool)
# Shift array to the left, dropping last column and appending column of zeros on the left.
shifted_arr = np.concatenate([np.zeros(len(arr), dtype=bool).reshape((-1, 1)), arr[:, :-1]], 1)
rowwise_runs_counts = (arr & (~shifted_arr)).sum(1)
rowwise_gaps_counts = np.maximum(rowwise_runs_counts - 1, 0)
return rowwise_gaps_counts.dot(row_weights)
def break_into_chunks(sets):
"""
Let us have a collection {S_1, ..., S_n} of finite sets and U be the union of all these sets.
For a given subset C = {i_1, ..., i_k} of indices {1, ..., n}, define the 'chunk', corresponding to C, as the set
of elements of U, that belong to S_i_1, ..., S_i_k, but not to any of the other sets.
For example, for a collection of two sets {S_1, S_2}, there can be max three chunks: S_1 - S_2, S_2 - S_1, S1 & S_2.
For three sets, there can be max 7 chunks (imagine a generic three-way Venn diagram and count how many different
area colors it can have).
In general, the number of possible non-empty chunks for a collection of n sets is equal to min(|U|, 2^n - 1).
Any chunk either lies completely inside any or completely outside any of the sets S_1, ... S_n.
This function takes a list of sets as its only argument and returns a dict with frozensets of indices as keys and
chunks as values.
:param sets: list of sets
:return: chunks_dict - dict with frozensets as keys and sets as values.
"""
if not sets:
raise ValueError('Sets list is empty.')
all_items = set.union(*sets)
if not all_items:
raise ValueError('All sets are empty')
# Each chunk is characterized by its occurrence pattern, which is a unique subset of indices of our sets.
# E.g. chunk with signature {1, 2, 5} is exactly the set of items such that they belong to sets 1, 2, 5, and
# don't belong to any of the other sets.
# Build a dict with signatures as keys (as frozensets), and lists of items as values,
chunks_dict = defaultdict(set)
for item in all_items:
occurrence_pattern = frozenset({i for i, set_ in enumerate(sets) if item in set_})
chunks_dict[occurrence_pattern].add(item)
return dict(chunks_dict)
def get_chunks_and_composition_array(sets):
"""
Take
- list of all chunks (each chunk is a set of items)
- a numpy.array A of zeros and ones with len(sets) rows and len(chunks) columns,
where A[i, j] == 1 <=> sets[i] includes chunks[j].
:param sets: list of sets
:return: chunks - list of sets, arr - numpy.array, chunks_dict - dict w
"""
chunks_dict = break_into_chunks(sets)
chunks_count = len(chunks_dict)
chunks = []
arr = np.zeros((len(sets), chunks_count), dtype=int)
for idx, (sets_indices, items) in enumerate(chunks_dict.items()):
chunks.append(items)
arr[list(sets_indices), idx] = 1
return chunks, arr
def find_best_columns_permutation_bruteforce(arr, row_weights=None):
"""
Using exhaustive search, find permutation of columns of np.array arr that will provide minimum value of weighted sum
of gaps counts in rows of arr. Will take unreasonably long time if arr has > 10 cols.
:param arr: 2D numpy.array. All that matters is which elements are zero and which are not
:param row_weights: 1D numpy array with len equal to len(arr). Provides weights for each row.
:return: optimal permutation as a list of column indices.
"""
if arr.shape[1] > BRUTEFORCE_SIZE_HARD_LIMIT:
raise ValueError('Bruteforce ordering method accepts max {} columns, got {} instead. It would take too long.'
.format(BRUTEFORCE_SIZE_HARD_LIMIT, arr.shape[1]))
best_permutation = None
best_total_gaps = HUGE_NUMBER
for permutation in permutations(range(arr.shape[1])):
total_gaps = get_total_gaps_in_rows(arr[:, permutation], row_weights=row_weights)
if total_gaps < best_total_gaps:
best_permutation = permutation
best_total_gaps = total_gaps
return list(best_permutation)
def columns_similarities_matrix(arr, row_weights=None):
"""
Let A and B be two 1D arrays with zeros and ones, of same shape, and row_weigths a non-negative array of same shape.
Define weighted similarity of A and B w.r.t. row weights as the sum of elements of row_weights in positions where
A and B have equal values.
So, given a M x N array arr, this function computes the N x N matrix of weighted similarities of its columns.
All weights are equal to 1 by default, in which case the similarity of two columns is equal to the number of
positions where values coincide in the two columns.
:param arr: M x N array with zeros and ones
:param row_weights: 1D numpy array with len equal to len(arr). Provides weights for each row.
:return: N x N array. with weighted similarities of columns of arr as defined above.
"""
if row_weights is None:
row_weights = np.ones(len(arr), dtype=int)
if len(arr) != len(row_weights):
raise ValueError('len(row_weights) must be equal to number of rows of arr')
return (arr.T * row_weights).dot(arr) + ((1 - arr).T * row_weights).dot(1 - arr)
def find_columns_permutation_greedily(similarities):
"""
Given an array of columns similarities, use a greedy algorithm to try and find a permutation of columns that
will lower the number of gaps in rows.
:param similarities: numpy.array of column similarities.
:return: a permutation (as a list of indices) of column indices, producing lower value of count_runs
"""
if len(similarities) == 1:
return [0]
# fill diagonal with negative value so that same column is never paired with itself, even if all similarities
# between different columns are zero.
similarities = similarities.copy()
np.fill_diagonal(similarities, -1)
ncols = similarities.shape[0]
# define placed_flags[i] == 1 <=> i-th column of arr has already been assinged a place in the permutation
placed_flags = np.zeros(ncols, dtype=int)
# find two most similar columns. Initialize two lists with tham.
first_col_index, second_col_index = np.unravel_index(similarities.argmax(), similarities.shape)
first_tail = [first_col_index]
second_tail = [second_col_index]
placed_flags[first_col_index] = 1
placed_flags[second_col_index] = 1
# the main greedy loop
for _ in range(ncols - 2):
# find column most similar to the last element of any of the two lists, append it to the corresponding list
similarities_to_first = similarities[:, first_tail[-1]] - placed_flags * HUGE_NUMBER
similarities_to_second = similarities[:, second_tail[-1]] - placed_flags * HUGE_NUMBER
first_argmax = similarities_to_first.argmax()
second_argmax = similarities_to_second.argmax()
if similarities_to_first[first_argmax] >= similarities_to_second[second_argmax]:
idx = first_argmax
first_tail.append(idx)
else:
idx = second_argmax
second_tail.append(idx)
# mark the chosen column as placed
placed_flags[idx] = 1
permutation = second_tail[::-1] + first_tail
return permutation
# todo rename to reflect what it does, not only how it does it
def run_greedy_algorithm_on_composition_array(arr, row_weights=None):
"""
Given a composition array, use a greedy algorithm to find a permutation of columns that will try to minimize the
total weighted number of gaps in the rows of the array.
:param arr: numpy array with zeros and ones
:param row_weights: 1D numpy array with len equal to len(arr). Provides weights for each row.
:return:
"""
similarities = columns_similarities_matrix(arr, row_weights=row_weights)
return find_columns_permutation_greedily(similarities)
# todo rename to reflect what it does, not only how it does it
def run_randomized_greedy_algorithm(arr, row_weights=None, seeds=DEFAULT_SEEDS, noise_prob=DEFAULT_NOISE_PROB):
"""
For a 2D np.array arr, find a permutation of columns that approximately minimizes the row-weighted number of gaps in
the rows of the permuted array. An approximate randomized greedy algorithm is used.
:param arr: np.array
:param seeds: number of different random perturbations to figh sticking in local minima.
:return: a list of indices representing an approximately optimal permutation of columns of arr
"""
arr = arr.astype(int)
# Compute similarities matrix
similarities = columns_similarities_matrix(arr, row_weights=row_weights)
best_found_permutation = None
best_found_gaps_count = HUGE_NUMBER
for seed in range(seeds + 1):
# Perturb similarities matrix if seed != 0
if seed == 0:
noise = np.zeros_like(similarities)
else:
np.random.seed(seed)
noise = (np.random.uniform(0, 1, size=similarities.shape) < noise_prob).astype(int)
np.random.seed(datetime.datetime.now().microsecond)
np.fill_diagonal(noise, 0)
noisy_similarities = similarities + noise
permutation = find_columns_permutation_greedily(noisy_similarities)
# Compute the target value for the found permutation, compare with current best.
gaps = get_total_gaps_in_rows(arr[:, permutation], row_weights=row_weights)
if gaps < best_found_gaps_count:
best_found_permutation = permutation
best_found_gaps_count = gaps
return best_found_permutation
def get_permutations(chunks, composition_array, chunks_ordering='minimize gaps', sets_ordering=None,
reverse_chunks_order=True, reverse_sets_order=True,
max_bruteforce_size=DEFAULT_MAX_BRUTEFORCE_SIZE,
seeds=DEFAULT_SEEDS, noise_prob=DEFAULT_NOISE_PROB):
"""
Given chunks and composition array, get permutations which will order the chunks and the sets according to specified
ordering methods.
:param chunks, composition_array: as returned by get_chunks_and_composition_array
For explanation of other params, see docstring to supervenn()
:return: a dict of the form {'chunks_ordering': [3, 2, 5, 4, 1, 6, 0], 'sets_ordering': [2, 0, 1, 3]}
"""
chunk_sizes = [len(chunk) for chunk in chunks]
set_sizes = composition_array.dot(np.array(chunk_sizes))
chunks_case = {
'sizes': chunk_sizes,
'param': 'chunks_ordering',
'array': composition_array,
'row_weights': None,
'ordering': chunks_ordering,
'allowed_orderings': ['size', 'occurrence', 'random', 'minimize gaps'] + ['occurence'], # todo remove with typo
'reverse': reverse_chunks_order
}
if chunks_ordering == 'occurence':
warnings.warn('Please use chunks_ordering="occurrence" (with double "r") instead of "occurence" (spelling fixed'
'in 0.3.0). The incorrect variant is still supported, but will be removed in a future version')
sets_case = {
'sizes': set_sizes,
'param': 'sets_ordering',
'array': composition_array.T,
'row_weights': chunk_sizes,
'ordering': sets_ordering,
'allowed_orderings': ['size', 'chunk count', 'random', 'minimize gaps', None],
'reverse': reverse_sets_order
}
permutations_ = {}
for case in chunks_case, sets_case:
if case['ordering'] not in case['allowed_orderings']:
raise ValueError('Unknown {}: {} (should be one of {})'
.format(case['param'], case['ordering'], case['allowed_orderings']))
if case['ordering'] == 'size':
permutation = np.argsort(case['sizes'])
elif case['ordering'] in ['occurrence', 'chunk count'] + ['occurence']:
permutation = np.argsort(case['array'].sum(0))
elif case['ordering'] == 'random':
permutation = np.array(range(len(case['sizes'])))
np.random.shuffle(permutation)
elif case['ordering'] is None:
permutation = np.array(range(len(case['sizes'])))
elif case['ordering'] == 'minimize gaps':
if len(case['sizes']) <= min(max_bruteforce_size, BRUTEFORCE_SIZE_HARD_LIMIT):
permutation = find_best_columns_permutation_bruteforce(case['array'], row_weights=case['row_weights'])
else:
permutation = run_randomized_greedy_algorithm(case['array'], seeds=seeds, noise_prob=noise_prob,
row_weights=case['row_weights'])
else:
raise ValueError(case['ordering'])
if case['ordering'] is not None and case['reverse']:
permutation = permutation[::-1]
permutations_[case['param']] = permutation
return permutations_
def _get_ordered_chunks_and_composition_array(sets, **kwargs):
"""
Wrapper for get_permutations, used only for testing
:param sets: list of sets
:param kwargs: all arguments to get_permutations except for chunks and composition_array,
:return:
"""
chunks, composition_array = get_chunks_and_composition_array(sets)
permutations_ = get_permutations(chunks, composition_array, **kwargs)
ordered_chunks = [chunks[i] for i in permutations_['chunks_ordering']]
ordered_composition_array = composition_array[:, permutations_['chunks_ordering']]
ordered_composition_array = ordered_composition_array[permutations_['sets_ordering'], :]
return ordered_chunks, ordered_composition_array
================================================
FILE: supervenn/_plots.py
================================================
# -*- coding: utf-8 -*-
"""
Routines for plotting multiple sets.
"""
from functools import partial
import warnings
import numpy as np
import matplotlib.gridspec as gridspec
import matplotlib.pyplot as plt
from supervenn._algorithms import (
break_into_chunks,
get_chunks_and_composition_array,
get_permutations,
DEFAULT_MAX_BRUTEFORCE_SIZE,
DEFAULT_SEEDS,
DEFAULT_NOISE_PROB)
DEFAULT_FONTSIZE = 12
class SupervennPlot(object):
"""
Attributes
----------
axes: `dict
a dict containing all the plot's axes under descriptive keys: 'main', 'top_side_plot', 'right_side_plot',
'unused' (the small empty square in the top right corner)
figure: matplotlib.figure.Figure
figure containing the plot.
chunks: dict
a dictionary allowing to get the contents of chunks. It has frozensets of key indices as keys and chunks
as values.
Methods
-------
get_chunk(set_indices)
get a chunk by the indices of its defining sets without them to a frozenset first
"""
def __init__(self, axes, figure, chunks_dict):
self.axes = axes
self.figure = figure
self.chunks = chunks_dict
def get_chunk(self, set_indices):
"""
Get the contents of a chunk defined by the sets indicated by sets_indices. Indices refer to the original sets
order as it was passed to supervenn() function (any reordering of sets due to use of sets_ordering params is
ignored).
For example .get_chunk_by_set_indices([1,5]) will return the chunk containing all the items that are in
sets[1] and sets[5], but not in any of the other sets.
supervenn() function, the
:param set_indices: iterable of integers, referring to positions in sets list, as passed into supervenn().
:return: chunk with items, that are in each of the sets with indices from set_indices, but not in any of the
other sets.
"""
return self.chunks[frozenset(set_indices)]
def get_alternated_ys(ys_count, low, high):
"""
A helper function generating y-positions for x-axis annotations, useful when some annotations positioned along the
x axis are too crowded.
:param ys_count: integer from 1 to 3.
:param low: lower bound of the area designated for annotations
:param high: higher bound for thr area designated for annotations.
:return:
"""
if ys_count not in [1, 2, 3]:
raise ValueError('Argument ys_count should be 1, 2 or 3.')
if ys_count == 1:
coefs = [0.5]
vas = ['center']
elif ys_count == 2:
coefs = [0.15, 0.85]
vas = ['bottom', 'top']
else:
coefs = [0.15, 0.5, 0.85]
vas = ['bottom', 'center', 'top']
ys = [low + coef * (high - low) for coef in coefs]
return ys, vas
def plot_binary_array(arr, ax=None, col_widths=None, row_heights=None, min_width_for_annotation=1,
row_annotations=None, row_annotations_y=0.5,
col_annotations=None, col_annotations_area_height=0.75, col_annotations_ys_count=1,
rotate_col_annotations=False,
color_by='row', bar_height=1, bar_alpha=0.6, bar_align='edge', color_cycle=None,
alternating_background=True, fontsize=DEFAULT_FONTSIZE):
"""
Visualize a binary array as a grid with variable sized columns and rows, where cells with 1 are filled using bars
and cells with 0 are blank.
:param arr: numpy.array of zeros and ones
:param ax: axis to plot into (current axis by default)
:param col_widths: widths for grid columns, must have len equal to arr.shape[1]
:param row_heights: heights for grid rows, must have len equal to arr.shape[0]
:param min_width_for_annotation: don't annotate column with its size if size is less than this value (default 1)
:param row_annotations: annotations for each row, plotted in the middle of the row
:param row_annotations_y: a number in (0, 1), position for row annotations in the row. Default 0.5 - center of row.
:param col_annotations: annotations for columns, plotted in the bottom, below the x axis.
:param col_annotations_area_height: height of area for column annotations in inches, 1 by default
:param col_annotations_ys_count: 1 (default), 2, or 3 - use to reduce clutter in column annotations area
:param rotate_col_annotations: True / False
:param color_by: 'row' (default) or 'column'. If 'row', all cells in same row are same color, etc.
:param bar_height: height of cell fill as a fraction of row height, a number in (0, 1).
:param bar_alpha: alpha for cell fills.
:param bar_align: vertical alignment of bars, 'edge' (defaulr) or 'center'. Only matters when bar_height < 1.
:param color_cycle: a list of colors, given as names of matplotlib named colors, or hex codes (e.g. '#1f77b4')
:param alternating_background: True (default) / False - give avery second row a slight grey tint
:param fontsize: font size for annotations (default {}).
""".format(DEFAULT_FONTSIZE)
if row_heights is None:
row_heights = [1] * arr.shape[0]
if col_widths is None:
col_widths = [1] * arr.shape[1]
if len(row_heights) != arr.shape[0]:
raise ValueError('len(row_heights) doesnt match number of rows of array')
if len(col_widths) != arr.shape[1]:
raise ValueError('len(col_widths) doesnt match number of columns of array')
allowed_argument_values = {
'bar_align': ['center', 'edge'],
'color_by': ['row', 'column'],
'col_annotations_ys_count': [1, 2, 3],
}
for argument_name, allowed_argument_values in allowed_argument_values.items():
if locals()[argument_name] not in allowed_argument_values:
raise ValueError('Argument {} should be one of {}'.format(argument_name, allowed_argument_values))
if not 0 <= row_annotations_y <= 1:
raise ValueError('row_annotations_y should be a number between 0 and 1')
if color_cycle is None:
color_cycle = plt.rcParams['axes.prop_cycle'].by_key()['color']
grid_xs = np.insert(np.cumsum(col_widths), 0, 0)[:-1]
grid_ys = np.insert(np.cumsum(row_heights), 0, 0)[:-1]
if ax is not None:
plt.sca(ax)
# BARS
for row_index, (row, grid_y, row_height) in enumerate(zip(arr, grid_ys, row_heights)):
bar_y = grid_y + 0.5 * row_height if bar_align == 'center' else grid_y
# alternating background
if alternating_background and row_index % 2:
plt.barh(y=bar_y, left=0, width=sum(col_widths), height=bar_height * row_height, align=bar_align,
color='grey', alpha=0.15)
for col_index, (is_filled, grid_x, col_width) in enumerate(zip(row, grid_xs, col_widths)):
if is_filled:
color_index = row_index if color_by == 'row' else col_index
color = color_cycle[color_index % len(color_cycle)]
plt.barh(y=bar_y, left=grid_x, width=col_width, height=bar_height * row_height, align=bar_align,
color=color, alpha=bar_alpha)
# ROW ANNOTATIONS
if row_annotations is not None:
for row_index, (grid_y, row_height, annotation) in enumerate(zip(grid_ys, row_heights, row_annotations)):
annot_y = grid_y + row_annotations_y * row_height
plt.annotate(str(annotation), xy=(0.5 * sum(col_widths), annot_y),
ha='center', va='center', fontsize=fontsize)
# COL ANNOTATIONS
min_y = 0
if col_annotations is not None:
min_y = - 1.0 * col_annotations_area_height / plt.gcf().get_size_inches()[1] * arr.shape[0]
plt.axhline(0, c='k')
annot_ys, vas = get_alternated_ys(col_annotations_ys_count, min_y, 0)
for col_index, (grid_x, col_width, annotation) in enumerate(zip(grid_xs, col_widths, col_annotations)):
annot_y = annot_ys[col_index % len(annot_ys)]
if col_width >= min_width_for_annotation:
plt.annotate(str(annotation), xy=(grid_x + col_width * 0.5, annot_y),
ha='center', va=vas[col_index % len(vas)], fontsize=fontsize,
rotation=90 * rotate_col_annotations)
plt.xlim(0, sum(col_widths))
plt.ylim(min_y, sum(row_heights))
plt.xticks(grid_xs, [])
plt.yticks(grid_ys, [])
plt.grid(True)
def side_plot(values, widths, orient, fontsize=DEFAULT_FONTSIZE, min_width_for_annotation=1, rotate_annotations=False,
color='tab:gray'):
"""
Barplot with multiple bars of variable width right next to each other, with an option to rotate the plot 90 degrees.
:param values: the values to be plotted.
:param widths: Widths of bars
:param orient: 'h' / 'horizontal' (default) or 'v' / 'vertical'
:param fontsize: font size for annotations
:param min_width_for_annotation: for horizontal plot, don't annotate bars of widths less than this value (to avoid
clutter. Default 1 - annotate all.)
:param rotate_annotations: True/False, whether to print annotations vertically instead of horizontally
:param color: color of bars, default 'tab:gray'
"""
bar_edges = np.insert(np.cumsum(widths), 0, 0)
annotation_positions = [0.5 * (begin + end) for begin, end in zip(bar_edges[:-1], bar_edges[1:])]
max_value = max(values)
if orient in ['h', 'horizontal']:
horizontal = True
plt.bar(x=bar_edges[:-1], height=values, width=widths, align='edge', alpha=0.5, color=color)
ticks = plt.xticks
lim = plt.ylim
elif orient in ['v', 'vertical']:
horizontal = False
plt.barh(y=bar_edges[:-1], width=values, height=widths, align='edge', alpha=0.5, color=color)
ticks = plt.yticks
lim = plt.xlim
else:
raise ValueError('Unknown orient: {} (should be "h" or "v")'.format(orient))
for i, (annotation_position, value, width) in enumerate(zip(annotation_positions, values, widths)):
if width < min_width_for_annotation and horizontal:
continue
x, y = 0.5 * max_value, annotation_position
if horizontal:
x, y = y, x
plt.annotate(value, xy=(x, y), ha='center', va='center',
rotation=rotate_annotations * 90, fontsize=fontsize)
ticks(bar_edges, [])
lim(0, max(values))
plt.grid(True)
def get_widths_balancer(widths, minmax_ratio=0.02):
"""
Given a list of positive numbers, find a linear function, such that when applied to the numbers, the maximum value
remains the same, and the minimum value is minmax_ratio times the maximum value.
:param widths: list of numbers
:param minmax_ratio: the desired max / min ratio in the transformed list.
:return: a linear function with one float argument that has the above property
"""
if not 0 <= minmax_ratio <= 1:
raise ValueError('minmax_ratio must be between 0 and 1')
max_width = max(widths)
min_width = min(widths)
if 1.0 * min_width / max_width >= minmax_ratio:
slope = 1
intercept = 0
else:
slope = max_width * (1.0 - minmax_ratio) / (max_width - min_width)
intercept = max_width * (max_width * minmax_ratio - min_width) / (max_width - min_width)
def balancer(width):
return slope * width + intercept
return balancer
def remove_ticks(ax):
ax.set_xticks([])
ax.set_yticks([])
def setup_axes(side_plots, figsize=None, dpi=None, ax=None, side_plot_width=1.5):
"""
Set up axes for plot and return them in a dictionary. The dictionary may include the following keys:
- 'main': always present
- 'top_side_plot': present if side_plots = True, 'both' or 'top'
- 'right_side_plot': present if side_plots = True, 'both' or 'right'
- 'unused': present if side_plots = 'True' or 'both' (unused area in the top right corner)
:param side_plots: True / False / 'top' / 'right'
:param figsize: deprecated, will be removed in future versions
:param dpi: deprecated, will be removed in future versions
:param ax: optional encasing axis to plot into, default None - plot into current axis.
:param side_plot_width: side plots width in inches, default 1.5
:return: dict with string as keys and axes as values, as described above.
"""
if side_plots not in (True, False, 'top', 'right'):
raise ValueError('Incorrect value for side_plots: {}'.format(side_plots))
# Define and optionally create the encasing axis for plot according to arguments
if ax is None:
if figsize is not None or dpi is not None:
plt.figure(figsize=figsize, dpi=dpi)
supervenn_ax = plt.gca()
else:
supervenn_ax = ax
# if no side plots, there is only one axis
if not side_plots:
axes = {'main': supervenn_ax}
# if side plots are used, break encasing axis into four smaller axis using matplotlib magic and store them in a dict
else:
bbox = supervenn_ax.get_window_extent().transformed(supervenn_ax.get_figure().dpi_scale_trans.inverted())
plot_width, plot_height = bbox.width, bbox.height
width_ratios = [plot_width - side_plot_width, side_plot_width]
height_ratios = [side_plot_width, plot_height - side_plot_width]
fig = supervenn_ax.get_figure()
get_gridspec = partial(gridspec.GridSpecFromSubplotSpec, subplot_spec=supervenn_ax.get_subplotspec(),
hspace=0, wspace=0)
if side_plots == True:
gs = get_gridspec(2, 2, height_ratios=height_ratios, width_ratios=width_ratios)
axes = {
'main': fig.add_subplot(gs[1, 0]),
'top_side_plot': fig.add_subplot(gs[0, 0]),
'unused': fig.add_subplot(gs[0, 1]),
'right_side_plot': fig.add_subplot(gs[1, 1])
}
elif side_plots == 'top':
gs = get_gridspec(2, 1, height_ratios=height_ratios)
axes = {
'main': fig.add_subplot(gs[1, 0]),
'top_side_plot': fig.add_subplot(gs[0, 0])
}
elif side_plots == 'right':
gs = get_gridspec(1, 2, width_ratios=width_ratios)
axes = {
'main': fig.add_subplot(gs[0, 0]),
'right_side_plot': fig.add_subplot(gs[0, 1])
}
# Remove tick from every axis, and set ticks length to 0 (we'll add ticks to the side plots manually later)
for ax in axes.values():
remove_ticks(ax)
ax.tick_params(which='major', length=0)
remove_ticks(supervenn_ax) # if side plots are used, supervenn_ax isn't included in axes dict
return axes
def supervenn(sets, set_annotations=None, figsize=None, side_plots=True,
chunks_ordering='minimize gaps', sets_ordering=None,
reverse_chunks_order=True, reverse_sets_order=True,
max_bruteforce_size=DEFAULT_MAX_BRUTEFORCE_SIZE, seeds=DEFAULT_SEEDS, noise_prob=DEFAULT_NOISE_PROB,
side_plot_width=1, min_width_for_annotation=1, widths_minmax_ratio=None, side_plot_color='gray',
dpi=None, ax=None, **kw):
"""
Plot a diagram visualizing relationship of multiple sets.
:param sets: list of sets
:param set_annotations: list of annotations for the sets
:param figsize: figure size
:param side_plots: True / False: add small barplots on top and on the right. On top, for each chunk it is shown,
how many sets does this chunk lie inslde. On the right, set sizes are shown.
:param chunks_ordering: method of ordering the chunks (columns of the grid)
- 'minimize gaps' (default): use a smart algorithm to find an order of columns giving fewer gaps in each row,
making the plot as readable as possible.
- 'size': bigger chunks go first (or last if reverse_chunks_order=False)
- 'occurence': chunks that are in most sets go first (or last if reverse_chunks_order=False)
- 'random': randomly shuffle the columns
:param sets_ordering: method of ordering the sets (rows of the grid)
- None (default): keep the order as it is passed
- 'minimize gaps': use a smart algorithm to find an order of rows giving fewer gaps in each column
- 'size': bigger sets go first (or last if reverse_sets_order = False)
- 'chunk count': sets that contain most chunks go first (or last if reverse_sets_order = False)
- 'random': randomly shuffle
:param reverse_chunks_order: True (default) / False when chunks_ordering is "size" or "occurence",
chunks with bigger corresponding property go first if reverse_chunks_order=True, smaller go first if False.
:param reverse_sets_order: True / False, works the same way as reverse_chunks_order
:param max_bruteforce_size: maximal number of items for which bruteforce method is applied to find permutation
:param seeds: number of different random seeds for the randomized greedy algorithm to find permutation
:param noise_prob: probability of given element being equal to 1 in the noise array for randomized greedy algorithm
:param side_plot_width: width of side plots in inches (default 1.5)
:param side_plot_color: color of bars in side plots, default 'gray'
:param dpi: figure DPI
:param ax: axis to plot into. If ax is specified, figsize and dpi will be ignored.
:param min_width_for_annotation: for horizontal plot, don't annotate bars of widths less than this value (to avoid
clutter)
:param widths_minmax_ratio: desired max/min ratio of displayed chunk widths, default None (show actual widths)
:param rotate_col_annotations: True / False, whether to print annotations vertically
:param fontsize: font size for all text elements
:param row_annotations_y: a number in (0, 1), position for row annotations in the row. Default 0.5 - center of row.
:param col_annotations_area_height: height of area for column annotations in inches, 1 by default
:param col_annotations_ys_count: 1 (default), 2, or 3 - use to reduce clutter in column annotations area
:param color_by: 'row' (default) or 'column'. If 'row', all cells in same row are same color, etc.
:param bar_height: height of cell fill as a fraction of row height, a number in (0, 1).
:param bar_alpha: alpha for cell fills.
:param bar_align: vertical alignment of bars, 'edge' (default) or 'center'. Only matters when bar_height < 1.
:param color_cycle: a list of set colors, given as names of matplotlib named colors, or hex codes (e.g. '#1f77b4')
:param alternating_background: True (default) / False - give avery second row a slight grey tint
:return: SupervennPlot instance with attributes `axes`, `figure`, `chunks`
and method `get_chunk(set_indices)`. See docstring to returned object.
"""
if figsize is not None or dpi is not None:
warnings.warn(
'Parameters figsize and dpi of supervenn() are deprecated and will be removed in a future version.\n'
'Instead of this:\n'
' supervenn(sets, figsize=(8, 5), dpi=90)'
'\nPlease either do this:\n'
' plt.figure(figsize=(8, 5), dpi=90)\n'
' supervenn(sets)\n'
'or plot into an existing axis by passing it as the ax argument:\n'
' supervenn(sets, ax=my_axis)\n'
)
axes = setup_axes(side_plots, figsize, dpi, ax, side_plot_width)
if set_annotations is None:
set_annotations = ['set_{}'.format(i) for i in range(len(sets))]
chunks, composition_array = get_chunks_and_composition_array(sets)
# Find permutations of rows and columns
permutations_ = get_permutations(
chunks,
composition_array,
chunks_ordering=chunks_ordering,
sets_ordering=sets_ordering,
reverse_chunks_order=reverse_chunks_order,
reverse_sets_order=reverse_sets_order,
max_bruteforce_size=max_bruteforce_size,
seeds=seeds,
noise_prob=noise_prob)
# Apply permutations
chunks = [chunks[i] for i in permutations_['chunks_ordering']]
composition_array = composition_array[:, permutations_['chunks_ordering']]
composition_array = composition_array[permutations_['sets_ordering'], :]
set_annotations = [set_annotations[i] for i in permutations_['sets_ordering']]
# Main plot
chunk_sizes = [len(chunk) for chunk in chunks]
if widths_minmax_ratio is not None:
widths_balancer = get_widths_balancer(chunk_sizes, widths_minmax_ratio)
col_widths = [widths_balancer(chunk_size) for chunk_size in chunk_sizes]
effective_min_width_for_annotation = widths_balancer(min_width_for_annotation)
else:
col_widths = chunk_sizes
effective_min_width_for_annotation = min_width_for_annotation
plot_binary_array(
arr=composition_array,
row_annotations=set_annotations,
col_annotations=chunk_sizes,
ax=axes['main'],
col_widths=col_widths,
min_width_for_annotation=effective_min_width_for_annotation,
**kw)
xlim = axes['main'].get_xlim()
ylim = axes['main'].get_ylim()
fontsize = kw.get('fontsize', DEFAULT_FONTSIZE)
plt.xlabel('ITEMS', fontsize=fontsize)
plt.ylabel('SETS', fontsize=fontsize)
# Side plots
if 'top_side_plot' in axes:
plt.sca(axes['top_side_plot'])
side_plot(composition_array.sum(0), col_widths, 'h',
min_width_for_annotation=effective_min_width_for_annotation,
rotate_annotations=kw.get('rotate_col_annotations', False), color=side_plot_color, fontsize=fontsize)
plt.xlim(xlim)
if 'right_side_plot' in axes:
plt.sca(axes['right_side_plot'])
side_plot([len(sets[i]) for i in permutations_['sets_ordering']], [1] * len(sets), 'v', color=side_plot_color,
fontsize=fontsize)
plt.ylim(ylim)
plt.sca(axes['main'])
return SupervennPlot(axes, plt.gcf(), break_into_chunks(sets)) # todo: break_into_chunks is called twice, fix
================================================
FILE: supervenn/_utils.py
================================================
from collections import defaultdict
import doctest
import sys
import pandas as pd
def make_sets_from_chunk_sizes(sizes_df):
"""
Given a pandas.DataFrame with sizes of intersections, produces synthetic sets of integers that
have exactly these intersection sizes.
It is a temporary roundabout before proper handling of intersection sizes without
the necessity for physical sets is implemented.
If your intersection sizes are huge, say in the tens of millions and higher, I recommend to scale
th numbers down to avoid using up too much memory. Don't forget to cast the scaled numbers to integer though.
:param sizes_df: pd.DataFrame, must have the following structure:
- For N sets, it must have N boolean columns and the last integer column, so N+1 columns in total.
- The names of the boolean columns are the names (labels) of the sets, the name of the integer column doesn't matter.
- Each row represents an unique intersection (chunk) of the sets. The boolean value in column 'set_x' indicate whether
this chunk lies within set_x. The integer value represents the size of the chunk.
- The index of the dataframe doesn't matter.
- 0's and 1's instead of booleans will work too.
For example, consider the following dataframe
set_1 set_2 set_3 size
0 False True True 1
1 True False False 3
2 True False True 2
3 True True False 1
It represents a configuration of three sets such that
- [row 0] there is one element that lies in set_2 and set_3 but not in set_1
- [row 1] there are three elements that lie in set_1 only and not in set_2 or set_3
- etc two more rows.
:return: sets, labels
where sets is a list of python sets, and labels is the list of set names (boolean colums names)
so the result can be used as follows:
sets, labels = make_sets_from_chunk_sizes(df)
supervenn(sets, labels, ...)
>>> values = [(False, True, True, 1), (True, False, False, 3), (True, False, True, 2), (True, True, False, 1)]
>>> df = pd.DataFrame(values, columns=['set_1', 'set_2', 'set_3', 'size'])
>>> sets, labels = make_sets_from_chunk_sizes(df)
>>> sets
[{1, 2, 3, 4, 5, 6}, {0, 6}, {0, 4, 5}]
>>> values = [(0, 1, 1, 1), (1, 0, 0, 3), (1, 0, 1, 2), (1, 1, 0, 1)]
>>> df = pd.DataFrame(values, columns=['set_1', 'set_2', 'set_3', 'size'])
>>> sets, labels = make_sets_from_chunk_sizes(df)
>>> sets
[{1, 2, 3, 4, 5, 6}, {0, 6}, {0, 4, 5}]
"""
sets = defaultdict(set)
idx = 0
for _, row in sizes_df.iterrows():
flags = row.iloc[:-1]
count = row.iloc[-1]
items = range(idx, idx + count)
try:
row_iterator = flags.iteritems() # deprecated since pandas 1.5
except AttributeError:
row_iterator = flags.items()
for col_name, bool_value in row_iterator:
if bool_value:
sets[col_name].update(items)
idx += count
sets_labels = sizes_df.columns[:-1].tolist()
return [sets[col] for col in sets_labels], sets_labels
doctest.testmod(sys.modules[__name__])
================================================
FILE: tests/test_algorithms.py
================================================
# -*- coding: utf-8 -*-
"""
Tests for _algorithms module.
"""
import unittest
import numpy as np
from collections import Counter
from itertools import product
from supervenn._algorithms import (
get_total_gaps_in_rows,
get_chunks_and_composition_array,
_get_ordered_chunks_and_composition_array,
find_best_columns_permutation_bruteforce,
run_greedy_algorithm_on_composition_array,
run_randomized_greedy_algorithm
)
def freeze_sets(sets):
"""
Convert an iterable of sets to a set of frozensets, and check that all sets are not repeated.
"""
counter = Counter(frozenset(set_) for set_ in sets)
assert max(counter.values()) == 1
return set(counter)
def is_ascending(sequence):
return all(sequence[i + 1] >= sequence[i] for i in range(len(sequence) - 1))
def array_is_binary(arr):
"""
:param arr: np.array
:return: True if the array only contains zeros and ones, False otherwise
"""
return not set(arr.flatten()) - {0, 1}
def make_random_sets(min_sets_count=1):
sets_count = np.random.randint(min_sets_count, 10)
max_item = np.random.choice([2 ** i for i in range(8)]) + 1
max_size = np.random.choice([2 ** i for i in range(8)]) + 1
sets = [set(np.random.randint(1, max_item, size=np.random.randint(1, max_size)))
for _ in range(sets_count)]
# decimate sets to introduce some empty sets into the list
for index in np.random.randint(0, len(sets), size=int(len(sets) / 10)):
sets[index] = set()
return sets
def is_permutation(sequence):
n = len(sequence)
if len(sequence) != n:
return False
if len(set(sequence)) != n:
return False
if set(sequence) != set(range(n)):
return False
return True
class TestGetTotalGaps(unittest.TestCase):
def test_all_zeros(self):
"""
Test that number of runs of a zero matrix is zero
"""
arr = np.zeros((2, 3), dtype=bool)
gaps_count = get_total_gaps_in_rows(arr)
self.assertEqual(gaps_count, 0)
def test_all_ones(self):
"""
Test that the number of runs of a matrix of ones is equal to the number of rows.
"""
arr = np.ones((7, 3), dtype=bool)
gaps_count = get_total_gaps_in_rows(arr)
self.assertEqual(gaps_count, 0)
def test_one_col(self):
"""
Test that the number of runs of a matrix with one col is equal to the number of ones
"""
rows_count = 100
arr = np.random.randint(0, 2, size=(rows_count, 1))
gaps_count = get_total_gaps_in_rows(arr)
self.assertEqual(gaps_count, 0)
def test_nontrivial_one(self):
arr = np.array([[1, 0, 1, 0],
[1, 0, 0, 1],
[0, 1, 0, 1]])
gaps_count = get_total_gaps_in_rows(arr)
self.assertEqual(gaps_count, 3)
def test_nontrivial_two(self):
arr = np.array([[1, 0, 0, 0],
[0, 0, 0, 1],
[0, 0, 0, 1]])
gaps_count = get_total_gaps_in_rows(arr)
self.assertEqual(gaps_count, 0)
def test_nontrivial_three(self):
arr = np.array([[1, 1, 0, 1],
[0, 1, 1, 0],
[1, 0, 1, 1]])
gaps_count = get_total_gaps_in_rows(arr)
self.assertEqual(gaps_count, 2)
class TestGetChunksAndCompositionArray(unittest.TestCase):
def test_single_set(self):
sets = [set(np.random.randint(1, 1000, size=100))]
chunks, arr = get_chunks_and_composition_array(sets)
self.assertEqual(chunks, sets)
self.assertEqual(arr.shape, (1, 1))
self.assertEqual(arr[0, 0], 1)
def test_one_empty(self):
set_ = set(np.random.randint(1, 1000, size=100))
sets = [set_, set()]
chunks, arr = get_chunks_and_composition_array(sets)
self.assertEqual(chunks, [set_])
self.assertEqual(arr.shape, (2, 1))
self.assertEqual(list(arr[:, 0]), [1, 0])
def test_disjoint_small(self):
sets = [{1}, {2}]
chunks, arr = get_chunks_and_composition_array(sets)
self.assertEqual(freeze_sets(sets), freeze_sets(chunks))
self.assertTrue(np.array_equal(arr, np.eye(2, dtype=int))) # fixme can be not eye
def test_disjoint_large(self):
set_count = 4
sets = [set(np.random.randint(1000 * i, 1000 * (i + 1), size=100 * (i + 1))) for i in range(set_count)]
chunks, arr = get_chunks_and_composition_array(sets)
self.assertEqual(freeze_sets(sets), freeze_sets(chunks))
# Verify that array is made of zeros and ones
self.assertTrue(array_is_binary(arr))
# Verify that each row and each column of arr sum to 1
self.assertEqual(set(arr.sum(0)), {1})
self.assertEqual(set(arr.sum(1)), {1})
def test_two_sets(self):
sets = [{1, 2, 3}, {3, 4}]
chunks, arr = get_chunks_and_composition_array(sets)
self.assertEqual(freeze_sets(chunks), {frozenset([1, 2]), frozenset([3]), frozenset([4])})
self.assertTrue(array_is_binary(arr))
def test_chunks_for_random_sets(self):
"""
For random sets, test that
1) the union of sets is the disjoint union of chunks
2) each chunk is either completely inside any set either completely outside
:return:
"""
for _ in range(100):
sets = make_random_sets()
chunks, arr = get_chunks_and_composition_array(sets)
all_elements = set.union(*sets)
self.assertEqual(set.union(*chunks), all_elements)
self.assertEqual(sum(len(chunk) for chunk in chunks), len(all_elements))
for chunk, set_ in product(chunks, sets):
self.assertTrue(not chunk - set_ or chunk - set_ == chunk)
def test_chunks_and_array(self):
"""
For random sets, test that the you indeed can recreate every original set as the union of chunks indicated in
the corresponding row of array.
"""
for _ in range(100):
sets = make_random_sets()
chunks, arr = get_chunks_and_composition_array(sets)
for (set_, row) in zip(sets, arr):
chunks_in_this_set = [chunk for is_included, chunk in zip(row, chunks) if is_included]
recreated_set = set.union(*chunks_in_this_set)
self.assertEqual(set_, recreated_set)
self.assertEqual(sum(len(chunk) for chunk in chunks_in_this_set), len(set_))
def make_test_for_algorithm(function):
class TestPermutationFinder(unittest.TestCase):
def test_single_set(self):
arr = np.array([[1]])
permutation = function(arr)
self.assertEqual(permutation, [0])
def test_single_chunk(self):
arr = np.array([1, 0, 1, 0]).reshape((-1, 1))
permutation = function(arr)
self.assertEqual(permutation, [0])
def test_two_cols(self):
for sets_count in 1, 2, 10:
col_1 = (np.random.uniform(0, 1, size=sets_count) > 0.6).astype(int)
col_2 = (np.random.uniform(0, 1, size=sets_count) > 0.6).astype(int)
col_1[0] = 1
col_2[0] = 1
arr = np.concatenate([col_1.reshape((-1, 1)), col_2.reshape((-1, 1))], 1)
permutation = function(arr)
self.assertIn(permutation, [[0, 1], [1, 0]])
def test_is_permutation(self):
for _ in range(100):
ncols = np.random.randint(1, 5)
nrows = np.random.randint(1, 5)
arr = (np.random.uniform(0, 1, size=(nrows, ncols)) > 0.5).astype(int)
arr[0][0] = 1
permutation = function(arr)
self.assertTrue(is_permutation(permutation))
def test_obvious_one(self):
arr = np.array([[1, 1, 1, 1],
[1, 0, 1, 0],
[1, 0, 1, 0]])
permutation = function(arr)
permutation_string = ''.join((str(i) for i in permutation))
self.assertIn('02', permutation_string + ' ' + permutation_string[::-1])
def test_obvious_two(self):
arr = np.array([[0, 1, 0, 1, 0, 0],
[1, 0, 1, 1, 0, 1],
[1, 0, 0, 1, 1, 0]])
permutation = function(arr)
permutation_string = ''.join((str(i) for i in permutation))
self.assertIn('03', permutation_string + ' ' + permutation_string[::-1])
def test_obvious_three(self):
arr = np.array([[0, 1, 0, 1, 1, 0],
[1, 0, 1, 1, 0, 1],
[1, 0, 0, 1, 0, 0],
[1, 1, 0, 1, 0, 0],
[1, 0, 0, 0, 1, 0]])
permutation = function(arr)
permutation_string = ''.join((str(i) for i in permutation))
self.assertIn('03', permutation_string + ' ' + permutation_string[::-1])
self.assertIn('13', permutation_string + ' ' + permutation_string[::-1])
return TestPermutationFinder
TestFindBestColumnPermutationBruteforce = make_test_for_algorithm(find_best_columns_permutation_bruteforce)
TestRunGreedyAlgorithmOnCompositionArray = make_test_for_algorithm(run_greedy_algorithm_on_composition_array)
TestRunRandomizedGreedyAlgorithm = make_test_for_algorithm(run_randomized_greedy_algorithm)
# TODO: A test that randomized is not worse than non-randomized
class TestRandomizedAlgorithmQuality(unittest.TestCase):
def test_quality(self):
for _ in range(100):
one_prob = np.random.uniform(0.1, 0.9)
nrows = np.random.randint(1, 30)
ncols = np.random.randint(1, 8)
arr = np.random.uniform(0, 1, size=(nrows, ncols)) < one_prob
permutation = run_randomized_greedy_algorithm(arr)
target = get_total_gaps_in_rows(arr[:, permutation])
best_permutation = find_best_columns_permutation_bruteforce(arr)
best_target = get_total_gaps_in_rows(arr[:, best_permutation])
self.assertLessEqual((target - best_target), 0.3 * best_target + 1)
class TestRandomizedAlgorithmReproducible(unittest.TestCase):
def test_reproducible(self):
arr = np.random.uniform(0, 1, size=(20, 20)) < 0.5
representations_set = set()
for _ in range(10):
permutation = run_randomized_greedy_algorithm(arr)
representations_set.add(str(permutation))
self.assertEqual(len(representations_set), 1)
class TestGetOrderedChunksAndCompositionArray(unittest.TestCase):
def test_order_chunks_size_descending(self):
for _ in range(10):
sets = make_random_sets()
chunks, _ = _get_ordered_chunks_and_composition_array(sets, chunks_ordering='size')
chunk_sizes_descending = is_ascending([len(chunk) for chunk in chunks][::-1])
self.assertTrue(chunk_sizes_descending)
def test_order_chunks_size_ascending(self):
for _ in range(10):
sets = make_random_sets()
chunks, _ = _get_ordered_chunks_and_composition_array(sets, chunks_ordering='size',
reverse_chunks_order=False)
chunk_sizes_ascending = is_ascending([len(chunk) for chunk in chunks])
self.assertTrue(chunk_sizes_ascending)
def test_order_chunks_occurence_descending(self):
for _ in range(10):
sets = make_random_sets()
_, composition_matrix = _get_ordered_chunks_and_composition_array(sets, chunks_ordering='occurrence')
occurences = composition_matrix.sum(0)
occurences_descending = is_ascending(occurences[::-1])
self.assertTrue(occurences_descending)
def test_order_chunks_occurence_ascending(self):
for _ in range(10):
sets = make_random_sets()
_, composition_matrix = _get_ordered_chunks_and_composition_array(sets, chunks_ordering='occurrence',
reverse_chunks_order=False)
occurences = composition_matrix.sum(0)
occurences_ascending = is_ascending(occurences)
self.assertTrue(occurences_ascending)
def test_order_chunks_random(self):
"""
Test that in 10 runs not all matrices are equal.
:return:
"""
done = False
while not done:
sets = make_random_sets(min_sets_count=9)
chunks, composition_matrix = get_chunks_and_composition_array(sets)
if len(chunks) == 1:
continue
representations_set = set()
for i in range(10):
_, composition_matrix = _get_ordered_chunks_and_composition_array(sets, chunks_ordering='random')
representations_set.add(str(composition_matrix))
self.assertGreater(len(representations_set), 1)
done = True
def test_order_sets_size_descending(self):
for _ in range(1):
sets = make_random_sets()
chunks, composition_matrix = _get_ordered_chunks_and_composition_array(sets, sets_ordering='size')
chunk_sizes = np.array([len(chunk) for chunk in chunks])
set_sizes = composition_matrix.dot(chunk_sizes.reshape((-1, 1))).flatten()
set_sizes_descending = is_ascending(set_sizes[::-1])
self.assertTrue(set_sizes_descending)
def test_order_sets_size_ascending(self):
for _ in range(1):
sets = make_random_sets()
chunks, composition_matrix = _get_ordered_chunks_and_composition_array(sets, sets_ordering='size',
reverse_sets_order=False)
chunk_sizes = np.array([len(chunk) for chunk in chunks])
set_sizes = composition_matrix.dot(chunk_sizes.reshape((-1, 1))).flatten()
set_sizes_ascending = is_ascending(set_sizes)
self.assertTrue(set_sizes_ascending)
def test_order_sets_chunk_count_descending(self):
for _ in range(10):
sets = make_random_sets()
_, composition_matrix = _get_ordered_chunks_and_composition_array(sets, sets_ordering='chunk count')
chunk_counts = composition_matrix.sum(1)
chunk_counts_descending = is_ascending(chunk_counts[::-1])
self.assertTrue(chunk_counts_descending)
def test_order_sets_chunk_count_ascending(self):
for _ in range(10):
sets = make_random_sets()
_, composition_matrix = _get_ordered_chunks_and_composition_array(sets, sets_ordering='chunk count',
reverse_sets_order=False)
chunk_counts = composition_matrix.sum(1)
chunk_counts_ascending = is_ascending(chunk_counts)
self.assertTrue(chunk_counts_ascending)
def test_order_sets_random(self):
done = False
while not done:
sets = make_random_sets(min_sets_count=9)
chunks, composition_matrix = get_chunks_and_composition_array(sets)
if len(chunks) == 1:
continue
representations_set = set()
for i in range(10):
_, composition_matrix = _get_ordered_chunks_and_composition_array(sets, sets_ordering='random')
representations_set.add(str(composition_matrix))
self.assertGreater(len(representations_set), 1)
done = True
if __name__ == '__main__':
unittest.main()
================================================
FILE: tests/test_plots.py
================================================
import matplotlib.pyplot as plt
from matplotlib.patches import Rectangle
import unittest
from supervenn._plots import supervenn
def rectangle_present(ax, expected_bbox_bounds):
"""
Check whether Axes ax contains a matplotlib.patches.Rectangle with given bbox bounds
:param ax: matplolib Axes
:param expected_bbox_bounds: expected bbox bounds [min_x, min_y, max_x, max_y]
:return: True / False
"""
found = False
for child in ax.get_children():
if isinstance(child, Rectangle) and child.get_bbox().bounds == expected_bbox_bounds:
found = True
break
return found
class TestSupervenn(unittest.TestCase):
def test_no_sets(self):
sets = []
with self.assertRaises(ValueError):
supervenn(sets)
plt.close()
def test_empty_sets(self):
sets = [set(), set()]
with self.assertRaises(ValueError):
supervenn(sets)
plt.close()
def test_no_side_plots(self):
"""
Test that the supervenn() runs without side plots, produces only one axes, and if given a list of one set
produces a rectangle of correct dimensions.
"""
set_size = 3
sets = [set(range(set_size))]
supervenn_plot = supervenn(sets, side_plots=False)
self.assertEqual(list(supervenn_plot.axes), ['main'])
self.assertEqual(len(supervenn_plot.figure.axes), 1)
expected_rectangle_bounds = (0.0, 0.0, float(set_size), 1.0)
self.assertTrue(rectangle_present(supervenn_plot.axes['main'], expected_rectangle_bounds))
plt.close()
def test_with_side_plots(self):
"""
Test that supervenn() runs with side plots, produces four axes, and if given a list of one set
produces a rectangle of correct dimensions.
"""
set_size = 3
sets = [set(range(set_size))]
supervenn_plot = supervenn(sets, side_plots=True)
self.assertEqual(set(supervenn_plot.axes), {'main', 'right_side_plot', 'top_side_plot', 'unused'})
expected_rectangle_bounds = (0.0, 0.0, float(set_size), 1.0) # same for all the three axes actually!
for ax_name, ax in supervenn_plot.axes.items():
if ax_name == 'unused':
continue
self.assertTrue(rectangle_present(ax, expected_rectangle_bounds))
plt.close()
def test_with_one_side_plot(self):
set_size = 3
sets = [set(range(set_size))]
for side_plots in ('top', 'right'):
supervenn_plot = supervenn(sets, side_plots=side_plots)
self.assertEqual(set(supervenn_plot.axes), {'main', '{}_side_plot'.format(side_plots)})
expected_rectangle_bounds = (0.0, 0.0, float(set_size), 1.0) # same for both axes
for ax_name, ax in supervenn_plot.axes.items():
self.assertTrue(rectangle_present(ax, expected_rectangle_bounds))
plt.close()
if __name__ == '__main__':
unittest.main()
_Thanks to [u/aboutscientific](https://www.reddit.com/user/aboutscientific/) for the link._
### Credits
This package was created and is maintained by [Fedor Indukaev](https://www.linkedin.com/in/fedor-indukaev-4a52961b/).
You can contact me on Gmail and Telegram by the same username as on github.
### How can I help?
- If you like supervenn, you can click the star at the top of the page and tell other people about this tool
- If you have an idea or even an implementation of a algorithm for matrix columns rearrangement, I'll be happy to try
it, as my current algorithm is quite primitive. (The problem in question is almost the traveling salesman problem in
Hamming metric).
- If you are a Python developer, you can help by reviewing the code in any way that is convenient to you.
- If you found a bug or have a feature request, you can submit them via the
[Issues section](https://github.com/gecko984/supervenn/issues).
================================================
FILE: setup.py
================================================
# -*- coding: utf-8 -*-
# python setup.py sdist bdist_wheel
# python2 setup.py sdist bdist_wheel
# twine upload dist/*
import setuptools
with open('README.md') as f:
README = f.read()
setuptools.setup(
author='Fedor Indukaev',
author_email='gecko984@gmail.com',
name='supervenn',
license='MIT',
description='supervenn is a tool for visualization of relations of many sets using matplotlib',
version='0.5.0',
long_description='See https://github.com/gecko984/supervenn/blob/master/README.md',
url='https://github.com/gecko984/supervenn',
packages=setuptools.find_packages(),
install_requires=['numpy', 'matplotlib>=2.2.5', 'pandas'],
classifiers=[
'Development Status :: 3 - Alpha',
'License :: OSI Approved :: MIT License',
'Programming Language :: Python',
'Programming Language :: Python :: 2.7',
'Programming Language :: Python :: 3.6',
'Programming Language :: Python :: 3.7',
'Programming Language :: Python :: 3.8',
'Programming Language :: Python :: 3.9',
'Programming Language :: Python :: 3.10',
'Programming Language :: Python :: 3.11',
'Topic :: Scientific/Engineering :: Visualization',
'Topic :: Scientific/Engineering :: Information Analysis',
'Intended Audience :: Science/Research',
'Intended Audience :: Developers'
]
)
================================================
FILE: supervenn/__init__.py
================================================
from supervenn._algorithms import (
get_chunks_and_composition_array,
get_permutations
)
from supervenn._plots import supervenn
from supervenn._utils import make_sets_from_chunk_sizes
================================================
FILE: supervenn/_algorithms.py
================================================
# -*- coding: utf-8 -*-
"""
supervenn._algorithms
This module implements all the algorithms used to prepare data for plotting.
~~~~~~~~~~~
A semi-formal explanation of what is going on here
==================================================
CHUNKS
Consider a three-way Venn diagram, shown below using squares rather than the usual circles, for obvious reasons.
It is easy to see that the three squares S1, S2, S3 break each other into seven elementary undivided parts, which we
will name :chunks:. The 7 chunks are marked as ch1 - ch7.
*-------S1-------*
| |
| ch1 |
*-----|---------* |
| | ch4 | |
| | | |
| | *-----|------|-----*
| | | ch7 | ch5 | |
S2 | | | | |
| *---|-----|------* |
| | | |
| ch2 | ch6 | S3
*---------|-----* |
| ch3 |
| |
*------------------*
The number 7 is easily derived by the following simple consideration. Each chunk is defined by a unique
subset of {S1, S2, S3}. For example, chunk ch4 is defined by {S1, S2} - it consists of exactly the points that lie
inside S1 and S2, but outside of S3. So the number of chunks is 2^3 - 1, 2^3 being the number of possible subsets of
{S1, S2, S3}, and -1 being for the empty set which has no business being among our chunks.
Note that, depending on how the three squares are positioned, there can be less chunks then 7. For instance, if the
three squares are disjoint, the number of chunks will be 3, as each square will be a chunk in itself.
What is important for us about the chunks, is that they are like the elementary building blocks of our
configuration of squares. In other words, we can represent any of the squares as a disjoint union of some of the
chunks. Also any combination of the squares w.r.t. the set-theoretical operations of intersection, union and
difference can be represented in the same way.
Now let's move from squares on the plane to abstract finite sets. The same line of reasoning leads us to
the conclusion that for N sets S1, ..., SN, there exist at most 2^N - 1 chunks (sets), such that any of the sets
(and any combination of the sets w.r.t union, intersection and difference) can be uniquely represented as the
disjoint union of several of the chunks.
COMPOSITION ARRAY
Suppose we have N sets S1, ..., SN, and we have found the chunks ch1, ... chM. As we said above, each of the sets
can be uniquely represented as a disjoint union of some of the chunks. Suppose we have found such decompositions for
all of the sets.
Now, represent the decompositions as a N x M array of zeros and ones, where the i,j-th item is 1 <=> set S_i
contains chunk ch_j. We'll call this array the :composition array: of our sets.
For example, for the squares above, the composition array will look like this:
ch1 ch2 ch3 ch4 ch5 ch6 ch7
S1 1 0 0 1 1 0 1 -> Square 1 is made up of chunks ch1, ch4, ch5 and ch7
S2 0 1 0 1 0 1 1
S3 0 0 1 0 1 1 1
Note that since chunks are something we've just made up by ourselves, they don't have to be ordered in any
particular way. This means that we can reorder the chunks (= the columns if the composition array) if we
need to.
Most part of the present module is actually about finding a permutations of the columns, that will minimize the
number of gaps between the 1's in all the rows of the array, so that the sets are visually broken into as few parts
as possible.
For the array above, we see that there are 5 total zero-filled gaps between ones: one in the first row, two in the
second, one in the third. But if we find and apply the right permutation of columns, we'll have only one gap between
the 1's in the whole array, highlighted by asterisks below:
ch1 ch4 ch2 ch6 ch7 ch5 ch3
S1 1 1 *0* 1 1 0 0
S2 0 1 1 1 1 0 0
S3 0 0 0 1 1 1 1
When there are few chunks (say, no more than 8) the optimal permutations is easily found in a bruteforce manner by
checking all the possible permutations. But for a greater number of chunks this would take too long. So instead an
approximate greedy algorithm with randomization is used. It is implemented in the run_randomized_greedy_algorithm()
function. The algorithm will be described below.
REORDERING THE ROWS / SETS
Unlike the order of chunks, the order of sets can be relevant in some cases. For example, our sets sets may relate
to different moments in time, and we may deem it important to preserve this temporal structure in the plot. But in
other cases when there is no inherent order to our sets, we might want to reorder the sets (rows of the composition
array) so that similar sets are closer to each other.
This is done by running the same algorithm on the transposed array. But there is an important distinction here: the
chunks are of different size, and it makes more sense to minimize total gap width, instead of just gap count.
To allow that, the run_randomized_greedy_algorithm() function accepts an additional argument named :row_weights:,
and minimizes gap counts weighted with these coefficients. In other words, the minimization target becomes
sum_i(gaps_count_in_row[i] * row_weights[i]) instead of just sum_i(gaps_count_in_row[i]).
DESCRIPTION OF THE ALGORITHM
Recall that our goal is to a find a permutation of columns of a matrix of zeros and ones, so that the row-weighted
sum of gaps counts in rows is as low as possible.
Define similarity of two columns as the sum of row weights for rows where the values are equal in the two columns.
Precompute matrix of similarities of all columns (if arr has N columns, this matrix has shape N x N)
Find two most similar columns C1, C2, initialize two lists [C1,] and [C2,]
Among the remaining N-2 columns, find one that has largest similarity to either of C1 or C2. Append that column to
the corresponding list. E.g. we now have lists [C1, C3] and [C2,]
Among the remaining N-3 columns find one that has largest similarity to the last elemt of either of the lists (in
our example, C3 and C2). Append it to the corresponding list.
Continue until all columns are distributed between in two lists.
Finally, one of the lists is reversed and the other is concatenated to it on the right, which gives the resulting
permutation. This concludes the greedy algorithm.
To mitigate the greediness, the similarity matrix is perturbed by means of adding a random matrix R with
elements {0, noise_value} with a fixed probability of non-zero, and the whole greedy procedure is repeated.
This is done with :seeds: different random matrices, and so :seeds: + 1 permutations are obtained (including the one
produced from the unperturbed similarities matrix). The permutation that yields the smallest value
of count_runs_of_ones_in_rows(arr[:, permutation]) is returned.
"""
from collections import defaultdict
import datetime
from itertools import permutations
import warnings
import numpy as np
HUGE_NUMBER = 1e10 # can fail for weighted! FIXME
DEFAULT_MAX_BRUTEFORCE_SIZE = 8
BRUTEFORCE_SIZE_HARD_LIMIT = 12
DEFAULT_SEEDS = 10000
DEFAULT_NOISE_PROB = 0.0075
DEFAULT_MAX_NOISE = 1.1
def get_total_gaps_in_rows(arr, row_weights=None):
"""
In a numpy.array arr, count how many gaps of zeros are there between contigous runs of non-zero values in each row.
The counts in each row are multiplied by weights given by row_weights array and summed. By default, all row weights
are equal to 1, so the returned value is just the total count of gaps in rows.
:param arr: 2D numpy.array, all that matters is which elements are zero and which are not.
:param row_weights: 1D numpy array with len equal to len(arr), provides weights for each row.
:return: weighted sum of number of gaps in rows.
"""
if row_weights is None:
row_weights = np.ones(len(arr), dtype=int)
if len(arr) != len(row_weights):
raise ValueError('len(row_weights) == {} != {} == len(arr)'.format(len(row_weights), len(arr)))
arr = arr.astype(bool)
# Shift array to the left, dropping last column and appending column of zeros on the left.
shifted_arr = np.concatenate([np.zeros(len(arr), dtype=bool).reshape((-1, 1)), arr[:, :-1]], 1)
rowwise_runs_counts = (arr & (~shifted_arr)).sum(1)
rowwise_gaps_counts = np.maximum(rowwise_runs_counts - 1, 0)
return rowwise_gaps_counts.dot(row_weights)
def break_into_chunks(sets):
"""
Let us have a collection {S_1, ..., S_n} of finite sets and U be the union of all these sets.
For a given subset C = {i_1, ..., i_k} of indices {1, ..., n}, define the 'chunk', corresponding to C, as the set
of elements of U, that belong to S_i_1, ..., S_i_k, but not to any of the other sets.
For example, for a collection of two sets {S_1, S_2}, there can be max three chunks: S_1 - S_2, S_2 - S_1, S1 & S_2.
For three sets, there can be max 7 chunks (imagine a generic three-way Venn diagram and count how many different
area colors it can have).
In general, the number of possible non-empty chunks for a collection of n sets is equal to min(|U|, 2^n - 1).
Any chunk either lies completely inside any or completely outside any of the sets S_1, ... S_n.
This function takes a list of sets as its only argument and returns a dict with frozensets of indices as keys and
chunks as values.
:param sets: list of sets
:return: chunks_dict - dict with frozensets as keys and sets as values.
"""
if not sets:
raise ValueError('Sets list is empty.')
all_items = set.union(*sets)
if not all_items:
raise ValueError('All sets are empty')
# Each chunk is characterized by its occurrence pattern, which is a unique subset of indices of our sets.
# E.g. chunk with signature {1, 2, 5} is exactly the set of items such that they belong to sets 1, 2, 5, and
# don't belong to any of the other sets.
# Build a dict with signatures as keys (as frozensets), and lists of items as values,
chunks_dict = defaultdict(set)
for item in all_items:
occurrence_pattern = frozenset({i for i, set_ in enumerate(sets) if item in set_})
chunks_dict[occurrence_pattern].add(item)
return dict(chunks_dict)
def get_chunks_and_composition_array(sets):
"""
Take
- list of all chunks (each chunk is a set of items)
- a numpy.array A of zeros and ones with len(sets) rows and len(chunks) columns,
where A[i, j] == 1 <=> sets[i] includes chunks[j].
:param sets: list of sets
:return: chunks - list of sets, arr - numpy.array, chunks_dict - dict w
"""
chunks_dict = break_into_chunks(sets)
chunks_count = len(chunks_dict)
chunks = []
arr = np.zeros((len(sets), chunks_count), dtype=int)
for idx, (sets_indices, items) in enumerate(chunks_dict.items()):
chunks.append(items)
arr[list(sets_indices), idx] = 1
return chunks, arr
def find_best_columns_permutation_bruteforce(arr, row_weights=None):
"""
Using exhaustive search, find permutation of columns of np.array arr that will provide minimum value of weighted sum
of gaps counts in rows of arr. Will take unreasonably long time if arr has > 10 cols.
:param arr: 2D numpy.array. All that matters is which elements are zero and which are not
:param row_weights: 1D numpy array with len equal to len(arr). Provides weights for each row.
:return: optimal permutation as a list of column indices.
"""
if arr.shape[1] > BRUTEFORCE_SIZE_HARD_LIMIT:
raise ValueError('Bruteforce ordering method accepts max {} columns, got {} instead. It would take too long.'
.format(BRUTEFORCE_SIZE_HARD_LIMIT, arr.shape[1]))
best_permutation = None
best_total_gaps = HUGE_NUMBER
for permutation in permutations(range(arr.shape[1])):
total_gaps = get_total_gaps_in_rows(arr[:, permutation], row_weights=row_weights)
if total_gaps < best_total_gaps:
best_permutation = permutation
best_total_gaps = total_gaps
return list(best_permutation)
def columns_similarities_matrix(arr, row_weights=None):
"""
Let A and B be two 1D arrays with zeros and ones, of same shape, and row_weigths a non-negative array of same shape.
Define weighted similarity of A and B w.r.t. row weights as the sum of elements of row_weights in positions where
A and B have equal values.
So, given a M x N array arr, this function computes the N x N matrix of weighted similarities of its columns.
All weights are equal to 1 by default, in which case the similarity of two columns is equal to the number of
positions where values coincide in the two columns.
:param arr: M x N array with zeros and ones
:param row_weights: 1D numpy array with len equal to len(arr). Provides weights for each row.
:return: N x N array. with weighted similarities of columns of arr as defined above.
"""
if row_weights is None:
row_weights = np.ones(len(arr), dtype=int)
if len(arr) != len(row_weights):
raise ValueError('len(row_weights) must be equal to number of rows of arr')
return (arr.T * row_weights).dot(arr) + ((1 - arr).T * row_weights).dot(1 - arr)
def find_columns_permutation_greedily(similarities):
"""
Given an array of columns similarities, use a greedy algorithm to try and find a permutation of columns that
will lower the number of gaps in rows.
:param similarities: numpy.array of column similarities.
:return: a permutation (as a list of indices) of column indices, producing lower value of count_runs
"""
if len(similarities) == 1:
return [0]
# fill diagonal with negative value so that same column is never paired with itself, even if all similarities
# between different columns are zero.
similarities = similarities.copy()
np.fill_diagonal(similarities, -1)
ncols = similarities.shape[0]
# define placed_flags[i] == 1 <=> i-th column of arr has already been assinged a place in the permutation
placed_flags = np.zeros(ncols, dtype=int)
# find two most similar columns. Initialize two lists with tham.
first_col_index, second_col_index = np.unravel_index(similarities.argmax(), similarities.shape)
first_tail = [first_col_index]
second_tail = [second_col_index]
placed_flags[first_col_index] = 1
placed_flags[second_col_index] = 1
# the main greedy loop
for _ in range(ncols - 2):
# find column most similar to the last element of any of the two lists, append it to the corresponding list
similarities_to_first = similarities[:, first_tail[-1]] - placed_flags * HUGE_NUMBER
similarities_to_second = similarities[:, second_tail[-1]] - placed_flags * HUGE_NUMBER
first_argmax = similarities_to_first.argmax()
second_argmax = similarities_to_second.argmax()
if similarities_to_first[first_argmax] >= similarities_to_second[second_argmax]:
idx = first_argmax
first_tail.append(idx)
else:
idx = second_argmax
second_tail.append(idx)
# mark the chosen column as placed
placed_flags[idx] = 1
permutation = second_tail[::-1] + first_tail
return permutation
# todo rename to reflect what it does, not only how it does it
def run_greedy_algorithm_on_composition_array(arr, row_weights=None):
"""
Given a composition array, use a greedy algorithm to find a permutation of columns that will try to minimize the
total weighted number of gaps in the rows of the array.
:param arr: numpy array with zeros and ones
:param row_weights: 1D numpy array with len equal to len(arr). Provides weights for each row.
:return:
"""
similarities = columns_similarities_matrix(arr, row_weights=row_weights)
return find_columns_permutation_greedily(similarities)
# todo rename to reflect what it does, not only how it does it
def run_randomized_greedy_algorithm(arr, row_weights=None, seeds=DEFAULT_SEEDS, noise_prob=DEFAULT_NOISE_PROB):
"""
For a 2D np.array arr, find a permutation of columns that approximately minimizes the row-weighted number of gaps in
the rows of the permuted array. An approximate randomized greedy algorithm is used.
:param arr: np.array
:param seeds: number of different random perturbations to figh sticking in local minima.
:return: a list of indices representing an approximately optimal permutation of columns of arr
"""
arr = arr.astype(int)
# Compute similarities matrix
similarities = columns_similarities_matrix(arr, row_weights=row_weights)
best_found_permutation = None
best_found_gaps_count = HUGE_NUMBER
for seed in range(seeds + 1):
# Perturb similarities matrix if seed != 0
if seed == 0:
noise = np.zeros_like(similarities)
else:
np.random.seed(seed)
noise = (np.random.uniform(0, 1, size=similarities.shape) < noise_prob).astype(int)
np.random.seed(datetime.datetime.now().microsecond)
np.fill_diagonal(noise, 0)
noisy_similarities = similarities + noise
permutation = find_columns_permutation_greedily(noisy_similarities)
# Compute the target value for the found permutation, compare with current best.
gaps = get_total_gaps_in_rows(arr[:, permutation], row_weights=row_weights)
if gaps < best_found_gaps_count:
best_found_permutation = permutation
best_found_gaps_count = gaps
return best_found_permutation
def get_permutations(chunks, composition_array, chunks_ordering='minimize gaps', sets_ordering=None,
reverse_chunks_order=True, reverse_sets_order=True,
max_bruteforce_size=DEFAULT_MAX_BRUTEFORCE_SIZE,
seeds=DEFAULT_SEEDS, noise_prob=DEFAULT_NOISE_PROB):
"""
Given chunks and composition array, get permutations which will order the chunks and the sets according to specified
ordering methods.
:param chunks, composition_array: as returned by get_chunks_and_composition_array
For explanation of other params, see docstring to supervenn()
:return: a dict of the form {'chunks_ordering': [3, 2, 5, 4, 1, 6, 0], 'sets_ordering': [2, 0, 1, 3]}
"""
chunk_sizes = [len(chunk) for chunk in chunks]
set_sizes = composition_array.dot(np.array(chunk_sizes))
chunks_case = {
'sizes': chunk_sizes,
'param': 'chunks_ordering',
'array': composition_array,
'row_weights': None,
'ordering': chunks_ordering,
'allowed_orderings': ['size', 'occurrence', 'random', 'minimize gaps'] + ['occurence'], # todo remove with typo
'reverse': reverse_chunks_order
}
if chunks_ordering == 'occurence':
warnings.warn('Please use chunks_ordering="occurrence" (with double "r") instead of "occurence" (spelling fixed'
'in 0.3.0). The incorrect variant is still supported, but will be removed in a future version')
sets_case = {
'sizes': set_sizes,
'param': 'sets_ordering',
'array': composition_array.T,
'row_weights': chunk_sizes,
'ordering': sets_ordering,
'allowed_orderings': ['size', 'chunk count', 'random', 'minimize gaps', None],
'reverse': reverse_sets_order
}
permutations_ = {}
for case in chunks_case, sets_case:
if case['ordering'] not in case['allowed_orderings']:
raise ValueError('Unknown {}: {} (should be one of {})'
.format(case['param'], case['ordering'], case['allowed_orderings']))
if case['ordering'] == 'size':
permutation = np.argsort(case['sizes'])
elif case['ordering'] in ['occurrence', 'chunk count'] + ['occurence']:
permutation = np.argsort(case['array'].sum(0))
elif case['ordering'] == 'random':
permutation = np.array(range(len(case['sizes'])))
np.random.shuffle(permutation)
elif case['ordering'] is None:
permutation = np.array(range(len(case['sizes'])))
elif case['ordering'] == 'minimize gaps':
if len(case['sizes']) <= min(max_bruteforce_size, BRUTEFORCE_SIZE_HARD_LIMIT):
permutation = find_best_columns_permutation_bruteforce(case['array'], row_weights=case['row_weights'])
else:
permutation = run_randomized_greedy_algorithm(case['array'], seeds=seeds, noise_prob=noise_prob,
row_weights=case['row_weights'])
else:
raise ValueError(case['ordering'])
if case['ordering'] is not None and case['reverse']:
permutation = permutation[::-1]
permutations_[case['param']] = permutation
return permutations_
def _get_ordered_chunks_and_composition_array(sets, **kwargs):
"""
Wrapper for get_permutations, used only for testing
:param sets: list of sets
:param kwargs: all arguments to get_permutations except for chunks and composition_array,
:return:
"""
chunks, composition_array = get_chunks_and_composition_array(sets)
permutations_ = get_permutations(chunks, composition_array, **kwargs)
ordered_chunks = [chunks[i] for i in permutations_['chunks_ordering']]
ordered_composition_array = composition_array[:, permutations_['chunks_ordering']]
ordered_composition_array = ordered_composition_array[permutations_['sets_ordering'], :]
return ordered_chunks, ordered_composition_array
================================================
FILE: supervenn/_plots.py
================================================
# -*- coding: utf-8 -*-
"""
Routines for plotting multiple sets.
"""
from functools import partial
import warnings
import numpy as np
import matplotlib.gridspec as gridspec
import matplotlib.pyplot as plt
from supervenn._algorithms import (
break_into_chunks,
get_chunks_and_composition_array,
get_permutations,
DEFAULT_MAX_BRUTEFORCE_SIZE,
DEFAULT_SEEDS,
DEFAULT_NOISE_PROB)
DEFAULT_FONTSIZE = 12
class SupervennPlot(object):
"""
Attributes
----------
axes: `dict
a dict containing all the plot's axes under descriptive keys: 'main', 'top_side_plot', 'right_side_plot',
'unused' (the small empty square in the top right corner)
figure: matplotlib.figure.Figure
figure containing the plot.
chunks: dict
a dictionary allowing to get the contents of chunks. It has frozensets of key indices as keys and chunks
as values.
Methods
-------
get_chunk(set_indices)
get a chunk by the indices of its defining sets without them to a frozenset first
"""
def __init__(self, axes, figure, chunks_dict):
self.axes = axes
self.figure = figure
self.chunks = chunks_dict
def get_chunk(self, set_indices):
"""
Get the contents of a chunk defined by the sets indicated by sets_indices. Indices refer to the original sets
order as it was passed to supervenn() function (any reordering of sets due to use of sets_ordering params is
ignored).
For example .get_chunk_by_set_indices([1,5]) will return the chunk containing all the items that are in
sets[1] and sets[5], but not in any of the other sets.
supervenn() function, the
:param set_indices: iterable of integers, referring to positions in sets list, as passed into supervenn().
:return: chunk with items, that are in each of the sets with indices from set_indices, but not in any of the
other sets.
"""
return self.chunks[frozenset(set_indices)]
def get_alternated_ys(ys_count, low, high):
"""
A helper function generating y-positions for x-axis annotations, useful when some annotations positioned along the
x axis are too crowded.
:param ys_count: integer from 1 to 3.
:param low: lower bound of the area designated for annotations
:param high: higher bound for thr area designated for annotations.
:return:
"""
if ys_count not in [1, 2, 3]:
raise ValueError('Argument ys_count should be 1, 2 or 3.')
if ys_count == 1:
coefs = [0.5]
vas = ['center']
elif ys_count == 2:
coefs = [0.15, 0.85]
vas = ['bottom', 'top']
else:
coefs = [0.15, 0.5, 0.85]
vas = ['bottom', 'center', 'top']
ys = [low + coef * (high - low) for coef in coefs]
return ys, vas
def plot_binary_array(arr, ax=None, col_widths=None, row_heights=None, min_width_for_annotation=1,
row_annotations=None, row_annotations_y=0.5,
col_annotations=None, col_annotations_area_height=0.75, col_annotations_ys_count=1,
rotate_col_annotations=False,
color_by='row', bar_height=1, bar_alpha=0.6, bar_align='edge', color_cycle=None,
alternating_background=True, fontsize=DEFAULT_FONTSIZE):
"""
Visualize a binary array as a grid with variable sized columns and rows, where cells with 1 are filled using bars
and cells with 0 are blank.
:param arr: numpy.array of zeros and ones
:param ax: axis to plot into (current axis by default)
:param col_widths: widths for grid columns, must have len equal to arr.shape[1]
:param row_heights: heights for grid rows, must have len equal to arr.shape[0]
:param min_width_for_annotation: don't annotate column with its size if size is less than this value (default 1)
:param row_annotations: annotations for each row, plotted in the middle of the row
:param row_annotations_y: a number in (0, 1), position for row annotations in the row. Default 0.5 - center of row.
:param col_annotations: annotations for columns, plotted in the bottom, below the x axis.
:param col_annotations_area_height: height of area for column annotations in inches, 1 by default
:param col_annotations_ys_count: 1 (default), 2, or 3 - use to reduce clutter in column annotations area
:param rotate_col_annotations: True / False
:param color_by: 'row' (default) or 'column'. If 'row', all cells in same row are same color, etc.
:param bar_height: height of cell fill as a fraction of row height, a number in (0, 1).
:param bar_alpha: alpha for cell fills.
:param bar_align: vertical alignment of bars, 'edge' (defaulr) or 'center'. Only matters when bar_height < 1.
:param color_cycle: a list of colors, given as names of matplotlib named colors, or hex codes (e.g. '#1f77b4')
:param alternating_background: True (default) / False - give avery second row a slight grey tint
:param fontsize: font size for annotations (default {}).
""".format(DEFAULT_FONTSIZE)
if row_heights is None:
row_heights = [1] * arr.shape[0]
if col_widths is None:
col_widths = [1] * arr.shape[1]
if len(row_heights) != arr.shape[0]:
raise ValueError('len(row_heights) doesnt match number of rows of array')
if len(col_widths) != arr.shape[1]:
raise ValueError('len(col_widths) doesnt match number of columns of array')
allowed_argument_values = {
'bar_align': ['center', 'edge'],
'color_by': ['row', 'column'],
'col_annotations_ys_count': [1, 2, 3],
}
for argument_name, allowed_argument_values in allowed_argument_values.items():
if locals()[argument_name] not in allowed_argument_values:
raise ValueError('Argument {} should be one of {}'.format(argument_name, allowed_argument_values))
if not 0 <= row_annotations_y <= 1:
raise ValueError('row_annotations_y should be a number between 0 and 1')
if color_cycle is None:
color_cycle = plt.rcParams['axes.prop_cycle'].by_key()['color']
grid_xs = np.insert(np.cumsum(col_widths), 0, 0)[:-1]
grid_ys = np.insert(np.cumsum(row_heights), 0, 0)[:-1]
if ax is not None:
plt.sca(ax)
# BARS
for row_index, (row, grid_y, row_height) in enumerate(zip(arr, grid_ys, row_heights)):
bar_y = grid_y + 0.5 * row_height if bar_align == 'center' else grid_y
# alternating background
if alternating_background and row_index % 2:
plt.barh(y=bar_y, left=0, width=sum(col_widths), height=bar_height * row_height, align=bar_align,
color='grey', alpha=0.15)
for col_index, (is_filled, grid_x, col_width) in enumerate(zip(row, grid_xs, col_widths)):
if is_filled:
color_index = row_index if color_by == 'row' else col_index
color = color_cycle[color_index % len(color_cycle)]
plt.barh(y=bar_y, left=grid_x, width=col_width, height=bar_height * row_height, align=bar_align,
color=color, alpha=bar_alpha)
# ROW ANNOTATIONS
if row_annotations is not None:
for row_index, (grid_y, row_height, annotation) in enumerate(zip(grid_ys, row_heights, row_annotations)):
annot_y = grid_y + row_annotations_y * row_height
plt.annotate(str(annotation), xy=(0.5 * sum(col_widths), annot_y),
ha='center', va='center', fontsize=fontsize)
# COL ANNOTATIONS
min_y = 0
if col_annotations is not None:
min_y = - 1.0 * col_annotations_area_height / plt.gcf().get_size_inches()[1] * arr.shape[0]
plt.axhline(0, c='k')
annot_ys, vas = get_alternated_ys(col_annotations_ys_count, min_y, 0)
for col_index, (grid_x, col_width, annotation) in enumerate(zip(grid_xs, col_widths, col_annotations)):
annot_y = annot_ys[col_index % len(annot_ys)]
if col_width >= min_width_for_annotation:
plt.annotate(str(annotation), xy=(grid_x + col_width * 0.5, annot_y),
ha='center', va=vas[col_index % len(vas)], fontsize=fontsize,
rotation=90 * rotate_col_annotations)
plt.xlim(0, sum(col_widths))
plt.ylim(min_y, sum(row_heights))
plt.xticks(grid_xs, [])
plt.yticks(grid_ys, [])
plt.grid(True)
def side_plot(values, widths, orient, fontsize=DEFAULT_FONTSIZE, min_width_for_annotation=1, rotate_annotations=False,
color='tab:gray'):
"""
Barplot with multiple bars of variable width right next to each other, with an option to rotate the plot 90 degrees.
:param values: the values to be plotted.
:param widths: Widths of bars
:param orient: 'h' / 'horizontal' (default) or 'v' / 'vertical'
:param fontsize: font size for annotations
:param min_width_for_annotation: for horizontal plot, don't annotate bars of widths less than this value (to avoid
clutter. Default 1 - annotate all.)
:param rotate_annotations: True/False, whether to print annotations vertically instead of horizontally
:param color: color of bars, default 'tab:gray'
"""
bar_edges = np.insert(np.cumsum(widths), 0, 0)
annotation_positions = [0.5 * (begin + end) for begin, end in zip(bar_edges[:-1], bar_edges[1:])]
max_value = max(values)
if orient in ['h', 'horizontal']:
horizontal = True
plt.bar(x=bar_edges[:-1], height=values, width=widths, align='edge', alpha=0.5, color=color)
ticks = plt.xticks
lim = plt.ylim
elif orient in ['v', 'vertical']:
horizontal = False
plt.barh(y=bar_edges[:-1], width=values, height=widths, align='edge', alpha=0.5, color=color)
ticks = plt.yticks
lim = plt.xlim
else:
raise ValueError('Unknown orient: {} (should be "h" or "v")'.format(orient))
for i, (annotation_position, value, width) in enumerate(zip(annotation_positions, values, widths)):
if width < min_width_for_annotation and horizontal:
continue
x, y = 0.5 * max_value, annotation_position
if horizontal:
x, y = y, x
plt.annotate(value, xy=(x, y), ha='center', va='center',
rotation=rotate_annotations * 90, fontsize=fontsize)
ticks(bar_edges, [])
lim(0, max(values))
plt.grid(True)
def get_widths_balancer(widths, minmax_ratio=0.02):
"""
Given a list of positive numbers, find a linear function, such that when applied to the numbers, the maximum value
remains the same, and the minimum value is minmax_ratio times the maximum value.
:param widths: list of numbers
:param minmax_ratio: the desired max / min ratio in the transformed list.
:return: a linear function with one float argument that has the above property
"""
if not 0 <= minmax_ratio <= 1:
raise ValueError('minmax_ratio must be between 0 and 1')
max_width = max(widths)
min_width = min(widths)
if 1.0 * min_width / max_width >= minmax_ratio:
slope = 1
intercept = 0
else:
slope = max_width * (1.0 - minmax_ratio) / (max_width - min_width)
intercept = max_width * (max_width * minmax_ratio - min_width) / (max_width - min_width)
def balancer(width):
return slope * width + intercept
return balancer
def remove_ticks(ax):
ax.set_xticks([])
ax.set_yticks([])
def setup_axes(side_plots, figsize=None, dpi=None, ax=None, side_plot_width=1.5):
"""
Set up axes for plot and return them in a dictionary. The dictionary may include the following keys:
- 'main': always present
- 'top_side_plot': present if side_plots = True, 'both' or 'top'
- 'right_side_plot': present if side_plots = True, 'both' or 'right'
- 'unused': present if side_plots = 'True' or 'both' (unused area in the top right corner)
:param side_plots: True / False / 'top' / 'right'
:param figsize: deprecated, will be removed in future versions
:param dpi: deprecated, will be removed in future versions
:param ax: optional encasing axis to plot into, default None - plot into current axis.
:param side_plot_width: side plots width in inches, default 1.5
:return: dict with string as keys and axes as values, as described above.
"""
if side_plots not in (True, False, 'top', 'right'):
raise ValueError('Incorrect value for side_plots: {}'.format(side_plots))
# Define and optionally create the encasing axis for plot according to arguments
if ax is None:
if figsize is not None or dpi is not None:
plt.figure(figsize=figsize, dpi=dpi)
supervenn_ax = plt.gca()
else:
supervenn_ax = ax
# if no side plots, there is only one axis
if not side_plots:
axes = {'main': supervenn_ax}
# if side plots are used, break encasing axis into four smaller axis using matplotlib magic and store them in a dict
else:
bbox = supervenn_ax.get_window_extent().transformed(supervenn_ax.get_figure().dpi_scale_trans.inverted())
plot_width, plot_height = bbox.width, bbox.height
width_ratios = [plot_width - side_plot_width, side_plot_width]
height_ratios = [side_plot_width, plot_height - side_plot_width]
fig = supervenn_ax.get_figure()
get_gridspec = partial(gridspec.GridSpecFromSubplotSpec, subplot_spec=supervenn_ax.get_subplotspec(),
hspace=0, wspace=0)
if side_plots == True:
gs = get_gridspec(2, 2, height_ratios=height_ratios, width_ratios=width_ratios)
axes = {
'main': fig.add_subplot(gs[1, 0]),
'top_side_plot': fig.add_subplot(gs[0, 0]),
'unused': fig.add_subplot(gs[0, 1]),
'right_side_plot': fig.add_subplot(gs[1, 1])
}
elif side_plots == 'top':
gs = get_gridspec(2, 1, height_ratios=height_ratios)
axes = {
'main': fig.add_subplot(gs[1, 0]),
'top_side_plot': fig.add_subplot(gs[0, 0])
}
elif side_plots == 'right':
gs = get_gridspec(1, 2, width_ratios=width_ratios)
axes = {
'main': fig.add_subplot(gs[0, 0]),
'right_side_plot': fig.add_subplot(gs[0, 1])
}
# Remove tick from every axis, and set ticks length to 0 (we'll add ticks to the side plots manually later)
for ax in axes.values():
remove_ticks(ax)
ax.tick_params(which='major', length=0)
remove_ticks(supervenn_ax) # if side plots are used, supervenn_ax isn't included in axes dict
return axes
def supervenn(sets, set_annotations=None, figsize=None, side_plots=True,
chunks_ordering='minimize gaps', sets_ordering=None,
reverse_chunks_order=True, reverse_sets_order=True,
max_bruteforce_size=DEFAULT_MAX_BRUTEFORCE_SIZE, seeds=DEFAULT_SEEDS, noise_prob=DEFAULT_NOISE_PROB,
side_plot_width=1, min_width_for_annotation=1, widths_minmax_ratio=None, side_plot_color='gray',
dpi=None, ax=None, **kw):
"""
Plot a diagram visualizing relationship of multiple sets.
:param sets: list of sets
:param set_annotations: list of annotations for the sets
:param figsize: figure size
:param side_plots: True / False: add small barplots on top and on the right. On top, for each chunk it is shown,
how many sets does this chunk lie inslde. On the right, set sizes are shown.
:param chunks_ordering: method of ordering the chunks (columns of the grid)
- 'minimize gaps' (default): use a smart algorithm to find an order of columns giving fewer gaps in each row,
making the plot as readable as possible.
- 'size': bigger chunks go first (or last if reverse_chunks_order=False)
- 'occurence': chunks that are in most sets go first (or last if reverse_chunks_order=False)
- 'random': randomly shuffle the columns
:param sets_ordering: method of ordering the sets (rows of the grid)
- None (default): keep the order as it is passed
- 'minimize gaps': use a smart algorithm to find an order of rows giving fewer gaps in each column
- 'size': bigger sets go first (or last if reverse_sets_order = False)
- 'chunk count': sets that contain most chunks go first (or last if reverse_sets_order = False)
- 'random': randomly shuffle
:param reverse_chunks_order: True (default) / False when chunks_ordering is "size" or "occurence",
chunks with bigger corresponding property go first if reverse_chunks_order=True, smaller go first if False.
:param reverse_sets_order: True / False, works the same way as reverse_chunks_order
:param max_bruteforce_size: maximal number of items for which bruteforce method is applied to find permutation
:param seeds: number of different random seeds for the randomized greedy algorithm to find permutation
:param noise_prob: probability of given element being equal to 1 in the noise array for randomized greedy algorithm
:param side_plot_width: width of side plots in inches (default 1.5)
:param side_plot_color: color of bars in side plots, default 'gray'
:param dpi: figure DPI
:param ax: axis to plot into. If ax is specified, figsize and dpi will be ignored.
:param min_width_for_annotation: for horizontal plot, don't annotate bars of widths less than this value (to avoid
clutter)
:param widths_minmax_ratio: desired max/min ratio of displayed chunk widths, default None (show actual widths)
:param rotate_col_annotations: True / False, whether to print annotations vertically
:param fontsize: font size for all text elements
:param row_annotations_y: a number in (0, 1), position for row annotations in the row. Default 0.5 - center of row.
:param col_annotations_area_height: height of area for column annotations in inches, 1 by default
:param col_annotations_ys_count: 1 (default), 2, or 3 - use to reduce clutter in column annotations area
:param color_by: 'row' (default) or 'column'. If 'row', all cells in same row are same color, etc.
:param bar_height: height of cell fill as a fraction of row height, a number in (0, 1).
:param bar_alpha: alpha for cell fills.
:param bar_align: vertical alignment of bars, 'edge' (default) or 'center'. Only matters when bar_height < 1.
:param color_cycle: a list of set colors, given as names of matplotlib named colors, or hex codes (e.g. '#1f77b4')
:param alternating_background: True (default) / False - give avery second row a slight grey tint
:return: SupervennPlot instance with attributes `axes`, `figure`, `chunks`
and method `get_chunk(set_indices)`. See docstring to returned object.
"""
if figsize is not None or dpi is not None:
warnings.warn(
'Parameters figsize and dpi of supervenn() are deprecated and will be removed in a future version.\n'
'Instead of this:\n'
' supervenn(sets, figsize=(8, 5), dpi=90)'
'\nPlease either do this:\n'
' plt.figure(figsize=(8, 5), dpi=90)\n'
' supervenn(sets)\n'
'or plot into an existing axis by passing it as the ax argument:\n'
' supervenn(sets, ax=my_axis)\n'
)
axes = setup_axes(side_plots, figsize, dpi, ax, side_plot_width)
if set_annotations is None:
set_annotations = ['set_{}'.format(i) for i in range(len(sets))]
chunks, composition_array = get_chunks_and_composition_array(sets)
# Find permutations of rows and columns
permutations_ = get_permutations(
chunks,
composition_array,
chunks_ordering=chunks_ordering,
sets_ordering=sets_ordering,
reverse_chunks_order=reverse_chunks_order,
reverse_sets_order=reverse_sets_order,
max_bruteforce_size=max_bruteforce_size,
seeds=seeds,
noise_prob=noise_prob)
# Apply permutations
chunks = [chunks[i] for i in permutations_['chunks_ordering']]
composition_array = composition_array[:, permutations_['chunks_ordering']]
composition_array = composition_array[permutations_['sets_ordering'], :]
set_annotations = [set_annotations[i] for i in permutations_['sets_ordering']]
# Main plot
chunk_sizes = [len(chunk) for chunk in chunks]
if widths_minmax_ratio is not None:
widths_balancer = get_widths_balancer(chunk_sizes, widths_minmax_ratio)
col_widths = [widths_balancer(chunk_size) for chunk_size in chunk_sizes]
effective_min_width_for_annotation = widths_balancer(min_width_for_annotation)
else:
col_widths = chunk_sizes
effective_min_width_for_annotation = min_width_for_annotation
plot_binary_array(
arr=composition_array,
row_annotations=set_annotations,
col_annotations=chunk_sizes,
ax=axes['main'],
col_widths=col_widths,
min_width_for_annotation=effective_min_width_for_annotation,
**kw)
xlim = axes['main'].get_xlim()
ylim = axes['main'].get_ylim()
fontsize = kw.get('fontsize', DEFAULT_FONTSIZE)
plt.xlabel('ITEMS', fontsize=fontsize)
plt.ylabel('SETS', fontsize=fontsize)
# Side plots
if 'top_side_plot' in axes:
plt.sca(axes['top_side_plot'])
side_plot(composition_array.sum(0), col_widths, 'h',
min_width_for_annotation=effective_min_width_for_annotation,
rotate_annotations=kw.get('rotate_col_annotations', False), color=side_plot_color, fontsize=fontsize)
plt.xlim(xlim)
if 'right_side_plot' in axes:
plt.sca(axes['right_side_plot'])
side_plot([len(sets[i]) for i in permutations_['sets_ordering']], [1] * len(sets), 'v', color=side_plot_color,
fontsize=fontsize)
plt.ylim(ylim)
plt.sca(axes['main'])
return SupervennPlot(axes, plt.gcf(), break_into_chunks(sets)) # todo: break_into_chunks is called twice, fix
================================================
FILE: supervenn/_utils.py
================================================
from collections import defaultdict
import doctest
import sys
import pandas as pd
def make_sets_from_chunk_sizes(sizes_df):
"""
Given a pandas.DataFrame with sizes of intersections, produces synthetic sets of integers that
have exactly these intersection sizes.
It is a temporary roundabout before proper handling of intersection sizes without
the necessity for physical sets is implemented.
If your intersection sizes are huge, say in the tens of millions and higher, I recommend to scale
th numbers down to avoid using up too much memory. Don't forget to cast the scaled numbers to integer though.
:param sizes_df: pd.DataFrame, must have the following structure:
- For N sets, it must have N boolean columns and the last integer column, so N+1 columns in total.
- The names of the boolean columns are the names (labels) of the sets, the name of the integer column doesn't matter.
- Each row represents an unique intersection (chunk) of the sets. The boolean value in column 'set_x' indicate whether
this chunk lies within set_x. The integer value represents the size of the chunk.
- The index of the dataframe doesn't matter.
- 0's and 1's instead of booleans will work too.
For example, consider the following dataframe
set_1 set_2 set_3 size
0 False True True 1
1 True False False 3
2 True False True 2
3 True True False 1
It represents a configuration of three sets such that
- [row 0] there is one element that lies in set_2 and set_3 but not in set_1
- [row 1] there are three elements that lie in set_1 only and not in set_2 or set_3
- etc two more rows.
:return: sets, labels
where sets is a list of python sets, and labels is the list of set names (boolean colums names)
so the result can be used as follows:
sets, labels = make_sets_from_chunk_sizes(df)
supervenn(sets, labels, ...)
>>> values = [(False, True, True, 1), (True, False, False, 3), (True, False, True, 2), (True, True, False, 1)]
>>> df = pd.DataFrame(values, columns=['set_1', 'set_2', 'set_3', 'size'])
>>> sets, labels = make_sets_from_chunk_sizes(df)
>>> sets
[{1, 2, 3, 4, 5, 6}, {0, 6}, {0, 4, 5}]
>>> values = [(0, 1, 1, 1), (1, 0, 0, 3), (1, 0, 1, 2), (1, 1, 0, 1)]
>>> df = pd.DataFrame(values, columns=['set_1', 'set_2', 'set_3', 'size'])
>>> sets, labels = make_sets_from_chunk_sizes(df)
>>> sets
[{1, 2, 3, 4, 5, 6}, {0, 6}, {0, 4, 5}]
"""
sets = defaultdict(set)
idx = 0
for _, row in sizes_df.iterrows():
flags = row.iloc[:-1]
count = row.iloc[-1]
items = range(idx, idx + count)
try:
row_iterator = flags.iteritems() # deprecated since pandas 1.5
except AttributeError:
row_iterator = flags.items()
for col_name, bool_value in row_iterator:
if bool_value:
sets[col_name].update(items)
idx += count
sets_labels = sizes_df.columns[:-1].tolist()
return [sets[col] for col in sets_labels], sets_labels
doctest.testmod(sys.modules[__name__])
================================================
FILE: tests/test_algorithms.py
================================================
# -*- coding: utf-8 -*-
"""
Tests for _algorithms module.
"""
import unittest
import numpy as np
from collections import Counter
from itertools import product
from supervenn._algorithms import (
get_total_gaps_in_rows,
get_chunks_and_composition_array,
_get_ordered_chunks_and_composition_array,
find_best_columns_permutation_bruteforce,
run_greedy_algorithm_on_composition_array,
run_randomized_greedy_algorithm
)
def freeze_sets(sets):
"""
Convert an iterable of sets to a set of frozensets, and check that all sets are not repeated.
"""
counter = Counter(frozenset(set_) for set_ in sets)
assert max(counter.values()) == 1
return set(counter)
def is_ascending(sequence):
return all(sequence[i + 1] >= sequence[i] for i in range(len(sequence) - 1))
def array_is_binary(arr):
"""
:param arr: np.array
:return: True if the array only contains zeros and ones, False otherwise
"""
return not set(arr.flatten()) - {0, 1}
def make_random_sets(min_sets_count=1):
sets_count = np.random.randint(min_sets_count, 10)
max_item = np.random.choice([2 ** i for i in range(8)]) + 1
max_size = np.random.choice([2 ** i for i in range(8)]) + 1
sets = [set(np.random.randint(1, max_item, size=np.random.randint(1, max_size)))
for _ in range(sets_count)]
# decimate sets to introduce some empty sets into the list
for index in np.random.randint(0, len(sets), size=int(len(sets) / 10)):
sets[index] = set()
return sets
def is_permutation(sequence):
n = len(sequence)
if len(sequence) != n:
return False
if len(set(sequence)) != n:
return False
if set(sequence) != set(range(n)):
return False
return True
class TestGetTotalGaps(unittest.TestCase):
def test_all_zeros(self):
"""
Test that number of runs of a zero matrix is zero
"""
arr = np.zeros((2, 3), dtype=bool)
gaps_count = get_total_gaps_in_rows(arr)
self.assertEqual(gaps_count, 0)
def test_all_ones(self):
"""
Test that the number of runs of a matrix of ones is equal to the number of rows.
"""
arr = np.ones((7, 3), dtype=bool)
gaps_count = get_total_gaps_in_rows(arr)
self.assertEqual(gaps_count, 0)
def test_one_col(self):
"""
Test that the number of runs of a matrix with one col is equal to the number of ones
"""
rows_count = 100
arr = np.random.randint(0, 2, size=(rows_count, 1))
gaps_count = get_total_gaps_in_rows(arr)
self.assertEqual(gaps_count, 0)
def test_nontrivial_one(self):
arr = np.array([[1, 0, 1, 0],
[1, 0, 0, 1],
[0, 1, 0, 1]])
gaps_count = get_total_gaps_in_rows(arr)
self.assertEqual(gaps_count, 3)
def test_nontrivial_two(self):
arr = np.array([[1, 0, 0, 0],
[0, 0, 0, 1],
[0, 0, 0, 1]])
gaps_count = get_total_gaps_in_rows(arr)
self.assertEqual(gaps_count, 0)
def test_nontrivial_three(self):
arr = np.array([[1, 1, 0, 1],
[0, 1, 1, 0],
[1, 0, 1, 1]])
gaps_count = get_total_gaps_in_rows(arr)
self.assertEqual(gaps_count, 2)
class TestGetChunksAndCompositionArray(unittest.TestCase):
def test_single_set(self):
sets = [set(np.random.randint(1, 1000, size=100))]
chunks, arr = get_chunks_and_composition_array(sets)
self.assertEqual(chunks, sets)
self.assertEqual(arr.shape, (1, 1))
self.assertEqual(arr[0, 0], 1)
def test_one_empty(self):
set_ = set(np.random.randint(1, 1000, size=100))
sets = [set_, set()]
chunks, arr = get_chunks_and_composition_array(sets)
self.assertEqual(chunks, [set_])
self.assertEqual(arr.shape, (2, 1))
self.assertEqual(list(arr[:, 0]), [1, 0])
def test_disjoint_small(self):
sets = [{1}, {2}]
chunks, arr = get_chunks_and_composition_array(sets)
self.assertEqual(freeze_sets(sets), freeze_sets(chunks))
self.assertTrue(np.array_equal(arr, np.eye(2, dtype=int))) # fixme can be not eye
def test_disjoint_large(self):
set_count = 4
sets = [set(np.random.randint(1000 * i, 1000 * (i + 1), size=100 * (i + 1))) for i in range(set_count)]
chunks, arr = get_chunks_and_composition_array(sets)
self.assertEqual(freeze_sets(sets), freeze_sets(chunks))
# Verify that array is made of zeros and ones
self.assertTrue(array_is_binary(arr))
# Verify that each row and each column of arr sum to 1
self.assertEqual(set(arr.sum(0)), {1})
self.assertEqual(set(arr.sum(1)), {1})
def test_two_sets(self):
sets = [{1, 2, 3}, {3, 4}]
chunks, arr = get_chunks_and_composition_array(sets)
self.assertEqual(freeze_sets(chunks), {frozenset([1, 2]), frozenset([3]), frozenset([4])})
self.assertTrue(array_is_binary(arr))
def test_chunks_for_random_sets(self):
"""
For random sets, test that
1) the union of sets is the disjoint union of chunks
2) each chunk is either completely inside any set either completely outside
:return:
"""
for _ in range(100):
sets = make_random_sets()
chunks, arr = get_chunks_and_composition_array(sets)
all_elements = set.union(*sets)
self.assertEqual(set.union(*chunks), all_elements)
self.assertEqual(sum(len(chunk) for chunk in chunks), len(all_elements))
for chunk, set_ in product(chunks, sets):
self.assertTrue(not chunk - set_ or chunk - set_ == chunk)
def test_chunks_and_array(self):
"""
For random sets, test that the you indeed can recreate every original set as the union of chunks indicated in
the corresponding row of array.
"""
for _ in range(100):
sets = make_random_sets()
chunks, arr = get_chunks_and_composition_array(sets)
for (set_, row) in zip(sets, arr):
chunks_in_this_set = [chunk for is_included, chunk in zip(row, chunks) if is_included]
recreated_set = set.union(*chunks_in_this_set)
self.assertEqual(set_, recreated_set)
self.assertEqual(sum(len(chunk) for chunk in chunks_in_this_set), len(set_))
def make_test_for_algorithm(function):
class TestPermutationFinder(unittest.TestCase):
def test_single_set(self):
arr = np.array([[1]])
permutation = function(arr)
self.assertEqual(permutation, [0])
def test_single_chunk(self):
arr = np.array([1, 0, 1, 0]).reshape((-1, 1))
permutation = function(arr)
self.assertEqual(permutation, [0])
def test_two_cols(self):
for sets_count in 1, 2, 10:
col_1 = (np.random.uniform(0, 1, size=sets_count) > 0.6).astype(int)
col_2 = (np.random.uniform(0, 1, size=sets_count) > 0.6).astype(int)
col_1[0] = 1
col_2[0] = 1
arr = np.concatenate([col_1.reshape((-1, 1)), col_2.reshape((-1, 1))], 1)
permutation = function(arr)
self.assertIn(permutation, [[0, 1], [1, 0]])
def test_is_permutation(self):
for _ in range(100):
ncols = np.random.randint(1, 5)
nrows = np.random.randint(1, 5)
arr = (np.random.uniform(0, 1, size=(nrows, ncols)) > 0.5).astype(int)
arr[0][0] = 1
permutation = function(arr)
self.assertTrue(is_permutation(permutation))
def test_obvious_one(self):
arr = np.array([[1, 1, 1, 1],
[1, 0, 1, 0],
[1, 0, 1, 0]])
permutation = function(arr)
permutation_string = ''.join((str(i) for i in permutation))
self.assertIn('02', permutation_string + ' ' + permutation_string[::-1])
def test_obvious_two(self):
arr = np.array([[0, 1, 0, 1, 0, 0],
[1, 0, 1, 1, 0, 1],
[1, 0, 0, 1, 1, 0]])
permutation = function(arr)
permutation_string = ''.join((str(i) for i in permutation))
self.assertIn('03', permutation_string + ' ' + permutation_string[::-1])
def test_obvious_three(self):
arr = np.array([[0, 1, 0, 1, 1, 0],
[1, 0, 1, 1, 0, 1],
[1, 0, 0, 1, 0, 0],
[1, 1, 0, 1, 0, 0],
[1, 0, 0, 0, 1, 0]])
permutation = function(arr)
permutation_string = ''.join((str(i) for i in permutation))
self.assertIn('03', permutation_string + ' ' + permutation_string[::-1])
self.assertIn('13', permutation_string + ' ' + permutation_string[::-1])
return TestPermutationFinder
TestFindBestColumnPermutationBruteforce = make_test_for_algorithm(find_best_columns_permutation_bruteforce)
TestRunGreedyAlgorithmOnCompositionArray = make_test_for_algorithm(run_greedy_algorithm_on_composition_array)
TestRunRandomizedGreedyAlgorithm = make_test_for_algorithm(run_randomized_greedy_algorithm)
# TODO: A test that randomized is not worse than non-randomized
class TestRandomizedAlgorithmQuality(unittest.TestCase):
def test_quality(self):
for _ in range(100):
one_prob = np.random.uniform(0.1, 0.9)
nrows = np.random.randint(1, 30)
ncols = np.random.randint(1, 8)
arr = np.random.uniform(0, 1, size=(nrows, ncols)) < one_prob
permutation = run_randomized_greedy_algorithm(arr)
target = get_total_gaps_in_rows(arr[:, permutation])
best_permutation = find_best_columns_permutation_bruteforce(arr)
best_target = get_total_gaps_in_rows(arr[:, best_permutation])
self.assertLessEqual((target - best_target), 0.3 * best_target + 1)
class TestRandomizedAlgorithmReproducible(unittest.TestCase):
def test_reproducible(self):
arr = np.random.uniform(0, 1, size=(20, 20)) < 0.5
representations_set = set()
for _ in range(10):
permutation = run_randomized_greedy_algorithm(arr)
representations_set.add(str(permutation))
self.assertEqual(len(representations_set), 1)
class TestGetOrderedChunksAndCompositionArray(unittest.TestCase):
def test_order_chunks_size_descending(self):
for _ in range(10):
sets = make_random_sets()
chunks, _ = _get_ordered_chunks_and_composition_array(sets, chunks_ordering='size')
chunk_sizes_descending = is_ascending([len(chunk) for chunk in chunks][::-1])
self.assertTrue(chunk_sizes_descending)
def test_order_chunks_size_ascending(self):
for _ in range(10):
sets = make_random_sets()
chunks, _ = _get_ordered_chunks_and_composition_array(sets, chunks_ordering='size',
reverse_chunks_order=False)
chunk_sizes_ascending = is_ascending([len(chunk) for chunk in chunks])
self.assertTrue(chunk_sizes_ascending)
def test_order_chunks_occurence_descending(self):
for _ in range(10):
sets = make_random_sets()
_, composition_matrix = _get_ordered_chunks_and_composition_array(sets, chunks_ordering='occurrence')
occurences = composition_matrix.sum(0)
occurences_descending = is_ascending(occurences[::-1])
self.assertTrue(occurences_descending)
def test_order_chunks_occurence_ascending(self):
for _ in range(10):
sets = make_random_sets()
_, composition_matrix = _get_ordered_chunks_and_composition_array(sets, chunks_ordering='occurrence',
reverse_chunks_order=False)
occurences = composition_matrix.sum(0)
occurences_ascending = is_ascending(occurences)
self.assertTrue(occurences_ascending)
def test_order_chunks_random(self):
"""
Test that in 10 runs not all matrices are equal.
:return:
"""
done = False
while not done:
sets = make_random_sets(min_sets_count=9)
chunks, composition_matrix = get_chunks_and_composition_array(sets)
if len(chunks) == 1:
continue
representations_set = set()
for i in range(10):
_, composition_matrix = _get_ordered_chunks_and_composition_array(sets, chunks_ordering='random')
representations_set.add(str(composition_matrix))
self.assertGreater(len(representations_set), 1)
done = True
def test_order_sets_size_descending(self):
for _ in range(1):
sets = make_random_sets()
chunks, composition_matrix = _get_ordered_chunks_and_composition_array(sets, sets_ordering='size')
chunk_sizes = np.array([len(chunk) for chunk in chunks])
set_sizes = composition_matrix.dot(chunk_sizes.reshape((-1, 1))).flatten()
set_sizes_descending = is_ascending(set_sizes[::-1])
self.assertTrue(set_sizes_descending)
def test_order_sets_size_ascending(self):
for _ in range(1):
sets = make_random_sets()
chunks, composition_matrix = _get_ordered_chunks_and_composition_array(sets, sets_ordering='size',
reverse_sets_order=False)
chunk_sizes = np.array([len(chunk) for chunk in chunks])
set_sizes = composition_matrix.dot(chunk_sizes.reshape((-1, 1))).flatten()
set_sizes_ascending = is_ascending(set_sizes)
self.assertTrue(set_sizes_ascending)
def test_order_sets_chunk_count_descending(self):
for _ in range(10):
sets = make_random_sets()
_, composition_matrix = _get_ordered_chunks_and_composition_array(sets, sets_ordering='chunk count')
chunk_counts = composition_matrix.sum(1)
chunk_counts_descending = is_ascending(chunk_counts[::-1])
self.assertTrue(chunk_counts_descending)
def test_order_sets_chunk_count_ascending(self):
for _ in range(10):
sets = make_random_sets()
_, composition_matrix = _get_ordered_chunks_and_composition_array(sets, sets_ordering='chunk count',
reverse_sets_order=False)
chunk_counts = composition_matrix.sum(1)
chunk_counts_ascending = is_ascending(chunk_counts)
self.assertTrue(chunk_counts_ascending)
def test_order_sets_random(self):
done = False
while not done:
sets = make_random_sets(min_sets_count=9)
chunks, composition_matrix = get_chunks_and_composition_array(sets)
if len(chunks) == 1:
continue
representations_set = set()
for i in range(10):
_, composition_matrix = _get_ordered_chunks_and_composition_array(sets, sets_ordering='random')
representations_set.add(str(composition_matrix))
self.assertGreater(len(representations_set), 1)
done = True
if __name__ == '__main__':
unittest.main()
================================================
FILE: tests/test_plots.py
================================================
import matplotlib.pyplot as plt
from matplotlib.patches import Rectangle
import unittest
from supervenn._plots import supervenn
def rectangle_present(ax, expected_bbox_bounds):
"""
Check whether Axes ax contains a matplotlib.patches.Rectangle with given bbox bounds
:param ax: matplolib Axes
:param expected_bbox_bounds: expected bbox bounds [min_x, min_y, max_x, max_y]
:return: True / False
"""
found = False
for child in ax.get_children():
if isinstance(child, Rectangle) and child.get_bbox().bounds == expected_bbox_bounds:
found = True
break
return found
class TestSupervenn(unittest.TestCase):
def test_no_sets(self):
sets = []
with self.assertRaises(ValueError):
supervenn(sets)
plt.close()
def test_empty_sets(self):
sets = [set(), set()]
with self.assertRaises(ValueError):
supervenn(sets)
plt.close()
def test_no_side_plots(self):
"""
Test that the supervenn() runs without side plots, produces only one axes, and if given a list of one set
produces a rectangle of correct dimensions.
"""
set_size = 3
sets = [set(range(set_size))]
supervenn_plot = supervenn(sets, side_plots=False)
self.assertEqual(list(supervenn_plot.axes), ['main'])
self.assertEqual(len(supervenn_plot.figure.axes), 1)
expected_rectangle_bounds = (0.0, 0.0, float(set_size), 1.0)
self.assertTrue(rectangle_present(supervenn_plot.axes['main'], expected_rectangle_bounds))
plt.close()
def test_with_side_plots(self):
"""
Test that supervenn() runs with side plots, produces four axes, and if given a list of one set
produces a rectangle of correct dimensions.
"""
set_size = 3
sets = [set(range(set_size))]
supervenn_plot = supervenn(sets, side_plots=True)
self.assertEqual(set(supervenn_plot.axes), {'main', 'right_side_plot', 'top_side_plot', 'unused'})
expected_rectangle_bounds = (0.0, 0.0, float(set_size), 1.0) # same for all the three axes actually!
for ax_name, ax in supervenn_plot.axes.items():
if ax_name == 'unused':
continue
self.assertTrue(rectangle_present(ax, expected_rectangle_bounds))
plt.close()
def test_with_one_side_plot(self):
set_size = 3
sets = [set(range(set_size))]
for side_plots in ('top', 'right'):
supervenn_plot = supervenn(sets, side_plots=side_plots)
self.assertEqual(set(supervenn_plot.axes), {'main', '{}_side_plot'.format(side_plots)})
expected_rectangle_bounds = (0.0, 0.0, float(set_size), 1.0) # same for both axes
for ax_name, ax in supervenn_plot.axes.items():
self.assertTrue(rectangle_present(ax, expected_rectangle_bounds))
plt.close()
if __name__ == '__main__':
unittest.main()