Repository: sarfraznawaz2005/meter
Branch: master
Commit: d5505c850353
Files: 69
Total size: 135.8 KB
Directory structure:
gitextract_q4lycjzt/

├── .editorconfig
├── .gitattributes
├── .gitignore
├── LICENSE.md
├── README.md
├── composer.json
├── phpunit.xml
├── src/
│   ├── Charts/
│   │   ├── Chart.php
│   │   ├── CommandsTimeChart.php
│   │   ├── ConnectionsChart.php
│   │   ├── CpuChart.php
│   │   ├── DiskSpaceChart.php
│   │   ├── EventsTimeChart.php
│   │   ├── OverAllTimesChart.php
│   │   ├── QueriesTimeChart.php
│   │   ├── RequestMemoryChart.php
│   │   ├── RequestTimeChart.php
│   │   ├── SchedulesTimeChart.php
│   │   └── ServerMemoryChart.php
│   ├── Config/
│   │   └── config.php
│   ├── Console/
│   │   ├── PruneCommand.php
│   │   ├── PublishCommand.php
│   │   └── ServerMonitorCommand.php
│   ├── Helpers.php
│   ├── Http/
│   │   ├── Controllers/
│   │   │   ├── PagesController.php
│   │   │   └── TablesController.php
│   │   ├── Middleware/
│   │   │   └── BasicAuth.php
│   │   └── routes.php
│   ├── Meter.php
│   ├── MeterServiceProvider.php
│   ├── Migrations/
│   │   └── 2019_12_12_100000_create_meter_entries_table.php
│   ├── Models/
│   │   └── MeterModel.php
│   ├── Monitors/
│   │   ├── CommandMonitor.php
│   │   ├── CpuMonitor.php
│   │   ├── DiskSpaceMonitor.php
│   │   ├── EventMonitor.php
│   │   ├── HttpConnectionsMonitor.php
│   │   ├── MemoryMonitor.php
│   │   ├── Monitor.php
│   │   ├── QueryMonitor.php
│   │   ├── RequestMonitor.php
│   │   └── ScheduleMonitor.php
│   ├── Resources/
│   │   ├── Assets/
│   │   │   ├── meter.css
│   │   │   └── meter.js
│   │   └── Views/
│   │       ├── commands.blade.php
│   │       ├── components/
│   │       │   ├── chart.blade.php
│   │       │   └── table.blade.php
│   │       ├── dashboard.blade.php
│   │       ├── events.blade.php
│   │       ├── layout/
│   │       │   ├── filters.blade.php
│   │       │   ├── layout.blade.php
│   │       │   ├── links.blade.php
│   │       │   └── modal.blade.php
│   │       ├── queries.blade.php
│   │       ├── requests.blade.php
│   │       ├── schedules.blade.php
│   │       └── server.blade.php
│   ├── Tables/
│   │   ├── CommandsTable.php
│   │   ├── EventsTable.php
│   │   ├── QueriesTable.php
│   │   ├── RequestsTable.php
│   │   ├── SchedulesTable.php
│   │   └── Table.php
│   ├── Traits/
│   │   ├── FetchesStackTrace.php
│   │   ├── FormatsClosure.php
│   │   └── RegistersMonitors.php
│   └── Type.php
└── tests/
    ├── ConsoleTest.php
    └── MeterModelTest.php
================================================
FILE CONTENTS
================================================
================================================
FILE: .editorconfig
================================================
; This file is for unifying the coding style for different editors and IDEs.
; More information at http://editorconfig.org
root = true
[*]
charset = utf-8
indent_size = 4
indent_style = space
end_of_line = lf
insert_final_newline = true
trim_trailing_whitespace = true
[*.md]
trim_trailing_whitespace = false
================================================
FILE: .gitattributes
================================================
# Path-based git attributes
# https://www.kernel.org/pub/software/scm/git/docs/gitattributes.html
# Ignore all test and documentation with "export-ignore".
/.gitattributes export-ignore
/.gitignore export-ignore
/.travis.yml export-ignore
/phpunit.xml.dist export-ignore
/.scrutinizer.yml export-ignore
/tests export-ignore
/.editorconfig export-ignore
================================================
FILE: .gitignore
================================================
build
composer.lock
docs
vendor
coverage
todo.txt
push.sh
================================================
FILE: LICENSE.md
================================================
MIT License
Copyright (c) Sarfraz Ahmed
Permission is hereby granted, free of charge, to any person obtaining a copy
of this software and associated documentation files (the "Software"), to deal
in the Software without restriction, including without limitation the rights
to use, copy, modify, merge, publish, distribute, sublicense, and/or sell
copies of the Software, and to permit persons to whom the Software is
furnished to do so, subject to the following conditions:
The above copyright notice and this permission notice shall be included in all
copies or substantial portions of the Software.
THE SOFTWARE IS PROVIDED "AS IS", WITHOUT WARRANTY OF ANY KIND, EXPRESS OR
IMPLIED, INCLUDING BUT NOT LIMITED TO THE WARRANTIES OF MERCHANTABILITY,
FITNESS FOR A PARTICULAR PURPOSE AND NONINFRINGEMENT. IN NO EVENT SHALL THE
AUTHORS OR COPYRIGHT HOLDERS BE LIABLE FOR ANY CLAIM, DAMAGES OR OTHER
LIABILITY, WHETHER IN AN ACTION OF CONTRACT, TORT OR OTHERWISE, ARISING FROM,
OUT OF OR IN CONNECTION WITH THE SOFTWARE OR THE USE OR OTHER DEALINGS IN THE
SOFTWARE.
================================================
FILE: README.md
================================================
[](LICENSE.md)
[![Latest Version on Packagist][ico-version]][link-packagist]
[![Total Downloads][ico-downloads]][link-downloads]
# Laravel Meter
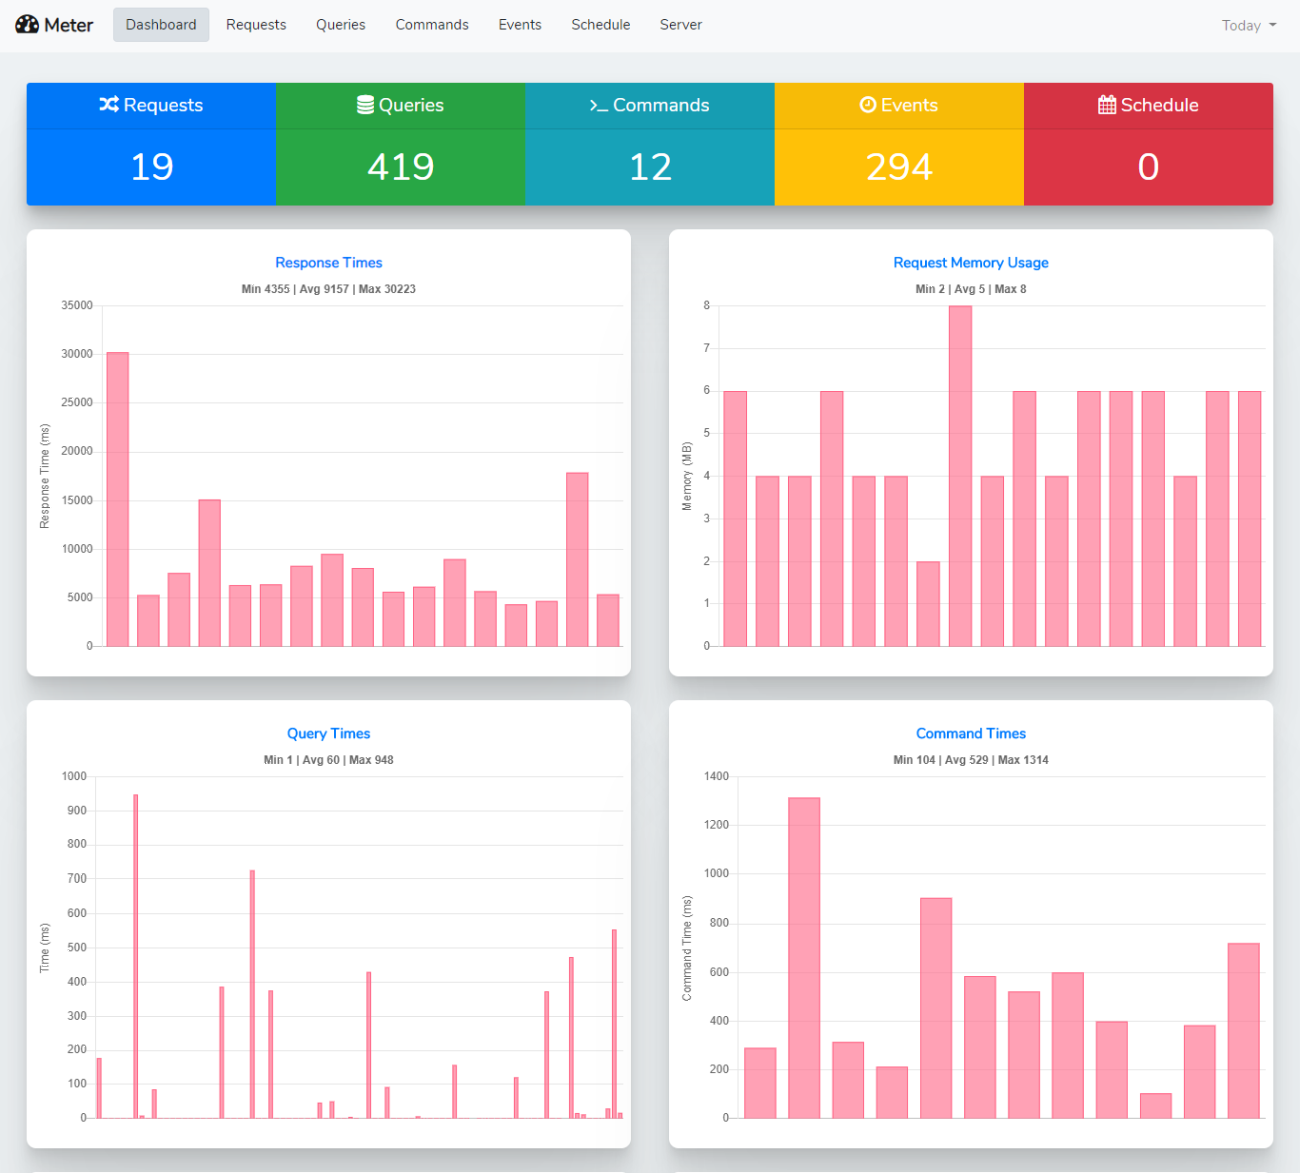
Laravel Meter monitors application performance for different things such as requests, commands, queries, events, etc and presents results in tables/charts. Think of it like Laravel Telescope but for performance monitoring.
## Requirements ##
- PHP >= 7.3
- Laravel 5.5+ | 6
## Configuration
Available options are:
- METER_DB_CONNECTION
` Database connection to use for meter entries. Default: mysql (uses default connection) `
- METER_PATH
` Path to access meter UI. Default: meter `
- METER_USERNAME
` Username to access meter UI. Default: null `
- METER_PASSWORD
` Password to access meter UI. Default: null `
- ignore_matched_string
` It helps to ignore the matched string in the query. Ex:`
```php
"ignore_matched_string" => [
"query" => [
"information_schema",
]
],
```
There are more options available, please check `config/meter.php` file for more details.
## Monitors ##
- Requests
- Queries
- Commands
- Events
- Schedule
- CPU Load
- Disk Space
- Server Memory
- HTTP Connections
## Screenshot ##
## Installation ##
Install via composer
```
composer require sarfraznawaz2005/meter
```
Publish package's config file by running below command:
```bash
php artisan vendor:publish --provider="Sarfraznawaz2005\Meter\MeterServiceProvider"
```
It should publish `config/meter.php` config file and migration file.
Now run `php artisan migrate` command to create `meter_entries` database table.
## Usage ##
Enable Meter in `config/meter.php` and setup any other options as needed. Meter UI will be visible at `path` config you set.
By default Meter monitors:
- Requests
- Queries
- Commands
- Events
- Schedule
To monitor server stuff:
- CPU Load
- Disk Space
- Server Memory
- HTTP Connections
You should use `meter:servermonitor` command. Schedule it in Laravel's console kernel file accordingly:
```php
// app/Console/Kernel.php
protected function schedule(Schedule $schedule)
{
$schedule->command('meter:servermonitor')->hourly(); // or daily
}
```
## Authentication ##
You can use `username` and `password` config options to setup basic HTTP authentication for Meter interface to be accessed. Once setup, user should provide correct username and password to access Meter page(s).
Alternatively, you can use `middleware` config option to apply your own auth middleware, etc
## Ignoring Things ##
You can use `ignore_paths` and `ignore_commands` config options to ignore desired pages or commands from being monitored by Meter.
## Data Pruning ##
You need to periodically remove meter data otherwise your database will turn big quickly. To prune meter data, you can setup prune command in Kernel file:
```php
$schedule->command('meter:prune')->daily();
// or
$schedule->command('meter:prune --days=7')->daily();
```
## Contributing
PRs are welcome. Thanks
## Security
If you discover any security related issues, please email sarfraznawaz2005@gmail.com instead of using the issue tracker.
## Credits
- [Sarfraz Ahmed][link-author]
- [All Contributors][link-contributors]
## License
Please see the [license file](LICENSE.md) for more information.
[ico-version]: https://img.shields.io/packagist/v/sarfraznawaz2005/meter.svg?style=flat-square
[ico-downloads]: https://img.shields.io/packagist/dt/sarfraznawaz2005/meter.svg?style=flat-square
[link-packagist]: https://packagist.org/packages/sarfraznawaz2005/meter
[link-downloads]: https://packagist.org/packages/sarfraznawaz2005/meter
[link-author]: https://github.com/sarfraznawaz2005
[link-contributors]: https://github.com/sarfraznawaz2005/meter/graphs/contributors
================================================
FILE: composer.json
================================================
{
"name": "sarfraznawaz2005/meter",
"description": "laravel package to find performance bottlenecks in your laravel application.",
"keywords": [
"laravel",
"performance",
"meter",
"log",
"request",
"queries",
"database",
"monitor",
"health"
],
"homepage": "https://github.com/sarfraznawaz2005/meter",
"license": "MIT",
"type": "library",
"authors": [
{
"name": "Sarfraz Ahmed",
"email": "sarfraznawaz2005@gmail.com",
"role": "Developer"
}
],
"require": {
"php": ">=7.3|>=8.0",
"illuminate/support": "~5|~6|~7|~8|~9",
"consoletvs/charts": "6.*",
"balping/json-raw-encoder": "^1.0"
},
"autoload": {
"psr-4": {
"Sarfraznawaz2005\\Meter\\": "src"
},
"files": [
"src/Helpers.php"
]
},
"autoload-dev": {
"psr-4": {
"Sarfraznawaz2005\\Meter\\Tests\\": "tests"
}
},
"scripts": {
"test": "vendor/bin/phpunit",
"test-coverage": "vendor/bin/phpunit --coverage-html coverage"
},
"config": {
"sort-packages": true
},
"extra": {
"laravel": {
"providers": [
"Sarfraznawaz2005\\Meter\\MeterServiceProvider"
]
}
}
}
================================================
FILE: phpunit.xml
================================================
<?xml version="1.0" encoding="UTF-8"?>
<phpunit bootstrap="vendor/autoload.php"
backupGlobals="false"
backupStaticAttributes="false"
colors="true"
verbose="true"
convertErrorsToExceptions="true"
convertNoticesToExceptions="true"
convertWarningsToExceptions="true"
processIsolation="false"
stopOnFailure="false">
<testsuites>
<testsuite name="Test Suite">
<directory>tests</directory>
</testsuite>
</testsuites>
<filter>
<whitelist>
<directory suffix=".php">src/</directory>
</whitelist>
</filter>
<logging>
<log type="tap" target="build/report.tap"/>
<log type="junit" target="build/report.junit.xml"/>
<log type="coverage-html" target="build/coverage" charset="UTF-8" yui="true" highlight="true"/>
<log type="coverage-text" target="build/coverage.txt"/>
<log type="coverage-clover" target="build/logs/clover.xml"/>
</logging>
</phpunit>
================================================
FILE: src/Charts/Chart.php
================================================
<?php
namespace Sarfraznawaz2005\Meter\Charts;
use ConsoleTVs\Charts\Classes\Chartjs\Chart as BaseChart;
use Sarfraznawaz2005\Meter\Models\MeterModel;
abstract class Chart extends BaseChart
{
const COLOR_RED = '255, 99, 132';
const COLOR_BLUE = '0, 123, 255';
const COLOR_GREEN = '40, 167, 69';
const COLOR_YELLOW = '255, 193, 7';
protected $data = [];
/**
* Sets options for chart.
*
* @return void
*/
abstract protected function setOptions();
/**
* Sets data for chart.
*
* @param MeterModel $model
* @return void
*/
abstract protected function setData(MeterModel $model);
/**
* Gets labels for chart.
*
* @return mixed
*/
abstract protected function getLabels(): array;
/**
* Gets values for chart.
*
* @return mixed
*/
abstract protected function getValues(): array;
/**
* Sets DataSet for chart.
*
* @return void
*/
abstract protected function setDataSet();
/**
* Chart constructor.
* @param MeterModel $model
*/
public function __construct(MeterModel $model)
{
parent::__construct();
$this->setData($model);
$this->setOptions();
$this->labels($this->getLabels());
$this->setDataSet();
}
}
================================================
FILE: src/Charts/CommandsTimeChart.php
================================================
<?php
namespace Sarfraznawaz2005\Meter\Charts;
use Balping\JsonRaw\Raw;
use Sarfraznawaz2005\Meter\Models\MeterModel;
use Sarfraznawaz2005\Meter\Monitors\CommandMonitor;
use Sarfraznawaz2005\Meter\Type;
class CommandsTimeChart extends Chart
{
/**
* Sets options for chart.
*
* @return void
*/
protected function setOptions()
{
$this->options([
'responsive' => true,
'maintainAspectRatio' => false,
'title' => [
'display' => true,
'text' => [
'Min ' . round(collect($this->getValues())->pluck('y')->min()) . ' | ' .
'Avg ' . round(collect($this->getValues())->pluck('y')->average()) . ' | ' .
'Max ' . round(collect($this->getValues())->pluck('y')->max())
],
],
'legend' => false,
'scales' => [
'yAxes' => [[
'ticks' => [
'beginAtZero' => true,
],
'scaleLabel' => [
'display' => true,
'labelString' => 'Command Time (ms)'
],
]],
'xAxes' => [[
'display' => false,
//'type' => 'time',
'time' => [
'displayFormats' => ['hour' => 'MMM D hA'],
],
'ticks' => [
'beginAtZero' => true,
'autoSkip' => true,
'autoSkipPadding' => 30,
'maxRotation' => 0,
],
'gridLines' => ['offsetGridLines' => true],
'offset' => true,
]]
],
'tooltips' => [
'callbacks' => [
'label' => new Raw('function(item, data) { return "Time: " + data.datasets[item.datasetIndex].data[item.index].y + " (Command: " + data.datasets[item.datasetIndex].data[item.index].x + ")"}')
]
],
], true);
}
/**
* Sets data for chart.
*
* @param MeterModel $model
* @return void
*/
protected function setData(MeterModel $model)
{
foreach ($model->type(Type::COMMAND)->filtered()->orderBy('id', 'asc')->get() as $item) {
if (isset($item->content['time'])) {
$this->data[(string)$item->created_at] = [
'x' => $item->content['command'],
'y' => (int)$item->content['time'],
];
}
}
}
/**
* Gets labels for chart.
*
* @return mixed
*/
protected function getLabels(): array
{
return array_keys($this->data);
}
/**
* Gets values for chart.
*
* @return mixed
*/
protected function getValues(): array
{
return array_values($this->data);
}
/**
* Generates and returns chart
*
* @return void
*/
protected function setDataSet()
{
$type = config('meter.monitors.' . CommandMonitor::class . '.graph_type', 'bar');
$this->dataset('Command Time', $type, $this->getValues())
->color('rgb(' . static::COLOR_RED . ')')
->options([
'pointRadius' => 2,
'fill' => true,
'lineTension' => 0,
'borderWidth' => 1,
//'minBarLength' => 50,
'barPercentage' => 0.9
])
->backgroundcolor('rgba(' . static::COLOR_RED . ', 0.6)');
}
}
================================================
FILE: src/Charts/ConnectionsChart.php
================================================
<?php
namespace Sarfraznawaz2005\Meter\Charts;
use Sarfraznawaz2005\Meter\Models\MeterModel;
use Sarfraznawaz2005\Meter\Monitors\HttpConnectionsMonitor;
use Sarfraznawaz2005\Meter\Type;
class ConnectionsChart extends Chart
{
/**
* Sets options for chart.
*
* @return void
*/
protected function setOptions()
{
$this->options([
'responsive' => true,
'maintainAspectRatio' => false,
'title' => [
'display' => true,
'text' => [
'Min ' . round(collect($this->getValues())->min()) . ' | ' .
'Avg ' . round(collect($this->getValues())->average()) . ' | ' .
'Max ' . round(collect($this->getValues())->max())
],
],
'legend' => false,
'scales' => [
'yAxes' => [[
'ticks' => [
'beginAtZero' => true
],
]],
'xAxes' => [[
'display' => false,
'ticks' => [
'beginAtZero' => true,
'autoSkip' => true,
'autoSkipPadding' => 30,
'maxRotation' => 0,
],
'gridLines' => ['offsetGridLines' => true],
'offset' => true,
]]
],
], true);
}
/**
* Sets data for chart.
*
* @param MeterModel $model
* @return void
*/
protected function setData(MeterModel $model)
{
foreach ($model->type(Type::CONNECTIONS)->filtered()->orderBy('id', 'asc')->get() as $item) {
$this->data[(string)$item->created_at] = (int)$item->content['count'];
}
}
/**
* Gets labels for chart.
*
* @return mixed
*/
protected function getLabels(): array
{
return array_keys($this->data);
}
/**
* Gets values for chart.
*
* @return mixed
*/
protected function getValues(): array
{
return array_values($this->data);
}
/**
* Generates and returns chart
*
* @return void
*/
protected function setDataSet()
{
$type = config('meter.monitors.' . HttpConnectionsMonitor::class . '.graph_type', 'bar');
$this->dataset('Count', $type, $this->getValues())
->color('rgb(' . static::COLOR_RED . ')')
->options([
'pointRadius' => 2,
'fill' => true,
'lineTension' => 0,
'borderWidth' => 1,
//'minBarLength' => 50,
'barPercentage' => 0.9
])
->backgroundcolor('rgba(' . static::COLOR_RED . ', 0.6)');
}
}
================================================
FILE: src/Charts/CpuChart.php
================================================
<?php
namespace Sarfraznawaz2005\Meter\Charts;
use Sarfraznawaz2005\Meter\Models\MeterModel;
use Sarfraznawaz2005\Meter\Monitors\CpuMonitor;
use Sarfraznawaz2005\Meter\Type;
class CpuChart extends Chart
{
/**
* Sets options for chart.
*
* @return void
*/
protected function setOptions()
{
$this->options([
'responsive' => true,
'maintainAspectRatio' => false,
'title' => [
'display' => true,
'text' => [
'Min ' . round(collect($this->getValues())->min()) . ' | ' .
'Avg ' . round(collect($this->getValues())->average()) . ' | ' .
'Max ' . round(collect($this->getValues())->max())
],
],
'legend' => false,
'scales' => [
'yAxes' => [[
'ticks' => [
'beginAtZero' => true
],
]],
'xAxes' => [[
'display' => false,
'ticks' => [
'beginAtZero' => true,
'autoSkip' => true,
'autoSkipPadding' => 30,
'maxRotation' => 0,
],
'gridLines' => ['offsetGridLines' => true],
'offset' => true,
]]
],
], true);
}
/**
* Sets data for chart.
*
* @param MeterModel $model
* @return void
*/
protected function setData(MeterModel $model)
{
foreach ($model->type(Type::CPU)->filtered()->orderBy('id', 'asc')->get() as $item) {
$this->data[(string)$item->created_at] = (int)$item->content['percent'];
}
}
/**
* Gets labels for chart.
*
* @return mixed
*/
protected function getLabels(): array
{
return array_keys($this->data);
}
/**
* Gets values for chart.
*
* @return mixed
*/
protected function getValues(): array
{
return array_values($this->data);
}
/**
* Generates and returns chart
*
* @return void
*/
protected function setDataSet()
{
$type = config('meter.monitors.' . CpuMonitor::class . '.graph_type', 'bar');
$this->dataset('Percent', $type, $this->getValues())
->color('rgb(' . static::COLOR_RED . ')')
->options([
'pointRadius' => 2,
'fill' => true,
'lineTension' => 0,
'borderWidth' => 1,
//'minBarLength' => 50,
'barPercentage' => 0.9
])
->backgroundcolor('rgba(' . static::COLOR_RED . ', 0.6)');
}
}
================================================
FILE: src/Charts/DiskSpaceChart.php
================================================
<?php
namespace Sarfraznawaz2005\Meter\Charts;
use Sarfraznawaz2005\Meter\Models\MeterModel;
use Sarfraznawaz2005\Meter\Monitors\DiskSpaceMonitor;
use Sarfraznawaz2005\Meter\Type;
class DiskSpaceChart extends Chart
{
/**
* Sets options for chart.
*
* @return void
*/
protected function setOptions()
{
$this->options([
'responsive' => true,
'maintainAspectRatio' => false,
'title' => [
'display' => true,
'text' => [
'Min ' . round(collect($this->getValues())->min()) . ' | ' .
'Avg ' . round(collect($this->getValues())->average()) . ' | ' .
'Max ' . round(collect($this->getValues())->max())
],
],
'legend' => false,
'scales' => [
'yAxes' => [[
'ticks' => [
'beginAtZero' => true
],
]],
'xAxes' => [[
'display' => false,
'ticks' => [
'beginAtZero' => true,
'autoSkip' => true,
'autoSkipPadding' => 30,
'maxRotation' => 0,
],
'gridLines' => ['offsetGridLines' => true],
'offset' => true,
]]
],
], true);
}
/**
* Sets data for chart.
*
* @param MeterModel $model
* @return void
*/
protected function setData(MeterModel $model)
{
foreach ($model->type(Type::DISK)->filtered()->orderBy('id', 'asc')->get() as $item) {
$this->data[(string)$item->created_at] = (int)$item->content['percent'];
}
}
/**
* Gets labels for chart.
*
* @return mixed
*/
protected function getLabels(): array
{
return array_keys($this->data);
}
/**
* Gets values for chart.
*
* @return mixed
*/
protected function getValues(): array
{
return array_values($this->data);
}
/**
* Generates and returns chart
*
* @return void
*/
protected function setDataSet()
{
$type = config('meter.monitors.' . DiskSpaceMonitor::class . '.graph_type', 'bar');
$this->dataset('Percent', $type, $this->getValues())
->color('rgb(' . static::COLOR_RED . ')')
->options([
'pointRadius' => 2,
'fill' => true,
'lineTension' => 0,
'borderWidth' => 1,
//'minBarLength' => 50,
'barPercentage' => 0.9
])
->backgroundcolor('rgba(' . static::COLOR_RED . ', 0.6)');
}
}
================================================
FILE: src/Charts/EventsTimeChart.php
================================================
<?php
namespace Sarfraznawaz2005\Meter\Charts;
use Balping\JsonRaw\Raw;
use Sarfraznawaz2005\Meter\Models\MeterModel;
use Sarfraznawaz2005\Meter\Monitors\EventMonitor;
use Sarfraznawaz2005\Meter\Type;
class EventsTimeChart extends Chart
{
/**
* Sets options for chart.
*
* @return void
*/
protected function setOptions()
{
$this->options([
'responsive' => true,
'maintainAspectRatio' => false,
'title' => [
'display' => true,
'text' => [
'Min ' . round(collect($this->getValues())->pluck('y')->min()) . ' | ' .
'Avg ' . round(collect($this->getValues())->pluck('y')->average()) . ' | ' .
'Max ' . round(collect($this->getValues())->pluck('y')->max())
],
],
'legend' => false,
'scales' => [
'yAxes' => [[
'ticks' => [
'beginAtZero' => true,
],
'scaleLabel' => [
'display' => true,
'labelString' => 'Event Time (ms)'
],
]],
'xAxes' => [[
'display' => false,
//'type' => 'time',
'time' => [
'displayFormats' => ['hour' => 'MMM D hA'],
],
'ticks' => [
'beginAtZero' => true,
'autoSkip' => true,
'autoSkipPadding' => 30,
'maxRotation' => 0,
],
'gridLines' => ['offsetGridLines' => true],
'offset' => true,
]]
],
'tooltips' => [
'callbacks' => [
'label' => new Raw('function(item, data) { return "Time: " + data.datasets[item.datasetIndex].data[item.index].y + " (Event: " + data.datasets[item.datasetIndex].data[item.index].x + ")"}')
]
],
], true);
}
/**
* Sets data for chart.
*
* @param MeterModel $model
* @return void
*/
protected function setData(MeterModel $model)
{
foreach ($model->type(Type::EVENT)->filtered()->orderBy('id', 'asc')->get() as $item) {
if (isset($item->content['time'])) {
$this->data[(string)$item->created_at] = [
'x' => $item->content['name'],
'y' => (int)$item->content['time'],
];
}
}
}
/**
* Gets labels for chart.
*
* @return mixed
*/
protected function getLabels(): array
{
return array_keys($this->data);
}
/**
* Gets values for chart.
*
* @return mixed
*/
protected function getValues(): array
{
return array_values($this->data);
}
/**
* Generates and returns chart
*
* @return void
*/
protected function setDataSet()
{
$type = config('meter.monitors.' . EventMonitor::class . '.graph_type', 'bar');
$this->dataset('Event Time', $type, $this->getValues())
->color('rgb(' . static::COLOR_RED . ')')
->options([
'pointRadius' => 2,
'fill' => true,
'lineTension' => 0,
'borderWidth' => 1,
//'minBarLength' => 50,
'barPercentage' => 0.9
])
->backgroundcolor('rgba(' . static::COLOR_RED . ', 0.6)');
}
}
================================================
FILE: src/Charts/OverAllTimesChart.php
================================================
<?php
namespace Sarfraznawaz2005\Meter\Charts;
use Sarfraznawaz2005\Meter\Models\MeterModel;
use Sarfraznawaz2005\Meter\Monitors\CommandMonitor;
use Sarfraznawaz2005\Meter\Monitors\EventMonitor;
use Sarfraznawaz2005\Meter\Monitors\QueryMonitor;
use Sarfraznawaz2005\Meter\Monitors\RequestMonitor;
use Sarfraznawaz2005\Meter\Monitors\ScheduleMonitor;
use function foo\func;
class OverAllTimesChart extends Chart
{
/**
* Sets options for chart.
*
* @return void
*/
protected function setOptions()
{
$this->options([
'responsive' => true,
'maintainAspectRatio' => false,
'scales' => [
'yAxes' => [[
'ticks' => [
'beginAtZero' => true
],
]],
'xAxes' => [[
'display' => false,
]]
],
], true);
}
/**
* Sets data for chart.
*
* @param MeterModel $model
* @return void
*/
protected function setData(MeterModel $model)
{
foreach ($model->filtered()->orderBy('id', 'asc')->get() as $item) {
$time = 0;
if (isset($item->content['duration'])) {
$time = $item->content['duration'];
} elseif (isset($item->content['time'])) {
$time = $item->content['time'];
}
$this->data[(string)$item->created_at] = [
'type' => $item->type,
'time' => $time
];
}
}
/**
* Gets labels for chart.
*
* @return mixed
*/
protected function getLabels(): array
{
return array_keys($this->data);
}
/**
* Gets values for chart.
*
* @return mixed
*/
protected function getValues(): array
{
return array_values($this->data);
}
/**
* Generates and returns chart
*
* @return void
*/
protected function setDataSet()
{
if (config('meter.monitors.' . RequestMonitor::class . '.enabled', true)) {
$this->dataset('Response Time', 'line', collect($this->getValues())->where('type', 'request')->pluck('time'))
->color('rgb(0, 123, 255)')
->options([
'pointRadius' => 2,
'fill' => true,
'lineTension' => 0,
'borderWidth' => 1,
'barPercentage' => 0.9
])
->backgroundcolor('rgba(0, 123, 255, 0.6)');
}
if (config('meter.monitors.' . QueryMonitor::class . '.enabled', true)) {
$this->dataset('Query Time', 'line', collect($this->getValues())->where('type', 'query')->pluck('time'))
->color('rgb(40, 167, 69)')
->options([
'pointRadius' => 2,
'fill' => true,
'lineTension' => 0,
'borderWidth' => 1,
'barPercentage' => 0.9
])
->backgroundcolor('rgba(40, 167, 69, 0.6)');
}
if (config('meter.monitors.' . CommandMonitor::class . '.enabled', true)) {
$this->dataset('Command Time', 'line', collect($this->getValues())->where('type', 'command')->pluck('time'))
->color('rgb(23, 162, 184)')
->options([
'pointRadius' => 2,
'fill' => true,
'lineTension' => 0,
'borderWidth' => 1,
'barPercentage' => 0.9
])
->backgroundcolor('rgba(23, 162, 184, 0.6)');
}
if (config('meter.monitors.' . EventMonitor::class . '.enabled', true)) {
$this->dataset('Event Time', 'line', collect($this->getValues())->where('type', 'event')->pluck('time'))
->color('rgb(255, 193, 7)')
->options([
'pointRadius' => 2,
'fill' => true,
'lineTension' => 0,
'borderWidth' => 1,
'barPercentage' => 0.9
])
->backgroundcolor('rgba(255, 193, 7, 0.6)');
}
if (config('meter.monitors.' . ScheduleMonitor::class . '.enabled', true)) {
$this->dataset('Schedule Time', 'line', collect($this->getValues())->where('type', 'schedule')->pluck('time'))
->color('rgb(220, 53, 69)')
->options([
'pointRadius' => 2,
'fill' => true,
'lineTension' => 0,
'borderWidth' => 1,
'barPercentage' => 0.9
])
->backgroundcolor('rgba(220, 53, 69, 0.6)');
}
}
}
================================================
FILE: src/Charts/QueriesTimeChart.php
================================================
<?php
namespace Sarfraznawaz2005\Meter\Charts;
use Balping\JsonRaw\Raw;
use Illuminate\Support\Str;
use Sarfraznawaz2005\Meter\Models\MeterModel;
use Sarfraznawaz2005\Meter\Monitors\QueryMonitor;
use Sarfraznawaz2005\Meter\Type;
class QueriesTimeChart extends Chart
{
/**
* Sets options for chart.
*
* @return void
*/
protected function setOptions()
{
$this->options([
'responsive' => true,
'maintainAspectRatio' => false,
'title' => [
'display' => true,
'text' => [
'Min ' . round(collect($this->getValues())->pluck('y')->min()) . ' | ' .
'Avg ' . round(collect($this->getValues())->pluck('y')->average()) . ' | ' .
'Max ' . round(collect($this->getValues())->pluck('y')->max())
],
],
'legend' => false,
'scales' => [
'yAxes' => [[
'ticks' => [
'beginAtZero' => true
],
'scaleLabel' => [
'display' => true,
'labelString' => 'Time (ms)'
]
]],
'xAxes' => [[
'display' => false,
//'type' => 'time',
'time' => [
'displayFormats' => ['hour' => 'MMM D hA'],
],
'ticks' => [
'beginAtZero' => true,
'autoSkip' => true,
'autoSkipPadding' => 30,
'maxRotation' => 0,
],
'gridLines' => ['offsetGridLines' => true],
'offset' => true,
]]
],
'tooltips' => [
'callbacks' => [
'label' => new Raw('function(item, data) { return "Time: " + data.datasets[item.datasetIndex].data[item.index].y + " (Query: " + data.datasets[item.datasetIndex].data[item.index].x + ")"}')
]
],
], true);
}
/**
* Sets data for chart.
*
* @param MeterModel $model
* @return void
*/
protected function setData(MeterModel $model)
{
foreach ($model->type(Type::QUERY)->filtered()->orderBy('id', 'asc')->get() as $item) {
if (isset($item->content['time'])) {
$this->data[(string)$item->created_at] = [
'x' => Str::limit($item->content['sql'], 120),
'y' => (int)$item->content['time'],
];
}
}
}
/**
* Gets labels for chart.
*
* @return mixed
*/
protected function getLabels(): array
{
return array_keys($this->data);
}
/**
* Gets values for chart.
*
* @return mixed
*/
protected function getValues(): array
{
return array_values($this->data);
}
/**
* Generates and returns chart
*
* @return void
*/
protected function setDataSet()
{
$type = config('meter.monitors.' . QueryMonitor::class . '.graph_type', 'bar');
$this->dataset('Query Time', $type, $this->getValues())
->color('rgb(' . static::COLOR_RED . ')')
->options([
'pointRadius' => 2,
'fill' => true,
'lineTension' => 0,
'borderWidth' => 1,
//'minBarLength' => 50,
'barPercentage' => 0.9
])
->backgroundcolor('rgba(' . static::COLOR_RED . ', 0.6)');
}
}
================================================
FILE: src/Charts/RequestMemoryChart.php
================================================
<?php
namespace Sarfraznawaz2005\Meter\Charts;
use Balping\JsonRaw\Raw;
use Sarfraznawaz2005\Meter\Models\MeterModel;
use Sarfraznawaz2005\Meter\Monitors\RequestMonitor;
use Sarfraznawaz2005\Meter\Type;
class RequestMemoryChart extends Chart
{
/**
* Sets options for chart.
*
* @return void
*/
protected function setOptions()
{
$this->options([
'responsive' => true,
'maintainAspectRatio' => false,
'title' => [
'display' => true,
'text' => [
'Min ' . round(collect($this->getValues())->pluck('y')->min()) . ' | ' .
'Avg ' . round(collect($this->getValues())->pluck('y')->average()) . ' | ' .
'Max ' . round(collect($this->getValues())->pluck('y')->max())
],
],
'legend' => false,
'scales' => [
'yAxes' => [[
'ticks' => [
'beginAtZero' => true
],
'scaleLabel' => [
'display' => true,
'labelString' => 'Memory (MB)'
]
]],
'xAxes' => [[
'display' => false,
//'type' => 'time',
'time' => [
'displayFormats' => ['hour' => 'MMM D hA'],
],
'ticks' => [
'beginAtZero' => true,
'autoSkip' => true,
'autoSkipPadding' => 30,
'maxRotation' => 0,
],
'gridLines' => ['offsetGridLines' => true],
'offset' => true,
]]
],
'tooltips' => [
'callbacks' => [
'label' => new Raw('function(item, data) { return "Memory: " + data.datasets[item.datasetIndex].data[item.index].y + " (Path: " + data.datasets[item.datasetIndex].data[item.index].x + ")"}')
]
],
], true);
}
/**
* Sets data for chart.
*
* @param MeterModel $model
* @return void
*/
protected function setData(MeterModel $model)
{
foreach ($model->type(Type::REQUEST)->filtered()->orderBy('id', 'asc')->get() as $item) {
if (isset($item->content['memory'])) {
$this->data[(string)$item->created_at] = [
'x' => $item->content['uri'],
'y' => (int)$item->content['memory'],
];
}
}
}
/**
* Gets labels for chart.
*
* @return mixed
*/
protected function getLabels(): array
{
return array_keys($this->data);
}
/**
* Gets values for chart.
*
* @return mixed
*/
protected function getValues(): array
{
return array_values($this->data);
}
/**
* Generates and returns chart
*
* @return void
*/
protected function setDataSet()
{
$type = config('meter.monitors.' . RequestMonitor::class . '.graph_type', 'bar');
$this->dataset('Memory', $type, $this->getValues())
->color('rgb(' . static::COLOR_RED . ')')
->options([
'pointRadius' => 2,
'fill' => true,
'lineTension' => 0,
'borderWidth' => 1,
//'minBarLength' => 50,
'barPercentage' => 0.9
])
->backgroundcolor('rgba(' . static::COLOR_RED . ', 0.6)');
}
}
================================================
FILE: src/Charts/RequestTimeChart.php
================================================
<?php
namespace Sarfraznawaz2005\Meter\Charts;
use Balping\JsonRaw\Raw;
use Sarfraznawaz2005\Meter\Models\MeterModel;
use Sarfraznawaz2005\Meter\Monitors\RequestMonitor;
use Sarfraznawaz2005\Meter\Type;
class RequestTimeChart extends Chart
{
/**
* Sets options for chart.
*
* @return void
*/
protected function setOptions()
{
$this->options([
'responsive' => true,
'maintainAspectRatio' => false,
'title' => [
'display' => true,
'text' => [
'Min ' . round(collect($this->getValues())->pluck('y')->min()) . ' | ' .
'Avg ' . round(collect($this->getValues())->pluck('y')->average()) . ' | ' .
'Max ' . round(collect($this->getValues())->pluck('y')->max())
],
],
'legend' => false,
'scales' => [
'yAxes' => [[
'ticks' => [
'beginAtZero' => true
],
'scaleLabel' => [
'display' => true,
'labelString' => 'Response Time (ms)'
]
]],
'xAxes' => [[
'display' => false,
//'type' => 'time',
'time' => [
'displayFormats' => ['hour' => 'MMM D hA'],
],
'ticks' => [
'beginAtZero' => true,
'autoSkip' => true,
'autoSkipPadding' => 30,
'maxRotation' => 0,
],
'gridLines' => ['offsetGridLines' => true],
'offset' => true,
]]
],
'tooltips' => [
'callbacks' => [
'label' => new Raw('function(item, data) { return "Time: " + data.datasets[item.datasetIndex].data[item.index].y + " (Path: " + data.datasets[item.datasetIndex].data[item.index].x + ")"}')
]
],
], true);
}
/**
* Sets data for chart.
*
* @param MeterModel $model
* @return void
*/
protected function setData(MeterModel $model)
{
foreach ($model->type(Type::REQUEST)->filtered()->orderBy('id', 'asc')->get() as $item) {
if (isset($item->content['duration'])) {
$this->data[(string)$item->created_at] = [
'x' => $item->content['uri'],
'y' => (int)$item->content['duration'],
];
}
}
}
/**
* Gets labels for chart.
*
* @return mixed
*/
protected function getLabels(): array
{
return array_keys($this->data);
}
/**
* Gets values for chart.
*
* @return mixed
*/
protected function getValues(): array
{
return array_values($this->data);
}
/**
* Generates and returns chart
*
* @return void
*/
protected function setDataSet()
{
$type = config('meter.monitors.' . RequestMonitor::class . '.graph_type', 'bar');
$this->dataset('Response Time', $type, $this->getValues())
->color('rgb(' . static::COLOR_RED . ')')
->options([
'pointRadius' => 2,
'fill' => true,
'lineTension' => 0,
'borderWidth' => 1,
//'minBarLength' => 50,
'barPercentage' => 0.9
])
->backgroundcolor('rgba(' . static::COLOR_RED . ', 0.6)');
}
}
================================================
FILE: src/Charts/SchedulesTimeChart.php
================================================
<?php
namespace Sarfraznawaz2005\Meter\Charts;
use Balping\JsonRaw\Raw;
use Sarfraznawaz2005\Meter\Models\MeterModel;
use Sarfraznawaz2005\Meter\Monitors\ScheduleMonitor;
use Sarfraznawaz2005\Meter\Type;
class SchedulesTimeChart extends Chart
{
/**
* Sets options for chart.
*
* @return void
*/
protected function setOptions()
{
$this->options([
'responsive' => true,
'maintainAspectRatio' => false,
'title' => [
'display' => true,
'text' => [
'Min ' . round(collect($this->getValues())->pluck('y')->min()) . ' | ' .
'Avg ' . round(collect($this->getValues())->pluck('y')->average()) . ' | ' .
'Max ' . round(collect($this->getValues())->pluck('y')->max())
],
],
'legend' => false,
'scales' => [
'yAxes' => [[
'ticks' => [
'beginAtZero' => true,
],
'scaleLabel' => [
'display' => true,
'labelString' => 'Command Time (ms)'
],
]],
'xAxes' => [[
'display' => false,
//'type' => 'time',
'time' => [
'displayFormats' => ['hour' => 'MMM D hA'],
],
'ticks' => [
'beginAtZero' => true,
'autoSkip' => true,
'autoSkipPadding' => 30,
'maxRotation' => 0,
],
'gridLines' => ['offsetGridLines' => true],
'offset' => true,
]]
],
'tooltips' => [
'callbacks' => [
'label' => new Raw('function(item, data) { return "Time: " + data.datasets[item.datasetIndex].data[item.index].y + " (Command: " + data.datasets[item.datasetIndex].data[item.index].x + ")"}')
]
],
], true);
}
/**
* Sets data for chart.
*
* @param MeterModel $model
* @return void
*/
protected function setData(MeterModel $model)
{
/*
$this->data = $model->type(Type::SCHEDULE)
->filtered()
->groupBy('date')
->orderBy('date', 'ASC')
->get([
DB::raw('DATE(created_at) as date'),
DB::raw('COUNT(*) as "total"')
])
->pluck('total', 'date')
->toArray();
*/
foreach ($model->type(Type::SCHEDULE)->filtered()->orderBy('id', 'asc')->get() as $item) {
if (isset($item->content['time'])) {
$this->data[(string)$item->created_at] = [
'x' => $item->content['command'],
'y' => (int)$item->content['time'],
];;
}
}
}
/**
* Gets labels for chart.
*
* @return mixed
*/
protected function getLabels(): array
{
return array_keys($this->data);
}
/**
* Gets values for chart.
*
* @return mixed
*/
protected function getValues(): array
{
return array_values($this->data);
}
/**
* Generates and returns chart
*
* @return void
*/
protected function setDataSet()
{
$type = config('meter.monitors.' . ScheduleMonitor::class . '.graph_type', 'bar');
$this->dataset('Command Time', $type, $this->getValues())
->color('rgb(' . static::COLOR_RED . ')')
->options([
'pointRadius' => 2,
'fill' => true,
'lineTension' => 0,
'borderWidth' => 1,
//'minBarLength' => 50,
'barPercentage' => 0.9
])
->backgroundcolor('rgba(' . static::COLOR_RED . ', 0.6)');
}
}
================================================
FILE: src/Charts/ServerMemoryChart.php
================================================
<?php
namespace Sarfraznawaz2005\Meter\Charts;
use Sarfraznawaz2005\Meter\Models\MeterModel;
use Sarfraznawaz2005\Meter\Monitors\MemoryMonitor;
use Sarfraznawaz2005\Meter\Type;
class ServerMemoryChart extends Chart
{
/**
* Sets options for chart.
*
* @return void
*/
protected function setOptions()
{
$this->options([
'responsive' => true,
'maintainAspectRatio' => false,
'title' => [
'display' => true,
'text' => [
'Min ' . round(collect($this->getValues())->min()) . ' | ' .
'Avg ' . round(collect($this->getValues())->average()) . ' | ' .
'Max ' . round(collect($this->getValues())->max())
],
],
'legend' => false,
'scales' => [
'yAxes' => [[
'ticks' => [
'beginAtZero' => true
],
]],
'xAxes' => [[
'display' => false,
'ticks' => [
'beginAtZero' => true,
'autoSkip' => true,
'autoSkipPadding' => 30,
'maxRotation' => 0,
],
'gridLines' => ['offsetGridLines' => true],
'offset' => true,
]]
],
], true);
}
/**
* Sets data for chart.
*
* @param MeterModel $model
* @return void
*/
protected function setData(MeterModel $model)
{
foreach ($model->type(Type::MEMORY)->filtered()->orderBy('id', 'asc')->get() as $item) {
$this->data[(string)$item->created_at] = (int)$item->content['percent'];
}
}
/**
* Gets labels for chart.
*
* @return mixed
*/
protected function getLabels(): array
{
return array_keys($this->data);
}
/**
* Gets values for chart.
*
* @return mixed
*/
protected function getValues(): array
{
return array_values($this->data);
}
/**
* Generates and returns chart
*
* @return void
*/
protected function setDataSet()
{
$type = config('meter.monitors.' . MemoryMonitor::class . '.graph_type', 'bar');
$this->dataset('Percent', $type, $this->getValues())
->color('rgb(' . static::COLOR_RED . ')')
->options([
'pointRadius' => 2,
'fill' => true,
'lineTension' => 0,
'borderWidth' => 1,
//'minBarLength' => 50,
'barPercentage' => 0.9
])
->backgroundcolor('rgba(' . static::COLOR_RED . ', 0.6)');
}
}
================================================
FILE: src/Config/config.php
================================================
<?php
return [
// Enable/Disable Meter
'enabled' => env('METER_ENABLED', false),
#---------------------------------------------------------------------
/*
* This is the subdomain where Meter will be accessible from. If the
* setting is null, Meter will reside under the same domain as the
* application.
*/
'domain' => env('METER_DOMAIN', null),
#---------------------------------------------------------------------
/*
* URI path Meter will be accessible from.
*
* Username and password for basic http authentication to access
* meter interface.
*/
'path' => env('METER_PATH', 'meter'),
'username' => env('METER_USERNAME', 'meter'),
'password' => env('METER_PASSWORD', 'meter'),
#---------------------------------------------------------------------
/*
* These middleware will be assigned to every Meter route, giving you
* the chance to add your own middleware to this list or change any of
* the existing middleware.
*/
'middleware' => [
//
],
#---------------------------------------------------------------------
/*
| The following array lists the URI paths and Artisan commands that will
| not be watched by Meter. In addition to this list, some Laravel
| commands like migrations and queue commands are always ignored.
*/
'ignore_paths' => [
//
],
'ignore_commands' => [
//
],
'ignore_matched_string' => [
"query" => [
"information_schema",
]
],
#---------------------------------------------------------------------
/*
* The database connection Meter will use to store data. By default, it
* will use the default database connection.
*/
'storage' => [
'database' => [
'connection' => env('METER_DB_CONNECTION', 'mysql'),
],
],
#---------------------------------------------------------------------
// Customize the monitors meter will use to show statiscs of.
'monitors' => [
Sarfraznawaz2005\Meter\Monitors\RequestMonitor::class => [
'enabled' => env('METER_REQUEST_MONITOR', true),
'slow' => 3000, // considered slow if equal or over given time in ms
'graph_type' => env('METER_REQUEST_GRAPH_TYPE', 'bar'), // bar, line
'show_on_dashboard' => env('METER_REQUEST_ON_DASHBOARD', true)
],
Sarfraznawaz2005\Meter\Monitors\QueryMonitor::class => [
'enabled' => env('METER_QUERY_MONITOR', true),
'ignore_packages' => true,
'slow' => 500, // considered slow if equal or over given time in ms
'graph_type' => env('METER_QUERY_GRAPH_TYPE', 'bar'), // bar, line
'show_on_dashboard' => env('METER_QUERY_ON_DASHBOARD', true)
],
Sarfraznawaz2005\Meter\Monitors\CommandMonitor::class => [
'enabled' => env('METER_COMMAND_MONITOR', true),
'ignore' => [],
'graph_type' => env('METER_COMMAND_GRAPH_TYPE', 'bar'), // bar, line
'show_on_dashboard' => env('METER_COMMAND_ON_DASHBOARD', true)
],
Sarfraznawaz2005\Meter\Monitors\EventMonitor::class => [
'enabled' => env('METER_EVENT_MONITOR', true),
'ignore' => [],
'graph_type' => env('METER_EVENT_GRAPH_TYPE', 'bar'), // bar, line
'show_on_dashboard' => env('METER_EVENT_ON_DASHBOARD', true)
],
Sarfraznawaz2005\Meter\Monitors\ScheduleMonitor::class => [
'enabled' => env('METER_SCHEDULE_MONITOR', true),
'graph_type' => env('METER_SCHEDULE_GRAPH_TYPE', 'bar'), // bar, line
'show_on_dashboard' => env('METER_SCHEDULE_ON_DASHBOARD', true)
],
#####################################################################
# below monitors are run via "meter:servermonitor" command if enabled
#####################################################################
// monitors average CPU usage
Sarfraznawaz2005\Meter\Monitors\CpuMonitor::class => [
'enabled' => env('METER_CPU_MONITOR', false),
'graph_type' => env('METER_CPU_GRAPH_TYPE', 'bar'), // bar, line
'show_on_dashboard' => env('METER_CPU_ON_DASHBOARD', true)
],
// monitors disk space usage
Sarfraznawaz2005\Meter\Monitors\DiskSpaceMonitor::class => [
'enabled' => env('METER_DISK_MONITOR', false),
'graph_type' => env('METER_DISK_GRAPH_TYPE', 'bar'), // bar, line
'show_on_dashboard' => env('METER_DISK_ON_DASHBOARD', true)
],
// monitors server memory usage
Sarfraznawaz2005\Meter\Monitors\MemoryMonitor::class => [
'enabled' => env('METER_MEMORY_MONITOR', false),
'graph_type' => env('METER_MEMORY_GRAPH_TYPE', 'bar'), // bar, line
'show_on_dashboard' => env('METER_MEMOR_ON_DASHBOARD', true)
],
// monitors active http connections count on port 80
Sarfraznawaz2005\Meter\Monitors\HttpConnectionsMonitor::class => [
'enabled' => env('METER_HTTP_CONNECTIONS_MONITOR', false),
'port' => env('METER_HTTP_CONNECTIONS_PORT', 80),
'graph_type' => env('METER_HTTP_CONNECTIONS_GRAPH_TYPE', 'bar'), // bar, line
'show_on_dashboard' => env('METER_HTTP_CONNECTIONS_ON_DASHBOARD', true)
],
],
// Graph/Table filters. Will be added between "Today" and "All".
'filters' => [
'Yesterday' => 1,
'Week' => 7,
'Month' => 30,
'3 Month' => 90,
'6 Month' => 180,
'Year' => 365,
],
];
================================================
FILE: src/Console/PruneCommand.php
================================================
<?php
namespace Sarfraznawaz2005\Meter\Console;
use Illuminate\Console\Command;
use Illuminate\Database\Eloquent\Builder;
use Sarfraznawaz2005\Meter\Models\MeterModel;
class PruneCommand extends Command
{
protected $signature = 'meter:prune {--days=1 : The number of days to retain Meter data}';
protected $description = 'Prune stale entries from the Meter database';
public function handle(MeterModel $model)
{
/* @var $model Builder */
$deleteCount = $model->whereDate('created_at', '<', now()->subDays($this->option('days')))->delete();
$this->info($deleteCount.' entries pruned.');
}
}
================================================
FILE: src/Console/PublishCommand.php
================================================
<?php
namespace Sarfraznawaz2005\Meter\Console;
use Illuminate\Console\Command;
class PublishCommand extends Command
{
protected $signature = 'meter:publish {--force : Overwrite any existing files}';
protected $description = 'Publish all of the Meter resources.';
public function handle()
{
$this->call('vendor:publish', [
'--tag' => 'meter-config',
'--force' => $this->option('force'),
]);
$this->call('vendor:publish', [
'--tag' => 'meter-views',
'--force' => true,
]);
$this->call('vendor:publish', [
'--tag' => 'meter-assets',
'--force' => true,
]);
}
}
================================================
FILE: src/Console/ServerMonitorCommand.php
================================================
<?php
namespace Sarfraznawaz2005\Meter\Console;
use Illuminate\Console\Command;
use Sarfraznawaz2005\Meter\Meter;
use Sarfraznawaz2005\Meter\Monitors\CpuMonitor;
use Sarfraznawaz2005\Meter\Monitors\DiskSpaceMonitor;
use Sarfraznawaz2005\Meter\Monitors\HttpConnectionsMonitor;
use Sarfraznawaz2005\Meter\Monitors\MemoryMonitor;
class ServerMonitorCommand extends Command
{
protected $signature = 'meter:servermonitor';
protected $description = 'Checks server stuff such as disk space, cpu usage, memory, etc';
public static $serverMonitors = [
CpuMonitor::class,
DiskSpaceMonitor::class,
MemoryMonitor::class,
HttpConnectionsMonitor::class,
];
public function handle()
{
if (!config('meter.enabled')) {
return;
}
if (Meter::isMonitoring()) {
$app = app();
foreach (static::$serverMonitors as $monitor) {
if (config('meter.monitors.' . $monitor . '.enabled', true)) {
$monitor = $app->make($monitor);
$monitor->register($app);
}
}
}
}
}
================================================
FILE: src/Helpers.php
================================================
<?php
use Illuminate\Database\Eloquent\Builder;
use Illuminate\Database\Eloquent\Model;
use Illuminate\Support\Arr;
if (!function_exists('meterActiveLink')) {
function meterActiveLink($path, $class = 'active')
{
if (request()->is((array)$path) || request()->routeIs((array)$path)) {
return $class;
}
return '';
}
}
if (!function_exists('meterWithHtmlTitle')) {
function meterWithHtmlTitle($text, $title)
{
return "<span data-toggle='tooltip' title='$title'>$text</span>";
}
}
if (!function_exists('meterBadge')) {
function meterBadge($text)
{
return "<span class='badge font-weight-light badge-secondary'>$text</span>";
}
}
if (!function_exists('meterAutoBadge')) {
function meterAutoBadge($text, $colorMap)
{
$color = array_keys(array_filter($colorMap))[0] ?? 'badge-secondary';
return "<span class='badge font-weight-light badge-$color'>$text</span>";
}
}
if (!function_exists('meterCenter')) {
function meterCenter($text)
{
return "<div class='text-center'>$text</div>";
}
}
if (!function_exists('meterDetailsButton')) {
function meterDetailsButton($details)
{
$details = htmlspecialchars(json_encode($details), ENT_QUOTES, 'UTF-8');
return <<< HTML
<a class="btnDetails" data-details="$details" href="#">
<i class="icon fa fa-bullseye"></i>
</a>
HTML;
}
}
if (!function_exists('meterGetSql')) {
function meterGetSql(Builder $builder)
{
$addSlashes = str_replace('?', "'?'", $builder->toSql());
return vsprintf(str_replace('?', '%s', $addSlashes), $builder->getBindings());
}
}
if (!function_exists('meterFormatModel')) {
function meterFormatModel(Model $model)
{
return get_class($model) . ':' . implode('_', Arr::wrap($model->getKey()));
}
}
if (!function_exists('meterIgnoreEntry')) {
function meterIgnoreEntry($key, $content)
{
return str_contains($content, $key);
}
}
================================================
FILE: src/Http/Controllers/PagesController.php
================================================
<?php
namespace Sarfraznawaz2005\Meter\Http\Controllers;
use Illuminate\Routing\Controller;
use Illuminate\Support\Facades\DB;
use Sarfraznawaz2005\Meter\Charts\CommandsTimeChart;
use Sarfraznawaz2005\Meter\Charts\ConnectionsChart;
use Sarfraznawaz2005\Meter\Charts\CpuChart;
use Sarfraznawaz2005\Meter\Charts\DiskSpaceChart;
use Sarfraznawaz2005\Meter\Charts\EventsTimeChart;
use Sarfraznawaz2005\Meter\Charts\QueriesTimeChart;
use Sarfraznawaz2005\Meter\Charts\RequestMemoryChart;
use Sarfraznawaz2005\Meter\Charts\RequestTimeChart;
use Sarfraznawaz2005\Meter\Charts\SchedulesTimeChart;
use Sarfraznawaz2005\Meter\Charts\ServerMemoryChart;
use Sarfraznawaz2005\Meter\Models\MeterModel;
class PagesController extends Controller
{
public function home(
RequestTimeChart $requestTimeChart,
RequestMemoryChart $requestMemoryChart,
QueriesTimeChart $queriesTimeChart,
CommandsTimeChart $commandsTimeChart,
EventsTimeChart $eventsTimeChart,
SchedulesTimeChart $schedulesTimeChart,
CpuChart $cpuChart,
DiskSpaceChart $diskSpaceChart,
ServerMemoryChart $serverMemoryChart,
ConnectionsChart $connectionsChart
)
{
$totals = MeterModel::select(
DB::raw('count(*) as total'),
DB::raw("count(case when type = 'command' then 1 end) as commands"),
DB::raw("count(case when type = 'event' then 1 end) as events"),
DB::raw("count(case when type = 'query' then 1 end) as queries"),
DB::raw("count(case when type = 'request' then 1 end) as requests"),
DB::raw("count(case when type = 'schedule' then 1 end) as schedules")
)->filtered()->first();
return view(
'meter::dashboard', compact(
'totals',
'requestTimeChart',
'requestMemoryChart',
'queriesTimeChart',
'commandsTimeChart',
'eventsTimeChart',
'schedulesTimeChart',
'cpuChart',
'diskSpaceChart',
'serverMemoryChart',
'connectionsChart'
)
);
}
public function queries(QueriesTimeChart $queriesTimeChart)
{
return view('meter::queries', compact('queriesTimeChart'));
}
public function requests(
RequestTimeChart $timeChart,
RequestMemoryChart $memoryChart
)
{
return view('meter::requests', compact('timeChart', 'memoryChart'));
}
public function commands(CommandsTimeChart $chart)
{
return view('meter::commands', compact('chart'));
}
public function events(EventsTimeChart $chart)
{
return view('meter::events', compact('chart'));
}
public function schedules(SchedulesTimeChart $chart)
{
return view('meter::schedules', compact('chart'));
}
public function serverStats(
CpuChart $cpuChart,
DiskSpaceChart $diskSpaceChart,
ServerMemoryChart $serverMemoryChart,
ConnectionsChart $connectionsChart
)
{
return view('meter::server', compact('cpuChart', 'diskSpaceChart', 'serverMemoryChart', 'connectionsChart'));
}
}
================================================
FILE: src/Http/Controllers/TablesController.php
================================================
<?php
namespace Sarfraznawaz2005\Meter\Http\Controllers;
use Illuminate\Routing\Controller;
use Sarfraznawaz2005\Meter\Tables\CommandsTable;
use Sarfraznawaz2005\Meter\Tables\EventsTable;
use Sarfraznawaz2005\Meter\Tables\QueriesTable;
use Sarfraznawaz2005\Meter\Tables\RequestsTable;
use Sarfraznawaz2005\Meter\Tables\SchedulesTable;
class TablesController extends Controller
{
public function requestsTable(RequestsTable $table): array
{
return $table->getData();
}
public function queriesTable(QueriesTable $table): array
{
return $table->getData();
}
public function commandsTable(CommandsTable $table): array
{
return $table->getData();
}
public function eventsTable(EventsTable $table): array
{
return $table->getData();
}
public function schedulesTable(SchedulesTable $table): array
{
return $table->getData();
}
}
================================================
FILE: src/Http/Middleware/BasicAuth.php
================================================
<?php
namespace Sarfraznawaz2005\Meter\Http\Middleware;
use Closure;
use Illuminate\Http\Request;
class BasicAuth
{
/**
* Handle an incoming request.
*
* @param Request $request
* @param Closure $next
* @return mixed
*/
public function handle($request, Closure $next)
{
$AUTH_USER = config('meter.username');
$AUTH_PASS = config('meter.password');
header('Cache-Control: no-cache, must-revalidate, max-age=0');
$hasSuppliedCredentials = !(empty($_SERVER['PHP_AUTH_USER']) && empty($_SERVER['PHP_AUTH_PW']));
$isNotAuthenticated = (
!$hasSuppliedCredentials ||
$_SERVER['PHP_AUTH_USER'] != $AUTH_USER ||
$_SERVER['PHP_AUTH_PW'] != $AUTH_PASS
);
if ($isNotAuthenticated) {
header('HTTP/1.1 401 Authorization Required');
header('WWW-Authenticate: Basic realm="Access Denied"');
exit;
}
return $next($request);
}
}
================================================
FILE: src/Http/routes.php
================================================
<?php
use Illuminate\Support\Facades\Route;
// pages
Route::get('/', 'PagesController@home')->name('meter_home');
Route::get('requests', 'PagesController@requests')->name('meter_requests');
Route::get('queries', 'PagesController@queries')->name('meter_queries');
Route::get('commands', 'PagesController@commands')->name('meter_commands');
Route::get('events', 'PagesController@events')->name('meter_events');
Route::get('schedules', 'PagesController@schedules')->name('meter_schedules');
Route::get('server_stats', 'PagesController@serverStats')->name('meter_server_stats');
// tables
Route::get('requests_table', 'TablesController@requestsTable')->name('meter_requests_table');
Route::get('queries_table', 'TablesController@queriesTable')->name('meter_queries_table');
Route::get('commands_table', 'TablesController@commandsTable')->name('meter_commands_table');
Route::get('events_table', 'TablesController@eventsTable')->name('meter_events_table');
Route::get('schedules_table', 'TablesController@schedulesTable')->name('meter_schedules_table');
================================================
FILE: src/Meter.php
================================================
<?php
namespace Sarfraznawaz2005\Meter;
use Illuminate\Contracts\Foundation\Application;
use Sarfraznawaz2005\Meter\Traits\RegistersMonitors;
class Meter
{
use RegistersMonitors;
/**
* Indicates if Meter should monitor entries.
*
* @var bool
*/
public static $shouldMonitor = false;
/**
* Starts Meter.
*
* @param Application $app
*/
public static function start($app)
{
if (!config('meter.enabled')) {
return;
}
if (static::runningApprovedArtisanCommand($app) || static::handlingApprovedRequest($app)) {
static::registerMonitors($app);
static::startMonitoring();
}
}
/**
* Determine if the application is running an approved command.
*
* @param $app
* @return bool
*/
protected static function runningApprovedArtisanCommand($app): bool
{
$ignoredCommands = array_merge([
'migrate',
'migrate:rollback',
'migrate:fresh',
'migrate:refresh',
'migrate:reset',
'migrate:install',
'package:discover',
'queue:listen',
'queue:work',
'horizon',
'horizon:work',
'horizon:supervisor',
], config('meter.ignore_commands', []));
return $app->runningInConsole() && !in_array($_SERVER['argv'][1] ?? null, $ignoredCommands, true);
}
/**
* Determine if the application is handling an approved request.
*
* @param $app
* @return bool
*/
protected static function handlingApprovedRequest($app): bool
{
$ignoredPaths = array_merge([
config('meter.path') . '*',
'meter*',
'debugbar*',
'_debugbar*',
'clockwork*',
'_clockwork*',
'telescope*',
'vendor/meter*',
'horizon*',
'vendor/horizon*',
'nova-api*',
], config('meter.ignore_paths', []));
return !$app->runningInConsole() && !$app['request']->is($ignoredPaths);
}
/**
* Start monitoring.
*
* @return void
*/
public static function startMonitoring()
{
static::$shouldMonitor = true;
}
/**
* Stop monitoring.
*
* @return void
*/
public static function stopMonitoring()
{
static::$shouldMonitor = false;
}
/**
* Determine if Meter is monitoring.
*
* @return bool
*/
public static function isMonitoring(): bool
{
return static::$shouldMonitor;
}
}
================================================
FILE: src/MeterServiceProvider.php
================================================
<?php
namespace Sarfraznawaz2005\Meter;
use Illuminate\Routing\Router;
use Illuminate\Support\Facades\Route;
use Illuminate\Support\ServiceProvider;
use Sarfraznawaz2005\Meter\Console\PruneCommand;
use Sarfraznawaz2005\Meter\Console\PublishCommand;
use Sarfraznawaz2005\Meter\Console\ServerMonitorCommand;
use Sarfraznawaz2005\Meter\Http\Middleware\BasicAuth;
class MeterServiceProvider extends ServiceProvider
{
public function boot(Router $router)
{
if ($this->app->runningInConsole()) {
$this->publishes([__DIR__ . '/Config/config.php' => config_path('meter.php')], 'meter-config');
$this->publishes([__DIR__ . '/Migrations' => database_path('migrations')], 'meter-migration');
$this->publishes([__DIR__ . '/Resources/Views' => resource_path('views/vendor/meter')], 'meter-views');
$this->publishes([__DIR__ . '/Resources/Assets' => public_path('vendor/meter')], 'meter-assets');
}
if (!config('meter.enabled')) {
return;
}
$this->registerDbConnection();
Meter::start($this->app);
if (method_exists($router, 'aliasMiddleware')) {
$router->aliasMiddleware('auth.basic_meter', BasicAuth::class);
} else {
$router->middleware('auth.basic_meter', BasicAuth::class);
}
Route::middlewareGroup('meter', array_merge(config('meter.middleware', []), ['web', 'auth.basic_meter']));
$this->loadViewsFrom(__DIR__ . '/Resources/Views', 'meter');
$this->loadMigrationsFrom(__DIR__ . '/Migrations');
Route::group([
'domain' => config('meter.domain', null),
'namespace' => 'Sarfraznawaz2005\Meter\Http\Controllers',
'prefix' => config('meter.path'),
'middleware' => 'meter',
], function () {
$this->loadRoutesFrom(__DIR__ . '/Http/routes.php');
});
}
// see: https://github.com/sarfraznawaz2005/meter/issues/2
// see: https://github.com/laravel/framework/issues/25768
protected function registerDbConnection()
{
$defaultConnection = config('database.default');
config(['database.connections.meter' => config("database.connections.{$defaultConnection}")]);
}
/**
* Register the application services.
*/
public function register()
{
$this->mergeConfigFrom(__DIR__ . '/Config/config.php', 'meter');
$this->commands([
PruneCommand::class,
PublishCommand::class,
ServerMonitorCommand::class,
]);
$this->app->singleton('meter', static function () {
return new Meter;
});
}
}
================================================
FILE: src/Migrations/2019_12_12_100000_create_meter_entries_table.php
================================================
<?php
use Illuminate\Database\Migrations\Migration;
use Illuminate\Database\Schema\Blueprint;
use Illuminate\Support\Facades\Schema;
class CreateMeterEntriesTable extends Migration
{
/**
* Run the migrations.
*
* @return void
*/
public function up()
{
Schema::connection(config('meter.storage.database.connection'))
->create('meter_entries', static function (Blueprint $table) {
$table->bigIncrements('id');
$table->string('type', 20);
$table->enum('is_slow', ['No', 'Yes'])->default('No');
$table->longText('content');
$table->dateTime('created_at')->nullable();
$table->index(['type']);
$table->index(['created_at']);
});
}
/**
* Reverse the migrations.
*
* @return void
*/
public function down()
{
Schema::dropIfExists('meter_entries');
}
}
================================================
FILE: src/Models/MeterModel.php
================================================
<?php
namespace Sarfraznawaz2005\Meter\Models;
use Illuminate\Database\Eloquent\Builder;
use Illuminate\Database\Eloquent\Model;
class MeterModel extends Model
{
protected $connection = 'meter';
protected $table = 'meter_entries';
protected $fillable = ['type', 'is_slow', 'content'];
protected $casts = [
'content' => 'json',
];
const UPDATED_AT = null;
function __construct()
{
$this->connection = config('meter.storage.database.connection');
}
/**
* Scope the query for the given type.
*
* @param Builder $query
* @param string $type
* @return Builder
*/
public function scopeType($query, $type): Builder
{
return $query->where('type', $type);
}
/**
* Scope the query for the given filter.
*
* @param Builder $query
* @return Builder
*/
public function scopeFiltered($query): Builder
{
if (request()->has('all')) {
$builder = $query;
} elseif (request()->has('days')) {
// not using "WHERE DATE(created_at)" since created_at is index column.
$date = now()->subDays(request()->days)->toDateString();
$builder = $query->whereRaw("created_at >= '$date 00:00:00'");
} elseif (request()->has('slow')) {
$builder = $query->where('is_slow', 1);
} else {
// default today
$builder = $query->whereRaw("created_at >= '" . now()->toDateString() . " 00:00:00'");
}
return $builder;
}
}
================================================
FILE: src/Monitors/CommandMonitor.php
================================================
<?php
namespace Sarfraznawaz2005\Meter\Monitors;
use Illuminate\Console\Events\CommandFinished;
use Illuminate\Console\Events\CommandStarting;
use Illuminate\Contracts\Foundation\Application;
use Sarfraznawaz2005\Meter\Meter;
use Sarfraznawaz2005\Meter\Type;
use function foo\func;
class CommandMonitor extends Monitor
{
protected $startTime = 0;
/**
* Listens to event(s) and performs actions.
*
* @param Application $app
* @return mixed
*/
public function register($app)
{
$app->events->listen(CommandStarting::class, function () {
$this->startTime = microtime(true);
});
return $app->events->listen(CommandFinished::class, [$this, 'collect']);
}
/**
* Collect entry data and save in $data variable.
*
* @param CommandFinished $event
*/
public function collect(CommandFinished $event)
{
if (!Meter::isMonitoring() || $this->shouldIgnore($event)) {
return;
}
$content = [
'time' => floor((microtime(true) - $this->startTime) * 1000),
'command' => $event->command ?? $event->input->getArguments()['command'] ?? 'default',
'exit_code' => $event->exitCode,
'arguments' => $event->input->getArguments(),
'options' => $event->input->getOptions(),
];
$this->record(Type::COMMAND, false, $content);
}
/**
* Determine if the event should be ignored.
*
* @param mixed $event
* @return bool
*/
private function shouldIgnore($event): bool
{
return in_array($event->command, array_merge($this->options['ignore'] ?? [], [
'schedule:run',
'schedule:finish',
'package:discover',
'meter:prune',
'meter:publish',
'meter:servermonitor',
]), true);
}
}
================================================
FILE: src/Monitors/CpuMonitor.php
================================================
<?php
namespace Sarfraznawaz2005\Meter\Monitors;
use Illuminate\Contracts\Foundation\Application;
use Sarfraznawaz2005\Meter\Type;
class CpuMonitor extends Monitor
{
/**
* Listens to event(s) and performs actions.
*
* @param Application $app
* @return void
*/
public function register($app)
{
try {
$cpuPercent = shell_exec("grep 'cpu ' /proc/stat | awk '{usage=($2+$4)*100/($2+$4+$5)} END {print usage}'");
$this->record(Type::CPU, false, ['percent' => round($cpuPercent)]);
} catch (\Exception $e) {
}
}
}
================================================
FILE: src/Monitors/DiskSpaceMonitor.php
================================================
<?php
namespace Sarfraznawaz2005\Meter\Monitors;
use Illuminate\Contracts\Foundation\Application;
use Sarfraznawaz2005\Meter\Type;
class DiskSpaceMonitor extends Monitor
{
/**
* Listens to event(s) and performs actions.
*
* @param Application $app
* @return void
*/
public function register($app)
{
$totalSpace = disk_total_space(base_path());
$freeSpace = disk_free_space(base_path());
$usedSpace = $totalSpace - $freeSpace;
$percent = round(($usedSpace / $totalSpace) * 100);
$this->record(Type::DISK, false, ['percent' => $percent]);
}
}
================================================
FILE: src/Monitors/EventMonitor.php
================================================
<?php
namespace Sarfraznawaz2005\Meter\Monitors;
use Illuminate\Contracts\Broadcasting\ShouldBroadcast;
use Illuminate\Contracts\Foundation\Application;
use Illuminate\Contracts\Queue\ShouldQueue;
use Illuminate\Database\Eloquent\Model;
use Illuminate\Support\Str;
use ReflectionClass;
use ReflectionFunction;
use Sarfraznawaz2005\Meter\Meter;
use Sarfraznawaz2005\Meter\Traits\FormatsClosure;
use Sarfraznawaz2005\Meter\Type;
class EventMonitor extends Monitor
{
use FormatsClosure;
protected $startTime = 0;
/**
* Listens to event(s) and performs actions.
*
* @param Application $app
* @return mixed
*/
public function register($app)
{
$this->startTime = microtime(true);
return $app->events->listen('*', function ($eventName, $payload) {
$this->collect($eventName, $payload);
});
}
/**
* Collect entry data and save in $data variable.
*
* @param $eventName
* @param $payload
* @throws \ReflectionException
*/
public function collect($eventName, $payload)
{
if (!Meter::isMonitoring() || $this->shouldIgnore($eventName)) {
return;
}
$formattedPayload = $this->extractPayload($eventName, $payload);
$content = [
'time' => floor((microtime(true) - $this->startTime) * 1000),
'name' => $eventName,
'payload' => empty($formattedPayload) ? null : $formattedPayload,
'listeners' => $this->formatListeners($eventName),
'broadcast' => class_exists($eventName)
? in_array(ShouldBroadcast::class, (array)class_implements($eventName), true)
: false,
];
$this->record(Type::EVENT, false, $content);
}
/**
* Extract the payload and tags from the event.
*
* @param string $eventName
* @param array $payload
* @return array
* @throws \ReflectionException
*/
protected function extractPayload($eventName, $payload): array
{
if (is_object($payload[0]) && isset($payload[0]) && class_exists($eventName)) {
return $this->extractProperties($payload[0]);
}
return collect($payload)->map(static function ($value) {
return is_object($value) ? [
'class' => get_class($value),
'properties' => json_decode(json_encode($value), true),
] : $value;
})->toArray();
}
/**
* Extract the properties for the given object in array form.
*
* The given array is ready for storage.
*
* @param mixed $target
* @return array
* @throws \ReflectionException
*/
protected function extractProperties($target): array
{
return collect((new ReflectionClass($target))->getProperties())
->mapWithKeys(static function ($property) use ($target) {
$property->setAccessible(true);
if (($value = $property->getValue($target)) instanceof Model) {
return [$property->getName() => meterFormatModel($value)];
}
if (is_object($value)) {
return [
$property->getName() => [
'class' => get_class($value),
'properties' => json_decode(json_encode($value), true),
],
];
}
return [$property->getName() => json_decode(json_encode($value), true)];
})->toArray();
}
/**
* Format list of event listeners.
*
* @param string $eventName
* @return array
*/
protected function formatListeners($eventName): array
{
return collect(app('events')->getListeners($eventName))
->map(function ($listener) {
$listener = (new ReflectionFunction($listener))->getStaticVariables()['listener'];
if (is_string($listener)) {
return Str::contains($listener, '@') ? $listener : $listener . '@handle';
}
if (is_array($listener)) {
return get_class($listener[0]) . '@' . $listener[1];
}
return $this->formatClosureListener($listener);
})->reject(static function ($listener) {
return Str::contains($listener, 'Laravel\\Telescope');
})->map(static function ($listener) {
if (Str::contains($listener, '@')) {
$queued = in_array(ShouldQueue::class, class_implements(explode('@', $listener)[0]), true);
}
return [
'name' => $listener,
'queued' => $queued ?? false,
];
})->values()->toArray();
}
/**
* Determine if the event should be ignored.
*
* @param string $eventName
* @return bool
*/
protected function shouldIgnore($eventName): bool
{
return $this->eventIsIgnored($eventName) || $this->eventIsFiredByTheFramework($eventName);
}
/**
* Determine if the event was fired internally by Laravel.
*
* @param string $eventName
* @return bool
*/
protected function eventIsFiredByTheFramework($eventName): bool
{
return Str::is(
['Illuminate\*', 'eloquent*', 'bootstrapped*', 'bootstrapping*', 'creating*', 'composing*'],
$eventName
);
}
/**
* Determine if the event is ignored manually.
*
* @param string $eventName
* @return bool
*/
protected function eventIsIgnored($eventName): bool
{
return Str::is($this->options['ignore'] ?? [], $eventName);
}
}
================================================
FILE: src/Monitors/HttpConnectionsMonitor.php
================================================
<?php
namespace Sarfraznawaz2005\Meter\Monitors;
use Illuminate\Contracts\Foundation\Application;
use Sarfraznawaz2005\Meter\Type;
class HttpConnectionsMonitor extends Monitor
{
/**
* Listens to event(s) and performs actions.
*
* @param Application $app
* @return void
*/
public function register($app)
{
try {
$port = config('meter.monitors.' . __CLASS__ . '.port', 80);
$connections = shell_exec("netstat -an | grep :$port 2>&1");
if (trim($connections)) {
$count = count(array_filter(explode("\n", $connections)));
}
$this->record(Type::CONNECTIONS, false, ['count' => $count]);
} catch (\Exception $e) {
}
}
}
================================================
FILE: src/Monitors/MemoryMonitor.php
================================================
<?php
namespace Sarfraznawaz2005\Meter\Monitors;
use Illuminate\Contracts\Foundation\Application;
use Sarfraznawaz2005\Meter\Type;
class MemoryMonitor extends Monitor
{
/**
* Listens to event(s) and performs actions.
*
* @param Application $app
* @return void
*/
public function register($app)
{
try {
if (stripos(PHP_OS, 'win') !== 0 && stripos(PHP_OS, 'mac') !== 0) {
$free = shell_exec('free');
$free = (string)trim($free);
$freeArr = explode("\n", $free);
$mem = explode(' ', $freeArr[1]);
$mem = array_filter($mem);
$mem = array_merge($mem);
$percent = round($mem[2] / $mem[1] * 100);
$this->record(Type::MEMORY, false, ['percent' => $percent]);
}
} catch (\Exception $e) {
}
}
}
================================================
FILE: src/Monitors/Monitor.php
================================================
<?php
namespace Sarfraznawaz2005\Meter\Monitors;
use Illuminate\Contracts\Foundation\Application;
use Sarfraznawaz2005\Meter\Meter;
use Sarfraznawaz2005\Meter\Models\MeterModel;
abstract class Monitor
{
/**
* The configured monitor options.
*
* @var array
*/
public $options = [];
/**
* The meter model.
*
* @var null|object
*/
protected $model = null;
/**
* Create a new monitor instance.
*
* @param array $options
* @return void
*/
public function __construct(array $options = [])
{
$this->options = $options;
$this->model = new MeterModel();
}
/**
* Listens to event(s) and performs actions.
*
* @param Application $app
* @return void
*/
abstract public function register($app);
/**
* Saves collected data in DB.
*
* @param string $type
* @param boolean $isSlow
* @param array $content
* @return mixed
*/
public function record($type, $isSlow, array $content)
{
Meter::stopMonitoring();
$result = true;
$skip = false;
if (count(config('meter.ignore_matched_string', [])) > 0) {
foreach (config('meter.ignore_matched_string', []) as $queryType) {
if (!is_array($queryType)) {
continue;
}
if(count($queryType) == 0) {
continue;
}
foreach ($queryType as $string) {
if (in_array($string, $content)) {
$skip = true;
break;
}
}
}
}
if ($skip === false) {
$result = $this->model->create([
'type' => $type,
'is_slow' => $isSlow ? '1' : '0',
'content' => $content,
'created_at' => now(),
]);
}
Meter::startMonitoring();
return $result;
}
}
================================================
FILE: src/Monitors/QueryMonitor.php
================================================
<?php
namespace Sarfraznawaz2005\Meter\Monitors;
use Illuminate\Contracts\Foundation\Application;
use Illuminate\Database\Events\QueryExecuted;
use Sarfraznawaz2005\Meter\Meter;
use Sarfraznawaz2005\Meter\Traits\FetchesStackTrace;
use Sarfraznawaz2005\Meter\Type;
class QueryMonitor extends Monitor
{
use FetchesStackTrace;
/**
* Listens to event(s) and performs actions.
*
* @param Application $app
* @return mixed
*/
public function register($app)
{
return $app->events->listen(QueryExecuted::class, [$this, 'collect']);
}
/**
* Collect entry data and save in $data variable.
*
* @param QueryExecuted $event
*/
public function collect(QueryExecuted $event)
{
if (!Meter::isMonitoring()) {
return;
}
$time = $event->time;
$isSlow = isset($this->options['slow']) && $time >= $this->options['slow'];
$caller = $this->getCallerFromStackTrace();
$content = [
'connection' => $event->connectionName,
'sql' => $this->replaceBindings($event),
'time' => number_format($time, 2),
'file' => $caller['file'],
'line' => $caller['line'],
];
$this->record(Type::QUERY, $isSlow, $content);
}
/**
* Replace the placeholders with the actual bindings.
*
* @param QueryExecuted $event
* @return string
*/
public function replaceBindings($event): string
{
$sql = $event->sql;
foreach ($this->formatBindings($event) as $key => $binding) {
$regex = is_numeric($key)
? "/\?(?=(?:[^'\\\']*'[^'\\\']*')*[^'\\\']*$)/"
: "/:{$key}(?=(?:[^'\\\']*'[^'\\\']*')*[^'\\\']*$)/";
if ($binding === null) {
$binding = 'null';
} elseif (!is_int($binding) && !is_float($binding)) {
$binding = $event->connection->getPdo()->quote($binding);
}
$sql = preg_replace($regex, $binding, $sql, 1);
}
return $sql;
}
/**
* Format the given bindings to strings.
*
* @param QueryExecuted $event
* @return array
*/
protected function formatBindings($event): array
{
return $event->connection->prepareBindings($event->bindings);
}
}
================================================
FILE: src/Monitors/RequestMonitor.php
================================================
<?php
namespace Sarfraznawaz2005\Meter\Monitors;
use Illuminate\Contracts\Foundation\Application;
use Illuminate\Foundation\Http\Events\RequestHandled;
use Sarfraznawaz2005\Meter\Meter;
use Sarfraznawaz2005\Meter\Type;
class RequestMonitor extends Monitor
{
/**
* Listens to event(s) and performs actions.
*
* @param Application $app
* @return mixed
*/
public function register($app)
{
return $app->events->listen(RequestHandled::class, [$this, 'collect']);
}
/**
* Collect entry data and save in $data variable.
*
* @param RequestHandled $event
*/
public function collect(RequestHandled $event)
{
if (!Meter::isMonitoring()) {
return;
}
$isSlow = false;
$startTime = defined('LARAVEL_START') ? LARAVEL_START : $event->request->server('REQUEST_TIME_FLOAT');
$duration = $startTime ? floor((microtime(true) - $startTime) * 1000) : null;
if (isset($this->options['slow']) && $duration) {
$isSlow = $duration >= $this->options['slow'];
}
$content = [
'uri' => str_replace($event->request->root(), '', $event->request->fullUrl()) ?: '/',
'method' => $event->request->method(),
'controller_action' => optional($event->request->route())->getActionName(),
'middleware' => array_values(optional($event->request->route())->gatherMiddleware() ?? []),
'response_status' => $event->response->getStatusCode(),
'duration' => $duration,
'memory' => round(memory_get_peak_usage(true) / 1024 / 1025, 1),
'ip' => $event->request->ip(),
];
$this->record(Type::REQUEST, $isSlow, $content);
}
}
================================================
FILE: src/Monitors/ScheduleMonitor.php
================================================
<?php
namespace Sarfraznawaz2005\Meter\Monitors;
use Cron\CronExpression;
use Illuminate\Console\Events\CommandStarting;
use Illuminate\Console\Scheduling\CallbackEvent;
use Illuminate\Console\Scheduling\Event;
use Illuminate\Console\Scheduling\Schedule;
use Illuminate\Contracts\Foundation\Application;
use Sarfraznawaz2005\Meter\Meter;
use Sarfraznawaz2005\Meter\Type;
class ScheduleMonitor extends Monitor
{
protected $startTime = 0;
/**
* Listens to event(s) and performs actions.
*
* @param Application $app
* @return mixed
*/
public function register($app)
{
return $app->events->listen(CommandStarting::class, [$this, 'collect']);
}
/**
* Collect entry data and save in $data variable.
*
* @param CommandStarting $event
*/
public function collect(CommandStarting $event)
{
if (($event->command !== 'schedule:run' && $event->command !== 'schedule:finish') || !Meter::isMonitoring()) {
return;
}
$this->startTime = microtime(true);
collect(app(Schedule::class)->events())->each(function ($event) {
$event->then(function () use ($event) {
$expression = CronExpression::factory($event->expression);
$content = [
'time' => floor((microtime(true) - $this->startTime) * 1000),
'command' => $event instanceof CallbackEvent ? 'Closure' : $this->fixupCommand($event->command),
'description' => $event->description,
'expression' => $event->expression,
'timezone' => $event->timezone,
'user' => $event->user,
'output' => $this->getEventOutput($event),
'next_run' => $expression->getNextRunDate(),
];
$this->record(Type::SCHEDULE, false, $content);
});
});
}
/**
* Get the output for the scheduled event.
*
* @param Event $event
* @return string|null
*/
protected function getEventOutput(Event $event)
{
if ($event->shouldAppendOutput || !$event->output || $event->output === $event->getDefaultOutput() || !file_exists($event->output)) {
return '';
}
return trim(file_get_contents($event->output));
}
/**
* Removes PHP path from command name.
*
* @param $command
* @return string
*/
protected function fixupCommand($command)
{
$parts = explode(' ', $command);
if (count($parts) > 2 && ($parts[1] === "'artisan'" || $parts[1] === '"artisan"')) {
array_shift($parts);
}
$command = implode(' ', $parts);
return trim(str_ireplace(["'artisan'", '"artisan"'], '', $command));
}
}
================================================
FILE: src/Resources/Assets/meter.css
================================================
body, .wrapper {
font-family: Nunito !important;
background: #edf1f3;
color: #333;
font-size: .95rem;
border-radius: unset !important;
}
.wrapper {
margin-top: 4rem;
}
.logo {
font-size: 25px;
}
.card-body {
padding: 1.5rem 0.50rem 0.50rem 0.50rem;
}
.table td {
vertical-align: middle !important;
font-size: .90rem;
}
.navbar-nav .nav-item {
margin-left: 5px;
}
.nav-tabs .nav-link {
border: none;
}
.nav-item a {
font-size: .95rem;
}
.table thead {
background: #DAE0E5;
color: #666;
font-size: .90rem;
}
.table th:last-child {
text-align: center;
}
.card {
border: none;
}
.navbar-toggler {
width: 47px;
height: 34px;
background-color: #d3d3d3;
border: none;
outline: none;
}
.navbar-toggler .line {
width: 100%;
float: left;
height: 2px;
background-color: #999;
outline: none;
margin-bottom: 5px;
}
table {
table-layout: fixed;
word-wrap: break-word;
}
table.dataTable {
border-collapse: collapse !important;
}
.table-bordered td, .table-bordered th {
border: none;
border-bottom: 1px solid #eee !important;
}
.table td, .table th {
padding: .50rem;
}
.badge {
font-size: .90rem;
min-width: 40px;
color: #212529;
}
.badge-primary {
background-color: #8ebef2;
}
.badge-secondary {
background-color: #DAE0E5;
}
.badge-info {
background-color: #c4e7ed;
}
.badge-success {
background-color: #a2e5b1;
}
.badge-warning {
background-color: #FFF382;
}
.badge-danger {
background-color: #f4bcc1;
}
.dataTables_wrapper .dataTables_processing {
background-color: #a2e5b1;
color: #212529;
position: absolute !important;
top: 1% !important;
}
.table-hover tbody tr {
background-color: #fff !important;
}
.table-hover tbody tr:hover {
background-color: #edf1f3 !important;
}
.icon {
color: #666;
font-size: 1.2rem;
}
.icon:hover {
color: #000;
font-size: 1.2rem;
}
.modal-dialog {
position: relative;
display: table;
overflow-y: auto;
overflow-x: auto;
width: auto;
min-width: 300px;
}
.nav.nav-tabs {
padding-bottom: 2px;
border: none;
}
.tab-content, .main {
border-radius: 10px;
margin: 0 10px 50px 10px;
}
.section {
border-radius: 10px;
margin: 0 20px 25px 20px;
background: #fff;
padding: 1.5rem 0.5rem;
box-shadow: 0 2.8px 2.2px rgba(0, 0, 0, 0.02),
0 6.7px 5.3px rgba(0, 0, 0, 0.028),
0 12.5px 10px rgba(0, 0, 0, 0.035),
0 22.3px 17.9px rgba(0, 0, 0, 0.042),
0 41.8px 33.4px rgba(0, 0, 0, 0.05),
0 100px 80px rgba(0, 0, 0, 0.07);
}
.shadow {
box-shadow: 0 2.8px 2.2px rgba(0, 0, 0, 0.02),
0 6.7px 5.3px rgba(0, 0, 0, 0.028),
0 12.5px 10px rgba(0, 0, 0, 0.035),
0 22.3px 17.9px rgba(0, 0, 0, 0.042),
0 41.8px 33.4px rgba(0, 0, 0, 0.05),
0 100px 80px rgba(0, 0, 0, 0.07);
}
.meter_sql {
font-family: Menlo, Monaco, Consolas, "Courier New", monospace;
color: #c7254e;
}
.meter_sql .sql_keyword {
color: #2953e1;
text-transform: uppercase;
}
#detailsModal pre {
font-family: Menlo, Monaco, Consolas, "Courier New", monospace;
background: #eee;
padding: 10px;
border-radius: 5px;
font-weight: bold;
}
pre.json .json_keyword {
color: #c7254e;
}
pre.json .json_keyword_braces {
color: #2953e1;
}
a.nav-link, a.nav-link:active, a.nav-link:visited {
color: #2953e1;
}
a.nav-link:hover {
color: #ff1493;
}
div.table-responsive-sm {
background: #EDF1F3;
padding: 20px 5px;
border-radius: 10px;
margin: 10px;
}
.totals a {
text-decoration: none;
}
================================================
FILE: src/Resources/Assets/meter.js
================================================
$(document).ready(function () {
meterSetup();
$('.dataTable').on('draw.dt', meterSetup);
// details modal
$(document).on('click', '.btnDetails', function () {
var details = '<table cellpadding="5" style="font-size: .85rem;">';
var detailsObject = $(this).data('details');
var $modal = $('#detailsModal');
for (var key in detailsObject) {
if (detailsObject.hasOwnProperty(key) && key !== 'Details') {
details += '<tr><td width="100"><strong>' + key + '</strong></td><td>' + detailsObject[key] + '</td></tr>';
}
}
details += '</table>';
$modal.find('.modal-body').html(details);
$modal.modal('show');
return false;
});
$('#detailsModal').on('shown.bs.modal', function () {
meterHighlightSQL();
meterHighlightJson();
});
});
function meterSetup() {
$('[data-toggle="popover"]').popover({
html: true,
placement: 'top',
trigger: 'hover'
});
$('[data-toggle="tooltip"]').tooltip();
meterHighlightSQL();
}
// creates DataTables
function meterTable(tableSelector, url, length, columns, extraOptions, data) {
length = length || 10;
extraOptions = extraOptions || {};
data = data || {};
var options = {
"serverSide": true,
"processing": true,
"responsive": true,
"autoWidth": false,
"ordering": false,
"lengthChange": false,
"pageLength": length,
"ajax": {
"url": url,
"dataType": "json",
"type": "GET",
"data": data
},
"columns": columns
};
// merge
options = $.extend({}, options, extraOptions);
return $(tableSelector).DataTable(options);
}
// highlights SQL keywords
function meterHighlightSQL() {
var sqlReg = /\b(AND|AS|ASC|BETWEEN|BY|CASE|CURRENT_DATE|CURRENT_TIME|DELETE|DESC|DISTINCT|EACH|ELSE|ELSEIF|FALSE|FOR|FROM|GROUP|HAVING|IF|IN|INSERT|INTERVAL|INTO|IS|JOIN|KEY|KEYS|LEFT|LIKE|LIMIT|MATCH|NOT|NULL|ON|OPTION|OR|ORDER|OUT|OUTER|REPLACE|RIGHT|SELECT|SET|TABLE|THEN|TO|TRUE|UPDATE|VALUES|WHEN|WHERE|CREATE|ALTER|ALL|DATABASE|GRANT|PRIVILEGES|IDENTIFIED|FLUSH|INNER|COUNT)(?=[^\w])/ig;
document.querySelectorAll("td .meter_sql").forEach(function(item) {
item.innerHTML = item.innerHTML.replace(sqlReg,'<span class="sql_keyword">$1</span>');
});
}
// highlights JSON keywords
function meterHighlightJson() {
var reg = /(.+?(?=: ))/g;
document.querySelectorAll("td pre.json").forEach(function(item) {
item.innerHTML = item.innerHTML.replace(/({|}|\[|\])/g,'<span class="json_keyword_braces">$1</span>');
item.innerHTML = item.innerHTML.replace(reg,'<span class="json_keyword">$1</span>');
});
}
================================================
FILE: src/Resources/Views/commands.blade.php
================================================
@extends('meter::layout.layout')
@section('content')
<ul class="nav nav-tabs justify-content-center">
<li class="nav-item">
<a class="nav-item nav-link active" data-toggle="tab" href="#graph">
<i class="fa fa-bar-chart"></i> Graph
</a>
</li>
<li class="nav-item">
<a class="nav-item nav-link" data-toggle="tab" href="#index">
<i class="fa fa-table"></i> Commands
</a>
</li>
</ul>
<div class="tab-content">
<div class="tab-pane fade show active" role="tabpanel" id="graph">
@component('meter::components.chart', ['chart' => $chart, 'title' => 'Command Times'])@endcomponent
</div>
<div class="tab-pane fade" role="tabpanel" id="index">
@component('meter::components.table',[
'url' => route('meter_commands_table'),
'columns' => ['Happened', 'Command', 'Time', 'Exit Code', 'More']
])
@endcomponent
</div>
</div>
@endsection
================================================
FILE: src/Resources/Views/components/chart.blade.php
================================================
<div class="section">
@if (isset($title))
<div class="text-center text-primary"><strong>{{$title}}</strong></div>
@endif
<div>{!! $chart->container() !!}</div>
</div>
@push('js')
{!! $chart->script() !!}
@endpush
================================================
FILE: src/Resources/Views/components/table.blade.php
================================================
<div class="section">
<table class="table-responsive-sm meter_table table table-hover mx-auto w-100">
<thead>
<tr>
@foreach($columns as $column)
<th>{{$column}}</th>
@endforeach
</tr>
</thead>
</table>
</div>
@push('js')
<script>
meterTable('.table', '{{ $url }}', 25, [
@foreach($columns as $column)
{data: '{{$column}}'},
@endforeach
], {
"columnDefs": [
@if (isset($columnDefs))
@foreach($columnDefs as $columnDef)
{!! $columnDef !!},
@endforeach
@else
{"width": "10%", "targets": -1}
@endif
]
}, {
{{request()->has('days') ? 'days : ' . request()->days : ''}}
{{request()->has('slow') ? 'slow : 1' : ''}}
{{request()->has('all') ? 'all : 1' : ''}}
});
</script>
@endpush
================================================
FILE: src/Resources/Views/dashboard.blade.php
================================================
@extends('meter::layout.layout')
@section('content')
<div class="section p-0">
<div class="shadow card-group totals">
@if (config('meter.monitors.' . Sarfraznawaz2005\Meter\Monitors\RequestMonitor::class . '.enabled', true))
<div class="card text-center text-white bg-primary border-primary">
<a href="{{route('meter_requests')}}" class="text-white">
<div class="card-header">
<span class="h5"><i class="fa fa-random"></i> Requests</span>
</div>
<div class="card-body p-3">
<strong class="h1">{{$totals->requests}}</strong>
</div>
</a>
</div>
@endif
@if (config('meter.monitors.' . Sarfraznawaz2005\Meter\Monitors\QueryMonitor::class . '.enabled', true))
<div class="card text-center text-white bg-success border-success">
<a href="{{route('meter_queries')}}" class="text-white">
<div class="card-header">
<span class="h5"><i class="fa fa-database"></i> Queries</span>
</div>
<div class="card-body p-3">
<strong class="h1">{{$totals->queries}}</strong>
</div>
</a>
</div>
@endif
@if (config('meter.monitors.' . Sarfraznawaz2005\Meter\Monitors\CommandMonitor::class . '.enabled', true))
<div class="card text-center text-white bg-info border-info">
<a href="{{route('meter_commands')}}" class="text-white">
<div class="card-header">
<span class="h5"><i class="fa fa-terminal"></i> Commands</span>
</div>
<div class="card-body p-3">
<strong class="h1">{{$totals->commands}}</strong>
</div>
</a>
</div>
@endif
@if (config('meter.monitors.' . Sarfraznawaz2005\Meter\Monitors\EventMonitor::class . '.enabled', true))
<div class="card text-center text-white bg-warning border-warning">
<a href="{{route('meter_events')}}" class="text-white">
<div class="card-header">
<span class="h5"><i class="fa fa-clock-o"></i> Events</span>
</div>
<div class="card-body p-3">
<strong class="h1">{{$totals->events}}</strong>
</div>
</a>
</div>
@endif
@if (config('meter.monitors.' . Sarfraznawaz2005\Meter\Monitors\ScheduleMonitor::class . '.enabled', true))
<div class="card text-center text-white bg-danger border-danger">
<a href="{{route('meter_schedules')}}" class="text-white">
<div class="card-header">
<span class="h5"><i class="fa fa-calendar"></i> Schedule</span>
</div>
<div class="card-body p-3">
<strong class="h1">{{$totals->schedules}}</strong>
</div>
</a>
</div>
@endif
</div>
</div>
<div class="d-flex flex-wrap w-100">
@if (
config('meter.monitors.' . Sarfraznawaz2005\Meter\Monitors\RequestMonitor::class . '.enabled', true) &&
config('meter.monitors.' . Sarfraznawaz2005\Meter\Monitors\RequestMonitor::class . '.show_on_dashboard', true)
)
<div class="col-md-6 col-lg-6 col-sm-12 p-0 border-0">
@component('meter::components.chart', ['chart' => $requestTimeChart, 'title' => 'Response Times'])@endcomponent
</div>
<div class="col-md-6 col-lg-6 col-sm-12 p-0 border-0">
@component('meter::components.chart', ['chart' => $requestMemoryChart, 'title' => 'Request Memory Usage'])@endcomponent
</div>
@endif
@if (
config('meter.monitors.' . Sarfraznawaz2005\Meter\Monitors\QueryMonitor::class . '.enabled', true) &&
config('meter.monitors.' . Sarfraznawaz2005\Meter\Monitors\QueryMonitor::class . '.show_on_dashboard', true)
)
<div class="col-md-6 col-lg-6 col-sm-12 p-0 border-0">
@component('meter::components.chart', ['chart' => $queriesTimeChart, 'title' => 'Query Times'])@endcomponent
</div>
@endif
@if (
config('meter.monitors.' . Sarfraznawaz2005\Meter\Monitors\CommandMonitor::class . '.enabled', true) &&
config('meter.monitors.' . Sarfraznawaz2005\Meter\Monitors\CommandMonitor::class . '.show_on_dashboard', true)
)
<div class="col-md-6 col-lg-6 col-sm-12 p-0 border-0">
@component('meter::components.chart', ['chart' => $commandsTimeChart, 'title' => 'Command Times'])@endcomponent
</div>
@endif
@if (
config('meter.monitors.' . Sarfraznawaz2005\Meter\Monitors\EventMonitor::class . '.enabled', true) &&
config('meter.monitors.' . Sarfraznawaz2005\Meter\Monitors\EventMonitor::class . '.show_on_dashboard', true)
)
<div class="col-md-6 col-lg-6 col-sm-12 p-0 border-0">
@component('meter::components.chart', ['chart' => $eventsTimeChart, 'title' => 'Event Times'])@endcomponent
</div>
@endif
@if (
config('meter.monitors.' . Sarfraznawaz2005\Meter\Monitors\ScheduleMonitor::class . '.enabled', true) &&
config('meter.monitors.' . Sarfraznawaz2005\Meter\Monitors\ScheduleMonitor::class . '.show_on_dashboard', true)
)
<div class="col-md-6 col-lg-6 col-sm-12 p-0 border-0">
@component('meter::components.chart', ['chart' => $schedulesTimeChart, 'title' => 'Schedule Times'])@endcomponent
</div>
@endif
@if (
config('meter.monitors.' . Sarfraznawaz2005\Meter\Monitors\CpuMonitor::class . '.enabled', true) &&
config('meter.monitors.' . Sarfraznawaz2005\Meter\Monitors\CpuMonitor::class . '.show_on_dashboard', true)
)
<div class="col-md-6 col-lg-6 col-sm-12 p-0 border-0">
@component('meter::components.chart', ['chart' => $cpuChart, 'title' => 'Server CPU Usage'])@endcomponent
</div>
@endif
@if (
config('meter.monitors.' . Sarfraznawaz2005\Meter\Monitors\DiskSpaceMonitor::class . '.enabled', true) &&
config('meter.monitors.' . Sarfraznawaz2005\Meter\Monitors\DiskSpaceMonitor::class . '.show_on_dashboard', true)
)
<div class="col-md-6 col-lg-6 col-sm-12 p-0 border-0">
@component('meter::components.chart', ['chart' => $diskSpaceChart, 'title' => 'Server Disk Space Usage'])@endcomponent
</div>
@endif
@if (
config('meter.monitors.' . Sarfraznawaz2005\Meter\Monitors\MemoryMonitor::class . '.enabled', true) &&
config('meter.monitors.' . Sarfraznawaz2005\Meter\Monitors\MemoryMonitor::class . '.show_on_dashboard', true)
)
<div class="col-md-6 col-lg-6 col-sm-12 p-0 border-0">
@component('meter::components.chart', ['chart' => $serverMemoryChart, 'title' => 'Server Memory Usage'])@endcomponent
</div>
@endif
@if (
config('meter.monitors.' . Sarfraznawaz2005\Meter\Monitors\HttpConnectionsMonitor::class . '.enabled', true) &&
config('meter.monitors.' . Sarfraznawaz2005\Meter\Monitors\HttpConnectionsMonitor::class . '.show_on_dashboard', true)
)
<div class="col-md-6 col-lg-6 col-sm-12 p-0 border-0">
@component('meter::components.chart', ['chart' => $connectionsChart, 'title' => 'Server HTTP Connections Count'])@endcomponent
</div>
@endif
</div>
@endsection
================================================
FILE: src/Resources/Views/events.blade.php
================================================
@extends('meter::layout.layout')
@section('content')
<ul class="nav nav-tabs justify-content-center">
<li class="nav-item">
<a class="nav-item nav-link active" data-toggle="tab" href="#graph">
<i class="fa fa-bar-chart"></i> Graph
</a>
</li>
<li class="nav-item">
<a class="nav-item nav-link" data-toggle="tab" href="#index">
<i class="fa fa-table"></i> Events
</a>
</li>
</ul>
<div class="tab-content">
<div class="tab-pane fade show active" role="tabpanel" id="graph">
@component('meter::components.chart', ['chart' => $chart, 'title' => 'Event Times'])@endcomponent
</div>
<div class="tab-pane fade" role="tabpanel" id="index">
@component('meter::components.table',[
'url' => route('meter_events_table'),
'columns' => ['Happened', 'Event', 'Time', 'Listeners', 'More']
])
@endcomponent
</div>
</div>
@endsection
================================================
FILE: src/Resources/Views/layout/filters.blade.php
================================================
<a
class="dropdown-item btnfilter {{(request()->has('days') || request()->has('slow') || request()->has('all')) ? '' : 'active'}}"
href="{{route($route)}}">
Today
</a>
@foreach(config('meter.filters', []) as $name => $days)
<a
class="dropdown-item btnfilter {{(request()->has('days') && request()->days == $days) ? 'active' : ''}}"
href="{{route($route, ['days' => $days])}}"
>
{{$name}}
</a>
@endforeach
<a
class="dropdown-item btnfilter {{request()->has('all') ? 'active' : ''}}"
href="{{route($route, ['all' => 1])}}">
All
</a>
@push('js')
<script>
document.addEventListener('DOMContentLoaded', function () {
document.querySelector('.filter_name').innerHTML = document.querySelector('.dropdown-item.btnfilter.active').innerHTML;
});
</script>
@endpush
================================================
FILE: src/Resources/Views/layout/layout.blade.php
================================================
<!doctype html>
<html lang="{{ app()->getLocale() }}">
<head>
<meta charset="utf-8">
<meta name="viewport" content="width=device-width, initial-scale=1, shrink-to-fit=no">
<meta name="author" content="Sarfraz Ahmed (sarfraznawaz2005@gmail.com)">
<title>Meter</title>
<link href="https://fonts.googleapis.com/css?family=Nunito" rel="stylesheet">
<link href="https://stackpath.bootstrapcdn.com/font-awesome/4.7.0/css/font-awesome.min.css" rel="stylesheet">
<link rel="stylesheet" href="{{ asset('vendor/meter/bootstrap/bootstrap.min.css') }}">
<link rel="stylesheet" href="{{ asset('vendor/meter/datatable/dataTables.bootstrap4.min.css') }}">
<link rel="stylesheet" href="{{ asset('vendor/meter/meter.css') }}">
@stack('css')
</head>
<body>
@include('meter::layout.links')
<div class="card wrapper">
<div class="card-body">
@yield('content')
</div>
</div>
@include('meter::layout.modal')
<script src="{{ asset('vendor/meter/jquery.min.js') }}"></script>
<script src="{{ asset('vendor/meter/bootstrap/popper.min.js') }}"></script>
<script src="{{ asset('vendor/meter/bootstrap/bootstrap.min.js') }}"></script>
<script src="{{ asset('vendor/meter/datatable/jquery.dataTables.min.js') }}"></script>
<script src="{{ asset('vendor/meter/datatable/dataTables.bootstrap4.min.js') }}"></script>
<script src="{{ asset('vendor/meter/moment.min.js') }}"></script>
<script src="{{ asset('vendor/meter/Chart.min.js') }}"></script>
<script src="{{ asset('vendor/meter/meter.js') }}"></script>
@stack('js')
</body>
</html>
================================================
FILE: src/Resources/Views/layout/links.blade.php
================================================
<nav class="navbar fixed-top navbar-expand-lg navbar-light bg-light">
<span class="navbar-brand">
<strong class="logo fa fa-dashboard"></strong>
<strong>Meter</strong>
</span>
<button class="navbar-toggler" type="button" data-toggle="collapse" data-target="#collapsibleNavbar">
<span class="line"></span>
<span class="line"></span>
<span class="line" style="margin-bottom: 0;"></span>
</button>
<div class="collapse navbar-collapse" id="collapsibleNavbar">
<ul class="navbar-nav w-100">
<li class="nav-item">
<a
class="btn btn-light {{meterActiveLink('meter_home') ? 'active' : ''}}"
href="{{route('meter_home')}}">
Dashboard
</a>
</li>
@if (config('meter.monitors.' . Sarfraznawaz2005\Meter\Monitors\RequestMonitor::class . '.enabled', true))
<li class="nav-item">
<a
class="btn btn-light {{meterActiveLink('meter_requests') ? 'active' : ''}}"
href="{{route('meter_requests')}}">
Requests
</a>
</li>
@endif
@if (config('meter.monitors.' . Sarfraznawaz2005\Meter\Monitors\QueryMonitor::class . '.enabled', true))
<li class="nav-item">
<a
class="btn btn-light {{meterActiveLink('meter_queries') ? 'active' : ''}}"
href="{{route('meter_queries')}}">
Queries
</a>
</li>
@endif
@if (config('meter.monitors.' . Sarfraznawaz2005\Meter\Monitors\CommandMonitor::class . '.enabled', true))
<li class="nav-item">
<a
class="btn btn-light {{meterActiveLink('meter_commands') ? 'active' : ''}}"
href="{{route('meter_commands')}}">
Commands
</a>
</li>
@endif
@if (config('meter.monitors.' . Sarfraznawaz2005\Meter\Monitors\EventMonitor::class . '.enabled', true))
<li class="nav-item">
<a
class="btn btn-light {{meterActiveLink('meter_events') ? 'active' : ''}}"
href="{{route('meter_events')}}">
Events
</a>
</li>
@endif
@if (config('meter.monitors.' . Sarfraznawaz2005\Meter\Monitors\ScheduleMonitor::class . '.enabled', true))
<li class="nav-item">
<a
class="btn btn-light {{meterActiveLink('meter_schedules') ? 'active' : ''}}"
href="{{route('meter_schedules')}}">
Schedule
</a>
</li>
@endif
@if (
config('meter.monitors.' . Sarfraznawaz2005\Meter\Monitors\CpuMonitor::class . '.enabled', true) ||
config('meter.monitors.' . Sarfraznawaz2005\Meter\Monitors\DiskSpaceMonitor::class . '.enabled', true) ||
config('meter.monitors.' . Sarfraznawaz2005\Meter\Monitors\MemoryMonitor::class . '.enabled', true) ||
config('meter.monitors.' . Sarfraznawaz2005\Meter\Monitors\HttpConnectionsMonitor::class . '.enabled', true)
)
<li class="nav-item">
<a
class="btn btn-light {{meterActiveLink('meter_server_stats') ? 'active' : ''}}"
href="{{route('meter_server_stats')}}">
Server
</a>
</li>
@endif
<li class="nav-item dropdown ml-auto">
<a class="nav-link dropdown-toggle filter_name" href="#" data-toggle="dropdown">Today </a>
<div class="dropdown-menu dropdown-menu-right">
@include('meter::layout.filters', ['route' => request()->route()->getName()])
</div>
</li>
</ul>
</div>
</nav>
================================================
FILE: src/Resources/Views/layout/modal.blade.php
================================================
<div class="modal" id="detailsModal">
<div class="modal-dialog modal-dialog-scrollable">
<div class="modal-content">
<div class="modal-body"></div>
<div class="modal-footer" style="padding: 5px;">
<button type="button" class="btn btn-default" data-dismiss="modal">Close</button>
</div>
</div>
</div>
</div>
================================================
FILE: src/Resources/Views/queries.blade.php
================================================
@extends('meter::layout.layout')
@section('content')
<ul class="nav nav-tabs justify-content-center">
<li class="nav-item">
<a class="nav-item nav-link active" data-toggle="tab" href="#graph">
<i class="fa fa-bar-chart"></i> Graph
</a>
</li>
<li class="nav-item">
<a class="nav-item nav-link" data-toggle="tab" href="#index">
<i class="fa fa-table"></i> Queries
</a>
</li>
</ul>
<div class="tab-content">
<div class="tab-pane fade show active" role="tabpanel" id="graph">
@component('meter::components.chart', ['chart' => $queriesTimeChart, 'title' => 'Query Times'])@endcomponent
</div>
<div class="tab-pane fade" role="tabpanel" id="index">
@component('meter::components.table',[
'url' => route('meter_queries_table'),
'columns' => ['Happened', 'Query', 'Time', 'Slow', 'More'],
'columnDefs' => ['{"width": "10%", "targets": 0}', '{"width": "5%", "targets": -1}', '{"width": "10%", "targets": -2}', '{"width": "10%", "targets": -3}']
])
@endcomponent
</div>
</div>
@endsection
================================================
FILE: src/Resources/Views/requests.blade.php
================================================
@extends('meter::layout.layout')
@section('content')
<ul class="nav nav-tabs justify-content-center">
<li class="nav-item">
<a class="nav-item nav-link active" data-toggle="tab" href="#graph">
<i class="fa fa-bar-chart"></i> Graph
</a>
</li>
<li class="nav-item">
<a class="nav-item nav-link" data-toggle="tab" href="#index">
<i class="fa fa-table"></i> Requests
</a>
</li>
</ul>
<div class="tab-content">
<div class="tab-pane fade show active" role="tabpanel" id="graph">
@component('meter::components.chart', ['chart' => $timeChart, 'title' => 'Response Times'])@endcomponent
@component('meter::components.chart', ['chart' => $memoryChart, 'title' => 'Memory Usage'])@endcomponent
</div>
<div class="tab-pane fade" role="tabpanel" id="index">
@component('meter::components.table',[
'url' => route('meter_requests_table'),
'columns' => ['Happened', 'Verb', 'Path', 'Status', 'Time', 'Memory', 'Slow', 'More'],
])
@endcomponent
</div>
</div>
@endsection
================================================
FILE: src/Resources/Views/schedules.blade.php
================================================
@extends('meter::layout.layout')
@section('content')
<ul class="nav nav-tabs justify-content-center">
<li class="nav-item">
<a class="nav-item nav-link active" data-toggle="tab" href="#graph">
<i class="fa fa-bar-chart"></i> Graph
</a>
</li>
<li class="nav-item">
<a class="nav-item nav-link" data-toggle="tab" href="#index">
<i class="fa fa-table"></i> Schedules
</a>
</li>
</ul>
<div class="tab-content">
<div class="tab-pane fade show active" role="tabpanel" id="graph">
@component('meter::components.chart', ['chart' => $chart, 'title' => 'Schedule Times'])@endcomponent
</div>
<div class="tab-pane fade" role="tabpanel" id="index">
@component('meter::components.table',[
'url' => route('meter_schedules_table'),
'columns' => ['Happened', 'Command', 'Expression', 'Time', 'More']
])
@endcomponent
</div>
</div>
@endsection
================================================
FILE: src/Resources/Views/server.blade.php
================================================
@extends('meter::layout.layout')
@section('content')
@component('meter::components.chart', ['chart' => $cpuChart, 'title' => 'Server CPU Usage'])@endcomponent
@component('meter::components.chart', ['chart' => $diskSpaceChart, 'title' => 'Server Disk Space Usage'])@endcomponent
@component('meter::components.chart', ['chart' => $serverMemoryChart, 'title' => 'Server Memory Usage'])@endcomponent
@component('meter::components.chart', ['chart' => $connectionsChart, 'title' => 'Server HTTP Connections Count'])@endcomponent
@endsection
================================================
FILE: src/Tables/CommandsTable.php
================================================
<?php
namespace Sarfraznawaz2005\Meter\Tables;
use Carbon\Carbon;
use Illuminate\Database\Eloquent\Builder;
use Sarfraznawaz2005\Meter\Models\MeterModel;
use Sarfraznawaz2005\Meter\Type;
class CommandsTable extends Table
{
/**
* Columns to be shown in table.
*
* @return array
*/
public function columns(): array
{
return [
'is_slow',
'content',
'created_at',
];
}
/**
* Searchable columns in table
*
* @return array
*/
public function searchColumns(): array
{
return $this->columns();
}
/**
* Table Query
*
* @return Builder
*/
public function builder(): Builder
{
return (new MeterModel)->type(Type::COMMAND)->filtered()->orderBy('id', 'desc');
}
/**
* Transform data as we need.
*
* @param array $rows
* @return array
*/
public function transform(array $rows): array
{
$transformed = [];
foreach ($rows as $row) {
$data['Happened'] = meterWithHtmlTitle(Carbon::parse($row['created_at'])->diffForHumans(), $row['created_at']);
$data['Command'] = $row['content']['command'];
$data['Time'] = $row['content']['time'] . ' ms';
$data['Exit Code'] = meterAutoBadge($row['content']['exit_code'], [
'success' => $row['content']['exit_code'] === 0,
'warning' => $row['content']['exit_code'] !== 0,
]);
// additional for details button
$details['Arguments'] = '<pre class="json">' . json_encode($row['content']['arguments'], JSON_PRETTY_PRINT) . '</pre>';
$details['Options'] = '<pre class="json">' . json_encode($row['content']['options'], JSON_PRETTY_PRINT) . '</pre>';
$data['More'] = meterCenter(meterDetailsButton($details));
$transformed[] = $data;
}
return $transformed;
}
}
================================================
FILE: src/Tables/EventsTable.php
================================================
<?php
namespace Sarfraznawaz2005\Meter\Tables;
use Carbon\Carbon;
use Illuminate\Database\Eloquent\Builder;
use Sarfraznawaz2005\Meter\Models\MeterModel;
use Sarfraznawaz2005\Meter\Type;
class EventsTable extends Table
{
/**
* Columns to be shown in table.
*
* @return array
*/
public function columns(): array
{
return [
'is_slow',
'content',
'created_at',
];
}
/**
* Searchable columns in table
*
* @return array
*/
public function searchColumns(): array
{
return $this->columns();
}
/**
* Table Query
*
* @return Builder
*/
public function builder(): Builder
{
return (new MeterModel)->type(Type::EVENT)->filtered()->orderBy('id', 'desc');
}
/**
* Transform data as we need.
*
* @param array $rows
* @return array
*/
public function transform(array $rows): array
{
$transformed = [];
foreach ($rows as $row) {
$data['Happened'] = meterWithHtmlTitle(Carbon::parse($row['created_at'])->diffForHumans(), $row['created_at']);
$data['Event'] = $row['content']['name'];
$data['Time'] = $row['content']['time'] . ' ms';
$data['Listeners'] = count($row['content']['listeners']);
// additional for details button
$details['Listeners'] = '<pre class="json">' . json_encode($row['content']['listeners'], JSON_PRETTY_PRINT) . '</pre>';
$details['Payload'] = '<pre class="json">' . json_encode($row['content']['payload'], JSON_PRETTY_PRINT) . '</pre>';
$details['Broadcast'] = $row['content']['broadcast'];
$data['More'] = meterCenter(meterDetailsButton($details));
$transformed[] = $data;
}
return $transformed;
}
}
================================================
FILE: src/Tables/QueriesTable.php
================================================
<?php
namespace Sarfraznawaz2005\Meter\Tables;
use Carbon\Carbon;
use Illuminate\Database\Eloquent\Builder;
use Illuminate\Support\Str;
use Sarfraznawaz2005\Meter\Models\MeterModel;
use Sarfraznawaz2005\Meter\Type;
class QueriesTable extends Table
{
/**
* Columns to be shown in table.
*
* @return array
*/
public function columns(): array
{
return [
'is_slow',
'content',
'created_at',
];
}
/**
* Searchable columns in table
*
* @return array
*/
public function searchColumns(): array
{
return $this->columns();
}
/**
* Table Query
*
* @return Builder
*/
public function builder(): Builder
{
return (new MeterModel)->type(Type::QUERY)->filtered()->orderBy('id', 'desc');
}
/**
* Transform data as we need.
*
* @param array $rows
* @return array
*/
public function transform(array $rows): array
{
$transformed = [];
foreach ($rows as $row) {
$data['Happened'] = meterWithHtmlTitle(Carbon::parse($row['created_at'])->diffForHumans(), $row['created_at']);
$data['Query'] = '<div class="meter_sql">' . Str::limit($row['content']['sql'], 80) . '</div>';
$data['Time'] = $row['content']['time'] . ' ms';
$data['Slow'] = meterAutoBadge($row['is_slow'], [
'secondary' => $row['is_slow'] === 'No',
'danger' => $row['is_slow'] === 'Yes'
]);
// additional for details button
$details['Query'] = '<div class="meter_sql">' . $row['content']['sql'] . '</div>';
$details['Connection'] = $row['content']['connection'];
$details['File'] = $row['content']['file'];
$details['Line'] = $row['content']['line'];
$data['More'] = meterCenter(meterDetailsButton($details));
$transformed[] = $data;
}
return $transformed;
}
}
================================================
FILE: src/Tables/RequestsTable.php
================================================
<?php
namespace Sarfraznawaz2005\Meter\Tables;
use Carbon\Carbon;
use Illuminate\Database\Eloquent\Builder;
use Sarfraznawaz2005\Meter\Models\MeterModel;
use Sarfraznawaz2005\Meter\Type;
class RequestsTable extends Table
{
/**
* Columns to be shown in table.
*
* @return array
*/
public function columns(): array
{
return [
'is_slow',
'content',
'created_at',
];
}
/**
* Searchable columns in table
*
* @return array
*/
public function searchColumns(): array
{
return $this->columns();
}
/**
* Table Query
*
* @return Builder
*/
public function builder(): Builder
{
return (new MeterModel)->type(Type::REQUEST)->filtered()->orderBy('id', 'desc');
}
/**
* Transform data as we need.
*
* @param array $rows
* @return array
*/
public function transform(array $rows): array
{
$transformed = [];
foreach ($rows as $row) {
$data['Happened'] = meterWithHtmlTitle(Carbon::parse($row['created_at'])->diffForHumans(), $row['created_at']);
$data['Verb'] = meterBadge($row['content']['method']);
$data['Path'] = meterWithHtmlTitle($row['content']['uri'], $row['content']['controller_action']);
$data['Status'] = meterAutoBadge($row['content']['response_status'], [
'success' => $row['content']['response_status'] < 400,
'warning' => $row['content']['response_status'] >= 400 && $row['content']['response_status'] < 500,
'danger' => $row['content']['response_status'] >= 500,
]);
$data['Time'] = $row['content']['duration'] . ' ms';
$data['Memory'] = $row['content']['memory'] . ' MB';
$data['Slow'] = meterAutoBadge($row['is_slow'], [
'secondary' => $row['is_slow'] === 'No',
'danger' => $row['is_slow'] === 'Yes'
]);
// additional for details button
$details['Controller'] = $row['content']['controller_action'];
$details['Middleware'] = $row['content']['middleware'];
$details['IP'] = $row['content']['ip'];
$data['More'] = meterCenter(meterDetailsButton($details));
$transformed[] = $data;
}
return $transformed;
}
}
================================================
FILE: src/Tables/SchedulesTable.php
================================================
<?php
namespace Sarfraznawaz2005\Meter\Tables;
use Carbon\Carbon;
use Illuminate\Database\Eloquent\Builder;
use Sarfraznawaz2005\Meter\Models\MeterModel;
use Sarfraznawaz2005\Meter\Type;
class SchedulesTable extends Table
{
/**
* Columns to be shown in table.
*
* @return array
*/
public function columns(): array
{
return [
'is_slow',
'content',
'created_at',
];
}
/**
* Searchable columns in table
*
* @return array
*/
public function searchColumns(): array
{
return $this->columns();
}
/**
* Table Query
*
* @return Builder
*/
public function builder(): Builder
{
return (new MeterModel)->type(Type::SCHEDULE)->filtered()->orderBy('id', 'desc');
}
/**
* Transform data as we need.
*
* @param array $rows
* @return array
*/
public function transform(array $rows): array
{
$transformed = [];
foreach ($rows as $row) {
$data['Happened'] = meterWithHtmlTitle(Carbon::parse($row['created_at'])->diffForHumans(), $row['created_at']);
$data['Command'] = $row['content']['command'];
$data['Expression'] = meterBadge($row['content']['expression']);
$data['Time'] = $row['content']['time'] . ' ms';
// additional for details button
$details['Description'] = $row['content']['description'];
$details['Timezone'] = $row['content']['timezone'];
$details['User'] = $row['content']['user'];
$details['Output'] = $row['content']['output'] ? '<pre>' . $row['content']['output'] . '</pre>' : 'null';
$data['More'] = meterCenter(meterDetailsButton($details));
$transformed[] = $data;
}
return $transformed;
}
}
================================================
FILE: src/Tables/Table.php
================================================
<?php
/**
* Created by PhpStorm.
* User: Sarfraz
* Date: 12/12/2019
* Time: 2:10 PM
*/
namespace Sarfraznawaz2005\Meter\Tables;
use Illuminate\Database\Eloquent\Builder;
use Illuminate\Pagination\Paginator;
abstract class Table
{
/**
* Columns to be shown in table.
*
* @return array
*/
abstract public function columns(): array;
/**
* Searchable columns in table
*
* @return array
*/
abstract public function searchColumns(): array;
/**
* Table Query
*
* @return Builder
*/
abstract public function builder(): Builder;
/**
* Returns data for DataTable
*
* @return array
*/
public function getData(): array
{
$entries = null;
$columns = $this->columns();
$searchColumns = $this->searchColumns();
$builder = $this->builder();
$draw = request()->draw;
$start = request()->start;
$length = request()->length;
$orderColumn = request()->order[0]['column'] ?? null;
$dir = request()->order[0]['dir'] ?? null;
$searchValue = trim(request()->search['value']);
// sets the current page
Paginator::currentPageResolver(static function () use ($start, $length) {
return ($start / $length + 1);
});
if ($searchValue) {
$where = '';
foreach ($searchColumns as $searchColumn) {
$where .= "`$searchColumn` like '%$searchValue%' OR ";
}
$where = rtrim($where, 'OR ');
$builder->whereRaw("($where)");
}
$builder->select($columns);
if ($orderColumn) {
$builder->orderBy($columns[$orderColumn], $dir);
}
$rows = $builder->paginate($length);
$entries = $rows->toArray()['data'];
if (method_exists($this, 'transform')) {
$entries = $this->transform($entries);
}
return $entries ? [
'draw' => $draw,
'recordsTotal' => $rows->total(),
'recordsFiltered' => $rows->total(),
'data' => $entries
] : [
'draw' => 0,
'recordsTotal' => 0,
'recordsFiltered' => 0,
'data' => [],
];
}
}
================================================
FILE: src/Traits/FetchesStackTrace.php
================================================
<?php
namespace Sarfraznawaz2005\Meter\Traits;
use Illuminate\Support\Str;
trait FetchesStackTrace
{
/**
* Find the first frame in the stack trace outside of Telescope/Laravel.
*
* @return mixed
*/
protected function getCallerFromStackTrace()
{
$trace = collect(debug_backtrace(DEBUG_BACKTRACE_IGNORE_ARGS))->forget(0);
return $trace->first(function ($frame) {
if (!isset($frame['file'])) {
return false;
}
return !Str::contains($frame['file'],
base_path('vendor' . DIRECTORY_SEPARATOR . $this->ignoredVendorPath())
);
});
}
/**
* Choose the frame outside of either Telescope/Laravel or all packages.
*
* @return string|null
*/
protected function ignoredVendorPath()
{
if (!($this->options['ignore_packages'] ?? true)) {
return 'laravel';
}
}
}
================================================
FILE: src/Traits/FormatsClosure.php
================================================
<?php
namespace Sarfraznawaz2005\Meter\Traits;
use Closure;
use ReflectionFunction;
trait FormatsClosure
{
/**
* Format a closure-based listener.
*
* @param \Closure $listener
* @return string
*
* @throws \ReflectionException
*/
protected function formatClosureListener(Closure $listener): string
{
$listener = new ReflectionFunction($listener);
return sprintf('Closure at %s[%s:%s]',
$listener->getFileName(),
$listener->getStartLine(),
$listener->getEndLine()
);
}
}
================================================
FILE: src/Traits/RegistersMonitors.php
================================================
<?php
namespace Sarfraznawaz2005\Meter\Traits;
use Illuminate\Contracts\Foundation\Application;
use Sarfraznawaz2005\Meter\Console\ServerMonitorCommand;
trait RegistersMonitors
{
/**
* The class names of the registered monitors.
*
* @var array
*/
protected static $monitors = [];
/**
* Determine if a given monitor has been registered.
*
* @param string $class
* @return bool
*/
public static function hasMonitor($class): bool
{
return in_array($class, static::$monitors, true);
}
/**
* Register the configured Meter monitors.
*
* @param Application $app
* @return void
*/
protected static function registerMonitors($app)
{
$serverMonitors = ServerMonitorCommand::$serverMonitors;
foreach (config('meter.monitors') as $key => $monitor) {
if (is_string($key) && $monitor === false) {
continue;
}
if (is_array($monitor) && !($monitor['enabled'] ?? true)) {
continue;
}
$monitor = $app->make(is_string($key) ? $key : $monitor, [
'options' => is_array($monitor) ? $monitor : [],
]);
$class = get_class($monitor);
// exclude server monitors
if (in_array($class, $serverMonitors, true)) {
unset($monitor);
continue;
}
static::$monitors[] = $class;
$monitor->register($app);
}
}
/**
* Returns all registered monitors.
*
* @return array
*/
protected static function getMonitors(): array
{
return static::$monitors;
}
}
================================================
FILE: src/Type.php
================================================
<?php
namespace Sarfraznawaz2005\Meter;
final class Type
{
const QUERY = 'query';
const REQUEST = 'request';
const COMMAND = 'command';
const EVENT = 'event';
const SCHEDULE = 'schedule';
const CPU = 'cpu';
const DISK = 'disk';
const MEMORY = 'memory';
const CONNECTIONS = 'connections';
}
================================================
FILE: tests/ConsoleTest.php
================================================
<?php
namespace Sarfraznawaz2005\Meter\Tests;
use Illuminate\Support\Facades\Artisan;
use Illuminate\Support\Facades\File;
use Tests\TestCase;
class ConsoleTest extends TestCase
{
public function test_publish_command_works()
{
if (File::exists(public_path('vendor/meter/meter.css'))) {
unlink(public_path('vendor/meter/meter.css'));
}
$this->assertFalse(File::exists(public_path('vendor/meter/meter.css')));
Artisan::call('meter:publish');
$this->assertTrue(File::exists(public_path('vendor/meter/meter.css')));
}
}
================================================
FILE: tests/MeterModelTest.php
================================================
<?php
namespace Sarfraznawaz2005\Meter\Tests;
use Illuminate\Foundation\Testing\RefreshDatabase;
use Sarfraznawaz2005\Meter\Models\MeterModel;
use Sarfraznawaz2005\Meter\Type;
use Tests\TestCase;
class MeterModelTest extends TestCase
{
use RefreshDatabase;
public function test_it_can_save_entries()
{
$model = factory(MeterModel::class)->create(['type' => Type::EVENT, 'No', 'test content']);
$this->assertEquals('test content', $model->content);
}
}
gitextract_q4lycjzt/
├── .editorconfig
├── .gitattributes
├── .gitignore
├── LICENSE.md
├── README.md
├── composer.json
├── phpunit.xml
├── src/
│ ├── Charts/
│ │ ├── Chart.php
│ │ ├── CommandsTimeChart.php
│ │ ├── ConnectionsChart.php
│ │ ├── CpuChart.php
│ │ ├── DiskSpaceChart.php
│ │ ├── EventsTimeChart.php
│ │ ├── OverAllTimesChart.php
│ │ ├── QueriesTimeChart.php
│ │ ├── RequestMemoryChart.php
│ │ ├── RequestTimeChart.php
│ │ ├── SchedulesTimeChart.php
│ │ └── ServerMemoryChart.php
│ ├── Config/
│ │ └── config.php
│ ├── Console/
│ │ ├── PruneCommand.php
│ │ ├── PublishCommand.php
│ │ └── ServerMonitorCommand.php
│ ├── Helpers.php
│ ├── Http/
│ │ ├── Controllers/
│ │ │ ├── PagesController.php
│ │ │ └── TablesController.php
│ │ ├── Middleware/
│ │ │ └── BasicAuth.php
│ │ └── routes.php
│ ├── Meter.php
│ ├── MeterServiceProvider.php
│ ├── Migrations/
│ │ └── 2019_12_12_100000_create_meter_entries_table.php
│ ├── Models/
│ │ └── MeterModel.php
│ ├── Monitors/
│ │ ├── CommandMonitor.php
│ │ ├── CpuMonitor.php
│ │ ├── DiskSpaceMonitor.php
│ │ ├── EventMonitor.php
│ │ ├── HttpConnectionsMonitor.php
│ │ ├── MemoryMonitor.php
│ │ ├── Monitor.php
│ │ ├── QueryMonitor.php
│ │ ├── RequestMonitor.php
│ │ └── ScheduleMonitor.php
│ ├── Resources/
│ │ ├── Assets/
│ │ │ ├── meter.css
│ │ │ └── meter.js
│ │ └── Views/
│ │ ├── commands.blade.php
│ │ ├── components/
│ │ │ ├── chart.blade.php
│ │ │ └── table.blade.php
│ │ ├── dashboard.blade.php
│ │ ├── events.blade.php
│ │ ├── layout/
│ │ │ ├── filters.blade.php
│ │ │ ├── layout.blade.php
│ │ │ ├── links.blade.php
│ │ │ └── modal.blade.php
│ │ ├── queries.blade.php
│ │ ├── requests.blade.php
│ │ ├── schedules.blade.php
│ │ └── server.blade.php
│ ├── Tables/
│ │ ├── CommandsTable.php
│ │ ├── EventsTable.php
│ │ ├── QueriesTable.php
│ │ ├── RequestsTable.php
│ │ ├── SchedulesTable.php
│ │ └── Table.php
│ ├── Traits/
│ │ ├── FetchesStackTrace.php
│ │ ├── FormatsClosure.php
│ │ └── RegistersMonitors.php
│ └── Type.php
└── tests/
├── ConsoleTest.php
└── MeterModelTest.php
SYMBOL INDEX (208 symbols across 46 files)

FILE: src/Charts/Chart.php
  class Chart (line 8) | abstract class Chart extends BaseChart
    method setOptions (line 22) | abstract protected function setOptions();
    method setData (line 30) | abstract protected function setData(MeterModel $model);
    method getLabels (line 37) | abstract protected function getLabels(): array;
    method getValues (line 44) | abstract protected function getValues(): array;
    method setDataSet (line 51) | abstract protected function setDataSet();
    method __construct (line 57) | public function __construct(MeterModel $model)

FILE: src/Charts/CommandsTimeChart.php
  class CommandsTimeChart (line 10) | class CommandsTimeChart extends Chart
    method setOptions (line 17) | protected function setOptions()
    method setData (line 71) | protected function setData(MeterModel $model)
    method getLabels (line 88) | protected function getLabels(): array
    method getValues (line 98) | protected function getValues(): array
    method setDataSet (line 108) | protected function setDataSet()

FILE: src/Charts/ConnectionsChart.php
  class ConnectionsChart (line 9) | class ConnectionsChart extends Chart
    method setOptions (line 16) | protected function setOptions()
    method setData (line 57) | protected function setData(MeterModel $model)
    method getLabels (line 69) | protected function getLabels(): array
    method getValues (line 79) | protected function getValues(): array
    method setDataSet (line 89) | protected function setDataSet()

FILE: src/Charts/CpuChart.php
  class CpuChart (line 9) | class CpuChart extends Chart
    method setOptions (line 16) | protected function setOptions()
    method setData (line 57) | protected function setData(MeterModel $model)
    method getLabels (line 69) | protected function getLabels(): array
    method getValues (line 79) | protected function getValues(): array
    method setDataSet (line 89) | protected function setDataSet()

FILE: src/Charts/DiskSpaceChart.php
  class DiskSpaceChart (line 9) | class DiskSpaceChart extends Chart
    method setOptions (line 16) | protected function setOptions()
    method setData (line 57) | protected function setData(MeterModel $model)
    method getLabels (line 69) | protected function getLabels(): array
    method getValues (line 79) | protected function getValues(): array
    method setDataSet (line 89) | protected function setDataSet()

FILE: src/Charts/EventsTimeChart.php
  class EventsTimeChart (line 10) | class EventsTimeChart extends Chart
    method setOptions (line 17) | protected function setOptions()
    method setData (line 71) | protected function setData(MeterModel $model)
    method getLabels (line 88) | protected function getLabels(): array
    method getValues (line 98) | protected function getValues(): array
    method setDataSet (line 108) | protected function setDataSet()

FILE: src/Charts/OverAllTimesChart.php
  class OverAllTimesChart (line 13) | class OverAllTimesChart extends Chart
    method setOptions (line 20) | protected function setOptions()
    method setData (line 44) | protected function setData(MeterModel $model)
    method getLabels (line 67) | protected function getLabels(): array
    method getValues (line 77) | protected function getValues(): array
    method setDataSet (line 87) | protected function setDataSet()

FILE: src/Charts/QueriesTimeChart.php
  class QueriesTimeChart (line 11) | class QueriesTimeChart extends Chart
    method setOptions (line 18) | protected function setOptions()
    method setData (line 72) | protected function setData(MeterModel $model)
    method getLabels (line 89) | protected function getLabels(): array
    method getValues (line 99) | protected function getValues(): array
    method setDataSet (line 109) | protected function setDataSet()

FILE: src/Charts/RequestMemoryChart.php
  class RequestMemoryChart (line 10) | class RequestMemoryChart extends Chart
    method setOptions (line 17) | protected function setOptions()
    method setData (line 71) | protected function setData(MeterModel $model)
    method getLabels (line 88) | protected function getLabels(): array
    method getValues (line 98) | protected function getValues(): array
    method setDataSet (line 108) | protected function setDataSet()

FILE: src/Charts/RequestTimeChart.php
  class RequestTimeChart (line 10) | class RequestTimeChart extends Chart
    method setOptions (line 17) | protected function setOptions()
    method setData (line 71) | protected function setData(MeterModel $model)
    method getLabels (line 88) | protected function getLabels(): array
    method getValues (line 98) | protected function getValues(): array
    method setDataSet (line 108) | protected function setDataSet()

FILE: src/Charts/SchedulesTimeChart.php
  class SchedulesTimeChart (line 10) | class SchedulesTimeChart extends Chart
    method setOptions (line 17) | protected function setOptions()
    method setData (line 71) | protected function setData(MeterModel $model)
    method getLabels (line 101) | protected function getLabels(): array
    method getValues (line 111) | protected function getValues(): array
    method setDataSet (line 121) | protected function setDataSet()

FILE: src/Charts/ServerMemoryChart.php
  class ServerMemoryChart (line 9) | class ServerMemoryChart extends Chart
    method setOptions (line 16) | protected function setOptions()
    method setData (line 57) | protected function setData(MeterModel $model)
    method getLabels (line 69) | protected function getLabels(): array
    method getValues (line 79) | protected function getValues(): array
    method setDataSet (line 89) | protected function setDataSet()

FILE: src/Console/PruneCommand.php
  class PruneCommand (line 9) | class PruneCommand extends Command
    method handle (line 14) | public function handle(MeterModel $model)

FILE: src/Console/PublishCommand.php
  class PublishCommand (line 7) | class PublishCommand extends Command
    method handle (line 12) | public function handle()

FILE: src/Console/ServerMonitorCommand.php
  class ServerMonitorCommand (line 12) | class ServerMonitorCommand extends Command
    method handle (line 24) | public function handle()

FILE: src/Helpers.php
  function meterActiveLink (line 8) | function meterActiveLink($path, $class = 'active')
  function meterWithHtmlTitle (line 19) | function meterWithHtmlTitle($text, $title)
  function meterBadge (line 26) | function meterBadge($text)
  function meterAutoBadge (line 33) | function meterAutoBadge($text, $colorMap)
  function meterCenter (line 42) | function meterCenter($text)
  function meterDetailsButton (line 49) | function meterDetailsButton($details)
  function meterGetSql (line 62) | function meterGetSql(Builder $builder)
  function meterFormatModel (line 71) | function meterFormatModel(Model $model)
  function meterIgnoreEntry (line 78) | function meterIgnoreEntry($key, $content)

FILE: src/Http/Controllers/PagesController.php
  class PagesController (line 19) | class PagesController extends Controller
    method home (line 21) | public function home(
    method queries (line 60) | public function queries(QueriesTimeChart $queriesTimeChart)
    method requests (line 65) | public function requests(
    method commands (line 73) | public function commands(CommandsTimeChart $chart)
    method events (line 78) | public function events(EventsTimeChart $chart)
    method schedules (line 83) | public function schedules(SchedulesTimeChart $chart)
    method serverStats (line 88) | public function serverStats(

FILE: src/Http/Controllers/TablesController.php
  class TablesController (line 12) | class TablesController extends Controller
    method requestsTable (line 14) | public function requestsTable(RequestsTable $table): array
    method queriesTable (line 19) | public function queriesTable(QueriesTable $table): array
    method commandsTable (line 24) | public function commandsTable(CommandsTable $table): array
    method eventsTable (line 29) | public function eventsTable(EventsTable $table): array
    method schedulesTable (line 34) | public function schedulesTable(SchedulesTable $table): array

FILE: src/Http/Middleware/BasicAuth.php
  class BasicAuth (line 8) | class BasicAuth
    method handle (line 17) | public function handle($request, Closure $next)

FILE: src/Meter.php
  class Meter (line 8) | class Meter
    method start (line 24) | public static function start($app)
    method runningApprovedArtisanCommand (line 42) | protected static function runningApprovedArtisanCommand($app): bool
    method handlingApprovedRequest (line 68) | protected static function handlingApprovedRequest($app): bool
    method startMonitoring (line 92) | public static function startMonitoring()
    method stopMonitoring (line 102) | public static function stopMonitoring()
    method isMonitoring (line 112) | public static function isMonitoring(): bool

FILE: src/MeterServiceProvider.php
  class MeterServiceProvider (line 13) | class MeterServiceProvider extends ServiceProvider
    method boot (line 15) | public function boot(Router $router)
    method registerDbConnection (line 56) | protected function registerDbConnection()
    method register (line 66) | public function register()

FILE: src/Migrations/2019_12_12_100000_create_meter_entries_table.php
  class CreateMeterEntriesTable (line 7) | class CreateMeterEntriesTable extends Migration
    method up (line 14) | public function up()
    method down (line 34) | public function down()

FILE: src/Models/MeterModel.php
  class MeterModel (line 8) | class MeterModel extends Model
    method __construct (line 22) | function __construct()
    method scopeType (line 34) | public function scopeType($query, $type): Builder
    method scopeFiltered (line 45) | public function scopeFiltered($query): Builder

FILE: src/Monitors/CommandMonitor.php
  class CommandMonitor (line 12) | class CommandMonitor extends Monitor
    method register (line 22) | public function register($app)
    method collect (line 36) | public function collect(CommandFinished $event)
    method shouldIgnore (line 59) | private function shouldIgnore($event): bool

FILE: src/Monitors/CpuMonitor.php
  class CpuMonitor (line 8) | class CpuMonitor extends Monitor
    method register (line 16) | public function register($app)

FILE: src/Monitors/DiskSpaceMonitor.php
  class DiskSpaceMonitor (line 8) | class DiskSpaceMonitor extends Monitor
    method register (line 16) | public function register($app)

FILE: src/Monitors/EventMonitor.php
  class EventMonitor (line 16) | class EventMonitor extends Monitor
    method register (line 28) | public function register($app)
    method collect (line 44) | public function collect($eventName, $payload)
    method extractPayload (line 73) | protected function extractPayload($eventName, $payload): array
    method extractProperties (line 96) | protected function extractProperties($target): array
    method formatListeners (line 125) | protected function formatListeners($eventName): array
    method shouldIgnore (line 163) | protected function shouldIgnore($eventName): bool
    method eventIsFiredByTheFramework (line 174) | protected function eventIsFiredByTheFramework($eventName): bool
    method eventIsIgnored (line 188) | protected function eventIsIgnored($eventName): bool

FILE: src/Monitors/HttpConnectionsMonitor.php
  class HttpConnectionsMonitor (line 8) | class HttpConnectionsMonitor extends Monitor
    method register (line 16) | public function register($app)

FILE: src/Monitors/MemoryMonitor.php
  class MemoryMonitor (line 8) | class MemoryMonitor extends Monitor
    method register (line 16) | public function register($app)

FILE: src/Monitors/Monitor.php
  class Monitor (line 9) | abstract class Monitor
    method __construct (line 31) | public function __construct(array $options = [])
    method register (line 44) | abstract public function register($app);
    method record (line 54) | public function record($type, $isSlow, array $content)

FILE: src/Monitors/QueryMonitor.php
  class QueryMonitor (line 11) | class QueryMonitor extends Monitor
    method register (line 21) | public function register($app)
    method collect (line 31) | public function collect(QueryExecuted $event)
    method replaceBindings (line 60) | public function replaceBindings($event): string
    method formatBindings (line 87) | protected function formatBindings($event): array

FILE: src/Monitors/RequestMonitor.php
  class RequestMonitor (line 10) | class RequestMonitor extends Monitor
    method register (line 18) | public function register($app)
    method collect (line 28) | public function collect(RequestHandled $event)

FILE: src/Monitors/ScheduleMonitor.php
  class ScheduleMonitor (line 14) | class ScheduleMonitor extends Monitor
    method register (line 24) | public function register($app)
    method collect (line 34) | public function collect(CommandStarting $event)
    method getEventOutput (line 69) | protected function getEventOutput(Event $event)
    method fixupCommand (line 84) | protected function fixupCommand($command)

FILE: src/Resources/Assets/meter.js
  function meterSetup (line 33) | function meterSetup() {
  function meterTable (line 46) | function meterTable(tableSelector, url, length, columns, extraOptions, d...
  function meterHighlightSQL (line 76) | function meterHighlightSQL() {
  function meterHighlightJson (line 85) | function meterHighlightJson() {

FILE: src/Tables/CommandsTable.php
  class CommandsTable (line 10) | class CommandsTable extends Table
    method columns (line 17) | public function columns(): array
    method searchColumns (line 31) | public function searchColumns(): array
    method builder (line 41) | public function builder(): Builder
    method transform (line 52) | public function transform(array $rows): array

FILE: src/Tables/EventsTable.php
  class EventsTable (line 10) | class EventsTable extends Table
    method columns (line 17) | public function columns(): array
    method searchColumns (line 31) | public function searchColumns(): array
    method builder (line 41) | public function builder(): Builder
    method transform (line 52) | public function transform(array $rows): array

FILE: src/Tables/QueriesTable.php
  class QueriesTable (line 11) | class QueriesTable extends Table
    method columns (line 18) | public function columns(): array
    method searchColumns (line 32) | public function searchColumns(): array
    method builder (line 42) | public function builder(): Builder
    method transform (line 53) | public function transform(array $rows): array

FILE: src/Tables/RequestsTable.php
  class RequestsTable (line 10) | class RequestsTable extends Table
    method columns (line 17) | public function columns(): array
    method searchColumns (line 31) | public function searchColumns(): array
    method builder (line 41) | public function builder(): Builder
    method transform (line 52) | public function transform(array $rows): array

FILE: src/Tables/SchedulesTable.php
  class SchedulesTable (line 10) | class SchedulesTable extends Table
    method columns (line 17) | public function columns(): array
    method searchColumns (line 31) | public function searchColumns(): array
    method builder (line 41) | public function builder(): Builder
    method transform (line 52) | public function transform(array $rows): array

FILE: src/Tables/Table.php
  class Table (line 14) | abstract class Table
    method columns (line 21) | abstract public function columns(): array;
    method searchColumns (line 28) | abstract public function searchColumns(): array;
    method builder (line 35) | abstract public function builder(): Builder;
    method getData (line 42) | public function getData(): array

FILE: src/Traits/FetchesStackTrace.php
  type FetchesStackTrace (line 7) | trait FetchesStackTrace
    method getCallerFromStackTrace (line 14) | protected function getCallerFromStackTrace()
    method ignoredVendorPath (line 34) | protected function ignoredVendorPath()

FILE: src/Traits/FormatsClosure.php
  type FormatsClosure (line 8) | trait FormatsClosure
    method formatClosureListener (line 18) | protected function formatClosureListener(Closure $listener): string

FILE: src/Traits/RegistersMonitors.php
  type RegistersMonitors (line 8) | trait RegistersMonitors
    method hasMonitor (line 23) | public static function hasMonitor($class): bool
    method registerMonitors (line 34) | protected static function registerMonitors($app)
    method getMonitors (line 71) | protected static function getMonitors(): array

FILE: src/Type.php
  class Type (line 5) | final class Type

FILE: tests/ConsoleTest.php
  class ConsoleTest (line 9) | class ConsoleTest extends TestCase
    method test_publish_command_works (line 11) | public function test_publish_command_works()

FILE: tests/MeterModelTest.php
  class MeterModelTest (line 10) | class MeterModelTest extends TestCase
    method test_it_can_save_entries (line 14) | public function test_it_can_save_entries()
Condensed preview — 69 files, each showing path, character count, and a content snippet. Download the .json file or copy for the full structured content (149K chars).
[
{
"path": ".editorconfig",
"chars": 312,
"preview": "; This file is for unifying the coding style for different editors and IDEs.\n; More information at http://editorconfig.o"
},
{
"path": ".gitattributes",
"chars": 395,
"preview": "# Path-based git attributes\n# https://www.kernel.org/pub/software/scm/git/docs/gitattributes.html\n\n# Ignore all test and"
},
{
"path": ".gitignore",
"chars": 58,
"preview": "build\ncomposer.lock\ndocs\nvendor\ncoverage\ntodo.txt\npush.sh\n"
},
{
"path": "LICENSE.md",
"chars": 1064,
"preview": "MIT License\n\nCopyright (c) Sarfraz Ahmed\n\nPermission is hereby granted, free of charge, to any person obtaining a copy\no"
},
{
"path": "README.md",
"chars": 3984,
"preview": "[](LICENSE.md)\n[![Latest "
},
{
"path": "composer.json",
"chars": 1403,
"preview": "{\n \"name\": \"sarfraznawaz2005/meter\",\n \"description\": \"laravel package to find performance bottlenecks in your lara"
},
{
"path": "phpunit.xml",
"chars": 1039,
"preview": "<?xml version=\"1.0\" encoding=\"UTF-8\"?>\n<phpunit bootstrap=\"vendor/autoload.php\"\n backupGlobals=\"false\"\n "
},
{
"path": "src/Charts/Chart.php",
"chars": 1346,
"preview": "<?php\n\nnamespace Sarfraznawaz2005\\Meter\\Charts;\n\nuse ConsoleTVs\\Charts\\Classes\\Chartjs\\Chart as BaseChart;\nuse Sarfrazna"
},
{
"path": "src/Charts/CommandsTimeChart.php",
"chars": 3709,
"preview": "<?php\n\nnamespace Sarfraznawaz2005\\Meter\\Charts;\n\nuse Balping\\JsonRaw\\Raw;\nuse Sarfraznawaz2005\\Meter\\Models\\MeterModel;\n"
},
{
"path": "src/Charts/ConnectionsChart.php",
"chars": 2857,
"preview": "<?php\n\nnamespace Sarfraznawaz2005\\Meter\\Charts;\n\nuse Sarfraznawaz2005\\Meter\\Models\\MeterModel;\nuse Sarfraznawaz2005\\Mete"
},
{
"path": "src/Charts/CpuChart.php",
"chars": 2821,
"preview": "<?php\n\nnamespace Sarfraznawaz2005\\Meter\\Charts;\n\nuse Sarfraznawaz2005\\Meter\\Models\\MeterModel;\nuse Sarfraznawaz2005\\Mete"
},
{
"path": "src/Charts/DiskSpaceChart.php",
"chars": 2840,
"preview": "<?php\n\nnamespace Sarfraznawaz2005\\Meter\\Charts;\n\nuse Sarfraznawaz2005\\Meter\\Models\\MeterModel;\nuse Sarfraznawaz2005\\Mete"
},
{
"path": "src/Charts/EventsTimeChart.php",
"chars": 3692,
"preview": "<?php\n\nnamespace Sarfraznawaz2005\\Meter\\Charts;\n\nuse Balping\\JsonRaw\\Raw;\nuse Sarfraznawaz2005\\Meter\\Models\\MeterModel;\n"
},
{
"path": "src/Charts/OverAllTimesChart.php",
"chars": 4880,
"preview": "<?php\n\nnamespace Sarfraznawaz2005\\Meter\\Charts;\n\nuse Sarfraznawaz2005\\Meter\\Models\\MeterModel;\nuse Sarfraznawaz2005\\Mete"
},
{
"path": "src/Charts/QueriesTimeChart.php",
"chars": 3729,
"preview": "<?php\n\nnamespace Sarfraznawaz2005\\Meter\\Charts;\n\nuse Balping\\JsonRaw\\Raw;\nuse Illuminate\\Support\\Str;\nuse Sarfraznawaz20"
},
{
"path": "src/Charts/RequestMemoryChart.php",
"chars": 3695,
"preview": "<?php\n\nnamespace Sarfraznawaz2005\\Meter\\Charts;\n\nuse Balping\\JsonRaw\\Raw;\nuse Sarfraznawaz2005\\Meter\\Models\\MeterModel;\n"
},
{
"path": "src/Charts/RequestTimeChart.php",
"chars": 3709,
"preview": "<?php\n\nnamespace Sarfraznawaz2005\\Meter\\Charts;\n\nuse Balping\\JsonRaw\\Raw;\nuse Sarfraznawaz2005\\Meter\\Models\\MeterModel;\n"
},
{
"path": "src/Charts/SchedulesTimeChart.php",
"chars": 4077,
"preview": "<?php\n\nnamespace Sarfraznawaz2005\\Meter\\Charts;\n\nuse Balping\\JsonRaw\\Raw;\nuse Sarfraznawaz2005\\Meter\\Models\\MeterModel;\n"
},
{
"path": "src/Charts/ServerMemoryChart.php",
"chars": 2839,
"preview": "<?php\n\nnamespace Sarfraznawaz2005\\Meter\\Charts;\n\nuse Sarfraznawaz2005\\Meter\\Models\\MeterModel;\nuse Sarfraznawaz2005\\Mete"
},
{
"path": "src/Config/config.php",
"chars": 5728,
"preview": "<?php\n\nreturn [\n\n // Enable/Disable Meter\n 'enabled' => env('METER_ENABLED', false),\n\n #-----------------------"
},
{
"path": "src/Console/PruneCommand.php",
"chars": 639,
"preview": "<?php\n\nnamespace Sarfraznawaz2005\\Meter\\Console;\n\nuse Illuminate\\Console\\Command;\nuse Illuminate\\Database\\Eloquent\\Build"
},
{
"path": "src/Console/PublishCommand.php",
"chars": 704,
"preview": "<?php\n\nnamespace Sarfraznawaz2005\\Meter\\Console;\n\nuse Illuminate\\Console\\Command;\n\nclass PublishCommand extends Command\n"
},
{
"path": "src/Console/ServerMonitorCommand.php",
"chars": 1155,
"preview": "<?php\n\nnamespace Sarfraznawaz2005\\Meter\\Console;\n\nuse Illuminate\\Console\\Command;\nuse Sarfraznawaz2005\\Meter\\Meter;\nuse "
},
{
"path": "src/Helpers.php",
"chars": 2050,
"preview": "<?php\n\nuse Illuminate\\Database\\Eloquent\\Builder;\nuse Illuminate\\Database\\Eloquent\\Model;\nuse Illuminate\\Support\\Arr;\n\nif"
},
{
"path": "src/Http/Controllers/PagesController.php",
"chars": 3238,
"preview": "<?php\n\nnamespace Sarfraznawaz2005\\Meter\\Http\\Controllers;\n\nuse Illuminate\\Routing\\Controller;\nuse Illuminate\\Support\\Fac"
},
{
"path": "src/Http/Controllers/TablesController.php",
"chars": 929,
"preview": "<?php\n\nnamespace Sarfraznawaz2005\\Meter\\Http\\Controllers;\n\nuse Illuminate\\Routing\\Controller;\nuse Sarfraznawaz2005\\Meter"
},
{
"path": "src/Http/Middleware/BasicAuth.php",
"chars": 1010,
"preview": "<?php\n\nnamespace Sarfraznawaz2005\\Meter\\Http\\Middleware;\n\nuse Closure;\nuse Illuminate\\Http\\Request;\n\nclass BasicAuth\n{\n "
},
{
"path": "src/Http/routes.php",
"chars": 1052,
"preview": "<?php\n\nuse Illuminate\\Support\\Facades\\Route;\n\n// pages\nRoute::get('/', 'PagesController@home')->name('meter_home');\nRout"
},
{
"path": "src/Meter.php",
"chars": 2661,
"preview": "<?php\n\nnamespace Sarfraznawaz2005\\Meter;\n\nuse Illuminate\\Contracts\\Foundation\\Application;\nuse Sarfraznawaz2005\\Meter\\Tr"
},
{
"path": "src/MeterServiceProvider.php",
"chars": 2697,
"preview": "<?php\n\nnamespace Sarfraznawaz2005\\Meter;\n\nuse Illuminate\\Routing\\Router;\nuse Illuminate\\Support\\Facades\\Route;\nuse Illum"
},
{
"path": "src/Migrations/2019_12_12_100000_create_meter_entries_table.php",
"chars": 972,
"preview": "<?php\n\nuse Illuminate\\Database\\Migrations\\Migration;\nuse Illuminate\\Database\\Schema\\Blueprint;\nuse Illuminate\\Support\\Fa"
},
{
"path": "src/Models/MeterModel.php",
"chars": 1567,
"preview": "<?php\n\nnamespace Sarfraznawaz2005\\Meter\\Models;\n\nuse Illuminate\\Database\\Eloquent\\Builder;\nuse Illuminate\\Database\\Eloqu"
},
{
"path": "src/Monitors/CommandMonitor.php",
"chars": 1902,
"preview": "<?php\n\nnamespace Sarfraznawaz2005\\Meter\\Monitors;\n\nuse Illuminate\\Console\\Events\\CommandFinished;\nuse Illuminate\\Console"
},
{
"path": "src/Monitors/CpuMonitor.php",
"chars": 603,
"preview": "<?php\n\nnamespace Sarfraznawaz2005\\Meter\\Monitors;\n\nuse Illuminate\\Contracts\\Foundation\\Application;\nuse Sarfraznawaz2005"
},
{
"path": "src/Monitors/DiskSpaceMonitor.php",
"chars": 627,
"preview": "<?php\n\nnamespace Sarfraznawaz2005\\Meter\\Monitors;\n\nuse Illuminate\\Contracts\\Foundation\\Application;\nuse Sarfraznawaz2005"
},
{
"path": "src/Monitors/EventMonitor.php",
"chars": 5814,
"preview": "<?php\n\nnamespace Sarfraznawaz2005\\Meter\\Monitors;\n\nuse Illuminate\\Contracts\\Broadcasting\\ShouldBroadcast;\nuse Illuminate"
},
{
"path": "src/Monitors/HttpConnectionsMonitor.php",
"chars": 763,
"preview": "<?php\n\nnamespace Sarfraznawaz2005\\Meter\\Monitors;\n\nuse Illuminate\\Contracts\\Foundation\\Application;\nuse Sarfraznawaz2005"
},
{
"path": "src/Monitors/MemoryMonitor.php",
"chars": 907,
"preview": "<?php\n\nnamespace Sarfraznawaz2005\\Meter\\Monitors;\n\nuse Illuminate\\Contracts\\Foundation\\Application;\nuse Sarfraznawaz2005"
},
{
"path": "src/Monitors/Monitor.php",
"chars": 2058,
"preview": "<?php\n\nnamespace Sarfraznawaz2005\\Meter\\Monitors;\n\nuse Illuminate\\Contracts\\Foundation\\Application;\nuse Sarfraznawaz2005"
},
{
"path": "src/Monitors/QueryMonitor.php",
"chars": 2369,
"preview": "<?php\n\nnamespace Sarfraznawaz2005\\Meter\\Monitors;\n\nuse Illuminate\\Contracts\\Foundation\\Application;\nuse Illuminate\\Datab"
},
{
"path": "src/Monitors/RequestMonitor.php",
"chars": 1768,
"preview": "<?php\n\nnamespace Sarfraznawaz2005\\Meter\\Monitors;\n\nuse Illuminate\\Contracts\\Foundation\\Application;\nuse Illuminate\\Found"
},
{
"path": "src/Monitors/ScheduleMonitor.php",
"chars": 2843,
"preview": "<?php\n\nnamespace Sarfraznawaz2005\\Meter\\Monitors;\n\nuse Cron\\CronExpression;\nuse Illuminate\\Console\\Events\\CommandStartin"
},
{
"path": "src/Resources/Assets/meter.css",
"chars": 3667,
"preview": "body, .wrapper {\n font-family: Nunito !important;\n background: #edf1f3;\n color: #333;\n font-size: .95rem;\n "
},
{
"path": "src/Resources/Assets/meter.js",
"chars": 2818,
"preview": "$(document).ready(function () {\n\n meterSetup();\n\n $('.dataTable').on('draw.dt', meterSetup);\n\n // details modal"
},
{
"path": "src/Resources/Views/commands.blade.php",
"chars": 1070,
"preview": "@extends('meter::layout.layout')\n\n@section('content')\n\n <ul class=\"nav nav-tabs justify-content-center\">\n <li "
},
{
"path": "src/Resources/Views/components/chart.blade.php",
"chars": 239,
"preview": "<div class=\"section\">\n @if (isset($title))\n <div class=\"text-center text-primary\"><strong>{{$title}}</strong><"
},
{
"path": "src/Resources/Views/components/table.blade.php",
"chars": 1028,
"preview": "<div class=\"section\">\n <table class=\"table-responsive-sm meter_table table table-hover mx-auto w-100\">\n <thead"
},
{
"path": "src/Resources/Views/dashboard.blade.php",
"chars": 8300,
"preview": "@extends('meter::layout.layout')\n\n@section('content')\n\n <div class=\"section p-0\">\n <div class=\"shadow card-gro"
},
{
"path": "src/Resources/Views/events.blade.php",
"chars": 1062,
"preview": "@extends('meter::layout.layout')\n\n@section('content')\n\n <ul class=\"nav nav-tabs justify-content-center\">\n <li "
},
{
"path": "src/Resources/Views/layout/filters.blade.php",
"chars": 855,
"preview": "<a\n class=\"dropdown-item btnfilter {{(request()->has('days') || request()->has('slow') || request()->has('all')) ? ''"
},
{
"path": "src/Resources/Views/layout/layout.blade.php",
"chars": 1572,
"preview": "<!doctype html>\n<html lang=\"{{ app()->getLocale() }}\">\n<head>\n <meta charset=\"utf-8\">\n <meta name=\"viewport\" conte"
},
{
"path": "src/Resources/Views/layout/links.blade.php",
"chars": 4235,
"preview": "<nav class=\"navbar fixed-top navbar-expand-lg navbar-light bg-light\">\n\n <span class=\"navbar-brand\">\n <strong c"
},
{
"path": "src/Resources/Views/layout/modal.blade.php",
"chars": 384,
"preview": "<div class=\"modal\" id=\"detailsModal\">\n <div class=\"modal-dialog modal-dialog-scrollable\">\n <div class=\"modal-c"
},
{
"path": "src/Resources/Views/queries.blade.php",
"chars": 1241,
"preview": "@extends('meter::layout.layout')\n\n@section('content')\n\n <ul class=\"nav nav-tabs justify-content-center\">\n <li "
},
{
"path": "src/Resources/Views/requests.blade.php",
"chars": 1211,
"preview": "@extends('meter::layout.layout')\n\n@section('content')\n\n <ul class=\"nav nav-tabs justify-content-center\">\n <li "
},
{
"path": "src/Resources/Views/schedules.blade.php",
"chars": 1072,
"preview": "@extends('meter::layout.layout')\n\n@section('content')\n\n <ul class=\"nav nav-tabs justify-content-center\">\n <li "
},
{
"path": "src/Resources/Views/server.blade.php",
"chars": 553,
"preview": "@extends('meter::layout.layout')\n\n@section('content')\n @component('meter::components.chart', ['chart' => $cpuChart, '"
},
{
"path": "src/Tables/CommandsTable.php",
"chars": 1987,
"preview": "<?php\n\nnamespace Sarfraznawaz2005\\Meter\\Tables;\n\nuse Carbon\\Carbon;\nuse Illuminate\\Database\\Eloquent\\Builder;\nuse Sarfra"
},
{
"path": "src/Tables/EventsTable.php",
"chars": 1888,
"preview": "<?php\n\nnamespace Sarfraznawaz2005\\Meter\\Tables;\n\nuse Carbon\\Carbon;\nuse Illuminate\\Database\\Eloquent\\Builder;\nuse Sarfra"
},
{
"path": "src/Tables/QueriesTable.php",
"chars": 2040,
"preview": "<?php\n\nnamespace Sarfraznawaz2005\\Meter\\Tables;\n\nuse Carbon\\Carbon;\nuse Illuminate\\Database\\Eloquent\\Builder;\nuse Illumi"
},
{
"path": "src/Tables/RequestsTable.php",
"chars": 2432,
"preview": "<?php\n\nnamespace Sarfraznawaz2005\\Meter\\Tables;\n\nuse Carbon\\Carbon;\nuse Illuminate\\Database\\Eloquent\\Builder;\nuse Sarfra"
},
{
"path": "src/Tables/SchedulesTable.php",
"chars": 1888,
"preview": "<?php\n\nnamespace Sarfraznawaz2005\\Meter\\Tables;\n\nuse Carbon\\Carbon;\nuse Illuminate\\Database\\Eloquent\\Builder;\nuse Sarfra"
},
{
"path": "src/Tables/Table.php",
"chars": 2302,
"preview": "<?php\n/**\n * Created by PhpStorm.\n * User: Sarfraz\n * Date: 12/12/2019\n * Time: 2:10 PM\n */\n\nnamespace Sarfraznawaz2005\\"
},
{
"path": "src/Traits/FetchesStackTrace.php",
"chars": 955,
"preview": "<?php\n\nnamespace Sarfraznawaz2005\\Meter\\Traits;\n\nuse Illuminate\\Support\\Str;\n\ntrait FetchesStackTrace\n{\n /**\n * F"
},
{
"path": "src/Traits/FormatsClosure.php",
"chars": 586,
"preview": "<?php\n\nnamespace Sarfraznawaz2005\\Meter\\Traits;\n\nuse Closure;\nuse ReflectionFunction;\n\ntrait FormatsClosure\n{\n /**\n "
},
{
"path": "src/Traits/RegistersMonitors.php",
"chars": 1735,
"preview": "<?php\n\nnamespace Sarfraznawaz2005\\Meter\\Traits;\n\nuse Illuminate\\Contracts\\Foundation\\Application;\nuse Sarfraznawaz2005\\M"
},
{
"path": "src/Type.php",
"chars": 328,
"preview": "<?php\n\nnamespace Sarfraznawaz2005\\Meter;\n\nfinal class Type\n{\n const QUERY = 'query';\n const REQUEST = 'request';\n "
},
{
"path": "tests/ConsoleTest.php",
"chars": 586,
"preview": "<?php\n\nnamespace Sarfraznawaz2005\\Meter\\Tests;\n\nuse Illuminate\\Support\\Facades\\Artisan;\nuse Illuminate\\Support\\Facades\\F"
},
{
"path": "tests/MeterModelTest.php",
"chars": 489,
"preview": "<?php\n\nnamespace Sarfraznawaz2005\\Meter\\Tests;\n\nuse Illuminate\\Foundation\\Testing\\RefreshDatabase;\nuse Sarfraznawaz2005\\"
}
]
About this extraction
This page contains the full source code of the sarfraznawaz2005/meter GitHub repository, extracted and formatted as plain text for AI agents and large language models (LLMs). The extraction includes 69 files (135.8 KB), approximately 35.7k tokens, and a symbol index with 208 extracted functions, classes, methods, constants, and types. Use this with OpenClaw, Claude, ChatGPT, Cursor, Windsurf, or any other AI tool that accepts text input. You can copy the full output to your clipboard or download it as a .txt file.
Extracted by GitExtract — free GitHub repo to text converter for AI. Built by Nikandr Surkov.