Repository: tctianchi/pyvenn
Branch: master
Commit: 78c72cb90e46
Files: 6
Total size: 27.0 KB
Directory structure:
gitextract_sjp_a6pd/

├── .gitignore
├── LICENSE
├── README.md
├── __init__.py
├── demo.py
└── venn.py
================================================
FILE CONTENTS
================================================
================================================
FILE: .gitignore
================================================
# Byte-compiled / optimized / DLL files
__pycache__/
*.py[cod]
*$py.class
# C extensions
*.so
# Distribution / packaging
.Python
env/
build/
develop-eggs/
dist/
downloads/
eggs/
.eggs/
lib/
lib64/
parts/
sdist/
var/
*.egg-info/
.installed.cfg
*.egg
# PyInstaller
# Usually these files are written by a python script from a template
# before PyInstaller builds the exe, so as to inject date/other infos into it.
*.manifest
*.spec
# Installer logs
pip-log.txt
pip-delete-this-directory.txt
# Unit test / coverage reports
htmlcov/
.tox/
.coverage
.coverage.*
.cache
nosetests.xml
coverage.xml
*,cover
.hypothesis/
# Translations
*.mo
*.pot
# Django stuff:
*.log
# Sphinx documentation
docs/_build/
# PyBuilder
target/
#Ipython Notebook
.ipynb_checkpoints
================================================
FILE: LICENSE
================================================
This is free and unencumbered software released into the public domain.
Anyone is free to copy, modify, publish, use, compile, sell, or
distribute this software, either in source code form or as a compiled
binary, for any purpose, commercial or non-commercial, and by any
means.
In jurisdictions that recognize copyright laws, the author or authors
of this software dedicate any and all copyright interest in the
software to the public domain. We make this dedication for the benefit
of the public at large and to the detriment of our heirs and
successors. We intend this dedication to be an overt act of
relinquishment in perpetuity of all present and future rights to this
software under copyright law.
THE SOFTWARE IS PROVIDED "AS IS", WITHOUT WARRANTY OF ANY KIND,
EXPRESS OR IMPLIED, INCLUDING BUT NOT LIMITED TO THE WARRANTIES OF
MERCHANTABILITY, FITNESS FOR A PARTICULAR PURPOSE AND NONINFRINGEMENT.
IN NO EVENT SHALL THE AUTHORS BE LIABLE FOR ANY CLAIM, DAMAGES OR
OTHER LIABILITY, WHETHER IN AN ACTION OF CONTRACT, TORT OR OTHERWISE,
ARISING FROM, OUT OF OR IN CONNECTION WITH THE SOFTWARE OR THE USE OR
OTHER DEALINGS IN THE SOFTWARE.
For more information, please refer to <http://unlicense.org>
================================================
FILE: README.md
================================================
# pyvenn
2 ~ 6 Sets Venn Diagram For Python
Checkout this repository first:
```python
git clone https://github.com/tctianchi/pyvenn.git
cd pyvenn
```
Use magic function in an ipython notebook:
```python
%matplotlib inline
import venn
```
Or use a non-interactive backend:
```python
import matplotlib
matplotlib.use('Agg')
import venn
```
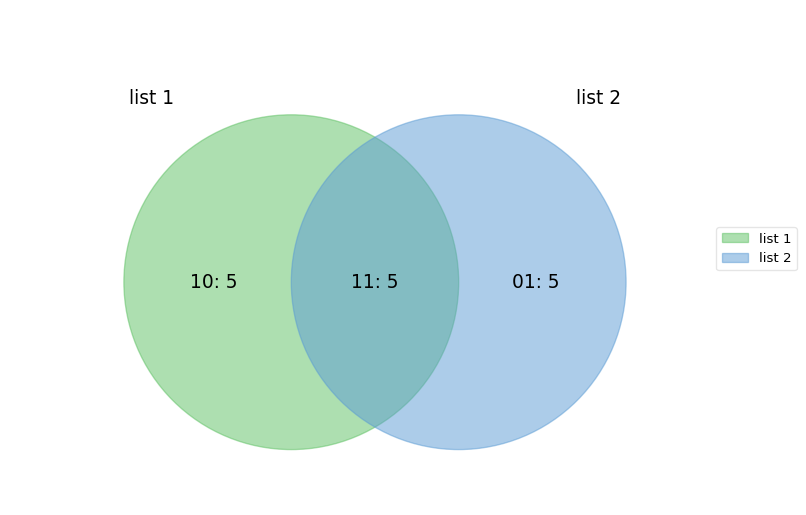
Fetch labels for each subset of the venn diagram. The input argument is an array of iterable data(list, set, etc.). You will get a mapping table, where "10" indicates the number of elements in set 1 but not in set 2, "01" indicates the number of elements in set 2 but not in set 1, and so on.
```python
In [5]: labels = venn.get_labels([
range(10),
range(5, 15)
], fill=['number', 'logic'])
In [6]: print labels
Out [6]: {'01': '01: 5', '10': '10: 5', '11': '11: 5'}
```
Plot functions are based on the labels:
```python
fig, ax = venn.venn2(labels, names=['list 1', 'list 2'])
fig.show()
```
More examples:
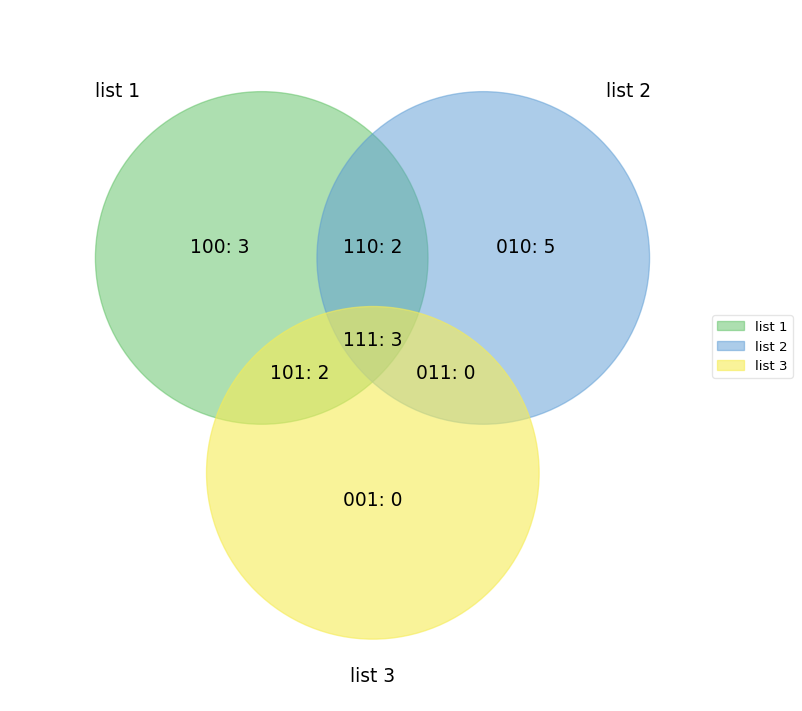
```python
labels = venn.get_labels([range(10), range(5, 15), range(3, 8)], fill=['number', 'logic'])
fig, ax = venn.venn3(labels, names=['list 1', 'list 2', 'list 3'])
fig.show()
```
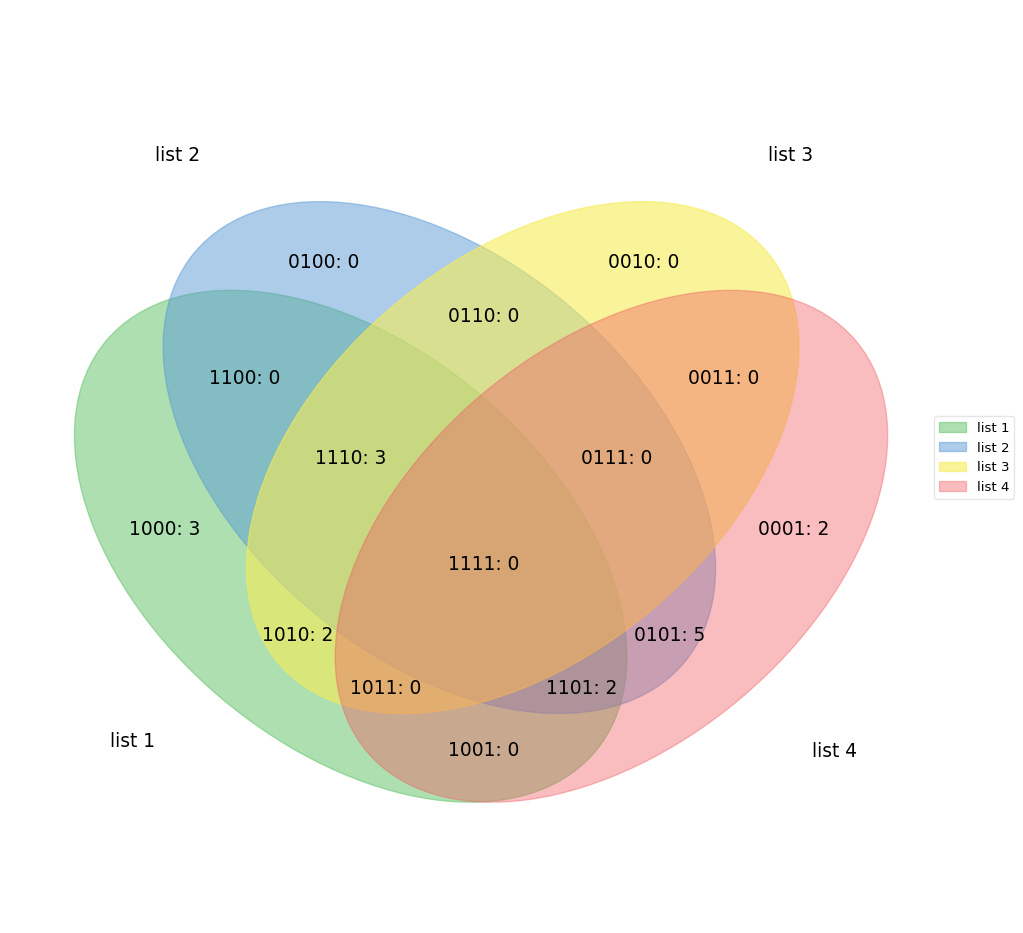
```python
labels = venn.get_labels([range(10), range(5, 15), range(3, 8), range(8, 17)], fill=['number', 'logic'])
fig, ax = venn.venn4(labels, names=['list 1', 'list 2', 'list 3', 'list 4'])
fig.show()
```
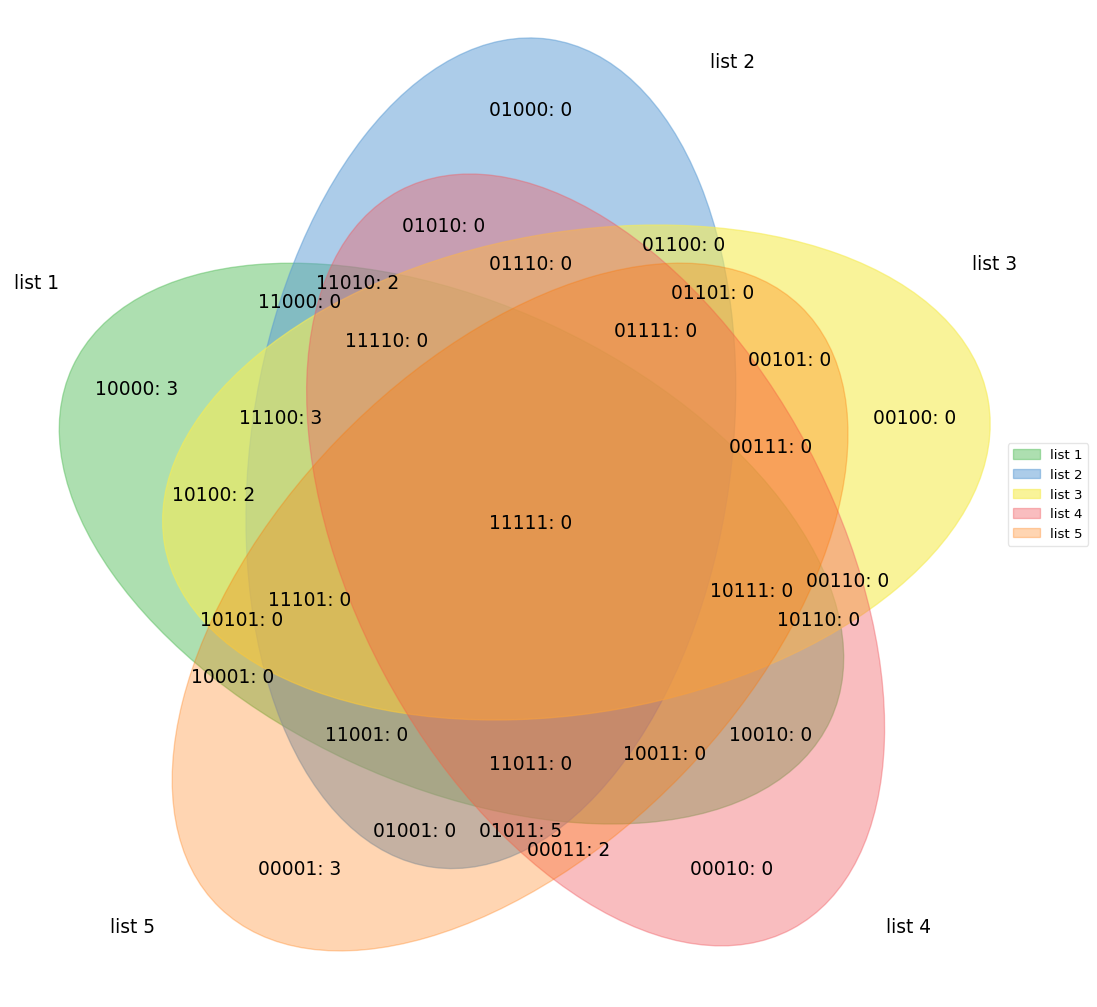
```python
labels = venn.get_labels([range(10), range(5, 15), range(3, 8), range(8, 17), range(10, 20)], fill=['number', 'logic'])
fig, ax = venn.venn5(labels, names=['list 1', 'list 2', 'list 3', 'list 4', 'list 5'])
fig.show()
```
```python
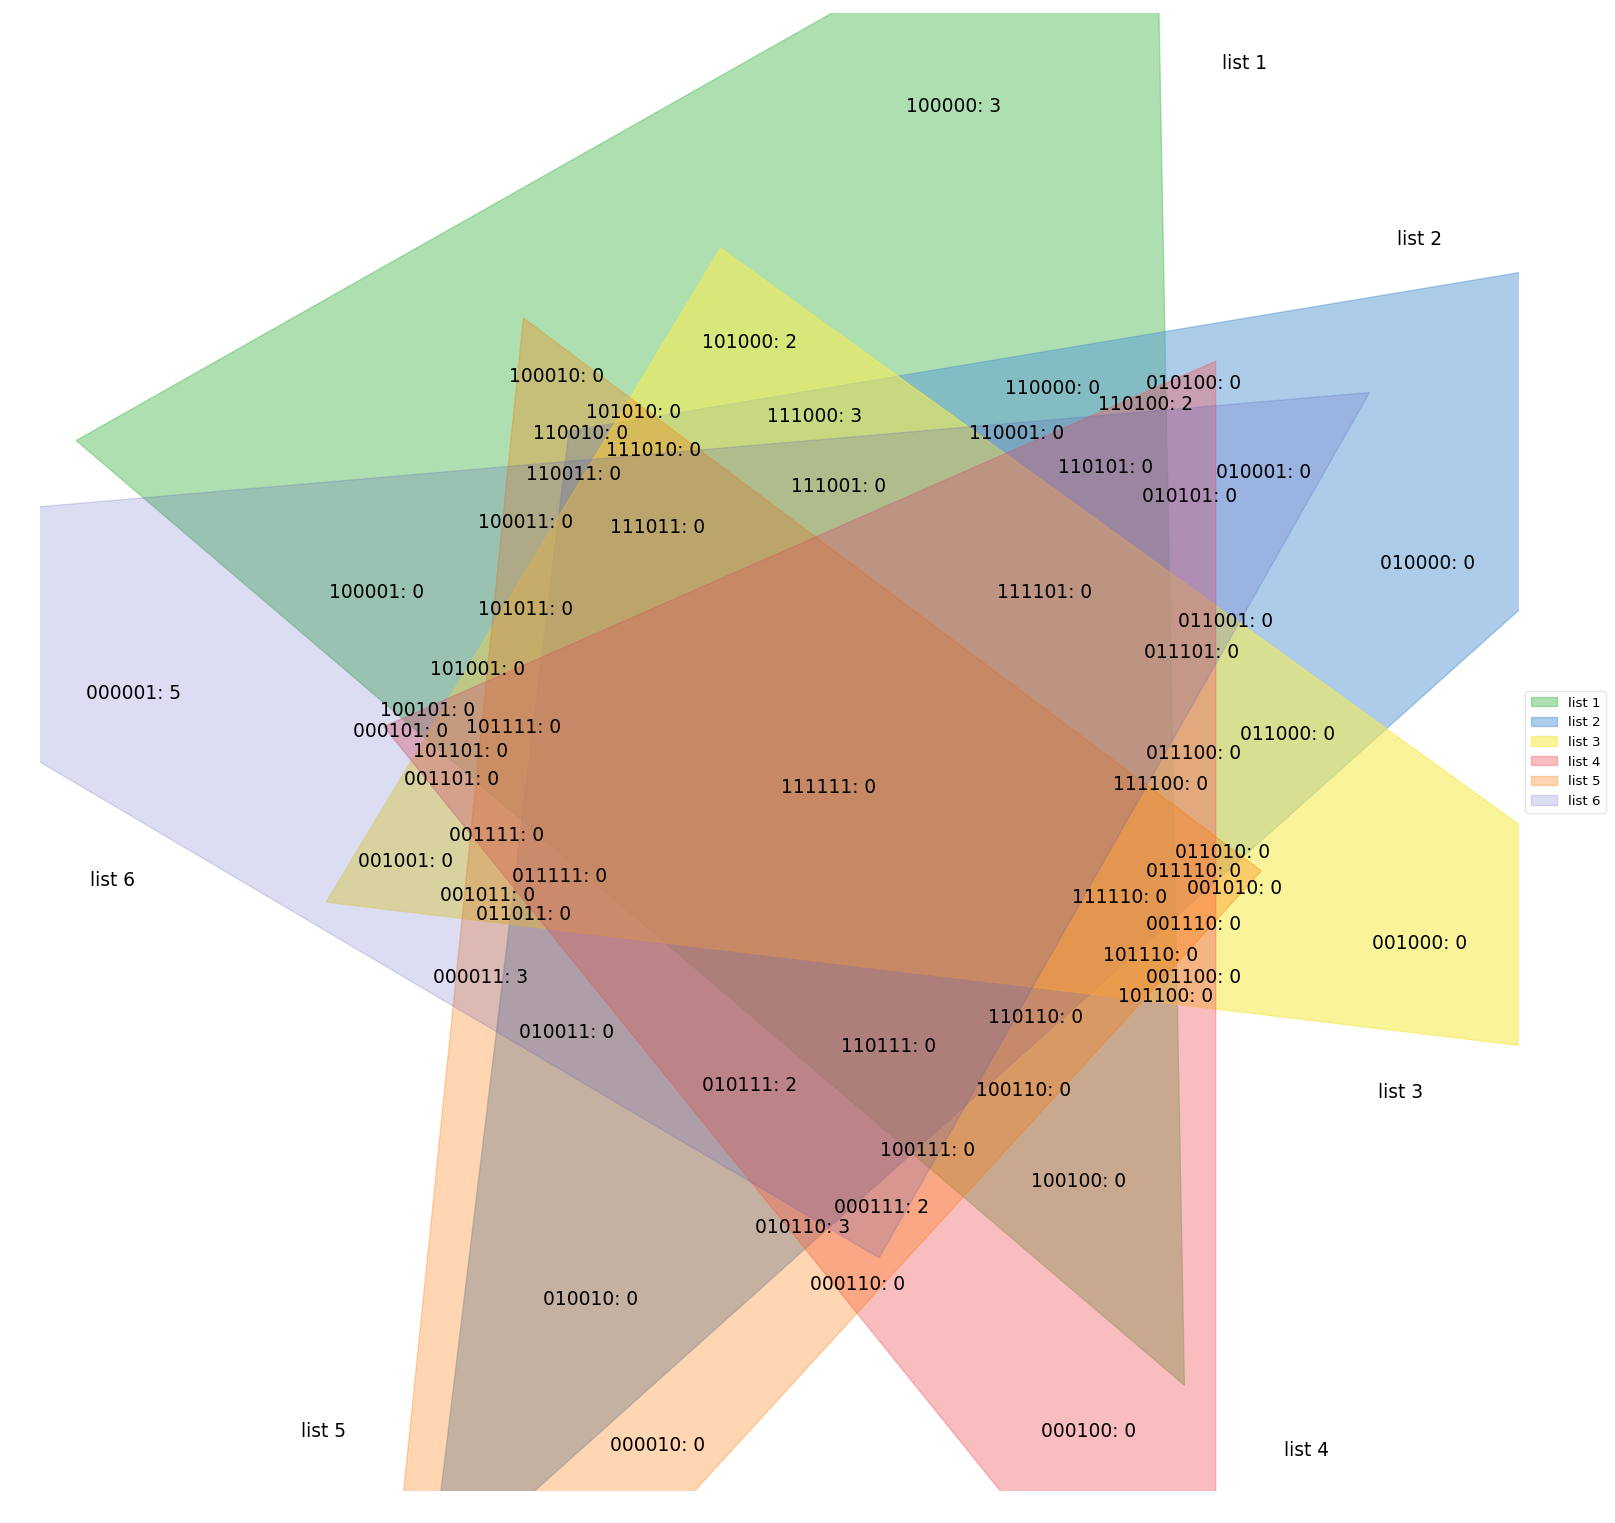
labels = venn.get_labels([range(10), range(5, 15), range(3, 8), range(8, 17), range(10, 20), range(13, 25)], fill=['number', 'logic'])
fig, ax = venn.venn6(labels, names=['list 1', 'list 2', 'list 3', 'list 4', 'list 5', 'list 6'])
fig.show()
```
================================================
FILE: __init__.py
================================================
================================================
FILE: demo.py
================================================
# coding: utf-8
# ipython notebook requires this
# %matplotlib inline
# python console requires this
import matplotlib
matplotlib.use('Agg')
import matplotlib.pyplot as plt
import venn
labels = venn.get_labels([range(10), range(5, 15)], fill=['number', 'logic'])
fig, ax = venn.venn2(labels, names=['list 1', 'list 2'])
fig.savefig('venn2.png', bbox_inches='tight')
plt.close()
labels = venn.get_labels([range(10), range(5, 15), range(3, 8)], fill=['number', 'logic'])
fig, ax = venn.venn3(labels, names=['list 1', 'list 2', 'list 3'])
fig.savefig('venn3.png', bbox_inches='tight')
plt.close()
labels = venn.get_labels([range(10), range(5, 15), range(3, 8), range(8, 17)], fill=['number', 'logic'])
fig, ax = venn.venn4(labels, names=['list 1', 'list 2', 'list 3', 'list 4'])
fig.savefig('venn4.png', bbox_inches='tight')
plt.close()
labels = venn.get_labels([range(10), range(5, 15), range(3, 8), range(8, 17), range(10, 20)], fill=['number', 'logic'])
fig, ax = venn.venn5(labels, names=['list 1', 'list 2', 'list 3', 'list 4', 'list 5'])
fig.savefig('venn5.png', bbox_inches='tight')
plt.close()
labels = venn.get_labels([range(10), range(5, 15), range(3, 8), range(8, 17), range(10, 20), range(13, 25)], fill=['number', 'logic'])
fig, ax = venn.venn6(labels, names=['list 1', 'list 2', 'list 3', 'list 4', 'list 5', 'list 6'])
fig.savefig('venn6.png', bbox_inches='tight')
plt.close()
================================================
FILE: venn.py
================================================
# coding: utf-8
from itertools import chain
try:
# since python 3.10
from collections.abc import Iterable
except ImportError:
from collections import Iterable
import matplotlib.pyplot as plt
import matplotlib.patches as patches
from matplotlib import colors
import math
default_colors = [
# r, g, b, a
[92, 192, 98, 0.5],
[90, 155, 212, 0.5],
[246, 236, 86, 0.6],
[241, 90, 96, 0.4],
[255, 117, 0, 0.3],
[82, 82, 190, 0.2],
]
default_colors = [
[i[0] / 255.0, i[1] / 255.0, i[2] / 255.0, i[3]]
for i in default_colors
]
def draw_ellipse(fig, ax, x, y, w, h, a, fillcolor):
e = patches.Ellipse(
xy=(x, y),
width=w,
height=h,
angle=a,
color=fillcolor)
ax.add_patch(e)
def draw_triangle(fig, ax, x1, y1, x2, y2, x3, y3, fillcolor):
xy = [
(x1, y1),
(x2, y2),
(x3, y3),
]
polygon = patches.Polygon(
xy=xy,
closed=True,
color=fillcolor)
ax.add_patch(polygon)
def draw_text(fig, ax, x, y, text, color=[0, 0, 0, 1], fontsize=14, ha="center", va="center"):
ax.text(
x, y, text,
horizontalalignment=ha,
verticalalignment=va,
fontsize=fontsize,
color="black")
def draw_annotate(fig, ax, x, y, textx, texty, text, color=[0, 0, 0, 1], arrowcolor=[0, 0, 0, 0.3]):
plt.annotate(
text,
xy=(x, y),
xytext=(textx, texty),
arrowprops=dict(color=arrowcolor, shrink=0, width=0.5, headwidth=8),
fontsize=14,
color=color,
xycoords="data",
textcoords="data",
horizontalalignment='center',
verticalalignment='center'
)
def get_labels(data, fill=["number"]):
"""
get a dict of labels for groups in data
@type data: list[Iterable]
@rtype: dict[str, str]
input
data: data to get label for
fill: ["number"|"logic"|"percent"]
return
labels: a dict of labels for different sets
example:
In [12]: get_labels([range(10), range(5,15), range(3,8)], fill=["number"])
Out[12]:
{'001': '0',
'010': '5',
'011': '0',
'100': '3',
'101': '2',
'110': '2',
'111': '3'}
"""
N = len(data)
sets_data = [set(data[i]) for i in range(N)] # sets for separate groups
s_all = set(chain(*data)) # union of all sets
# bin(3) --> '0b11', so bin(3).split('0b')[-1] will remove "0b"
set_collections = {}
for n in range(1, 2**N):
key = bin(n).split('0b')[-1].zfill(N)
value = s_all
sets_for_intersection = [sets_data[i] for i in range(N) if key[i] == '1']
sets_for_difference = [sets_data[i] for i in range(N) if key[i] == '0']
for s in sets_for_intersection:
value = value & s
for s in sets_for_difference:
value = value - s
set_collections[key] = value
labels = {k: "" for k in set_collections}
if "logic" in fill:
for k in set_collections:
labels[k] = k + ": "
if "number" in fill:
for k in set_collections:
labels[k] += str(len(set_collections[k]))
if "percent" in fill:
data_size = len(s_all)
for k in set_collections:
labels[k] += "(%.1f%%)" % (100.0 * len(set_collections[k]) / data_size)
return labels
def venn2(labels, names=['A', 'B'], **options):
"""
plots a 2-set Venn diagram
@type labels: dict[str, str]
@type names: list[str]
@rtype: (Figure, AxesSubplot)
input
labels: a label dict where keys are identified via binary codes ('01', '10', '11'),
hence a valid set could look like: {'01': 'text 1', '10': 'text 2', '11': 'text 3'}.
unmentioned codes are considered as ''.
names: group names
more: colors, figsize, dpi, fontsize
return
pyplot Figure and AxesSubplot object
"""
colors = options.get('colors', [default_colors[i] for i in range(2)])
figsize = options.get('figsize', (9, 7))
dpi = options.get('dpi', 96)
fontsize = options.get('fontsize', 14)
fig = plt.figure(0, figsize=figsize, dpi=dpi)
ax = fig.add_subplot(111, aspect='equal')
ax.set_axis_off()
ax.set_ylim(bottom=0.0, top=0.7)
ax.set_xlim(left=0.0, right=1.0)
# body
draw_ellipse(fig, ax, 0.375, 0.3, 0.5, 0.5, 0.0, colors[0])
draw_ellipse(fig, ax, 0.625, 0.3, 0.5, 0.5, 0.0, colors[1])
draw_text(fig, ax, 0.74, 0.30, labels.get('01', ''), fontsize=fontsize)
draw_text(fig, ax, 0.26, 0.30, labels.get('10', ''), fontsize=fontsize)
draw_text(fig, ax, 0.50, 0.30, labels.get('11', ''), fontsize=fontsize)
# legend
draw_text(fig, ax, 0.20, 0.56, names[0], colors[0], fontsize=fontsize, ha="right", va="bottom")
draw_text(fig, ax, 0.80, 0.56, names[1], colors[1], fontsize=fontsize, ha="left", va="bottom")
leg = ax.legend(names, loc='center left', bbox_to_anchor=(1.0, 0.5), fancybox=True)
leg.get_frame().set_alpha(0.5)
return fig, ax
def venn3(labels, names=['A', 'B', 'C'], **options):
"""
plots a 3-set Venn diagram
@type labels: dict[str, str]
@type names: list[str]
@rtype: (Figure, AxesSubplot)
input
labels: a label dict where keys are identified via binary codes ('001', '010', '100', ...),
hence a valid set could look like: {'001': 'text 1', '010': 'text 2', '100': 'text 3', ...}.
unmentioned codes are considered as ''.
names: group names
more: colors, figsize, dpi, fontsize
return
pyplot Figure and AxesSubplot object
"""
colors = options.get('colors', [default_colors[i] for i in range(3)])
figsize = options.get('figsize', (9, 9))
dpi = options.get('dpi', 96)
fontsize = options.get('fontsize', 14)
fig = plt.figure(0, figsize=figsize, dpi=dpi)
ax = fig.add_subplot(111, aspect='equal')
ax.set_axis_off()
ax.set_ylim(bottom=0.0, top=1.0)
ax.set_xlim(left=0.0, right=1.0)
# body
draw_ellipse(fig, ax, 0.333, 0.633, 0.5, 0.5, 0.0, colors[0])
draw_ellipse(fig, ax, 0.666, 0.633, 0.5, 0.5, 0.0, colors[1])
draw_ellipse(fig, ax, 0.500, 0.310, 0.5, 0.5, 0.0, colors[2])
draw_text(fig, ax, 0.50, 0.27, labels.get('001', ''), fontsize=fontsize)
draw_text(fig, ax, 0.73, 0.65, labels.get('010', ''), fontsize=fontsize)
draw_text(fig, ax, 0.61, 0.46, labels.get('011', ''), fontsize=fontsize)
draw_text(fig, ax, 0.27, 0.65, labels.get('100', ''), fontsize=fontsize)
draw_text(fig, ax, 0.39, 0.46, labels.get('101', ''), fontsize=fontsize)
draw_text(fig, ax, 0.50, 0.65, labels.get('110', ''), fontsize=fontsize)
draw_text(fig, ax, 0.50, 0.51, labels.get('111', ''), fontsize=fontsize)
# legend
draw_text(fig, ax, 0.15, 0.87, names[0], colors[0], fontsize=fontsize, ha="right", va="bottom")
draw_text(fig, ax, 0.85, 0.87, names[1], colors[1], fontsize=fontsize, ha="left", va="bottom")
draw_text(fig, ax, 0.50, 0.02, names[2], colors[2], fontsize=fontsize, va="top")
leg = ax.legend(names, loc='center left', bbox_to_anchor=(1.0, 0.5), fancybox=True)
leg.get_frame().set_alpha(0.5)
return fig, ax
def venn4(labels, names=['A', 'B', 'C', 'D'], **options):
"""
plots a 4-set Venn diagram
@type labels: dict[str, str]
@type names: list[str]
@rtype: (Figure, AxesSubplot)
input
labels: a label dict where keys are identified via binary codes ('0001', '0010', '0100', ...),
hence a valid set could look like: {'0001': 'text 1', '0010': 'text 2', '0100': 'text 3', ...}.
unmentioned codes are considered as ''.
names: group names
more: colors, figsize, dpi, fontsize
return
pyplot Figure and AxesSubplot object
"""
colors = options.get('colors', [default_colors[i] for i in range(4)])
figsize = options.get('figsize', (12, 12))
dpi = options.get('dpi', 96)
fontsize = options.get('fontsize', 14)
fig = plt.figure(0, figsize=figsize, dpi=dpi)
ax = fig.add_subplot(111, aspect='equal')
ax.set_axis_off()
ax.set_ylim(bottom=0.0, top=1.0)
ax.set_xlim(left=0.0, right=1.0)
# body
draw_ellipse(fig, ax, 0.350, 0.400, 0.72, 0.45, 140.0, colors[0])
draw_ellipse(fig, ax, 0.450, 0.500, 0.72, 0.45, 140.0, colors[1])
draw_ellipse(fig, ax, 0.544, 0.500, 0.72, 0.45, 40.0, colors[2])
draw_ellipse(fig, ax, 0.644, 0.400, 0.72, 0.45, 40.0, colors[3])
draw_text(fig, ax, 0.85, 0.42, labels.get('0001', ''), fontsize=fontsize)
draw_text(fig, ax, 0.68, 0.72, labels.get('0010', ''), fontsize=fontsize)
draw_text(fig, ax, 0.77, 0.59, labels.get('0011', ''), fontsize=fontsize)
draw_text(fig, ax, 0.32, 0.72, labels.get('0100', ''), fontsize=fontsize)
draw_text(fig, ax, 0.71, 0.30, labels.get('0101', ''), fontsize=fontsize)
draw_text(fig, ax, 0.50, 0.66, labels.get('0110', ''), fontsize=fontsize)
draw_text(fig, ax, 0.65, 0.50, labels.get('0111', ''), fontsize=fontsize)
draw_text(fig, ax, 0.14, 0.42, labels.get('1000', ''), fontsize=fontsize)
draw_text(fig, ax, 0.50, 0.17, labels.get('1001', ''), fontsize=fontsize)
draw_text(fig, ax, 0.29, 0.30, labels.get('1010', ''), fontsize=fontsize)
draw_text(fig, ax, 0.39, 0.24, labels.get('1011', ''), fontsize=fontsize)
draw_text(fig, ax, 0.23, 0.59, labels.get('1100', ''), fontsize=fontsize)
draw_text(fig, ax, 0.61, 0.24, labels.get('1101', ''), fontsize=fontsize)
draw_text(fig, ax, 0.35, 0.50, labels.get('1110', ''), fontsize=fontsize)
draw_text(fig, ax, 0.50, 0.38, labels.get('1111', ''), fontsize=fontsize)
# legend
draw_text(fig, ax, 0.13, 0.18, names[0], colors[0], fontsize=fontsize, ha="right")
draw_text(fig, ax, 0.18, 0.83, names[1], colors[1], fontsize=fontsize, ha="right", va="bottom")
draw_text(fig, ax, 0.82, 0.83, names[2], colors[2], fontsize=fontsize, ha="left", va="bottom")
draw_text(fig, ax, 0.87, 0.18, names[3], colors[3], fontsize=fontsize, ha="left", va="top")
leg = ax.legend(names, loc='center left', bbox_to_anchor=(1.0, 0.5), fancybox=True)
leg.get_frame().set_alpha(0.5)
return fig, ax
def venn5(labels, names=['A', 'B', 'C', 'D', 'E'], **options):
"""
plots a 5-set Venn diagram
@type labels: dict[str, str]
@type names: list[str]
@rtype: (Figure, AxesSubplot)
input
labels: a label dict where keys are identified via binary codes ('00001', '00010', '00100', ...),
hence a valid set could look like: {'00001': 'text 1', '00010': 'text 2', '00100': 'text 3', ...}.
unmentioned codes are considered as ''.
names: group names
more: colors, figsize, dpi, fontsize
return
pyplot Figure and AxesSubplot object
"""
colors = options.get('colors', [default_colors[i] for i in range(5)])
figsize = options.get('figsize', (13, 13))
dpi = options.get('dpi', 96)
fontsize = options.get('fontsize', 14)
fig = plt.figure(0, figsize=figsize, dpi=dpi)
ax = fig.add_subplot(111, aspect='equal')
ax.set_axis_off()
ax.set_ylim(bottom=0.0, top=1.0)
ax.set_xlim(left=0.0, right=1.0)
# body
draw_ellipse(fig, ax, 0.428, 0.449, 0.87, 0.50, 155.0, colors[0])
draw_ellipse(fig, ax, 0.469, 0.543, 0.87, 0.50, 82.0, colors[1])
draw_ellipse(fig, ax, 0.558, 0.523, 0.87, 0.50, 10.0, colors[2])
draw_ellipse(fig, ax, 0.578, 0.432, 0.87, 0.50, 118.0, colors[3])
draw_ellipse(fig, ax, 0.489, 0.383, 0.87, 0.50, 46.0, colors[4])
draw_text(fig, ax, 0.27, 0.11, labels.get('00001', ''), fontsize=fontsize)
draw_text(fig, ax, 0.72, 0.11, labels.get('00010', ''), fontsize=fontsize)
draw_text(fig, ax, 0.55, 0.13, labels.get('00011', ''), fontsize=fontsize)
draw_text(fig, ax, 0.91, 0.58, labels.get('00100', ''), fontsize=fontsize)
draw_text(fig, ax, 0.78, 0.64, labels.get('00101', ''), fontsize=fontsize)
draw_text(fig, ax, 0.84, 0.41, labels.get('00110', ''), fontsize=fontsize)
draw_text(fig, ax, 0.76, 0.55, labels.get('00111', ''), fontsize=fontsize)
draw_text(fig, ax, 0.51, 0.90, labels.get('01000', ''), fontsize=fontsize)
draw_text(fig, ax, 0.39, 0.15, labels.get('01001', ''), fontsize=fontsize)
draw_text(fig, ax, 0.42, 0.78, labels.get('01010', ''), fontsize=fontsize)
draw_text(fig, ax, 0.50, 0.15, labels.get('01011', ''), fontsize=fontsize)
draw_text(fig, ax, 0.67, 0.76, labels.get('01100', ''), fontsize=fontsize)
draw_text(fig, ax, 0.70, 0.71, labels.get('01101', ''), fontsize=fontsize)
draw_text(fig, ax, 0.51, 0.74, labels.get('01110', ''), fontsize=fontsize)
draw_text(fig, ax, 0.64, 0.67, labels.get('01111', ''), fontsize=fontsize)
draw_text(fig, ax, 0.10, 0.61, labels.get('10000', ''), fontsize=fontsize)
draw_text(fig, ax, 0.20, 0.31, labels.get('10001', ''), fontsize=fontsize)
draw_text(fig, ax, 0.76, 0.25, labels.get('10010', ''), fontsize=fontsize)
draw_text(fig, ax, 0.65, 0.23, labels.get('10011', ''), fontsize=fontsize)
draw_text(fig, ax, 0.18, 0.50, labels.get('10100', ''), fontsize=fontsize)
draw_text(fig, ax, 0.21, 0.37, labels.get('10101', ''), fontsize=fontsize)
draw_text(fig, ax, 0.81, 0.37, labels.get('10110', ''), fontsize=fontsize)
draw_text(fig, ax, 0.74, 0.40, labels.get('10111', ''), fontsize=fontsize)
draw_text(fig, ax, 0.27, 0.70, labels.get('11000', ''), fontsize=fontsize)
draw_text(fig, ax, 0.34, 0.25, labels.get('11001', ''), fontsize=fontsize)
draw_text(fig, ax, 0.33, 0.72, labels.get('11010', ''), fontsize=fontsize)
draw_text(fig, ax, 0.51, 0.22, labels.get('11011', ''), fontsize=fontsize)
draw_text(fig, ax, 0.25, 0.58, labels.get('11100', ''), fontsize=fontsize)
draw_text(fig, ax, 0.28, 0.39, labels.get('11101', ''), fontsize=fontsize)
draw_text(fig, ax, 0.36, 0.66, labels.get('11110', ''), fontsize=fontsize)
draw_text(fig, ax, 0.51, 0.47, labels.get('11111', ''), fontsize=fontsize)
# legend
draw_text(fig, ax, 0.02, 0.72, names[0], colors[0], fontsize=fontsize, ha="right")
draw_text(fig, ax, 0.72, 0.94, names[1], colors[1], fontsize=fontsize, va="bottom")
draw_text(fig, ax, 0.97, 0.74, names[2], colors[2], fontsize=fontsize, ha="left")
draw_text(fig, ax, 0.88, 0.05, names[3], colors[3], fontsize=fontsize, ha="left")
draw_text(fig, ax, 0.12, 0.05, names[4], colors[4], fontsize=fontsize, ha="right")
leg = ax.legend(names, loc='center left', bbox_to_anchor=(1.0, 0.5), fancybox=True)
leg.get_frame().set_alpha(0.5)
return fig, ax
def venn6(labels, names=['A', 'B', 'C', 'D', 'E', 'F'], **options):
"""
plots a 6-set Venn diagram
@type labels: dict[str, str]
@type names: list[str]
@rtype: (Figure, AxesSubplot)
input
labels: a label dict where keys are identified via binary codes ('000001', '000010', '000100', ...),
hence a valid set could look like: {'000001': 'text 1', '000010': 'text 2', '000100': 'text 3', ...}.
unmentioned codes are considered as ''.
names: group names
more: colors, figsize, dpi, fontsize
return
pyplot Figure and AxesSubplot object
"""
colors = options.get('colors', [default_colors[i] for i in range(6)])
figsize = options.get('figsize', (20, 20))
dpi = options.get('dpi', 96)
fontsize = options.get('fontsize', 14)
fig = plt.figure(0, figsize=figsize, dpi=dpi)
ax = fig.add_subplot(111, aspect='equal')
ax.set_axis_off()
ax.set_ylim(bottom=0.230, top=0.845)
ax.set_xlim(left=0.173, right=0.788)
# body
# See https://web.archive.org/web/20040819232503/http://www.hpl.hp.com/techreports/2000/HPL-2000-73.pdf
draw_triangle(fig, ax, 0.637, 0.921, 0.649, 0.274, 0.188, 0.667, colors[0])
draw_triangle(fig, ax, 0.981, 0.769, 0.335, 0.191, 0.393, 0.671, colors[1])
draw_triangle(fig, ax, 0.941, 0.397, 0.292, 0.475, 0.456, 0.747, colors[2])
draw_triangle(fig, ax, 0.662, 0.119, 0.316, 0.548, 0.662, 0.700, colors[3])
draw_triangle(fig, ax, 0.309, 0.081, 0.374, 0.718, 0.681, 0.488, colors[4])
draw_triangle(fig, ax, 0.016, 0.626, 0.726, 0.687, 0.522, 0.327, colors[5])
draw_text(fig, ax, 0.212, 0.562, labels.get('000001', ''), fontsize=fontsize)
draw_text(fig, ax, 0.430, 0.249, labels.get('000010', ''), fontsize=fontsize)
draw_text(fig, ax, 0.356, 0.444, labels.get('000011', ''), fontsize=fontsize)
draw_text(fig, ax, 0.609, 0.255, labels.get('000100', ''), fontsize=fontsize)
draw_text(fig, ax, 0.323, 0.546, labels.get('000101', ''), fontsize=fontsize)
draw_text(fig, ax, 0.513, 0.316, labels.get('000110', ''), fontsize=fontsize)
draw_text(fig, ax, 0.523, 0.348, labels.get('000111', ''), fontsize=fontsize)
draw_text(fig, ax, 0.747, 0.458, labels.get('001000', ''), fontsize=fontsize)
draw_text(fig, ax, 0.325, 0.492, labels.get('001001', ''), fontsize=fontsize)
draw_text(fig, ax, 0.670, 0.481, labels.get('001010', ''), fontsize=fontsize)
draw_text(fig, ax, 0.359, 0.478, labels.get('001011', ''), fontsize=fontsize)
draw_text(fig, ax, 0.653, 0.444, labels.get('001100', ''), fontsize=fontsize)
draw_text(fig, ax, 0.344, 0.526, labels.get('001101', ''), fontsize=fontsize)
draw_text(fig, ax, 0.653, 0.466, labels.get('001110', ''), fontsize=fontsize)
draw_text(fig, ax, 0.363, 0.503, labels.get('001111', ''), fontsize=fontsize)
draw_text(fig, ax, 0.750, 0.616, labels.get('010000', ''), fontsize=fontsize)
draw_text(fig, ax, 0.682, 0.654, labels.get('010001', ''), fontsize=fontsize)
draw_text(fig, ax, 0.402, 0.310, labels.get('010010', ''), fontsize=fontsize)
draw_text(fig, ax, 0.392, 0.421, labels.get('010011', ''), fontsize=fontsize)
draw_text(fig, ax, 0.653, 0.691, labels.get('010100', ''), fontsize=fontsize)
draw_text(fig, ax, 0.651, 0.644, labels.get('010101', ''), fontsize=fontsize)
draw_text(fig, ax, 0.490, 0.340, labels.get('010110', ''), fontsize=fontsize)
draw_text(fig, ax, 0.468, 0.399, labels.get('010111', ''), fontsize=fontsize)
draw_text(fig, ax, 0.692, 0.545, labels.get('011000', ''), fontsize=fontsize)
draw_text(fig, ax, 0.666, 0.592, labels.get('011001', ''), fontsize=fontsize)
draw_text(fig, ax, 0.665, 0.496, labels.get('011010', ''), fontsize=fontsize)
draw_text(fig, ax, 0.374, 0.470, labels.get('011011', ''), fontsize=fontsize)
draw_text(fig, ax, 0.653, 0.537, labels.get('011100', ''), fontsize=fontsize)
draw_text(fig, ax, 0.652, 0.579, labels.get('011101', ''), fontsize=fontsize)
draw_text(fig, ax, 0.653, 0.488, labels.get('011110', ''), fontsize=fontsize)
draw_text(fig, ax, 0.389, 0.486, labels.get('011111', ''), fontsize=fontsize)
draw_text(fig, ax, 0.553, 0.806, labels.get('100000', ''), fontsize=fontsize)
draw_text(fig, ax, 0.313, 0.604, labels.get('100001', ''), fontsize=fontsize)
draw_text(fig, ax, 0.388, 0.694, labels.get('100010', ''), fontsize=fontsize)
draw_text(fig, ax, 0.375, 0.633, labels.get('100011', ''), fontsize=fontsize)
draw_text(fig, ax, 0.605, 0.359, labels.get('100100', ''), fontsize=fontsize)
draw_text(fig, ax, 0.334, 0.555, labels.get('100101', ''), fontsize=fontsize)
draw_text(fig, ax, 0.582, 0.397, labels.get('100110', ''), fontsize=fontsize)
draw_text(fig, ax, 0.542, 0.372, labels.get('100111', ''), fontsize=fontsize)
draw_text(fig, ax, 0.468, 0.708, labels.get('101000', ''), fontsize=fontsize)
draw_text(fig, ax, 0.355, 0.572, labels.get('101001', ''), fontsize=fontsize)
draw_text(fig, ax, 0.420, 0.679, labels.get('101010', ''), fontsize=fontsize)
draw_text(fig, ax, 0.375, 0.597, labels.get('101011', ''), fontsize=fontsize)
draw_text(fig, ax, 0.641, 0.436, labels.get('101100', ''), fontsize=fontsize)
draw_text(fig, ax, 0.348, 0.538, labels.get('101101', ''), fontsize=fontsize)
draw_text(fig, ax, 0.635, 0.453, labels.get('101110', ''), fontsize=fontsize)
draw_text(fig, ax, 0.370, 0.548, labels.get('101111', ''), fontsize=fontsize)
draw_text(fig, ax, 0.594, 0.689, labels.get('110000', ''), fontsize=fontsize)
draw_text(fig, ax, 0.579, 0.670, labels.get('110001', ''), fontsize=fontsize)
draw_text(fig, ax, 0.398, 0.670, labels.get('110010', ''), fontsize=fontsize)
draw_text(fig, ax, 0.395, 0.653, labels.get('110011', ''), fontsize=fontsize)
draw_text(fig, ax, 0.633, 0.682, labels.get('110100', ''), fontsize=fontsize)
draw_text(fig, ax, 0.616, 0.656, labels.get('110101', ''), fontsize=fontsize)
draw_text(fig, ax, 0.587, 0.427, labels.get('110110', ''), fontsize=fontsize)
draw_text(fig, ax, 0.526, 0.415, labels.get('110111', ''), fontsize=fontsize)
draw_text(fig, ax, 0.495, 0.677, labels.get('111000', ''), fontsize=fontsize)
draw_text(fig, ax, 0.505, 0.648, labels.get('111001', ''), fontsize=fontsize)
draw_text(fig, ax, 0.428, 0.663, labels.get('111010', ''), fontsize=fontsize)
draw_text(fig, ax, 0.430, 0.631, labels.get('111011', ''), fontsize=fontsize)
draw_text(fig, ax, 0.639, 0.524, labels.get('111100', ''), fontsize=fontsize)
draw_text(fig, ax, 0.591, 0.604, labels.get('111101', ''), fontsize=fontsize)
draw_text(fig, ax, 0.622, 0.477, labels.get('111110', ''), fontsize=fontsize)
draw_text(fig, ax, 0.501, 0.523, labels.get('111111', ''), fontsize=fontsize)
# legend
draw_text(fig, ax, 0.674, 0.824, names[0], colors[0], fontsize=fontsize)
draw_text(fig, ax, 0.747, 0.751, names[1], colors[1], fontsize=fontsize)
draw_text(fig, ax, 0.739, 0.396, names[2], colors[2], fontsize=fontsize)
draw_text(fig, ax, 0.700, 0.247, names[3], colors[3], fontsize=fontsize)
draw_text(fig, ax, 0.291, 0.255, names[4], colors[4], fontsize=fontsize)
draw_text(fig, ax, 0.203, 0.484, names[5], colors[5], fontsize=fontsize)
leg = ax.legend(names, loc='center left', bbox_to_anchor=(1.0, 0.5), fancybox=True)
leg.get_frame().set_alpha(0.5)
return fig, ax
gitextract_sjp_a6pd/ ├── .gitignore ├── LICENSE ├── README.md ├── __init__.py ├── demo.py └── venn.py
SYMBOL INDEX (10 symbols across 1 files)

FILE: venn.py
  function draw_ellipse (line 27) | def draw_ellipse(fig, ax, x, y, w, h, a, fillcolor):
  function draw_triangle (line 36) | def draw_triangle(fig, ax, x1, y1, x2, y2, x3, y3, fillcolor):
  function draw_text (line 48) | def draw_text(fig, ax, x, y, text, color=[0, 0, 0, 1], fontsize=14, ha="...
  function draw_annotate (line 56) | def draw_annotate(fig, ax, x, y, textx, texty, text, color=[0, 0, 0, 1],...
  function get_labels (line 70) | def get_labels(data, fill=["number"]):
  function venn2 (line 128) | def venn2(labels, names=['A', 'B'], **options):
  function venn3 (line 172) | def venn3(labels, names=['A', 'B', 'C'], **options):
  function venn4 (line 222) | def venn4(labels, names=['A', 'B', 'C', 'D'], **options):
  function venn5 (line 282) | def venn5(labels, names=['A', 'B', 'C', 'D', 'E'], **options):
  function venn6 (line 360) | def venn6(labels, names=['A', 'B', 'C', 'D', 'E', 'F'], **options):
Condensed preview — 6 files, each showing path, character count, and a content snippet. Download the .json file or copy for the full structured content (29K chars).
[
  {
    "path": ".gitignore",
    "chars": 764,
    "preview": "# Byte-compiled / optimized / DLL files\n__pycache__/\n*.py[cod]\n*$py.class\n\n# C extensions\n*.so\n\n# Distribution / packagi"
  },
  {
    "path": "LICENSE",
    "chars": 1210,
    "preview": "This is free and unencumbered software released into the public domain.\n\nAnyone is free to copy, modify, publish, use, c"
  },
  {
    "path": "README.md",
    "chars": 2253,
    "preview": "# pyvenn\n2 ~ 6 Sets Venn Diagram For Python\n\nCheckout this repository first:\n```python\ngit clone https://github.com/tcti"
  },
  {
    "path": "__init__.py",
    "chars": 0,
    "preview": ""
  },
  {
    "path": "demo.py",
    "chars": 1398,
    "preview": "# coding: utf-8\n\n# ipython notebook requires this\n# %matplotlib inline\n\n# python console requires this\nimport matplotlib"
  },
  {
    "path": "venn.py",
    "chars": 22023,
    "preview": "# coding: utf-8\nfrom itertools import chain\ntry:\n    # since python 3.10\n    from collections.abc import Iterable\nexcept"
  }
]
About this extraction
This page contains the full source code of the tctianchi/pyvenn GitHub repository, extracted and formatted as plain text for AI agents and large language models (LLMs). The extraction includes 6 files (27.0 KB), approximately 9.6k tokens, and a symbol index with 10 extracted functions, classes, methods, constants, and types. Use this with OpenClaw, Claude, ChatGPT, Cursor, Windsurf, or any other AI tool that accepts text input. You can copy the full output to your clipboard or download it as a .txt file.
Extracted by GitExtract — free GitHub repo to text converter for AI. Built by Nikandr Surkov.