Repository: thlorenz/v8-perf
Branch: master
Commit: eab80c8ba242
Files: 24
Total size: 225.4 KB
Directory structure:
gitextract_5m067cum/
├── .gitignore
├── .jshintrc
├── README.md
├── compiler.md
├── crankshaft/
│ ├── compiler.md
│ ├── data-types.md
│ ├── gc.md
│ ├── memory-profiling.md
│ └── performance-profiling.md
├── data-types.md
├── examples/
│ ├── fibonacci.js
│ └── memory-hog.js
├── gc.md
├── inspection.md
├── language-features.md
├── memory-profiling.md
├── package.json
├── runtime-functions.md
├── snapshots+code-caching.md
└── test/
├── _versions.js
├── boxing.js
├── fast-elements.js
├── package.json
└── util/
└── element-kind.js
================================================
FILE CONTENTS
================================================
================================================
FILE: .gitignore
================================================
node_modules
.DS_Store
================================================
FILE: .jshintrc
================================================
{
"curly": false,
"noempty": true,
"newcap": true,
"eqeqeq": true,
"eqnull": true,
"undef": true,
"devel": true,
"node": true,
"browser": true,
"evil": false,
"latedef": false,
"nonew": true,
"immed": true,
"smarttabs": true,
"strict": true,
"laxcomma": true,
"laxbreak": true,
"asi": true
}
================================================
FILE: README.md
================================================
# v8-perf
Notes and resources related to V8 and thus Node.js performance.
**Table of Contents** *generated with [DocToc](https://github.com/thlorenz/doctoc)*
- [Topics](#topics)
- [Data Types](#data-types)
- [Compiler](#compiler)
- [Language Features](#language-features)
- [Garbage Collector](#garbage-collector)
- [Memory Profiling](#memory-profiling)
- [Inspection and Performance Profiling](#inspection-and-performance-profiling)
- [Snapshots and Code Caching](#snapshots-and-code-caching)
- [Runtime Functions](#runtime-functions)
- [V8 source and documentation](#v8-source-and-documentation)
- [source](#source)
- [source documentation](#source-documentation)
- [LICENSE](#license)
## Topics
### Data Types
The [data types](data-types.md) document explains what data types V8 uses under the hood to
store JavaScript data and how it relates to the performance of your code.
### Compiler
The [V8 compiler](compiler.md) document outlines the V8 compiler pipeline including the
Ignition Interpreter and TurboFan optimizing compiler. It explains how information about your
code is executed to allow optimizations, how and when deoptimizations occur and how features
like the CodeStubAssembler allowed reducing performance bottlenecks found in the [older
pipeline](crankshaft/compiler.md).
### Language Features
The [language features](language-features.md) document lists JavaScript language features and
provides info with regard to their performance mainly to provide assurance that performance of
most features is no longer an issue as it was with the previous compiler pipeline.
### Garbage Collector
The [V8 garbage collector](gc.md) document talks about how memory is organized on the V8 heap,
how garbage collection is performed and how it was parallelized as much as possible to avoid
pausing the main thread more than necessary.
### Memory Profiling
The [memory profiling](memory-profiling.md) document explains how JavaScript objects are
referenced to form a tree of nodes which the garbage collector uses to determine _collectable_
objects. It also outlines numerous techniques to profile memory leaks and allocations.
### Inspection and Performance Profiling
Inside the [inspection](inspection.md) document you will find techniques that allow you to
profile your Node.js or web app, how to produce flamegraphs and what flags and tools are
available to gain an insight into operations of V8 itself.
### Snapshots and Code Caching
[This document](snapshots+code-caching.md) includes information as to how V8 uses caching
techniques in order to avoid recompiling scripts during initialization and thus achieve faster
startup times.
### Runtime Functions
The [runtime functions](runtime-functions.md) document gives a quick intro into C++ functions
accessible from JavaScript that can be used to provide information of the V8 engine as well as
direct it to take a specific action like optimize a function on next call.
## V8 source and documentation
It's best to dig into the source to confirm assumptions about V8 performance first hand.
### source
- [home of V8 source code](https://code.google.com/p/v8/)
- [V8 code search](https://source.chromium.org/chromium/chromium/src/+/main:v8/)
- [V8 source code mirror on github](https://github.com/v8/v8/)
### source documentation
Documented V8 source code for specific versions of Node.js can be found on the [v8docs
page](https://v8docs.nodesource.com/).
## LICENSE
MIT
================================================
FILE: compiler.md
================================================
# Ignition and TurboFan Compiler Pipeline
_find the previous version of this document at
[crankshaft/compiler.md](crankshaft/compiler.md)_
Fully activated with V8 version 5.9. Earliest LTS Node.js release with a TurboFan activated
pipleline is Node.js V8.
**Table of Contents** *generated with [DocToc](https://github.com/thlorenz/doctoc)*
- [Goals](#goals)
- [Simplified Pipeline](#simplified-pipeline)
- [Basic Steps](#basic-steps)
- [Pipeline as Part of New V8 Architecture](#pipeline-as-part-of-new-v8-architecture)
- [Detailed Phases of Frontend, Optimization and Backend Stages](#detailed-phases-of-frontend-optimization-and-backend-stages)
- [Advantages Over Old Pipeline](#advantages-over-old-pipeline)
- [Smaller Performance Cliffs](#smaller-performance-cliffs)
- [Startup Time Improved](#startup-time-improved)
- [Memory Usage Reduced](#memory-usage-reduced)
- [Baseline Performance Improved](#baseline-performance-improved)
- [New Language Features](#new-language-features)
- [New Language Features Support And Transpilers](#new-language-features-support-and-transpilers)
- [Resources](#resources)
- [Ignition Interpreter](#ignition-interpreter)
- [Collecting Feedback via ICs](#collecting-feedback-via-ics)
- [Monomorphism vs. Polymorphism](#monomorphism-vs-polymorphism)
- [Feedback Lattice](#feedback-lattice)
- [Information Stored in Function Closures](#information-stored-in-function-closures)
- [TurboFan](#turbofan)
- [Speculative Optimization](#speculative-optimization)
- [`add` Example of Ignition and Feedback Vector](#add-example-of-ignition-and-feedback-vector)
- [Bytecode annotated](#bytecode-annotated)
- [Feedback Used To Optimize Code](#feedback-used-to-optimize-code)
- [Deoptimization](#deoptimization)
- [Bailout](#bailout)
- [Example of x86 Assembly Code including Checks and Bailouts](#example-of-x86-assembly-code-including-checks-and-bailouts)
- [Lazy Cleanup of Optimized Code](#lazy-cleanup-of-optimized-code)
- [Deoptimization Loop](#deoptimization-loop)
- [Causes for Deoptimization](#causes-for-deoptimization)
- [Modifying Object Shape](#modifying-object-shape)
- [Considerations](#considerations)
- [Class Definitions inside Functions](#class-definitions-inside-functions)
- [Considerations](#considerations-1)
- [Resources](#resources-1)
- [Inlining Functions](#inlining-functions)
- [Background Compilation](#background-compilation)
- [Sea Of Nodes](#sea-of-nodes)
- [Advantages](#advantages)
- [CodeStubAssembler](#codestubassembler)
- [What is the CodeStubAssember aka CSA?](#what-is-the-codestubassember-aka-csa)
- [Why is it a Game Changer?](#why-is-it-a-game-changer)
- [Improvements via CodeStubAssembler](#improvements-via-codestubassembler)
- [Recommendations](#recommendations)
- [Resources](#resources-2)
- [Slides](#slides)
- [Videos](#videos)
- [More Resources](#more-resources)
## Goals
[watch](https://youtu.be/HDuSEbLWyOY?t=7m22s)
> Speed up real world performance for modern JavaScript, and enable developers to build a
> faster future web.
- fast startup vs. peak performance
- low memory vs. max optimization
- Ignition Interpreter allows to run code with some amount of optimization very quickly and has
very low memory footprint
- TurboFan makes functions that run a lot fast, sacrificing some memory in the process
- designed to support entire JavaScript language and make it possible to quickly add new
features and to optimize them fast and incrementally
## Simplified Pipeline
[slide: pipeline 2010](https://docs.google.com/presentation/d/1_eLlVzcj94_G4r9j9d_Lj5HRKFnq6jgpuPJtnmIBs88/edit#slide=id.g2134da681e_0_163) |
[slide: pipeline 2014](https://docs.google.com/presentation/d/1_eLlVzcj94_G4r9j9d_Lj5HRKFnq6jgpuPJtnmIBs88/edit#slide=id.g2134da681e_0_220) |
[slide: pipeline 2016](https://docs.google.com/presentation/d/1_eLlVzcj94_G4r9j9d_Lj5HRKFnq6jgpuPJtnmIBs88/edit#slide=id.g2134da681e_0_249) |
[slide: pipeline 2017](https://docs.google.com/presentation/d/1_eLlVzcj94_G4r9j9d_Lj5HRKFnq6jgpuPJtnmIBs88/edit#slide=id.g2134da681e_0_125)
Once crankshaft was taken out of the mix the below pipeline was possible
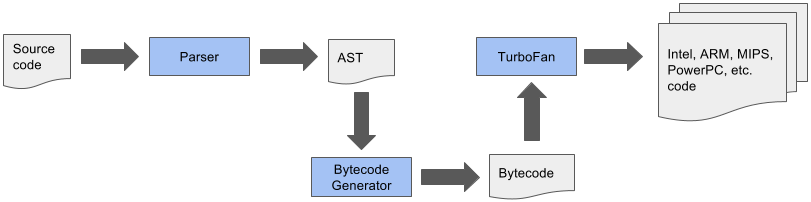 ### Basic Steps
1. Parse JavaScript into an [AST (abstract syntax tree)](https://en.wikipedia.org/wiki/Abstract_syntax_tree)
2. Generate bytecode from that AST
3. Turn bytecode into sequence of bytecodes by the BytecodeGenerator, which is part of the [Ignition Interpreter](https://v8.dev/blog/ignition-interpreter)
- sequences are divided on a per function basis
4. Execute bytecode sequences via Ignition and collect feedback via inline caches
- feedback used by Ignition itself to speed up subsequent interpretation of the bytecode
- feedback used for speculative optimization by TurboFan when code is optimized
5. _Speculatively_ optimize and compile bytecode using collected feedback to generate optimized machine code
for the current architecture
### Pipeline as Part of New V8 Architecture
### Basic Steps
1. Parse JavaScript into an [AST (abstract syntax tree)](https://en.wikipedia.org/wiki/Abstract_syntax_tree)
2. Generate bytecode from that AST
3. Turn bytecode into sequence of bytecodes by the BytecodeGenerator, which is part of the [Ignition Interpreter](https://v8.dev/blog/ignition-interpreter)
- sequences are divided on a per function basis
4. Execute bytecode sequences via Ignition and collect feedback via inline caches
- feedback used by Ignition itself to speed up subsequent interpretation of the bytecode
- feedback used for speculative optimization by TurboFan when code is optimized
5. _Speculatively_ optimize and compile bytecode using collected feedback to generate optimized machine code
for the current architecture
### Pipeline as Part of New V8 Architecture
 ### Detailed Phases of Frontend, Optimization and Backend Stages
[slide](https://docs.google.com/presentation/d/1H1lLsbclvzyOF3IUR05ZUaZcqDxo7_-8f4yJoxdMooU/edit#slide=id.g18ceb14729_0_135)
### Detailed Phases of Frontend, Optimization and Backend Stages
[slide](https://docs.google.com/presentation/d/1H1lLsbclvzyOF3IUR05ZUaZcqDxo7_-8f4yJoxdMooU/edit#slide=id.g18ceb14729_0_135)
 ## Advantages Over Old Pipeline
[watch old architecture](https://youtu.be/HDuSEbLWyOY?t=8m51s) | [watch new architecture](https://youtu.be/HDuSEbLWyOY?t=9m21s)
- reduces memory and startup overhead significantly
- AST no longer source of truth that compilers need to agree on
- AST much simpler and smaller in size
- TurboFan uses Ignition bytecode directly to optimize (no re-parse needed)
- bytecode is 25-50% the size of equivalent baseline machine code
- combines cutting-edge IR (intermediate representation) with multi-layered translation +
optimization pipeline
- relaxed [sea of nodes](#sea-of-nodes) approach allows more effective reordering and optimization when generating
CFG
- to achieve that fluid code motion, control flow optimizations and precise numerical range
analysis are used
- clearer separation between JavaScript, V8 and the target architectures allows cleaner, more
robust generated code and adds flexibility
- generates better quality machine code than Crankshaft JIT
- crossing from JS to C++ land has been minimized using techniques like CodeStubAssembler
- as a result optimizations can be applied in more cases and are attempted more aggressively
- for the same reason (and due to other improvements) TurboFan inlines code more aggressively,
leading to even more performance improvements
### Smaller Performance Cliffs
- for most websites the optimizing compiler isn't important and could even hurt performance
(speculative optimizations aren't cheap)
- pages need to load fast and unoptimized code needs to run fast _enough_, esp. on mobile
devices
- previous V8 implementations suffered from _performance cliffs_
- optimized code ran super fast (focus on peak performance case)
- baseline performance was much lower
- as a result one feature in your code that prevented it's optimization would affect your
app's performance dramatically, i.e. 100x difference
- TurboFan improves this as
- widens fast path to ensure that optimized code is more flexible and can accept more types
of arguments
- reduces code memory overhead by reusing code generation parts of TurboFan to build Ignition
interpreter
- improves slow path
### Startup Time Improved
[watch](https://youtu.be/M1FBosB5tjM?t=43m25s)
- bytecode smaller and faster to generate than machine code (crankshaft)
- bytecode better suited for smaller icache (low end mobile)
- code parsed + AST converted to bytecode only once and optimized from bytecode
- data driven ICs reduced slow path cost (collected in feedback form, previously collected in code form)
### Memory Usage Reduced
[watch](https://youtu.be/M1FBosB5tjM?t=47m20s)
- most important on mobile
- Ignition code up to 8x smaller than Full-Codegen code (crankshaft)
### Baseline Performance Improved
[watch](https://youtu.be/M1FBosB5tjM?t=37m)
- no longer relying on optimizing compiler for _sufficiently_ fast code
- thus improved baseline performance allows delaying optimization until more feedback is collected
- avoids optimizations of infrequently executed code
- leads to less time and resources spent optimizing
### New Language Features
[watch](https://youtu.be/M1FBosB5tjM?t=29m3s) | [watch](https://youtu.be/EdFDJANJJLs?t=20m) | [watch](https://youtu.be/HDuSEbLWyOY?t=11m22s)
- can address optimization killers that Crankshaft couldn't b/c it never supported fundamental techniques needed to do so
- as a result no specific syntax (like `try/catch`) inside a function will cause it not being optimized
- other subtle optimization killers that made performance unpredictable are no longer an issue and if they are they can be easily fixed in TF
- passing `undefined` as first parameter to `Math.max.apply`
- mixing strict and sloppy modes
- easier to support future JavaScript features as the JavaScript frontend is clearly separated
from the architecture dependent backends
- new language features are not useful by just being implemented
- need to be fast (at least matching transpiled code), related optimizations are easier with
new pipeline
- need to support debugging and be inspectable, this is achieved via better integration with
Chrome DevTools
- new language features are easier optimized which makes them useable after much shorter time
after they are introduced to V8 (previously performance issues for new features prevented
their use in code that needed to run fast)
- performance of ES6 features relative to the ES5 baseline operations per second tracked at [sixspeed](http://incaseofstairs.com/six-speed/)
- at this point ES6 features are almost on par with ES5 versions of same code for most cases
#### New Language Features Support And Transpilers
[watch how to leverage babel optimally](https://youtu.be/HDuSEbLWyOY?t=15m5s)| [read deploying es2015 code](https://philipwalton.com/articles/deploying-es2015-code-in-production-today/)
- using features directly, instead of transpiling, results in smaller code size [watch](https://youtu.be/HDuSEbLWyOY?t=13m)
- additionally less parse time for untranspiled code and easier optimized
- use [babel-preset-env](https://github.com/babel/babel/tree/master/packages/babel-preset-env) to specify browsers to target
- therefore transpile es2015+ selectively
### Resources
- [Digging into the TurboFan JIT](https://v8.dev/blog/turbofan-jit)
## Ignition Interpreter
[watch](https://youtu.be/EdFDJANJJLs?t=13m16s) | [read](https://v8.dev/blog/ignition-interpreter)
- uses TurboFan's low-level architecture-independent macro-assembly instructions to generate
bytecode handlers for each _opcode_
- TurboFan compiles these instructions to target architecture including low-level instruction
selection and machine register allocation
- bytecode passes through inline-optimization stages as it is generated
- common patterns replaced with faster sequences
- redundant operations removed
- minimize number of register transfers
- this results in highly optimized and small interpreter code which can execute the bytecode instructions
and interact with rest of V8 VM in low overhead manner
- Ignition Interpreter uses a [register machine](https://en.wikipedia.org/wiki/Register_machine)
with each bytecode specifying inputs and outputs as explicit register operands
- holds its local state in _interpreter registers_
- some map to _real_ CPU registers
- others map to specific slots in native machine _stack memory_
- last computed value of each bytecode is kept in special _accumulator_ register minimizing
load/store operations (from/to explicit registers)
- current stack frame is identified by stack pointer
- program counter points to currently executed instruction in the bytecode
- each bytecode handler tail-calls into the next bytecode handler (indirectly threaded
interpreter)
## Collecting Feedback via ICs
[watch hidden classes/maps](https://youtu.be/u7zRSm8jzvA?t=6m12s) | [watch](https://youtu.be/u7zRSm8jzvA?t=8m20s) | [watch feedback workflow](https://youtu.be/u7zRSm8jzvA?t=14m58s)
[Inline Caches implemented in JavaScript](http://mrale.ph/blog/2012/06/03/explaining-js-vms-in-js-inline-caches.html)
- gather knowledge about types while program runs
- feedback collected via data-driven approach
- uses _FeedbackVector_ attached to every function, responsible to record and manage all
execution feedback to later speed up its execution
- _FeedbackVector_ linked from function closure and contains slots to store different kinds
of feedback
- we can inspect what's inside the _FeedbackVector_ of a function in a debug build of d8 by
passing the `--allow-natives-syntax` flag and calling `%DebugPrint(fn)`
- if monomorphic compare maps and if they match just load prop at offset in memory, i.e. `mov eax, [eax+0xb]`
- IC feedback slots reserved when AST is created, see them via `--print-ast`, i.e. `Slot(0) at 29`
- collect typeinfo for ~24% of the function's ICs before attempting optimization
- feedback vectors aren't embedded in optimized code but map ids or specific type checks, like for Smis
- see optimization + IC info via [`--trace-opt`](inspection.md#tracing-optimizations)
- evaluate ICs via the [`--trace-ic` flag](inspection.md#tracing-inline-caches)
### Monomorphism vs. Polymorphism
[watch](https://youtu.be/UJPdhx5zTaw?t=31m30s) | [slide](http://v8-io12.appspot.com/index.html#61)
- operations are monomorphic if hidden classes of arguments are **always** same
- all others are polymorphic at best and megamorphic at worst
- polymorphic: 2-4 different types seen
- monomorphic operations are easier optimized
### Feedback Lattice
- the feedback [lattice](https://en.wikipedia.org/wiki/Lattice#Science,_technology,_and_mathematics)
describes the possible states of feedback that can be collected about the type of a function
argument
- all states but _Any_ are considered _monomorphic_ and _Any_ is considered _polymorphic_
- states can only change in one direction, thus going back from _Number_ to _SignedSmall_ is
not possible for instance
## Advantages Over Old Pipeline
[watch old architecture](https://youtu.be/HDuSEbLWyOY?t=8m51s) | [watch new architecture](https://youtu.be/HDuSEbLWyOY?t=9m21s)
- reduces memory and startup overhead significantly
- AST no longer source of truth that compilers need to agree on
- AST much simpler and smaller in size
- TurboFan uses Ignition bytecode directly to optimize (no re-parse needed)
- bytecode is 25-50% the size of equivalent baseline machine code
- combines cutting-edge IR (intermediate representation) with multi-layered translation +
optimization pipeline
- relaxed [sea of nodes](#sea-of-nodes) approach allows more effective reordering and optimization when generating
CFG
- to achieve that fluid code motion, control flow optimizations and precise numerical range
analysis are used
- clearer separation between JavaScript, V8 and the target architectures allows cleaner, more
robust generated code and adds flexibility
- generates better quality machine code than Crankshaft JIT
- crossing from JS to C++ land has been minimized using techniques like CodeStubAssembler
- as a result optimizations can be applied in more cases and are attempted more aggressively
- for the same reason (and due to other improvements) TurboFan inlines code more aggressively,
leading to even more performance improvements
### Smaller Performance Cliffs
- for most websites the optimizing compiler isn't important and could even hurt performance
(speculative optimizations aren't cheap)
- pages need to load fast and unoptimized code needs to run fast _enough_, esp. on mobile
devices
- previous V8 implementations suffered from _performance cliffs_
- optimized code ran super fast (focus on peak performance case)
- baseline performance was much lower
- as a result one feature in your code that prevented it's optimization would affect your
app's performance dramatically, i.e. 100x difference
- TurboFan improves this as
- widens fast path to ensure that optimized code is more flexible and can accept more types
of arguments
- reduces code memory overhead by reusing code generation parts of TurboFan to build Ignition
interpreter
- improves slow path
### Startup Time Improved
[watch](https://youtu.be/M1FBosB5tjM?t=43m25s)
- bytecode smaller and faster to generate than machine code (crankshaft)
- bytecode better suited for smaller icache (low end mobile)
- code parsed + AST converted to bytecode only once and optimized from bytecode
- data driven ICs reduced slow path cost (collected in feedback form, previously collected in code form)
### Memory Usage Reduced
[watch](https://youtu.be/M1FBosB5tjM?t=47m20s)
- most important on mobile
- Ignition code up to 8x smaller than Full-Codegen code (crankshaft)
### Baseline Performance Improved
[watch](https://youtu.be/M1FBosB5tjM?t=37m)
- no longer relying on optimizing compiler for _sufficiently_ fast code
- thus improved baseline performance allows delaying optimization until more feedback is collected
- avoids optimizations of infrequently executed code
- leads to less time and resources spent optimizing
### New Language Features
[watch](https://youtu.be/M1FBosB5tjM?t=29m3s) | [watch](https://youtu.be/EdFDJANJJLs?t=20m) | [watch](https://youtu.be/HDuSEbLWyOY?t=11m22s)
- can address optimization killers that Crankshaft couldn't b/c it never supported fundamental techniques needed to do so
- as a result no specific syntax (like `try/catch`) inside a function will cause it not being optimized
- other subtle optimization killers that made performance unpredictable are no longer an issue and if they are they can be easily fixed in TF
- passing `undefined` as first parameter to `Math.max.apply`
- mixing strict and sloppy modes
- easier to support future JavaScript features as the JavaScript frontend is clearly separated
from the architecture dependent backends
- new language features are not useful by just being implemented
- need to be fast (at least matching transpiled code), related optimizations are easier with
new pipeline
- need to support debugging and be inspectable, this is achieved via better integration with
Chrome DevTools
- new language features are easier optimized which makes them useable after much shorter time
after they are introduced to V8 (previously performance issues for new features prevented
their use in code that needed to run fast)
- performance of ES6 features relative to the ES5 baseline operations per second tracked at [sixspeed](http://incaseofstairs.com/six-speed/)
- at this point ES6 features are almost on par with ES5 versions of same code for most cases
#### New Language Features Support And Transpilers
[watch how to leverage babel optimally](https://youtu.be/HDuSEbLWyOY?t=15m5s)| [read deploying es2015 code](https://philipwalton.com/articles/deploying-es2015-code-in-production-today/)
- using features directly, instead of transpiling, results in smaller code size [watch](https://youtu.be/HDuSEbLWyOY?t=13m)
- additionally less parse time for untranspiled code and easier optimized
- use [babel-preset-env](https://github.com/babel/babel/tree/master/packages/babel-preset-env) to specify browsers to target
- therefore transpile es2015+ selectively
### Resources
- [Digging into the TurboFan JIT](https://v8.dev/blog/turbofan-jit)
## Ignition Interpreter
[watch](https://youtu.be/EdFDJANJJLs?t=13m16s) | [read](https://v8.dev/blog/ignition-interpreter)
- uses TurboFan's low-level architecture-independent macro-assembly instructions to generate
bytecode handlers for each _opcode_
- TurboFan compiles these instructions to target architecture including low-level instruction
selection and machine register allocation
- bytecode passes through inline-optimization stages as it is generated
- common patterns replaced with faster sequences
- redundant operations removed
- minimize number of register transfers
- this results in highly optimized and small interpreter code which can execute the bytecode instructions
and interact with rest of V8 VM in low overhead manner
- Ignition Interpreter uses a [register machine](https://en.wikipedia.org/wiki/Register_machine)
with each bytecode specifying inputs and outputs as explicit register operands
- holds its local state in _interpreter registers_
- some map to _real_ CPU registers
- others map to specific slots in native machine _stack memory_
- last computed value of each bytecode is kept in special _accumulator_ register minimizing
load/store operations (from/to explicit registers)
- current stack frame is identified by stack pointer
- program counter points to currently executed instruction in the bytecode
- each bytecode handler tail-calls into the next bytecode handler (indirectly threaded
interpreter)
## Collecting Feedback via ICs
[watch hidden classes/maps](https://youtu.be/u7zRSm8jzvA?t=6m12s) | [watch](https://youtu.be/u7zRSm8jzvA?t=8m20s) | [watch feedback workflow](https://youtu.be/u7zRSm8jzvA?t=14m58s)
[Inline Caches implemented in JavaScript](http://mrale.ph/blog/2012/06/03/explaining-js-vms-in-js-inline-caches.html)
- gather knowledge about types while program runs
- feedback collected via data-driven approach
- uses _FeedbackVector_ attached to every function, responsible to record and manage all
execution feedback to later speed up its execution
- _FeedbackVector_ linked from function closure and contains slots to store different kinds
of feedback
- we can inspect what's inside the _FeedbackVector_ of a function in a debug build of d8 by
passing the `--allow-natives-syntax` flag and calling `%DebugPrint(fn)`
- if monomorphic compare maps and if they match just load prop at offset in memory, i.e. `mov eax, [eax+0xb]`
- IC feedback slots reserved when AST is created, see them via `--print-ast`, i.e. `Slot(0) at 29`
- collect typeinfo for ~24% of the function's ICs before attempting optimization
- feedback vectors aren't embedded in optimized code but map ids or specific type checks, like for Smis
- see optimization + IC info via [`--trace-opt`](inspection.md#tracing-optimizations)
- evaluate ICs via the [`--trace-ic` flag](inspection.md#tracing-inline-caches)
### Monomorphism vs. Polymorphism
[watch](https://youtu.be/UJPdhx5zTaw?t=31m30s) | [slide](http://v8-io12.appspot.com/index.html#61)
- operations are monomorphic if hidden classes of arguments are **always** same
- all others are polymorphic at best and megamorphic at worst
- polymorphic: 2-4 different types seen
- monomorphic operations are easier optimized
### Feedback Lattice
- the feedback [lattice](https://en.wikipedia.org/wiki/Lattice#Science,_technology,_and_mathematics)
describes the possible states of feedback that can be collected about the type of a function
argument
- all states but _Any_ are considered _monomorphic_ and _Any_ is considered _polymorphic_
- states can only change in one direction, thus going back from _Number_ to _SignedSmall_ is
not possible for instance
 ### Information Stored in Function Closures
```
+-------------+
| Closure |-------+-------------------+--------------------+
+-------------+ | | |
↓ ↓ ↓
+-------------+ +--------------------+ +-----------------+
| Context | | SharedFunctionInfo | | Feedback Vector |
+-------------+ +--------------------+ +-----------------+
| | Invocation Count|
| +-----------------+
| | Optimized Code |
| +-----------------+
| | Binary Op |
| +-----------------+
|
| +-----------------+
+-----------> | Byte Code |
+-----------------+
```
- function _Closure_ links to _Context_, _SharedFunctionInfo_ and _FeedbackVector_
- Context: contains values for the _free variables_ of the function
and provides access to global object
- [free variables](https://en.wikipedia.org/wiki/Free_variables_and_bound_variables)
are variables that are neither local nor paramaters to the function, i.e. they are in scope
of the function but declared outside of it
- SharedFunctionInfo: general info about the function like source position and bytecode
- FeedbackVector: collects feedback via ICs as explained above
## TurboFan
[watch TurboFan history](https://youtu.be/EdFDJANJJLs?t=10m22s) | [watch TurboFan goals](https://youtu.be/EdFDJANJJLs?t=11m44s)
TurboFan is a simple compiler + backend responsible for the following:
- instruction selection + scheduling
- innovative scheduling algorithm makes use of reordering freedom ([sea of nodes](#sea-of-nodes)) to move
code out of loops into less frequently executed paths
- register allocation
- code generation
- generates fast code via _speculative optimization_ from the feedback collected while running
unoptimized bytecode
- architecture specific optimizations exploit features of each target platform for best quality
code
TurboFan is not just an optimizing compiler:
- interpreter bytecode handlers run on top of TurboFan
- builtins benefit from TurboFan
- code stubs / IC subsystem runs on top of TurboFan
- web assembly code generation (also runs on top of TurboFan by using its back-end passes)
## Speculative Optimization
[watch](https://youtu.be/VhpdsjBUS3g?t=18m53s)
- recompiles and optimizes hot code identified by the runtime profiler
- compiler speculates that kinds of values seen in the past will be see in the future as well
- generates optimized code just for those cases which is not only smaller but also executes at
peak speed
### `add` Example of Ignition and Feedback Vector
```
Bytecode Interpreter State Machine Stack
+--------------+ +-------------------+ +--------------+
| StackCheck | <----+ | stack pointer |---+ | receiver |
+--------------+ | +-------------------+ | +--------------+
| Ldar a1 | +-- | program counter | | | a0 |
+--------------+ +-------------------+ | +--------------+
| Add a0, [0] | | accumulator | | | a1 |
+--------------+ +-------------------+ | +--------------+
| Return | | | return addr. |
+--------------+ | +--------------+
| | context |
| +--------------+
| | closure |
| +--------------+
+---> | frame pointer|
+--------------+
| ... |
+--------------+
```
#### Bytecode annotated
```asm
StackCheck ; check for stack overflow
Ldar a1 ; load a1 into accumulator register
Add a0, [0] ; load value from a0 register and add it to value in accumulator register
Return ; end execution, return value in accum. reg. and tranfer control to caller
```
#### Feedback Used To Optimize Code
[slides](https://docs.google.com/presentation/d/1wZVIqJMODGFYggueQySdiA3tUYuHNMcyp_PndgXsO1Y/edit#slide=id.g19e50fc32a_1_24)
- the `[0]` of `Add a0, [0]` refers to _feedback vector slot_ where Ignition stores profiling
info which later is used by TurboFan to optimize the function
- `+` operator needs to perform a huge amount of checks to cover all cases, but if we assume
that we always add numbers we don't have to handle those other cases
- additionally numbers don't call side effects and thus the compiler knows that it can
eliminate the expression as part of the optimization
## Deoptimization
[slides](https://docs.google.com/presentation/d/1Z6oCocRASCfTqGq1GCo1jbULDGS-w-nzxkbVF7Up0u0/edit#slide=id.p) |
[slides](https://docs.google.com/presentation/d/1wZVIqJMODGFYggueQySdiA3tUYuHNMcyp_PndgXsO1Y/edit#slide=id.g19ee040be6_0_180) |
[watch](https://youtu.be/UJPdhx5zTaw?t=36m50s)
- optimizations are speculative and assumptions are made
- if assumption is violated
- function deoptimized
- execution resumes in Ignition bytecode
- in short term execution slows down
- normal to occur
- more info about about function collected
- _better_ optimization attempted
- if assumptions are violated again, deoptimized again and start over
- too many deoptimizations cause function to be sent to *deoptimization hell*
- considered not optimizable and no optimization is **ever** attempted again
- assumptions are verified as follows:
- _code objects_ are verified via a `test` in the _prologue_ of the generated machine code for a
particular function
- argument types are verified before entering the function body
### Bailout
[watch bailout example](https://youtu.be/u7zRSm8jzvA?t=26m43s) | [watch walk through TurboFan optimized code with bailouts](https://youtu.be/u7zRSm8jzvA?t=19m36s)
- when assumptions made by optimizing compiler don't hold it bails out to deoptimized code
- on bail out the code object is _thrown_ away as it doesn't handle the current case
- _trampoline_ to unoptimized code (stored in SharedFunctionInfo) used to _jump_ and continue
execution
#### Example of x86 Assembly Code including Checks and Bailouts
```asm
; x64 machine code generated by TurboFan for the Add Example above
; expecting that both parameters and the result are Smis
leaq rcx, [rip+0x0] ; load memory address of instruction pointer into rcx
movq rcx, [rcx-0x37] ; copy code object stored right in front into rcx
testb [rcx+0xf], 0x1 ; check if code object is valid
jnz CompileLazyDeoptimizedCode ; if not bail out via a jump
[ .. ] ; push registers onto stack
cmpq rsp, [r13+0xdb0] ; enough space on stack to execute code?
jna StackCheck ; if not we're sad and raise stack overflow
movq rax, [rbp+0x18] ; load x into rax
test al, 0x1 ; check tag bit to ensure x is small integer
jnz Deoptimize ; if not bail
movq rbx, [rbp+0x10] ; load y into rbx
testb rbx, 0x1 ; check tag bit to ensure y is small integer
jnz Deoptimize ; if not bail
[ .. ] ; do some nifty conversions via shifts
; and store results in rdx and rcx
addl rdx, rcx ; perform add including overflow check
jo Deoptimize ; if overflowed bail
[ .. ] ; cleanup and return to caller
```
### Lazy Cleanup of Optimized Code
[read](https://v8.dev/blog/lazy-unlinking)
- code objects created during optimization are no longer useful after deoptimization
- on deoptimization embedded fields of code object are invalidated, however code object itself
is kept alive
- for performance reasons unlinking of code object is postponed until next invocation of the
function in question
### Deoptimization Loop
[read](https://v8.dev/blog/v8-release-65)
- occurred when optimized code deoptimized and there was _no way to learn what went wrong_
- one cause was altering the shape of the array in the callback function of a second order
array builtin, i.e. by changing it's length
- TurboFan kept trying to optimized and gave up after ~30 attempts
- starting with V8 v6.5 this is detected and array built in is no longer inlined at that site
on future optimization attempts
### Causes for Deoptimization
#### Modifying Object Shape
[watch](https://youtu.be/VhpdsjBUS3g?t=21m00s)
- added fields (order matters) to object generate id of hidden class
- adding more fields later on generates new class id which results in code using Point that now gets Point' to be
deoptimized
[watch](https://youtu.be/VhpdsjBUS3g?t=21m45s)
[watch](https://youtu.be/UJPdhx5zTaw?t=12m18s)
```js
function Point(x, y) {
this.x = x;
this.y = y;
}
var p = new Point(1, 2); // => hidden Point class created
// ....
p.z = 3; // => another hidden class (Point') created
```
- `Point` class created, code still deoptimized
- functions that have `Point` argument are optimized
- `z` property added which causes `Point'` class to be created
- functions that get passed `Point'` but were optimized for `Point` get deoptimized
- later functions get optimized again, this time supporting `Point` and `Point'` as argument
- [detailed explanation](http://v8-io12.appspot.com/index.html#30)
##### Considerations
- avoid hidden class changes
- initialize all members in the **class constructor** or the **prototype constructor function**
and **in the same order**
- this creates one place in your code base where properties are assigned to an Object
- you may use Object literals, i.e. `const a = {}` or `const a = { b: 1 }`, as they also
benefit from hidden classes, but the creation of those may be spread around your code base
and it becomes much harder to verify that you are assigning the same properties in the same
order
#### Class Definitions inside Functions
```js
function createPoint(x, y) {
class Point {
constructor(x, y) {
this.x = x
this.y = y
}
distance(other) {
const dx = Math.abs(this.x - other.x)
const dy = Math.abs(this.y - other.y)
return dx + dy
}
}
return new Point(x, y)
}
function usePoint(point) {
// do something with the point
}
```
- defining a class inside `createPoint` results in its definition to be executed on each
`createPoint` invocation
- executing that definition causes a new prototype to be created along with methods and
constructor
- thus each new point has a different prototype and thus a different object shape
- passing these objects with differing prototypes to `usePoint` makes that function
become polymorphic
- V8 gives up on polymorphism after it has seen **more than 4** different object shapes, and enters
megamorphic state
- as a result `usePoint` won't be optimized
- pulling the `Point` class definition out of the `createPoint` function fixes that issue as
now the class definition is only executed once and all point prototypes match
- the performance improvement resulting from this simple change is substantial, the exact
speedup factor depends on the `usePoint` function
- when class or prototype definition is collected it's hidden class (associated maps) are
collected as well
- need to re-learn hidden classes for short living objects including metadata and all feedback
collected by inline caches
- references to maps and JS objects from optimized code are considered weak to avoid memory
leaks
##### Considerations
- always declare classes at the script scope, i.e. _never inside functions_ when it is
avoidable
##### Resources
- [optimization patterns part1](http://benediktmeurer.de/2017/06/20/javascript-optimization-patterns-part1/)
- [The case of temporary objects in Chrome](http://benediktmeurer.de/2016/10/11/the-case-of-temporary-objects-in-chrome/)
### Inlining Functions
[watch](https://youtu.be/u7zRSm8jzvA?t=26m12s)
- smart heuristics, i.e. how many times was the function called so far
## Background Compilation
[read](https://v8.dev/blog/background-compilation)
- part of the compilation pipeline that doesn't acess objects on the JavaScript heap run on a
background thread
- via some optimization to the bytecode compiler and how AST is stored and accessed, almost all
of the compilation of a script happens on a background thread
- only short AST internalizatoin and bytecode finalization happens on main thread
## Sea Of Nodes
[slides](https://docs.google.com/presentation/d/1sOEF4MlF7LeO7uq-uThJSulJlTh--wgLeaVibsbb3tc/edit#slide=id.g5499b9c42_074) |
[slides](https://docs.google.com/presentation/d/1sOEF4MlF7LeO7uq-uThJSulJlTh--wgLeaVibsbb3tc/edit#slide=id.g5499b9c42_0105) |
[read](http://darksi.de/d.sea-of-nodes/)
- doesn't include total order of program, but _control dependencies_ between operations
- instead expresses many possible legal orderings of code
- most efficient ordering and placement can be derived from the _nodes_
- depends on control dominance, loop nesting, register pressure
- _graph reductions_ applied to further optimize
- total ordering (traditional CFG) is built from that, so code can be generated and registers
allocated
- entrypoints are TurboFan optimizing compiler and WASM Compiler
### Advantages
[slide](https://docs.google.com/presentation/d/1H1lLsbclvzyOF3IUR05ZUaZcqDxo7_-8f4yJoxdMooU/edit#slide=id.g18ceb14729_0_92)
Flexibility of sea of nodes approach enables the below optimizations.
- better redundant code elimination due to more code motion
- loop peeling
- load/check elimination
- escape analysis [watch](https://youtu.be/KiWEWLwQ3oI?t=7m25s) | [watch](https://youtu.be/KiWEWLwQ3oI?t=17m25s)
- eliminates non-escaping allocations
- aggregates like `const o = { foo: 1, bar: 2}` are replaces with scalars like
`const o_foo = 1; const o_bar = 2`
- representation selection
- optimizing of number representation via type and range analysis
- [slides](https://docs.google.com/presentation/d/1sOEF4MlF7LeO7uq-uThJSulJlTh--wgLeaVibsbb3tc/edit#slide=id.g5499b9c42_094)
- redundant store elimination
- control flow elimination
- turns branch chains into switches
- allocation folding and write barrier elimination
- verify var is only assigned once (SSA - single static assignment)
- compiler may move the assignment anywhere, i.e. outside a loop
- may remove redundant checks
## CodeStubAssembler
[watch](https://youtu.be/M1FBosB5tjM?t=23m38s) |
[read](https://v8.dev/blog/csa) |
[slides](https://docs.google.com/presentation/d/1u6bsgRBqyVY3RddMfF1ZaJ1hWmqHZiVMuPRw_iKpHlY/edit#slide=id.g17a3a2e7fd_0_114) |
[slides](https://docs.google.com/presentation/d/1u6bsgRBqyVY3RddMfF1ZaJ1hWmqHZiVMuPRw_iKpHlY/edit#slide=id.p)
### What is the CodeStubAssember aka CSA?
- defines a portable assembly language built on top of TurboFan's backend and adds a C++ based
API to generate highly portable TurboFan machine-level IR directly
- can generate highly efficient code for parts of slow-paths in JS without crossing to C++
runtime
- API includes very low-level operations (pretty much assembly), _primitive_ CSA instructions
that translate directly into one or two assembly instructions
- Macros include fixed set of pre-defined CSA instructions corresponding to most commonly used
assembly instructions

_CSA and JavaScript compilation pipelines_
### Why is it a Game Changer?
The CSA allows much faster iteration when implementing and optimizing new language features due
to the following characteristics.
- CSA includes type verification at IR level to catch many correctness bugs at compile time
- CSA's instruction selector ensures that optimal code is generated on all platforms
- CSA's performs register allocations automatically
- CSA understands API calling conventions, both standard C++ and internal V8 register-based,
i.e. entry-point stubs into C++ can easily be called from CSA, making trivial to
interoperate between CSA generated code and other parts of V8
- CSA-based built in functionality can easily be inlined into Ignition bytecode handlers to
improve its performance
- builtins are coded in that DSL (no longer [self hosted](https://en.wikipedia.org/wiki/Self-hosting))
- very fast property accesses
#### Improvements via CodeStubAssembler
[slide](https://docs.google.com/presentation/d/1H1lLsbclvzyOF3IUR05ZUaZcqDxo7_-8f4yJoxdMooU/edit#slide=id.g18ceb14721_0_50)
CSA is the basis for fast builtins and thus was used to speed up multiple builtins. Below are a
few examples.
- [faster Regular Expressions](./js-feature-improvements.md#regular-expressions) sped up by
removing need to switch between C++ and JavaScript runtimes
- `Object.create` has predictable performance by using CodeStubAssembler
- `Function.prototype.bind` achieved final boost when ported to CodeStubAssembler for a total
60,000% improvement
- `Promise`s where ported to CodeStubAssembler which resulted in 500% speedup for `async/await`
## Recommendations
[watch](https://youtu.be/M1FBosB5tjM?t=52m54s) |
[watch](https://youtu.be/HDuSEbLWyOY?t=10m36s) |
[slide](https://docs.google.com/presentation/d/1_eLlVzcj94_G4r9j9d_Lj5HRKFnq6jgpuPJtnmIBs88/edit#slide=id.g2134da681e_0_577)
- performance of your code is improved
- less _anti patterns_ aka _you are holding it wrong_
- write idiomatic, declarative JavaScript as in _easy to read_ JavaScript with good data structures and algorithms, including all language features (even functional ones) will execute with predictable, good performance
- instead focus on your application design
- now can handle exceptions where it makes sense as `try/catch/finally` no longer ruins the performance of a function
- use appropriate collections as their performance is on par with the raw use of Objects for same task
- Maps, Sets, WeakMaps, WeakSets used where it makes sense results in easier maintainable JavaScript as they offer specific functionality to iterate over and inspect their values
- avoid engine specific workarounds aka _CrankshaftScript_, instead file a bug report if you discover a bottleneck
## Resources
- [V8: Behind the Scenes (November Edition) - 2016](http://benediktmeurer.de/2016/11/25/v8-behind-the-scenes-november-edition/)
- [V8: Behind the Scenes (February Edition - 2017)](http://benediktmeurer.de/2017/03/01/v8-behind-the-scenes-february-edition/)
- [An Introduction to Speculative Optimization in V8 - 2017](http://benediktmeurer.de/2017/12/13/an-introduction-to-speculative-optimization-in-v8/)
- [High-performance ES2015 and beyond - 2017](https://v8.dev/blog/high-performance-es2015)
- [Launching Ignition and TurboFan - 2017](https://v8.dev/blog/launching-ignition-and-turbofan)
- [lazy unlinking of deoptimized functions - 2017](https://v8.dev/blog/lazy-unlinking)
- [Taming architecture complexity in V8 — the CodeStubAssembler - 2017](https://v8.dev/blog/csa)
- [V8 release v6.5 - 2018](https://v8.dev/blog/v8-release-65)
- [Background compilation - 2018](https://v8.dev/blog/background-compilation)
- [Sea of Nodes - 2015](http://darksi.de/d.sea-of-nodes/)
### Slides
- [CodeStubAssembler: Redux - 2016](https://docs.google.com/presentation/d/1u6bsgRBqyVY3RddMfF1ZaJ1hWmqHZiVMuPRw_iKpHlY/edit#slide=id.p)
- [Deoptimization in V8 - 2016](https://docs.google.com/presentation/d/1Z6oCocRASCfTqGq1GCo1jbULDGS-w-nzxkbVF7Up0u0/edit#slide=id.p)
- [Turbofan IR - 2016](https://docs.google.com/presentation/d/1Z9iIHojKDrXvZ27gRX51UxHD-bKf1QcPzSijntpMJBM/edit#slide=id.p)
- [TurboFan: A new code generation architecture for V8 - 2017](https://docs.google.com/presentation/d/1_eLlVzcj94_G4r9j9d_Lj5HRKFnq6jgpuPJtnmIBs88/edit#slide=id.p)
- [Fast arithmetic for dynamic languages - 2016](https://docs.google.com/presentation/d/1wZVIqJMODGFYggueQySdiA3tUYuHNMcyp_PndgXsO1Y/edit#slide=id.p)
- [An overview of the TurboFan compiler - 2016](https://docs.google.com/presentation/d/1H1lLsbclvzyOF3IUR05ZUaZcqDxo7_-8f4yJoxdMooU/edit#slide=id.p)
- [TurboFan JIT Design - 2016](https://docs.google.com/presentation/d/1sOEF4MlF7LeO7uq-uThJSulJlTh--wgLeaVibsbb3tc/edit#slide=id.p)
### Videos
- [performance improvements in latest V8 - 2017](https://youtu.be/HDuSEbLWyOY?t=4m58s)
- [V8 and how it listens to you - ICs and FeedbackVectors - 2017](https://www.youtube.com/watch?v=u7zRSm8jzvA)
- [Escape Analysis in V8 - 2018](https://www.youtube.com/watch?v=KiWEWLwQ3oI)
### More Resources
- [TurboFan wiki](https://v8.dev/docs/turbofan)
================================================
FILE: crankshaft/compiler.md
================================================
**Table of Contents** *generated with [DocToc](http://doctoc.herokuapp.com/)*
- [v8 Compiler](#v8-compiler)
- [Components](#components)
- [Base Compiler](#base-compiler)
- [Runtime Profiler](#runtime-profiler)
- [Optimizing Compiler](#optimizing-compiler)
- [Deoptimization Support](#deoptimization-support)
- [Optimized Code vs. Inline Caches and Unoptimized Code](#optimized-code-vs-inline-caches-and-unoptimized-code)
- [Full Compiler](#full-compiler)
- [Inline Caches](#inline-caches)
- [Monomorphism vs. Polymorphism](#monomorphism-vs-polymorphism)
- [Considerations](#considerations)
- [Optimizing Compiler](#optimizing-compiler-1)
- [Deoptimization](#deoptimization)
- [Causes for Deoptimization](#causes-for-deoptimization)
- [Modifying Object Shape](#modifying-object-shape)
- [Considerations](#considerations-1)
- [Efficiently Representing Values and Tagging](#efficiently-representing-values-and-tagging)
- [Considerations](#considerations-2)
- [Arrays](#arrays)
- [Fast Elements](#fast-elements)
- [Characteristics](#characteristics)
- [Dictionary Elements](#dictionary-elements)
- [Characteristics](#characteristics-1)
- [Double Array Unboxing](#double-array-unboxing)
- [Typed Arrays](#typed-arrays)
- [Float64Array](#float64array)
- [Considerations](#considerations-3)
- [Resources](#resources)
# v8 Compiler
## Components
### Base Compiler
- is used for all code initially
- generates code quickly without heavy optimizations
- compilation with the base compiler is very fast generates little code
### Runtime Profiler
- monitors the running system and identifies hot code
### Optimizing Compiler
- recompiles and optimizes hot code identified by the runtime profiler
- uses static single assignment form to perform optimizations
- loop-invariant code motion
- linear-scan register allocation
- inlining.
- optimization decisions are based on type information collected while running the code produced by the base compiler
### Deoptimization Support
- allows the optimizing compiler to be optimistic in the assumptions it makes when generating code
- deoptimization support allows to bail out to the code generated by the base compiler if the assumptions in the
optimized code turn out to be too optimistic
## Optimized Code vs. Inline Caches and Unoptimized Code
[watch](http://youtu.be/VhpdsjBUS3g?t=18m53s)
[watch](http://youtu.be/UJPdhx5zTaw?t=26m30s)
### Full Compiler
[slide](http://v8-io12.appspot.com/index.html#54)
- generates code for any JavaScript
- all code starts unoptimized
- initial (quick) JIT
- is not great and knows (almost) nothing about types
- needed to start executing code ASAP
- uses Inline Caches (ICs) to refine knowledge about types at runtime
### Inline Caches
[slide](http://v8-io12.appspot.com/index.html#55)
[Inline Caches implemented in JavaScript](http://mrale.ph/blog/2012/06/03/explaining-js-vms-in-js-inline-caches.html)
- gather knowledge about types while program runs
- **type dependent** code for operations given specific hidden classes as inputs
- 1. validate type assumptions (are hidden classes as expected)
- 2. do work
- change at runtime via backpatching as more types are discovered to generate new ICs
[watch](http://youtu.be/UJPdhx5zTaw?t=28m44s) | [slide](http://v8-io12.appspot.com/index.html#56)
Inline Caches alone without optimizing compiler step make huge performance difference (20x speedup).
### Monomorphism vs. Polymorphism
[watch](http://youtu.be/UJPdhx5zTaw?t=31m30s) | [slide](http://v8-io12.appspot.com/index.html#61)
- operations are monomorphic if hidden classes of arguments are **always** same
- all others are polymorphic at best and megamorphic at worst
- monomorphic operations are easier optimized
#### Considerations
- prefer monomorphic over polymorphic functions wherever possible
### Optimizing Compiler
[watch](http://youtu.be/UJPdhx5zTaw?t=33m12s) | [slide](http://v8-io12.appspot.com/index.html#65)
- if function executes a lot it becomes **hot**
- hot function is re-compiled with optimizing compiler
- optimistically
- lots of assumptions made from the calls made to that function so far
- type information takend from ICs
- operations get inlined speculatively using historic information
- monomorphic functions/constructors can be inlined entirely
- inlining allows even further optimizations
### Deoptimization
[watch](http://youtu.be/UJPdhx5zTaw?t=36m50s) | [slide](http://v8-io12.appspot.com/index.html#78)
- optimizations are speculative and assumptions are made
- if assumption is violated
- function deoptimized
- execution resumes in full compiler code
- in short term execution slows down
- normal to occur
- more info about about function collected
- *better* optimization attempted
- if assumptions are violated again, deoptimized again and start over
- too many deoptimizations cause function to be sent to *deoptimization hell*
- considered not optimizable and no optimization is **ever** attempted again
- certain constructs like `try/catch` are considered not optimizable and functions containing it go straight to
*deoptimization hell* due to **bailout** [watch](http://youtu.be/UJPdhx5zTaw?t=35m23s)
None of this can be diagnosed with Chrome Devtools at this point.
### Causes for Deoptimization
#### Modifying Object Shape
[watch](http://youtu.be/VhpdsjBUS3g?t=21m00s)
- added fields (order matters) to object generate id of hidden class
- adding more fields later on generates new class id which results in code using Point that now gets Point' to be
deoptimized
[watch](http://youtu.be/VhpdsjBUS3g?t=21m45s)
[watch](http://youtu.be/UJPdhx5zTaw?t=12m18s)
```js
function Point(x, y) {
this.x = x;
this.y = y;
}
var p = new Point(1, 2); // => hidden Point class created
// ....
p.z = 3; // => another hidden class (Point') created
```
- `Point` class created, code still deoptimized
- functions that have `Point` argument are optimized
- `z` property added which causes `Point'` class to be created
- functions that get passed `Point'` but were optimized for `Point` get deoptimized
- later functions get optimized again, this time supporting `Point` and `Point'` as argument
- [detailed explanation](http://v8-io12.appspot.com/index.html#30)
##### Considerations
- avoid hidden class changes
- initialize all members in **constructor function** and **in the same order**
## Efficiently Representing Values and Tagging
[watch](http://youtu.be/UJPdhx5zTaw?t=15m35s) | [slide](http://v8-io12.appspot.com/index.html#34)
- v8 passes around 32bit numbers to represent all values
- bottom bit reserved as tag to signify if value is a SMI (small integer) or a pointer to an object
[watch](http://youtu.be/UJPdhx5zTaw?t=10m05ss) | [slide](http://v8-io12.appspot.com/index.html#35)
```
| object pointer | 1 |
or
| 31-bit-signed integer (SMI) | 0 |
```
- numbers bigger than 31 bits are boxed
- stored inside an object referenced via a pointer
- adds extra overhead (at a minimum an extra lookup)
### Considerations
- prefer SMIs for numeric values whenever possible
## Arrays
[watch](http://youtu.be/UJPdhx5zTaw?t=17m25s) | [slide](http://v8-io12.appspot.com/index.html#38)
v8 has two methods for storing arrays.
### Fast Elements
- compact keysets
- linear storage buffer
#### Characteristics
- contiguous (non-sparse)
- `0` based
- smaller than 64K
### Dictionary Elements
- hash table storage
- slow access
#### Characteristics
- sparse
- large
### Double Array Unboxing
[watch](http://youtu.be/UJPdhx5zTaw?t=20m20s) | [slide](http://v8-io12.appspot.com/index.html#45)
- Array's hidden class tracks element types
- if all doubles, array is unboxed
- wrapped objects layed out in linear buffer of doubles
- each element slot is 64-bit to hold a double
- SMIs that are currently in Array are converted to doubles
- very efficient access
- storing requires no allocation as is the case for boxed doubles
- causes hidden class change
- careless array manipulation may cause overhead due to boxing/unboxing [watch](http://youtu.be/UJPdhx5zTaw?t=21m50s) |
[slide](http://v8-io12.appspot.com/index.html#47)
### Typed Arrays
[blog](http://mrale.ph/blog/2011/05/12/dangers-of-cross-language-benchmark-games.htm) |
[spec](https://www.khronos.org/registry/typedarray/specs/latest/)
- difference is in semantics of indexed properties
- v8 uses unboxed backing stores for such typed arrays
#### Float64Array
- gets 64-bit allocated for each element
### Considerations
- don't pre-allocate large arrays (`>64K`), instead grow as needed, to avoid them being considered sparse
- do pre-allocate small arrays to correct size to avoid allocations due to resizing
- don't delete elements
- don't load uninitialized or deleted elements [watch](http://youtu.be/UJPdhx5zTaw?t=19m30s) |
[slide](http://v8-io12.appspot.com/index.html#43)
- use literal initializer for Arrays with mixed values
- don't store non-numeric values in numeric arrays
- causes boxing and efficient code that was generated for manipulating values can no longer be used
- use typed arrays whenever possible
## Resources
- [video: accelerating oz with v8](https://www.youtube.com/watch?v=VhpdsjBUS3g) |
[slides](http://commondatastorage.googleapis.com/io-2013/presentations/223.pdf)
- [video: breaking the javascript speed limit with v8](https://www.youtube.com/watch?v=UJPdhx5zTaw) |
[slides](http://v8-io12.appspot.com/index.html#1)
- [chromium blog announcement 2010](http://blog.chromium.org/2010/12/new-crankshaft-for-v8.html)
- [mraleph: dangers of cross language
benchmarks 5/2011](http://mrale.ph/blog/2011/05/12/dangers-of-cross-language-benchmark-games)
- [wingo: closer look at crankshaft 8/2011](http://wingolog.org/archives/2011/08/02/a-closer-look-at-crankshaft-v8s-optimizing-compiler)
- [wingo: inside full-codegen 4/2013](http://wingolog.org/archives/2013/04/18/inside-full-codegen-v8s-baseline-compiler)
- [tour of crankshaft 4/2013](http://jayconrod.com/posts/54/a-tour-of-v8-crankshaft-the-optimizing-compiler)
================================================
FILE: crankshaft/data-types.md
================================================
**Table of Contents** *generated with [DocToc](http://doctoc.herokuapp.com/)*
- [Data Types](#data-types)
- [Efficiently Representing Values and Tagging](#efficiently-representing-values-and-tagging)
- [Considerations](#considerations)
- [Objects](#objects)
- [Structure](#structure)
- [Object Properties](#object-properties)
- [Hash Tables](#hash-tables)
- [Key Value Insertion](#key-value-insertion)
- [Key Value Retrieval](#key-value-retrieval)
- [Fast, In-Object Properties](#fast-in-object-properties)
- [Assigning Properties inside Constructor Call](#assigning-properties-inside-constructor-call)
- [Assigning More Properties Later](#assigning-more-properties-later)
- [Assigning Same Properties in Different Order](#assigning-same-properties-in-different-order)
- [In-object Slack Tracking](#in-object-slack-tracking)
- [Methods And Prototypes](#methods-and-prototypes)
- [Assigning Functions to Properties](#assigning-functions-to-properties)
- [Assigning Functions to Prototypes](#assigning-functions-to-prototypes)
- [Numbered Properties](#numbered-properties)
- [Arrays](#arrays)
- [Fast Elements](#fast-elements)
- [Characteristics](#characteristics)
- [Dictionary Elements](#dictionary-elements)
- [Characteristics](#characteristics-1)
- [Double Array Unboxing](#double-array-unboxing)
- [Typed Arrays](#typed-arrays)
- [Float64Array](#float64array)
- [Considerations](#considerations-1)
- [Strings](#strings)
- [Resources](#resources)
# Data Types
## Efficiently Representing Values and Tagging
[watch](http://youtu.be/UJPdhx5zTaw?t=15m35s) | [slide](http://v8-io12.appspot.com/index.html#34)
[read](http://jayconrod.com/posts/52/a-tour-of-v8-object-representation) *Numbered properties: fast elements*
- most objects in heap are 4-byte aligned
- according to spec all numbers in JS are 64-bit floating doubles
- v8 passes around 32-bit numbers to represent all values for improved efficiency
- bottom bit reserved as tag to signify if value is a SMI (small integer) or a pointer to an object
[watch](http://youtu.be/UJPdhx5zTaw?t=10m05ss) | [slide](http://v8-io12.appspot.com/index.html#35)
```
| object pointer | 1 |
or
| 31-bit-signed integer (SMI) | 0 |
```
- numbers bigger than 31 bits are boxed
- stored inside an object referenced via a pointer
- adds extra overhead (at a minimum an extra lookup)
### Considerations
- prefer SMIs for numeric values whenever possible
## Objects
### Structure
```
+-------------------+
| Object | +----> +------------------+ +----> +------------------+
|-------------------| | | FixedArray | | | FixedArray |
| Map | | |------------------| | |------------------|
|-------------------| | | Map | | | Map |
| Extra Properties |----+ |------------------| | |------------------|
|-------------------| | Length | | | Length |
| Elements |------+ |------------------| | |------------------|
|-------------------| | | Property "poo" | | | Property "0" |
| Property "foo" | | |------------------| | |------------------|
|-------------------| | | Property "baz" | | | Property "1" |
| Property "bar" | | +__________________+ | +__________________+
+___________________+ | |
| |
| |
+-----------------------------+
```
- above shows most common optimized representation
- most objects contain all their properties in single block of memory `"foo", "bar"`
- all blocks have a `Map` property describing their structure
- named properties that don't fit are stored in overflow array `"poo", "baz"`
- numbered properties are stored in a separate contiguous array `"1", "2"`
### Object Properties
[read](http://jayconrod.com/posts/52/a-tour-of-v8-object-representation) *Some surprising properties of properties*
- object is a collection of properties aka *key-value pairs*
- property names are **always** strings
- any name used as property name that is not a string is stringified via `.toString()`, **even numbers**, so `1` becomes `"1"`
- **Arrays in JavaScript are just objects** with *magic* `length` property
### Hash Tables
- hash table used for *difficult* objects
- aka objects in *dictionary mode*
- accessing hash table property is much slower than accessing a field at a known offset
- if *non-symbol* string is used to access a property it is *uniquified* first
- v8 hash tables are large arrays containing keys and values
- initially all keys and values are `undefined`
#### Key Value Insertion
- on *key-vaule pair* insertion the key's *hash code* is computed
- low bits of *hash code* are used as initial insertion index
- if that slot is taken the hash table attempts to insert it at next index (modulo length) and so on
#### Key Value Retrieval
- computing hash code and comparing keys for equality is commonly a fast operation
- still slow to execute these non-trivial routines on every property read/write
- v8 avoids hash table representation whenever possible
### Fast, In-Object Properties
[read](http://jayconrod.com/posts/52/a-tour-of-v8-object-representation) *Fast, in-object properties* |
[read](https://developers.google.com/v8/design#prop_access)
- v8 describes the structure of objects using maps used to create *hidden classes* and match data types
- resembles a table of descriptors with one entry for each property
- map contains info about size of the object
- map contains info about pointers to constructors and prototypes
- objects with same structure share same map
- objects created by the same constructor and have the **same set of properties assigned in the same order**
- have regular logical structure and therefore regular structure in memory
- share same map
- adding new property is handled via *transition* descriptor
- use existing map
- *transition* descriptor points at other map
#### Assigning Properties inside Constructor Call
```js
function Point () {
// Map M0
// "x": Transition to M1 at offset 12
this.x = x;
// Map M1
// "x": Field at offset 12
// "y": Transition to M2 at offset 16
this.y = y;
// Map M2
// "x": Field at offset 12
// "y": Field at offset 16
}
```
- `Point` starts out without any fields with `M0`
- `this.x =x` -> map pointer set to `M1` and value `x` is stored at offset `12` and `"x" Transition` descriptor added to `M0`
- `this.y =y` -> map pointer set to `M2` and value `y` is stored at offset `16` and `"y" Transition` descriptor added to `M1`
#### Assigning More Properties Later
```js
var p = new Point();
// Map M2
// "x": Field at offset 12
// "y": Field at offset 16
// "z": Transition at offset 20
p.z = z;
// Map M3
// "x": Field at offset 12
// "y": Field at offset 16
// "z": Field at offset 20
```
- assigning `z` later
- create `M3`, a copy of `M2`
- add `Transition` descriptor to `M2`
- add `Field` descriptor to `M3`
#### Assigning Same Properties in Different Order
```js
function Point(x, y, reverse) {
// Map M0
// "x": Transition to M1 at offset 12ak
// "y": Transition to M2 at offset 12
if (reverse) {
// variation 1
// Map M1
// "x": Field at offset 12
// "y": Transition to M4 at offset 16
this.x = x;
// Map M4
// "x": Field at offset 12
// "y": Field at offset 16
this.y = y;
} else {
// variation 2
// Map M2
// "y": Field at offset 12
// "x": Transition to M5 at offset 16
this.y = x;
// Map M5
// "y": Field at offset 12
// "x": Field at offset 16
this.x = y;
}
}
```
- both variations share `M0` which has two *transitions*
- not all `Point`s share same map
- in worse cases v8 drops object into *dictionary mode* in order to prevent huge number of maps to be allocated
- when assigning random properties to objects from same constructor in random order
- when deleting properties
### In-object Slack Tracking
[read](http://jayconrod.com/posts/52/a-tour-of-v8-object-representation) *In-object slack tracking*
- objects allocated by a constructor are given enough memory for 32 *fast* properties to be stored
- after certain number of objects (8) were allocated from same constructor
- v8 traverses *transition tree* from initial map to determine size of largest of these initial objects
- new objects of same type are allocated with exact amount of memory to store max number of properties
- initial objects are resized (down)
### Methods And Prototypes
[read](http://jayconrod.com/posts/52/a-tour-of-v8-object-representation) *Methods and prototypes*
#### Assigning Functions to Properties
```js
function Point () {
// Map M0
// "x": Transition to M1 at offset 12
this.x = x;
// Map M1
// "x": Field at offset 12
// "y": Transition to M2 at offset 16
this.y = y;
// Map M2
// "x": Field at offset 12
// "y": Field at offset 16
// "distance": Transition to M3
this.distance = pointDistance;
// Map M3
// "x": Field at offset 12
// "y": Field at offset 16
// "distance": Constant_Function
}
function pointDistance(p) { /* calculates distance */ }
```
- properties pointing to `Function`s are handled via `constant functions` descriptor
- `constant_function` descriptor indicates that value of property is stored with descriptor itself rather than in the
object
- pointers to functions are directly embedded into optimized code
- if `distance` is reassigned, a new map has to be created since the `Transition` breaks
#### Assigning Functions to Prototypes
```js
function Point(x, y) {
this.x = x;
this.y = y;
}
Point.prototype.pointDistance = function () { /* calculates distance */ }
```
- v8 represents prototype methods using `constant_function` descriptors
- calling prototype methods maybe a **tiny** bit slower due to overhead of the following:
- check *receiver's* map (as with *own* properties)
- check maps of *prototype chain* (extra step)
- the above lookup overhead won't make measurable performance difference and **shouldn't impact how you write code**
### Numbered Properties
[read](http://jayconrod.com/posts/52/a-tour-of-v8-object-representation) *Numbered properties: fast elements*
[see Arrays](#arrays)
- numbered properties are treated and ordered differently than others since any object can *behave* like an array
- *element* === any property whose key is non-negative integer
- v8 stores elements separate from named properties in an *elements kind* field (see [structure diagram](#structure))
- if object drops into *dictionary mode* for elements, access to named properties remains fast and vice versa
- maps don't need *transitions* to maps that are identical except for *element kinds*
- most elements are *fast elements* which are stored in a contiguous array
## Arrays
[watch](http://youtu.be/UJPdhx5zTaw?t=17m25s) | [slide](http://v8-io12.appspot.com/index.html#38)
[read](http://jayconrod.com/posts/52/a-tour-of-v8-object-representation) *Numbered properties: fast elements*
[read]((https://v8.dev/blog/fast-properties)
- v8 has two methods for storing arrays, *fast elements* and *dictionary elements*
### Fast Elements
[see Numbered Properties](#numbered-properties)
- compact keysets
- linear storage buffer
#### Characteristics
- contiguous (non-sparse)
- `0` based
- smaller than `100K` elements [see this test](https://github.com/thlorenz/v8-perf/blob/master/test/fast-elements.js)
#### Packed vs. Holey Elements
- v8 makes distinction whether the elements backing store is packed or has holes
- holes in a backing store are created by deleting an indexed element
- missing properties are marked with special _hole_ value to keep Array functions performant
- however missing properties cause expensive lookups on prototype chain
- in the past reading beyond the length of an array made it holey, however this has been fixed
and is no longer a problem (TODO: resource)
#### Elements Kinds
[read](https://v8.dev/blog/elements-kinds)
- fast *elements kinds* in order of increasing generality:
- fast SMIs (small integers)
- fast doubles (Doubles stored in unboxed representation)
- fast values (strings or other objects)
##### Elements Kind Lattice
```
+--------------------+
| PACKED_SMI_ELEMENT |---+
+--------------------+ | +------------------------+
| +--->| PACKED_DOUBLE_ELEMENTS |---+
↓ +------------------------+ | +-------------------+
+--------------------+ | +--->| PACKED_ELEMENTS |
| HOLEY_SMI_ELEMENTS |---+ ↓ +-------------------+
+--------------------+ | +------------------------+ |
+--->| HOLEY_DOUBLE_ELEMENTS |---+ ↓
+------------------------+ | +-------------------+
+--->| HOLEY_ELEMENTS |
+-------------------+
```
- can only transition downwards through the lattice
- more specific elements kinds enable more fine-grained optimizations
### Dictionary Elements
[see Hash Tables](#hash-tables)
- hash table storage
- slow access
#### Characteristics
- sparse
- large
### Double Array Unboxing
[watch](http://youtu.be/UJPdhx5zTaw?t=20m20s) | [slide](http://v8-io12.appspot.com/index.html#45)
- Array's hidden class tracks element types
- if all doubles, array is unboxed aka *upgraded to fast doubles*
- wrapped objects layed out in linear buffer of doubles
- each element slot is 64-bit to hold a double
- SMIs that are currently in Array are converted to doubles
- very efficient access
- storing requires no allocation as is the case for boxed doubles
- causes hidden class change
- requires expensive copy-and-convert operation
- careless array manipulation may cause overhead due to boxing/unboxing [watch](http://youtu.be/UJPdhx5zTaw?t=21m50s) |
[slide](http://v8-io12.appspot.com/index.html#47)
### Typed Arrays
[blog](http://mrale.ph/blog/2011/05/12/dangers-of-cross-language-benchmark-games.html) |
[spec](https://www.khronos.org/registry/typedarray/specs/latest/)
- difference is in semantics of indexed properties
- v8 uses unboxed backing stores for such typed arrays
#### Float64Array
- gets 64-bit allocated for each element
### Considerations
- once array is marked as holey it is holey forever
- don't pre-allocate large arrays (`>=100K` elements), instead grow as needed, to avoid them being considered sparse
- do pre-allocate small arrays to correct size to avoid allocations due to resizing
- avoid createing holes, and thus don't delete elements
- don't load uninitialized or deleted elements [watch](http://youtu.be/UJPdhx5zTaw?t=19m30s) |
[slide](http://v8-io12.appspot.com/index.html#43)
- use literal initializer for Arrays with mixed values
- don't store non-numeric values in numeric arrays
- causes boxing and efficient code that was generated for manipulating values can no longer be used
- use typed arrays whenever possible especially when performing mathematical operations on an
array of numbers
- copying an array, you should avoid copying from the back (higher indices to lower indices) because this will almost certainly trigger dictionary mode
- avoid elements kind transitions, i.e. edge case of adding `-0, NaN, Infinity` to a SMI array
as they are represented as doubles
## Strings
- string representation and how it maps to each bit
```
map |len |hash|characters
0123|4567|8901|23.........
```
- contain only data (no pointers)
- content not tagged
- immutable except for hashcode field which is lazily computed (at most once)
## Resources
- [video: breaking the javascript speed limit with v8](https://www.youtube.com/watch?v=UJPdhx5zTaw) |
[slides](http://v8-io12.appspot.com/index.html#1)
- [tour of v8: garbage collection - 2013](http://jayconrod.com/posts/55/a-tour-of-v8-garbage-collection)
- [tour of v8: object representation - 2013](http://jayconrod.com/posts/52/a-tour-of-v8-object-representation)
- [v8-design](https://developers.google.com/v8/design#garb_coll)
- [Fast Properties in V8 - 2017](https://v8.dev/blog/fast-properties)
- [“Elements kinds” in V8 - 2017](https://v8.dev/blog/elements-kinds)
================================================
FILE: crankshaft/gc.md
================================================
**Table of Contents** *generated with [DocToc](http://doctoc.herokuapp.com/)*
- [v8 Garbage Collector](#v8-garbage-collector)
- [Goals, Techniques](#goals-techniques)
- [Cost of Allocating Memory](#cost-of-allocating-memory)
- [How objects are determined to be dead](#how-objects-are-determined-to-be-dead)
- [Two Generations](#two-generations)
- [Heap Organization in Detail](#heap-organization-in-detail)
- [New Space](#new-space)
- [Old Pointer Space](#old-pointer-space)
- [Old Data Space](#old-data-space)
- [Large Object Space](#large-object-space)
- [Code Space](#code-space)
- [Cell Space, Property Cell Space, Map Space](#cell-space-property-cell-space-map-space)
- [Pages](#pages)
- [Young Generation](#young-generation)
- [ToSpace, FromSpace, Memory Exhaustion](#tospace-fromspace-memory-exhaustion)
- [Sample Scavenge Scenario](#sample-scavenge-scenario)
- [Collection to free ToSpace](#collection-to-free-tospace)
- [Write Barriers](#write-barriers)
- [Write Barrier Crankshaft Optimizations](#write-barrier-crankshaft-optimizations)
- [Considerations](#considerations)
- [Old Generation](#old-generation)
- [Collection Steps](#collection-steps)
- [Mark Sweep and Mark Compact](#mark-sweep-and-mark-compact)
- [Mark](#mark)
- [Marking State](#marking-state)
- [Depth-First Search](#depth-first-search)
- [Handling Deque Overflow](#handling-deque-overflow)
- [Sweep and Compact](#sweep-and-compact)
- [Sweep](#sweep)
- [Compact](#compact)
- [Incremental Mark and Lazy Sweep](#incremental-mark-and-lazy-sweep)
- [Incremental Marking](#incremental-marking)
- [Lazy Sweeping](#lazy-sweeping)
- [Causes For GC Pause](#causes-for-gc-pause)
- [Resources](#resources)
# v8 Garbage Collector
## Goals, Techniques
- ensures fast object allocation, short garbage collection pauses and no memory fragmentation
- **stop-the-world**,
[generational](http://www.memorymanagement.org/glossary/g.html#term-generational-garbage-collection) accurate garbage collector
- stops program execution when performing garbage collections cycle
- processes only part of the object heap in most garbage collection cycles to minimize impact of above
- wraps objects in `Handle`s in order to track objects in memory even if they get moved (i.e. due to being promoted)
- identifies dead sections of memory
- GC can quickly scan [tagged words](data-types.md#efficiently-representing-values-and-tagging)
- follows pointers and ignores SMIs and *data only* types like strings
## Cost of Allocating Memory
[watch](http://youtu.be/VhpdsjBUS3g?t=10m54s)
- cheap to allocate memory
- expensive to collect when memory pool is exausted
## How objects are determined to be dead
*an object is live if it is reachable through some chain of pointers from an object which is live by definition,
everything else is garbage*
- considered dead when object is unreachable from a root node
- i.e. not referenced by a root node or another live object
- global objects are roots (always accessible)
- objects pointed to by local variables are roots (stack is scanned for roots)
- DOM elements are roots (may be weakly referenced)
## Two Generations
[watch](http://youtu.be/VhpdsjBUS3g?t=11m24s)
- object heap segmented into two parts (well kind of, [see below](#heap-organization-in-detail))
- **New Space** in which objects aka **Young Generation** are created
- **Old Space** into which objects that survived a GC cycle aka **Old Generation** are promoted
## Heap Organization in Detail
### New Space
- most objects allocated here
- executable `Codes` are always allocated in Old Space
- fast allocation
- simply increase allocation pointer to reserve space for new object
- fast garbage collection
- independent of other spaces
- between 1 and 8 MB
### Old Pointer Space
- contains objects that may have pointers to other objects
- objects surviving **New Space** long enough are moved here
### Old Data Space
- contains *raw data* objects -- **no pointers**
- strings
- boxed numbers
- arrays of unboxed doubles
- objects surviving **New Space** long enough are moved here
### Large Object Space
- objects exceeding size limits of other spaces
- each object gets its own [`mmap`](http://www.memorymanagement.org/glossary/m.html#mmap)d region of memory
- these objects are never moved by GC
### Code Space
- code objects containing JITed instructions
- only space with executable memory with the exception of **Large Object Space**
### Cell Space, Property Cell Space, Map Space
- each of these specialized spaces places constraints on size and the type of objects they point to
- simplifies collection
### Pages
- each space divided into set of pages
- page is **contiguous** chunk of memory allocated via `mmap`
- page is 1MB in size and 1MB aligned
- exception **Large Object Space** where page can be larger
- page contains header
- flags and meta-data
- marking bitmap to indicate which objects are alive
- page has slots buffer
- allocated in separate memory
- forms list of objects which may point to objects stored on the page aka [*remembered
set*](http://www.memorymanagement.org/glossary/r.html#remembered.set)
## Young Generation
*most performance problems related to young generation collections*
- fast allocation
- fast collection performed frequently via [stop and
copy](http://www.memorymanagement.org/glossary/s.html#term-stop-and-copy-collection) - [two-space
collector](http://www.memorymanagement.org/glossary/t.html#term-two-space-collector)
### ToSpace, FromSpace, Memory Exhaustion
[watch](http://youtu.be/VhpdsjBUS3g?t=13m40s)
- ToSpace is used to allocate values i.e. `new`
- FromSpace is used by GC when collection is triggered
- ToSpace and FromSpace have **exact same size**
- large space overhead (need ToSpace and FromSpace) and therefore only suitable for small **New Space**
- when **New Space** allocation pointer reaches end of **New Space** v8 triggers minor garbage collection cycle
called **scavenge** or [copying garbage
collection](http://www.memorymanagement.org/glossary/c.html#term-copying-garbage-collection)
- scavenge implements [Cheney's algorithm](http://en.wikipedia.org/wiki/Cheney's_algorithm)
- [more details](http://jayconrod.com/posts/55/a-tour-of-v8-garbage-collection) *Generational collection* section
#### Sample Scavenge Scenario
ToSpace starts as unallocated memory.
- alloc A, B, C, D
```
| A | B | C | D | unallocated |
```
- alloc E (not enough space - exhausted **Young Generation** memory)
- triggers collection which blocks the main thread
##### Collection to free ToSpace
- swap labels of FromSpace and ToSpace
- as a result the empty (previous) FromSpace is now the ToSpace
- objects on FromSpace are determined to be live or dead
- dead ones are collected
- live ones are marked and copied (expensive) out of From Space and either
- moved to ToSpace and compacted in the process to improve cache locality
- promoted to Old Space
- assuming B and D were dead
```
| A | C | unallocated |
```
- now we can allocate E
#### Write Barriers
[read](http://jayconrod.com/posts/55/a-tour-of-v8-garbage-collection) *Write barriers: the secret ingredient*
[barrier](http://www.memorymanagement.org/glossary/b.html#term-barrier-1) | [write
barrier](http://www.memorymanagement.org/glossary/w.html#term-write-barrier) | [read
barrier](http://www.memorymanagement.org/glossary/r.html#term-read-barrier)
**Problem**: how does GC know an object in **New Space** is alive if it is only pointed to from an object in **Old Space** without
scanning **Old Space** all the time?
- *store buffer* maintains list of pointers from **Old Space** to **New Space**
- on new allocation of object, no other object points to it
- when pointer of object in **New Space** is written to field of object in **Old Space**, record location of that field in store
buffer
- above is archieved via a *write barrier* which is a bit of code that detects and records these pointers
- *write barriers* are expensive, but don't act as often (writes are less frequent than reads)
##### Write Barrier Crankshaft Optimizations
- most execution time spent in optimized code
- crankshaft may statically prove object is in New Space and thus write barriers can be omitted for them
- crankshaft allocates objects on stack when only local references to them exist -> no write barriers for stack
- `old->new` pointers are rare, so optimizing for detecting `new->new` and `old->old` pointers quickly
- since pages are aligned on 1 MB boundary object's page is found quickly by masking off the low 20 bits of its address
- page headers have flags indicating which space they are in
- above allows checking which space object is in with a few instructions
- once `old->new` pointer is found, record location of it at end of store buffer
- *store buffer* entries are sorted and deduped periodically and entries no longer pointing to **New Space** are removed
#### Considerations
[watch](http://youtu.be/VhpdsjBUS3g?t=15m30s)
- every allocation brings us closer to GC pause
- **collection pauses our app**
- try to pre-alloc as much as possible ahead of time
## Old Generation
- fast alloc
- slow collection performed infrequently
- `~20%` of objects survive into **Old Generation**
### Collection Steps
[watch](http://youtu.be/VhpdsjBUS3g?t=12m30s)
- parts of collection run concurrent with mutator, i.e. runs on same thread our JavaScript is executed on
- [incremental marking/collection](http://www.memorymanagement.org/glossary/i.html#term-incremental-garbage-collection)
- [mark-sweep](http://www.memorymanagement.org/glossary/m.html#term-mark-sweep): return memory to system
- [mark-compact](http://www.memorymanagement.org/glossary/m.html#term-mark-compact): move values
### Mark Sweep and Mark Compact
[read](http://jayconrod.com/posts/55/a-tour-of-v8-garbage-collection) *Mark-sweep and Mark-compact*
- used to collect **Old Space** which may contain +100 MB of data
- scavenge impractical for more than a few MBs
- two phases
- Mark
- Sweep or Compact
#### Mark
- all objects on heap are discovered and marked
- objects can start at any *word aligned* offset in page and are at least two words long
- each page contains marking bitmap (one bit per allocatable word)
- results in memory overhead `3.1% on 32-bit, 1.6% on 64-bit systems`
- when marking completes all objects are either considered dead *white* or alive *black*
- that info is used during sweeping or compacting phase
#### Marking State
- pairs of bits represent object's *marking state*
- **white**: not yet discovered by GC
- **grey**: discovered, but not all of its neighbors were processed yet
- **black**: discovered and all of its neighbors were processed
- **marking deque**: separately allocated buffer used to store objects being processed
##### Depth-First Search
- starts with clear marking bitmap and all *white* objects
- objects reachable from roots become *grey* and pushed onto *marking deque*
- at each step GC pops object from *marking deque*, marks it *black*
- then marks it's neighboring *white* objects *grey* and pushes them onto *marking deque*
- exit condition: *marking deque* is empty and all discovered objects are *black*
#### Handling Deque Overflow
- large objects i.e. long arrays may be processed in pieces to avoid **deque** overflow
- if *deque* overflows, objects are still marked *grey*, but not pushed onto it
- when *deque* is empty again GC scans heap for *grey* objects, pushes them back onto *deque* and resumes marking
#### Sweep and Compact
- both work at **v8** page level == 1MB contiguous chunks (different from [virtual memory
pages](http://www.memorymanagement.org/glossary/p.html#page))
#### Sweep
- iterates across page's *marking bitmap* to find ranges of unmarked objects
- scans for contiguous ranges of dead objects
- converts them to free spaces
- adds them to free list
- each page maintains separate free lists
- for small regions `< 256 words`
- for medium regions `< 2048 words`
- for large regions `< 16384 words`
- used by scavenge algorithm for promoting surviving objects to **Old Space**
- used by compacting algorithm to relocate objects
#### Compact
[read](http://jayconrod.com/posts/55/a-tour-of-v8-garbage-collection) *Mark-sweep and Mark-compact*
last paragraph
- reduces actual memory usage by migrating objects from fragmented pages to free spaces on other pages
- new pages may be allocated
- evacuated pages are released back to OS
### Incremental Mark and Lazy Sweep
[read](http://jayconrod.com/posts/55/a-tour-of-v8-garbage-collection) *Incremental marking and lazy sweeping*
#### Incremental Marking
- algorithm similar to regular marking
- allows heap to be marked in series of small pauses `5-10ms` each (vs. `500-1000ms` before)
- activates when heap reaches certain threshold size
- when active an incremental marking step is performed on each memory allocation
#### Lazy Sweeping
- occurs after each incremental marking
- at this point heap knows exactly how much memory could be freed
- may be ok to delay sweeping, so actual page sweeps happen on *as-needed* basis
- GC cycle is complete when all pages have been swept at which point incremental marking starts again
## Causes For GC Pause
[watch](http://youtu.be/VhpdsjBUS3g?t=16m30s)
- calling `new` a lot and keeping references to created objects for longer than necessary
- client side **never `new` within a frame**
[watch](http://youtu.be/VhpdsjBUS3g?t=17m15s)
- running unoptimized code
- causes memory allocation for implicit/immediate results of calculations even when not assigned
- if it was optimized, only for final results gets memory allocated (intermediates stay in registers? -- todo confirm)
## Resources
- [video: accelerating oz with v8](https://www.youtube.com/watch?v=VhpdsjBUS3g) |
[slides](http://commondatastorage.googleapis.com/io-2013/presentations/223.pdf)
- [v8-design](https://developers.google.com/v8/design#garb_coll)
- [tour of v8: garbage collection - 2013](http://jayconrod.com/posts/55/a-tour-of-v8-garbage-collection)
- [memory management reference](http://www.memorymanagement.org/)
================================================
FILE: crankshaft/memory-profiling.md
================================================
**Table of Contents** *generated with [DocToc](http://doctoc.herokuapp.com/)*
- [Theory](#theory)
- [Objects](#objects)
- [Shallow size](#shallow-size)
- [Retained size](#retained-size)
- [GC roots](#gc-roots)
- [Storage](#storage)
- [Object Groups](#object-groups)
- [Retainers](#retainers)
- [Dominators](#dominators)
- [Causes for Leaks](#causes-for-leaks)
- [Tools](#tools)
- [DevTools Timeline](#devtools-timeline)
- [Drilling into Events](#drilling-into-events)
- [DevTools Heap Profiler](#devtools-heap-profiler)
- [Collecting a HeapDump for a Node.js app](#collecting-a-heapdump-for-a-nodejs-app)
- [Ensuring GC](#ensuring-gc)
- [Considerations to make code easier to debug](#considerations-to-make-code-easier-to-debug)
- [Name your function declarations](#name-your-function-declarations)
- [Views](#views)
- [Color Coding](#color-coding)
- [Summary View](#summary-view)
- [Limiting included Objects](#limiting-included-objects)
- [Comparison View](#comparison-view)
- [Advanced Comparison Technique](#advanced-comparison-technique)
- [Object Allocation Tracker](#object-allocation-tracker)
- [Allocation Stack](#allocation-stack)
- [Containment View](#containment-view)
- [Entry Points](#entry-points)
- [Dominators View](#dominators-view)
- [Retainer View](#retainer-view)
- [Constructors listed in Views](#constructors-listed-in-views)
- [Closures](#closures)
- [Resources](#resources)
- [blogs/tutorials](#blogstutorials)
- [videos](#videos)
- [slides](#slides)
## Theory
### Objects
[read](https://developer.chrome.com/devtools/docs/javascript-memory-profiling#object-sizes)
[read](https://developer.chrome.com/devtools/docs/memory-analysis-101#object_sizes)
#### Shallow size
- memory held by object **itself**
- arrays and strings may have significant shallow size
#### Retained size
- memory that is freed once object itself is deleted due to it becoming unreachable from *GC roots*
- held by object *implicitly*
##### GC roots
- made up of *handles* that are created when making a reference from native code to a JS object ouside of v8
- found in heap snapshot under **GC roots > Handle scope** and **GC roots > Global handles**
- internal GC roots are window global object and DOM tree
#### Storage
[read](https://developer.chrome.com/devtools/docs/javascript-memory-profiling#javascript-object-representation)
[read](https://github.com/thlorenz/v8-perf/blob/master/data-types.md)
- primitives are leafs or terminating nodes
- strings stored in *VM heap* or externally (accessible via *wrapper object*)
- *VM heap* is heap dedicated to JS objects and managed byt v8 gargabe collector
- *native objects* stored outside of *VM heap*, not managed by v8 garbage collector and are accessed via JS *wrapper
object*
- *cons string* object created by concatenating strings, consists of pairs of strings that are only joined as needed
- *arrays* objects with numeric keys, used to store large amount of data, i.e. hashtables (key-value-pair sets) are
backed by arrays
- *map* object describing object kind and layout
#### Object Groups
[read](https://developer.chrome.com/devtools/docs/javascript-memory-profiling#object-groups)
- *native objects* group is made up from objects holding mutual references to each other
- not represented in JS heap -> have zero size
- wrapper objects created instead, each holding reference to corresponding *native object*
- object group holds wrapper objects creating a cycle
- GC releases object groups whose wrapper objects aren't referenced, but holding on to single wrapper will hold whole
group of associated wrappers
### Retainers
[read](https://developer.chrome.com/devtools/docs/javascript-memory-profiling#objects-retaining-tree)
[read](https://developer.chrome.com/devtools/docs/memory-analysis-101#retaining_paths)
- shown at the bottom inside heap snapshots UI
- *nodes/objects* labelled by name of constructor function used to build them
- *edges* labelled using property names
- *retaining path* is any path from *GC roots* to an object, if such a path doesn't exist the object is *unreachable*
and subject to being garbage collected
### Dominators
[read](https://developer.chrome.com/devtools/docs/javascript-memory-profiling#dominators)
[read](https://en.wikipedia.org/wiki/Dominator_(graph_theory))
[read](https://developer.chrome.com/devtools/docs/memory-analysis-101#dominators)
- can be seen in [**Dominators** view](#dominators-view)
- tree structure in which each object has **one** dominator
- if *dominator* is deleted the *dominated* node is no longer reachable from *GC root*
- node **d** dominates a node **n** if every path from the start node to **n** must go through **d**
### Causes for Leaks
[read](http://addyosmani.com/blog/taming-the-unicorn-easing-javascript-memory-profiling-in-devtools/) *Understanding the Unicorn*
- logical errors in JS that keep references to objects that aren't needed anymore
- number one error: event listeners that haven't been cleaned up correctly
- this causes an object to be considered live by the GC and thus prevents it from being reclaimed
## Tools
### DevTools Timeline
[read](https://developer.chrome.com/devtools/docs/javascript-memory-profiling#identifying-a-memory-problem-with-the-devtools-timeline)
- not available to use with Node.js ATM

- memory usage overview over time
- can be used to identify memory leaks and/or performance bottlenecks caused by a *busy* garbage collector
- top band shows events over time that caused memory usage to be affected
- **Records** shows these events in detail and allows drilling into them to see a stack trace
- GC events are included as well (not shown in the picture)
- **Memory** shows memory usages colored coded
- **Details** (on the right) shows how long each event or each separate function call took
##### Drilling into Events

### DevTools Heap Profiler

[read](https://developer.chrome.com/devtools/docs/javascript-memory-profiling#heap-profiler)
#### Collecting a HeapDump for a Node.js app
- the [heapdump](https://github.com/bnoordhuis/node-heapdump) module supports Node.js `v0.6-v0.10`
- `require('heapdump')` in your module and cause it to write a heap snapshot via `kill -USR2 `
- before a heap dump is taken, v8 [performs two GC
cycles](https://github.com/v8/v8/blob/21f01f64c420fffdb917c9890d03f1eb0c2c1ede/src/heap-snapshot-generator.cc#L2594-L2599)
(also for [Node.js
`v0.10`](https://github.com/joyent/node/blob/v0.10.29-release/deps/v8/src/profile-generator.cc#L3091-L3096))in order
to remove collectable objects
- objects in the resulting heapdump are still referenced and thus couldn't be garbage collected
##### Ensuring GC
Although as mentioned above before a heapdump is taken all garbage is collected, I found that manually triggering
garbage collection and forcing the GC to compact yields better results. The reason for this is unclear to me.
Add the below snippet to your code which will only activate if you are exposing the garbage collector:
```js
// shortest
if (typeof gc === 'function') setTimeout(gc, 1000);
// longer in order to see indicators of gc being performed
if (typeof gc === 'function') {
setTimeout(function doGC() { gc(); process.stdout.write(' gc ') }, 1000);
}
```
Then run your app with the appropriate flags to expose the gc and force compaction.
```
node --always-compact --expose-gc app.js
```
Now you can wait for the garbage collection to occur and take a heapdump right after.
Alternatively you can add a hook to your app, i.e. a route, that will trigger manual `gc` and invoke that before taking
a heapdump.
#### Considerations to make code easier to debug
The usefulness of the information presented in the below views depends on how you authored your code. Here are a few
rules to make your code more debuggable.
###### Name your function declarations
This requires little extra effort but makes is so much easier to track down which function is closing over an object and
thus prevents it from being collected. Unfortunately CoffeeScript generates JS that has unnamed functions due to a bug
in older Internet Explorers.
The below does **not** show as `foo` in the snapshot:
```js
var foo = function () {
[..]
}
```
This one will:
```js
var foo = function foo() {
[..]
}
```
This one as well:
```js
function foo() {
[..]
}
```
#### Views
[overview](https://developer.chrome.com/devtools/docs/heap-profiling#basics)
##### Color Coding
[read](https://developer.chrome.com/devtools/docs/javascript-memory-profiling#looking-up-color-coding)
Properties and values are colored according to their types.
- *a:property* regular propertye, i.e. `foo.bar`
- *0:element* numeric index property, i.e. `arr[0]`
- *a:context var* variable in function context, accessible by name from inside function closure
- *a:system prop* added by JS VM and not accessible from JS code, i.e. v8 internal objects
- yellow objects are referenced by JS
- red objects are detached nodes which are referenced by yellow background object
##### Summary View
[read](https://developer.chrome.com/devtools/docs/javascript-memory-profiling#summary-view)
- shows top level entries, a row per constructor
- columns for distance of the object to the *GC root*, number of object instances, shallow size and retained size.
- `@` character is objects’ unique ID, allowing you to compare heap snapshots on per-object basis
###### Limiting included Objects
- to the right of the View selector you can limit the objects by class name i.e. the name of the constructor function
- to the right of the class filter you can choose which objects to include in your summary (defaults to all)
- select *objects allocated between heapdump 1 and heapdump 2* to identify objects that are still around in *heapdump
3* but shouldn't be
- another way to archieve similar results is by comparing two heapdumps (see below)
##### Comparison View
- compares multiple snapshots to each other
- shows diff of both and delta in ref counts and freed and newly allocated memory
- used to find leaked objects
- after starting and completing (or canceling) the action, no garbage related to that action should be left
- note that garbage is collected each time a snapshot is taken, therefore remaining items are still referenced
1. Take bottom line snapshot
2. Perform operation that might cause a leak
3. Perform reverse operation and/or ensure that action `2` is complete and therefore all objects needed to perform it
should no longer be needed
4. Take second snapshot
5. Compare both snapshots
- select a Snapshot, then *Comparison* on the left and another Snapshot to compare it to on the right
- the *Size Delta* will tell you how much memory couldn't be collected

###### Advanced Comparison Technique
[slides](https://speakerdeck.com/addyosmani/javascript-memory-management-masterclass?slide=102)
Use at least three snapshots and compare those.
1. Take bottom line snapshot *Checkpoint 1*
2. Perform operation that might cause a leak
3. Take snapshot *Checkpoint 2*
4. Perform same operation as in *2.*
5. Take snapshot *Checkpoint 3*
- all memory needed to perform action the first time should have been collected by now
- any objects allocated between *Checkpoint 1* and *Checkpoint 2* should be no longer present in *Checkpoint 3*
- select *Snapshot 3* and from the dropdown on the right select *Objects allocated between Snapshot 1 and 2*
- ideally you see no *Objects* that are created by your application (ignore memory that is unrelated to your action,
i.e. *(compiled code)*)
- if you see any *Objects* that shouldn't be there but are in doubt create a 4th snapshot and select *Objects allocated
between Snapshot 1 and 2* as shown in the picture below

##### Object Allocation Tracker
[watch](http://youtu.be/LaxbdIyBkL0?t=50m33s)
- **not supported by Node.js** ATM
- now **preferred over snapshot comparisons** especially to track down memory leaks
- *blue* bars show memory allocations
- *grey* bars show memory deallocations
###### Allocation Stack
[slides](https://speakerdeck.com/addyosmani/javascript-memory-management-masterclass?slide=102)
[watch](http://youtu.be/LaxbdIyBkL0?t=51m30s)
- only available when using *Object Allocation Tracker*
- needs to be enabled in settings *General/Profiler/Record heap allocation stack traces*
- shows stack traces of executed code that led to the object being allocated

##### Containment View
[read](https://developer.chrome.com/devtools/docs/javascript-memory-profiling#containment-view)
- birds eye view of apps object structure
- low level, allows peeking inside function closures and look at VM internal objects
- used to determine what keeps objects from being collected
###### Entry Points
- *GC roots* actual GC roots used by garbage collector
- *DOMWindow objects* (not present when profiling Node.js apps)
- *Native objects* (not present when profiling Node.js apps)
Additional entry points only present when profiling a Node.js app:
- *1::* global object
- *2::* global object
- *[4] Buffer* reference to Node.js Buffers
##### Dominators View
[read](https://developer.chrome.com/devtools/docs/javascript-memory-profiling#dominators-view)
- only available once *Settings/General/Profiler/Show advanced heap snapshot properties* is checked and browser
refreshed afterwards
- shows dominators tree of heap
- similar to containment view but lacks property names since dominator may not have direct reference to all objects it
dominates
- useful to identify memory accumulation points
- also used to ensure that objects are well contained instead of hanging around due to GC not working properly
##### Retainer View
- always shown at bottom of the UI
- displays retaining tree of currently selected object
- retaining tree has references going outward, i.e. inner item references outer item
#### Constructors listed in Views
[read](https://developer.chrome.com/devtools/docs/javascript-memory-profiling#memory-profiling-faq)
- *(global property)* intermediate object between global object and an object refereced by it
- *(roots)* root entries in retaining view are entities that reference the selected object
- *(closure)* count of references to a group of objects through function closures
- *(array, string, number, regexp)* list of object types with properties which reference an Array, String, Number or
regular expression
- *(compiled code)* *SharedFunctionInfos* have no context and standibetween functions that do have context
- *(system)* references to builtin functions mainly `Map` (TODO: confirm and more details)
##### Closures
[read](http://zetafleet.com/blog/google-chromes-heap-profiler-and-memory-timeline)
- source of unintentional memory retention
- v8 will not clean up **any** memory of a closure untiil **all** members of the closure have gone out of scope
- therefore they should be used sparingly to avoid unnecessary [semantic
garbage](https://en.wikipedia.org/wiki/Garbage_(computer_science))
## Resources
### blogs/tutorials
Keep in mind that most of these are someehwat out of date albeit still useful.
- [chrome-docs memory profiling](https://developer.chrome.com/devtools/docs/javascript-memory-profiling)
- [related demos](https://developer.chrome.com/devtools/docs/javascript-memory-profiling#supporting-demos) including [more resources](https://developer.chrome.com/devtools/docs/javascript-memory-profiling#community-resources)
- [chrome-docs Memory Analysis 101](https://developer.chrome.com/devtools/docs/memory-analysis-101) overlaps with chrome-docs memory profiling
- [chrome-docs heap profiling](https://developer.chrome.com/devtools/docs/heap-profiling) overlaps with chrome-docs memory profiling
- [Chasing Leaks With The Chrome DevTools Heap Profiler Views](https://plus.google.com/+AddyOsmani/posts/D3296iL3ZRE)
- [heap profiler in chrome dev tools](http://rein.pk/using-the-heap-profiler-in-chrome-dev-tools/)
- [performance-optimisation-with-timeline-profiles](http://addyosmani.com/blog/performance-optimisation-with-timeline-profiles/) time line data cannot be pulled out of a Node.js app currently, therfore skipping this for now
- [timeline and heap profiler](http://zetafleet.com/blog/google-chromes-heap-profiler-and-memory-timeline)
- [chromium blog](http://blog.chromium.org/2011/05/chrome-developer-tools-put-javascript.html)
- [Easing JavaScript Memory Profiling In Chrome DevTools](http://addyosmani.com/blog/taming-the-unicorn-easing-javascript-memory-profiling-in-devtools/)
- [Effectively Managing Memory at Gmail scale](http://www.html5rocks.com/en/tutorials/memory/effectivemanagement/)
- [javascript memory management masterclass](https://speakerdeck.com/addyosmani/javascript-memory-management-masterclass)
- [fixing memory leaks in drupal's editor](https://www.drupal.org/node/2159965)
- [writing fast memory efficient javascript](http://www.smashingmagazine.com/2012/11/05/writing-fast-memory-efficient-javascript/)
- [imgur avoiding a memory leak situation in JS](http://imgur.com/blog/2013/04/30/tech-tuesday-avoiding-a-memory-leak-situation-in-js/)
### videos
- [The Breakpoint Ep8: Memory Profiling with Chrome DevTools](https://www.youtube.com/watch?v=L3ugr9BJqIs)
- [Google I/O 2013 - A Trip Down Memory Lane with Gmail and DevTools](https://www.youtube.com/watch?v=x9Jlu_h_Lyw#t=1448)
### slides
- [Finding and debugging memory leaks in JavaScript with Chrome DevTools](http://www.slideshare.net/gonzaloruizdevilla/finding-and-debugging-memory-leaks-in-javascript-with-chrome-devtools)
- [eliminating memory leaks in Gmail](https://docs.google.com/presentation/d/1wUVmf78gG-ra5aOxvTfYdiLkdGaR9OhXRnOlIcEmu2s/pub?start=false&loop=false&delayms=3000#slide=id.g1d65bdf6_0_0)
================================================
FILE: crankshaft/performance-profiling.md
================================================
**Table of Contents** *generated with [DocToc](http://doctoc.herokuapp.com/)*
- [General Strategies to track and improve Performance](#general-strategies-to-track-and-improve-performance)
- [Identify and Understand Performance Problem](#identify-and-understand-performance-problem)
- [Sampling CPU Profilers](#sampling-cpu-profilers)
- [Structural CPU Profilers](#structural-cpu-profilers)
- [Instrumentation Techniques](#instrumentation-techniques)
- [Instrumenting vs. Sampling](#instrumenting-vs-sampling)
- [Plan for Performance](#plan-for-performance)
- [Animation Frame](#animation-frame)
- [v8 Performance Profiling](#v8-performance-profiling)
- [Chrome Devtools Profiler](#chrome-devtools-profiler)
- [Chrome Tracing aka chrome://tracing](#chrome-tracing-aka-chrometracing)
- [Preparation](#preparation)
- [Running](#running)
- [Evaluation](#evaluation)
- [Filter for Signal](#filter-for-signal)
- [Inspect](#inspect)
- [Resources](#resources)
- [v8 tools](#v8-tools)
- [Using Chrome](#using-chrome)
- [v8 timeline](#v8-timeline)
- [Capturing](#capturing)
- [Analyzing](#analyzing)
- [Top Band](#top-band)
- [Middle Band](#middle-band)
- [Bottom Graph](#bottom-graph)
- [Finding Slow Running Unoptimized Functions](#finding-slow-running-unoptimized-functions)
- [d8](#d8)
- [Determining why a Function was not Optimized](#determining-why-a-function-was-not-optimized)
- [d8](#d8-1)
- [Improvments](#improvments)
- [Resources](#resources-1)
# General Strategies to track and improve Performance
## Identify and Understand Performance Problem
[watch](http://youtu.be/UJPdhx5zTaw?t=40m1s) | [slide](http://v8-io12.appspot.com/index.html#83)
[watch profiling workflow](https://www.youtube.com/watch?v=nxXkquTPng8&feature=share&t=40m50s)
Analyse performance only once you have a problem in a top down manner like so:
- ensure it's JavaScript and not the DOM
- reduce testcase to pure JavaScript and run in `v8` shell
- collect metrics and locate bottlenecks
- sample profiling to narrow down the general problem area
- at this point think about the algorithm, data structures, techniques, etc. used in this area and evaluate if
improvements in this area are possible since that will most likely yield greater impact than any of the more fine
grained improvments
- structural profiling to isolate the exact area i.e. function in which most time is spent
- evaluate what can be improved here again thinking about algorithm first
- *only once* algorithm and data structures seem optimal evaluate how the code structure affects assembly code generated by v8 and
possible optimizations (small functions, `try/catch`, closures, loops vs. `forEach`, etc.)
- optimize slowest section of code and repeat structural profiling
## Sampling CPU Profilers
[watch](https://www.youtube.com/watch?v=nxXkquTPng8&feature=share&t=3m20s)
[watch walkthrough](https://www.youtube.com/watch?v=nxXkquTPng8&feature=share&t=34m00s)
- at fixed frequency program is instantaneously paused *by setting stacksize to 0* and the call stack sampled
- assumes that the sample is representative of workload
- gives no sense fo flow to due gaps between samples
- functions that were inlined by compiler aren't shown
- collect data for longer period of time, sampling every 1ms
- ensure code is exercising the right code paths
## Structural CPU Profilers
[watch](https://www.youtube.com/watch?v=nxXkquTPng8&feature=share&t=7m10s)
[watch walkthrough](https://www.youtube.com/watch?v=nxXkquTPng8&feature=share&t=37m10s)
- functions are instrumented to record entry and exit times
- three data points per function
- **Inclusive Time**: time spent in function *including* its children
- **Exclusive Time**: time spent in function *excluding* its children
- **Call Count**: number of times the function was called
- data points are taken at much higher frequency than sampling
- higher cost than sampling dut to instrumentation
- goal of optimization is to **minimize inclusive time**
- inlined functions retain markers
### Instrumentation Techniques
[watch](https://www.youtube.com/watch?v=nxXkquTPng8&feature=share&t=46m10s)
- think about data being processed
- is one piece of data slower?
- name time ranges based on data
- use variables/properties to dynamically name ranges
## Instrumenting vs. Sampling
[watch](https://www.youtube.com/watch?v=nxXkquTPng8&feature=share&t=10m30s)
```
+--------------------------------------------------------------------------------------------+
| | Sampling | Structural / Instrumenting |
|-----------------------------------+------------------------+-------------------------------|
| Time | Approximate | Exact |
| Invocation count | Approximate | Exact |
| Overhead | Small | High(er) |
| Accuracy | Good - Poor | Good - Poor |
| Extra code / instrumentation | No | Yes |
+--------------------------------------------------------------------------------------------+
```
- need both
- manual instrumentation can reduce overhead
- instrumentation affects performance and may affect behavior
- samples are very accurate, but inaccurate for extacting time
- samping requires no program modification
## Plan for Performance
[watch](https://www.youtube.com/watch?v=nxXkquTPng8&feature=share&t=47m50s)
- each module of app sould have time budget
- sum of modules should be `< 16ms` for smooth client side apps
- track performance daily or per commit in order to catch *budget busters* right away
## Animation Frame
[watch](https://www.youtube.com/watch?v=nxXkquTPng8&feature=share&t=50m00s)
[watch walkthrough](https://www.youtube.com/watch?v=nxXkquTPng8&feature=share&t=52m20s)
- queue up key handlers and execute inside Animation Frame
- optimize for lowest common denominator that your app will run on
- for mobile stay below `8-10ms` since remaining time is needed for chrome to do its work, i.e. render
# v8 Performance Profiling
## Chrome Devtools Profiler
[watch](https://www.youtube.com/watch?v=nxXkquTPng8&feature=share&t=15m00s)
- *Profile Tab -> Start -> Record Sample*
- tree view gives idea of flow (call stack) and allows drilling into tree nodes
- save profiles to load them later i.e. for bug reports
- use [octane benchmark](http://octane-benchmark.googlecode.com/svn/latest/index.html) to experiment with the profiler
## Chrome Tracing aka chrome://tracing
[watch](https://www.youtube.com/watch?v=nxXkquTPng8&feature=share&t=17m55s)
- access at [chrome://tracing](chrome://tracing/)
- hidden feature like [`chrome://memory`](chrome://memory) originally designed *by chrome developers for chrome developers*
- view into guts of what chrome is doing
- timeline of what code is doing framed in larger chrome context
- allows optimizing low level gpu performance
### Preparation
[watch](https://www.youtube.com/watch?v=nxXkquTPng8&feature=share&t=20m10s)
- instrument code
- a) manually add calls to `console.time` and `console.timeEnd` with a unique `name` as argument to mark entry and exit points of an
area in the code
- b) Firefox does automatic instrumentation via Firebug (Chrome's Profiler is sample based, while Firebug's is structural)
- c) use compiler/automatic tool to add calls
- d) use runtime instrumentation, similar to valgrind in C
- instrumentation archieved via trace macros
- can be nested (hierarchy reflected in profiling display)
- when turned off cost at most a few dozen clocks
- when turned on cost a few thousand clocks (0.01ms)
- arguments passed to macro are only computed when macro is enabled
- `time/timeEnd` spam dev tools console (keep it closed)
- in order to easily remove macro in production wrap `time/timeEnd` calls
### Running
[watch](https://www.youtube.com/watch?v=nxXkquTPng8&feature=share&t=24m45s)
- close all other tabs in order to have the least noise caused by other tabs and thus get cleaner samples
- `|Record|` to start recording a trace
- switch to app and interact with it, limit this to 10s as buffer gets large very quickly
- switch back `|Stop Tracing|`
- `|Save| / |Load|` trace
### Evaluation
[watch](https://www.youtube.com/watch?v=nxXkquTPng8&feature=share&t=27m00s)
- data includes lots of noise since each tab/process will include activity from the following pieces:
- IO thread
- renderer thread
- compositor thread
- find pid of your page via [`chrome://memory`](chrome://memory)
#### Filter for Signal
[watch](https://www.youtube.com/watch?v=nxXkquTPng8&feature=share&t=28m35s)
- in order to get nice timeline
- remove unnec. threads and components by selecting only rows with your pid
- filter by categories, v8 and webkit are most relevant for JS profiling
### Inspect
[watch](https://www.youtube.com/watch?v=nxXkquTPng8&feature=share&t=30m00s)
- navigation based on quake keys and is not mouse friendly, although it seems to be improving
```
+---+
| W | zoom in
+---+ +---+ +---+ +---+
| A | pan left | S | zoom out | D | pan right | ? | help (other shortcuts)
+---+ +---+ +---+ +---+
```
### Resources
- [trace-viewer](https://code.google.com/p/trace-viewer/) supports streaming trace data over web sockets
- [trace event format](https://docs.google.com/document/d/1CvAClvFfyA5R-PhYUmn5OOQtYMH4h6I0nSsKchNAySU/edit) JSON format
to allow interfacing with other tools
- [web tracing framework](http://google.github.io/tracing-framework/) an alternative to the built in tracer
- [about:tracing](http://dev.chromium.org/developers/how-tos/trace-event-profiling-tool)
## v8 tools
- ship with v8 source code
- **plot-time-events**: generates `png` showing v8 timeline
- **(mac|linux|windows)-tick-processor**: generates table of functions sorted by time spent in them
## Using Chrome
### v8 timeline
#### Capturing
[watch](http://youtu.be/VhpdsjBUS3g?t=24m26s)
```sh
Chrome --no-sandbox --js-flags="--prof --noprof-lazy --log-timer-events"
[ .. ]
tools/plot-timer-events /chrome/dir/v8.log
```
#### Analyzing
[watch](http://youtu.be/VhpdsjBUS3g?t=25m00s)
##### Top Band
- `v8.GCScavenger` young generation collection
- `v8.Execute` executing JavaScript
- scavenges interrupt script execution
#### Middle Band
- shows code kind
- bright green - optimized
- blue/purple - unoptimized
#### Bottom Graph
- shows pauses
- lots in beginning since scripts are being parsed
- no pauses when running optimized code
- scavenges (top band) correllate with pause time spikes
### Finding Slow Running Unoptimized Functions
[watch](http://youtu.be/VhpdsjBUS3g?t=27m55s)
```sh
Chrome --no-sandbox --js-flags="--prof --noprof-lazy --log-timer-events"
[ .. ]
tools/mac-timer-events /chrome/dir/v8.log
```
[watch](http://youtu.be/UJPdhx5zTaw?t=42m33s) | [slide](http://v8-io12.appspot.com/index.html#88)
- generates table of functions sorted by time spent in them
- includes C++ functions
- `*` indicates optimized functions
- functions without `*` could not be optimized
#### d8
[watch](http://youtu.be/UJPdhx5zTaw?t=40m53s) | [slide](http://v8-io12.appspot.com/index.html#84)
```sh
/v8/out/native/d8 test.js --prof
```
### Determining why a Function was not Optimized
[watch](http://youtu.be/VhpdsjBUS3g?t=29m00s)
[watch](http://youtu.be/UJPdhx5zTaw?t=39m30s) | [slide](http://v8-io12.appspot.com/index.html#81)
```sh
"/Applications/Google Chrome.app/Contents/MacOS/Google Chrome" \
--no-sandbox --js-flags="--trace-deopt --trace-opt-verbose --trace-bailout"
[ . lots of other output. ]
[disabled optimization for xxx, reason: The Reason why function couldn't be optimized]
```
- lots of output which is best piped into file and evaluated
- especially watch out for deoptimized functions with lots of arithmetic operations
#### d8
[watch](http://youtu.be/UJPdhx5zTaw?t=35m12s) | [slide](http://v8-io12.appspot.com/index.html#69)
```sh
d8 --trace-opt
```
Log optimizing compiler bailouts:
[watch](http://youtu.be/UJPdhx5zTaw?t=36m24s) | [slide](http://v8-io12.appspot.com/index.html#73)
```sh
d8 --trace-bailout
```
Log deoptimizations:
[watch](http://youtu.be/UJPdhx5zTaw?t=39m12s) | [slide](http://v8-io12.appspot.com/index.html#80)
```sh
d8 --trace-deopt
```
#### Improvments
- don't use construct that caused function to be deoptimized
- or move all code inside construct into separate function and call it instead
## Resources
- [video: accelerating oz with v8](https://www.youtube.com/watch?v=VhpdsjBUS3g) |
[slides](http://commondatastorage.googleapis.com/io-2013/presentations/223.pdf)
- [video: structural and sampling profiling in google chrome](https://www.youtube.com/watch?v=nxXkquTPng8) |
[slides](https://www.igvita.com/slides/2012/structural-and-sampling-javascript-profiling-in-chrome.pdf)
- [v8 profiler](https://code.google.com/p/v8/wiki/V8Profiler)
- [stackoverflow: how to debug nodejs applications](http://stackoverflow.com/a/16512303/97443)
================================================
FILE: data-types.md
================================================
# Data Types
_find the previous version of this document at
[crankshaft/data-types.md](crankshaft/data-types.md)_
**Table of Contents** *generated with [DocToc](https://github.com/thlorenz/doctoc)*
- [Efficiently Representing Values and Tagging](#efficiently-representing-values-and-tagging)
- [Considerations](#considerations)
- [Objects](#objects)
- [Structure](#structure)
- [Object Properties](#object-properties)
- [Hash Tables](#hash-tables)
- [HashTables and Hash Codes](#hashtables-and-hash-codes)
- [Resources](#resources)
- [Fast, In-Object Properties](#fast-in-object-properties)
- [Assigning Properties inside Constructor Call](#assigning-properties-inside-constructor-call)
- [Assigning More Properties Later](#assigning-more-properties-later)
- [Assigning Same Properties in Different Order](#assigning-same-properties-in-different-order)
- [In-object Slack Tracking](#in-object-slack-tracking)
- [Methods And Prototypes](#methods-and-prototypes)
- [Assigning Functions to Properties](#assigning-functions-to-properties)
- [Assigning Functions to Prototypes](#assigning-functions-to-prototypes)
- [Numbered Properties](#numbered-properties)
- [Arrays](#arrays)
- [Fast Elements](#fast-elements)
- [Dictionary Elements](#dictionary-elements)
- [Packed vs. Holey Elements](#packed-vs-holey-elements)
- [Elements Kinds](#elements-kinds)
- [Elements Kind Lattice](#elements-kind-lattice)
- [Double Array Unboxing](#double-array-unboxing)
- [Typed Arrays](#typed-arrays)
- [Float64Array](#float64array)
- [Considerations](#considerations-1)
- [Strings](#strings)
- [Resources](#resources-1)
## Efficiently Representing Values and Tagging
[watch](https://youtu.be/UJPdhx5zTaw?t=15m35s) | [slide](http://v8-io12.appspot.com/index.html#34)
[read](http://jayconrod.com/posts/52/a-tour-of-v8-object-representation) *Numbered properties: fast elements*
- most objects in heap are 4-byte aligned
- according to spec all numbers in JS are 64-bit floating doubles
- V8 passes around 32-bit numbers to represent all values for improved efficiency
- bottom bit reserved as tag to signify if value is a Smi (small integer) or a pointer to an object
[watch](https://youtu.be/UJPdhx5zTaw?t=10m05ss) | [slide](http://v8-io12.appspot.com/index.html#35)
```
| object pointer | 1 |
or
| 31-bit-signed integer (Smi) | 0 |
```
- numbers bigger than 31 bits are boxed
- stored inside an object referenced via a pointer
- adds extra overhead (at a minimum an extra lookup)
- on 64 bit architectures Smis are `32-bit-signed` instead of the `31-bit-signed` on 32 bit
architectures
### Considerations
- prefer Smis for numeric values whenever possible
## Objects
### Structure
```
+-------------------+
| Object | +----> +------------------+ +----> +------------------+
|-------------------| | | FixedArray | | | FixedArray |
| Map | | |------------------| | |------------------|
|-------------------| | | Map | | | Map |
| Extra Properties |----+ |------------------| | |------------------|
|-------------------| | Length | | | Length |
| Elements |------+ |------------------| | |------------------|
|-------------------| | | Property "poo" | | | Property "0" |
| Property "foo" | | |------------------| | |------------------|
|-------------------| | | Property "baz" | | | Property "1" |
| Property "bar" | | +__________________+ | +__________________+
+___________________+ | |
| |
| |
+-----------------------------+
```
- above shows most common optimized representation
- most objects contain all their properties in single block of memory `"foo", "bar"`
- all blocks have a `Map` property describing their structure
- named properties that don't fit are stored in overflow array `"poo", "baz"`
- numbered properties are stored in a separate contiguous array `"1", "2"`
### Object Properties
[read](http://jayconrod.com/posts/52/a-tour-of-v8-object-representation) *Some surprising properties of properties*
- object is a collection of properties aka *key-value pairs*
- property names are **always** strings
- any name used as property name that is not a string is stringified via `.toString()`, **even numbers**, so `1` becomes `"1"`
- **Arrays in JavaScript are just objects** with *magic* `length` property
### Hash Tables
- hash table used for *difficult* objects
- aka objects in *dictionary mode*
- accessing hash table property is much slower than accessing a field at a known offset
- if *non-symbol* string is used to access a property it is *uniquified* first
- V8 hash tables are large arrays containing keys and values
- initially all keys and values are `undefined`
#### HashTables and Hash Codes
- on *key-vaule pair* insertion the key's *hash code* is computed
- computing hash code and comparing keys for equality is commonly a fast operation
- still slow to execute these non-trivial routines on every property read/write
- data structures such as Map, Set, WeakSet and WeakMap use hash tables under the hood
- a _hash function_ returns a _hash code_ for given keys which is used to map them to a
location in the hash table
- hash code is a random number (independent of object value) and thus needs to be stored
- storing the hash code as private symbol on the object, like was done previously, resulted in
a variety of performance problems
- led to slow megamorphic IC lookups of the hash code and
- triggered hidden class transition in the key on storing the hash code
- performance issues were fixed (~500% improvement for Maps and Sets) by _hiding_ the hashcode
and storing it in unused memory space that is _connected_ to the JSObject
- if properties backing store is empty: directly stored in the offset of JSObject
- if properties backing store is array: stored in extranous 21 bits of 31 bits to store array length
- if properties backing store is dictionary: increase dictionary size by 1 word to store hashcode
in dedicated slot at the beginning of the dictionary
### Resources
- [Optimizing hash tables: hiding the hash code - 2018](https://v8.dev/blog/hash-code)
### Fast, In-Object Properties
[read](http://jayconrod.com/posts/52/a-tour-of-v8-object-representation) *Fast, in-object properties* |
[read](https://developers.google.com/v8/design#prop_access)
- V8 describes the structure of objects using maps used to create *hidden classes* and match data types
- resembles a table of descriptors with one entry for each property
- map contains info about size of the object
- map contains info about pointers to constructors and prototypes
- objects with same structure share same map
- objects created by the same constructor and have the **same set of properties assigned in the same order**
- have regular logical structure and therefore regular structure in memory
- share same map
- adding new property is handled via *transition* descriptor
- use existing map
- *transition* descriptor points at other map
#### Assigning Properties inside Constructor Call
```js
class Point {
constructor(x, y) {
// Map M0
// "x": Transition to M1 at offset 12
this.x = x
// Map M1
// "x": Field at offset 12
// "y": Transition to M2 at offset 16
this.y = y
// Map M2
// "x": Field at offset 12
// "y": Field at offset 16
}
}
```
- `Point` starts out without any fields with `M0`
- `this.x =x` -> map pointer set to `M1` and value `x` is stored at offset `12` and `"x" Transition` descriptor added to `M0`
- `this.y =y` -> map pointer set to `M2` and value `y` is stored at offset `16` and `"y" Transition` descriptor added to `M1`
#### Assigning More Properties Later
```js
var p = new Point(1, 2)
// Map M2
// "x": Field at offset 12
// "y": Field at offset 16
// "z": Transition at offset 20
p.z = z
// Map M3
// "x": Field at offset 12
// "y": Field at offset 16
// "z": Field at offset 20
```
- assigning `z` later
- create `M3`, a copy of `M2`
- add `Transition` descriptor to `M2`
- add `Field` descriptor to `M3`
#### Assigning Same Properties in Different Order
```js
class Point {
constructor(x, y, reverse) {
// Map M0
// "x": Transition to M1 at offset 12ak
// "y": Transition to M2 at offset 12
if (reverse) {
// variation 1
// Map M1
// "x": Field at offset 12
// "y": Transition to M4 at offset 16
this.x = x
// Map M4
// "x": Field at offset 12
// "y": Field at offset 16
this.y = y
} else {
// variation 2
// Map M2
// "y": Field at offset 12
// "x": Transition to M5 at offset 16
this.y = x
// Map M5
// "y": Field at offset 12
// "x": Field at offset 16
this.x = y
}
}
}
```
- both variations share `M0` which has two *transitions*
- not all `Point`s share same map
- in worse cases V8 drops object into *dictionary mode* in order to prevent huge number of maps to be allocated
- when assigning random properties to objects from same constructor in random order
- when deleting properties
### In-object Slack Tracking
[read](http://jayconrod.com/posts/52/a-tour-of-v8-object-representation) *In-object slack tracking*
- objects allocated by a constructor are given enough memory for 32 *fast* properties to be stored
- after certain number of objects (8) were allocated from same constructor
- V8 traverses *transition tree* from initial map to determine size of largest of these initial objects
- new objects of same type are allocated with exact amount of memory to store max number of properties
- initial objects are resized (down)
### Methods And Prototypes
[read](http://jayconrod.com/posts/52/a-tour-of-v8-object-representation) *Methods and prototypes*
#### Assigning Functions to Properties
```js
function pointDistance(p) { /* calculates distance */ }
class Point {
constructor(x, y) {
// Map M0
// "x": Transition to M1 at offset 12
this.x = x
// Map M1
// "x": Field at offset 12
// "y": Transition to M2 at offset 16
this.y = y
// Map M2
// "x": Field at offset 12
// "y": Field at offset 16
// "distance": Transition to M3
this.distance = pointDistance
// Map M3
// "x": Field at offset 12
// "y": Field at offset 16
// "distance": Constant_Function
}
}
```
- properties pointing to `Function`s are handled via `constant functions` descriptor
- `constant_function` descriptor indicates that value of property is stored with descriptor itself rather than in the
object
- pointers to functions are directly embedded into optimized code
- if `distance` is reassigned, a new map has to be created since the `Transition` breaks
#### Assigning Functions to Prototypes
```js
class Point {
constructor(x, y) {
this.x = x
this.y = y
}
pointDistance() { /* calculates distance */ }
}
```
- V8 represents prototype methods (aka _class methods_) using `constant_function` descriptors
- calling prototype methods maybe a **tiny** bit slower due to overhead of the following:
- check *receiver's* map (as with *own* properties)
- check maps of *prototype chain* (extra step)
- the above lookup overhead won't make measurable performance difference and **shouldn't impact how you write code**
### Numbered Properties
[read](http://jayconrod.com/posts/52/a-tour-of-v8-object-representation) *Numbered properties: fast elements*
[see Arrays](#arrays)
- numbered properties are treated and ordered differently than others since any object can *behave* like an array
- *element* === any property whose key is non-negative integer
- V8 stores elements separate from named properties in an *elements kind* field (see [structure diagram](#structure))
- if object drops into *dictionary mode* for elements, access to named properties remains fast and vice versa
- maps don't need *transitions* to maps that are identical except for *element kinds*
- most elements are *fast elements* which are stored in a contiguous array
## Arrays
[watch](https://youtu.be/UJPdhx5zTaw?t=17m25s) | [slide](http://v8-io12.appspot.com/index.html#38)
[read](http://jayconrod.com/posts/52/a-tour-of-v8-object-representation) *Numbered properties: fast elements*
[read](https://v8.dev/blog/fast-properties)
- V8 has two methods for storing arrays, *fast elements* and *dictionary elements*
### Fast Elements
[see Numbered Properties](#numbered-properties)
- compact keysets
- linear storage buffer
- contiguous (non-sparse)
- `0` based
- smaller than 64K
### Dictionary Elements
- hash table storage
- slow access
- sparse
- large
#### Packed vs. Holey Elements
- V8 makes distinction whether the elements backing store is packed or has holes
- holes in a backing store are created by deleting an indexed element
- missing properties are marked with special _hole_ value to keep Array functions performant
- however missing properties cause expensive lookups on prototype chain
#### Elements Kinds
[read](https://v8.dev/blog/elements-kinds)
- fast *elements kinds* in order of increasing generality:
- fast Smis (small integers)
- fast doubles (Doubles stored in unboxed representation)
- fast values (strings or other objects)
##### Elements Kind Lattice
```
+--------------------+
| PACKED_SMI_ELEMENT |---+
+--------------------+ | +------------------------+
| +--->| PACKED_DOUBLE_ELEMENTS |---+
↓ +------------------------+ | +-------------------+
+--------------------+ | +--->| PACKED_ELEMENTS |
| HOLEY_SMI_ELEMENTS |---+ ↓ +-------------------+
+--------------------+ | +------------------------+ |
+--->| HOLEY_DOUBLE_ELEMENTS |---+ ↓
+------------------------+ | +-------------------+
+--->| HOLEY_ELEMENTS |
+-------------------+
```
### Double Array Unboxing
[watch](https://youtu.be/UJPdhx5zTaw?t=20m20s) | [slide](http://v8-io12.appspot.com/index.html#45)
- Array's hidden class tracks element types
- if all doubles, array is unboxed aka *upgraded to fast doubles*
- wrapped objects layed out in linear buffer of doubles
- each element slot is 64-bit to hold a double
- Smis that are currently in Array are converted to doubles
- very efficient access
- storing requires no allocation as is the case for boxed doubles
- causes hidden class change
- requires expensive copy-and-convert operation
- careless array manipulation may cause overhead due to boxing/unboxing [watch](https://youtu.be/UJPdhx5zTaw?t=21m50s) |
[slide](http://v8-io12.appspot.com/index.html#47)
### Typed Arrays
[blog](http://mrale.ph/blog/2011/05/12/dangers-of-cross-language-benchmark-games.html) |
[spec](https://www.khronos.org/registry/typedarray/specs/latest/)
- difference is in semantics of indexed properties
- V8 uses unboxed backing stores for such typed arrays
#### Float64Array
- gets 64-bit allocated for each element
### Considerations
- once array is marked as holey it is holey forever
- don't pre-allocate large arrays (`>64K`), instead grow as needed, to avoid them being considered sparse
- do pre-allocate small arrays to correct size to avoid allocations due to resizing
- avoid creating holes, and thus don't delete elements
- don't load uninitialized or deleted elements [watch](https://youtu.be/UJPdhx5zTaw?t=19m30s) |
[slide](http://v8-io12.appspot.com/index.html#43)
- use literal initializer for Arrays with mixed values
- don't store non-numeric values in numeric arrays
- causes boxing and efficient code that was generated for manipulating values can no longer be used
- use typed arrays whenever possible especially when performing mathematical operations on an
array of numbers
- when copying an array, you should avoid copying from the back (higher indices to lower
indices) because this will almost certainly trigger dictionary mode
- avoid elements kind transitions, i.e. edge case of adding `-0, NaN, Infinity` to a Smi array
as they are represented as doubles
## Strings
- string representation and how it maps to each bit
```
map |len |hash|characters
0123|4567|8901|23.........
```
- contain only data (no pointers)
- content not tagged
- immutable except for hashcode field which is lazily computed (at most once)
## Resources
- [video: breaking the javascript speed limit with V8](https://www.youtube.com/watch?v=UJPdhx5zTaw) |
[slides](http://v8-io12.appspot.com/index.html#1)
- [tour of V8: garbage collection - 2013](http://jayconrod.com/posts/55/a-tour-of-v8-garbage-collection)
- [tour of V8: object representation - 2013](http://jayconrod.com/posts/52/a-tour-of-v8-object-representation)
- [V8-design](https://developers.google.com/v8/design#garb_coll)
- [Fast Properties in V8 - 2017](https://v8.dev/blog/fast-properties)
- [“Elements kinds” in V8 - 2017](https://v8.dev/blog/elements-kinds)
- [video: V8 internals for JavaScript developers - 2018](https://www.youtube.com/watch?v=m9cTaYI95Zc)
- [slides: V8 internals for JavaScript developers - 2018](https://slidr.io/mathiasbynens/v8-internals-for-javascript-developers)
================================================
FILE: examples/fibonacci.js
================================================
'use strict'
const PORT = process.env.PORT || 8000
const http = require('http')
const server = http.createServer()
function calArrayConcat(n) {
function toFib(x, y, z) {
return x.concat((z < 2) ? z : x[z - 1] + x[z - 2])
}
const arr = Array.apply(null, new Array(n)).reduce(toFib, [])
const len = arr.length
return arr[len - 1] + arr[len - 2]
}
function calArrayPush(n) {
function toFib(x, y, z) {
x.push((z < 2) ? z : x[z - 1] + x[z - 2])
return x
}
const arr = Array.apply(null, new Array(n)).reduce(toFib, [])
const len = arr.length
return arr[len - 1] + arr[len - 2]
}
function calIterative(n) {
let x = 0
let y = 1
let c = 0
let t
while (c !== n) {
t = x
x = y
y += t
c++
}
return x
}
const METHOD = process.env.METHOD
function onRequest(req, res) {
res.writeHead(200, { 'Content-Type': 'text/plain' })
var n = parseInt(req.url.slice(1))
if (isNaN(n) || n < 0) {
return res.end('Please supply a number larger than 0, i.e. curl localhost:8000/12')
}
let result
switch (METHOD) {
case 'push': result = calArrayPush(n); break
case 'iter': result = calIterative(n); break
default: result = calArrayConcat(n)
}
res.end(`fibonacci of ${n} is ${result}\r\n`)
}
function onListening() {
console.error('HTTP server listening on port', PORT)
}
server
.on('request', onRequest)
.on('listening', onListening)
.listen(PORT)
================================================
FILE: examples/memory-hog.js
================================================
'use strict'
const matrix = []
const TIMEOUT = 2E3
const OUTER_ITER = 1E3
const INNER_ITER = 10
var outer = 2
function minorHog() {
// this is to show that function that allocate less have less width in the allocation profile
const arr = []
for (var i = 0; i < Math.pow(INNER_ITER, outer / 2); i++) {
arr.push(`minor-hog | round: ${outer} | element: ${i}`)
}
matrix.push(arr)
}
function hog() {
const arr = []
for (var i = 0; i < Math.pow(INNER_ITER, outer); i++) {
arr.push(`memory-hog | round: ${outer} | element: ${i}`)
}
matrix.push(arr)
if (++outer < OUTER_ITER) {
setTimeout(hog, TIMEOUT)
setTimeout(minorHog, TIMEOUT / 10)
setTimeout(() => {
// anonymous hog
for (var i = 0; i < Math.pow(INNER_ITER, outer * 0.8); i++) {
arr.push(`anonymous-hog | round: ${outer} | element: ${i}`)
}
matrix.push(arr)
}, TIMEOUT / 5)
} else {
console.log(matrix.length)
}
}
hog()
================================================
FILE: gc.md
================================================
# V8 Garbage Collector
_find the previous version of this document at
[crankshaft/gc.md](crankshaft/gc.md)_
**Table of Contents** *generated with [DocToc](https://github.com/thlorenz/doctoc)*
- [Goals, Techniques](#goals-techniques)
- [Cost of Allocating Memory](#cost-of-allocating-memory)
- [How objects are determined to be dead](#how-objects-are-determined-to-be-dead)
- [Two Generations](#two-generations)
- [Generational Garbage Collector](#generational-garbage-collector)
- [Heap Organization in Detail](#heap-organization-in-detail)
- [New Space aka Young Generation](#new-space-aka-young-generation)
- [Read Only Space](#read-only-space)
- [Old Space](#old-space)
- [Large Object Space](#large-object-space)
- [Code Space](#code-space)
- [Map Space](#map-space)
- [Pages](#pages)
- [Young Generation](#young-generation)
- [ToSpace, FromSpace, Memory Exhaustion](#tospace-fromspace-memory-exhaustion)
- [Sample Scavenge Scenario](#sample-scavenge-scenario)
- [Collection to free ToSpace](#collection-to-free-tospace)
- [Considerations](#considerations)
- [Orinoco Garbage Collector](#orinoco-garbage-collector)
- [Parallel Scavenger](#parallel-scavenger)
- [Scavenger Phases](#scavenger-phases)
- [Distribution of scavenger work across one main thread and two worker threads](#distribution-of-scavenger-work-across-one-main-thread-and-two-worker-threads)
- [Results](#results)
- [Techniques to Improve GC Performance](#techniques-to-improve-gc-performance)
- [Memory Partition and Parallelization](#memory-partition-and-parallelization)
- [Tracking Pointers](#tracking-pointers)
- [Black Allocation](#black-allocation)
- [Resources](#resources)
- [Old Generation Garbage Collector Deep Dive](#old-generation-garbage-collector-deep-dive)
- [Collection Steps](#collection-steps)
- [Mark Sweep and Mark Compact](#mark-sweep-and-mark-compact)
- [Mark](#mark)
- [Marking State](#marking-state)
- [Depth-First Search](#depth-first-search)
- [Handling Deque Overflow](#handling-deque-overflow)
- [Sweep and Compact](#sweep-and-compact)
- [Sweep](#sweep)
- [Compact](#compact)
- [Incremental Mark and Lazy Sweep](#incremental-mark-and-lazy-sweep)
- [Incremental Marking](#incremental-marking)
- [Lazy Sweeping](#lazy-sweeping)
- [Resources](#resources-1)
## Goals, Techniques
- ensures fast object allocation, short garbage collection pauses and no memory fragmentation
- **stop-the-world**,
[generational](http://www.memorymanagement.org/glossary/g.html#term-generational-garbage-collection)
precise garbage collector
- stops program execution when performing steps of young generation garbage collections cycle that can only run
synchronously
- many steps are performed in parallel, see [Orinoco Garbage
Collector](#orinoco-garbage-collector) and only part of the object heap is processed in most
garbage collection cycles to minimize impact on main thread execution
- [mark compact](#mark-sweep-and-mark-compact) is performed
[incrementally](#incremental-mark-and-lazy-sweep) and therefore not _stop-the-world_
- wraps objects in `Handle`s in order to track objects in memory even if they get moved (i.e. due to being promoted)
- identifies dead sections of memory
- GC can quickly scan [tagged words](data-types.md#efficiently-representing-values-and-tagging)
- follows pointers and ignores Smis and *data only* types like strings
## Cost of Allocating Memory
[watch](https://youtu.be/VhpdsjBUS3g?t=10m54s)
- cheap to allocate memory
- expensive to collect when memory pool is exhausted
## How objects are determined to be dead
*an object is live if it is reachable through some chain of pointers from an object which is live by definition,
everything else is garbage*
- considered dead when object is unreachable from a root node
- i.e. not referenced by a root node or another live object
- global objects are roots (always accessible)
- objects pointed to by local variables are roots (stack is scanned for roots)
- DOM element's liveliness is determined via cross-component tracing by tracing from JavaScript
to the C++ implementation of the DOM and back
## Two Generations
[watch](https://youtu.be/VhpdsjBUS3g?t=11m24s)
- object heap segmented into two parts, _Young Generation_ and _Old Generation_
- _Young Generation_ consists of _New Space_ in which new objects are allocated
- _Old Generation_ is divided into multiple parts like _Old Space_, _Map Space_, _Large
Object Space_
- _Old Space_ stores objects that survived enough GC cycles to be promoted to the _Old
Generation_
- for more details [see below](#heap-organization-in-detail)
### Generational Garbage Collector
- two garbage collectors are implemented, each focusing on _young_ and _old_ generation
respectively
- young generation evacuation ([more details](#tospace-fromspace-memory-exhaustion))
- objects initially allocated in _nursery_ of the _young generation_
- objects surviving one GC are copied into _intermediate_ space of the _young generation_
- objects surviving two GCs are moved into _old generation_
```
young generation | old generation
|
nursery | intermediate |
| |
+--------+ | +--------+ | +--------+
| object |---GC--->| object |---GC--->| object |
+--------+ | +--------+ | +--------+
| |
```
## Heap Organization in Detail
### New Space aka Young Generation
- most objects allocated here
- executable `Codes` are always allocated in Old Space
- fast allocation
- simply increase allocation pointer to reserve space for new object
- fast garbage collection
- independent of other spaces
- between 1 and 8 MB
### Read Only Space
- immortal, immovable and immutable objects
### Old Space
- objects surviving _New Space_ long enough are moved here
- may contain pointers to _New Space_
### Large Object Space
- promoted large objects (exceeding size limits of other spaces)
- each object gets its own [`mmap`](http://www.memorymanagement.org/glossary/m.html#mmap)d region of memory
- these objects are never moved by GC
### Code Space
- contains executable code and therefore is marked _executable_
- no pointers to _New Space_
### Map Space
- contains map objects only
### Pages
- each space divided into set of pages
- page is **contiguous** chunk of memory allocated via `mmap`
- page is 512KB in size and 512KB aligned
- exception **Large Object Space** where page can be larger
- page size will most likely decrease in the future
- page contains header
- flags and meta-data
- marking bitmap to indicate which objects are alive
- page has slots buffer
- allocated in separate memory
- forms list of objects which may point to objects stored on the page aka [*remembered
set*](http://www.memorymanagement.org/glossary/r.html#remembered.set)
## Young Generation
*most performance problems related to young generation collections*
- fast allocation
- fast collection performed frequently via [stop and
copy](http://www.memorymanagement.org/glossary/s.html#term-stop-and-copy-collection) - [two-space
collector](http://www.memorymanagement.org/glossary/t.html#term-two-space-collector)
- however some copy operations can run in parallel due to techniques like page isolation, see
[Orinoco Garbage Collector](#orinoco-garbage-collector)
### ToSpace, FromSpace, Memory Exhaustion
[watch](https://youtu.be/VhpdsjBUS3g?t=13m40s) | [code](https://cs.chromium.org/chromium/src/v8/src/heap/spaces.h)
- ToSpace is used to allocate values i.e. `new`
- FromSpace is used by GC when collection is triggered
- ToSpace and FromSpace have **exact same size**
- large space overhead (need ToSpace and FromSpace) and therefore only suitable for small **New Space**
- when **New Space** allocation pointer reaches end of **New Space** V8 triggers minor garbage collection cycle
called **scavenge** or [copying garbage
collection](http://www.memorymanagement.org/glossary/c.html#term-copying-garbage-collection)
- scavenge algorithm similar to the [Halstead semispace copying collector](https://www.cs.cmu.edu/~guyb/papers/gc2001.pdf)
to support parallel processing
- in the past scavenge used to implement [Cheney's algorithm](http://en.wikipedia.org/wiki/Cheney's_algorithm) which is synchronous
- [more details](http://jayconrod.com/posts/55/a-tour-of-v8-garbage-collection) *Generational collection* section
#### Sample Scavenge Scenario
ToSpace starts as unallocated memory.
- alloc A, B, C, D
```
| A | B | C | D | unallocated |
```
- alloc E (not enough space - exhausted **Young Generation** memory)
- triggers collection which partially blocks the main thread
##### Collection to free ToSpace
- swap labels of FromSpace and ToSpace
- as a result the empty (previous) FromSpace is now the ToSpace
- objects on FromSpace are determined to be live or dead
- dead ones are collected
- live ones are marked and copied (expensive) out of From Space and either
- moved to ToSpace, compacted in the process to improve cache locality and considered
_intermediates_ since they survived one GC
- promoted to OldSpace if they were considered _intermediates_
- assuming B and D were dead
```
| A | C | unallocated |
```
- now we can allocate E
#### Considerations
[watch](https://youtu.be/VhpdsjBUS3g?t=15m30s)
- every allocation brings us closer to GC pause
- even though as many steps of collection are performed in parallel and thus average GC pauses
are small (1ms - 10ms) on average
- however **every collection pauses our app**
- avoid referencing short-lived objects longer than necessary, since as long as they die on
the next Scavenge they incurr almost no cost to the GC, but if they need to be copied, they
do
- try to pre-alloc values ahead of time if the are known when your application initializes and
don't change after that, however don't go overboard, i.e. don't sacrifice code quality
## Orinoco Garbage Collector
[watch orinoco overview]([watch](https://youtu.be/EdFDJANJJLs?t=15m10s)) | [jank and concurrent GC](https://youtu.be/HDuSEbLWyOY?t=5m14s) |
[read](https://v8.dev/blog/orinoco)
The Orinioco garbage collector was created in an attempt to lessen the time that our
application stops due to garbage collection by performing as many steps as possible in
parallel.
Numerous techniques like smart paging and use of concurrency friendly algorithms have been used
to both partially parallelize the Old Generation and Young Generation garbage collectors.
- mostly parallel and concurrent garbage collector without _strict_ generational boundaries
- most parts of GC taken off the main thread (56% less GC on main thread)
- optimized weak global handles
- unified heap for full garbage collection
- optimized V8's black allocation additions
- reduced peak memory consumption of on-heap peak memory by up to 40% and off-heap peak memory
by 20% for low-memory devices by tuning several GC heuristics
### Parallel Scavenger
[read](https://v8.dev/blog/orinoco-parallel-scavenger)
- introduced with V8 v6.2 which is part of Node.js V8
- older V8 versions used Cheney semispace copying garbage collector that divides young
generation in two equal halves and [performed moving/copying of objects that survived GC
synchronously](crankshaft/gc.md#tospace-fromspace-memory-exhaustion)
- single threaded scavenger made sense on single-core environments, but at this point Chrome,
Node.js and thus V8 runs in many multicore scenarios
- new algorithm similar to the [Halstead semispace copying collector](https://www.cs.cmu.edu/~guyb/papers/gc2001.pdf)
except that V8 uses dynamic instead of static _work stealing_ across multiple threads
#### Scavenger Phases
As with the previous algorithm scavenge happens in four phases.
All phases are performed in parallel and interleaved on each task, thus maximizing utilization
of worker tasks.
1. scan for roots
- majority of root set are the references from the old generation to the young generation
- [remembered sets](#tracking-pointers) are maintained per page and thus naturally distributes
the root sets among garbage collection threads
2. copy objects within the young generation
3. promote objects to the old generation
- objects are processed in parallel
- newly found objects are added to a global work list from which garbage collection threads can
_steal_
4. update pointers
##### Distribution of scavenger work across one main thread and two worker threads
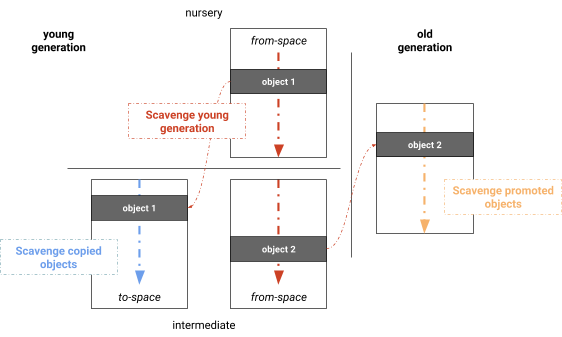

#### Results
- just a little slower than the optimized Cheney algorithm on very small heaps
- provides high throughput when heap gets larger with lots of life objects
- time spent on main thread by the scavenger was reduced by 20%-50%
### Techniques to Improve GC Performance
#### Memory Partition and Parallelization
- heap memory is partitioned into fixed-size chunks, called _pages_
- _young generation evacuation_ is achieved in parallel by copying memory based on pages
- _memory compaction_ parallelized on page-level
- young generation and old generation compaction phases don't depend on each other and thus are
parallelized
- resulted in 75% reduction of compaction time
#### Tracking Pointers
[read](https://v8.dev/blog/orinoco)
- GC tracks pointers to objects which have to be updated whenever an object is moved
- all pointers to old location need to be updated to object's new location
- V8 uses a _rembered set_ of _interesting pointers_ on the heap
- an object is _interesting_ if it may move during garbage collection or if it lives in heavily
fragmented pages and thus will be moved during compaction
- _remembered sets_ are organized to simplify parallelization and ensure that threads get
disjoint sets of pointers to update
- each page stores offsets to _interesting_ pointers originating from that page
#### Black Allocation
[read](https://v8.dev/blog/orinoco)
- assumption: objects recently allocated in the old generation should at least survive the next
old generation garbage collection and thus are _colored_ black
- _black objects_ are allocated on black pages which aren't swept
- speeds up incremental marking process and results in less garbage collection
### Resources
- [Getting Garbage Collection for Free](https://v8.dev/blog/free-garbage-collection)
_maybe outdated except the scheduling part at the beginning_?
- [Jank Busters Part One](https://v8.dev/blog/jank-busters)
_outdated_?
- [Jank Busters Part Two: Orinoco](https://v8.dev/blog/orinoco)
_outdated_ except for paging, pointer tracking and black allocation?
- [V8 Release 5.3](https://v8.dev/blog/v8-release-53)
- [V8 Release 5.4](https://v8.dev/blog/v8-release-54)
- [Optimizing V8 memory consumption](https://v8.dev/blog/optimizing-v8-memory)
- [Orinoco: young generation garbage collection](https://v8.dev/blog/orinoco-parallel-scavenger)
## Old Generation Garbage Collector Deep Dive
- fast alloc
- slow collection performed infrequently and thus in most cases doesn't affect application
performance as much as the more frequently performed _scavenge_
- `~20%` of objects survive into **Old Generation**
### Collection Steps
[watch](https://youtu.be/VhpdsjBUS3g?t=12m30s)
- parts of collection run concurrent with mutator, i.e. runs on same thread our JavaScript is executed on
- [incremental marking/collection](http://www.memorymanagement.org/glossary/i.html#term-incremental-garbage-collection)
- [mark-sweep](http://www.memorymanagement.org/glossary/m.html#term-mark-sweep): return memory to system
- [mark-compact](http://www.memorymanagement.org/glossary/m.html#term-mark-compact): move values
### Mark Sweep and Mark Compact
[read](http://jayconrod.com/posts/55/a-tour-of-v8-garbage-collection) *Mark-sweep and Mark-compact*
- used to collect **Old Space** which may contain +100 MB of data
- scavenge impractical for more than a few MBs
- two phases
- Mark
- Sweep or Compact
#### Mark
- all objects on heap are discovered and marked
- objects can start at any *word aligned* offset in page and are at least two words long
- each page contains marking bitmap (one bit per allocatable word)
- results in memory overhead `3.1% on 32-bit, 1.6% on 64-bit systems`
- when marking completes all objects are either considered dead *white* or alive *black*
- that info is used during sweeping or compacting phase
#### Marking State
- pairs of bits represent object's *marking state*
- **white**: not yet discovered by GC
- **grey**: discovered, but not all of its neighbors were processed yet
- **black**: discovered and all of its neighbors were processed
- **marking deque**: separately allocated buffer used to store objects being processed
##### Depth-First Search
- starts with clear marking bitmap and all *white* objects
- objects reachable from roots become *grey* and pushed onto *marking deque*
- at each step GC pops object from *marking deque*, marks it *black*
- then marks it's neighboring *white* objects *grey* and pushes them onto *marking deque*
- exit condition: *marking deque* is empty and all discovered objects are *black*
#### Handling Deque Overflow
- large objects i.e. long arrays may be processed in pieces to avoid **deque** overflow
- if *deque* overflows, objects are still marked *grey*, but not pushed onto it
- when *deque* is empty again GC scans heap for *grey* objects, pushes them back onto *deque* and resumes marking
#### Sweep and Compact
- both work at **V8** page level == 1MB contiguous chunks (different from [virtual memory
pages](http://www.memorymanagement.org/glossary/p.html#page))
#### Sweep
- iterates across page's *marking bitmap* to find ranges of unmarked objects
- scans for contiguous ranges of dead objects
- converts them to free spaces
- adds them to free list
- each page maintains separate free lists
- for small regions `< 256 words`
- for medium regions `< 2048 words`
- for large regions `< 16384 words`
- used by scavenge algorithm for promoting surviving objects to **Old Space**
- used by compacting algorithm to relocate objects
#### Compact
[read](http://jayconrod.com/posts/55/a-tour-of-v8-garbage-collection) *Mark-sweep and Mark-compact*
last paragraph
- reduces actual memory usage by migrating objects from fragmented pages to free spaces on other pages
- new pages may be allocated
- evacuated pages are released back to OS
### Incremental Mark and Lazy Sweep
[read](http://jayconrod.com/posts/55/a-tour-of-v8-garbage-collection) *Incremental marking and lazy sweeping*
#### Incremental Marking
- algorithm similar to regular marking
- allows heap to be marked in series of small pauses `5-10ms` each (vs. `500-1000ms` before)
- activates when heap reaches certain threshold size
- when active an incremental marking step is performed on each memory allocation
#### Lazy Sweeping
- occurs after each incremental marking
- at this point heap knows exactly how much memory could be freed
- may be ok to delay sweeping, so actual page sweeps happen on *as-needed* basis
- GC cycle is complete when all pages have been swept at which point incremental marking starts again
## Resources
- [video: accelerating oz with V8](https://www.youtube.com/watch?v=VhpdsjBUS3g)
- [V8-design](https://github.com/v8/v8/wiki/Design%20Elements#efficient-garbage-collection)
- [tour of V8: garbage collection - 2013](http://jayconrod.com/posts/55/a-tour-of-v8-garbage-collection)
- [memory management reference](http://www.memorymanagement.org/)
- [Tracing from JS to the DOM and back again](https://v8project.blogspot.de/2018/03/tracing-js-dom.html)
================================================
FILE: inspection.md
================================================
# Inspection and Performance Profiling
_find the previous version of this document at
[crankshaft/performance-profiling.md](crankshaft/performance-profiling.md)_
- [General Strategies to track and improve Performance](#general-strategies-to-track-and-improve-performance)
- [Identify and Understand Performance Problem](#identify-and-understand-performance-problem)
- [Sampling CPU Profilers](#sampling-cpu-profilers)
- [Structural CPU Profilers](#structural-cpu-profilers)
- [Instrumentation Techniques](#instrumentation-techniques)
- [Instrumenting vs. Sampling](#instrumenting-vs-sampling)
- [Plan for Performance](#plan-for-performance)
- [Animation Frame](#animation-frame)
- [Node.js Perf And Tooling](#nodejs-perf-and-tooling)
- [Profile JavaScript CPU Usage of Node.js via Chrome DevTools](#profile-javascript-cpu-usage-of-nodejs-via-chrome-devtools)
- [Resources](#resources)
- [Profile FullStack CPU Usage of Node.js](#profile-fullstack-cpu-usage-of-nodejs)
- [Tools To Produce Full Stack Flamegraphs](#tools-to-produce-full-stack-flamegraphs)
- [Brendan Gregg's Flamegraph Tool](#brendan-greggs-flamegraph-tool)
- [0x](#0x)
- [Perf](#perf)
- [Dtrace](#dtrace)
- [Inspecting V8](#inspecting-v8)
- [V8 flags](#v8-flags)
- [AST](#ast)
- [Byte Code](#byte-code)
- [Tracing Inline Caches](#tracing-inline-caches)
- [Optimized Code](#optimized-code)
- [Tracing Optimizations](#tracing-optimizations)
- [Tracing Map Creation](#tracing-map-creation)
- [Resources](#resources-1)
- [Runtime Call Stats](#runtime-call-stats)
- [Resources](#resources-2)
- [Memory Visualization](#memory-visualization)
- [Resources](#resources-3)
- [Array Elements Kinds](#array-elements-kinds)
- [Resources](#resources-4)
- [Tools to Inspect/Visualize V8 Operations](#tools-to-inspectvisualize-v8-operations)
- [Turbolizer](#turbolizer)
- [Considerations when Improving Performance](#considerations-when-improving-performance)
- [Profilers](#profilers)
- [Tweaking hot Code](#tweaking-hot-code)
- [Resources](#resources-5)
## General Strategies to track and improve Performance
### Identify and Understand Performance Problem
[watch](https://youtu.be/UJPdhx5zTaw?t=40m1s) |
[slide](http://v8-io12.appspot.com/index.html#83) |
[watch profiling workflow](https://www.youtube.com/watch?v=nxXkquTPng8&feature=share&t=40m50s)
Analyse performance only once you have a problem in a top down manner like so:
- ensure it's JavaScript and not the DOM
- reduce testcase to pure JavaScript and run in `d8` shell
- collect metrics and locate bottlenecks
- sample profiling to narrow down the general problem area
- at this point think about the algorithm, data structures, techniques, etc. used in this area and evaluate if
improvements in this area are possible since that will most likely yield greater impact than any of the more fine
grained improvments
- structural profiling to isolate the exact area i.e. function in which most time is spent
- evaluate what can be improved here again thinking about algorithm first
- *only once* algorithm and data structures seem optimal evaluate how the code structure affects assembly code generated by V8 and
possible optimizations (small functions, `try/catch`, closures, loops vs. `forEach`, etc.)
- optimize slowest section of code and repeat structural profiling
### Sampling CPU Profilers
[watch](https://www.youtube.com/watch?v=nxXkquTPng8&feature=share&t=3m20s) |
[watch walkthrough](https://www.youtube.com/watch?v=nxXkquTPng8&feature=share&t=34m00s)
- at fixed frequency program is instantaneously paused *by setting stacksize to 0* and the call stack sampled
- assumes that the sample is representative of workload
- gives no sense fo flow to due gaps between samples
- functions that were inlined by compiler aren't shown
- collect data for longer period of time, sampling every 1ms
- ensure code is exercising the right code paths
### Structural CPU Profilers
[watch](https://www.youtube.com/watch?v=nxXkquTPng8&feature=share&t=7m10s) |
[watch walkthrough](https://www.youtube.com/watch?v=nxXkquTPng8&feature=share&t=37m10s)
- functions are instrumented to record entry and exit times
- three data points per function
- **Inclusive Time**: time spent in function *including* its children
- **Exclusive Time**: time spent in function *excluding* its children
- **Call Count**: number of times the function was called
- data points are taken at much higher frequency than sampling
- higher cost than sampling dut to instrumentation
- goal of optimization is to **minimize inclusive time**
- inlined functions retain markers
#### Instrumentation Techniques
[watch](https://www.youtube.com/watch?v=nxXkquTPng8&feature=share&t=46m10s)
- think about data being processed
- is one piece of data slower?
- name time ranges based on data
- use variables/properties to dynamically name ranges
### Instrumenting vs. Sampling
[watch](https://www.youtube.com/watch?v=nxXkquTPng8&feature=share&t=10m30s)
```
+--------------------------------------------------------------------------------------------+
| | Sampling | Structural / Instrumenting |
|-----------------------------------+------------------------+-------------------------------|
| Time | Approximate | Exact |
| Invocation count | Approximate | Exact |
| Overhead | Small | High(er) |
| Accuracy | Good - Poor | Good - Poor |
| Extra code / instrumentation | No | Yes |
+--------------------------------------------------------------------------------------------+
```
- need both
- manual instrumentation can reduce overhead
- instrumentation affects performance and may affect behavior
- samples are very accurate, but inaccurate for extracting time
- sampling requires no program modification
### Plan for Performance
[watch](https://www.youtube.com/watch?v=nxXkquTPng8&feature=share&t=47m50s)
- each module of app sould have time budget
- sum of modules should be `< 16ms` for smooth client side apps
- track performance daily or per commit in order to catch *budget busters* right away
### Animation Frame
[watch](https://www.youtube.com/watch?v=nxXkquTPng8&feature=share&t=50m00s) |
[watch walkthrough](https://www.youtube.com/watch?v=nxXkquTPng8&feature=share&t=52m20s)
- queue up key handlers and execute inside Animation Frame
- optimize for lowest common denominator that your app will run on
- for mobile stay below `8-10ms` since remaining time is needed for chrome to do its work, i.e. render
## Node.js Perf And Tooling
[watch](https://youtu.be/EdFDJANJJLs?t=23m51s)
- Node.js is _inspectable_ via the `--inspect` and [similar flags](https://nodejs.org/en/docs/inspector/#command-line-options)
- multiple tools, like DevTools (chrome://inspect) and VS Code integrate with it to allow debugging and profiling Node.js applications
- DevTools includes dedicated Node.js window that auto connects to any Node.js process that is launched with the debugger enabled
- _in line_ breakpoints allow breaking on specific statement on a line with multiple statements
- async code flow debugging is supported (async stack traces)
### Profile JavaScript CPU Usage of Node.js via Chrome DevTools
[read](https://developers.google.com/web/updates/2016/12/devtools-javascript-cpu-profile-migration) |
[read](https://nodejs.org/en/docs/guides/debugging-getting-started/#command-line-options)
- launch your application with `node --inspect app.js`
- open dedicated Node.js DevTools via [chrome://inspect](chrome://inspect) or by clicking the
Node.js icon in the upper left of any DevTools window
- select the profiler tab and click _Start_ while loading your application and _Stop_ when done
- inspect the profile via the _Chart_ view to see the timeline of function execution
- select the _Heavy (Bottom Up)_ view to see functions ordered by aggregated time spent
executing them
- in both views `Cmd|Ctrl - F` allows searching for specific functions, i.e. searching for
`garbage` will highlight all instances in which garbage was collected
- the time spent in `program` frames is either spent in native code or idling and if a lot of
those frames it is advised to profile either via `node --prof` or kernel tracing tools like
_perf_ or _dtrace_ in conjunction with flamegraph visualizers

### Resources
- [Node.js Inspector Clients like DevTools](https://nodejs.org/en/docs/guides/debugging-getting-started/#inspector-clients)
### Profile FullStack CPU Usage of Node.js
#### Tools To Produce Full Stack Flamegraphs
##### Brendan Gregg's Flamegraph Tool
[read](http://www.brendangregg.com/flamegraphs.html)
- takes [perf](#perf) or [dtrace](#dtrace) results as input and transforms them into
flamegraphs in three steps using the included Perl scripts
- when using [perf](#perf) and the Node.js process was run with `--perf-basic-prof` it is able
to resolve JavaScript symbols
- [thlorenz/flamegraph](https://github.com/thlorenz/flamegraph) is a port of those scripts to a
JavaScript module and [application](http://thlorenz.github.io/flamegraph/web/) to make it
easier to use with the added benefit of resolving JavaScript symbols when using dtrace as
well
- [0x](#0x) took ideas from both of these tools to provide a very easy to use solution to
profile Node.js applications
##### 0x
- [0x](https://github.com/davidmarkclements/0x) combines all steps to generate flamegraphs into
an easy to use package and is the recommended solution to produce flamegraphs for Node.js
applications running locally
- by default it adds the `--prof` flag when running your Node.js application and includes
JavaScript as well as native symbols for V8 and Node.js, selectable in the toolbar of the
visualization (_V8_ and _cpp_)
- for cases in which lower level inspection is required, the [command line
api](https://github.com/davidmarkclements/0x#command-line-api) includes a
[`--kernel-tracing` flag](https://github.com/davidmarkclements/0x/blob/master/docs/kernel-tracing.md)
which will use perf or dtrace (depending on OS) to profile your application and produce a
flamegraph from its output
- an interactive demo can be [found here](http://davidmarkclements.github.io/0x-demo/)
#### Perf
[read](https://mrale.ph/blog/2018/02/03/maybe-you-dont-need-rust-to-speed-up-your-js.html#profiling-the-pure-javascript-version) |
[read](http://www.brendangregg.com/perf.html) _very comprehensive resource on perf with tons of examples_
Only available on Linux.
```sh
perf record -g node --perf-basic-prof app.js
perf report ## add --no-children to avoid expanding nodes
```
- visualize `perf` output via [Brendan Gregg's Flamegraph Tool](https://github.com/brendangregg/FlameGraph)
- [0x](#0x) uses it under the hood to produce input when `--kernel-tracing` is enabled when
profiling Node.js applications on Linux
#### Dtrace
[read](http://www.brendangregg.com/dtrace.html)
Only available on BSD Unix, like Mac OSX or Solaris.
- since dtrace accepts a full script, there are infinite ways of profiling applications with it
- [here](https://github.com/thlorenz/cpuprofilify/blob/master/bin/profile_1ms.d) is an example
script that produces data that can become input to tools to produce flamegraphs
- [0x](#0x) uses it under the hood to produce input when `--kernel-tracing` is enabled when
profiling Node.js applications on BSD Unixes
- [here](https://github.com/thlorenz/cpuprofilify#instructions) is an example to do this
manually for Node.js applications
## Inspecting V8
### V8 flags
Multiple flags and so called _run time functions_ are available to anyone who likes to peek
into the inner workings of V8.
#### AST
- `--print-ast` prints the AST generated by V8 to the console
#### Byte Code
- `--print-bytecode` prints bytecode generated by ignition interpreter to the console
- provides more info when run with debug build d8, i.e. information about maps created
#### Tracing Inline Caches
- `--trace-ic` dumps IC traces to the console
- pipe that output into `./v8/tools/ic-processor` to visualize it
#### Optimized Code
- `--print-opt-code` prints the actual optimized code that is generated by TurboFan
- `--code-comments` adds comments to printed optimized code
#### Tracing Optimizations
- `--trace-opt` traces lazy optimization
- _generic ICs_ are _bad_ as if lots of them are present, code will not be optimized
- _ICs with typeinfo_ are _good_
#### Tracing Map Creation
- `--trace-maps` in combination with `--trace-maps-details` trace map generation into v8.log
- `--expose-gc` allows forcing GC via `gc()` in your code to see which maps are short lived
- the output can be parsed to see what maps _hidden classes_ and transitions into other maps V8
creates to represent your objects
- a graphical presentation is also available by loading the resulting `v8.log` into
`/v8/tools/map-processor.htm` (requires V8 checkout)
##### Resources
- [The case of temporary objects in Chrome](http://benediktmeurer.de/2016/10/11/the-case-of-temporary-objects-in-chrome/)
#### Runtime Call Stats
- `--runtime-call-stats` dumps statistics about the V8 runtime to the console
- these stats give detailed info where V8 time is spent
**Sample Output** (abbreviated)
```
Runtime Function/C++ Builtin Time Count
========================================================================================
JS_Execution 8.82ms 47.24% 1 0.11%
RecompileSynchronous 3.89ms 20.83% 7 0.75%
API_Context_New 2.20ms 11.78% 1 0.11%
GC_SCAVENGER_SCAVENGE 0.88ms 4.73% 15 1.60%
AllocateInNewSpace 0.51ms 2.71% 71 7.59%
GC_SCAVENGER_SCAVENGE_ROOTS 0.38ms 2.04% 15 1.60%
GC_SCAVENGER_SCAVENGE_PARALLEL 0.24ms 1.29% 15 1.60%
GC_SCAVENGER_BACKGROUND_SCAVENGE_PARALLEL 0.18ms 0.94% 15 1.60%
GC_Custom_SlowAllocateRaw 0.15ms 0.79% 6 0.64%
CompileForOnStackReplacement 0.13ms 0.70% 2 0.21%
ParseProgram 0.13ms 0.70% 1 0.11%
CompileIgnition 0.13ms 0.69% 4 0.43%
PreParseNoVariableResolution 0.11ms 0.59% 3 0.32%
OptimizeCode 0.09ms 0.46% 5 0.53%
CompileScript 0.08ms 0.41% 1 0.11%
Map_TransitionToDataProperty 0.07ms 0.40% 92 9.84%
InterpreterDeserializeLazy 0.07ms 0.36% 28 2.99%
Map_SetPrototype 0.06ms 0.29% 249 26.63%
FunctionCallback 0.05ms 0.27% 3 0.32%
ParseFunctionLiteral 0.04ms 0.22% 3 0.32%
GC_HEAP_EPILOGUE 0.04ms 0.19% 15 1.60%
[ ... ... ... ... ... ]
----------------------------------------------------------------------------------------
Total 18.67ms 100.00% 935 100.00%
```
##### Resources
- [real world performance measurements](http://benediktmeurer.de/2016/12/20/v8-behind-the-scenes-december-edition/#real-world-performance-measurements)
#### Memory Visualization
- V8 heap statistics feature provides insight into both the V8 managed heap and the C++ heap
- `--trace-gc-object-stats` dumps memory-related statistics to the console
- this data can be visualized via the [V8 heap visualizer](https://mlippautz.github.io/v8-heap-stats/)
- make sure to not log to _stdout_ when generating the `v8.gc_stats` file
- NOTE: when I tried this tool by loading a `v8.gc_stats` generated via
`node --trace-gc-object-stats script.js > v8.gc_stats` it errored
- serving `v8 ./tools/heap-stats` locally had the same result
##### Resources
- [Optimizing V8 memory consumption](https://v8.dev/blog/optimizing-v8-memory)
#### Array Elements Kinds
- enable native functions via `--allow-natives-syntax`
- then use `%DebugPrint(array)` to dump information about this array to the console
- the `elements` field will hold information about the _elements kinds_ of the array
**Sample Output** (abbreviated)
```
DebugPrint: 0x1fbbad30fd71: [JSArray]
- map = 0x10a6f8a038b1 [FastProperties]
- prototype = 0x1212bb687ec1
- elements = 0x1fbbad30fd19 [PACKED_SMI_ELEMENTS (COW)]
- length = 3
- properties = 0x219eb0702241 {
#length: 0x219eb0764ac9 (const accessor descriptor)
}
- elements= 0x1fbbad30fd19 {
0: 1
1: 2
2: 3
}
[…]
```
- `--trace-elements-transitions` dumps elements transitions taking place to the console
**Sample Output**
```
elements transition [PACKED_SMI_ELEMENTS -> PACKED_DOUBLE_ELEMENTS]
in ~+34 at x.js:2 for 0x1df87228c911
from 0x1df87228c889 to 0x1df87228c941
```
##### Resources
- ["Elements kinds" in V8](https://v8.dev/blog/elements-kinds)
### Tools to Inspect/Visualize V8 Operations
#### Turbolizer
- when Node.js or d8 is run with the `--trace-turbo` it outputs one `turbo-*.json` file per
function
- each JSON file includes information about optimized code along the various phases of Turbofan's optimization pipeline
- [turbolizer](https://github.com/thlorenz/turbolizer) is a tool derived from the [turbolizer
application](https://github.com/v8/v8/tree/master/tools/turbolizer) included with V8
- it visualizes the TurboFan optimization pipeline information and provides easy navigation between source
code, Turbofan IR graphs, scheduled IR nodes and generated assembly code
## Considerations when Improving Performance
Three groups of optimizations are algorithmic improvements, workarounds JavaScript limitations
and workarounds for V8 related issues.
As we have shown V8 related issues have decreased immensely and should be reported to the V8
team if found, however in some cases workarounds are needed.
However before applying any optimizations first profile your app and understand the underlying
problem, then apply changes and prove by measuring that they change things for the better.
#### Profilers
- different performance problems call for different approaches to profile and visualize the
cause
- learn to use different profilers including _low level_ profilers like `perf`
#### Tweaking hot Code
- before applying micro optimizations to your code reason about its abstract complexity
- evaluate how your code would be used on average and in the worst case and make sure your
algorithm handles both cases in a performant manner
- prefer monomorphism in very hot code paths if possible, as polymorphic functions cannot be
optimized to the extent that monomorphic ones can
- measure that strategies like _caching_ and _memoization_ actually result in performance
improvements before applying them as in some cases the cache lookup maybe more expensive than
performing the computation
- understand limitations and costs of V8, a garbage collected system, in order to choose
appropriate data types to improve performance, i.e. prefer a `Uint8Array` over a `String`
when it makes sense
### Resources
- [Maybe you don't need Rust and WASM to speed up your JS - 2018](https://mrale.ph/blog/2018/02/03/maybe-you-dont-need-rust-to-speed-up-your-js.html)
- [video: accelerating oz with V8](https://www.youtube.com/watch?v=VhpdsjBUS3g) |
[slides](http://commondatastorage.googleapis.com/io-2013/presentations/223.pdf)
- [video: structural and sampling profiling in google chrome](https://www.youtube.com/watch?v=nxXkquTPng8) |
[slides](https://www.igvita.com/slides/2012/structural-and-sampling-javascript-profiling-in-chrome.pdf)
- [V8 profiler](https://code.google.com/p/v8/wiki/V8Profiler)
- [stackoverflow: how to debug nodejs applications](http://stackoverflow.com/a/16512303/97443)
================================================
FILE: language-features.md
================================================
# Language Features
This document lists JavaScript language features and provides info with regard to their
performance. In some cases it is explained why a feature used to be slow and how it was sped
up.
The bottom line is that most features that could not be optimized previously due to limitations
of crankshaft are now first class citizens of the new compiler chain and don't prevent
optimizations anymore.
Therefore write clean idiomatic code [as explained
here](https://github.com/thlorenz/v8-perf/blob/turbo/compiler.md#facit), and use all features
that the language provides.
**Table of Contents** *generated with [DocToc](https://github.com/thlorenz/doctoc)*
- [Function Bind](#function-bind)
- [Why Was Bind Slow?](#why-was-bind-slow)
- [What Changed?](#what-changed)
- [Recommendations](#recommendations)
- [Resources](#resources)
- [instanceof and @@hasInstance](#instanceof-and-hasinstance)
- [Recommendations](#recommendations-1)
- [Resources](#resources-1)
- [Reflection API](#reflection-api)
- [Resources](#resources-2)
- [Array Builtins](#array-builtins)
- [const](#const)
- [Recommendations](#recommendations-2)
- [Resources](#resources-3)
- [Iterating Maps and Sets via `for of`](#iterating-maps-and-sets-via-for-of)
- [Why was it Slow?](#why-was-it-slow)
- [What Changed?](#what-changed-1)
- [Recommendations](#recommendations-3)
- [Resources](#resources-4)
- [Iterating Maps and Sets via `forEach` and Callbacks](#iterating-maps-and-sets-via-foreach-and-callbacks)
- [Why was it Slow?](#why-was-it-slow-1)
- [What Changed?](#what-changed-2)
- [Recommendations](#recommendations-4)
- [Resources](#resources-5)
- [Iterating Object properties via for in](#iterating-object-properties-via-for-in)
- [Incorrect Use of For In To Iterate Object Properties](#incorrect-use-of-for-in-to-iterate-object-properties)
- [Correct Use of For In To Iterate Object Properties](#correct-use-of-for-in-to-iterate-object-properties)
- [Why was it Fast?](#why-was-it-fast)
- [What Changed?](#what-changed-3)
- [Recommendations](#recommendations-5)
- [Resources](#resources-6)
- [Object Constructor Subclassing and Class Factories](#object-constructor-subclassing-and-class-factories)
- [Recommendations](#recommendations-6)
- [Resources](#resources-7)
- [Tagged Templates](#tagged-templates)
- [Resources](#resources-8)
- [Typed Arrays and ArrayBuffer](#typed-arrays-and-arraybuffer)
- [Recommendations](#recommendations-7)
- [Resources](#resources-9)
- [Object.is](#objectis)
- [Resources](#resources-10)
- [Regular Expressions](#regular-expressions)
- [Resources](#resources-11)
- [Destructuring](#destructuring)
- [Recommendations](#recommendations-8)
- [Resources](#resources-12)
- [Promises Async/Await](#promises-asyncawait)
- [Resources](#resources-13)
- [Generators](#generators)
- [Resources](#resources-14)
- [Proxies](#proxies)
- [Recommendations](#recommendations-9)
- [Resources](#resources-15)
## Function Bind
### Why Was Bind Slow?
- performance of `Function.prototype.bind` and `bound` functions suffered from performance
issues in crankshaft days
- language boundaries C++/JS were crossed both ways which is expensive (esp. calling back from
C++ into JS)
- two temporary arrays were created on every invocation of a bound function
- due to crankshaft limitations this couldn't be fixed easily there
### What Changed?
- entirely new approach to how _bound function exotic objects_ are implemented
- crossing C++/JS boundaries no longer needed
- pushing bound receiver and bound arguments directly and then calling target function allows
further compile time optimizations and enables inlining the target function into the
caller
- TurboFan inlines all mononomorphic calls to `bind` itself
- resulted in **~400x** speed improvement
- the performance of the React runtime, which makes heavy use of `bind`, doubled as a result
### Recommendations
- developers should use bound functions freely wherever they apply without having to worry
about performance penalties
- the two below snippets perform the same but arguably the second one is more readable and for the
case of `arr.reduce` is the only way to pass `this` as it doesn't support passing it as a
separate parameter like `forEach` and `map` do
```js
// passing `this` to map as separate parameter
arr.map(convert, this)
// binding `this` to the convert function directly
arr.map(convert.bind(this))
```
### Resources
- [A new approach to Function.prototype.bind - 2015](http://benediktmeurer.de/2015/12/25/a-new-approach-to-function-prototype-bind/)
- [Optimizing bound functions further - 2016](http://benediktmeurer.de/2016/01/14/optimizing-bound-functions-further/)
- [bound function exotic objects](https://tc39.github.io/ecma262/#sec-bound-function-exotic-objects)
- [V8 release v6.4 - 2017](https://v8.dev/blog/v8-release-64)
## instanceof and @@hasInstance
- latest JS allows overriding behavior of `instanceOf` via the `@@hasInstance` _well known
symbol_
- naively this requires a check if `@@hasInstance` is defined for the given object every time
`instanceof` is invoked for it (in 99% of the cases it won't be defined)
- initially that check was skipped as long as no overrides were added EVER (global protector
cell)
- Node.js `Writable` class used `@@hasInstance` and thus incurred huge performance bottleneck
for `instanceof` ~100x, since now checks were no longer skipped
- optimizations weren't possible in these cases initially
- by avoiding to depend on global protector cell for TurboFan and allowing inlining `instancof`
code this performance bottleneck has been fixed
- similar improvements were made in similar fashion to other _well-known symbols_ like
`@@iterator` and `@@toStringTag`
### Recommendations
- developers can use `instanceof` freely without worrying about non-deterministic performance
characteristics
- developers should think hard before overriding its behavior via `@@hasInstance` since this
_magical behavior_ may confuse others, but using it will incur no performance penalties
### Resources
- [V8: Behind the Scenes (November Edition) - 2016](http://benediktmeurer.de/2016/11/25/v8-behind-the-scenes-november-edition/)
- [Investigating Performance of Object#toString in ES2015 - 2017](http://benediktmeurer.de/2017/08/14/investigating-performance-object-prototype-to-string-es2015/)
## Reflection API
- `Reflect.apply` and `Reflect.construct` received 17x performance boost in V8 v6.1 and
therefore should be considered performant at this point
### Resources
- [V8 Release 6.1 - 2017](https://v8.dev/blog/v8-release-61)
## Array Builtins
- `Array` builtins like `map`, `forEach`, `reduce`, `reduceRight`, `find`, `findIndex`, `some`
and `every` can be inlined into TurboFan optimized code which results in considerable
performance improvement
- optimizations are applied to all _major non-holey_ elements kinds for all `Array` builtins
- for all builtins, except `find` and `findIndex` _holey floating-point_ arrays don't cause
bailouts anymore
- [V8: Behind the Scenes (February Edition) - 2017](http://benediktmeurer.de/2017/03/01/v8-behind-the-scenes-february-edition/)
- [V8 Release 6.1 - 2017](https://v8.dev/blog/v8-release-61)
- [V8 release v6.5 - 2018](https://v8.dev/blog/v8-release-65)
## const
- `const` has more overhead when it comes to temporal deadzone related checks since it isn't
hoisted
- however the `const` keyword also guarantees that once a value is assigned to its slot it
won't change in the future
- as a result TurboFan skips loading and checking `const` slot values slots each time they are
accessed (_Function Context Specialization_)
- thus `const` improves performance, but only once the code was optimized
### Recommendations
- `const`, like `let` adds cost due to TDZ (temporal deadzone) and thus performs slightly worse
in unoptimized code
- `const` performs a lot better in optimized code than `var` or `let`
### Resources
- [JavaScript Optimization Patterns (Part 2) - 2017](http://benediktmeurer.de/2017/06/29/javascript-optimization-patterns-part2/)
## Iterating Maps and Sets via `for of`
- `for of` can be used to walk any collection that is _iterable_
- this includes `Array`s, `Map`s, and `Set`s
### Why was it Slow?
- set iterators where implemented via a mix of self-hosted JavaScript and C++
- allocated two objects per iteration step (memory overhead -> increased GC work)
- transitioned between C++ and JS on every iteration step (expensive)
- additionally each `for of` is implicitly wrapped in a `try/catch` block as per the language
specification, which prevented its optimization due to crankshaft not ever optimizing
functions which contained a `try/catch` statement
### What Changed?
- improved optimization of calls to `iterator.next()`
- avoid allocation of `iterResult` via _store-load propagation_, _escape analysis_ and _scalar
replacement of aggregates_
- avoid allocation of the _iterator_
- fully implemented in JavaScript via [CodeStubAssembler](https://v8.dev/docs/csa-builtins)
- only calls to C++ during GC
- full optimization now possible due to TurboFan's ability to optimize functions that include a
`try/catch` statement
### Recommendations
- use `for of` wherever needed without having to worry about performance cost
### Resources
- [Faster Collection Iterators - 2017](http://benediktmeurer.de/2017/07/14/faster-collection-iterators/)
- [V8 Release 6.1 - 2017](https://v8.dev/blog/v8-release-61)
## Iterating Maps and Sets via `forEach` and Callbacks
- both `Map`s and `Set`s provide a `forEach` method which allows iterating over it's items by
providing a callback
### Why was it Slow?
- were mainly implemented in C++
- thus needed to transition to C++ first and to handle the callback needed to transition back
to JavaScript (expensive)
### What Changed?
- `forEach` builtins were ported to the
[CodeStubAssembler](https://v8.dev/docs/csa-builtins) which lead to
a significant performance improvement
- since now no C++ is in play these function can further be optimized and inlined by TurboFan
### Recommendations
- performance cost of using builtin `forEach` on `Map`s and `Set`s has been reduced drastically
- however an additional closure is created which causes memory overhead
- the callback function is created new each time `forEach` is called (not for each item but
each time we run that line of code) which could lead to it running in unoptimized mode
- therefore when possible prefer `for of` construct as that doesn't need a callback function
### Resources
- [Faster Collection Iterators - Callback Based Iteration - 2017](http://benediktmeurer.de/2017/07/14/faster-collection-iterators/#callback-based-iteration)
- [V8 Release 6.1 - 2017](https://v8.dev/blog/v8-release-61)
## Iterating Object properties via for in
### Incorrect Use of For In To Iterate Object Properties
```js
var ownProps = 0
for (const prop in obj) {
if (obj.hasOwnProperty(prop)) ownProps++
}
```
- problematic due to `obj.hasOwnProperty` call
- may raise an error if `obj` was created via `Object.create(null)`
- `obj.hasOwnProperty` becomes megamorphic if `obj`s with different shapes are passed
- better to replace that call with `Object.prototype.hasOwnProperty.call(obj, prop)` as it is
safer and avoids potential performance hit
### Correct Use of For In To Iterate Object Properties
```js
var ownProps = 0
for (const prop in obj) {
if (Object.prototype.hasOwnProperty.call(obj, prop)) ownProps++
}
```
### Why was it Fast?
- crankshaft applied two optimizations for cases were only enumerable fast properties on
receiver were considered and prototype chain didn't contain enumerable properties or other
special cases like proxies
- _constant-folded_ `Object.hasOwnProperty` calls inside `for in` to `true` whenever
possible, the below three conditions need to be met
- object passed to call is identical to object we are enumerating
- object shape didn't change during loop iteration
- the passed key is the current enumerated property name
- enum cache indices were used to speed up property access
### What Changed?
- _enum cache_ needed to be adapted so TurboFan knew when it could safely use _enum cache
indices_ in order to avoid deoptimization loop (that also affected crankshaft)
- _constant folding_ was ported to TurboFan
- separate _KeyAccumulator_ was introduced to deal with complexities of collecting keys for
`for-in`
- _KeyAccumulator_ consists of fast part which support limited set of `for-in` actions and slow part which
supports all complex cases like ES6 Proxies
- coupled with other TurboFan+Ignition advantages this led to ~60% speedup of the above case
### Recommendations
- `for in` coupled with the correct use of `Object.prototype.hasOwnProperty.call(obj, prop)` is
a very fast way to iterate over the properties of an object and thus should be used for these
cases
### Resources
- [Restoring for..in peak performance - 2017](http://benediktmeurer.de/2017/09/07/restoring-for-in-peak-performance/)
- [Require Guarding for-in](https://eslint.org/docs/rules/guard-for-in)
- [Fast For-In in V8 - 2017](https://v8.dev/blog/fast-for-in)
## Object Constructor Subclassing and Class Factories
- pure object subclassing `class A extends Object {}` by itself is not useful as `class B
{}` will yield the same result even though [`class A`'s constructor will have different
prototype chain than `class B`'s](https://github.com/thlorenz/d8box/blob/8ec3c71cb6bdd7fe8e32b82c5f19d5ff24c65776/examples/object-subclassing.js#L22-L23)
- however subclassing to `Object` is heavily used when implementing mixins via class factories
- in the case that no base class is desired we pass `Object` as in the example below
```js
function createClassBasedOn(BaseClass) {
return class Foo extends BaseClass { }
}
class Bar {}
const JustFoo = createClassBasedOn(Object)
const FooBar = createClassBasedOn(Bar)
```
- TurboFan detects the cases for which the `Object` constructor is used as the base class and
fully inlines object instantiation
### Recommendations
- class factories won't incur any extra overhead if no specific base class needs to be _mixed
in_ and `Object` is passed to be extended from
- therefore use freely wherever if mixins make sense
### Resources
- [Optimize Object constructor subclassing - 2017](http://benediktmeurer.de/2017/10/05/connecting-the-dots/#optimize-object-constructor-subclassing)
## Tagged Templates
- [tagged templates](https://developer.mozilla.org/en-US/docs/Web/JavaScript/Reference/Template_literals#Tagged_templates)
are optimized by TurboFan and can be used where they apply
### Resources
- [optimize tagged templates - 2017](http://benediktmeurer.de/2017/10/05/connecting-the-dots/#optimize-tagged-templates)
## Typed Arrays and ArrayBuffer
- typed arrays are highly optimized by TurboFan
- calls to [`Function.prototype.apply` with TypedArrays as a parameter](http://benediktmeurer.de/2017/10/05/connecting-the-dots/#fast-path-for-typedarrays-in-functionprototypeapply)
were sped up which positively affected calls to `String.fromCharCode`
- [`ArrayBuffer` view checks](http://benediktmeurer.de/2017/10/05/connecting-the-dots/#optimize-arraybuffer-view-checks)
were improved by optimizing `ArrayBuffer.isView` and `TypedArray.prototype[@@toStringTag]`
- storing booleans inside TypedArrays was improved to where it now is identical to storing
integers
### Recommendations
- TypedArrays should be used wherever possible as it allows V8 to apply optimizations faster
and more aggressively than for instance with plain Arrays
- any remaining bottlenecks will be fixed ASAP as TypedArrays being fast is a prerequisite of
Webgl performing smoothly
### Resources
- [Connecting the dots - 2017](http://benediktmeurer.de/2017/10/05/connecting-the-dots)
## Object.is
- one usecase of `Object.is` is to check if a value is `-0` via `Object.is(v, -0)`
- previously implemented as C++ and thus couldn't be optimized
- now implemented via fast CodeStubAssembler which improved performance by ~14x
### Resources
- [Improve performance of Object.is - 2017](http://benediktmeurer.de/2017/10/05/connecting-the-dots/#improve-performance-of-objectis)
## Regular Expressions
- migrated away from JavaScript to minimize overhead that hurt performance in previous
implementation
- new design based on [CodeStubAssembler](compiler.md#codestubassembler)
- entry-point stub into RegExp engine can easily be called from CodeStubAssembler
- make sure to neither modify the `RegExp` instance or its prototype as that will interfere
with optimizations applied to regex operations
- [named capture groups](https://developers.google.com/web/updates/2017/07/upcoming-regexp-features#named_captures)
are supported starting with V8 v6.4
### Resources
- [Speeding up V8 Regular Expressions - 2017](https://v8.dev/blog/speeding-up-regular-expressions)
- [V8 release v6.4 - 2017](https://v8.dev/blog/v8-release-64)
- [RegExp named capture groups - 2017](http://2ality.com/2017/05/regexp-named-capture-groups.html#named-capture-groups)
## Destructuring
- _array destructuring_ performance on par with _naive_ ES5 equivalent
### Recommendations
- employ destructuring syntax freely in your applications
### Resources
- [High-performance ES2015 and beyond - 2017](https://v8.dev/blog/high-performance-es2015)
## Promises Async/Await
- native Promises in V8 have seen huge performance improvements as well as their use via
`async/await`
- V8 exposes C++ API allowing to trace through Promise lifecycle which is used by Node.js API
to provide insight into Promise execution
- DevTools async stacktraces make Promise debugging a lot easier
- DevTools _pause on exception_ breaks immediately when a Promise `reject` is invoked
### Resources
- [V8 Release 5.7 - 2017](https://v8.dev/blog/v8-release-57)k
## Generators
- weren't optimizable in the past due to control flow limitations in Crankshaft
- new compiler chain generates bytecodes which de-sugar complex generator control flow into
simpler local-control flow bytecodes
- these resulting bytecodes are easily optimized by TurboFan without knowing anything specific
about generator control flow
### Resources
- [High-performance ES2015 and beyond - 2017](https://v8.dev/blog/high-performance-es2015)
## Proxies
- [proxies](https://developer.mozilla.org/en-US/docs/Web/JavaScript/Reference/Global_Objects/Proxy)
required 4 jumps between C++ and JavaScript runtimes in the previous V8 compiler
implementation
- porting C++ bits to [CodeStubAssembler](compiler.md#codestubassembler) allows all execution
to happen inside the JavaScript runtime, resulting in 0 jumps between runtimes
- this sped up numerous proxy operations
- constructing proxies 49%-74% improvement
- calling proxies up to 500% improvement
- [has trap](https://developer.mozilla.org/en-US/docs/Web/JavaScript/Reference/Global_Objects/Proxy/handler/has)
71%-428% improvement, larger improvement when trap is present
- [set trap](https://developer.mozilla.org/en-US/docs/Web/JavaScript/Reference/Global_Objects/Proxy/handler/set)
27%-438% improvement, larger improvement when trap is set
### Recommendations
- while the use of proxies does incur an overhead, that overhead has been reduced drastically,
but still should be avoided in hot code paths
- however use proxies whenever the problem you're trying to solve calls for it
### Resources
- [Optimizing ES2015 proxies in V8 - 2017](https://v8.dev/blog/optimizing-proxies)
================================================
FILE: memory-profiling.md
================================================
# Memory Profiling
_find the previous version of this document at
[crankshaft/memory-profiling.md](crankshaft/memory-profiling.md)_
**Table of Contents** *generated with [DocToc](https://github.com/thlorenz/doctoc)*
- [Theory](#theory)
- [Objects](#objects)
- [Shallow size](#shallow-size)
- [Retained size](#retained-size)
- [GC roots](#gc-roots)
- [Storage](#storage)
- [Object Groups](#object-groups)
- [Retainers](#retainers)
- [Dominators](#dominators)
- [Causes for Leaks](#causes-for-leaks)
- [Tools](#tools)
- [DevTools Allocation Timeline](#devtools-allocation-timeline)
- [Allocation Stack](#allocation-stack)
- [Recording Allocation Timeline with Node.js](#recording-allocation-timeline-with-nodejs)
- [DevTools Allocation Profile](#devtools-allocation-profile)
- [Recording Allocation Profile with Node.js Manually](#recording-allocation-profile-with-nodejs-manually)
- [Recording Allocation Profile with Node.js Programatically](#recording-allocation-profile-with-nodejs-programatically)
- [DevTools Heap Snapshots](#devtools-heap-snapshots)
- [Taking Heap Snapshot with Node.js](#taking-heap-snapshot-with-nodejs)
- [Views](#views)
- [Color Coding](#color-coding)
- [Summary View](#summary-view)
- [Limiting included Objects](#limiting-included-objects)
- [Comparison View](#comparison-view)
- [Containment View](#containment-view)
- [Entry Points](#entry-points)
- [Dominators View](#dominators-view)
- [Retainer View](#retainer-view)
- [Constructors listed in Views](#constructors-listed-in-views)
- [Closures](#closures)
- [Advanced Comparison Technique](#advanced-comparison-technique)
- [Dynamic Heap Limit and Large HeapSnapshots](#dynamic-heap-limit-and-large-heapsnapshots)
- [Considerations to make code easier to debug](#considerations-to-make-code-easier-to-debug)
- [Resources](#resources)
- [blogs/tutorials](#blogstutorials)
- [videos](#videos)
- [slides](#slides)
## Theory
### Objects
[read](https://developer.chrome.com/devtools/docs/javascript-memory-profiling#object-sizes)
[read](https://developers.google.com/web/tools/chrome-devtools/memory-problems/memory-101#object_sizes)
#### Shallow size
[read](https://developers.google.com/web/tools/chrome-devtools/memory-problems/memory-101#shallow_size)
- memory held by object **itself**
- arrays and strings may have significant shallow size
#### Retained size
[read](https://developers.google.com/web/tools/chrome-devtools/memory-problems/memory-101#retained_size)
- memory that is freed once object itself is deleted due to it becoming unreachable from *GC roots*
- held by object *implicitly*
##### GC roots
- made up of *handles* that are created when making a reference from native code to a JS object ouside of V8
- found in heap snapshot under **GC roots > Handle scope** and **GC roots > Global handles**
- internal GC roots are window global object and DOM tree
#### Storage
[read](https://developers.google.com/web/tools/chrome-devtools/memory-problems/memory-101#javascript_object_representation) |
[read](https://github.com/thlorenz/v8-perf/blob/master/data-types.md)
- primitives are leafs or terminating nodes
- strings stored in *VM heap* or externally (accessible via *wrapper object*)
- *VM heap* is heap dedicated to JS objects and managed byt V8 gargabe collector
- *native objects* stored outside of *VM heap*, not managed by V8 garbage collector and are accessed via JS *wrapper
object*
- *cons string* object created by concatenating strings, consists of pairs of strings that are only joined as needed
- *arrays* objects with numeric keys, used to store large amount of data, i.e. hashtables (key-value-pair sets) are
backed by arrays
- *map* object describing object kind and layout
#### Object Groups
[read](https://developers.google.com/web/tools/chrome-devtools/memory-problems/memory-101#object_groups)
- *native objects* group is made up from objects holding mutual references to each other
- not represented in JS heap -> have zero size
- wrapper objects created instead, each holding reference to corresponding *native object*
- object group holds wrapper objects creating a cycle
- GC releases object groups whose wrapper objects aren't referenced, but holding on to single wrapper will hold whole
group of associated wrappers
### Retainers
[read](https://developers.google.com/web/tools/chrome-devtools/memory-problems/memory-101#objects_retaining_tree) |
[read](https://developer.chrome.com/devtools/docs/memory-analysis-101#retaining_paths)
- shown at the bottom inside heap snapshots UI
- *nodes/objects* labelled by name of constructor function used to build them
- *edges* labelled using property names
- *retaining path* is any path from *GC roots* to an object, if such a path doesn't exist the object is *unreachable*
and subject to being garbage collected
### Dominators
[read](https://developers.google.com/web/tools/chrome-devtools/memory-problems/memory-101#dominators) |
[read](https://en.wikipedia.org/wiki/Dominator_(graph_theory)) |
[read](https://developer.chrome.com/devtools/docs/memory-analysis-101#dominators)
- can be seen in [**Dominators** view](#dominators-view)
- tree structure in which each object has **one** dominator
- if *dominator* is deleted the *dominated* node is no longer reachable from *GC root*
- node **d** dominates a node **n** if every path from the start node to **n** must go through **d**
### Causes for Leaks
[read](http://addyosmani.com/blog/taming-the-unicorn-easing-javascript-memory-profiling-in-devtools/) *Understanding the Unicorn*
- logical errors in JS that keep references to objects that aren't needed anymore
- number one error: event listeners that haven't been cleaned up correctly
- this causes an object to be considered live by the GC and thus prevents it from being reclaimed
## Tools
### DevTools Allocation Timeline
[watch](https://youtu.be/LaxbdIyBkL0?t=50m33s) |
[read](https://developers.google.com/web/tools/chrome-devtools/memory-problems/allocation-profiler)
(slightly out of date especially WRT naming, but does show the allocation timeline profiler) |
[read](https://developers.google.com/web/tools/chrome-devtools/memory-problems/#identify_js_heap_memory_leaks_with_allocation_timelines)
- **preferred over snapshot comparisons** to track down memory leaks
- *blue* bars show memory allocations
- *grey* bars show memory deallocations
#### Allocation Stack
[slides](https://speakerdeck.com/addyosmani/javascript-memory-management-masterclass?slide=102)
[watch](https://youtu.be/LaxbdIyBkL0?t=51m30s)

- _Allocation_ view (selectable in top left) shows allocations grouped by function and whose
traces can be followed to see the function code responsible for the allocation
#### Recording Allocation Timeline with Node.js
- run app via `node --inspect` or `node --inspect-brk`
- open DevTools anywhere and click on the Node.js icon in the upper left corner to open a
dedicated Node.js DevTools instance
- select the _Memory_ tab and there select _Record allocation timeline_ and then click _Start_
- if you launched with `--inspect-brk` go back to the source panel to start debugging and
then return to _Memory_ tab
- stop profiling via the red circle on the upper left and examine the timeline and related
snapshots
- notice that the dropdown on the upper left has an _Allocations_ option which allows you to
inspect allocations by function

### DevTools Allocation Profile
[read](https://developers.google.com/web/tools/chrome-devtools/memory-problems/#allocation-profile)
- helps identify functions responsible for allocating memory
- in case of memory leaks or performance issues due to lots of allocatd objects it can be used
to track down which functions allocate most memory
#### Recording Allocation Profile with Node.js Manually
- run app via `node --inspect` or `node --inspect-brk`
- open DevTools anywhere and click on the Node.js icon in the upper left corner to open a
dedicated Node.js DevTools instance
- select the _Memory_ tab and there select _Record allocation profile_ and then click _Start_
- the application will continue running automatically if it was paused, i.e. due to use of
`--inspect-brk`
- stop profiling via the red circle on the upper left and select _Chart_ from the dropdown on
the left
- you will see a function execution stack with the functions that allocated the most memory or
had children that executed lots of memory being the widest

#### Recording Allocation Profile with Node.js Programatically
- the [sampling-heap-profiler](https://github.com/v8/sampling-heap-profiler) package allows to
trigger and stop heap samples programatically and write them to a file
- supposed to be lightweight enough for in-production use on servers
- generated snapshots can be saved offline, and be opened in DevTools later
### DevTools Heap Snapshots

[read](https://developers.google.com/web/tools/chrome-devtools/memory-problems/heap-snapshots#take_a_snapshot)
_out of date graphics, but most still works as shown_
[read](https://developers.google.com/web/tools/chrome-devtools/memory-problems/#discover_detached_dom_tree_memory_leaks_with_heap_snapshots)
_example is about DOM nodes, but techniques apply in general_
- taking heap snapshots is quite easy, but the challenge is understanding whats in them
- when investigating leaks it is a good idea to trigger garbage collection right before taking
a snapshot via the _collect garbage trashcan_ in the upper left
#### Taking Heap Snapshot with Node.js
- run app via `node --inspect`
- open DevTools anywhere and click on the Node.js icon in the upper left corner to open a
dedicated Node.js DevTools instance
- select the _Memory_ tab and there select _Take Heap Snapshot_ and then click _Take Sanpshot_
- perform this multiple times in order to to detect leaks as explained in [advanced comparison
technique](#advanced-comparison-technique)
#### Views
[overview](https://developer.chrome.com/devtools/docs/heap-profiling#basics) |
[overview](https://developers.google.com/web/tools/chrome-devtools/memory-problems/heap-snapshots#take_a_snapshot)
Even though views here are explained in conjunction with taking a heap snapshot, most of them
are also available when using any of the other techniques like _allocation profile_ or
_allocation timeline_.
##### Color Coding
[read](https://developers.google.com/web/tools/chrome-devtools/memory-problems/heap-snapshots#look_up_color_coding)
Properties and values are colored according to their types.
- *a:property* regular propertye, i.e. `foo.bar`
- *0:element* numeric index property, i.e. `arr[0]`
- *a:context var* variable in function context, accessible by name from inside function closure
- *a:system prop* added by JS VM and not accessible from JS code, i.e. V8 internal objects
- yellow objects are referenced by JS
- red objects are detached nodes which are referenced by yellow background object
##### Summary View
[read](https://developers.google.com/web/tools/chrome-devtools/memory-problems/heap-snapshots#summary_view)
- shows top level entries, a row per constructor
- columns for distance of the object to the *GC root*, number of object instances, shallow size and retained size.
- `@` character is objects’ unique ID, allowing you to compare heap snapshots on per-object basis
###### Limiting included Objects
- to the right of the View selector you can limit the objects by class name i.e. the name of the constructor function
- to the right of the class filter you can choose which objects to include in your summary (defaults to all)
- select *objects allocated between heapdump 1 and heapdump 2* to identify objects that are still around in *heapdump
3* but shouldn't be
- another way to archieve similar results is by comparing two heapdumps (see below)
##### Comparison View
[read](https://developers.google.com/web/tools/chrome-devtools/memory-problems/heap-snapshots#comparison_view)
- compares multiple snapshots to each other
- note that **the preferred way to investigate leaks is the [advanced comparison
technique](#advanced-comparison-technique)** using the summary view
- shows diff of both and delta in ref counts and freed and newly allocated memory
- used to find leaked objects
- after starting and completing (or canceling) the action, no garbage related to that action should be left
- note that garbage is collected each time a snapshot is taken, therefore remaining items are still referenced
1. Take bottom line snapshot
2. Perform operation that might cause a leak
3. Perform reverse operation and/or ensure that action `2` is complete and therefore all objects needed to perform it
should no longer be needed
4. Take second snapshot
5. Compare both snapshots
- select a Snapshot, then *Comparison* on the left and another Snapshot to compare it to on the right
- the *Size Delta* will tell you how much memory couldn't be collected

##### Containment View
[read](https://developers.google.com/web/tools/chrome-devtools/memory-problems/heap-snapshots#containment_view)
- birds eye view of apps object structure
- low level, allows peeking inside function closures and look at VM internal objects
- used to determine what keeps objects from being collected
###### Entry Points
- *GC roots* actual GC roots used by garbage collector
- *DOMWindow objects* (not present when profiling Node.js apps)
- *Native objects* (not present when profiling Node.js apps)
Additional entry points only present when profiling a Node.js app:
- *1::* global object
- *2::* global object
- *[4] Buffer* reference to Node.js Buffers
##### Dominators View
[read](https://developers.google.com/web/tools/chrome-devtools/memory-problems/heap-snapshots#dominators_view)
- only available once *Settings/General/Profiler/Show advanced heap snapshot properties* is checked and browser
refreshed afterwards
- shows dominators tree of heap
- similar to containment view but lacks property names since dominator may not have direct reference to all objects it
dominates
- useful to identify memory accumulation points
- also used to ensure that objects are well contained instead of hanging around due to GC not working properly
##### Retainer View
- always shown at bottom of the UI
- displays retaining tree of currently selected object
- retaining tree has references going outward, i.e. inner item references outer item
#### Constructors listed in Views
[read](https://developer.chrome.com/devtools/docs/javascript-memory-profiling#memory-profiling-faq)
- *(global property)* intermediate object between global object and an object refereced by it
- *(roots)* root entries in retaining view are entities that reference the selected object
- *(closure)* count of references to a group of objects through function closures
- *(array, string, number, regexp)* list of object types with properties which reference an Array, String, Number or
regular expression
- *(compiled code)* *SharedFunctionInfos* have no context and standibetween functions that do have context
- *(system)* references to builtin functions mainly `Map` (TODO: confirm and more details)
##### Closures
[read](http://zetafleet.com/blog/google-chromes-heap-profiler-and-memory-timeline)
- source of unintentional memory retention
- V8 will not clean up **any** memory of a closure untiil **all** members of the closure have gone out of scope
- therefore they should be used sparingly to avoid unnecessary [semantic
garbage](https://en.wikipedia.org/wiki/Garbage_(computer_science))
###### Advanced Comparison Technique
[slides](https://speakerdeck.com/addyosmani/javascript-memory-management-masterclass?slide=102)
Use at least three snapshots and compare those.
1. Take bottom line snapshot *Checkpoint 1*
2. Perform operation that might cause a leak
3. Take snapshot *Checkpoint 2*
4. Perform same operation as in *2.*
5. Take snapshot *Checkpoint 3*
- all memory needed to perform action the first time should have been collected by now
- any objects allocated between *Checkpoint 1* and *Checkpoint 2* should be no longer present in *Checkpoint 3*
- select *Snapshot 3* and from the dropdown on the right select *Objects allocated between Snapshot 1 and 2*
- ideally you see no *Objects* that are created by your application (ignore memory that is unrelated to your action,
i.e. *(compiled code)*)
- if you see any *Objects* that shouldn't be there but are in doubt create a 4th snapshot and select *Objects allocated
between Snapshot 1 and 2* as shown in the picture below

#### Dynamic Heap Limit and Large HeapSnapshots
[read](https://v8.dev/blog/heap-size-limit) _One small step for Chrome, one giant heap for V8_
- V8's ability to dynamically increase its heap limit allows taking heap snapshot when close to
running out of memory
- `set_max_old_space_size` is exposed to V8 embedders as part of the _ResourceConstraints_ API
to allow them to increase the heap limit
- DevTools added feature to pause application when close to running out of memory
1. pauses application and increases heap limit which allows taking a snapshot, inspect the
heap, evaluate expressions, etc.
2. developer can then clean up items that are taking up memory
3. application can be resumed
- you can try it by running `node --inspect examples/memory-hog` in this repo, and opening a
Node.js dedicated DevTools to see it it pause due to _potential out of memory crash_
## Considerations to make code easier to debug
The usefulness of the information presented in the views depends on how you authored your code. Here are a few
rules to make your code more debuggable.
Anonymous functions, i.e. `function() { ... }` show as `(anonymous)` and thus are hard to find
in your code. V8 + DevTools are getting smarter about this, i.e. for arrow functions where
`setTimeout(() => { ... }, TIMEOUT)` will show as `setTimeout` and you can navigate to the
function during a live profiling session.
However it is recommended to name your functions to make memory and performance profiling as
well as debugging your applications easier.
## Resources
### blogs/tutorials
Keep in mind that most of these are someehwat out of date albeit still useful.
- [chrome-docs memory profiling](https://developer.chrome.com/devtools/docs/javascript-memory-profiling)
- [chrome-docs Memory Analysis 101](https://developer.chrome.com/devtools/docs/memory-analysis-101) overlaps with chrome-docs memory profiling
- [chrome-docs heap profiling](https://developer.chrome.com/devtools/docs/heap-profiling) overlaps with chrome-docs memory profiling
- [Chasing Leaks With The Chrome DevTools Heap Profiler Views](https://plus.google.com/+AddyOsmani/posts/D3296iL3ZRE)
- [heap profiler in chrome dev tools](http://rein.pk/using-the-heap-profiler-in-chrome-dev-tools/)
- [performance-optimisation-with-timeline-profiles](http://addyosmani.com/blog/performance-optimisation-with-timeline-profiles/) time line data cannot be pulled out of a Node.js app currently, therfore skipping this for now
- [timeline and heap profiler](http://zetafleet.com/blog/google-chromes-heap-profiler-and-memory-timeline)
- [chromium blog](http://blog.chromium.org/2011/05/chrome-developer-tools-put-javascript.html)
- [Easing JavaScript Memory Profiling In Chrome DevTools](http://addyosmani.com/blog/taming-the-unicorn-easing-javascript-memory-profiling-in-devtools/)
- [Effectively Managing Memory at Gmail scale](http://www.html5rocks.com/en/tutorials/memory/effectivemanagement/)
- [javascript memory management masterclass](https://speakerdeck.com/addyosmani/javascript-memory-management-masterclass)
- [fixing memory leaks in drupal's editor](https://www.drupal.org/node/2159965)
- [writing fast memory efficient javascript](http://www.smashingmagazine.com/2012/11/05/writing-fast-memory-efficient-javascript/)
- [imgur avoiding a memory leak situation in JS](http://imgur.com/blog/2013/04/30/tech-tuesday-avoiding-a-memory-leak-situation-in-js/)
### videos
- [The Breakpoint Ep8: Memory Profiling with Chrome DevTools](https://www.youtube.com/watch?v=L3ugr9BJqIs)
- [Google I/O 2013 - A Trip Down Memory Lane with Gmail and DevTools](https://www.youtube.com/watch?v=x9Jlu_h_Lyw#t=1448)
- [Memory Profiling for Mere Mortals - 2016](https://www.youtube.com/watch?v=taADm6ndvVo)
### slides
- [Finding and debugging memory leaks in JavaScript with Chrome DevTools](http://www.slideshare.net/gonzaloruizdevilla/finding-and-debugging-memory-leaks-in-javascript-with-chrome-devtools)
- [eliminating memory leaks in Gmail](https://docs.google.com/presentation/d/1wUVmf78gG-ra5aOxvTfYdiLkdGaR9OhXRnOlIcEmu2s/pub?start=false&loop=false&delayms=3000#slide=id.g1d65bdf6_0_0)
- [Memory Profiling for Mere Mortals Slides - 2016](http://thlorenz.com/talks/memory-profiling.2016/book/)
================================================
FILE: package.json
================================================
{
"name": "v8-perf",
"version": "0.0.0",
"description": "Notes and resources related to v8 and thus Node.js performance.",
"scripts": {
"test-main": "set -e; for t in test/*.js; do $t; done",
"test-0.8": "nave use 0.8 npm run test-main",
"test-0.10": "nave use 0.10 npm run test-main",
"test-0.11": "nave use 0.11 npm run test-main",
"test": "npm run test-0.8 && npm run test-0.10 && npm run test-0.11"
},
"repository": {
"type": "git",
"url": "git://github.com/thlorenz/v8-perf.git"
},
"homepage": "https://github.com/thlorenz/v8-perf",
"dependencies": {
"ansicolors": "~0.3.2"
},
"devDependencies": {
"nave": "~0.4.3",
"tap": "~0.4.9"
},
"keywords": [],
"author": {
"name": "Thorsten Lorenz",
"email": "thlorenz@gmx.de",
"url": "http://thlorenz.com"
},
"license": {
"type": "MIT",
"url": "https://github.com/thlorenz/v8-perf/blob/master/LICENSE"
},
"engine": {
"node": ">=0.8"
}
}
================================================
FILE: runtime-functions.md
================================================
# V8 runtime functions
- V8 JS lib uses minimal set of C+ runtime functions (callable from JavaScript)
- lots of these have names starting with `%` and are visible
- others aren't visible as they are only called by generated code
- they are defined inside [v8/runtime.h](https://cs.chromium.org/chromium/src/v8/src/runtime/runtime.h)
- [test for these can be found here](https://github.com/v8/v8/tree/master/test/mjsunit/runtime-gen)
## Usage
- allow access via `--allow-natives-syntax`
- [example test using runtime
functions](https://github.com/thlorenz/v8-perf/blob/0d32979a42a05b4d8aa97bf42d017c7a02e9d8e3/test/fast-elements.js#L9-L13)
- examples on how to use them can be found inside [v8
tests](https://github.com/v8/v8/search?l=JavaScript&q=--allow-natives-syntax+size%3A%3E400&type=Code) (size set to `>400` to filter
out generated runtime functions)
## Resources
- [short doc on V8 wiki](https://v8.dev/docs/builtin-functions)
================================================
FILE: snapshots+code-caching.md
================================================
# Snapshots and Code Caching
This document explains techniques used by V8 in order to avoid having to re-compile and
optimized JavaScript whenever an application that embeds it (i.e. Chrome or Node.js) starts up
fresh.
**Table of Contents** *generated with [DocToc](https://github.com/thlorenz/doctoc)*
- [Code Caching](#code-caching)
- [Chrome's Use of Code Caching](#chromes-use-of-code-caching)
- [Resources](#resources)
- [Startup Snapshots](#startup-snapshots)
- [Custom Startup Snapshots](#custom-startup-snapshots)
- [Lazy Deserialization](#lazy-deserialization)
- [Resources](#resources-1)
## Code Caching
- lessens overhead of parsing + compiling script
- uses cached data to recreate previous compilation result
- exposed via V8's API to embedders
- pass `v8::ScriptCompiler::kProduceCodeCache` as an option when compiling script
- Note: V8 is deprecating `v8::ScriptCompiler::kProduceCodeCache` in favor of
`v8::ScriptCompiler::GetCodeCache`
- cached data is attached to source object to be retrieved via
`v8::ScriptCompiler::Source::GetCachedData`
- can be persisted for later
- later cache data can be attached to the source object and passed
`v8::ScriptCompiler::kConsumeCodeCache` as an option to cause V8 to bypass compileing the
code and deserialize the provided cache data instead
- V8 6.6 caches top level code as well as code generated _after_ script's top-level execution,
which means that lazily compiled functions are included in the cache
### Chrome's Use of Code Caching
Since Chrome embeds V8 it can make use of Code Caching and does so as follows.
- cold load: page loaded for the first time and thus no cached data is available
- warm load: page loaded before and caches compiled code along with the script file in disk
cache
- to qualify, the last load needs to be within the last 72 hours and the script source be
larger than 1KB
- hot load: page loaded twice before and thus can use the cached compiled code instead of
parsing + compiling the script again
### Resources
- [Code caching - 2015](https://v8.dev/blog/code-caching)
- [Code caching after execution - 2018](https://v8.dev/blog/v8-release-66)
- [V8 ScriptRunner source](https://cs.chromium.org/chromium/src/third_party/blink/renderer/bindings/core/v8/v8_script_runner.cc?l=269&rcl=c59618d0f92b57e4dcfb903f3c99bb0574eac340)
## Startup Snapshots
### Custom Startup Snapshots
- V8 uses snapshots and lazy deserialization to _retrieve_ previously optimized code for builtin
functions
- powerful snapshot API exposed to embedders via `v8::SnapshotCreator`
- among other things this API allows embedders to provide an additional script to customize a
start-up snapshot
- new contexts created from the snapshot are initialized in a state obtained _after_ the script
executed
- native C++ functions are recognized and encoded by the serializer as long as they have been
registered with V8
- serializer cannot _directly_ capture state outside of V8, thus outside state needs to be
attached to a JavaScript object via _embedder fields_
### Lazy Deserialization
[read](https://v8.dev/blog/lazy-deserialization)
- only about 30% of builtin functions are used on average
- deserialize builtin function from the snapshot when it is called the first time
- functions have _well-known_ positions within the snapshot's dedicated builtins area
- starting offset of each code object is kept in a dedicated section within builtins area
- additionally implemented lazy deserializations for bytecode handlers, which contain logic to
execute each bytecode within Ignition interpreter
- enabled in V8 v6.4 resulting in average V8's heap size savings of 540 KB
### Resources
- [custom startup snapshots - 2015](https://v8.dev/blog/custom-startup-snapshots)
somewhat out of date as embedder API changed and lazy deserialization was introduced
- [Energizing Atom with V8's custom start-up snapshot - 2017](https://v8.dev/blog/custom-startup-snapshots)
- [Lazy deserialization - 2018](https://v8.dev/blog/lazy-deserialization)
- [Speeding up Node.js startup using V8 snapshot](https://docs.google.com/document/d/1YEIBdH7ocJfm6PWISKw03szNAgnstA2B3e8PZr_-Gp4/edit)
================================================
FILE: test/_versions.js
================================================
#!/usr/bin/env node
var colors = require('ansicolors')
, format = require('util').format
, os = require('os');
var specs = { cpus: Object.keys(os.cpus()).length, platform: os.platform(), host: os.hostname() }
, v = process.versions
var msg =
format(colors.cyan('node') + ' %s', colors.yellow('v' + v.node))
+ format(colors.cyan(' | v8') + ' %s | ' + colors.cyan('uv') + ' %s', colors.yellow('v' + v.v8), colors.yellow('v' + v.uv))
+ format(' | %s cpus | %s platform | %s', colors.green(specs.cpus), colors.green(specs.platform), colors.green(specs.host))
console.log(msg + '\n');
================================================
FILE: test/boxing.js
================================================
#!/usr/bin/env node --allow-natives-syntax
'use strict';
/**
* ## 32-bit architecture
*
* 32-bit slot separation to hold a signed integer:
*
* - 1 bit to tag it as value
* - 1 bit for sign
* - 30 bits for actual value
*
* ### Producing 30 bits actual value
*
* #### In Detail (each left shift `<<` multiplies value by 2):
*
* ```
* pad > ((1 << 30) - 1).toString(2)
* '111111111111111111111111111111'
*
* pad > ((1 << 30) - 1).toString(2).length
* 30
*
* pad > ((1 << 30) - 1).toString(10)
* '1073741823'
*
* pad > (-(1 << 30)).toString(10)
* '-1073741824'
* ```
*
* #### Short
*
* pad > console.log('min: %d, max: %d', -Math.pow(2, 30), Math.pow(2, 30) - 1)
* min: -1073741824, max: 1073741823
*
* ## 64-bit architecture
*
* - on x64 SMIs are 32-bit signed integers represented at higher half of 64-bit value
* - format: [32 bit signed int] [31 bits zero padding] 0
*
* #### Short
*
* pad > console.log('min: %d, max: %d', -Math.pow(2, 31), Math.pow(2, 31) - 1)
* min: -2147483648, max: 2147483647
*
*/
var test = require('tape');
function isInteger(val) {
/*jshint ignore:start*/
return %_IsSmi(val);
/*jshint ignore:end*/
}
var is64Bit = /64/.test(process.arch);
var min, max;
if (is64Bit) {
min = -2147483648;
max = 2147483647;
} else {
min = -1073741824;
max = 1073741823;
}
test('\nintegers inside min/max ranges on a ' + process.arch + ' system' , function (t) {
t.ok(isInteger(min), 'min number is SMI')
t.ok(isInteger(max), 'max number is SMI')
t.end()
})
test('\nintegers outside min/max ranges on a ' + process.arch + ' system' , function (t) {
t.ok(!isInteger(min - 1), 'number smaller than min is not a SMI')
t.ok(!isInteger(max + 1), 'number larger than max is not a SMI')
t.end()
})
================================================
FILE: test/fast-elements.js
================================================
#!/usr/bin/env node --allow-natives-syntax
'use strict'
const test = require('tape')
const {
assertKind
, FAST_SMI_ONLY
, FAST_DOUBLE
, FAST
, DICTIONARY
} = require('./util/element-kind')
// https://cs.chromium.org/chromium/src/v8/src/objects/js-array.h?type=cs&q=kmaxFast&l=90
const kMaxFastArrayLength = 32 * 1024 * 1024
test('\narray that was not pre-allocated but grown on demand', function(t) {
const arr = []
let len = kMaxFastArrayLength + 1
while (len--) {
arr.push(len)
}
assertKind(t, arr, FAST_SMI_ONLY, `to ${kMaxFastArrayLength + 1} elements, is fast`)
arr[1] = undefined
const msg = (
`to ${kMaxFastArrayLength + 1} elements, becomes fast ` +
`(no longer Smi only) when assigning a slot to 'undefined'`
)
assertKind(t, arr, FAST, msg)
t.end()
})
function fillSmis(arr, max = arr.length) {
for (let i = 0; max > i && i < arr.length; i++) arr[i] = i
}
function fillDoubles(arr) {
for (let i = 0; i < arr.length; i++) arr[i] = i * 0.1
}
test('\narrays that were pre-allocated to hold a specific number of elements', function(t) {
const a = new Array(kMaxFastArrayLength)
const b = new Array(kMaxFastArrayLength + 1)
assertKind(t, a, FAST_SMI_ONLY, `to ${a.length}, is initially fast smis`)
assertKind(t, b, DICTIONARY, `to ${b.length}, is initially slow`)
fillSmis(b, 1E6)
assertKind(t, b, DICTIONARY, `to ${b.length}, and filled partially with Smis, is still slow`)
fillSmis(b, b.length)
assertKind(t, b, FAST_SMI_ONLY, `to ${b.length} and filled completely with Smis, becomes fast smis`)
fillDoubles(a, 10)
assertKind(t, a, FAST_DOUBLE, `to ${a.length}, and filled partially with Doubles becomes fast doubles`)
t.end()
})
================================================
FILE: test/package.json
================================================
{
"name": "v8-perf-tests",
"devDependencies": {
"ansicolors": "~0.3.2",
"tape": "~4.9.0"
}
}
================================================
FILE: test/util/element-kind.js
================================================
'use strict'
// From: https://cs.chromium.org/chromium/src/v8/test/mjsunit/opt-elements-kind.js
const FAST_SMI_ONLY = 'fast smi only elements'
const FAST = 'fast elements'
const FAST_DOUBLE = 'fast double elements'
const DICTIONARY = 'dictionary elements'
const FIXED_INT8 = 'fixed int8 elements'
const FIXED_UINT8 = 'fixed uint8 elements'
const FIXED_INT16 = 'fixed int16 elements'
const FIXED_UINT16 = 'fixed uint16 elements'
const FIXED_INT32 = 'fixed int32 elements'
const FIXED_UINT32 = 'fixed uint32 elements'
const FIXED_FLOAT32 = 'fixed float32 elements'
const FIXED_FLOAT64 = 'fixed float64 elements'
const FIXED_UINT8_CLAMPED = 'fixed uint8_clamped elements'
function getKind(obj) {
if (%HasSmiElements(obj)) return FAST_SMI_ONLY
if (%HasObjectElements(obj)) return FAST
if (%HasDoubleElements(obj)) return FAST_DOUBLE
if (%HasDictionaryElements(obj)) return DICTIONARY
if (%HasFixedInt8Elements(obj)) {
return FIXED_INT8
}
if (%HasFixedUint8Elements(obj)) {
return FIXED_UINT8
}
if (%HasFixedInt16Elements(obj)) {
return FIXED_INT16
}
if (%HasFixedUint16Elements(obj)) {
return FIXED_UINT16
}
if (%HasFixedInt32Elements(obj)) {
return FIXED_INT32
}
if (%HasFixedUint32Elements(obj)) {
return FIXED_UINT32
}
if (%HasFixedFloat32Elements(obj)) {
return FIXED_FLOAT32
}
if (%HasFixedFloat64Elements(obj)) {
return FIXED_FLOAT64
}
if (%HasFixedUint8ClampedElements(obj)) {
return FIXED_UINT8_CLAMPED
}
}
function assertKind(t, obj, expected, msg = '') {
const actual = getKind(obj)
t.equal(actual, expected, `${msg} (elements kind: ${actual})`)
}
module.exports = {
assertKind
, getKind
, FAST_SMI_ONLY
, FAST
, FAST_DOUBLE
, DICTIONARY
, FIXED_INT8
, FIXED_UINT8
, FIXED_INT16
, FIXED_UINT16
, FIXED_INT32
, FIXED_UINT32
, FIXED_FLOAT32
, FIXED_FLOAT64
, FIXED_UINT8_CLAMPED
}
### Information Stored in Function Closures
```
+-------------+
| Closure |-------+-------------------+--------------------+
+-------------+ | | |
↓ ↓ ↓
+-------------+ +--------------------+ +-----------------+
| Context | | SharedFunctionInfo | | Feedback Vector |
+-------------+ +--------------------+ +-----------------+
| | Invocation Count|
| +-----------------+
| | Optimized Code |
| +-----------------+
| | Binary Op |
| +-----------------+
|
| +-----------------+
+-----------> | Byte Code |
+-----------------+
```
- function _Closure_ links to _Context_, _SharedFunctionInfo_ and _FeedbackVector_
- Context: contains values for the _free variables_ of the function
and provides access to global object
- [free variables](https://en.wikipedia.org/wiki/Free_variables_and_bound_variables)
are variables that are neither local nor paramaters to the function, i.e. they are in scope
of the function but declared outside of it
- SharedFunctionInfo: general info about the function like source position and bytecode
- FeedbackVector: collects feedback via ICs as explained above
## TurboFan
[watch TurboFan history](https://youtu.be/EdFDJANJJLs?t=10m22s) | [watch TurboFan goals](https://youtu.be/EdFDJANJJLs?t=11m44s)
TurboFan is a simple compiler + backend responsible for the following:
- instruction selection + scheduling
- innovative scheduling algorithm makes use of reordering freedom ([sea of nodes](#sea-of-nodes)) to move
code out of loops into less frequently executed paths
- register allocation
- code generation
- generates fast code via _speculative optimization_ from the feedback collected while running
unoptimized bytecode
- architecture specific optimizations exploit features of each target platform for best quality
code
TurboFan is not just an optimizing compiler:
- interpreter bytecode handlers run on top of TurboFan
- builtins benefit from TurboFan
- code stubs / IC subsystem runs on top of TurboFan
- web assembly code generation (also runs on top of TurboFan by using its back-end passes)
## Speculative Optimization
[watch](https://youtu.be/VhpdsjBUS3g?t=18m53s)
- recompiles and optimizes hot code identified by the runtime profiler
- compiler speculates that kinds of values seen in the past will be see in the future as well
- generates optimized code just for those cases which is not only smaller but also executes at
peak speed
### `add` Example of Ignition and Feedback Vector
```
Bytecode Interpreter State Machine Stack
+--------------+ +-------------------+ +--------------+
| StackCheck | <----+ | stack pointer |---+ | receiver |
+--------------+ | +-------------------+ | +--------------+
| Ldar a1 | +-- | program counter | | | a0 |
+--------------+ +-------------------+ | +--------------+
| Add a0, [0] | | accumulator | | | a1 |
+--------------+ +-------------------+ | +--------------+
| Return | | | return addr. |
+--------------+ | +--------------+
| | context |
| +--------------+
| | closure |
| +--------------+
+---> | frame pointer|
+--------------+
| ... |
+--------------+
```
#### Bytecode annotated
```asm
StackCheck ; check for stack overflow
Ldar a1 ; load a1 into accumulator register
Add a0, [0] ; load value from a0 register and add it to value in accumulator register
Return ; end execution, return value in accum. reg. and tranfer control to caller
```
#### Feedback Used To Optimize Code
[slides](https://docs.google.com/presentation/d/1wZVIqJMODGFYggueQySdiA3tUYuHNMcyp_PndgXsO1Y/edit#slide=id.g19e50fc32a_1_24)
- the `[0]` of `Add a0, [0]` refers to _feedback vector slot_ where Ignition stores profiling
info which later is used by TurboFan to optimize the function
- `+` operator needs to perform a huge amount of checks to cover all cases, but if we assume
that we always add numbers we don't have to handle those other cases
- additionally numbers don't call side effects and thus the compiler knows that it can
eliminate the expression as part of the optimization
## Deoptimization
[slides](https://docs.google.com/presentation/d/1Z6oCocRASCfTqGq1GCo1jbULDGS-w-nzxkbVF7Up0u0/edit#slide=id.p) |
[slides](https://docs.google.com/presentation/d/1wZVIqJMODGFYggueQySdiA3tUYuHNMcyp_PndgXsO1Y/edit#slide=id.g19ee040be6_0_180) |
[watch](https://youtu.be/UJPdhx5zTaw?t=36m50s)
- optimizations are speculative and assumptions are made
- if assumption is violated
- function deoptimized
- execution resumes in Ignition bytecode
- in short term execution slows down
- normal to occur
- more info about about function collected
- _better_ optimization attempted
- if assumptions are violated again, deoptimized again and start over
- too many deoptimizations cause function to be sent to *deoptimization hell*
- considered not optimizable and no optimization is **ever** attempted again
- assumptions are verified as follows:
- _code objects_ are verified via a `test` in the _prologue_ of the generated machine code for a
particular function
- argument types are verified before entering the function body
### Bailout
[watch bailout example](https://youtu.be/u7zRSm8jzvA?t=26m43s) | [watch walk through TurboFan optimized code with bailouts](https://youtu.be/u7zRSm8jzvA?t=19m36s)
- when assumptions made by optimizing compiler don't hold it bails out to deoptimized code
- on bail out the code object is _thrown_ away as it doesn't handle the current case
- _trampoline_ to unoptimized code (stored in SharedFunctionInfo) used to _jump_ and continue
execution
#### Example of x86 Assembly Code including Checks and Bailouts
```asm
; x64 machine code generated by TurboFan for the Add Example above
; expecting that both parameters and the result are Smis
leaq rcx, [rip+0x0] ; load memory address of instruction pointer into rcx
movq rcx, [rcx-0x37] ; copy code object stored right in front into rcx
testb [rcx+0xf], 0x1 ; check if code object is valid
jnz CompileLazyDeoptimizedCode ; if not bail out via a jump
[ .. ] ; push registers onto stack
cmpq rsp, [r13+0xdb0] ; enough space on stack to execute code?
jna StackCheck ; if not we're sad and raise stack overflow
movq rax, [rbp+0x18] ; load x into rax
test al, 0x1 ; check tag bit to ensure x is small integer
jnz Deoptimize ; if not bail
movq rbx, [rbp+0x10] ; load y into rbx
testb rbx, 0x1 ; check tag bit to ensure y is small integer
jnz Deoptimize ; if not bail
[ .. ] ; do some nifty conversions via shifts
; and store results in rdx and rcx
addl rdx, rcx ; perform add including overflow check
jo Deoptimize ; if overflowed bail
[ .. ] ; cleanup and return to caller
```
### Lazy Cleanup of Optimized Code
[read](https://v8.dev/blog/lazy-unlinking)
- code objects created during optimization are no longer useful after deoptimization
- on deoptimization embedded fields of code object are invalidated, however code object itself
is kept alive
- for performance reasons unlinking of code object is postponed until next invocation of the
function in question
### Deoptimization Loop
[read](https://v8.dev/blog/v8-release-65)
- occurred when optimized code deoptimized and there was _no way to learn what went wrong_
- one cause was altering the shape of the array in the callback function of a second order
array builtin, i.e. by changing it's length
- TurboFan kept trying to optimized and gave up after ~30 attempts
- starting with V8 v6.5 this is detected and array built in is no longer inlined at that site
on future optimization attempts
### Causes for Deoptimization
#### Modifying Object Shape
[watch](https://youtu.be/VhpdsjBUS3g?t=21m00s)
- added fields (order matters) to object generate id of hidden class
- adding more fields later on generates new class id which results in code using Point that now gets Point' to be
deoptimized
[watch](https://youtu.be/VhpdsjBUS3g?t=21m45s)
[watch](https://youtu.be/UJPdhx5zTaw?t=12m18s)
```js
function Point(x, y) {
this.x = x;
this.y = y;
}
var p = new Point(1, 2); // => hidden Point class created
// ....
p.z = 3; // => another hidden class (Point') created
```
- `Point` class created, code still deoptimized
- functions that have `Point` argument are optimized
- `z` property added which causes `Point'` class to be created
- functions that get passed `Point'` but were optimized for `Point` get deoptimized
- later functions get optimized again, this time supporting `Point` and `Point'` as argument
- [detailed explanation](http://v8-io12.appspot.com/index.html#30)
##### Considerations
- avoid hidden class changes
- initialize all members in the **class constructor** or the **prototype constructor function**
and **in the same order**
- this creates one place in your code base where properties are assigned to an Object
- you may use Object literals, i.e. `const a = {}` or `const a = { b: 1 }`, as they also
benefit from hidden classes, but the creation of those may be spread around your code base
and it becomes much harder to verify that you are assigning the same properties in the same
order
#### Class Definitions inside Functions
```js
function createPoint(x, y) {
class Point {
constructor(x, y) {
this.x = x
this.y = y
}
distance(other) {
const dx = Math.abs(this.x - other.x)
const dy = Math.abs(this.y - other.y)
return dx + dy
}
}
return new Point(x, y)
}
function usePoint(point) {
// do something with the point
}
```
- defining a class inside `createPoint` results in its definition to be executed on each
`createPoint` invocation
- executing that definition causes a new prototype to be created along with methods and
constructor
- thus each new point has a different prototype and thus a different object shape
- passing these objects with differing prototypes to `usePoint` makes that function
become polymorphic
- V8 gives up on polymorphism after it has seen **more than 4** different object shapes, and enters
megamorphic state
- as a result `usePoint` won't be optimized
- pulling the `Point` class definition out of the `createPoint` function fixes that issue as
now the class definition is only executed once and all point prototypes match
- the performance improvement resulting from this simple change is substantial, the exact
speedup factor depends on the `usePoint` function
- when class or prototype definition is collected it's hidden class (associated maps) are
collected as well
- need to re-learn hidden classes for short living objects including metadata and all feedback
collected by inline caches
- references to maps and JS objects from optimized code are considered weak to avoid memory
leaks
##### Considerations
- always declare classes at the script scope, i.e. _never inside functions_ when it is
avoidable
##### Resources
- [optimization patterns part1](http://benediktmeurer.de/2017/06/20/javascript-optimization-patterns-part1/)
- [The case of temporary objects in Chrome](http://benediktmeurer.de/2016/10/11/the-case-of-temporary-objects-in-chrome/)
### Inlining Functions
[watch](https://youtu.be/u7zRSm8jzvA?t=26m12s)
- smart heuristics, i.e. how many times was the function called so far
## Background Compilation
[read](https://v8.dev/blog/background-compilation)
- part of the compilation pipeline that doesn't acess objects on the JavaScript heap run on a
background thread
- via some optimization to the bytecode compiler and how AST is stored and accessed, almost all
of the compilation of a script happens on a background thread
- only short AST internalizatoin and bytecode finalization happens on main thread
## Sea Of Nodes
[slides](https://docs.google.com/presentation/d/1sOEF4MlF7LeO7uq-uThJSulJlTh--wgLeaVibsbb3tc/edit#slide=id.g5499b9c42_074) |
[slides](https://docs.google.com/presentation/d/1sOEF4MlF7LeO7uq-uThJSulJlTh--wgLeaVibsbb3tc/edit#slide=id.g5499b9c42_0105) |
[read](http://darksi.de/d.sea-of-nodes/)
- doesn't include total order of program, but _control dependencies_ between operations
- instead expresses many possible legal orderings of code
- most efficient ordering and placement can be derived from the _nodes_
- depends on control dominance, loop nesting, register pressure
- _graph reductions_ applied to further optimize
- total ordering (traditional CFG) is built from that, so code can be generated and registers
allocated
- entrypoints are TurboFan optimizing compiler and WASM Compiler
### Advantages
[slide](https://docs.google.com/presentation/d/1H1lLsbclvzyOF3IUR05ZUaZcqDxo7_-8f4yJoxdMooU/edit#slide=id.g18ceb14729_0_92)
Flexibility of sea of nodes approach enables the below optimizations.
- better redundant code elimination due to more code motion
- loop peeling
- load/check elimination
- escape analysis [watch](https://youtu.be/KiWEWLwQ3oI?t=7m25s) | [watch](https://youtu.be/KiWEWLwQ3oI?t=17m25s)
- eliminates non-escaping allocations
- aggregates like `const o = { foo: 1, bar: 2}` are replaces with scalars like
`const o_foo = 1; const o_bar = 2`
- representation selection
- optimizing of number representation via type and range analysis
- [slides](https://docs.google.com/presentation/d/1sOEF4MlF7LeO7uq-uThJSulJlTh--wgLeaVibsbb3tc/edit#slide=id.g5499b9c42_094)
- redundant store elimination
- control flow elimination
- turns branch chains into switches
- allocation folding and write barrier elimination
- verify var is only assigned once (SSA - single static assignment)
- compiler may move the assignment anywhere, i.e. outside a loop
- may remove redundant checks
## CodeStubAssembler
[watch](https://youtu.be/M1FBosB5tjM?t=23m38s) |
[read](https://v8.dev/blog/csa) |
[slides](https://docs.google.com/presentation/d/1u6bsgRBqyVY3RddMfF1ZaJ1hWmqHZiVMuPRw_iKpHlY/edit#slide=id.g17a3a2e7fd_0_114) |
[slides](https://docs.google.com/presentation/d/1u6bsgRBqyVY3RddMfF1ZaJ1hWmqHZiVMuPRw_iKpHlY/edit#slide=id.p)
### What is the CodeStubAssember aka CSA?
- defines a portable assembly language built on top of TurboFan's backend and adds a C++ based
API to generate highly portable TurboFan machine-level IR directly
- can generate highly efficient code for parts of slow-paths in JS without crossing to C++
runtime
- API includes very low-level operations (pretty much assembly), _primitive_ CSA instructions
that translate directly into one or two assembly instructions
- Macros include fixed set of pre-defined CSA instructions corresponding to most commonly used
assembly instructions

_CSA and JavaScript compilation pipelines_
### Why is it a Game Changer?
The CSA allows much faster iteration when implementing and optimizing new language features due
to the following characteristics.
- CSA includes type verification at IR level to catch many correctness bugs at compile time
- CSA's instruction selector ensures that optimal code is generated on all platforms
- CSA's performs register allocations automatically
- CSA understands API calling conventions, both standard C++ and internal V8 register-based,
i.e. entry-point stubs into C++ can easily be called from CSA, making trivial to
interoperate between CSA generated code and other parts of V8
- CSA-based built in functionality can easily be inlined into Ignition bytecode handlers to
improve its performance
- builtins are coded in that DSL (no longer [self hosted](https://en.wikipedia.org/wiki/Self-hosting))
- very fast property accesses
#### Improvements via CodeStubAssembler
[slide](https://docs.google.com/presentation/d/1H1lLsbclvzyOF3IUR05ZUaZcqDxo7_-8f4yJoxdMooU/edit#slide=id.g18ceb14721_0_50)
CSA is the basis for fast builtins and thus was used to speed up multiple builtins. Below are a
few examples.
- [faster Regular Expressions](./js-feature-improvements.md#regular-expressions) sped up by
removing need to switch between C++ and JavaScript runtimes
- `Object.create` has predictable performance by using CodeStubAssembler
- `Function.prototype.bind` achieved final boost when ported to CodeStubAssembler for a total
60,000% improvement
- `Promise`s where ported to CodeStubAssembler which resulted in 500% speedup for `async/await`
## Recommendations
[watch](https://youtu.be/M1FBosB5tjM?t=52m54s) |
[watch](https://youtu.be/HDuSEbLWyOY?t=10m36s) |
[slide](https://docs.google.com/presentation/d/1_eLlVzcj94_G4r9j9d_Lj5HRKFnq6jgpuPJtnmIBs88/edit#slide=id.g2134da681e_0_577)
- performance of your code is improved
- less _anti patterns_ aka _you are holding it wrong_
- write idiomatic, declarative JavaScript as in _easy to read_ JavaScript with good data structures and algorithms, including all language features (even functional ones) will execute with predictable, good performance
- instead focus on your application design
- now can handle exceptions where it makes sense as `try/catch/finally` no longer ruins the performance of a function
- use appropriate collections as their performance is on par with the raw use of Objects for same task
- Maps, Sets, WeakMaps, WeakSets used where it makes sense results in easier maintainable JavaScript as they offer specific functionality to iterate over and inspect their values
- avoid engine specific workarounds aka _CrankshaftScript_, instead file a bug report if you discover a bottleneck
## Resources
- [V8: Behind the Scenes (November Edition) - 2016](http://benediktmeurer.de/2016/11/25/v8-behind-the-scenes-november-edition/)
- [V8: Behind the Scenes (February Edition - 2017)](http://benediktmeurer.de/2017/03/01/v8-behind-the-scenes-february-edition/)
- [An Introduction to Speculative Optimization in V8 - 2017](http://benediktmeurer.de/2017/12/13/an-introduction-to-speculative-optimization-in-v8/)
- [High-performance ES2015 and beyond - 2017](https://v8.dev/blog/high-performance-es2015)
- [Launching Ignition and TurboFan - 2017](https://v8.dev/blog/launching-ignition-and-turbofan)
- [lazy unlinking of deoptimized functions - 2017](https://v8.dev/blog/lazy-unlinking)
- [Taming architecture complexity in V8 — the CodeStubAssembler - 2017](https://v8.dev/blog/csa)
- [V8 release v6.5 - 2018](https://v8.dev/blog/v8-release-65)
- [Background compilation - 2018](https://v8.dev/blog/background-compilation)
- [Sea of Nodes - 2015](http://darksi.de/d.sea-of-nodes/)
### Slides
- [CodeStubAssembler: Redux - 2016](https://docs.google.com/presentation/d/1u6bsgRBqyVY3RddMfF1ZaJ1hWmqHZiVMuPRw_iKpHlY/edit#slide=id.p)
- [Deoptimization in V8 - 2016](https://docs.google.com/presentation/d/1Z6oCocRASCfTqGq1GCo1jbULDGS-w-nzxkbVF7Up0u0/edit#slide=id.p)
- [Turbofan IR - 2016](https://docs.google.com/presentation/d/1Z9iIHojKDrXvZ27gRX51UxHD-bKf1QcPzSijntpMJBM/edit#slide=id.p)
- [TurboFan: A new code generation architecture for V8 - 2017](https://docs.google.com/presentation/d/1_eLlVzcj94_G4r9j9d_Lj5HRKFnq6jgpuPJtnmIBs88/edit#slide=id.p)
- [Fast arithmetic for dynamic languages - 2016](https://docs.google.com/presentation/d/1wZVIqJMODGFYggueQySdiA3tUYuHNMcyp_PndgXsO1Y/edit#slide=id.p)
- [An overview of the TurboFan compiler - 2016](https://docs.google.com/presentation/d/1H1lLsbclvzyOF3IUR05ZUaZcqDxo7_-8f4yJoxdMooU/edit#slide=id.p)
- [TurboFan JIT Design - 2016](https://docs.google.com/presentation/d/1sOEF4MlF7LeO7uq-uThJSulJlTh--wgLeaVibsbb3tc/edit#slide=id.p)
### Videos
- [performance improvements in latest V8 - 2017](https://youtu.be/HDuSEbLWyOY?t=4m58s)
- [V8 and how it listens to you - ICs and FeedbackVectors - 2017](https://www.youtube.com/watch?v=u7zRSm8jzvA)
- [Escape Analysis in V8 - 2018](https://www.youtube.com/watch?v=KiWEWLwQ3oI)
### More Resources
- [TurboFan wiki](https://v8.dev/docs/turbofan)
================================================
FILE: crankshaft/compiler.md
================================================
**Table of Contents** *generated with [DocToc](http://doctoc.herokuapp.com/)*
- [v8 Compiler](#v8-compiler)
- [Components](#components)
- [Base Compiler](#base-compiler)
- [Runtime Profiler](#runtime-profiler)
- [Optimizing Compiler](#optimizing-compiler)
- [Deoptimization Support](#deoptimization-support)
- [Optimized Code vs. Inline Caches and Unoptimized Code](#optimized-code-vs-inline-caches-and-unoptimized-code)
- [Full Compiler](#full-compiler)
- [Inline Caches](#inline-caches)
- [Monomorphism vs. Polymorphism](#monomorphism-vs-polymorphism)
- [Considerations](#considerations)
- [Optimizing Compiler](#optimizing-compiler-1)
- [Deoptimization](#deoptimization)
- [Causes for Deoptimization](#causes-for-deoptimization)
- [Modifying Object Shape](#modifying-object-shape)
- [Considerations](#considerations-1)
- [Efficiently Representing Values and Tagging](#efficiently-representing-values-and-tagging)
- [Considerations](#considerations-2)
- [Arrays](#arrays)
- [Fast Elements](#fast-elements)
- [Characteristics](#characteristics)
- [Dictionary Elements](#dictionary-elements)
- [Characteristics](#characteristics-1)
- [Double Array Unboxing](#double-array-unboxing)
- [Typed Arrays](#typed-arrays)
- [Float64Array](#float64array)
- [Considerations](#considerations-3)
- [Resources](#resources)
# v8 Compiler
## Components
### Base Compiler
- is used for all code initially
- generates code quickly without heavy optimizations
- compilation with the base compiler is very fast generates little code
### Runtime Profiler
- monitors the running system and identifies hot code
### Optimizing Compiler
- recompiles and optimizes hot code identified by the runtime profiler
- uses static single assignment form to perform optimizations
- loop-invariant code motion
- linear-scan register allocation
- inlining.
- optimization decisions are based on type information collected while running the code produced by the base compiler
### Deoptimization Support
- allows the optimizing compiler to be optimistic in the assumptions it makes when generating code
- deoptimization support allows to bail out to the code generated by the base compiler if the assumptions in the
optimized code turn out to be too optimistic
## Optimized Code vs. Inline Caches and Unoptimized Code
[watch](http://youtu.be/VhpdsjBUS3g?t=18m53s)
[watch](http://youtu.be/UJPdhx5zTaw?t=26m30s)
### Full Compiler
[slide](http://v8-io12.appspot.com/index.html#54)
- generates code for any JavaScript
- all code starts unoptimized
- initial (quick) JIT
- is not great and knows (almost) nothing about types
- needed to start executing code ASAP
- uses Inline Caches (ICs) to refine knowledge about types at runtime
### Inline Caches
[slide](http://v8-io12.appspot.com/index.html#55)
[Inline Caches implemented in JavaScript](http://mrale.ph/blog/2012/06/03/explaining-js-vms-in-js-inline-caches.html)
- gather knowledge about types while program runs
- **type dependent** code for operations given specific hidden classes as inputs
- 1. validate type assumptions (are hidden classes as expected)
- 2. do work
- change at runtime via backpatching as more types are discovered to generate new ICs
[watch](http://youtu.be/UJPdhx5zTaw?t=28m44s) | [slide](http://v8-io12.appspot.com/index.html#56)
Inline Caches alone without optimizing compiler step make huge performance difference (20x speedup).
### Monomorphism vs. Polymorphism
[watch](http://youtu.be/UJPdhx5zTaw?t=31m30s) | [slide](http://v8-io12.appspot.com/index.html#61)
- operations are monomorphic if hidden classes of arguments are **always** same
- all others are polymorphic at best and megamorphic at worst
- monomorphic operations are easier optimized
#### Considerations
- prefer monomorphic over polymorphic functions wherever possible
### Optimizing Compiler
[watch](http://youtu.be/UJPdhx5zTaw?t=33m12s) | [slide](http://v8-io12.appspot.com/index.html#65)
- if function executes a lot it becomes **hot**
- hot function is re-compiled with optimizing compiler
- optimistically
- lots of assumptions made from the calls made to that function so far
- type information takend from ICs
- operations get inlined speculatively using historic information
- monomorphic functions/constructors can be inlined entirely
- inlining allows even further optimizations
### Deoptimization
[watch](http://youtu.be/UJPdhx5zTaw?t=36m50s) | [slide](http://v8-io12.appspot.com/index.html#78)
- optimizations are speculative and assumptions are made
- if assumption is violated
- function deoptimized
- execution resumes in full compiler code
- in short term execution slows down
- normal to occur
- more info about about function collected
- *better* optimization attempted
- if assumptions are violated again, deoptimized again and start over
- too many deoptimizations cause function to be sent to *deoptimization hell*
- considered not optimizable and no optimization is **ever** attempted again
- certain constructs like `try/catch` are considered not optimizable and functions containing it go straight to
*deoptimization hell* due to **bailout** [watch](http://youtu.be/UJPdhx5zTaw?t=35m23s)
None of this can be diagnosed with Chrome Devtools at this point.
### Causes for Deoptimization
#### Modifying Object Shape
[watch](http://youtu.be/VhpdsjBUS3g?t=21m00s)
- added fields (order matters) to object generate id of hidden class
- adding more fields later on generates new class id which results in code using Point that now gets Point' to be
deoptimized
[watch](http://youtu.be/VhpdsjBUS3g?t=21m45s)
[watch](http://youtu.be/UJPdhx5zTaw?t=12m18s)
```js
function Point(x, y) {
this.x = x;
this.y = y;
}
var p = new Point(1, 2); // => hidden Point class created
// ....
p.z = 3; // => another hidden class (Point') created
```
- `Point` class created, code still deoptimized
- functions that have `Point` argument are optimized
- `z` property added which causes `Point'` class to be created
- functions that get passed `Point'` but were optimized for `Point` get deoptimized
- later functions get optimized again, this time supporting `Point` and `Point'` as argument
- [detailed explanation](http://v8-io12.appspot.com/index.html#30)
##### Considerations
- avoid hidden class changes
- initialize all members in **constructor function** and **in the same order**
## Efficiently Representing Values and Tagging
[watch](http://youtu.be/UJPdhx5zTaw?t=15m35s) | [slide](http://v8-io12.appspot.com/index.html#34)
- v8 passes around 32bit numbers to represent all values
- bottom bit reserved as tag to signify if value is a SMI (small integer) or a pointer to an object
[watch](http://youtu.be/UJPdhx5zTaw?t=10m05ss) | [slide](http://v8-io12.appspot.com/index.html#35)
```
| object pointer | 1 |
or
| 31-bit-signed integer (SMI) | 0 |
```
- numbers bigger than 31 bits are boxed
- stored inside an object referenced via a pointer
- adds extra overhead (at a minimum an extra lookup)
### Considerations
- prefer SMIs for numeric values whenever possible
## Arrays
[watch](http://youtu.be/UJPdhx5zTaw?t=17m25s) | [slide](http://v8-io12.appspot.com/index.html#38)
v8 has two methods for storing arrays.
### Fast Elements
- compact keysets
- linear storage buffer
#### Characteristics
- contiguous (non-sparse)
- `0` based
- smaller than 64K
### Dictionary Elements
- hash table storage
- slow access
#### Characteristics
- sparse
- large
### Double Array Unboxing
[watch](http://youtu.be/UJPdhx5zTaw?t=20m20s) | [slide](http://v8-io12.appspot.com/index.html#45)
- Array's hidden class tracks element types
- if all doubles, array is unboxed
- wrapped objects layed out in linear buffer of doubles
- each element slot is 64-bit to hold a double
- SMIs that are currently in Array are converted to doubles
- very efficient access
- storing requires no allocation as is the case for boxed doubles
- causes hidden class change
- careless array manipulation may cause overhead due to boxing/unboxing [watch](http://youtu.be/UJPdhx5zTaw?t=21m50s) |
[slide](http://v8-io12.appspot.com/index.html#47)
### Typed Arrays
[blog](http://mrale.ph/blog/2011/05/12/dangers-of-cross-language-benchmark-games.htm) |
[spec](https://www.khronos.org/registry/typedarray/specs/latest/)
- difference is in semantics of indexed properties
- v8 uses unboxed backing stores for such typed arrays
#### Float64Array
- gets 64-bit allocated for each element
### Considerations
- don't pre-allocate large arrays (`>64K`), instead grow as needed, to avoid them being considered sparse
- do pre-allocate small arrays to correct size to avoid allocations due to resizing
- don't delete elements
- don't load uninitialized or deleted elements [watch](http://youtu.be/UJPdhx5zTaw?t=19m30s) |
[slide](http://v8-io12.appspot.com/index.html#43)
- use literal initializer for Arrays with mixed values
- don't store non-numeric values in numeric arrays
- causes boxing and efficient code that was generated for manipulating values can no longer be used
- use typed arrays whenever possible
## Resources
- [video: accelerating oz with v8](https://www.youtube.com/watch?v=VhpdsjBUS3g) |
[slides](http://commondatastorage.googleapis.com/io-2013/presentations/223.pdf)
- [video: breaking the javascript speed limit with v8](https://www.youtube.com/watch?v=UJPdhx5zTaw) |
[slides](http://v8-io12.appspot.com/index.html#1)
- [chromium blog announcement 2010](http://blog.chromium.org/2010/12/new-crankshaft-for-v8.html)
- [mraleph: dangers of cross language
benchmarks 5/2011](http://mrale.ph/blog/2011/05/12/dangers-of-cross-language-benchmark-games)
- [wingo: closer look at crankshaft 8/2011](http://wingolog.org/archives/2011/08/02/a-closer-look-at-crankshaft-v8s-optimizing-compiler)
- [wingo: inside full-codegen 4/2013](http://wingolog.org/archives/2013/04/18/inside-full-codegen-v8s-baseline-compiler)
- [tour of crankshaft 4/2013](http://jayconrod.com/posts/54/a-tour-of-v8-crankshaft-the-optimizing-compiler)
================================================
FILE: crankshaft/data-types.md
================================================
**Table of Contents** *generated with [DocToc](http://doctoc.herokuapp.com/)*
- [Data Types](#data-types)
- [Efficiently Representing Values and Tagging](#efficiently-representing-values-and-tagging)
- [Considerations](#considerations)
- [Objects](#objects)
- [Structure](#structure)
- [Object Properties](#object-properties)
- [Hash Tables](#hash-tables)
- [Key Value Insertion](#key-value-insertion)
- [Key Value Retrieval](#key-value-retrieval)
- [Fast, In-Object Properties](#fast-in-object-properties)
- [Assigning Properties inside Constructor Call](#assigning-properties-inside-constructor-call)
- [Assigning More Properties Later](#assigning-more-properties-later)
- [Assigning Same Properties in Different Order](#assigning-same-properties-in-different-order)
- [In-object Slack Tracking](#in-object-slack-tracking)
- [Methods And Prototypes](#methods-and-prototypes)
- [Assigning Functions to Properties](#assigning-functions-to-properties)
- [Assigning Functions to Prototypes](#assigning-functions-to-prototypes)
- [Numbered Properties](#numbered-properties)
- [Arrays](#arrays)
- [Fast Elements](#fast-elements)
- [Characteristics](#characteristics)
- [Dictionary Elements](#dictionary-elements)
- [Characteristics](#characteristics-1)
- [Double Array Unboxing](#double-array-unboxing)
- [Typed Arrays](#typed-arrays)
- [Float64Array](#float64array)
- [Considerations](#considerations-1)
- [Strings](#strings)
- [Resources](#resources)
# Data Types
## Efficiently Representing Values and Tagging
[watch](http://youtu.be/UJPdhx5zTaw?t=15m35s) | [slide](http://v8-io12.appspot.com/index.html#34)
[read](http://jayconrod.com/posts/52/a-tour-of-v8-object-representation) *Numbered properties: fast elements*
- most objects in heap are 4-byte aligned
- according to spec all numbers in JS are 64-bit floating doubles
- v8 passes around 32-bit numbers to represent all values for improved efficiency
- bottom bit reserved as tag to signify if value is a SMI (small integer) or a pointer to an object
[watch](http://youtu.be/UJPdhx5zTaw?t=10m05ss) | [slide](http://v8-io12.appspot.com/index.html#35)
```
| object pointer | 1 |
or
| 31-bit-signed integer (SMI) | 0 |
```
- numbers bigger than 31 bits are boxed
- stored inside an object referenced via a pointer
- adds extra overhead (at a minimum an extra lookup)
### Considerations
- prefer SMIs for numeric values whenever possible
## Objects
### Structure
```
+-------------------+
| Object | +----> +------------------+ +----> +------------------+
|-------------------| | | FixedArray | | | FixedArray |
| Map | | |------------------| | |------------------|
|-------------------| | | Map | | | Map |
| Extra Properties |----+ |------------------| | |------------------|
|-------------------| | Length | | | Length |
| Elements |------+ |------------------| | |------------------|
|-------------------| | | Property "poo" | | | Property "0" |
| Property "foo" | | |------------------| | |------------------|
|-------------------| | | Property "baz" | | | Property "1" |
| Property "bar" | | +__________________+ | +__________________+
+___________________+ | |
| |
| |
+-----------------------------+
```
- above shows most common optimized representation
- most objects contain all their properties in single block of memory `"foo", "bar"`
- all blocks have a `Map` property describing their structure
- named properties that don't fit are stored in overflow array `"poo", "baz"`
- numbered properties are stored in a separate contiguous array `"1", "2"`
### Object Properties
[read](http://jayconrod.com/posts/52/a-tour-of-v8-object-representation) *Some surprising properties of properties*
- object is a collection of properties aka *key-value pairs*
- property names are **always** strings
- any name used as property name that is not a string is stringified via `.toString()`, **even numbers**, so `1` becomes `"1"`
- **Arrays in JavaScript are just objects** with *magic* `length` property
### Hash Tables
- hash table used for *difficult* objects
- aka objects in *dictionary mode*
- accessing hash table property is much slower than accessing a field at a known offset
- if *non-symbol* string is used to access a property it is *uniquified* first
- v8 hash tables are large arrays containing keys and values
- initially all keys and values are `undefined`
#### Key Value Insertion
- on *key-vaule pair* insertion the key's *hash code* is computed
- low bits of *hash code* are used as initial insertion index
- if that slot is taken the hash table attempts to insert it at next index (modulo length) and so on
#### Key Value Retrieval
- computing hash code and comparing keys for equality is commonly a fast operation
- still slow to execute these non-trivial routines on every property read/write
- v8 avoids hash table representation whenever possible
### Fast, In-Object Properties
[read](http://jayconrod.com/posts/52/a-tour-of-v8-object-representation) *Fast, in-object properties* |
[read](https://developers.google.com/v8/design#prop_access)
- v8 describes the structure of objects using maps used to create *hidden classes* and match data types
- resembles a table of descriptors with one entry for each property
- map contains info about size of the object
- map contains info about pointers to constructors and prototypes
- objects with same structure share same map
- objects created by the same constructor and have the **same set of properties assigned in the same order**
- have regular logical structure and therefore regular structure in memory
- share same map
- adding new property is handled via *transition* descriptor
- use existing map
- *transition* descriptor points at other map
#### Assigning Properties inside Constructor Call
```js
function Point () {
// Map M0
// "x": Transition to M1 at offset 12
this.x = x;
// Map M1
// "x": Field at offset 12
// "y": Transition to M2 at offset 16
this.y = y;
// Map M2
// "x": Field at offset 12
// "y": Field at offset 16
}
```
- `Point` starts out without any fields with `M0`
- `this.x =x` -> map pointer set to `M1` and value `x` is stored at offset `12` and `"x" Transition` descriptor added to `M0`
- `this.y =y` -> map pointer set to `M2` and value `y` is stored at offset `16` and `"y" Transition` descriptor added to `M1`
#### Assigning More Properties Later
```js
var p = new Point();
// Map M2
// "x": Field at offset 12
// "y": Field at offset 16
// "z": Transition at offset 20
p.z = z;
// Map M3
// "x": Field at offset 12
// "y": Field at offset 16
// "z": Field at offset 20
```
- assigning `z` later
- create `M3`, a copy of `M2`
- add `Transition` descriptor to `M2`
- add `Field` descriptor to `M3`
#### Assigning Same Properties in Different Order
```js
function Point(x, y, reverse) {
// Map M0
// "x": Transition to M1 at offset 12ak
// "y": Transition to M2 at offset 12
if (reverse) {
// variation 1
// Map M1
// "x": Field at offset 12
// "y": Transition to M4 at offset 16
this.x = x;
// Map M4
// "x": Field at offset 12
// "y": Field at offset 16
this.y = y;
} else {
// variation 2
// Map M2
// "y": Field at offset 12
// "x": Transition to M5 at offset 16
this.y = x;
// Map M5
// "y": Field at offset 12
// "x": Field at offset 16
this.x = y;
}
}
```
- both variations share `M0` which has two *transitions*
- not all `Point`s share same map
- in worse cases v8 drops object into *dictionary mode* in order to prevent huge number of maps to be allocated
- when assigning random properties to objects from same constructor in random order
- when deleting properties
### In-object Slack Tracking
[read](http://jayconrod.com/posts/52/a-tour-of-v8-object-representation) *In-object slack tracking*
- objects allocated by a constructor are given enough memory for 32 *fast* properties to be stored
- after certain number of objects (8) were allocated from same constructor
- v8 traverses *transition tree* from initial map to determine size of largest of these initial objects
- new objects of same type are allocated with exact amount of memory to store max number of properties
- initial objects are resized (down)
### Methods And Prototypes
[read](http://jayconrod.com/posts/52/a-tour-of-v8-object-representation) *Methods and prototypes*
#### Assigning Functions to Properties
```js
function Point () {
// Map M0
// "x": Transition to M1 at offset 12
this.x = x;
// Map M1
// "x": Field at offset 12
// "y": Transition to M2 at offset 16
this.y = y;
// Map M2
// "x": Field at offset 12
// "y": Field at offset 16
// "distance": Transition to M3
this.distance = pointDistance;
// Map M3
// "x": Field at offset 12
// "y": Field at offset 16
// "distance": Constant_Function
}
function pointDistance(p) { /* calculates distance */ }
```
- properties pointing to `Function`s are handled via `constant functions` descriptor
- `constant_function` descriptor indicates that value of property is stored with descriptor itself rather than in the
object
- pointers to functions are directly embedded into optimized code
- if `distance` is reassigned, a new map has to be created since the `Transition` breaks
#### Assigning Functions to Prototypes
```js
function Point(x, y) {
this.x = x;
this.y = y;
}
Point.prototype.pointDistance = function () { /* calculates distance */ }
```
- v8 represents prototype methods using `constant_function` descriptors
- calling prototype methods maybe a **tiny** bit slower due to overhead of the following:
- check *receiver's* map (as with *own* properties)
- check maps of *prototype chain* (extra step)
- the above lookup overhead won't make measurable performance difference and **shouldn't impact how you write code**
### Numbered Properties
[read](http://jayconrod.com/posts/52/a-tour-of-v8-object-representation) *Numbered properties: fast elements*
[see Arrays](#arrays)
- numbered properties are treated and ordered differently than others since any object can *behave* like an array
- *element* === any property whose key is non-negative integer
- v8 stores elements separate from named properties in an *elements kind* field (see [structure diagram](#structure))
- if object drops into *dictionary mode* for elements, access to named properties remains fast and vice versa
- maps don't need *transitions* to maps that are identical except for *element kinds*
- most elements are *fast elements* which are stored in a contiguous array
## Arrays
[watch](http://youtu.be/UJPdhx5zTaw?t=17m25s) | [slide](http://v8-io12.appspot.com/index.html#38)
[read](http://jayconrod.com/posts/52/a-tour-of-v8-object-representation) *Numbered properties: fast elements*
[read]((https://v8.dev/blog/fast-properties)
- v8 has two methods for storing arrays, *fast elements* and *dictionary elements*
### Fast Elements
[see Numbered Properties](#numbered-properties)
- compact keysets
- linear storage buffer
#### Characteristics
- contiguous (non-sparse)
- `0` based
- smaller than `100K` elements [see this test](https://github.com/thlorenz/v8-perf/blob/master/test/fast-elements.js)
#### Packed vs. Holey Elements
- v8 makes distinction whether the elements backing store is packed or has holes
- holes in a backing store are created by deleting an indexed element
- missing properties are marked with special _hole_ value to keep Array functions performant
- however missing properties cause expensive lookups on prototype chain
- in the past reading beyond the length of an array made it holey, however this has been fixed
and is no longer a problem (TODO: resource)
#### Elements Kinds
[read](https://v8.dev/blog/elements-kinds)
- fast *elements kinds* in order of increasing generality:
- fast SMIs (small integers)
- fast doubles (Doubles stored in unboxed representation)
- fast values (strings or other objects)
##### Elements Kind Lattice
```
+--------------------+
| PACKED_SMI_ELEMENT |---+
+--------------------+ | +------------------------+
| +--->| PACKED_DOUBLE_ELEMENTS |---+
↓ +------------------------+ | +-------------------+
+--------------------+ | +--->| PACKED_ELEMENTS |
| HOLEY_SMI_ELEMENTS |---+ ↓ +-------------------+
+--------------------+ | +------------------------+ |
+--->| HOLEY_DOUBLE_ELEMENTS |---+ ↓
+------------------------+ | +-------------------+
+--->| HOLEY_ELEMENTS |
+-------------------+
```
- can only transition downwards through the lattice
- more specific elements kinds enable more fine-grained optimizations
### Dictionary Elements
[see Hash Tables](#hash-tables)
- hash table storage
- slow access
#### Characteristics
- sparse
- large
### Double Array Unboxing
[watch](http://youtu.be/UJPdhx5zTaw?t=20m20s) | [slide](http://v8-io12.appspot.com/index.html#45)
- Array's hidden class tracks element types
- if all doubles, array is unboxed aka *upgraded to fast doubles*
- wrapped objects layed out in linear buffer of doubles
- each element slot is 64-bit to hold a double
- SMIs that are currently in Array are converted to doubles
- very efficient access
- storing requires no allocation as is the case for boxed doubles
- causes hidden class change
- requires expensive copy-and-convert operation
- careless array manipulation may cause overhead due to boxing/unboxing [watch](http://youtu.be/UJPdhx5zTaw?t=21m50s) |
[slide](http://v8-io12.appspot.com/index.html#47)
### Typed Arrays
[blog](http://mrale.ph/blog/2011/05/12/dangers-of-cross-language-benchmark-games.html) |
[spec](https://www.khronos.org/registry/typedarray/specs/latest/)
- difference is in semantics of indexed properties
- v8 uses unboxed backing stores for such typed arrays
#### Float64Array
- gets 64-bit allocated for each element
### Considerations
- once array is marked as holey it is holey forever
- don't pre-allocate large arrays (`>=100K` elements), instead grow as needed, to avoid them being considered sparse
- do pre-allocate small arrays to correct size to avoid allocations due to resizing
- avoid createing holes, and thus don't delete elements
- don't load uninitialized or deleted elements [watch](http://youtu.be/UJPdhx5zTaw?t=19m30s) |
[slide](http://v8-io12.appspot.com/index.html#43)
- use literal initializer for Arrays with mixed values
- don't store non-numeric values in numeric arrays
- causes boxing and efficient code that was generated for manipulating values can no longer be used
- use typed arrays whenever possible especially when performing mathematical operations on an
array of numbers
- copying an array, you should avoid copying from the back (higher indices to lower indices) because this will almost certainly trigger dictionary mode
- avoid elements kind transitions, i.e. edge case of adding `-0, NaN, Infinity` to a SMI array
as they are represented as doubles
## Strings
- string representation and how it maps to each bit
```
map |len |hash|characters
0123|4567|8901|23.........
```
- contain only data (no pointers)
- content not tagged
- immutable except for hashcode field which is lazily computed (at most once)
## Resources
- [video: breaking the javascript speed limit with v8](https://www.youtube.com/watch?v=UJPdhx5zTaw) |
[slides](http://v8-io12.appspot.com/index.html#1)
- [tour of v8: garbage collection - 2013](http://jayconrod.com/posts/55/a-tour-of-v8-garbage-collection)
- [tour of v8: object representation - 2013](http://jayconrod.com/posts/52/a-tour-of-v8-object-representation)
- [v8-design](https://developers.google.com/v8/design#garb_coll)
- [Fast Properties in V8 - 2017](https://v8.dev/blog/fast-properties)
- [“Elements kinds” in V8 - 2017](https://v8.dev/blog/elements-kinds)
================================================
FILE: crankshaft/gc.md
================================================
**Table of Contents** *generated with [DocToc](http://doctoc.herokuapp.com/)*
- [v8 Garbage Collector](#v8-garbage-collector)
- [Goals, Techniques](#goals-techniques)
- [Cost of Allocating Memory](#cost-of-allocating-memory)
- [How objects are determined to be dead](#how-objects-are-determined-to-be-dead)
- [Two Generations](#two-generations)
- [Heap Organization in Detail](#heap-organization-in-detail)
- [New Space](#new-space)
- [Old Pointer Space](#old-pointer-space)
- [Old Data Space](#old-data-space)
- [Large Object Space](#large-object-space)
- [Code Space](#code-space)
- [Cell Space, Property Cell Space, Map Space](#cell-space-property-cell-space-map-space)
- [Pages](#pages)
- [Young Generation](#young-generation)
- [ToSpace, FromSpace, Memory Exhaustion](#tospace-fromspace-memory-exhaustion)
- [Sample Scavenge Scenario](#sample-scavenge-scenario)
- [Collection to free ToSpace](#collection-to-free-tospace)
- [Write Barriers](#write-barriers)
- [Write Barrier Crankshaft Optimizations](#write-barrier-crankshaft-optimizations)
- [Considerations](#considerations)
- [Old Generation](#old-generation)
- [Collection Steps](#collection-steps)
- [Mark Sweep and Mark Compact](#mark-sweep-and-mark-compact)
- [Mark](#mark)
- [Marking State](#marking-state)
- [Depth-First Search](#depth-first-search)
- [Handling Deque Overflow](#handling-deque-overflow)
- [Sweep and Compact](#sweep-and-compact)
- [Sweep](#sweep)
- [Compact](#compact)
- [Incremental Mark and Lazy Sweep](#incremental-mark-and-lazy-sweep)
- [Incremental Marking](#incremental-marking)
- [Lazy Sweeping](#lazy-sweeping)
- [Causes For GC Pause](#causes-for-gc-pause)
- [Resources](#resources)
# v8 Garbage Collector
## Goals, Techniques
- ensures fast object allocation, short garbage collection pauses and no memory fragmentation
- **stop-the-world**,
[generational](http://www.memorymanagement.org/glossary/g.html#term-generational-garbage-collection) accurate garbage collector
- stops program execution when performing garbage collections cycle
- processes only part of the object heap in most garbage collection cycles to minimize impact of above
- wraps objects in `Handle`s in order to track objects in memory even if they get moved (i.e. due to being promoted)
- identifies dead sections of memory
- GC can quickly scan [tagged words](data-types.md#efficiently-representing-values-and-tagging)
- follows pointers and ignores SMIs and *data only* types like strings
## Cost of Allocating Memory
[watch](http://youtu.be/VhpdsjBUS3g?t=10m54s)
- cheap to allocate memory
- expensive to collect when memory pool is exausted
## How objects are determined to be dead
*an object is live if it is reachable through some chain of pointers from an object which is live by definition,
everything else is garbage*
- considered dead when object is unreachable from a root node
- i.e. not referenced by a root node or another live object
- global objects are roots (always accessible)
- objects pointed to by local variables are roots (stack is scanned for roots)
- DOM elements are roots (may be weakly referenced)
## Two Generations
[watch](http://youtu.be/VhpdsjBUS3g?t=11m24s)
- object heap segmented into two parts (well kind of, [see below](#heap-organization-in-detail))
- **New Space** in which objects aka **Young Generation** are created
- **Old Space** into which objects that survived a GC cycle aka **Old Generation** are promoted
## Heap Organization in Detail
### New Space
- most objects allocated here
- executable `Codes` are always allocated in Old Space
- fast allocation
- simply increase allocation pointer to reserve space for new object
- fast garbage collection
- independent of other spaces
- between 1 and 8 MB
### Old Pointer Space
- contains objects that may have pointers to other objects
- objects surviving **New Space** long enough are moved here
### Old Data Space
- contains *raw data* objects -- **no pointers**
- strings
- boxed numbers
- arrays of unboxed doubles
- objects surviving **New Space** long enough are moved here
### Large Object Space
- objects exceeding size limits of other spaces
- each object gets its own [`mmap`](http://www.memorymanagement.org/glossary/m.html#mmap)d region of memory
- these objects are never moved by GC
### Code Space
- code objects containing JITed instructions
- only space with executable memory with the exception of **Large Object Space**
### Cell Space, Property Cell Space, Map Space
- each of these specialized spaces places constraints on size and the type of objects they point to
- simplifies collection
### Pages
- each space divided into set of pages
- page is **contiguous** chunk of memory allocated via `mmap`
- page is 1MB in size and 1MB aligned
- exception **Large Object Space** where page can be larger
- page contains header
- flags and meta-data
- marking bitmap to indicate which objects are alive
- page has slots buffer
- allocated in separate memory
- forms list of objects which may point to objects stored on the page aka [*remembered
set*](http://www.memorymanagement.org/glossary/r.html#remembered.set)
## Young Generation
*most performance problems related to young generation collections*
- fast allocation
- fast collection performed frequently via [stop and
copy](http://www.memorymanagement.org/glossary/s.html#term-stop-and-copy-collection) - [two-space
collector](http://www.memorymanagement.org/glossary/t.html#term-two-space-collector)
### ToSpace, FromSpace, Memory Exhaustion
[watch](http://youtu.be/VhpdsjBUS3g?t=13m40s)
- ToSpace is used to allocate values i.e. `new`
- FromSpace is used by GC when collection is triggered
- ToSpace and FromSpace have **exact same size**
- large space overhead (need ToSpace and FromSpace) and therefore only suitable for small **New Space**
- when **New Space** allocation pointer reaches end of **New Space** v8 triggers minor garbage collection cycle
called **scavenge** or [copying garbage
collection](http://www.memorymanagement.org/glossary/c.html#term-copying-garbage-collection)
- scavenge implements [Cheney's algorithm](http://en.wikipedia.org/wiki/Cheney's_algorithm)
- [more details](http://jayconrod.com/posts/55/a-tour-of-v8-garbage-collection) *Generational collection* section
#### Sample Scavenge Scenario
ToSpace starts as unallocated memory.
- alloc A, B, C, D
```
| A | B | C | D | unallocated |
```
- alloc E (not enough space - exhausted **Young Generation** memory)
- triggers collection which blocks the main thread
##### Collection to free ToSpace
- swap labels of FromSpace and ToSpace
- as a result the empty (previous) FromSpace is now the ToSpace
- objects on FromSpace are determined to be live or dead
- dead ones are collected
- live ones are marked and copied (expensive) out of From Space and either
- moved to ToSpace and compacted in the process to improve cache locality
- promoted to Old Space
- assuming B and D were dead
```
| A | C | unallocated |
```
- now we can allocate E
#### Write Barriers
[read](http://jayconrod.com/posts/55/a-tour-of-v8-garbage-collection) *Write barriers: the secret ingredient*
[barrier](http://www.memorymanagement.org/glossary/b.html#term-barrier-1) | [write
barrier](http://www.memorymanagement.org/glossary/w.html#term-write-barrier) | [read
barrier](http://www.memorymanagement.org/glossary/r.html#term-read-barrier)
**Problem**: how does GC know an object in **New Space** is alive if it is only pointed to from an object in **Old Space** without
scanning **Old Space** all the time?
- *store buffer* maintains list of pointers from **Old Space** to **New Space**
- on new allocation of object, no other object points to it
- when pointer of object in **New Space** is written to field of object in **Old Space**, record location of that field in store
buffer
- above is archieved via a *write barrier* which is a bit of code that detects and records these pointers
- *write barriers* are expensive, but don't act as often (writes are less frequent than reads)
##### Write Barrier Crankshaft Optimizations
- most execution time spent in optimized code
- crankshaft may statically prove object is in New Space and thus write barriers can be omitted for them
- crankshaft allocates objects on stack when only local references to them exist -> no write barriers for stack
- `old->new` pointers are rare, so optimizing for detecting `new->new` and `old->old` pointers quickly
- since pages are aligned on 1 MB boundary object's page is found quickly by masking off the low 20 bits of its address
- page headers have flags indicating which space they are in
- above allows checking which space object is in with a few instructions
- once `old->new` pointer is found, record location of it at end of store buffer
- *store buffer* entries are sorted and deduped periodically and entries no longer pointing to **New Space** are removed
#### Considerations
[watch](http://youtu.be/VhpdsjBUS3g?t=15m30s)
- every allocation brings us closer to GC pause
- **collection pauses our app**
- try to pre-alloc as much as possible ahead of time
## Old Generation
- fast alloc
- slow collection performed infrequently
- `~20%` of objects survive into **Old Generation**
### Collection Steps
[watch](http://youtu.be/VhpdsjBUS3g?t=12m30s)
- parts of collection run concurrent with mutator, i.e. runs on same thread our JavaScript is executed on
- [incremental marking/collection](http://www.memorymanagement.org/glossary/i.html#term-incremental-garbage-collection)
- [mark-sweep](http://www.memorymanagement.org/glossary/m.html#term-mark-sweep): return memory to system
- [mark-compact](http://www.memorymanagement.org/glossary/m.html#term-mark-compact): move values
### Mark Sweep and Mark Compact
[read](http://jayconrod.com/posts/55/a-tour-of-v8-garbage-collection) *Mark-sweep and Mark-compact*
- used to collect **Old Space** which may contain +100 MB of data
- scavenge impractical for more than a few MBs
- two phases
- Mark
- Sweep or Compact
#### Mark
- all objects on heap are discovered and marked
- objects can start at any *word aligned* offset in page and are at least two words long
- each page contains marking bitmap (one bit per allocatable word)
- results in memory overhead `3.1% on 32-bit, 1.6% on 64-bit systems`
- when marking completes all objects are either considered dead *white* or alive *black*
- that info is used during sweeping or compacting phase
#### Marking State
- pairs of bits represent object's *marking state*
- **white**: not yet discovered by GC
- **grey**: discovered, but not all of its neighbors were processed yet
- **black**: discovered and all of its neighbors were processed
- **marking deque**: separately allocated buffer used to store objects being processed
##### Depth-First Search
- starts with clear marking bitmap and all *white* objects
- objects reachable from roots become *grey* and pushed onto *marking deque*
- at each step GC pops object from *marking deque*, marks it *black*
- then marks it's neighboring *white* objects *grey* and pushes them onto *marking deque*
- exit condition: *marking deque* is empty and all discovered objects are *black*
#### Handling Deque Overflow
- large objects i.e. long arrays may be processed in pieces to avoid **deque** overflow
- if *deque* overflows, objects are still marked *grey*, but not pushed onto it
- when *deque* is empty again GC scans heap for *grey* objects, pushes them back onto *deque* and resumes marking
#### Sweep and Compact
- both work at **v8** page level == 1MB contiguous chunks (different from [virtual memory
pages](http://www.memorymanagement.org/glossary/p.html#page))
#### Sweep
- iterates across page's *marking bitmap* to find ranges of unmarked objects
- scans for contiguous ranges of dead objects
- converts them to free spaces
- adds them to free list
- each page maintains separate free lists
- for small regions `< 256 words`
- for medium regions `< 2048 words`
- for large regions `< 16384 words`
- used by scavenge algorithm for promoting surviving objects to **Old Space**
- used by compacting algorithm to relocate objects
#### Compact
[read](http://jayconrod.com/posts/55/a-tour-of-v8-garbage-collection) *Mark-sweep and Mark-compact*
last paragraph
- reduces actual memory usage by migrating objects from fragmented pages to free spaces on other pages
- new pages may be allocated
- evacuated pages are released back to OS
### Incremental Mark and Lazy Sweep
[read](http://jayconrod.com/posts/55/a-tour-of-v8-garbage-collection) *Incremental marking and lazy sweeping*
#### Incremental Marking
- algorithm similar to regular marking
- allows heap to be marked in series of small pauses `5-10ms` each (vs. `500-1000ms` before)
- activates when heap reaches certain threshold size
- when active an incremental marking step is performed on each memory allocation
#### Lazy Sweeping
- occurs after each incremental marking
- at this point heap knows exactly how much memory could be freed
- may be ok to delay sweeping, so actual page sweeps happen on *as-needed* basis
- GC cycle is complete when all pages have been swept at which point incremental marking starts again
## Causes For GC Pause
[watch](http://youtu.be/VhpdsjBUS3g?t=16m30s)
- calling `new` a lot and keeping references to created objects for longer than necessary
- client side **never `new` within a frame**
[watch](http://youtu.be/VhpdsjBUS3g?t=17m15s)
- running unoptimized code
- causes memory allocation for implicit/immediate results of calculations even when not assigned
- if it was optimized, only for final results gets memory allocated (intermediates stay in registers? -- todo confirm)
## Resources
- [video: accelerating oz with v8](https://www.youtube.com/watch?v=VhpdsjBUS3g) |
[slides](http://commondatastorage.googleapis.com/io-2013/presentations/223.pdf)
- [v8-design](https://developers.google.com/v8/design#garb_coll)
- [tour of v8: garbage collection - 2013](http://jayconrod.com/posts/55/a-tour-of-v8-garbage-collection)
- [memory management reference](http://www.memorymanagement.org/)
================================================
FILE: crankshaft/memory-profiling.md
================================================
**Table of Contents** *generated with [DocToc](http://doctoc.herokuapp.com/)*
- [Theory](#theory)
- [Objects](#objects)
- [Shallow size](#shallow-size)
- [Retained size](#retained-size)
- [GC roots](#gc-roots)
- [Storage](#storage)
- [Object Groups](#object-groups)
- [Retainers](#retainers)
- [Dominators](#dominators)
- [Causes for Leaks](#causes-for-leaks)
- [Tools](#tools)
- [DevTools Timeline](#devtools-timeline)
- [Drilling into Events](#drilling-into-events)
- [DevTools Heap Profiler](#devtools-heap-profiler)
- [Collecting a HeapDump for a Node.js app](#collecting-a-heapdump-for-a-nodejs-app)
- [Ensuring GC](#ensuring-gc)
- [Considerations to make code easier to debug](#considerations-to-make-code-easier-to-debug)
- [Name your function declarations](#name-your-function-declarations)
- [Views](#views)
- [Color Coding](#color-coding)
- [Summary View](#summary-view)
- [Limiting included Objects](#limiting-included-objects)
- [Comparison View](#comparison-view)
- [Advanced Comparison Technique](#advanced-comparison-technique)
- [Object Allocation Tracker](#object-allocation-tracker)
- [Allocation Stack](#allocation-stack)
- [Containment View](#containment-view)
- [Entry Points](#entry-points)
- [Dominators View](#dominators-view)
- [Retainer View](#retainer-view)
- [Constructors listed in Views](#constructors-listed-in-views)
- [Closures](#closures)
- [Resources](#resources)
- [blogs/tutorials](#blogstutorials)
- [videos](#videos)
- [slides](#slides)
## Theory
### Objects
[read](https://developer.chrome.com/devtools/docs/javascript-memory-profiling#object-sizes)
[read](https://developer.chrome.com/devtools/docs/memory-analysis-101#object_sizes)
#### Shallow size
- memory held by object **itself**
- arrays and strings may have significant shallow size
#### Retained size
- memory that is freed once object itself is deleted due to it becoming unreachable from *GC roots*
- held by object *implicitly*
##### GC roots
- made up of *handles* that are created when making a reference from native code to a JS object ouside of v8
- found in heap snapshot under **GC roots > Handle scope** and **GC roots > Global handles**
- internal GC roots are window global object and DOM tree
#### Storage
[read](https://developer.chrome.com/devtools/docs/javascript-memory-profiling#javascript-object-representation)
[read](https://github.com/thlorenz/v8-perf/blob/master/data-types.md)
- primitives are leafs or terminating nodes
- strings stored in *VM heap* or externally (accessible via *wrapper object*)
- *VM heap* is heap dedicated to JS objects and managed byt v8 gargabe collector
- *native objects* stored outside of *VM heap*, not managed by v8 garbage collector and are accessed via JS *wrapper
object*
- *cons string* object created by concatenating strings, consists of pairs of strings that are only joined as needed
- *arrays* objects with numeric keys, used to store large amount of data, i.e. hashtables (key-value-pair sets) are
backed by arrays
- *map* object describing object kind and layout
#### Object Groups
[read](https://developer.chrome.com/devtools/docs/javascript-memory-profiling#object-groups)
- *native objects* group is made up from objects holding mutual references to each other
- not represented in JS heap -> have zero size
- wrapper objects created instead, each holding reference to corresponding *native object*
- object group holds wrapper objects creating a cycle
- GC releases object groups whose wrapper objects aren't referenced, but holding on to single wrapper will hold whole
group of associated wrappers
### Retainers
[read](https://developer.chrome.com/devtools/docs/javascript-memory-profiling#objects-retaining-tree)
[read](https://developer.chrome.com/devtools/docs/memory-analysis-101#retaining_paths)
- shown at the bottom inside heap snapshots UI
- *nodes/objects* labelled by name of constructor function used to build them
- *edges* labelled using property names
- *retaining path* is any path from *GC roots* to an object, if such a path doesn't exist the object is *unreachable*
and subject to being garbage collected
### Dominators
[read](https://developer.chrome.com/devtools/docs/javascript-memory-profiling#dominators)
[read](https://en.wikipedia.org/wiki/Dominator_(graph_theory))
[read](https://developer.chrome.com/devtools/docs/memory-analysis-101#dominators)
- can be seen in [**Dominators** view](#dominators-view)
- tree structure in which each object has **one** dominator
- if *dominator* is deleted the *dominated* node is no longer reachable from *GC root*
- node **d** dominates a node **n** if every path from the start node to **n** must go through **d**
### Causes for Leaks
[read](http://addyosmani.com/blog/taming-the-unicorn-easing-javascript-memory-profiling-in-devtools/) *Understanding the Unicorn*
- logical errors in JS that keep references to objects that aren't needed anymore
- number one error: event listeners that haven't been cleaned up correctly
- this causes an object to be considered live by the GC and thus prevents it from being reclaimed
## Tools
### DevTools Timeline
[read](https://developer.chrome.com/devtools/docs/javascript-memory-profiling#identifying-a-memory-problem-with-the-devtools-timeline)
- not available to use with Node.js ATM

- memory usage overview over time
- can be used to identify memory leaks and/or performance bottlenecks caused by a *busy* garbage collector
- top band shows events over time that caused memory usage to be affected
- **Records** shows these events in detail and allows drilling into them to see a stack trace
- GC events are included as well (not shown in the picture)
- **Memory** shows memory usages colored coded
- **Details** (on the right) shows how long each event or each separate function call took
##### Drilling into Events

### DevTools Heap Profiler

[read](https://developer.chrome.com/devtools/docs/javascript-memory-profiling#heap-profiler)
#### Collecting a HeapDump for a Node.js app
- the [heapdump](https://github.com/bnoordhuis/node-heapdump) module supports Node.js `v0.6-v0.10`
- `require('heapdump')` in your module and cause it to write a heap snapshot via `kill -USR2 `
- before a heap dump is taken, v8 [performs two GC
cycles](https://github.com/v8/v8/blob/21f01f64c420fffdb917c9890d03f1eb0c2c1ede/src/heap-snapshot-generator.cc#L2594-L2599)
(also for [Node.js
`v0.10`](https://github.com/joyent/node/blob/v0.10.29-release/deps/v8/src/profile-generator.cc#L3091-L3096))in order
to remove collectable objects
- objects in the resulting heapdump are still referenced and thus couldn't be garbage collected
##### Ensuring GC
Although as mentioned above before a heapdump is taken all garbage is collected, I found that manually triggering
garbage collection and forcing the GC to compact yields better results. The reason for this is unclear to me.
Add the below snippet to your code which will only activate if you are exposing the garbage collector:
```js
// shortest
if (typeof gc === 'function') setTimeout(gc, 1000);
// longer in order to see indicators of gc being performed
if (typeof gc === 'function') {
setTimeout(function doGC() { gc(); process.stdout.write(' gc ') }, 1000);
}
```
Then run your app with the appropriate flags to expose the gc and force compaction.
```
node --always-compact --expose-gc app.js
```
Now you can wait for the garbage collection to occur and take a heapdump right after.
Alternatively you can add a hook to your app, i.e. a route, that will trigger manual `gc` and invoke that before taking
a heapdump.
#### Considerations to make code easier to debug
The usefulness of the information presented in the below views depends on how you authored your code. Here are a few
rules to make your code more debuggable.
###### Name your function declarations
This requires little extra effort but makes is so much easier to track down which function is closing over an object and
thus prevents it from being collected. Unfortunately CoffeeScript generates JS that has unnamed functions due to a bug
in older Internet Explorers.
The below does **not** show as `foo` in the snapshot:
```js
var foo = function () {
[..]
}
```
This one will:
```js
var foo = function foo() {
[..]
}
```
This one as well:
```js
function foo() {
[..]
}
```
#### Views
[overview](https://developer.chrome.com/devtools/docs/heap-profiling#basics)
##### Color Coding
[read](https://developer.chrome.com/devtools/docs/javascript-memory-profiling#looking-up-color-coding)
Properties and values are colored according to their types.
- *a:property* regular propertye, i.e. `foo.bar`
- *0:element* numeric index property, i.e. `arr[0]`
- *a:context var* variable in function context, accessible by name from inside function closure
- *a:system prop* added by JS VM and not accessible from JS code, i.e. v8 internal objects
- yellow objects are referenced by JS
- red objects are detached nodes which are referenced by yellow background object
##### Summary View
[read](https://developer.chrome.com/devtools/docs/javascript-memory-profiling#summary-view)
- shows top level entries, a row per constructor
- columns for distance of the object to the *GC root*, number of object instances, shallow size and retained size.
- `@` character is objects’ unique ID, allowing you to compare heap snapshots on per-object basis
###### Limiting included Objects
- to the right of the View selector you can limit the objects by class name i.e. the name of the constructor function
- to the right of the class filter you can choose which objects to include in your summary (defaults to all)
- select *objects allocated between heapdump 1 and heapdump 2* to identify objects that are still around in *heapdump
3* but shouldn't be
- another way to archieve similar results is by comparing two heapdumps (see below)
##### Comparison View
- compares multiple snapshots to each other
- shows diff of both and delta in ref counts and freed and newly allocated memory
- used to find leaked objects
- after starting and completing (or canceling) the action, no garbage related to that action should be left
- note that garbage is collected each time a snapshot is taken, therefore remaining items are still referenced
1. Take bottom line snapshot
2. Perform operation that might cause a leak
3. Perform reverse operation and/or ensure that action `2` is complete and therefore all objects needed to perform it
should no longer be needed
4. Take second snapshot
5. Compare both snapshots
- select a Snapshot, then *Comparison* on the left and another Snapshot to compare it to on the right
- the *Size Delta* will tell you how much memory couldn't be collected

###### Advanced Comparison Technique
[slides](https://speakerdeck.com/addyosmani/javascript-memory-management-masterclass?slide=102)
Use at least three snapshots and compare those.
1. Take bottom line snapshot *Checkpoint 1*
2. Perform operation that might cause a leak
3. Take snapshot *Checkpoint 2*
4. Perform same operation as in *2.*
5. Take snapshot *Checkpoint 3*
- all memory needed to perform action the first time should have been collected by now
- any objects allocated between *Checkpoint 1* and *Checkpoint 2* should be no longer present in *Checkpoint 3*
- select *Snapshot 3* and from the dropdown on the right select *Objects allocated between Snapshot 1 and 2*
- ideally you see no *Objects* that are created by your application (ignore memory that is unrelated to your action,
i.e. *(compiled code)*)
- if you see any *Objects* that shouldn't be there but are in doubt create a 4th snapshot and select *Objects allocated
between Snapshot 1 and 2* as shown in the picture below

##### Object Allocation Tracker
[watch](http://youtu.be/LaxbdIyBkL0?t=50m33s)
- **not supported by Node.js** ATM
- now **preferred over snapshot comparisons** especially to track down memory leaks
- *blue* bars show memory allocations
- *grey* bars show memory deallocations
###### Allocation Stack
[slides](https://speakerdeck.com/addyosmani/javascript-memory-management-masterclass?slide=102)
[watch](http://youtu.be/LaxbdIyBkL0?t=51m30s)
- only available when using *Object Allocation Tracker*
- needs to be enabled in settings *General/Profiler/Record heap allocation stack traces*
- shows stack traces of executed code that led to the object being allocated

##### Containment View
[read](https://developer.chrome.com/devtools/docs/javascript-memory-profiling#containment-view)
- birds eye view of apps object structure
- low level, allows peeking inside function closures and look at VM internal objects
- used to determine what keeps objects from being collected
###### Entry Points
- *GC roots* actual GC roots used by garbage collector
- *DOMWindow objects* (not present when profiling Node.js apps)
- *Native objects* (not present when profiling Node.js apps)
Additional entry points only present when profiling a Node.js app:
- *1::* global object
- *2::* global object
- *[4] Buffer* reference to Node.js Buffers
##### Dominators View
[read](https://developer.chrome.com/devtools/docs/javascript-memory-profiling#dominators-view)
- only available once *Settings/General/Profiler/Show advanced heap snapshot properties* is checked and browser
refreshed afterwards
- shows dominators tree of heap
- similar to containment view but lacks property names since dominator may not have direct reference to all objects it
dominates
- useful to identify memory accumulation points
- also used to ensure that objects are well contained instead of hanging around due to GC not working properly
##### Retainer View
- always shown at bottom of the UI
- displays retaining tree of currently selected object
- retaining tree has references going outward, i.e. inner item references outer item
#### Constructors listed in Views
[read](https://developer.chrome.com/devtools/docs/javascript-memory-profiling#memory-profiling-faq)
- *(global property)* intermediate object between global object and an object refereced by it
- *(roots)* root entries in retaining view are entities that reference the selected object
- *(closure)* count of references to a group of objects through function closures
- *(array, string, number, regexp)* list of object types with properties which reference an Array, String, Number or
regular expression
- *(compiled code)* *SharedFunctionInfos* have no context and standibetween functions that do have context
- *(system)* references to builtin functions mainly `Map` (TODO: confirm and more details)
##### Closures
[read](http://zetafleet.com/blog/google-chromes-heap-profiler-and-memory-timeline)
- source of unintentional memory retention
- v8 will not clean up **any** memory of a closure untiil **all** members of the closure have gone out of scope
- therefore they should be used sparingly to avoid unnecessary [semantic
garbage](https://en.wikipedia.org/wiki/Garbage_(computer_science))
## Resources
### blogs/tutorials
Keep in mind that most of these are someehwat out of date albeit still useful.
- [chrome-docs memory profiling](https://developer.chrome.com/devtools/docs/javascript-memory-profiling)
- [related demos](https://developer.chrome.com/devtools/docs/javascript-memory-profiling#supporting-demos) including [more resources](https://developer.chrome.com/devtools/docs/javascript-memory-profiling#community-resources)
- [chrome-docs Memory Analysis 101](https://developer.chrome.com/devtools/docs/memory-analysis-101) overlaps with chrome-docs memory profiling
- [chrome-docs heap profiling](https://developer.chrome.com/devtools/docs/heap-profiling) overlaps with chrome-docs memory profiling
- [Chasing Leaks With The Chrome DevTools Heap Profiler Views](https://plus.google.com/+AddyOsmani/posts/D3296iL3ZRE)
- [heap profiler in chrome dev tools](http://rein.pk/using-the-heap-profiler-in-chrome-dev-tools/)
- [performance-optimisation-with-timeline-profiles](http://addyosmani.com/blog/performance-optimisation-with-timeline-profiles/) time line data cannot be pulled out of a Node.js app currently, therfore skipping this for now
- [timeline and heap profiler](http://zetafleet.com/blog/google-chromes-heap-profiler-and-memory-timeline)
- [chromium blog](http://blog.chromium.org/2011/05/chrome-developer-tools-put-javascript.html)
- [Easing JavaScript Memory Profiling In Chrome DevTools](http://addyosmani.com/blog/taming-the-unicorn-easing-javascript-memory-profiling-in-devtools/)
- [Effectively Managing Memory at Gmail scale](http://www.html5rocks.com/en/tutorials/memory/effectivemanagement/)
- [javascript memory management masterclass](https://speakerdeck.com/addyosmani/javascript-memory-management-masterclass)
- [fixing memory leaks in drupal's editor](https://www.drupal.org/node/2159965)
- [writing fast memory efficient javascript](http://www.smashingmagazine.com/2012/11/05/writing-fast-memory-efficient-javascript/)
- [imgur avoiding a memory leak situation in JS](http://imgur.com/blog/2013/04/30/tech-tuesday-avoiding-a-memory-leak-situation-in-js/)
### videos
- [The Breakpoint Ep8: Memory Profiling with Chrome DevTools](https://www.youtube.com/watch?v=L3ugr9BJqIs)
- [Google I/O 2013 - A Trip Down Memory Lane with Gmail and DevTools](https://www.youtube.com/watch?v=x9Jlu_h_Lyw#t=1448)
### slides
- [Finding and debugging memory leaks in JavaScript with Chrome DevTools](http://www.slideshare.net/gonzaloruizdevilla/finding-and-debugging-memory-leaks-in-javascript-with-chrome-devtools)
- [eliminating memory leaks in Gmail](https://docs.google.com/presentation/d/1wUVmf78gG-ra5aOxvTfYdiLkdGaR9OhXRnOlIcEmu2s/pub?start=false&loop=false&delayms=3000#slide=id.g1d65bdf6_0_0)
================================================
FILE: crankshaft/performance-profiling.md
================================================
**Table of Contents** *generated with [DocToc](http://doctoc.herokuapp.com/)*
- [General Strategies to track and improve Performance](#general-strategies-to-track-and-improve-performance)
- [Identify and Understand Performance Problem](#identify-and-understand-performance-problem)
- [Sampling CPU Profilers](#sampling-cpu-profilers)
- [Structural CPU Profilers](#structural-cpu-profilers)
- [Instrumentation Techniques](#instrumentation-techniques)
- [Instrumenting vs. Sampling](#instrumenting-vs-sampling)
- [Plan for Performance](#plan-for-performance)
- [Animation Frame](#animation-frame)
- [v8 Performance Profiling](#v8-performance-profiling)
- [Chrome Devtools Profiler](#chrome-devtools-profiler)
- [Chrome Tracing aka chrome://tracing](#chrome-tracing-aka-chrometracing)
- [Preparation](#preparation)
- [Running](#running)
- [Evaluation](#evaluation)
- [Filter for Signal](#filter-for-signal)
- [Inspect](#inspect)
- [Resources](#resources)
- [v8 tools](#v8-tools)
- [Using Chrome](#using-chrome)
- [v8 timeline](#v8-timeline)
- [Capturing](#capturing)
- [Analyzing](#analyzing)
- [Top Band](#top-band)
- [Middle Band](#middle-band)
- [Bottom Graph](#bottom-graph)
- [Finding Slow Running Unoptimized Functions](#finding-slow-running-unoptimized-functions)
- [d8](#d8)
- [Determining why a Function was not Optimized](#determining-why-a-function-was-not-optimized)
- [d8](#d8-1)
- [Improvments](#improvments)
- [Resources](#resources-1)
# General Strategies to track and improve Performance
## Identify and Understand Performance Problem
[watch](http://youtu.be/UJPdhx5zTaw?t=40m1s) | [slide](http://v8-io12.appspot.com/index.html#83)
[watch profiling workflow](https://www.youtube.com/watch?v=nxXkquTPng8&feature=share&t=40m50s)
Analyse performance only once you have a problem in a top down manner like so:
- ensure it's JavaScript and not the DOM
- reduce testcase to pure JavaScript and run in `v8` shell
- collect metrics and locate bottlenecks
- sample profiling to narrow down the general problem area
- at this point think about the algorithm, data structures, techniques, etc. used in this area and evaluate if
improvements in this area are possible since that will most likely yield greater impact than any of the more fine
grained improvments
- structural profiling to isolate the exact area i.e. function in which most time is spent
- evaluate what can be improved here again thinking about algorithm first
- *only once* algorithm and data structures seem optimal evaluate how the code structure affects assembly code generated by v8 and
possible optimizations (small functions, `try/catch`, closures, loops vs. `forEach`, etc.)
- optimize slowest section of code and repeat structural profiling
## Sampling CPU Profilers
[watch](https://www.youtube.com/watch?v=nxXkquTPng8&feature=share&t=3m20s)
[watch walkthrough](https://www.youtube.com/watch?v=nxXkquTPng8&feature=share&t=34m00s)
- at fixed frequency program is instantaneously paused *by setting stacksize to 0* and the call stack sampled
- assumes that the sample is representative of workload
- gives no sense fo flow to due gaps between samples
- functions that were inlined by compiler aren't shown
- collect data for longer period of time, sampling every 1ms
- ensure code is exercising the right code paths
## Structural CPU Profilers
[watch](https://www.youtube.com/watch?v=nxXkquTPng8&feature=share&t=7m10s)
[watch walkthrough](https://www.youtube.com/watch?v=nxXkquTPng8&feature=share&t=37m10s)
- functions are instrumented to record entry and exit times
- three data points per function
- **Inclusive Time**: time spent in function *including* its children
- **Exclusive Time**: time spent in function *excluding* its children
- **Call Count**: number of times the function was called
- data points are taken at much higher frequency than sampling
- higher cost than sampling dut to instrumentation
- goal of optimization is to **minimize inclusive time**
- inlined functions retain markers
### Instrumentation Techniques
[watch](https://www.youtube.com/watch?v=nxXkquTPng8&feature=share&t=46m10s)
- think about data being processed
- is one piece of data slower?
- name time ranges based on data
- use variables/properties to dynamically name ranges
## Instrumenting vs. Sampling
[watch](https://www.youtube.com/watch?v=nxXkquTPng8&feature=share&t=10m30s)
```
+--------------------------------------------------------------------------------------------+
| | Sampling | Structural / Instrumenting |
|-----------------------------------+------------------------+-------------------------------|
| Time | Approximate | Exact |
| Invocation count | Approximate | Exact |
| Overhead | Small | High(er) |
| Accuracy | Good - Poor | Good - Poor |
| Extra code / instrumentation | No | Yes |
+--------------------------------------------------------------------------------------------+
```
- need both
- manual instrumentation can reduce overhead
- instrumentation affects performance and may affect behavior
- samples are very accurate, but inaccurate for extacting time
- samping requires no program modification
## Plan for Performance
[watch](https://www.youtube.com/watch?v=nxXkquTPng8&feature=share&t=47m50s)
- each module of app sould have time budget
- sum of modules should be `< 16ms` for smooth client side apps
- track performance daily or per commit in order to catch *budget busters* right away
## Animation Frame
[watch](https://www.youtube.com/watch?v=nxXkquTPng8&feature=share&t=50m00s)
[watch walkthrough](https://www.youtube.com/watch?v=nxXkquTPng8&feature=share&t=52m20s)
- queue up key handlers and execute inside Animation Frame
- optimize for lowest common denominator that your app will run on
- for mobile stay below `8-10ms` since remaining time is needed for chrome to do its work, i.e. render
# v8 Performance Profiling
## Chrome Devtools Profiler
[watch](https://www.youtube.com/watch?v=nxXkquTPng8&feature=share&t=15m00s)
- *Profile Tab -> Start -> Record Sample*
- tree view gives idea of flow (call stack) and allows drilling into tree nodes
- save profiles to load them later i.e. for bug reports
- use [octane benchmark](http://octane-benchmark.googlecode.com/svn/latest/index.html) to experiment with the profiler
## Chrome Tracing aka chrome://tracing
[watch](https://www.youtube.com/watch?v=nxXkquTPng8&feature=share&t=17m55s)
- access at [chrome://tracing](chrome://tracing/)
- hidden feature like [`chrome://memory`](chrome://memory) originally designed *by chrome developers for chrome developers*
- view into guts of what chrome is doing
- timeline of what code is doing framed in larger chrome context
- allows optimizing low level gpu performance
### Preparation
[watch](https://www.youtube.com/watch?v=nxXkquTPng8&feature=share&t=20m10s)
- instrument code
- a) manually add calls to `console.time` and `console.timeEnd` with a unique `name` as argument to mark entry and exit points of an
area in the code
- b) Firefox does automatic instrumentation via Firebug (Chrome's Profiler is sample based, while Firebug's is structural)
- c) use compiler/automatic tool to add calls
- d) use runtime instrumentation, similar to valgrind in C
- instrumentation archieved via trace macros
- can be nested (hierarchy reflected in profiling display)
- when turned off cost at most a few dozen clocks
- when turned on cost a few thousand clocks (0.01ms)
- arguments passed to macro are only computed when macro is enabled
- `time/timeEnd` spam dev tools console (keep it closed)
- in order to easily remove macro in production wrap `time/timeEnd` calls
### Running
[watch](https://www.youtube.com/watch?v=nxXkquTPng8&feature=share&t=24m45s)
- close all other tabs in order to have the least noise caused by other tabs and thus get cleaner samples
- `|Record|` to start recording a trace
- switch to app and interact with it, limit this to 10s as buffer gets large very quickly
- switch back `|Stop Tracing|`
- `|Save| / |Load|` trace
### Evaluation
[watch](https://www.youtube.com/watch?v=nxXkquTPng8&feature=share&t=27m00s)
- data includes lots of noise since each tab/process will include activity from the following pieces:
- IO thread
- renderer thread
- compositor thread
- find pid of your page via [`chrome://memory`](chrome://memory)
#### Filter for Signal
[watch](https://www.youtube.com/watch?v=nxXkquTPng8&feature=share&t=28m35s)
- in order to get nice timeline
- remove unnec. threads and components by selecting only rows with your pid
- filter by categories, v8 and webkit are most relevant for JS profiling
### Inspect
[watch](https://www.youtube.com/watch?v=nxXkquTPng8&feature=share&t=30m00s)
- navigation based on quake keys and is not mouse friendly, although it seems to be improving
```
+---+
| W | zoom in
+---+ +---+ +---+ +---+
| A | pan left | S | zoom out | D | pan right | ? | help (other shortcuts)
+---+ +---+ +---+ +---+
```
### Resources
- [trace-viewer](https://code.google.com/p/trace-viewer/) supports streaming trace data over web sockets
- [trace event format](https://docs.google.com/document/d/1CvAClvFfyA5R-PhYUmn5OOQtYMH4h6I0nSsKchNAySU/edit) JSON format
to allow interfacing with other tools
- [web tracing framework](http://google.github.io/tracing-framework/) an alternative to the built in tracer
- [about:tracing](http://dev.chromium.org/developers/how-tos/trace-event-profiling-tool)
## v8 tools
- ship with v8 source code
- **plot-time-events**: generates `png` showing v8 timeline
- **(mac|linux|windows)-tick-processor**: generates table of functions sorted by time spent in them
## Using Chrome
### v8 timeline
#### Capturing
[watch](http://youtu.be/VhpdsjBUS3g?t=24m26s)
```sh
Chrome --no-sandbox --js-flags="--prof --noprof-lazy --log-timer-events"
[ .. ]
tools/plot-timer-events /chrome/dir/v8.log
```
#### Analyzing
[watch](http://youtu.be/VhpdsjBUS3g?t=25m00s)
##### Top Band
- `v8.GCScavenger` young generation collection
- `v8.Execute` executing JavaScript
- scavenges interrupt script execution
#### Middle Band
- shows code kind
- bright green - optimized
- blue/purple - unoptimized
#### Bottom Graph
- shows pauses
- lots in beginning since scripts are being parsed
- no pauses when running optimized code
- scavenges (top band) correllate with pause time spikes
### Finding Slow Running Unoptimized Functions
[watch](http://youtu.be/VhpdsjBUS3g?t=27m55s)
```sh
Chrome --no-sandbox --js-flags="--prof --noprof-lazy --log-timer-events"
[ .. ]
tools/mac-timer-events /chrome/dir/v8.log
```
[watch](http://youtu.be/UJPdhx5zTaw?t=42m33s) | [slide](http://v8-io12.appspot.com/index.html#88)
- generates table of functions sorted by time spent in them
- includes C++ functions
- `*` indicates optimized functions
- functions without `*` could not be optimized
#### d8
[watch](http://youtu.be/UJPdhx5zTaw?t=40m53s) | [slide](http://v8-io12.appspot.com/index.html#84)
```sh
/v8/out/native/d8 test.js --prof
```
### Determining why a Function was not Optimized
[watch](http://youtu.be/VhpdsjBUS3g?t=29m00s)
[watch](http://youtu.be/UJPdhx5zTaw?t=39m30s) | [slide](http://v8-io12.appspot.com/index.html#81)
```sh
"/Applications/Google Chrome.app/Contents/MacOS/Google Chrome" \
--no-sandbox --js-flags="--trace-deopt --trace-opt-verbose --trace-bailout"
[ . lots of other output. ]
[disabled optimization for xxx, reason: The Reason why function couldn't be optimized]
```
- lots of output which is best piped into file and evaluated
- especially watch out for deoptimized functions with lots of arithmetic operations
#### d8
[watch](http://youtu.be/UJPdhx5zTaw?t=35m12s) | [slide](http://v8-io12.appspot.com/index.html#69)
```sh
d8 --trace-opt
```
Log optimizing compiler bailouts:
[watch](http://youtu.be/UJPdhx5zTaw?t=36m24s) | [slide](http://v8-io12.appspot.com/index.html#73)
```sh
d8 --trace-bailout
```
Log deoptimizations:
[watch](http://youtu.be/UJPdhx5zTaw?t=39m12s) | [slide](http://v8-io12.appspot.com/index.html#80)
```sh
d8 --trace-deopt
```
#### Improvments
- don't use construct that caused function to be deoptimized
- or move all code inside construct into separate function and call it instead
## Resources
- [video: accelerating oz with v8](https://www.youtube.com/watch?v=VhpdsjBUS3g) |
[slides](http://commondatastorage.googleapis.com/io-2013/presentations/223.pdf)
- [video: structural and sampling profiling in google chrome](https://www.youtube.com/watch?v=nxXkquTPng8) |
[slides](https://www.igvita.com/slides/2012/structural-and-sampling-javascript-profiling-in-chrome.pdf)
- [v8 profiler](https://code.google.com/p/v8/wiki/V8Profiler)
- [stackoverflow: how to debug nodejs applications](http://stackoverflow.com/a/16512303/97443)
================================================
FILE: data-types.md
================================================
# Data Types
_find the previous version of this document at
[crankshaft/data-types.md](crankshaft/data-types.md)_
**Table of Contents** *generated with [DocToc](https://github.com/thlorenz/doctoc)*
- [Efficiently Representing Values and Tagging](#efficiently-representing-values-and-tagging)
- [Considerations](#considerations)
- [Objects](#objects)
- [Structure](#structure)
- [Object Properties](#object-properties)
- [Hash Tables](#hash-tables)
- [HashTables and Hash Codes](#hashtables-and-hash-codes)
- [Resources](#resources)
- [Fast, In-Object Properties](#fast-in-object-properties)
- [Assigning Properties inside Constructor Call](#assigning-properties-inside-constructor-call)
- [Assigning More Properties Later](#assigning-more-properties-later)
- [Assigning Same Properties in Different Order](#assigning-same-properties-in-different-order)
- [In-object Slack Tracking](#in-object-slack-tracking)
- [Methods And Prototypes](#methods-and-prototypes)
- [Assigning Functions to Properties](#assigning-functions-to-properties)
- [Assigning Functions to Prototypes](#assigning-functions-to-prototypes)
- [Numbered Properties](#numbered-properties)
- [Arrays](#arrays)
- [Fast Elements](#fast-elements)
- [Dictionary Elements](#dictionary-elements)
- [Packed vs. Holey Elements](#packed-vs-holey-elements)
- [Elements Kinds](#elements-kinds)
- [Elements Kind Lattice](#elements-kind-lattice)
- [Double Array Unboxing](#double-array-unboxing)
- [Typed Arrays](#typed-arrays)
- [Float64Array](#float64array)
- [Considerations](#considerations-1)
- [Strings](#strings)
- [Resources](#resources-1)
## Efficiently Representing Values and Tagging
[watch](https://youtu.be/UJPdhx5zTaw?t=15m35s) | [slide](http://v8-io12.appspot.com/index.html#34)
[read](http://jayconrod.com/posts/52/a-tour-of-v8-object-representation) *Numbered properties: fast elements*
- most objects in heap are 4-byte aligned
- according to spec all numbers in JS are 64-bit floating doubles
- V8 passes around 32-bit numbers to represent all values for improved efficiency
- bottom bit reserved as tag to signify if value is a Smi (small integer) or a pointer to an object
[watch](https://youtu.be/UJPdhx5zTaw?t=10m05ss) | [slide](http://v8-io12.appspot.com/index.html#35)
```
| object pointer | 1 |
or
| 31-bit-signed integer (Smi) | 0 |
```
- numbers bigger than 31 bits are boxed
- stored inside an object referenced via a pointer
- adds extra overhead (at a minimum an extra lookup)
- on 64 bit architectures Smis are `32-bit-signed` instead of the `31-bit-signed` on 32 bit
architectures
### Considerations
- prefer Smis for numeric values whenever possible
## Objects
### Structure
```
+-------------------+
| Object | +----> +------------------+ +----> +------------------+
|-------------------| | | FixedArray | | | FixedArray |
| Map | | |------------------| | |------------------|
|-------------------| | | Map | | | Map |
| Extra Properties |----+ |------------------| | |------------------|
|-------------------| | Length | | | Length |
| Elements |------+ |------------------| | |------------------|
|-------------------| | | Property "poo" | | | Property "0" |
| Property "foo" | | |------------------| | |------------------|
|-------------------| | | Property "baz" | | | Property "1" |
| Property "bar" | | +__________________+ | +__________________+
+___________________+ | |
| |
| |
+-----------------------------+
```
- above shows most common optimized representation
- most objects contain all their properties in single block of memory `"foo", "bar"`
- all blocks have a `Map` property describing their structure
- named properties that don't fit are stored in overflow array `"poo", "baz"`
- numbered properties are stored in a separate contiguous array `"1", "2"`
### Object Properties
[read](http://jayconrod.com/posts/52/a-tour-of-v8-object-representation) *Some surprising properties of properties*
- object is a collection of properties aka *key-value pairs*
- property names are **always** strings
- any name used as property name that is not a string is stringified via `.toString()`, **even numbers**, so `1` becomes `"1"`
- **Arrays in JavaScript are just objects** with *magic* `length` property
### Hash Tables
- hash table used for *difficult* objects
- aka objects in *dictionary mode*
- accessing hash table property is much slower than accessing a field at a known offset
- if *non-symbol* string is used to access a property it is *uniquified* first
- V8 hash tables are large arrays containing keys and values
- initially all keys and values are `undefined`
#### HashTables and Hash Codes
- on *key-vaule pair* insertion the key's *hash code* is computed
- computing hash code and comparing keys for equality is commonly a fast operation
- still slow to execute these non-trivial routines on every property read/write
- data structures such as Map, Set, WeakSet and WeakMap use hash tables under the hood
- a _hash function_ returns a _hash code_ for given keys which is used to map them to a
location in the hash table
- hash code is a random number (independent of object value) and thus needs to be stored
- storing the hash code as private symbol on the object, like was done previously, resulted in
a variety of performance problems
- led to slow megamorphic IC lookups of the hash code and
- triggered hidden class transition in the key on storing the hash code
- performance issues were fixed (~500% improvement for Maps and Sets) by _hiding_ the hashcode
and storing it in unused memory space that is _connected_ to the JSObject
- if properties backing store is empty: directly stored in the offset of JSObject
- if properties backing store is array: stored in extranous 21 bits of 31 bits to store array length
- if properties backing store is dictionary: increase dictionary size by 1 word to store hashcode
in dedicated slot at the beginning of the dictionary
### Resources
- [Optimizing hash tables: hiding the hash code - 2018](https://v8.dev/blog/hash-code)
### Fast, In-Object Properties
[read](http://jayconrod.com/posts/52/a-tour-of-v8-object-representation) *Fast, in-object properties* |
[read](https://developers.google.com/v8/design#prop_access)
- V8 describes the structure of objects using maps used to create *hidden classes* and match data types
- resembles a table of descriptors with one entry for each property
- map contains info about size of the object
- map contains info about pointers to constructors and prototypes
- objects with same structure share same map
- objects created by the same constructor and have the **same set of properties assigned in the same order**
- have regular logical structure and therefore regular structure in memory
- share same map
- adding new property is handled via *transition* descriptor
- use existing map
- *transition* descriptor points at other map
#### Assigning Properties inside Constructor Call
```js
class Point {
constructor(x, y) {
// Map M0
// "x": Transition to M1 at offset 12
this.x = x
// Map M1
// "x": Field at offset 12
// "y": Transition to M2 at offset 16
this.y = y
// Map M2
// "x": Field at offset 12
// "y": Field at offset 16
}
}
```
- `Point` starts out without any fields with `M0`
- `this.x =x` -> map pointer set to `M1` and value `x` is stored at offset `12` and `"x" Transition` descriptor added to `M0`
- `this.y =y` -> map pointer set to `M2` and value `y` is stored at offset `16` and `"y" Transition` descriptor added to `M1`
#### Assigning More Properties Later
```js
var p = new Point(1, 2)
// Map M2
// "x": Field at offset 12
// "y": Field at offset 16
// "z": Transition at offset 20
p.z = z
// Map M3
// "x": Field at offset 12
// "y": Field at offset 16
// "z": Field at offset 20
```
- assigning `z` later
- create `M3`, a copy of `M2`
- add `Transition` descriptor to `M2`
- add `Field` descriptor to `M3`
#### Assigning Same Properties in Different Order
```js
class Point {
constructor(x, y, reverse) {
// Map M0
// "x": Transition to M1 at offset 12ak
// "y": Transition to M2 at offset 12
if (reverse) {
// variation 1
// Map M1
// "x": Field at offset 12
// "y": Transition to M4 at offset 16
this.x = x
// Map M4
// "x": Field at offset 12
// "y": Field at offset 16
this.y = y
} else {
// variation 2
// Map M2
// "y": Field at offset 12
// "x": Transition to M5 at offset 16
this.y = x
// Map M5
// "y": Field at offset 12
// "x": Field at offset 16
this.x = y
}
}
}
```
- both variations share `M0` which has two *transitions*
- not all `Point`s share same map
- in worse cases V8 drops object into *dictionary mode* in order to prevent huge number of maps to be allocated
- when assigning random properties to objects from same constructor in random order
- when deleting properties
### In-object Slack Tracking
[read](http://jayconrod.com/posts/52/a-tour-of-v8-object-representation) *In-object slack tracking*
- objects allocated by a constructor are given enough memory for 32 *fast* properties to be stored
- after certain number of objects (8) were allocated from same constructor
- V8 traverses *transition tree* from initial map to determine size of largest of these initial objects
- new objects of same type are allocated with exact amount of memory to store max number of properties
- initial objects are resized (down)
### Methods And Prototypes
[read](http://jayconrod.com/posts/52/a-tour-of-v8-object-representation) *Methods and prototypes*
#### Assigning Functions to Properties
```js
function pointDistance(p) { /* calculates distance */ }
class Point {
constructor(x, y) {
// Map M0
// "x": Transition to M1 at offset 12
this.x = x
// Map M1
// "x": Field at offset 12
// "y": Transition to M2 at offset 16
this.y = y
// Map M2
// "x": Field at offset 12
// "y": Field at offset 16
// "distance": Transition to M3
this.distance = pointDistance
// Map M3
// "x": Field at offset 12
// "y": Field at offset 16
// "distance": Constant_Function
}
}
```
- properties pointing to `Function`s are handled via `constant functions` descriptor
- `constant_function` descriptor indicates that value of property is stored with descriptor itself rather than in the
object
- pointers to functions are directly embedded into optimized code
- if `distance` is reassigned, a new map has to be created since the `Transition` breaks
#### Assigning Functions to Prototypes
```js
class Point {
constructor(x, y) {
this.x = x
this.y = y
}
pointDistance() { /* calculates distance */ }
}
```
- V8 represents prototype methods (aka _class methods_) using `constant_function` descriptors
- calling prototype methods maybe a **tiny** bit slower due to overhead of the following:
- check *receiver's* map (as with *own* properties)
- check maps of *prototype chain* (extra step)
- the above lookup overhead won't make measurable performance difference and **shouldn't impact how you write code**
### Numbered Properties
[read](http://jayconrod.com/posts/52/a-tour-of-v8-object-representation) *Numbered properties: fast elements*
[see Arrays](#arrays)
- numbered properties are treated and ordered differently than others since any object can *behave* like an array
- *element* === any property whose key is non-negative integer
- V8 stores elements separate from named properties in an *elements kind* field (see [structure diagram](#structure))
- if object drops into *dictionary mode* for elements, access to named properties remains fast and vice versa
- maps don't need *transitions* to maps that are identical except for *element kinds*
- most elements are *fast elements* which are stored in a contiguous array
## Arrays
[watch](https://youtu.be/UJPdhx5zTaw?t=17m25s) | [slide](http://v8-io12.appspot.com/index.html#38)
[read](http://jayconrod.com/posts/52/a-tour-of-v8-object-representation) *Numbered properties: fast elements*
[read](https://v8.dev/blog/fast-properties)
- V8 has two methods for storing arrays, *fast elements* and *dictionary elements*
### Fast Elements
[see Numbered Properties](#numbered-properties)
- compact keysets
- linear storage buffer
- contiguous (non-sparse)
- `0` based
- smaller than 64K
### Dictionary Elements
- hash table storage
- slow access
- sparse
- large
#### Packed vs. Holey Elements
- V8 makes distinction whether the elements backing store is packed or has holes
- holes in a backing store are created by deleting an indexed element
- missing properties are marked with special _hole_ value to keep Array functions performant
- however missing properties cause expensive lookups on prototype chain
#### Elements Kinds
[read](https://v8.dev/blog/elements-kinds)
- fast *elements kinds* in order of increasing generality:
- fast Smis (small integers)
- fast doubles (Doubles stored in unboxed representation)
- fast values (strings or other objects)
##### Elements Kind Lattice
```
+--------------------+
| PACKED_SMI_ELEMENT |---+
+--------------------+ | +------------------------+
| +--->| PACKED_DOUBLE_ELEMENTS |---+
↓ +------------------------+ | +-------------------+
+--------------------+ | +--->| PACKED_ELEMENTS |
| HOLEY_SMI_ELEMENTS |---+ ↓ +-------------------+
+--------------------+ | +------------------------+ |
+--->| HOLEY_DOUBLE_ELEMENTS |---+ ↓
+------------------------+ | +-------------------+
+--->| HOLEY_ELEMENTS |
+-------------------+
```
### Double Array Unboxing
[watch](https://youtu.be/UJPdhx5zTaw?t=20m20s) | [slide](http://v8-io12.appspot.com/index.html#45)
- Array's hidden class tracks element types
- if all doubles, array is unboxed aka *upgraded to fast doubles*
- wrapped objects layed out in linear buffer of doubles
- each element slot is 64-bit to hold a double
- Smis that are currently in Array are converted to doubles
- very efficient access
- storing requires no allocation as is the case for boxed doubles
- causes hidden class change
- requires expensive copy-and-convert operation
- careless array manipulation may cause overhead due to boxing/unboxing [watch](https://youtu.be/UJPdhx5zTaw?t=21m50s) |
[slide](http://v8-io12.appspot.com/index.html#47)
### Typed Arrays
[blog](http://mrale.ph/blog/2011/05/12/dangers-of-cross-language-benchmark-games.html) |
[spec](https://www.khronos.org/registry/typedarray/specs/latest/)
- difference is in semantics of indexed properties
- V8 uses unboxed backing stores for such typed arrays
#### Float64Array
- gets 64-bit allocated for each element
### Considerations
- once array is marked as holey it is holey forever
- don't pre-allocate large arrays (`>64K`), instead grow as needed, to avoid them being considered sparse
- do pre-allocate small arrays to correct size to avoid allocations due to resizing
- avoid creating holes, and thus don't delete elements
- don't load uninitialized or deleted elements [watch](https://youtu.be/UJPdhx5zTaw?t=19m30s) |
[slide](http://v8-io12.appspot.com/index.html#43)
- use literal initializer for Arrays with mixed values
- don't store non-numeric values in numeric arrays
- causes boxing and efficient code that was generated for manipulating values can no longer be used
- use typed arrays whenever possible especially when performing mathematical operations on an
array of numbers
- when copying an array, you should avoid copying from the back (higher indices to lower
indices) because this will almost certainly trigger dictionary mode
- avoid elements kind transitions, i.e. edge case of adding `-0, NaN, Infinity` to a Smi array
as they are represented as doubles
## Strings
- string representation and how it maps to each bit
```
map |len |hash|characters
0123|4567|8901|23.........
```
- contain only data (no pointers)
- content not tagged
- immutable except for hashcode field which is lazily computed (at most once)
## Resources
- [video: breaking the javascript speed limit with V8](https://www.youtube.com/watch?v=UJPdhx5zTaw) |
[slides](http://v8-io12.appspot.com/index.html#1)
- [tour of V8: garbage collection - 2013](http://jayconrod.com/posts/55/a-tour-of-v8-garbage-collection)
- [tour of V8: object representation - 2013](http://jayconrod.com/posts/52/a-tour-of-v8-object-representation)
- [V8-design](https://developers.google.com/v8/design#garb_coll)
- [Fast Properties in V8 - 2017](https://v8.dev/blog/fast-properties)
- [“Elements kinds” in V8 - 2017](https://v8.dev/blog/elements-kinds)
- [video: V8 internals for JavaScript developers - 2018](https://www.youtube.com/watch?v=m9cTaYI95Zc)
- [slides: V8 internals for JavaScript developers - 2018](https://slidr.io/mathiasbynens/v8-internals-for-javascript-developers)
================================================
FILE: examples/fibonacci.js
================================================
'use strict'
const PORT = process.env.PORT || 8000
const http = require('http')
const server = http.createServer()
function calArrayConcat(n) {
function toFib(x, y, z) {
return x.concat((z < 2) ? z : x[z - 1] + x[z - 2])
}
const arr = Array.apply(null, new Array(n)).reduce(toFib, [])
const len = arr.length
return arr[len - 1] + arr[len - 2]
}
function calArrayPush(n) {
function toFib(x, y, z) {
x.push((z < 2) ? z : x[z - 1] + x[z - 2])
return x
}
const arr = Array.apply(null, new Array(n)).reduce(toFib, [])
const len = arr.length
return arr[len - 1] + arr[len - 2]
}
function calIterative(n) {
let x = 0
let y = 1
let c = 0
let t
while (c !== n) {
t = x
x = y
y += t
c++
}
return x
}
const METHOD = process.env.METHOD
function onRequest(req, res) {
res.writeHead(200, { 'Content-Type': 'text/plain' })
var n = parseInt(req.url.slice(1))
if (isNaN(n) || n < 0) {
return res.end('Please supply a number larger than 0, i.e. curl localhost:8000/12')
}
let result
switch (METHOD) {
case 'push': result = calArrayPush(n); break
case 'iter': result = calIterative(n); break
default: result = calArrayConcat(n)
}
res.end(`fibonacci of ${n} is ${result}\r\n`)
}
function onListening() {
console.error('HTTP server listening on port', PORT)
}
server
.on('request', onRequest)
.on('listening', onListening)
.listen(PORT)
================================================
FILE: examples/memory-hog.js
================================================
'use strict'
const matrix = []
const TIMEOUT = 2E3
const OUTER_ITER = 1E3
const INNER_ITER = 10
var outer = 2
function minorHog() {
// this is to show that function that allocate less have less width in the allocation profile
const arr = []
for (var i = 0; i < Math.pow(INNER_ITER, outer / 2); i++) {
arr.push(`minor-hog | round: ${outer} | element: ${i}`)
}
matrix.push(arr)
}
function hog() {
const arr = []
for (var i = 0; i < Math.pow(INNER_ITER, outer); i++) {
arr.push(`memory-hog | round: ${outer} | element: ${i}`)
}
matrix.push(arr)
if (++outer < OUTER_ITER) {
setTimeout(hog, TIMEOUT)
setTimeout(minorHog, TIMEOUT / 10)
setTimeout(() => {
// anonymous hog
for (var i = 0; i < Math.pow(INNER_ITER, outer * 0.8); i++) {
arr.push(`anonymous-hog | round: ${outer} | element: ${i}`)
}
matrix.push(arr)
}, TIMEOUT / 5)
} else {
console.log(matrix.length)
}
}
hog()
================================================
FILE: gc.md
================================================
# V8 Garbage Collector
_find the previous version of this document at
[crankshaft/gc.md](crankshaft/gc.md)_
**Table of Contents** *generated with [DocToc](https://github.com/thlorenz/doctoc)*
- [Goals, Techniques](#goals-techniques)
- [Cost of Allocating Memory](#cost-of-allocating-memory)
- [How objects are determined to be dead](#how-objects-are-determined-to-be-dead)
- [Two Generations](#two-generations)
- [Generational Garbage Collector](#generational-garbage-collector)
- [Heap Organization in Detail](#heap-organization-in-detail)
- [New Space aka Young Generation](#new-space-aka-young-generation)
- [Read Only Space](#read-only-space)
- [Old Space](#old-space)
- [Large Object Space](#large-object-space)
- [Code Space](#code-space)
- [Map Space](#map-space)
- [Pages](#pages)
- [Young Generation](#young-generation)
- [ToSpace, FromSpace, Memory Exhaustion](#tospace-fromspace-memory-exhaustion)
- [Sample Scavenge Scenario](#sample-scavenge-scenario)
- [Collection to free ToSpace](#collection-to-free-tospace)
- [Considerations](#considerations)
- [Orinoco Garbage Collector](#orinoco-garbage-collector)
- [Parallel Scavenger](#parallel-scavenger)
- [Scavenger Phases](#scavenger-phases)
- [Distribution of scavenger work across one main thread and two worker threads](#distribution-of-scavenger-work-across-one-main-thread-and-two-worker-threads)
- [Results](#results)
- [Techniques to Improve GC Performance](#techniques-to-improve-gc-performance)
- [Memory Partition and Parallelization](#memory-partition-and-parallelization)
- [Tracking Pointers](#tracking-pointers)
- [Black Allocation](#black-allocation)
- [Resources](#resources)
- [Old Generation Garbage Collector Deep Dive](#old-generation-garbage-collector-deep-dive)
- [Collection Steps](#collection-steps)
- [Mark Sweep and Mark Compact](#mark-sweep-and-mark-compact)
- [Mark](#mark)
- [Marking State](#marking-state)
- [Depth-First Search](#depth-first-search)
- [Handling Deque Overflow](#handling-deque-overflow)
- [Sweep and Compact](#sweep-and-compact)
- [Sweep](#sweep)
- [Compact](#compact)
- [Incremental Mark and Lazy Sweep](#incremental-mark-and-lazy-sweep)
- [Incremental Marking](#incremental-marking)
- [Lazy Sweeping](#lazy-sweeping)
- [Resources](#resources-1)
## Goals, Techniques
- ensures fast object allocation, short garbage collection pauses and no memory fragmentation
- **stop-the-world**,
[generational](http://www.memorymanagement.org/glossary/g.html#term-generational-garbage-collection)
precise garbage collector
- stops program execution when performing steps of young generation garbage collections cycle that can only run
synchronously
- many steps are performed in parallel, see [Orinoco Garbage
Collector](#orinoco-garbage-collector) and only part of the object heap is processed in most
garbage collection cycles to minimize impact on main thread execution
- [mark compact](#mark-sweep-and-mark-compact) is performed
[incrementally](#incremental-mark-and-lazy-sweep) and therefore not _stop-the-world_
- wraps objects in `Handle`s in order to track objects in memory even if they get moved (i.e. due to being promoted)
- identifies dead sections of memory
- GC can quickly scan [tagged words](data-types.md#efficiently-representing-values-and-tagging)
- follows pointers and ignores Smis and *data only* types like strings
## Cost of Allocating Memory
[watch](https://youtu.be/VhpdsjBUS3g?t=10m54s)
- cheap to allocate memory
- expensive to collect when memory pool is exhausted
## How objects are determined to be dead
*an object is live if it is reachable through some chain of pointers from an object which is live by definition,
everything else is garbage*
- considered dead when object is unreachable from a root node
- i.e. not referenced by a root node or another live object
- global objects are roots (always accessible)
- objects pointed to by local variables are roots (stack is scanned for roots)
- DOM element's liveliness is determined via cross-component tracing by tracing from JavaScript
to the C++ implementation of the DOM and back
## Two Generations
[watch](https://youtu.be/VhpdsjBUS3g?t=11m24s)
- object heap segmented into two parts, _Young Generation_ and _Old Generation_
- _Young Generation_ consists of _New Space_ in which new objects are allocated
- _Old Generation_ is divided into multiple parts like _Old Space_, _Map Space_, _Large
Object Space_
- _Old Space_ stores objects that survived enough GC cycles to be promoted to the _Old
Generation_
- for more details [see below](#heap-organization-in-detail)
### Generational Garbage Collector
- two garbage collectors are implemented, each focusing on _young_ and _old_ generation
respectively
- young generation evacuation ([more details](#tospace-fromspace-memory-exhaustion))
- objects initially allocated in _nursery_ of the _young generation_
- objects surviving one GC are copied into _intermediate_ space of the _young generation_
- objects surviving two GCs are moved into _old generation_
```
young generation | old generation
|
nursery | intermediate |
| |
+--------+ | +--------+ | +--------+
| object |---GC--->| object |---GC--->| object |
+--------+ | +--------+ | +--------+
| |
```
## Heap Organization in Detail
### New Space aka Young Generation
- most objects allocated here
- executable `Codes` are always allocated in Old Space
- fast allocation
- simply increase allocation pointer to reserve space for new object
- fast garbage collection
- independent of other spaces
- between 1 and 8 MB
### Read Only Space
- immortal, immovable and immutable objects
### Old Space
- objects surviving _New Space_ long enough are moved here
- may contain pointers to _New Space_
### Large Object Space
- promoted large objects (exceeding size limits of other spaces)
- each object gets its own [`mmap`](http://www.memorymanagement.org/glossary/m.html#mmap)d region of memory
- these objects are never moved by GC
### Code Space
- contains executable code and therefore is marked _executable_
- no pointers to _New Space_
### Map Space
- contains map objects only
### Pages
- each space divided into set of pages
- page is **contiguous** chunk of memory allocated via `mmap`
- page is 512KB in size and 512KB aligned
- exception **Large Object Space** where page can be larger
- page size will most likely decrease in the future
- page contains header
- flags and meta-data
- marking bitmap to indicate which objects are alive
- page has slots buffer
- allocated in separate memory
- forms list of objects which may point to objects stored on the page aka [*remembered
set*](http://www.memorymanagement.org/glossary/r.html#remembered.set)
## Young Generation
*most performance problems related to young generation collections*
- fast allocation
- fast collection performed frequently via [stop and
copy](http://www.memorymanagement.org/glossary/s.html#term-stop-and-copy-collection) - [two-space
collector](http://www.memorymanagement.org/glossary/t.html#term-two-space-collector)
- however some copy operations can run in parallel due to techniques like page isolation, see
[Orinoco Garbage Collector](#orinoco-garbage-collector)
### ToSpace, FromSpace, Memory Exhaustion
[watch](https://youtu.be/VhpdsjBUS3g?t=13m40s) | [code](https://cs.chromium.org/chromium/src/v8/src/heap/spaces.h)
- ToSpace is used to allocate values i.e. `new`
- FromSpace is used by GC when collection is triggered
- ToSpace and FromSpace have **exact same size**
- large space overhead (need ToSpace and FromSpace) and therefore only suitable for small **New Space**
- when **New Space** allocation pointer reaches end of **New Space** V8 triggers minor garbage collection cycle
called **scavenge** or [copying garbage
collection](http://www.memorymanagement.org/glossary/c.html#term-copying-garbage-collection)
- scavenge algorithm similar to the [Halstead semispace copying collector](https://www.cs.cmu.edu/~guyb/papers/gc2001.pdf)
to support parallel processing
- in the past scavenge used to implement [Cheney's algorithm](http://en.wikipedia.org/wiki/Cheney's_algorithm) which is synchronous
- [more details](http://jayconrod.com/posts/55/a-tour-of-v8-garbage-collection) *Generational collection* section
#### Sample Scavenge Scenario
ToSpace starts as unallocated memory.
- alloc A, B, C, D
```
| A | B | C | D | unallocated |
```
- alloc E (not enough space - exhausted **Young Generation** memory)
- triggers collection which partially blocks the main thread
##### Collection to free ToSpace
- swap labels of FromSpace and ToSpace
- as a result the empty (previous) FromSpace is now the ToSpace
- objects on FromSpace are determined to be live or dead
- dead ones are collected
- live ones are marked and copied (expensive) out of From Space and either
- moved to ToSpace, compacted in the process to improve cache locality and considered
_intermediates_ since they survived one GC
- promoted to OldSpace if they were considered _intermediates_
- assuming B and D were dead
```
| A | C | unallocated |
```
- now we can allocate E
#### Considerations
[watch](https://youtu.be/VhpdsjBUS3g?t=15m30s)
- every allocation brings us closer to GC pause
- even though as many steps of collection are performed in parallel and thus average GC pauses
are small (1ms - 10ms) on average
- however **every collection pauses our app**
- avoid referencing short-lived objects longer than necessary, since as long as they die on
the next Scavenge they incurr almost no cost to the GC, but if they need to be copied, they
do
- try to pre-alloc values ahead of time if the are known when your application initializes and
don't change after that, however don't go overboard, i.e. don't sacrifice code quality
## Orinoco Garbage Collector
[watch orinoco overview]([watch](https://youtu.be/EdFDJANJJLs?t=15m10s)) | [jank and concurrent GC](https://youtu.be/HDuSEbLWyOY?t=5m14s) |
[read](https://v8.dev/blog/orinoco)
The Orinioco garbage collector was created in an attempt to lessen the time that our
application stops due to garbage collection by performing as many steps as possible in
parallel.
Numerous techniques like smart paging and use of concurrency friendly algorithms have been used
to both partially parallelize the Old Generation and Young Generation garbage collectors.
- mostly parallel and concurrent garbage collector without _strict_ generational boundaries
- most parts of GC taken off the main thread (56% less GC on main thread)
- optimized weak global handles
- unified heap for full garbage collection
- optimized V8's black allocation additions
- reduced peak memory consumption of on-heap peak memory by up to 40% and off-heap peak memory
by 20% for low-memory devices by tuning several GC heuristics
### Parallel Scavenger
[read](https://v8.dev/blog/orinoco-parallel-scavenger)
- introduced with V8 v6.2 which is part of Node.js V8
- older V8 versions used Cheney semispace copying garbage collector that divides young
generation in two equal halves and [performed moving/copying of objects that survived GC
synchronously](crankshaft/gc.md#tospace-fromspace-memory-exhaustion)
- single threaded scavenger made sense on single-core environments, but at this point Chrome,
Node.js and thus V8 runs in many multicore scenarios
- new algorithm similar to the [Halstead semispace copying collector](https://www.cs.cmu.edu/~guyb/papers/gc2001.pdf)
except that V8 uses dynamic instead of static _work stealing_ across multiple threads
#### Scavenger Phases
As with the previous algorithm scavenge happens in four phases.
All phases are performed in parallel and interleaved on each task, thus maximizing utilization
of worker tasks.
1. scan for roots
- majority of root set are the references from the old generation to the young generation
- [remembered sets](#tracking-pointers) are maintained per page and thus naturally distributes
the root sets among garbage collection threads
2. copy objects within the young generation
3. promote objects to the old generation
- objects are processed in parallel
- newly found objects are added to a global work list from which garbage collection threads can
_steal_
4. update pointers
##### Distribution of scavenger work across one main thread and two worker threads


#### Results
- just a little slower than the optimized Cheney algorithm on very small heaps
- provides high throughput when heap gets larger with lots of life objects
- time spent on main thread by the scavenger was reduced by 20%-50%
### Techniques to Improve GC Performance
#### Memory Partition and Parallelization
- heap memory is partitioned into fixed-size chunks, called _pages_
- _young generation evacuation_ is achieved in parallel by copying memory based on pages
- _memory compaction_ parallelized on page-level
- young generation and old generation compaction phases don't depend on each other and thus are
parallelized
- resulted in 75% reduction of compaction time
#### Tracking Pointers
[read](https://v8.dev/blog/orinoco)
- GC tracks pointers to objects which have to be updated whenever an object is moved
- all pointers to old location need to be updated to object's new location
- V8 uses a _rembered set_ of _interesting pointers_ on the heap
- an object is _interesting_ if it may move during garbage collection or if it lives in heavily
fragmented pages and thus will be moved during compaction
- _remembered sets_ are organized to simplify parallelization and ensure that threads get
disjoint sets of pointers to update
- each page stores offsets to _interesting_ pointers originating from that page
#### Black Allocation
[read](https://v8.dev/blog/orinoco)
- assumption: objects recently allocated in the old generation should at least survive the next
old generation garbage collection and thus are _colored_ black
- _black objects_ are allocated on black pages which aren't swept
- speeds up incremental marking process and results in less garbage collection
### Resources
- [Getting Garbage Collection for Free](https://v8.dev/blog/free-garbage-collection)
_maybe outdated except the scheduling part at the beginning_?
- [Jank Busters Part One](https://v8.dev/blog/jank-busters)
_outdated_?
- [Jank Busters Part Two: Orinoco](https://v8.dev/blog/orinoco)
_outdated_ except for paging, pointer tracking and black allocation?
- [V8 Release 5.3](https://v8.dev/blog/v8-release-53)
- [V8 Release 5.4](https://v8.dev/blog/v8-release-54)
- [Optimizing V8 memory consumption](https://v8.dev/blog/optimizing-v8-memory)
- [Orinoco: young generation garbage collection](https://v8.dev/blog/orinoco-parallel-scavenger)
## Old Generation Garbage Collector Deep Dive
- fast alloc
- slow collection performed infrequently and thus in most cases doesn't affect application
performance as much as the more frequently performed _scavenge_
- `~20%` of objects survive into **Old Generation**
### Collection Steps
[watch](https://youtu.be/VhpdsjBUS3g?t=12m30s)
- parts of collection run concurrent with mutator, i.e. runs on same thread our JavaScript is executed on
- [incremental marking/collection](http://www.memorymanagement.org/glossary/i.html#term-incremental-garbage-collection)
- [mark-sweep](http://www.memorymanagement.org/glossary/m.html#term-mark-sweep): return memory to system
- [mark-compact](http://www.memorymanagement.org/glossary/m.html#term-mark-compact): move values
### Mark Sweep and Mark Compact
[read](http://jayconrod.com/posts/55/a-tour-of-v8-garbage-collection) *Mark-sweep and Mark-compact*
- used to collect **Old Space** which may contain +100 MB of data
- scavenge impractical for more than a few MBs
- two phases
- Mark
- Sweep or Compact
#### Mark
- all objects on heap are discovered and marked
- objects can start at any *word aligned* offset in page and are at least two words long
- each page contains marking bitmap (one bit per allocatable word)
- results in memory overhead `3.1% on 32-bit, 1.6% on 64-bit systems`
- when marking completes all objects are either considered dead *white* or alive *black*
- that info is used during sweeping or compacting phase
#### Marking State
- pairs of bits represent object's *marking state*
- **white**: not yet discovered by GC
- **grey**: discovered, but not all of its neighbors were processed yet
- **black**: discovered and all of its neighbors were processed
- **marking deque**: separately allocated buffer used to store objects being processed
##### Depth-First Search
- starts with clear marking bitmap and all *white* objects
- objects reachable from roots become *grey* and pushed onto *marking deque*
- at each step GC pops object from *marking deque*, marks it *black*
- then marks it's neighboring *white* objects *grey* and pushes them onto *marking deque*
- exit condition: *marking deque* is empty and all discovered objects are *black*
#### Handling Deque Overflow
- large objects i.e. long arrays may be processed in pieces to avoid **deque** overflow
- if *deque* overflows, objects are still marked *grey*, but not pushed onto it
- when *deque* is empty again GC scans heap for *grey* objects, pushes them back onto *deque* and resumes marking
#### Sweep and Compact
- both work at **V8** page level == 1MB contiguous chunks (different from [virtual memory
pages](http://www.memorymanagement.org/glossary/p.html#page))
#### Sweep
- iterates across page's *marking bitmap* to find ranges of unmarked objects
- scans for contiguous ranges of dead objects
- converts them to free spaces
- adds them to free list
- each page maintains separate free lists
- for small regions `< 256 words`
- for medium regions `< 2048 words`
- for large regions `< 16384 words`
- used by scavenge algorithm for promoting surviving objects to **Old Space**
- used by compacting algorithm to relocate objects
#### Compact
[read](http://jayconrod.com/posts/55/a-tour-of-v8-garbage-collection) *Mark-sweep and Mark-compact*
last paragraph
- reduces actual memory usage by migrating objects from fragmented pages to free spaces on other pages
- new pages may be allocated
- evacuated pages are released back to OS
### Incremental Mark and Lazy Sweep
[read](http://jayconrod.com/posts/55/a-tour-of-v8-garbage-collection) *Incremental marking and lazy sweeping*
#### Incremental Marking
- algorithm similar to regular marking
- allows heap to be marked in series of small pauses `5-10ms` each (vs. `500-1000ms` before)
- activates when heap reaches certain threshold size
- when active an incremental marking step is performed on each memory allocation
#### Lazy Sweeping
- occurs after each incremental marking
- at this point heap knows exactly how much memory could be freed
- may be ok to delay sweeping, so actual page sweeps happen on *as-needed* basis
- GC cycle is complete when all pages have been swept at which point incremental marking starts again
## Resources
- [video: accelerating oz with V8](https://www.youtube.com/watch?v=VhpdsjBUS3g)
- [V8-design](https://github.com/v8/v8/wiki/Design%20Elements#efficient-garbage-collection)
- [tour of V8: garbage collection - 2013](http://jayconrod.com/posts/55/a-tour-of-v8-garbage-collection)
- [memory management reference](http://www.memorymanagement.org/)
- [Tracing from JS to the DOM and back again](https://v8project.blogspot.de/2018/03/tracing-js-dom.html)
================================================
FILE: inspection.md
================================================
# Inspection and Performance Profiling
_find the previous version of this document at
[crankshaft/performance-profiling.md](crankshaft/performance-profiling.md)_
- [General Strategies to track and improve Performance](#general-strategies-to-track-and-improve-performance)
- [Identify and Understand Performance Problem](#identify-and-understand-performance-problem)
- [Sampling CPU Profilers](#sampling-cpu-profilers)
- [Structural CPU Profilers](#structural-cpu-profilers)
- [Instrumentation Techniques](#instrumentation-techniques)
- [Instrumenting vs. Sampling](#instrumenting-vs-sampling)
- [Plan for Performance](#plan-for-performance)
- [Animation Frame](#animation-frame)
- [Node.js Perf And Tooling](#nodejs-perf-and-tooling)
- [Profile JavaScript CPU Usage of Node.js via Chrome DevTools](#profile-javascript-cpu-usage-of-nodejs-via-chrome-devtools)
- [Resources](#resources)
- [Profile FullStack CPU Usage of Node.js](#profile-fullstack-cpu-usage-of-nodejs)
- [Tools To Produce Full Stack Flamegraphs](#tools-to-produce-full-stack-flamegraphs)
- [Brendan Gregg's Flamegraph Tool](#brendan-greggs-flamegraph-tool)
- [0x](#0x)
- [Perf](#perf)
- [Dtrace](#dtrace)
- [Inspecting V8](#inspecting-v8)
- [V8 flags](#v8-flags)
- [AST](#ast)
- [Byte Code](#byte-code)
- [Tracing Inline Caches](#tracing-inline-caches)
- [Optimized Code](#optimized-code)
- [Tracing Optimizations](#tracing-optimizations)
- [Tracing Map Creation](#tracing-map-creation)
- [Resources](#resources-1)
- [Runtime Call Stats](#runtime-call-stats)
- [Resources](#resources-2)
- [Memory Visualization](#memory-visualization)
- [Resources](#resources-3)
- [Array Elements Kinds](#array-elements-kinds)
- [Resources](#resources-4)
- [Tools to Inspect/Visualize V8 Operations](#tools-to-inspectvisualize-v8-operations)
- [Turbolizer](#turbolizer)
- [Considerations when Improving Performance](#considerations-when-improving-performance)
- [Profilers](#profilers)
- [Tweaking hot Code](#tweaking-hot-code)
- [Resources](#resources-5)
## General Strategies to track and improve Performance
### Identify and Understand Performance Problem
[watch](https://youtu.be/UJPdhx5zTaw?t=40m1s) |
[slide](http://v8-io12.appspot.com/index.html#83) |
[watch profiling workflow](https://www.youtube.com/watch?v=nxXkquTPng8&feature=share&t=40m50s)
Analyse performance only once you have a problem in a top down manner like so:
- ensure it's JavaScript and not the DOM
- reduce testcase to pure JavaScript and run in `d8` shell
- collect metrics and locate bottlenecks
- sample profiling to narrow down the general problem area
- at this point think about the algorithm, data structures, techniques, etc. used in this area and evaluate if
improvements in this area are possible since that will most likely yield greater impact than any of the more fine
grained improvments
- structural profiling to isolate the exact area i.e. function in which most time is spent
- evaluate what can be improved here again thinking about algorithm first
- *only once* algorithm and data structures seem optimal evaluate how the code structure affects assembly code generated by V8 and
possible optimizations (small functions, `try/catch`, closures, loops vs. `forEach`, etc.)
- optimize slowest section of code and repeat structural profiling
### Sampling CPU Profilers
[watch](https://www.youtube.com/watch?v=nxXkquTPng8&feature=share&t=3m20s) |
[watch walkthrough](https://www.youtube.com/watch?v=nxXkquTPng8&feature=share&t=34m00s)
- at fixed frequency program is instantaneously paused *by setting stacksize to 0* and the call stack sampled
- assumes that the sample is representative of workload
- gives no sense fo flow to due gaps between samples
- functions that were inlined by compiler aren't shown
- collect data for longer period of time, sampling every 1ms
- ensure code is exercising the right code paths
### Structural CPU Profilers
[watch](https://www.youtube.com/watch?v=nxXkquTPng8&feature=share&t=7m10s) |
[watch walkthrough](https://www.youtube.com/watch?v=nxXkquTPng8&feature=share&t=37m10s)
- functions are instrumented to record entry and exit times
- three data points per function
- **Inclusive Time**: time spent in function *including* its children
- **Exclusive Time**: time spent in function *excluding* its children
- **Call Count**: number of times the function was called
- data points are taken at much higher frequency than sampling
- higher cost than sampling dut to instrumentation
- goal of optimization is to **minimize inclusive time**
- inlined functions retain markers
#### Instrumentation Techniques
[watch](https://www.youtube.com/watch?v=nxXkquTPng8&feature=share&t=46m10s)
- think about data being processed
- is one piece of data slower?
- name time ranges based on data
- use variables/properties to dynamically name ranges
### Instrumenting vs. Sampling
[watch](https://www.youtube.com/watch?v=nxXkquTPng8&feature=share&t=10m30s)
```
+--------------------------------------------------------------------------------------------+
| | Sampling | Structural / Instrumenting |
|-----------------------------------+------------------------+-------------------------------|
| Time | Approximate | Exact |
| Invocation count | Approximate | Exact |
| Overhead | Small | High(er) |
| Accuracy | Good - Poor | Good - Poor |
| Extra code / instrumentation | No | Yes |
+--------------------------------------------------------------------------------------------+
```
- need both
- manual instrumentation can reduce overhead
- instrumentation affects performance and may affect behavior
- samples are very accurate, but inaccurate for extracting time
- sampling requires no program modification
### Plan for Performance
[watch](https://www.youtube.com/watch?v=nxXkquTPng8&feature=share&t=47m50s)
- each module of app sould have time budget
- sum of modules should be `< 16ms` for smooth client side apps
- track performance daily or per commit in order to catch *budget busters* right away
### Animation Frame
[watch](https://www.youtube.com/watch?v=nxXkquTPng8&feature=share&t=50m00s) |
[watch walkthrough](https://www.youtube.com/watch?v=nxXkquTPng8&feature=share&t=52m20s)
- queue up key handlers and execute inside Animation Frame
- optimize for lowest common denominator that your app will run on
- for mobile stay below `8-10ms` since remaining time is needed for chrome to do its work, i.e. render
## Node.js Perf And Tooling
[watch](https://youtu.be/EdFDJANJJLs?t=23m51s)
- Node.js is _inspectable_ via the `--inspect` and [similar flags](https://nodejs.org/en/docs/inspector/#command-line-options)
- multiple tools, like DevTools (chrome://inspect) and VS Code integrate with it to allow debugging and profiling Node.js applications
- DevTools includes dedicated Node.js window that auto connects to any Node.js process that is launched with the debugger enabled
- _in line_ breakpoints allow breaking on specific statement on a line with multiple statements
- async code flow debugging is supported (async stack traces)
### Profile JavaScript CPU Usage of Node.js via Chrome DevTools
[read](https://developers.google.com/web/updates/2016/12/devtools-javascript-cpu-profile-migration) |
[read](https://nodejs.org/en/docs/guides/debugging-getting-started/#command-line-options)
- launch your application with `node --inspect app.js`
- open dedicated Node.js DevTools via [chrome://inspect](chrome://inspect) or by clicking the
Node.js icon in the upper left of any DevTools window
- select the profiler tab and click _Start_ while loading your application and _Stop_ when done
- inspect the profile via the _Chart_ view to see the timeline of function execution
- select the _Heavy (Bottom Up)_ view to see functions ordered by aggregated time spent
executing them
- in both views `Cmd|Ctrl - F` allows searching for specific functions, i.e. searching for
`garbage` will highlight all instances in which garbage was collected
- the time spent in `program` frames is either spent in native code or idling and if a lot of
those frames it is advised to profile either via `node --prof` or kernel tracing tools like
_perf_ or _dtrace_ in conjunction with flamegraph visualizers

### Resources
- [Node.js Inspector Clients like DevTools](https://nodejs.org/en/docs/guides/debugging-getting-started/#inspector-clients)
### Profile FullStack CPU Usage of Node.js
#### Tools To Produce Full Stack Flamegraphs
##### Brendan Gregg's Flamegraph Tool
[read](http://www.brendangregg.com/flamegraphs.html)
- takes [perf](#perf) or [dtrace](#dtrace) results as input and transforms them into
flamegraphs in three steps using the included Perl scripts
- when using [perf](#perf) and the Node.js process was run with `--perf-basic-prof` it is able
to resolve JavaScript symbols
- [thlorenz/flamegraph](https://github.com/thlorenz/flamegraph) is a port of those scripts to a
JavaScript module and [application](http://thlorenz.github.io/flamegraph/web/) to make it
easier to use with the added benefit of resolving JavaScript symbols when using dtrace as
well
- [0x](#0x) took ideas from both of these tools to provide a very easy to use solution to
profile Node.js applications
##### 0x
- [0x](https://github.com/davidmarkclements/0x) combines all steps to generate flamegraphs into
an easy to use package and is the recommended solution to produce flamegraphs for Node.js
applications running locally
- by default it adds the `--prof` flag when running your Node.js application and includes
JavaScript as well as native symbols for V8 and Node.js, selectable in the toolbar of the
visualization (_V8_ and _cpp_)
- for cases in which lower level inspection is required, the [command line
api](https://github.com/davidmarkclements/0x#command-line-api) includes a
[`--kernel-tracing` flag](https://github.com/davidmarkclements/0x/blob/master/docs/kernel-tracing.md)
which will use perf or dtrace (depending on OS) to profile your application and produce a
flamegraph from its output
- an interactive demo can be [found here](http://davidmarkclements.github.io/0x-demo/)
#### Perf
[read](https://mrale.ph/blog/2018/02/03/maybe-you-dont-need-rust-to-speed-up-your-js.html#profiling-the-pure-javascript-version) |
[read](http://www.brendangregg.com/perf.html) _very comprehensive resource on perf with tons of examples_
Only available on Linux.
```sh
perf record -g node --perf-basic-prof app.js
perf report ## add --no-children to avoid expanding nodes
```
- visualize `perf` output via [Brendan Gregg's Flamegraph Tool](https://github.com/brendangregg/FlameGraph)
- [0x](#0x) uses it under the hood to produce input when `--kernel-tracing` is enabled when
profiling Node.js applications on Linux
#### Dtrace
[read](http://www.brendangregg.com/dtrace.html)
Only available on BSD Unix, like Mac OSX or Solaris.
- since dtrace accepts a full script, there are infinite ways of profiling applications with it
- [here](https://github.com/thlorenz/cpuprofilify/blob/master/bin/profile_1ms.d) is an example
script that produces data that can become input to tools to produce flamegraphs
- [0x](#0x) uses it under the hood to produce input when `--kernel-tracing` is enabled when
profiling Node.js applications on BSD Unixes
- [here](https://github.com/thlorenz/cpuprofilify#instructions) is an example to do this
manually for Node.js applications
## Inspecting V8
### V8 flags
Multiple flags and so called _run time functions_ are available to anyone who likes to peek
into the inner workings of V8.
#### AST
- `--print-ast` prints the AST generated by V8 to the console
#### Byte Code
- `--print-bytecode` prints bytecode generated by ignition interpreter to the console
- provides more info when run with debug build d8, i.e. information about maps created
#### Tracing Inline Caches
- `--trace-ic` dumps IC traces to the console
- pipe that output into `./v8/tools/ic-processor` to visualize it
#### Optimized Code
- `--print-opt-code` prints the actual optimized code that is generated by TurboFan
- `--code-comments` adds comments to printed optimized code
#### Tracing Optimizations
- `--trace-opt` traces lazy optimization
- _generic ICs_ are _bad_ as if lots of them are present, code will not be optimized
- _ICs with typeinfo_ are _good_
#### Tracing Map Creation
- `--trace-maps` in combination with `--trace-maps-details` trace map generation into v8.log
- `--expose-gc` allows forcing GC via `gc()` in your code to see which maps are short lived
- the output can be parsed to see what maps _hidden classes_ and transitions into other maps V8
creates to represent your objects
- a graphical presentation is also available by loading the resulting `v8.log` into
`/v8/tools/map-processor.htm` (requires V8 checkout)
##### Resources
- [The case of temporary objects in Chrome](http://benediktmeurer.de/2016/10/11/the-case-of-temporary-objects-in-chrome/)
#### Runtime Call Stats
- `--runtime-call-stats` dumps statistics about the V8 runtime to the console
- these stats give detailed info where V8 time is spent
**Sample Output** (abbreviated)
```
Runtime Function/C++ Builtin Time Count
========================================================================================
JS_Execution 8.82ms 47.24% 1 0.11%
RecompileSynchronous 3.89ms 20.83% 7 0.75%
API_Context_New 2.20ms 11.78% 1 0.11%
GC_SCAVENGER_SCAVENGE 0.88ms 4.73% 15 1.60%
AllocateInNewSpace 0.51ms 2.71% 71 7.59%
GC_SCAVENGER_SCAVENGE_ROOTS 0.38ms 2.04% 15 1.60%
GC_SCAVENGER_SCAVENGE_PARALLEL 0.24ms 1.29% 15 1.60%
GC_SCAVENGER_BACKGROUND_SCAVENGE_PARALLEL 0.18ms 0.94% 15 1.60%
GC_Custom_SlowAllocateRaw 0.15ms 0.79% 6 0.64%
CompileForOnStackReplacement 0.13ms 0.70% 2 0.21%
ParseProgram 0.13ms 0.70% 1 0.11%
CompileIgnition 0.13ms 0.69% 4 0.43%
PreParseNoVariableResolution 0.11ms 0.59% 3 0.32%
OptimizeCode 0.09ms 0.46% 5 0.53%
CompileScript 0.08ms 0.41% 1 0.11%
Map_TransitionToDataProperty 0.07ms 0.40% 92 9.84%
InterpreterDeserializeLazy 0.07ms 0.36% 28 2.99%
Map_SetPrototype 0.06ms 0.29% 249 26.63%
FunctionCallback 0.05ms 0.27% 3 0.32%
ParseFunctionLiteral 0.04ms 0.22% 3 0.32%
GC_HEAP_EPILOGUE 0.04ms 0.19% 15 1.60%
[ ... ... ... ... ... ]
----------------------------------------------------------------------------------------
Total 18.67ms 100.00% 935 100.00%
```
##### Resources
- [real world performance measurements](http://benediktmeurer.de/2016/12/20/v8-behind-the-scenes-december-edition/#real-world-performance-measurements)
#### Memory Visualization
- V8 heap statistics feature provides insight into both the V8 managed heap and the C++ heap
- `--trace-gc-object-stats` dumps memory-related statistics to the console
- this data can be visualized via the [V8 heap visualizer](https://mlippautz.github.io/v8-heap-stats/)
- make sure to not log to _stdout_ when generating the `v8.gc_stats` file
- NOTE: when I tried this tool by loading a `v8.gc_stats` generated via
`node --trace-gc-object-stats script.js > v8.gc_stats` it errored
- serving `v8 ./tools/heap-stats` locally had the same result
##### Resources
- [Optimizing V8 memory consumption](https://v8.dev/blog/optimizing-v8-memory)
#### Array Elements Kinds
- enable native functions via `--allow-natives-syntax`
- then use `%DebugPrint(array)` to dump information about this array to the console
- the `elements` field will hold information about the _elements kinds_ of the array
**Sample Output** (abbreviated)
```
DebugPrint: 0x1fbbad30fd71: [JSArray]
- map = 0x10a6f8a038b1 [FastProperties]
- prototype = 0x1212bb687ec1
- elements = 0x1fbbad30fd19 [PACKED_SMI_ELEMENTS (COW)]
- length = 3
- properties = 0x219eb0702241 {
#length: 0x219eb0764ac9 (const accessor descriptor)
}
- elements= 0x1fbbad30fd19 {
0: 1
1: 2
2: 3
}
[…]
```
- `--trace-elements-transitions` dumps elements transitions taking place to the console
**Sample Output**
```
elements transition [PACKED_SMI_ELEMENTS -> PACKED_DOUBLE_ELEMENTS]
in ~+34 at x.js:2 for 0x1df87228c911
from 0x1df87228c889 to 0x1df87228c941
```
##### Resources
- ["Elements kinds" in V8](https://v8.dev/blog/elements-kinds)
### Tools to Inspect/Visualize V8 Operations
#### Turbolizer
- when Node.js or d8 is run with the `--trace-turbo` it outputs one `turbo-*.json` file per
function
- each JSON file includes information about optimized code along the various phases of Turbofan's optimization pipeline
- [turbolizer](https://github.com/thlorenz/turbolizer) is a tool derived from the [turbolizer
application](https://github.com/v8/v8/tree/master/tools/turbolizer) included with V8
- it visualizes the TurboFan optimization pipeline information and provides easy navigation between source
code, Turbofan IR graphs, scheduled IR nodes and generated assembly code
## Considerations when Improving Performance
Three groups of optimizations are algorithmic improvements, workarounds JavaScript limitations
and workarounds for V8 related issues.
As we have shown V8 related issues have decreased immensely and should be reported to the V8
team if found, however in some cases workarounds are needed.
However before applying any optimizations first profile your app and understand the underlying
problem, then apply changes and prove by measuring that they change things for the better.
#### Profilers
- different performance problems call for different approaches to profile and visualize the
cause
- learn to use different profilers including _low level_ profilers like `perf`
#### Tweaking hot Code
- before applying micro optimizations to your code reason about its abstract complexity
- evaluate how your code would be used on average and in the worst case and make sure your
algorithm handles both cases in a performant manner
- prefer monomorphism in very hot code paths if possible, as polymorphic functions cannot be
optimized to the extent that monomorphic ones can
- measure that strategies like _caching_ and _memoization_ actually result in performance
improvements before applying them as in some cases the cache lookup maybe more expensive than
performing the computation
- understand limitations and costs of V8, a garbage collected system, in order to choose
appropriate data types to improve performance, i.e. prefer a `Uint8Array` over a `String`
when it makes sense
### Resources
- [Maybe you don't need Rust and WASM to speed up your JS - 2018](https://mrale.ph/blog/2018/02/03/maybe-you-dont-need-rust-to-speed-up-your-js.html)
- [video: accelerating oz with V8](https://www.youtube.com/watch?v=VhpdsjBUS3g) |
[slides](http://commondatastorage.googleapis.com/io-2013/presentations/223.pdf)
- [video: structural and sampling profiling in google chrome](https://www.youtube.com/watch?v=nxXkquTPng8) |
[slides](https://www.igvita.com/slides/2012/structural-and-sampling-javascript-profiling-in-chrome.pdf)
- [V8 profiler](https://code.google.com/p/v8/wiki/V8Profiler)
- [stackoverflow: how to debug nodejs applications](http://stackoverflow.com/a/16512303/97443)
================================================
FILE: language-features.md
================================================
# Language Features
This document lists JavaScript language features and provides info with regard to their
performance. In some cases it is explained why a feature used to be slow and how it was sped
up.
The bottom line is that most features that could not be optimized previously due to limitations
of crankshaft are now first class citizens of the new compiler chain and don't prevent
optimizations anymore.
Therefore write clean idiomatic code [as explained
here](https://github.com/thlorenz/v8-perf/blob/turbo/compiler.md#facit), and use all features
that the language provides.
**Table of Contents** *generated with [DocToc](https://github.com/thlorenz/doctoc)*
- [Function Bind](#function-bind)
- [Why Was Bind Slow?](#why-was-bind-slow)
- [What Changed?](#what-changed)
- [Recommendations](#recommendations)
- [Resources](#resources)
- [instanceof and @@hasInstance](#instanceof-and-hasinstance)
- [Recommendations](#recommendations-1)
- [Resources](#resources-1)
- [Reflection API](#reflection-api)
- [Resources](#resources-2)
- [Array Builtins](#array-builtins)
- [const](#const)
- [Recommendations](#recommendations-2)
- [Resources](#resources-3)
- [Iterating Maps and Sets via `for of`](#iterating-maps-and-sets-via-for-of)
- [Why was it Slow?](#why-was-it-slow)
- [What Changed?](#what-changed-1)
- [Recommendations](#recommendations-3)
- [Resources](#resources-4)
- [Iterating Maps and Sets via `forEach` and Callbacks](#iterating-maps-and-sets-via-foreach-and-callbacks)
- [Why was it Slow?](#why-was-it-slow-1)
- [What Changed?](#what-changed-2)
- [Recommendations](#recommendations-4)
- [Resources](#resources-5)
- [Iterating Object properties via for in](#iterating-object-properties-via-for-in)
- [Incorrect Use of For In To Iterate Object Properties](#incorrect-use-of-for-in-to-iterate-object-properties)
- [Correct Use of For In To Iterate Object Properties](#correct-use-of-for-in-to-iterate-object-properties)
- [Why was it Fast?](#why-was-it-fast)
- [What Changed?](#what-changed-3)
- [Recommendations](#recommendations-5)
- [Resources](#resources-6)
- [Object Constructor Subclassing and Class Factories](#object-constructor-subclassing-and-class-factories)
- [Recommendations](#recommendations-6)
- [Resources](#resources-7)
- [Tagged Templates](#tagged-templates)
- [Resources](#resources-8)
- [Typed Arrays and ArrayBuffer](#typed-arrays-and-arraybuffer)
- [Recommendations](#recommendations-7)
- [Resources](#resources-9)
- [Object.is](#objectis)
- [Resources](#resources-10)
- [Regular Expressions](#regular-expressions)
- [Resources](#resources-11)
- [Destructuring](#destructuring)
- [Recommendations](#recommendations-8)
- [Resources](#resources-12)
- [Promises Async/Await](#promises-asyncawait)
- [Resources](#resources-13)
- [Generators](#generators)
- [Resources](#resources-14)
- [Proxies](#proxies)
- [Recommendations](#recommendations-9)
- [Resources](#resources-15)
## Function Bind
### Why Was Bind Slow?
- performance of `Function.prototype.bind` and `bound` functions suffered from performance
issues in crankshaft days
- language boundaries C++/JS were crossed both ways which is expensive (esp. calling back from
C++ into JS)
- two temporary arrays were created on every invocation of a bound function
- due to crankshaft limitations this couldn't be fixed easily there
### What Changed?
- entirely new approach to how _bound function exotic objects_ are implemented
- crossing C++/JS boundaries no longer needed
- pushing bound receiver and bound arguments directly and then calling target function allows
further compile time optimizations and enables inlining the target function into the
caller
- TurboFan inlines all mononomorphic calls to `bind` itself
- resulted in **~400x** speed improvement
- the performance of the React runtime, which makes heavy use of `bind`, doubled as a result
### Recommendations
- developers should use bound functions freely wherever they apply without having to worry
about performance penalties
- the two below snippets perform the same but arguably the second one is more readable and for the
case of `arr.reduce` is the only way to pass `this` as it doesn't support passing it as a
separate parameter like `forEach` and `map` do
```js
// passing `this` to map as separate parameter
arr.map(convert, this)
// binding `this` to the convert function directly
arr.map(convert.bind(this))
```
### Resources
- [A new approach to Function.prototype.bind - 2015](http://benediktmeurer.de/2015/12/25/a-new-approach-to-function-prototype-bind/)
- [Optimizing bound functions further - 2016](http://benediktmeurer.de/2016/01/14/optimizing-bound-functions-further/)
- [bound function exotic objects](https://tc39.github.io/ecma262/#sec-bound-function-exotic-objects)
- [V8 release v6.4 - 2017](https://v8.dev/blog/v8-release-64)
## instanceof and @@hasInstance
- latest JS allows overriding behavior of `instanceOf` via the `@@hasInstance` _well known
symbol_
- naively this requires a check if `@@hasInstance` is defined for the given object every time
`instanceof` is invoked for it (in 99% of the cases it won't be defined)
- initially that check was skipped as long as no overrides were added EVER (global protector
cell)
- Node.js `Writable` class used `@@hasInstance` and thus incurred huge performance bottleneck
for `instanceof` ~100x, since now checks were no longer skipped
- optimizations weren't possible in these cases initially
- by avoiding to depend on global protector cell for TurboFan and allowing inlining `instancof`
code this performance bottleneck has been fixed
- similar improvements were made in similar fashion to other _well-known symbols_ like
`@@iterator` and `@@toStringTag`
### Recommendations
- developers can use `instanceof` freely without worrying about non-deterministic performance
characteristics
- developers should think hard before overriding its behavior via `@@hasInstance` since this
_magical behavior_ may confuse others, but using it will incur no performance penalties
### Resources
- [V8: Behind the Scenes (November Edition) - 2016](http://benediktmeurer.de/2016/11/25/v8-behind-the-scenes-november-edition/)
- [Investigating Performance of Object#toString in ES2015 - 2017](http://benediktmeurer.de/2017/08/14/investigating-performance-object-prototype-to-string-es2015/)
## Reflection API
- `Reflect.apply` and `Reflect.construct` received 17x performance boost in V8 v6.1 and
therefore should be considered performant at this point
### Resources
- [V8 Release 6.1 - 2017](https://v8.dev/blog/v8-release-61)
## Array Builtins
- `Array` builtins like `map`, `forEach`, `reduce`, `reduceRight`, `find`, `findIndex`, `some`
and `every` can be inlined into TurboFan optimized code which results in considerable
performance improvement
- optimizations are applied to all _major non-holey_ elements kinds for all `Array` builtins
- for all builtins, except `find` and `findIndex` _holey floating-point_ arrays don't cause
bailouts anymore
- [V8: Behind the Scenes (February Edition) - 2017](http://benediktmeurer.de/2017/03/01/v8-behind-the-scenes-february-edition/)
- [V8 Release 6.1 - 2017](https://v8.dev/blog/v8-release-61)
- [V8 release v6.5 - 2018](https://v8.dev/blog/v8-release-65)
## const
- `const` has more overhead when it comes to temporal deadzone related checks since it isn't
hoisted
- however the `const` keyword also guarantees that once a value is assigned to its slot it
won't change in the future
- as a result TurboFan skips loading and checking `const` slot values slots each time they are
accessed (_Function Context Specialization_)
- thus `const` improves performance, but only once the code was optimized
### Recommendations
- `const`, like `let` adds cost due to TDZ (temporal deadzone) and thus performs slightly worse
in unoptimized code
- `const` performs a lot better in optimized code than `var` or `let`
### Resources
- [JavaScript Optimization Patterns (Part 2) - 2017](http://benediktmeurer.de/2017/06/29/javascript-optimization-patterns-part2/)
## Iterating Maps and Sets via `for of`
- `for of` can be used to walk any collection that is _iterable_
- this includes `Array`s, `Map`s, and `Set`s
### Why was it Slow?
- set iterators where implemented via a mix of self-hosted JavaScript and C++
- allocated two objects per iteration step (memory overhead -> increased GC work)
- transitioned between C++ and JS on every iteration step (expensive)
- additionally each `for of` is implicitly wrapped in a `try/catch` block as per the language
specification, which prevented its optimization due to crankshaft not ever optimizing
functions which contained a `try/catch` statement
### What Changed?
- improved optimization of calls to `iterator.next()`
- avoid allocation of `iterResult` via _store-load propagation_, _escape analysis_ and _scalar
replacement of aggregates_
- avoid allocation of the _iterator_
- fully implemented in JavaScript via [CodeStubAssembler](https://v8.dev/docs/csa-builtins)
- only calls to C++ during GC
- full optimization now possible due to TurboFan's ability to optimize functions that include a
`try/catch` statement
### Recommendations
- use `for of` wherever needed without having to worry about performance cost
### Resources
- [Faster Collection Iterators - 2017](http://benediktmeurer.de/2017/07/14/faster-collection-iterators/)
- [V8 Release 6.1 - 2017](https://v8.dev/blog/v8-release-61)
## Iterating Maps and Sets via `forEach` and Callbacks
- both `Map`s and `Set`s provide a `forEach` method which allows iterating over it's items by
providing a callback
### Why was it Slow?
- were mainly implemented in C++
- thus needed to transition to C++ first and to handle the callback needed to transition back
to JavaScript (expensive)
### What Changed?
- `forEach` builtins were ported to the
[CodeStubAssembler](https://v8.dev/docs/csa-builtins) which lead to
a significant performance improvement
- since now no C++ is in play these function can further be optimized and inlined by TurboFan
### Recommendations
- performance cost of using builtin `forEach` on `Map`s and `Set`s has been reduced drastically
- however an additional closure is created which causes memory overhead
- the callback function is created new each time `forEach` is called (not for each item but
each time we run that line of code) which could lead to it running in unoptimized mode
- therefore when possible prefer `for of` construct as that doesn't need a callback function
### Resources
- [Faster Collection Iterators - Callback Based Iteration - 2017](http://benediktmeurer.de/2017/07/14/faster-collection-iterators/#callback-based-iteration)
- [V8 Release 6.1 - 2017](https://v8.dev/blog/v8-release-61)
## Iterating Object properties via for in
### Incorrect Use of For In To Iterate Object Properties
```js
var ownProps = 0
for (const prop in obj) {
if (obj.hasOwnProperty(prop)) ownProps++
}
```
- problematic due to `obj.hasOwnProperty` call
- may raise an error if `obj` was created via `Object.create(null)`
- `obj.hasOwnProperty` becomes megamorphic if `obj`s with different shapes are passed
- better to replace that call with `Object.prototype.hasOwnProperty.call(obj, prop)` as it is
safer and avoids potential performance hit
### Correct Use of For In To Iterate Object Properties
```js
var ownProps = 0
for (const prop in obj) {
if (Object.prototype.hasOwnProperty.call(obj, prop)) ownProps++
}
```
### Why was it Fast?
- crankshaft applied two optimizations for cases were only enumerable fast properties on
receiver were considered and prototype chain didn't contain enumerable properties or other
special cases like proxies
- _constant-folded_ `Object.hasOwnProperty` calls inside `for in` to `true` whenever
possible, the below three conditions need to be met
- object passed to call is identical to object we are enumerating
- object shape didn't change during loop iteration
- the passed key is the current enumerated property name
- enum cache indices were used to speed up property access
### What Changed?
- _enum cache_ needed to be adapted so TurboFan knew when it could safely use _enum cache
indices_ in order to avoid deoptimization loop (that also affected crankshaft)
- _constant folding_ was ported to TurboFan
- separate _KeyAccumulator_ was introduced to deal with complexities of collecting keys for
`for-in`
- _KeyAccumulator_ consists of fast part which support limited set of `for-in` actions and slow part which
supports all complex cases like ES6 Proxies
- coupled with other TurboFan+Ignition advantages this led to ~60% speedup of the above case
### Recommendations
- `for in` coupled with the correct use of `Object.prototype.hasOwnProperty.call(obj, prop)` is
a very fast way to iterate over the properties of an object and thus should be used for these
cases
### Resources
- [Restoring for..in peak performance - 2017](http://benediktmeurer.de/2017/09/07/restoring-for-in-peak-performance/)
- [Require Guarding for-in](https://eslint.org/docs/rules/guard-for-in)
- [Fast For-In in V8 - 2017](https://v8.dev/blog/fast-for-in)
## Object Constructor Subclassing and Class Factories
- pure object subclassing `class A extends Object {}` by itself is not useful as `class B
{}` will yield the same result even though [`class A`'s constructor will have different
prototype chain than `class B`'s](https://github.com/thlorenz/d8box/blob/8ec3c71cb6bdd7fe8e32b82c5f19d5ff24c65776/examples/object-subclassing.js#L22-L23)
- however subclassing to `Object` is heavily used when implementing mixins via class factories
- in the case that no base class is desired we pass `Object` as in the example below
```js
function createClassBasedOn(BaseClass) {
return class Foo extends BaseClass { }
}
class Bar {}
const JustFoo = createClassBasedOn(Object)
const FooBar = createClassBasedOn(Bar)
```
- TurboFan detects the cases for which the `Object` constructor is used as the base class and
fully inlines object instantiation
### Recommendations
- class factories won't incur any extra overhead if no specific base class needs to be _mixed
in_ and `Object` is passed to be extended from
- therefore use freely wherever if mixins make sense
### Resources
- [Optimize Object constructor subclassing - 2017](http://benediktmeurer.de/2017/10/05/connecting-the-dots/#optimize-object-constructor-subclassing)
## Tagged Templates
- [tagged templates](https://developer.mozilla.org/en-US/docs/Web/JavaScript/Reference/Template_literals#Tagged_templates)
are optimized by TurboFan and can be used where they apply
### Resources
- [optimize tagged templates - 2017](http://benediktmeurer.de/2017/10/05/connecting-the-dots/#optimize-tagged-templates)
## Typed Arrays and ArrayBuffer
- typed arrays are highly optimized by TurboFan
- calls to [`Function.prototype.apply` with TypedArrays as a parameter](http://benediktmeurer.de/2017/10/05/connecting-the-dots/#fast-path-for-typedarrays-in-functionprototypeapply)
were sped up which positively affected calls to `String.fromCharCode`
- [`ArrayBuffer` view checks](http://benediktmeurer.de/2017/10/05/connecting-the-dots/#optimize-arraybuffer-view-checks)
were improved by optimizing `ArrayBuffer.isView` and `TypedArray.prototype[@@toStringTag]`
- storing booleans inside TypedArrays was improved to where it now is identical to storing
integers
### Recommendations
- TypedArrays should be used wherever possible as it allows V8 to apply optimizations faster
and more aggressively than for instance with plain Arrays
- any remaining bottlenecks will be fixed ASAP as TypedArrays being fast is a prerequisite of
Webgl performing smoothly
### Resources
- [Connecting the dots - 2017](http://benediktmeurer.de/2017/10/05/connecting-the-dots)
## Object.is
- one usecase of `Object.is` is to check if a value is `-0` via `Object.is(v, -0)`
- previously implemented as C++ and thus couldn't be optimized
- now implemented via fast CodeStubAssembler which improved performance by ~14x
### Resources
- [Improve performance of Object.is - 2017](http://benediktmeurer.de/2017/10/05/connecting-the-dots/#improve-performance-of-objectis)
## Regular Expressions
- migrated away from JavaScript to minimize overhead that hurt performance in previous
implementation
- new design based on [CodeStubAssembler](compiler.md#codestubassembler)
- entry-point stub into RegExp engine can easily be called from CodeStubAssembler
- make sure to neither modify the `RegExp` instance or its prototype as that will interfere
with optimizations applied to regex operations
- [named capture groups](https://developers.google.com/web/updates/2017/07/upcoming-regexp-features#named_captures)
are supported starting with V8 v6.4
### Resources
- [Speeding up V8 Regular Expressions - 2017](https://v8.dev/blog/speeding-up-regular-expressions)
- [V8 release v6.4 - 2017](https://v8.dev/blog/v8-release-64)
- [RegExp named capture groups - 2017](http://2ality.com/2017/05/regexp-named-capture-groups.html#named-capture-groups)
## Destructuring
- _array destructuring_ performance on par with _naive_ ES5 equivalent
### Recommendations
- employ destructuring syntax freely in your applications
### Resources
- [High-performance ES2015 and beyond - 2017](https://v8.dev/blog/high-performance-es2015)
## Promises Async/Await
- native Promises in V8 have seen huge performance improvements as well as their use via
`async/await`
- V8 exposes C++ API allowing to trace through Promise lifecycle which is used by Node.js API
to provide insight into Promise execution
- DevTools async stacktraces make Promise debugging a lot easier
- DevTools _pause on exception_ breaks immediately when a Promise `reject` is invoked
### Resources
- [V8 Release 5.7 - 2017](https://v8.dev/blog/v8-release-57)k
## Generators
- weren't optimizable in the past due to control flow limitations in Crankshaft
- new compiler chain generates bytecodes which de-sugar complex generator control flow into
simpler local-control flow bytecodes
- these resulting bytecodes are easily optimized by TurboFan without knowing anything specific
about generator control flow
### Resources
- [High-performance ES2015 and beyond - 2017](https://v8.dev/blog/high-performance-es2015)
## Proxies
- [proxies](https://developer.mozilla.org/en-US/docs/Web/JavaScript/Reference/Global_Objects/Proxy)
required 4 jumps between C++ and JavaScript runtimes in the previous V8 compiler
implementation
- porting C++ bits to [CodeStubAssembler](compiler.md#codestubassembler) allows all execution
to happen inside the JavaScript runtime, resulting in 0 jumps between runtimes
- this sped up numerous proxy operations
- constructing proxies 49%-74% improvement
- calling proxies up to 500% improvement
- [has trap](https://developer.mozilla.org/en-US/docs/Web/JavaScript/Reference/Global_Objects/Proxy/handler/has)
71%-428% improvement, larger improvement when trap is present
- [set trap](https://developer.mozilla.org/en-US/docs/Web/JavaScript/Reference/Global_Objects/Proxy/handler/set)
27%-438% improvement, larger improvement when trap is set
### Recommendations
- while the use of proxies does incur an overhead, that overhead has been reduced drastically,
but still should be avoided in hot code paths
- however use proxies whenever the problem you're trying to solve calls for it
### Resources
- [Optimizing ES2015 proxies in V8 - 2017](https://v8.dev/blog/optimizing-proxies)
================================================
FILE: memory-profiling.md
================================================
# Memory Profiling
_find the previous version of this document at
[crankshaft/memory-profiling.md](crankshaft/memory-profiling.md)_
**Table of Contents** *generated with [DocToc](https://github.com/thlorenz/doctoc)*
- [Theory](#theory)
- [Objects](#objects)
- [Shallow size](#shallow-size)
- [Retained size](#retained-size)
- [GC roots](#gc-roots)
- [Storage](#storage)
- [Object Groups](#object-groups)
- [Retainers](#retainers)
- [Dominators](#dominators)
- [Causes for Leaks](#causes-for-leaks)
- [Tools](#tools)
- [DevTools Allocation Timeline](#devtools-allocation-timeline)
- [Allocation Stack](#allocation-stack)
- [Recording Allocation Timeline with Node.js](#recording-allocation-timeline-with-nodejs)
- [DevTools Allocation Profile](#devtools-allocation-profile)
- [Recording Allocation Profile with Node.js Manually](#recording-allocation-profile-with-nodejs-manually)
- [Recording Allocation Profile with Node.js Programatically](#recording-allocation-profile-with-nodejs-programatically)
- [DevTools Heap Snapshots](#devtools-heap-snapshots)
- [Taking Heap Snapshot with Node.js](#taking-heap-snapshot-with-nodejs)
- [Views](#views)
- [Color Coding](#color-coding)
- [Summary View](#summary-view)
- [Limiting included Objects](#limiting-included-objects)
- [Comparison View](#comparison-view)
- [Containment View](#containment-view)
- [Entry Points](#entry-points)
- [Dominators View](#dominators-view)
- [Retainer View](#retainer-view)
- [Constructors listed in Views](#constructors-listed-in-views)
- [Closures](#closures)
- [Advanced Comparison Technique](#advanced-comparison-technique)
- [Dynamic Heap Limit and Large HeapSnapshots](#dynamic-heap-limit-and-large-heapsnapshots)
- [Considerations to make code easier to debug](#considerations-to-make-code-easier-to-debug)
- [Resources](#resources)
- [blogs/tutorials](#blogstutorials)
- [videos](#videos)
- [slides](#slides)
## Theory
### Objects
[read](https://developer.chrome.com/devtools/docs/javascript-memory-profiling#object-sizes)
[read](https://developers.google.com/web/tools/chrome-devtools/memory-problems/memory-101#object_sizes)
#### Shallow size
[read](https://developers.google.com/web/tools/chrome-devtools/memory-problems/memory-101#shallow_size)
- memory held by object **itself**
- arrays and strings may have significant shallow size
#### Retained size
[read](https://developers.google.com/web/tools/chrome-devtools/memory-problems/memory-101#retained_size)
- memory that is freed once object itself is deleted due to it becoming unreachable from *GC roots*
- held by object *implicitly*
##### GC roots
- made up of *handles* that are created when making a reference from native code to a JS object ouside of V8
- found in heap snapshot under **GC roots > Handle scope** and **GC roots > Global handles**
- internal GC roots are window global object and DOM tree
#### Storage
[read](https://developers.google.com/web/tools/chrome-devtools/memory-problems/memory-101#javascript_object_representation) |
[read](https://github.com/thlorenz/v8-perf/blob/master/data-types.md)
- primitives are leafs or terminating nodes
- strings stored in *VM heap* or externally (accessible via *wrapper object*)
- *VM heap* is heap dedicated to JS objects and managed byt V8 gargabe collector
- *native objects* stored outside of *VM heap*, not managed by V8 garbage collector and are accessed via JS *wrapper
object*
- *cons string* object created by concatenating strings, consists of pairs of strings that are only joined as needed
- *arrays* objects with numeric keys, used to store large amount of data, i.e. hashtables (key-value-pair sets) are
backed by arrays
- *map* object describing object kind and layout
#### Object Groups
[read](https://developers.google.com/web/tools/chrome-devtools/memory-problems/memory-101#object_groups)
- *native objects* group is made up from objects holding mutual references to each other
- not represented in JS heap -> have zero size
- wrapper objects created instead, each holding reference to corresponding *native object*
- object group holds wrapper objects creating a cycle
- GC releases object groups whose wrapper objects aren't referenced, but holding on to single wrapper will hold whole
group of associated wrappers
### Retainers
[read](https://developers.google.com/web/tools/chrome-devtools/memory-problems/memory-101#objects_retaining_tree) |
[read](https://developer.chrome.com/devtools/docs/memory-analysis-101#retaining_paths)
- shown at the bottom inside heap snapshots UI
- *nodes/objects* labelled by name of constructor function used to build them
- *edges* labelled using property names
- *retaining path* is any path from *GC roots* to an object, if such a path doesn't exist the object is *unreachable*
and subject to being garbage collected
### Dominators
[read](https://developers.google.com/web/tools/chrome-devtools/memory-problems/memory-101#dominators) |
[read](https://en.wikipedia.org/wiki/Dominator_(graph_theory)) |
[read](https://developer.chrome.com/devtools/docs/memory-analysis-101#dominators)
- can be seen in [**Dominators** view](#dominators-view)
- tree structure in which each object has **one** dominator
- if *dominator* is deleted the *dominated* node is no longer reachable from *GC root*
- node **d** dominates a node **n** if every path from the start node to **n** must go through **d**
### Causes for Leaks
[read](http://addyosmani.com/blog/taming-the-unicorn-easing-javascript-memory-profiling-in-devtools/) *Understanding the Unicorn*
- logical errors in JS that keep references to objects that aren't needed anymore
- number one error: event listeners that haven't been cleaned up correctly
- this causes an object to be considered live by the GC and thus prevents it from being reclaimed
## Tools
### DevTools Allocation Timeline
[watch](https://youtu.be/LaxbdIyBkL0?t=50m33s) |
[read](https://developers.google.com/web/tools/chrome-devtools/memory-problems/allocation-profiler)
(slightly out of date especially WRT naming, but does show the allocation timeline profiler) |
[read](https://developers.google.com/web/tools/chrome-devtools/memory-problems/#identify_js_heap_memory_leaks_with_allocation_timelines)
- **preferred over snapshot comparisons** to track down memory leaks
- *blue* bars show memory allocations
- *grey* bars show memory deallocations
#### Allocation Stack
[slides](https://speakerdeck.com/addyosmani/javascript-memory-management-masterclass?slide=102)
[watch](https://youtu.be/LaxbdIyBkL0?t=51m30s)

- _Allocation_ view (selectable in top left) shows allocations grouped by function and whose
traces can be followed to see the function code responsible for the allocation
#### Recording Allocation Timeline with Node.js
- run app via `node --inspect` or `node --inspect-brk`
- open DevTools anywhere and click on the Node.js icon in the upper left corner to open a
dedicated Node.js DevTools instance
- select the _Memory_ tab and there select _Record allocation timeline_ and then click _Start_
- if you launched with `--inspect-brk` go back to the source panel to start debugging and
then return to _Memory_ tab
- stop profiling via the red circle on the upper left and examine the timeline and related
snapshots
- notice that the dropdown on the upper left has an _Allocations_ option which allows you to
inspect allocations by function

### DevTools Allocation Profile
[read](https://developers.google.com/web/tools/chrome-devtools/memory-problems/#allocation-profile)
- helps identify functions responsible for allocating memory
- in case of memory leaks or performance issues due to lots of allocatd objects it can be used
to track down which functions allocate most memory
#### Recording Allocation Profile with Node.js Manually
- run app via `node --inspect` or `node --inspect-brk`
- open DevTools anywhere and click on the Node.js icon in the upper left corner to open a
dedicated Node.js DevTools instance
- select the _Memory_ tab and there select _Record allocation profile_ and then click _Start_
- the application will continue running automatically if it was paused, i.e. due to use of
`--inspect-brk`
- stop profiling via the red circle on the upper left and select _Chart_ from the dropdown on
the left
- you will see a function execution stack with the functions that allocated the most memory or
had children that executed lots of memory being the widest

#### Recording Allocation Profile with Node.js Programatically
- the [sampling-heap-profiler](https://github.com/v8/sampling-heap-profiler) package allows to
trigger and stop heap samples programatically and write them to a file
- supposed to be lightweight enough for in-production use on servers
- generated snapshots can be saved offline, and be opened in DevTools later
### DevTools Heap Snapshots

[read](https://developers.google.com/web/tools/chrome-devtools/memory-problems/heap-snapshots#take_a_snapshot)
_out of date graphics, but most still works as shown_
[read](https://developers.google.com/web/tools/chrome-devtools/memory-problems/#discover_detached_dom_tree_memory_leaks_with_heap_snapshots)
_example is about DOM nodes, but techniques apply in general_
- taking heap snapshots is quite easy, but the challenge is understanding whats in them
- when investigating leaks it is a good idea to trigger garbage collection right before taking
a snapshot via the _collect garbage trashcan_ in the upper left
#### Taking Heap Snapshot with Node.js
- run app via `node --inspect`
- open DevTools anywhere and click on the Node.js icon in the upper left corner to open a
dedicated Node.js DevTools instance
- select the _Memory_ tab and there select _Take Heap Snapshot_ and then click _Take Sanpshot_
- perform this multiple times in order to to detect leaks as explained in [advanced comparison
technique](#advanced-comparison-technique)
#### Views
[overview](https://developer.chrome.com/devtools/docs/heap-profiling#basics) |
[overview](https://developers.google.com/web/tools/chrome-devtools/memory-problems/heap-snapshots#take_a_snapshot)
Even though views here are explained in conjunction with taking a heap snapshot, most of them
are also available when using any of the other techniques like _allocation profile_ or
_allocation timeline_.
##### Color Coding
[read](https://developers.google.com/web/tools/chrome-devtools/memory-problems/heap-snapshots#look_up_color_coding)
Properties and values are colored according to their types.
- *a:property* regular propertye, i.e. `foo.bar`
- *0:element* numeric index property, i.e. `arr[0]`
- *a:context var* variable in function context, accessible by name from inside function closure
- *a:system prop* added by JS VM and not accessible from JS code, i.e. V8 internal objects
- yellow objects are referenced by JS
- red objects are detached nodes which are referenced by yellow background object
##### Summary View
[read](https://developers.google.com/web/tools/chrome-devtools/memory-problems/heap-snapshots#summary_view)
- shows top level entries, a row per constructor
- columns for distance of the object to the *GC root*, number of object instances, shallow size and retained size.
- `@` character is objects’ unique ID, allowing you to compare heap snapshots on per-object basis
###### Limiting included Objects
- to the right of the View selector you can limit the objects by class name i.e. the name of the constructor function
- to the right of the class filter you can choose which objects to include in your summary (defaults to all)
- select *objects allocated between heapdump 1 and heapdump 2* to identify objects that are still around in *heapdump
3* but shouldn't be
- another way to archieve similar results is by comparing two heapdumps (see below)
##### Comparison View
[read](https://developers.google.com/web/tools/chrome-devtools/memory-problems/heap-snapshots#comparison_view)
- compares multiple snapshots to each other
- note that **the preferred way to investigate leaks is the [advanced comparison
technique](#advanced-comparison-technique)** using the summary view
- shows diff of both and delta in ref counts and freed and newly allocated memory
- used to find leaked objects
- after starting and completing (or canceling) the action, no garbage related to that action should be left
- note that garbage is collected each time a snapshot is taken, therefore remaining items are still referenced
1. Take bottom line snapshot
2. Perform operation that might cause a leak
3. Perform reverse operation and/or ensure that action `2` is complete and therefore all objects needed to perform it
should no longer be needed
4. Take second snapshot
5. Compare both snapshots
- select a Snapshot, then *Comparison* on the left and another Snapshot to compare it to on the right
- the *Size Delta* will tell you how much memory couldn't be collected

##### Containment View
[read](https://developers.google.com/web/tools/chrome-devtools/memory-problems/heap-snapshots#containment_view)
- birds eye view of apps object structure
- low level, allows peeking inside function closures and look at VM internal objects
- used to determine what keeps objects from being collected
###### Entry Points
- *GC roots* actual GC roots used by garbage collector
- *DOMWindow objects* (not present when profiling Node.js apps)
- *Native objects* (not present when profiling Node.js apps)
Additional entry points only present when profiling a Node.js app:
- *1::* global object
- *2::* global object
- *[4] Buffer* reference to Node.js Buffers
##### Dominators View
[read](https://developers.google.com/web/tools/chrome-devtools/memory-problems/heap-snapshots#dominators_view)
- only available once *Settings/General/Profiler/Show advanced heap snapshot properties* is checked and browser
refreshed afterwards
- shows dominators tree of heap
- similar to containment view but lacks property names since dominator may not have direct reference to all objects it
dominates
- useful to identify memory accumulation points
- also used to ensure that objects are well contained instead of hanging around due to GC not working properly
##### Retainer View
- always shown at bottom of the UI
- displays retaining tree of currently selected object
- retaining tree has references going outward, i.e. inner item references outer item
#### Constructors listed in Views
[read](https://developer.chrome.com/devtools/docs/javascript-memory-profiling#memory-profiling-faq)
- *(global property)* intermediate object between global object and an object refereced by it
- *(roots)* root entries in retaining view are entities that reference the selected object
- *(closure)* count of references to a group of objects through function closures
- *(array, string, number, regexp)* list of object types with properties which reference an Array, String, Number or
regular expression
- *(compiled code)* *SharedFunctionInfos* have no context and standibetween functions that do have context
- *(system)* references to builtin functions mainly `Map` (TODO: confirm and more details)
##### Closures
[read](http://zetafleet.com/blog/google-chromes-heap-profiler-and-memory-timeline)
- source of unintentional memory retention
- V8 will not clean up **any** memory of a closure untiil **all** members of the closure have gone out of scope
- therefore they should be used sparingly to avoid unnecessary [semantic
garbage](https://en.wikipedia.org/wiki/Garbage_(computer_science))
###### Advanced Comparison Technique
[slides](https://speakerdeck.com/addyosmani/javascript-memory-management-masterclass?slide=102)
Use at least three snapshots and compare those.
1. Take bottom line snapshot *Checkpoint 1*
2. Perform operation that might cause a leak
3. Take snapshot *Checkpoint 2*
4. Perform same operation as in *2.*
5. Take snapshot *Checkpoint 3*
- all memory needed to perform action the first time should have been collected by now
- any objects allocated between *Checkpoint 1* and *Checkpoint 2* should be no longer present in *Checkpoint 3*
- select *Snapshot 3* and from the dropdown on the right select *Objects allocated between Snapshot 1 and 2*
- ideally you see no *Objects* that are created by your application (ignore memory that is unrelated to your action,
i.e. *(compiled code)*)
- if you see any *Objects* that shouldn't be there but are in doubt create a 4th snapshot and select *Objects allocated
between Snapshot 1 and 2* as shown in the picture below

#### Dynamic Heap Limit and Large HeapSnapshots
[read](https://v8.dev/blog/heap-size-limit) _One small step for Chrome, one giant heap for V8_
- V8's ability to dynamically increase its heap limit allows taking heap snapshot when close to
running out of memory
- `set_max_old_space_size` is exposed to V8 embedders as part of the _ResourceConstraints_ API
to allow them to increase the heap limit
- DevTools added feature to pause application when close to running out of memory
1. pauses application and increases heap limit which allows taking a snapshot, inspect the
heap, evaluate expressions, etc.
2. developer can then clean up items that are taking up memory
3. application can be resumed
- you can try it by running `node --inspect examples/memory-hog` in this repo, and opening a
Node.js dedicated DevTools to see it it pause due to _potential out of memory crash_
## Considerations to make code easier to debug
The usefulness of the information presented in the views depends on how you authored your code. Here are a few
rules to make your code more debuggable.
Anonymous functions, i.e. `function() { ... }` show as `(anonymous)` and thus are hard to find
in your code. V8 + DevTools are getting smarter about this, i.e. for arrow functions where
`setTimeout(() => { ... }, TIMEOUT)` will show as `setTimeout` and you can navigate to the
function during a live profiling session.
However it is recommended to name your functions to make memory and performance profiling as
well as debugging your applications easier.
## Resources
### blogs/tutorials
Keep in mind that most of these are someehwat out of date albeit still useful.
- [chrome-docs memory profiling](https://developer.chrome.com/devtools/docs/javascript-memory-profiling)
- [chrome-docs Memory Analysis 101](https://developer.chrome.com/devtools/docs/memory-analysis-101) overlaps with chrome-docs memory profiling
- [chrome-docs heap profiling](https://developer.chrome.com/devtools/docs/heap-profiling) overlaps with chrome-docs memory profiling
- [Chasing Leaks With The Chrome DevTools Heap Profiler Views](https://plus.google.com/+AddyOsmani/posts/D3296iL3ZRE)
- [heap profiler in chrome dev tools](http://rein.pk/using-the-heap-profiler-in-chrome-dev-tools/)
- [performance-optimisation-with-timeline-profiles](http://addyosmani.com/blog/performance-optimisation-with-timeline-profiles/) time line data cannot be pulled out of a Node.js app currently, therfore skipping this for now
- [timeline and heap profiler](http://zetafleet.com/blog/google-chromes-heap-profiler-and-memory-timeline)
- [chromium blog](http://blog.chromium.org/2011/05/chrome-developer-tools-put-javascript.html)
- [Easing JavaScript Memory Profiling In Chrome DevTools](http://addyosmani.com/blog/taming-the-unicorn-easing-javascript-memory-profiling-in-devtools/)
- [Effectively Managing Memory at Gmail scale](http://www.html5rocks.com/en/tutorials/memory/effectivemanagement/)
- [javascript memory management masterclass](https://speakerdeck.com/addyosmani/javascript-memory-management-masterclass)
- [fixing memory leaks in drupal's editor](https://www.drupal.org/node/2159965)
- [writing fast memory efficient javascript](http://www.smashingmagazine.com/2012/11/05/writing-fast-memory-efficient-javascript/)
- [imgur avoiding a memory leak situation in JS](http://imgur.com/blog/2013/04/30/tech-tuesday-avoiding-a-memory-leak-situation-in-js/)
### videos
- [The Breakpoint Ep8: Memory Profiling with Chrome DevTools](https://www.youtube.com/watch?v=L3ugr9BJqIs)
- [Google I/O 2013 - A Trip Down Memory Lane with Gmail and DevTools](https://www.youtube.com/watch?v=x9Jlu_h_Lyw#t=1448)
- [Memory Profiling for Mere Mortals - 2016](https://www.youtube.com/watch?v=taADm6ndvVo)
### slides
- [Finding and debugging memory leaks in JavaScript with Chrome DevTools](http://www.slideshare.net/gonzaloruizdevilla/finding-and-debugging-memory-leaks-in-javascript-with-chrome-devtools)
- [eliminating memory leaks in Gmail](https://docs.google.com/presentation/d/1wUVmf78gG-ra5aOxvTfYdiLkdGaR9OhXRnOlIcEmu2s/pub?start=false&loop=false&delayms=3000#slide=id.g1d65bdf6_0_0)
- [Memory Profiling for Mere Mortals Slides - 2016](http://thlorenz.com/talks/memory-profiling.2016/book/)
================================================
FILE: package.json
================================================
{
"name": "v8-perf",
"version": "0.0.0",
"description": "Notes and resources related to v8 and thus Node.js performance.",
"scripts": {
"test-main": "set -e; for t in test/*.js; do $t; done",
"test-0.8": "nave use 0.8 npm run test-main",
"test-0.10": "nave use 0.10 npm run test-main",
"test-0.11": "nave use 0.11 npm run test-main",
"test": "npm run test-0.8 && npm run test-0.10 && npm run test-0.11"
},
"repository": {
"type": "git",
"url": "git://github.com/thlorenz/v8-perf.git"
},
"homepage": "https://github.com/thlorenz/v8-perf",
"dependencies": {
"ansicolors": "~0.3.2"
},
"devDependencies": {
"nave": "~0.4.3",
"tap": "~0.4.9"
},
"keywords": [],
"author": {
"name": "Thorsten Lorenz",
"email": "thlorenz@gmx.de",
"url": "http://thlorenz.com"
},
"license": {
"type": "MIT",
"url": "https://github.com/thlorenz/v8-perf/blob/master/LICENSE"
},
"engine": {
"node": ">=0.8"
}
}
================================================
FILE: runtime-functions.md
================================================
# V8 runtime functions
- V8 JS lib uses minimal set of C+ runtime functions (callable from JavaScript)
- lots of these have names starting with `%` and are visible
- others aren't visible as they are only called by generated code
- they are defined inside [v8/runtime.h](https://cs.chromium.org/chromium/src/v8/src/runtime/runtime.h)
- [test for these can be found here](https://github.com/v8/v8/tree/master/test/mjsunit/runtime-gen)
## Usage
- allow access via `--allow-natives-syntax`
- [example test using runtime
functions](https://github.com/thlorenz/v8-perf/blob/0d32979a42a05b4d8aa97bf42d017c7a02e9d8e3/test/fast-elements.js#L9-L13)
- examples on how to use them can be found inside [v8
tests](https://github.com/v8/v8/search?l=JavaScript&q=--allow-natives-syntax+size%3A%3E400&type=Code) (size set to `>400` to filter
out generated runtime functions)
## Resources
- [short doc on V8 wiki](https://v8.dev/docs/builtin-functions)
================================================
FILE: snapshots+code-caching.md
================================================
# Snapshots and Code Caching
This document explains techniques used by V8 in order to avoid having to re-compile and
optimized JavaScript whenever an application that embeds it (i.e. Chrome or Node.js) starts up
fresh.
**Table of Contents** *generated with [DocToc](https://github.com/thlorenz/doctoc)*
- [Code Caching](#code-caching)
- [Chrome's Use of Code Caching](#chromes-use-of-code-caching)
- [Resources](#resources)
- [Startup Snapshots](#startup-snapshots)
- [Custom Startup Snapshots](#custom-startup-snapshots)
- [Lazy Deserialization](#lazy-deserialization)
- [Resources](#resources-1)
## Code Caching
- lessens overhead of parsing + compiling script
- uses cached data to recreate previous compilation result
- exposed via V8's API to embedders
- pass `v8::ScriptCompiler::kProduceCodeCache` as an option when compiling script
- Note: V8 is deprecating `v8::ScriptCompiler::kProduceCodeCache` in favor of
`v8::ScriptCompiler::GetCodeCache`
- cached data is attached to source object to be retrieved via
`v8::ScriptCompiler::Source::GetCachedData`
- can be persisted for later
- later cache data can be attached to the source object and passed
`v8::ScriptCompiler::kConsumeCodeCache` as an option to cause V8 to bypass compileing the
code and deserialize the provided cache data instead
- V8 6.6 caches top level code as well as code generated _after_ script's top-level execution,
which means that lazily compiled functions are included in the cache
### Chrome's Use of Code Caching
Since Chrome embeds V8 it can make use of Code Caching and does so as follows.
- cold load: page loaded for the first time and thus no cached data is available
- warm load: page loaded before and caches compiled code along with the script file in disk
cache
- to qualify, the last load needs to be within the last 72 hours and the script source be
larger than 1KB
- hot load: page loaded twice before and thus can use the cached compiled code instead of
parsing + compiling the script again
### Resources
- [Code caching - 2015](https://v8.dev/blog/code-caching)
- [Code caching after execution - 2018](https://v8.dev/blog/v8-release-66)
- [V8 ScriptRunner source](https://cs.chromium.org/chromium/src/third_party/blink/renderer/bindings/core/v8/v8_script_runner.cc?l=269&rcl=c59618d0f92b57e4dcfb903f3c99bb0574eac340)
## Startup Snapshots
### Custom Startup Snapshots
- V8 uses snapshots and lazy deserialization to _retrieve_ previously optimized code for builtin
functions
- powerful snapshot API exposed to embedders via `v8::SnapshotCreator`
- among other things this API allows embedders to provide an additional script to customize a
start-up snapshot
- new contexts created from the snapshot are initialized in a state obtained _after_ the script
executed
- native C++ functions are recognized and encoded by the serializer as long as they have been
registered with V8
- serializer cannot _directly_ capture state outside of V8, thus outside state needs to be
attached to a JavaScript object via _embedder fields_
### Lazy Deserialization
[read](https://v8.dev/blog/lazy-deserialization)
- only about 30% of builtin functions are used on average
- deserialize builtin function from the snapshot when it is called the first time
- functions have _well-known_ positions within the snapshot's dedicated builtins area
- starting offset of each code object is kept in a dedicated section within builtins area
- additionally implemented lazy deserializations for bytecode handlers, which contain logic to
execute each bytecode within Ignition interpreter
- enabled in V8 v6.4 resulting in average V8's heap size savings of 540 KB
### Resources
- [custom startup snapshots - 2015](https://v8.dev/blog/custom-startup-snapshots)
somewhat out of date as embedder API changed and lazy deserialization was introduced
- [Energizing Atom with V8's custom start-up snapshot - 2017](https://v8.dev/blog/custom-startup-snapshots)
- [Lazy deserialization - 2018](https://v8.dev/blog/lazy-deserialization)
- [Speeding up Node.js startup using V8 snapshot](https://docs.google.com/document/d/1YEIBdH7ocJfm6PWISKw03szNAgnstA2B3e8PZr_-Gp4/edit)
================================================
FILE: test/_versions.js
================================================
#!/usr/bin/env node
var colors = require('ansicolors')
, format = require('util').format
, os = require('os');
var specs = { cpus: Object.keys(os.cpus()).length, platform: os.platform(), host: os.hostname() }
, v = process.versions
var msg =
format(colors.cyan('node') + ' %s', colors.yellow('v' + v.node))
+ format(colors.cyan(' | v8') + ' %s | ' + colors.cyan('uv') + ' %s', colors.yellow('v' + v.v8), colors.yellow('v' + v.uv))
+ format(' | %s cpus | %s platform | %s', colors.green(specs.cpus), colors.green(specs.platform), colors.green(specs.host))
console.log(msg + '\n');
================================================
FILE: test/boxing.js
================================================
#!/usr/bin/env node --allow-natives-syntax
'use strict';
/**
* ## 32-bit architecture
*
* 32-bit slot separation to hold a signed integer:
*
* - 1 bit to tag it as value
* - 1 bit for sign
* - 30 bits for actual value
*
* ### Producing 30 bits actual value
*
* #### In Detail (each left shift `<<` multiplies value by 2):
*
* ```
* pad > ((1 << 30) - 1).toString(2)
* '111111111111111111111111111111'
*
* pad > ((1 << 30) - 1).toString(2).length
* 30
*
* pad > ((1 << 30) - 1).toString(10)
* '1073741823'
*
* pad > (-(1 << 30)).toString(10)
* '-1073741824'
* ```
*
* #### Short
*
* pad > console.log('min: %d, max: %d', -Math.pow(2, 30), Math.pow(2, 30) - 1)
* min: -1073741824, max: 1073741823
*
* ## 64-bit architecture
*
* - on x64 SMIs are 32-bit signed integers represented at higher half of 64-bit value
* - format: [32 bit signed int] [31 bits zero padding] 0
*
* #### Short
*
* pad > console.log('min: %d, max: %d', -Math.pow(2, 31), Math.pow(2, 31) - 1)
* min: -2147483648, max: 2147483647
*
*/
var test = require('tape');
function isInteger(val) {
/*jshint ignore:start*/
return %_IsSmi(val);
/*jshint ignore:end*/
}
var is64Bit = /64/.test(process.arch);
var min, max;
if (is64Bit) {
min = -2147483648;
max = 2147483647;
} else {
min = -1073741824;
max = 1073741823;
}
test('\nintegers inside min/max ranges on a ' + process.arch + ' system' , function (t) {
t.ok(isInteger(min), 'min number is SMI')
t.ok(isInteger(max), 'max number is SMI')
t.end()
})
test('\nintegers outside min/max ranges on a ' + process.arch + ' system' , function (t) {
t.ok(!isInteger(min - 1), 'number smaller than min is not a SMI')
t.ok(!isInteger(max + 1), 'number larger than max is not a SMI')
t.end()
})
================================================
FILE: test/fast-elements.js
================================================
#!/usr/bin/env node --allow-natives-syntax
'use strict'
const test = require('tape')
const {
assertKind
, FAST_SMI_ONLY
, FAST_DOUBLE
, FAST
, DICTIONARY
} = require('./util/element-kind')
// https://cs.chromium.org/chromium/src/v8/src/objects/js-array.h?type=cs&q=kmaxFast&l=90
const kMaxFastArrayLength = 32 * 1024 * 1024
test('\narray that was not pre-allocated but grown on demand', function(t) {
const arr = []
let len = kMaxFastArrayLength + 1
while (len--) {
arr.push(len)
}
assertKind(t, arr, FAST_SMI_ONLY, `to ${kMaxFastArrayLength + 1} elements, is fast`)
arr[1] = undefined
const msg = (
`to ${kMaxFastArrayLength + 1} elements, becomes fast ` +
`(no longer Smi only) when assigning a slot to 'undefined'`
)
assertKind(t, arr, FAST, msg)
t.end()
})
function fillSmis(arr, max = arr.length) {
for (let i = 0; max > i && i < arr.length; i++) arr[i] = i
}
function fillDoubles(arr) {
for (let i = 0; i < arr.length; i++) arr[i] = i * 0.1
}
test('\narrays that were pre-allocated to hold a specific number of elements', function(t) {
const a = new Array(kMaxFastArrayLength)
const b = new Array(kMaxFastArrayLength + 1)
assertKind(t, a, FAST_SMI_ONLY, `to ${a.length}, is initially fast smis`)
assertKind(t, b, DICTIONARY, `to ${b.length}, is initially slow`)
fillSmis(b, 1E6)
assertKind(t, b, DICTIONARY, `to ${b.length}, and filled partially with Smis, is still slow`)
fillSmis(b, b.length)
assertKind(t, b, FAST_SMI_ONLY, `to ${b.length} and filled completely with Smis, becomes fast smis`)
fillDoubles(a, 10)
assertKind(t, a, FAST_DOUBLE, `to ${a.length}, and filled partially with Doubles becomes fast doubles`)
t.end()
})
================================================
FILE: test/package.json
================================================
{
"name": "v8-perf-tests",
"devDependencies": {
"ansicolors": "~0.3.2",
"tape": "~4.9.0"
}
}
================================================
FILE: test/util/element-kind.js
================================================
'use strict'
// From: https://cs.chromium.org/chromium/src/v8/test/mjsunit/opt-elements-kind.js
const FAST_SMI_ONLY = 'fast smi only elements'
const FAST = 'fast elements'
const FAST_DOUBLE = 'fast double elements'
const DICTIONARY = 'dictionary elements'
const FIXED_INT8 = 'fixed int8 elements'
const FIXED_UINT8 = 'fixed uint8 elements'
const FIXED_INT16 = 'fixed int16 elements'
const FIXED_UINT16 = 'fixed uint16 elements'
const FIXED_INT32 = 'fixed int32 elements'
const FIXED_UINT32 = 'fixed uint32 elements'
const FIXED_FLOAT32 = 'fixed float32 elements'
const FIXED_FLOAT64 = 'fixed float64 elements'
const FIXED_UINT8_CLAMPED = 'fixed uint8_clamped elements'
function getKind(obj) {
if (%HasSmiElements(obj)) return FAST_SMI_ONLY
if (%HasObjectElements(obj)) return FAST
if (%HasDoubleElements(obj)) return FAST_DOUBLE
if (%HasDictionaryElements(obj)) return DICTIONARY
if (%HasFixedInt8Elements(obj)) {
return FIXED_INT8
}
if (%HasFixedUint8Elements(obj)) {
return FIXED_UINT8
}
if (%HasFixedInt16Elements(obj)) {
return FIXED_INT16
}
if (%HasFixedUint16Elements(obj)) {
return FIXED_UINT16
}
if (%HasFixedInt32Elements(obj)) {
return FIXED_INT32
}
if (%HasFixedUint32Elements(obj)) {
return FIXED_UINT32
}
if (%HasFixedFloat32Elements(obj)) {
return FIXED_FLOAT32
}
if (%HasFixedFloat64Elements(obj)) {
return FIXED_FLOAT64
}
if (%HasFixedUint8ClampedElements(obj)) {
return FIXED_UINT8_CLAMPED
}
}
function assertKind(t, obj, expected, msg = '') {
const actual = getKind(obj)
t.equal(actual, expected, `${msg} (elements kind: ${actual})`)
}
module.exports = {
assertKind
, getKind
, FAST_SMI_ONLY
, FAST
, FAST_DOUBLE
, DICTIONARY
, FIXED_INT8
, FIXED_UINT8
, FIXED_INT16
, FIXED_UINT16
, FIXED_INT32
, FIXED_UINT32
, FIXED_FLOAT32
, FIXED_FLOAT64
, FIXED_UINT8_CLAMPED
}